UNITED STATES
SECURITIES AND EXCHANGE COMMISSION
Washington, D.C. 20549
FORM 10-K
 | | |
| x | | ANNUAL REPORT PURSUANT TO SECTION 13 OR 15(d)
OF THE SECURITIES EXCHANGE ACT OF 1934 |
For the fiscal year ended December 31, 2010
or
| | |
| o | | TRANSITION REPORT PURSUANT TO SECTION 13 OR 15(d)
OF THE SECURITIES EXCHANGE ACT OF 1934 |
For the transition period from to
to
Commission File No. 1-32248
GRAMERCY CAPITAL CORP.
(Exact name of registrant as specified in its charter)
| | |
| Maryland | | 06-1722127 |
(State or other jurisdiction
incorporation or organization) | | (I.R.S. Employer of
Identification No.) |
420 Lexington Avenue, New York, NY 10170
(Address of principal executive offices — zip code)
(212) 297-1000
(Registrant’s telephone number, including area code)
SECURITIES REGISTERED PURSUANT TO SECTION 12(b) OF THE ACT:
| | |
| Title of Each Class | | Name of Each Exchange on Which Registered |
Common Stock, $0.001 Par Value
Series A Cumulative Redeemable
Preferred Stock, $0.001 Par Value | | New York Stock Exchange
New York Stock Exchange |
SECURITIES REGISTERED PURSUANT TO SECTION 12(g) OF THE ACT:None
Indicate by check mark if the registrant is a well-known seasoned issuer, as defined in Rule 405 of the Securities Act. Yeso Nox
Indicate by check mark if the registrant is not required to file reports pursuant to Section 13 or Section 15(d) of the Act. Yeso Nox
Indicate by check mark whether the registrant (1) has filed all reports required to be filed by Section 13 or 15(d) of the Securities Exchange Act of 1934 during the preceding 12 months (or for such shorter period that the registrant was required to file such reports), and (2) has been subject to such filing requirements for the past 90 days. Yeso Nox
Indicate by check mark whether the registrant has submitted electronically and posted on its corporate Website, if any, every Interactive Data File required to be submitted and posted pursuant to Rule 405 of Regulation S-T (Section 232.405 of this chapter) during the preceding 12 months (or for such shorter period that the registrant was required to submit and post such files). Yeso Noo
Indicate by check mark if disclosure of delinquent filers pursuant to Item 405 of Regulation S-K is not contained herein, and will not be contained, to the best of the registrant’s knowledge, in definitive proxy or information statements incorporated by reference in Part III of this Form 10-K or any amendment to this Form 10-K.o
Indicate by check mark whether the registrant is a large accelerated filer, an accelerated filer, a non-accelerated filer or a small reporting company. See the definitions of “large accelerated filer,” “accelerated filer” and “small reporting company” in Rule 12b-2 of the Exchange Act.
| | | | | | |
| Large accelerated filero | | Accelerated filerx | | Non-accelerated filero
(Do not check if a smaller reporting company) | | Smaller reporting companyo |
Indicate by check mark whether the registrant is a shell company (as defined in Rule 12b-2 of the Exchange Act). Yeso Nox
As of September 22, 2011, there were 50,517,365 shares of the Registrant’s common stock outstanding. The aggregate market value of common stock held by non-affiliates of the registrant (43,686,810 shares) at June 30, 2010, was $55,045,381. The aggregate market value was calculated by using the closing price of the common stock as of that date on the New York Stock Exchange, which was $1.26 per share.
TABLE OF CONTENTS
GRAMERCY CAPITAL CORP.
FORM 10-K
TABLE OF CONTENTS
10-K PART AND ITEM NO.
| | |
| | Page |
PART I
| |
1. Business | | | 1 | |
1A. Risk Factors | | | 18 | |
1B. Unresolved Staff Comments | | | 53 | |
2. Properties | | | 54 | |
3. Legal Proceedings | | | 58 | |
4. Reserved | | | 59 | |
PART II
| |
5. Market for Registrant’s Common Equity, Related Stockholders Matters and Issuer Purchases of Equity Securities | | | 59 | |
6. Selected Financial Data | | | 62 | |
7. Management’s Discussion and Analysis of Financial Condition and Results of Operations | | | 65 | |
7A. Quantitative and Qualitative Disclosures About Market Risk | | | 107 | |
8. Financial Statements and Supplementary Data | | | 109 | |
9. Changes in and Disagreements with Accountants on Accounting and Financial Disclosure | | | 213 | |
9A. Controls and Procedures | | | 213 | |
9B. Other Information | | | 213 | |
PART III
| |
10. Directors, Executive Officers and Corporate Governance of the Registrant | | | 214 | |
11. Executive Compensation | | | 218 | |
12. Security Ownership of Certain Beneficial Owners and Management and Related Stockholder Matters | | | 235 | |
13. Certain Relationships and Related Transactions and Director Independence | | | 237 | |
14. Principal Accounting Fees and Services | | | 242 | |
PART IV
| |
15. Exhibits, Financial Statements and Schedules | | | 243 | |
| Signatures | | | 249 | |
i
TABLE OF CONTENTS
ITEM 1. BUSINESS
General
Gramercy Capital Corp. is a self-managed, integrated commercial real estate finance and property management and investment company. On April 1, 2008, we completed the acquisition of American Financial Realty Trust (NYSE: AFR), or American Financial, in a transaction with a total value of approximately $3.3 billion, including the assumption of approximately $1.3 billion of American Financial’s secured debt.
Our commercial real estate finance business, which operates under the name Gramercy Finance, focuses on the direct origination, acquisition and portfolio management of whole loans, bridge loans, subordinate interests in whole loans, mezzanine loans, preferred equity, commercial mortgage-backed securities, or CMBS, and other real estate related securities.
Our property management and investment business, which operates under the name Gramercy Realty, historically focused on the acquisition and management of commercial properties leased primarily to regulated financial institutions and affiliated users throughout the United States. These institutions are for the most part deposit taking commercial banks, thrifts and credit unions, which we generally refer to as “banks.” Our portfolio of wholly-owned and jointly-owned bank branches and office buildings is leased to large banks such as Bank of America, N.A., or Bank of America, Wells Fargo Bank National Association (formerly Wachovia Bank, National Association), or Wells Fargo Bank, Regions Financial Corporation, or Regions Financial, and Citizens Financial Group, Inc., or Citizens Financial, and to mid-sized and community banks.
In September 2011, we entered into a collateral transfer and settlement agreement, or Settlement Agreement, for an orderly transition of substantially all of Gramercy Realty’s assets to Gramercy Realty’s senior mezzanine lenders in full satisfaction of Gramercy Realty’s obligations with respect to Gramercy Realty’s $240.5 million mortgage loan, or the Goldman Mortgage Loan, and Gramercy Realty’s $549.7 million senior and junior mezzanine loans, or the Goldman Mezzanine Loans, in exchange for a mutual release of claims among us and the mortgage and mezzanine lenders and, subject to certain termination provisions, our continued management of Gramercy Realty’s assets on behalf of such mezzanine lenders for a fixed fee plus incentive fees. In July 2011, our Dana portfolio, which consists of 15 properties totaling approximately 3.8 million rentable square feet, was transferred to its mortgage lender through a deed in lieu of foreclosure. Subsequent to those agreements, the business of Gramercy Realty will change from being primarily an owner of commercial properties to being primarily a third-party manager of commercial properties. The scale of Gramercy Realty’s revenues will decline substantially as a substantial portion of net revenues from property operations will be replaced with fee revenues of a substantially smaller scale. Additionally, as assets are transferred, our total assets and liabilities are expected to decline. If the transfer had happened as of December 31, 2010, our assets would have declined from approximately $5.5 billion to approximately $2.8 billion and our liabilities would have declined from approximately $6.0 billion to approximately $2.9 billion. Our consolidated financial statements would have reflected significant liquidity including cash and cash equivalents of approximately $185.8 million and we would have no recourse debt obligations outstanding. We anticipate all transfers under the Settlement Agreement to be completed by December 15, 2011. After all transfers are complete, we expect to own a portfolio of commercial real estate with an aggregate book value of approximately $108.5 million, in addition to approximately $1.2 billion of loan investments, approximately $1.0 billion of CMBS, and approximately $463.1 million in other assets, based on our Consolidated Balance Sheet as of December 31, 2010.
During 2010, we recorded impairment charges totaling $912.1 million in continuing operations to reduce the carrying value of 692 properties to estimated fair value. All of the impaired properties are part of the Gramercy Realty portfolio and serve as collateral for the Goldman Mezzanine Loans. Substantially all of the impaired properties will be transferred to the mezzanine lenders pursuant to the Settlement Agreement. As a result of recording these impairments, our total stockholders’ equity, or book equity, is negative $493.9 million as of December 31, 2010 as compared to a positive book equity balance of $566.2 million as of December 31, 2009. The carrying value of liabilities associated with the impaired properties has not been adjusted and remained outstanding as of December 31, 2010. As of December 31, 2010, the liabilities of the impaired properties exceed the carrying value of the assets and accordingly, the subsequent transfer of assets and liabilities pursuant to the Settlement Agreement will generate gains as the carrying values of such liabilities
1
TABLE OF CONTENTS
are reduced to $0, which in turn will reduce our negative book equity balance. After all transfers under the Settlement Agreement are complete, which we anticipate will occur by December 15, 2011, we expect that stockholders’ equity will remain negative, however, such negative balance will be substantially lower than the negative $493.9 million balance presented on the December 31, 2010 balance sheet.
Neither Gramercy Finance nor Gramercy Realty is a separate legal entity but are divisions through which our commercial real estate finance and property management and investment businesses are conducted.
At December 31, 2010, we owned approximately 25.3 million net rentable square feet of commercial real estate in 36 states and the District of Columbia with an aggregate book value of approximately $2.6 billion, in addition to $1.1 billion of loan investments, $1.0 billion of CMBS, and $731.4 million in other assets. As of December 31, 2010, approximately 48.0% of our assets were comprised of commercial property, 20.4% of debt investments, 18.3% of commercial mortgage real estate securities and 13.3% of other assets.
Our corporate offices are located in midtown Manhattan at 420 Lexington Avenue, New York, New York 10170. As of December 31, 2010, we had 135 employees. We can be contacted at (212) 297-1000. We maintain a website atwww.gkk.com. On our website, you can obtain, free of charge, a copy of our annual report on Form 10-K, quarterly reports on Form 10-Q, current reports on Form 8-K, and amendments to those reports filed or furnished pursuant to Section 13(a) or 15(d) of the Securities Exchange Act of 1934, as amended, or the Exchange Act, as soon as practicable after we file such material electronically with, or furnish it to, the Securities and Exchange Commission, or the SEC. We have also made available on our website our audit committee charter, compensation committee charter, nominating and corporate governance committee charter, code of business conduct and ethics and corporate governance principles. You can also read and copy materials we file with the SEC at its Public Reference Room at 100 F Street, NE, Washington, DC 20549 (1-800-SEC-0330). The SEC maintains an Internet site (http://www.sec.gov) that contains reports, proxy and information statements, and other information regarding the issuers that file electronically with the SEC.
Corporate Structure
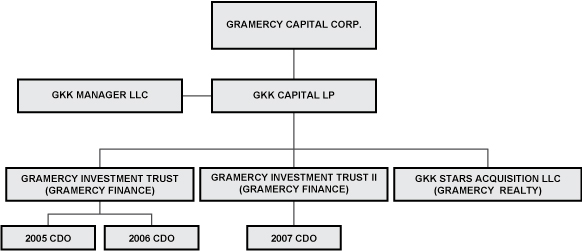
We were formed in April 2004 as a Maryland corporation and we completed our initial public offering in August 2004. We conduct substantially all of our operations through our operating partnership, GKK Capital LP, or our Operating Partnership. We are the sole general partner of our Operating Partnership. Our Operating Partnership conducts our finance business primarily through two private real estate investment trusts, or REITs, Gramercy Investment Trust and Gramercy Investment Trust II, and our commercial real estate investment and property management business through GKK Stars Acquisition LLC and various other wholly owned entities. The chart below summarizes the organizational structure of these entities as of December 31, 2010:
2
TABLE OF CONTENTS
Prior to the internalization of our management in April 2009, we were externally managed and advised by GKK Manager LLC, or the Manager, then a wholly-owned subsidiary of SL Green Realty Corp. (NYSE: SLG), or SL Green, which owned approximately 10.7% of the outstanding shares of our common stock as of December 31, 2010 and is our largest stockholder. On April 24, 2009, we completed the internalization of our management through the direct acquisition of the Manager from SL Green. As a result of the internalization, beginning in May 2009, management and incentive fees payable by us to the Manager ceased and we added 77 former employees of the Manager to our own staff.
We have elected to be taxed as a REIT under the Internal Revenue Code of 1986, as amended, or the Internal Revenue Code, and generally will not be subject to U.S. federal income taxes to the extent we distribute our taxable income, if any, to our stockholders. We have in the past established, and may in the future establish, taxable REIT subsidiaries, or TRSs, to effect various taxable transactions. Those TRSs would incur U.S. federal, state and local taxes on the taxable income from their activities.
Unless the context requires otherwise, all references to “Gramercy,” “the Company,” “we,” “our,” and “us” in this annual report mean Gramercy Capital Corp., a Maryland corporation, and one or more of its subsidiaries, including our Operating Partnership.
Business and Strategy
During 2010, we remained focused on improving our consolidated balance sheet by reducing leverage, generating liquidity from existing assets, actively managing portfolio credit, accretively re-investing repayments from our loan and CMBS investments and renewing expiring leases.
In December 2010, we closed on the sale of certain investments to SL Green, including our 45% joint venture interests in the leased fee at 885 Third Avenue and 2 Herald Square, the entire leased fee interest in 292 Madison Avenue and a $38.7 million mezzanine loan secured by equity interests in 601 West 26th Street, New York, NY, also known as the Starrett-Lehigh Building, for an aggregate price of $390.8 million, including the assumption of $265.6 million of mortgage debt. Net of associated costs and including the release of approximately $6.0 million posted as cash collateral for related letters of credit, these transactions increased our unrestricted corporate liquidity by approximately $89.9 million and increased our restricted cash in one of our collaterized debt obligations, or CDOs, by approximately $38.9 million.
In November 2010, we completed a tender offer for approximately 23.4% of the outstanding shares of our Series A cumulative redeemable preferred stock, or Series A preferred stock, or 1,074,178 shares, at $15.00 per preferred share. Subsequent to the tender, 3,525,822 shares remain outstanding. Net of expenses, the tender offer used approximately $16.6 million of unrestricted cash and resulted in the extinguishment of accrued preferred stock dividends of approximately $4.4 million for no additional proceeds. The excess of the carrying amount of tendered Series A preferred stock over the consideration resulted in an increase in book value to the common stockholders of approximately $13.7 million.
In June 2010, we redeemed the remaining $52.5 million of junior subordinated notes liabilities by transferring to the holders of the junior subordinated notes an equivalent par value amount of various classes of bonds issued by our CDOs which were previously purchased by us in the open market and cash equivalents of $5.0 million. This redemption eliminated the liability for our junior subordinated notes from our consolidated financial statements, which had an original balance of $150.0 million. Additionally, during 2010, we repurchased $39.0 million of CDO bonds previously issued by two of our three CDOs, generating gains on early extinguishment of debt of approximately $19.4 million.
As a result of these and other transactions executed during the year, we increased our unrestricted cash on our balance sheet during the year by approximately $82.5 million to $220.8 million at December 31, 2010, increased restricted cash available for portfolio investments within two of our three CDOs by approximately $63.1 million to approximately $90.0 million at December 31, 2010 and reduced our secured and other debt by approximately $187.9 million to approximately $4.9 billion at December 31, 2010.
We also sought to extend or restructure the Goldman Mortgage Loan with Goldman Sachs Mortgage Company, or GSMC, Citicorp North America, Inc., or Citicorp, and SL Green and the Goldman Mezzanine Loans with KBS Real Estate Investment Trust, Inc., or KBS, GSMC, Citicorp and SL Green. The Goldman Mortgage Loan is collateralized by approximately 195 properties held by Gramercy Realty and the Goldman
3
TABLE OF CONTENTS
Mezzanine Loans are collateralized by the equity interest in substantially all of the entities comprising our Gramercy Realty division, including its cash and cash equivalents totaling $35.0 million of our unrestricted cash as of December 31, 2010. Subsequent to the final maturity of the Goldman Mortgage Loan and the Goldman Mezzanine Loans in March 2011, we entered into a series of short term extensions to provide additional time to exchange and consider proposals for an extension, modification, restructuring or refinancing of the Goldman Mortgage Loan and the Goldman Mezzanine Loans and to explore an orderly transition of the collateral to the lenders if such discussions failed. On May 9, 2011, we announced that the scheduled maturity of the Goldman Mortgage Loan and the Goldman Mezzanine Loans occurred without repayment and without an extension or restructuring of the loans by the lenders.
Notwithstanding the maturity and non-repayment of the loans, we maintained active communications with the lenders and in September 2011, we entered into the Settlement Agreement for an orderly transition of substantially all of Gramercy Realty’s assets to the mezzanine lenders, in exchange for a mutual release of claims among us and the mortgage and mezzanine lenders and, subject to certain termination provisions, an arrangement for our continued management of Gramercy Realty’s assets on behalf of such mezzanine lenders for a fixed fee plus incentive fees. In July 2011, our Dana portfolio, which consists of 15 properties totaling approximately 3.8 million rentable square feet, was transferred to its mortgage lender through a deed in lieu of foreclosure. Subsequent to the execution of the Settlement Agreement, the business of Gramercy Realty will change from being primarily an owner of commercial properties to being primarily a third party manager of commercial properties. The scale of Gramercy Realty’s revenues will substantially decline as a substantial portion of net revenues from property operations will be replaced with fee revenues of a substantially smaller scale. Additionally, as assets are transferred, our total assets and liabilities are expected to decline substantially.
Property Management and Investment
Our property management and investment business operates under the name Gramercy Realty. It historically focused on the acquisition and/or management of commercial properties primarily leased on a long-term basis to regulated financial institutions and affiliated users throughout the United States. The Gramercy Realty portfolio of bank branches and office buildings is leased to large banks such as Bank of America, Wells Fargo Bank, Regions Financial and Citizens Financial and to mid-sized and community banks. Summarized in the table below are our key property portfolio statistics as of December 31, 2010:
| | | | | | | | | | | | |
| | Number of Properties | | Rentable Square Feet | | Occupancy |
| Properties(1) | | December 31,
2010 | | December 31,
2009 | | December 31,
2010 | | December 31,
2009 | | December 31,
2010 | | December 31,
2009 |
| Branches | | | 571 | | | | 583 | | | | 3,689,190 | | | | 3,726,399 | | | | 84.4 | % | | | 85.5 | % |
| Office Buildings | | | 321 | | | | 324 | | | | 21,613,441 | | | | 21,847,249 | | | | 82.3 | % | | | 85.9 | % |
| Land | | | 2 | | | | 6 | | | | — | | | | — | | | | — | | | | — | |
| Total | | | 894 | | | | 913 | | | | 25,302,631 | | | | 25,573,648 | | | | 82.6 | % | | | 85.9 | % |
| (1) | Excludes investments in unconsolidated joint ventures. Approximately 872 properties, of which 54 properties are held by an unconsolidated joint venture, comprising approximately 20.9 million rentable square feet, or the Lender Portfolio, are expected to be subject to the Settlement Agreement and ownership will be transferred to Gramercy Realty’s mezzanine lenders, in exchange for a mutual release of claims among us and the mortgage and mezzanine lenders and, subject to certain termination provisions, our continued management of the properties on behalf of the mezzanine lenders for a fixed fee plus incentive fees. In addition, our Dana portfolio, which consists of 15 properties comprising approximately 3.8 million rentable square feet, was transferred to its mortgage lender through a deed in lieu of foreclosure. We will continue to manage the Lender Portfolio. |
Gramercy Realty’s investment strategy was to acquire, operate and selectively dispose of commercial properties leased to investment-grade financial services companies for the purpose of generating stable earnings, substantial depreciation expense to shield us from taxes and the distribution requirements of earnings, and the potential for long-term capital appreciation in the value of the underlying real estate. After the transition, Gramercy Realty will also provide property and asset management services for the lender portfolio.
4
TABLE OF CONTENTS
Gramercy Realty seeks to capitalize on its knowledge of the market for bank branches and office properties occupied by financial institutions by applying a proactive approach to leasing, which includes: (i) identifying the most attractive and efficient use of vacant or low occupancy properties; (ii) renegotiating short-term leases to achieve longer lease terms at market rates; (iii) using market research; and (iv) utilizing a broad network of third-party brokers. Gramercy Realty has in the past provided tenants who lease multiple properties with specialized lease structures such as substitution, relocation and early termination rights, rent step-downs and in some cases, shorter lease terms in selected properties within a portfolio.
Gramercy Realty seeks to apply a customer-focused, hands-on approach to asset and property management, which includes: (i) focusing on tenant satisfaction by providing quality tenant services at affordable rental rates; (ii) hiring and closely overseeing third party property managers; and (iii) imposing strict return-on-investment procedures when evaluating capital expenditures, acquisitions, and dispositions.
Gramercy Realty typically and historically entered into long-term leases with financial institution tenants. As of December 31, 2010, the weighted average remaining term of our leases was 8.5 years and approximately 70.6% of our base revenue was derived from triple-net and bond-net leases.
In September 2011, we entered into an asset management arrangement upon the terms and conditions set forth in the Settlement Agreement, or Interim Management Agreement, to provide for our continued management of the lender portfolio through December 31, 2013 for a fixed fee of $10.0 million annually, the reimbursement of certain costs and incentive fees equal to 10.0% of the excess of the equity value, if any, of the transferred collateral over $375.0 million plus all new capital invested into the transferred collateral by KBS, its affiliates and/or joint venture partners, or the Threshold Value Participation, and 12.5% of the excess equity value, if any, of the transferred collateral over $468.5 million plus all new capital invested into the transferred collateral by KBS, its affiliates and/or joint venture partners, or the Excess Value Participation. The minimum amount of the Threshold Value Participation equals $3.5 million. The Threshold Value Participation and the Excess Value Participation will be valued and paid following the earlier of December 13, 2013, subject to extension to no later than December 31, 2015, or the sale by KBS of at least 90% (by value) of the transferred collateral. Under the terms of the Interim Management Agreement, we do not forfeit our incentive fee rights unless we resign as manager or are terminated as manager for cause and, with respect to the Excess Value Participation, in the event of a Failure to Agree Termination (as defined below). The Interim Management Agreement may be terminated by either party without cause 90 days following written notice; however, any notice of termination given by us cannot be effective until December 31, 2011 at the earliest. Notwithstanding the foregoing, we have agreed with KBS to promptly commence and diligently seek to negotiate a full and complete management services agreement by no later than March 31, 2012. If the parties do not execute a mutually acceptable asset management services agreement prior to March 31, 2012, a Failure to Agree Termination shall be effectuated and the Interim Management Agreement shall automatically terminate on June 30, 2012, without liability or a penalty of any kind, except for our loss of the Excess Value Participation.
Commercial Real Estate Finance
Our commercial real estate finance business operates under the name Gramercy Finance. We invest in a diversified portfolio of real estate loans, including whole loans, bridge loans, subordinate interests in whole loans, mezzanine loans, CMBS and preferred equity involving commercial properties throughout the United States. As of December 31, 2010, Gramercy Finance also held interests in one credit tenant net lease investment, or CTL investment, and eight interests in real estate acquired through foreclosures. When evaluating transactions, we assess our risk-adjusted return and target transactions with yields that seek to provide excess returns for the risks being taken. In 2010, we engaged in a relatively small amount of new investment activity. In 2010, we had focused primarily on the asset management of our existing portfolio of real estate loans and CMBS.
We generate income principally from the spread between the yields on our assets and the cost of our borrowing and hedging activities. We have historically financed, or may finance in the future, assets through a
5
TABLE OF CONTENTS
variety of techniques, including repurchase agreements, secured and unsecured credit facilities, CDOs, unsecured junior subordinated corporate debt, issuances of CMBS, and other structured financings. In addition, we attempt to match fund interest rates with like-kind debt (i.e., fixed-rate assets are financed with fixed-rate debt, and floating rate assets are financed with floating rate debt), through the use of hedges such as interest rate swaps, caps, or through a combination of these strategies. This allows us to reduce the impact of changing interest rates on our cash flow and earnings. We actively manage our positions, using our credit, structuring and asset management resources to enhance returns.
We attempt to actively manage and maintain the credit quality of our portfolio by using our management team’s expertise in structuring and repositioning investments to improve the quality and yield on managed investments. When investing in higher leverage transactions, we use guidelines and standards developed and employed by senior management, including the underwriting of collateral performance and valuation, reviewing the creditworthiness of the equity investors, securing additional forms of collateral and developing strategies to increase the likelihood of repayment. If defaults occur, we employ our asset management resources to mitigate the severity of any losses and seek to optimize the recovery from assets in the event that we foreclose upon them.
We seek to control the negotiation and structure of the debt transactions in which we invest, which enhances our ability to mitigate our losses, to negotiate loan documents that afford us appropriate rights and control over our collateral, and to have the right to control the debt that is senior to our position. We generally avoid investments where we cannot secure adequate control rights, unless we believe the default risk is very low and the transaction involves high-quality sponsors. Our flexibility to invest in all or any part of a debt capital structure enables us to participate in many transactions and to retain only the investments that meet our investment parameters.
Our commercial real estate finance investments include the following:
Whole Loans — We originate or have originated fixed-rate, permanent whole loans with terms of up to 15 years. We may separate certain of these loans into tranches, which can be securitized and resold. When we do so, we occasionally retain that component of the whole loan that we believe has the most advantageous risk-adjusted returns. The retained interest can be the senior interest, a subordinate interest, a mezzanine loan or a preferred equity interest created in connection with such whole loan origination. At origination, our whole loans typically had last-dollar loan-to-value ratios between 65% and 75%. The initial stated maturity of our whole loan investments range from five years to 15 years. We may sell these investments prior to maturity.
Bridge Loans — We have offered floating rate bridge whole loans to borrowers who are seeking debt capital with a final term to maturity of not more than five years to be used in the acquisition, construction or redevelopment of a property. Typically, the borrower has identified a property in a favorable market that it believes to be poorly managed or undervalued. Bridge financing enables the borrower to employ short-term financing while improving the operating performance and physical aspects of the property and avoid burdening it with restrictive long-term debt. The bridge loans we originated are predominantly secured by first mortgage liens on the property. At origination, our bridge loans typically had last-dollar loan-to-value ratios between 70% and 80%. The initial stated maturity of our bridge loans range from two years to five years, and we frequently hold these investments to maturity.
Our bridge loans occasionally have led to additional financing opportunities since bridge facilities are often a first step toward permanent financing or a sale of the underlying real estate. We generally view securitization as a financing rather than a trading activity. We have pooled together smaller bridge loans with other loans and retained the resulting non-investment grade interests (and interest-only certificates, if any) resulting from these securitizations, which historically have taken the form of CDOs.
Subordinate Interests in Whole Loans — We purchase or have purchased from third parties, and may retain from whole loans we originate and co-originate and securitize or sell, subordinate interests in whole loans. Subordinate interests are participation interests in mortgage notes or loans secured by a lien subordinated to a senior interest in the same loan. The subordination is generally evidenced by a co-lender or participation agreement between the holders of the related senior interest and the subordinate interest. In some instances, the subordinate interest lender may additionally require a security interest in the stock or partnership
6
TABLE OF CONTENTS
interests of the borrower as part of the transaction. When we originate whole loans, we may divide them, and securitize or sell the senior interest and keep a subordinate interest for investment, or the opposite.
At origination, our subordinate interests in whole loans typically had last-dollar loan-to-value ratios between 65% and 85%. Subordinate interest lenders have the same obligations, collateral and borrower as the senior interest lender, but typically are subordinated in recovery upon a default. Subordinate interests in whole loans share certain credit characteristics with second mortgages, in that both are subject to greater credit risk with respect to the underlying mortgage collateral than the corresponding senior interest.
Subordinate interests created from bridge loans generally will have terms matching those of the whole loan of which they are a part, typically two to five years. Subordinate interests created from whole loans generally will have terms of five years to fifteen years. We expect to hold subordinate interests in whole loans to their maturity.
Upon co-origination or acquisition of subordinate interests in whole loans from third parties, we may earn income on the investment, in addition to the interest payable on the subordinate piece, in the form of fees charged to the borrower under that note or by receiving principal payments in excess of the discounted price (below par value) we paid to acquire the note. When we create subordinate interests out of whole loans and then sell the senior interest, we allocate our basis in the whole loan among the two (or more) components to reflect the fair market value of the new instruments. We may realize a profit on sale if our allocated value is below the sale price or we may realize a loss on sale if our allocated value is above the sale price. Our ownership of a subordinate interest with controlling class rights, which typically means we have the ability to determine when, and in what manner, to exercise the rights and remedies afforded the holder of the senior interest, may, in the event the financing fails to perform according to its terms, cause us to elect to pursue our remedies as owner of the subordinate interest, which may include foreclosure on, or modification of, the note. In some cases, usually restricted to situations where the appraised value of the collateral for the debt falls below agreed levels relative to the total outstanding debt, the owner of the senior interest may be able to foreclose or modify the note against our wishes as holder of the subordinate interest. As a result, our economic and business interests may diverge from the interests of the holders of the senior interest. These divergent interests among the holders of each investment may result in conflicts of interest.
Mezzanine Loans — We acquire and originate, or have acquired or originated mezzanine loans that are senior to the borrower’s equity in, and subordinate to a mortgage loan, on a property. These loans are secured by pledges of ownership interests, typically in whole but occasionally in part (but usually with effective sole control over all the ownership interests), in entities that directly or indirectly own the real property. In addition, we may require other collateral to secure mezzanine loans, including letters of credit, personal guarantees, or collateral unrelated to the property. We typically structure our mezzanine loans to receive a stated coupon (benchmarked usually against LIBOR, or occasionally against a Treasury index or a swap index). We may in certain select instances structure our mezzanine loans to receive a stated coupon plus a percentage of gross revenues and a percentage of the increase in the fair market value of the property securing the loan, payable upon maturity, refinancing or sale of the property.
At origination, these investments typically have initial terms from two to ten years. Some transactions entail the issuance of more than one tranche or class of mezzanine debt. At origination, our mezzanine loans usually had last-dollar loan-to-value ratios of between 65% and 90%, depending on their vintage. Mezzanine loans frequently have maturities that match the maturity of the related mortgage loan but may have shorter or longer terms. We expect to hold these investments to maturity.
Commercial Mortgage-Backed Securities (CMBS) — We acquire, or have acquired, CMBS that are created when commercial loans are pooled and securitized. CMBS are secured by or evidenced by ownership interests in a single commercial mortgage loan or a pool of mortgage loans secured by commercial properties. We expect a majority of our CMBS to be rated by at least one rating agency. CMBS are generally pass-through certificates that represent beneficial ownership interests in common law trusts whose assets consist of defined portfolios of one or more commercial mortgage loans. They are typically issued in multiple tranches whereby the more senior classes are entitled to priority distributions from the trust’s income to make specified interest and principal payments on such tranches. Losses and other shortfalls on the mortgage pool
7
TABLE OF CONTENTS
are borne by the most subordinate classes, which receive payments only after the more senior classes have received all principal and/or interest to which they are entitled.
The credit quality of CMBS depends on the credit quality of the underlying mortgage loans, which is a function of factors including but not limited to:
| • | the principal amount of loans relative to the value of the related properties; |
| • | the mortgage loan terms (e.g. amortization and remaining term); |
| • | market assessment and geographic location; |
| • | construction quality and economic utility of the property; and |
| • | the creditworthiness of the tenants. |
Expected maturities of our CMBS investments range from several months to up to 15 years. We designate our CMBS investments as held to maturity or available for sale, on the date of acquisition of the investment. CMBS securities that we do not hold for the purpose of selling in the near-term but may dispose of prior to maturity, are designated as available-for-sale.
Preferred Equity — We have originated preferred equity investments in entities that directly or indirectly own commercial real estate. Preferred equity is not secured, but holders have priority relative to common equity holders on cash flow distributions and proceeds from capital events. In addition, preferred holders can often enhance their position and protect their equity position with covenants that limit the entity’s activities and grant us the exclusive right to control the property after an event of default. Occasionally, the first mortgage on a property prohibits additional liens and a preferred equity structure provides an attractive financing alternative. With preferred equity investments, we may become a special limited partner or member in the ownership entity and may be entitled to take certain actions, or cause liquidation, upon a default. Preferred equity typically is more highly leveraged, with last-dollar loan-to-value ratios at origination of 85% to more than 90%. We expect our preferred equity to have mandatory redemption dates (that is, maturity dates) that range from three years to five years, and we expect to hold these investments to maturity.
The aggregate carrying values, allocated by product type and weighted average coupons of our loans, and other lending investments and CMBS investments as of December 31, 2010 and December 31, 2009, were as follows (dollars in thousands):
| | | | | | | | | | | | | | | | |
| | | | | | | | | | | | | | | | |
| | Carrying Value(1) | | Allocation by
Investment Type | | Fixed Rate
Average Yield | | Floating Rate Average
Spread over LIBOR(2) |
| | | 2010 | | 2009 | | 2010 | | 2009 | | 2010 | | 2009 | | 2010 | | 2009 |
| Whole loans, floating rate | | $ | 659,095 | | | $ | 830,617 | | | | 58.7 | % | | | 60.2 | % | | | — | | | | — | | | | 330 bps | | | | 454 bps | |
| Whole loans, fixed rate | | | 132,268 | | | | 122,846 | | | | 11.8 | % | | | 8.9 | % | | | 7.16 | % | | | 6.89 | % | | | — | | | | — | |
| Subordinate interests in whole loans, floating rate | | | 75,066 | | | | 76,331 | | | | 6.7 | % | | | 5.5 | % | | | — | | | | — | | | | 297 bps | | | | 246 bps | |
| Subordinate interests in whole loans, fixed rate | | | 46,468 | | | | 44,988 | | | | 4.1 | % | | | 3.2 | % | | | 6.01 | % | | | 7.46 | % | | | — | | | | — | |
| Mezzanine loans, floating rate | | | 152,349 | | | | 190,668 | | | | 13.5 | % | | | 13.7 | % | | | — | | | | — | | | | 754 bps | | | | 577 bps | |
| Mezzanine loans, fixed rate | | | 48,828 | | | | 85,898 | | | | 4.3 | % | | | 6.2 | % | | | 12.69 | % | | | 8.08 | % | | | — | | | | — | |
| Preferred equity, floating rate | | | 5,224 | | | | 28,228 | | | | 0.5 | % | | | 2.0 | % | | | — | | | | — | | | | 350 bps | | | | 1,064 bps | |
| Preferred equity, fixed rate | | | 4,230 | | | | 4,256 | | | | 0.4 | % | | | 0.3 | % | | | 7.25 | % | | | 7.23 | % | | | — | | | | — | |
| Subtotal/Weighted average | | | 1,123,528 | | | | 1,383,832 | | | | 100.0 | % | | | 100.0 | % | | | 8.09 | % | | | 7.39 | % | | | 400 bps | | | | 476 bps | |
| CMBS, floating rate | | | 50,798 | | | | 67,876 | | | | 5.1 | % | | | 6.9 | % | | | — | | | | — | | | | 394 bps | | | | 254 bps | |
| CMBS, fixed rate | | | 954,369 | | | | 916,833 | | | | 94.9 | % | | | 93.1 | % | | | 8.37 | % | | | 7.84 | % | | | — | | | | — | |
| Subtotal/Weighted average | | | 1,005,167 | | | | 984,709 | | | | 100.0 | % | | | 100.0 | % | | | 8.37 | % | | | 7.84 | % | | | 394 bps | | | | 254 bps | |
| Total | | $ | 2,128,695 | | | $ | 2,368,541 | | | | 100.0 | % | | | 100.0 | % | | | 8.32 | % | | | 7.74 | % | | | 400 bps | | | | 463 bps | |
| (1) | Loans and other lending investments and CMBS investments are presented net of unamortized fees, discounts, unfunded commitments, reserves for loan losses and other adjustments. |
| (2) | Spreads over an index other than 30 day-LIBOR have been adjusted to a LIBOR based equivalent. In some cases, LIBOR is floored, giving rise to higher current effective spreads. |
8
TABLE OF CONTENTS
The percentage of non-performing loans and sub-performing loans were as follows (dollars in thousands):
| | | | | | | | | | | | |
| | Number of
Investments | | Unpaid
Principal
Balance | | Carrying
Value | | Weighted
Average Last
Dollar Loan
to Value(1) | | Non-performing | | Sub-performing |
| Whole loans | | | 29 | | | $ | 917,065 | | | $ | 791,363 | | | | 69.4 | % | | | — | | | | 1.7 | % |
| Subordinate interests in whole loans | | | 9 | | | | 181,640 | | | | 121,534 | | | | 67.6 | % | | | — | | | | — | |
| Mezzanine loans | | | 12 | | | | 254,129 | | | | 201,177 | | | | 75.6 | % | | | — | | | | 4.9 | % |
| Preferred equity | | | 2 | | | | 60,668 | | | | 9,454 | | | | 78.6 | % | | | — | | | | — | |
| Total | | | 52 | | | $ | 1,413,502 | | | $ | 1,123,528 | | | | 70.7 | % | | | — | | | | 2.1 | % |
| (1) | Loan to Value is based upon appraised value at the date of origination. Interest only strips have no appraised value for the calculation. |
The period during which we are permitted to reinvest principal payments on the underlying assets into qualifying replacement collateral for our 2005 and 2006 CDOs expired in July 2010 and July 2011, respectively, and will expire for our 2007 CDO in August 2012. In the past, our ability to reinvest has been instrumental in maintaining compliance with the overcollateralization and interest coverage tests for our CDOs. Following the conclusion of the reinvestment period in one of our CDOs, our ability to maintain compliance with such tests for that CDO will be negatively impacted.
As of December 31, 2010, Gramercy Finance also held interests in one CTL investment and eight interests in real estate acquired through foreclosures.
Financing Strategy
Our financing strategy historically had focused on the use of match-funded financing structures. This means that we sought whenever possible to match the maturities of our financial obligations with the maturities of our debt and CMBS investments to minimize the risk that we have to refinance our liabilities prior to the maturities of our assets, and to reduce the impact of changing interest rates on our cash flow and earnings. In addition, subject to maintaining our qualification as a REIT, we seek whenever possible to match fund interest rates with like-kind debt (i.e., fixed-rate assets are financed with fixed-rate debt, and floating rate assets are financed with floating rate debt), through the use of hedges such as interest rate swaps, caps, or through a combination of these strategies. This allowed us to reduce the impact on our cash flow and earnings of changing interest rates. We used short-term financing in the form of our repurchase agreements, unsecured revolving credit facilities and bridge financings in conjunction with or prior to the implementation of longer-term match-funded financing.
Gramercy Realty properties subject to long-term remaining lease terms were typically financed with long-term, fixed rate mortgage loans issued by life insurance companies or other institutional lenders. However, we had entered into relatively short-term borrowing arrangements to acquire American Financial, such as the Goldman Mortgage Loan and Goldman Mezzanine Loans which are described more fully in Note 9 to the Consolidated Financial Statements. For funding in our Gramercy Finance business, we have historically utilized securitization structures, including CDOs, as well as other match-funded financing structures. Our CDOs are multiple class debt securities, or bonds, secured by pools of assets, such as CMBS, bridge loans, permanent loans, subordinate interests in whole loans and mezzanine loans. In our CDOs, the assets are owned via sale, assignment or participation by the issuer and co-issuer of the applicable CDO and subject to trustee oversight for the benefit of the holders of the bonds. The bonds were rated by one or more rating agencies. One or more classes of the bonds were marketed to a wide variety of fixed income investors, which enabled us to achieve a relatively low cost of long-term financing. CDOs were a suitable long-term financing vehicle for our investments because they enabled us to maintain our strategy of funding substantially all of our assets and related liabilities using the same, or similar, LIBOR benchmark, lock-in a long-term cost of funds tied to LIBOR, and reduced the risk that we have to refinance our liabilities prior to the maturities of our investments.
9
TABLE OF CONTENTS
Each CDO may be replenished, pursuant to limitations imposed by the indenture (including compliance with certain financial covenants) and rating agency guidelines, with substitute collateral for debt investments that are repaid or sold during the first five years of the CDO. Thereafter, the CDO securities will be retired in sequential order from senior-most to junior-most as debt investments are repaid or sold. The financial statements of the issuers are consolidated in our financial statements. The originally rated investment grade notes in our CDOs are treated as a secured financing, and are non-recourse to us. Proceeds from the sale of the originally rated investment grade notes issued in each CDO were used to repay outstanding debt under our repurchase agreements and to fund additional investments.
Our charter and bylaws do not limit the amount of indebtedness we can incur. Our board of directors has discretion to deviate from or change our indebtedness policy at any time. However, we seek to maintain an adequate capital base to protect against various business environments in which our financing and hedging costs might exceed the interest income from our investments. These conditions could occur, for example, due to credit losses or when, due to interest rate fluctuations, interest income on our investment lags behind interest rate increases on our borrowings, which are predominantly variable rate. We use leverage for the sole purpose of financing our portfolio and not for the purpose of speculating on changes in interest rates.
We have historically relied on the securitization markets as a source of efficient match-funded financing structures for our portfolio of commercial real estate loans and CMBS investment portfolio. It is unlikely that in the near term we will be able to issue liabilities similar to our existing CDOs. In 2010, the capital markets environment remained difficult for us with limited, if any, availability of new debt or equity capital. Our stock price remained low and we currently have limited, if any, availability to the public or private equity capital markets. In this environment, we have sought to raise capital or maintain liquidity through other means, such as modifying debt arrangements, selling assets and aggressively managing our loan portfolio to encourage repayments, as well as reducing capital and overhead expenses and as a result, have engaged in limited new investment activity, other than reinvestment of available restricted cash with our CDOs.
Origination, Acquisition and Asset Management
Our origination, acquisition and disposition of investments are based on careful review and preparation, and generally proceeds as follows:
| • | potential investments are analyzed for consistency with investment parameters adopted by our board of directors; |
| • | potential investment transactions considered are presented at a pipeline meeting attended by our senior executive officers; and |
| • | prior to consummation, potential investment opportunities must receive the required level of approvals from our senior management and, when applicable, board of directors approval as described more fully below. |
Investment transactions of $3.0 million or less must be approved by one of our senior executive officers. The affirmative vote of all members of a credit committee consisting, of our most senior officers, is necessary to approve all transactions over $3 million. The investment committee of our board of directors must unanimously approve all transactions involving investments of (i) $50 million or more with respect to CMBS investments, (ii) $35 million or more with respect to whole loans, (iii) $30 million or more with respect to subordinate interests in whole loans, and (iv) $20 million or over with respect to mezzanine loans, preferred equity, CTL and real estate investments. The full board of directors must approve investments (i) over $75 million with respect to whole loans and CMBS investments, (ii) over $65 million with respect to subordinate interests in whole loans, (iii) over $55 million with respect to mezzanine loans, and (iv) over $50 million with respect to preferred equity, CTL and other real estate investments.
Origination
We utilize an extensive national network of relationships with property owners, developers, mortgage loan brokers, commercial and investment banks and institutional investors. We may originate investments in direct transactions with borrowers, we co-originate with or acquire existing assets from third parties, primarily financial institutions and we may occasionally co-invest with other institutional partners.
10
TABLE OF CONTENTS
Acquisition
Once a potential investment has been identified, we perform comprehensive financial, structural, property, real estate market, operational and legal due diligence to assess the risks of the investment. We generally review the following criteria as part of the underwriting process, where applicable:
| • | the historic, in-place and projected property revenues and expenses; |
| • | the potential for near-term revenue growth and opportunity for expense reduction and increased operating efficiencies; |
| • | accountants may be engaged to audit operating expense recovery income; |
| • | the property’s location and its attributes; |
| • | the valuation of the property based upon financial projections prepared by us and confirmed by an independent “as is” and/or “as stabilized” appraisal; |
| • | market assessment, including, review of tenant lease files, surveys of property sales and leasing comparables based on conversations with local property owners, leasing brokers, investment sales brokers and other local market participants, and an analysis of area economic and demographic trends, and a review of an acceptable mortgagee’s title policy; |
| • | market rents, leasing projections for major vacant spaces and near-term vacancies, frequently prepared by commercial leasing brokers with local knowledge, or by members of our leasing and asset management group, and confirmed by discussion with other owners of competitive commercial properties in the same sub-market; |
| • | the terms and form of the leases at a property; |
| • | structural and environmental review of the property, including review of engineering and environmental reports and a site inspection, to determine future maintenance and capital expenditure requirements; |
| • | the requirements for any reserves, including those for immediate repairs or rehabilitation, replacement reserves, tenant improvement and leasing commission costs, real estate taxes and property, casualty and liability insurance; |
| • | the “Net Cash Flow” for a property, which is a set of calculations and adjustments prepared to assist in evaluating a property’s cash flows. The Net Cash Flow is generally the estimated stabilized annual revenue derived from the use and operation of the property (consisting primarily of rental income and reimbursement of expenses where applicable) after an allowance for vacancies, concessions and credit losses, less estimated stabilized annual expenses; |
| • | for financing transactions, credit quality of the borrower and sponsors through background checks and review of financial strength and real estate operating experience; and |
| • | for real estate investments, the credit quality and financial conditions of the financial institution that occupies all, or substantially all, of the property(ies) considered for acquisition. |
For debt investments at Gramercy Finance, additional key factors that are considered in credit decisions include, but are not limited to, debt service coverage, loan-to-value ratios and property and financial operating performance. Consideration is also given to other factors such as the experience, financial strength, reputation and investment track record of the borrower and individual sponsors, additional forms of collateral and identified likely strategies to effect repayment. Once diligence is completed, we determine the level in the capital structure at which an investment will be made, the pricing for such an investment, and the required legal and structural protections.
Asset Management
Our leasing and asset management group within Gramercy Realty is organized by geographic region and provides: tenant relationship management, leasing, operations, property management, lease administration, property accounting and construction management. Regional heads are primarily accountable for the
11
TABLE OF CONTENTS
profitability and investment performance of their portfolios, and have control over income statements and capital expenditures, subject to oversight and approval of senior management. To the extent that we provide asset management services for third-party property owners, we provide such services in consultation with and at the direction of such owners. Our approach is intended to provide greater control over operations, capital expenditures, and return on investment.
Our loan servicing and asset management group within Gramercy Finance monitors our debt investments to identify any potential underperformance of the asset and work to remedy the situation in an expeditious manner in order to mitigate any effects of underperformance. The asset manager is responsible for understanding our business plan with respect to each investment and the borrower’s business plan with respect to each property underlying our debt investment and monitoring performance measured against that plan. We believe that asset management is a vital component of our business because it enables us to be responsive, timely, anticipate changes to financing requirements and generally develop a strong relationship that can lead to repeat business.
Operating Policies
Investment and Borrowing Guidelines
We operate pursuant to the following general guidelines for our investments and borrowings:
| • | no investments are made that we believe would cause us to fail to qualify as a REIT; |
| • | no investments are made that we believe would cause us to be regulated as an investment company under the Investment Company Act of 1940, as amended, or the Investment Company Act; |
| • | substantially all assets and investments are financed in whole or in part through mortgages, securitization, syndication and secured borrowings, and assets intended for inclusion in traditional securitization transactions will be hedged, where possible, against movements in the applicable swap yield through customary techniques; |
| • | we engage an outside advisory firm to assist in executing and monitoring hedges, advising management on the appropriateness of such hedges, and establishing the appropriate tax and accounting treatment of our hedges; and |
| • | we will not co-invest with SL Green or any of its affiliates unless the terms of such transaction are approved by a majority of our independent directors. |
These investment guidelines may be changed by our board of directors without the approval of our stockholders.
For debt investments, the affirmative vote of all members of a credit committee consisting of our most senior executive officers is necessary to approve all transactions over $3 million.
Hedging Activities
Subject to maintaining qualification as a REIT, we use a variety of commonly used derivative instruments that are considered conventional, or “plain vanilla” derivatives, including interest rate swaps, caps, collars and floors, in our risk management strategy to limit the effects of changes in interest rates on our operations. Each of our CDOs maintains a minimum amount of allowable unhedged interest rate risk. The CDO that closed in 2005 permits a minimum amount of unhedged interest rate risk of 20% of the net outstanding principal balance and both the CDO that closed in 2006 and the CDO that closed in 2007 permit a minimum amount of unhedged interest rate risk of 5% of the net outstanding principal balance. Our hedging strategy consists of entering into interest rate swap and interest rate cap contracts for Gramercy Finance and interest rate caps for Gramercy Realty. The value of our derivatives may fluctuate over time in response to changing market conditions, and will tend to change inversely with the value of the risk in our liabilities that we intend to hedge. Hedges are sometimes ineffective because the correlation between changes in value of the underlying investment and the derivative instrument is less than was expected when the hedging transaction was undertaken. We continuously monitor the effectiveness of our hedging strategies and we have retained the services of an outside financial services firm with expertise in the use of derivative instruments to advise us
12
TABLE OF CONTENTS
on our overall hedging strategy, to effect hedging trades, and to provide the appropriate designation and accounting of all hedging activities from a GAAP and tax accounting and reporting perspective.
These instruments are used to hedge as much of the interest rate risk as we determine is in the best interest of our stockholders, given the cost of such hedges and the need to maintain our qualifications as a REIT. To the extent that we enter into a hedging contract to reduce interest rate risk on indebtedness incurred to acquire or carry real estate assets, any income that we derive from the contract is not considered income for purposes of the REIT 95% gross income test and is either non-qualifying for the 75% gross income test (hedges entered into prior to August 1, 2008), or is not considered income for purposes of the 75% gross income test (hedges entered into after July 31, 2008). This change in character for the 75% gross income test was included in the Housing and Economic Recovery Act of 2008. We can elect to bear a level of interest rate risk that could otherwise be hedged when we believe, based on all relevant facts, that bearing such risk is advisable.
Disposition Policies
We evaluate our assets on a regular basis to determine if they continue to satisfy our investment criteria. Subject to market conditions certain restrictions applicable to REITs, we may sell our investments opportunistically and use the proceeds of any such sale for debt reduction, additional acquisitions or working capital purposes.
Equity Capital Policies
Subject to applicable law, our board of directors has the authority, without further stockholder approval, to issue additional authorized common stock and preferred stock or otherwise raise capital, including through the issuance of senior securities, in any manner and on the terms and for the consideration it deems appropriate.
We may, under certain circumstances, repurchase our common or preferred stock in private transactions with our stockholders if those purchases are approved by our board of directors. Our board of directors has no present intention of causing us to repurchase any shares, and any action would only be taken in conformity with applicable federal and state laws and the applicable requirements for qualifying as a REIT, for so long as our board of directors concludes that we should remain a qualified REIT.
Other Policies
We operate in a manner that we believe will not subject us to regulation under the Investment Company Act. We may invest in the securities of other issuers for the purpose of exercising control over such issuers. We do not underwrite the securities of other issuers.
Future Revisions in Policies and Strategies
Our board of directors has the power to modify or waive our investment guidelines, policies and strategies. Among other factors, developments in the market that either affects the policies and strategies mentioned herein or that change our assessment of the market may cause our board of directors to revise our investment guidelines, policies and strategies.
Competition
In our investment activities, we compete with other REITs, specialty finance companies, savings and loan associations, banks, mortgage bankers, insurance companies, mutual funds, hedge funds, institutional investors, investment banking firms, private equity firms, other lenders, governmental bodies and other entities, which may have greater financial resources and lower costs of capital available to them than we have. We also compete with numerous commercial properties for tenants. Some of the properties we compete with may be newer or have more desirable locations or the competing properties’ owners may be willing to accept lower rents than are acceptable to us. In addition, the competitive environment for leasing is affected considerably by a number of factors including, among other things, changes in economic factors and supply and demand of space. These factors may make it difficult for us to lease existing vacant space and space associated with future lease expirations at rental rates that are sufficient to meeting our capital needs.
13
TABLE OF CONTENTS
To the extent that a competitor is willing to risk larger amounts of capital in a particular transaction or to employ more liberal standards when evaluating potential investments than we are, our origination volume and profit margins for our investment portfolio could be adversely affected. Our competitors may also be willing to accept lower returns on their investments and may succeed in originating or acquiring assets that we have targeted for acquisition. Although we believe that we are positioned to compete effectively in each facet of our business, there is considerable competition in our market sector and there can be no assurance that we will compete effectively or that we will not encounter further increased competition in the future that could limit our ability to conduct our business effectively.
Compliance With The Americans With Disabilities Act Of 1990
Properties that we acquire, and the properties underlying our investments, are required to meet federal requirements related to access and use by disabled persons as a result of the Americans with Disabilities Act of 1990. In addition, a number of additional federal, state and local laws may require modifications to any properties we purchase, or may restrict further renovations of our properties, with respect to access by disabled persons. Noncompliance with these laws or regulations could result in the imposition of fines or an award of damages to private litigants. Additional legislation could impose additional financial obligations or restrictions with respect to access by disabled persons. If required changes involve greater expenditures than we currently anticipate, or if the changes must be made on a more accelerated basis, our ability to make distributions could be adversely affected.
Industry Segments
We have determined that we operate two reportable operating segments: Finance and Real Estate. The reportable segments were determined based on the management approach, which looks to our internal organizational structure. These two lines of business require different support infrastructures.
The Real Estate segment includes substantially all of our activities related to the ownership, property management, investment and leasing of commercial real estate. We have an integrated asset management platform within Gramercy Realty to consolidate responsibility for, and control over, leasing, lease administration, property management, operations, construction management, tenant relationship management and property accounting. To the extent that we provide asset management services for third-party property owners, we provide such services in consultation with and at the direction of such owners.
The Finance segment includes all of our activities related to senior and mezzanine real estate debt and senior and mezzanine capital investment activities and the financing thereof, including our CMBS investments. These include a dedicated management team within Gramercy Finance for real estate lending, origination, acquisition, sales and syndications, asset management and primary and special servicing.
Segment revenue and profit information is presented in Note 21 to the Consolidated Financial Statements.
Employees
As of December 31, 2010, we had 135 employees. Our employees are not represented by a collective bargaining agreement.
Corporate Governance and Internet Address; Where Readers Can Find Additional Information
We emphasize the importance of professional business conduct and ethics through our corporate governance initiatives. Our board of directors consists of a majority of independent directors; the Audit, Nominating and Corporate Governance, and Compensation Committees of our board of directors are composed exclusively of independent directors. We have adopted corporate governance guidelines and a code of business conduct and ethics.
We file annual, quarterly and current reports, proxy statements and other information required by the Exchange Act with the SEC. Readers may read and copy any document that we file at the SEC’s Public Reference Room located at 100 F Street, N.E., Washington, D.C. 20549, U.S.A. Please call the SEC at 1-800-SEC-0330 for further information on the Public Reference Room. Our SEC filings are also available to the public from the SEC’s internet site athttp://www.sec.gov. Copies of these reports, proxy statements and other information can also be inspected at the offices of the New York Stock Exchange, Inc., 20 Broad Street, New York, New York 10005.
14
TABLE OF CONTENTS
Our internet site ishttp://www.gkk.com. We make available free of charge through our internet site our annual reports on Form 10-K, quarterly reports on Form 10-Q, current reports on Form 8-K, proxy statements and Forms 3, 4 and 5 filed on behalf of directors and executive officers and any amendments to those reports filed or furnished pursuant to the Exchange Act as soon as reasonably practicable after we electronically file such material with, or furnish it to, the SEC. Also posted on our website in the “Investor Relations — Corporate Governance” section are charters for our Audit Committee, Compensation Committee and Nominating and Corporate Governance Committee as well as our Corporate Governance Guidelines and our Code of Business Conduct and Ethics governing our directors, officers and employees. Information on, or accessible through, our website is not a part of, and is not incorporated into, this report.
Investment Company Act Exemption
We have conducted our operations and intend to continue to conduct our operations so as not to become regulated as an investment company under the Investment Company Act. We believe that there are a number of exclusions or exemptions under the Investment Company Act that may be applicable to us. We will either be excluded from the definition of an investment company under Section 3(a)(1)(C) of the Investment Company Act, by owning or proposing to acquire “investment securities” having a value not exceeding 40% of the value of the our total assets (exclusive of U.S. Government securities and cash items) on an unconsolidated basis, or by qualifying for the exclusions from registration provided by Sections 3(a)(1)(A), 3(c)(5)(C) and/or 3(c)(6) of the Investment Company Act. We will monitor our portfolio periodically and prior to each acquisition to confirm that we continue to qualify for the relevant exclusion or exemption.
Qualifying for the Section 3(c)(5)(C) exemption requires that at least 55% of our portfolio be comprised of “qualifying assets,” and a total of at least 80% of our portfolio be comprised of “qualifying assets” and “real estate-related assets,” a category that includes qualifying assets. We generally expect whole mortgage loans, real property investments, and Tier 1 mezzanine loans to be qualifying assets, in each case meeting certain qualifications based on SEC staff no-action letters. Substantially all of the commercial properties owned in our Gramercy Realty segment are considered to be “real estate-related assets.” The treatment of distressed debt securities as qualifying assets is based on the characteristics of the particular type of loan, including its foreclosure rights. Although SEC staff no-action letters have not specifically addressed the categorization of these types of assets, we believe junior (first loss) interests in CMBS pools may constitute qualifying assets under Section 3(c)(5)(C), provided that we have the unilateral right to foreclose, directly or indirectly, on the mortgages in the pool and that we may act as the controlling class or directing holder of the pool.
Tier 1 mezzanine loans are loans granted to a mezzanine borrower that directly owns interests in the entity that owns the property being financed. Subordinate interests in whole loans may constitute qualifying assets under Section 3(c)(5)(C), provided that we have, among other things, approval rights in connection with any material decisions pertaining to the administration and servicing of the relevant mortgage loan and, in the event that the mortgage loan becomes non-performing, we have effective control over the remedies relating to the enforcement of the loan, including ultimate control of the foreclosure process. We generally do not treat preferred equity investments as qualifying assets. In relying on the exemption provided by Section 3(c)(5)(C), we also make investments so that at least 80% of our portfolio is comprised of qualifying assets and real estate-related assets, we expect that all of these classes of investments will be considered real estate-related assets under the Investment Company Act for purposes of the 80% investment threshold.
Qualification for the Section 3(a)(1)(C), Section 3(c)(5)(C) and/or Section 3(c)(6) exclusions or exemptions may limit our ability to make certain investments. No assurance can be given that the SEC staff will concur with our classification of our assets, or that the SEC staff will not, in the future, issue further guidance that may require us to reclassify those assets for purpose of qualifying for an exemption or exclusion from regulation under the Investment Company Act. To the extent that the staff of the SEC provides more specific guidance regarding any of the matters bearing upon the definition of investment company and the exceptions to that definition, we may be required to adjust our investment strategy accordingly. Any additional guidance from the staff of the SEC could provide additional flexibility to us, or it could further inhibit our ability to pursue the investment strategy we have chosen.
15
TABLE OF CONTENTS
The SEC recently solicited public comment on a wide range of issues relating to Section 3(c)(5)(C) of the 1940 Act, including the nature of the assets that qualify for purposes of the exemption and whether mortgage REITs should be regulated in a manner similar to investment companies. There can be no assurance that the laws and regulations governing the 1940 Act status of REITs, including the Division of Investment Management of the SEC providing more specific or different guidance regarding these exemptions, will not change in a manner that adversely affects our operations. If we or our subsidiaries fail to maintain an exception or exemption from the 1940 Act, we could, among other things, be required either to (a) change the manner in which we conduct our operations to avoid being required to register as an investment company, (b) effect sales of our assets in a manner that, or at a time when, we would not otherwise choose to do so, or (c) register as an investment company, any of which could negatively affect the value of our common stock, the sustainability of our business model, and our ability to make distributions which could have an adverse effect on our business and the market price for our shares of common stock.
Environmental Matters
Under various federal, state and local environmental laws, ordinances and regulations, a current or previous owner of real estate (including, in certain circumstances, a secured lender that succeeds to ownership or control of a property) may become liable for the costs of removal or remediation of certain hazardous or toxic substances at, on, under or in its property. Those laws typically impose cleanup responsibility and liability without regard to whether the owner or control party knew of or was responsible for the release or presence of such hazardous or toxic substances. The costs of investigation, remediation or removal of those substances may be substantial. The owner or control party of a site may be subject to common law claims by third parties based on damages and costs resulting from environmental contamination emanating from a site. Certain environmental laws also impose liability in connection with the handling of or exposure to asbestos-containing materials, pursuant to which third parties may seek recovery from owners of real properties for personal injuries associated with asbestos-containing materials. Absent succeeding to ownership or control of real property, a secured lender is not likely to be subject to any of these forms of environmental liability. We are not currently aware of any environmental issues which could materially affect us or our operations.
Federal regulations require building owners and those exercising control over a building’s management to identify and warn, via signs and labels, of potential hazards posed by workplace exposure to installed asbestos-containing materials and potentially asbestos-containing materials in the building. The regulations also set forth employee training, record keeping and due diligence requirements pertaining to asbestos- containing materials and potential asbestos-containing materials. Significant fines can be assessed for violation of these regulations. Building owners and those exercising control over a building’s management may be subject to an increased risk of personal injury lawsuits by workers and others exposed to asbestos-containing materials and potentially asbestos-containing materials as a result of these regulations. The regulations may affect the value of a building containing asbestos-containing materials and potential asbestos-containing materials in which we have invested. Federal, state and local laws and regulations also govern the removal, encapsulation, disturbance, handling and/or disposal of asbestos-containing materials and potential asbestos-containing materials when such materials are in poor condition or in the event of construction, remodeling, renovation or demolition of a building. Such laws may impose liability for improper handling or a release into the environment of asbestos-containing materials and potential asbestos-containing materials and may provide for fines to, and for third parties to seek recovery from, owners or operators of real properties for personal injury or improper work exposure associated with asbestos-containing materials and potentially asbestos-containing materials.
Prior to closing any property acquisition, we obtain environmental assessments in a manner we believe prudent in order to attempt to identify potential environmental concerns at such properties. These assessments are carried out in accordance with an appropriate level of due diligence and generally include a physical site inspection, a review of relevant federal, state and local environmental and health agency database records, one or more interviews with appropriate site-related personnel, review of the property’s chain of title and review of historic aerial photographs and other information on past uses of the property. We may also conduct limited subsurface investigations and test for substances of concern where the result of the first phase of the environmental assessments or other information indicates possible contamination or where our consultants recommend such procedures.
16
TABLE OF CONTENTS
While we purchase many of our properties on an “as is” basis, our purchase contracts for such properties contain an environmental contingency clause, which permits us to reject a property because of any environmental hazard at such property. However, we do acquire properties which may have asbestos abatement requirements, for which we set aside appropriate reserves.
We believe that our portfolio is in compliance in all material respects with all federal and state regulations regarding hazardous or toxic substances and other environmental matters.
Insurance
We carry commercial liability and all risk property insurance, including flood, where required, earthquake, wind and terrorism coverage, on substantially all of the properties that we own. For certain net leased properties, however, we rely on our tenant’s insurance and do not maintain separate coverage. We continue to monitor the state of the insurance market and the scope and costs of specialty coverage, including flood, earthquake, wind and terrorism. However, we cannot anticipate what coverage will be available on commercially reasonable terms in future policy years.
Our debt instruments, consisting primarily of mortgage loans secured by our properties (which are generally non-recourse to us), and senior and junior mezzanine loans, contain customary covenants requiring us to maintain insurance. Although we believe that we have adequate insurance coverage for purposes of these agreements, we may not be able to obtain an equivalent amount of coverage at reasonable costs in the future. Further, if lenders insist on greater coverage than we are able to obtain it could adversely affect our ability to finance and/or refinance our properties and expand our portfolio.
17
TABLE OF CONTENTS
ITEM 1A. RISK FACTORS
Risks Related to Our Business
Our senior management’s focus on the Goldman Mortgage Loan and the Goldman Mezzanine Loans has and may continue to adversely affect us.
As discussed throughout this Annual Report on Form 10-K, we sought to extend or restructure Gramercy Realty’s $240.5 million Goldman Mortgage Loan, and $549.7 million Goldman Mezzanine Loans. In September 2011, we negotiated an agreement for an orderly transition of all or substantially all of Gramercy Realty’s assets to the mezzanine lenders, a mutual release of claims among us and the mortgage and mezzanine lenders and, subject to certain termination provisions, our continued management of Gramercy Realty’s assets on behalf of the mezzanine lenders for a fixed fee plus incentive fees. The terms of such an agreement provide for transfer of assets commencing at execution and continuing through an outside transfer date of December 15, 2011. Focus on this effort has and could continue to adversely affect our operations in a number of ways, including the risks that such activities could, among other things:
| • | disrupt operations and distract management; |
| • | fail to successfully achieve the expected benefits; |
| • | be time consuming and expensive and result in the loss of business opportunities; |
| • | subject us to litigation; |
| • | result in increased difficulties due to uncertainties regarding our future operations; and |
| • | cause the trading price of our common and preferred stock to decrease and/or to be highly volatile. |
Focus on recapitalizing our Company may reduce new investment activity.
Subsequent to the execution of the Settlement Agreement with respect to Gramercy Realty, our board of directors continues to explore various means by which we might improve our position and thereby potentially create value for our stockholders, and has created a special committee to evaluate strategic alternatives. The committee is authorized to engage a financial adviser to assist in this process. It is not possible to predict whether or when any such actions can or will be implemented. During this period, it is possible that new investment activity may be limited, other than reinvestment of available restricted cash within our CDOs. A reduction in new investment activity may have an adverse effect on our investment income and our net income available to stockholders.
A negative book equity balance may impair our ability to raise new debt or equity capital.
In September 2011, we entered into the Settlement Agreement for an orderly transition of substantially all of Gramercy Realty’s assets to the mezzanine lenders, in exchange for a mutual release of claims among us and the mortgage and mezzanine lenders and, subject to certain termination provisions, an arrangement for our continued management of Gramercy Realty’s assets on behalf of the mezzanine lenders for a fixed fee plus incentive fees. During 2010, we recorded impairment charges totaling $912.1 million in continuing operations to reduce the carrying value of 692 properties to estimated fair value. All of the impaired properties serve as collateral for the Goldman Mezzanine Loans and are part of the Gramercy Realty portfolio. As a result of recording these impairments, our book equity balance is negative as of December 31, 2010 and although the negative balance will improve as Gramercy Realty’s assets are transferred and the corresponding liabilities are removed from our balance sheet in connection with the Settlement Agreement, we expect that stockholders’ equity will remain negative after all transfers are complete. The capital markets may have a negative perception of our long-term and short-term financial prospects due to a negative book equity balance and accordingly, our ability to raise new debt or equity capital could be impaired.
Liquidity in the capital markets is essential to our businesses and future growth and we rely on external sources to finance a significant portion of our operations. We have limited liquidity and we may be required to pursue certain measures in order to maintain or enhance our liquidity.
Liquidity is essential to our business and our ability to operate and grow and to fund existing obligations. A primary source of liquidity for us has been the equity and debt capital markets, including issuing common
18
TABLE OF CONTENTS
equity, perpetual preferred equity and trust preferred securities. We depend on external financing to fund the growth of our business mainly because, as a REIT, we are required under the Internal Revenue Code to distribute 90% of our taxable income to our stockholders, including taxable income where we do not receive corresponding cash. Our access to equity or debt financing depends on the willingness of third parties to make equity investments in us and provide us with corporate or asset level debt. It also depends on conditions in the capital markets generally. Companies in the real estate industry have at times historically experienced limited availability of capital, and new capital sources may not be available on acceptable terms, if at all. Our ability to raise capital could be impaired if the capital markets have a negative perception of our long-term and short-term financial prospects or the prospects for mortgage REITs and the commercial real estate market generally. We cannot be certain that sufficient funding or capital will be available to us in the future on terms that are acceptable to us, if at all. If we cannot obtain sufficient funding on acceptable terms, or at all, we will not be able to operate and/or grow our business, which would likely have a negative impact on the market price of our common stock and our ability to make distributions to our stockholders. In such an instance, a lack of sufficient liquidity would have a material adverse impact on our operations, cash flow, financial condition and our ability to continue as a going concern.
As of December 31, 2010, excluding the $35.0 million of cash within our Gramercy Realty division, our unrestricted cash balance was $185.8 million. We currently do not have a corporate credit facility to draw against for liquidity purposes.
We may be required to pursue certain measures in order to maintain or enhance our liquidity, including seeking the extension or replacement of our debt facilities, potentially selling assets at unfavorable prices and/or reducing our operating expenses. Sales of assets held in the CDOs do not generate unrestricted cash or further liquidity for us because proceeds from CDO asset sales are restricted and available only for reinvestment within the CDOs during the applicable reinvestment period and subject to compliance with various collateral qualification tests. We cannot assure you that we will be successful in measures to improve our liquidity.
For information about our available sources of funds, see “Management’s Discussion and Analysis of Financial Condition and Results of Operations — Liquidity and Capital Resources” and the notes to the Consolidated Financial Statements in this Annual Report on Form 10-K.
Failure to comply with CDO coverage tests may have a negative impact on our liquidity and net cash flows.
The terms of our CDOs include certain overcollateralization and interest coverage tests, which are used primarily to determine whether and to what extent principal and interest paid on the debt securities and other assets that serve as collateral underlying the CDOs may be used to pay principal and interest on the various classes of notes payable issued by the CDOs. If any of the various CDO tests are not satisfied, distributions that we currently receive with respect to our equity interests in the CDOs, interest and principal payments that we currently receive on certain of the tranches of CDO notes that we hold, as well as the subordinate management fees that we currently receive, will instead be redirected to pay principal on certain senior tranches of CDO notes that are not held by us. Because a material portion of our operating cash flow in 2010 came from our 2006 CDO, failure to satisfy the CDO tests could materially and adversely affect our liquidity and net cash flows. Our 2007 CDO failed its overcollateralization tests beginning with the November 2009 distribution date and our 2005 CDO failed its overcollateralization tests beginning with the April 2010 distribution date. We do not expect the 2007 CDO to regain compliance in 2011. Although our 2006 CDO was in compliance with its CDO tests as of December 31, 2010 and as of the July 2011 distribution date, and our 2005 CDO regained compliance with its CDO tests as of the July 2011 distribution date, the compliance margin was thin and relatively small declines in performance and credit metrics could cause the CDOs to fall out of compliance in the future. We cannot be certain that the CDO tests will continue to be satisfied and that we will continue to receive cash flows relating to our CDOs in the future. If the cash flow from our 2005 and 2006 CDOs is redirected, our business, financial condition, results of operations and our ability to continue as a going concern would be materially and adversely affected.
Apart from overcollateralization and interest coverage tests, the operative documents for the CDOs provide for certain events of default, the occurrence of which would entitle a senior class or classes of notes payable to accelerate the notes payable of such CDO and, depending upon the circumstances, require a
19
TABLE OF CONTENTS
liquidation of the collateral under then-current market conditions, which could result in higher levels of losses on the collateral and the notes payable of such CDO than might otherwise occur.
Additionally, we could, in certain instances, be removed as the collateral manager of our CDOs, which could result in a loss of the collateral management fees, which are remitted to us by our CDOs. If we were removed as collateral manager or as special servicer of our CDOs, a different collateral manager or special servicer appointed by the holders of the senior class or classes of notes may manage the CDO or service the notes in a manner that is not in our best interests as holder of the equity and subordinated classes of CDO securities.
Our CDOs could continue to generate taxable income for us despite the fact that if in the future we are not receiving cash distributions on our equity and subordinated note holdings from these CDOs. Should this occur, taxable income would continue to be recognized on each underlying investment in the relevant CDO. We would continue to be required to distribute 90% of our REIT taxable income (determined with regard to the dividends paid deduction and excluding net capital gain) from these transactions to continue to qualify as a REIT, despite the fact that we are not receiving cash distributions on our equity and subordinated note holdings from these CDOs.
We have historically utilized a significant amount of debt to finance our portfolios of debt investments and real estate investments, which may subject us to an increased risk of loss, adversely affecting the return on our investments and reducing cash available for distribution.
We have historically utilized a significant amount of debt to finance our operations, which can compound losses and reduce the cash available for distributions to our stockholders. We historically leveraged our portfolios through the use of securitizations, including the issuance of CDOs, mortgage and mezzanine borrowings and other borrowings. The leverage we employ varies depending on our ability to obtain financing, the loan-to-value and debt service coverage ratios of our assets, the yield on our assets, the targeted leveraged return we expect from our portfolios and our ability to meet ongoing covenants related to our asset mix and financial performance. Currently, neither our charter nor our bylaws impose any limitations on the extent to which we may leverage our assets. Substantially all of our loans and other lending investments and CMBS are pledged, as collateral for our secured borrowings under our CDOs. Our return on our investments and cash available for distribution to our stockholders may be reduced to the extent that changes in market conditions cause the cost of our financing to increase relative to the income that we can derive from the assets we acquire. For example, we have purchased, and may purchase in the future, both subordinate classes of bonds and certain investment grade classes of bonds in our CDOs which represent leveraged investments in the collateral debt securities and other underlying assets. The use of leverage through such CDOs creates the risk for the holders of these classes of bonds of increased exposure to losses on a leveraged basis as a result of defaults with respect to such collateral debt securities. As a result, the occurrence of defaults with respect to only a small portion of the collateral debt securities could result in the complete loss of the investment of the holders of the subordinate classes of bonds and defaults with respect to larger or a material portion of the collateral debt securities could result in complete or partial losses of the investment of the holders of certain investment grade classes of bonds.
Our debt service payments, including payments in connection with any CDOs, reduce our net income available for distributions. Moreover, we may not be able to meet our debt service obligations and, to the extent that we cannot, we risk the loss of some or all of our assets to foreclosure or sale to satisfy our debt obligations. Additionally, our ability to make scheduled payments of principal or interest on, or to refinance, our indebtedness depends on our future performance, which, to a certain extent, is subject to general economic, financial, competitive and other factors beyond our control. In particular, the credit crisis, which began in earnest in mid-2007 and spread throughout the global economy in 2008, 2009 and 2010, materially impacted our business. The credit crisis has, among other things, increased our costs of funds, eliminated our access to the unsecured debt markets and adversely affected our results of operations.
Our outstanding debt contains restrictive covenants relating to our operations.
When we obtain financing, lenders may impose restrictions on us that affect our ability to incur additional debt, our capability to make distributions to stockholders and our flexibility to determine our
20
TABLE OF CONTENTS
operating policies. Loan documents may contain negative covenants that could limit, among other things, our ability to repurchase stock, distribute more than a certain amount of our funds from operations and employ leverage beyond certain amounts.
Loan documents also may require compliance with various financial covenants, including minimum liquidity and net worth as well as specified financial ratios such as fixed charge coverage, unencumbered assets to unsecured indebtedness, leverage and debt service coverage. A breach of financial covenants could result in an acceleration of our debt if a waiver or modification is not agreed upon with the lenders.
We were in compliance with all such covenants as of December 31, 2010, except for certain covenants under our PB Loan Agreement relating to tangible net worth. We have obtained a waiver from the PB Loan Agreement lender for non-compliance of the tangible net worth covenant as of December 31, 2010. We were not in compliance with the tangible net worth covenant under our PB Loan Agreement as of June 30, 2011, and such non-compliance may permit the lender to exercise remedies against the mortgage collateral on a non-recourse basis. In September 2011, pursuant to the Settlement Agreement, the PB Loan Agreement and the related collateral will be transitioned to the mezzanine lenders. Accordingly, as a result of the execution of the Settlement Agreement, any acceleration of the PB Loan Agreement loan is not expected to have an adverse effect on us.
One of our three CDOs is currently in its reinvestment period which will expire in 2012.
The period during which we are permitted to reinvest principal payments on the underlying assets into qualifying replacement collateral for our 2005 and 2006 CDOs expired in July 2010 and July 2011, respectively, and will expire for our 2007 CDO in August 2012. In the past, our ability to reinvest has been instrumental in maintaining compliance with the overcollateralization and interest coverage tests for our CDOs. Following the conclusion of the reinvestment period our ability to maintain compliance with such tests for that CDO will be negatively impacted.
Potential rating agency downgrades may adversely affect our ability to reinvest CDO proceeds.
To date, rating agency downgrades and impairments of our loan investments and CMBS investments have not impeded our right to reinvest CDO proceeds as provided in the operative CDO document. However, there can be no assurance that our right to reinvest CDO proceeds will not be impaired by future rating agency downgrades or investment impairments and, in such event, the cash flows that otherwise would have been payable to us, as the holder of certain junior and senior tranches of notes payable issued by our CDOs, may, depending on circumstances, instead be redirected to pay principal and interest on the most senior tranches of notes payable issued by our CDOs, which are owned by third parties. As a result, such downgrades could have a material adverse effect on our liquidity, results of operations and business.
We may be required to repurchase loans that we have sold or to indemnify holders of our CDOs.
If any of the loans we originate or acquire and sell or securitize do not comply with representations and warranties that we make about certain characteristics of the loans, the borrowers and the underlying properties, we may be required to repurchase those loans or replace them with substitute loans. In addition, in the case of loans that we have sold instead of retained, we may be required to indemnify persons for losses or expenses incurred as a result of a breach of a representation or warranty. Repurchased loans would likely require a significant allocation of working capital to carry on our balance sheet, and our ability to borrow against such assets is limited. Any significant repurchases or indemnification payments could adversely affect our financial condition and operating results.
Our mortgage and mezzanine loans contain cross-default provisions.
Certain of our mortgage and mezzanine loan agreements contain cross-default provisions whereby a default under one agreement could result in a default and acceleration of indebtedness under other agreements. If a cross-default were to occur, we may not be able to pay our debts or access capital from external sources in order to refinance our debts. If some or all of our debt obligations default and it causes a default under other indebtedness, our business, financial condition and results of operations would be materially and adversely affected.
21
TABLE OF CONTENTS
We presently have virtually no additional borrowing capacity.
We currently do not have a corporate credit facility to draw against for liquidity purposes and substantially all of our assets are pledged as collateral for our secured borrowings. As a result, we must fund future funding commitments and capital expenditures with existing liquidity, including unrestricted cash and cash in our CDOs, or future liquidity resulting from asset sales, which will have a significant impact on our liquidity position. If we are unable to meet future funding commitments or fund required capital expenditures, our borrowers or tenants may take legal action against us, which could have a material adverse effect.
We have incurred substantial impairments of our loans and other lending investments and may incur significant loan loss reserves/impairments in the future.
Due to a variety of factors, including adverse market conditions affecting the real estate market, we have recorded substantial loan loss provisions. For the years ended December 31, 2010 and 2009, we recorded approximately $84.4 million and $517.8 million, respectively, in loan loss provisions and impairment losses related to our loans and other lending investments. In addition, during 2010, we recorded impairment charges totaling $912.1 million in continuing operations to reduce the carrying value of 692 properties to estimated fair value. All of the impaired properties serve as collateral for the Goldman Mezzanine Loans and are part of the Gramercy Realty portfolio which was subject to the Settlement Agreement executed in September 2011. Our debt investments may suffer additional loan loss provisions/impairments in the future causing us to recognize significant losses. If we are unsuccessful in renegotiating, selling or otherwise resolving assets that are currently nonperforming or that we expect will become nonperforming, we may experience loss of principal or reduced income available for distributions. Investors and lenders alike could lose confidence in the quality and value of our assets. These impairments, or the perception that these impairments may occur, can depress our stock price, harm our liquidity and materially adversely impact our results of operations. We may be forced to sell substantial assets at a time when the market is depressed in order to support or enhance our liquidity. Despite our need to sell substantial assets, we may be unable to make such sales on favorable terms or at all, further materially damaging our liquidity and operations. If we are unable to maintain adequate liquidity as a result of these impairments or otherwise, our ability to continue as a going concern would be affected and you could lose some or all of your investment.
Our reserves for loan losses may prove inadequate, which could have a material adverse effect on us.
We maintain and regularly evaluate financial reserves to protect against potential future losses. Our reserves reflect management’s judgment of the probability and severity of losses. We cannot be certain that our judgment will prove to be correct and that reserves will be adequate over time to protect against potential future losses because of unanticipated adverse changes in the economy or events adversely affecting specific assets, borrowers, industries in which our borrowers operate or markets in which our borrowers or their properties are located. We must evaluate existing conditions on our debt investments to make determinations to take loan loss reserves on these specific investments. If our reserves for credit losses prove inadequate, we could suffer losses which would have a material adverse effect on our financial performance, the market price of our common stock and our ability to make distributions to our stockholders.
Loan loss reserves are particularly difficult to estimate in a turbulent economic environment.
Our loan loss reserves are evaluated on a quarterly basis. Our determination of loan loss reserves requires us to make certain estimates and judgments, which are particularly difficult to determine during the current economic environment. Our estimates and judgments are based on a number of factors, including projected cash flows from the collateral securing our commercial real estate loans, loan structure, including the availability of reserves and recourse guarantees, likelihood of repayment in full at the maturity of a loan, potential for a refinancing market returning to commercial real estate in the future and expected market discount rates for varying property types. If our estimates and judgments are not correct, our results of operations and financial condition could be severely impacted.
22
TABLE OF CONTENTS
There can be no assurance that the actions of the U.S. government, Federal Reserve and other governmental and regulatory bodies for the purpose of stabilizing the financial markets, or market response to those actions, will achieve the intended effect and our business may not benefit from, and may be adversely impacted by, these actions and further government or market developments could adversely impact us.
Since mid-2007, and particularly during the second half of 2008, the financial services industry and securities markets generally were materially and adversely affected by significant declines in the values of nearly all asset classes and by a serious lack of liquidity. This was initially triggered by declines in the values of subprime mortgages, but spread to all mortgage and real estate asset classes, to leveraged bank loans and to nearly all assets classes, including equities. The global markets have been characterized by substantially increased volatility and short-selling and an overall loss of investor confidence, initially in the financial institutions, but afterwards in companies in a number of other industries and in the broader markets. The decline in asset values has caused increases in margin calls for investors, requirements that derivatives counterparties post additional collateral and redemptions by mutual and hedge fund investors, all of which have increased the downward pressure on asset values and outflows of client funds across the financial services industry. In addition, the increased redemptions and unavailability of credit have required hedge funds and others to rapidly reduce leverage, which has increased volatility and further contributed to the decline of asset values.
In response to the recent unprecedented financial issues affecting the banking system and financial markets and going concern threats to investment banks and other financial institutions, the Emergency Economic Stabilization Act of 2008, or the EESA, was signed into law on October 3, 2008. The EESA provides the U.S. Secretary of Treasury with the authority to establish a Troubled Asset Relief Program, or TARP, to purchase from financial institutions up to $700 billion of residential or commercial mortgages and any securities, obligations, or other instruments that are based on, or related to, such mortgages, that in each case was originated or issued on or before March 14, 2008. The ESSA also provides for a program that would allow companies to insure their troubled assets. On February 17, 2009, President Obama signed the American Recovery and Reinvestment Act of 2009, or ARRA, a $787 billion stimulus bill for the purpose of stabilizing the economy by creating jobs among other things. As of February 12, 2010, the U.S. Treasury is managing or overseeing the following programs under TARP: the Capital Purchase Program, the Systemically Failing Institutions Program, the Auto Industry Financing Program and the Homeowner Affordability, the Legacy Public-Private Investment Program, and Stability Plan, which is partially financed by TARP.
There can be no assurance that the EESA, TARP or other programs will have a beneficial impact on the financial markets, including current extreme levels of volatility. In addition, the U.S. Government, Federal Reserve and other governmental and regulatory bodies have taken or are considering taking other actions to address the financial crisis. In November 2010, the Federal Reserve initiated a program to purchase up to $600 billion of long-term U.S. Treasury securities by mid-2011 as part of its continuing effort to help stimulate the economy by reducing mortgage and interest rates. We cannot predict whether or when such actions may occur or what impact, if any, such actions could have on our business, results of operations and financial condition.
We do not know what impact the Dodd-Frank Act will have on our business.
On July 21, 2010, the United States enacted the Dodd-Frank Wall Street Reform and Consumer Protection Act, or the Dodd-Frank Act. The Dodd-Frank Act affects almost every aspect of the U.S. financial services industry, including certain aspects of the markets in which we operate. The Dodd-Frank Act imposes new regulations on us and how we conduct our business. For example, the Dodd-Frank Act will impose additional disclosure requirements for public companies and generally require issuers or originators of asset-backed securities to retain at least five percent of the credit risk associated with the securitized assets. In addition, the Dodd-Frank Act will require us to register as an investment advisor with the SEC, which will increase our regulatory compliance costs and subject us to new restrictions as well as penalties for any future non-compliance with these regulations. Importantly, many key aspects of the changes imposed by the Dodd-Frank Act will be established by various regulatory bodies and other groups over the next several years. As a result, we do not know how significantly the Dodd-Frank Act will affect us. It is possible that the Dodd-Frank
23
TABLE OF CONTENTS
Act could, among other things, increase our costs of operating as a public company, impose restrictions on our ability to securitize assets and reduce our investment returns on securitized assets.
We are required to make a number of judgments in applying accounting policies and different estimates and assumptions in the application of these policies could result in changes to our reporting of financial condition and results of operations.
Material estimates that are particularly susceptible to significant change relate to the determination for loan losses, the effectiveness of derivatives and other hedging activities, the fair value of certain financial instruments (debt obligations, CMBS, loan assets, securities, derivatives, and privately held investments), CTL investments, deferred income tax assets or liabilities, share-based compensation, and accounting for acquisitions, including the fair value determinations and the analysis of goodwill impairment. While we have identified those accounting policies that are considered critical and have procedures in place to facilitate the associated judgments, different assumptions in the application of these policies could result in material changes to our reports of financial condition and results of operations.
We are dependent on key personnel whose continued service is not guaranteed.
We rely on a small number of persons who comprise our existing senior management team and our board of directors to implement our business and investment strategies. While we have entered into employment agreements with certain members of our senior management team, they may nevertheless cease to provide services to us at any time.
The loss of services of any of our key management personnel or directors, or our inability to recruit and retain qualified personnel or directors in the future, could have an adverse effect on our business.
Quarterly results may fluctuate and may not be indicative of future quarterly performance.
Our quarterly operating results could fluctuate; therefore, you should not rely on past quarterly results to be indicative of our performance in future quarters. Factors that could cause quarterly operating results to fluctuate include, among others, variations in our investment origination volume, loan loss reserves or impairments, loan maturities, variations in the timing of prepayments, the degree to which we encounter competition in our markets and general economic conditions.
Maintenance of our Investment Company Act exclusions and exemptions imposes limits on our operations.
We believe that there are a number of exclusions and exemptions under the Investment Company Act that may be applicable to us and we have conducted and intend to continue to conduct our operations so as not to become regulated as an investment company under the Investment Company Act. We will either be excluded from the definition of investment company under Section 3(a)(1)(C) of the Investment Company Act, by owning or proposing to acquire “investment securities” having a value not exceeding 40% of the value of our total assets (exclusive of U.S. Government securities and cash items) on an unconsolidated basis, or exempted by qualifying for the exemptions from registration provided by Sections 3(a)(1)(A), 3(c)(5)(C) and/or 3(c)(6) of the Investment Company Act. Section 3(a)(1)(A) of the Investment Company Act defines an investment company as any issuer which is or holds itself out as being engaged primarily, or proposed to engage primarily in the business of investing, reinvesting or trading in securities. We believe we will not be considered an investment company under Section 3(a)(1)(A) of the Investment Company Act because we will not engage primarily or hold ourselves out as being engaged primarily in the business of investing, reinvesting or trading in securities. Section 3(c)(5)(C) exempts from the definition of “investment company” any person who is “primarily engaged in the business of purchasing or otherwise acquiring mortgages and other liens on and interests in real estate.” Additionally, Section 3(c)(6) exempts from the definition of “investment company” any company primarily engaged, directly or through majority-owned subsidiaries, in the business of purchasing or otherwise acquiring mortgages and other liens on and interests in real estate. The assets that we have acquired and may acquire in the future, therefore, are limited by the provisions of the Investment Company Act and the exclusions and exemptions on which we rely. In addition, we could, among other things, be required either (a) to change the manner in which we conduct our operations to avoid being required to register as an investment company or (b) to register as an investment company, either of which could have an adverse effect on our business and our ability to pay dividends.
24
TABLE OF CONTENTS
To maintain our qualification for an exclusion from registration under the Investment Company Act pursuant to Sections 3(c)(5)(C) and 3(c)(6) at least 55% of our portfolio, or the assets of our majority-owned subsidiaries, must be comprised of qualifying assets under Section 3(c)(5)(C) of the Investment Company Act, and 80% of our portfolio, or the assets of our majority-owned subsidiaries, must be comprised of qualifying assets and real estate-related assets under Section 3(c)(5)(C) of the Investment Company Act. In addition, we may not issue “redeemable securities”. To comply with the Section 3(c)(5)(C) exemption, we may from time to time buy RMBS and other qualifying assets. We generally expect that mortgage loans, junior (first loss) interests in whole pool CMBS, CTL and other real property investments, certain distressed debt securities and Tier 1 mezzanine loans to be qualifying assets under the Section 3(c)(5)(C) exemption from the Investment Company Act. Tier 1 mezzanine loans are loans granted to a mezzanine borrower that directly owns interests in the entity that owns the property being financed. The treatment of distressed debt securities as qualifying assets is, and will be, based on the characteristics of the particular type of loan, including its foreclosure rights. Although SEC staff no-action letters have not specifically addressed the categorization of these types of assets, we believe junior (first loss) interests in CMBS pools may constitute qualifying assets under Section 3(c)(5)(C) provided that we have the unilateral right to foreclose, directly or indirectly, on the mortgages in the pool and that we may act as the controlling class or directing holder of the pool. Similarly, subordinate interests in whole loans may constitute qualifying assets under Section 3(c)(5)(C) provided that, among other things, approval rights in connection with any material decisions pertaining to the administration and servicing of the relevant mortgage loan and, in the event that the mortgage loan becomes non-performing, we have effective control over the remedies relating to the enforcement of the loan, including ultimate control of the foreclosure process. We generally do not treat non-Tier 1 mezzanine loans and preferred equity investments as qualifying assets. Although we monitor our portfolio periodically and prior to each origination or acquisition of a new asset or disposition of an existing asset, there can be no assurance that we will be able to maintain an exclusion or exemption from registration under the Investment Company Act. Further, we may not be able to invest in sufficient qualifying and/or real estate-related assets and future revision or interpretations of the Investment Company Act may cause us to lose our exclusion or exemption or force us to re-evaluate our portfolio and our business strategy. Such changes may prevent us from operating our business successfully. No assurance can be given that the SEC staff will concur with our classification of our assets, or that the SEC staff will not, in the future, issue further guidance that may require us to reclassify those assets for purpose of qualifying for an exemption or exclusion from regulation under the Investment Company Act. To the extent that the staff of the SEC provides more specific guidance regarding any of the matters bearing upon the definition of investment company and the exceptions to that definition, we may be required to adjust our investment strategy accordingly. Any additional guidance from the staff of the SEC could provide additional flexibility to us, or it could further inhibit our ability to pursue the investment strategy we have chosen.
The SEC recently solicited public comment on a wide range of issues relating to Section 3(c)(5)(C) of the 1940 Act, including the nature of the assets that qualify for purposes of the exemption and whether mortgage REITs should be regulated in a manner similar to investment companies. There can be no assurance that the laws and regulations governing the 1940 Act status of REITs, including the Division of Investment Management of the SEC providing more specific or different guidance regarding these exemptions, will not change in a manner that adversely affects our operations. If we or our subsidiaries fail to maintain an exception or exemption from the 1940 Act, we could, among other things, be required either to (a) change the manner in which we conduct our operations to avoid being required to register as an investment company, (b) effect sales of our assets in a manner that, or at a time when, we would not otherwise choose to do so, or (c) register as an investment company, any of which could negatively affect the value of our common stock, the sustainability of our business model, and our ability to make distributions which could have an adverse effect on our business and the market price for our shares of common stock.
In consultation with legal and tax advisors, we periodically evaluate our assets, and also evaluate prior to an acquisition or origination the structure of each prospective investment or asset, to determine whether we avoid coming within the definition of investment company in Section 3(a)(1)(C) and/or whether we believe the investment will be a qualifying asset for purposes of maintaining the exemptions found in Sections 3(c)(5)(C) and/or 3(c)(6) from registration under the Investment Company Act. We consult with counsel to assist us with such determination as appropriate. If we are obligated to register as an investment
25
TABLE OF CONTENTS
company, we would have to comply with a variety of substantive requirements under the Investment Company Act, including limitations on capital structure, restrictions on specified investments, prohibitions on transactions with affiliates, changes in the composition of our board of directors and compliance with reporting, record keeping, voting, proxy disclosure and other rules and regulations that would significantly change our operations.
Rapid changes in the values of our CMBS and other real estate related investments may make it more difficult for us to maintain our qualification as a REIT or exemption from the Investment Company Act.
If the market value or income potential of our CMBS and other real estate-related investments declines as a result of increased interest rates, prepayment rates or other factors, we may need to increase our real estate investments and income and/or liquidate our non-qualifying assets in order to maintain our REIT qualification or exemption from the Investment Company Act. If the decline in real estate asset values and/or income occurs quickly, this may be especially difficult to accomplish. This difficulty may be exacerbated by the illiquid nature of many of our non-real estate assets. We may have to make investment decisions that we otherwise would not make absent the REIT and Investment Company Act considerations.
We may incur losses as a result of ineffective risk management processes and strategies.
We seek to monitor and control our risk exposure through a risk and control framework encompassing a variety of separate but complementary financial, credit, operational, compliance and legal reporting systems, internal controls, management review processes and other mechanisms. While we employ a broad and diversified set of risk monitoring and risk mitigation techniques, those techniques and the judgments that accompany their application cannot anticipate every economic and financial outcome or the specifics and timing of such outcomes. Thus, we may, in the course of our activities, incur losses. Recent market conditions have involved unprecedented dislocations and highlight the limitations inherent in using historical data to manage risk.
The models that we use to assess and control our risk exposures reflect assumptions about the degrees of correlation or lack thereof among prices of various asset classes or other market indicators. In times of market stress or other unforeseen circumstances, previously uncorrelated indicators may become correlated, or conversely previously correlated indicators may move in different directions. These types of market movements have at times limited the effectiveness of our hedging strategies and have caused us to incur significant losses, and they may do so in the future. These changes in correlation can be exacerbated where other market participants are using risk models with assumptions or algorithms that are similar to ours. In these and other cases, it may be difficult to reduce our risk positions due to the activity of other market participants or widespread market dislocations, including circumstances where asset values are declining significantly or no market exists for certain assets. To the extent that we make investments that do not have an established liquid trading market or are otherwise subject to restrictions on sale or hedging, we may not be able to reduce our positions and therefore reduce our risk associated with such positions.
We may experience reductions in portfolio income which would reduce our ability to make distributions over time.
Due to our status as a REIT, we are required to distribute at least 90% of our REIT taxable income, if any, to stockholders. We may experience declines in the size of the investment portfolio over time. A reduction in the size of our portfolio would also result in reduced income available for distribution and thereby lessen our ability to make distributions to our stockholders.
If we fail to achieve adequate operating cash flow, our ability to make distributions will be adversely affected.
As a REIT, we must distribute annually at least 90% of our REIT taxable income, if any, to our stockholders, determined without regard to the deduction for dividends paid and excluding net capital gain. Our ability to make and sustain cash distributions is based on many factors, including the return on our investments, operating expense levels and certain restrictions imposed by Maryland law. Some of the factors are beyond our control and a change in any such factor could affect our ability to pay future dividends. No assurance can be given as to our ability to pay distributions to our stockholders.
26
TABLE OF CONTENTS
The competitive pressures we face as a result of operating in a highly competitive market could have a material adverse effect on our business, financial condition, liquidity and results of operations.
The current state of the global credit markets has resulted in a lack of liquidity and significant volatility in the types of asset classes that we have historically invested. These disruptions are currently and are expected to continue to limit our ability and our competitors’ ability to execute on historical investment strategies. Upon the return of liquidity to the credit markets, we expect to continue to encounter significant competition in seeking investments. We have significant competition with respect to our acquisition and origination of assets with many other companies, including other REITs, insurance companies, commercial banks, private investment funds, hedge funds, specialty finance companies and other investors. Some competitors may have a lower cost of funds and access to funding sources that are not available to us. In addition, some of our competitors may have higher risk tolerances or different risk assessments, which could allow them to consider a wider variety of investments and establish more relationships than us. Furthermore, there is significant competition on a national, regional and local level with respect to property management services and in commercial real estate services generally and we are subject to competition from large national and multi-national firms as well as local or regional firms that offer similar services to ours. Some of our competitors may have greater financial and operational resources, larger customer bases, and more established relationships with their customers and suppliers than we do. The competitive pressures we face, if not effectively managed, may have a material adverse effect on our business, financial condition, liquidity and results of operations.
Also, as a result of this competition, we may not be able to take advantage of attractive origination and investment opportunities and therefore may not be able to identify and pursue opportunities that are consistent with our objectives. Competition may limit the number of suitable investment opportunities offered to us. It may also result in higher prices, lower yields and a narrower spread of yields over our borrowing costs, making it more difficult for us to acquire new investments on attractive terms. In addition, competition for desirable investments could delay the investment in desirable assets, which may in turn reduce our earnings per share and negatively affect our ability to declare distributions to our stockholders.
Termination of our Interim Management Agreement could harm our business.
We have agreed to manage the Gramercy Realty assets on behalf of the mezzanine lenders pursuant to an Interim Management Agreement through December 31, 2013 for a fixed fee of $10.0 million annually, the reimbursement of certain costs and the potential to earn certain incentive fees as therein provided. However, the Interim Management Agreement can be terminated by the mezzanine lenders and, subject to certain restrictions, by us, at any time upon 90 day written notice. However, any notice of termination given by us cannot be effective until December 31, 2011 at the earliest. Notwithstanding the foregoing, we have agreed with KBS to promptly commence and diligently seek to negotiate a full and complete management services agreement by no later than March 31, 2012. If the parties do not execute a mutually acceptable asset management services agreement prior to March 31, 2012, a Failure to Agree Termination shall be effectuated and the Interim Management Agreement shall automatically terminate on June 30, 2012, without liability or a penalty of any kind, except for our loss of the Excess Value Participation. Upon any termination of the Interim Management Agreement, our management fees, after payment of any termination payments required, would cease, thereby reducing our expected revenues, which could harm our business.
We may change our investment and operational policies without stockholder consent.
We may change our investment and operational policies, including our policies with respect to investments, acquisitions, growth, operations, indebtedness, capitalization and distributions, at any time without the consent of our stockholders, which could result in our making investments that are different from, and possibly riskier than, the types of investments described in this filing. A change in our investment strategy may increase our exposure to interest rate risk, default risk and real estate market fluctuations, all of which could adversely affect our ability to make distributions.
27
TABLE OF CONTENTS
Terrorist attacks and other acts of violence or war may affect the market for our common stock, the industry in which we conduct our operations and our profitability.
Terrorist attacks may harm our results of operations and the stockholders’ investment. We cannot assure the stockholders that there will not be further terrorist attacks against the U.S. or U.S. businesses. These attacks or armed conflicts may directly impact the property underlying our asset-based securities or the securities markets in general. Losses resulting from these types of events are uninsurable.
More generally, any of these events could cause consumer confidence and spending to decrease or result in increased volatility in the U.S. and worldwide financial markets and economy. Adverse economic conditions could harm the value of our properties, the property underlying our asset-backed securities or the securities markets in general which could harm our operating results and revenues and may result in the volatility of the value of our securities.
We are highly dependent on information systems and third parties, and systems failures could significantly disrupt our business, which may, in turn, negatively affect the market price of our common stock and our ability to make distributions to our stockholders.
Our business is highly dependent on communications and information systems, some of which are provided by third parties. Any failure or interruption of our systems could cause delays or other problems, which could have a material adverse effect on our operating results and negatively affect the market price of our common stock and our ability to make distributions to our stockholders.
Lack of diversification in number of investments increases our dependence on individual investments.
If we acquire larger loans or property interests, our portfolio will be concentrated in a smaller number of assets, increasing the risk of loss to stockholders if a default or other problem arises. Alternatively, if through loan repayments, loan resolutions or property sales we reduce the aggregate amount of our debt investment portfolio or our property investment portfolio, and number of investments in either or each, our portfolio may become concentrated in larger assets, thereby reducing the benefits of diversification by geography, property type, tenancy or other measures.
Risk Relating to Our Capital Structure and Access to Liquidity
The downturn in the credit markets has increased the cost of borrowing and has made financing difficult to obtain, which has negatively impacted our business, and may have a material adverse effect on us.
Beginning in 2007 and continuing during 2008, 2009, 2010 and into 2011, the credit and capital markets had been materially impacted. The commercial real estate and mortgage, the asset-backed, corporate and other credit and equity markets experienced accelerated default rates and declining values. Volatility and risk premiums in most credit and equity markets increased dramatically while liquidity decreased. Increasing concerns regarding the U.S. and world economic outlook, such as large asset write-downs at banks, volatile oil prices, sovereign debt defaults, declining business and consumer confidence and increased and maintained unemployment, compounded these issues. The factors described above resulted in substantially reduced commercial mortgage loan originations and securitizations, and more generalized credit market dislocations. As a result, we are finding it difficult to obtain cost-effective debt capital to finance new investment activity or to refinance maturing debt.
Due to these conditions, the commercial real estate finance market experienced higher volatility, reduced liquidity and accelerating default rates. Credit has become more expensive and difficult to obtain for us. The cost of financing as well as overall market-demanded risk premiums in commercial lending increased. The negative impact on the tightening of the credit markets, declines in real estate values in the U.S. and credit and liquidity concerns have had a material adverse effect on us. Additionally, there is no assurance that the increased financing costs, financing with increasingly restrictive terms or the increase in risk premiums that are demanded by investors will not have a material impact on our future profitability measures.
Our CDO financing agreements may limit our ability to make investments.
Each CDO financing that we engage in contains certain eligibility criteria with respect to the collateral that we seek to acquire and sell to the CDO issuer. If the collateral does not meet the eligibility criteria for
28
TABLE OF CONTENTS
eligible collateral as set forth in the transaction documents of such CDO transaction, we may not be able to acquire and sell such collateral to the CDO issuer. The inability of the collateral to meet eligibility requirements with respect to our CDOs may limit our ability to execute our business plan. In the event that an investment that we believe is favorable to our company does not meet eligibility requirements for our CDOs, we may be unable to obtain alternative financing for such investment.
We may not be able to issue CDO securities on attractive terms or at all, which may require us to seek more costly financing for our investments or to liquidate assets.
Conditions in the capital markets have made the issuance of a CDO unavailable to us. Historically, we have relied, to a substantial extent, on CDO financings to obtain match funded financing for our investments. Unless and until the market for commercial real estate CDOs recovers, we may be unable to utilize CDOs to finance our investments and we may need to utilize less favorable sources of financing to finance our investments on a long-term basis, if available. If such other forms of long-term financing are unavailable, it may be necessary to fund our investments using shorter-term debt financing, in which case we would not meet our objective of match funding for substantially all of our investments. There can be no assurance as to whether or when demand for commercial real estate CDOs will return or the terms of such securities investors will demand or whether we will be able to issue CDOs to finance our investments on terms beneficial to us.
If we issue senior securities we will be exposed to additional restrictive covenants and limitations on our operating flexibility, which could adversely affect our ability to pay dividends.
If we decide to issue senior securities in the future, it is likely that they will be governed by an indenture or other instrument containing covenants restricting our operating flexibility. Holders of senior securities may be granted specific rights, including but not limited to: the right to hold a perfected security interest in certain of our assets, the right to accelerate payments due under the indenture, rights to restrict dividend payments and rights to require approval to sell assets. Additionally, any convertible or exchangeable securities that we issue in the future may have rights, preferences and privileges more favorable than those of our common stock. We, and indirectly our stockholders, will bear the cost of issuing and servicing such securities.
We may not be able to access financing sources on favorable terms, or at all, which could adversely affect our ability to execute our business plan and our ability to distribute dividends.
We have financed our assets through a variety of means, including mortgages, mezzanine loans, repurchase agreements, secured and unsecured credit facilities, CDOs, other structured financings and junior subordinated debentures. We have also financed our investments in the past through the issuance of trust preferred securities. Our ability to execute this strategy depends on various conditions in the markets for financing in this manner which are beyond our control, including lack of liquidity and wider credit spreads. We cannot be certain that these markets, especially the structured finance markets, will provide an efficient source of long-term financing for our assets. Our ability to finance through CDOs is subject to a level of investor demand which has almost entirely been curtailed. If our strategy is not viable, we will have to attempt to find alternative forms of long-term financing for our assets, such as secured revolving credit facilities and repurchase facilities, if available. This could subject us to more recourse indebtedness and the risk that debt service on less efficient forms of financing would require a larger portion of our cash flows, to service our debt thereby reducing cash available for distribution to our stockholders, funds available for operations as well as for future business opportunities.
In addition, we depend upon the availability of adequate financing sources and capital for our operations. As a REIT, we are required to distribute at least 90% of our REIT taxable income, if any, determined without regard to the deduction for dividends paid and excluding net capital gain, to our stockholders and are therefore not able to retain our earnings for new investments. We cannot be certain that any, or sufficient, funding or capital will be available to us in the future on terms that are acceptable to us.
Furthermore, if the minimum dividend distribution required to maintain our REIT qualification becomes large relative to our cash flow due to our taxable income exceeding our cash flow from operations, then we could be forced to borrow funds, sell assets or raise capital on unfavorable terms, if we are able to at all, in
29
TABLE OF CONTENTS
order to maintain our REIT qualification. In the event that we cannot obtain sufficient funding on acceptable terms, there may be a negative impact on the market price of our common shares and our ability to distribute dividends.
Interest rate fluctuations could reduce our ability to generate income on our investments.
The yield on our investments in real estate securities and loans is sensitive to changes in prevailing interest rates and changes in prepayment rates. Changes in interest rates can affect our net interest income, which is the difference between the interest income we earn on our interest-earning investments and the interest expense we incur in financing these investments. We tend to price loans at a spread to either United States Treasury obligations, swaps or LIBOR. A decrease in these indexes will lower the yield on our investments, except to the extent certain of our loans contain floors below which the interest rate cannot decline. Conversely, if these indexes rise materially, borrowers may be unable to meet their debt service requirements and borrow the higher-leverage loans that we target. For more information on interest rate risk, see Item 7A. “Quantitative and Qualitative Disclosure About Market Risk” in this Annual Report on Form 10-K.
In a period of rising interest rates, our interest expense could increase while the interest we earn on our fixed-rate investments would not change, which would adversely affect our profitability.
Our operating results depend in large part on differences between the income from our investments, net of financing costs. In most cases, for any period during which our investments are not match-funded, the income from such debt investments will respond more slowly to interest rate fluctuations than the cost of our borrowings. Consequently, changes in interest rates, particularly short-term interest rates, may significantly influence our net income. Increases in these rates will tend to decrease our net income and market value of our investments. Interest rate fluctuations resulting in our interest expense exceeding our interest income would result in operating losses for us and may limit or eliminate our ability to make distributions to our stockholders. For more information on interest rate risk, see Item 7A. “Quantitative and Qualitative Disclosure About Market Risk” in this Annual Report on Form 10-K.
If credit spreads widen before we obtain long-term financing for our assets, the value of our assets may suffer.
We price our assets based on our assumptions about future credit spreads for financing of those assets. We have obtained, and may obtain in the future, longer term financing for our assets using structured financing techniques. Such issuances entail interest rates set at a spread over a certain benchmark, such as the yield on United States Treasury obligations, swaps or LIBOR. If the spread that investors are paying on our current structured finance vehicles and will pay on future structured finance vehicles we may engage in over the benchmark widens and the rates we are charging or will charge on our securitized assets are not increased accordingly, our income may be reduced or we could suffer losses, which could affect our ability to make distributions to our stockholders.
Risks Related to Our Investments
Some of our portfolio investments may be recorded at fair value, as a result, there will be uncertainty as to the value of these investments.
Changes in the market values of our investments in securities available for sale will be directly charged or credited to stockholders’ equity. As a result, a decline in values may reduce the book value of our assets. Moreover, if the decline in value of a security is other-than-temporary, such decline will reduce earnings. Any such charges may result in volatility in our reported earnings and may adversely affect the market price of our common stock. Some of our portfolio investments may be in the form of securities, including CMBS, that are not publicly traded. The fair value of securities and other investments that are not publicly traded may not be readily determinable. We value these investments quarterly. Because such valuations are inherently uncertain, may fluctuate over short periods of time and may be based on estimates, our determinations of fair value may differ materially from the values that would have been used if a ready market for these securities existed. The value of our common stock could be adversely affected if our determinations regarding the fair value of these investments were materially higher than the values that we ultimately realize upon their disposal.
30
TABLE OF CONTENTS
We may not realize gains or income from our investments.
We seek to generate both current income and capital appreciation. However, our investments may not appreciate in value and, in fact, may decline in value, and the debt securities we invest in may default on interest and/or principal payments. Accordingly, we may not be able to realize gains or income from our investments. Any gains that we do realize may not be sufficient to offset any other losses we experience. Any income that we realize may not be sufficient to offset our expenses.
We may be adversely affected by unfavorable economic changes in geographic areas where our properties or the properties underlying our investments are concentrated.
Adverse conditions in the areas where our properties or the properties underlying our investments are located (including business layoffs or downsizing, industry slowdowns, changing demographics and other factors) and local real estate conditions (such as oversupply of, or reduced demand for, office, industrial or retail properties) may have an adverse effect on the value of our properties. A material decline in the demand or the ability of tenants to pay rent for office, industrial or retail space in these geographic areas may result in a material decline in our cash available for distribution.
The commercial mortgage and mezzanine loans we originate or acquire and the commercial mortgage loans underlying the CMBS in which we invest are subject to delinquency, foreclosure and loss, which could result in losses to us.
Our commercial mortgage and mezzanine loans are secured by commercial property and are subject to risks of delinquency and foreclosure, and risks of loss that are greater than similar risks associated with loans made on the security of single-family residential property. The ability of a borrower to repay a loan secured by an income-producing property typically is dependent primarily upon the successful operation of the property rather than upon the existence of independent income or assets of the borrower. If the net operating income of the property is reduced, the borrower’s ability to repay the loan may be impaired. Net operating income of an income-producing property can be affected by, among other things, tenant mix, success of tenant businesses, property management decisions, property location and condition, competition from comparable types of properties, changes in laws that increase operating expenses or limit rents that may be charged, any need to address environmental contamination at the property, changes in national, regional or local economic conditions and/or specific industry segments, declines in regional or local real estate values, declines in regional or local rental or occupancy rates, increases in interest rates, real estate tax rates and other operating expenses, and changes in governmental rules, regulations and fiscal policies, including environmental legislation, acts of God, terrorism, social unrest and civil disturbances.
Joint investments could be adversely affected by our lack of sole decision-making authority and reliance upon a co-venturer’s financial condition.
We co-invest with third parties through partnerships, joint ventures, co-tenancies or other entities, acquiring non-controlling interests in, or sharing responsibility for managing the affairs of, a property, partnership, joint venture, co-tenancy or other entity. Therefore, we will not be in a position to exercise sole decision-making authority regarding that property, partnership, joint venture or other entity. Investments in partnerships, joint ventures, or other entities may involve risks not present were a third party not involved, including the possibility that our partners, co-tenants or co-venturers might become bankrupt or otherwise fail to fund their share of required capital contributions. Additionally, our partners or co-venturers might at any time have economic or other business interests or goals which are inconsistent with our business interests or goals. These investments may also have the potential risk of impasses on decisions such as a sale, because neither we nor the partner, co-tenant or co-venturer would have full control over the partnership or joint venture. Consequently, actions by such partner, co-tenant or co-venturer might result in subjecting properties owned by the partnership or joint venture to additional risk. In addition, we may in specific circumstances be liable for the actions of our third-party partners, co-tenants or co-venturers.
Some of our loans are participation interests in loans, or co-lender arrangements, in which we share the rights, obligations and benefits of the loan with other lenders. We may need the consent of these parties to exercise our rights under such loans, including rights with respect to amendment of loan documentation,
31
TABLE OF CONTENTS
enforcement proceedings in the event of default and the institution of, and control over, foreclosure proceedings. Similarly, a majority of the participants may be able to take actions to which we object but to which we will be bound if our participation interest represents a minority interest. We may be adversely affected by this lack of complete control.
We may in the future enter, into joint venture agreements that contain terms in favor of our partners that may have an adverse effect on the value of our investments in the joint ventures. For example, we may be entitled under a particular joint venture agreement to an economic share in the profits of the joint venture that is smaller than our ownership percentage in the joint venture, our partner may be entitled to a specified portion of the profits of the joint venture before we are entitled to any portion of such profits and our partner may have rights to buy our interest in the joint venture, to force us to buy the partner’s interest in the joint venture or to compel the sale of the property owned by such joint venture. These rights may permit our partner in a particular joint venture to obtain a greater benefit from the value or profits of the joint venture than us, which may have an adverse effect on the value of our investment in the joint venture and on our financial condition and results of operations.
Liability relating to environmental matters may impact the value of the properties that we may acquire or underlying our investments.
Under various U.S. federal, state and local laws, an owner or operator of real property may become liable for the costs of removal of certain hazardous substances released on its property. These laws often impose liability without regard to whether the owner or operator knew of, or, was responsible for, the release of such hazardous substances. If we fail to disclose environmental issues, we could also be liable to a buyer or lessee of a property.
There may be environmental problems associated with our properties which we were unaware of at the time of acquisition. The presence of hazardous substances may adversely affect an owner’s ability to sell real estate or borrow using real estate as collateral. To the extent that an owner of a property underlying one of our debt investments becomes liable for removal costs, the ability of the owner to make debt payments to us may be reduced. This, in turn, may adversely affect the value of the relevant mortgage asset held by us and our ability to make distributions to stockholders.
The presence of hazardous substances, if any, on our properties may adversely affect our ability to sell an affected property and we may incur substantial remediation costs, thus harming our financial condition. In addition, although our leases, if any, will generally require our tenants to operate in compliance with all applicable laws and to indemnify us against any environmental liabilities arising from a tenant’s activities on the property, we nonetheless would be subject to strict liability by virtue of our ownership interest for environmental liabilities created by such tenants, and we cannot ensure the stockholders that any tenants we might have would satisfy their indemnification obligations under the applicable sales agreement or lease. The discovery of material environmental liabilities attached to such properties could have a material adverse effect on our results of operations and financial condition and our ability to make distributions to our stockholders.
Hedging instruments often are not traded on regulated exchanges, guaranteed by an exchange or its clearing house, or regulated by any U.S. or foreign governmental authorities and involve risks and costs.
The cost of using hedging instruments increases as the period covered by the instrument increases and during periods of rising and volatile interest rates. We may increase our hedging activity and thus increase our hedging costs during periods when interest rates are volatile or rising and hedging costs have increased.
In addition, hedging instruments involve risk since they often are not traded on regulated exchanges, guaranteed by an exchange or its clearing house, or regulated by any U.S. or foreign governmental authorities. Consequently, there are no requirements with respect to record keeping, financial responsibility or segregation of customer funds and positions. Furthermore, the enforceability of agreements underlying derivative transactions may depend on compliance with applicable statutory and commodity and other regulatory requirements and, depending on the identity of the counterparty, applicable international requirements. The business failure of a hedging counterparty with whom we enter into a hedging transaction will most likely result in a default. Default by a party with whom we enter into a hedging transaction may result in the loss of unrealized profits and force us to cover our resale commitments, if any, at the then current market price.
32
TABLE OF CONTENTS
Although generally we will seek to reserve the right to terminate our hedging positions, it may not always be possible to dispose of or close out a hedging position without the consent of the hedging counterparty, and we may not be able to enter into an offsetting contract in order to cover our risk. We cannot be assured that a liquid secondary market will exist for hedging instruments purchased or sold, and we may be required to maintain a position until exercise or expiration, which could result in losses.
We may enter into derivative contracts that could expose us to contingent liabilities in the future.
Subject to maintaining our qualification as a REIT, part of our investment strategy involves entering into derivative contracts that could require us to fund cash payments in the future under certain circumstances, e.g., the early termination of the derivative agreement caused by an event of default or other early termination event, or the decision by a counterparty to request margin securities it is contractually owed under the terms of the derivative contract. The amount due would be equal to the unrealized loss of the open swap positions with the respective counterparty and could also include other fees and charges. These economic losses will be reflected in our financial results of operations, and our ability to fund these obligations will depend on the liquidity of our assets and access to capital at the time, and the need to fund these obligations could adversely impact our financial condition.
Risks Relating Primarily to Gramercy Realty
A significant portion of our properties are leased to financial institutions, making us more economically vulnerable in the event of a downturn in the banking industry.
A significant portion of our 2010 revenue was derived from leases to financial institutions. Individual banks, as well as the banking industry in general, may be adversely affected by negative economic and market conditions throughout the United States or in the local economies in which regional or community banks operate, including negative conditions caused by the recent disruptions in the financial markets. In addition, changes in trade, monetary and fiscal policies and laws, including interest rate policies of the Board of Governors of the Federal Reserve System, may have an adverse impact on banks’ loan portfolios and allowances for loan losses. As a result, we may experience higher rates of lease default or terminations in the event of a downturn in the banking industry than we would if our tenant base was more diversified.
Bank of America and Wells Fargo Bank represent a significant portion of the revenue generated by our Gramercy Realty business and failure of these tenants to perform their obligations or renew their leases upon expiration may adversely affect our cash flow and ability to pay distributions to our stockholders.
As of December 31, 2010, Bank of America and Wells Fargo Bank represented approximately 41.0% and 15.3%, respectively, of Gramercy Realty’s portfolio base rental income and occupied approximately 42.7% and 16.6%, respectively, of our total rentable square feet. The default, financial distress or insolvency of Bank of America or Wells Fargo Bank, or the failure of any of these parties to renew their leases with us upon expiration, could cause interruptions in the receipt of lease revenue from these tenants and/or result in vacancies, which would reduce our revenue and increase operating costs until the affected properties are leased, and could decrease the ultimate value of the affected properties upon sale. We may be unable to lease the vacant property at a comparable lease rate or at all, which could have a material adverse impact on our operating results and financial condition as well as our ability to make distributions to stockholders.
Certain of our leases permit our tenants to terminate their leases, in whole or in part, prior to their stated lease expiration dates, sometimes with little or no termination fee being paid to us.
Certain of our leases, including our two large portfolio leases with Bank of America, which we refer to as the BBD 1 and BBD 2 Portfolios, our large portfolio lease with Wells Fargo Bank, which we refer to as the WBBD Portfolio, and our Dana Portfolio lease with Bank of America, permit our tenants to terminate their lease as to all or, in most cases, a portion of the leased premises prior to their stated lease expiration dates. Most such terminations can be effectuated by our tenants with little or no termination fee being paid to us. When tenants exercise early termination rights, our cash flow and earnings will be adversely affected to the extent that we are unable to generate an equivalent amount of net rental income by leasing the vacated space to new third party tenants. Currently, our tenants are contractually permitted to vacate 31,171 square feet.
33
TABLE OF CONTENTS
Rising operating expenses relating to our properties could reduce our cash flow and funds available for future distributions.
Our properties are subject to operating risks common to real estate in general, any or all of which may negatively affect us. If the properties do not generate revenue sufficient to meet expenses, including debt service, tenant improvements, leasing commissions and other capital expenditures, our cash flow will be negatively impacted and we may have to utilize our existing liquidity to cover these expenses or risk forfeiture of the assets if we default on any associated debt obligations.
The bankruptcy or insolvency of our tenants under their leases or delays by our tenants in making rental payments could seriously harm our operating results and financial condition.
Any bankruptcy filings by or relating to one of our tenants could bar us from collecting pre-bankruptcy debts from that tenant or its property, unless we receive an order permitting us to do so from the bankruptcy court. A tenant bankruptcy could delay our efforts to collect past due balances under the relevant leases, and could ultimately preclude full collection of these sums. If a lease is rejected by a tenant in bankruptcy, we would have only a general unsecured claim for damages. Any unsecured claim we hold against a bankrupt entity may be paid only to the extent that funds are available and only in the same percentage as is paid to all other holders of unsecured claims. We may recover substantially less than the full value of any unsecured claims, which would harm our financial condition.
Many of our tenants are banks that are not eligible to be debtors under the federal bankruptcy code, but would be subject to the liquidation and insolvency provisions of applicable banking laws and regulations. If the FDIC were appointed as receiver of a banking tenant because of a tenant’s insolvency, we would become an unsecured creditor of the tenant and be entitled to share with the other unsecured non-depositor creditors in the tenant’s assets on an equal basis after payment to the depositors of their claims. The FDIC has broad powers to reject any contract (including a lease) of a failed depository institution that the FDIC deems burdensome if the FDIC determines that such rejection is necessary to promise the orderly administration of the institution’s affairs. By federal statute, a landlord under a lease rejected by the FDIC is not entitled to claim any damages with respect to the disaffirmation, other than rent through the effective date of the disaffirmation. The amount paid on claims in respect of the lease would depend on, among other factors, the amount of assets of the insolvent tenant available for unsecured claims. We may recover substantially less than the full value of any unsecured claims, which could have a material adverse effect on our operating results and financial condition, as well as our ability to pay dividends to stockholders at historical levels or at all.
Certain of our mortgage loans that we assumed in connection with the American Financial merger impose “cash traps” when the financial performance of the property or the portfolio of properties securing such loans fails to meet certain pre-determined financial metrics, which if enforced could adversely affect our financial condition and operating results.
If the provisions relating to “cash traps” in our mortgage loans are triggered as a result of the failure of the mortgaged properties to meet certain financial performance metrics, we may be required to fund excess cash flow into reserve accounts with our mortgage lenders until compliance with the required metrics is achieved and, in such event, our liquidity will be negatively impacted and this could have a material adverse effect on our results of operations and financial condition.
We structure many of our real property acquisitions using complex structures often based on forecasted results for the acquisitions, and if the acquired properties underperforms forecasted results, our financial condition and operating results may be harmed.
We may acquire some of our properties under complex structures that we tailor to meet the specific needs of the tenants and/or sellers. For instance, we may enter into transactions under which a portion of the properties are vacant or will be vacant following the completion of the acquisition. If we fail to accurately forecast the leasing of such properties following our acquisition, our operating results and financial condition, as well as our ability to pay dividends to stockholders, may be adversely impacted.
34
TABLE OF CONTENTS
Our properties may contain or develop harmful mold, which could lead to liability for adverse health effects and costs of remediating the problem.
When excessive moisture accumulates in buildings or on building materials, mold growth may occur, particularly if the moisture problem remains undiscovered or is not addressed over a period of time. Some molds may produce airborne toxins or irritants. Concern about indoor exposure to mold has been increasing as exposure to mold may cause a variety of adverse health effects and symptoms, including allergic or other reactions. As a result, the presence of significant mold at any of our properties could require us to undertake a costly remediation program to contain or remove the mold from the affected property. In addition, the presence of significant mold could expose us to liability from our tenants, employees of our tenants and others if property damage or health concerns arise.
Our properties may contain asbestos which could lead to liability for adverse health effects and costs of remediating asbestos.
Certain laws and regulations govern the removal, encapsulation or disturbance of asbestos-containing materials, or ACMs, when those materials are in poor condition or in the event of building renovation or demolition, impose certain worker protection and notification requirements, and govern emissions of and exposure to asbestos fibers in the air. These laws may also impose liability for a release of ACMs and may enable third parties to seek recovery against us for personal injury associated with ACMs. There are or may be ACMs at certain of our properties. We have either developed and implemented or are in the process of developing and implementing operations and maintenance programs that establish operating procedures with respect to ACMs.
In March 2005, GAAP clarified that the term conditional asset retirement obligation as a legal obligation to perform an asset retirement activity in which the timing and (or) method of settlement are conditional on a future event that may or may not be within the control of the entity. The obligation to perform the asset retirement activity is unconditional even though uncertainty exists about the timing and (or) method of settlement. Thus, the timing and (or) method of settlement may be conditional on a future event. Accordingly, an entity is required to recognize a liability for the fair value of a conditional asset retirement obligation if the fair value of the liability can be reasonably estimated. The fair value of a liability for the conditional asset retirement obligation is recognized when incurred — generally upon acquisition, construction, or development and (or) through the normal operation of the asset.
To comply with GAAP we assessed the cost associated with our legal obligation to remediate asbestos in our properties known to contain asbestos. We believe that the majority of the costs associated with our remediation of asbestos have been identified and recorded in compliance with GAAP, however other obligations associated with asbestos in our properties may exist. Other obligations associated with asbestos in our properties will be recorded in our consolidated statement of operations in the future when/if the cost is incurred.
Compliance with the Americans with Disabilities Act and fire, safety and other regulations may require us to make unintended expenditures that adversely impact our ability to pay dividends to stockholders at historical levels or at all.
All of our properties are required to comply with the Americans with Disabilities Act, or the ADA. The ADA has separate compliance requirements for “public accommodations” and “commercial facilities,” but generally requires that buildings be made accessible to people with disabilities. Compliance with the ADA requirements could require removal of access barriers and non-compliance could result in imposition of fines by the U.S. government or an award of damages to private litigants or both. While the tenants to whom we lease properties are obligated by law to comply with the ADA provisions with respect to their operations, we could be required to expend our own funds to achieve such compliance should our tenants fail to do so. In addition, we (and not our tenants) are generally required to comply with ADA provisions within the parking lots, access ways and other common areas of the properties we own and to operate our properties in compliance with fire and safety regulations, building codes and other land use regulations, as they may be adopted by governmental agencies and bodies and become applicable to our properties. We may be required to make substantial capital expenditures to comply with those requirements and these expenditures could have a material adverse effect on our ability to pay dividends to stockholders at historical levels or at all.
35
TABLE OF CONTENTS
An uninsured loss or a loss that exceeds the policies on our properties could subject us to lost capital or revenue on those properties.
Under the terms and conditions of the leases currently in force on our properties, tenants generally are required to indemnify and hold us harmless from liabilities resulting from injury to persons, air, water, land or property, on or off the premises, due to activities conducted on the properties, except for claims arising from the negligence or intentional misconduct of us or our agents. Additionally, tenants are generally required, at the tenants’ expense, to obtain and keep in full force during the term of the lease, liability and property damage insurance policies issued by companies holding general policyholder ratings of at least “A” as set forth in the most current issue of Best’s Insurance Guide. Insurance policies for property damage are generally in amounts not less than the full replacement cost of the improvements less slab, foundations, supports and other customarily excluded improvements and insure against all perils of fire, extended coverage, vandalism, malicious mischief and special extended perils (“all risk,” as that term is used in the insurance industry). Insurance policies are generally obtained by the tenant providing general liability coverage varying between $1.0 million and $10.0 million depending on the facts and circumstances surrounding the tenant and the industry in which it operates. These policies include liability coverage for bodily injury and property damage arising out of the ownership, use, occupancy or maintenance of the properties and all of their appurtenant areas.
In addition to the indemnities and required insurance policies identified above, many of our properties are also covered by flood and earthquake insurance policies obtained by and paid for by the tenants as part of their risk management programs. Additionally, we have obtained blanket liability and property damage insurance policies to protect us and our properties against loss should the indemnities and insurance policies provided by the tenants fail to restore the properties to their condition prior to a loss. All of these policies may involve substantial deductibles and certain exclusions. In certain areas, we may have to obtain earthquake and flood insurance on specific properties as required by our lenders or by law. We have also obtained terrorism insurance on some of our larger office buildings, but this insurance is subject to exclusions for loss or damage caused by nuclear substances, pollutants, contaminants and biological and chemical weapons. Should a loss occur that is uninsured or in an amount exceeding the combined aggregate limits for the policies noted above, or in the event of a loss that is subject to a substantial deductible under an insurance policy, we could lose all or part of our capital invested in, and anticipated revenue from, one or more of the properties, which could have a material adverse effect on our operating results and financial condition, as well as our ability to pay dividends to stockholders at historical levels or at all.
Our real estate investments are subject to risks particular to real property.
We own both assets secured by real estate and real estate directly. Real estate investments are subject to risks particular to real property, including:
| • | acts of God, including earthquakes floods and other natural disasters, which may result in uninsured losses; |
| • | acts of war or terrorism, including the consequences of terrorist attacks; |
| • | adverse changes in national and local economic and market conditions, including the credit and securitization markets; |
| • | changes in governmental laws and regulations, fiscal policies and zoning ordinances and the related costs of compliance with laws and regulations, fiscal policies and ordinances; |
| • | the perceptions of prospective tenants of the attractiveness of the properties; |
| • | costs of remediation and liabilities associated with environmental conditions; and |
| • | the potential for uninsured or under-insured property losses. |
If any of these or similar events occur, it may reduce our return from an affected property or investment and reduce or eliminate our ability to make distributions to stockholders.
36
TABLE OF CONTENTS
Our real estate investments may be illiquid, which could restrict our ability to respond rapidly to changes in economic conditions.
The real estate and real estate-related assets in which we invest are generally illiquid. In addition, the instruments that we purchase in connection with privately negotiated transactions are not registered under the relevant securities laws, resulting in a prohibition against their transfer, sale, pledge or other disposition except in a transaction that is exempt from the registration requirements of, or is otherwise in accordance with, those laws. As a result, our ability to sell under-performing assets in our portfolio or respond to changes in economic and other conditions may be relatively limited.
CTL and real estate investments may generate losses.
The value of our investments and the income from our real estate investments may be significantly adversely affected by a number of factors, including:
| • | national, state and local economic climates; |
| • | real estate conditions, such as an oversupply of or a reduction in demand for real estate space in the area; |
| • | the perceptions of tenants and prospective tenants of the convenience, attractiveness and safety of our properties; |
| • | competition from comparable properties; |
| • | the occupancy rate of our properties; |
| • | the ability to collect on a timely basis all rent from tenants; |
| • | the effects of any bankruptcies or insolvencies of major tenants; |
| • | the expense of re-leasing space; |
| • | changes in interest rates and in the availability, cost and terms of mortgage funding; |
| • | the impact of present or future environmental legislation and compliance with environmental laws; |
| • | cost of compliance with the American with Disabilities Act of 1990; |
| • | adverse changes in governmental rules and fiscal policies; |
| • | acts of nature, including earthquakes, hurricanes and other natural disasters (which may result in uninsured losses); |
| • | acts of terrorism or war; and |
| • | adverse changes in zoning laws; and other factors which are beyond our control. |
We may experience losses if the creditworthiness of our tenants deteriorates and they are unable to meet their obligations under our leases.
We own the properties leased to the tenants of our CTL and real estate investments and we receive rents from the tenants during the terms of our leases. A tenant’s ability to pay rent is determined by the creditworthiness of the tenant. If a tenant’s credit deteriorates, the tenant may default on its obligations under our lease and the tenant may also become bankrupt. The bankruptcy or insolvency of our tenants or other failure to pay is likely to adversely affect the income produced by our CTL and real estate investments. If a tenant defaults, we may experience delays and incur substantial costs in enforcing our rights as landlord. If a tenant files for bankruptcy, we may not be able to evict the tenant solely because of such bankruptcy or failure to pay. A court, however, may authorize a tenant to reject and terminate its lease with us. In such a case, our claim against the tenant for unpaid, future rent would be subject to a statutory cap that might be substantially less than the remaining rent owed under the lease. In addition, certain amounts paid to us within 90 days prior to the tenant’s bankruptcy filing could be required to be returned to the tenant’s bankruptcy
37
TABLE OF CONTENTS
estate. In any event, it is highly unlikely that a bankrupt or insolvent tenant would pay in full amounts it owes us under a lease. In other circumstances, where a tenant’s financial condition has become impaired, we may agree to partially or wholly terminate the lease in advance of the termination date in consideration for a lease termination fee that is likely less than the agreed rental amount. Without regard to the manner in which the lease termination occurs, we are likely to incur additional costs in the form of tenant improvements and leasing commissions in our efforts to lease the space to a new tenant. In any of the foregoing circumstances, our financial performance, the market prices of our securities and our ability to pay dividends could be materially adversely affected.
We may not be able to relet or renew leases at the properties held by us on terms favorable to us.
We are subject to risks that upon expiration or earlier termination of the leases for space located at our properties the space may not be relet or, if relet, the terms of the renewal or reletting (including the costs of required renovations or concessions to tenants) may be less favorable that current lease terms. Any of these situations may result in extended periods where there is a significant decline in revenues or no revenues generated by a property. If we are unable to relet or renew leases for all or substantially all of the spaces at these properties, if the rental rates upon such renewal or reletting are significantly lower than expected, or if our reserves for these purposes prove inadequate, we will experience a reduction in net income and may be required to reduce or eliminate distributions to our stockholders.
Lease defaults or terminations or landlord-tenant disputes may adversely reduce our income from our leased property portfolio.
Lease defaults or terminations by one or more of our significant tenants may reduce our revenues unless a default in cured or a suitable replacement tenant is found promptly. In addition, disputes may arise between the landlord and tenant that result in the tenant withholding rent payments, possibly for an extended period. These disputes may lead to litigation or other legal procedures to secure payment of the rent withheld or to evict the tenant. Any of these situations may result in extended periods during which there is a significant decline in revenues or no revenues generated by the property. If this were to occur, it could adversely affect our results of operations.
Risks Relating Primarily to Gramercy Finance
Our borrowers may increasingly be unable to achieve their business plans due to the economic environment and strain on commercial real estate, which may cause stress in our commercial real estate loan portfolio.
Many of our commercial real estate loans were made to borrowers who had a business plan to improve the collateral property. The current economic environment has created a number of obstacles to borrowers attempting to achieve their business plans, including lower occupancy rates and lower lease rates across all property types, which continues to be exacerbated by high unemployment and overall financial uncertainty. If borrowers are unable achieve their business plans, the related commercial real estate loans could go into default and severely impact our operating results and cash flows.
A prolonged economic slowdown, a lengthy or severe recession, a reduction in liquidity, or declining real estate values could harm our operations.
We believe the risk associated with our business is more severe during periods of economic slowdown or recession if these periods are accompanied by declining real estate values. Declining real estate values will likely reduce our level of new mortgage loan originations, since borrowers often use increases in the value of their existing properties to support the purchase or investment in additional properties. Borrowers may also be less able to pay principal and interest on our loans if the real estate economy weakens. Further, declining real estate values significantly increase the likelihood that we will incur losses on our loans in the event of default because the value of our collateral may be insufficient to recover the carrying value of the loan. A reduction in capital markets liquidity may cause difficulties for borrowers seeking to refinance existing loans at or prior to maturity, even in instances of satisfactory property cash flow and collateral value. Any sustained period of increased payment delinquencies, foreclosures or losses could adversely affect both our net interest income
38
TABLE OF CONTENTS
from loans in our portfolio as well as our ability to originate, sell and securitize loans, which would significantly harm our revenues, results of operations, financial condition, business prospects and our ability to make distributions to our stockholders.
Markets have experienced, and may continue to experience, periods of high volatility accompanied by reduced liquidity.
Financial markets are susceptible to severe events evidenced by rapid depreciation in asset values accompanied by a reduction in asset liquidity. Under these extreme conditions, hedging and other risk management strategies may not be as effective at mitigating investment portfolio losses as they would be under more normal market conditions. Severe market events have historically been difficult to predict, however, and we could realize significant losses if unprecedented extreme market events were to occur, such as the recent conditions in the global financial markets and global economy.
Many of our commercial real estate loans are funded with interest reserves and our borrowers may be unable to replenish those interest reserves once they are depleted.
Given the transitional nature of many of our commercial real estate loans, we required borrowers to pre-fund reserves to cover interest and operating expenses until the property cash flows were projected to increase sufficiently to cover debt service costs. We also generally require the borrower to replenish reserves if they became deficient due to underperformance or if the borrower wanted to exercise extension options under the loan. Despite low interest rates, revenues on the properties underlying any commercial real estate loan investments will likely decrease in the current economic environment, making it more difficult for borrowers to meet their payment obligations to us. We expect that in the future some of our borrowers may have difficulty servicing our debt and will not have sufficient capital to replenish reserves, which could have a significant impact on our operating results and cash flow.
We currently have certain loans that permit interest to be accrued until the loans’ maturity or refinancing.
We currently have several loans that provide for interest accrual, in whole or in part, through loan maturity or refinancing. For loans of this type, often referred to as PIK loans, the time period between interest accrual and collection (as additional loan principal) may extend for 12 months or longer, depending on the term of the PIK loan.
The loans we invest in and the commercial mortgage loans underlying the CMBS we invest in are subject to risks of delinquency, foreclosure and loss.
Commercial mortgage loans are secured by commercial property and are subject to risks of delinquency, foreclosure and loss. CMBS evidence interests in or are secured by a single commercial mortgage loan or a pool of commercial mortgage loans. These risks of loss are greater than similar risks associated with loans made on the security of single-family residential property. The ability of a borrower to pay principal and interest on a loan secured by an income-producing property typically is dependent primarily upon the successful operation of the property rather than upon the existence of independent income or assets of the borrower. If the net operating income of the property is reduced, the borrower’s ability to repay the loan may be impaired. Net operating income of an income-producing property can be affected by a number of conditions beyond our control, including:
| • | success of tenant businesses; |
| • | property management decisions; |
| • | property location and condition; |
| • | competition from comparable types of properties; |
| • | changes in laws that increase operating expense or limit rents that may be charged; |
| • | any need to address environmental contamination at the property; |
39
TABLE OF CONTENTS
| • | the occurrence of any uninsured casualty at the property; |
| • | changes in national, regional or local economic conditions and/or specific industry segments; |
| • | declines in regional or local real estate values; |
| • | declines in regional or local rental or occupancy rates; |
| • | increases in interest rates, real estate tax rates and other operating expenses; and |
| • | changes in governmental rules, regulations and fiscal policies, including environmental legislation, acts of God, terrorism, social unrest and civil disturbances. |
Any of these factors could have an adverse affect on the ability of the borrower to make payments of principal and interest in a timely fashion, or at all, on the mortgage loans in which we invest and could adversely affect the cash flows we intend to receive from these investments.
In the event of any default under a mortgage loan held directly by us, we will bear the risk of loss of principal to the extent of any deficiency between the value of the collateral and the principal and accrued interest on the mortgage loan, which could have a material adverse effect on our cash flow from operations and our ability to make distributions to our stockholders. In the event of the bankruptcy of a mortgage loan borrower, the mortgage loan to the borrower will be deemed to be secured only to the extent of the value of the underlying collateral at the time of bankruptcy (as determined by the bankruptcy court), and the lien securing the mortgage loan will be subject to the avoidance powers of the bankruptcy trustee or debtor-in-possession to the extent the lien is unenforceable under state law. Foreclosure of a mortgage loan can be an expensive and lengthy process which could have a substantial negative effect on our anticipated return on the foreclosed mortgage loan.
The subordinate interests in whole loans in which we invest may be subject to additional risks relating to the privately negotiated structure and terms of the transaction, which may result in losses to us.
A subordinate interest in a whole loan is a mortgage loan typically (i) secured by a whole loan on a single large commercial property or group of related properties and (ii) subordinated to a senior interest secured by the same whole loan on the same collateral. As a result, if a borrower defaults, there may not be sufficient funds remaining for subordinate interest owners after payment to the senior interest owners. Subordinate interests reflect similar credit risks to comparably rated CMBS. However, since each transaction is privately negotiated, subordinate interests can vary in their structural characteristics and risks. For example, the rights of holders of subordinate interests to control the process following a borrower default may be limited in certain investments. We cannot predict the terms of each subordinate investment. Further, subordinate interests typically are secured by a single property, and so reflect the increased risks associated with a single property compared to a pool of properties. Subordinate interests also are less liquid than CMBS, thus we may be unable to dispose of underperforming or non-performing investments. The higher risks associated with our subordinate position in these investments could subject us to increased risk of losses.
Investments in mezzanine loans involve greater risks of loss than senior loans.
Investments in mezzanine loans are secured by a pledge of the ownership interests in the entity that directly or indirectly owns the property. These types of investments involve a higher degree of risk than a senior mortgage loan because the investment may become unsecured as a result of foreclosure by the senior lender. Frequently, senior loans mature simultaneously and unless extended, the investments in the mezzanine loans may be severely impaired. In the event of a bankruptcy of the entity providing the pledge of its ownership interests as security, we may not have full recourse to the assets of the property owning entity, or the assets of the entity may not be sufficient to satisfy our mezzanine loan. If a borrower defaults on our mezzanine loan or debt senior to our loan, or in the event of a borrower bankruptcy, our mezzanine loan will be satisfied only after the senior debt is paid in full. As a result, we may not recover some or all of our investment, which could result in losses. In addition, mezzanine loans may have higher loan to value ratios than conventional mortgage loans, resulting in less equity in the property and increasing the risk of loss of principal.
40
TABLE OF CONTENTS
We evaluate the collectability of both interest and principal of each of our loans, if circumstances warrant, to determine whether they are impaired. A loan is impaired when, based on current information and events, it is probable that we will be unable to collect all amounts due according to the existing contractual terms. When a loan is impaired, the amount of the loss provision is calculated by comparing the carrying amount of the investment to the value determined by discounting the expected future cash flows at the loan’s effective interest rate or, as a practical expedient, to the value of the collateral if the loan is collateral dependent. We cannot be certain that our estimates of collectible amounts will not change over time or that they will be representative of the amounts we actually collect, including amounts we would collect if we chose to sell these investments before their maturity. If we collect less than our estimates, we will record charges which could be material.
Investment in non-conforming and non-investment grade loans may involve increased risk of loss.
We have acquired or originated, and may continue to acquire or originate in the future, certain loans that do not conform to conventional loan criteria applied by traditional lenders and are not rated or are rated as non-investment grade (for example, for investments rated by Moody’s Investors Service, ratings lower than Baa3, and for Standard & Poor’s, BBB- or below). The non-investment grade ratings for these loans typically result from the overall leverage of the loans, the lack of a strong operating history for the properties underlying the loans, the borrowers’ credit history, the properties’ underlying cash flow or other factors. As a result, these loans have a higher risk of default and loss than conventional loans. Any loss we incur may reduce distributions to our stockholders. There are no limits on the percentage of unrated or non-investment grade assets we may hold in our portfolio.
Bridge loans involve a greater risk of loss than traditional mortgage loans.
We provide bridge loans secured by first lien mortgages on a property to borrowers who are typically seeking short-term capital to be used in an acquisition or renovation of real estate. The borrower has usually identified an undervalued asset that has been under-managed or is located in a recovering market. If the market in which the asset is located fails to recover according to the borrower’s projections, or if the borrower fails to improve the quality of the asset’s management or the value of the asset, the borrower may not receive a sufficient return on the asset to satisfy the bridge loan, and we may not recover some or all of our investment.
In addition, owners usually borrow funds under a conventional mortgage loan to repay a bridge loan. We may therefore be dependent on a borrower’s ability to obtain permanent financing to repay our bridge loan, which could depend on market conditions and other factors. Bridge loans are also subject to risks of borrower defaults, bankruptcies, fraud, losses and special hazard losses that are not covered by standard hazard insurance. In the event of any default under bridge loans held by us, we bear the risk of loss of principal and non-payment of interest and fees to the extent of any deficiency between the value of the mortgage collateral and the principal amount of the bridge loan. To the extent we suffer such losses with respect to our investments in bridge loans, the value of our company and the price of our common stock may be adversely affected.
Preferred equity investments involve a greater risk of loss than traditional debt financing.
Preferred equity investments are subordinate to debt financing and are not secured. Should the issuer default on our investment, we would only be able to proceed against the entity that issued the preferred equity in accordance with the terms of the preferred security, and not any property owned by the entity. Furthermore, in the event of bankruptcy or foreclosure, we would only be able to recoup our investment after any lenders to the entity are paid. As a result, we may not recover some or all of our investment, which could result in losses.
We may make investments in assets with lower credit quality, which will increase our risk of losses.
Substantially all of our securities investments have explicit ratings assigned by at least one of the three leading nationally-recognized statistical rating agencies. However, we may invest in unrated securities or participate in unrated or distressed mortgage loans. An economic downturn, for example, could cause a
41
TABLE OF CONTENTS
decline in the price of lower credit quality investments and securities because the ability of the obligors of mortgages, including mortgages underlying CMBS, to make principal and interest payments may be impaired. If this were to occur, existing credit support in the securitization structure may be insufficient to protect us against loss of our principal on these investments and securities. We have not established and do not currently plan to establish any investment criteria to limit our exposure to these risks for future investments.
Our investments in subordinate loans and subordinated CMBS are subject to losses.
We acquire subordinated loans and may invest in subordinated CMBS. In the event a borrower defaults on a loan and lacks sufficient assets to satisfy our loan, we may suffer a loss of principal or interest. In the event a borrower declares bankruptcy, we may not have full recourse to the assets of the borrower, or the assets of the borrower may not be sufficient to satisfy the loan. In addition, certain of our loans may be subordinate to other debt of the borrower. If a borrower defaults on our loan or on debt senior to our loan, or in the event of a borrower bankruptcy, our loan will be satisfied only after the senior debt is paid in full. Where debt senior to our loan exists, the presence of intercreditor arrangements may limit our ability to amend our loan documents, assign our loans, accept prepayments, exercise our remedies (through “standstill periods”) and control decisions made in bankruptcy proceedings relating to borrowers.
In general, losses on a mortgage loan included in a securitization will be borne first by the equity holder of the property, then by a cash reserve fund or letter of credit, if any, and then by the “first loss” subordinated security holder. In the event of default and the exhaustion of any equity support, reserve fund, letter of credit and any classes of securities junior to those in which we invest, we will not be able to recover all of our investment in the securities we purchase. Likewise, we may not be able to recover some or all of our investment in certain subordinated loans in which we obtain interests. In addition, if the underlying mortgage portfolio has been overvalued by the originator, or if the value subsequently declines and, as a result, less collateral is available to satisfy interest and principal payments due on the related CMBS, the securities in which we invest may effectively become the “first loss” position behind the more senior securities, which may result in significant losses to us.
An economic slowdown or recession, such as we are experiencing, could increase the risk of loss on our investments in subordinated CMBS. The prices of lower credit-quality securities, such as the subordinated CMBS in which we may invest, are very sensitive to adverse economic downturns or individual property developments. An economic downturn or a projection of an economic downturn could cause a decline in the price of lower credit quality securities because the ability of obligors of mortgages underlying CMBS to make principal and interest payments may be impaired. In such event, existing credit support to a securitized structure may be insufficient to protect us against loss of our principal on these securities.
Our due diligence may not reveal all of a borrower’s liabilities and may not reveal other weaknesses in its business.
Before making a loan to a borrower, we assess the strength and skills of such entity’s management and other factors that we believe are material to the performance of the investment. In making the assessment and otherwise conducting customary due diligence, we rely on the resources available to us and, in some cases, an investigation by third parties. This process is particularly subjective with respect to newly organized entities because there may be little or no information publicly available about the entities. There can be no assurance that our due diligence processes will uncover all relevant facts or that any investment will be successful.
We are subject to the risk that provisions of our loan agreements may be unenforceable.
Our rights and obligations with respect to our loans are governed by written loan agreements and related documentation. It is possible that a court could determine that one or more provisions of a loan agreement are unenforceable, such as a loan prepayment provision or the provisions governing our security interest in the underlying collateral. If this were to happen with respect to a material asset or group of assets we could be adversely affected.
42
TABLE OF CONTENTS
Credit ratings assigned to our CMBS investments are subject to ongoing evaluation and we cannot assure you that the ratings currently assigned to our investments will not be downgraded or that they accurately reflect the risks associated with those investments.
Some of the CMBS securities in which we invest are rated by S&P, Moody’s and/or Fitch. Rating agencies rate these investments based upon their assessment of the perceived safety of the receipt of principal and interest payments from the issuers of such debt securities. Credit ratings assigned by the rating agencies may not fully reflect the true risks of an investment in such securities. Also, rating agencies may fail to make timely adjustments to credit ratings based on recently available data or changes in economic outlook or may otherwise fail to make changes in credit ratings in response to subsequent events, so that our investments may in fact be better or worse than the ratings indicate. We try to reduce the impact of the risk that a credit rating may not accurately reflect the risks associated with a particular debt security by not relying solely on credit ratings as the indicator of the quality of an investment. We make our acquisition decisions after factoring in other information, such as the discounted value of a CMBS security’s projected future cash flows, and the value of the real estate collateral underlying the mortgage loans owned by the issuing Real Estate Mortgage Investment Conduit, or REMIC, trust. However, our assessment of the quality of a CMBS investment may also prove to be inaccurate and we may incur credit losses in excess of our initial expectations.
Credit rating agencies may also change their methods of evaluating credit risk and determining ratings on securities backed by real estate loans and securities. These changes have increased in frequency over the past year and in the future may occur quickly and often. Downgrades of CMBS could result in subsequent downgrades in the CDO liabilities issued by our CDOs. The commercial real estate mortgage finance, real estate and capital markets’ ability to understand and absorb these changes, and the impact to the securitization market in general, are difficult to predict, and such downgrades could have a material adverse effect on our business, financial condition, liquidity and results of operations.
We may not be able to find suitable replacement investments for CDOs within reinvestment periods.
Our CDOs have periods where principal proceeds received from assets securing the CDO can be reinvested only for a defined period of time, commonly referred to as a reinvestment period, and only if we are in compliance with certain collateral quality tests as set forth in the operative documents for each of our CDOs. The reinvestment periods on our 2005 and 2006 CDOs have expired and the reinvestment period on our 2007 CDO will end in August 2012. Our ability to find suitable investments during the reinvestment period that meet the criteria set forth in the CDO documentation and by rating agencies may determine the success of our CDO investments. Our potential inability to find suitable investments may cause, among other things, lower returns, interest deficiencies, hyper-amortization of the senior CDO securities and may cause us to reduce the life of our CDOs and accelerate the amortization of certain fees and expenses.
Our returns will be adversely affected when investments held in CDOs are prepaid or sold subsequent to the reinvestment period.
Our loan and CMBS investments are subject to prepayment risk. In addition, we may sell, and realize gains (or losses) on, investments. To the extent such assets were held in CDOs subsequent to the end of the reinvestment period, the proceeds are fully utilized to pay down the related CDO’s debt which will cause the leverage on the CDO to decrease. A reduction in leverage will cause our return on equity to be lower and such decrease could have a material adverse effect on our business, financial condition, liquidity and results of operations. A decrease in our return on equity could make it more difficult to raise capital in the future.
Our investments in debt securities are subject to specific risks relating to the particular issuer of the securities and to the general risks of investing in subordinated real estate securities.
Our investments in debt securities involve special risks. REITs generally are required to invest substantially in real estate or real estate-related assets and are subject to the inherent risks associated with real estate-related investments discussed in this filing. Our investments in debt are subject to the risks described above with respect to mortgage loans and CMBS and similar risks, including:
| • | risks of delinquency and foreclosure, and risks of loss in the event thereof; |
| • | the dependence upon the successful operation of and net income from real property; |
43
TABLE OF CONTENTS
| • | risks generally incident to interests in real property; and |
| • | risks that may be presented by the type and use of a particular commercial property. |
Debt securities may be unsecured and may also be subordinated to other obligations of the issuer. We may also invest in debt securities that are rated below investment grade. As a result, investments in debt securities are also subject to risks of:
| • | limited liquidity in the secondary trading market; |
| • | substantial market price volatility resulting from changes in prevailing interest rates or credit spreads; |
| • | subordination to the prior claims of banks and other senior lenders to the issuer; |
| • | the operation of mandatory sinking fund or call/redemption provisions during periods of declining interest rates that could cause the issuer to reinvest premature redemption proceeds in lower yielding assets; |
| • | the possibility that earnings of the debt security issuer may be insufficient to meet its debt service; and |
| • | the declining creditworthiness and potential for insolvency of the issuer of such debt securities during periods of rising interest rates and economic downturn. |
These risks may adversely affect the value of outstanding debt securities and the ability of the issuers thereof to repay principal and interest.
Our mortgage loans, mezzanine loans, participation interests in mortgage and mezzanine loans, real estate securities and preferred equity investments have been and may continue to be adversely affected by widening credit spreads, and if spreads continue to widen, the value of our loan and securities portfolios would decline further.
Our investments in commercial real estate loans and real estate securities are subject to changes in credit spreads. When credit spreads widen, the economic value of our existing loans decrease. If a lender were to originate a similar loan today, such loan would carry a greater credit spread than the existing loan. Even though a loan may be performing in accordance with its loan agreement and the underlying collateral has not changed, the economic value of the loan may be negatively impacted by the incremental interest foregone from the widened credit spread. The economic value of our commercial real estate loan portfolio and our real estate securities portfolio has been significantly impacted, and may continue to be significantly impacted, by credit spread widening.
Our hedging transactions may limit our gains or result in losses.
Subject to maintaining our qualification as a REIT, we use a variety of derivative instruments that are considered conventional “plain vanilla” derivatives, including interest rate swaps, caps, collars and floors, in our risk management strategy to limit the effects of changes in interest rates on our operations. The value of our derivatives may fluctuate over time in response to changing market conditions, and will tend to change inversely with the value of the risk in our liabilities that we intend to hedge. Hedges are sometimes ineffective because the correlation between changes in value of the underlying investment and the derivative instrument is less than was expected when the hedging transaction was undertaken. Our hedging transactions, which are intended to limit losses, may actually limit gains and increase our exposure to losses. The use of derivatives to hedge our liabilities carries certain risks, including the risk that losses on a hedge position will reduce the cash available for distribution to stockholders and that these losses may exceed the amount invested in such instruments. A hedge may not be effective in eliminating all of the risks inherent in any particular position and could result in higher interest rates than we would otherwise have. In addition, there will be various market risks against which we may not be able to hedge effectively. Moreover, no hedging activity can completely insulate us from the risks associated with changes in interest rates, and our qualification as a REIT may limit our ability to effectively hedge our interest rate exposure. Our profitability may be adversely affected during any period as a result of the use of derivatives. Also, mark-to-market adjustments on our hedging transactions may require us to post additional collateral or make a cash deposit that reduces our available liquidity.
44
TABLE OF CONTENTS
Risks Related to Our Organization and Structure
Maryland takeover statutes may prevent a change of control of our company, which could depress our stock price.
Under Maryland law, certain “business combinations” between a Maryland corporation and an interested stockholder or an affiliate of an interested stockholder are prohibited for five years after the most recent date on which the interested stockholder becomes an interested stockholder. These business combinations include a merger, consolidation, share exchange, or asset transfers or issuance or reclassification of equity securities. An interested stockholder is defined as:
| • | any person who beneficially owns 10% or more of the voting power of the corporation’s shares; or |
| • | an affiliate or associate of the corporation who, at any time within the two-year period prior to the date in question, was the beneficial owner of 10% or more of the voting power of the then outstanding voting stock of the corporation. |
A person is not an interested stockholder under the statute if our board of directors approves in advance the transaction by which he otherwise would have become an interested stockholder.
After the five-year prohibition, any business combination between the Maryland corporation and an interested stockholder generally must be recommended by our board of directors of the corporation and approved by the affirmative vote of at least:
| • | 80% of the votes entitled to be cast by holders of outstanding shares of voting stock of the corporation; and |
| • | two-thirds of the votes entitled to be cast by holders of voting stock of the corporation other than shares held by the interested stockholder with whom or with whose affiliate the business combination is to be effected or by the interested stockholder’s affiliates or associates, voting together as a single group. |
The business combination statute may discourage others from trying to acquire control of us and increase the difficulty of consummating any offer, including potential acquisitions that might involve a premium price for our common stock or otherwise be in the best interest of our stockholders.
We have opted out of these provisions of the Maryland General Corporation Law, or the MGCL, with respect to its business combination provisions and its control share provisions by resolution of our board of directors and a provision in our bylaws, respectively. However, in the future our board of directors may reverse its decision by resolution and elect to opt in to the MGCL’s business combination provisions, or amend our bylaws and elect to opt in to the MGCL’s control share provisions.
Additionally, Title 8, Subtitle 3 of the MGCL permits our board of directors, without stockholder approval and regardless of what is provided in our charter or bylaws, to implement takeover defenses, some of which we do not have. These provisions may have the effect of inhibiting a third party from making us an acquisition proposal or of delaying, deferring or preventing a change in our control under circumstances that otherwise could provide the stockholders with an opportunity to realize a premium over the then-current market price.
Our authorized but unissued preferred stock may prevent a change in our control which could be in the stockholders’ best interests.
Our charter authorizes us to issue additional authorized but unissued shares of our common stock or preferred stock. Any such issuance could dilute our existing stockholders’ interests. In addition, our board of directors may classify or reclassify any unissued shares of preferred stock and may set the preferences, rights and other terms of the classified or reclassified shares. As a result, our board of directors may establish a series of preferred stock that could delay or prevent a transaction or a change in control that might be in the best interest of our stockholders.
45
TABLE OF CONTENTS
Our staggered board of directors and other provisions of our charter and bylaws may prevent a change in our control.
Our board of directors is divided into three classes of directors. The current terms of the directors expire in 2011, 2012 and 2013. Directors of each class are chosen for three-year terms upon the expiration of their current terms, and each year one class of directors is elected by the stockholders. On April 22, 2010, Marc Holliday notified our board of directors that he would not stand for election as a Class III director for a new term at our 2010 annual meeting of stockholders. However, Mr. Holliday agreed with our board of directors that he would remain as a director on an interim basis for an unspecified period of time following our 2010 annual meeting. Due to the time necessary to complete the resolution of the Goldman Mortgage Loan and Goldman Mezzanine Loans, which has been subject to many delays, Mr. Holliday has remained as a director in an interim role for much longer than we intended. Under Maryland law, a director continues as a director until he resigns or his successor is duly elected and appointed.
The staggered terms of our directors may reduce the possibility of a tender offer or an attempt at a change in control, even though a tender offer or change in control might be in the best interest of our stockholders. In addition, our charter and bylaws also contain other provisions that may delay or prevent a transaction or a change in control that might be in the best interest of our stockholders.
Changes in market conditions could adversely affect the market price of our common stock.
As with other publicly traded equity securities, the value of our common stock depends on various market conditions which may change from time to time. Among the market conditions that may affect the value of our common stock are the following:
| • | the general reputation of REITs and the attractiveness of our equity securities in comparison to other equity securities, including securities issued by other real estate-based companies; |
| • | our financial performance; and |
| • | general stock and bond market conditions. |
The market value of our common stock is based primarily upon the market’s perception of our growth potential and our current and potential future earnings and cash distributions. Consequently, our common stock may trade at prices that are higher or lower than our net asset value per share of common stock. If our future earnings or cash dividends are less than expected, it is likely that the market price of our common stock will diminish.
An increase in market interest rates may have an adverse effect on the market price of our common stock.
One of the factors that investors may consider in deciding whether to buy or sell shares of our common stock is our distribution rate as a percentage of our share price relative to market interest rates. If the market price of our common stock is based primarily on the earnings and return that we derive from our investments and income with respect to our investments and our related distributions to stockholders, and not from the market value of the investments themselves, then interest rate fluctuations and capital market conditions will likely affect the market price of our common stock. For instance, if market rates rise without an increase in our distribution rate, the market price of our common stock could decrease as potential investors may require a higher distribution yield on our common stock or seek other securities paying higher distributions or interest. In addition, rising interest rates would result in increased interest expense on our variable rate debt, thereby adversely affecting cash flow and our ability to service our indebtedness and pay distributions.
Holders of the Series A preferred stock are entitled, under the articles supplementary of the Series A preferred stock, to elect one additional director to our board of directors at the next annual meeting of stockholders or at any special meeting called for such purpose, until full dividends accrued on the Series A preferred stocks have been paid in full or declared and set apart for payment.
We currently have 3,525,822 shares of the Series A preferred stock outstanding. Our board of directors has elected not to pay the Series A preferred stock dividends since the fourth quarter of 2008. Pursuant to the articles supplementary of the Series A preferred stock, if and when six or more quarterly dividends (whether
46
TABLE OF CONTENTS
or not consecutive) payable on the Series A preferred stock are in arrears, the holders of the Series A preferred stock, voting together as a single class, will be entitled to elect one additional director to our board of directors at any annual meeting of stockholders or any properly called special meeting for such purpose, until all arrears in dividends on the Series A preferred stock then outstanding have been paid and full dividends thereon for the current quarterly dividend period have been paid or declared and set apart for payment. We may be required to add one additional member to our board of directors if and when the holders of the Series A preferred stock exercise their right to elect one additional director.
Risks Related to Our Taxation as a REIT
Our failure to qualify as a REIT would result in higher taxes and reduced cash available for stockholders.
We intend to continue to operate in a manner so as to qualify as a REIT for U.S. federal income tax purposes. Our continued qualification as a REIT depends on our satisfaction of certain asset, income, organizational, distribution and stockholder ownership requirements on a continuing basis. Our ability to satisfy some of the asset tests depends upon the fair market values of our assets, some of which are not able to be precisely determined and for which we will not obtain independent appraisals. If we were to fail to qualify as a REIT in any taxable year, and certain statutory relief provisions were not available, we would be subject to U.S. federal income tax, including any applicable alternative minimum tax, on our taxable income at regular corporate rates, and distributions to stockholders would not be deductible by us in computing our taxable income. Any such corporate tax liability could be substantial and would reduce the amount of cash available for distribution. Unless entitled to relief under certain Internal Revenue Code provisions, we also would be disqualified from taxation as a REIT for the four taxable years following the year during which we ceased to qualify as a REIT.
REIT distribution requirements could adversely affect our liquidity.
In order to qualify as a REIT, each year we must distribute to our stockholders at least 90% of our REIT taxable income, if any, determined without regard to the dividends paid deduction, and not including any net capital gain. To the extent that we satisfy this distribution requirement, but distribute less than 100% of our net taxable income, we will be subject to U.S. federal corporate income tax on our undistributed net taxable income. In addition, we will be subject to a 4% nondeductible excise tax if the actual amount that we pay out to our stockholders in a calendar year is less than a minimum amount specified under U.S. federal tax laws.
When necessary, we intend to continue to make distributions to our stockholders to comply with the REIT distribution requirements and avoid corporate income tax and/or excise tax. However, differences in timing between the recognition of taxable income and the actual receipt of cash could require us to sell assets or borrow funds on a short-term or long-term basis to meet the 90% distribution requirement or avoid corporate income or excise tax. We may own assets that generate mismatches between taxable income and available cash. These assets may include (a) securities that have been financed through financing structures which require some or all of available cash flows to be used to service borrowings, (b) loans or CMBS we hold that have been issued at a discount and require the accrual of taxable economic interest in advance of receipt in cash and (c) distressed debt on which we may be required to accrue taxable interest income even though the borrower is unable to make current debt service payments in cash. As a result, the requirement to distribute a substantial portion of our net taxable income could cause us to: (a) sell assets in adverse market conditions, (b) borrow on unfavorable terms or (c) distribute amounts that would otherwise be invested in future acquisitions, capital expenditures or repayment of debt to comply with REIT requirements.
Further, amounts distributed will not be available to fund investment activities. We expect to fund our investments by raising equity capital and through borrowings from financial institutions and the debt capital markets. If we fail to obtain debt or equity capital in the future, it could limit our ability to grow, which could have a material adverse effect on the value of our common stock.
47
TABLE OF CONTENTS
In January 2011, an “ownership change” for purposes of Section 382 of the Internal Revenue Code, of 1986, as amended, occurred which limits our ability to utilize our net operating losses and net capital losses against future taxable income, increasing our dividend distribution requirement which could adversely affect our liquidity.
We have substantial net operating and net capital loss carry forwards which we have used to offset our tax and/or distribution requirements. In January 2011, an “ownership change” for purposes of Section 382 of the Internal Revenue Code occurred, which will limit our ability to use these losses in the future. In general, an “ownership change” occurs if there is a change in ownership of more than 50% of our common stock during any cumulative three year period. For this purpose, determinations of ownership changes are generally limited to shareholders deemed to own 5% or more of our common stock. Such a change in ownership may be triggered by regular trading activity in our common stock, which is generally beyond our control. The provisions of Section 382, will apply an annual limit to the amount of net operating loss carryforward that can be used by us to offset future ordinary taxable income, beginning with our 2011 taxable year. Such limitations may increase our dividend distribution requirement in the future which could adversely affect our liquidity.
Complying with REIT requirements may limit our ability to hedge effectively.
The existing REIT provisions of the Internal Revenue Code may limit our ability to hedge our operations. Except to the extent provided by Treasury regulations, (i) for transactions entered into on or prior to July 30, 2008, any income from a hedging transaction we enter into in the normal course of our business primarily to manage risk of interest rate or price changes or currency fluctuations with respect to borrowings made or to be made, or ordinary obligations incurred or to be incurred, to acquire or carry real estate assets, including gain from the sale or disposition of such a transaction, will not constitute gross income for purposes of the 95% gross income test (and will generally constitute non-qualifying income for purposes of the 75% gross income test) and (ii) for transactions entered into after July 30, 2008, any income from a hedging transaction where the instrument hedges interest rate risk on liabilities used to carry or acquire real estate or hedges risk of currency fluctuations with respect to any item of income or gain that would be qualifying income under the 75% or 95% gross income tests will be excluded from gross income for purposes of the 75% and 95% gross income tests. To qualify under either (i) or (ii) of the preceding sentence, the hedging transaction must be clearly identified as specified in Treasury regulations before the close of the day on which it was acquired, originated or entered into. To the extent that we enter into other types of hedging transactions, the income from those transactions is likely to be treated as non-qualifying income for purposes of both of the gross income tests. In addition, we must limit our aggregate income from non-qualified hedging transactions, from our provision of services and from other non-qualifying sources, to less than 5% of our annual gross income (determined without regard to gross income from qualified hedging transactions). As a result, we may have to limit our use of certain hedging techniques or implement those hedges through TRSs. This could result in greater risks associated with changes in interest rates than we would otherwise want to incur or could increase the cost of our hedging activities. If we fail to satisfy the 75% or 95% limitations, we could lose our REIT qualification for U.S. federal income tax purposes, unless our failure was due to reasonable cause and not due to willful neglect, and we meet certain other technical requirements. Even if our failure was due to reasonable cause, we might incur a penalty tax.
We may in the future choose to pay dividends in our own stock, in which case you may be required to pay income taxes in excess of the cash dividends you receive.
We may in the future distribute taxable dividends that are payable in cash and shares of our common stock at the election of each stockholder. Under IRS Revenue Procedure 2010 – 12, up to 90% of any such taxable dividend for 2010 and 2011 could be payable in our stock. Taxable stockholders receiving such dividends will be required to include the full amount of the dividend as ordinary income to the extent of our current and accumulated earnings and profits for United States federal income tax purposes. As a result, a U.S. stockholder may be required to pay income taxes with respect to such dividends in excess of the cash dividends received. If a U.S. stockholder sells the stock it receives as a dividend in order to pay this tax, the sales proceeds may be less than the amount included in income with respect to the dividend, depending on the market price of our stock at the time of the sale. Furthermore, with respect to non-U.S. stockholders, we may be required to withhold U.S. tax with respect to such dividends, including in respect of all or a portion of
48
TABLE OF CONTENTS
such dividend that is payable in stock. In addition, if a significant number of our stockholders determine to sell shares of our common stock in order to pay taxes owed on dividends, it may put downward pressure on the trading price of our common stock.
Further, while Revenue Procedure 2010 – 12 applies only to taxable dividends payable in cash or stock in 2010 and 2011, it is unclear whether and to what extent we will be able to pay taxable dividends in cash and stock in later years. Moreover, various aspects of such a taxable cash/stock dividend are uncertain and have not yet been addressed by the IRS. No assurance can be given that the IRS will not impose additional requirements in the future with respect to taxable cash/stock dividends, including on a retroactive basis, or assert that the requirements for such taxable cash/stock dividends have not been met.
The stock ownership limit imposed by the Internal Revenue Code for REITs and our charter may inhibit market activity in our stock and may restrict our business combination opportunities.
In order for us to maintain our qualification as a REIT under the Internal Revenue Code, not more than 50% in value of our outstanding stock may be owned, directly or indirectly, by five or fewer individuals (as defined in the Internal Revenue Code to include certain entities) at any time during the last half of each taxable year. Our charter, with certain exceptions, authorizes our directors to take such actions as are necessary and desirable to preserve our qualification as a REIT. Unless exempted by our board of directors, no person may own more than 9.8% of the aggregate value of the outstanding shares of our stock. Our board of directors may not grant such an exemption to any proposed transferee whose ownership of in excess of 9.8% of the value of our outstanding shares would result in the termination of our status as a REIT. Our board of directors has waived this provision in connection with SL Green’s purchase of our shares. We have also granted waivers to two other purchasers in connection with their purchase of our shares in a previous private placement. These ownership limits could delay or prevent a transaction or a change in our control that might be in the best interest of our stockholders.
The tax on prohibited transactions will limit our ability to engage in transactions, including certain methods of securitizing loans and selling our loans and real estate properties, that may be treated as sales for U.S. federal income tax purposes. In addition, as we have succeeded to any potential tax liability of American Financial in the merger, we may be subject to this tax on certain of its past dispositions. If the Internal Revenue Service were to successfully characterize those past dispositions as prohibited transactions, the resulting tax liability could have a material adverse effect on our results of operations.
A REIT’s gain from prohibited transactions is subject to a 100% tax. In general, prohibited transactions are sales or other dispositions of property, other than foreclosure property, but including mortgage loans and real estate, held primarily for sale to customers in the ordinary course of business.
We might be subject to this tax if we were to sell or securitize loans or dispose of loans or real estate in a manner that was treated as a sale of the loans or real estate for U.S. federal income tax purposes. Therefore, in order to avoid the prohibited transactions tax, we may choose not to engage in certain sales of loans or real estate and may limit the structures we utilize for our securitization transactions even though such sales or structures might otherwise be beneficial to us. It may be possible to reduce the impact of the prohibited transaction tax by engaging in securitization transactions treated as sales and loan and real estate dispositions through one or more of our TRSs, subject to certain limitations. Generally, to the extent that we engage in securitizations treated as sales or dispose of loans or real estate through one or more TRSs, the income associated with such activities would be subject to full corporate income tax at standard rates.
Prior to our merger with American Financial, American Financial disposed of properties that it deemed to be inconsistent with the investment parameters for its portfolio or for other reasons it deemed appropriate. If American Financial believed that a sale of a property would likely be subject to the prohibited transaction tax if sold by the parent REIT, it disposed of that property through its TRS, in which case the gain from the sale was subject to corporate income tax at standard rates but not the 100% prohibited transaction tax. We intend to continue to sell real estate in a manner similar to American Financial. If the Internal Revenue Service were to successfully characterize American Financial’s past dispositions (including the dispositions through its TRS) as prohibited transactions, we, as successor to American Financial’s tax liabilities and property disposition procedures, could be subject to a 100% tax on the gain from those dispositions, and the resulting tax liability
49
TABLE OF CONTENTS
could have a material adverse effect on our results of operations. In addition, we may be liable for the 100% prohibited transaction tax if the Internal Revenue Service were to successfully challenge our future dispositions of loans and real estate.
The “taxable mortgage pool” rules may limit the manner in which we effect future securitizations and may subject us to U.S. federal income tax and increase the tax liability of our stockholders.
Certain of our current and future securitizations, such as our CDOs, could be considered to result in the creation of taxable mortgage pools for U.S. federal income tax purposes. As a REIT, so long as we or another private subsidiary REIT own 100% of the equity interests in a taxable mortgage pool, our qualification as a REIT would not be adversely affected by the characterization of the securitization as a taxable mortgage pool. We would generally be precluded, however, from holding equity interests in such securitizations through our operating partnership (unless held through a private subsidiary REIT), selling to outside investors equity interests in such securitizations or from selling any debt securities issued in connection with such securitizations that might be considered to be equity interests for tax purposes. These limitations will preclude us from using certain techniques to maximize our returns from securitization transactions.
Furthermore, we are taxable at the highest corporate income tax rate on a portion of the income arising from a taxable mortgage pool that is allocable to the percentage of our shares held by “disqualified organizations,” which are generally certain cooperatives, governmental entities and tax-exempt organizations that are exempt from unrelated business taxable income. We expect that disqualified organizations will own our shares from time to time.
In addition, if we realize excess inclusion income and allocate it to stockholders, this income cannot be offset by net operating losses of our stockholders. If the stockholder is a tax-exempt entity and not a disqualified organization, then this income would be fully taxable as unrelated business taxable income under Section 512 of the Internal Revenue Code. If the stockholder is a foreign person, it would be subject to U.S. federal income tax withholding on this. Nominees or other broker/dealers who hold our stock on behalf of disqualified organizations are subject to tax at the highest corporate income tax rate on a portion of our excess inclusion income allocable to the stock held on behalf of disqualified organizations. If the stockholder is a REIT, a regulated investment company, or RIC, common trust fund, or other pass-through entity, its allocable share of our excess inclusion income could be considered excess inclusion income of such entity and such entity will be subject to tax at the highest corporate tax rate on any excess inclusion income allocated to their owners that are disqualified organizations. Accordingly, such investors should be aware that a portion of our income may be considered excess inclusion income. Finally, if we fail to qualify as a REIT, our taxable mortgage pool securitizations will be treated as separate taxable corporations for U.S. federal income tax purposes.
We may be unable to generate sufficient revenue from operations to pay our operating expenses and to pay distributions to our stockholders.
As a REIT, we are generally required to distribute at least 90% of our REIT taxable income, if any, determined without regard to the dividends paid deduction and not including net capital gains, each year to our stockholders. To qualify for the tax benefits accorded to REITs, we have and intend to continue to make distributions to our stockholders in amounts such that we distribute all or substantially all our net taxable income each year, subject to certain adjustments. However, our ability to make distributions may be adversely affected by the risk factors described in this Annual Report on Form 10-K. In the event of a downturn in our operating results and financial performance or unanticipated declines in the value of our asset portfolio, we may be unable to declare or pay quarterly distributions or make distributions to our stockholders. The timing and amount of distributions are in the sole discretion of our board of directors, which considers, among other factors, our earnings, financial condition, debt service obligations and applicable debt covenants, REIT qualification requirements and other tax considerations and capital expenditure requirements as our board may deem relevant from time to time.
50
TABLE OF CONTENTS
Although our use of TRSs may be able to partially mitigate the impact of meeting the requirements necessary to maintain our qualification as a REIT, our ownership of and relationship with our TRSs will be limited and a failure to comply with the limits would jeopardize our REIT qualification and may result in the application of a 100% excise tax.
A REIT may own up to 100% of the stock of one or more TRSs. A TRS generally may hold assets and earn income that would not be qualifying assets or income if held or earned directly by a REIT. Both the subsidiary and the REIT must jointly elect to treat the subsidiary as a TRS. A corporation of which a TRS directly or indirectly owns more than 35% of the voting power or value of the stock will automatically be treated as a TRS. Overall, no more than 25% (20% for tax years commencing before January 1, 2009) of the value of a REIT’s assets may consist of stock or securities of one or more TRSs. In addition, the TRS rules limit the deductibility of interest paid or accrued by a TRS to its parent REIT to assure that the TRS is subject to an appropriate level of corporate taxation. The rules also impose a 100% excise tax on certain transactions between a TRS and its parent REIT that are not conducted on an arm’s-length basis.
Our TRSs, including GKK Trading Corp., GIT Trading Corp., Whiteface Holdings, LLC and American Financial TRS, Inc., will pay U.S. federal, state and local income tax on their taxable income, and their after-tax net income will be available for distribution to us but will not be required to be distributed to us. We anticipate that the aggregate value of TRS securities owned by us will be less than 25% of the value of our total assets (including such TRS securities). Furthermore, we will monitor the value of our respective investments in our TRSs for the purpose of ensuring compliance with the rule that no more than 25% (20% for tax years commencing before January 1, 2009) of the value of a REIT’s assets may consist of TRS securities (which is applied at the end of each calendar quarter). In addition, we will scrutinize all of our transactions with our TRSs for the purpose of ensuring that they are entered into on arm’s-length terms in order to avoid incurring the 100% excise tax described above. The value of the securities that we hold in our TRSs may not be subject to precise valuation. Accordingly, there can be no complete assurance that we will be able to comply with the 25% (20% for tax years commencing before January 1, 2009) limitation discussed above or avoid application of the 100% excise tax discussed above.
While we believe that American Financial qualified as a REIT prior to the merger, there is no guaranty the Internal Revenue Service will not successfully challenge such characterization. In the event American Financial did not qualify as a REIT, we as successor to American Financial’s tax liabilities could be subject to significant corporate tax on American Financial’s income prior to the merger. If such a tax were imposed, it could have a material adverse effect on our results of operations.
A corporation which qualifies as a REIT is entitled to a deduction for dividends that it pays and, therefore, will not be subject to U.S. federal corporate income tax to the extent such corporation’s net income is currently distributed to its stockholders. However, should the corporation cease to qualify as a REIT it would no longer be entitled to a deduction for dividends paid and would therefore be required to pay U.S. federal corporate level tax on its net income regardless of any dividends paid.
While we believe that American Financial qualified as a REIT prior to the merger, should the Internal Revenue Service successfully challenge such characterization, American Financial would not have been eligible to deduct any dividends paid to its stockholders and it would have been subject to full U.S. federal corporate taxes on its net income. As successor to American Financial’s tax liabilities, we would be liable for any such tax imposed. If such taxes were imposed, it could have a material adverse effect on our results of operations.
Cautionary Note Regarding Forward-Looking Information
This report contains “forward-looking statements” within the meaning of Section 27A of the Securities Act and Section 21E of the Securities Exchange Act of 1934, as amended, or the Exchange Act. You can identify forward-looking statements by the use of forward-looking expressions such as “may,” “will,” “should,” “expect,” “believe,” “anticipate,” “estimate,” “intend,” “plan,” “project,” “continue,” or any negative or other variations on such expressions. Forward-looking statements include information concerning possible or assumed future results of our operations, including any forecasts, projections, plans and objectives for future operations. Although we believe that our plans, intentions and expectations as reflected in or
51
TABLE OF CONTENTS
suggested by those forward-looking statements are reasonable, we can give no assurance that the plans, intentions or expectations will be achieved. We have listed below some important risks, uncertainties and contingencies which could cause our actual results, performance or achievements to be materially different from the forward-looking statements we make in this report. These risks, uncertainties and contingencies include, but are not limited to, the following:
| • | our ability to complete an orderly transition of all or substantially all of the collateral for the Goldman Mortgage Loan and the Goldman Mezzanine Loans pursuant to the Settlement Agreement; |
| • | the continuity of the management agreement for the lender portfolio; |
| • | reduction in cash flows received from our investments, in particular our CDOs and our Gramercy Realty portfolio; |
| • | the adequacy of our cash reserves, working capital and other forms of liquidity; |
| • | the availability, terms and deployment of short-term and long-term capital; |
| • | the performance and financial condition of borrowers, tenants, and corporate customers; |
| • | the cost and availability of our financings, which depends in part on our asset quality, the nature of our relationships with our lenders and other capital providers, our business prospects and outlook and general market conditions; |
| • | availability of, and ability to retain, qualified personnel and directors; |
| • | our ability to satisfy all covenants in our CDOs and specifically compliance with overcollateralization and interest coverage tests; |
| • | changes to our management and board of directors; |
| • | the success or failure of our efforts to implement our current business strategy; |
| • | economic conditions generally and in the commercial finance and real estate markets and the banking industry specifically; |
| • | the resolution of our non-performing and sub-performing assets and any losses we might recognize in connection with such investments; |
| • | unanticipated increases in financing and other costs, including a rise in interest rates; |
| • | availability of investment opportunities on real estate assets and real estate-related and other securities; |
| • | our ability to comply with financial covenants in our debt instruments, but specifically in our loan agreement with PB Capital Corporation; |
| • | risks of structured finance investments; |
| • | risks of real estate acquisitions; |
| • | the actions of our competitors and our ability to respond to those actions; |
| • | the timing of cash flows, if any, from our investments; |
| • | our ability to lease-up assumed leasehold interests above the leasehold liability obligation; |
| • | demand for office space; |
| • | our ability to maintain our current relationships with financial institutions and to establish new relationships with additional financial institutions; |
| • | our ability to identify and complete additional property acquisitions; |
| • | our ability to profitably dispose of non-core assets; |
| • | changes in governmental regulations, tax rates and similar matters; |
52
TABLE OF CONTENTS
| • | legislative and regulatory changes (including changes to laws governing the taxation of REITs or the exemptions from registration as an investment company); |
| • | environmental and/or safety requirements; |
| • | our ability to satisfy complex rules in order for us to qualify as a REIT, for federal income tax purposes and qualify for our exemption under the Investment Company Act, our operating partnership’s ability to satisfy the rules in order for it to qualify as a partnership for federal income tax purposes, and the ability of certain of our subsidiaries to qualify as REITs and certain of our subsidiaries to qualify as taxable REIT subsidiaries for federal income tax purposes, and our ability and the ability of our subsidiaries to operate effectively within the limitations imposed by these rules; |
| • | the continuing threat of terrorist attacks on the national, regional and local economies; and |
| • | other factors discussed under Item IA Risk Factors of this Annual Report on Form 10-K for the year ended December 31, 2010 and those factors that may be contained in any filing we make with the SEC, including Part II, Item 1A of the Quarterly Reports on Form 10-Q. |
We assume no obligation to update publicly any forward-looking statements, whether as a result of new information, future events, or otherwise. In evaluating forward-looking statements, you should consider these risks and uncertainties, together with the other risks described from time-to-time in our reports and documents which are filed with the SEC, and you should not place undue reliance on those statements.
The risks included here are not exhaustive. Other sections of this report may include additional factors that could adversely affect our business and financial performance. Moreover, we operate in a very competitive and rapidly changing environment. New risk factors emerge from time to time and it is not possible for management to predict all such risk factors, nor can it assess the impact of all such risk factors on our business or the extent to which any factor, or combination of factors, may cause actual results to differ materially from those contained in any forward-looking statements. Given these risks and uncertainties, investors should not place undue reliance on forward-looking statements as a prediction of actual results.
SPECIAL NOTE REGARDING EXHIBITS
In reviewing the agreements included as exhibits to this Annual Report on Form 10-K, please remember they are included to provide you with information regarding their terms and are not intended to provide any other factual or disclosure information about our company or the other parties to the agreements. The agreements contain representations and warranties by each of the parties to the applicable agreement. These representations and warranties have been made solely for the benefit of the other parties to the applicable agreement and:
| • | should not in all instances be treated as categorical statements of fact, but rather as a way of allocating the risk tone of the parties if those statements provide to be inaccurate; |
| • | have been qualified by disclosures that were made to the other party in connection with the negotiation of the applicable agreement, which disclosures are not necessarily reflected in the agreement; |
| • | may apply standards of materiality in a way that is different from what may be viewed as material to you or other investors; and |
| • | were made only as of the date of the applicable agreement or such other date or dates as may be specified in the agreement and are subject to more recent developments. |
Accordingly, these representations and warranties may not describe the actual state of affairs as of the date they were made or at any other time. Additional information about our company may be found elsewhere in this Annual Report on Form 10-K and our other public filings, which are available without charge through the SEC’s website athttp://www.sec.gov. See “Item 1. Business — Corporate Governance and Internet Address: Where Readers Can Find Additional Information.”
ITEM 1B. UNRESOLVED STAFF COMMENTS
As of December 31, 2010, we did not have any unresolved comments with the staff of the SEC.
53
TABLE OF CONTENTS
ITEM 2. PROPERTIES
Our corporate headquarters are located in midtown Manhattan at 420 Lexington Avenue, New York, New York 10170. We also have regional offices located in Jenkintown, Pennsylvania, St. Louis, Missouri and Charlotte, North Carolina. We can be contacted at (212) 297-1000. We maintain a website atwww.gkk.com. Our reference to our website is intended to be an inactive textual reference only. Information contained in our website is not, and should not be interpreted to be, part of this Annual Report on Form 10-K.
As of December 31, 2010, Gramercy Finance held interests in one CTL investment, and eight interests in real estate acquired through foreclosures.
As of December 31, 2010, Gramercy Realty’s portfolio consisted of 948 properties, including 625 bank branches, 321 office buildings and two land parcels, of which 54 bank branches were owned through an unconsolidated joint venture. Gramercy Realty’s consolidated properties aggregated approximately 25.3 million rentable square feet and its unconsolidated properties aggregated approximately 251,000 rentable square feet. As of December 31, 2010, the occupancy of Gramercy Realty’s consolidated properties was 82.6% and the occupancy for its unconsolidated properties was 100.0%. The weighted average remaining term of the leases in Gramercy Realty’s consolidated portfolio was 8.5 years. Approximately 76.7% of its contractual rent was derived from leases with financial institution tenants. The two largest tenants are Bank of America and Wells Fargo Bank and for the year ended December 31, 2010, they represented approximately 41.0% and 15.3%, respectively, of the rental income of Gramercy’s consolidated portfolio and occupied approximately 42.7% and 16.6%, respectively, of Gramercy Realty’s total consolidated rentable square feet.
In September 2011, we entered into the Settlement Agreement for an orderly transition of substantially all of Gramercy Realty’s assets to the mezzanine lenders of the Goldman Mortgage Loan and the Goldman Mezzanine Loans, in exchange for a mutual release of claims among us and the mortgage and mezzanine lenders and, subject to certain termination provisions, our continued management of Gramercy Realty’s assets on behalf of the mezzanine lenders for a fixed fee plus incentive fees. In July 2011, our Dana portfolio, which consists of 15 properties totaling approximately 3.8 million rentable square feet was transferred to its mortgage lender through a deed in lieu of foreclosure.
The following table presents the Gramercy Realty consolidated portfolio as of December 31, 2010:
| | | | | | | | | | |
| Properties(1) | | Number of Properties | | Rentable
Sq. Ft. | | Occupancy | | Percentage of 2011 Contractual Rent | | Percentage of Portfolio NOI(2) |
| Branches | | | 571 | | | | 3,689,190 | | | | 84.4 | % | | | 25.0 | % | | | 22.0 | % |
| Office Buildings | | | 321 | | | | 21,613,441 | | | | 82.3 | % | | | 75.0 | % | | | 78.0 | % |
| Land | | | 2 | | | | — | | | | — | | | | — | | | | — | |
| | | | 894 | | | | 25,302,631 | | | | 82.6 | % | | | 100.0 | % | | | 100.0 | % |
| (1) | Excludes investments in unconsolidated joint ventures. Approximately 872 properties, of which 54 properties are held by an unconsolidated joint venture, comprising approximately 20.9 million rentable square feet, or the lender portfolio, are expected to be subject to the Settlement Agreement and ownership will be transferred to Gramercy Realty’s mezzanine lenders, in exchange for a mutual release of claims among us and the mortgage and mezzanine lenders and, subject to certain termination provisions, our continued management of the properties on behalf of the mezzanine lenders for a fixed fee plus incentive fees. In addition, our Dana portfolio, which consists of 15 properties comprising approximately 3.8 million rentable square feet, was transferred to its mortgage lender through a deed in lieu of foreclosure. We will continue to manage the lender portfolio. |
| (2) | Net operating income is a non-GAAP financial measure that represents income before provision for taxes, minority interest and discontinued operations. We believe that net operating income provides an accurate measure of the operating performance of our operating assets because net operating income excludes certain items that are not associated with management of the properties. Additionally, we believe that net operating income is a widely accepted measure of comparative operating performance in the real estate community. Net operating income does not represent net income (loss) in accordance with GAAP and should not be considered as an alternative to net income (determined in accordance with GAAP), as an indication of our financial performance. Our calculation of net operating income may be different from the calculation used by other companies and, therefore, comparability may be limited. |
54
TABLE OF CONTENTS
Gramercy Realty owns properties in 36 states and Washington, D.C. set forth below are the top ten states based on percent of consolidated portfolio net operating income:
| | | | | | | | | | |
| States | | Number of
Properties(1)(2) | | Rentable
Sq. Ft. | | Percentage of
Portfolio
Rentable
Sq. Ft. | | Occupancy | | Percentage of
Portfolio NOI |
| 1 North Carolina | | | 173 | | | | 4,252,125 | | | | 16.8 | % | | | 88.0 | % | | | 20.4 | % |
| 2 Florida | | | 144 | | | | 3,122,319 | | | | 12.3 | % | | | 83.0 | % | | | 14.0 | % |
| 3 Virginia | | | 43 | | | | 2,550,945 | | | | 10.1 | % | | | 85.9 | % | | | 12.4 | % |
| 4 Georgia | | | 67 | | | | 1,500,105 | | | | 5.9 | % | | | 77.0 | % | | | 7.1 | % |
| 5 Pennsylvania | | | 45 | | | | 1,467,529 | | | | 5.8 | % | | | 91.3 | % | | | 6.6 | % |
| 6 California | | | 95 | | | | 1,512,019 | | | | 6.0 | % | | | 90.9 | % | | | 5.7 | % |
| 7 Maryland | | | 7 | | | | 1,041,138 | | | | 4.1 | % | | | 62.4 | % | | | 4.6 | % |
| 8 Illinois | | | 14 | | | | 1,432,194 | | | | 5.7 | % | | | 81.0 | % | | | 3.2 | % |
| 9 Delaware | | | 2 | | | | 378,723 | | | | 1.5 | % | | | 100.0 | % | | | 3.0 | % |
| 10 South Carolina | | | 22 | | | | 583,658 | | | | 2.3 | % | | | 89.5 | % | | | 2.7 | % |
| Total | | | 612 | | | | 17,840,755 | | | | 70.5 | % | | | 84.7 | % | | | 79.7 | % |
| (1) | Land parcels are excluded from property totals. |
| (2) | Approximately 872 properties, of which 54 properties are held by an unconsolidated joint venture, comprising approximately 20.9 million rentable square feet, or the lender portfolio, are expected to be subject to the Settlement Agreement and ownership will be transferred to Gramercy Realty’s mezzanine lenders, in exchange for a mutual release of claims among us and the mortgage and mezzanine lenders and, subject to certain termination provisions, our continued management of the properties on behalf of the mezzanine lenders for a fixed fee plus incentive fees. In addition, our Dana portfolio, which consists of 15 properties comprising approximately 3.8 million rentable square feet, was transferred to its mortgage lender through a deed in lieu of foreclosure. We will continue to manage the lender portfolio. |
Set forth below is information regarding lease expirations for Gramercy Realty’s consolidated properties as of December 31, 2010 (dollars in thousands):
| | | | | | | | | | |
Year of Lease
Expiration(1) | | Number of Expiring Leases | | Total Sq. Ft. under Expiring Leases | | Percentage of
Total Rentable
Sq. Ft. | | 2011 Contractual Rent under Expiring Leases | | Percentage of 2011 Contractual Rent |
| Monthly | | | 72 | | | | 160,168 | | | | 0.6 | % | | $ | 93 | | | | — | |
| 2011 | | | 166 | | | | 677,618 | | | | 2.7 | % | | | 6,560 | | | | 3.1 | % |
| 2012 | | | 116 | | | | 892,446 | | | | 3.5 | % | | | 16,245 | | | | 7.7 | % |
| 2013 | | | 93 | | | | 498,912 | | | | 2.0 | % | | | 11,375 | | | | 5.4 | % |
| 2014 | | | 63 | | | | 535,483 | | | | 2.1 | % | | | 10,763 | | | | 5.1 | % |
| 2015 | | | 96 | | | | 1,277,602 | | | | 5.1 | % | | | 21,679 | | | | 10.3 | % |
| 2016 | | | 45 | | | | 445,784 | | | | 1.8 | % | | | 7,917 | | | | 3.8 | % |
| 2017 | | | 40 | | | | 532,743 | | | | 2.1 | % | | | 10,285 | | | | 4.9 | % |
| 2018 | | | 9 | | | | 44,079 | | | | 0.2 | % | | | 1,140 | | | | 0.5 | % |
| 2019 | | | 161 | | | | 3,156,108 | | | | 12.5 | % | | | 23,593 | | | | 11.3 | % |
| 2020 | | | 74 | | | | 821,352 | | | | 3.2 | % | | | 7,422 | | | | 3.5 | % |
| 2021 and thereafter | | | 396 | | | | 11,850,467 | | | | 46.8 | % | | | 93,285 | | | | 44.4 | % |
| Total | | | 1,331 | | | | 20,892,762 | | | | 82.6 | % | | $ | 210,357 | | | | 100.0 | % |
| (1) | Excludes leases for parking, signs and antennae. |
55
TABLE OF CONTENTS
Set forth below is general information as of December 31, 2010, relating to Gramercy Realty’s consolidated properties.
| | | | | | | | | | | | |
| Portfolio/Property Description(1) | | Number of Properties(1) | | Rentable
Sq. Ft. | | Occupancy(2) | | Percentage of 2011 Contractual Rent | | Primary Tenant | | Percentage Leased to Primary Tenant(1) |
| BBD1 | | | 119 | | | | 5,712,267 | | | | 88.3 | % | | | 22.1 | % | | | Bank of America | | | | 82.0 | % |
| BBD2 | | | 149 | | | | 4,543,177 | | | | 80.5 | % | | | 13.0 | % | | | Bank of America | | | | 67.3 | % |
| DANA | | | 15 | | | | 3,821,375 | | | | 79.5 | % | | | 7.5 | % | | | Bank of America | | | | 60.1 | % |
| PREFCO BoA | | | 87 | | | | 440,649 | | | | 96.6 | % | | | 2.7 | % | | | Bank of America | | | | 86.9 | % |
| Charlotte Office Bldg | | | 1 | | | | 565,694 | | | | 76.5 | % | | | 3.7 | % | | | Bank of America | | | | 46.1 | % |
| WBBD | | | 66 | | | | 4,203,502 | | | | 90.2 | % | | | 11.1 | % | | | Wells Fargo Bank | | | | 86.9 | % |
| PREFCO Wachovia | | | 77 | | | | 960,643 | | | | 60.0 | % | | | 3.8 | % | | | Wells Fargo Bank | | | | 52.8 | % |
| Jersey City Office Bldg | | | 1 | | | | 330,329 | | | | 82.1 | % | | | 3.9 | % | | | Citco Fund Services
(USA), Inc. | | | | 31.6 | % |
| Regions | | | 54 | | | | 1,254,411 | | | | 56.8 | % | | | 2.0 | % | | | Regions Bank | | | | 44.4 | % |
| Philadelphia Office Bldg | | | 1 | | | | 365,624 | | | | 99.7 | % | | | 3.8 | % | | | General Services
Administration (GSA) | | | | 46.7 | % |
| Providence Office Bldg | | | 1 | | | | 224,089 | | | | 98.3 | % | | | 3.5 | % | | | Citizens Financial
Group | | | | 42.5 | % |
| Wilmington Office Bldg | | | 1 | | | | 263,058 | | | | 100.0 | % | | | 2.5 | % | | | Zurich Financial
Services Group | | | | 100.0 | % |
| PREFCO Key | | | 30 | | | | 140,590 | | | | 100.0 | % | | | 1.4 | % | | | KeyBank | | | | 100.0 | % |
| Other Branches | | | 269 | | | | 1,308,656 | | | | 80.3 | % | | | 14.1 | % | | | Various | |
| Other Offices | | | 21 | | | | 1,168,567 | | | | 77.8 | % | | | 4.9 | % | | | Various | | | | | |
| Land | | | 2 | | | | — | | | | — | | | | 0.0 | % | | | | | | | | |
| Total Portfolio | | | 894 | | | | 25,302,631 | | | | 82.6 | % | | | 100.0 | % | | | | | | | | |
| (1) | Approximately 872 properties, of which 54 properties are held by an unconsolidated joint venture, comprising approximately 20.9 million rentable square feet, or the lender portfolio, are expected to be subject to the Settlement Agreement and ownership will be transferred to Gramercy Realty’s mezzanine lenders, in exchange for a mutual release of claims among us and the mortgage and mezzanine lenders and, subject to certain termination provisions, our continued management of the properties on behalf of the mezzanine lenders for a fixed fee plus incentive fees. In addition, our Dana portfolio, which consists of 15 properties comprising approximately 3.8 million rentable square feet, was transferred to its mortgage lender through a deed in lieu of foreclosure. We will continue to manage the lender portfolio. |
| (2) | Percentage based on rentable square feet. All square feet leased by tenant in respective portfolio or property is included, of which some leases might have different lease terms. |
At December 31, 2010 and 2009, we had no single property with a book value equal to or greater than 10.0% of our total assets. For the years ended December 31, 2010 and 2009, we had no single property with gross revenues equal to or greater than 10.0% of our total revenues. Our two largest tenants are Bank of America and Wells Fargo Bank and, as of December 31, 2010, they represented approximately 41.0% and 15.3%, respectively, of the rental income of our portfolio and occupied approximately 42.7% and 16.6%, respectively, of our total rentable square feet. No other Gramercy Realty tenant pays rent representing more than 5.0% of the rental income of our portfolio or occupies more than 5.0% of our total rentable area.
A detailed listing of our properties is presented in Item 8 — Schedule III Real Estate Investments.
Bank of America, N.A.
Significant leases with Bank of America include the multi-property portfolio leases that are referred to as the BBD1, BBD2, Dana and PREFCO BoA Portfolios, and an office property in Charlotte, North Carolina. In addition, Bank of America leases space in four other office properties and in seven branch properties.
56
TABLE OF CONTENTS
As of December 31, 2010, the BBD1 Portfolio was comprised of 119 properties containing approximately 5.7 million square feet. Approximately 4.7 million square feet, or 82.0% of the BBD1 Portfolio, is leased to Bank of America for a term ending June 30, 2023. The base rent paid by Bank of America under the BBD1 Portfolio lease equals $8.74 per square foot, escalating to $8.87 per square foot in 2013 and $9.00 per square foot in 2018. In addition, Bank of America pays its proportionate share of property operating expenses, including capital items on an amortized basis. The BBD1 Portfolio lease currently permits Bank of America to reduce its leased premises by approximately 5 thousand square feet, an additional 105 thousand square feet commencing January 1, 2012, and by an additional 105 thousand square feet commencing January 1, 2017, all upon 60 days prior notice and without payment of a termination fee. Bank of America has the right to renew the BBD1 Portfolio lease, in whole or in part, for up to six consecutive terms of five years each, ending not later than June 30, 2053. Bank of America Corporation has guaranteed the lessee’s obligations under the BBD1 Portfolio lease.
As of December 31, 2010, the BBD2 Portfolio was comprised of 149 properties containing approximately 4.5 million square feet. Approximately 3.1 million square feet, or 67.3% of the BBD2 Portfolio, is leased to Bank of America for a term ending September 30, 2019. The base rent paid by Bank of America under the BBD2 Portfolio lease equals $6.90 per square foot, escalating to $7.00 per square foot in 2014. In addition, Bank of America pays its proportionate share of property operating expenses, including capital items on an amortized basis. The BBD2 Portfolio lease permits Bank of America to reduce its leased premises by up to approximately 16 thousand square feet, upon 56 weeks prior notice and the payment of a termination fee. In addition, Bank of America may reduce its leased premises by approximately 139 thousand square feet commencing April 1, 2013, upon 60 days prior notice and without payment of a termination fee. Bank of America has the right to renew the BBD2 Portfolio lease, in whole or in part, for up to 17 consecutive terms of five years each for all banking center properties and for up to seven consecutive terms of five years each for all other properties. Bank of America Corporation has guaranteed the lessee’s obligations under the BBD2 Portfolio lease.
As of December 31, 2010, the Dana Portfolio consists of 13 office buildings and two parking facilities containing approximately 3.8 million square feet of which approximately 2.3 million square feet, or 60.1%, is currently leased to Bank of America. Under the Dana Portfolio lease, which was originally entered into by Bank of America, as tenant, and Dana Commercial Credit Corporation, as landlord, as part of a larger bond-net lease transaction, Bank of America was required to make annual base rental payments of approximately $40.4 million through January 2010, an annual base rental payment of approximately $3.0 million in January 2011 and no annual base rental payments from January 2012 through lease expiration in June 2022. From January 2012 until the expiration of the initial term of the Dana Portfolio lease, Bank of America is only required to pay operating expenses, including capital items as incurred, on the space that it occupies. As permitted by the Dana Portfolio lease, Bank of America elected to surrender in June 2009, approximately 958 thousand square feet. This surrender did not reduce the annual base rental otherwise required to be paid to us by Bank of America. Under the Dana Portfolio lease, in June 2015, Bank of America may vacate and surrender additional leased premises constituting 16.0% of the original Dana Portfolio purchase price value. If Bank of America fails to vacate space as otherwise permitted under the lease, it is obligated to pay additional rent as provided in the Dana Portfolio lease for the space it is permitted to but does not vacate, which is currently approximately $60 thousand annually. In July 2011, the Dana Portfolio was transferred to its mortgage lender through a deed in lieu of foreclosure.
As of December 31, 2010, the PREFCO BoA Portfolio is comprised of 87 branches containing approximately 441 thousand square feet. Bank of America net leases 86.9% of the PREFCO BoA Portfolio, of which 80.2% expires on September 30, 2023 and 6.7% expires on March 31, 2012. Bank of America is required to make annual base rental payments of approximately $5.0 million and $410 thousand throughout the remaining terms to September 30, 2023 and March 31, 2012, respectively. In addition, Bank of America operates and maintains each of the properties it leases under the PREFCO BoA Portfolio at Bank of America’s sole cost and expense. Bank of America has the right to renew the PREFCO BoA Portfolio lease that expires in 2023, in whole or in part, for up to 30 years in consecutive terms of not less than five years (but not more than 10 years each), ending not later than September 30, 2053, and has three renewal options of three years each remaining on the lease that expires in 2012.
57
TABLE OF CONTENTS
In the Charlotte Office Building, Bank of America leases 261 thousand square feet, or 46.1% of the building area. The base rent paid by Bank of America at this location averages approximately $18.00 per square foot.
Wells Fargo Bank, National Association
Significant leases with Wells Fargo Bank (formerly Wachovia Bank) include the multi-property portfolio leases that are referred to as the WBBD and PREFCO Wachovia Portfolios. In addition, Wells Fargo Bank leases space in two other office properties and in three branch properties.
As of December 31, 2010, the WBBD Portfolio is comprised of 66 commercial office properties containing approximately 4.2 million square feet. Approximately 3.7 million square feet, or 86.9% of the WBBD Portfolio, is leased to Wells Fargo Bank for a term ending September 30, 2024. The base rent per square foot paid by Wells Fargo Bank under the WBBD Portfolio lease equals $6.04 per square foot, escalating to $6.13 per square foot in 2014 and $6.22 per square foot in 2019. In addition, Wells Fargo Bank pays its proportionate share of property operating expenses, including capital items on an amortized basis. The WBBD Portfolio lease currently permits Wells Fargo Bank to reduce its leased premises by approximately 10 thousand square feet, by an additional 234 thousand square feet commencing October 1, 2012, and by an additional 234.3 thousand square feet commencing October 1, 2017, all upon nine months prior notice and without payment of a termination fee. Wells Fargo Bank has the right to renew the WBBD Portfolio lease, in whole or in part, for up to six consecutive terms of five years each, ending not later than September 30, 2053. Wachovia Corporation guaranteed the lessee’s obligations under the WBBD Portfolio lease.
As of December 31, 2010, the PREFCO Wachovia Portfolio is comprised of 77 properties containing approximately 961 thousand square feet. Wells Fargo Bank net leases 52.8% of the PREFCO Wachovia Portfolio, of which 36.8% expires on August 31, 2015, 15.4% expires on March 31, 2023, and 0.6% expires on August 31, 2030. Wells Fargo Bank pays approximately $4.9 million, $2.4 million and $145 thousand annually for the spaces expiring on August 31, 2015, March 31, 2023, and August 31, 2030, respectively. In addition, Wells Fargo Bank operates and maintains the properties it leases at Wells Fargo Bank’s sole cost and expense. Wells Fargo has the right to renew its leased properties, in whole or in part, for up to four consecutive terms of five years each. In August 2010, Wells Fargo Bank exercised its first renewal option on the group of properties that now expires in August 2015.
Leased Properties
As of December 31, 2010, Gramercy Realty subleases approximately 330 thousand square feet in the Jersey City Office Building through September 2017. It also has assumed certain management functions with respect to an additional 264 thousand square feet of space in the same building that has been subleased to third-party tenants. In the event that any of these third-party tenants defaults on their lease obligations or fails to renew their lease upon expiration, Gramercy Realty has agreed to sublease this additional space through September 2017. Of the approximately 330 thousand square feet that Gramercy Realty currently subleases, it has in turn sublet approximately 271 thousand square feet.
Development Plans
As of December 31, 2010, we have no plans for the renovation, improvement or development of our properties other than in connection with its on-going repair and maintenance and tenant leasing programs.
ITEM 3. LEGAL PROCEEDINGS
As of December 31, 2010, we were not involved in any material litigation.
58
TABLE OF CONTENTS
ITEM 4. RESERVED
ITEM 5. MARKET FOR REGISTRANT’S COMMON EQUITY, RELATED STOCKHOLDER MATTERS AND ISSUER PURCHASES OF EQUITY SECURITIES
Our common stock began trading on the New York Stock Exchange, or the NYSE, on August 2, 2004 under the symbol “GKK.” On September 21, 2011, the reported closing sale price per share of common stock on the NYSE was $3.22 and there were approximately 215 holders of record of our common stock. The table below sets forth the quarterly high and low closing sales prices of our common stock on the NYSE for the years ended December 31, 2010 and 2009 and the distributions paid by us with respect to the periods indicated.
| | | | | | | | | | | | |
| | 2010 | | 2009 |
| Quarter Ended | | High | | Low | | Dividends | | High | | Low | | Dividends |
| March 31 | | $ | 4.33 | | | $ | 2.50 | | | $ | — | | | $ | 1.68 | | | $ | 0.43 | | | $ | — | |
| June 30 | | $ | 3.36 | | | $ | 1.15 | | | $ | — | | | $ | 3.20 | | | $ | 0.98 | | | $ | — | |
| September 30 | | $ | 1.65 | | | $ | 1.25 | | | $ | — | | | $ | 2.97 | | | $ | 1.23 | | | $ | — | |
| December 31 | | $ | 2.84 | | | $ | 1.51 | | | $ | — | | | $ | 3.34 | | | $ | 2.15 | | | $ | — | |
If dividends are declared in a quarter, those dividends will be paid during the subsequent quarter. Beginning with the third quarter of 2008, our board of directors elected to not pay a dividend on our common stock. Additionally our board of directors elected not to pay the Series A preferred stock dividend of $0.50781 per share beginning with the fourth quarter of 2008. The unpaid Series A preferred stock dividend has been accrued for nine quarters as of December 31, 2010. As a result, we have accrued dividends for over six quarters which pursuant to the terms of our charter, permits the Series A preferred stockholders to elect an additional director to our board of directors. We may, or upon request of the holders of the Series A preferred stock representing 20% or more of the liquidation value of the Series A preferred stock shall, call a special meeting of our stockholders to elect such additional director in accordance with the provisions of our bylaws and other procedures established by our board of directors relating to election of directors. Based on current estimates of our taxable loss, we expect that we will have no distribution requirements in order to maintain our REIT status for the 2010 tax year and we expect that we will continue to elect to retain capital for liquidity purposes until the requirement to make a cash distribution to satisfy our REIT requirements arise. We may elect to pay dividends on our common stock in cash or a combination of cash and shares of common stock as permitted under U.S. federal income tax laws governing REIT distribution requirements. However, in accordance with the provisions of our charter, we may not pay any dividends on our common stock until all accrued dividends and the dividend for the then current quarter on the Series A preferred stock are paid in full. We expect to continue our policy of generally distributing 100% of our taxable income through dividends, although there is no assurance as to future dividends because they depend on future earnings, capital requirements and financial condition. See Item 7 “Management’s Discussion and Analysis of Financial Condition and Results of Operations — Dividends” for additional information regarding our dividends.
For the year ended December 31, 2008, we declared dividends of $1.26 per share, of which $1.26 represented distributions of taxable earnings and profits.
59
TABLE OF CONTENTS
Stock Performance Graph
This graph compares the performance of our shares with the Standard & Poor’s 500 Composite Index and the NAREIT All REIT Index. This graph assumes $100 invested on January 1, 2006 and assumes the reinvestment of dividends.
COMPARISON OF 5-YEAR CUMULATIVE TOTAL RETURN AMONG
GRAMERCY CAPITAL CORP., S&P 500 COMPOSITE INDEX AND
NAREIT ALL REIT INDEX

Equity Compensation Plan Information
The following table summarizes information, as of December 31, 2010, relating to our equity compensation plans pursuant to which shares of our common stock or other equity securities may be granted from time to time.
| | | | | | |
| Plan Category | | (a)
Number of securities to
be issued upon exercise
of outstanding options,
warrants and rights | | (b)
Weighted-average
exercise price of
outstanding options,
warrants and rights | | (c)
Number of securities
remaining available for
future issuance under
equity compensation
plans (excluding
securities reflected in
column (a)) |
| Equity compensation plans approved by security holders(1) | | | 841,377 | | | $ | 11.82 | | | | 1,656,711 | |
| Equity compensation plans not approved by security holders | | | N/A | | | | N/A | | | | N/A | |
| Total | | | 841,377 | | | $ | 11.82 | | | | 1,656,711 | |
| (1) | Includes information related to our 2004 Equity Incentive Plan. |
Issuer Purchases of Equity Securities
In November 2010, we settled a tender offer to purchase up to 4,000,000 shares of our Series A preferred stock for $15.00 per preferred share, net to seller in cash. In the aggregate, we paid approximately $16.6 million to acquire the 1,074,178 shares of the Series A preferred stock tendered and not withdrawn. The shares of Series A preferred stock acquired by us were retired upon receipt and accrued and unpaid dividends of $4.4 million or $4.0625 per share of the acquired Series A preferred stock, were eliminated. After settlement of the tender offer, 3,525,822 shares of Series A preferred stock remain outstanding for trading on the NYSE.
60
TABLE OF CONTENTS
The table below provides information concerning our repurchase of shares of our equity securities during the quarter ended December 31, 2010.
| | | | | | | | |
| Period | | Total number of
shares purchased | | Average price paid
per share | | Total number of
shares purchased
as part of publicly
announced plans or
programs(1) | | Maximum number
(or approximate
dollar value) of
shares that may yet
be purchased under
the plans or programs |
| October 1 – October 31, 2010 | | | — | | | | — | | | | — | | | | — | |
| November 1 – November 30, 2010 | | | 1,074,178 | | | $ | 15.00 | | | | 1,074,178 | | | | — | |
| December 1 – December 31, 2010 | | | — | | | | — | | | | — | | | | — | |
| Total | | | 1,074,178 | | | $ | 15.00 | | | | 1,074,178 | | | | — | |
| (1) | On October 1, 2010, we announced the commencement of an offer to purchase up to 4,000,000 shares of Series A preferred stock for $15.00 per share, net to seller in cash. The offer expired at 5:00 p.m., New York City time, on November 4, 2010. |
61
TABLE OF CONTENTS
ITEM 6. SELECTED FINANCIAL DATA
The following tables set forth our selected financial data and should be read in conjunction with our Financial Statements and notes thereto included in Item 8, “Financial Statements and Supplementary Data” and Item 7, “Management’s Discussion and Analysis of Financial Condition and Results of Operations” in this Form 10-K.
Operating Data (In thousands, except share and per share data)
| | | | | | | | | | |
| | For the year ended December 31, |
| | | 2010 | | 2009 | | 2008 | | 2007 | | 2006 |
| Total revenues | | $ | 607,148 | | | $ | 627,088 | | | $ | 584,708 | | | $ | 312,509 | | | $ | 196,178 | |
| Property operating expenses | | | 183,489 | | | | 187,998 | | | | 144,831 | | | | — | | | | — | |
| Property and leasehold impairments | | | 913,648 | | | | 18,933 | | | | — | | | | — | | | | — | |
| Interest expense | | | 198,107 | | | | 229,493 | | | | 256,607 | | | | 170,421 | | | | 96,909 | |
| Management fees | | | — | | | | 7,787 | | | | 30,299 | | | | 22,671 | | | | 16,668 | |
| Incentive fee | | | — | | | | — | | | | 2,350 | | | | 32,235 | | | | 7,609 | |
| Depreciation and amortization | | | 108,232 | | | | 111,681 | | | | 66,688 | | | | 2,157 | | | | 1,210 | |
| Management, general and administrative | | | 33,293 | | | | 39,380 | | | | 16,550 | | | | 13,529 | | | | 11,957 | |
| Impairment on loans held for sale and commercial mortgage backed securities | | | 39,453 | | | | 151,081 | | | | — | | | | — | | | | — | |
| Impairment on business combination, net | | | 2,722 | | | | — | | | | — | | | | — | | | | — | |
| Provision for loan loss | | | 84,392 | | | | 517,784 | | | | 97,853 | | | | 9,398 | | | | 1,430 | |
| Total expenses | | | 1,563,336 | | | | 1,264,137 | | | | 615,178 | | | | 250,411 | | | | 135,783 | |
| Income (loss) from continuing operations before equity in income (loss) from unconsolidated joint ventures, provision for taxes and non-controlling interest | | | (956,188 | ) | | | (637,049 | ) | | | (30,470 | ) | | | 62,098 | | | | 60,395 | |
| Equity in net income (loss) of unconsolidated joint ventures | | | (4,139 | ) | | | (2,524 | ) | | | (2,432 | ) | | | 3,222 | | | | 109 | |
| Income (loss) from continuing operations before provision for taxes, gain on extinguishment of debt, and discontinued operations | | | (960,327 | ) | | | (639,573 | ) | | | (32,902 | ) | | | 65,320 | | | | 60,504 | |
| Gain on extinguishment of debt | | | 19,443 | | | | 119,305 | | | | 77,234 | | | | 3,806 | | | | — | |
| Provision for taxes | | | (966 | ) | | | (2,495 | ) | | | (53 | ) | | | (1,341 | ) | | | (1,808 | ) |
| Net income (loss) from continuing operations | | | (941,850 | ) | | | (522,763 | ) | | | 44,279 | | | | 67,785 | | | | 58,696 | |
| Net income (loss) from discontinued operations | | | (31,693 | ) | | | 2,364 | | | | 15,409 | | | | 93,812 | | | | (2,794 | ) |
| Net income (loss) | | | (973,543 | ) | | | (520,399 | ) | | | 59,688 | | | | 161,597 | | | | 55,902 | |
| Net (income) loss attributable to non-controlling interest | | | (145 | ) | | | 770 | | | | (385 | ) | | | — | | | | — | |
| Net income (loss) attributable to Gramercy Capital Corp. | | | (973,688 | ) | | | (519,629 | ) | | | 59,303 | | | | 161,597 | | | | 55,902 | |
| Accrued preferred stock dividends | | | (8,798 | ) | | | (9,414 | ) | | | (9,344 | ) | | | (6,567 | ) | | | — | |
| Excess of carrying amount of tendered preferred stock over consideration paid | | | 13,713 | | | | — | | | | — | | | | — | | | | — | |
| Net income (loss) available to common stockholders | | $ | (968,773 | ) | | $ | (529,043 | ) | | $ | 49,959 | | | $ | 155,030 | | | $ | 55,902 | |
| Net income (loss) per common share-Basic | | $ | (19.40 | ) | | $ | (10.61 | ) | | $ | 1.06 | | | $ | 5.54 | | | $ | 2.26 | |
Net income (loss) per common share-
Diluted | | $ | (19.40 | ) | | $ | (10.61 | ) | | $ | 1.06 | | | $ | 5.28 | | | $ | 2.15 | |
| Basic weighted average common shares outstanding | | | 49,923,930 | | | | 49,854,174 | | | | 47,205,078 | | | | 27,968,387 | | | | 24,721,627 | |
| Diluted weighted average common shares and common share equivalents outstanding | | | 49,923,930 | | | | 49,854,174 | | | | 47,330,182 | | | | 29,378,217 | | | | 26,008,940 | |
62
TABLE OF CONTENTS
Balance Sheet Data (In thousands)
| | | | | | | | | | |
| | Year ended December 31, |
| | | 2010 | | 2009 | | 2008 | | 2007 | | 2006 |
| Total real estate investments, net | | $ | 2,323,700 | | | $ | 3,231,080 | | | $ | 3,279,869 | | | $ | 71,933 | | | $ | 99,821 | |
| Loans and other lending investments, net | | | 1,123,528 | | | | 1,383,832 | | | | 2,213,473 | | | | 2,441,747 | | | | 2,144,151 | |
| Commercial mortgage- backed securities | | | 1,005,167 | | | | 984,709 | | | | 869,973 | | | | 791,983 | | | | — | |
| Assets held for sale, net | | | 28,660 | | | | 841 | | | | 192,780 | | | | 295,222 | | | | 42,733 | |
| Investment in unconsolidated joint ventures | | | 3,650 | | | | 108,465 | | | | 93,919 | | | | 49,440 | | | | 57,567 | |
| Total assets | | | 5,491,993 | | | | 6,765,437 | | | | 7,818,098 | | | | 4,205,078 | | | | 2,766,113 | |
| Mortgage note payable | | | 1,640,671 | | | | 1,743,668 | | | | 1,833,005 | | | | 59,099 | | | | 94,525 | |
| Mezzanine loans payable | | | 549,713 | | | | 553,522 | | | | 580,462 | | | | — | | | | — | |
| Unsecured credit facility | | | — | | | | — | | | | 172,301 | | | | — | | | | 15,000 | |
| Term loan, credit facility and repurchase facility | | | — | | | | — | | | | 95,897 | | | | 200,197 | | | | 277,412 | |
| Collateralized debt obligations | | | 2,682,321 | | | | 2,710,946 | | | | 2,608,065 | | | | 2,735,145 | | | | 1,714,250 | |
| Junior subordinated notes | | | — | | | | 52,500 | | | | — | | | | — | | | | — | |
| Deferred interest debentures held by trusts that issued trust preferred securities | | | — | | | | — | | | | 150,000 | | | | 150,000 | | | | 150,000 | |
| Total liablilites | | | 5,984,986 | | | | 6,197,919 | | | | 6,785,665 | | | | 3,456,343 | | | | 2,305,453 | |
| Stockholders’ equity | | | (492,993 | ) | | | 567,518 | | | | 1,032,433 | | | | 748,735 | | | | 460,660 | |
Other Data (In thousands)
| | | | | | | | | | |
| | For the year ended December 31, |
| | | 2010 | | 2009 | | 2008 | | 2007 | | 2006 |
| Funds from operations(1) | | $ | (870,602 | ) | | $ | (417,610 | ) | | $ | 123,495 | | | $ | 89,056 | | | $ | 64,027 | |
| Cash flows provided by operating activities | | $ | 116,831 | | | $ | 86,960 | | | $ | 171,755 | | | $ | 59,574 | | | $ | 154,707 | |
| Cash flows provided by (used by) investing activities | | $ | 154,707 | | | $ | 131,121 | | | $ | (490,572 | ) | | $ | (1,229,382 | ) | | $ | (1,149,526 | ) |
| Cash flows provided by (used by) financing activities | | $ | (189,038 | ) | | $ | (216,564 | ) | | $ | 162,519 | | | $ | 1,443,620 | | | $ | 943,557 | |
| (1) | We present FFO because we consider it an important supplemental measure of our operating performance and believe that it is frequently used by securities analysts, investors and other interested parties in the evaluation of REITS. We also use FFO as one of several criteria to determine performance-based incentive compensation for members of our senior management, which may be payable in cash or equity awards. The revised White Paper on FFO approved by the Board of Governors of the National Association of Real Estate Investment Trusts, or NAREIT, in April 2002 defines FFO as net income (loss) (computed in accordance with GAAP), excluding gains (or losses) from items which are not a recurring part of our business, such as sales of properties, plus real estate-related depreciation and amortization and after adjustments for unconsolidated partnerships and joint ventures. We consider gains and losses on the sales of debt investments to be a normal part of our recurring operations and therefore include such gains and losses when arriving at FFO. FFO does not represent cash generated from operating activities in accordance with GAAP and should not be considered as an alternative to net income (determined in accordance with GAAP), as an indication of our financial performance, or to cash |
63
TABLE OF CONTENTS
| | flow from operating activities (determined in accordance with GAAP) as a measure of our liquidity, nor is it entirely indicative of funds available to fund our cash needs, including our ability to make cash distributions. Our calculation of FFO may be different from the calculation used by other companies and, therefore, comparability may be limited. |
A reconciliation of FFO to net income computed in accordance with GAAP is provided under the heading of “Management’s Discussion and Analysis of Financial Condition and Results of Operations — Funds From Operations.”
64
TABLE OF CONTENTS
ITEM 7. MANAGEMENT’S DISCUSSION AND ANALYSIS OF FINANCIAL CONDITION AND RESULTS OF OPERATIONS (Amounts in thousands, except for share, per share data and Overview section)
Overview
Gramercy Capital Corp. is a self-managed, integrated commercial real estate finance and property management and investment company. We were formed in April 2004 and commenced operations upon the completion of our initial public offering in August 2004. On April 1, 2008, we completed the acquisition of American Financial, in a transaction with a total value of approximately $3.3 billion, including the assumption of approximately $1.3 billion of American Financial’s secured debt.
Our commercial real estate finance business, which operates under the name Gramercy Finance, focuses on the direct origination, acquisition and portfolio management of whole loans, bridge loans, subordinate interests in whole loans, mezzanine loans, preferred equity, commercial mortgage-backed securities, or CMBS, and other real estate related securities. Our property management and investment business, which operates under the name Gramercy Realty, historically focused on the acquisition and management of commercial properties leased primarily to regulated financial institutions and affiliated users throughout the United States. Neither Gramercy Finance nor Gramercy Realty is a separate legal entity, but are divisions through which our commercial real estate finance and property investment businesses are conducted.
In September 2011, we entered into the Settlement Agreement for an orderly transition of substantially all of Gramercy Realty’s assets to Gramercy Realty’s senior mezzanine lenders in full satisfaction of Gramercy Realty’s obligations with respect to Gramercy Realty’s $240.5 million mortgage loan, or the Goldman Mortgage Loan, Gramercy Realty’s $549.7 million senior and junior mezzanine loans, or the Goldman Mezzanine Loans, in exchange for a mutual release of claims among us and the mortgage and mezzanine lenders and, subject to certain termination provisions, our continued management of Gramercy Realty’s assets on behalf of the mezzanine lenders for a fixed fee plus incentive fees. In July 2011, our Dana portfolio, which consists of 15 properties totaling approximately 3.8 million rentable square feet, was transferred to its mortgage lender through a deed in lieu of foreclosure. Subsequent to those agreements, the business of Gramercy Realty will change from being primarily an owner of commercial properties to being primarily a third party manager of commercial properties. The scale of Gramercy Realty’s revenues will substantially decline as a substantial portion of net revenues from property operations will be replaced with fee revenues of a substantially smaller scale. Additionally, as assets are transferred, our total assets and liabilities are expected to decline. If the transfer had happened as of December 31, 2010, our assets would have declined from approximately $5.5 billion to approximately $2.8 billion and our liabilities would have declined from approximately $6.0 billion to approximately $2.9 billion. Our consolidated financial statements would have reflected significant liquidity, including cash and cash equivalents of approximately $185.8 million and we would have no recourse debt obligations outstanding. We anticipate all transfers under the Settlement Agreement to be completed by December 15, 2011. After all transfers are complete, we expect to own a portfolio of commercial real estate with an aggregate book value of approximately $108.5 million, in addition to approximately $1.2 billion of loan investments, approximately $1.0 billion of CMBS, and approximately $463.1 million in other assets, based on our Consolidated Balance Sheet as of December 31, 2010.
We conduct substantially all of our operations through our operating partnership, GKK Capital LP, or our Operating Partnership. We are the sole general partner of our Operating Partnership. Our Operating Partnership conducts our finance business primarily through two private REITs, Gramercy Investment Trust and Gramercy Investment Trust II, and our commercial real estate investment and property management business through various wholly owned entities as of December 31, 2010.
During 2010, we recorded impairment charges totaling $912.1 million in continuing operations to reduce the carrying value of 692 properties to estimated fair value. All of the impaired properties are part of the Gramercy Realty portfolio and serve as collateral for the Goldman Mezzanine Loans. Substantially all of the impaired properties will be transferred to the mezzanine lenders pursuant to the Settlement Agreement. As a result of recording these impairments, our total stockholders’ equity, or book equity, is negative $493.9 million as of December 31, 2010 as compared to a positive book equity balance of $566.2 million as of December 31, 2009. The carrying value of liabilities associated with the impaired properties have not been adjusted and remained outstanding as of December 31, 2010. As of December 31, 2010, the liabilities of the impaired
65
TABLE OF CONTENTS
properties exceed the carrying value of the assets and accordingly, the subsequent transfer of assets and liabilities pursuant to the Settlement Agreement will generate gains as the carrying values of such liabilities are reduced to $0, which in turn will reduce our negative book equity balance. After all transfers under the Settlement Agreement are complete, which we anticipate will occur by December 15, 2011, we expect that stockholders’ equity will remain negative, however, such negative balance will be substantially lower than the negative $493.9 million balance presented on the December 31, 2010 balance sheet.
Prior to the internalization of our management in April 2009, we were externally managed and advised by GKK Manager LLC, or the Manager, then a wholly-owned subsidiary of SL Green, which owned approximately 10.7% of the outstanding shares of our common stock as of December 31, 2010 and is our largest stockholder. On April 24, 2009, we completed the internalization of our management through the direct acquisition of the Manager from SL Green. As a result of the internalization, beginning in May 2009, management and incentive fees payable by us to the Manager ceased and we added 77 former employees of the Manager to our own staff.
We have elected to be taxed as a REIT under the Internal Revenue Code and generally will not be subject to U.S. federal income taxes to the extent we distribute our taxable income, if any, to our stockholders. We have in the past established, and may in the future establish TRSs, to effect various taxable transactions. Those TRSs would incur U.S. federal, state and local taxes on the taxable income from their activities.
Unless the context requires otherwise, all references to “we,” “our” and “us” mean Gramercy Capital Corp, a Maryland corporation, and one or more of its subsidiaries, including our Operating Partnership.
Since our inception, we have completed debt investment transactions in a variety of markets and secured by a variety of property types. Beginning in the second quarter of 2007, the sub-prime residential lending and single family housing markets in the U.S. began to experience significant default rates, declining real estate values and increasing backlog of housing supply, and other lending markets experienced higher volatility and decreased liquidity resulting from the poor credit performance in the residential lending markets. Concerns in the residential sector of the capital markets quickly spread more broadly into the asset-backed, commercial real estate, corporate and other credit and equity markets. The factors described above continued through mid-2009 and resulted in substantially reduced mortgage loan originations and securitizations, and caused more generalized credit market dislocations and a significant contraction in available credit. Despite signs of improvement in 2010 and to date in 2011, market conditions remain challenging and we continue to find it difficult to obtain cost-effective debt capital to finance new investment activity or to refinance maturing debt.
Credit spreads on commercial mortgages (i.e., the interest rate spread over given benchmarks such as LIBOR or U.S. Treasury securities) are significantly influenced by: (a) supply and demand for such mortgage loans; (b) perceived risk of the underlying real estate collateral cash flow; and (c) capital markets execution for the sale or financing of such commercial mortgage assets. The number of potential lenders in the market place and the amount of funds they are willing to devote to commercial mortgage assets will impact credit spreads. As liquidity increases, spreads on equivalent commercial mortgage loans will decrease. Conversely, a lack of liquidity results in credit spreads increasing. During periods of volatility, the number of lenders participating in the market may change at an accelerated pace. For existing loans, when credit spreads widen, the fair value of these loans decreases, even though a loan may be performing in accordance with its loan agreement and the underlying collateral has not changed. Accordingly, when a lender wishes to sell or finance the loan, the reduced value of the loan may reduce the total sale or borrowing proceeds that the lender will receive.
Although credit and liquidity conditions have improved during 2010 and to date in 2011, the current market continues to provide increasing challenges to both our industry and our company. We continue to believe commercial real estate and commercial real estate lending can provide attractive risk-adjusted returns; however, we continue to experience the following: (i) reduced access to capital, and increased cost of financing, (ii) reduced cash available for distribution to stockholders, particularly as our debt portfolio is reduced by scheduled maturities and prepayments, (iii) increased instances of defaults by borrowers and tenants and (iv) depressed loan originations and acquisitions.
66
TABLE OF CONTENTS
During 2008, 2009 and 2010, the global capital markets experienced volatility and a wide-ranging lack of liquidity. The impact of the global credit crisis on our sector was acute. Transaction volume declined significantly, credit spreads for forms of mortgage debt investments reached all-time highs, and other forms of financing from the debt markets were dramatically curtailed. The dislocation in the debt capital markets, coupled with a recession in the United States, reduced property valuations and has adversely impacted commercial real estate fundamentals. These developments impact and have impacted the performance of our portfolio of financial and real property assets. Among other things, such conditions resulted in our recognizing significant amounts of loan loss reserves and impairments, narrowed our margin of compliance with debt and CDO covenants, depressed the price of our common stock and effectively removed our ability to raise public capital. It reduced our borrowers’ ability to repay their loans, and when combined with declining real estate values on our collateral for such loans, increased the likelihood that we would continue to take further loan loss reserves. Additionally, it led to increased vacancies in our properties.
We responded to these difficult conditions by decreasing investment activity, other than reinvestment of available restricted cash within our CDOs, to maintain our liquidity, extending debt maturities and restructuring certain of our debt facilities. In addition, beginning with the third quarter of 2008, our board of directors elected to not pay the dividend on our common stock. Our board of directors also elected not to pay the Series A preferred stock dividend of $0.50781 per share beginning with the fourth quarter of 2008. The unpaid preferred stock dividend has been accrued for nine quarters as of December 31, 2010. As a result, we have accrued dividends for over six quarters which pursuant to the terms of our charter, permits the Series A preferred stockholders to elect an additional director to our board of directors. We may, or upon request of the holders of the Series A preferred stock representing 20% or more of the liquidation value of the Series A preferred stock shall, call a special meeting of our stockholders to elect such additional director in accordance with the provisions of our bylaws and other procedures established by our board of directors relating to election of directors. Based on current estimates of our taxable loss, we expect that we will have no distribution requirements in order to maintain our REIT status for the 2010 tax year and we expect that we will continue to elect to retain capital for liquidity purposes until the requirement to make a cash distribution to satisfy our REIT requirements arise. We may elect to pay dividends on our common stock in cash or a combination of cash and shares of common stock as permitted under U.S. federal income tax laws governing REIT distribution requirements. However, in accordance with the provisions of our charter, we may not pay any dividends on our common stock until all accrued dividends and the dividend for the then current quarter on the Series A preferred stock are paid in full. We do not know when or if we will pay future dividends, including accumulated and unpaid dividends on the Series A preferred stock.
During 2010, we remained focused on improving our consolidated balance sheet by reducing leverage, generating liquidity from existing assets, actively managing portfolio credit, accretively re-investing repayments from our loan and CMBS investments and renewing expiring leases.
In December 2010, we closed on the sale of investments to SL Green, including non-controlling co-investment positions such as the 45% joint venture interests in the leased fee at 885 Third Avenue and 2 Herald Square, the entire leased fee interest in 292 Madison Avenue and a $38.7 million mezzanine loan secured by equity interests in 601 West 26th Street, New York, NY, also known as the Starrett-Lehigh Building, for an aggregate price of $390.8 million, including the assumption of $265.6 million of mortgage debt. Net of associated costs and including the release of approximately $6.0 million posted as cash collateral for related letters of credit, these transactions increased our unrestricted corporate liquidity by approximately $89.9 million and increased our restricted cash in one of our CDOs by approximately $38.9 million.
In November 2010, we completed a tender offer for approximately 23.4% of the outstanding shares of our Series A preferred stock or 1,074,178 shares at $15.00 per preferred share. Subsequent to the tender, 3,525,822 shares remain outstanding. Net of expenses, the tender offer used approximately $16.6 million of unrestricted cash and resulted in the extinguishment of accrued preferred stock dividends of approximately $4.4 million for no additional proceeds. The excess of the carrying amount of tendered Series A preferred stock over the consideration resulted in an increase in book value to the common stockholders of approximately $13.7 million.
67
TABLE OF CONTENTS
In June 2010, we redeemed the remaining $52.5 million of junior subordinated notes liabilities by transferring to the holders of the junior subordinated notes an equivalent par value amount of various classes of bonds issued by our CDOs which were previously purchased by us in the open market and cash equivalents of $5.0 million. This redemption eliminated the liability for our junior subordinated notes from our consolidated financial statements, which had an original balance of $150.0 million. Additionally, during 2010, we repurchased $39.0 million of CDO bonds previously issued by two of our three CDOs, generating gains on early extinguishment of debt of approximately $19.4 million. As a result of these and other transactions executed during the year, we increased our unrestricted cash on our balance sheet during the year by approximately $82.5 million to $220.8 million at December 31, 2010, increased restricted cash available for portfolio investments within two of our three CDOs by approximately $63.1 million to approximately $90.0 million at December 31, 2010 and reduced our secured and other debt by approximately $187.9 million to approximately $4.9 billion at December 31, 2010.
We also sought to extend or restructure the Goldman Mortgage Loan with GSMC, Citicorp, and SL Green, and the Goldman Mezzanine Loans with KBS, GSMC, Citicorp and SL Green. The Goldman Mortgage Loan is collateralized by approximately 195 properties held by Gramercy Realty and the Goldman Mezzanine Loans are collateralized by the equity interest in substantially all of the entities comprising our Gramercy Realty division, including its cash and cash equivalents totaling $35.0 million of our unrestricted cash as of December 31, 2010. Subsequent to the final maturity of the Goldman Mortgage Loan and the Goldman Mezzanine Loans on March 11, 2011, we entered into a series of short term extensions to provide additional time to exchange and consider proposals for an extension, modification, restructuring or refinancing of the Goldman Mortgage Loan and the Goldman Mezzanine Loans and to explore an orderly transition of the collateral to the lenders if such discussions fail. On May 9, 2011, we announced that the scheduled maturity of the Goldman Mortgage Loan and the Goldman Mezzanine Loans occurred without repayment and without an extension or restructuring of the loans by the lenders.
Notwithstanding the maturity and non-repayment of the loans, we maintained active communications with the lenders and in September 2011, we entered into the Settlement Agreement for an orderly transition of substantially all of Gramercy Realty’s assets to the mezzanine lenders, in exchange for a mutual release of claims among us and the mortgage and mezzanine lenders and, subject to certain termination provisions, an arrangement for our continued management of Gramercy Realty’s assets on behalf of such mezzanine lenders for a fixed fee plus incentive fees. In July 2011, our Dana portfolio, which consists of 15 properties totaling approximately 3.8 million rentable square feet, was transferred to its mortgage lender through a deed in lieu of foreclosure. Subsequent to the execution of the Settlement Agreement, the business of Gramercy Realty will change from being primarily an owner of commercial properties to being primarily a third party manager of commercial properties. The scale of Gramercy Realty’s revenues will substantially decline as a substantial portion of net revenues from property operations will be replaced with fee revenues of a substantially smaller scale. Additionally, as assets are transferred, our total assets and liabilities are expected to decline substantially.
During the second quarter of 2010, our board of directors retained a financial adviser to conduct discussions with various third parties regarding potential transactions to recapitalize our company. We received indications of interest from several of these parties regarding a variety of potential transactions that ranged from the acquisition of our entire company to acquisitions of parts of our assets or business, joint ventures with either or both of our Finance and Realty divisions, externalization of our management function and investment of capital through new issuances of our equity or debt securities. Some indications of interest contemplated change of control transactions or, at a minimum, significant changes in the composition of our management team and board of directors. All indications of interest were subject to significant additional due diligence by the parties submitting them and to the satisfaction of substantial qualifications and conditions, including but not limited to eliminating various of our contingent and other liabilities, restructuring Gramercy Realty indebtedness, repurchasing certain of our equity securities (including our Series A preferred stock), selling certain of our assets and obtaining the approval of our stockholders.
After reviewing the indications of interest received, and conducting discussions to understand the likelihood that the indicated terms could be improved, our board of directors decided to discontinue discussions regarding the indications of interest because, among other reasons, each of the proposed
68
TABLE OF CONTENTS
transactions was subject to conditions and contingencies that made consummation highly uncertain and none of the indications of interest appeared to offer a level of value to our stockholders that our board of directors deemed acceptable.
We may need to modify our strategies, businesses or operations, and we may incur increased capital requirements and constraints to compete in a changed business environment. Our failure to do so could materially and adversely affect our business, financial condition, results of operations and prospects.
Our commercial real estate finance business, which operates under the name Gramercy Finance, focuses on the direct origination, acquisition and portfolio management of whole loans, bridge loans, subordinate interests in whole loans, mezzanine loans, preferred equity, CMBS, and other real estate related securities. Our property management and investment business, which operates under the name Gramercy Realty, historically focused on the acquisition and management of commercial properties leased primarily to regulated financial institutions and affiliated users throughout the United States. These institutions are for the most part deposit taking commercial banks, thrifts and credit unions, which we generally refer to as “banks.” Our portfolio of wholly-owned and jointly-owned bank branches and office buildings is leased to large banks such as Bank of America, Wells Fargo Bank, Regions Financial, and Citizen Financial, and to mid-sized and community banks. Neither Gramercy Finance nor Gramercy Realty is a separate legal entity but are divisions of us through which our commercial real estate finance and property investment businesses are conducted.
The aggregate carrying values, allocated by product type and weighted average coupons of our loans, and other lending investments and CMBS investments as of December 31, 2010 and December 31, 2009, were as follows (dollars in thousands):
| | | | | | | | | | | | | | | | |
| | | | | | | | | | | | | | | | |
| | Carrying Value(1) | | Allocation by
Investment Type | | Fixed Rate
Average Yield | | Floating Rate Average
Spread over LIBOR(2) |
| | | 2010 | | 2009 | | 2010 | | 2009 | | 2010 | | 2009 | | 2010 | | 2009 |
| Whole loans, floating rate | | $ | 659,095 | | | $ | 830,617 | | | | 58.7 | % | | | 60.2 | % | | | — | | | | — | | | | 330 bps | | | | 454 bps | |
| Whole loans, fixed rate | | | 132,268 | | | | 122,846 | | | | 11.8 | % | | | 8.9 | % | | | 7.16 | % | | | 6.89 | % | | | — | | | | — | |
| Subordinate interests in whole loans, floating rate | | | 75,066 | | | | 76,331 | | | | 6.7 | % | | | 5.5 | % | | | — | | | | — | | | | 297 bps | | | | 246 bps | |
| Subordinate interests in whole loans, fixed rate | | | 46,468 | | | | 44,988 | | | | 4.1 | % | | | 3.2 | % | | | 6.01 | % | | | 7.46 | % | | | — | | | | — | |
| Mezzanine loans, floating rate | | | 152,349 | | | | 190,668 | | | | 13.5 | % | | | 13.7 | % | | | — | | | | — | | | | 754 bps | | | | 577 bps | |
| Mezzanine loans, fixed rate | | | 48,828 | | | | 85,898 | | | | 4.3 | % | | | 6.2 | % | | | 12.69 | % | | | 8.08 | % | | | — | | | | — | |
| Preferred equity, floating rate | | | 5,224 | | | | 28,228 | | | | 0.5 | % | | | 2.0 | % | | | — | | | | — | | | | 350 bps | | | | 1,064 bps | |
| Preferred equity, fixed rate | | | 4,230 | | | | 4,256 | | | | 0.4 | % | | | 0.3 | % | | | 7.25 | % | | | 7.23 | % | | | — | | | | — | |
| Subtotal/Weighted average | | | 1,123,528 | | | | 1,383,832 | | | | 100.0 | % | | | 100.0 | % | | | 8.09 | % | | | 7.39 | % | | | 400 bps | | | | 476 bps | |
| CMBS, floating rate | | | 50,798 | | | | 67,876 | | | | 5.1 | % | | | 6.9 | % | | | — | | | | — | | | | 394 bps | | | | 254 bps | |
| CMBS, fixed rate | | | 954,369 | | | | 916,833 | | | | 94.9 | % | | | 93.1 | % | | | 8.37 | % | | | 7.84 | % | | | — | | | | — | |
| Subtotal/Weighted average | | | 1,005,167 | | | | 984,709 | | | | 100.0 | % | | | 100.0 | % | | | 8.37 | % | | | 7.84 | % | | | 394 bps | | | | 254 bps | |
| Total | | $ | 2,128,695 | | | $ | 2,368,541 | | | | 100.0 | % | | | 100.0 | % | | | 8.32 | % | | | 7.74 | % | | | 400 bps | | | | 463 bps | |
| (1) | Loans and other lending investments and CMBS investments are presented net of unamortized fees, discounts, unfunded commitments, reserves for loan losses and other adjustments. |
| (2) | Spreads over an index other than 30 day-LIBOR have been adjusted to a LIBOR based equivalent. In some cases, LIBOR is floored, giving rise to higher current effective spreads. |
The period during which we are permitted to reinvest principal payments on the underlying assets into qualifying replacement collateral for two of our CDOs expired in July 2010 and July 2011, respectively, and will expire for our other CDO in August 2012. In the past, our ability to reinvest has been instrumental in maintaining compliance with the overcollateralization and interest coverage tests for our CDOs. Following the conclusion of each CDO’s reinvestment period, our ability to maintain compliance with such tests for that CDO will be negatively impacted.
69
TABLE OF CONTENTS
As of December 31, 2010, Gramercy Finance also held interests in one CTL investment and eight interests in real estate acquired through foreclosures.
As of December 31, 2010, Gramercy Realty owned a portfolio comprised of 625 bank branches, 321 office buildings and two land parcels, of which 54 bank branches were owned through an unconsolidated joint venture. Gramercy Realty’s consolidated properties aggregated approximately 25.3 million rentable square feet and its unconsolidated properties aggregated approximately 251 thousand rentable square feet. As of December 31, 2010, the occupancy of Gramercy Realty’s consolidated properties was 82.6% and the occupancy for its unconsolidated properties was 100%. Gramercy Realty’s two largest tenants are Bank of America and Wells Fargo Bank and as of December 31, 2010, they represented approximately 41.0% and 15.3%, respectively, of the rental income of Gramercy Realty’s portfolio and occupied approximately 42.7% and 16.6%, respectively, of its total rentable square feet.
Summarized in the table below are our key property portfolio statistics as of December 31, 2010:
| | | | | | | | | | | | |
| | Number of Properties | | Rentable Square Feet | | Occupancy |
| Properties(1) | | December 31,
2010 | | December 31,
2009 | | December 31,
2010 | | December 31,
2009 | | December 31,
2010 | | December 31,
2009 |
| Branches | | | 571 | | | | 583 | | | | 3,689,190 | | | | 3,726,399 | | | | 84.4 | % | | | 85.5 | % |
| Office Buildings | | | 321 | | | | 324 | | | | 21,613,441 | | | | 21,847,249 | | | | 82.3 | % | | | 85.9 | % |
| Land | | | 2 | | | | 6 | | | | — | | | | — | | | | — | | | | — | |
| Total | | | 894 | | | | 913 | | | | 25,302,631 | | | | 25,573,648 | | | | 82.6 | % | | | 85.9 | % |
| (1) | Excludes investments in unconsolidated joint ventures. Approximately 872 properties, of which 54 properties are held by an unconsolidated joint venture, comprising approximately 20.9 million rentable square feet, or the lender portfolio, are expected to be subject to the Settlement Agreement and ownership will be transferred to Gramercy Realty’s mezzanine lenders, in exchange for a mutual release of claims among us and the mortgage and mezzanine lenders and, subject to certain termination provisions, our continued management of the properties. In addition, our Dana portfolio, which consists of 15 properties comprising approximately 3.8 million rentable square feet, was transferred to its mortgage lender through a deed in lieu of foreclosure. We will continue to manage the lender portfolio. |
Gramercy Realty typically and historically entered into long-term net leases with our financial institution tenants. As of December 31, 2010, the weighted average remaining term of our leases was 8.5 years and approximately 70.6% of our base revenue was derived from triple-net and bond-net leases. With in-house capabilities in acquisitions, asset management, property management and leasing, we are focused on maximizing the value of our portfolio through acquisitions and strategic sales and through effective and efficient property management and leasing operations.
We rely on the credit and equity markets to finance and grow our business. Beginning in the second quarter of 2007, the sub-prime residential lending and single family housing markets in the United States began to experience significant default rates, declining real estate values and increasing backlog of housing supply, and other lending markets experienced higher volatility and decreased liquidity resulting from the poor credit performance in the residential lending markets. Concerns in the residential sector of the capital markets quickly spread more broadly into the asset-backed, commercial real estate, corporate and other credit and equity markets. The factors described above continued through mid 2009 and resulted in substantially reduced mortgage loan originations and securitizations, and caused more generalized credit market dislocations and a significant contraction in available credit. Despite signs of improvement in 2010 and to date in 2011, market conditions remained difficult for us with limited, if any, availability of new debt or equity capital. Our stock price remained low and we currently have limited, if any availability to the public or private equity capital markets. In this environment, we have sought to raise capital or maintain liquidity through other means, such as modifying debt arrangements, selling assets and aggressively managing our loan portfolio to encourage repayments, as well as reducing capital and overhead expenses and as a result, have engaged in limited new investment activity, other than reinvestment of available restricted cash within our CDOs.
Liquidity is a measurement of the ability to meet cash requirements, including ongoing commitments to repay borrowings, fund and maintain loans and other investments, pay dividends and other general business needs. In addition to cash on hand, our primary sources of funds for short-term (within the next 12 months)
70
TABLE OF CONTENTS
liquidity requirements, including working capital, distributions, if any, debt service and additional investments, if any, consists of (i) cash flow from operations; (ii) proceeds and management fees from our existing CDOs; (iii) proceeds from principal and interest payments and rents on our investments; (iv) proceeds from potential loan and asset sales; (v) proceeds from the Interim Management Agreement for the lender portfolio; and, to a lesser extent, (vi) new financings or additional securitization or CDO offerings and (vii) proceeds from additional common or preferred equity offerings. We do not anticipate having the ability in the near term to access new equity or debt capital through new warehouse lines, CDO issuances, term or credit facilities or trust preferred issuances, although we continue to explore capital raising options. In the event we are not able to successfully secure financing, we will rely primarily on cash on hand, cash flows from operations, principal, interest and lease payments on our investments, management fees and proceeds from asset and loan sales to satisfy our liquidity requirements. If we (i) are unable to renew, replace or expand our sources of financing, (ii) are unable to execute asset and loan sales in a timely manner or to receive anticipated proceeds from them or (iii) fully utilize available cash, it may have an adverse effect on our business, results of operations, and ability to make distributions to our stockholders.
Substantially all of our loan and other investments and CMBS are pledged as collateral for our CDO bonds and the income generated from these investments is used to fund interest obligations of our CDO bonds and the remaining income, if any, is retained by us. Our CDO bonds contain minimum interest coverage and asset overcollateralization covenants that must be met in order for us to receive cash flow on the interests retained by us in the CDOs and to receive the subordinate collateral management fee earned. If we fail these covenants in some or all of the CDOs, all cash flows from the applicable CDO other than senior collateral management fees would be diverted to repay principal and interest on the most senior outstanding CDO bonds and we may not receive some or all residual payments or the subordinate collateral management fee until that CDO regained compliance with such tests. As of July 2011, our 2005 and 2006 CDOs were in compliance with their interest coverage and asset overcollateralization covenants, however the compliance margin was narrow and relatively small declines in collateral performance and credit metrics could cause the CDOs to fall out of compliance. Our 2005 CDO failed its overcollateralization test at the April 2011, January 2011, October 2010, July 2010 and April 2010 distribution dates and our 2007 CDO failed its overcollateralization test at the August 2011, May 2011, February 2011, November 2010, August 2010, May 2010 and February 2010 distribution dates. The chart below is a summary of our CDO compliance tests as of the most recent distribution date (July 25, 2011 for our 2005 and 2006 CDOs and August 19, 2011 for our 2007 CDO):
| | | | | | |
| Cash Flow Triggers | | CDO 2005-1 | | CDO 2006-1 | | CDO 2007-1 |
Overcollateralization(1)
| | | | | | | | | | | | |
| Current | | | 118.96 | % | | | 109.21 | % | | | 87.26 | % |
| Limit | | | 117.85 | % | | | 105.15 | % | | | 102.05 | % |
| Compliance margin | | | 1.11 | % | | | 4.06 | % | | | -14.79 | % |
| Pass/Fail | | | Pass | | | | Pass | | | | Fail | |
Interest Coverage(2)
| | | | | | | | | | | | |
| Current | | | 650.49 | % | | | 695.19 | % | | | N/A | |
| Limit | | | 132.85 | % | | | 105.15 | % | | | N/A | |
| Compliance margin | | | 517.64 | % | | | 590.04 | % | | | N/A | |
| Pass/Fail | | | Pass | | | | Pass | | | | N/A | |
| (1) | The overcollateralization ratio divides the total principal balance of all collateral in the CDO by the total bonds outstanding for the classes senior to those retained by us. To the extent an asset is considered a defaulted security, the asset’s principal balance is multiplied by the asset’s recovery rate which is determined by the rating agencies. |
| (2) | The interest coverage ratio divides interest income by interest expense for the classes senior to those retained by us. |
In the event of a breach of our CDO covenants that we could not cure in the near term, we would be required to fund our non-CDO expenses, with (i) cash on hand, (ii) income from any CDO not in default, (iii) income from our real property and unencumbered loan assets, (iv) sale of assets, and (v) or accessing the equity or debt capital markets, if available.
Notwithstanding the challenges which confront our company and continued volatility within the capital markets, our board of directors remains committed to identifying and pursuing strategies and transactions that
71
TABLE OF CONTENTS
could preserve or improve our cash flows from our CDOs, increase our net asset value per share of common stock, improve our future access to capital or otherwise potentially create value for our stockholders. In considering these alternatives (which could include additional repurchases or issuances of our debt or equity securities or strategic sales of our assets), we expect our board of directors will carefully consider the potential impact of any such transaction on our liquidity position before deciding to pursue it. We expect our board of directors will only authorize us to take any of these actions if they can be accomplished on terms our board of directors finds attractive. Accordingly, there is a substantial possibility that not all such actions can or will be implemented.
In early June 2011, our board of directors created a special committee to evaluate strategic alternatives of our Company following the anticipated disposition of our Realty division’s assets. The committee is authorized to engage a financial advisor to assist in this process.
The following discussion related to our consolidated financial statements should be read in conjunction with the financial statements appearing in Item 8 of this Annual Report on Form 10-K.
Critical Accounting Policies
Our discussion and analysis of financial condition and results of operations is based on our financial statements, which have been prepared in accordance with accounting principles generally accepted in the United States, known as GAAP. These accounting principles require us to make some complex and subjective decisions and assessments. Our most critical accounting policies involve decisions and assessments, which could significantly affect our reported assets, liabilities and contingencies, as well as our reported revenues and expenses. We believe that all of the decisions and assessments upon which our financial statements are based were reasonable at the time made based upon information available to us at that time. We evaluate these decisions and assessments on an ongoing basis. Actual results may differ from these estimates under different assumptions or conditions. We have identified our most critical accounting policies to be the following:
Variable Interest Entities
Consolidated VIEs
As of December 31, 2010, the Consolidated Balance Sheet includes $2,387,513 of assets and $2,851,912 of liabilities related to four consolidated VIEs. Due to the non-recourse nature of these VIEs, and other factors discussed below, our net exposure to loss from investments in these entities is $0.
Collateralized Debt Obligations
We currently consolidate three collateralized debt obligations, or CDOs, which are VIEs. These CDOs invest in commercial real estate debt instruments, the majority of which we originated within the CDOs, and are financed by the debt and equity issued. We are named as collateral manager of all three CDOs. As a result of consolidation, our subordinate debt and equity ownership interests in these CDOs have been eliminated, and the Consolidated Balance Sheet reflects both the assets held and debt issued by these CDOs to third parties. Similarly, the operating results and cash flows include the gross amounts related to the assets and liabilities of the CDOs, as opposed to our net economic interests in these CDOs. Refer to Note 8 for further discussion of fees earned related to the management of the CDOs.
Our interest in the assets held by these CDOs is restricted by the structural provisions of these entities, and the recovery of these assets will be limited by the CDOs’ distribution provisions, which are subject to change due to non-compliance with covenants, which are described further in Note 8. The liabilities of the CDO trusts are non-recourse, and can generally only be satisfied from the respective asset pool of each CDO.
We are not obligated to provide any financial support to these CDOs. As of December 31, 2010, we have no exposure to loss as a result of the investment in these CDOs. Since we are the collateral manager of the three CDOs and can make decisions related to the collateral that would most significantly impact the economic outcome of the CDOs, we have concluded that we are the primary beneficiary of the CDOs.
Unconsolidated VIEs
Investment in Commercial Mortgage-Backed Securities
We have investments in CMBS, which are considered to be VIEs. These securities were acquired through investment, and are primarily comprised of securities that were originally investment grade securities, and do
72
TABLE OF CONTENTS
not represent a securitization or other transfer of our assets. We are not named as the special servicer or collateral manager of these investments, except as discussed further below.
We are not obligated to provide, nor have we provided, any financial support to these entities. The majority of our securities portfolio, with an aggregate face amount of $1,228,050, is financed by our CDOs, and our exposure to loss is therefore limited to our interests in these consolidated entities described above. We have not consolidated the aforementioned CMBS investments due to the determination that based on the structural provisions and nature of each investment. We do not directly control the activities that most significantly impact the VIEs’ economic performance.
We further analyzed our investment in controlling class CMBS to determine if we were the primary beneficiary. At December 31, 2010, we owned securities of one controlling non-investment grade CMBS investment, GS Mortgage Securities Trust 2007-GKK1, or the Trust. The carrying value of the investment was $0 at December 31, 2010. The total par amount of CMBS issued by the CMBS trust was $633,654.
The Trust is a resecuritization of $633,654 of CMBS originally rated AA through BB. We purchased a portion of the below investment grade securities, totaling approximately $27,300. The Manager is the collateral administrator on the transaction and receives a total fee of 5.5 basis points on the par value of the underlying collateral. We have determined that we are the non-transferor sponsor of the Trust. As collateral administrator, the Manager has the right to purchase defaulted securities from the Trust at fair value if very specific triggers have been reached. We have no other rights or obligations that could impact the economics of the Trust and therefore have concluded that we are not the primary beneficiary. The Manager can be removed as collateral administrator, for cause only, with the vote of 66 2/3% of the certificate holders. There are no liquidity facilities or financing agreements associated with the Trust. Neither we nor the Manager has any on-going financial obligations, including advancing, funding or purchasing collateral in the Trust.
Our maximum exposure to loss as a result of its investment in controlling class CMBS totaled $0, which equals the book value of these investments as of December 31, 2010.
Real Estate and CTL Investments
We record acquired real estate and CTL investments at cost. Costs directly related to the acquisition of such investments are capitalized. Certain improvements are capitalized when they are determined to increase the useful life of the building. Depreciation is computed using the straight-line method over the shorter of the estimated useful life of the capitalized item or 40 years for buildings, five to ten years for building equipment and fixtures, and the lesser of the useful life or the remaining lease term for tenant improvements and leasehold interests. Maintenance and repair expenditures are charged to expense as incurred.
In leasing office space, we may provide funding to the lessee through a tenant allowance. In accounting for tenant allowances, we determine whether the allowance represents funding for the construction of leasehold improvements and evaluate the ownership of such improvements. If we are considered the owner of the leasehold improvements, we capitalize the amount of the tenant allowance and depreciate it over the shorter of the useful life of the leasehold improvements or the lease term. If the tenant allowance represents a payment for a purpose other than funding leasehold improvements, or in the event we are not considered the owner of the improvements for accounting purposes, the allowance is considered to be a lease incentive and is recognized over the lease term as a reduction of rental revenue. Factors considered during this evaluation usually include (i) who holds legal title to the improvements, (ii) evidentiary requirements concerning the spending of the tenant allowance, and (iii) other controlling rights provided by the lease agreement (e.g. unilateral control of the tenant space during the build-out process). Determination of the accounting for a tenant allowance is made on a case-by-case basis, considering the facts and circumstances of the individual tenant lease.
73
TABLE OF CONTENTS
We also review the recoverability of the property’s carrying value when circumstances indicate a possible impairment of the value of a property. The review of recoverability is based on an estimate of the future undiscounted cash flows, excluding interest charges, expected to result from the property’s use and eventual disposition. These estimates consider factors such as changes in strategy resulting in an increased or decreased holding period, expected future operating income, market and other applicable trends and residual value, as well as the effects of leasing demand, competition and other factors. If management determines impairment exists due to the inability to recover the carrying value of a property, an impairment loss is recorded to the extent that the carrying value exceeds the estimated fair value of the property for properties to be held and used and for assets held for sale, an impairment loss is recorded to the extent that the carrying value exceeds the fair value less estimated cost to dispose for assets held for sale. These assessments are recorded as an impairment loss in our Consolidated Statements of Operations in the period the determination is made. The estimated fair value of the asset becomes its new cost basis. For a depreciable long-lived asset, the new cost basis will be depreciated or amortized over the remaining useful life of that asset.
During 2010, we recorded impairment charges of $933,884 related to our investments in real estate, including $85,294 of impairments on intangible assets. Impairment charges for properties classified as held for investment were $913,648 and $20,236 has been recorded on properties reclassified as discontinued operations. We recorded impairment charges totaling $912,147 in continuing operations during 2010 to reduce the carrying value of 692 properties to estimated fair value. All of the impaired properties served as collateral for the Goldman Mezzanine Loans and are part of the Gramercy Realty portfolio. We also recorded impairment charges on three leasehold properties totaling $1,501 based on the difference between estimated cash flow shortfalls over the sub-tenants’ lease term. No other real estate assets in the portfolio were determined to be impaired as of December 31, 2010 as a result of the analysis. The estimated fair values for the properties serving as collateral for the Goldman Mezzanine loans were calculated using discounted cash flows based on internally developed models and residual values calculated with capitalization rates utilizing a study completed by a third party property management provider for similar types of buildings. We identified several possible future outcomes and applied a probability-weighted approach to estimate the future undiscounted cash flows. We determined as of December 31, 2010, based on the likelihood of the possible outcomes and the probability-weighted undiscounted cash flows, that our investments in real estate were impaired.
The assessment as to whether a real estate investment is impaired is highly subjective. The calculations involve management’s best estimate of the holding period, market comparables, future occupancy levels, rental rates, capitalization rates, lease-up periods and capital requirements for each property. A change in any one or more of these factors could materially impact whether a property is impaired as of any given valuation date.
We allocate the purchase price of real estate to land, building and intangibles, such as the value of above- and below-market leases and origination costs associated with the in-place leases.
In April 2008, we acquired via a deed in lieu of foreclosure, a 40% interest in the Whiteface Lodge, a hotel and condominium located in Lake Placid, New York. In July 2010, we acquired the remaining 60% interest in Whiteface Lodge. In connection with this acquisition, we acquired 521 fractional residential condominium units. These fractional residential condominium units are included in Other Real Estate Investments on our Consolidated Balance Sheets.
Leasehold Interests
Leasehold interest liabilities are recorded based on the difference between our estimate of the cash flows expected to be paid and earned from the subleases over the non-cancelable lease terms and any payments received in consideration for assuming the leasehold interests. Factors used in determining the net present value of cash flows include contractual rental amounts and amounts due under the corresponding operating lease assumed. Amounts allocated to leasehold interests, based on their respective fair values, are amortized on a straight-line basis over the remaining lease term.
74
TABLE OF CONTENTS
Investments in Unconsolidated Joint Ventures
We account for our investments in unconsolidated joint ventures under the equity method of accounting since we exercise significant influence, but do not unilaterally control the entities, and we are not considered to be the primary beneficiary. In the joint ventures, the rights of the other investors are protective and participating. Unless we are determined to be the primary beneficiary, these rights preclude us from consolidating the investments. The investments are recorded initially at cost as an investment in unconsolidated joint ventures, and subsequently are adjusted for equity in net income (loss) and cash contributions and distributions. Any difference between the carrying amount of the investments on our balance sheet and the underlying equity in net assets is evaluated for impairment at each reporting period. None of the joint venture debt is recourse to us. As of December 31, 2010 and 2009, we had investments of $3,650 and $108,465 in unconsolidated joint ventures, respectively.
Assets Held for Sale
Real Estate and CTL Investments Held for Sale
Real estate investments or CTL investments to be disposed of are reported at the lower of carrying amount or estimated fair value, less cost to sell. Once an asset is classified as held for sale, depreciation expense is no longer recorded and current and prior periods are reclassified as “discontinued operations.” As of December 31, 2010 and 2009, we had real estate investments held for sale of $28,660 and $841, respectively. We recorded impairment charges of $20,236, $24,507 and $0, during the years ended December 31, 2010, 2009 and 2008, respectively, related to real estate investments classified as held-for-sale.
None of the properties that serve as collateral for the Goldman Mortgage and Goldman Mezzanine Loans met the criteria to be classified as held for sale as of December 31, 2010. These properties do not meet the criteria to be classified as held for sale as they are expected to be disposed of other than by sale. Accordingly, the assets and liabilities of these properties are included in the Consolidated Balance Sheets as of December 31, 2010 and 2009 and their results of operations are presented as part of continuing operations in the Consolidated Statements of Operations for all periods presented. The assets and liabilities of these properties will be removed from the Consolidated Balance Sheet and the results of operations will be reclassified to discontinued operations in the Consolidated Statements of Operations upon the ultimate disposition of each property.
Loans and Other Lending Investments Held for Sale
Loans held for investment are intended to be held to maturity and, accordingly, are carried at cost, net of unamortized loan origination fees, discounts, repayments, sales of partial interests in loans, and unfunded commitments unless such loan or investment is deemed to be impaired. Loans held for sale are carried at the lower of cost or market value using available market information obtained through consultation with dealers or other originators of such investments. As of December 31, 2010 and 2009, we had no loans and other lending investments designated as held for sale. We recorded impairment charges of $2,000, $138,570 and $0, related to the mark-to-market of the loans designated as held-for-sale during the years ended December 31, 2010, 2009 and 2008, respectively.
Commercial Mortgage-Backed Securities
We designate our CMBS investments on the date of acquisition of the investment. Held to maturity investments are stated at cost plus any premiums or discounts which are amortized through the consolidated statements of operations using the level yield method. CMBS securities that we do not hold for the purpose of selling in the near-term but may dispose of prior to maturity, are designated as available-for-sale and are carried at estimated fair value with the net unrealized gains or losses recorded as a component of accumulated other comprehensive income (loss) in stockholders’ equity. Unrealized losses that are, in the judgment of management, an other-than-temporary impairment are bifurcated into (i) the amount related to credit losses, and (ii) the amount related to all other factors. The portion of the other-than-temporary impairment related to credit losses is computed by comparing the amortized cost of the investment to the present value of cash flows expected to be collected, discounted at the investment’s current yield, and is charged against earnings on the Consolidated Statement of Operations. The portion of the other-than-temporary impairment related to all other factors is recognized as a component of other comprehensive loss on the Consolidated Balance Sheet. The determination of an other-than-temporary impairment is a subjective process, and different judgments and assumptions could affect the timing of loss realization.
75
TABLE OF CONTENTS
We determine the fair value of CMBS based on the types of securities in which we have invested. For liquid, investment-grade securities, we consult with dealers of such securities to periodically obtain updated market pricing for the same or similar instruments. For non-investment grade securities, we actively monitor the performance of the underlying properties and loans and update our pricing model to reflect changes in projected cash flows. The value of the securities is derived by applying discount rates to such cash flows based on current market yields. The yields employed are obtained from our own experience in the market, advice from dealers and/or information obtained in consultation with other investors in similar instruments. Because fair value estimates when available may vary to some degree, we must make certain judgments and assumptions about the appropriate price to use to calculate the fair values for financial reporting purposes. Different judgments and assumptions could result in materially different presentations of value.
During the year ended December 31, 2010, we sold nine CMBS investments due to credit events for a realized loss of $294. During the year ended December 31, 2009, we did not sell any CMBS investments.
Pledged Government Securities
We maintain a portfolio of treasury securities that are pledged to provide principal and interest payments for mortgage debt previously collateralized by properties in our real estate portfolio. We do not intend to sell the securities and believe it is more likely than not that we will realize the full amortized cost basis of the security over their remaining life. These securities had a carrying value of $92,918, a fair value of $96,729 and unrealized gains of $3,811 at December 31, 2010, and have maturities that extend through November 2013.
Tenant and Other Receivables
Tenant and other receivables are primarily derived from the rental income that each tenant pays in accordance with the terms of its lease, which is recorded on a straight-line basis over the initial term of the lease. Since many leases provide for rental increases at specified intervals, straight-line basis accounting requires us to record a receivable, and include in revenues, unbilled rent receivables that will only be received if the tenant makes all rent payments required through the expiration of the initial term of the lease. Tenant and other receivables also include receivables related to tenant reimbursements for common area maintenance expenses and certain other recoverable expenses that are recognized as revenue in the period in which the related expenses are incurred.
Tenant and other receivables are recorded net of the allowances for doubtful accounts, which as of December 31, 2010 and December 31, 2009 were $5,440 and $8,172, respectively. We continually review receivables related to rent, tenant reimbursements and unbilled rent receivables and determine collectability by taking into consideration the tenant’s payment history, the financial condition of the tenant, business conditions in the industry in which the tenant operates and economic conditions in the area in which the property is located. In the event that the collectability of a receivable is in doubt, we increase the allowance for doubtful accounts or record a direct write-off of the receivable in the Consolidated Statements of Income.
Intangible Assets
We follow the purchase method of accounting for business combinations. We allocate the purchase price of acquired properties to tangible and identifiable intangible assets acquired based on their respective fair values. Tangible assets include land, buildings and improvements on an as-if-vacant basis. We utilize various estimates, processes and information to determine the as-if-vacant property value. Estimates of value are made using customary methods, including data from appraisals, comparable sales, discounted cash flow analysis and other methods. Identifiable intangible assets include amounts allocated to acquired leases for above- and below-market lease rates and the value of in-place leases.
Above-market and below-market lease values for properties acquired are recorded based on the present value (using an interest rate which reflects the risks associated with the leases acquired) of the difference between the contractual amount to be paid pursuant to each in-place lease and management’s estimate of the fair market lease rate for each such in-place lease, measured over a period equal to the remaining non-cancelable term of the lease. The capitalized above-market lease values are amortized as a reduction of rental income over the remaining non-cancelable terms of the respective leases. The capitalized below-market
76
TABLE OF CONTENTS
lease values are amortized as an increase to rental income over the initial term of the respective leases. If a tenant vacates its space prior to the contractual termination of the lease and no rental payments are being made on the lease, any unamortized balance of the related intangible will be written off.
The aggregate value of intangible assets related to in-place leases is primarily the difference between the property valued with existing in-place leases adjusted to market rental rates and the property valued as-if-vacant. Factors considered by management in its analysis of the in-place lease intangibles include an estimate of carrying costs during the expected lease-up period for each property taking into account current market conditions and costs to execute similar leases. In estimating carrying costs, we include real estate taxes, insurance and other operating expenses and estimates of lost rentals at market rates during the anticipated lease-up period, which is expected to average six months. We also estimate costs to execute similar leases including leasing commissions, legal and other related expenses.
The value of in-place leases is amortized to expense over the initial term of the respective leases, which range primarily from one to 20 years. In no event does the amortization period for intangible assets exceed the remaining depreciable life of the building. If a tenant terminates its lease, the unamortized portion of the in-place lease value is charged to expense.
In making estimates of fair values for purposes of allocating purchase price, we utilize a number of sources, including independent appraisals that may be obtained in connection with the acquisition or financing of the respective property and other market data. We also consider information obtained about each property as a result of its pre-acquisition due diligence, as well as subsequent marketing and leasing activities, in estimating the fair value of the tangible and intangible assets acquired and intangible liabilities assumed.
During 2010, we recorded impairment charges of $76,083 and $9,211 related to in-place lease and above-market lease asset intangibles, respectively. We recorded impairment charges to reduce the carrying value of assets, serving as collateral for the Goldman Mezzanine Loans, to estimated fair value.
Valuation of Financial Instruments
ASC 820-10, “Fair Value Measurements and Disclosures,” among other things, establishes a hierarchical disclosure framework associated with the level of pricing observability utilized in measuring financial instruments at fair value. Considerable judgment is necessary to interpret market data and develop estimated fair values. Accordingly, fair values are not necessarily indicative of the amounts that we could realize on disposition of the financial instruments. Financial instruments with readily available active quoted prices or for which fair value can be measured from actively quoted prices generally will have a higher degree of pricing observability and will require a lesser degree of judgment to be utilized in measuring fair value. Conversely, financial instruments rarely traded or not quoted will generally have less, or no, pricing observability and will require a higher degree of judgment to be utilized in measuring fair value. Pricing observability is generally affected by such items as the type of financial instrument, whether the financial instrument is new to the market and not yet established, the characteristics specific to the transaction and overall market conditions. The use of different market assumptions and/or estimation methodologies may have a material effect on estimated fair value amounts.
Fair value is defined as the price that would be received to sell an asset or paid to transfer a liability in an orderly transaction between market participants at the measurement date, or an exit price. The level of pricing observability generally correlates to the degree of judgment utilized in measuring the fair value of financial instruments. The less judgment utilized in measuring fair value financial instruments such as with readily available active quoted prices or for which fair value can be measured from actively quoted prices in active markets generally have more pricing observability. Conversely, financial instruments rarely traded or not quoted have less observability and are measured at fair value using valuation models that require more judgment. Impacted by a number of factors, pricing observability is generally affected by such items as the type of financial instrument, whether the financial instrument is new to the market and not yet established, the characteristics specific to the transaction and overall market conditions.
77
TABLE OF CONTENTS
The three broad levels defined are as follows:
Level I — This level is comprised of financial instruments that have quoted prices that are available in active markets for identical assets or liabilities. The types of financial instruments included in this category are highly liquid instruments with quoted prices.
Level II — This level is comprised of financial instruments that have pricing inputs other than quoted prices in active markets that are either directly or indirectly observable. The nature of these financial instruments includes instruments for which quoted prices are available but traded less frequently and instruments that are fair valued using other financial instruments, the parameters of which can be directly observed.
Level III — This level is comprised of financial instruments that have little to no pricing observability as of the reported date. These financial instruments do not have active markets and are measured using management’s best estimate of fair value, where the inputs into the determination of fair value require significant management judgment and assumptions. Instruments that are generally included in this category are derivatives, whole loans, subordinate interests in whole loans and mezzanine loans.
At December 31, 2010, we measured certain financial assets and financial liabilities at fair value on a recurring basis, including available-for-sale CMBS securities and derivative instruments. We calculated the fair value using Level III inputs that required management to make significant judgments and assumptions.
CMBS available for sale: The fair values of our available for sale CMBS securities are generally valued by a combination of (i) obtaining assessments from third-party dealers and (ii) in limited cases where such assessments are unavailable or, in the opinion of management, deemed not to be indicative of fair value, discounting expected cash flows using internal cash flow models and estimated market discount rates. In the case of internal models, expected cash flows of each security are based on management’s assumptions regarding the collection of principal and interest on the underlying loans and securities.
Derivative instruments: Fair values of our derivative instruments are valued using advice from a third party derivative specialist, based on a combination of observable market-based inputs, such as interest rate curves, and unobservable inputs such as credit valuation adjustments due to the risk of non-performance.
At December 31, 2010, we measured certain assets at fair value on a nonrecurring basis, including real estate investments, held to maturity CMBS securities, and lending investments.
Real Estate investments: The real estate investments identified for impairment are collateral under the Goldman Mezzanine Loans. The impairment is calculated by comparing our internally developed discounted cash flows to the carrying value of the respective property. The discounted cash flows require significant judgmental inputs on each property, which include assumptions regarding capitalization rates, lease-up periods, future occupancy rates, market rental rates, holding periods, capital improvements and other factors deemed necessary by management.
Loans subject to impairments or reserves for loan loss: The loans identified for impairment or reserves for loan loss are collateral dependent loans. Impairment or reserves for loan loss on these loans are measured by comparing management’s estimation of fair value of the underlying collateral to the carrying value of the respective loan. These valuations require significant judgments, which include assumptions regarding capitalization rates, leasing, creditworthiness of major tenants, occupancy rates, availability of financing, exit plan, loan sponsorship, actions of other lenders and other factors deemed necessary by management.
CMBS: CMBS securities which are other-than-temporarily impaired are generally valued by a combination of (i) obtaining assessments from third-party dealers and, (ii) in limited cases where such assessments are unavailable or, in the opinion of management deemed not to be indicative of fair value, discounting expected cash flows using internal cash flow models and estimated market discount rates. In the case of internal models, expected cash flows of each security are based on management’s assumptions regarding the collection of principal and interest on the underlying loans and securities.
78
TABLE OF CONTENTS
The valuations derived from pricing models may include adjustments to the financial instruments. These adjustments may be made when, in management’s judgment, either the size of the position in the financial instrument or other features of the financial instrument such as its complexity, or the market in which the financial instrument is traded (such as counterparty, credit, concentration or liquidity) require that an adjustment be made to the value derived from the pricing models. Additionally, an adjustment from the price derived from a model typically reflects management’s judgment that other participants in the market for the financial instrument being measured at fair value would also consider such an adjustment in pricing that same financial instrument.
Assets and liabilities presented at fair value and categorized as Level III are generally those that are marked to model using relevant empirical data to extrapolate an estimated fair value. The models’ inputs reflect assumptions that market participants would use in pricing the instrument in a current period transaction and outcomes from the models represent an exit price and expected future cash flows. The parameters and inputs are adjusted for assumptions about risk and current market conditions. Changes to inputs in valuation models are not changes to valuation methodologies; rather, the inputs are modified to reflect direct or indirect impacts on asset classes from changes in market conditions. Accordingly, results from valuation models in one period may not be indicative of future period measurements.
Revenue Recognition
Real Estate and CTL Investments
Rental income from leases is recognized on a straight-line basis regardless of when payments are contractually due. Certain lease agreements also contain provisions that require tenants to reimburse us for real estate taxes, common area maintenance costs and the amortized cost of capital expenditures with interest. Such amounts are included in both revenues and operating expenses when we are the primary obligor for these expenses and assume the risks and rewards of a principal under these arrangements. Under leases where the tenant pays these expenses directly, such amounts are not included in revenues or expenses.
Deferred revenue represents rental revenue and management fees received prior to the date earned. Deferred revenue also includes rental payments received in excess of rental revenues recognized as a result of straight-line basis accounting.
Other income includes fees paid by tenants to terminate their leases, which are recognized when fees due are determinable, no further actions or services are required to be performed by us, and collectability is reasonably assured. In the event of early termination, the unrecoverable net book values of the assets or liabilities related to the terminated lease are recognized as depreciation and amortization expense in the period of termination.
We recognize sales of real estate properties only upon closing. Payments received from purchasers prior to closing are recorded as deposits. Profit on real estate sold is recognized using the full accrual method upon closing when the collectability of the sale price is reasonably assured and we are not obligated to perform significant activities after the sale. Profit may be deferred in whole or part until the sale meets the requirements of profit recognition on sale of real estate.
Finance Investments
Interest income on debt investments, which includes loan and CMBS investments, are recognized over the life of the investments using the effective interest method and recognized on the accrual basis. Fees received in connection with loan commitments are deferred until the loan is funded and are then recognized over the term of the loan using the effective interest method. Anticipated exit fees, whose collection is expected, are also recognized over the term of the loan as an adjustment to yield. Fees on commitments that expire unused are recognized at expiration. Fees received in exchange for the credit enhancement of another lender, either subordinate or senior to us, in the form of a guarantee are recognized over the term of that guarantee using the straight-line method.
Income recognition is generally suspended for debt investments at the earlier of the date at which payments become 90 days past due or when, in our opinion, a full recovery of income and principal becomes doubtful. Income recognition is resumed when the loan becomes contractually current and performance is demonstrated to be resumed.
79
TABLE OF CONTENTS
We designate loans as non-performing at such time as: (1) the loan becomes 90 days delinquent or (2) the loan has a maturity default. All non-performing loans are placed on non-accrual status and subsequent cash receipts are applied to principal or recognized as income when received. At December 31, 2010, we had one second lien loan with an aggregate carrying value of $0 and one third lien loan with an aggregate carrying value of $0, which were classified as non-performing loans. At December 31, 2009, we had three first mortgage loans with an aggregate carrying value of $55,122, four mezzanine loans with an aggregate carrying value of $319, one second lien loan with a carrying value of $0 and one third lien loan with a carrying value of $0, which were classified as non-performing loans.
We classify loans as sub-performing if they are not performing in material accordance with their terms, but they do not qualify as non-performing loans and the specific facts and circumstances of these loans may cause them to develop into non-performing loans should certain events occur in the normal passage of time, which we consider to be 90 days from the measurement date. At December 31, 2010, we had one first mortgage loan with a carrying value of $13,222 and two mezzanine loans with an aggregate carrying value of $9,826 were classified as sub-performing. At December 31, 2009, four first mortgage loans with an aggregate carrying value of $160,212 were classified as sub-performing.
For the years ended December 31, 2010, 2009 and 2008, we recognized $1,482, $0, and $1,256, respectively, in net gains from the sale of debt investments or commitments.
Reserve for Loan Losses
Specific valuation allowances are established for loan losses on loans in instances where it is deemed probable that we may be unable to collect all amounts of principal and interest due according to the contractual terms of the loan. The reserve is increased through the provision for loan losses on our Consolidated Statements of Operations and is decreased by charge-offs when losses are realized through sale, foreclosure, or when significant collection efforts have ceased.
We consider the present value of payments expected to be received, observable market prices, or the estimated fair value of the collateral (for loans that are dependent on the collateral for repayment), and compare it to the carrying value of the loan. The determination of the estimated fair value is based on the key characteristics of the collateral type, collateral location, quality and prospects of the sponsor, the amount and status of any senior debt, and other factors. We also include the evaluation of operating cash flow from the property during the projected holding period, and the estimated sales value of the collateral computed by applying an expected capitalization rate to the stabilized net operating income of the specific property, less selling costs, all of which are discounted at market discount rates. We also consider if the loan’s terms have been modified in a troubled debt restructuring. Because the determination of estimated value is based upon projections of future economic events, which are inherently subjective, amounts ultimately realized from loans and investments may differ materially from the carrying value at the balance sheet date.
If, upon completion of the valuation, the estimated fair value of the underlying collateral securing the loan is less than the net carrying value of the loan, an allowance is created with a corresponding charge to the provision for loan losses. The allowance for each loan is maintained at a level we believe is adequate to absorb losses. During the year ended December 31, 2010, we incurred charge-offs totaling $239,078 relating to realized losses on ten loans. During the year ended December 31, 2009, we incurred charge-offs totaling $188,574 relating to realized losses on 16 loans. We maintained a reserve for loan losses of $263,516 against 19 separate investments with a carrying value of $438,541 as of December 31, 2010 and a reserve for loan losses of $418,202 against 23 separate investments with a carrying value of $536,445 as of December 31, 2009.
Rent Expense
Rent expense is recognized on a straight-line basis regardless of when payments are due. Accounts payable and accrued expenses in the accompanying Consolidated Balance Sheets as of December 31, 2010 and 2009 includes an accrual for rental expense recognized in excess of amounts due at that time. Rent expense related to leasehold interests is included in property operating expenses, and rent expense related to office rentals is included in management, general and administrative expense.
80
TABLE OF CONTENTS
Stock-Based Compensation Plans
We have a stock-based compensation plan, described more fully in Note 15. We account for this plan using the fair value recognition provisions.
We use the Black-Scholes option-pricing model to estimate the fair value of a stock option award. This model requires inputs such as expected term, expected volatility, and risk-free interest rate. Further, the forfeiture rate also impacts the amount of aggregate compensation cost. These inputs are highly subjective and generally require significant analysis and judgment to develop.
Prior to the termination of the management agreement in April 2009, we determined fair value of the stock options granted to employees of the Manager who provided services to us, using a mark-to-market model. In April 2009, we completed the internalization of management through the direct acquisition of the Manager. Stock option awards were re-valued at the date of the internalization and such value will be amortized over the remaining vesting period of the award for employees that remained with the Manager.
Compensation cost for stock options, if any, is recognized ratably over the vesting period of the award. Our policy is to grant options with an exercise price equal to the quoted closing market price of our stock on the business day preceding the grant date. Awards of stock or restricted stock are expensed as compensation on a current basis over the benefit period.
The fair value of each stock option granted is estimated on the date of grant for options issued to employees, and quarterly for options issued to non-employees, using the Black-Scholes option pricing model with the following weighted average assumptions for grants in 2010 and 2009.
| | | | |
| | 2010 | | 2009 |
| Dividend yield | | | 5.7% | | | | 14.0% | |
| Expected life of option | | | 5.0 years | | | | 5.0 years | |
| Risk-free interest rate | | | 2.65% | | | | 1.72% | |
| Expected stock price volatility | | | 75.0% | | | | 90.0% | |
Incentive Distribution (Class B Limited Partner Interest)
Prior to our internalization, the Class B limited partner interests were entitled to receive an incentive return equal to 25% of the amount by which funds from operations, or FFO, plus certain accounting gains (as defined in the partnership agreement of our Operating Partnership) exceed the product of our weighted average stockholders equity (as defined in the partnership agreement of our Operating Partnership) multiplied by 9.5% (divided by four to adjust for quarterly calculations). We recorded any distributions on the Class B limited partner interests as an incentive distribution expense in the period when earned and when payment of such amounts became probable and reasonably estimable in accordance with our partnership agreement. These cash distributions reduced the amount of cash available for distribution to the common unit holders in our Operating Partnership and to our common stockholders. In April 2009, we completed the internalization of our management through the direct acquisition of the Manager from SL Green. Accordingly, beginning in May 2009, management and incentive fees payable by us to the Manager ceased and Class B limited partner interests have been cancelled. No incentive distribution was earned for the years ended December 31, 2010 and 2009. We incurred approximately $2,350 with respect to incentive distributions on such Class B limited partner interests for the year ended December 31, 2008.
Derivative Instruments
In the normal course of business, we use a variety of derivative instruments to manage, or hedge, interest rate risk. We require that hedging derivative instruments be effective in reducing the interest rate risk exposure that they are designated to hedge. This effectiveness is essential for qualifying for hedge accounting. Instruments that meet these hedging criteria are formally designated as hedges at the inception of the derivative contract. We use a variety of commonly used derivative products that are considered “plain vanilla” derivatives. These derivatives typically include interest rate swaps, caps, collars and floors. We expressly prohibit the use of unconventional derivative instruments and using derivative instruments for trading or speculative purposes. Further, we have a policy of only entering into contracts with major financial institutions based upon their credit ratings and other factors.
81
TABLE OF CONTENTS
To determine the fair value of derivative instruments, we use a variety of methods and assumptions that are based on market conditions and risks existing at each balance sheet date. For the majority of financial instruments including most derivatives, long-term investments and long-term debt, standard market conventions and techniques such as discounted cash flow analysis, option-pricing models, replacement cost and termination cost are used to determine fair value. All methods of assessing fair value result in a general approximation of value, and such value may never actually be realized.
In the normal course of business, we are exposed to the effect of interest rate changes and limit these risks by following established risk management policies and procedures including the use of derivatives. To address exposure to interest rates, we use derivatives primarily to hedge cash flow variability caused by interest rate fluctuations of our liabilities. Each of our CDOs maintains a maximum amount of allowable unhedged interest rate risk. Our 2005 CDO permits 20% of the net outstanding principal balance and our 2006 and 2007 CDOs permits 5% of the net outstanding principal balance to be unhedged.
We recognize all derivatives on the balance sheet at fair value. Derivatives that are not hedges must be adjusted to fair value through income. If a derivative is a hedge, depending on the nature of the hedge, changes in the fair value of the derivative will either be offset against the change in fair value of the hedged asset, liability or firm commitment through earnings, or recognized in other comprehensive income until the hedged item is recognized in earnings. The ineffective portion of a derivative’s change in fair value will be immediately recognized in earnings. Derivative accounting may increase or decrease reported net income and stockholders’ equity prospectively, depending on future levels of LIBOR, swap spreads and other variables affecting the fair values of derivative instruments and hedged items, but will have no effect on cash flows, provided the contract is carried through to full term.
All hedges held by us are deemed effective based upon the hedging objectives established by our corporate policy governing interest rate risk management. The effect of our derivative instruments on our financial statements is discussed more fully in Note 18 to the Consolidated Financial Statements.
Income Taxes
We elected to be taxed as a REIT, under Sections 856 through 860 of the Internal Revenue Code, beginning with our taxable year ended December 31, 2004. To qualify as a REIT, we must meet certain organizational and operational requirements, including a requirement to distribute at least 90% of our ordinary taxable income, if any, to stockholders. As a REIT, we generally will not be subject to U.S. federal income tax on taxable income that we distribute to our stockholders. If we fail to qualify as a REIT in any taxable year, we will then be subject to U.S. federal income taxes on our taxable income at regular corporate rates and we will not be permitted to qualify for treatment as a REIT for U.S. federal income tax purposes for four years following the year during which qualification is lost unless the Internal Revenue Service grants us relief under certain statutory provisions. Such an event could materially adversely affect our net income and net cash available for distributions to stockholders. However, we believe that we will be organized and operate in such a manner as to qualify for treatment as a REIT and we intend to operate in the foreseeable future in such a manner so that we will qualify as a REIT for U.S. federal income tax purposes. We may, however, be subject to certain state and local taxes. Our TRSs are subject to federal, state and local taxes.
For the years ended December 31, 2010, 2009 and 2008, we recorded $966, $2,495 and $53 of income tax expense, respectively. Tax expense for the years ended December 31, 2010 and 2009 is comprised entirely of state and local taxes. Included in tax expense for the year ended December 31, 2009 is an accrual for state income taxes on the gain on extinguishment of debt of $119,305. Under federal law, we are allowed to defer this gain until 2014; however, not all states follow this federal rule.
82
TABLE OF CONTENTS
Results of Operations
Comparison of the year ended December 31, 2010 to the year ended December 31, 2009
Revenues
| | | | | | |
| | 2010 | | 2009 | | $ Change |
| Rental revenue | | $ | 311,069 | | | $ | 318,075 | | | $ | (7,006 | ) |
| Investment income | | | 166,642 | | | | 184,607 | | | | (17,965 | ) |
| Operating expense reimbursements | | | 114,304 | | | | 119,718 | | | | (5,414 | ) |
| Other income | | | 15,133 | | | | 4,688 | | | | 10,445 | |
| Total revenues | | $ | 607,148 | | | $ | 627,088 | | | $ | (19,940 | ) |
| Equity in net loss from unconsolidated joint ventures | | $ | (4,139 | ) | | $ | (2,524 | ) | | $ | (1,615 | ) |
| Gain on extinguishment of debt | | $ | 19,443 | | | $ | 119,305 | | | $ | (99,862 | ) |
Rental revenue for the year ended December 31, 2010 is primarily comprised of revenue earned on our portfolio of 894 properties owned by our Gramercy Realty division. The decrease in rental revenue of $7,006 is primarily due to accelerated amortization of lease intangibles of $8,596, reduced rental income due to lease terminations and expirations in 2010 of $5,918 within our Gramercy Realty portfolio. These are offset by $5,062 of additional rental income from the Bank of America Dana portfolio due to the assumption of third party tenants as part of the required space reduction by Bank of America, $1,174 related to properties we foreclosed on since June 2009, $659 on a property we acquired controlling interest in June 2010, and contractual rent increase, new leasing and lease renewals on our remaining portfolio.
Investment income is generated on our whole loans, subordinate interests in whole loans, mezzanine loans, preferred equity interests and CMBS. For the year ended December 31, 2010, $99,392 was earned on fixed rate investments while the remaining $67,250 was earned on floating rate investments. For the year ended December 31, 2009, $83,346 was earned on fixed rate investments while the remaining $101,261 was earned on floating rate investments. The decrease of $17,965 over the prior period is primarily due to the suspension of interest income accruals on certain payment-in-kind loans, a decrease in the size of our portfolio of loans and other leading instruments by approximately $239,846, and a decline in LIBOR interest rates in 2010 compared to 2009.
Operating expense reimbursements were $114,304 for the year ended December 31, 2010 and $119,718 for the year ended December 31, 2009. The decrease of $5,414 was primarily related to a decrease in property operating expenses which caused a decrease in reimbursement income of $8,639. The decrease is partially offset by a $3,211 increase in reimbursements due to the change in the billing of overtime HVAC and $925 increase in the Bank of America Dana portfolio due to the assumption of third party tenants as part of the required space reduction by Bank of America in June 2009.
Other income of $15,133 for the year ended December 31, 2010 is primarily composed of operating income from properties we foreclosed on since June 2009 of $1,527, operating income from a property we acquired controlling interest in June 2010 of $3,460, interest earned on restricted cash balances and other cash balances held by us of $3,275, lease termination fees of $2,483, gains on sales of $1,476 and other income of $2,912. For the year ended December 31, 2009, other income of $4,688 is composed of interest earned on restricted cash balances and other cash balances held by us of $3,641, other income of $781, and lease termination of $266.
The loss on investments in unconsolidated joint ventures of $4,139 for the year ended December 31, 2010 represents our proportionate share of the income generated by three of our joint venture interests including $4,347 of real estate-related depreciation and amortization, which when added back, results in a contribution to Funds from Operations, or FFO, of $208. The loss on investments in unconsolidated joint ventures of $2,524 for the year ended December 31, 2009 represents our proportionate share of income generated by three of our joint venture interests including $4,347 of real estate-related depreciation and amortization, which when added back, results in a contribution to FFO of $1,823. As of December 31, 2010, we classified three investments in joint ventures as discontinued operations, which had income of $11,004 and $10,486 and FFO of $11,004 and $10,605, for the years ended December 31, 2010 and 2009, respectively. Our use of FFO as an important non-GAAP financial measure is discussed in more detail below.
83
TABLE OF CONTENTS
During the year ended December 31, 2010, we repurchased, at a discount, approximately $39,000 of notes previously issued by two of our three CDOs, generating a net gain on extinguishment of debt of $19,443. In March 2009, we entered into an amendment and compromise agreement with KeyBank National Association, or KeyBank, to settle and satisfy the existing loan obligations under the $175,000 unsecured facility at a discount for a cash payment of $45,000, and a future maximum cash payment of up to $15,000 from 50% of all cash distributions received by us after May 2009 from certain junior tranches and preferred classes of securities under our CDOs, which was fully satisfied in January 2010. We recorded a net gain of $107,179 as a result of this agreement. In December 2009, we entered into a termination agreement with Wachovia, to settle and satisfy in full the pre-existing loan obligation of $44,542 under the secured term loan and credit facility. We made a one-time cash payment of $22,500 and executed and delivered to Wachovia a subordinate participation interest in our 50% interest in one of the four mezzanine loans formerly pledged under the credit facility. We recorded a gain on extinguishment of debt of $12,126 pursuant the termination agreement.
Expenses
| | | | | | |
| | 2010 | | 2009 | | $ Change |
| Property operating expenses | | $ | 1,097,137 | | | $ | 206,931 | | | $ | 890,206 | |
| Interest expense | | | 198,107 | | | | 229,493 | | | | (31,386 | ) |
| Depreciation and amortization | | | 108,232 | | | | 111,681 | | | | (3,449 | ) |
| Management, general and administrative | | | 33,293 | | | | 39,380 | | | | (6,087 | ) |
| Management fees | | | — | | | | 7,787 | | | | (7,787 | ) |
| Impairment on securities and loans held for sale | | | 39,453 | | | | 151,081 | | | | (111,628 | ) |
| Impairment on business combination, net | | | 2,722 | | | | — | | | | 2,722 | |
| Provision for loan loss | | | 84,392 | | | | 517,784 | | | | (433,392 | ) |
| Provision for taxes | | | 966 | | | | 2,495 | | | | (1,529 | ) |
| Total Expenses | | $ | 1,564,302 | | | $ | 1,266,632 | | | $ | 297,670 | |
Property operating expenses is comprised of expenses incurred on our portfolio of 894 properties owned by our Gramercy Realty division, which increased $890,206 from the $206,931 recorded in the year ended December 31, 2009 to $1,097,137 recorded in the year ended December 31, 2010. The increase is attributable to increased non-cash impairment charges of $894,715, increased rent expense of $712 on our Schwab Harborside building, $3,151 of expenses related to properties we foreclosed on since June 2009, and $4,221 on a property we acquired a controlling interest in June 2010. Substantially all of the impairments recorded for the year ended December 31, 2010 were related to properties that served as collateral for Gramercy Realty’s $549,713 senior and junior mezzanine loans. These are partially offset by reductions in real estate tax assessments of $3,349, lower utilities costs of $3,110 due to the reduced over-time HVAC charges, decrease in bad debt expense by $5,289, lower property management costs of $1,549 and cost savings initiative related to the operations of our real estate.
Interest expense was $198,107 for the year ended December 31, 2010 compared to $229,493 for the year ended December 31, 2009. The decrease of $31,386 is primarily attributed to reductions in the interest rate indexes, primarily LIBOR-based, charged on our variable rate debt over the year ended December 31, 2010 compared to the year ended December 31, 2009, as well as lower average principal balances outstanding over the same periods due to debt extinguishments, repayments using proceeds from additional cash repayments, sales of certain investments that served as collateral for these borrowings and reduced amortization of financing costs.
We recorded depreciation and amortization expenses of $108,232 for the year ended December 31, 2010, compared to $111,681 for the year ended December 31, 2009. The decrease of $3,449 is primarily due to $4,302 of lower amortization expense on in-place lease intangible assets reflecting the expiration or termination of related leases and $865 of lower amortization on loan costs. This is partially offset by increased depreciation expense on capital additions, tenant improvements and leasing costs of $1,719.
84
TABLE OF CONTENTS
Management, general and administrative expenses were $33,293 for the year ended December 31, 2010, compared to $39,380 for the same period in 2009. The decrease of $6,087 includes $5,010 of expense for costs incurred in connection with the internalization of the Manager, the acquisition costs were expensed in the period incurred, $5,416 of lower legal and professional fees and $1,779 of other cost savings in 2010. The decrease in legal and professional fees is primarily related to loan enforcement and restructurings completed during 2009, costs incurred in connection with modifications sought with respect to our CDOs, and approximately $1,626 of fees and costs incurred in connection with the exchange agreement with certain affiliates of Taberna Capital Management, LLC, or Taberna, pursuant to which a subsidiary of our Operating Partnership and Taberna agreed to exchange $97,500 of the junior subordinated notes for $97,533 face amount of bonds previously issued by our CDOs. These are offset by about $6,150 of increased salaries, benefits and other administrative costs previously borne by SL Green prior to the internalization of our management in May 2009.
Management fees of $7,787 were expensed for the year ended December 31, 2009. We did not record any management fees for the year ended December 31, 2010. The decrease is due primarily to the internalization of the Manager, which took place on April 24, 2009. The internalization was completed through a direct acquisition of the Manager, which was previously then a wholly-owned subsidiary of SL Green. Upon completion of the internalization, all management fees payable by us to the Manager were eliminated.
During the year ended December 31, 2010, we recorded impairment charges totaling $39,453, consisting of $2,000 on one loan previously classified as held for sale and an other-than-temporary impairment of $37,453 due to adverse changes in expected cash flows related to credit losses for 14 CMBS investments. Impairment charges on loans were taken to reduce the carrying value of loans-held-for sale to their fair value based upon anticipated selling prices.
During the year ended December 31, 2010, we recorded an impairment charge of $2,722 related to the acquisition of the 60% interest in the Whiteface Lodge.
Provision for loan losses was $84,392 for the year ended December 31, 2010, compared to $517,784 for the year ended December 31, 2009, a decrease of $433,392. The provision was based upon periodic credit reviews of our loan portfolio, and reflects the challenging economic conditions, severe illiquidity in the capital markets and a difficult operating environment.
Provision for taxes was $966 for the year ended December 31, 2010, versus $2,495 for the year ended December 31, 2009. The decrease of $1,529 is primarily related to a lower state income tax accrual on the gain on extinguishment of debt in the year ended December 31, 2010.
Comparison of the year ended December 31, 2009 to the year ended December 31, 2008
Revenues
| | | | | | |
| | 2009 | | 2008 | | $ Change |
| Rental revenue | | $ | 318,075 | | | $ | 222,045 | | | $ | 96,030 | |
| Investment income | | | 184,607 | | | | 254,821 | | | | (70,214 | ) |
| Operating expense reimbursements | | | 119,718 | | | | 92,469 | | | | 27,249 | |
| Other income | | | 4,688 | | | | 15,373 | | | | (10,685 | ) |
| Total revenues | | $ | 627,088 | | | $ | 584,708 | | | $ | 42,380 | |
| Equity in net income from unconsolidated joint ventures | | $ | (2,524 | ) | | $ | (2,432 | ) | | $ | (92 | ) |
| Gain on extinguishment of debt | | $ | 119,305 | | | $ | 77,234 | | | $ | 42,071 | |
85
TABLE OF CONTENTS
Rental revenue for the year ended December 31, 2009 is primarily comprised of revenue earned on our portfolio of 894 properties owned by our Gramercy Realty division. The increase in rental revenue of $96,030 is primarily due to acquisition of American Financial. Accordingly, rental revenue of $222,045 for the year ended December 31, 2008 only includes rental revenue from the American Financial acquisition beginning in April 1, 2008, the closing date of the transaction. Additionally, we assumed new third party tenants that previously were sub-tenants of Bank of America, received as part of a space reduction required by their lease in connection with the Dana Portfolio and due to higher non-cash market lease amortization reflecting the impact of purchase price allocation adjustments finalized in the first quarter of 2009.
Investment income is generated on our whole loans, subordinate interests in whole loans, mezzanine loans, preferred equity interests and CMBS. For the year ended December 31, 2009, $83,346 was earned on fixed rate investments while the remaining $101,261 was earned on floating rate investments. The decrease of $70,214 over the prior period is primarily due to an increase in non-performing loans, the suspension of interest income accruals on certain payment-in-kind loans, a decrease in the size of our portfolio of loans and other leading instruments by approximately $714,905, and a decline in LIBOR interest rates in 2009 compared to 2008.
Operating expense reimbursements of $119,718 for the year ended December 31, 2009 is attributable to the portfolio of operating real estate acquired in the American Financial acquisition. Operating expense reimbursement is included in income beginning on the date of acquisition. Accordingly, operating expense reimbursement of $92,469 for the year ended December 31, 2008 only includes revenue from the American Financial acquisition beginning April 1, 2008, the closing date of the transaction.
Gains on sales and other income of $4,688 for the year ended December 31, 2009 is primarily composed of interest earned on restricted cash balances and other cash balances held by us of $3,641, other income of $781, and lease termination of $266. For the year ended December 31, 2008, gains on sales and other income of $15,373 is composed primarily of interest earned on restricted cash balances and other cash balances held by us.
The loss on investments in unconsolidated joint ventures of $2,524 for the year ended December 31, 2009 represents our proportionate share of the income generated by three of our joint venture interests including $4,347 of real estate-related depreciation and amortization, which when added back, results in a contribution to Funds from Operations, or FFO, of $1,823. The loss on investments in unconsolidated joint ventures of $2,432 for the year ended December 31, 2008 represents our proportionate share of income generated by three of our joint venture interests including $625 of real estate-related depreciation and amortization, which when added back, results in a reduction to FFO of $1,807. As of December 31, 2010, we classified three investments in joint ventures as discontinued operations, which had income of $10,486 and $10,214 and FFO of $10,605 and $10,571, for the years ended December 31, 2009 and 2008, respectively. Our use of FFO as an important non-GAAP financial measure is discussed in more detail below.
Gain on extinguishment of debt of $119,305 for the year ended December 31, 2009 was primarily comprised of gains generated from the satisfaction of our facility with KeyBank, and the termination of our facility with Wachovia Capital Markets LLC, or Wachovia. In March 2009, we entered into an amendment and compromise agreement with KeyBank, to settle and satisfy the existing loan obligations under the $175,000 unsecured facility at a discount for a cash payment of $45,000, and a future maximum cash payment of up to $15,000 from 50% of all cash distributions received by us after May 2009 from certain junior tranches and preferred classes of securities under our CDOs, which was fully satisfied in January 2010. We recorded a net gain of $107,179 as a result of this agreement. In December 2009, we entered into a termination agreement with Wachovia, to settle and satisfy in full the pre-existing loan obligation of $44,542 under the secured term loan and credit facility. We made a one-time cash payment of $22,500 and executed and delivered to Wachovia a subordinate participation interest in our 50% interest in one of the four mezzanine loans formerly pledged under the credit facility. We recorded a gain on extinguishment of debt of $12,126 pursuant the termination agreement. During the year ended December 31, 2008, we repurchased at a discount, investment grade notes issued by our three CDOs, generating net gains on early extinguishment of debt of $77,234.
86
TABLE OF CONTENTS
Expenses
| | | | | | |
| | 2009 | | 2008 | | Change |
| Property operating expenses | | $ | 206,931 | | | $ | 144,831 | | | $ | 62,100 | |
| Interest expense | | | 229,493 | | | | 256,607 | | | | (27,114 | ) |
| Depreciation and amortization | | | 111,681 | | | | 66,688 | | | | 44,993 | |
| Management, general and administrative | | | 39,380 | | | | 16,550 | | | | 22,830 | |
| Management fees | | | 7,787 | | | | 30,299 | | | | (22,512 | ) |
| Incentive Fee | | | — | | | | 2,350 | | | | (2,350 | ) |
| Impairment on securities and loans held for sale | | | 151,081 | | | | — | | | | 151,081 | |
| Provision for loan loss | | | 517,784 | | | | 97,853 | | | | 419,931 | |
| Provision for taxes | | | 2,495 | | | | 53 | | | | 2,442 | |
| Total Expenses | | $ | 1,266,632 | | | $ | 615,231 | | | $ | 651,401 | |
Property operating expenses for the year ended December 31, 2009 is comprised of expenses incurred on our portfolio of 894 properties owned by our Gramercy Realty division, which increased $62,100 from the $144,831 recorded in the year ended December 31, 2008 to $206,931 recorded in the year ended December 31, 2009. The increase is attributable to the American Financial acquisition which closed on April 1, 2008.
Interest expense was $229,493 for the year ended December 31, 2009 compared to $256,607 for the year ended December 31, 2008. The decrease of $27,114 is primarily attributed to reductions in the interest rate indexes, primarily LIBOR-based, charged on our variable rate debt over the year ended December 31, 2009 compared to the year ended December 31, 2008, as well as lower average principal balances outstanding over the same periods due to debt extinguishments, repayments using proceeds from additional cash repayments and sales of certain investments classified as held for sale that served as collateral for these borrowings. This decrease is partially offset by the assumption of $2,500,000 of debt in April 2008 as a result of the American Financial acquisition.
We recorded depreciation and amortization expenses of $111,681 for the year ended December 31, 2009, compared to $66,688 for the year ended December 31, 2008. The increase of $44,993 is primarily due to higher amortization expense on in-place lease intangible assets reflecting the impact of purchase price allocation adjustments finalized in the first quarter of 2009 for the American Financial acquisition.
Management, general and administrative expenses were $39,380 for the year ended December 31, 2009, compared to $16,550 for the same period in 2008. The increase of $22,830 includes salaries, benefits and other administrative costs previously borne by SL Green prior to the internalization of our management, higher legal and professional fees related to loan enforcement and restructurings completed during 2009, costs incurred in connection with modifications sought with respect to our CDOs, and approximately $1,626 of fees and costs incurred in connection with the an exchange agreement with certain affiliates of Taberna, pursuant to which a subsidiary of our Operating Partnership and Taberna agreed to exchange $97,500 of the junior subordinated notes for $97,533 face amount of bonds previously issued by our CDOs. In addition, management, general and administrative expenses for the year ended December 31, 2009 includes $5,010 of expense for costs incurred in connection with the internalization of the Manager. Acquisition costs were expensed in the period incurred.
Management fees of $7,787 were expensed for the year ended December 31, 2009. We recorded $30,299 for the year ended December 31, 2008. The decrease is due primarily to the internalization of the Manager, which took place on April 24, 2009. The internalization was completed through a direct acquisition of the Manager, which was previously then a wholly-owned subsidiary of SL Green. Upon completion of the internalization, all management fees and incentive management fees payable by us to the Manager were eliminated.
87
TABLE OF CONTENTS
No incentive fees were earned for the year ended December 31, 2009. We recorded an incentive fee expense of $2,350 during the year ended December 31, 2008 in accordance with requirements of the partnership agreement of our Operating Partnership, which entitled owners of Class B limited partner interests in our Operating Partnership to an incentive return equal to 25% of the amount by which FFO plus certain accounting gains (as defined in the partnership agreement of our Operating Partnership) exceed the product of our weighted average stockholders equity (as defined in the partnership agreement of our Operating Partnership) multiplied by 9.5% (divided by four to adjust for quarterly calculations).
During the year ended December 31, 2009, we recorded impairment charges of $138,570 on 12 loans previously classified as held for sale and an other-than-temporary impairment of $12,511 due to an adverse change in expected cash flows related to credit losses for five CMBS investments. Impairment charges on loans were taken to reduce the carrying value of loans-held-for sale to their fair value based upon anticipated selling prices.
Provision for loan losses was $517,784 for the year ended December 31, 2009, compared to $97,853 for the year ended December 31, 2008, an increase of $419,931. The provision was based upon periodic credit reviews of our loan portfolio, and reflects the challenging economic conditions, severe illiquidity in the capital markets and a difficult operating environment.
Provision for taxes was $2,495 for the year ended December 31, 2009, versus $53 for the year ended December 31, 2008. The increase of $2,442 is primarily related to an additional state income tax accrual on the gain on extinguishment of debt in the year ended December 31, 2009.
Liquidity and Capital Resources
Liquidity is a measurement of the ability to meet cash requirements, including ongoing commitments to repay borrowings, fund and maintain loans and other investments, pay dividends and other general business needs. In addition to cash on hand, our primary sources of funds for short-term liquidity requirements, including working capital, distributions, if any, debt service and additional investments, if any, consist of: (i) cash flow from operations; (ii) proceeds and management fees from our existing CDOs; (iii) proceeds from principal and interest payments and rents on our investments; (iv) proceeds from potential loan and asset sales; (v) proceeds from the Interim Management Agreement for the lender portfolio; (vi) new financings or additional securitizations or CDO offerings; and, to a lesser extent; (vii) proceeds from additional common or preferred equity offerings. We believe these sources of financing will be sufficient to meet our short-term liquidity requirements. We do not anticipate having the ability in the near-term to access equity or debt capital through new warehouse lines, CDO issuances, term or credit facilities or trust preferred issuances, although we continue to explore capital raising options. In the event we are not able to successfully secure financing, we will rely primarily on cash on hand, cash flows from operations, principal, interest and lease payments on our investments, management fees, and proceeds from asset and loan sales to satisfy our liquidity requirements. If we (i) are unable to renew, replace or expand our sources of financing, (ii) are unable to execute asset and loan sales in a timely manner or to receive anticipated proceeds from them or (iii) fully utilize available cash, it may have an adverse effect on our business, results of operations, our ability to make distributions to our stockholders and to continue as a going concern.
Our ability to fund our short-term liquidity needs, including debt service and general operations (including employment related benefit expenses), through cash flow from operations can be evaluated through the Consolidated Statement of Cash Flows included in our financial statements. Beginning with the third quarter of 2008 our board of directors elected not to pay a dividend on our common stock. Additionally our board of directors elected not to pay the Series A preferred stock dividend of $0.50781 per share beginning with the fourth quarter of 2008. As of December 31, 2010 and 2009 we accrued $16,114 and $11,707, respectively, for the Series A preferred stock dividends. Based on current estimates of our taxable loss, we expect that we will have no distribution requirements in order to maintain our REIT status for the 2010 tax year and we expect that we will continue to elect to retain capital for liquidity purposes until the requirement to make a cash distribution to satisfy our REIT requirements arise. We may elect to pay dividends to satisfy our REIT distribution requirements on our common stock in cash or a combination of cash and shares of our common stock as permitted under U.S. federal income tax laws. However, in accordance with the provisions of our charter, we may not pay any dividends on our common stock until all accrued dividends and the dividend for the then current quarter on the Series A preferred stock are paid in full. We do not know when or if we will pay future dividends, including accumulated and unpaid dividends on the Series A preferred stock.
88
TABLE OF CONTENTS
Our ability to meet our long-term (beyond the next 12 months) liquidity and capital resource requirements will be subject to obtaining additional debt financing and equity capital. Our inability to renew, replace or expand our sources of financing on substantially similar terms, or any at all may have an adverse effect on our business and results of operations. Any indebtedness we incur will likely be subject to continuing or more restrictive covenants and we will likely be required to make continuing representations and warranties in connection with such debt.
Our current and future borrowings may require us, among other restrictive covenants, to keep uninvested cash on hand, to maintain a certain minimum tangible net worth, to maintain a certain portion of our assets free from liens and to secure such borrowings with assets. These conditions could limit our ability to do further borrowings. We were in compliance with all such covenants as of December 31, 2010 except for certain covenants under our PB Loan Agreement relating to tangible net worth. We have obtained a waiver from the PB Loan Agreement lender for non-compliance of the tangible net worth covenant as of December 31, 2010. We were not in compliance with the tangible net worth covenant under our PB Loan Agreement as of June 30, 2011, and such non-compliance may permit the lender to exercise remedies against the mortgage collateral on a non-recourse basis. If we are unable to make required payments under such borrowings, breach any representation or warranty in the loan documents or violate any covenant contained in a loan document, lenders may accelerate the maturity of our debt. If we are unable to retire our borrowings in such a situation, (i) we may need to prematurely sell the assets securing such debt, (ii) the lenders could accelerate the debt and foreclose on our assets pledged as collateral to such lenders, (iii) such lenders could force us into bankruptcy, (iv) such lenders could force us to take other actions to protect the value of their collateral and/or (v) our other debt financings could become immediately due and payable. Any such event would have a material adverse effect on our liquidity, the value of our common stock, and our ability to make distributions to our stockholders.
As of the date of this filing, we expect that our cash on hand and cash flow from operations will be sufficient to satisfy our current and our anticipated liquidity needs as well as our recourse liabilities.
The majority of our loan and other investments are pledged as collateral for our CDO bonds and the income generated from these investments is used to fund interest obligations of our CDO bonds and the remaining income, if any, is retained by us. Our CDO indentures contain minimum interest coverage and asset overcollateralization covenants that must be met in order for us to receive cash flow on the CDO interests retained by us and to receive the subordinate collateral management fee earned. If some or all of our CDOs fail to comply with the covenants all cash flows from the applicable CDO other than senior collateral management fees would be diverted to repay principal and interest on the most senior outstanding CDO bonds and we may not receive some or all residual payments or the subordinate collateral management fee until that CDO regained compliance with such tests. As of July 2011, our 2005 and 2006 CDOs were in compliance with their interest coverage and asset overcollateralization covenants, however the compliance margin was narrow and relatively small declines in collateral performance and credit metrics could cause the CDOs to fall out of compliance. Our 2005 CDO failed its overcollateralization test at the April 2011, January 2011, October 2010, July 2010 and April 2010 distribution dates and our 2007 CDO failed its overcollateralization test at the August 2011, May 2011, February 2011, November 2010, August 2010, May 2010 and February 2010 distribution dates.
Notwithstanding the challenges which confront our company and continued volatility within the capital markets, our board of directors remains committed to identifying and pursuing strategies and transactions that could preserve or improve our cash flows from our CDOs, increase our net asset value per share of common stock, improve our future access to capital or otherwise potentially create value for our stockholders. In considering these alternatives (which could include additional repurchases or issuances of our debt or equity securities or strategic sales of our assets), we expect our board of directors will carefully consider the potential impact of any such transaction on our liquidity position before deciding to pursue it. We expect our board of directors will only authorize us to take any of these actions if they can be accomplished on terms our board of directors finds attractive. Accordingly, there is a substantial possibility that not all such actions can or will be implemented.
89
TABLE OF CONTENTS
In early June 2011, our board of directors created a special committee to evaluate strategic alternatives of our Company following the anticipated disposition of our Realty division’s assets. The committee is authorized to engage a financial advisor to assist in this process.
To maintain our qualification as a REIT under the Internal Revenue Code, we must distribute annually at least 90% of our taxable income, if any. This distribution requirement limits our ability to retain earnings and thereby replenish or increase capital for operations. We may elect to pay dividends on our common stock in cash or a combination of cash and shares of common stock as permitted under U.S. federal income tax laws governing REIT distribution requirements. However, in accordance with the provisions of our charter, we may not pay any dividends on our common stock until all accrued dividends and the dividend for the then current quarter on the Series A Preferred Stock are paid in full.
Cash Flows
Net cash provided by operating activities increased $29,871 to $116,831 for the year ended December 31, 2010 compared to $86,960 for the same period in 2009. Operating cash flow was generated primarily by net interest income from our commercial real estate finance segment and net rental income from our property investment segment. The increase in operating cash flow for the year ended December 31, 2010 compared to the same period in 2009 was primarily due to reduced interest expense of $31,386.
Net cash provided by investing activities for the year ended December 31, 2010 was $154,707 compared to $131,121 during the same period in 2009. The increase in cash flow from investing activities is primarily attributable to the capital expenditure and leasehold costs and payment of acquisitions of joint venture investments for the year ended December 31, 2010 as compared to the year ended December 31, 2009.
Net cash used by financing activities for the year ended December 31, 2010 was $189,038 as compared to $216,564 during the same period in 2009. The decrease in cash used in financing activities for the year ended December 31, 2010 is primarily attributable to the extinguishment of our unsecured credit facility in the prior period.
Capitalization
Our authorized capital stock consists of 125,000,000 shares, $0.001 par value, of which we have authorized the issuance of up to 100,000,000 shares of common stock, $0.001 par value per share, and 25,000,000 shares of preferred stock, par value $0.001 per share. As of December 31, 2010, 49,984,559 shares of common stock and 3,525,822 shares of preferred stock were issued and outstanding.
Preferred Stock
In April 2007, we issued 4,600,000 shares of our 8.125% Series A cumulative redeemable preferred stock (including the underwriters’ over-allotment option of 600,000 shares) with a mandatory liquidation preference of $25.00 per share. Holders of the Series A preferred stock are entitled to annual dividends of $2.03125 per share on a quarterly basis and dividends are cumulative, subject to certain provisions. On or after April 18, 2012, we may at our option redeem the Series A preferred stock at par for cash. Net proceeds (after deducting underwriting fees and expenses) from the offering were approximately $111,205.
In November 2010, we settled a tender offer to purchase up to 4,000,000 shares of our Series A preferred stock for $15.00 per preferred share, net to seller in cash. In the aggregate, we paid approximately $16,620 to acquire the 1,074,178 shares of the Series A preferred stock tendered and not withdrawn. The shares of Series A preferred stock acquired by us were retired upon receipt and accrued and unpaid dividends of $4,364 or $4.0625 per share of the acquired preferred stock, were eliminated. After settlement of the tender offer, 3,525,822 shares of Series A preferred stock remain outstanding for trading on the NYSE.
The $13,713 excess of the $30,332 carrying value of the tendered preferred stock, including accrued dividends of $4,364, over the $16,620 of consideration paid was recorded as a decrease to net loss available to common stockholders.
90
TABLE OF CONTENTS
Beginning with the fourth quarter of 2008, our board of directors elected not to pay the quarterly Series A preferred stock dividends of $0.50781 per share. As of December 31, 2010 and 2009, we have accrued Series A preferred stock dividends of $16,114 and $11,707, respectively. As a result, we have accrued dividends for over six quarters which pursuant to the terms of our charter, permits the Series A preferred stockholders to elect an additional director to our board of directors. We may, or upon request of the holders of the Series A preferred stock representing 20% or more of the liquidation value of the Series A preferred stock shall, call a special meeting of our stockholders to elect such additional director in accordance with the provisions of our bylaws and other procedures established by our board of directors relating to election of directors.
Deferred Stock Compensation Plan for Directors
Under our Independent Director’s Deferral Program, which commenced April 2005, our independent directors may elect to defer up to 100% of their annual retainer fee, chairman fees and meeting fees. Unless otherwise elected by a participant, fees deferred under the program shall be credited in the form of phantom stock units. The phantom stock units are convertible into an equal number of shares of common stock upon such directors’ termination of service from the board of directors or a change in control by us, as defined by the program. Phantom stock units are credited to each independent director quarterly using the closing price of our common stock on the applicable dividend record date for the respective quarter. If dividends are declared by us, each participating independent director who elects to receive fees in the form of phantom stock units has the option to have their account credited for an equivalent amount of phantom stock units based on the dividend rate for each quarter or have dividends paid in cash.
As of December 31, 2010, there were approximately 414,108 phantom stock units outstanding, of which 408,108 units are vested.
Market Capitalization
At December 31, 2010, our CDOs and mortgage loans (including the Goldman Mortgage and Senior and Junior Mezzanine Loans) represented 96.0% of our consolidated market capitalization of $5.1 billion (based on a common stock price of $2.31 per share, the closing price of our common stock on the New York Stock Exchange on December 31, 2010). Market capitalization includes our consolidated debt and common and preferred stock.
Indebtedness
The table below summarizes secured and other debt at December 31, 2010 and December 31, 2009, including our junior subordinated notes:
| | | | |
| | December 31,
2010(1) | | December 31,
2009 |
| Mortgage notes payable | | $ | 1,640,671 | | | $ | 1,743,668 | |
| Mezzanine notes payable | | | 549,713 | | | | 553,522 | |
| Collateralized debt obligations | | | 2,682,321 | | | | 2,710,946 | |
| Junior subordinated notes | | | — | | | | 52,500 | |
| Total | | $ | 4,872,705 | | | $ | 5,060,636 | |
| Cost of debt | | | LIBOR+2.47 | % | | | LIBOR+2.31 | % |
| (1) | Pursuant to the Settlement Agreement with respect to Gramercy Realty’s $240,523 mortgage loan and Gramercy Realty’s $549,713 senior and junior mezzanine loans, the mortgage notes payable and the related collateral will be transitioned to the mezzanine lenders, in exchange for a mutual release of claims among us and the mortgage and mezzanine lenders and, subject to certain termination provisions, an arrangement for our continued management of the assets on behalf of the mezzanine lenders for a fixed fee plus incentive fees. |
91
TABLE OF CONTENTS
Term Loan, Credit Facility and Repurchase Facility
A facility with Wachovia, was initially established as a $250,000 facility in 2004, and was subsequently increased to $500,000 effective April 2005. In July 2008, the original facility was terminated and a new credit facility was executed to provide for a total credit availability of $215,680, comprised of a term loan equal to $115,680 and a revolving credit facility equal to $100,000 with a credit spread of 242.5 basis points. The term of the credit facility was two years and we could have extended for an additional twelve-month period if certain conditions were met. In April 2009, we entered into an amendment with Wachovia, pursuant to which the maturity date of the credit facility was extended to March 31, 2011. The amendment also eliminated all financial covenants, eliminated Wachovia’s right to impose future margin calls, reduced the recourse guarantee to be no more than $10,000 and eliminated cross-default provisions with respect to our other indebtedness. We made a $13,000 deposit and provided other credit support to backstop letters of credit which Wachovia issued in connection with our mortgage debt obligations of certain of our subsidiaries. We also agreed to attempt to divest of certain loan investments in the future in order to further deleverage the credit facility and to forego additional borrowing under the facility. In December 2009, we entered into a termination agreement with Wachovia, to settle and satisfy in full the pre-existing loan obligation of $44,542 under the secured term loan and credit facility. We made a one-time cash payment of $22,500 and executed and delivered to Wachovia a subordinate participation interest in our 50% interest in one of the four mezzanine loans formerly pledged under the credit agreement. Upon termination, all of the security interests and liens in favor of Wachovia under the credit agreement were released. We recorded a gain on extinguishment of debt of $12,126 pursuant the termination agreement.
In January 2009, we closed a master repurchase facility with JP Morgan Chase Bank, N.A., or JP Morgan, in the amount of $9,500. The term of the facility was through July 23, 2010, and the interest rate was 30-day LIBOR plus 175 basis points. The facility was recourse to us for 30% of this facility amount, and the facility was subject to normal mark-to-market provisions after March 2009. Proceeds under the facility, which was fully drawn at closing, were used to retire certain borrowings under the Wachovia credit facility. This facility was secured by a perfected security interest in a single debt investment. In March 2009, we terminated the JP Morgan master repurchase facility by making a cash payment of approximately $1,880 pursuant to the recourse guarantee and transferring the full ownership and control of, and responsibility for, this related loan collateral to JP Morgan. We recorded an impairment charge of $8,843 in connection with the collateral transfer.
Unsecured Credit Facility
In May 2006, we closed on a $100,000 senior unsecured revolving credit facility with KeyBank, with an initial term of three years and a one-year extension option. In June 2007, the facility was increased to $175,000. In March 2009, we entered into an amendment and compromise agreement with KeyBank to settle and satisfy the loan obligations at a discount for a cash payment of $45,000 and a maximum amount of up to $15,000 from 50% of all payments from distributions after May 2009 from certain junior tranches and preferred classes of securities under our CDOs. The remaining balance of $85 in potential cash distribution is recorded in other liabilities on our balance sheet as of December 31, 2009 and was fully paid in January 2010. We recorded a gain on extinguishment of debt of $107,229 as a result of this agreement.
In connection with the acquisition of American Financial on April 1, 2008, our indirect wholly-owned subsidiaries, First States Investors DB I L.P. (formerly known as First States Investors DB I LLC) and First States Investors DB I B, L.P., and certain of their direct or indirect subsidiaries, collectively, the DB Loan Borrowers entered into an amendment and restatement of an assumed American Financial credit facility, or the DB Loan Agreement, with Deutsche Bank AG, Cayman Islands Branch, or Deutsche Bank, as agent for certain lenders. Originally, the DB Loan Agreement provided the DB Loan Borrowers with a one year facility that would have matured on March 31, 2009. Advances made under the DB Loan bear interest at 3.00% plus the greater of (i) 3.50% or (ii) 30 day LIBOR. The DB Loan allows for prepayment in whole or in part on any payment date; provided, however, that any such prepayment shall be accompanied by all accrued interest on the portion of the DB Loan being prepaid. In September 2008, two of our CDOs purchased the DB Loan from the lender and simultaneously amended the maturity date to be September 2011 and subject to certain conditions, granted the DB Loan Borrowers two options to extend the DB Loan for one year each (i.e. to September 11, 2013 if both options are exercised). As of December 31, 2010 and 2009 the outstanding principal balance of the DB Loan was $62,379 and $64,172, respectively. The loan is eliminated in the preparation of our consolidated financial statements.
92
TABLE OF CONTENTS
The obligations under the DB Loan Agreement now owned by two of our CDOs, are secured by equity pledges of the shares in certain DB Loan Borrowers and mortgages over the various properties owned by certain DB Loan Borrowers. The DB Loan is guaranteed by us. In connection with the Settlement Agreement, we were released from this guaranty in September 2011. The DB Loan Agreement contains customary events of default, the occurrence of which could result in the acceleration of all amounts payable there under. The DB Loan, now owned by our CDOs, requires us to establish and fund certain reserve accounts to be used for the payment of taxes and insurance, rollover and replacement expenses, payment of tenant improvements and leasing commissions and the funding of debt service shortfalls.
Mortgage and Mezzanine Loans
Certain real estate assets are subject to mortgage and mezzanine liens. As of December 31, 2010, 948 (including 54 properties held by an unconsolidated joint venture) of our real estate assets were encumbered with mortgages and mezzanine debt with a cumulative outstanding balance of $2,190,384. Our mortgage notes payable typically require that specified loan-to-value and debt service coverage ratios be maintained with respect to the financed properties before we can exercise certain rights under the loan agreements relating to such properties. If the specified criteria are not satisfied, in addition to other conditions that we may have to observe, our ability to release properties from the financing may be restricted and the lender may be able to “trap” portfolio cash flow until the required ratios are met on an ongoing basis. As of December 31, 2010 and December 31, 2009, we were in covenant compliance on all of our mortgage and mezzanine loans, except that, as of December 31, 2010, we were out of debt service coverage compliance under two of our mortgage note financings. Such non-compliance does not constitute an event of default under the applicable loan agreements. Under one of the loans, the lender has the ability to restrict distributions which are limited to budgeted property operating expenses; under the other loan, the lender has the right to replace the management of the property.
Certain of our mortgage notes payable related to assets held for sale contain provisions that require us to compensate the lender for the early repayment of the loan. These charges will be separately classified in the statement of operations as yield maintenance fees within discontinued operations during the period in which the charges are incurred.
In September 2011, pursuant to the Settlement Agreement with respect to Gramercy Realty’s $240,523 mortgage loan and Gramercy Realty’s $549,713 senior and junior mezzanine loans, the mortgage notes payable and the related collateral will be transitioned to the mezzanine lenders, in exchange for a mutual release of claims among us and the mortgage and mezzanine lenders and, subject to certain termination provisions, an arrangement for our continued management of the assets on behalf of the mezzanine lenders for a fixed fee plus incentive fees. In July 2011, our Dana portfolio, which consists of 15 properties totaling approximately 3.8 million rentable square feet, was transferred to its mortgage lender through a deed in lieu of foreclosure.
Goldman Mortgage Loan
On April 1, 2008, certain of our subsidiaries, collectively, the Goldman Loan Borrowers, entered into a mortgage loan agreement, the Goldman Mortgage Loan, with GSMC, Citicorp, and SL Green in connection with a mortgage loan in the amount of $250,000, which is secured by certain properties owned or ground leased by the Goldman Loan Borrowers. The Goldman Mortgage Loan had an initial maturity date of March 9, 2010, with a single one-year extension option. The terms of the Goldman Mortgage Loan were negotiated between the Goldman Borrower and GSMC and Citicorp. The Goldman Mortgage Loan bore interest at 4.35% over one-month LIBOR. The Goldman Mortgage Loan provides for customary events of default, the occurrence of which could result in an acceleration of all amounts payable under the Goldman Mortgage Loan. The Goldman Mortgage Loan allows for prepayment under the terms of the agreement, as long as simultaneously therewith a proportionate prepayment of the Goldman Mezzanine Loan (discussed below) shall also be pre-paid. In August 2008, an amendment to the loan agreement was entered into for the Goldman Mortgage Loan in conjunction with the bifurcation of the Goldman Mezzanine loan into two separate mezzanine loans. Under this loan agreement amendment, the Goldman Mortgage Loan bears interest at 1.99% over LIBOR. We have accrued interest of $256 and borrowings of $240,523 as of December 31, 2010 and accrued interest of $253 and borrowings of $241,324 as of December 31, 2009.
93
TABLE OF CONTENTS
In March 2010, we extended the maturity date of the Goldman Mortgage Loan to March 2011, and amended certain terms of the loan agreement, including, among others, (i) a prohibition on distributions from the Goldman Loan Borrowers to us, other than to cover direct costs related to executing the extension and reimbursement of not more than $2,500 per quarter of corporate overhead actually incurred and allocated to Gramercy Realty, (ii) requirement of $5,000 of available cash on deposit in a designated account on the commencement date of the Goldman Mortgage Loan extension term, and (iii) within 90 days after the first day of the Goldman Mortgage Loan extension term, delivery by the Goldman Loan Borrowers to GSMC, Citicorp and SL Green of a comprehensive long-term business plan and restructuring proposal addressing repayment of the Goldman Mortgage Loan. Subsequent to the final maturity of the Goldman Mortgage Loan and the Goldman Mezzanine Loans, we entered into a series of short term extensions to provide additional time to exchange and consider proposals for an extension, modification, restructuring or refinancing of the Goldman Mortgage Loan and the Goldman Mezzanine Loans and to explore an orderly transition of the collateral to the lenders if such discussions fail. On May 9, 2011, we announced that the scheduled maturity of the Goldman Mortgage Loan and the Goldman Mezzanine Loans occurred without repayment and without an extension or restructuring of the loans by the lenders.
Notwithstanding the maturity and non-repayment of the loans, we maintained active communications with the lenders and in September 2011, we entered into the Settlement Agreement for an orderly transition of substantially all of Gramercy Realty’s assets to the mezzanine lenders, in exchange for a mutual release of claims among us and the mortgage and mezzanine lenders and, subject to certain termination provisions, an arrangement for our continued management of Gramercy Realty’s assets on behalf of such mezzanine lenders for a fixed fee plus incentive fees. In July 2011, our Dana portfolio, which consists of 15 properties totaling approximately 3.8 million rentable square feet, was transferred to its mortgage lender through a deed in lieu of foreclosure. Subsequent to the execution of the Settlement Agreement, the business of Gramercy Realty will change from being primarily an owner of commercial properties to being primarily a third party manager of commercial properties. The scale of Gramercy Realty’s revenues will substantially decline as a substantial portion of net revenues from property operations will be replaced with fee revenues of a substantially smaller scale. Additionally, as assets are transferred, our total assets and liabilities are expected to decline substantially.
Secured Term Loan
On April 1, 2008 First States Investors 3300 B, L.P., an indirect wholly-owned subsidiary of ours, or the PB Loan Borrower, entered into a loan agreement, the PB Loan Agreement, with PB Capital Corporation, as agent for itself and other lenders, in connection with a secured term loan in the amount of $240,000, or the PB Loan in part to refinance a portion of a portfolio of American Financial’s properties known as the WBBD Portfolio. The PB Loan matures on April 1, 2013 and bears interest at a 1.65% over one-month LIBOR. The PB Loan is secured by mortgages on the 41 properties owned by the PB Loan Borrower and all other assets of the PB Loan Borrower. The PB Loan Agreement provides for customary events of default, the occurrence of which could result in an acceleration of all amounts payable under the PB Loan Agreement. The PB Loan Borrower may prepay the PB Loan, in whole or in part (in amounts equal to at least $1,000), on any date. We had accrued interest of $395 and borrowings of $219,513 as of December 31, 2010 and accrued interest of $418 and borrowings of $234,851 as of December 31, 2009. In September 2011, pursuant to the Settlement Agreement with respect to Gramercy Realty’s $240,523 mortgage loan and Gramercy Realty’s $549,713 senior and junior mezzanine loans, the PB Loan and the related collateral will be transitioned to the mezzanine lenders, in exchange for a mutual release of claims among us and the mortgage and mezzanine lenders and, subject to certain termination provisions, an arrangement for our continued management of the assets on behalf of the mezzanine lenders for a fixed fee plus incentive fees.
The PB Loan requires us to enter into an interest rate protection agreement within five days of the tenth consecutive LIBOR banking day on which the strike rate exceeds 6.00% per annum. The interest rate protection agreement must protect the PB Loan Borrower against upward fluctuations of interest rates in excess of 6.25% per annum.
94
TABLE OF CONTENTS
The PB Loan Agreement contains covenants relating to liquidity and tangible net worth. As of December 31, 2010, we were not in compliance with the tangible net worth covenant. We have obtained a waiver from our lender for non-compliance of the tangible net worth covenant as of December 31, 2010. We were not in compliance with the tangible net worth covenant under our PB Loan Agreement as of June 30, 2011, and such non-compliance may permit the lender to exercise remedies against the mortgage collateral on a non-recourse basis.
Goldman Senior and Junior Mezzanine Loans
On April 1, 2008, certain of our subsidiaries, collectively, the Mezzanine Borrowers, entered into a mezzanine loan agreement with GSMC, Citicorp and SL Green in connection with a mezzanine loan in the amount of $600,000, or the Goldman Mezzanine Loan, which is secured by pledges of certain equity interests owned by the Mezzanine Borrowers and any amounts receivable by the Mezzanine Borrowers whether by way of distributions or other sources. The Goldman Mezzanine Loan had an initial maturity date of on March 9, 2010, with a single one-year extension option. The terms of the Goldman Mezzanine Loan were negotiated between the Mezzanine Borrowers and GSMC and Citicorp. The Goldman Mezzanine Loan bore interest at 4.35% over one-month LIBOR. The Goldman Mezzanine Loan provides for customary events of default, the occurrence of which could result in an acceleration of all amounts payable under the Goldman Mezzanine Loan. The Goldman Mezzanine Loan allows for prepayment under the terms of the agreement, subject to a 1.00% prepayment fee during the first six months, payable to the lender, as long as simultaneously therewith a proportionate prepayment of the Goldman Mortgage Loan shall also be made on such date. In addition, under certain circumstances the Goldman Mezzanine Loan is cross-defaulted with events of default under the Goldman Mortgage Loan and with other mortgage loans pursuant to which an indirect wholly-owned subsidiary of ours is the mortgagor. In August 2008, the $600,000 mezzanine loan was bifurcated into two separate mezzanine loans, (the Junior Mezzanine Loan and the Senior Mezzanine Loan) by the lenders. Additional loan agreement amendments were entered into for the Goldman Mezzanine Loan and Goldman Mortgage Loan. Under these loan agreement amendments, the Junior Mezzanine Loan bears interest at 6.00% over LIBOR and the Senior Mezzanine Loan bears interest at 5.20% over LIBOR, and the Goldman Mortgage Loan bears interest at 1.99% over LIBOR. The weighted average of these interest rate spreads is equal to the combined weighted average of the interest rates spreads on the initial loans. We have accrued interest of $1,454 and borrowings of $549,713 as of December 31, 2010 and accrued interest of $1,455 and borrowings of $553,522 as of December 31, 2009.
In March 2010, we extended the maturity date of the Goldman Mortgage Loan to March 2011, and amended certain terms of the loan agreement, including, among others, (i) a prohibition on distributions from the Goldman Loan Borrowers to us, other than to cover direct costs related to executing the extension and reimbursement of not more than $2,500 per quarter of corporate overhead actually incurred and allocated to Gramercy Realty, (ii) requirement of $5,000 of available cash on deposit in a designated account on the commencement date of the Goldman Mortgage Loan extension term, and (iii) within 90 days after the first day of the Goldman Mortgage Loan extension term, delivery by the Goldman Loan Borrowers to GSMC, Citicorp and SL Green of a comprehensive long-term business plan and restructuring proposal addressing repayment of the Goldman Mortgage Loan. Subsequent to the final maturity of the Goldman Mortgage Loan and the Goldman Mezzanine Loans, we entered into a series of short term extensions to provide additional time to exchange and consider proposals for an extension, modification, restructuring or refinancing of the Goldman Mortgage Loan and the Goldman Mezzanine Loans and to explore an orderly transition of the collateral to the lenders if such discussions fail. On May 9, 2011, we announced that the scheduled maturity of the Goldman Mortgage Loan and the Goldman Mezzanine Loans occurred without repayment and without an extension or restructuring of the loans by the lenders.
Notwithstanding the maturity and non-repayment of the loans, we maintained active communications with the lenders and in September 2011, we entered into the Settlement Agreement for an orderly transition of substantially all of Gramercy Realty’s assets to the mezzanine lenders, in exchange for a mutual release of claims among us and the mortgage and mezzanine lenders and, subject to certain termination provisions, an arrangement for our continued management of Gramercy Realty’s assets on behalf of such mezzanine lenders for a fixed fee plus incentive fees. In July 2011, our Dana portfolio, which consists of 15 properties totaling approximately 3.8 million rentable square feet, was transferred to its mortgage lender through a deed in lieu of
95
TABLE OF CONTENTS
foreclosure. Subsequent to the execution of the Settlement Agreement, the business of Gramercy Realty will change from being primarily an owner of commercial properties to being primarily a third party manager of commercial properties. The scale of Gramercy Realty’s revenues will substantially decline as a substantial portion of net revenues from property operations will be replaced with fee revenues of a substantially smaller scale. Additionally, as assets are deconsolidated from our Consolidated Balance Sheet, our total assets and liabilities are expected to decline substantially.
Collateralized Debt Obligations
During 2005 we issued approximately $1,000,000 of CDO bonds through two indirect subsidiaries, Gramercy Real Estate CDO 2005-1 Ltd., or the 2005 Issuer, and Gramercy Real Estate CDO 2005-1 LLC, or the 2005 Co-Issuer. At issuance, the CDO consisted of $810,500 of investment grade notes, $84,500 of non-investment grade notes, which were co-issued by the 2005 Issuer and the 2005 Co-Issuer, and $105,000 of preferred shares, which were issued by the 2005 Issuer. The investment grade notes were issued with floating rate coupons with a combined weighted average rate of three-month LIBOR plus 0.49%. We incurred approximately $11,957 of costs related to Gramercy Real Estate CDO 2005-1, which are amortized on a level- yield basis over the average life of the CDO.
During 2006 we issued approximately $1,000,000 of CDO bonds through two indirect subsidiaries, Gramercy Real Estate CDO 2006-1 Ltd., or the 2006 Issuer, and Gramercy Real Estate CDO 2006-1 LLC, or the 2006 Co-Issuer. At issuance, the CDO consisted of $903,750 of investment grade notes, $38,750 of non-investment grade notes, which were co-issued by the 2006 Issuer and the 2006 Co-Issuer, and $57,500 of preferred shares, which were issued by the 2006 Issuer. The investment grade notes were issued with floating rate coupons with a combined weighted average rate of three-month LIBOR plus 0.37%. We incurred approximately $11,364 of costs related to Gramercy Real Estate CDO 2006-1, which are amortized on a level-yield basis over the average life of the CDO.
In August 2007, we issued $1,100,000 of CDO bonds through two indirect subsidiaries, Gramercy Real Estate CDO 2007-1 Ltd., or the 2007 Issuer, and Gramercy Real Estate CDO 2007-1 LLC, or the 2007 Co-Issuer. At issuance, the CDO consisted of $1,045,550 of investment grade notes, $22,000 of non-investment grade notes, which were co-issued by the 2007 Issuer and the 2007 Co-Issuer, and $32,450 of preferred shares, which were issued by the 2007 Issuer. The investment grade notes were issued with floating rate coupons with a combined weighted average rate of three-month LIBOR plus 0.46%. We incurred approximately $16,816 of costs related to Gramercy Real Estate CDO 2007-1, which are amortized on a level-yield basis over the average life of the CDO.
In connection with the closing of our first CDO in July 2005, pursuant to the collateral management agreement, the Manager agreed to provide certain advisory and administrative services in relation to the collateral debt securities and other eligible investments securing the CDO notes. The collateral management agreement provides for a senior collateral management fee, payable quarterly in accordance with the priority of payments as set forth in the indenture, equal to 0.15% per annum of the net outstanding portfolio balance, and a subordinate collateral management fee, payable quarterly in accordance with the priority of payments as set forth in the indenture, equal to 0.25% per annum of the net outstanding portfolio balance. Net outstanding portfolio balance is the sum of the (i) aggregate principal balance of the collateral debt securities, excluding defaulted securities, (ii) aggregate principal balance of all principal proceeds held as cash and eligible investments in certain accounts, and (iii) with respect to the defaulted securities, the calculation amount of such defaulted securities. The collateral management agreement for our 2006 CDO provides for a senior collateral management fee, payable quarterly in accordance with the priority of payments as set forth in the indenture, equal to 0.15% per annum of the net outstanding portfolio balance, and a subordinate collateral management fee, payable quarterly in accordance with the priority of payments as set forth in the indenture, equal to 0.25% per annum of the net outstanding portfolio balance. Net outstanding portfolio balance is the sum of the (i) aggregate principal balance of the collateral debt securities, excluding defaulted securities, (ii) aggregate principal balance of all principal proceeds held as cash and eligible investments in certain accounts, and (iii) with respect to the defaulted securities, the calculation amount of such defaulted securities. The collateral management agreement for our 2007 CDO provides for a senior collateral management fee, payable quarterly in accordance with the priority of payments as set forth in the indenture, equal to (i) 0.05% per annum of the aggregate principal balance of the CMBS securities, (ii) 0.10% per annum of the
96
TABLE OF CONTENTS
aggregate principal balance of loans, preferred equity securities, cash and certain defaulted securities, and (iii) a subordinate collateral management fee, payable quarterly in accordance with the priority of payments as set forth in the indenture, equal to 0.15% per annum of the aggregate principal balance of the loans, preferred equity securities, cash and certain defaulted securities.
We retained all non-investment grade securities, the preferred shares and the common shares in the Issuer of each CDO. The Issuers and Co-Issuers in each CDO holds assets, consisting primarily of whole loans, subordinate interests in whole loans, mezzanine loans, preferred equity investments and CMBS, which serve as collateral for the CDO. Each CDO may be replenished, pursuant to certain rating agency guidelines relating to credit quality and diversification, with substitute collateral using cash generated by debt investments that are repaid during the reinvestment periods (generally, five years from issuance) of the CDO. Thereafter, the CDO securities will be retired in sequential order from senior-most to junior-most as debt investments are repaid. The financial statements of the Issuer of each CDO are consolidated in our financial statements. The securities originally rated as investment grade at time of issuance are treated as a secured financing, and are non-recourse to us. Proceeds from the sale of the securities originally rated as investment grade in each CDO were used to repay substantially all outstanding debt under our repurchase agreements and to fund additional investments. Loans and other investments are owned by the Issuers and the Co-Issuers, serve as collateral for our CDO securities, and the income generated from these investments is used to fund interest obligations of our CDO securities and the remaining income, if any, is retained by us.
The CDO indentures contain minimum interest coverage and asset overcollateralization covenants that must be satisfied in order for us to receive cash flow on the interests retained by us in our CDOs and to receive the subordinate collateral management fee earned. If some or all of our CDOs fail these covenants, all cash flows from the applicable CDO other than senior collateral management fees would be diverted to repay principal and interest on the most senior outstanding CDO securities, and we may not receive some or all residual payments or the subordinate collateral management fee until the applicable CDO regained compliance with such tests. As of July 2011, our 2005 and 2006 CDOs were in compliance with their interest coverage and asset overcollateralization covenants, however the compliance margin was narrow and relatively small declines in collateral performance and credit metrics could cause the CDOs to fall out of compliance. Our 2005 CDO failed its overcollateralization test at the April 2011, January 2011, October 2010, July 2010 and April 2010 distribution dates and our 2007 CDO failed its overcollateralization test at the August 2011, May 2011, February 2011, November 2010, August 2010, May 2010 and February 2010 distribution dates.
During the year ended December 31, 2010, we repurchased, at a discount, $39,000 of notes previously issued by two of our three CDOs. We recorded a net gain on the early extinguishment of debt of $19,443 for the year ended December 31, 2010, in connection with the repurchase of notes of such Issuers. We did not repurchase any notes during the year ended December 31, 2009. During the year ended December 31, 2008, we repurchased, at a discount, $127,300 of investment grade notes previously issued by our three CDOs. We recorded a net gain on the early extinguishment of debt of $77,234 for the year ended December 31, 2008, in connection with the repurchase of notes of such Issuers.
Junior Subordinated Notes
In May 2005, August 2005 and January 2006, we completed issuances of $50,000 each in unsecured trust preferred securities through three Delaware Statutory Trusts, or DSTs, Gramercy Capital Trust I, or GCTI, Gramercy Capital Trust II, or GCTII, and Gramercy Capital Trust III, or GCT III, that were also wholly-owned subsidiaries of our Operating Partnership. The securities issued in May 2005 bore interest at a fixed rate of 7.57% for the first ten years ending June 2015 and the securities issued in August 2005 bore interest at a fixed rate of 7.75% for the first ten years ending October 2015. Thereafter the rates were to float based on the three-month LIBOR plus 300 basis points. The securities issued in January 2006 bore interest at a fixed rate of 7.65% for the first ten years ending January 2016, with an effective rate of 7.43% when giving effect to the swap arrangement previously entered into in contemplation of this financing. Thereafter the rate was to float based on the three-month LIBOR plus 270 basis points.
97
TABLE OF CONTENTS
In January 2009, our Operating Partnership entered into an exchange agreement with the holders of the securities, pursuant to which we and the holders agreed to exchange all of the previously issued trust preferred securities for newly issued unsecured junior subordinated notes, or our Junior Notes, in the aggregate principal amount of $150,000. Our Junior Notes will mature on June 30, 2035, or the Maturity Date, and will bear (i) a fixed interest rate of 0.50% per annum for the period beginning on January 30, 2009 and ending on January 29, 2012 and (ii) a fixed interest rate of 7.50% per annum for the period commencing on January 30, 2012 through and including the Maturity Date. We may redeem our Junior Notes in whole at any time, or in part from time to time, at a redemption price equal to 100% of the principal amount of the Junior Notes. The optional redemption of our Junior Notes in part must be made in at least $25,000 increments. The Junior Notes also contained additional covenants restricting, among other things, our ability to declare or pay any dividends during the calendar year 2009 (except to maintain our REIT qualification), or make any payment or redeem any debt securities ranked pari passu or junior to the Junior Notes. In connection with the exchange agreement, the final payment on the trust preferred securities for the period October 30, 2008 through January 29, 2009 was revised to be at a reduced interest rate of 0.50% per annum. In October 2009, a subsidiary of our Operating Partnership exchanged $97,500 of our Junior Notes for $97,533 face amount of the bonds issued by our CDOs that we had repurchased in the open market. In June 2010, we redeemed the remaining $52,500 of junior subordinated notes by transferring an equivalent par value amount of various classes of bonds issued by our CDOs previously purchased by us in the open market, and cash equivalents of $5,000. This redemption eliminates our junior subordinated notes from our consolidated financial statements, which had an original balance of $150,000.
Contractual Obligations
Combined aggregate principal maturities of our CDOs, mortgage loans (including the Goldman Mortgage and Senior and Junior Mezzanine Loans), unfunded loan commitments and operating leases as of December 31, 2010 are as follows:
| | | | | | | | | | | | |
| | CDOs | | Mortgage
and
Mezzanine
Loans(1) | | Interest
Payments | | Unfunded
Loan
Commitments(2) | | Operating
Leases | | Total |
| 2011 | | $ | — | | | $ | 815,701 | | | $ | 157,236 | | | $ | 4,883 | | | $ | 21,299 | | | $ | 999,119 | |
| 2012 | | | — | | | | 80,719 | | | | 147,535 | | | | — | | | | 21,045 | | | | 249,299 | |
| 2013 | | | — | | | | 602,904 | | | | 132,304 | | | | — | | | | 20,561 | | | | 755,769 | |
| 2014 | | | — | | | | 12,884 | | | | 109,319 | | | | — | | | | 19,978 | | | | 142,181 | |
| 2015 | | | — | | | | 47,650 | | | | 104,823 | | | | — | | | | 19,157 | | | | 171,630 | |
| Thereafter | | | 2,682,321 | | | | 618,769 | | | | 214,689 | | | | — | | | | 159,090 | | | | 3,674,869 | |
| Above/Below Market Interest | | | — | | | | 11,757 | | | | — | | | | — | | | | — | | | | 11,757 | |
| Total | | $ | 2,682,321 | | | $ | 2,190,384 | | | $ | 865,906 | | | $ | 4,883 | | | $ | 261,130 | | | $ | 6,004,624 | |
| (1) | Certain of our real estate assets are subject to mortgage liens. As of December 31, 2010, 709 real estate assets were encumbered with 27 mortgages with a cumulative outstanding balance of approximately $1,628,914. As of December 31, 2010, the mortgages’ balance ranged in amount from approximately $392 to $458,605 and had maturity dates ranging from approximately 2 months to 20 years. As of December 31, 2010, 23 of the loans had fixed interest rates ranging 5.06% to 10.29% and four variable rate loans had interest rates ranging from 1.91% to 6.27%. In September 2011, pursuant to the Settlement Agreement with respect to Gramercy Realty’s $240,523 mortgage loan and Gramercy Realty’s $549,713 senior and junior mezzanine loans, the mortgage notes payable and the related collateral will be transitioned to the mezzanine lenders, in exchange for a mutual release of claims among us and the mortgage and mezzanine lenders and, subject to certain termination provisions, an arrangement for our continued management of the assets on behalf of the mezzanine lenders for a fixed fee plus incentive fees. In July 2011, our Dana portfolio, which consists of 15 properties totaling approximately 3.8 million rentable square feet, was transferred to its mortgage lender through a deed in lieu of foreclosure. |
| (2) | Based on loan budgets and estimates. |
98
TABLE OF CONTENTS
Leasing Agreements
Our properties are leased and subleased to tenants under operating leases with expiration dates extending through the year 2031. These leases generally contain rent increases and renewal options. As of December 31, 2010, we also leased bank branches and office buildings from third parties with expiration dates extending to the year 2085 and have various ground leases with expiration dates extending through 2101. These lease obligations generally contain rent increases and renewal options. In September 2011, pursuant to the Settlement Agreement with respect to Gramercy Realty’s $240,523 mortgage loan and Gramercy Realty’s $549,713 senior and junior mezzanine loans, substantially all of Gramercy Realty’s assets and liabilities, including its leasing agreements, will be transitioned to the mezzanine lenders, in exchange for a mutual release of claims among us and the mortgage and mezzanine lenders and, subject to certain termination provisions, an arrangement for our continued management of Gramercy Realty’s assets on behalf of such mezzanine lenders for a fixed fee plus incentive fees.
Future minimum rental payments under non-cancelable leases, excluding reimbursements for operating expenses, as of December 31, 2010 are as follows:
| | |
| | Operating
Leases |
| 2011 | | $ | 213,876 | |
| 2012 | | | 199,781 | |
| 2013 | | | 187,521 | |
| 2014 | | | 177,156 | |
| 2015 | | | 160,126 | |
| Thereafter | | | 927,232 | |
| Total minimum lease payments | | $ | 1,865,692 | |
Off-Balance-Sheet Arrangements
We have several off-balance-sheet investments, including joint ventures and structured finance investments. These investments all have varying ownership structures. Substantially all of our joint venture arrangements are accounted for under the equity method of accounting as we have the ability to exercise significant influence, but not control over the operating and financial decisions of these joint venture arrangements. Our off-balance-sheet arrangements are discussed in Note 6, “Investments in Unconsolidated Joint Ventures” in the accompanying financial statements.
Dividends
To maintain our qualification as a REIT, we must pay annual dividends to our stockholders of at least 90% of our REIT taxable income, if any, determined before taking into consideration the dividends paid deduction and net capital gains. Before we pay any dividend, whether for U.S. federal income tax purposes or otherwise, which would only be paid out of available cash, we must first meet both our operating requirements and scheduled debt service on our mortgages and loans payable. We may elect to pay dividends on our common stock in cash or a combination of cash and shares of common stock as permitted under U.S. federal income tax laws governing REIT distribution requirements. However, in accordance with the provisions of our charter, we may not pay any dividends on our common stock until all accrued dividends and the dividend for the then current quarter on the Series A preferred stock are paid in full.
Beginning with the third quarter of 2008, our board of directors elected not to pay a dividend on our common stock. Our board of directors also elected not to pay the Series A preferred stock dividend of $0.50781 per share beginning with the fourth quarter of 2008. The unpaid preferred stock dividends have been accrued for nine quarters as of December 31, 2010. As a result, we have accrued dividends for over six quarters which pursuant to the terms of our charter, permits the Series A preferred stockholders to elect an additional director to our board of directors. We may, or upon request of the holders of the Series A preferred stock representing 20% or more of the liquidation value of the Series A preferred stock shall, call a special meeting of our stockholders to elect such additional director in accordance with the provisions of our bylaws and other procedures established by our board of directors relating to election of directors. Based on current estimates of taxable loss, we believe we will have no distribution requirement in order to maintain our REIT status for the 2010 tax year.
99
TABLE OF CONTENTS
Inflation
A majority of our assets and liabilities are interest rate sensitive in nature. As a result, interest rates and other factors influence our performance more so than inflation. Changes in interest rates do not necessarily correlate with inflation rates or changes in inflation rates.
Further, our financial statements are prepared in accordance with GAAP and our distributions are determined by our board of directors based primarily on our net income as calculated for tax purposes, in each case, our activities and balance sheet are measured with reference to historical costs or fair market value without considering inflation.
Related Party Transactions
On April 24, 2009, in connection with the internalization, we entered into a securities transfer agreement with SL Green Operating Partnership L.P., or SL Green OP, GKK Manager Member Corp., or Manager Corp., and SL Green, pursuant to which (i) SL Green OP and Manager Corp. agreed to transfer to our Operating Partnership, membership interests in the Manager and (ii) SL Green OP agreed to transfer to our Operating Partnership its Class B limited partner interests in our Operating Partnership, in exchange for certain de minimis cash consideration. The securities transfer agreement contains standard representations, warranties, covenants and indemnities. No distributions were due on the Class B limited partner in connection with the internalization.
Concurrently with the execution of the securities transfer agreement, we also entered into a special rights agreement with SL Green OP and SL Green, pursuant to which SL Green and SL Green OP agreed to provide us certain management information systems services from April 24, 2009 through the date that was 90 days thereafter and we agreed to pay SL Green OP a monthly cash fee of $25 in connection therewith. We also agreed to use our best efforts to operate as a REIT during each taxable year and to cause our tax counsel to provide legal opinions to SL Green relating to our REIT status. Other than with respect to the transitional services provisions of the special rights agreement as set forth therein, the special rights agreement will terminate when SL Green OP ceases to own at least 7.5% of the shares of our common stock.
In connection with our initial public offering, we entered into a management agreement with the Manager, which was subsequently terminated in connection with the internalization. The management agreement provided for a term through December 2009 with automatic one-year extension options and was subject to certain termination rights. We paid the Manager an annual management fee equal to 1.75% of our gross stockholders equity (as defined in the management agreement) inclusive of our trust preferred securities. In October 2008, we entered into the second amended and restated management agreement with the Manager which generally contained the same terms and conditions as the amended and restated management agreement, as amended, except for the following material changes: (1) reduced the annual base management fee to 1.50% of our gross stockholders equity; (2) reduces the termination fee to an amount equal to the management fee earned by the Manager during the 12 months preceding the termination date; and (3) commencing July 2008, all fees in connection with collateral management agreements were to be remitted by the Manager to us. We incurred expense to the Manager under this agreement of an aggregate of $0, $7,534 and $21,058 for the years ended December 31, 2010, 2009 and 2008, respectively.
Prior to the internalization, to provide an incentive to enhance the value of our common stock, the holders of the Class B limited partner interests of our Operating Partnership were entitled to an incentive return equal to 25% of the amount by which FFO plus certain accounting gains and losses (as defined in the partnership agreement of our Operating Partnership) exceed the product of the weighted average stockholders equity (as defined in the partnership agreement of our Operating Partnership) multiplied by 9.5% (divided by four to adjust for quarterly calculations). We recorded any distributions on the Class B limited partner interests as an incentive distribution expense in the period when earned and when payments of such became probable and reasonably estimable in accordance with the partnership agreement. We incurred approximately $2,350 with respect to such Class B limited partner interests for the year ended December 31, 2008. No incentive distribution was earned by the Class B limited partner interests for the year ended December 31, 2009.
100
TABLE OF CONTENTS
Prior to the internalization, we were obligated to reimburse the Manager for its costs incurred under an asset servicing agreement between the Manager and an affiliate of SL Green OP and a separate outsource agreement between the Manager and SL Green OP. The asset servicing agreement, which was amended and restated in April 2006, provided for an annual fee payable to SL Green OP by us of 0.05% of the book value of all credit tenant lease assets and non-investment grade bonds and 0.15% of the book value of all other assets. The outsource agreement provided for an annual fee payable by us, which became $2,814 per year subsequent to the closing of the American Financial merger to reflect higher costs resulting from the increased size and number of assets of the combined company, increasing 3% annually over the prior year on the anniversary date of the outsource agreement in August of each year. For the year ended December 31, 2008, we realized expense of $1,721 to the Manager under the outsource agreement. For the year ended December 31, 2008, we realized expense of $4,022 to the Manager, under the asset servicing agreement. In October 2008, the outsource agreement was terminated and the asset servicing agreement was replaced with that certain interim asset servicing agreement between the Manager and an affiliate of SL Green, pursuant to which we were obligated to reimburse the Manager for its costs incurred there under from October 2008 until April 24, 2009 when such agreement was terminated in connection with the internalization. Pursuant to that agreement, the SL Green affiliate acted as the rated special servicer to our CDOs, for a fee equal to two basis points per year on the carrying value of the specially serviced loans assigned to it. Concurrent with the internalization, the interim asset servicing agreement was terminated and the Manager entered into a special servicing agreement with an affiliate of SL Green, pursuant to which the SL Green affiliate agreed to act as the rated special servicer to our CDOs for a period beginning on April 24, 2009 through the date that is the earlier of (i) 60 days thereafter and (ii) a date on which a new special servicing agreement is entered into between the Manager and a rated third-party special servicer. The SL Green affiliate was entitled to a servicing fee equal to (i) 25 basis points per year on the outstanding principal balance of assets with respect to certain specially serviced assets and (ii) two basis points per year on the outstanding principal balance of assets with respect to certain other assets. The April 24, 2009 agreement expired effective June 23, 2009. Effective May 2009, we entered into new special servicing arrangements with Situs Serve, L.P., which became the rated special servicer for our CDOs. An affiliate of SL Green continues to provide special servicing services with respect to a limited number of loans owned by us that are secured by properties in New York City, or in which we and SL Green are co-investors. For the years ended December 31, 2010, 2009 and 2008 we incurred expense of $477, $1,014 and $0, respectively, pursuant to the special servicing arrangement.
On October 27, 2008, we entered into a services agreement with SL Green and SL Green OP which was subsequently terminated in connection with the internalization. Pursuant to the services agreement, SL Green agreed to provide consulting and other services to us. SL Green would make Marc Holliday, Andrew Mathias and David Schonbraun available in connection with the provision of the services until the earliest of (i) September 30, 2009, (ii) the termination of the management agreement or (iii) with respect to a particular executive, the termination of any such executive’s employment with SL Green. In consideration for the consulting services, we paid a fee to SL Green of $200 per month, payable, at our option, in cash or, if permissible under applicable law or the requirements of the exchange on which the shares of our common stock trade, shares of our common stock. SL Green also provided us with certain other services described in the services agreement for a fee of $100 per month in cash and for a period terminating at the earlier of (i) three months after the date of the services agreement, subject to a one-time 30-day extension, or (ii) the termination of the management agreement.
In connection with the closing of our first CDO in July 2005, the 2005 Issuer entered into a collateral management agreement with the Manager. Refer to Note 8 for further discussion of fees related to the management of the CDO. As compensation for the performance of its obligations as collateral manager under the first CDO, our board of directors had allocated to the Manager the subordinate collateral management fee paid on the CDO notes not held by us. In October 2008, pursuant to the second amended and restated management agreement, the Manager had, commencing July 1, 2008, agreed to remit this amount to us. For the year ended December 31, 2008, we realized expense of $1,024 to the Manager under such collateral management agreement.
101
TABLE OF CONTENTS
Prior to the internalization, fees payable in connection with CDOs or other securitization vehicles, except for our 2005 CDO, were governed by the management agreement. Pursuant to the management agreement, if a collateral manager is retained as part of the formation of a CDO or other securitization vehicle, the Manager or an affiliate will be the collateral manager and will receive the following fees: (i) 0.25% per annum of the principal amount outstanding of bonds issued by a managed transitional CDO that are owned by third-party investors unaffiliated with us or the Manager, which CDO is structured to own loans secured by transitional properties, (ii) 0.15% per annum of the book value of the principal amount outstanding of bonds issued by a managed non-transitional CDO that are owned by third-party investors unaffiliated with us or the Manager, which CDOs structured to own loans secured by non-transitional properties, (iii) 0.10% per annum of the principal amount outstanding of bonds issued by a static CDO that are owned by third-party investors unaffiliated with us or the Manager, which CDO is structured to own non-investment grade bonds, and (iv) 0.05% per annum of the principal amount outstanding of bonds issued by a static CDO that are owned by third-party investors unaffiliated with us or the Manager, which CDO is structured to own investment grade bonds. For the purposes of the management agreement, a “managed transitional” CDO means a CDO that is actively managed, has a reinvestment period and is structured to own debt collateral secured primarily by non-stabilized real estate assets that are expected to experience substantial net operating income growth, and a “managed non-transitional” CDO means a CDO that is actively managed, has a reinvestment period and is structured to own debt collateral secured primarily by stabilized real estate assets that are not expected to experience substantial net operating income growth. Both “managed transitional” and “managed non-transitional” CDOs may at any given time during the reinvestment period of the respective vehicles invest in and own non-debt collateral (in limited quantity) as defined by the respective indentures. If any fees are paid to the collateral manager in excess of the fee structure provided for above, such fees are paid to us. In October 2008, pursuant to the second amended and restated management agreement, the Manager, commencing July 1, 2008, agreed to remit this amount to us. For the year ended December 31, 2008, we realized expense of approximately $1,574 to the Manager under this agreement. In connection with the internalization, the management agreement was terminated and the fees payable in connection with our 2006 and 2007 CDOs are governed by their respective collateral management agreements. Refer to Note 8 for further discussion of fees related to the management of the CDOs.
Commencing in May 2005, we are party to a lease agreement with SLG Graybar Sublease LLC, an affiliate of SL Green, for our corporate offices at 420 Lexington Avenue, New York, New York. The lease is for approximately 7,300 square feet and carries a term of 10 years with rents of approximately $249 per annum for year one rising to $315 per annum in year ten. In May and June 2009, we amended our lease with SLG Graybar Sublease LLC to increase the leased premises by approximately 2,260 square feet. The additional premises is leased on a co-terminus basis with the remainder of our leased premises and carries rents of approximately $103 per annum during the initial year and $123 per annum during the final lease year. For the years ended December 31, 2010, 2009 and 2008 we paid $339, $437 and $423 under this lease, respectively.
In July 2005, we closed on the purchase from an SL Green affiliate of a $40,000 mezzanine loan which bears interest at 11.20%. As part of that sale, the seller retained an interest-only participation. The mezzanine loan is secured by the equity interests in an office property in New York, New York. In December 2010, we sold our entire interest to an affiliate of SL Green for $38,893. As of December 31, 2009, the loan had a book value of $39,285.
In March 2006, we closed on the purchase of a $25,000 mezzanine loan, which bears interest at one-month LIBOR plus 8.00%, to a joint venture in which SL Green was an equity holder. The mezzanine loan was repaid in full on May 9, 2006, when we originated a $90,287 whole loan, which bears interest at one-month LIBOR plus 2.75%, to the joint venture. The whole loan is secured by office and industrial properties in northern New Jersey and has a book value of $24,821 and $64,130 as of December 31, 2010 and December 31, 2009, respectively.
102
TABLE OF CONTENTS
In June 2006, we closed on the acquisition of a 49.75% TIC interest in 55 Corporate Drive, located in Bridgewater, New Jersey with a 0.25% interest to be acquired in the future. The remaining 50% of the property was owned as a TIC interest by an affiliate of SL Green Operating Partnership, L.P. The property was comprised of three buildings totaling approximately 670,000 square feet which was 100% net leased to an entity whose obligations were guaranteed by Sanofi-Aventis Group through April 2023. The transaction was valued at $236,000 and was financed with a $190,000, 10-year, fixed-rate first mortgage loan. In January 2009, we and SL Green sold 100% of the respective interests in 55 Corporate.
In January 2007, we originated two mezzanine loans totaling $200,000. The $150,000 loan was secured by a pledge of cash flow distributions and partial equity interests in a portfolio of multi-family properties and bore interest at one-month LIBOR plus 6.00%. The $50,000 loan was initially secured by cash flow distributions and partial equity interests in an office property. On March 8, 2007, the $50,000 loan was increased by $31,000 when the existing mortgage loan on the property was defeased, upon which event our loan became secured by a first mortgage lien on the property and was reclassified as a whole loan. The whole loan currently bears interest at one-month LIBOR plus 6.00% for the initial funding and one-month LIBOR plus 1.00% for the subsequent funding. At closing, an affiliate of SL Green acquired from us and held a 15.15% pari-passu interest in the mezzanine loan and the whole loan. The investment in the mezzanine loan was repaid in full in September 2007. In September 2010, the whole loan was repaid at a discount. We received $56,093 and forgave the remaining balance outstanding. As of December 31, 2009, our interest in the whole loan had a carrying value of $63,894.
In April 2007, we purchased for $103,200 a 45% TIC interest to acquire the fee interest in a parcel of land located at 2 Herald Square, located along 34th Street in New York, New York. The acquisition was financed with $86,063 10-year fixed rate mortgage loan. The property is subject to a long-term ground lease with an unaffiliated third party for a term of 70 years. The remaining TIC interest is owned by a wholly-owned subsidiary of SL Green. The TIC interests are pari-passu. We sold our 45% interest in December 2010 to a wholly-owned subsidiary of SL Green for net proceeds of $25,350, resulting in a loss of $11,885. As of December 31, 2009, the investment had a carrying value of $31,557. We recorded our pro rata share of net income of $5,078, $4,988 and $5,228 for the years ended December 31, 2010, 2009 and 2008, respectively.
In July 2007, we purchased for $144,240 an investment in a 45% TIC interest to acquire a 79% fee interest and 21% leasehold interest in the fee position in a parcel of land located at 885 Third Avenue, on which is situated The Lipstick Building. The transaction was financed with a $120,443 10-year fixed rate mortgage loan. The property is subject to a 70-year leasehold ground lease with an unaffiliated third party. The remaining TIC interest is owned by a wholly-owned subsidiary of SL Green. The TIC interests are pari passu. We sold our 45% interest in December 2010 to a wholly-owned subsidiary of SL Green for net proceeds of $38,911, resulting in a loss of $15,407. As of December 31, 2009, the investment had a carrying value of $45,695. We recorded our pro rata share of net income of $5,926, $5,972 and $6,292 for the years ended December 31, 2010, 2009 and 2008, respectively.
In September 2007, we acquired a 50% interest in a $25,000 senior mezzanine loan from SL Green. Immediately thereafter, we, along with SL Green, sold all of our interests in the loan to an unaffiliated third party. Additionally, we acquired from SL Green a 100% interest in a $25,000 junior mezzanine loan associated with the same properties as the preceding senior mezzanine loan. Immediately thereafter we participated 50% of our interest in the loan back to SL Green. As of December 31, 2010 and December 31, 2009, the loan had a book value of $0 and $0, respectively. In October 2007, we acquired a 50% pari-passu interest in $57,795 of two additional tranches in the senior mezzanine loan from an unaffiliated third party. At closing, an affiliate of SL Green simultaneously acquired the other 50% pari-passu interest in the two tranches. As of December 31, 2010 and December 31, 2009, the loan has a book value of $0 and $319, respectively. We held a contingent interest in the property which was sold to SL Green in December 2010 for $2,016.
103
TABLE OF CONTENTS
In December 2007, we acquired a $52,000 interest in a senior mezzanine loan from a financial institution. Immediately thereafter, we participated 50% of our interest in the loan to an affiliate of SL Green. The investment, which is secured by an office building in New York, New York, was purchased at a discount and bears interest at an effective spread to one-month LIBOR of 5.00%. In July 2009, we sold our remaining interest in the loan to an affiliate of SL Green for $16,120 pursuant to purchase rights established when the loan was acquired. The sale also included a contingent participation in future net proceeds from SL Green of up to $1,040 in excess of the purchase price upon their ultimate disposition of the loan, which was surrendered and cancelled in December 2010 in connection with certain transactions that we consummated with wholly-owned subsidiaries of SL Green.
In December 2007, we acquired a 50% interest in a $200,000 senior mezzanine loan from a financial institution. Immediately thereafter, we participated 50% of our interest in the loan to an affiliate of SL Green. The investment was purchased at a discount and bears interest at an effective spread to one-month LIBOR of 6.50%. In December 2010, we subsequently purchased an affiliate of SL Green’s full participation in the senior mezzanine loan at a discount. As of December 31, 2010 and December 31, 2009, the original loan has a book value of $5,224 and $28,228 and the subsequently purchased loan has a book value of $13,586 and $0, respectively.
In August 2008, we closed on the purchase from an SL Green affiliate of a $9,375 pari-passu participation interest in $18,750 first mortgage. The loan is secured by a retail shopping center located in Staten Island, New York. The investment bears interest at a fixed rate of 6.50%. In December 2010, we purchased the remaining 50% interest in the loan from an SL Green affiliate for a discount of $9,420. As of December 31, 2010 and 2009 the loan has a book value of $19,367 and $9,926, respectively.
In September 2008, we closed on the purchase from an SL Green affiliate of a $30,000 interest in a $135,000 mezzanine loan. The loan is secured by the borrower’s interests in a retail condominium located New York, New York. The investment bears interest at an effective spread to one-month LIBOR of 10.00%. As of December 31, 2010 and 2009, the loan has a book value of approximately $27,778 and $29,925, respectively. In December 2010, we sold our contingent interest to SL Green for $300.
In December 2010, the Company sold its interest in a parcel of land located at 292 Madison Avenue in New York, New York to a wholly-owned subsidiary of SL Green. The Company received proceeds of $16,765 and recorded an impairment charge of $9,759.
Funds from Operations
We present FFO because we consider it an important supplemental measure of our operating performance and believe that it is frequently used by securities analysts, investors and other interested parties in the evaluation of REITS. We also use FFO as one of several criteria to determine performance-based incentive compensation for members of our senior management, which may be payable in cash or equity awards. The revised White Paper on FFO approved by the Board of Governors of the National Association of Real Estate Investment Trusts, or NAREIT, in April 2002 defines FFO as net income (loss) (computed in accordance with GAAP, inclusive of the impact of straight line rents), excluding gains (or losses) from items which are not a recurring part of our business, such as sales of properties, plus real estate-related depreciation and amortization and after adjustments for unconsolidated partnerships and joint ventures. We consider gains and losses on the sales of debt investments to be a normal part of our recurring operations and therefore include such gains and losses when arriving at FFO. FFO does not represent cash generated from operating activities in accordance with GAAP and should not be considered as an alternative to net income (determined in accordance with GAAP), as an indication of our financial performance, or to cash flow from operating activities (determined in accordance with GAAP) as a measure of our liquidity, nor is it entirely indicative of funds available to fund our cash needs, including our ability to make cash distributions. Our calculation of FFO may be different from the calculation used by other companies and, therefore, comparability may be limited.
104
TABLE OF CONTENTS
FFO for the years ended December 31, 2010, 2009 and 2008 are as follows:
| | | | | | |
| | For the Year Ended December 31, |
| | | 2010 | | 2009 | | 2008 |
| Net income (loss) available to common shareholders | | $ | (968,773 | ) | | $ | (529,043 | ) | | $ | 49,959 | |
Add:
| | | | | | | | | | | | |
| Depreciation and amortization | | | 115,051 | | | | 122,489 | | | | 84,290 | |
| FFO adjustments for unconsolidated joint ventures | | | 4,347 | | | | 4,450 | | | | 625 | |
Less:
| | | | | | | | | | | | |
| Non real estate depreciation and amortization | | | (7,925 | ) | | | (10,348 | ) | | | (11,379 | ) |
| Gain on sale | | | (13,302 | ) | | | (5,158 | ) | | | — | |
| Funds from operations | | $ | (870,602 | ) | | $ | (417,610 | ) | | $ | 123,495 | |
| Funds from operations per share – basis | | $ | (17.44 | ) | | $ | (8.38 | ) | | $ | 2.61 | |
| Funds from operations per share – diluted | | $ | (17.44 | ) | | $ | (8.38 | ) | | $ | 2.61 | |
Recently Issued Accounting Pronouncements
In April 2009, the FASB issued guidance that requires fair value disclosures to be included for interim reporting periods. We have adopted this new accounting standard effective April 1, 2009. We have made the appropriate disclosures in the interim financial statements during 2009.
In April 2009, the FASB issued guidance on other-than-temporary-impairments that amends the impairment guidance relating to certain debt securities and will require a company to assess the likelihood of selling the security prior to recovering its cost basis. Additionally, when a company meets the criteria for impairment, the impairment charges related to credit losses would be recognized in earnings, while non-credit losses would be reflected in other comprehensive income. We adopted this standard effective April 1, 2009. Adoption of the new guidance did not have a material impact on our consolidated financial statements.
In April 2009, the FASB issued clarifying guidance on determining when the trading volume and activity for an asset or liability has significantly decreased, which may indicate an inactive market, and on measuring the fair value of an asset or liability in inactive markets. We adopted this new accounting standard effective April 1, 2009. Adoption of the new guidance did not have a material impact on our consolidated financial statements.
In April 2009, the FASB issued guidance that requires that an acquirer to recognize at fair value, at the acquisition date, an asset acquired or a liability assumed in a business combination that arises from a contingency if the acquisition-date fair value of the asset or liability can be determined during the measurement period. We adopted this new accounting standard effective January 1, 2009. Adoption of the new guidance did not have a material impact on the consolidated financial statements.
In May 2009, the FASB issued new guidance that incorporates into authoritative accounting literature certain guidance that already existed within generally accepted auditing standards relative to the reporting of subsequent events, with the requirements concerning recognition and disclosure of subsequent events remaining essentially unchanged. This guidance addresses events which occur after the balance sheet date but before the issuance of financial statements. Under the new guidance, as under previous practice, an entity must record the effects of subsequent events that provide evidence about conditions that existed at the balance sheet date and must disclose but not record the effects of subsequent events which provide evidence about conditions that did not exist at the balance sheet date. This standard added an additional required disclosure relative to the date through which subsequent events have been evaluated and whether that is the date on which the financial statements were issued. We adopted this standard effective April 1, 2009. In February 2010, the FASB issued an Accounting Standards Update (ASU) clarifying the application of this guidance to entities, specifying that if an entity is an SEC filer then it should evaluate subsequent events through the date the financial statements are available to be issued. Additionally the ASU incorporates a definition of an SEC filer and states that an SEC filer is not required to disclose the date through which subsequent events have been evaluated. We have applied this update to our financial statements for the period ended December 31, 2010.
105
TABLE OF CONTENTS
In June 2009, the FASB amended the guidance on transfers of financial assets to, among other things, eliminate the qualifying special-purpose entity concept, include a new unit of account definition that must be met for transfers of portions of financial assets to be eligible for sale accounting, clarify and change the derecognition criteria for a transfer to be accounted for as a sale, and require significant additional disclosure. This standard was effective January 1, 2010. The adoption of this guidance did not have a material impact on our consolidated financial statements.
In June 2009, the FASB issued new guidance which revised the consolidation guidance for variable-interest entities. The modifications include the elimination of the exemption for qualifying special purpose entities, a new approach for determining who should consolidate a variable-interest entity, and changes to when it is necessary to reassess who should consolidate a variable-interest entity. This standard was effective January 1, 2010. The adoption of this guidance did not have a material impact on our consolidated financial statements.
In January 2010, the FASB amended guidance to require a number of additional disclosures regarding fair value measurements. Specifically, the guidance revises two disclosure requirements concerning fair value measurements and clarifies two others. It requires separate presentation of significant transfers into and out of Levels 1 and 2 of the fair value hierarchy and disclosure of the reasons for such transfers. Also, it requires the presentation of purchases, sales, issuances and settlements within Level III on a gross basis rather than on a net basis. The amendments clarify that disclosures should be disaggregated by class of asset or liability and that disclosures about inputs and valuation techniques should be provided for both recurring and non-recurring fair value measurements. The Company has determined the adoption of this guidance did not have a material impact on the Company’s consolidated financial statements.
In March 2010, the FASB issued a clarification of previous guidance that exempts certain credit related features from analysis as potential embedded derivatives subject to bifurcation and separate fair value accounting. This guidance specifies that an embedded credit derivative feature related to the transfer of credit risk that is only in the form of subordination of one financial instrument to another is not subject to bifurcation from a host contract. All other embedded credit derivative features should be analyzed to determine whether their economic characteristics and risks are “clearly and closely related” to the economic characteristics and risks of the host contract and whether bifurcation and separate fair value accounting is required. The adoption of this guidance by the Company on July 1, 2010 had no material effect on the Company’s consolidated financial statements.
In July 2010, FASB issued guidance which outlines specific disclosures that will be required for the allowance for credit losses and all finance receivables. Finance receivables includes loans, lease receivables and other arrangements with a contractual right to receive money on demand or on fixed or determinable dates that is recognized as an asset on an entity’s statement of financial position. This guidance will require companies to provide disaggregated levels of disclosure by portfolio segment and class to enable users of the financial statement to understand the nature of credit risk, how the risk is analyzed in determining the related allowance for credit losses and changes to the allowance during the reporting period. Required disclosures under this guidance as of the end of a reporting period are effective for the Company’s December 31, 2010 reporting period and disclosures regarding activities during a reporting period are effective for the Company’s March 31, 2011 interim reporting period. In January 2011, the FASB delayed the effective date of the new disclosures about troubled debt restructurings to allow the FASB the time needed to complete its deliberations about on what constitutes a troubled debt restructuring. The effective date of the new disclosures about and the guidance for determining what constitutes a troubled debt restructuring will then be coordinated. The guidance is anticipated to be effective for our September 30, 2011 reporting period. We have applied this update to our financial statements for the period ended December 31, 2010.
In December 2010, the FASB issued guidance on the disclosure of supplementary pro forma information for business combinations. The guidance specifies that if a public entity enters into business combinations that are material on an individual or aggregate basis and presents comparative financial statements, the entity must present pro forma revenue and earnings of the combined entity as though the business combination that occurred during the current period had occurred as of the beginning of the comparable annual period only. The adoption of this guidance for our annual reporting period ending December 31, 2011 will not have a material impact on our financial statements.
106
TABLE OF CONTENTS
ITEM 7A. QUANTITATIVE AND QUALITATIVE DISCLOSURE ABOUT MARKET RISK
Market Risk
Market risk includes risks that arise from changes in interest rates, credit, commodity prices, equity prices and other market changes that affect market sensitive instruments. In pursuing our business plan, we expect that the primary market risks to which we will be exposed are real estate, interest rate and credit risks. These risks are highly sensitive to many factors, including governmental monetary and tax policies, domestic and international economic and political considerations and other factors that are beyond our control.
Real Estate Risk
Commercial and multi-family property values and net operating income derived from such properties are subject to volatility and may be affected adversely by a number of factors, including, but not limited to, national, regional and local economic conditions, local real estate conditions (such as an oversupply of retail, industrial, office or other commercial or multi-family space), changes or continued weakness in specific industry segments, construction quality, age and design, demographic factors, retroactive changes to building or similar codes, and increases in operating expenses (such as energy costs). In the event net operating income decreases, a borrower may have difficulty repaying our loans, which could result in losses to us. In addition, decreases in property values reduce the value of the collateral and the potential proceeds available to a borrower to repay our loans, which could also cause us to suffer losses. Even when a property’s net operating income is sufficient to cover the property’s debt service at the time a loan is made, there can be no assurance that this will continue in the future. We employ careful business selection, rigorous underwriting and credit approval processes and attentive asset management to mitigate these risks. These same factors pose risks to the operating income we receive from our portfolio of real estate investments, the valuation of our portfolio of owned properties, and our ability to refinance existing mortgage and mezzanine borrowings supported by the cash flow and value of our owned properties.
Interest Rate Risk
Interest rate risk is highly sensitive to many factors, including governmental monetary and tax policies, domestic and international economic and political considerations and other factors beyond our control. Our operating results will depend in large part on differences between the income from our assets and our borrowing costs. Most of our commercial real estate finance assets and borrowings are variable-rate instruments that we finance with variable rate debt. The objective of this strategy is to minimize the impact of interest rate changes on the spread between the yield on our assets and our cost of funds. We seek to enter into hedging transactions with respect to all liabilities relating to fixed rate assets. If we were to finance fixed rate assets with variable rate debt and the benchmark for our variable rate debt increased, our net income would decrease. Some of our loans are subject to various interest rate floors. As a result, if interest rates fall below the floor rates, the spread between the yield on our assets and our cost of funds will increase, which will generally increase our returns. Because we generate income on our commercial real estate finance assets principally from the spread between the yields on our assets and the cost of our borrowing and hedging activities, our net income on our commercial real estate finance assets will generally increase if LIBOR increases and decrease if LIBOR decreases. Our real estate assets generate income principally from fixed long-term leases and we are exposed to changes in interest rates primarily from our floating rate borrowing arrangements. We have used interest rate caps to manage our exposure to interest rate changes above 5.25% on $850,000 of borrowings, however, because our borrowing secured by our real estate assets is largely unhedged and because our real estate assets generate income from long-term leases, our net income from our real estate assets will generally decrease if LIBOR increases. The following chart shows a hypothetical 100 basis point increase in interest rates along the entire interest rate curve:
| | |
| Change in LIBOR | | Projected Increase
(Decrease) in Net Income |
Base case
| | | | |
| +100 bps | | $ | (16,132 | ) |
| +200 bps | | $ | (30,533 | ) |
| +300 bps | | $ | (42,810 | ) |
107
TABLE OF CONTENTS
Our exposure to interest rates will also be affected by our overall corporate leverage, which may vary depending on our mix of assets.
In the event of a significant rising interest rate environment and/or economic downturn, delinquencies and defaults could increase and such delinquencies or defaults could have an adverse effect on the spreads between interest-earning assets and interest-bearing liabilities.
In the event of a rapidly rising interest rate environment, our operating cash flow from our real estate assets may be insufficient to cover the corresponding increase in interest expense on our variable rate borrowing secured by our real estate assets.
Credit Risk
Credit risk refers to the ability of each tenant in our portfolio of real estate investments to make contractual lease payments and each individual borrower under our loans and securities investments to make required interest and principal payments on the scheduled due dates. We seek to reduce credit risk of our real estate investments by entering into long-term leases with investment-grade financial services companies and financial institutions and we attempt to reduce credit risk of our loan and securities investments by actively managing our portfolio and the underlying credit quality of the subject collateral. If defaults occur, we employ our asset management resources to mitigate the severity of any losses and seek to optimize the recovery from assets in the event that we foreclose upon them. We seek to control the negotiation and structure of the debt transactions in which we invest, which enhances our ability to mitigate our losses, to negotiate loan documents that afford us appropriate rights and control over our collateral, and to have the right to control the debt that is senior to our position. We generally avoid investments where we cannot secure adequate control rights, unless we believe the default risk is very low and the transaction involves high-quality sponsors. In the event of a significant rising interest rate environment and/or economic downturn, tenant and borrower delinquencies and defaults may increase and result in credit losses that would materially and adversely affect our business, financial condition and results of operations.
108
TABLE OF CONTENTS
ITEM 8. FINANCIAL STATEMENTS AND SUPPLEMENTARY DATA
Index to Financial Statements and Schedules
All other schedules are omitted because they are not required or the required information is shown in the financial statements or notes thereto.
109
TABLE OF CONTENTS
Report of Independent Registered Public Accounting Firm
The Board of Directors and Stockholders of Gramercy Capital Corp.
We have audited the accompanying consolidated balance sheets of Gramercy Capital Corp. (the “Company”) as of December 31, 2010 and 2009, and the related consolidated statements of operations, stockholders’ equity and non-controlling interests, and cash flows for each of the three years in the period ended December 31, 2010. Our audits also included the financial statement schedules listed in the Index at Item 15(a). These financial statements and schedules are the responsibility of the Company’s management. Our responsibility is to express an opinion on these financial statements based on our audits.
We conducted our audits in accordance with the standards of the Public Company Accounting Oversight Board (United States). Those standards require that we plan and perform the audit to obtain reasonable assurance about whether the financial statements are free of material misstatement. An audit includes examining, on a test basis, evidence supporting the amounts and disclosures in the financial statements. An audit also includes assessing the accounting principles used and significant estimates made by management, as well as evaluating the overall financial statement presentation. We believe that our audits provide a reasonable basis for our opinion.
In our opinion, the financial statements referred to above present fairly, in all material respects, the consolidated financial position of Gramercy Capital Corp. at December 31, 2010 and 2009, and the consolidated results of its operations and its cash flows for each of the three years in the period ended December 31, 2010, in conformity with U.S. generally accepted accounting principles. Also, in our opinion, the related financial statement schedules, when considered in relation to the basic financial statements taken as a whole, present fairly in all material respects the information set forth therein.
We also have audited, in accordance with the standards of the Public Company Accounting Oversight Board (United States), Gramercy Capital Corp.’s internal control over financial reporting as of December 31, 2010, based on criteria established in Internal Control — Integrated Framework issued by the Committee of Sponsoring Organizations of the Treadway Commission and our report dated September 22, 2011 expressed an unqualified opinion thereon.
/s/ ERNST & YOUNG LLP
New York, New York
September 22, 2011
110
TABLE OF CONTENTS
Report of Independent Registered Public Accounting Firm
The Board of Directors and Stockholders of Gramercy Capital Corp.
We have audited Gramercy Capital Corp.’s internal control over financial reporting as of December 31, 2010, based on criteria established in Internal Control — Integrated Framework issued by the Committee of Sponsoring Organizations of the Treadway Commission (the COSO criteria). Gramercy Capital Corp.’s management is responsible for maintaining effective internal control over financial reporting, and for its assessment of the effectiveness of internal control over financial reporting included in the accompanying Management’s Annual Report on Internal Control over Financial Reporting. Our responsibility is to express an opinion on the company’s internal control over financial reporting based on our audit.
We conducted our audit in accordance with the standards of the Public Company Accounting Oversight Board (United States). Those standards require that we plan and perform the audit to obtain reasonable assurance about whether effective internal control over financial reporting was maintained in all material respects. Our audit included obtaining an understanding of internal control over financial reporting, assessing the risk that a material weakness exists, testing and evaluating the design and operating effectiveness of internal control based on the assessed risk, and performing such other procedures as we considered necessary in the circumstances. We believe that our audit provides a reasonable basis for our opinion.
A company’s internal control over financial reporting is a process designed to provide reasonable assurance regarding the reliability of financial reporting and the preparation of financial statements for external purposes in accordance with generally accepted accounting principles. A company’s internal control over financial reporting includes those policies and procedures that (1) pertain to the maintenance of records that, in reasonable detail, accurately and fairly reflect the transactions and dispositions of the assets of the company; (2) provide reasonable assurance that transactions are recorded as necessary to permit preparation of financial statements in accordance with generally accepted accounting principles, and that receipts and expenditures of the company are being made only in accordance with authorizations of management and directors of the company; and (3) provide reasonable assurance regarding prevention or timely detection of unauthorized acquisition, use, or disposition of the company’s assets that could have a material effect on the financial statements.
Because of its inherent limitations, internal control over financial reporting may not prevent or detect misstatements. Also, projections of any evaluation of effectiveness to future periods are subject to the risk that controls may become inadequate because of changes in conditions, or that the degree of compliance with the policies or procedures may deteriorate.
In our opinion, Gramercy Capital Corp. maintained, in all material respects, effective internal control over financial reporting as of December 31, 2010, based on the COSO criteria.
We also have audited, in accordance with the standards of the Public Company Accounting Oversight Board (United States), the consolidated balance sheets of Gramercy Capital Corp. as of December 31, 2010 and 2009, and the related consolidated statements of operations, stockholders’ equity and noncontrolling interests, and cash flows for each of the three years in the period ended December 31, 2010 of Gramercy Capital Corp. and our report dated September 22, 2011 expressed an unqualified opinion thereon.
/s/ ERNST & YOUNG LLP
New York, New York
September 22, 2011
111
TABLE OF CONTENTS
Gramercy Capital Corp.
Consolidated Balance Sheets
(Amounts in thousands, except share and per share data)
| | | | |
| | December 31,
2010 | | December 31,
2009 |
Assets:
| | | | | | | | |
Real estate investments, at cost:
| | | | | | | | |
| Land | | $ | 608,455 | | | $ | 891,078 | |
| Building and improvements | | | 1,818,012 | | | | 2,391,817 | |
| Other real estate investments | | | 20,318 | | | | — | |
| Less: accumulated depreciation | | | (168,333 | ) | | | (106,018 | ) |
| Total real estate investments, net | | | 2,278,452 | | | | 3,176,877 | |
| Cash and cash equivalents | | | 220,777 | | | | 135,006 | |
| Restricted cash | | | 128,806 | | | | 129,309 | |
| Pledged government securities, net | | | 92,918 | | | | 97,286 | |
| Loans and other lending investments, net | | | 1,512 | | | | — | |
| Investment in joint ventures | | | 3,650 | | | | 84,645 | |
| Assets held for sale, net | | | — | | | | 841 | |
| Tenant and other receivables, net | | | 44,788 | | | | 61,065 | |
| Derivative instruments, at fair value | | | 4 | | | | — | |
| Acquired lease assets, net of accumulated amortization of $147,366 and $92,958 | | | 310,207 | | | | 450,436 | |
| Deferred costs, net of accumulated amortization of $29,929 and $21,243 | | | 8,156 | | | | 10,332 | |
| Other assets | | | 15,210 | | | | 13,342 | |
| Subtotal | | | 3,104,480 | | | | 4,159,139 | |
Assets of Consolidated Variable Interest Entities (“VIEs”):
| | | | | | | | |
Real estate investments, at cost:
| | | | | | | | |
| Land | | | 26,486 | | | | 19,059 | |
| Building and improvements | | | 18,970 | | | | 36,586 | |
| Less: accumulated depreciation | | | (208 | ) | | | (1,442 | ) |
| Total real estate investments directly owned | | | 45,248 | | | | 54,203 | |
| Cash and cash equivalents | | | 68 | | | | 3,339 | |
| Restricted cash | | | 116,591 | | | | 77,881 | |
| Loans and other lending investments, net | | | 1,122,016 | | | | 1,383,832 | |
| Commercial mortgage-backed securities – held to maturity | | | 973,278 | | | | 984,709 | |
| Commercial mortgage-backed securities – available for sale | | | 31,889 | | | | — | |
| Investment in joint ventures | | | — | | | | 23,820 | |
| Assets held for sale, net | | | 28,660 | | | | — | |
| Derivative instruments, at fair value | | | 1,632 | | | | — | |
| Accrued interest | | | 29,784 | | | | 32,122 | |
| Acquired lease assets, net of accumulated amortization of $153 and $0 | | | 5,546 | | | | — | |
| Deferred costs, net of accumulated amortization of $25,760 and $19,478 | | | 14,744 | | | | 21,709 | |
| Other assets | | | 18,057 | | | | 24,683 | |
| Subtotal | | | 2,387,513 | | | | 2,606,298 | |
| Total assets | | $ | 5,491,993 | | | $ | 6,765,437 | |
The accompanying notes are an integral part of these financial statements.
112
TABLE OF CONTENTS
Gramercy Capital Corp.
Consolidated Balance Sheets
(Amounts in thousands, except share and per share data)
| | | | |
| | December 31,
2010 | | December 31,
2009 |
Liabilities and Equity:
| | | | | | | | |
Liabilities:
| | | | | | | | |
| Mortgage notes payable | | $ | 1,640,671 | | | $ | 1,702,155 | |
| Mezzanine notes payable | | | 549,713 | | | | 553,522 | |
| Junior subordinated notes | | | — | | | | 52,500 | |
| Total secured and other debt | | | 2,190,384 | | | | 2,308,177 | |
| Accounts payable and accrued expenses | | | 57,688 | | | | 58,157 | |
| Dividends payable | | | 16,114 | | | | 11,707 | |
| Accrued interest payable | | | 6,934 | | | | 2,793 | |
| Deferred revenue | | | 152,601 | | | | 159,179 | |
| Below market lease liabilities, net of accumulated amortization of $223,256 and $144,253 | | | 691,592 | | | | 770,781 | |
| Leasehold interests, net of accumulated amortization of $7,770 and $5,030 | | | 17,027 | | | | 18,254 | |
| Liabilities related to assets held for sale | | | — | | | | 238 | |
| Other liabilities | | | 734 | | | | 16,193 | |
| Subtotal | | | 3,133,074 | | | | 3,345,479 | |
Non-Recourse Liabilities of Consolidated VIEs:
| | | | | | | | |
| Mortgage notes payable | | | — | | | | 41,513 | |
| Collateralized debt obligations | | | 2,682,321 | | | | 2,710,946 | |
| Total secured and other debt | | | 2,682,321 | | | | 2,752,459 | |
| Accounts payable and accrued expenses | | | 1,438 | | | | 4,137 | |
| Accrued interest payable | | | 4,818 | | | | 6,991 | |
| Deferred revenue | | | 188 | | | | 67 | |
Below market lease liabilities, net of accumulated amortization of
$26 and $0 | | | 1,556 | | | | — | |
| Liabilities related to assets held for sale | | | 531 | | | | — | |
| Derivative instruments, at fair value | | | 157,932 | | | | 88,786 | |
| Other liabilities | | | 3,128 | | | | — | |
| Subtotal | | | 2,851,912 | | | | 2,852,440 | |
| Total liabilities | | | 5,984,986 | | | | 6,197,919 | |
| Commitments and contingencies | | | — | | | | — | |
Equity:
| | | | | | | | |
| Common stock, par value $0.001, 100,000,000 shares authorized, 49,984,559 and 49,884,500 shares issued and outstanding at December 31, 2010 and 2009, respectively. | | | 50 | | | | 50 | |
| Series A cumulative redeemable preferred stock, par value $0.001, liquidation preference $88,146, 4,600,000 shares authorized, 3,525,822 and 4,600,000 shares issued and outstanding at December 31, 2010 and 2009, respectively. | | | 85,235 | | | | 111,205 | |
| Additional paid-in-capital | | | 1,078,198 | | | | 1,078,784 | |
| Accumulated other comprehensive loss | | | (160,785 | ) | | | (96,038 | ) |
| Accumulated deficit | | | (1,496,594 | ) | | | (527,821 | ) |
| Total Gramercy Capital Corp. stockholders’ equity | | | (493,896 | ) | | | 566,180 | |
| Non-controlling interest | | | 903 | | | | 1,338 | |
| Total equity | | | (492,993 | ) | | | 567,518 | |
| Total liabilities and equity | | $ | 5,491,993 | | | $ | 6,765,437 | |
The accompanying notes are an integral part of these financial statements.
113
TABLE OF CONTENTS
Gramercy Capital Corp.
Consolidated Statements of Operations
(Amounts in thousands, except share and per share data)
| | | | | | |
| | Year Ended December 31, |
| | | 2010 | | 2009 | | 2008 |
Revenues
| | | | | | | | | | | | |
| Rental revenue | | $ | 311,069 | | | $ | 318,075 | | | $ | 222,045 | |
| Investment income | | | 166,642 | | | | 184,607 | | | | 254,821 | |
| Operating expense reimbursements | | | 114,304 | | | | 119,718 | | | | 92,469 | |
| Other income | | | 15,133 | | | | 4,688 | | | | 15,373 | |
| Total revenues | | | 607,148 | | | | 627,088 | | | | 584,708 | |
Expenses
| | | | | | | | | | | | |
Property operating expenses
| | | | | | | | | | | | |
| Real estate taxes | | | 36,822 | | | | 39,539 | | | | 28,287 | |
| Utilities | | | 39,297 | | | | 41,833 | | | | 31,419 | |
| Ground rent and leasehold obligations | | | 19,754 | | | | 18,496 | | | | 13,260 | |
| Property and leasehold impairments | | | 913,648 | | | | 18,933 | | | | — | |
| Direct billable expenses | | | 6,543 | | | | 6,449 | | | | 5,664 | |
| Other property operating expenses | | | 81,073 | | | | 81,681 | | | | 66,201 | |
| Total property operating expenses | | | 1,097,137 | | | | 206,931 | | | | 144,831 | |
| Interest expense | | | 198,107 | | | | 229,493 | | | | 256,607 | |
| Depreciation and amortization | | | 108,232 | | | | 111,681 | | | | 66,688 | |
| Management, general and administrative | | | 33,293 | | | | 39,380 | | | | 16,550 | |
| Management fees | | | — | | | | 7,787 | | | | 30,299 | |
| Incentive fee | | | — | | | | — | | | | 2,350 | |
| Impairment on loans held for sale and commercial mortgage-backed securities | | | 39,453 | | | | 151,081 | | | | — | |
| Impairment on business acquisition, net | | | 2,722 | | | | — | | | | — | |
| Provision for loan loss | | | 84,392 | | | | 517,784 | | | | 97,853 | |
| Total expenses | | | 1,563,336 | | | | 1,264,137 | | | | 615,178 | |
| Loss from continuing operations before equity in income from joint ventures, provisions for taxes and non-controlling interest | | | (956,188 | ) | | | (637,049 | ) | | | (30,470 | ) |
| Equity in net loss of joint ventures | | | (4,139 | ) | | | (2,524 | ) | | | (2,432 | ) |
| Loss from continuing operations before provision for taxes, gain on extinguishment of debt and discontinued operations | | | (960,327 | ) | | | (639,573 | ) | | | (32,902 | ) |
| Gain on extinguishment of debt | | | 19,443 | | | | 119,305 | | | | 77,234 | |
| Provision for taxes | | | (966 | ) | | | (2,495 | ) | | | (53 | ) |
| Net income (loss) from continuing operations | | | (941,850 | ) | | | (522,763 | ) | | | 44,279 | |
| Net income (loss) from discontinued operations | | | 2,700 | | | | (9,133 | ) | | | 15,409 | |
| Net loss from discontinued operations with a related party | | | (9,759 | ) | | | — | | | | — | |
| Income on sale of joint venture interests | | | — | | | | 6,317 | | | | — | |
| Loss on sale of joint venture interests to a related party | | | (27,292 | ) | | | — | | | | — | |
| Net gains from disposals | | | 2,658 | | | | 5,180 | | | | — | |
| Net income (loss) from discontinued operations | | | (31,693 | ) | | | 2,364 | | | | 15,409 | |
| Net income (loss) | | | (973,543 | ) | | | (520,399 | ) | | | 59,688 | |
| Net (income) loss attributable to non-controlling interest | | | (145 | ) | | | 770 | | | | (385 | ) |
| Net income (loss) attributable to Gramercy Capital Corp. | | | (973,688 | ) | | | (519,629 | ) | | | 59,303 | |
| Accrued preferred stock dividends | | | (8,798 | ) | | | (9,414 | ) | | | (9,344 | ) |
| Excess of carrying amount of tendered preferred stock over consideration paid | | | 13,713 | | | | — | | | | — | |
| Net income (loss) available to common stockholders | | $ | (968,773 | ) | | $ | (529,043 | ) | | $ | 49,959 | |
Basic earnings per share:
| | | | | | | | | | | | |
| Net income (loss) from continuing operations, net of non-controlling interest and after preferred dividends | | $ | (18.77 | ) | | $ | (10.68 | ) | | $ | 0.73 | |
| Net income (loss) from discontinued operations | | | (0.63 | ) | | | 0.07 | | | | 0.33 | |
| Net income (loss) available to common stockholders | | $ | (19.40 | ) | | $ | (10.61 | ) | | $ | 1.06 | |
Diluted earnings per share:
| | | | | | | | | | | | |
| Net income (loss) from continuing operations, net of non-controlling interest and after preferred dividends | | $ | (18.77 | ) | | $ | (10.68 | ) | | $ | 0.73 | |
| Net income (loss) from discontinued operations | | | (0.63 | ) | | | 0.07 | | | | 0.33 | |
| Net income (loss) available to common stockholders | | $ | (19.40 | ) | | $ | (10.61 | ) | | $ | 1.06 | |
| Basic weighted average common shares outstanding | | | 49,923,930 | | | | 49,854,174 | | | | 47,205,078 | |
| Diluted weighted average common shares and common share equivalents outstanding | | | 49,923,930 | | | | 49,854,174 | | | | 47,330,182 | |
The accompanying notes are an integral part of these financial statements.
114
TABLE OF CONTENTS
Gramercy Capital Corp.
Consolidated Statements of Stockholders’ Equity and Non-controlling Interests
(Amounts in thousands, except share data)
| | | | | | | | | | | | | | | | | | | | |
| |
Common Stock | | Series A
Preferred
Stock | | Additional
Paid-In-
Capital | | Accumulated
Other
Comprehensive
Income (Loss) | | Retained
Earnings/
(Accumulated
Deficit) | | Total
Gramercy
Capital
Corp | | Non-controlling
interest | | Total | | Comprehensive
Income (loss) |
| | | Shares | | Par Value |
| Balance at December 31, 2007 | | | 34,850,577 | | | $ | 34 | | | $ | 111,205 | | | $ | 685,958 | | | $ | (65,658 | ) | | $ | 17,196 | | | $ | 748,735 | | | $ | — | | | $ | 748,735 | |
| Net income | | | | | | | | | | | | | | | | | | | | | | | 59,303 | | | | 59,303 | | | | 384 | | | | 59,687 | | | $ | 59,303 | |
| Change in net unrealized loss on derivative instruments | | | | | | | | | | | | | | | | | | | (85,350 | ) | | | | | | | (85,350 | ) | | | | | | | (85,350 | ) | | | (85,350 | ) |
| Reclassification adjustments from cash flow hedges included in net income | | | | | | | | | | | | | | | | | | | (10,320 | ) | | | | | | | (10,320 | ) | | | | | | | (10,320 | ) | | | (10,320 | ) |
| Reclassification adjustments of net unrealized loss on securities previously available for sale | | | | | | | | | | | | | | | | | | | 589 | | | | | | | | 589 | | | | | | | | 589 | | | | 589 | |
| Issuance of common stock in connection with American Financial Realty Trust acquisition | | | 16,280,396 | | | | 16 | | | | | | | | 389,793 | | | | | | | | | | | | 389,809 | | | | | | | | 389,809 | | | | | |
| Issuance of stock – stock purchase plan | | | 10,905 | | | | | | | | | | | | 61 | | | | | | | | | | | | 61 | | | | | | | | 61 | | | | | |
| Acquisition of common stock in connection with recapture agreement with SL Green | | | (1,900,000 | ) | | | (2 | ) | | | | | | | | | | | | | | | | | | | (2 | ) | | | | | | | (2 | ) | | | | |
| Proceeds from stock options exercised | | | 85,545 | | | | 1 | | | | | | | | 1,305 | | | | | | | | | | | | 1,306 | | | | | | | | 1,306 | | | | | |
| Stock based compensation – fair value | | | — | | | | | | | | | | | | 3,214 | | | | | | | | | | | | 3,214 | | | | | | | | 3,214 | | | | | |
| Deferred compensation plan, net | | | 524,820 | | | | 1 | | | | | | | | (2,348 | ) | | | | | | | | | | | (2,347 | ) | | | | | | | (2,347 | ) | | | — | |
| Dividends declared on common stock | | | | | | | | | | | | | | | | | | | | | | | (65,933 | ) | | | (65,933 | ) | | | | | | | (65,933 | ) | | | — | |
| Dividends declared on preferred stock | | | | | | | | | | | | | | | | | | | | | | | (9,344 | ) | | | (9,344 | ) | | | | | | | (9,344 | ) | | | — | |
| Non-controlling interest assumed in connection with American Financial Realty Trust acquisition | | | | | | | | | | | | | | | | | | | | | | | | | | | — | | | | 2,328 | | | | 2,328 | | | | | |
| Balance at December 31, 2008 | | | 49,852,243 | | | | 50 | | | | 111,205 | | | | 1,077,983 | | | | (160,739 | ) | | | 1,222 | | | | 1,029,721 | | | | 2,712 | | | | 1,032,433 | | | $ | (35,778 | ) |
| Net loss | | | | | | | | | | | | | | | | | | | | | | | (519,629 | ) | | | (519,629 | ) | | | (770 | ) | | | (520,399 | ) | | $ | (519,629 | ) |
| Change in net unrealized loss on derivative instruments | | | | | | | | | | | | | | | | | | | 63,621 | | | | | | | | 63,621 | | | | | | | | 63,621 | | | | 63,621 | |
| Reclassification of adjustments of net unrealized loss on securities previously available for sale | | | | | | | | | | | | | | | | | | | 1,080 | | | | | | | | 1,080 | | | | | | | | 1,080 | | | | 1,080 | |
| Issuance of stock – stock purchase plan | | | 44,523 | | | | | | | | | | | | 27 | | | | | | | | | | | | 27 | | | | | | | | 27 | | | | | |
| Stock based compensation – fair value | | | (12,266 | ) | | | | | | | | | | | 937 | | | | | | | | | | | | 937 | | | | | | | | 937 | | | | | |
| Dividends accrued on preferred stock | | | | | | | | | | | | | | | | | | | | | | | (9,414 | ) | | | (9,414 | ) | | | | | | | (9,414 | ) | | | | |
| Contributions from non-controlling interests | | | | | | | | | | | | | | | | | | | | | | | | | | | — | | | | 7,227 | | | | 7,227 | | | | | |
| Distributions to non-controlling interests | | | | | | | | | | | | | | | (163 | ) | | | | | | | | | | | (163 | ) | | | (7,831 | ) | | | (7,994 | ) | | | | |
| Balance at December 31, 2009 | | | 49,884,500 | | | | 50 | | | | 111,205 | | | | 1,078,784 | | | | (96,038 | ) | | | (527,821 | ) | | | 566,180 | | | | 1,338 | | | | 567,518 | | | $ | (454,928 | ) |
| Net loss | | | | | | | | | | | | | | | | | | | | | | | (973,688 | ) | | | (973,688 | ) | | | 145 | | | | (973,543 | ) | | $ | (973,688 | ) |
| Change in net unrealized loss on derivative instruments | | | | | | | | | | | | | | | | | | | (70,603 | ) | | | | | | | (70,603 | ) | | | | | | | (70,603 | ) | | | (70,603 | ) |
| Reclassification of adjustments of net unrealized loss on securities previously available for sale | | | | | | | | | | | | | | | | | | | 5,856 | | | | | | | | 5,856 | | | | | | | | 5,856 | | | | 5,856 | |
| Issuance of stock – stock purchase plan | | | 25,211 | | | | | | | | | | | | 26 | | | | | | | | | | | | 26 | | | | | | | | 26 | | | | | |
| Stock based compensation – fair value | | | 74,848 | | | | | | | | | | | | 1,068 | | | | | | | | | | | | 1,068 | | | | | | | | 1,068 | | | | | |
| Acquisition of non-controlling interest | | | | | | | | | | | | | | | (1,680 | ) | | | | | | | | | | | (1,680 | ) | | | (580 | ) | | | (2,260 | ) | | | | |
| Tender of Series A Preferred Stock | | | | | | | | | | | (25,970 | ) | | | | | | | | | | | 13,713 | | | | (12,257 | ) | | | | | | | (12,257 | ) | | | | |
| Dividends accrued on preferred stock | | | | | | | | | | | | | | | | | | | | | | | (8,798 | ) | | | (8,798 | ) | | | | | | | (8,798 | ) | | | | |
| Balance at December 31, 2010 | | | 49,984,559 | | | $ | 50 | | | $ | 85,235 | | | $ | 1,078,198 | | | $ | (160,785 | ) | | $ | (1,496,594 | ) | | $ | (493,896 | ) | | $ | 903 | | | $ | (492,993 | ) | | $ | (1,038,435 | ) |
115
TABLE OF CONTENTS
Gramercy Capital Corp.
Consolidated Statements of Cash Flows
(Amounts in thousands)
| | | | | | |
| | Year ended December 31, |
| | | 2010 | | 2009 | | 2008 |
Operating Activities
| | | | | | | | | | | | |
| Net income (loss) | | $ | (973,543 | ) | | $ | (520,399 | ) | | $ | 59,688 | |
Adjustments to net cash provided by operating activities:
| | | | | | | | | | | | |
| Depreciation and amortization | | | 114,485 | | | | 123,451 | | | | 83,858 | |
| Amortization of leasehold interests | | | (2,727 | ) | | | (2,860 | ) | | | — | |
| Amortization of acquired leases to rental revenue | | | (68,507 | ) | | | (80,666 | ) | | | (44,734 | ) |
| Amortization of deferred costs | | | 7,732 | | | | 11,580 | | | | 10,392 | |
| Amortization of discount and other fees | | | (28,140 | ) | | | (24,030 | ) | | | (31,223 | ) |
| Payment of capitalized tenant leasing costs | | | (2,939 | ) | | | (2,161 | ) | | | (1,204 | ) |
| Straight-line rent adjustment | | | 26,289 | | | | 24,641 | | | | 14,553 | |
| Non-cash impairment charges | | | 963,497 | | | | 194,286 | | | | — | |
| Non-cash impairment charges with related party | | | 9,759 | | | | — | | | | — | |
| Net gain on sale of properties and lease terminations | | | (2,737 | ) | | | (5,180 | ) | | | — | |
| Impairment on business acquisition, net | | | 2,722 | | | | — | | | | — | |
| Net realized gain on loans | | | 1,483 | | | | — | | | | — | |
| Equity in net loss of joint ventures | | | (6,865 | ) | | | (8,130 | ) | | | (7,782 | ) |
| Gain on extinguishment of debt | | | (19,443 | ) | | | (119,305 | ) | | | (77,234 | ) |
| Amortization of stock compensation | | | 1,094 | | | | 961 | | | | 866 | |
| Provision for loan losses | | | 84,392 | | | | 517,784 | | | | 97,853 | |
| Unrealized gain on derivative instruments | | | — | | | | (916 | ) | | | (10,320 | ) |
| Net realized gain on sale of joint venture investment | | | — | | | | (6,317 | ) | | | — | |
| Net realized loss on sale of joint venture investment to a related party | | | 27,292 | | | | — | | | | — | |
Changes in operating assets and liabilities:
| | | | | | | | | | | | |
| Restricted cash | | | 15,942 | | | | 8,836 | | | | 51,421 | |
| Tenant and other receivables | | | 4,576 | | | | (12,075 | ) | | | 1,419 | |
| Accrued interest | | | 37 | | | | (10,064 | ) | | | 549 | |
| Other assets | | | 1,517 | | | | 8,143 | | | | 27,917 | |
| Management and incentive fees payable | | | — | | | | (847 | ) | | | (4,638 | ) |
| Accounts payable, accrued expenses and other liabilities | | | 1,909 | | | | (31,819 | ) | | | (12,267 | ) |
| Deferred revenue | | | (40,994 | ) | | | 22,047 | | | | 12,641 | |
| Net cash provided by operating activities | | | 116,831 | | | | 86,960 | | | | 171,755 | |
Investing Activities
| | | | | | | | | | | | |
| Transaction costs of business combination | | | — | | | | — | | | | (108,199 | ) |
| Cash consideration paid for business combination, net of cash acquired of $155,356 | | | — | | | | — | | | | (586,900 | ) |
| Capital expenditures and leasehold costs | | | (19,084 | ) | | | — | | | | (13,724 | ) |
| Payment for acquisitions of real estate investments | | | (4,550 | ) | | | — | | | | — | |
| Proceeds from sale of joint venture investment | | | — | | | | (10,450 | ) | | | — | |
| Proceeds from sale of joint venture investment to a related party | | | 64,203 | | | | — | | | | — | |
| Deferred investment costs | | | — | | | | (651 | ) | | | (2,297 | ) |
| Proceeds from sale of real estate | | | 37,709 | | | | 172,895 | | | | 138,750 | |
| Proceeds from sale of real estate to a related party | | | 16,765 | | | | — | | | | — | |
| New investment originations and funded commitments | | | (121,447 | ) | | | (55,374 | ) | | | (355,854 | ) |
| Principal collections on investments | | | 221,975 | | | | 89,106 | | | | 456,438 | |
| Proceeds from loan syndications | | | 25,617 | | | | 52,926 | | | | 105,421 | |
| Investment in commercial real estate | | | — | | | | — | | | | (1,828 | ) |
116
TABLE OF CONTENTS
Gramercy Capital Corp.
Consolidated Statements of Cash Flows
(Amounts in thousands)
| | | | | | |
| | Year ended December 31, |
| | | 2010 | | 2009 | | 2008 |
| Investment in commercial mortgage-backed securities | | | (63,562 | ) | | | (119,122 | ) | | | (72,196 | ) |
| Investment in joint venture | | | (3,168 | ) | | | (3,237 | ) | | | (2,324 | ) |
| Change in accrued interest income | | | (11 | ) | | | (32 | ) | | | 80 | |
| Purchase of marketable investments | | | 2 | | | | (7 | ) | | | (5,362 | ) |
| Sale of marketable investments | | | 6,139 | | | | 6,606 | | | | 4,989 | |
| Change in restricted cash from investing activities | | | (5,881 | ) | | | (1,539 | ) | | | (47,566 | ) |
| Net cash provided by (used by) investing activities | | | 154,707 | | | | 131,121 | | | | (490,572 | ) |
Financing Activities
| | | | | | | | | | | | |
| Distribution to non-controlling interests | | | — | | | | (7,995 | ) | | | — | |
| Proceeds from hedge termination | | | — | | | | (4,452 | ) | | | — | |
| Proceeds from repurchase facilities | | | — | | | | 9,500 | | | | 45,039 | |
| Repayments of repurchase facilities | | | (85 | ) | | | (76,243 | ) | | | (149,339 | ) |
| Purchase of interest rate caps | | | (3,162 | ) | | | — | | | | — | |
| Proceeds of unsecured credit facility | | | — | | | | — | | | | 172,301 | |
| Repayment of unsecured credit facility | | | — | | | | (45,000 | ) | | | — | |
| (Repurchase) issuance of collateralized debt obligations | | | (19,557 | ) | | | — | | | | (50,066 | ) |
| Payment for exchange of junior subordinate note | | | (5,000 | ) | | | — | | | | — | |
| Repayment of mortgage notes | | | (43,529 | ) | | | (111,559 | ) | | | (801,913 | ) |
| Proceeds from stock options exercised | | | — | | | | — | | | | 1,305 | |
| Proceeds from acquisition financing | | | — | | | | — | | | | 1,114,743 | |
| Deferred financing costs and other liabilities | | | (6,698 | ) | | | (3,205 | ) | | | (27,031 | ) |
| Net proceeds of sale of common stock | | | — | | | | — | | | | 61 | |
| Cash consideration paid to redeem preferred stock | | | (16,620 | ) | | | — | | | | — | |
| Dividends paid on common stock | | | — | | | | (31 | ) | | | (159,891 | ) |
| Dividends paid on preferred stock | | | — | | | | — | | | | (7,019 | ) |
| Change in restricted cash from financing activities | | | (94,387 | ) | | | 22,421 | | | | 24,329 | |
| Net cash (used by) provided by financing activities | | | (189,038 | ) | | | (216,564 | ) | | | 162,519 | |
| Net (decrease) increase in cash and cash equivalents | | | 82,500 | | | | 1,517 | | | | (156,298 | ) |
| Cash and cash equivalents at beginning of period | | | 138,345 | | | | 136,828 | | | | 293,126 | |
| Cash and cash equivalents at end of period | | $ | 220,845 | | | $ | 138,345 | | | $ | 136,828 | |
Non-cash activity
| | | | | | | | | | | | |
| Deferred gain (loss) and other non-cash activity related to derivatives | | $ | (70,707 | ) | | $ | 68,073 | | | $ | 5,299 | |
| Issuance of common stock for acquisition advisory costs | | $ | — | | | $ | — | | | $ | 11,213 | |
| Issuance of common stock in business combination | | $ | — | | | $ | — | | | $ | 378,672 | |
| Assumptions of mortgage loans in a business combination | | $ | — | | | $ | — | | | $ | 1,316,004 | |
| Mark-to-market of debt assumed in business acquistion | | $ | — | | | $ | — | | | $ | 24,743 | |
| Debt assumed by purchaser in sale of real estate | | $ | — | | | $ | 103,621 | | | $ | — | |
Supplemental cash flow disclosures
| | | | | | | | | | | | |
| Interest paid | | $ | 205,441 | | | $ | 192,229 | | | $ | 249,400 | |
| Income taxes paid | | $ | 591 | | | $ | 513 | | | $ | 433 | |
117
TABLE OF CONTENTS
Gramercy Capital Corp.
Notes To Consolidated Financial Statements
(Amounts in thousands, except share and per share data)
December 31, 2010
1. Business and Organization
Gramercy Capital Corp. (the “Company” or “Gramercy”) is a self-managed, integrated, commercial real estate finance and property management and investment company. The Company was formed in April 2004 and commenced operations upon the completion of its initial public offering in August 2004. On April 1, 2008, the Company completed the acquisition of American Financial Realty Trust (NYSE: AFR) (“American Financial”) in a transaction with a total value of approximately $3,300,000, including the assumption of approximately $1,300,000 of American Financial’s secured debt.
From its inception until April 2009, the Company was externally managed and advised by GKK Manager LLC, or the Manager, a wholly-owned subsidiary of SL Green Realty Corp., or SL Green. On April 24, 2009, the Company completed the internalization of its management through the direct acquisition of the Manager from SL Green. Beginning in May 2009, management and incentive fees payable by the Company to the Manager ceased and the Company added 77 former employees of the Manager to its own staff. For the year ended December 31, 2009, the Company expensed $5,010 for the costs incurred in connection with the Company’s acquisition of the Manager. At December 31, 2010 and 2009, SL Green Operating Partnership, L.P., or SL Green OP, a wholly-owned subsidiary of SL Green, owned approximately 10.7% and 12.5%, respectively, of the outstanding shares of the Company’s common stock.
Substantially all of the Company’s operations are conducted through GKK Capital LP, a Delaware limited partnership, or the Operating Partnership. The Company, as the sole general partner, has responsibility and discretion in the management and control of the Operating Partnership, accordingly, the Company consolidates the accounts of the Operating Partnership. The Company qualified as a real estate investment trust, or REIT, under the Internal Revenue Code of 1986, as amended, or the Internal Revenue Code, commencing with its taxable year ended December 31, 2004 and the Company expects to qualify for the current fiscal year. To maintain the Company’s qualification as a REIT, the Company plans to distribute at least 90% of taxable income, if any. The Operating Partnership conducts its finance business primarily through the use of two private REITs, Gramercy Investment Trust and Gramercy Investment Trust II, and its commercial real estate investment and property management business through various wholly owned entities.
The Company’s commercial real estate finance business, which operates under the name Gramercy Finance, focuses on the direct origination, acquisition and portfolio management of whole loans, bridge loans, subordinate interests in whole loans, mezzanine loans, preferred equity, commercial mortgage-backed securities, or CMBS, and other real estate related securities. The Company’s property management and investment business, which operates under the name Gramercy Realty, historically focused on the acquisition and management of commercial properties net leased primarily to regulated financial institutions and affiliated users throughout the United States. These institutions are, for the most part, deposit-taking commercial banks, thrifts and credit unions, which the Company generally refers to as “banks.” The Company’s portfolio of wholly-owned and jointly-owned bank branches and office buildings is leased to large banks such as Bank of America, N.A., or Bank of America, Wells Fargo Bank National Association (formerly Wachovia Bank, National Association), or Wells Fargo Bank, Regions Financial Corporation, or Regions Financial and Citizens Financial Group, Inc., or Citizens Financial, and to mid-sized and community banks. Neither Gramercy Finance nor Gramercy Realty is a separate legal entity but are divisions of the Company through which the Company’s commercial real estate finance and property investment businesses are conducted.
In March 2010, the Company amended its $240,523 mortgage loan with Goldman Sachs Mortgage Company, or GSMC, Citicorp North America, Inc., or Citicorp, and SL Green, or the Goldman Mortgage Loan, and its $549,713 senior and junior mezzanine loans with KBS Real Estate Investment Trust, Inc., or KBS, GSMC, Citicorp and SL Green, or the Goldman Mezzanine Loans, to extend the maturity date to March 11, 2011. Subsequent to the final maturity of the Goldman Mortgage Loan and the Goldman Mezzanine Loans, the Company entered into a series of short term extensions to provide additional time to exchange and consider proposals for an extension, modification, restructuring or refinancing of the Goldman
118
TABLE OF CONTENTS
Gramercy Capital Corp.
Notes To Consolidated Financial Statements
(Amounts in thousands, except share and per share data)
December 31, 2010
1. Business and Organization – (continued)
Mortgage Loan and the Goldman Mezzanine Loans and to explore an orderly transition of the collateral to the lenders if such discussions fail. On May 9, 2011, the Company announced that the scheduled maturity of the Goldman Mortgage Loan and the Goldman Mezzanine Loans occurred without repayment and without an extension or restructuring of the loans by the lenders.
Notwithstanding the maturity and non-repayment of the loans, the Company maintained active communications with the lenders and in September 2011, the Company entered into a collateral transfer and settlement agreement, or the Settlement Agreement, for an orderly transition of substantially all of Gramercy Realty’s assets to the mezzanine lenders, in exchange for a mutual release of claims among the Company and the mortgage and mezzanine lenders and, subject to certain termination provisions, an arrangement for the Company’s continued management of Gramercy Realty’s assets on behalf of such mezzanine lenders for a fixed fee plus incentive fees. In July 2011, the Company’s Dana portfolio, which consists of 15 properties totaling approximately 3.8 million rentable square feet was transferred to its mortgage lender through a deed in lieu of foreclosure.
Subsequent to the execution of the Settlement Agreement, the business of Gramercy Realty will change from being primarily an owner of commercial properties to being primarily a third party manager of commercial properties. The scale of Gramercy Realty’s revenues are expected to significantly decline as a substantial portion of net revenues from property operations will be replaced with fee revenues of a substantially smaller scale. Additionally, as assets are transferred, the Company’s total assets and liabilities are expected to decline substantially. The transition of Gramercy Realty’s business and the effects of these changes on the Company’s Consolidated Financial Statements are expected to be completed by December 31, 2011.
As of December 31, 2010, Gramercy Finance held loans and other lending investments and CMBS of $2,128,695 net of unamortized fees, discounts, asset sales, unfunded commitments reserves for loan losses and other adjustments, with an average spread to 30-day LIBOR of 400 basis points for its floating rate investments, and an average yield of approximately 8.32% for its fixed rate investments. As of December 31, 2010, Gramercy Finance also held interests in one CTL investment and eight interests in real estate acquired through foreclosures.
As of December 31, 2010, Gramercy Realty’s portfolio consisted of 625 bank branches, 321 office buildings and two land parcels, of which 54 bank branches were owned through unconsolidated joint ventures. Gramercy Realty’s consolidated properties aggregated approximately 25,303 rentable square feet and its unconsolidated properties aggregated approximately 251 rentable square feet. As of December 31, 2010, the occupancy of Gramercy Realty’s consolidated properties was 82.6% and the occupancy for its unconsolidated properties was 100%. Gramercy Realty’s two largest tenants are Bank of America and Wells Fargo Bank and as of December 31, 2010, they represented approximately 41.0% and 15.3%, respectively, of the rental income of the Company’s portfolio and occupied approximately 42.7% and 16.6%, respectively, of Gramercy Realty’s total rentable square feet.
Gramercy Realty typically and historically entered into long-term net leases with its financial institution tenants. As of December 31, 2010, the weighted average remaining term of Gramercy Realty’s leases was 8.5 years and approximately 70.6% of its base revenue was derived from net leases.
The Company relies on the credit and equity markets to finance and grow its business. Despite signs of improvement in 2010 and to date in 2011, market conditions remained difficult for the Company with limited, if any, availability of new debt or equity capital. The Company’s stock price remained low and the Company currently has limited, if any, availability to the public or private equity capital markets. In this environment, the Company has sought to raise capital or maintain liquidity through other means, such as modifying debt arrangements, selling assets and aggressively managing our loan portfolio to encourage repayments as well as
119
TABLE OF CONTENTS
Gramercy Capital Corp.
Notes To Consolidated Financial Statements
(Amounts in thousands, except share and per share data)
December 31, 2010
1. Business and Organization – (continued)
reducing capital and overhead expenses, and as a result, the Company has engaged in limited new investment activity, other than reinvestment of available restricted cash within our CDOs. Nevertheless, the Company remains committed to identifying and pursuing strategies and transactions that could preserve or improve cash flows to the Company from its CDOs, increase the Company’s net asset value per share of common stock, improve the Company’s future access to capital or otherwise potentially create value for the Company’s stockholders.
2. Significant Accounting Policies
Reclassification
Certain prior year balances have been reclassified to conform with the current year presentation for assets classified as discontinued operations.
The Company reclassified the unamortized accrued interest payable in connection with the January 2009 redemption of the junior subordinated notes of $5,412 from Accounts payable and accrued expenses to Collateralized debt obligations on the Consolidated Balance Sheet. Also, the Company reclassified the Consolidated Balance Sheet at December 31, 2010 and 2009 to conform with the reporting requirements for variable interest entities.
Principles of Consolidation
The consolidated financial statements include the Company’s accounts and those of the Company’s subsidiaries which are wholly-owned or controlled by the Company, or entities which are variable interest entities (“VIE”) in which the Company is the primary beneficiary. The primary beneficiary is the party that absorbs a majority of the VIE’s anticipated losses and/or a majority of the expected returns. The Company has evaluated its investments for potential classification as variable interests by evaluating the sufficiency of entity’s equity investment at risk to absorb losses, and determined that the Company is the primary beneficiary for one variable interest entity and has included the accounts of this entity in the consolidated financial statements.
Entities which the Company does not control and entities which are VIE’s, but where the Company is not the primary beneficiary, are accounted for under the equity method. All significant intercompany balances and transactions have been eliminated.
Variable Interest Entities
The following is a summary of the Company’s involvement with VIEs as of December 31, 2010:
| | | | | | | | |
| | Company carrying
value – assets | | Company carrying
value – liabilities | | Face value of assets held by the VIE | | Face value of liabilities issued by the VIE |
Consolidated VIEs
| | | | | | | | | | | | | | | | |
| Collateralized debt obligations | | $ | 2,387,513 | | | $ | 2,851,912 | | | $ | 3,103,990 | | | $ | 3,063,802 | |
Unconsolidated VIEs
| | | | | | | | | | | | | | | | |
| CMBS-controlling class | | $ | — | (1) | | $ | — | | | $ | 633,654 | | | $ | 633,654 | |
| (1) | CMBS are assets held by the collateralized debt obligations classified on the Consolidated Balance Sheets as an Asset of Consolidated VIEs. |
120
TABLE OF CONTENTS
Gramercy Capital Corp.
Notes To Consolidated Financial Statements
(Amounts in thousands, except share and per share data)
December 31, 2010
2. Significant Accounting Policies – (continued)
The following is a summary of the Company’s involvement with VIEs as of December 31, 2009:
| | | | | | | | |
| | Company carrying
value – assets | | Company carrying
value – liabilities | | Face value of
assets held by the VIE | | Face value of liabilities issued by the VIE |
Consolidated VIEs
| | | | | | | | | | | | | | | | |
| Total real estate investments, net | | $ | 43,159 | | | $ | 41,934 | | | $ | 43,159 | | | $ | 41,934 | |
| Collateralized debt obligations | | | 2,563,139 | | | | 2,810,506 | | | | 3,083,873 | | | | 3,101,953 | |
| | | $ | 2,606,298 | | | $ | 2,852,440 | | | $ | 3,127,032 | | | $ | 3,143,887 | |
Unconsolidated VIEs
| | | | | | | | | | | | | | | | |
| CMBS-controlling class | | $ | 28,968 | (1) | | $ | — | | | $ | 921,654 | | | $ | 921,654 | |
| (1) | CMBS are assets held by the collateralized debt obligations classified on the Consolidated Balance Sheets as an Asset of Consolidated VIEs. |
Consolidated VIEs
As of December 31, 2010, the Consolidated Balance Sheet includes $2,387,513 of assets and $2,851,912 of liabilities related to four consolidated VIEs. Due to the non-recourse nature of these VIEs, and other factors discussed below, the Company’s net exposure to loss from investments in these entities is $0.
Collateralized Debt Obligations
The Company currently consolidates three collateralized debt obligations, or CDOs, which are VIEs. These CDOs invest in commercial real estate debt instruments, the majority of which the Company originated within the CDOs, and are financed by the debt and equity issued. The Company is named as collateral manager of all three CDOs. As a result of consolidation, the Company’s subordinate debt and equity ownership interests in these CDOs have been eliminated, and the Consolidated Balance Sheets reflect both the assets held and debt issued by these CDOs to third parties. Similarly, the operating results and cash flows include the gross amounts related to the assets and liabilities of the CDOs, as opposed to the Company’s net economic interests in these CDOs. Refer to Note 8 for further discussion of fees earned related to the management of the CDOs.
The Company’s interest in the assets held by these CDOs is restricted by the structural provisions of these entities, and the recovery of these assets will be limited by the CDOs’ distribution provisions, which are subject to change due to non-compliance with covenants, which are described further in Note 8. The liabilities of the CDO trusts are non-recourse, and can generally only be satisfied from the respective asset pool of each CDO.
The Company is not obligated to provide any financial support to these CDOs. As of December 31, 2010, the Company has no exposure to loss as a result of the investment in these CDOs. Since the Company is the collateral manager of the three CDOs and can make decisions related to the collateral that would most significantly impact the economic outcome of the CDOs, the Company has concluded that it is the primary beneficiary of the CDOs.
Unconsolidated VIEs
Investment in CMBS
The Company has investments in CMBS, which are considered to be VIEs. These securities were acquired through investment, and are primarily comprised of securities that were originally investment grade securities, and do not represent a securitization or other transfer of the Company’s assets. The Company is not named as the special servicer or collateral manager of these investments, except as discussed further below.
121
TABLE OF CONTENTS
Gramercy Capital Corp.
Notes To Consolidated Financial Statements
(Amounts in thousands, except share and per share data)
December 31, 2010
2. Significant Accounting Policies – (continued)
The Company is not obligated to provide, nor has it provided, any financial support to these entities. The majority of the Company’s securities portfolio, with an aggregate face amount of $1,228,050, is financed by the Company’s CDOs, and the Company’s exposure to loss is therefore limited to its interests in these consolidated entities described above. The Company has not consolidated the aforementioned CMBS investments due to the determination that based on the structural provisions and nature of each investment, the Company does not directly control the activities that most significantly impact the VIEs’ economic performance.
The Company further analyzed its investment in controlling class CMBS to determine if it was the primary beneficiary. At December 31, 2010, the Company owned securities of one controlling non-investment grade CMBS investment, GS Mortgage Securities Trust 2007-GKK1, or the Trust. The carrying value of the investment is $0 at December 31, 2010. The total par amount of CMBS issued by the CMBS trust was $633,654.
The Trust is a resecuritization of $633,654 of CMBS originally rated AA through BB. The Company purchased a portion of the below investment grade securities, totaling approximately $27,300. The Manager is the collateral administrator on the transaction and receives a total fee of 5.5 basis points on the par value of the underlying collateral. The Company has determined that it is the non-transferor sponsor of the Trust. As collateral administrator, the Manager has the right to purchase defaulted securities from the Trust at fair value if very specific triggers have been reached. The Company has no other rights or obligations that could impact the economics of the Trust and therefore has concluded that it is not the primary beneficiary. The Manager can be removed as collateral administrator, for cause only, with the vote of 66 2/3% of the certificate holders. There are no liquidity facilities or financing agreements associated with the Trust. Neither the Company nor the Manager has any on-going financial obligations, including advancing, funding or purchasing collateral in the Trust.
The Company’s maximum exposure to loss as a result of its investment in controlling class CMBS totaled $0, which equals the book value of these investments as of December 31, 2010.
Real Estate and CTL Investments
The Company records acquired real estate and CTL investments at cost. Costs directly related to the acquisition of such investments are capitalized. Certain improvements are capitalized when they are determined to increase the useful life of the building. Depreciation is computed using the straight-line method over the shorter of the estimated useful life of the capitalized item or 40 years for buildings, five to ten years for building equipment and fixtures, and the lesser of the useful life or the remaining lease term for tenant improvements and leasehold interests. Maintenance and repair expenditures are charged to expense as incurred.
In leasing office space, the Company may provide funding to the lessee through a tenant allowance. In accounting for tenant allowances, the Company determines whether the allowance represents funding for the construction of leasehold improvements and evaluates the ownership of such improvements. If the Company is considered the owner of the leasehold improvements, the Company capitalizes the amount of the tenant allowance and depreciates it over the shorter of the useful life of the leasehold improvements or the lease term.
If the tenant allowance represents a payment for a purpose other than funding leasehold improvements, or in the event the Company is not considered the owner of the improvements for accounting purposes, the allowance is considered to be a lease incentive and is recognized over the lease term as a reduction of rental revenue. Factors considered during this evaluation usually include (i) who holds legal title to the improvements, (ii) evidentiary requirements concerning the spending of the tenant allowance, and (iii) other
122
TABLE OF CONTENTS
Gramercy Capital Corp.
Notes To Consolidated Financial Statements
(Amounts in thousands, except share and per share data)
December 31, 2010
2. Significant Accounting Policies – (continued)
controlling rights provided by the lease agreement (e.g. unilateral control of the tenant space during the build-out process). Determination of the accounting for a tenant allowance is made on a case-by-case basis, considering the facts and circumstances of the individual tenant lease.
The Company also reviews the recoverability of the property’s carrying value when circumstances indicate a possible impairment of the value of a property. The review of recoverability is based on an estimate of the future undiscounted cash flows, excluding interest charges, expected to result from the property’s use and eventual disposition. These estimates consider factors such as changes in strategy resulting in an increased or decreased holding period, expected future operating income, market and other applicable trends and residual value, as well as the effects of leasing demand, competition and other factors. If management determines impairment exists due to the inability to recover the carrying value of a property, an impairment loss is recorded to the extent that the carrying value exceeds the estimated fair value of the property for properties to be held and used and for assets held for sale, an impairment loss is recorded to the extent that the carrying value exceeds the fair value less estimated cost to dispose for assets held for sale.
These assessments are recorded as an impairment loss in the Consolidated Statements of Operations in the period the determination is made. The estimated fair value of the asset becomes its new cost basis. For a depreciable long-lived asset, the new cost basis will be depreciated or amortized over the remaining useful life of that asset.
During 2010, the Company recorded impairment charges of $933,884 related to its investments in real estate, including $85,294 of impairments on intangible assets. Impairment charges for properties classified as held for investment were $913,648 and $20,236 has been recorded on properties reclassified as discontinued operations. The Company recorded impairment charges totaling $912,147 in continuing operations during 2010 to reduce the carrying value of 692 properties to the estimated fair value. All of the impaired properties serve as collateral for the Goldman Mezzanine Loans and are part of the Gramercy Realty portfolio. The Company also recorded impairment charges on three leasehold properties totaling $1,501 based on the difference between estimated cash flow shortfalls over the sub-tenants’ lease term. No other real estate assets in the portfolio were determined to be impaired as of December 31, 2010 as a result of the analysis. The estimated fair values for the properties serving as collateral for the Goldman Mezzanine loans were calculated using discounted cash flows based on internally developed models and residual values calculated with capitalization rates utilizing a study completed by a third party property management provider for similar types of buildings. The Company identified several possible future outcomes and applied a probability-weighted approach to estimate the future undiscounted cash flows. The Company determined that, as of December 31, 2010, based on the likelihood of possible outcomes and the probability-weighted undiscounted cash flows, its investments in real estate were impaired.
During 2009, the Company recorded impairment charges of $43,440 related to its investments in real estate. Impairment charges for properties classified as held for investment were $18,932 and $24,507 has been recorded on properties reclassified as discontinued operations. The Company recorded impairment charges totaling $18,870 in continuing operations during 2009 to reduce the carrying value of the properties to their estimated fair value. The Company also recorded impairment charges on one leasehold property totaling $62 based on the difference between estimated cash flow shortfalls over the sub-tenant’s lease term. The estimated fair values for the properties were calculated using discounted cash flows based on internally developed models and residual values calculated with capitalization rates.
During 2008, the Company recorded no impairment charges related to its investments in real estate.
The assessment as to whether a real estate investment is impaired is highly subjective. The calculations involve management’s best estimate of the holding period, market comparables, future occupancy levels, rental
123
TABLE OF CONTENTS
Gramercy Capital Corp.
Notes To Consolidated Financial Statements
(Amounts in thousands, except share and per share data)
December 31, 2010
2. Significant Accounting Policies – (continued)
rates, capitalization rates, lease-up periods and capital requirements for each property. A change in any one or more of these factors could materially impact whether a property is impaired as of any given valuation date.
The Company allocates the purchase price of real estate to land, building and intangibles, such as the value of above- and below-market leases and origination costs associated with the leases in-place at the acquisition date.
Leasehold Interests
Leasehold interest liabilities are recorded based on the difference between management’s estimate of the cash flows expected to be paid and earned from the subleases over the non-cancelable lease terms and any payments received in consideration for assuming the leasehold interests. Factors used in determining the net present value of cash flows include contractual rental amounts and amounts due under the corresponding operating lease assumed. Amounts allocated to leasehold interests, based on their respective fair values, are amortized on a straight-line basis over the remaining lease term.
Investments in Unconsolidated Joint Ventures
The Company accounts for its investments in unconsolidated joint ventures under the equity method of accounting since it exercises significant influence, but does not unilaterally control the entities, and is not considered to be the primary beneficiary. In the joint ventures, the rights of the other investors are protective and participating. Unless the Company is determined to be the primary beneficiary, these rights preclude it from consolidating the investments. The investments are recorded initially at cost as an investment in unconsolidated joint ventures, and subsequently are adjusted for equity in net income (loss) and cash contributions and distributions. Any difference between the carrying amount of the investments on the Company’s balance sheet and the underlying equity in net assets is evaluated for impairment at each reporting period. None of the joint venture debt is recourse to the Company. As of December 31, 2010 and 2009, the Company had investments of $3,650 and $108,465 in unconsolidated joint ventures, respectively.
Cash and Cash Equivalents
The Company considers all highly liquid investments with maturities of three months or less when purchased to be cash equivalents.
Restricted Cash
Restricted cash at December 31, 2010 consists of $114,179 on deposit with the trustee of the Company’s collateralized debt obligations, or CDOs. The remaining balance consists of $52,451 held as collateral for letters of credit, $1,975 of interest reserves held on behalf of borrowers and $78,088, which includes $1,296 related to assets held for sale, which represents amounts escrowed pursuant to mortgage agreements securing the Company’s real estate investments and CTL investments for insurance, taxes, repairs and maintenance, tenant improvements, interest, and debt service and amounts held as collateral under security and pledge agreements relating to leasehold interests.
Assets Held for Sale
Real Estate and CTL Investments Held for Sale
Real estate investments or CTL investments to be disposed of are reported at the lower of carrying amount or estimated fair value, less cost to sell. Once an asset is classified as held for sale, depreciation expense is no longer recorded and current and prior periods are reclassified as ‘discontinued operations.’ As of December 31, 2010 and 2009, the Company had real estate investments held for sale of $28,660 and $841, respectively. The Company recorded impairment charges of $20,236, $24,507 and $0, during the years ended December 31, 2010, 2009 and 2008, respectively, related to real estate investments classified as held-for-sale.
124
TABLE OF CONTENTS
Gramercy Capital Corp.
Notes To Consolidated Financial Statements
(Amounts in thousands, except share and per share data)
December 31, 2010
2. Significant Accounting Policies – (continued)
None of the properties that serve as collateral for the Goldman Mortgage and Goldman Mezzanine Loans met the criteria to be classified as held for sale as of December 31, 2010. These properties do not meet the criteria to be classified as held for sale as they are expected to be disposed of other than by sale. Accordingly, the assets and liabilities of these properties are included in the Consolidated Balance Sheets as of December 31, 2010 and 2009 and their results of operations are presented as part of continuing operations in the Consolidated Statements of Operations for all periods presented. The assets and liabilities of these properties will be removed from the Consolidated Balance Sheet and the results of operations will be reclassified to discontinued operations in the Consolidated Statements of Operations upon the ultimate disposition of each property.
Loans and Other Lending Investments Held For Sale
Loans held for investment are intended to be held to maturity and, accordingly, are carried at cost, net of unamortized loan origination fees, discounts, repayments, sales of partial interests in loans, and unfunded commitments unless such loan or investment is deemed to be impaired. Loans held for sale are carried at the lower of cost or market value using available market information obtained through consultation with dealers or other originators of such investments.
As of December 31, 2010 and 2009, the Company had no loans and other lending investments designated as held-for-sale. The Company recorded impairment charges of $2,000, $138,570 and $0, related to the mark-to-market of the loans designated as held-for-sale during the years ended December 31, 2010, 2009 and 2008, respectively.
Gain on Settlement of Debt
A gain on settlement of debt is recorded when the carrying amount of the liability settled exceeds the fair value of the assets transferred to the lender or special servicer in accordance with GAAP. For the year ended December 31, 2010, the Company did not recognize any gain on settlement of debt and the Company has not transferred any properties to the lender in satisfaction of the mortgage obligation. During the year ended December 31, 2010, the Company recorded $946 of legal and professional fees related to the restructuring of the Goldman Mortgage Loan and the Goldman Mezzanine Loans in the Consolidated Statements of Operations.
Commercial Mortgage-Backed Securities
The Company designates its CMBS investments on the date of acquisition of the investment. Held to maturity investments are stated at cost plus any premiums or discounts which are amortized through the Consolidated Statements of Operations using the level yield method. CMBS securities that the Company does not hold for the purpose of selling in the near-term but may dispose of prior to maturity, are designated as available-for-sale and are carried at estimated fair value with the net unrealized gains or losses recorded as a component of accumulated other comprehensive income (loss) in stockholders’ equity. Unrealized losses that are, in the judgment of management, an other-than-temporary impairment are bifurcated into (i) the amount related to credit losses and (ii) the amount related to all other factors. The portion of the other-than-temporary impairment related to credit losses is computed by comparing the amortized cost of the investment to the present value of cash flows expected to be collected, discounted at the investment’s current yield, and is charged against earnings on the consolidated statement of operations. The portion of the other-than-temporary impairment related to all other factors is recognized as a component of other comprehensive loss on the Consolidated Balance Sheet. The determination of an other-than-temporary impairment is a subjective process, and different judgments and assumptions could affect the timing of loss realization.
On a quarterly basis, when significant changes in estimated cash flows from the cash flows previously estimated occur due to actual prepayment and credit loss experience, and the present value of the revised cash
125
TABLE OF CONTENTS
Gramercy Capital Corp.
Notes To Consolidated Financial Statements
(Amounts in thousands, except share and per share data)
December 31, 2010
2. Significant Accounting Policies – (continued)
flow is less than the present value previously estimated, an other-than-temporary impairment is deemed to have occurred. The security is written down to fair value with the resulting charge against earnings and a new cost basis is established.
The Company calculates a revised yield based on the current amortized cost of the investment (including any other-than-temporary impairments recognized to date) and the revised yield is then applied prospectively to recognize interest income. In January 2009, the FASB clarified the guidance for impairment by removing the requirement to place exclusive reliance on market participants’ assumptions about future cash flows when evaluating an asset for other-than-temporary impairment. The standard now requires that assumptions about future cash flows consider reasonable management judgment about the probability that the holder of an asset will be unable to collect all amounts due. As of December 31, 2010, 2009 and 2008, the Company recognized other-than-temporary impairments of $37,453, $12,511 and $0, respectively, due to an adverse change in expected cash flows related to credit losses for 14 and five CMBS investments, respectively, which are recorded in impairment on loans held for sale and CMBS in the Company’s Consolidated Statement of Operations.
The Company determines the fair value of CMBS based on the types of securities in which the Company has invested. For liquid, investment-grade securities, the Company consults with dealers of such securities to periodically obtain updated market pricing for the same or similar instruments. For non-investment grade securities, the Company actively monitors the performance of the underlying properties and loans and updates the Company’s pricing model to reflect changes in projected cash flows. The value of the securities is derived by applying discount rates to such cash flows based on current market yields. The yields employed are obtained from the Company’s own experience in the market, advice from dealers when available, and/or information obtained in consultation with other investors in similar instruments. Because fair value estimates, when available, may vary to some degree, the Company must make certain judgments and assumptions about the appropriate price to use to calculate the fair values for financial reporting purposes. Different judgments and assumptions could result in materially different presentations of value.
During the year ended December 31, 2010, the Company sold nine CMBS investments due to credit events for a realized loss of $294. During the year ended December 31, 2009, the Company did not sell any CMBS investments.
Pledged Government Securities
The Company maintains a portfolio of treasury securities that are pledged to provide principal and interest payments for mortgage debt previously collateralized by properties in its real estate portfolio. The Company does not intend to sell the securities and believes it is more likely than not that it will realize the full amortized cost basis of the securities over their remaining life. These securities had a carrying value of $92,918, a fair value of $96,729 and unrealized gains of $3,811 at December 31, 2010, and have maturities that extend through November 2013.
Tenant and Other Receivables
Tenant and other receivables are primarily derived from the rental income that each tenant pays in accordance with the terms of its lease, which is recorded on a straight-line basis over the initial term of the lease. Since many leases provide for rental increases at specified intervals, straight-line basis accounting requires the Company to record a receivable, and include in revenues, unbilled rent receivables that will only be received if the tenant makes all rent payments required through the expiration of the initial term of the lease. Tenant and other receivables also include receivables related to tenant reimbursements for common area maintenance expenses and certain other recoverable expenses that are recognized as revenue in the period in which the related expenses are incurred.
126
TABLE OF CONTENTS
Gramercy Capital Corp.
Notes To Consolidated Financial Statements
(Amounts in thousands, except share and per share data)
December 31, 2010
2. Significant Accounting Policies – (continued)
Tenant and other receivables are recorded net of the allowances for doubtful accounts, which as of December 31, 2010 and December 31, 2009, were $5,440 and $8,172, respectively. The Company continually reviews receivables related to rent, tenant reimbursements and unbilled rent receivables and determines collectability by taking into consideration the tenant’s payment history, the financial condition of the tenant, business conditions in the industry in which the tenant operates and economic conditions in the area in which the property is located. In the event that the collectability of a receivable is in doubt, the Company increases the allowance for doubtful accounts or records a direct write-off of the receivable in the Consolidated Statements of Income.
Intangible Assets
The Company follows the purchase method of accounting for business combinations. The Company allocates the purchase price of acquired properties to tangible and identifiable intangible assets acquired based on their respective fair values. Tangible assets include land, buildings and improvements on an as-if vacant basis. The Company utilizes various estimates, processes and information to determine the as-if vacant property value. Estimates of value are made using customary methods, including data from appraisals, comparable sales, discounted cash flow analyses and other methods. Identifiable intangible assets include amounts allocated to acquired leases for above- and below-market lease rates and the value of in-place leases.
Above-market and below-market lease values for properties acquired are recorded based on the present value (using an interest rate which reflects the risks associated with the leases acquired) of the difference between the contractual amount to be paid pursuant to each in-place lease and management’s estimate of the fair market lease rate for each such in-place lease, measured over a period equal to the remaining non-cancelable term of the lease. The capitalized above-market lease values are amortized as a reduction of rental income over the remaining non-cancelable terms of the respective leases. The capitalized below-market lease values are amortized as an increase to rental income over the initial term of the respective leases. If a tenant vacates its space prior to the contractual termination of the lease and no rental payments are being made on the lease, any unamortized balance of the related intangible will be written off.
The aggregate value of intangible assets related to in-place leases is primarily the difference between the property valued with existing in-place leases adjusted to market rental rates and the property valued as-if vacant. Factors considered by management in its analysis of the in-place lease intangibles include an estimate of carrying costs during the expected lease-up period for each property taking into account current market conditions and costs to execute similar leases. In estimating carrying costs, management includes real estate taxes, insurance and other operating expenses and estimates of lost rentals at market rates during the anticipated lease-up period, which is expected to average six months. Management also estimates costs to execute similar leases including leasing commissions, legal and other related expenses.
The value of in-place leases is amortized to expense over the initial term of the respective leases, which range primarily from one to 20 years. In no event does the amortization period for intangible assets exceed the remaining depreciable life of the building. If a tenant terminates its lease, the unamortized portion of the in-place lease value is charged to expense.
In making estimates of fair values for purposes of allocating purchase price, management utilizes a number of sources, including independent appraisals that may be obtained in connection with the acquisition or financing of the respective property and other market data. Management also considers information obtained about each property as a result of its pre-acquisition due diligence, as well as subsequent marketing and leasing activities, in estimating the fair value of the tangible and intangible assets acquired and intangible liabilities assumed.
127
TABLE OF CONTENTS
Gramercy Capital Corp.
Notes To Consolidated Financial Statements
(Amounts in thousands, except share and per share data)
December 31, 2010
2. Significant Accounting Policies – (continued)
Intangible assets and acquired lease obligations consist of the following:
| | | | |
| | December 31, 2010 | | December 31,
2009 |
Intangible assets:
| | | | | | | | |
| In-place leases, net of accumulated amortization of $114,383 and $70,363 | | $ | 248,021 | | | $ | 363,655 | |
| Above-market leases, net of accumulated amortization of $33,136 and $22,601 | | | 67,732 | | | | 86,823 | |
| Amounts related to assets held for sale, net of accumulated amortization of $0 and $6 | | | — | | | | (42 | ) |
| Total intangible assets | | $ | 315,753 | | | $ | 450,436 | |
Intangible liabilities:
| | | | | | | | |
| Below-market leases, net of accumulated amortization of $223,282 and $144,261 | | $ | 693,148 | | | $ | 770,839 | |
| Amounts related to assets held for sale, net of accumulated amortization of $0 and $8 | | | — | | | | (58 | ) |
| Total intangible liabilities | | $ | 693,148 | | | $ | 770,781 | |
The following table provides the weighted-average amortization period as of December 31, 2010 for intangible assets and liabilities and the projected amortization expense for the next five years.
| | | | | | | | | | | | |
| | Weighted-
Average
Amortization
Period | | 2011 | | 2012 | | 2013 | | 2014 | | 2015 |
| In-Place Leases | | | 13.4 | | | $ | 27,011 | | | $ | 24,854 | | | $ | 23,469 | | | $ | 22,415 | | | $ | 21,022 | |
| Total to be included in Depreciation and Amortization Expense | | | | | | $ | 27,011 | | | $ | 24,854 | | | $ | 23,469 | | | $ | 22,415 | | | $ | 21,022 | |
| Above-Market Lease Assets | | | 14.1 | | | $ | (7,208 | ) | | $ | (6,708 | ) | | $ | (6,319 | ) | | $ | (5,374 | ) | | $ | (4,977 | ) |
| Below-Market Lease Liabilities | | | 13.9 | | | | 68,332 | | | | 65,143 | | | | 62,983 | | | | 62,075 | | | | 61,547 | |
| Total to be included in Rental Revenue | | | | | | $ | 61,124 | | | $ | 58,435 | | | $ | 56,664 | | | $ | 56,701 | | | $ | 56,570 | |
During 2010, the Company recorded impairment charges of $76,083 and $9,211 related to in-place lease and above-market lease asset intangibles, respectively. The Company recorded impairment charges to reduce the carrying value of assets, serving as collateral for the Goldman Mezzanine Loans, to estimated fair value.
Deferred Costs
Deferred costs include deferred financing costs that represent commitment fees, legal and other third party costs associated with obtaining commitments for financing which result in a closing of such financing. These costs are amortized over the terms of the respective agreements and the amortization is reflected as interest expense. Unamortized deferred financing costs are expensed when the associated debt is refinanced or repaid before maturity. Costs incurred in seeking financing transactions that do not close are expensed in the
128
TABLE OF CONTENTS
Gramercy Capital Corp.
Notes To Consolidated Financial Statements
(Amounts in thousands, except share and per share data)
December 31, 2010
2. Significant Accounting Policies – (continued)
period in which it is determined that the financing will not close. Deferred costs also consist of fees and direct costs incurred to originate new investments and are amortized using the effective yield method over the related term of the investment.
The Company has deferred certain expenditures related to the leasing of certain properties. Direct costs of leasing including internally capitalized payroll costs associated with leasing activities are deferred and amortized over the terms of the underlying leases.
Other Assets
The Company makes payments for certain expenses such as insurance and property taxes in advance of the period in which it receives the benefit. These payments are classified as other assets and amortized over the respective period of benefit relating to the contractual arrangement. The Company also escrows deposits related to pending acquisitions and financing arrangements, as required by a seller or lender, respectively. Costs prepaid in connection with securing financing for a property are reclassified into deferred financing costs at the time the transaction is completed.
Asset Retirement Obligation
Accounting for asset retirement obligations, refers to a legal obligation to perform an asset retirement activity in which the timing and (or) method of settlement are conditional on a future event that may or may not be within the control of the entity. The obligation to perform the asset retirement activity is unconditional even though uncertainty exists about the timing and (or) method of settlement. Thus, the timing and (or) method of settlement may be conditional on a future event. Accordingly, an entity is required to recognize a liability for the fair value of a conditional asset retirement obligation if the fair value of the liability can be reasonably estimated. The fair value of a liability for the conditional asset retirement obligation is recognized when incurred — generally upon acquisition, construction, or development and (or) through the normal operation of the asset.
The Company assessed the cost associated with its legal obligation to remediate asbestos in its properties known to contain asbestos and recorded the present value of the asset retirement obligation. As of December 31, 2010 and December 31, 2009 the Company has recorded a liability of approximately $3,686 and $3,498, respectively. The Company recorded an expense of $188, $175 and $181 for the years ended December 31, 2010, 2009, and 2008, respectively.
Valuation of Financial Instruments
ASC 820-10, “Fair Value Measurements and Disclosures,” among other things, establishes a hierarchical disclosure framework associated with the level of pricing observability utilized in measuring financial instruments at fair value. Considerable judgment is necessary to interpret market data and develop estimated fair values. Accordingly, fair values are not necessarily indicative of the amounts the Company could realize on disposition of the financial instruments. Financial instruments with readily available active quoted prices or for which fair value can be measured from actively quoted prices generally will have a higher degree of pricing observability and will require a lesser degree of judgment to be utilized in measuring fair value. Conversely, financial instruments rarely traded or not quoted will generally have less, or no, pricing observability and will require a higher degree of judgment to be utilized in measuring fair value. Pricing observability is generally affected by such items as the type of financial instrument, whether the financial instrument is new to the market and not yet established, the characteristics specific to the transaction and overall market conditions. The use of different market assumptions and/or estimation methodologies may have a material effect on estimated fair value amounts.
Fair value is defined as the price that would be received to sell an asset or paid to transfer a liability in an orderly transaction between market participants at the measurement date, or an exit price. The level of
129
TABLE OF CONTENTS
Gramercy Capital Corp.
Notes To Consolidated Financial Statements
(Amounts in thousands, except share and per share data)
December 31, 2010
2. Significant Accounting Policies – (continued)
pricing observability generally correlates to the degree of judgment utilized in measuring the fair value of financial instruments. The less judgment utilized in measuring fair value financial instruments such as with readily available active quoted prices or for which fair value can be measured from actively quoted prices in active markets generally have more pricing observability. Conversely, financial instruments rarely traded or not quoted have less observability and are measured at fair value using valuation models that require more judgment. Impacted by a number of factors, pricing observability is generally affected by such items as the type of financial instrument, whether the financial instrument is new to the market and not yet established, the characteristics specific to the transaction and overall market conditions.
The three broad levels defined are as follows:
Level I — This level is comprised of financial instruments that have quoted prices that are available in active markets for identical assets or liabilities. The type of financial instruments included in this category are highly liquid instruments with quoted prices.
Level II — This level is comprised of financial instruments that have pricing inputs other than quoted prices in active markets that are either directly or indirectly observable. The nature of these financial instruments includes instruments for which quoted prices are available but traded less frequently and instruments that are fair valued using other financial instruments, the parameters of which can be directly observed.
Level III — This level is comprised of financial instruments that have little to no pricing observability as of the reported date. These financial instruments do not have active markets and are measured using management’s best estimate of fair value, where the inputs into the determination of fair value require significant management judgment and assumptions. Instruments that are generally included in this category are derivatives, whole loans, subordinate interests in whole loans and mezzanine loans.
For a further discussion regarding the measurement of financial instruments see Note 14, “Fair Value of Financial Instruments.”
Revenue Recognition
Real Estate and CTL Investments
Rental income from leases is recognized on a straight-line basis regardless of when payments are contractually due. Certain lease agreements also contain provisions that require tenants to reimburse the Company for real estate taxes, common area maintenance costs and the amortized cost of capital expenditures with interest. Such amounts are included in both revenues and operating expenses when the Company is the primary obligor for these expenses and assumes the risks and rewards of a principal under these arrangements. Under leases where the tenant pays these expenses directly, such amounts are not included in revenues or expenses.
Deferred revenue represents rental revenue and management fees received prior to the date earned. Deferred revenue also includes rental payments received in excess of rental revenues recognized as a result of straight-line basis accounting.
Other income includes fees paid by tenants to terminate their leases, which are recognized when fees due are determinable, no further actions or services are required to be performed by the Company, and collectability is reasonably assured. In the event of early termination, the unrecoverable net book values of the assets or liabilities related to the terminated lease are recognized as depreciation and amortization expense in the period of termination.
The Company recognizes sales of real estate properties only upon closing. Payments received from purchasers prior to closing are recorded as deposits. Profit on real estate sold is recognized using the full
130
TABLE OF CONTENTS
Gramercy Capital Corp.
Notes To Consolidated Financial Statements
(Amounts in thousands, except share and per share data)
December 31, 2010
2. Significant Accounting Policies – (continued)
accrual method upon closing when the collectability of the sale price is reasonably assured and the Company is not obligated to perform significant activities after the sale. Profit may be deferred in whole or part until the sale meets the requirements of profit recognition on sale of real estate.
Finance Investments
Interest income on debt investments, which includes loan and CMBS investments, are recognized over the life of the investments using the effective interest method and recognized on the accrual basis. Fees received in connection with loan commitments are deferred until the loan is funded and are then recognized over the term of the loan using the effective interest method.
Anticipated exit fees, whose collection is expected, are also recognized over the term of the loan as an adjustment to yield. Fees on commitments that expire unused are recognized at expiration. Fees received in exchange for the credit enhancement of another lender, either subordinate or senior to the Company, in the form of a guarantee are recognized over the term of that guarantee using the straight-line method.
Income recognition is generally suspended for debt investments at the earlier of the date at which payments become 90 days past due or when, in the opinion of management, a full recovery of income and principal becomes doubtful. Income recognition is resumed when the loan becomes contractually current and performance is demonstrated to be resumed.
The Company designates loans as non-performing at such time as: (1) the loan becomes 90 days delinquent or (2) the loan has a maturity default. All non-performing loans are placed on non-accrual status and subsequent cash receipts are applied to principal or recognized as income when received. At December 31, 2010, the Company had one second lien loan with a carrying value of $0 and one third lien loan with a carrying value of $0, which were classified as non-performing loans. At December 31, 2009, the Company had three first mortgage loans with a carrying value of $55,122, four mezzanine loans with an aggregate carrying value of $319, one second lien loan with the carrying value of $0 and one third lien loan with a carrying value of $0, which were classified as non-performing loans.
The Company classifies loans as sub-performing if they are not performing in material accordance with their terms, but they do not qualify as non-performing loans and the specific facts and circumstances of these loans may cause them to develop into non-performing loans should certain events occur in the normal passage of time, which the Company considers to be 90 days from the measurement date. At December 31, 2010, one first mortgage loan with a carrying value of $13,222 and two mezzanine loans with an aggregate carrying value of $9,826 were classified as sub-performing. At December 31, 2009, four first mortgage loans with an aggregate carrying value of $160,212 were classified as sub-performing.
For the years ended December 31, 2010, 2009 and 2008, the Company recognized $1,482, $0 and $1,256, respectively, in net gains from the sale of debt investments or commitments.
Reserve for Loan Losses
Specific valuation allowances are established for loan losses on loans in instances where it is deemed probable that the Company may be unable to collect all amounts of principal and interest due according to the contractual terms of the loan. The reserve is increased through the provision for loan losses on the Consolidated Statements of Operations and is decreased by charge-offs when losses are realized through sale, foreclosure, or when significant collection efforts have ceased.
The Company considers the present value of payments expected to be received, observable market prices or the estimated fair value of the collateral (for loans that are dependent on the collateral for repayment), and compares it to the carrying value of the loan. The determination of the estimated fair value is based on the key characteristics of the collateral type, collateral location, quality and prospects of the sponsor, the amount
131
TABLE OF CONTENTS
Gramercy Capital Corp.
Notes To Consolidated Financial Statements
(Amounts in thousands, except share and per share data)
December 31, 2010
2. Significant Accounting Policies – (continued)
and status of any senior debt, and other factors. The Company also includes the evaluation of operating cash flow from the property during the projected holding period, and the estimated sales value of the collateral computed by applying an expected capitalization rate to the stabilized net operating income of the specific property, less selling costs, all of which are discounted at market discount rates. The Company also considers if the loan’s terms have been modified in a troubled debt restructuring. Because the determination of estimated value is based upon projections of future economic events, which are inherently subjective, amounts ultimately realized from loans and investments may differ materially from the carrying value at the balance sheet date.
If, upon completion of the valuation, the estimated fair value of the underlying collateral securing the loan is less than the net carrying value of the loan, an allowance is created with a corresponding charge to the provision for loan losses. The allowance for each loan is maintained at a level the Company believes is adequate to absorb losses. During the year ended December 31, 2010, the Company incurred charge-offs totaling $239,078 relating to realized losses on ten loans. During the year ended December 31, 2009, the Company incurred charge-offs totaling $188,574 relating to realized losses on 16 loans. The Company maintained a reserve for loan losses of $263,516 against 19 separate investments with a carrying value of $438,541 as of December 31, 2010, and a reserve for loan losses of $418,202 against 23 separate investments with a carrying value of $536,445 as of December 31, 2009.
Rent Expense
Rent expense is recognized on a straight-line basis regardless of when payments are due. Accounts payable and accrued expenses in the accompanying consolidated balance sheet as of December 31, 2010 and 2009 includes an accrual for rental expense recognized in excess of amounts due at that time. Rent expense related to leasehold interests is included in property operating expenses, and rent expense related to office rentals is included in management, general and administrative expense.
Stock-Based Compensation Plans
The Company has a stock-based compensation plan, described more fully in Note 15. The Company accounts for this plan using the fair value recognition provisions.
The Company uses the Black-Scholes option-pricing model to estimate the fair value of a stock option award. This model requires inputs such as expected term, expected volatility, and risk-free interest rate. Further, the forfeiture rate also impacts the amount of aggregate compensation cost. These inputs are highly subjective and generally require significant analysis and judgment to develop.
Prior to the termination of the management agreement in April 2009, the Company determined fair value of the stock options granted to employees of the Manager who provided services to the Company, using a mark-to-market model. In April 2009, the Company completed the internalization of management through the direct acquisition of the Manager. Stock option awards were re-valued at the date of the internalization and such value will be amortized over the remaining vesting period of the award for employees that remained with the Manager.
Compensation cost for stock options, if any, is recognized ratably over the vesting period of the award. The Company’s policy is to grant options with an exercise price equal to the quoted closing market price of its stock on the business day preceding the grant date. Awards of stock or restricted stock are expensed as compensation over the benefit period.
The fair value of each stock option granted is estimated on the date of grant for options issued to employees, and quarterly awards to non-employees, using the Black-Scholes option pricing model with the following weighted average assumptions for grants in 2010 and 2009.
132
TABLE OF CONTENTS
Gramercy Capital Corp.
Notes To Consolidated Financial Statements
(Amounts in thousands, except share and per share data)
December 31, 2010
2. Significant Accounting Policies – (continued)
| | | | |
| | 2010 | | 2009 |
| Dividend yield | | | 5.7% | | | | 14.0% | |
| Expected life of option | | | 5.0 years | | | | 5.0 years | |
| Risk free interest rate | | | 2.65% | | | | 1.72% | |
| Expected stock price volatility | | | 75.0% | | | | 90.0% | |
Incentive Distribution (Class B Limited Partner Interest)
Prior to the internalization, the Class B limited partner interests were entitled to receive an incentive return equal to 25% of the amount by which funds from operations, or FFO, plus certain accounting gains (as defined in the partnership agreement of the Company’s Operating Partnership) exceed the product of the Company’s weighted average stockholders equity (as defined in the partnership agreement of the Company’s Operating Partnership) multiplied by 9.5% (divided by four to adjust for quarterly calculations). The Company recorded any distributions on the Class B limited partner interests as an incentive distribution expense in the period when earned and when payment of such amounts became probable and reasonably estimable in accordance with the partnership agreement. These cash distributions reduced the amount of cash available for distribution to the common unit holders in the Company’s Operating Partnership and to the Company’s common stockholders. In April 2009, the Company completed the internalization of its management through the direct acquisition of the Manager from SL Green. Accordingly, beginning in May 2009, management and incentive fees payable by the Company to the Manager ceased and the Class B limited partner interests have been cancelled. No incentive distribution was earned for the years ended December 31, 2010 and 2009. The Company incurred approximately $2,350 with respect to incentive distributions on such Class B limited partner interests for the year ended December 31, 2008.
Derivative Instruments
In the normal course of business, the Company uses a variety of derivative instruments to manage, or hedge, interest rate risk. The Company requires that hedging derivative instruments be effective in reducing the interest rate risk exposure that they are designated to hedge. This effectiveness is essential for qualifying for hedge accounting. Instruments that meet these hedging criteria are formally designated as hedges at the inception of the derivative contract. The Company uses a variety of commonly used derivative products that are considered “plain vanilla” derivatives. These derivatives typically include interest rate swaps, caps, collars and floors. The Company expressly prohibits the use of unconventional derivative instruments and using derivative instruments for trading or speculative purposes. Further, the Company has a policy of only entering into contracts with major financial institutions based upon their credit ratings and other factors.
To determine the fair value of derivative instruments, the Company uses a variety of methods and assumptions that are based on market conditions and risks existing at each balance sheet date. For the majority of financial instruments including most derivatives, long-term investments and long-term debt, standard market conventions and techniques such as discounted cash flow analysis, option-pricing models, replacement cost and termination cost are used to determine fair value. All methods of assessing fair value result in a general approximation of value, and such value may never actually be realized.
In the normal course of business, the Company is exposed to the effect of interest rate changes and limits these risks by following established risk management policies and procedures including the use of derivatives. To address exposure to interest rates, the Company uses derivatives primarily to hedge the cash flow variability caused by interest rate fluctuations of its liabilities. Each of the Company’s CDOs maintains a maximum amount of allowable unhedged interest rate risk. The 2005 CDO permits 20% of the net outstanding principal balance and the 2006 CDO and the 2007 CDO permit 5% of the net outstanding principal balance to be unhedged.
133
TABLE OF CONTENTS
Gramercy Capital Corp.
Notes To Consolidated Financial Statements
(Amounts in thousands, except share and per share data)
December 31, 2010
2. Significant Accounting Policies – (continued)
The Company recognizes all derivatives on the balance sheet at fair value. Derivatives that are not hedges must be adjusted to fair value through income. If a derivative is a hedge, depending on the nature of the hedge, changes in the fair value of the derivative will either be offset against the change in fair value of the hedged asset, liability or firm commitment through earnings, or recognized in other comprehensive income until the hedged item is recognized in earnings. The ineffective portion of a derivative’s change in fair value will be immediately recognized in earnings. Derivative accounting may increase or decrease reported net income and stockholders’ equity prospectively, depending on future levels of LIBOR, swap spreads and other variables affecting the fair values of derivative instruments and hedged items, but will have no effect on cash flows, provided the contract is carried through to full term.
All hedges held by the Company are deemed effective based upon the hedging objectives established by the Company’s corporate policy governing interest rate risk management. The effect of the Company’s derivative instruments on its financial statements is discussed more fully in Note 18.
Income Taxes
The Company elected to be taxed as a REIT, under Sections 856 through 860 of the Internal Revenue Code, beginning with its taxable year ended December 31, 2004. To qualify as a REIT, the Company must meet certain organizational and operational requirements, including a requirement to distribute at least 90% of its ordinary taxable income, if any, to stockholders. As a REIT, the Company generally will not be subject to U.S. federal income tax on taxable income that the Company distributes to its stockholders. If the Company fails to qualify as a REIT in any taxable year, it will then be subject to U.S. federal income taxes on taxable income at regular corporate rates and will not be permitted to qualify for treatment as a REIT for U.S. federal income tax purposes for four years following the year during which qualification is lost unless the Internal Revenue Service grants the Company relief under certain statutory provisions. Such an event could materially adversely affect the Company’s net income and net cash available for distributions to stockholders. However, the Company believes that it will be organized and operate in such a manner as to qualify for treatment as a REIT and the Company intends to operate in the foreseeable future in such a manner so that it will qualify as a REIT for U.S. federal income tax purposes. The Company is subject to certain state and local taxes.
For the years December 31, 2010, 2009 and 2008, the Company recorded $966, $2,495 and $53 of income tax expense, respectively. Tax expense for the years ended December 31, 2010 and 2009 is comprised entirely of state and local taxes. Included in tax expense for the year ended December 31, 2009 is an accrual for state income taxes on the gain of extinguishment of debt of $119,305. Under federal tax law, the Company is allowed to defer this gain until 2014; however not all states follow this federal rule.
Earnings Per Share
The Company presents both basic and diluted earnings per share, or EPS. Basic EPS excludes dilution and is computed by dividing net income available to common stockholders by the weighted average number of common shares outstanding during the period. Diluted EPS reflects the potential dilution that could occur if securities or other contracts to issue common stock were exercised or converted into common stock, as long as their inclusion would not be anti-dilutive.
Use of Estimates
The preparation of financial statements in conformity with GAAP requires management to make estimates and assumptions that affect the amounts reported in the financial statements and accompanying notes. Actual results could differ from those estimates.
134
TABLE OF CONTENTS
Gramercy Capital Corp.
Notes To Consolidated Financial Statements
(Amounts in thousands, except share and per share data)
December 31, 2010
2. Significant Accounting Policies – (continued)
Concentrations of Credit Risk
Financial instruments that potentially subject the Company to concentrations of credit risk consist primarily of cash investments, debt investments and accounts receivable. The Company places its cash investments in excess of insured amounts with high quality financial institutions. The Company performs ongoing analysis of credit risk concentrations in its loan and other lending investment portfolio by evaluating exposure to various markets, underlying property types, investment structure, term, sponsors, tenants and other credit metrics.
Four investments accounted for approximately 24.2% of the total carrying value of the Company’s debt investments as of December 31, 2010 compared to four investments which accounted for approximately 20.8% of the total carrying value of the Company’s debt investments as of December 31, 2009. Seven investments accounted for approximately 17.2% of the revenue earned on the Company’s debt investments for the year ended December 31, 2010, compared to six investments which accounted for approximately 16.7% of the revenue earned on the Company’s debt investments for the year ended December 31, 2009 and six investments which accounted for approximately 17.9% of the revenue earned on the Company’s debt investments for the year ended December 31, 2008. The largest sponsor accounted for approximately 10.7% and 9.5% of the total carrying value of the Company’s debt investments as of December 31, 2010 and 2009, respectively. The largest sponsor accounted for approximately 5.8% of the revenue earned on the Company’s debt investments for the year ended December 31, 2010, compared to approximately 5.9% and 4.7% of the revenue earned on the Company’s debt investments for the years ended December 31, 2009 and 2008, respectively.
Additionally, two tenants, Bank of America and Wells Fargo Bank accounted for approximately 41.0% and 15.3% of the Company’s rental revenue for the year ended December 31, 2010, respectively.
Recently Issued Accounting Pronouncements
In April 2009, the FASB issued guidance that requires fair value disclosures to be included for interim reporting periods. The Company has adopted this new accounting standard effective April 1, 2009. The Company has made the appropriate disclosures in the interim financial statements during 2009.
In April 2009, the FASB issued guidance on other-than-temporary-impairments that amends the impairment guidance relating to certain debt securities and will require a company to assess the likelihood of selling the security prior to recovering its cost basis. Additionally, when a company meets the criteria for impairment, the impairment charges related to credit losses would be recognized in earnings, while non-credit losses would be reflected in other comprehensive income. The Company adopted this standard effective April 1, 2009. Adoption of the new guidance did not have a material impact on the Company’s consolidated financial statements.
In April 2009, the FASB issued clarifying guidance on determining when the trading volume and activity for an asset or liability has significantly decreased, which may indicate an inactive market, and on measuring the fair value of an asset or liability in inactive markets. The Company adopted this new accounting standard effective April 1, 2009. Adoption of the new guidance did not have a material impact on the Company’s consolidated financial statements.
In April 2009, the FASB issued guidance that requires that an acquirer to recognize at fair value, at the acquisition date, an asset acquired or a liability assumed in a business combination that arises from a contingency if the acquisition-date fair value of the asset or liability can be determined during the measurement period. The Company adopted this new accounting standard effective January 1, 2009. Adoption of the new guidance did not have a material impact on the consolidated financial statements.
135
TABLE OF CONTENTS
Gramercy Capital Corp.
Notes To Consolidated Financial Statements
(Amounts in thousands, except share and per share data)
December 31, 2010
2. Significant Accounting Policies – (continued)
In May 2009, the FASB issued new guidance that incorporates into authoritative accounting literature certain guidance that already existed within generally accepted auditing standards relative to the reporting of subsequent events, with the requirements concerning recognition and disclosure of subsequent events remaining essentially unchanged. This guidance addresses events which occur after the balance sheet date but before the issuance of financial statements. Under the new guidance, as under previous practice, an entity must record the effects of subsequent events that provide evidence about conditions that existed at the balance sheet date and must disclose but not record the effects of subsequent events which provide evidence about conditions that did not exist at the balance sheet date. This standard added an additional required disclosure relative to the date through which subsequent events have been evaluated and whether that is the date on which the financial statements were issued. The Company adopted this standard effective beginning in April 1, 2009. In February 2010, the FASB issued an Accounting Standards Update (ASU) clarifying the application of this guidance to entities, specifying that if an entity is an SEC filer then it should evaluate subsequent events through the date the financial statements are available to be issued. Additionally the ASU incorporates a definition of an SEC filer and states that an SEC filer is not required to disclose the date through which subsequent events have been evaluated. The Company has applied this update to its financial statements for the period ended December 31, 2010.
In June 2009, the FASB amended the guidance on transfers of financial assets to, among other things, eliminate the qualifying special-purpose entity concept, include a new unit of account definition that must be met for transfers of portions of financial assets to be eligible for sale accounting, clarify and change the derecognition criteria for a transfer to be accounted for as a sale, and require significant additional disclosure. This standard was effective January 1, 2010. The adoption of this guidance did not have a material impact on the Company’s consolidated financial statements.
In June 2009, the FASB issued new guidance which revised the consolidation guidance for variable-interest entities. The modifications include the elimination of the exemption for qualifying special purpose entities, a new approach for determining who should consolidate a variable-interest entity, and changes to when it is necessary to reassess who should consolidate a variable-interest entity. This standard was effective January 1, 2010. The adoption of this guidance did not have a material impact on the Company’s consolidated financial statements, other than presentation on the Consolidated Balance Sheets.
In January 2010, the FASB amended guidance to require a number of additional disclosures regarding fair value measurements. Specifically, the guidance revises two disclosure requirements concerning fair value measurements and clarifies two others. It requires separate presentation of significant transfers into and out of Levels 1 and 2 of the fair value hierarchy and disclosure of the reasons for such transfers. Also, it requires the presentation of purchases, sales, issuances and settlements within Level III on a gross basis rather than on a net basis. The amendments clarify that disclosures should be disaggregated by class of asset or liability and that disclosures about inputs and valuation techniques should be provided for both recurring and non-recurring fair value measurements. The adoption of this guidance did not have a material impact on the Company’s consolidated financial statements.
In March 2010, the FASB issued a clarification of previous guidance that exempts certain credit related features from analysis as potential embedded derivatives subject to bifurcation and separate fair value accounting. This guidance specifies that an embedded credit derivative feature related to the transfer of credit risk that is only in the form of subordination of one financial instrument to another is not subject to bifurcation from a host contract. All other embedded credit derivative features should be analyzed to determine whether their economic characteristics and risks are “clearly and closely related” to the economic characteristics and risks of the host contract and whether bifurcation and separate fair value accounting is required. The adoption of this guidance by the Company on July 1, 2010 had no material effect on the Company’s consolidated financial statements.
136
TABLE OF CONTENTS
Gramercy Capital Corp.
Notes To Consolidated Financial Statements
(Amounts in thousands, except share and per share data)
December 31, 2010
2. Significant Accounting Policies – (continued)
In July 2010, FASB issued guidance which outlines specific disclosures that will be required for the allowance for credit losses and all finance receivables. Finance receivables includes loans, lease receivables and other arrangements with a contractual right to receive money on demand or on fixed or determinable dates that is recognized as an asset on an entity’s statement of financial position. This guidance will require companies to provide disaggregated levels of disclosure by portfolio segment and class to enable users of the financial statement to understand the nature of credit risk, how the risk is analyzed in determining the related allowance for credit losses and changes to the allowance during the reporting period. Required disclosures under this guidance as of the end of a reporting period are effective for the Company’s December 31, 2010 reporting period and disclosures regarding activities during a reporting period are effective for the Company’s March 31, 2011 interim reporting period. In January 2011, the FASB delayed the effective date of the new disclosures about troubled debt restructurings to allow the FASB the time needed to complete its deliberations about on what constitutes a troubled debt restructuring. The effective date of the new disclosures about and the guidance for determining what constitutes a troubled debt restructuring will then be coordinated. The guidance is anticipated to be effective for the Company’s September 30, 2011 reporting period. The Company has applied this update to its financial statements for the period ended December 31, 2010.
In December 2010, the FASB issued guidance on the disclosure of supplementary pro forma information for business combinations. The guidance specifies that if a public entity enters into business combinations that are material on an individual or aggregate basis and presents comparative financial statements, the entity must present pro forma revenue and earnings of the combined entity as though the business combination that occurred during the current period had occurred as of the beginning of the comparable annual period only. The adoption of this guidance for the Company’s annual reporting period ending December 31, 2011 will not have a material impact on the Company’s financial statements.
137
TABLE OF CONTENTS
Gramercy Capital Corp.
Notes To Consolidated Financial Statements
(Amounts in thousands, except share and per share data)
December 31, 2010
3. Loans and Other Lending Investments
The aggregate carrying values, allocated by product type and weighted-average coupons, of the Company’s loan, other lending investments, and CMBS investments as of December 31, 2010 and December 31, 2009, were as follows:
| | | | | | | | | | | | | | | | |
| | Carrying Value(1) | | Allocation by
Investment Type | | Fixed Rate
Average Yield | | Floating Rate Average Spread over LIBOR(2) |
| | | 2010 | | 2009 | | 2010 | | 2009 | | 2010 | | 2009 | | 2010 | | 2009 |
| Whole loans, floating rate | | $ | 659,095 | | | $ | 830,617 | | | | 58.7 | % | | | 60.2 | % | | | — | | | | — | | | | 330 bps | | | | 454 bps | |
| Whole loans, fixed rate | | | 132,268 | | | | 122,846 | | | | 11.8 | % | | | 8.9 | % | | | 7.16 | % | | | 6.89 | % | | | — | | | | — | |
| Subordinate interests in whole loans, floating rate | | | 75,066 | | | | 76,331 | | | | 6.7 | % | | | 5.5 | % | | | — | | | | — | | | | 297 bps | | | | 246 bps | |
| Subordinate interests in whole loans, fixed rate | | | 46,468 | | | | 44,988 | | | | 4.1 | % | | | 3.2 | % | | | 6.01 | % | | | 7.46 | % | | | — | | | | — | |
| Mezzanine loans, floating rate | | | 152,349 | | | | 190,668 | | | | 13.5 | % | | | 13.7 | % | | | — | | | | — | | | | 754 bps | | | | 577 bps | |
| Mezzanine loans, fixed rate | | | 48,828 | | | | 85,898 | | | | 4.3 | % | | | 6.2 | % | | | 12.69 | % | | | 8.08 | % | | | — | | | | — | |
| Preferred equity, floating rate | | | 5,224 | | | | 28,228 | | | | 0.5 | % | | | 2.0 | % | | | — | | | | — | | | | 350 bps | | | | 1,064 bps | |
| Preferred equity, fixed rate | | | 4,230 | | | | 4,256 | | | | 0.4 | % | | | 0.3 | % | | | 7.25 | % | | | 7.23 | % | | | — | | | | — | |
| Subtotal/Weighted average | | | 1,123,528 | | | | 1,383,832 | | | | 100.0 | % | | | 100.0 | % | | | 8.09 | % | | | 7.39 | % | | | 400 bps | | | | 476 bps | |
| CMBS, floating rate | | | 50,798 | | | | 67,876 | | | | 5.1 | % | | | 6.9 | % | | | — | | | | — | | | | 394 bps | | | | 254 bps | |
| CMBS, fixed rate | | | 954,369 | | | | 916,833 | | | | 94.9 | % | | | 93.1 | % | | | 8.37 | % | | | 7.84 | % | | | — | | | | — | |
| Subtotal/Weighted average | | | 1,005,167 | | | | 984,709 | | | | 100.0 | % | | | 100.0 | % | | | 8.37 | % | | | 7.84 | % | | | 394 bps | | | | 254 bps | |
| Total | | $ | 2,128,695 | | | $ | 2,368,541 | | | | 100.0 | % | | | 100.0 | % | | | 8.32 | % | | | 7.74 | % | | | 400 bps | | | | 463 bps | |
| (1) | Loans and other lending investments and CMBS investments are presented net of unamortized fees, discounts, asset sales, unfunded commitments, reserves for loan losses and other adjustments. |
| (2) | Spreads over an index other than 30 day-LIBOR have been adjusted to a LIBOR based equivalent. In some cases, LIBOR is floored, giving rise to higher current effective spreads. |
Whole loans are permanent first mortgage loans with initial terms of up to 15 years. Whole loans are first mortgage liens and senior in interest to subordinate mortgage interest in whole loans, mezzanine loan and preferred equity interest.
Subordinate mortgage interests in whole loans are participation interests in mortgage notes or loans secured by a lien subordinated to a senior interest in the same loan. Subordinate interests in whole loans are subject to greater credit risk with respect to the underlying mortgage collateral than the corresponding senior interest.
Mezzanine loans are senior to the borrower’s equity in, and subordinate to a whole loan and subordinate mortgage interest, on a property. These loans are secured by pledges of ownership interests in entities that directly or indirectly own the real property.
Preferred Equity are investments in entities that directly or indirectly own commercial real estate. Preferred equity is not secured, but holders have priority relative to common equity holders.
138
TABLE OF CONTENTS
Gramercy Capital Corp.
Notes To Consolidated Financial Statements
(Amounts in thousands, except share and per share data)
December 31, 2010
3. Loans and Other Lending Investments – (continued)
Quarterly, the Company evaluates its loans for instances where specific valuation allowances are necessary, as described in Note 2. As a component of the Company’s quarterly policies and procedures for loan valuation and risk assessment, each loan is assigned a risk rating. Individual ratings range from one to six, with one being the lowest risk and six being the highest risk. Each credit risk rating has benchmark guidelines which pertain to debt-service coverage ratios, loan-to-value (“LTV”) ratio, borrower strength, asset quality, and funded cash reserves. Other factors such as guarantees, market strength, remaining loan term and borrower equity are also reviewed and factored into determining the credit risk rating assigned to each loan. Loans with a risk rating of one to three have characteristics of a lower risk loan and such loans are generally expected to perform through maturity. Loans with a risk rating of four to five generally have characteristics of a higher risk loan and may indicate instances of a higher likelihood of a contractual default or expectation of a principal loss. Loans with a risk rating of six are nonperforming and often times have been fully reserved.
A summary of the Company’s loans by loan class as of December 31, 2010 and 2009 are as follows:
| | | | | | | | | | | | |
| | Risk Ratings as of December 31, 2010 |
| | | One to Three | | Four to Six |
| | | Number of
Loans | | Unpaid
Principal
Balance | | Carrying
Value | | Number of
Loans | | Unpaid
Principal
Balance | | Carrying
Value |
| Whole Loans | | | 11 | | | $ | 412,837 | | | $ | 403,265 | | | | 18 | | | $ | 504,229 | | | $ | 388,098 | |
| Subordinate Mortgage Interests(1) | | | 6 | | | | 96,145 | | | | 96,073 | | | | 3 | | | | 85,494 | | | | 25,461 | |
| Mezzanine Loans | | | 2 | | | | 39,979 | | | | 40,342 | | | | 10 | | | | 214,151 | | | | 160,835 | |
| Preferred Equity | | | — | | | | — | | | | — | | | | 2 | | | | 60,668 | | | | 9,454 | |
| Total | | | 19 | | | $ | 548,961 | | | $ | 539,680 | | | | 33 | | | $ | 864,542 | | | $ | 583,848 | |
| (1) | Includes one Interest-Only Strip. |
| | | | | | | | | | | | |
| | Risk Ratings as of December 31, 2009 |
| | | One to Three | | Four to Six |
| | | Number of
Loans | | Unpaid
Principal
Balance | | Carrying
Value | | Number of
Loans | | Unpaid
Principal
Balance | | Carrying
Value |
| Whole Loans | | | 6 | | | $ | 146,326 | | | $ | 134,655 | | | | 26 | | | $ | 979,291 | | | $ | 818,808 | |
| Subordinate Mortgage Interests(1) | | | 6 | | | | 96,067 | | | | 96,054 | | | | 2 | | | | 70,494 | | | | 25,265 | |
| Mezzanine Loans | | | 7 | | | | 146,845 | | | | 140,640 | | | | 13 | | | | 360,361 | | | | 135,926 | |
| Preferred Equity | | | 1 | | | | 48,485 | | | | 28,229 | | | | 1 | | | | 12,214 | | | | 4,255 | |
| Total | | | 20 | | | $ | 437,723 | | | $ | 399,578 | | | | 42 | | | $ | 1,422,360 | | | $ | 984,254 | |
| (1) | Includes one Interest-Only Strip. |
139
TABLE OF CONTENTS
Gramercy Capital Corp.
Notes To Consolidated Financial Statements
(Amounts in thousands, except share and per share data)
December 31, 2010
3. Loans and Other Lending Investments – (continued)
As of December 31, 2010, the Company’s loans and other lending investments, excluding CMBS investments, had the following maturity characteristics:
| | | | | | |
| Year of Maturity | | Number of
Investments
Maturing | | Current
Carrying Value
(In thousands) | | % of Total |
| 2011 | | | 30 | (1) | | $ | 490,302 | | | | 43.6 | % |
| 2012 | | | 11 | | | | 334,260 | | | | 29.8 | % |
| 2013 | | | 2 | | | | 89,003 | | | | 7.9 | % |
| 2014 | | | 2 | | | | 28,968 | | | | 2.6 | % |
| 2015 | | | 3 | | | | 50,821 | | | | 4.5 | % |
| Thereafter | | | 4 | | | | 130,174 | | | | 11.6 | % |
| Total | | | 52 | | | $ | 1,123,528 | | | | 100.0 | % |
| Weighted average maturity | | | | | | | 1.8 years | (2) | | | | |
| (1) | Of the loans maturing in 2011, 13 investments with a carrying value of $243,582 have subsequently been extended, and six investments with a carrying value of $114,480 have subsequently been paid off, of which one investment was paid off at a discount. There are 11 investments with a carrying value of $132,240 which have not yet been extended. |
| (2) | The calculation of weighted-average maturity is based upon the remaining initial term of the investment and does not include option or extension periods or the ability to prepay the investment after a negotiated lock-out period, which may be available to the borrower. |
For the years ended December 31, 2010, 2009 and 2008, the Company’s investment income from loan and other lending investments and CMBS investments, was generated by the following investment types:
| | | | | | | | | | | | |
| | For the year ended
December 31, 2010 | | For the year ended
December 31, 2009 | | For the year ended
December 31, 2008 |
| Investment Type | | Investment Income | | % of Total | | Investment Income | | % of Total | | Investment Income | | % of Total |
| Whole loans | | $ | 55,328 | | | | 33.2 | % | | $ | 74,536 | | | | 40.3 | % | | $ | 121,843 | | | | 47.8 | % |
| Subordinate interest in whole loans | | | 5,826 | | | | 3.5 | % | | | 4,863 | | | | 2.6 | % | | | 9,290 | | | | 3.7 | % |
| Mezz loans | | | 24,306 | | | | 14.6 | % | | | 38,169 | | | | 20.7 | % | | | 66,180 | | | | 26.0 | % |
| Preferred equity | | | 2,692 | | | | 1.6 | % | | | 1,941 | | | | 1.1 | % | | | 1,361 | | | | 0.5 | % |
| CMBS | | | 78,490 | | | | 47.1 | % | | | 65,098 | | | | 35.3 | % | | | 56,147 | | | | 22.0 | % |
| Total | | $ | 166,642 | | | | 100.0 | % | | $ | 184,607 | | | | 100.0 | % | | $ | 254,821 | | | | 100.0 | % |
140
TABLE OF CONTENTS
Gramercy Capital Corp.
Notes To Consolidated Financial Statements
(Amounts in thousands, except share and per share data)
December 31, 2010
3. Loans and Other Lending Investments – (continued)
At December 31, 2010 and 2009, the Company’s loans and other lending investments, excluding CMBS investments, had the following geographic diversification:
| | | | | | | | |
| | December 31, 2010 | | December 31, 2009 |
| Region | | Carrying Value | | % of Total | | Carrying Value | | % of Total |
| Northeast | | $ | 497,030 | | | | 44.2 | % | | $ | 638,937 | | | | 46.2 | % |
| West | | | 277,478 | | | | 24.7 | % | | | 347,531 | | | | 25.1 | % |
| South | | | 119,841 | | | | 10.7 | % | | | 132,961 | | | | 9.6 | % |
| Mid-Atlantic | | | 116,495 | | | | 10.4 | % | | | 127,872 | | | | 9.2 | % |
| Midwest | | | 50,298 | | | | 4.4 | % | | | 22,165 | | | | 1.6 | % |
| Various(1) | | | 32,365 | | | | 2.9 | % | | | 42,406 | | | | 3.1 | % |
| Southwest | | | 30,021 | | | | 2.7 | % | | | 71,960 | | | | 5.2 | % |
| Total | | $ | 1,123,528 | | | | 100.0 | % | | $ | 1,383,832 | | | | 100.0 | % |
| (1) | Includes interest-only strips and at December 31, 2009 included a defeased loan. |
At December 31, 2010 and 2009, the Company’s loans and other lending investments, excluding CMBS investments, by property type are as follows:
| | | | | | | | |
| | December 31, 2010 | | December 31, 2009 |
| Property Type | | Carrying Value | | % of Total | | Carrying Value | | % of Total |
| Office | | $ | 425,773 | | | | 37.9 | % | | $ | 644,720 | | | | 46.6 | % |
| Retail | | | 202,090 | | | | 18.0 | % | | | 107,115 | | | | 7.7 | % |
| Hotel | | | 184,306 | | | | 16.4 | % | | | 220,385 | | | | 15.9 | % |
| Land – Commercial | | | 143,589 | | | | 12.8 | % | | | 167,300 | | | | 12.1 | % |
| Multifamily | | | 54,488 | | | | 4.8 | % | | | 88,975 | | | | 6.4 | % |
| Industrial | | | 47,784 | | | | 4.3 | % | | | 50,842 | | | | 3.7 | % |
| Condo | | | 30,923 | | | | 2.8 | % | | | 53,475 | | | | 3.9 | % |
| Mixed-Use | | | 28,622 | | | | 2.5 | % | | | 24,203 | | | | 1.8 | % |
| Other(1) | | | 5,953 | | | | 0.5 | % | | | 9,621 | | | | 0.7 | % |
| Land – Residential(2) | | | — | | | | — | | | | 17,196 | | | | 1.2 | % |
| Total | | $ | 1,123,528 | | | | 100.0 | % | | $ | 1,383,832 | | | | 100.0 | % |
| (1) | Includes interest-only strips and at December 31, 2009, a defeased loan. |
| (2) | All of the loans secured by residential land are secured by first mortgages or first deeds of trust, except for two loans secured by second-and third-mortgage liens to the same sponsor with an aggregate carrying value of $0. The second and third lien loans are secured by land intended primarily for residential development. These loans were classified as non-performing as of December 31, 2010 and 2009. |
The Company recorded provisions for loan losses of $84,392, $517,784 and $97,853 for the years ended December 31, 2010, 2009 and 2008, respectively. These provisions represent increases in loan loss reserves based on management’s estimates considering delinquencies, loss experience, collateral quality by individual asset or category of asset and modifications that resulted in troubled debt restructurings.
For the year ended December 31, 2010, the Company incurred charge-offs of $239,078 related to realized losses on ten loan investments. During the year ended December 31, 2009, the Company incurred charge-offs of $188,574 related to realized losses on 16 loan investments. During the year ended December 31, 2008, the
141
TABLE OF CONTENTS
Gramercy Capital Corp.
Notes To Consolidated Financial Statements
(Amounts in thousands, except share and per share data)
December 31, 2010
3. Loans and Other Lending Investments – (continued)
Company incurred charge-offs totaling $17,519 related to two defaulted loans the Company foreclosed upon which had a carrying value totaling $31,760, which is included in real estate investments on the Consolidated Balance Sheet, and three additional loans, two of which were sold at a loss and the other was for a negotiated payoff below par.
The interest income on impaired loans during the time within the financial statement period that they were impaired was $42,169, $38,966 and $25,813 for the years ended December 31, 2010, 2009 and 2008 respectively.
Changes in the reserve for possible loan losses were as follows:
| | |
| Reserve for loan losses, December 31, 2007 | | $ | 8,658 | |
| Additional provision for loan losses | | | 97,853 | |
| Charge-offs | | | (17,519 | ) |
| Reserve for loan losses, December 31, 2008 | | | 88,992 | |
| Additional provision for loan losses | | | 517,784 | |
| Charge-offs | | | (188,574 | ) |
| Reserve for loan losses, December 31, 2009 | | | 418,202 | |
| Additional provision for loan losses | | | 84,392 | |
| Charge-offs | | | (239,078 | ) |
| Reserve for loan losses, December 31, 2010 | | $ | 263,516 | |
As of December 31, 2010 and 2009, the Company’s recorded investments in impaired loans were as follows:
| | | | | | | | | | |
| | For the year ended December 31, 2010 |
| | | Unpaid Principal Balance | | Carrying Value | | Allowance for Loan Losses | | Average Recorded Investment(1) | | Investment Income Recognized |
| Whole loans | | $ | 506,211 | | | $ | 382,272 | | | $ | 126,823 | | | $ | 428,618 | | | $ | 23,440 | |
| Subordinate interests in whole loans | | | 50,647 | | | | 5,062 | | | | 45,585 | | | | 3,091 | | | | 38 | |
| Mezzanine loans | | | 156,161 | | | | 94,312 | | | | 39,708 | | | | 96,589 | | | | 9,675 | |
| Preferred equity | | | 60,668 | | | | 9,454 | | | | 51,400 | | | | 30,748 | | | | 2,792 | |
| Total | | $ | 773,687 | | | $ | 491,100 | | | $ | 263,516 | | | $ | 559,046 | | | $ | 35,945 | |
| (1) | Represents the average of the month end balances for the year ended December 31, 2010. |
| | | | | | | | | | |
| | For the year ended December 31, 2009 |
| | | Unpaid Principal Balance | | Carrying Value | | Allowance for Loan Losses | | Average Recorded Investment(1) | | Investment Income Recognized |
| Whole loans | | $ | 606,128 | | | $ | 444,108 | | | $ | 165,905 | | | $ | 578,220 | | | $ | 25,226 | |
| Subordinate interests in whole loans | | | 15,000 | | | | — | | | | 15,000 | | | | — | | | | (1,224 | ) |
| Mezzanine loans | | | 349,647 | | | | 73,792 | | | | 208,897 | | | | 186,728 | | | | 3,018 | |
| Preferred equity | | | 60,699 | | | | 32,484 | | | | 28,400 | | | | 48,441 | | | | 2,982 | |
| Total | | $ | 1,031,474 | | | $ | 550,384 | | | $ | 418,202 | | | $ | 813,389 | | | $ | 30,002 | |
| (1) | Represents the average of the month end balances for the year ended December 31, 2009. |
142
TABLE OF CONTENTS
Gramercy Capital Corp.
Notes To Consolidated Financial Statements
(Amounts in thousands, except share and per share data)
December 31, 2010
3. Loans and Other Lending Investments – (continued)
As of December 31, 2010 and 2009, the Company’s non-performing loans by class are as follows:
| | | | | | | | |
| | As of December 31, 2010 |
| | | Number of Investments | | Carrying value | | Less Than
90 Days
Past Due | | Greater Than 90 Days
Past Due |
| Whole loans | | | — | | | $ | — | | | $ | — | | | $ | — | |
| Subordinate interests in whole loans | | | 1 | | | | — | | | | — | | | | — | |
| Mezzanine loans | | | 1 | | | | — | | | | — | | | | — | |
| Preferred equity | | | — | | | | — | | | | — | | | | — | |
| Total | | | 2 | | | $ | — | | | $ | — | | | $ | — | |
| | | | | | | | |
| | As of December 31, 2009 |
| | | Number of Investments | | Carrying value | | Less Than
90 Days
Past Due | | Greater Than 90 Days
Past Due |
| Whole loans | | | 3 | | | $ | 55,122 | | | $ | — | | | $ | 55,122 | |
| Subordinate interests in whole loans | | | 1 | | | | — | | | | — | | | | — | |
| Mezzanine loans | | | 4 | | | | 319 | | | | — | | | | 319 | |
| Preferred equity | | | — | | | | — | | | | — | | | | — | |
| Total | | | 8 | | | $ | 55,441 | | | $ | — | | | $ | 55,441 | |
At December 31, 2010, the Company does not have any loans contractually past due 90 days or more that are still accruing interest. Also, the Company had no unfunded commitments on modified loans which were considered “troubled debt restructurings.” As of December 31, 2010 and 2009, there were no loans for which the collateral securing the loan was less than the carrying value of the loan for which the Company did not record a provision for loan loss.
The following is a summary of the Company’s CMBS investments at December 31, 2010:
| | | | | | | | | | | | |
| Description | | Number of Securities | | Face Value | | Amortized Cost | | Fair Value | | Gross Unrealized Gain | | Gross Unrealized Loss |
Held to maturity:
| | | | | | | | | | | | | | | | | | | | | | | | |
| Floating rate CMBS | | | 2 | | | $ | 48,500 | | | $ | 47,698 | | | $ | 43,650 | | | $ | — | | | $ | (4,048 | ) |
| Fixed rate CMBS | | | 97 | | | | 1,133,574 | | | | 925,580 | | | | 825,275 | | | | 96,428 | | | | (196,733 | ) |
Available for Sale:
| | | | | | | | | | | | | | | | | | | | | | | | |
| Floating rate CMBS | | | 1 | | | | 5,000 | | | | 3,100 | | | | 3,100 | | | | — | | | | — | |
| Fixed rate CMBS | | | 8 | | | | 43,444 | | | | 26,806 | | | | 28,789 | | | | 1,983 | (1) | | | — | |
| Total | | | 108 | | | $ | 1,230,518 | | | $ | 1,003,184 | | | $ | 900,814 | | | $ | 98,411 | | | $ | (200,781 | ) |
| (1) | Included in Other Comprehensive Income. |
143
TABLE OF CONTENTS
Gramercy Capital Corp.
Notes To Consolidated Financial Statements
(Amounts in thousands, except share and per share data)
December 31, 2010
3. Loans and Other Lending Investments – (continued)
The following is a summary of the Company’s CMBS investments at December 31, 2009:
| | | | | | | | | | | | |
| Description | | Number of Securities | | Face Value | | Amortized Cost | | Fair Value | | Gross Unrealized Gain | | Gross Unrealized Loss |
Held to maturity:
| | | | | | | | | | | | | | | | | | | | | | | | |
| Floating rate CMBS | | | 9 | | | $ | 81,664 | | | $ | 67,876 | | | $ | 42,364 | | | $ | — | | | $ | (25,512 | ) |
| Fixed rate CMBS | | | 90 | | | | 1,096,968 | | | | 916,833 | | | | 514,031 | | | | 30,662 | | | | (433,464 | ) |
| Total | | | 99 | | | $ | 1,178,632 | | | $ | 984,709 | | | $ | 556,395 | | | $ | 30,662 | | | $ | (458,976 | ) |
The following table shows the Company’s fair value unrealized losses, aggregated by investment category and length of time that individual securities have been in a continuous unrealized loss position, at December 31, 2010:
| | | | | | | | | | | | | | | | |
| | | | | | | | | | | | | | | | |
| | Less than 12 Months | | 12 months or More | | Total |
| Description | | Number of
Investments | | Estimated
Fair Value | | Gross
Unrealized
Loss | | Number of
Investments | | Estimated
Fair Value | | Gross
Unrealized
Loss | | Estimated
Fair Value | | Gross
Unrealized
Loss |
| Floating rate CMBS | | | — | | | $ | — | | | $ | — | | | | 2 | | | $ | 43,650 | | | $ | (4,048 | ) | | $ | 43,650 | | | $ | (4,048 | ) |
| Fixed rate CMBS | | | 3 | | | | 11,971 | | | | (649 | ) | | | 56 | | | | 554,551 | | | | (196,084 | ) | | | 566,522 | | | | (196,733 | ) |
| Total temporarily impaired securities | | | 3 | | | $ | 11,971 | | | $ | (649 | ) | | | 58 | | | $ | 598,201 | | | $ | (200,132 | ) | | $ | 610,172 | | | $ | (200,781 | )(1) |
| (1) | All of the CMBS investments in a loss position are classified as Held to Maturity as of December 31, 2010 and there are no unrealized losses in Other Comprehensive Income. |
As of December 31, 2010, the Company’s CMBS investments had the following maturity characteristics:
| | | | | | | | | | |
| Year of Maturity | | Number of Investments Maturing | | Current Carrying Value | | Percent of Total Carrying Value | | Current
Fair Value | | Percent of Total Fair Value |
Held to Maturity:
| | | | | | | | | | | | | | | | | | | | |
| Less than 1 year | | | 2 | | | $ | 47,698 | | | | 4.7 | % | | $ | 43,650 | | | | 4.8 | % |
| 1 – 5 years | | | 11 | | | | 69,742 | | | | 6.9 | % | | | 60,770 | | | | 6.7 | % |
| 5 – 10 years | | | 86 | | | | 855,838 | | | | 85.1 | % | | | 764,505 | | | | 84.9 | % |
| Total Held to Maturity | | | 99 | | | $ | 973,278 | | | | 96.7 | % | | $ | 868,925 | | | | 96.4 | % |
Available for Sale:
| | | | | | | | | | | | | | | | | | | | |
| Less than 1 year | | | — | | | $ | — | | | | 0.0 | % | | $ | — | | | | 0.0 | % |
| 1 – 5 years | | | 2 | | | | 9,265 | | | | 0.9 | % | | | 9,265 | | | | 1.0 | % |
| 5 – 10 years | | | 7 | | | | 22,624 | | | | 2.4 | % | | | 22,624 | | | | 2.6 | % |
| Total Available for Sale | | | 9 | | | | 31,889 | | | | 3.3 | % | | | 31,889 | | | | 3.6 | % |
| Total | | | 108 | | | $ | 1,005,167 | | | | 100.0 | % | | $ | 900,814 | | | | 100.0 | % |
144
TABLE OF CONTENTS
Gramercy Capital Corp.
Notes To Consolidated Financial Statements
(Amounts in thousands, except share and per share data)
December 31, 2010
3. Loans and Other Lending Investments – (continued)
The following is a summary of the underlying credit ratings of the Company’s CMBS investments at December 31, 2010 and 2009 (for split-rated securities, the higher rating was used):
| | | | | | | | |
| | December 31, 2010 | | December 31, 2009 |
| | | Carrying Value | | Percentage | | Carrying Value | | Percentage |
Investment grade:
| | | | | | | | | | | | | | | | |
| AAA | | $ | 51,590 | | | | 5.1 | % | | $ | 111,902 | | | | 11.4 | % |
| AA+ | | | — | | | | — | | | | 13,701 | | | | 1.4 | % |
| AA | | | 76,484 | | | | 7.6 | % | | | 139,449 | | | | 14.2 | % |
| AA- | | | 67,717 | | | | 6.7 | % | | | 25,967 | | | | 2.6 | % |
| A+ | | | 2,103 | | | | 0.2 | % | | | 84,214 | | | | 8.6 | % |
| A | | | 57,314 | | | | 5.7 | % | | | 219,563 | | | | 22.4 | % |
| A- | | | — | | | | — | | | | 29,441 | | | | 3.0 | % |
| BBB+ | | | 29,775 | | | | 3.0 | % | | | — | | | | — | |
| BBB | | | 57,663 | | | | 5.7 | % | | | 79,231 | | | | 8.0 | % |
| BBB- | | | 166,843 | | | | 16.6 | % | | | 93,626 | | | | 9.5 | % |
| Total investment grade | | | 509,489 | | | | 50.6 | % | | | 797,094 | | | | 81.1 | % |
Non-investment grade:
| | | | | | | | | | | | | | | | |
| BB+ | | | 69,733 | | | | 6.9 | % | | | 55,606 | | | | 5.6 | % |
| BB | | | 97,261 | | | | 9.7 | % | | | 100,631 | | | | 10.2 | % |
| BB- | | | 138,680 | | | | 13.8 | % | | | — | | | | — | |
| B+ | | | 153,970 | | | | 15.3 | % | | | — | | | | — | |
| B | | | 5,160 | | | | 0.6 | % | | | 1,477 | | | | 0.1 | % |
| B- | | | 30,613 | | | | 3.1 | % | | | 932 | | | | 0.1 | % |
| CCC+ | | | 261 | | | | 0.0 | % | | | — | | | | — | |
| CCC | | | — | | | | — | | | | 12,164 | | | | 1.2 | % |
| CCC- | | | — | | | | — | | | | 6,374 | | | | 0.6 | % |
| C | | | — | | | | — | | | | 4,644 | | | | 0.5 | % |
| D | | | — | | | | — | | | | 5,787 | | | | 0.6 | % |
| Total non-investment grade | | | 495,678 | | | | 49.4 | % | | | 187,615 | | | | 18.9 | % |
| Total | | $ | 1,005,167 | | | | 100.0 | % | | $ | 984,709 | | | | 100.0 | % |
The Company evaluates CMBS investments to determine if there has been an other-than-temporary impairment. The Company’s unrealized losses are primarily the result of market factors other than credit impairment which is generally indicated by significant change in estimated cash flows from the cash flows previously estimated based on actual prepayments and credit loss experience. Unrealized losses can be caused by changes in interest rates, changes in credit spreads, realized losses in the underlying collateral, or general market conditions. The Company evaluates CMBS investments on a quarterly basis and has determined that there has been an adverse change in expected cash flows related to credit losses for 14 CMBS investments. Therefore, the Company recognized an other-than-temporary impairment of $37,453 during the year ended December 31, 2010 that was recorded as an impairment in the Company’s Consolidated Statement of Operations. This other-than-temporary impairment relates entirely to expected credit losses which has been recorded through earnings. To determine the component of the other-than-temporary impairment related to expected credit losses, the Company compares the amortized cost basis of each other-than-temporarily impaired security to the present value of its revised expected cash flows, discounted using its pre-impairment
145
TABLE OF CONTENTS
Gramercy Capital Corp.
Notes To Consolidated Financial Statements
(Amounts in thousands, except share and per share data)
December 31, 2010
3. Loans and Other Lending Investments – (continued)
yield. Significant judgment of management is required in this analysis that includes, but is not limited to, (i) assumptions regarding the collectability of principal and interest, net of related expenses, on the underlying loans, and (ii) current subordination levels at both the individual loans which serve as collateral under the Company’s securities and at the securities themselves.
The Company’s assessment of cash flows, which is supplemented by third-party research reports and dialogue with market participants, combined with the Company’s ability and intent to hold its CMBS investments to maturity, at which point the Company expects to recover book value, is the basis for its conclusion the remainder of these investments are not other-than-temporarily impaired, despite the difference between the carrying value the and fair value. The Company has considered the rating downgrades in its evaluation and apart from the two bonds noted above, it believes that the book value of its CMBS investments is recoverable at December 31, 2010. The Company attributes the current difference between carrying value and market value to current market conditions including a decrease demand in structured financial products and commercial real estate. The Company has concluded that, excluding its securities classified as available-for-sale with a carrying value of $31,889 as of December 31, 2010, it does not intend to sell these securities and it is not more likely than not it will be required to sell the securities before recovering the amortized costs basis.
In connection with a preferred equity investment, which was repaid in October 2006, the Company has guaranteed a portion of the outstanding principal balance of the first mortgage loan that is a financial obligation of the entity in which the Company was previously a preferred equity investor invested in the event of a borrower default under such loan. The loan matures in 2012. This guarantee in the event of a borrower default under such loan is considered to be an off-balance-sheet arrangement and will survive until the repayment of the first mortgage loan. As compensation, the Company received a credit enhancement fee of $125 from the borrower, which is recognized as the fair value of the guarantee and has been recorded on its Consolidated Balance Sheet as a liability. The liability is amortized over the life of the guarantee using the straight-line method and corresponding fee income will be recorded. The Company’s maximum exposure under this guarantee is approximately $1,366 as of December 31, 2010. Under the terms of the guarantee, the investment sponsor is required to reimburse the Company for the entire amount paid under the guarantee until the guarantee expires.
4. Acquisitions
GKK Manager, LLC
On April 24, 2009, in connection with the Company’s internalization of the Manager, the Company and the Operating Partnership entered into a securities transfer agreement with SL Green OP, GKK Manager Member Corp. (“Manager Corp”) and SL Green, pursuant to which (i) SL Green OP and Manager Corp agreed to transfer to the Operating Partnership, membership interests in the Manager and (ii) SL Green OP agreed to transfer to the Operating Partnership its Class B limited partner interests in the Operating Partnership, in exchange for certain de minimis cash consideration. The securities transfer agreement contains standard representations, warranties, covenants and indemnities. For the year ended December 31, 2009, the Company expensed costs incurred in connection with the internalization of the Manager of $5,010 which is included under management, general and administrative expense in the Consolidated Statement of Operations.
Whiteface Lodge
In April 2008, the Company acquired via a deed in lieu of foreclosure, a 40% interest in the Whiteface Lodge, a hotel and condominium located in Lake Placid, New York. In July 2010, the Company acquired the remaining 60% joint venture interest in the Whiteface Lodge for $4,550. The Company acquired the remaining interest to effect the business plan of the investment. The Whiteface Lodge is a fractional residential condominium complex. The Company acquired 521 unsold fractional residential condominium
146
TABLE OF CONTENTS
Gramercy Capital Corp.
Notes To Consolidated Financial Statements
(Amounts in thousands, except share and per share data)
December 31, 2010
4. Acquisitions – (continued)
units of a total of 1,104 units and the related amenities for use by the unit owners and guests. The Company accounted for the acquisition of the remaining joint venture interest utilizing the purchase method of accounting and recorded a net impairment of $2,722. The Company calculated the fair value of the property using a discounted cash flow model for the hotel operations and sales of the fractional residential condominium units.
Pro Forma
The following table summarizes, on an unaudited pro forma basis, the Company’s combined results of operations for the years ended December 31, 2010 and 2009 as though the acquisition of GKK Manager and the Whiteface Lodge were completed on January 1, 2009. The supplemental pro forma operating data is not necessarily indicative of what the actual results of operations would have been assuming the transaction had been completed as set forth above, nor do they purport to represent the Company’s results of operations for future periods. In addition, the following supplement pro forma operating data does not present the sale of assets through December 31, 2010.
| | | | |
| | 2010 | | 2009 |
| Pro forma revenues | | $ | 608,847 | | | $ | 632,719 | |
| Pro forma net income (loss) available to common stockholders | | $ | (967,407 | ) | | $ | (532,076 | ) |
| Pro forma earnings per common share – basic | | $ | (19.38 | ) | | $ | (10.67 | ) |
| Pro forma earnings per common share – diluted | | $ | (19.38 | ) | | $ | (10.67 | ) |
| Pro forma common shares-basic | | | 49,923,930 | | | | 49,854,174 | |
| Pro forma common share – diluted | | | 49,923,930 | | | | 49,854,174 | |
5. Dispositions and Assets Held for Sale
During the years ended December 31, 2010 and 2009, the Company sold 17 and 56 properties, for net sales proceeds of $54,474 and $172,895, respectively. The sales transactions resulted in gains totaling $2,589 and $5,180 for the years ended December 31, 2010 and 2009, respectively.
The Company separately classifies properties held for sale in the Consolidated Balance Sheets and Consolidated Statements of Operations. In the normal course of business the Company identifies non-strategic assets for sale. Changes in the market may compel the Company to decide to classify a property held for sale or classify a property that was designated as held for sale back to held for investment. During the year ended December 31, 2009, the Company reclassified 69 properties, with a total carrying value of $37,174, previously identified as held for sale to held for investment. Each property was impaired to value it at the lesser of (i) fair value as the date of transfer, or (ii) its carrying value before the asset was classified as held for sale, adjusted for any depreciation expense that would have been recognized had the property been continuously classified as held for investment. The Company recorded an impairment of $8,868 during the year ended December 31, 2009. During the year ended December 31, 2010, the Company did not reclassify any properties previously identified as held for sale to held for investment.
147
TABLE OF CONTENTS
Gramercy Capital Corp.
Notes To Consolidated Financial Statements
(Amounts in thousands, except share and per share data)
December 31, 2010
5. Dispositions and Assets Held for Sale – (continued)
The Company classified two properties as held for sale as of December 31, 2010 and 2009. The following table summarizes information for these properties:
| | | | |
| | December 31, 2010 | | December 31, 2009 |
Assets held for sale:
| | | | | | | | |
Real estate investments, at cost:
| | | | | | | | |
| Land | | $ | 15,142 | | | $ | 279 | |
| Building and improvement | | | 11,612 | | | | 565 | |
| Total real estate investments, at cost | | | 26,754 | | | | 844 | |
| Less: accumulated depreciation | | | (202 | ) | | | (6 | ) |
| Real estate investments held for sale, net | | | 26,552 | | | | 838 | |
| Accrued interest and receivables | | | 398 | | | | (35 | ) |
| Acquired lease assets, net of accumulated amortization | | | — | | | | 42 | |
| Other assets | | | 1,710 | | | | (4 | ) |
| Total assets held for sale | | | 28,660 | | | | 841 | |
Liabilities related to assets held for sale:
| | | | | | | | |
| Accrued expenses | | | 474 | | | | 55 | |
| Deferred revenue | | | 57 | | | | 125 | |
| Below market lease liabilities, net of accumulated amortization | | | — | | | | 58 | |
| Total liabilities related to assets held for sale | | | 531 | | | | 238 | |
| Net assets held for sale | | $ | 28,129 | | | $ | 603 | |
The following operating results of the assets held for sale as of December 31, 2010, and the assets sold during the years ended December 31, 2010, 2009 and 2008 are included in discontinued operations for all periods presented:
| | | | | | |
| | Year Ended December 31, |
| | | 2010 | | 2009 | | 2008 |
Operating Results:
| | | | | | | | | | | | |
| Revenues | | $ | 18,015 | | | $ | 32,089 | | | $ | 40,759 | |
| Operating expenses | | | (21,962 | ) | | | (41,695 | ) | | | (16,885 | ) |
| Marketing, general and administrative | | | (316 | ) | | | (1,020 | ) | | | (1,066 | ) |
| Interest expense | | | (3,546 | ) | | | (6,432 | ) | | | (11,961 | ) |
| Depreciation and amortization | | | (495 | ) | | | (2,561 | ) | | | (5,652 | ) |
| Equity in net income from joint venture | | | 11,004 | | | | 10,486 | | | | 10,214 | |
| Net income (loss) from operations | | | 2,700 | | | | (9,133 | ) | | | 15,409 | |
| Net income (loss) from operations with a related party | | | (9,759 | ) | | | — | | | | — | |
| Income on sale of joint venture interests | | | — | | | | 6,317 | | | | — | |
| Loss on sale of joint venture interests to a related party | | | (27,292 | ) | | | — | | | | — | |
| Net gains from disposals | | | 2,658 | | | | 5,180 | | | | — | |
| Net income (loss) from discontinued operations | | $ | (31,693 | ) | | $ | 2,364 | | | $ | 15,409 | |
Subsequent to December 31, 2010, the Company entered into agreements of sale on five properties totaling approximately $3,654 on properties with a total carrying value of $2,283 as of December 31, 2010, and net loss of $194 for the year the ended December 31, 2010.
Discontinued operations have not been segregated in the Consolidated Statements of Cash Flows.
148
TABLE OF CONTENTS
Gramercy Capital Corp.
Notes To Consolidated Financial Statements
(Amounts in thousands, except share and per share data)
December 31, 2010
6. Investments in Joint Ventures
200 Franklin Square Drive, Somerset, New Jersey
The Company owns a 25% interest in an equity owner and a fee interest in 200 Franklin Square Drive, a 200,000 square foot building located in Somerset, New Jersey which is 100% net leased to Philips Holdings, USA Inc, a wholly-owned subsidiary of Royal Phillips Electronics through December 2021. As of December 31, 2010 and December 31, 2009, the investment has a carrying value of $746 and $997, respectively. The Company recorded its pro rata share of net income of the joint venture of $120, $114 and $119 for the years ended December 31, 2010, 2009 and 2008, respectively.
101 S. Marengo Avenue, Pasadena, California
In November 2005, the Company closed on the purchase of a 50% interest in an office building in Pasadena, CA. The Company also acquired an interest in certain related assets as part of the transaction. The 345,000 square foot office property, which was net leased to Bank of America through September 2015, assuming the exercise of options, and related collateral were acquired for $52,000 plus closing costs, using a non-recourse, $50,000, ten-year fixed-rate first mortgage loan. The Company sold its 50% interest in April 2009 for a gain of $6,317. For the years ended December 31, 2009 and 2008, the Company recorded its pro rata share of net losses of the joint ventures of $474 and $1,306, respectively, within discontinued operations.
2 Herald Square, New York, New York
In April 2007, the Company purchased for $103,200 a 45% Tenant-In-Common, or TIC, interest to acquire the fee interest in a parcel of land located at 2 Herald Square, located along 34th Street in New York, New York. The acquisition was financed with a $86,063 ten-year fixed rate mortgage loan. The property is subject to a long-term ground lease with an unaffiliated third party for a term of 70 years. The remaining TIC interest is owned by a wholly-owned subsidiary of SL Green. The TIC interests are pari-passu. The Company sold its 45% interest in December 2010 for a loss of $11,885. As of December 31, 2009, the investment had a carrying value of $31,567. For the years ended December 31, 2010, 2009 and 2008 the Company recorded its pro rata share of net income of $5,078, $4,987 and $5,228 respectively, within discontinued operations.
885 Third Avenue, New York, New York
In July 2007, the Company purchased for $144,240 an investment in a 45% TIC interest to acquire a 79% fee interest and 21% leasehold interest in the fee position in a parcel of land located at 885 Third Avenue, on which is situated The Lipstick Building. The transaction was financed with a $120,443 ten-year fixed-rate mortgage loan. The property is subject to a 70-year leasehold ground lease with an unaffiliated third party. The remaining TIC interest is owned by a wholly-owned subsidiary of SL Green. The TIC interests are pari-passu. The Company sold its 45% interest in December 2010 for a loss of $15,407. As of December 31, 2009, the investment had a carrying value of $45,695. The Company recorded its pro rata share of net income of $5,926, $5,972 and $6,292 for the years ended December 31, 2010, 2009 and 2008 respectively, within discontinued operations.
Citizens Portfolio
The Company, through its acquisition of American Financial on April 1, 2008, obtained an interest in a joint venture with UBS. The joint venture, as of December 31, 2010, owns and manages 54 bank branches totaling approximately 251,000 square feet. These branches are fully occupied, on a triple-net basis, by Citizens Bank, N.A. and Charter One Bank, N.A., two bank subsidiaries of Citizens Financial Group, Inc. As of December 31, 2010 and December 31, 2009, the investment had a carrying value of $2,904 and $6,386 respectively. The Company recorded its pro rata share of net loss of $2,884, $2,637 and $2,092 for the years ended December 31, 2010, 2009 and 2008, respectively. In September 2011, pursuant to the Settlement Agreement with respect to Gramercy Realty’s $240,523 mortgage loan and Gramercy Realty’s $549,713 senior
149
TABLE OF CONTENTS
Gramercy Capital Corp.
Notes To Consolidated Financial Statements
(Amounts in thousands, except share and per share data)
December 31, 2010
6. Investments in Joint Ventures – (continued)
and junior mezzanine loans, the Citizens Portfolio will be transitioned to the mezzanine lenders, in exchange for a mutual release of claims among the Company and the mortgage and mezzanine lenders and, subject to certain termination provisions, an arrangement for the Company’s continued management of the assets on behalf of the lenders.
Whiteface, Lake Placid, New York
In April 2008, the Company acquired via a deed-in-lieu of foreclosure, a 40% interest in the Whiteface Lodge, a hotel and condominium located in Lake Placid, New York. In July 2010, the company purchased the remaining 60% interest from the joint venture partner. In connection with the acquisition, the Company controls 100% of the joint venture’s interest and has consolidated its accounts. As of December 31, 2009, the joint venture investment had a carrying value of $23,820. The Company recorded its pro rata share of net loss of $1,375, $0 and $459 for the years ended December 31, 2010, 2009 and 2008, respectively.
The condensed combined balance sheets for the Company’s joint ventures at December 31, 2010 and 2009 are as follows:
| | | | |
| | 2010 | | 2009 |
Assets:
| | | | | | | | |
| Real estate assets, net | | $ | 660,412 | | | $ | 718,147 | |
| Other assets | | | 131,605 | | | | 99,284 | |
| Total assets | | $ | 792,017 | | | $ | 817,431 | |
Liabilities and members’ equity:
| | | | | | | | |
| Mortgages payable | | $ | 565,711 | | | $ | 566,978 | |
| Other liabilities | | | 4,925 | | | | 5,972 | |
| Members’ equity | | | 221,381 | | | | 244,480 | |
| Liabilities and members’ equity | | $ | 792,017 | | | $ | 817,430 | |
| Company’s net investment in joint ventures | | $ | 3,650 | | | $ | 108,465 | |
The condensed combined statements of income for the joint ventures for the three years ended December 31, 2010, or partial period for acquisitions or dispositions which closed during these periods, are as follows:
| | | | | | |
| | 2010 | | 2009 | | 2008 |
| Revenues | | $ | 65,628 | | | $ | 71,859 | | | $ | 71,849 | |
| Operating expenses | | | 4,875 | | | | 9,235 | | | | 13,188 | |
| Interest | | | 34,620 | | | | 36,706 | | | | 39,894 | |
| Depreciation | | | 5,494 | | | | 7,430 | | | | 8,377 | |
| Total expenses | | | 44,989 | | | | 53,371 | | | | 61,459 | |
| Net income from operations | | | 20,639 | | | | 18,488 | | | | 10,390 | |
| Net gain on disposals | | | — | | | | 18,720 | | | | 1,889 | |
| Net income | | $ | 20,639 | | | $ | 37,208 | | | $ | 12,279 | |
| Company’s equity in net loss within continuing operations | | $ | (4,139 | ) | | $ | (2,524 | ) | | $ | (2,432 | ) |
| Company’s equity in net income within discontinued operations | | $ | 11,004 | | | $ | 10,959 | | | $ | 10,214 | |
150
TABLE OF CONTENTS
Gramercy Capital Corp.
Notes To Consolidated Financial Statements
(Amounts in thousands, except share and per share data)
December 31, 2010
7. Junior Subordinated Notes
In May 2005, August 2005 and January 2006, the Company completed issuances of $50,000 each in unsecured trust preferred securities through three Delaware Statutory Trusts, or DSTs, Gramercy Capital Trust I, or GCTI, Gramercy Capital Trust II, or GCTII, and Gramercy Capital Trust III, or GCT III, that were also wholly-owned subsidiaries of the Operating Partnership. The securities issued in May 2005 bore interest at a fixed rate of 7.57% for the first ten years ending June 2015 and the securities issued in August 2005 bore interest at a fixed rate of 7.75% for the first ten years ending October 2015. Thereafter, the rates were to float based on the three-month LIBOR plus 300 basis points. The securities issued in January 2006 bore interest at a fixed rate of 7.65% for the first ten years ending January 2016, with an effective rate of 7.43% when giving effect to the swap arrangement previously entered into in contemplation of this financing. Thereafter, the rate was to float based on the three-month LIBOR plus 270 basis points.
In January 2009, the Operating Partnership entered into an exchange agreement with the holders of the securities, pursuant to which the Operating Partnership and the holders agreed to exchange all of the previously issued trust preferred securities for newly issued unsecured junior subordinated notes, or the Junior Notes, in the aggregate principal amount of $150,000. The Junior Notes will mature on June 30, 2035, or the Maturity Date, and will bear (i) a fixed interest rate of 0.50% per annum for the period beginning on January 30, 2009 and ending on January 29, 2012 and (ii) a fixed interest rate of 7.50% per annum for the period commencing on January 30, 2012 through and including the Maturity Date. The Company, at its option, may redeem the Junior Notes in whole at any time, or in part from time to time, at a redemption price equal to 100% of the principal amount of the Junior Notes. The optional redemption of the Junior Notes in part must be made in at least $25,000 increments. The Junior Notes also contained additional covenants restricting, among other things, the Company’s ability to declare or pay any dividends during the calendar year 2009, or make any payment or redeem any debt securities ranked pari passu or junior to the Junior Notes. In connection with the exchange agreement, the final payment on the trust preferred securities for the period October 30, 2008 through January 29, 2009 was revised to be at a reduced interest rate of 0.50% per annum. In October 2009, a subsidiary of the Operating Partnership exchanged $97,500 of the Junior Notes for $97,533 face amount of bonds issued by the Company’s CDOs that the Company had repurchased in the open market. In June 2010, the Company redeemed the remaining $52,500 of junior subordinated notes by transferring an equivalent par value amount of various classes of bonds issued by the Company’s CDOs previously purchased by the Company in the open market, and cash equivalents of $5,000. This redemption eliminates the Company’s junior subordinated notes from its consolidated financial statements, which had an original balance of $150,000.
8. Collateralized Debt Obligations
During 2005, the Company issued approximately $1,000,000 of CDO bonds through two indirect subsidiaries, Gramercy Real Estate CDO 2005-1 Ltd., or the 2005 Issuer, and Gramercy Real Estate CDO 2005-1 LLC, or the 2005 Co-Issuer. At issuance, the CDO consisted of $810,500 of investment grade notes, $84,500 of non-investment grade notes, which were co-issued by the 2005 Issuer and the 2005 Co-Issuer, and $105,000 of preferred shares, which were issued by the 2005 Issuer. The investment grade notes were issued with floating rate coupons with a combined weighted average rate of three-month LIBOR plus 0.49%. The Company incurred approximately $11,957 of costs related to Gramercy Real Estate CDO 2005-1, which are amortized on a level-yield basis over the average life of the CDO.
During 2006, the Company issued approximately $1,000,000 of CDO bonds through two indirect subsidiaries, Gramercy Real Estate CDO 2006-1 Ltd., or the 2006 Issuer, and Gramercy Real Estate CDO 2006-1 LLC, or the 2006 Co-Issuer. At issuance, the CDO consisted of $903,750 of investment grade notes, $38,750 of non-investment grade notes, which were co-issued by the 2006 Issuer and the 2006 Co-Issuer, and $57,500 of preferred shares, which were issued by the 2006 Issuer. The investment grade notes were issued with floating rate coupons with a combined weighted average rate of three-month LIBOR
151
TABLE OF CONTENTS
Gramercy Capital Corp.
Notes To Consolidated Financial Statements
(Amounts in thousands, except share and per share data)
December 31, 2010
8. Collateralized Debt Obligations – (continued)
plus 0.37%. The Company incurred approximately $11,364 of costs related to Gramercy Real Estate CDO 2006-1, which are amortized on a level-yield basis over the average life of the CDO.
In August 2007, the Company issued $1,100,000 of CDO bonds through two indirect subsidiaries, Gramercy Real Estate CDO 2007-1 Ltd., or the 2007 issuer and Gramercy Real Estate CDO 2007-1 LLC, or the 2007 Co-Issuer. At issuance, the CDO consisted of $1,045,550 of investment grade notes, $22,000 of non-investment grade notes, which were co-issued by the 2007 Issuer and the 2007 Co-Issuer, and $32,450 of preferred shares, which were issued by the 2007 Issuer. The investment grade notes were issued with floating rate coupons with a combined weighted average rate of three-month LIBOR plus 0.46%. The Company incurred approximately $16,816 of costs related to Gramercy Real Estate CDO 2007-1, which are amortized on a level-yield basis over the average life of the CDO.
In connection with the closing of the Company’s first CDO in July 2005, pursuant to the collateral management agreement, the Manager agreed to provide certain advisory and administrative services in relation to the collateral debt securities and other eligible investments securing the CDO notes. The collateral management agreement provides for a senior collateral management fee, payable quarterly in accordance with the priority of payments as set forth in the indenture, equal to 0.15% per annum of the net outstanding portfolio balance, and a subordinate collateral management fee, payable quarterly in accordance with the priority of payments as set forth in the indenture, equal to 0.25% per annum of the net outstanding portfolio balance. Net outstanding portfolio balance is the sum of the (i) aggregate principal balance of the collateral debt securities, excluding defaulted securities, (ii) aggregate principal balance of all principal proceeds held as cash and eligible investments in certain accounts, and (iii) with respect to the defaulted securities, the calculation amount of such defaulted securities. The collateral management agreement for the Company’s 2006 CDO provides for a senior collateral management fee, payable quarterly in accordance with the priority of payments as set forth in the indenture, equal to 0.15% per annum of the net outstanding portfolio balance, and a subordinate collateral management fee, payable quarterly in accordance with the priority of payments as set forth in the indenture, equal to 0.25% per annum of the net outstanding portfolio balance. Net outstanding portfolio balance is the sum of the (i) aggregate principal balance of the collateral debt securities, excluding defaulted securities, (ii) aggregate principal balance of all principal proceeds held as cash and eligible investments in certain accounts, and (iii) with respect to the defaulted securities, the calculation amount of such defaulted securities. The collateral management agreement for the Company’s 2007 CDO provides for a senior collateral management fee, payable quarterly in accordance with the priority of payments as set forth in the indenture, equal to (i) 0.05% per annum of the aggregate principal balance of the CMBS securities, (ii) 0.10% per annum of the aggregate principal balance of loans, preferred equity securities, cash and certain defaulted securities, and (iii) a subordinate collateral management fee, payable quarterly in accordance with the priority of payments as set forth in the indenture, equal to 0.15% per annum of the aggregate principal balance of the loans, preferred equity securities, cash and certain defaulted securities.
The Company retained all non-investment grade securities, the preferred shares and the common shares in the Issuer of each CDO. The Issuers and Co-Issuers in each CDO holds assets, consisting primarily of whole loans, subordinate interests in whole loans, mezzanine loans, preferred equity investments and CMBS, which serve as collateral for the CDO. Each CDO may be replenished, pursuant to certain rating agency guidelines relating to credit quality and diversification, with substitute collateral using cash generated by debt investments that are repaid during the reinvestment periods (generally, five years from issuance) of the CDO. Thereafter, the CDO securities will be retired in sequential order from senior-most to junior-most as debt investments are repaid. The financial statements of the Issuer of each CDO are consolidated in the Company’s financial statements. The securities originally rated as investment grade at time of issuance are treated as a secured financing, and are non-recourse to the Company. Proceeds from the sale of the securities originally rated as investment grade in each CDO were used to repay substantially all outstanding debt under the
152
TABLE OF CONTENTS
Gramercy Capital Corp.
Notes To Consolidated Financial Statements
(Amounts in thousands, except share and per share data)
December 31, 2010
8. Collateralized Debt Obligations – (continued)
Company’s repurchase agreements and to fund additional investments. Loans and other investments are owned by the Issuers and the Co-Issuers, serve as collateral for the Company’s CDO securities, and the income generated from these investments is used to fund interest obligations of the Company’s CDO securities and the remaining income, if any, is retained by the Company.
The CDO indentures contain minimum interest coverage and asset overcollateralization covenants that must be satisfied in order for the Company to receive cash flow on the interests retained in its CDOs and to receive the subordinate collateral management fee earned. If some or all of the Company’s CDOs fail these covenants, all cash flows from the applicable CDO other than senior collateral management fees would be diverted to repay principal and interest on the most senior outstanding CDO securities, and the Company may not receive some or all residual payments or the subordinate collateral management fee until the applicable CDO regained compliance with such tests. As of July 2011, the most recent distribution date, the Company’s 2005 and 2006 CDOs were in compliance with their interest coverage and asset overcollateralization covenants; however, the compliance margin was narrow and relatively small declines in collateral performance and credit metrics could cause the CDOs to fall out of compliance. The Company’s 2005 CDO failed its overcollateralization test at the April 2011, January 2011, October 2010, July 2010 and April 2010 distribution dates and its 2007 CDO failed its overcollaterization test at the August 2011, May 2011, February 2011, November 2010, August 2010, May 2010 and February 2010 distribution dates.
During the year ended December 31, 2010, the Company repurchased, at a discount, $39,000 of notes previously issued by two of the Company’s three CDOs. The Company recorded a net gain on the early extinguishment of debt of $19,443 for the year ended December 31, 2010, in connection with the repurchase of notes of such Issuers. The Company did not repurchase any notes during the year ended December 31, 2009. During the year ended December 31, 2008, the Company repurchased, at a discount, $127,300 of investment grade notes previously issued by the Company’s three CDOs. The Company recorded a net gain on the early extinguishment of debt of $77,234 for the year ended December 31, 2008, in connection with the repurchase of notes of such Issuers.
9. Debt Obligations
Term Loan, Credit Facility and Repurchase Facility
A facility with Wachovia Capital Markets, LLC or one or more of its affiliates, or Wachovia, was initially established as a $250,000 facility in 2004, and was subsequently increased to $500,000 effective April 2005. In July 2008, the original facility was terminated and a new facility was executed with Wachovia to provide for a total credit availability of $215,680, comprised of a term loan equal to $115,680 and a revolving credit facility equal to $100,000 with a credit spread of 242.5 basis points. The term of the credit facility was two years which could have been extended for an additional twelve-month period if certain conditions were met. In April 2009, the Company entered into an amendment with Wachovia, pursuant to which the maturity date of the credit facility was extended to March 31, 2011. The amendment also eliminated all financial covenants, eliminated Wachovia’s right to impose future margin calls, reduced the recourse guarantee to be no more than $10,000, and eliminated cross default provisions with respect to the Company’s other indebtedness. The Company made a $13,000 deposit and provided other credit support to backstop letters of credit which Wachovia issued in connection with the Company’s mortgage debt obligations of certain of the Company’s subsidiaries. The Company also agreed to attempt to divest of certain loan investments in the future in order to further deleverage the credit facility and to forego additional borrowing under the facility. In December 2009, the Company entered into an agreement with Wachovia, to settle and satisfy in full the pre-existing loan obligation of $44,542 under the secured term loan and credit facility. The Company made a one-time cash payment of $22,500 and executed and delivered to Wachovia a subordinate participation interest in the Company’s 50% interest in one of the four mezzanine loans formerly pledged under the credit
153
TABLE OF CONTENTS
Gramercy Capital Corp.
Notes To Consolidated Financial Statements
(Amounts in thousands, except share and per share data)
December 31, 2010
9. Debt Obligations – (continued)
agreement. Upon termination, all of the security interests and liens in favor of Wachovia under the credit agreement were released. The Company recorded a gain on extinguishment of debt of $12,126 pursuant the termination agreement.
In January 2009, the Company closed a master repurchase facility with JP Morgan Chase Bank, N.A. or JP Morgan, in the amount of $9,500. The term of the facility was through July 23, 2010, the interest rate was 30-day LIBOR plus 175 basis points. The facility was recourse to the Company for 30% of the facility amount, and the facility was subject to normal mark-to-market provisions after March 2009. Proceeds under the facility, which was fully drawn at closing, were used to retire certain borrowings under the Wachovia credit facility. This facility was secured by a perfected security interest in a single debt investment. In March 2009, the Company terminated this facility by making a cash payment of approximately $1,880 and transferring the full ownership and control of, and responsibility for, the related loan collateral to JP Morgan. The Company recorded an impairment charge of $8,843 in connection with the collateral transfer.
Unsecured Credit Facility
In May 2006, the Company closed on a $100,000 senior unsecured revolving credit facility with KeyBank National Association, or KeyBank, with an initial term of three years and a one-year extension option. In June 2007, the facility was increased to $175,000. In March 2009, the Company entered into an amendment and compromise agreement with KeyBank to settle and satisfy the loan obligations at a discount for a current cash payment of $45,000, and a future cash payment in a maximum amount of up to $15,000 from 50% of all payments from distributions after May 2009 from certain junior tranches and preferred classes of securities in the Company’s CDOs. The remaining balance of $85 in potential cash distribution is recorded in other liabilities on the Company’s balance sheet as of December 31, 2009 and was fully paid in January 2010. The Company recorded a net gain on extinguishment of debt of $107,229 as a result of to this agreement.
In connection with the acquisition of American Financial on April 1, 2008, the Company’s indirect wholly-owned subsidiaries, First States Investors DB I L.P., (formerly known as First States Investors DB I LLC) and First States Investors DB I B, L.P., and certain of their direct or indirect subsidiaries, collectively, (the “DB Loan Borrowers”), entered into an amendment and restatement of an assumed American Financial credit facility (the “DB Loan Agreement”) with Deutsche Bank AG, Cayman Islands Branch, or Deutsche Bank, as agent for certain lenders. Originally, the DB Loan Agreement provided the DB Loan Borrowers with a one year facility that would have matured on March 31, 2009. Advances made under the DB Loan bear interest at 3.00% plus the greater of (i) 3.50% or (ii) 30 day LIBOR. The DB Loan allows for prepayment in whole or in part on any payment date; provided, however, that any such prepayment shall be accompanied by all accrued interest on the portion of the DB Loan being prepaid. In September 2008, two of the Company’s CDOs purchased the DB Loan from the lender and simultaneously amended the maturity date to be September 2011, and subject to certain conditions, granted the DB Loan Borrowers two options to extend the DB Loan for one year each (i.e. to September 11, 2013 if both options are exercised). As of December 31, 2010 and 2009, the outstanding principal balance of the DB Loan was $62,379 and $64,172, respectively. The loan is eliminated in the preparation of the Company’s consolidated financial statements.
The obligations under the DB Loan Agreement now owned by two of the Company’s CDOs, are secured by equity pledges of the shares in certain DB Loan Borrowers and mortgages over the various properties owned by certain DB Loan Borrowers. The DB Loan is guaranteed by the Company. In connection with the Settlement Agreement, the Company was released under this guaranty in September 2011. The DB Loan Agreement contains customary events of default, the occurrence of which could result in the acceleration of all amounts payable there under. The DB Loan requires the Company to establish and fund certain reserve
154
TABLE OF CONTENTS
Gramercy Capital Corp.
Notes To Consolidated Financial Statements
(Amounts in thousands, except share and per share data)
December 31, 2010
9. Debt Obligations – (continued)
accounts to be used for the payment of taxes and insurance, rollover and replacement expenses, payment of tenant improvements and leasing commissions and the funding of debt service shortfalls.
Mortgage and Mezzanine Loans
Certain real estate assets are subject to mortgage and mezzanine liens. As of December 31, 2010, 948 (including 54 properties held by an unconsolidated joint venture) of the Company’s real estate investments were encumbered with mortgage and mezzanine loans with a cumulative outstanding balance of $2,190,384. In September 2011, pursuant to the Settlement Agreement with respect to Gramercy Realty’s $240,523 mortgage loan and Gramercy Realty’s $549,713 senior and junior mezzanine loans, the mortgage notes payable and the related collateral will be transitioned to the mezzanine lenders, in exchange for a mutual release of claims among the Company and the mortgage and mezzanine lenders and, subject to certain termination provisions and an arrangement for the Company’s continued management of the assets on behalf of the mezzanine lenders for a fixed fee plus incentive fees.
The Company’s mortgage notes payable typically require that specified loan-to-value and debt service coverage ratios be maintained with respect to the financed properties before the Company can exercise certain rights under the loan agreements relating to such properties. If the specified criteria are not satisfied, in addition to other conditions that the Company may have to observe, the Company’s ability to release properties from the financing may be restricted and the lender may be able to “trap” portfolio cash flow until the required ratios are met on an ongoing basis. As of December 31, 2010 and December 31, 2009, the Company was in covenant compliance on all of its mortgage and mezzanine loans, except that, as of December 31, 2010, the Company was out of debt service coverage compliance under two of its mortgage note financings. Such non-compliance does not constitute an event of default under the applicable loan agreements. Under one of the loans, the lender has the ability to restrict distributions which are limited to budgeted property operating expenses; under the other loan, the lender has the right to replace the management of the property.
Certain of the Company’s mortgage notes payable related to assets held for sale contain provisions that require the Company to compensate the lender for the early repayment of the loan. These charges will be separately classified in the statement of operations as yield maintenance fees within discontinued operations during the period in which the charges are incurred.
Goldman Mortgage Loan
On April 1, 2008, certain subsidiaries of the Company, collectively, the Goldman Loan Borrowers, entered into a mortgage loan agreement, with GSMC, Citicorp and SL Green in connection with a mortgage loan in the amount of $250,000, which is secured by certain properties owned or ground leased by the Goldman Loan Borrowers. The Goldman Mortgage Loan had an initial maturity date of March 9, 2010, with a single one-year extension option. The terms of the Goldman Mortgage Loan were negotiated between the Goldman Borrowers and GSMC and Citicorp. The Goldman Mortgage Loan bore interest at 4.35% over one-month LIBOR. The Goldman Mortgage Loan provides for customary events of default, the occurrence of which could result in an acceleration of all amounts payable under the Goldman Mortgage Loan. The Goldman Mortgage Loan allows for prepayment under the terms of the agreement, as long as simultaneously therewith a proportionate prepayment of the Goldman Mezzanine Loan (discussed below) shall also be pre-paid. In August 2008, an amendment to the loan agreement described below was entered into for the Goldman Mortgage Loan in conjunction with the bifurcation of the Goldman Mezzanine loan into two separate mezzanine loans. Under this loan agreement amendment, the Goldman Mortgage Loan bears interest at 1.99% over LIBOR. The Company has accrued interest of $256 and $253 and borrowings of $240,523 and $241,324 as of December 31, 2010 and 2009, respectively.
155
TABLE OF CONTENTS
Gramercy Capital Corp.
Notes To Consolidated Financial Statements
(Amounts in thousands, except share and per share data)
December 31, 2010
9. Debt Obligations – (continued)
In March 2010, the Company extended the maturity date of the Goldman Mortgage Loan to March 2011, and amended certain terms of the loan agreement, including, among others, (i) a prohibition on distributions from the Goldman Loan Borrowers to the Company, other than to cover direct costs related to executing the extension and reimbursement of not more than $2,500 per quarter of corporate overhead actually incurred and allocated to Gramercy Realty, (ii) requirement of $5,000 of available cash on deposit in a designated account on the commencement date of the Goldman Mortgage Loan extension term, and (iii) within 90 days after the first day of the Goldman Mortgage Loan extension term, delivery by the Goldman Loan Borrowers to GSMC, Citicorp and SL Green of a comprehensive long-term business plan and restructuring proposal addressing repayment of the Goldman Mortgage Loan. Subsequent to the final maturity of the Goldman Mortgage Loan and the Goldman Mezzanine Loans, the Company entered into a series of short term extensions to provide additional time to exchange and consider proposals for an extension, modification, restructuring or refinancing of the Goldman Mortgage Loan and the Goldman Mezzanine Loans and to explore an orderly transition of the collateral to the lenders if such discussions fail. On May 9, 2011, the Company announced that the scheduled maturity of the Goldman Mortgage Loan and the Goldman Mezzanine Loans occurred without repayment and without an extension or restructuring of the loans by the lenders.
Notwithstanding the maturity and non-repayment of the loans, the Company maintained active communications with the lenders and in September 2011, the Company entered into the Settlement Agreement for an orderly transition of substantially all of Gramercy Realty’s assets to the mezzanine lenders, in exchange for a mutual release of claims among the Company and the lenders and, subject to certain termination provisions, an arrangement for the Company’s continued management of Gramercy Realty’s assets on behalf of such mezzanine lenders for a fixed fee plus incentive fees. In July 2011, the Company’s Dana portfolio, which consists of 15 properties totaling approximately 3.8 million rentable square feet was transferred to its mortgage lender through a deed in lieu of foreclosure. Subsequent to the execution of the Settlement Agreement, the business of Gramercy Realty will change from being primarily an owner of commercial properties to being primarily a third party manager of commercial properties. The scale of Gramercy Realty’s revenues will substantially decline as a substantial portion of net revenues from property operations will be replaced with fee revenues of a substantially smaller scale. Additionally, as assets are deconsolidated from the Company’s Consolidated Balance Sheet, its total assets and liabilities are expected to decline substantially. The transition of Gramercy Realty’s business and the effects of these changes on the Company’s Consolidated Financial Statements are expected to be completed by December 31, 2011.
Secured Term Loan
On April 1, 2008, First States Investors 3300 B, L.P., an indirect wholly-owned subsidiary of the Company (“PB Loan Borrower”), entered into a loan agreement, or the PB Loan Agreement, with PB Capital Corporation, as agent for itself and other lenders, in connection with a secured term loan in the amount of $240,000, or the PB Loan in part to refinance a portion of a portfolio of American Financial’s properties known as the WBBD Portfolio. The PB Loan matures on April 1, 2013 and bears interest at a 1.65% over one-month LIBOR. The PB Loan is secured by mortgages on the 41 properties owned by the PB Loan Borrower and all other assets of the PB Loan Borrower. The PB Loan Agreement provides for customary events of default, the occurrence of which could result in an acceleration of all amounts payable under the PB Loan Agreement. The PB Loan Borrower may prepay the PB Loan, in whole or in part (in amounts equal to at least $1,000), on any date. The Company had accrued interest of $395 and $418 and borrowings of $219,513 and $234,851 as of December 31, 2010 and 2009 respectively. In 2011, pursuant to the Settlement Agreement with respect to Gramercy Realty’s $240,523 mortgage loan and Gramercy Realty’s $549,713 senior and junior mezzanine loans, the PB Loan and the related collateral will be transitioned to the mezzanine lenders, in exchange for a mutual release of claims among the Company and the mortgage and mezzanine
156
TABLE OF CONTENTS
Gramercy Capital Corp.
Notes To Consolidated Financial Statements
(Amounts in thousands, except share and per share data)
December 31, 2010
9. Debt Obligations – (continued)
lenders and, subject to certain termination provisions, an arrangement for the Company’s continued management of the assets on behalf of the mezzanine lenders for a fixed fee plus incentive fees.
The PB Loan requires the Company to enter into an interest rate protection agreement within five days of the tenth consecutive LIBOR banking day on which the strike rate exceeds 6.00% per annum. The interest rate protection agreement must protect the PB Loan Borrower against upward fluctuations of interest rates in excess of 6.25% per annum.
The PB Loan Agreement contains certain covenants relating to liquidity and tangible net worth. As of December 31, 2010, the Company is not in compliance with the tangible net worth covenant. The Company has obtained a waiver from its lender for non-compliance of the tangible net worth covenant as of December 31, 2010. The Company was not in compliance with the tangible net worth covenant under the PB Loan Agreement as of June 30, 2011, and such non-compliance may permit the lender to exercise remedies against the mortgage collateral on a non-recourse basis.
Goldman Senior and Junior Mezzanine Loans
On April 1, 2008, certain subsidiaries of the Company, collectively, the Mezzanine Borrowers, entered into a mezzanine loan agreement with GSMC, Citicorp and SL Green in connection with a mezzanine loan in the amount of $600,000, or the Goldman Mezzanine Loan, which is secured by pledges of certain equity interests owned by the Mezzanine Borrowers and any amounts receivable by the Mezzanine Borrowers whether by way of distributions or other sources. The Goldman Mezzanine Loan had an initial maturity date of March 9, 2010, with a single one-year extension option. The terms of the Goldman Mezzanine Loan were negotiated between the Mezzanine Borrowers and GSMC and Citicorp. The Goldman Mezzanine Loan bore interest at 4.35% over one-month LIBOR. The Goldman Mezzanine Loan provides for customary events of default, the occurrence of which could result in an acceleration of all amounts payable under the Goldman Mezzanine Loan. The Goldman Mezzanine Loan allows for prepayment under the terms of the agreement, subject to a 1.00% prepayment fee during the first six months, payable to the lender, as long as simultaneously therewith a proportionate prepayment of the Goldman Mortgage Loan shall also be made on such date. In addition, under certain circumstances the Goldman Mezzanine Loan is cross-defaulted with events of default under the Goldman Mortgage Loan and with other mortgage loans pursuant to which, an indirect wholly-owned subsidiary of the Company, is the mortgagor. In August 2008, the $600,000 mezzanine loan was bifurcated into two separate mezzanine loans (the Junior Mezzanine loan and the Senior Mezzanine Loan) by the lenders. Additional loan agreement amendments were entered into for the Goldman Mezzanine Loan and Goldman Mortgage Loan. Under these loan agreement amendments, the Junior Mezzanine Loan bears interest at 6.00% over LIBOR, the Senior Mezzanine Loan bears interest at 5.20% over LIBOR and the Goldman Mortgage Loan bears interest at 1.99% over LIBOR. The weighted average of these interest rate spreads is equal to the combined weighted average of the interest rates spreads on the initial loans. The Goldman Mezzanine loans encumber all properties held by Gramercy Realty. The Company has accrued interest of $1,454 and $1,455 and borrowings of $549,713 and $553,522 as of December 31, 2010 and 2009, respectively.
In March 2010, the Company extended the maturity date of the Goldman Mezzanine Loans to March 2011, and amended certain terms of the Senior Mezzanine Loan agreement and the Junior Mezzanine Loan agreement, including, among others, with respect to the Senior Mezzanine Loan agreement, (i) a prohibition on distributions from the Senior Mezzanine Loan borrowers to the Company, other than to cover direct costs related to executing the extension and reimbursement of not more than $2,500 per quarter of corporate overhead actually incurred and allocated to Gramercy Realty, (ii) requirement of $5,000 of available cash on deposit in a designated account on the commencement date of the Senior Mezzanine Loan extension term and agreement, upon request, to grant a security interest in that account to KBS, and (iii) within 90 days
157
TABLE OF CONTENTS
Gramercy Capital Corp.
Notes To Consolidated Financial Statements
(Amounts in thousands, except share and per share data)
December 31, 2010
9. Debt Obligations – (continued)
after the first day of the Senior Mezzanine Loan extension term, delivery by the Senior Mezzanine Loan borrowers to KBS of a comprehensive long-term business plan and restructuring proposal addressing repayment of the Senior Mezzanine Loan, and with respect to the Junior Mezzanine Loan agreement, (i) a prohibition on distributions from the Junior Mezzanine Loan borrower to the Company, other than to cover direct costs related to executing the extension and reimbursement of not more than $2,500 per quarter of corporate overhead actually incurred and allocated to Gramercy Realty, (ii) requirement of $5,000 of available cash on deposit in a designated account on the commencement date of the Junior Mezzanine Loan extension term and agreement, upon request, to grant a security interest in that account to GSMC, Citicorp and SL Green, and (iii) within 90 days after the first day of the Junior Mezzanine Loan extension term, delivery by the Junior Mezzanine Loan borrower to GSMC, Citicorp and SL Green of a comprehensive long-term business plan and restructuring proposal addressing repayment of the Junior Mezzanine Loan. Subsequent to the final maturity of the Goldman Mortgage Loan and the Goldman Mezzanine Loans, the Company entered into a series of short term extensions to provide additional time to exchange and consider proposals for an extension, modification, restructuring or refinancing of the Goldman Mortgage Loan and the Goldman Mezzanine Loans and to explore an orderly transition of the collateral to the lenders if such discussions fail. On May 9, 2011, the Company announced that the scheduled maturity of the Goldman Mortgage Loan and the Goldman Mezzanine Loans occurred without repayment and without an extension or restructuring of the loans by the lenders.
Notwithstanding the maturity and non-repayment of the loans, the Company maintained active communications with the lenders and in September 2011, the Company entered into the Settlement Agreement for an orderly transition of substantially all of Gramercy Realty’s assets to the mezzanine lenders, in exchange for a mutual release of claims among the Company and the mortgage and mezzanine lenders and, subject to certain termination provisions, an arrangement for the Company’s continued management of Gramercy Realty’s assets on behalf of such mezzanine lenders for a fixed fee plus incentive fees. In July 2011, the Company’s Dana portfolio, which consists of 15 properties totaling approximately 3.8 million rentable square feet was transferred to its mortgage lender through a deed in lieu of foreclosure. Subsequent to the execution of the Settlement Agreement, the business of Gramercy Realty will change from being primarily an owner of commercial properties to being primarily a third party manager of commercial properties. The scale of Gramercy Realty’s revenues will substantially decline as a substantial portion of net revenues from property operations will be replaced with fee revenues of a substantially smaller scale. Additionally, as assets are transferred, its total assets and liabilities are expected to decline substantially. The carrying value of liabilities associated with the impaired properties have not been adjusted and remained outstanding as of December 31, 2010. As of December 31, 2010, the liabilities of the impaired properties exceeded the carrying value of the assets and accordingly, the subsequent transfer of assets and liabilities pursuant to the Settlement Agreement will generate gains as the carrying values of such liabilities are reduced to $0, which in turn will reduce our negative book equity balance as liabilities. The transition of Gramercy Realty’s business and the effects of these changes on the Company’s Consolidated Financial Statements are expected to be completed by December 31, 2011.
158
TABLE OF CONTENTS
Gramercy Capital Corp.
Notes To Consolidated Financial Statements
(Amounts in thousands, except share and per share data)
December 31, 2010
9. Debt Obligations – (continued)
The following is a summary of first mortgage loans as of December 31, 2010:
| | | | | | | | |
| | Encumbered
Properties(1) | | Balance | | Interest Rate | | Maturity Date |
| Fixed-rate mortgages | | | 473 | | | $ | 1,168,878 | (2) | | | 5.06% to 10.29 | % | | | January 2012 to
August 2030 | |
| Variable-rate mortgages | | | 236 | | | | 460,036 | | | | 1.91% to 2.26 | % | | | May 2011 to April 2013 | |
| Total mortgage notes payable | | | 709 | | | | 1,628,914 | | | | | | | | | |
| Above-/below-market interest | | | — | | | | 11,757 | | | | | | | | | |
| Balance, December 31, 2010 | | | 709 | | | $ | 1,640,671 | | | | | | | | | |
| (1) | In September 2011, pursuant to the Settlement Agreement with respect to Gramercy Realty’s $240,523 mortgage loan and Gramercy Realty’s $549,713 senior and junior mezzanine loans, the mortgage notes payable and the related collateral will be transitioned to the mezzanine lenders, in exchange for a mutual release of claims among the Company and the mortgage and mezzanine lenders and, subject to certain termination provisions, an arrangement for the Company’s continued management of the assets on behalf of the mezzanine lenders for a fixed fee plus incentive fees. In July 2011, our Dana portfolio, which consists of 15 properties totaling approximately 3.8 million rentable square feet was transferred to its mortgage lender through a deed in lieu of foreclosure. |
| (2) | Includes $86,016 of debt that is collateralized by $92,918 of pledged treasury securities, net of discounts and premiums. |
Combined aggregate principal maturities of the Company’s consolidated CDOs, notes and mortgage loans (including the Goldman Mortgage, Senior Mezzanine Loan and Junior Mezzanine loan) as of December 31, 2010 are as follows:
| | | | | | | | |
| | CDOs | | Mortgage and
Mezzanine
Loans(1) | | Interest
Payments | | Total |
| 2011 | | $ | — | | | $ | 815,701 | | | $ | 157,236 | | | $ | 972,937 | |
| 2012 | | | — | | | | 80,719 | | | | 147,535 | | | | 228,254 | |
| 2013 | | | — | | | | 602,904 | | | | 132,304 | | | | 735,208 | |
| 2014 | | | — | | | | 12,884 | | | | 109,319 | | | | 122,203 | |
| 2015 | | | — | | | | 47,650 | | | | 104,823 | | | | 152,473 | |
| Thereafter | | | 2,682,321 | | | | 618,769 | | | | 214,689 | | | | 3,515,779 | |
| Above-/below-market interest | | | — | | | | 11,757 | | | | — | | | | 11,757 | |
| Total | | $ | 2,682,321 | | | $ | 2,190,384 | | | $ | 865,906 | | | $ | 5,738,611 | |
| (1) | In September 2011, pursuant to the Settlement Agreement with respect to Gramercy Realty’s $240,523 mortgage loan and Gramercy Realty’s $549,713 senior and junior mezzanine loans, the mortgage notes payable and the related collateral will be transitioned to the mezzanine lenders, in exchange for a mutual release of claims among the Company and the mortgage and mezzanine lenders and, subject to certain termination provisions, an arrangement for the Company’s continued management of the assets on behalf of the mezzanine lenders for a fixed fee plus incentive fees. In July 2011, our Dana portfolio, which consists of 15 properties totaling approximately 3.8 million rentable square feet was transferred to its mortgage lender through a deed in lieu of foreclosure. |
159
TABLE OF CONTENTS
Gramercy Capital Corp.
Notes To Consolidated Financial Statements
(Amounts in thousands, except share and per share data)
December 31, 2010
10. Leasing Agreements
The Company’s properties are leased and subleased to tenants under operating leases with expiration dates extending through the year 2031. These leases generally contain rent increases and renewal options. In September 2011, pursuant to the Settlement Agreement with respect to Gramercy Realty’s $240,523 mortgage loan and Gramercy Realty’s $549,713 senior and junior mezzanine loans, substantially all of Gramercy Realty’s assets and liabilities, including its leasing agreements, will be transitioned to the mezzanine lenders, in exchange for a mutual release of claims among the Company and the mortgage and mezzanine lenders and, subject to certain termination provisions, an arrangement for the Company’s continued management of Gramercy Realty’s assets on behalf of such mezzanine lenders for a fixed fee plus incentive fees.
Future minimum rental payments under non-cancelable leases, excluding reimbursements for operating expenses, as of December 31, 2010 are as follows:
| | |
| | Operating
Leases(1) |
| 2011 | | $ | 213,876 | |
| 2012 | | | 199,781 | |
| 2013 | | | 187,521 | |
| 2014 | | | 177,156 | |
| 2015 | | | 160,126 | |
| Thereafter | | | 927,232 | |
| Total minimum lease payments | | $ | 1,865,692 | |
11. Operating Partnership Agreement/Manager
At December 31, 2010 and 2009, the Company owned all of the Class A limited partner interests in the Operating Partnership. For the period January 1, 2009 through April 24, 2009 all of the Class B limited partner interests were owned by SL Green OP. For the period January 1, 2009 through April 24, 2009 all of the interests in the Manager were held by SL Green OP. On April 24, 2009, the Company completed the internalization of management through the direct acquisition of the Manager. The consideration paid to SL Green in the transaction was de minimis. Accordingly, beginning in May 2009, management and incentive fees payable by the Company to the Manager ceased and the Class B limited partner interests have been cancelled.
12. Related Party Transactions
On April 24, 2009, in connection with the internalization, the Company and the Operating Partnership entered into a securities transfer agreement with SL Green OP, Manager Corp. and SL Green, pursuant to which (i) SL Green OP and Manager Corp. agreed to transfer to the Operating Partnership, membership interests in the Manager and (ii) SL Green OP agreed to transfer to the Operating Partnership its Class B limited partner interests in the Operating Partnership, in exchange for certain de minimis cash consideration. The securities transfer agreement contains standard representations, warranties, covenants and indemnities. No distributions were due on the Class B limited partner interests in connection with the internalization.
Concurrently with the execution of the securities transfer agreement, the Company also entered into a special rights agreement with SL Green OP and SL Green, pursuant to which SL Green and SL Green OP agreed to provide the Company certain management information systems services from April 24, 2009 through the date that was 90 days thereafter and the Company agreed to pay SL Green OP a monthly cash fee of $25 in connection therewith. The Company also agreed to use its best efforts to operate as a REIT during each taxable year and to cause the Company’s tax counsel to provide legal opinions to SL Green relating to the Company’s REIT status. Other than with respect to the transitional services provisions of the special rights
160
TABLE OF CONTENTS
Gramercy Capital Corp.
Notes To Consolidated Financial Statements
(Amounts in thousands, except share and per share data)
December 31, 2010
12. Related Party Transactions – (continued)
agreement as set forth therein, the special rights agreement will terminate when SL Green OP ceases to own at least 7.5% of the shares of the Company’s common stock.
In connection with its initial public offering, the Company entered into a management agreement with the Manager, which was subsequently amended and restated in April 2006. The management agreement was further amended in September 2007, and amended and restated in October 2008 and was subsequently terminated in connection with the internalization. The management agreement provided for a term through December 2009 with automatic one-year extension options and was subject to certain termination rights. The Company paid the Manager an annual management fee equal to 1.75% of the Company’s gross stockholders equity (as defined in the management agreement) inclusive of the Company’s trust preferred securities. In October 2008, the Company entered into the second amended and restated management agreement with the Manager which generally contained the same terms and conditions as the amended and restated management agreement, as amended, except for the following material changes: (1) reduced the annual base management fee to 1.50% of the Company’s gross stockholders equity; (2) reduces the termination fee to an amount equal to the management fee earned by the Manager during the 12 months preceding the termination date; and (3) commencing July 2008, all fees in connection with collateral management agreements were to be remitted by the Manager to the Company. The Company incurred expense to the Manager under this agreement of an aggregate of $0, $7,534 and $21,058 for the years ended December 31, 2010, 2009 and 2008 respectively.
Prior to the internalization, to provide an incentive to enhance the value of the Company’s common stock, the holders of the Class B limited partner interests of the Operating Partnership were entitled to an incentive return equal to 25% of the amount by which FFO plus certain accounting gains and losses (as defined in the partnership agreement of the Operating Partnership) exceed the product of the weighted average stockholders equity (as defined in the partnership agreement of the Operating Partnership) multiplied by 9.5% (divided by four to adjust for quarterly calculations). The Company recorded any distributions on the Class B limited partner interests as an incentive distribution expense in the period when earned and when payments of such became probable and reasonably estimable in accordance with the partnership agreement. The Company incurred approximately $2,350 with respect to such Class B limited partner interests for the year ended December 31, 2008. No incentive distribution was earned by the Class B limited partner interests for the year ended December 31, 2009.
Prior to the internalization, the Company was obligated to reimburse the Manager for its costs incurred under an asset servicing agreement between the Manager and an affiliate of SL Green OP and a separate outsource agreement between the Manager and SL Green OP. The asset servicing agreement, which was amended and restated in April 2006, provided for an annual fee payable to SL Green OP by the Company of 0.05% of the book value of all credit tenant lease assets and non-investment grade bonds and 0.15% of the book value of all other assets. The outsource agreement provided for an annual fee payable by the Company, which became $2,814 per year subsequent to the closing of the American Financial merger to reflect higher costs resulting from the increased size and number of assets of the combined company, increasing 3% annually over the prior year on the anniversary date of the outsource agreement in August of each year. For the year ended December 31, 2008, the Company realized expense of $1,721 to the Manager under the outsource agreement. For the year ended December 31, 2008, the Company realized expense of $4,022 to the Manager, under the asset servicing agreement. In October 2008, the outsource agreement was terminated and the asset servicing agreement was replaced with that certain interim asset servicing agreement between the Manager and an affiliate of SL Green, pursuant to which the Company was obligated to reimburse the Manager for its costs incurred there under from October 2008 until April 24, 2009 when such agreement was terminated in connection with the internalization. Pursuant to that agreement, the SL Green affiliate acted as the rated special servicer to the Company’s CDOs, for a fee equal to two basis points per year on the carrying value of the specially serviced loans assigned to it. Concurrent with the internalization, the interim asset
161
TABLE OF CONTENTS
Gramercy Capital Corp.
Notes To Consolidated Financial Statements
(Amounts in thousands, except share and per share data)
December 31, 2010
12. Related Party Transactions – (continued)
servicing agreement was terminated and the Manager entered into a special servicing agreement with an affiliate of SL Green, pursuant to which the SL Green affiliate agreed to act as the rated special servicer to the Company’s CDOs for a period beginning on April 24, 2009 through the date that is the earlier of (i) 60 days thereafter and (ii) a date on which a new special servicing agreement is entered into between the Manager and a rated third-party special servicer. The SL Green affiliate was entitled to a servicing fee equal to (i) 25 basis points per year on the outstanding principal balance of assets with respect to certain specially serviced assets and (ii) two basis points per year on the outstanding principal balance of assets with respect to certain other assets. The April 24, 2009 agreement expired effective June 23, 2009. Effective May 2009, the Company entered into new special servicing arrangements with Situs Serve, L.P., which became the rated special servicer for the Company’s CDOs. An affiliate of SL Green continues to provide special servicing services with respect to a limited number of loans owned by the Company that are secured by properties in New York City, or in which the Company and SL Green are co-investors. For the years ended December 31, 2010, 2009 and 2008 the Company incurred expense of $477, $1,014 and $0, respectively, pursuant to the special servicing arrangement.
On October 27, 2008, the Company entered into a services agreement with SL Green and SL Green OP which was subsequently terminated in connection with the internalization. Pursuant to the services agreement, SL Green agreed to provide consulting and other services to the Company. SL Green would make Marc Holliday, Andrew Mathias and David Schonbraun available in connection with the provision of the services until the earliest of (i) September 30, 2009, (ii) the termination of the management agreement or (iii) with respect to a particular executive, the termination of any such executive’s employment with SL Green. In consideration for the consulting services, the Company paid a fee to SL Green of $200 per month, payable, at its option, in cash or, if permissible under applicable law or the requirements of the exchange on which the shares of the Company’s common stock trade, shares of its common stock. SL Green also provided the Company with certain other services described in the services agreement for a fee of $100 per month in cash and for a period terminating at the earlier of (i) three months after the date of the services agreement, subject to a one-time 30-day extension, or (ii) the termination of the management agreement.
In connection with the closing of the Company’s first CDO in July 2005, the 2005 Issuer, entered into a collateral management agreement with the Manager. Refer to Note 8 for further discussion of fees related to the management of the CDO. As compensation for the performance of its obligations as collateral manager under the first CDO, the Company’s board of directors had allocated to the Manager the subordinate collateral management fee paid on the CDO notes not held by the Company. In October 2008, pursuant to the second amended and restated management agreement, the Manager had, commencing July 1, 2008, agreed to remit this amount to the Company. For the year ended December 31, 2008, the Company realized expense of $1,024 to the Manager under such collateral management agreement.
Prior to the internalization, fees payable in connection with CDOs or other securitization vehicles, except for the 2005 CDO, were governed by the management agreement. Pursuant to the management agreement, if a collateral manager is retained as part of the formation of a CDO or other securitization vehicle, the Manager or an affiliate will be the collateral manager and will receive the following fees: (i) 0.25% per annum of the principal amount outstanding of bonds issued by a managed transitional CDO that are owned by third-party investors unaffiliated with the Company or the Manager, which CDO is structured to own loans secured by transitional properties, (ii) 0.15% per annum of the book value of the principal amount outstanding of bonds issued by a managed non-transitional CDO that are owned by third-party investors unaffiliated with the Company or the Manager, which CDOs structured to own loans secured by non-transitional properties, (iii) 0.10% per annum of the principal amount outstanding of bonds issued by a static CDO that are owned by third-party investors unaffiliated with the Company or the Manager, which CDO is structured to own non-investment grade bonds, and (iv) 0.05% per annum of the principal amount outstanding of bonds issued by a
162
TABLE OF CONTENTS
Gramercy Capital Corp.
Notes To Consolidated Financial Statements
(Amounts in thousands, except share and per share data)
December 31, 2010
12. Related Party Transactions – (continued)
static CDO that are owned by third-party investors unaffiliated the Company or the Manager, which CDO is structured to own investment grade bonds. For the purposes of the management agreement, a “managed transitional” CDO means a CDO that is actively managed, has a reinvestment period and is structured to own debt collateral secured primarily by non-stabilized real estate assets that are expected to experience substantial net operating income growth, and a “managed non-transitional” CDO means a CDO that is actively managed, has a reinvestment period and is structured to own debt collateral secured primarily by stabilized real estate assets that are not expected to experience substantial net operating income growth. Both “managed transitional” and “managed non-transitional” CDOs may at any given time during the reinvestment period of the respective vehicles invest in and own non-debt collateral (in limited quantity) as defined by the respective indentures. If any fees are paid to the collateral manager in excess of the fee structure provided for above, such fees are paid to the Company. In October 2008, pursuant to the second amended and restated management agreement, the Manager, commencing July 1, 2008, agreed to remit this amount to the Company. For the year ended December 31, 2008, the Company realized expense of approximately $1,574 to the Manager under this agreement. In connection with the internalization, the management agreement was terminated and the fees payable in connection with the Company’s 2006 and 2007 CDOs will be governed by their respective collateral management agreements. Refer to Note 8 for further discussion of fees related to the management of the CDOs.
Commencing in May 2005, the Company is party to a lease agreement with SLG Graybar Sublease LLC, an affiliate of SL Green, for its corporate offices at 420 Lexington Avenue, New York, New York. The lease is for approximately 7,300 square feet and carries a term of 10 years with rents of approximately $249 per annum for year one rising to $315 per annum in year ten. In May and June 2009, the Company amended its lease with SLG Graybar Sublease LLC to increase the leased premises by approximately 2,260 square feet. The additional premises is leased on a co-terminus basis with the remainder of its leased premises and carries rents of approximately $103 per annum during the initial year and $123 per annum during the final lease year. For the years ended December 31, 2010, 2009 and 2008, the Company paid $339, $437 and $423 under this lease, respectively.
In July 2005, the Company closed on the purchase from an SL Green affiliate of a $40,000 mezzanine loan which bears interest at 11.20%. As part of that sale, the seller retained an interest-only participation. The mezzanine loan is secured by the equity interests in an office property in New York, New York. In December 2010, the Company sold its entire interest to an affiliate of SL Green for $38,893. As of December 31, 2009, the loan had a book value of $39,285.
In March 2006, the Company closed on the purchase of a $25,000 mezzanine loan to a joint venture in which SL Green was an equity holder, which bears interest at one-month LIBOR plus 8.00%. The mezzanine loan was repaid in full on May 9, 2006, when the Company originated a $90,287 whole loan, which bears interest at one-month LIBOR plus 2.75%, to the joint venture. The whole loan is secured by office and industrial properties in northern New Jersey and has a book value of $24,821 and $64,130 as of December 31, 2010 and December 31, 2009, respectively.
In June 2006, the Company closed on the acquisition of a 49.75% TIC interest in 55 Corporate Drive, located in Bridgewater, New Jersey with a 0.25% interest to be acquired in the future. The remaining 50% of the property was owned as a TIC interest by an affiliate of SL Green Operating Partnership, L.P. The property was comprised of three buildings totaling approximately 670,000 square feet which was 100% net leased to an entity whose obligations were guaranteed by Sanofi-Aventis Group through April 2023. The transaction was valued at $236,000 and was financed with a $190,000, 10-year, fixed-rate first mortgage loan. In January 2009, the Company and SL Green sold 100% of the respective interests in 55 Corporate.
163
TABLE OF CONTENTS
Gramercy Capital Corp.
Notes To Consolidated Financial Statements
(Amounts in thousands, except share and per share data)
December 31, 2010
12. Related Party Transactions – (continued)
In January 2007, the Company originated two mezzanine loans totaling $200,000. The $150,000 loan was secured by a pledge of cash flow distributions and partial equity interests in a portfolio of multi-family properties and bore interest at one-month LIBOR plus 6.00%. The $50,000 loan was initially secured by cash flow distributions and partial equity interests in an office property. On March 8, 2007, the $50,000 loan was increased by $31,000 when the existing mortgage loan on the property was defeased, upon which event the Company’s loan became secured by a first mortgage lien on the property and was reclassified as a whole loan. The whole loan currently bears interest at one-month LIBOR plus 6.00% for the initial funding and one-month LIBOR plus 1.00% for the subsequent funding. At closing, an affiliate of SL Green acquired from the Company and held a 15.15% pari-passu interest in the mezzanine loan and the whole loan. The investment in the mezzanine loan was repaid in full in September 2007. In September 2010, the whole loan was repaid at a discount. The Company received $56,093 and forgave the remaining balance outstanding. As of December 31, 2009, the Company’s interest in the whole loan had a carrying value of $63,894.
In April 2007, the Company purchased for $103,200 a 45% TIC interest to acquire the fee interest in a parcel of land located at 2 Herald Square, located along 34th Street in New York, New York. The acquisition was financed with $86,063 10- year fixed rate mortgage loan. The property is subject to a long-term ground lease with an unaffiliated third party for a term of 70 years. The remaining TIC interest is owned by a wholly-owned subsidiary of SL Green. The TIC interests are pari-passu. The Company sold its 45% interest in December 2010 to a wholly-owned subsidiary of SL Green for net proceeds of $25,350, resulting in a loss of $11,885. As of December 31, 2009, the investment had a carrying value of $31,557. The Company recorded its pro rata share of net income of $5,078, $4,988 and $5,228 for the years ended December 31, 2010, 2009 and 2008, respectively.
In July 2007, the Company purchased for $144,240 an investment in a 45% TIC interest to acquire a 79% fee interest and 21% leasehold interest in the fee position in a parcel of land located at 885 Third Avenue, on which is situated The Lipstick Building. The transaction was financed with a $120,443 10-year fixed rate mortgage loan. The property is subject to a 70-year leasehold ground lease with an unaffiliated third party. The remaining TIC interest is owned by a wholly-owned subsidiary of SL Green. The TIC interests are pari passu. The Company sold its 45% interest in December 2010 to a wholly-owned subsidiary of SL Green for net proceeds of $38,911, resulting in a loss of $15,407. As of December 31, 2009, the investment had a carrying value of $45,695. The Company recorded its pro rata share of net income of $5,926, $5,972 and $6,292 for the years ended December 31, 2010, 2009 and 2008, respectively.
In September 2007, the Company acquired a 50% interest in a $25,000 senior mezzanine loan from SL Green. Immediately thereafter, the Company, along with SL Green, sold all of its interests in the loan to an unaffiliated third party. Additionally, the Company acquired from SL Green a 100% interest in a $25,000 junior mezzanine loan associated with the same properties as the preceding senior mezzanine loan. Immediately thereafter the Company participated 50% of its interest in the loan back to SL Green. As of December 31, 2010 and December 31, 2009, the loan had a book value of $0 and $0, respectively. In October 2007, the Company acquired a 50% pari-passu interest in $57,795 of two additional tranches in the senior mezzanine loan from an unaffiliated third party. At closing, an affiliate of SL Green simultaneously acquired the other 50% pari-passu interest in the two tranches. As of December 31, 2010 and December 31, 2009, the loan has a book value of $0 and $319, respectively. The Company held a contingent interest in the property which was sold to SL Green in December 2010 for $2,016.
In December 2007, the Company acquired a $52,000 interest in a senior mezzanine loan from a financial institution. Immediately thereafter, the Company participated 50% of its interest in the loan to an affiliate of SL Green. The investment, which is secured by an office building in New York, New York, was purchased at a discount and bears interest at an effective spread to one-month LIBOR of 5.00%. In July 2009, the Company sold its remaining interest in the loan to an affiliate of SL Green for $16,120 pursuant to purchase
164
TABLE OF CONTENTS
Gramercy Capital Corp.
Notes To Consolidated Financial Statements
(Amounts in thousands, except share and per share data)
December 31, 2010
12. Related Party Transactions – (continued)
rights established when the loan was acquired. The sale also included a contingent participation in future net proceeds from SL Green of up to $1,040 in excess of the purchase price upon their ultimate disposition of the loan, which was surrendered and cancelled in December 2010 in connection with certain transactions that the Company consummated with wholly-owned subsidiaries of SL Green.
In December 2007, the Company acquired a 50% interest in a $200,000 senior mezzanine loan from a financial institution. Immediately thereafter, the Company participated 50% of the Company’s interest in the loan to an affiliate of SL Green. The investment was purchased at a discount and bears interest at an effective spread to one-month LIBOR of 6.50%. In December 2010, the Company subsequently purchased an affiliate of SL Green’s full participation in the senior mezzanine loan at a discount. As of December 31, 2010 and December 31, 2009, the original loan has a book value of $5,224 and $28,228 and the subsequently purchased loan has a book value of $13,586 and $0, respectively.
In August 2008, the Company closed on the purchase from an SL Green affiliate of a $9,375 pari-passu participation interest in $18,750 first mortgage. The loan is secured by a retail shopping center located in Staten Island, New York. The investment bears interest at a fixed rate of 6.50%. In December 2010, the Company purchased the remaining 50% interest in the loan from an SL Green affiliate for a discount of $9,420. As of December 31, 2010 and 2009 the loan has a book value of approximately $19,367 and $9,926, respectively.
In September 2008, the Company closed on the purchase from an SL Green affiliate of a $30,000 interest in a $135,000 mezzanine loan. The loan is secured by the borrower’s interests in a retail condominium located New York, New York. The investment bears interest at an effective spread to one-month LIBOR of 10.00%. As of December 31, 2010 and 2009, the loan has a book value of $27,778 and $29,925, respectively. In December 2010, the Company sold its contingent interest to SL Green for $300.
In December 2010, the Company sold its interest in a parcel of land located at 292 Madison Avenue in New York, New York to a wholly-owned subsidiary of SL Green. The Company received proceeds of $16,765 and recorded an impairment charge of $9,759.
13. Deferred Costs
Deferred costs at December 31, 2010 and December 31, 2009 consisted of the following:
| | | | |
| | 2010 | | 2009 |
| Deferred Financing Costs | | $ | 73,756 | | | $ | 69,235 | |
| Deferred Acquisition Costs | | | 132 | | | | 853 | |
| Deferred Leasing Costs | | | 4,701 | | | | 2,674 | |
| | | | 78,589 | | | | 72,762 | |
| Accumulated Amortization | | | (55,689 | ) | | | (40,721 | ) |
| | | $ | 22,900 | | | $ | 32,041 | |
Deferred financing costs relate to the Goldman Mortgage Loan, the Goldman Senior and Junior Mezzanine Loans, the PB Loan Agreement, the Company’s CDOs, mortgage loans, and the junior subordinated notes. These costs are amortized on a straight-line basis to interest expense based on the contractual term of the related financing.
Deferred acquisition costs consist of fees and direct costs incurred to originate the Company’s investments and are amortized using the effective yield method over the related term of the investment. Straight-line expense approximates the effective interest method.
Deferred leasing costs include direct costs incurred to initiate and renew operating leases and are amortized on a straight-line basis over the related lease term.
165
TABLE OF CONTENTS
Gramercy Capital Corp.
Notes To Consolidated Financial Statements
(Amounts in thousands, except share and per share data)
December 31, 2010
14. Fair Value of Financial Instruments
The Company discloses fair value information about financial instruments, whether or not recognized in the statement of financial condition, for which it is practicable to estimate that value. In cases where quoted market prices are not available, fair values are based upon the application of discount rates to estimated future cash flows based upon market yields or by using other valuation methodologies. Considerable judgment is necessary to interpret market data and develop estimated fair value. Accordingly, fair values are not necessarily indicative of the amounts the Company could realize on disposition of the financial instruments. The use of different market assumptions and/or estimation methodologies may have a material effect on estimated fair value amounts.
The following table presents the carrying value in the financial statements, and approximate fair value of other financial instruments at December 31, 2010 and 2009:
| | | | | | | | |
| | December 31, 2010 | | December 31, 2009 |
| | | Carrying
Value | | Fair
Value | | Carrying
Value | | Fair
Value |
Financial assets:
| | | | | | | | | | | | | | | | |
| Government securities | | $ | 92,918 | | | $ | 97,247 | | | $ | 97,286 | | | $ | 98,832 | |
| Lending investments | | $ | 1,123,528 | | | $ | 1,117,743 | | | $ | 1,383,832 | | | $ | 1,313,127 | |
| CMBS | | $ | 1,005,167 | | | $ | 900,815 | | | $ | 984,709 | | | $ | 556,395 | |
Financial liabilities:
| | | | | | | | | | | | | | | | |
| Mortgage note payable and senior and junior mezzanine loans | | $ | 2,190,384 | | | $ | 1,679,029 | | | $ | 2,297,190 | | | $ | 2,099,450 | |
| Collateralized debt obligations | | $ | 2,682,321 | | | $ | 1,704,338 | | | $ | 2,710,946 | | | $ | 1,097,485 | |
| Junior subordinated debentures | | $ | — | | | $ | — | | | $ | 52,500 | | | $ | 9,533 | |
The following methods and assumptions were used to estimate the fair value of each class of financial instruments for which it is practicable to estimate the value:
Cash and cash equivalents, accrued interest, and accounts payable: These balances in the consolidated financial statements reasonably approximate their fair values due to the short maturities of these items.
Government Securities: The Company maintains a portfolio of treasury securities that are pledged to provide principal and interest payments for mortgage debt previously collateralized by properties in the Company’s real estate portfolio. These securities are presented in the consolidated financial statements on a held-to-maturity basis and not at fair value. The fair values were based upon valuations obtained from dealers of those securities.
Lending investments: These instruments are presented in the consolidated financial statements at the lower of cost or market value and not at fair value. The fair values were estimated by using market yields floating rate and fixed rate (as appropriate) loans with similar credit characteristics.
CMBS — held-to-maturity: These investments are presented in the consolidated financial statements on a held-to-maturity basis and not at fair value. The fair values were based upon valuations obtained from dealers of those securities, and internal models.
CMBS available for sale: These investments are presented in the consolidated financial statements at fair value, not held-to-maturity basis. The fair values were based upon valuations obtained from dealers of those securities, and internal models.
166
TABLE OF CONTENTS
Gramercy Capital Corp.
Notes To Consolidated Financial Statements
(Amounts in thousands, except share and per share data)
December 31, 2010
14. Fair Value of Financial Instruments – (continued)
Mortgage note payable and senior and junior mezzanine loans: These obligations are presented in the consolidated financial statements based on the actual balance outstanding and not at fair value. The fair value was estimated using discounted cash flows methodology, using discount rates that best reflect current market interest rates for financing with similar characteristics and credit quality.
Collateralized debt obligations: These obligations are presented in the consolidated financial statements on the basis of proceeds received at issuance and not at fair value. The fair value was estimated based upon the amount at which similarly placed financial instruments would be valued today.
Derivative instruments: The Company’s derivative instruments, which are primarily comprised of interest rate swap agreements, are carried at fair value in the consolidated financial statements based upon third party valuations.
Junior subordinated debentures: These instruments bear interest at fixed rates. The fair value was estimated by calculating the present value based on current market interest rates.
Disclosure about fair value of financial instruments is based on pertinent information available to the Company at December 31, 2010 and 2009. Although the Company is not aware of any factors that would significantly affect the reasonable fair value amounts, such amounts have not been comprehensively revalued for the purpose of these financial statements since December 31, 2010 and 2009 and current estimates of fair value may differ significantly from the amounts presented herein.
The following discussion of fair value was determined by the Company using available market information and appropriate valuation methodologies. Considerable judgment is necessary to interpret market data and develop estimated fair value. Accordingly, fair values are not necessarily indicative of the amounts the Company could realize on disposition of the financial instruments. Financial instruments with readily available active quoted prices or for which fair value can be measured from actively quoted prices generally will have a higher degree of pricing observability and a lesser degree of judgment utilized in measuring fair value. Conversely, financial instruments rarely traded or not quoted will generally have less, or no, pricing observability and a higher degree of judgment utilized in measuring fair value. The use of different market assumptions and/or estimation methodologies may have a material effect on estimated fair value amounts.
Determining which category an asset or liability falls within the hierarchy requires significant judgment and the Company evaluates its hierarchy disclosures each quarter.
167
TABLE OF CONTENTS
Gramercy Capital Corp.
Notes To Consolidated Financial Statements
(Amounts in thousands, except share and per share data)
December 31, 2010
14. Fair Value of Financial Instruments – (continued)
Fair Value on a Recurring Basis
Assets and liabilities measured at fair value on a recurring basis are categorized in the table below based upon the lowest level of significant input to the valuations.
| | | | | | | | |
| At December 31, 2010 | | Total | | Level I | | Level II | | Level III |
Financial Assets:
| | | | | | | | | | | | | | | | |
Derivative instruments:
| | | | | | | | | | | | | | | | |
| Interest rate caps | | $ | 1,636 | | | $ | — | | | $ | — | | | $ | 1,636 | |
| Interest rate swaps | | | — | | | | — | | | | — | | | | — | |
| | | $ | 1,636 | | | $ | — | | | $ | — | | | $ | 1,636 | |
CMBS available for sale:
| | | | | | | | | | | | | | | | |
| Investment grade | | $ | 20,607 | | | $ | — | | | $ | — | | | $ | 20,607 | |
| Non-investment grade | | | 11,282 | | | | — | | | | — | | | | 11,282 | |
| | | $ | 31,889 | | | $ | — | | | $ | — | | | $ | 31,889 | |
Financial Liabilities:
| | | | | | | | | | | | | | | | |
Derivative instruments:
| | | | | | | | | | | | | | | | |
| Interest rate caps | | $ | — | | | $ | — | | | $ | — | | | $ | — | |
| Interest rate swaps | | | 157,932 | | | | — | | | | — | | | | 157,932 | |
| | | $ | 157,932 | | | $ | — | | | $ | — | | | $ | 157,932 | |
| | | | | | | | |
| At December 31, 2009 | | Total | | Level I | | Level II | | Level III |
Financial Liabilities:
| | | | | | | | | | | | | | | | |
Derivative instruments:
| | | | | | | | | | | | | | | | |
| Interest rate caps | | $ | — | | | $ | — | | | $ | — | | | $ | — | |
| Interest rate swaps | | | 88,786 | | | | — | | | | — | | | | 88,786 | |
| | | $ | 88,786 | | | $ | — | | | $ | — | | | $ | 88,786 | |
Derivative instruments: Interest rate caps and swaps were valued using advice from a third party derivative specialist, based on a combination of observable market-based inputs, such as interest rate curves, and unobservable inputs such as credit valuation adjustments due to the risk of non-performance by both the Company and its counterparties. See Note 18 for additional details on the Company’s interest rate caps and swaps. Derivatives were classified as Level III due to the significance of the credit valuation allowance which is based upon less observable inputs.
Total losses from derivatives for the year ended December 31, 2010 is $70,603 and is included in Accumulated Other Comprehensive Loss. During the year ended December 31, 2010, the Company entered into eight interest rate caps for a total purchase price of $3,162.
CMBS available for sale: CMBS securities are generally valued by a combination of (i) obtaining assessments from third-party dealers and (ii) in limited cases where such assessments are unavailable or, in the opinion of management, deemed not to be indicative of fair value, discounting expected cash flows using internal cash flow models and estimated market discount rates. In the case of internal models, expected cash flows of each security are based on management’s assumptions regarding the collection of principal and interest on the underlying loans and securities. The table above includes only securities which were classified as available for sale as of December 31, 2010.
168
TABLE OF CONTENTS
Gramercy Capital Corp.
Notes To Consolidated Financial Statements
(Amounts in thousands, except share and per share data)
December 31, 2010
14. Fair Value of Financial Instruments – (continued)
The following roll forward table reconciles the beginning and ending balances of financial assets measured at fair value on a recurring basis using Level III inputs:
| | | | | | |
| | CMBS
available for
sale – investment
grade | | CMBS
available for
sale – non-investment
grade | | Derivative
instruments |
| Balance as of December 31, 2009 | | $ | — | | | $ | — | | | $ | — | |
| Transfers from securities held to maturity | | | 6,855 | | | | 2,618 | | | | — | |
| Purchases of CMBS investments | | | 12,354 | | | | 8,080 | | | | — | |
| Purchases of derivative investments | | | — | | | | — | | | | 3,162 | |
Adjustments to fair value:
| | | | | | | | | | | | |
| Included in other comprehensive income | | | 1,398 | | | | 584 | | | | (1,526 | ) |
| Other-than-temporary impairments | | | — | | | | — | | | | — | |
| Balance as of December 31, 2010 | | $ | 20,607 | | | $ | 11,282 | | | $ | 1,636 | |
The following roll forward table reconciles the beginning and ending balances of financial liabilities measured at fair value on a recurring basis using Level III inputs:
| | |
| | Derivative instruments –
interest rate swaps |
| Balance as of December 31, 2009 | | $ | 88,786 | |
| Purchases of derivative investments | | | — | |
Adjustments to fair value:
| | | | |
| Unrealized loss | | | 69,146 | |
| Balance as of December 31, 2010 | | $ | 157,932 | |
169
TABLE OF CONTENTS
Gramercy Capital Corp.
Notes To Consolidated Financial Statements
(Amounts in thousands, except share and per share data)
December 31, 2010
14. Fair Value of Financial Instruments – (continued)
Fair Value on a Non-Recurring Basis
The Company uses fair value measurements on a nonrecurring basis in its assessment of assets classified as loans and other lending investments, which are reported at cost and have been written down to fair value as a result of valuation allowances established for loan losses and commercial mortgage-backed securities which are reported at cost and have been written down to fair value due to other-than-temporary impairments. The following table shows the fair value hierarchy for those assets measured at fair value on a non-recurring basis based upon the lowest level of significant input to the valuations for which a non-recurring change in fair value has been recorded during the years ended December 31, 2010 and December 31, 2009:
| | | | | | | | |
| At December 31, 2010 | | Total | | Level I | | Level II | | Level III |
Assets:
| | | | | | | | | | | | | | | | |
Real estate investments:
| | | | | | | | | | | | | | | | |
| Office | | $ | 1,097,535 | | | $ | — | | | $ | — | | | $ | 1,097,535 | |
| Branch | | | 484,629 | | | | — | | | | — | | | | 484,629 | |
| Land | | | — | | | | — | | | | — | | | | — | |
| | | $ | 1,582,164 | | | $ | — | | | $ | — | | | $ | 1,582,164 | |
Lending investments:
| | | | | | | | | | | | | | | | |
| Whole loans | | $ | 212,633 | | | $ | — | | | $ | — | | | $ | 212,633 | |
| Subordinate interests in whole loans | | | — | | | | — | | | | — | | | | — | |
| Mezzanine loans | | | 22,337 | | | | — | | | | — | | | | 22,337 | |
| Preferred equity | | | — | | | | — | | | | — | | | | — | |
| | | $ | 234,970 | | | $ | — | | | $ | — | | | $ | 234,970 | |
CMBS held-to-maturity:
| | | | | | | | | | | | | | | | |
| Investment grade | | $ | — | | | $ | — | | | $ | — | | | $ | — | |
| Non-investment grade | | | — | | | | — | | | | — | | | | — | |
| | | $ | — | | | $ | — | | | $ | — | | | $ | — | |
| | | | | | | | |
| At December 31, 2009 | | Total | | Level I | | Level II | | Level III |
Assets:
| | | | | | | | | | | | | | | | |
Lending investments:
| | | | | | | | | | | | | | | | |
| Whole loans | | $ | 419,881 | | | $ | — | | | $ | — | | | $ | 419,881 | |
| Subordinate interests in whole loans | | | — | | | | — | | | | — | | | | — | |
| Mezzanine loans | | | 73,792 | | | | — | | | | — | | | | 73,792 | |
| Preferred equity | | | 32,484 | | | | — | | | | — | | | | 32,484 | |
| | | $ | 526,157 | | | $ | — | | | $ | — | | | $ | 526,157 | |
CMBS held-to-maturity:
| | | | | | | | | | | | | | | | |
| Investment grade | | $ | — | | | $ | — | | | $ | — | | | $ | — | |
| Non-investment grade | | | 1,324 | | | | — | | | | — | | | | 1,324 | |
| | | $ | 1,324 | | | $ | — | | | $ | — | | | $ | 1,324 | |
The total change in fair value of financial instruments for which a fair value adjustment has been included in the Consolidated Statements of Operations for the years ended December 31, 2010 and December 31, 2009 were $84,392 and $517,784, respectively.
170
TABLE OF CONTENTS
Gramercy Capital Corp.
Notes To Consolidated Financial Statements
(Amounts in thousands, except share and per share data)
December 31, 2010
14. Fair Value of Financial Instruments – (continued)
Real Estate investments: The properties identified for impairment are collateral under the Goldman Mezzanine Loans. The impairment is calculated by comparing the company’s internally developed discounted cash flow methodology to the carrying value of the respective property. The discounted cash flows require significant judgmental inputs on each property, which include assumptions regarding capitalization rates, lease-up periods, future occupancy rates, market rental rates, holding periods, capital improvements and other factors deemed necessary by management.
Loans subject to impairments or reserves for loan loss: The loans identified for impairment or reserves for loan loss are collateral dependant loans. Impairment or reserves for loan loss on these loans are measured by comparing management’s estimation of fair value of the underlying collateral to the carrying value of the respective loan. These valuations require significant judgments, which include assumptions regarding capitalization rates, leasing, creditworthiness of major tenants, occupancy rates, availability of financing, exit plan, loan sponsorship, actions of other lenders and other factors deemed necessary by management.
CMBS: CMBS securities which are other-than-temporarily impaired are generally valued by a combination of (i) obtaining assessments from third-party dealers and, (ii) in limited cases where such assessments are unavailable or, in the opinion of management deemed not to be indicative of fair value, discounting expected cash flows using internal cash flow models and estimated market discount rates. In the case of internal models, expected cash flows of each security are based on management’s assumptions regarding the collection of principal and interest on the underlying loans and securities. The table above includes only securities which were impaired during the year ended December 31, 2010. Previously impaired securities have been subsequently adjusted for amortization, and are therefore no longer reported at fair value as of December 31, 2010.
The valuations derived from pricing models may include adjustments to the financial instruments. These adjustments may be made when, in management’s judgment, either the size of the position in the financial instrument or other features of the financial instrument such as its complexity, or the market in which the financial instrument is traded (such as counterparty, credit, concentration or liquidity) require that an adjustment be made to the value derived from the pricing models. Additionally, an adjustment from the price derived from a model typically reflects management’s judgment that other participants in the market for the financial instrument being measured at fair value would also consider such an adjustment in pricing that same financial instrument.
Assets and liabilities presented at fair value and categorized as Level III are generally those that are marked to model using relevant empirical data to extrapolate an estimated fair value. The models’ inputs reflect assumptions that market participants would use in pricing the instrument in a current period transaction and outcomes from the models represent an exit price and expected future cash flows. The parameters and inputs are adjusted for assumptions about risk and current market conditions. Changes to inputs in valuation models are not changes to valuation methodologies; rather, the inputs are modified to reflect direct or indirect impacts on asset classes from changes in market conditions. Accordingly, results from valuation models in one period may not be indicative of future period measurements.
15. Stockholders’ Equity
The Company’s authorized capital stock consists of 125,000,000 shares, $0.001 par value, of which the Company has authorized the issuance of up to 100,000,000 shares of common stock, $0.001 par value per share, and 25,000,000 shares of preferred stock, par value $0.001 per share. As of December 31, 2010, 49,984,559 shares of common stock and 3,525,822 shares of preferred stock were issued and outstanding.
171
TABLE OF CONTENTS
Gramercy Capital Corp.
Notes To Consolidated Financial Statements
(Amounts in thousands, except share and per share data)
December 31, 2010
15. Stockholders’ Equity – (continued)
Preferred Stock
In April 2007, the Company issued 4,600,000 shares of its 8.125% Series A cumulative redeemable preferred stock (including the underwriters’ over-allotment option of 600,000 shares) with a mandatory liquidation preference of $25.00 per share. Holders of the Series A cumulative redeemable preferred shares are entitled to receive annual dividends of $2.03125 per share on a quarterly basis and dividends are cumulative, subject to certain provisions. On or after April 18, 2012, the Company may at its option redeem the Series A cumulative redeemable preferred stock at par for cash. Net proceeds (after deducting underwriting fees and expenses) from the offering were approximately $111,205.
In November 2010, the Company settled a tender offer to purchase up to 4,000,000 shares of our Series A preferred stock for $15.00 per preferred share, net to seller in cash. In the aggregate, we paid approximately $16,620 to acquire the 1,074,178 shares of the Series A preferred stock tendered and not withdrawn. The shares of Series A preferred stock acquired by the Company were retired upon receipt and accrued and unpaid dividends of $4,364 or $4.0625 per share of the acquired preferred stock were eliminated. After settlement of the tender offer, 3,525,822 shares of Series A preferred stock remain outstanding for trading on the NYSE.
The $13,713 excess of the $30,332 carrying value of the tendered preferred stock, including accrued dividends of $4,364, over the $16,620 of consideration paid was recorded as a decrease to net loss available to common stockholders.
Beginning with the fourth quarter of 2008, the Company’s board of directors elected not to pay the quarterly Series A preferred stock dividends of $0.50781 per share. As of December 31, 2010 and 2009, the Company accrued Series A preferred stock dividends of $16,114 and $11,707, respectively. As a result, the Company has accrued dividends for over six quarters which pursuant to the terms of its charter, permits the Series A preferred stockholders to elect an additional director to the board of directors. The Company may, or upon request of the holders of the Series A preferred stock representing 20% or more of the liquidation value of the Series A preferred stock, call a special meeting of our stockholders to elect such additional director in accordance with the provisions of the bylaws and other procedures established by the Company’s board of directors relating to election of directors.
Equity Incentive Plan
As part of the Company’s initial public offering, the Company instituted its Equity Incentive Plan. The Equity Incentive Plan, as amended, authorizes (i) the grant of stock options that qualify as incentive stock options under Section 422 of the Internal Revenue Code, or ISOs, (ii) the grant of stock options that do not qualify, or NQSOs, (iii) the grant of stock options in lieu of cash directors’ fees and (iv) grants of shares of restricted and unrestricted common stock. The exercise price of stock options will be determined by the compensation committee, but may not be less than 100% of the fair market value of the shares of common stock on the date of grant. At December 31, 2010, 1,656,711 shares of common stock were available for issuance under the Equity Incentive Plan.
Options granted under the Equity Incentive Plan to recipients who are employees of Gramercy are exercisable at the fair market value on the date of grant and, subject to termination of employment, expire ten years from the date of grant, are not transferable other than on death, and are exercisable in three to four annual installments commencing one year from the date of grant. In some instances, options may be granted under the Equity Incentive Plan to persons who provide significant services to the Company but are not employees of the Company. Options granted to recipients that are not employees have the same terms as those issued to employees except as it relates to any performance-based provisions within the grant. To the extent there are performance provisions associated with a grant to a recipient who is not an employee, an
172
TABLE OF CONTENTS
Gramercy Capital Corp.
Notes To Consolidated Financial Statements
(Amounts in thousands, except share and per share data)
December 31, 2010
15. Stockholders’ Equity – (continued)
estimated expense related to these options is recognized over the vesting period and the final expense is reconciled at the point performance has been met, or the measurement date. If no performance based provision exists, the fair value of the options is calculated on a quarterly basis and the related expense is recognized over the vesting period.
A summary of the status of the Company’s stock options as of December 31, 2010 and December 31, 2009 are presented below:
| | | | | | | | |
| | December 31, 2010 | | December 31, 2009 |
| | | Options
Outstanding | | Weighted
Average
Exercise
Price | | Options
Outstanding | | Weighted
Average
Exercise
Price |
| Balance at beginning of period | | | 1,516,394 | | | $ | 16.70 | | | | 1,691,336 | | | $ | 17.61 | |
| Granted | | | 25,000 | | | | 2.73 | | | | 30,000 | | | | 1.25 | |
| Exercised | | | — | | | | — | | | | — | | | | — | |
| Lapsed or cancelled | | | (700,017 | ) | | | 22.07 | | | | (204,942 | ) | | | 21.92 | |
| Balance at end of period | | | 841,377 | | | $ | 11.82 | | | | 1,516,394 | | | $ | 16.70 | |
For the year ended December 31, 2010, all options were granted with a price of $2.73. The remaining weighted average contractual life of the options was 6.1 years. Compensation expense of $180, $119 and $792 was recorded for the years ended December 31, 2010, 2009 and 2008, respectively, related to the issuance of stock options.
Through December 31, 2010, 1,192,988 restricted shares had been issued under the Equity Incentive Plan, of which 73% have vested. The vested and unvested shares are currently entitled to receive distributions on common stock if declared by the Company. Holders of restricted shares are prohibited from selling such shares until they vest but are provided the ability to vote such shares beginning on the date of grant. Compensation expense of $369, $333 and $2,422 was recorded for the years ended December 31, 2010, 2009 and 2008, respectively, related to the issuance of restricted shares.
Employee Stock Purchase Plan
In November 2007, the Company’s board of directors adopted, and the stockholders subsequently approved in June 2008, the 2008 Employee Stock Purchase Plan, or ESPP, to provide equity-based incentives to eligible employees. The ESPP is intended to qualify as an “employee stock purchase plan” under Section 423 of the Internal Revenue Code of 1986, as amended, and has been adopted by the board to enable the Company’s eligible employees to purchase its shares of common stock through payroll deductions. The ESPP became effective on January 1, 2008 with a maximum of 250,000 shares of the common stock available for issuance, subject to adjustment upon a merger, reorganization, stock split or other similar corporate change. The Company filed a registration statement on Form S-8 with the Securities and Exchange Commission with respect to the ESPP. The common stock is offered for purchase through a series of successive offering periods. Each offering period will be three months in duration and will begin on the first day of each calendar quarter, with the first offering period having commenced on January 1, 2008. The ESPP provides for eligible employees to purchase the common stock at a purchase price equal to 85% of the lesser of (1) the market value of the common stock on the first day of the offering period or (2) the market value of the common stock on the last day of the offering period.
Deferred Stock Compensation Plan for Directors
Under the Company’s Independent Director’s Deferral Program, which commenced April 2005, the Company’s independent directors may elect to defer up to 100% of their annual retainer fee, chairman fees and meeting fees. Unless otherwise elected by a participant, fees deferred under the program shall be credited
173
TABLE OF CONTENTS
Gramercy Capital Corp.
Notes To Consolidated Financial Statements
(Amounts in thousands, except share and per share data)
December 31, 2010
15. Stockholders’ Equity – (continued)
in the form of phantom stock units. The phantom stock units are convertible into an equal number of shares of common stock upon such directors’ termination of service from the board of directors or a change in control by the Company, as defined by the program. Phantom stock units are credited to each independent director quarterly using the closing price of the Company’s common stock on the applicable dividend record date for the respective quarter. If dividends are declared by the Company, each participating independent director who elects to receive fees in the form of phantom stock units has the option to have their account credited for an equivalent amount of phantom stock units based on the dividend rate for each quarter or have dividends paid in cash.
As of December 31, 2010, there were approximately 414,108 phantom stock units outstanding, of which 408,108 units are vested.
Earnings per Share
Earnings per share for the years ended 2010, 2009 and 2008 are computed as follows:
| | | | | | |
| | For the Year Ended December 31,(1) |
| | | 2010 | | 2009 | | 2008 |
Numerator – Income (loss)
| | | | | | | | | | | | |
| Net income (loss) from continuing operations | | $ | (942,095 | ) | | $ | (522,951 | ) | | $ | 43,897 | |
| Net income (loss) from discontinued operations | | | (31,593 | ) | | | 3,322 | | | | 15,406 | |
| Net Income (loss) | | | (973,688 | ) | | | (519,629 | ) | | | 59,303 | |
| Preferred stock dividends | | | (8,798 | ) | | | (9,414 | ) | | | (9,344 | ) |
| Excess of carrying amount of tendered preferred stock over consideration paid | | | 13,713 | | | | — | | | | — | |
| Numerator for basic income per share – Net income (loss) available to common stockholders: | | | (968,773 | ) | | | (529,043 | ) | | | 49,959 | |
| Effect of dilutive securities | | | — | | | | — | | | | — | |
Diluted Earnings:
| | | | | | | | | | | | |
| Net income (loss) available to common stockholders | | $ | (968,773 | ) | | $ | (529,043 | ) | | $ | 49,959 | |
Denominator – Weighted Average shares:
| | | | | | | | | | | | |
| Denominator for basic income per share – weighted average shares | | | 49,923,930 | | | | 49,854,174 | | | | 47,205,078 | |
Effect of dilutive securities
| | | | | | | | | | | | |
| Stock based compensation plans | | | — | | | | — | | | | 50,348 | |
| Phantom stock units | | | — | | | | — | | | | 74,756 | |
| Diluted shares | | | 49,923,930 | | | | 49,854,174 | | | | 47,330,182 | |
| (1) | Net income (loss) adjusted for non-controlling interests. |
Diluted income (loss) per share assumes the conversion of all common share equivalents into an equivalent number of common shares if the effect is not anti-dilutive. For the year ended December 31, 2010, 208,821 share options and 414,108 phantom share units, respectively, were computed using the treasury share
174
TABLE OF CONTENTS
Gramercy Capital Corp.
Notes To Consolidated Financial Statements
(Amounts in thousands, except share and per share data)
December 31, 2010
15. Stockholders’ Equity – (continued)
method, which due to the net loss were anti-dilutive. For the year ended December 31, 2009, 179,990 share options and 272,652 phantom share units, respectively, were computed using the treasury share method, which due to the net loss were anti-dilutive.
Accumulated other comprehensive income (loss) for the years ended December 31, 2010 and 2009 is comprised of the following:
| | | | |
| | December 31,
2010 | | December 31,
2009 |
| Net unrealized loss on held-to-maturity securities | | $ | — | | | $ | (3,906 | ) |
| Net realized and unrealized losses on interest rate swap and cap agreements accounted for as cash flow hedges and FV adjustment of available-for-sale securities | | | (160,785 | ) | | | (92,132 | ) |
| Total accumulated other comprehensive loss | | $ | (160,785 | ) | | $ | (96,038 | ) |
16. Benefit Plans
In June 2009, the Company implemented a 401(K) Savings/Retirement Plan, or the 401(K) Plan, to cover eligible employees of the Company, and any designated affiliate. The 401(K) Plan permits eligible employees to defer up to 15% of their annual compensation, subject to certain limitations imposed by the Code. The employees’ elective deferrals are immediately vested and non-forfeitable. The 401(K) Plan provides for discretionary matching contributions by the Company. Prior to the implementation of the 401(K) Plan, as an affiliate of SL Green, the Company’s employees were eligible to participate in a 401(K) Savings/Retirement Plan implemented by SL Green. Except for the 401(k) Plan, at December 31, 2010, the Company did not maintain a defined benefit pension plan, post-retirement health and welfare plan or other benefit plans. The expense associated with the Company’s matching contribution was $367, $62 and $0 for the years ended December 31, 2010, 2009 and 2008, respectively.
17. Commitments and Contingencies
The Company and the Operating Partnership are not presently involved in any material litigation nor, to the Company’s knowledge, is any material litigation threatened against the Company or its investments, other than routine litigation arising in the ordinary course of business. Management believes the costs, if any, incurred by the Operating Partnership and the Company related to litigation will not materially affect its financial position, operating results or liquidity.
The Company’s corporate offices at 420 Lexington Avenue, New York, New York are subject to an operating lease agreement with SLG Graybar Sublease LLC, an affiliate of SL Green, effective May 1, 2005. The lease is for approximately 7,300 square feet and carries a term of 10 years with rents of approximately $249 per annum for year one rising to $315 per annum in year ten. In May and June 2009, the Company amended its lease with SLG Graybar Sublease LLC to increase the leased premises by approximately 2,260 square feet. The additional premises is leased on a co-terminus basis with the remainder of the Company’s leased premises and carries rents of approximately $103 per annum during the initial lease year and $123 per annum during the final lease year.
As of December 31, 2010, the Company leased certain of its commercial properties from third parties with expiration dates extending to the year 2085 and has various ground leases with expiration dates extending through 2101. These lease obligations generally contain rent increases and renewal options.
175
TABLE OF CONTENTS
Gramercy Capital Corp.
Notes To Consolidated Financial Statements
(Amounts in thousands, except share and per share data)
December 31, 2010
17. Commitments and Contingencies – (continued)
Future minimum lease payments under non-cancelable operating leases as of December 31, 2010 are as follows:
| | |
| | Operating
Leases |
| 2011 | | $ | 21,299 | |
| 2012 | | | 21,045 | |
| 2013 | | | 20,561 | |
| 2014 | | | 19,978 | |
| 2015 | | | 19,157 | |
| Thereafter | | | 159,090 | |
| Total minimum lease payments | | $ | 261,130 | |
The Company, through certain of its subsidiaries, may be required in its role in connection with its CDOs, to repurchase loans that it contributed to its CDOs in the event of breaches of certain representations or warranties provided at the time the CDOs were formed and the loans contributed. These obligations do not relate to the credit performance of the loans or other collateral contributed to the CDOs, but only to breaches of specific representations and warranties. Since inception, the Company has not been required to make any repurchases.
Certain real estate assets are pledged as collateral for mortgage loans held by two of its CDOs. One mortgage borrowing of $62,379 is also guaranteed by the Company. In connection with the Settlement Agreement, the Company was released under this guarantee in September 2011.
18. Financial Instruments: Derivatives and Hedging
The Company recognizes all derivatives on the balance sheet at fair value. Derivatives that are not hedges must be adjusted to fair value through income. If a derivative is a hedge, depending on the nature of the hedge, changes in the fair value of the derivative will either be offset against the change in fair value of the hedged asset, liability or firm commitment through earnings, or recognized in other comprehensive income until the hedged item is recognized in earnings. The ineffective portion of a derivative’s change in fair value will be immediately recognized in earnings. Derivative accounting may increase or decrease reported net income and stockholders’ equity prospectively, depending on future levels of LIBOR interest rates and other variables affecting the fair values of derivative instruments and hedged items, but will have no effect on cash flows, provided the contract is carried through to full term.
176
TABLE OF CONTENTS
Gramercy Capital Corp.
Notes To Consolidated Financial Statements
(Amounts in thousands, except share and per share data)
December 31, 2010
18. Financial Instruments: Derivatives and Hedging – (continued)
The following table summarizes the notional and fair value of the Company’s derivative financial instruments at December 31, 2010. The notional value is an indication of the extent of the Company’s involvement in this instrument at that time, but does not represent exposure to credit, interest rate or market risks:
| | | | | | | | | | | | |
| | Benchmark Rate | | Notional
Value | | Strike Rate | | Effective
Date | | Expiration
Date | | Fair Value |
Assets of Non-VIEs:
| | | | | | | | | | | | | | | | | | | | | | | | |
| Interest Rate Cap | | | 1 month LIBOR | | | $ | 91,698 | | | | 2.00 | % | | | Mar-10 | | | | Mar-11 | | | $ | — | |
| Interest Rate Cap | | | 1 month LIBOR | | | | 241,324 | | | | 6.00 | % | | | Mar-10 | | | | Mar-11 | | | | — | |
| Interest Rate Cap | | | 1 month LIBOR | | | | 461,573 | | | | 2.00 | % | | | Mar-10 | | | | Mar-11 | | | | — | |
| Interest Rate Cap | | | 3 month LIBOR | | | | 38,500 | | | | 6.00 | % | | | Jul-10 | | | | Jul-12 | | | | 4 | |
| | | | | | | | 833,095 | | | | | | | | | | | | | | | | 4 | |
Assets of Consolidated VIEs:
| | | | | | | | | | | | | | | | | | | | | | | | |
| Interest Rate Cap | | | 3 month LIBOR | | | | 10,828 | | | | 4.73 | % | | | Dec-10 | | | | Feb-15 | | | | 68 | |
| Interest Rate Cap | | | 3 month LIBOR | | | | 8,877 | | | | 5.04 | % | | | Oct-10 | | | | Feb-16 | | | | 112 | |
| Interest Rate Cap | | | 3 month LIBOR | | | | 23,000 | | | | 4.96 | % | | | Jun-10 | | | | Apr-17 | | | | 350 | |
| Interest Rate Cap | | | 3 month LIBOR | | | | 48,945 | | | | 4.80 | % | | | Mar-10 | | | | Jul-17 | | | | 1,102 | |
| | | | | | | | 91,650 | | | | | | | | | | | | | | | | 1,632 | |
Liabilities of Consolidated VIEs:
| | | | | | | | | | | | | | | | | | | | | | | | |
| Interest Rate Swap | | | 3 month LIBOR | | | | 12,000 | | | | 9.85 | % | | | Aug-06 | | | | Aug-11 | | | | (355 | ) |
| Interest Rate Swap | | | 3 month LIBOR | | | | 4,700 | | | | 3.17 | % | | | Apr-08 | | | | Apr-12 | | | | (162 | ) |
| Interest Rate Swap | | | 3 month LIBOR | | | | 10,000 | | | | 3.92 | % | | | Oct-08 | | | | Oct-13 | | | | (748 | ) |
| Interest Rate Swap | | | 3 month LIBOR | | | | 17,500 | | | | 3.92 | % | | | Oct-08 | | | | Oct-13 | | | | (1,309 | ) |
| Interest Rate Swap | | | 1 month LIBOR | | | | 8,993 | | | | 4.26 | % | | | Aug-08 | | | | Jan-15 | | | | (870 | ) |
| Interest Rate Swap | | | 3 month LIBOR | | | | 14,650 | | | | 4.43 | % | | | Nov-07 | | | | Jul-15 | | | | (1,542 | ) |
| Interest Rate Swap | | | 3 month LIBOR | | | | 24,143 | | | | 5.11 | % | | | Feb-08 | | | | Jan-17 | | | | (3,442 | ) |
| Interest Rate Swap | | | 3 month LIBOR | | | | 281,391 | | | | 5.41 | % | | | Aug-07 | | | | May-17 | | | | (38,218 | ) |
| Interest Rate Swap | | | 3 month LIBOR | | | | 16,412 | | | | 5.20 | % | | | Feb-08 | | | | May-17 | | | | (2,447 | ) |
| Interest Rate Swap | | | 3 month LIBOR | | | | 699,442 | | | | 5.33 | % | | | Aug-07 | | | | Jan-18 | | | | (108,839 | ) |
| | | | | | | | 1,089,231 | | | | | | | | | | | | | | | | (157,932 | ) |
| Total | | | | | | $ | 2,013,976 | | | | | | | | | | | | | | | $ | (156,296 | ) |
The Company is hedging exposure to variability in future interest payments on its debt facilities. At December 31, 2010, derivative instruments were reported at their fair value as a net liability of $156,296. Offsetting adjustments are represented as deferred gains in Accumulated Other Comprehensive Income of $70,603, which includes the amortization of gain or (loss) on terminated hedges of $201 for the year ended December 31, 2010. The Company anticipates recognizing approximately $400 in amortization over the next 12 months. For the year ended December 31, 2010, the Company recognized a decrease to interest expense of $207 attributable to any ineffective component of its derivative instruments designated as cash flow hedges. Currently, all derivative instruments are designated as cash flow hedging instruments. Over time, the realized and unrealized gains and losses held in Accumulated Other Comprehensive Income will be reclassified into earnings in the same periods in which the hedged interest payments affect earnings.
177
TABLE OF CONTENTS
Gramercy Capital Corp.
Notes To Consolidated Financial Statements
(Amounts in thousands, except share and per share data)
December 31, 2010
19. Income Taxes
The Company has elected to be taxed as a REIT, under Sections 856 through 860 of the Internal Revenue Code beginning with its taxable year ended December 31, 2004. To qualify as a REIT, the Company must meet certain organizational and operational requirements, including a requirement to distribute at least 90% of its ordinary taxable income to stockholders. As a REIT, the Company generally will not be subject to U.S. federal income tax on taxable income that it distributes to its stockholders. If the Company fails to qualify as a REIT in any taxable year, it will then be subject to U.S. federal income taxes on taxable income at regular corporate rates and will not be permitted to qualify for treatment as a REIT for U.S. federal income tax purposes for four years following the year during which qualification is lost unless the Internal Revenue Service grants the Company relief under certain statutory provisions. Such an event could materially adversely affect the Company’s net income and net cash available for distributions to stockholders. However, the Company believes that it is organized and will operate in such a manner as to qualify for treatment as a REIT and the Company intends to operate in the foreseeable future in such a manner so that it will qualify as a REIT for U.S. federal income tax purposes. The Company may, however, be subject to certain state and local taxes.
Beginning with the third quarter of 2008, the Company’s board of directors elected to not pay dividend to common stockholders. The board of directors also elected not to pay the Series A preferred stock dividend of $0.50781 per share beginning with the fourth quarter of 2008. The unpaid preferred stock dividend has been accrued for nine quarters as of December 31, 2010. Based on current estimates of its taxable loss, the Company has no distribution requirements in order to maintain its REIT status for the 2010 tax year and it expects that it will continue to elect to retain capital for liquidity purposes until required to make a cash distribution to maintain its REIT status. The Company may elect to pay dividends on its common stock in cash or a combination of cash and shares of common stock as permitted under U.S. federal income tax laws governing REIT distribution requirements. However, in accordance with the provisions of the Company’s charter, the Company may not pay any dividends on its common stock until all accrued dividends and the dividend for the then current quarter on the Series A preferred stock are paid in full.
For the years ended December 31, 2010, 2009 and 2008, the Company recorded $966, $2,495 and $53 of income tax expense, respectively. Tax expense for the year ended December 31, 2009 was comprised entirely of state and local taxes. Included in tax expense for the years ended December 31, 2010 and 2009 is an accrual for state income taxes on the gain from extinguishment of debt. Under federal law, the Company is allowed to defer these gains until 2014, however, not all states follow the federal rule.
As of December 31, 2010, the Company and each of its six subsidiaries which file corporate tax returns, had total net loss carryforwards, inclusive of net operating losses and capital losses, of approximately $511,000. Net operating loss carryforwards and capital loss carryforwards can generally be used to offset future ordinary income and capital gains of the entity originating the losses, for up to 20 years and 5 years, respectively. The amounts of net operating loss carryforwards and capital loss carryforwards as of December 31, 2010 are subject to the completion of the 2010 tax returns. In January 2011, the Company and two of its subsidiaries experienced an ownership change, as defined for purposes of Section 382 of the Internal Revenue Code of 1986, as amended. In general, an “ownership change” occurs if there is a change in ownership of more than 50% of its common stock during a cumulative three year period. For this purpose, determinations of ownership changes are generally limited to shareholders deemed to own 5% or more of the Company’s common stock. The provisions of Section 382 will apply an annual limit to the amount of net loss carryforwards that can be used to offset future ordinary income and capital gains, beginning with the 2011 taxable year.
178
TABLE OF CONTENTS
Gramercy Capital Corp.
Notes To Consolidated Financial Statements
(Amounts in thousands, except share and per share data)
December 31, 2010
20. Environmental Matters
The Company believes that it is in compliance in all material respects with applicable Federal, state and local ordinances and regulations regarding environmental issues. Its management is not aware of any environmental liability that it believes would have a materially adverse impact on the Company’s financial position, results of operations or cash flows.
21. Segment Reporting
The Company has determined that it has two reportable operating segments: Finance and Real Estate. The reportable segments were determined based on the management approach, which looks to the Company’s internal organizational structure. These two lines of business require different support infrastructures.
The Real Estate segment includes substantially all of the Company’s activities related to the ownership and leasing of commercial real estate and credit net lease properties. In connection with the Company’s significant increase in the size and scope of its real estate portfolio resulting from the American Financial acquisition, the Company initiated the build-out of an integrated asset management platform within Gramercy Realty to consolidate responsibility for, and control over, leasing, lease administration, property management and tenant relationship management.
The Finance segment includes all of the Company’s activities related to senior and mezzanine real estate debt and senior and mezzanine capital investment activities and the financing thereof, including the Company’s CMBS investments. These include a dedicated management team within Gramercy Finance for real estate lending origination, acquisition and portfolio management.
The Company evaluates performance based on the following financial measures for each segment:
| | | | | | | | |
| | Realty(1) | | Finance | | Corporate/
Other(2) | | Total Company |
Year Ended December 31, 2010
| | | | | | | | | | | | | | | | |
| Total revenues(3) | | $ | 428,921 | | | $ | 178,227 | | | $ | — | | | $ | 607,148 | |
| Equity in net loss from unconsolidated joint ventures | | | (2,884 | ) | | | (1,255 | ) | | | — | | | | (4,139 | ) |
| Total operating and interest expense(4) | | | (1,315,020 | ) | | | (196,547 | ) | | | (33,292 | ) | | | (1,544,859 | ) |
| Net loss from continuing operations(5) | | $ | (888,983 | ) | | $ | (19,575 | ) | | $ | (33,292 | ) | | $ | (941,850 | ) |
| | | | | | | | |
| | Realty(1) | | Finance | | Corporate/
Other(2) | | Total Company |
Year Ended December 31, 2009
| | | | | | | | | | | | | | | | |
| Total revenues(3) | | $ | 440,520 | | | $ | 186,568 | | | $ | — | | | $ | 627,088 | |
| Equity in net loss from unconsolidated joint ventures | | | (2,637 | ) | | | 113 | | | | — | | | | (2,524 | ) |
| Total operating and interest expense(4) | | | (443,292 | ) | | | (660,862 | ) | | | (43,173 | ) | | | (1,147,327 | ) |
| Net loss from continuing operations(5) | | $ | (5,409 | ) | | $ | (474,181 | ) | | $ | (43,173 | ) | | $ | (522,763 | ) |
Total Assets:
| | | | | | | | | | | | | | | | |
| December 31, 2010 | | $ | 2,834,035 | | | $ | 3,558,472 | | | $ | (900,514 | ) | | $ | 5,491,993 | |
| December 31, 2009 | | $ | 3,883,279 | | | $ | 3,787,371 | | | $ | (905,213 | ) | | $ | 6,765,437 | |
179
TABLE OF CONTENTS
Gramercy Capital Corp.
Notes To Consolidated Financial Statements
(Amounts in thousands, except share and per share data)
December 31, 2010
21. Segment Reporting – (continued)
| (1) | As a result of the Settlement Agreement that the Company entered into in September 2011, for an orderly transition of substantially all of Gramercy Realty’s assets to Gramercy Realty’s senior mezzanine lenders, the segment will significantly change in future periods. For more information about the Settlement Agreement, see Note 24. |
| (2) | Corporate and Other represents all corporate level items, including general and administrative expenses and any intercompany elimination necessary to reconcile to the consolidated Company totals. |
| (3) | Total revenue represents all revenue earned during the period from the assets in each segment. Revenue from the Finance business primarily represents interest income and revenue from the Real Estate business primarily represents operating lease income. |
| (4) | Total operating and interest expense includes provision for loan losses for the Structured Finance business and operating costs on commercial property assets for the Real Estate business, and impairment charges relating to the Gramercy Realty properties collateralized under the Goldman Mezzanine Loans and interest expense and gain on early extinguishment of debt, specifically related to each segment. General and administrative expense is included in Corporate/Other for all periods. Depreciation and amortization of $108,232 and $111,681 for the years ended December 31, 2010 and 2009, respectively, is included in the amounts presented above. |
| (5) | Net loss from continuing operations represents loss before non-controlling interest and discontinued operations. |
22. Supplemental Disclosure of Non-Cash Investing and Financing Activities
The following table represents non-cash activities recognized in other comprehensive income for the years ended December 31, 2010, 2009 and 2008:
| | | | | | |
| | 2010 | | 2009 | | 2008 |
| Deferred losses and other non-cash activity related to derivatives | | $ | (70,603 | ) | | $ | 63,621 | | | $ | (85,350 | ) |
| Reclassification of adjustments of net unrealized loss on securities previously available for sale | | $ | 5,856 | | | $ | 1,080 | | | $ | 589 | |
180
TABLE OF CONTENTS
Gramercy Capital Corp.
Notes To Consolidated Financial Statements
(Amounts in thousands, except share and per share data)
December 31, 2010
23. Quarterly Financial Data (unaudited)
This unaudited interim financial information has been adjusted to reflect the effects of the reclassification of assets between held for investment and discontinued operations during the year ended December 31, 2010. The quarterly data for the last two years is presented below.
| | | | | | | | |
| 2010 Quarter Ended | | December 31 | | September 30 | | June 30 | | March 31 |
| Total Revenues | | $ | 149,503 | | | $ | 152,840 | | | $ | 151,761 | | | $ | 153,044 | |
| Income (loss) before equity in net income of joint ventures, provision for taxes, minority interest and discontinued operations | | | (931,375 | ) | | | 927 | | | | 6,083 | | | | (31,823 | ) |
| Equity in net loss of unconsolidated joint ventures | | | (753 | ) | | | (699 | ) | | | (1,016 | ) | | | (1,671 | ) |
| Income (loss) from continuing operations before provision for taxes and gain on extinguishment of debt and discontinued operations | | | (932,128 | ) | | | 228 | | | | 5,067 | | | | (33,494 | ) |
| Gain on extinguishment of debt | | | — | | | | 11,703 | | | | — | | | | 7,740 | |
| Provision for taxes | | | (843 | ) | | | (19 | ) | | | (66 | ) | | | (38 | ) |
| Net income (loss) from continuing operations | | | (932,971 | ) | | | 11,912 | | | | 5,001 | | | | (25,792 | ) |
| Net income (loss) from discontinued operations | | | (34,426 | ) | | | (4,702 | ) | | | 4,031 | | | | 3,404 | |
| Net income (loss) | | | (967,397 | ) | | | 7,210 | | | | 9,032 | | | | (22,388 | ) |
| Net (income) loss attributable to non-controlling interest | | | (61 | ) | | | (60 | ) | | | 20 | | | | (44 | ) |
| Net income (loss) attributable to Gramercy Capital Corp. | | | (967,458 | ) | | | 7,150 | | | | 9,052 | | | | (22,432 | ) |
| Preferred stock dividends | | | (1,790 | ) | | | (2,336 | ) | | | (2,336 | ) | | | (2,336 | ) |
| Excess of carrying amount of tendered preferred stock over consideration paid | | | 13,713 | | | | — | | | | — | | | | — | |
| Net income (loss) available to common stockholders | | $ | (955,535 | ) | | $ | 4,814 | | | $ | 6,716 | | | $ | (24,768 | ) |
Basic earnings per share:
| | | | | | | | | | | | | | | | |
| Net income (loss) from continuing operations, net of non-controlling interest and after preferred dividends | | $ | (18.43 | ) | | $ | 0.19 | | | $ | 0.05 | | | $ | (0.57 | ) |
| Net income (loss) from discontinued operations | | | (0.69 | ) | | | (0.09 | ) | | | 0.08 | | | | 0.07 | |
| Net income (loss) available to common stockholders | | $ | (19.12 | ) | | $ | 0.10 | | | $ | 0.13 | | | $ | (0.50 | ) |
Diluted earnings per share:
| | | | | | | | | | | | | | | | |
| Net income (loss) from continuing operations, net of non-controlling interest and after preferred dividends | | $ | (18.43 | ) | | $ | 0.19 | | | $ | 0.05 | | | $ | (0.57 | ) |
| Net income (loss) from discontinued operations | | | (0.69 | ) | | | (0.09 | ) | | | 0.08 | | | | 0.07 | |
| Net income (loss) available to common stockholders | | $ | (19.12 | ) | | $ | 0.10 | | | $ | 0.13 | | | $ | (0.50 | ) |
| Basic weighted average common shares outstanding | | | 49,976,237 | | | | 49,919,653 | | | | 49,905,648 | | | | 49,826,278 | |
| Diluted weighted average common shares and common share equivalents outstanding | | | 49,976,237 | | | | 50,422,669 | | | | 50,432,260 | | | | 49,826,278 | |
181
TABLE OF CONTENTS
Gramercy Capital Corp.
Notes To Consolidated Financial Statements
(Amounts in thousands, except share and per share data)
December 31, 2010
23. Quarterly Financial Data (unaudited) – (continued)
| | | | | | | | |
| 2009 Quarter Ended | | December 31 | | September 30 | | June 30 | | March 31 |
| Total Revenues | | $ | 156,104 | | | $ | 152,116 | | | $ | 156,505 | | | $ | 162,363 | |
| Loss before equity in net income of joint ventures, provision for taxes, minority interest and discontinued operations | | | (103,364 | ) | | | (205,088 | ) | | | (197,321 | ) | | | (131,276 | ) |
| Equity in net loss of unconsolidated joint ventures | | | (865 | ) | | | (317 | ) | | | (772 | ) | | | (570 | ) |
| Loss from continuing operations before provision for taxes and gain on extinguishment of debt and discontinued operations | | | (104,229 | ) | | | (205,405 | ) | | | (198,093 | ) | | | (131,846 | ) |
| Gain on extinguishment of debt | | | 12,076 | | | | — | | | | — | | | | 107,229 | |
| Provision for taxes | | | (9 | ) | | | (90 | ) | | | (129 | ) | | | (2,267 | ) |
| Net loss from continuing operations | | | (92,162 | ) | | | (205,495 | ) | | | (198,222 | ) | | | (26,884 | ) |
| Net income (loss) from discontinued operations | | | (5,752 | ) | | | 4,775 | | | | 1,392 | | | | 1,949 | |
| Net loss | | | (97,914 | ) | | | (200,720 | ) | | | (196,830 | ) | | | (24,935 | ) |
| Net (income) loss attributable to non-controlling interest | | | (174 | ) | | | (60 | ) | | | 1,024 | | | | (20 | ) |
| Net loss attributable to Gramercy Capital Corp. | | | (98,088 | ) | | | (200,780 | ) | | | (195,806 | ) | | | (24,955 | ) |
| Preferred stock dividends | | | (2,406 | ) | | | (2,336 | ) | | | (2,336 | ) | | | (2,336 | ) |
| Net loss available to common stockholders | | $ | (100,494 | ) | | $ | (203,116 | ) | | $ | (198,142 | ) | | $ | (27,291 | ) |
Basic earnings per share:
| | | | | | | | | | | | | | | | |
| Net loss from continuing operations, net of non-controlling interest and after preferred dividends | | $ | (1.89 | ) | | $ | (4.17 | ) | | $ | (4.03 | ) | | $ | (0.59 | ) |
| Net income (loss) from discontinued operations | | | (0.12 | ) | | | 0.10 | | | | 0.05 | | | | 0.04 | |
| Net loss available to common stockholders | | $ | (2.01 | ) | | $ | (4.07 | ) | | $ | (3.98 | ) | | $ | (0.55 | ) |
Diluted earnings per share:
| | | | | | | | | | | | | | | | |
| Net loss from continuing operations, net of non-controlling interest and after preferred dividends | | $ | (1.89 | ) | | $ | (4.17 | ) | | $ | (4.03 | ) | | $ | (0.59 | ) |
| Net income (loss) from discontinued operations | | | (0.12 | ) | | | 0.10 | | | | 0.05 | | | | 0.04 | |
| Net loss available to common stockholders | | $ | (2.01 | ) | | $ | (4.07 | ) | | $ | (3.98 | ) | | $ | (0.55 | ) |
| Basic weighted average common shares outstanding | | | 49,882,917 | | | | 49,857,261 | | | | 49,817,991 | | | | 49,859,711 | |
| Diluted weighted average common shares and common share equivalents outstanding | | | 49,882,917 | | | | 49,857,261 | | | | 49,817,991 | | | | 49,859,711 | |
24. Subsequent Events
In March 2011, the Company purchased a $25,000 interest in the A-2 subordinate tranche of a $2.95 billion senior secured credit facility to iStar Financial Inc originally provided by JP Morgan Chase. The investment is held by the Company’s 2006 CDO and matures in June 2014.
In April 2011, the Company originated a floating rate, first mortgage loan in the amount of $18,500 secured by a limited service hotel, located in Bloomington, Minnesota. The loan is held by the Company’s 2006 CDO. The loan matures in May 2014 and can be extended at the borrower’s option for two twelve month periods, subject to performance hurdles.
182
TABLE OF CONTENTS
Gramercy Capital Corp.
Notes To Consolidated Financial Statements
(Amounts in thousands, except share and per share data)
December 31, 2010
24. Subsequent Events – (continued)
In June 2011, the Company sold five CMBS securities classified as held to maturity and three CMBS securities classified as available for sale from the Company’s 2007 CDO. The total face amount of these securities was $78,247. The proceeds from the sale was $65,584 and resulted in a gain of $15,126. As of March 2011, the five CMBS securities classified as held to maturity were designated to available for sale.
In June 2011, the company purchased, at a discount, two fixed-rate pari-passu interests in a whole loan and a fixed rate subordinate interest in the same whole loan in the amount of $85,000 and $100,000, respectively, all secured by a first mortgage against a landmark office building located in Chicago, Illinois. The acquired interests are held by the Company’s 2005, 2006 and 2007 CDOs. The loans mature in February 2017, with no options for extension.
In July 2011, Gramercy Realty’s Dana portfolio, which consists of 15 properties totaling approximately 3.8 million rentable square feet, was transferred to its mortgage lender through a deed in lieu of foreclosure. In connection with the deed in lieu, the Company was relieved of its obligation to repay the $171,938 mortgage loan secured by the Dana portfolio as well as contractual and default interest.
On September 1, 2011, the Company entered into the Settlement Agreement, for an orderly transition of substantially all of Gramercy Realty’s assets to KBS, the senior mezzanine lender, of the Goldman Mortgage Loan and the Goldman Mezzanine Loans. The Settlement Agreement provides, among other things, for (i) the transfer of beneficial ownership of the entities owning substantially all of the properties comprising the Company’s Gramercy Realty division to KBS or another entity as directed by KBS by December 15, 2011 (unless a stay or other injunctive action prevents the transfer of the equity interests on that date), (ii) certain releases, terminations and satisfactions of obligations of the Company and its affiliates in connection with the Loans, including releases of any guaranties delivered to the Lenders by the Company with respect to the Loans, and (iii) certain releases of the Lenders and their affiliates in connection with the Loans. The Company will retain 58 properties comprising of 758,231 square feet encumbered by approximately $31,800 in first lien mortgage debt held by a Company-affiliated CDO. The initial transfer of the entities owning approximately 317 properties to KBS occurred on September 1, 2011. The Company expects additional transfers to KBS to occur over the next several months as and when certain third-party conditions are satisfied. Assuming no stay or other injunctive action is then in place to prevent the same, the Settlement Agreement obligates KBS to acquire from the Company any and all remaining Gramercy Realty entities on December 15, 2011. The Company will continue to operate the remaining 555 properties until they are transferred to KBS only to the extent that sufficient cash flow is generated by the properties. KBS may elect to fund all or a portion of any shortfall. The Company has no obligation to contribute any capital or provide other financial support to the remaining properties.
The Settlement Agreement also provides for the Company’s continued management of the Gramercy Realty assets on behalf of the Lenders until December 31, 2013, for a fixed fee of $10,000 annually, the reimbursement of certain costs and incentive fees equal to 10.0% of the excess of the equity value, if any, of the transferred collateral over $375,000 plus all new capital invested into the transferred collateral by KBS, its affiliates and/or joint venture partners (the “Threshold Value Participation”) and 12.5% of the excess equity value, if any, of the transferred collateral over $468,500 plus all new capital invested into the transferred collateral by KBS, its affiliates and/or joint venture partners (the “Excess Value Participation”). The minimum amount of the Threshold Value Participation equals $3,500. The Threshold Value Participation and the Excess Value Participation will be valued and paid following the earlier of December 13, 2013, subject to extension to no later than December 31, 2015, or the sale by KBS of at least 90% (by value) of the transferred collateral. The interim management agreement may be terminated by either party without Cause 90 days following written notice; however, any Company notice of termination cannot be effective until December 31, 2011 at the earliest.
183
TABLE OF CONTENTS
Gramercy Capital Corp.
Notes To Consolidated Financial Statements
(Amounts in thousands, except share and per share data)
December 31, 2010
24. Subsequent Events – (continued)
KBS and the Company have agreed to promptly commence and diligently seek to negotiate a full and complete management services agreement by no later than March 31, 2012. If the parties do not execute a mutually acceptable asset management services agreement prior to March 31, 2012, the interim management agreement upon the terms and conditions set forth in the Settlement Agreement shall automatically terminate on June 30, 2012 without liability or a penalty of any kind, except for the Company’s loss of the Excess Value Participation.
During 2011, the Company repurchased $46,525 and $1,734 par value of bonds issued by the Company’s 2006 and 2005 CDOs, respectively including $20,000 par value of Class A-1 from the 2006 CDO, $17,067 par value of Class A-2 from the 2006 CDO, and $667 par value of Class B from the 2005 CDO, generating gains on early extinguishment of debt of $14,418.
184
TABLE OF CONTENTS
Gramercy Capital Corp.
SCHEDULE III
Real Estate Investments
(In thousands)
| | | | | | | | | | | | | | | | | | | | | | |
| | State | | Acquisition
Date | | Encumbrances at
December 31,
2010 | | Initial Costs | | Net
Improvements
(Retirements)
Since
Acquisition | | Gross Amount at Which Carried
December 31, 2010(1) | | Accumulated
Depreciation
12/31/10(2) | | Average
Depreciable
Life |
| City | | Land | | Building and
Improvements | | Land | | Building and
Improvements | | Total |
| Aberdeen | | | WA | | | | 4/1/2008 | | | | (b)(l) | | | $ | 53 | | | $ | 1,312 | | | $ | (1,365 | ) | | $ | — | | | $ | — | | | $ | — | | | $ | — | | | | 40 | |
| Abingdon | | | VA | | | | 4/1/2008 | | | | (e)(l) | | | | 112 | | | | 331 | | | | — | | | | 112 | | | | 331 | | | | 443 | | | | (82 | ) | | | 40 | |
| Abingdon | | | VA | | | | 4/1/2008 | | | | (g)(l) | | | | 199 | | | | 1,177 | | | | — | | | | 199 | | | | 1,177 | | | | 1,376 | | | | (80 | ) | | | 40 | |
| Abington | | | PA | | | | 4/1/2008 | | | | (g)(l) | | | | 169 | | | | 630 | | | | (92 | ) | | | 169 | | | | 538 | | | | 707 | | | | (38 | ) | | | 40 | |
| Acworth | | | GA | | | | 4/1/2008 | | | | — (l) | | | | 1,235 | | | | 561 | | | | (407 | ) | | | 949 | | | | 440 | | | | 1,389 | | | | (38 | ) | | | 40 | |
| Addison | | | IL | | | | 4/1/2008 | | | | (g)(l) | | | | 469 | | | | 485 | | | | (752 | ) | | | 85 | | | | 117 | | | | 202 | | | | (33 | ) | | | 40 | |
| Advance | | | NC | | | | 4/1/2008 | | | | (g)(l) | | | | 543 | | | | 208 | | | | (279 | ) | | | 337 | | | | 135 | | | | 472 | | | | (14 | ) | | | 40 | |
| Aiken | | | SC | | | | 4/1/2008 | | | | (b)(l) | | | | 3,614 | | | | 8,483 | | | | (2,589 | ) | | | 2,805 | | | | 6,703 | | | | 9,508 | | | | (530 | ) | | | 40 | |
| Aiken | | | SC | | | | 4/1/2008 | | | | — (l) | | | | 202 | | | | 1,631 | | | | (1,472 | ) | | | 30 | | | | 331 | | | | 361 | | | | (109 | ) | | | 40 | |
| Albany | | | NY | | | | 4/1/2008 | | | | (e)(l) | | | | 869 | | | | 5,319 | | | | (5,805 | ) | | | 2 | | | | 381 | | | | 383 | | | | (368 | ) | | | 40 | |
| Albertville | | | AL | | | | 4/1/2008 | | | | — (l) | | | | 107 | | | | 412 | | | | (214 | ) | | | 60 | | | | 245 | | | | 305 | | | | (28 | ) | | | 40 | |
| Albuquerque | | | NM | | | | 4/1/2008 | | | | (b)(l) | | | | 1,618 | | | | 2,425 | | | | (589 | ) | | | 1,373 | | | | 2,081 | | | | 3,454 | | | | (163 | ) | | | 40 | |
| Alexandria | | | VA | | | | 4/1/2008 | | | | — (l) | | | | 3,092 | | | | 4,427 | | | | (3,953 | ) | | | 1,390 | | | | 2,176 | | | | 3,566 | | | | (298 | ) | | | 40 | |
| Albany | | | NY | | | | 4/1/2008 | | | | (e)(l) | | | | 388 | | | | 5,563 | | | | (3,366 | ) | | | 151 | | | | 2,434 | | | | 2,585 | | | | (432 | ) | | | 40 | |
| Alpharetta | | | GA | | | | 4/1/2008 | | | | — (l) | | | | 1,234 | | | | 1,278 | | | | (462 | ) | | | 999 | | | | 1,051 | | | | 2,050 | | | | (87 | ) | | | 40 | |
| Alpharetta | | | GA | | | | 4/1/2008 | | | | (j)(l) | | | | 698 | | | | 444 | | | | (78 | ) | | | 649 | | | | 415 | | | | 1,064 | | | | (31 | ) | | | 40 | |
| Altamont Spring | | | FL | | | | 4/1/2008 | | | | (k)(l) | | | | 660 | | | | 681 | | | | (1 | ) | | | 659 | | | | 681 | | | | 1,340 | | | | (47 | ) | | | 40 | |
| Amherst | | | VA | | | | 4/1/2008 | | | | (d)(l) | | | | 249 | | | | 374 | | | | (229 | ) | | | 153 | | | | 241 | | | | 394 | | | | (26 | ) | | | 40 | |
| Anderson | | | SC | | | | 4/1/2008 | | | | — (l) | | | | 495 | | | | 855 | | | | (215 | ) | | | 381 | | | | 754 | | | | 1,135 | | | | (74 | ) | | | 40 | |
| Annapolis | | | MD | | | | 4/1/2008 | | | | (b)(l) | | | | 11,542 | | | | 7,006 | | | | (2,875 | ) | | | 9,710 | | | | 5,963 | | | | 15,673 | | | | (437 | ) | | | 40 | |
| Anniston | | | AL | | | | 4/1/2008 | | | | — (l) | | | | 295 | | | | 1,215 | | | | — | | | | 295 | | | | 1,215 | | | | 1,510 | | | | (84 | ) | | | 40 | |
| Apex | | | NC | | | | 4/1/2008 | | | | (g)(l) | | | | 156 | | | | 120 | | | | — | | | | 156 | | | | 120 | | | | 276 | | | | (8 | ) | | | 40 | |
| Aransas Pass | | | TX | | | | 4/1/2008 | | | | (b)(l) | | | | 160 | | | | 439 | | | | (433 | ) | | | 40 | | | | 126 | | | | 166 | | | | (29 | ) | | | 40 | |
| Arlington | | | TX | | | | 4/1/2008 | | | | 1,587 | (l) | | | 676 | | | | 1,574 | | | | (1,039 | ) | | | 348 | | | | 863 | | | | 1,211 | | | | (109 | ) | | | 40 | |
| Arlington | | | VA | | | | 4/1/2008 | | | | (a)(l) | | | | 805 | | | | 928 | | | | 76 | | | | 805 | | | | 1,004 | | | | 1,809 | | | | (140 | ) | | | 40 | |
| Arnold | | | CA | | | | 4/1/2008 | | | | (e)(l) | | | | 1,251 | | | | 2,466 | | | | (772 | ) | | | 979 | | | | 1,966 | | | | 2,945 | | | | (162 | ) | | | 40 | |
| Arroyo Grande | | | CA | | | | 4/1/2008 | | | | (g)(l) | | | | 849 | | | | 423 | | | | (325 | ) | | | 627 | | | | 320 | | | | 947 | | | | (29 | ) | | | 40 | |
| Asheville | | | NC | | | | 4/1/2008 | | | | (g)(l) | | | | 1,295 | | | | 4,081 | | | | (1,282 | ) | | | 970 | | | | 3,124 | | | | 4,094 | | | | (275 | ) | | | 40 | |
| Asheville | | | NC | | | | 4/1/2008 | | | | (g)(l) | | | | 538 | | | | 133 | | | | (221 | ) | | | 358 | | | | 92 | | | | 450 | | | | (9 | ) | | | 40 | |
| Asheville | | | NC | | | | 4/1/2008 | | | | (c)(l) | | | | 977 | | | | 1,130 | | | | (373 | ) | | | 798 | | | | 936 | | | | 1,734 | | | | (73 | ) | | | 40 | |
185
TABLE OF CONTENTS
| | | | | | | | | | | | | | | | | | | | | | |
| | State | | Acquisition
Date | | Encumbrances at
December 31,
2010 | | Initial Costs | | Net
Improvements
(Retirements)
Since
Acquisition | | Gross Amount at Which Carried
December 31, 2010(1) | | Accumulated
Depreciation
12/31/10(2) | | Average
Depreciable
Life |
| City | | Land | | Building and
Improvements | | Land | | Building and
Improvements | | Total |
| Asheville | | | NC | | | | 4/1/2008 | | | | — (l) | | | | 695 | | | | 2,278 | | | | (775 | ) | | | 350 | | | | 1,848 | | | | 2,198 | | | | (253 | ) | | | 40 | |
| Ashtabula | | | OH | | | | 4/1/2008 | | | | (g)(l) | | | | 609 | | | | 1,953 | | | | (1,956 | ) | | | 118 | | | | 488 | | | | 606 | | | | (135 | ) | | | 40 | |
| Athens | | | AL | | | | 4/1/2008 | | | | — (l) | | | | 454 | | | | 3,262 | | | | (889 | ) | | | 339 | | | | 2,488 | | | | 2,827 | | | | (210 | ) | | | 40 | |
| Atlanta | | | GA | | | | 4/1/2008 | | | | 2,017 (l) | | | | 1,615 | | | | 2,481 | | | | (857 | ) | | | 1,262 | | | | 1,977 | | | | 3,239 | | | | (169 | ) | | | 40 | |
| Atlanta | | | GA | | | | 4/1/2008 | | | | 581 (l) | | | | 1,138 | | | | 737 | | | | (409 | ) | | | 883 | | | | 583 | | | | 1,466 | | | | (49 | ) | | | 40 | |
| Atlanta | | | GA | | | | 4/1/2008 | | | | (h)(l) | | | | 1,031 | | | | 432 | | | | (124 | ) | | | 942 | | | | 397 | | | | 1,339 | | | | (30 | ) | | | 40 | |
| Atlanta | | | GA | | | | 4/1/2008 | | | | (d)(l) | | | | 3,200 | | | | 54,813 | | | | (10,231 | ) | | | 2,528 | | | | 45,254 | | | | 47,782 | | | | (3,805 | ) | | | 40 | |
| Auburn | | | CA | | | | 4/1/2008 | | | | (b)(l) | | | | 469 | | | | 1,505 | | | | (753 | ) | | | 269 | | | | 952 | | | | 1,221 | | | | (118 | ) | | | 40 | |
| Auburn | | | ME | | | | 4/1/2008 | | | | (e)(l) | | | | 377 | | | | 373 | | | | (370 | ) | | | 185 | | | | 195 | | | | 380 | | | | (25 | ) | | | 40 | |
| Auburn | | | NY | | | | 4/1/2008 | | | | (e)(l) | | | | 230 | | | | 3,837 | | | | (1,938 | ) | | | 113 | | | | 2,016 | | | | 2,129 | | | | (276 | ) | | | 40 | |
| Augusta | | | GA | | | | 4/1/2008 | | | | 989 (l) | | | | 1,093 | | | | 747 | | | | (426 | ) | | | 833 | | | | 581 | | | | 1,414 | | | | (51 | ) | | | 40 | |
| Augusta | | | GA | | | | 4/1/2008 | | | | 1,132 (l) | | | | 637 | | | | 1,316 | | | | (312 | ) | | | 530 | | | | 1,111 | | | | 1,641 | | | | (90 | ) | | | 40 | |
| Aurora | | | MO | | | | 4/1/2008 | | | | (g)(l) | | | | 20 | | | | 370 | | | | — | | | | 20 | | | | 370 | | | | 390 | | | | (25 | ) | | | 40 | |
| Austin | | | TX | | | | 4/1/2008 | | | | (g)(l) | | | | 260 | | | | 293 | | | | (180 | ) | | | 143 | | | | 230 | | | | 373 | | | | (28 | ) | | | 40 | |
| Avon Park | | | FL | | | | 4/1/2008 | | | | — (l) | | | | 78 | | | | 432 | | | | (104 | ) | | | 78 | | | | 328 | | | | 406 | | | | (14 | ) | | | 40 | |
| Avondale | | | PA | | | | 4/1/2008 | | | | (g)(l) | | | | 217 | | | | 276 | | | | (223 | ) | | | 115 | | | | 155 | | | | 270 | | | | (19 | ) | | | 40 | |
| Bakersfield | | | CA | | | | 4/1/2008 | | | | (e)(l) | | | | 601 | | | | 2,216 | | | | (663 | ) | | | 443 | | | | 1,711 | | | | 2,154 | | | | (150 | ) | | | 40 | |
| Bakersfield | | | CA | | | | 4/1/2008 | | | | (b)(l) | | | | 954 | | | | 1,758 | | | | (642 | ) | | | 698 | | | | 1,372 | | | | 2,070 | | | | (119 | ) | | | 40 | |
| Bakersfield | | | CA | | | | 4/1/2008 | | | | (b)(l) | | | | 946 | | | | 1,243 | | | | (882 | ) | | | 522 | | | | 785 | | | | 1,307 | | | | (93 | ) | | | 40 | |
| Ballwin | | | MO | | | | 4/1/2008 | | | | (e)(l) | | | | 361 | | | | 329 | | | | 174 | | | | 361 | | | | 503 | | | | 864 | | | | (33 | ) | | | 40 | |
| Baltimore | | | MD | | | | 4/1/2008 | | | | (b)(l) | | | | 703 | | | | 2,076 | | | | (433 | ) | | | 575 | | | | 1,771 | | | | 2,346 | | | | (402 | ) | | | 40 | |
| Baltimore | | | MD | | | | 4/1/2008 | | | | (a)(l) | | | | 4,888 | | | | 15,092 | | | | 1,393 | | | | 4,888 | | | | 16,485 | | | | 21,373 | | | | (1,311 | ) | | | 40 | |
| Baltimore | | | MD | | | | 4/1/2008 | | | | (a)(l) | | | | 11,150 | | | | 29,967 | | | | 1,372 | | | | 11,150 | | | | 31,339 | | | | 42,489 | | | | (2,301 | ) | | | 40 | |
| Baltimore | | | MD | | | | 4/1/2008 | | | | (d)(l) | | | | 642 | | | | 896 | | | | (1,040 | ) | | | 187 | | | | 311 | | | | 498 | | | | (69 | ) | | | 40 | |
| Banner Elk | | | NC | | | | 4/1/2008 | | | | (k)(l) | | | | 440 | | | | 255 | | | | (83 | ) | | | 386 | | | | 226 | | | | 612 | | | | (18 | ) | | | 40 | |
| Batesville | | | AR | | | | 4/1/2008 | | | | — (l) | | | | 217 | | | | 825 | | | | 63 | | | | 217 | | | | 888 | | | | 1,105 | | | | (58 | ) | | | 40 | |
| Beachwood | | | OH | | | | 4/1/2008 | | | | (g)(l) | | | | 2,113 | | | | 546 | | | | (937 | ) | | | 1,358 | | | | 364 | | | | 1,722 | | | | (38 | ) | | | 40 | |
| Beaumont | | | TX | | | | 4/1/2008 | | | | (e)(l) | | | | 59 | | | | 594 | | | | (114 | ) | | | 48 | | | | 491 | | | | 539 | | | | (41 | ) | | | 40 | |
| Bedford | | | OH | | | | 4/1/2008 | | | | (g)(l) | | | | 27 | | | | 1,410 | | | | (379 | ) | | | 20 | | | | 1,038 | | | | 1,058 | | | | (97 | ) | | | 40 | |
| Bedford | | | IN | | | | 4/1/2008 | | | | — (l) | | | | 136 | | | | 373 | | | | (184 | ) | | | 136 | | | | 189 | | | | 325 | | | | (6 | ) | | | 40 | |
| Beebe | | | AR | | | | 4/1/2008 | | | | — (l) | | | | 29 | | | | 148 | | | | (57 | ) | | | 19 | | | | 101 | | | | 120 | | | | (10 | ) | | | 40 | |
| Belle Chasse | | | LA | | | | 4/1/2008 | | | | — (l) | | | | 164 | | | | 518 | | | | (482 | ) | | | 42 | | | | 158 | | | | 200 | | | | (35 | ) | | | 40 | |
| Belleville | | | IL | | | | 4/1/2008 | | | | — (l) | | | | 972 | | | | 2,870 | | | | (1,912 | ) | | | 421 | | | | 1,509 | | | | 1,930 | | | | (343 | ) | | | 40 | |
| Bellingham | | | WA | | | | 4/1/2008 | | | | (b)(l) | | | | 147 | | | | 3,344 | | | | (823 | ) | | | 110 | | | | 2,558 | | | | 2,668 | | | | (230 | ) | | | 40 | |
186
TABLE OF CONTENTS
| | | | | | | | | | | | | | | | | | | | | | |
| | State | | Acquisition
Date | | Encumbrances at
December 31,
2010 | | Initial Costs | | Net
Improvements
(Retirements)
Since
Acquisition | | Gross Amount at Which Carried
December 31, 2010(1) | | Accumulated
Depreciation
12/31/10(2) | | Average
Depreciable
Life |
| City | | Land | | Building and
Improvements | | Land | | Building and
Improvements | | Total |
| Belton | | | MO | | | | 4/1/2008 | | | | (e)(l) | | | | 222 | | | | 465 | | | | 23 | | | | 222 | | | | 488 | | | | 710 | | | | (32 | ) | | | 40 | |
| Bennettsville | | | SC | | | | 4/1/2008 | | | | (d)(l) | | | | 48 | | | | 362 | | | | (125 | ) | | | 33 | | | | 252 | | | | 285 | | | | (22 | ) | | | 40 | |
| Bensalem | | | PA | | | | 4/1/2008 | | | | (g)(l) | | | | 476 | | | | 928 | | | | (203 | ) | | | 404 | | | | 797 | | | | 1,201 | | | | (64 | ) | | | 40 | |
| Benton | | | AR | | | | 4/1/2008 | | | | (e)(l) | | | | 615 | | | | 355 | | | | (592 | ) | | | 225 | | | | 153 | | | | 378 | | | | (27 | ) | | | 40 | |
| Berea | | | OH | | | | 4/1/2008 | | | | (g)(l) | | | | 581 | | | | 1,815 | | | | (1,271 | ) | | | 256 | | | | 869 | | | | 1,125 | | | | (125 | ) | | | 40 | |
| Berkeley Height | | | NJ | | | | 4/1/2008 | | | | 478 (l) | | | | 1,164 | | | | 314 | | | | (317 | ) | | | 911 | | | | 250 | | | | 1,161 | | | | (22 | ) | | | 40 | |
| Bethel | | | OH | | | | 4/1/2008 | | | | — (l) | | | | 22 | | | | 746 | | | | (511 | ) | | | 6 | | | | 251 | | | | 257 | | | | (51 | ) | | | 40 | |
| Black Mountain | | | NC | | | | 4/1/2008 | | | | — (l) | | | | 259 | | | | 247 | | | | (361 | ) | | | 68 | | | | 77 | | | | 145 | | | | (17 | ) | | | 40 | |
| Blacksburg | | | VA | | | | 4/1/2008 | | | | (d)(l) | | | | 232 | | | | 385 | | | | — | | | | 232 | | | | 385 | | | | 617 | | | | (26 | ) | | | 40 | |
| Bloomington | | | IL | | | | 4/1/2008 | | | | — (l) | | | | 201 | | | | 552 | | | | 18 | | | | 201 | | | | 570 | | | | 771 | | | | (21 | ) | | | 40 | |
| Blountstown | | | FL | | | | 4/1/2008 | | | | (e)(l) | | | | 205 | | | | 843 | | | | 36 | | | | 205 | | | | 879 | | | | 1,084 | | | | (58 | ) | | | 40 | |
| Blowing Rock | | | NC | | | | 4/1/2008 | | | | (g)(l) | | | | 579 | | | | 45 | | | | (313 | ) | | | 287 | | | | 24 | | | | 311 | | | | (3 | ) | | | 40 | |
| Boca Raron | | | FL | | | | 4/1/2008 | | | | 680 (l) | | | | 1,180 | | | | 423 | | | | (427 | ) | | | 860 | | | | 316 | | | | 1,176 | | | | (29 | ) | | | 40 | |
| Boca Raton | | | FL | | | | 4/1/2008 | | | | — (l) | | | | 2,565 | | | | 1,732 | | | | (1,022 | ) | | | 1,938 | | | | 1,337 | | | | 3,275 | | | | (118 | ) | | | 40 | |
| Bonita Springs | | | FL | | | | 4/1/2008 | | | | (h)(l) | | | | 959 | | | | 638 | | | | (153 | ) | | | 865 | | | | 579 | | | | 1,444 | | | | (44 | ) | | | 40 | |
| Boone | | | NC | | | | 4/1/2008 | | | | (c)(l) | | | | 935 | | | | 2,067 | | | | (500 | ) | | | 772 | | | | 1,730 | | | | 2,502 | | | | (134 | ) | | | 40 | |
| Boyertown | | | PA | | | | 4/1/2008 | | | | (g)(l) | | | | 389 | | | | 313 | | | | — | | | | 389 | | | | 313 | | | | 702 | | | | (22 | ) | | | 40 | |
| Boynton Beach | | | FL | | | | 4/1/2008 | | | | — (l) | | | | 1,633 | | | | 1,341 | | | | (1,174 | ) | | | 967 | | | | 833 | | | | 1,800 | | | | (90 | ) | | | 40 | |
| Bradenton | | | FL | | | | 4/1/2008 | | | | (e)(l) | | | | 143 | | | | 129 | | | | (129 | ) | | | 73 | | | | 70 | | | | 143 | | | | (9 | ) | | | 40 | |
| Bradenton | | | FL | | | | 4/1/2008 | | | | (k)(l) | | | | 1,078 | | | | 1,151 | | | | (959 | ) | | | 597 | | | | 673 | | | | 1,270 | | | | (79 | ) | | | 40 | |
| Bradenton | | | FL | | | | 4/1/2008 | | | | (h)(l) | | | | 728 | | | | 650 | | | | (55 | ) | | | 698 | | | | 625 | | | | 1,323 | | | | (45 | ) | | | 40 | |
| Bradentown | | | FL | | | | 4/1/2008 | | | | (e)(l) | | | | 56 | | | | 183 | | | | 27 | | | | 56 | | | | 210 | | | | 266 | | | | (16 | ) | | | 40 | |
| Brandon | | | FL | | | | 4/1/2008 | | | | (j)(l) | | | | 775 | | | | 161 | | | | (54 | ) | | | 730 | | | | 152 | | | | 882 | | | | (11 | ) | | | 40 | |
| Brandon | | | FL | | | | 4/1/2008 | | | | (k)(l) | | | | 923 | | | | 300 | | | | (72 | ) | | | 868 | | | | 283 | | | | 1,151 | | | | (21 | ) | | | 40 | |
| Breman | | | GA | | | | 4/1/2008 | | | | (g)(l) | | | | 211 | | | | 911 | | | | (162 | ) | | | 179 | | | | 781 | | | | 960 | | | | (62 | ) | | | 40 | |
| Bremen | | | GA | | | | 4/1/2008 | | | | — (l) | | | | 113 | | | | 311 | | | | — | | | | 113 | | | | 311 | | | | 424 | | | | (21 | ) | | | 40 | |
| Bremerton | | | WA | | | | 4/1/2008 | | | | (b)(l) | | | | 73 | | | | 664 | | | | (455 | ) | | | 25 | | | | 257 | | | | 282 | | | | (46 | ) | | | 40 | |
| Brevard | | | NC | | | | 4/1/2008 | | | | (g)(l) | | | | 967 | | | | 656 | | | | (1,093 | ) | | | 297 | | | | 233 | | | | 530 | | | | (45 | ) | | | 40 | |
| Bridgewater | | | NJ | | | | 4/1/2008 | | | | (e)(l) | | | | 3,483 | | | | 9,880 | | | | (6,503 | ) | | | 1,676 | | | | 5,184 | | | | 6,860 | | | | (770 | ) | | | 40 | |
| Bristol | | | PA | | | | 4/1/2008 | | | | (g)(l) | | | | 72 | | | | 214 | | | | (203 | ) | | | 7 | | | | 76 | | | | 83 | | | | (49 | ) | | | 40 | |
| Broken Arrow | | | OK | | | | 4/1/2008 | | | | (e)(l) | | | | 357 | | | | 434 | | | | (626 | ) | | | 63 | | | | 102 | | | | 165 | | | | (31 | ) | | | 40 | |
| Brookneal | | | VA | | | | 4/1/2008 | | | | (d)(l) | | | | 92 | | | | 406 | | | | (112 | ) | | | 70 | | | | 316 | | | | 386 | | | | (28 | ) | | | 40 | |
| Brooksville | | | FL | | | | 4/1/2008 | | | | (e)(l) | | | | 200 | | | | 267 | | | | — | | | | 200 | | | | 267 | | | | 467 | | | | (18 | ) | | | 40 | |
| Brownwood | | | TX | | | | 4/1/2008 | | | | (b)(l) | | | | 88 | | | | 242 | | | | (33 | ) | | | 88 | | | | 209 | | | | 297 | | | | (16 | ) | | | 40 | |
187
TABLE OF CONTENTS
| | | | | | | | | | | | | | | | | | | | | | |
| | State | | Acquisition
Date | | Encumbrances at
December 31,
2010 | | Initial Costs | | Net
Improvements
(Retirements)
Since
Acquisition | | Gross Amount at Which Carried
December 31, 2010(1) | | Accumulated
Depreciation
12/31/10(2) | | Average
Depreciable
Life |
| City | | Land | | Building and
Improvements | | Land | | Building and
Improvements | | Total |
| Buford | | | GA | | | | 4/1/2008 | | | | — (l) | | | | 333 | | | | 915 | | | | (397 | ) | | | 333 | | | | 518 | | | | 851 | | | | (24 | ) | | | 40 | |
| Burbank | | | CA | | | | 4/1/2008 | | | | (e)(l) | | | | 1,934 | | | | 3,769 | | | | (1,194 | ) | | | 1,473 | | | | 3,036 | | | | 4,509 | | | | (249 | ) | | | 40 | |
| Burgaw | | | NC | | | | 4/1/2008 | | | | (c)(l) | | | | 497 | | | | 611 | | | | (242 | ) | | | 384 | | | | 482 | | | | 866 | | | | (41 | ) | | | 40 | |
| Burlingame | | | CA | | | | 4/1/2008 | | | | (e)(l) | | | | 1,226 | | | | 603 | | | | (501 | ) | | | 843 | | | | 485 | | | | 1,328 | | | | (56 | ) | | | 40 | |
| Burlington | | | NC | | | | 4/1/2008 | | | | (c)(l) | | | | 489 | | | | 1,444 | | | | (518 | ) | | | 351 | | | | 1,064 | | | | 1,415 | | | | (100 | ) | | | 40 | |
| Burlington | | | NC | | | | 4/1/2008 | | | | (d)(l) | | | | 1,931 | | | | 5,162 | | | | (2,500 | ) | | | 1,216 | | | | 3,377 | | | | 4,593 | | | | (342 | ) | | | 40 | |
| Calabash | | | NC | | | | 4/1/2008 | | | | — (l) | | | | 686 | | | | 355 | | | | (538 | ) | | | 323 | | | | 180 | | | | 503 | | | | (24 | ) | | | 40 | |
| Callahan | | | FL | | | | 4/1/2008 | | | | (g)(l) | | | | 1,653 | | | | 1,923 | | | | (1,229 | ) | | | 1,063 | | | | 1,284 | | | | 2,347 | | | | (132 | ) | | | 40 | |
| Camas | | | WA | | | | 4/1/2008 | | | | (e)(l) | | | | 179 | | | | 205 | | | | (65 | ) | | | 128 | | | | 191 | | | | 319 | | | | (22 | ) | | | 40 | |
| Cambelltown | | | PA | | | | 4/1/2008 | | | | (g)(l) | | | | 65 | | | | 255 | | | | — | | | | 65 | | | | 255 | | | | 320 | | | | (18 | ) | | | 40 | |
| Cameron Park | | | CA | | | | 4/1/2008 | | | | (j)(l) | | | | 693 | | | | 1,718 | | | | (453 | ) | | | 556 | | | | 1,402 | | | | 1,958 | | | | (117 | ) | | | 40 | |
| Candler | | | NC | | | | 4/1/2008 | | | | (c)(l) | | | | 771 | | | | 319 | | | | (299 | ) | | | 555 | | | | 236 | | | | 791 | | | | (22 | ) | | | 40 | |
| Canoga Park | | | CA | | | | 4/1/2008 | | | | (e)(l) | | | | 1,219 | | | | 828 | | | | (565 | ) | | | 873 | | | | 609 | | | | 1,482 | | | | (56 | ) | | | 40 | |
| Canton | | | NC | | | | 4/1/2008 | | | | (g)(l) | | | | 254 | | | | 762 | | | | (86 | ) | | | 231 | | | | 699 | | | | 930 | | | | (52 | ) | | | 40 | |
| Canton | | | OH | | | | 4/1/2008 | | | | — (l) | | | | 40 | | | | 2,383 | | | | (1,213 | ) | | | 18 | | | | 1,192 | | | | 1,210 | | | | (180 | ) | | | 40 | |
| Cape Coral | | | FL | | | | 4/1/2008 | | | | (k)(l) | | | | 802 | | | | 406 | | | | (55 | ) | | | 764 | | | | 389 | | | | 1,153 | | | | (28 | ) | | | 40 | |
| Carolina Beach | | | NC | | | | 4/1/2008 | | | | (c)(l) | | | | 1,330 | | | | 1,660 | | | | (640 | ) | | | 1,034 | | | | 1,316 | | | | 2,350 | | | | (110 | ) | | | 40 | |
| Carrollton | | | TX | | | | 4/1/2008 | | | | (b)(l) | | | | 705 | | | | 1,353 | | | | (505 | ) | | | 521 | | | | 1,032 | | | | 1,553 | | | | (102 | ) | | | 40 | |
| Carrolton | | | GA | | | | 4/1/2008 | | | | — (l) | | | | 458 | | | | 1,246 | | | | (1,154 | ) | | | 132 | | | | 418 | | | | 550 | | | | (84 | ) | | | 40 | |
| Cartersville | | | GA | | | | 4/1/2008 | | | | (g)(l) | | | | 225 | | | | 164 | | | | — | | | | 225 | | | | 164 | | | | 389 | | | | (11 | ) | | | 40 | |
| Cary | | | NC | | | | 4/1/2008 | | | | (g)(l) | | | | 400 | | | | 224 | | | | (208 | ) | | | 263 | | | | 153 | | | | 416 | | | | (15 | ) | | | 40 | |
| Cary | | | NC | | | | 4/1/2008 | | | | (c)(l) | | | | 755 | | | | 459 | | | | (320 | ) | | | 551 | | | | 343 | | | | 894 | | | | (31 | ) | | | 40 | |
| Cary | | | NC | | | | 4/1/2008 | | | | 1,137 (l) | | | | 2,028 | | | | 1,102 | | | | (595 | ) | | | 1,633 | | | | 902 | | | | 2,535 | | | | (76 | ) | | | 40 | |
| Cary | | | NC | | | | 4/1/2008 | | | | (g)(l) | | | | 754 | | | | 338 | | | | (212 | ) | | | 604 | | | | 276 | | | | 880 | | | | (23 | ) | | | 40 | |
| Cary | | | NC | | | | 4/1/2008 | | | | (i)(l) | | | | 514 | | | | 430 | | | | (80 | ) | | | 469 | | | | 395 | | | | 864 | | | | (30 | ) | | | 40 | |
| Casselberry | | | FL | | | | 4/1/2008 | | | | — (l) | | | | 355 | | | | 245 | | | | — | | | | 355 | | | | 245 | | | | 600 | | | | (17 | ) | | | 40 | |
| Catoosa | | | OK | | | | 4/1/2008 | | | | (e)(l) | | | | 168 | | | | 1,331 | | | | (491 | ) | | | 106 | | | | 902 | | | | 1,008 | | | | (102 | ) | | | 40 | |
| Cayce | | | SC | | | | 4/1/2008 | | | | (g)(l) | | | | 641 | | | | 541 | | | | (211 | ) | | | 523 | | | | 448 | | | | 971 | | | | (37 | ) | | | 40 | |
| Chapel Hill | | | NC | | | | 4/1/2008 | | | | (j)(l) | | | | 741 | | | | 2,382 | | | | (556 | ) | | | 602 | | | | 1,965 | | | | 2,567 | | | | (163 | ) | | | 40 | |
| Charleston | | | SC | | | | 4/1/2008 | | | | (j)(l) | | | | 163 | | | | 142 | | | | — | | | | 163 | | | | 142 | | | | 305 | | | | (10 | ) | | | 40 | |
| Charleston | | | SC | | | | 4/1/2008 | | | | (d)(l) | | | | 1,827 | | | | 5,394 | | | | (3,289 | ) | | | 928 | | | | 3,004 | | | | 3,932 | | | | (374 | ) | | | 40 | |
| Charlotte | | | NC | | | | 4/1/2008 | | | | (e)(l) | | | | 4,651 | | | | 40,166 | | | | (16,261 | ) | | | 2,823 | | | | 25,733 | | | | 28,556 | | | | (3,196 | ) | | | 40 | |
| Charlotte | | | NC | | | | 4/1/2008 | | | | (b)(l) | | | | 8,119 | | | | 80,952 | | | | (34,715 | ) | | | 4,734 | | | | 49,622 | | | | 54,356 | | | | (5,821 | ) | | | 40 | |
| Charlotte | | | NC | | | | 4/1/2008 | | | | 72,461 (l) | | | | 20,837 | | | | 105,506 | | | | (48,406 | ) | | | 12,232 | | | | 65,705 | | | | 77,937 | | | | (7,682 | ) | | | 40 | |
188
TABLE OF CONTENTS
| | | | | | | | | | | | | | | | | | | | | | |
| | State | | Acquisition
Date | | Encumbrances at
December 31,
2010 | | Initial Costs | | Net
Improvements
(Retirements)
Since
Acquisition | | Gross Amount at Which Carried
December 31, 2010(1) | | Accumulated
Depreciation
12/31/10(2) | | Average
Depreciable
Life |
| City | | Land | | Building and
Improvements | | Land | | Building and
Improvements | | Total |
| Charlotte | | | NC | | | | 4/1/2008 | | | | (g)(l) | | | | 363 | | | | 721 | | | | (419 | ) | | | 216 | | | | 449 | | | | 665 | | | | (50 | ) | | | 40 | |
| Charlotte | | | NC | | | | 4/1/2008 | | | | 397 (l) | | | | 818 | | | | 610 | | | | (309 | ) | | | 636 | | | | 483 | | | | 1,119 | | | | (41 | ) | | | 40 | |
| Charlotte | | | NC | | | | 4/1/2008 | | | | (c)(l) | | | | 1,210 | | | | 428 | | | | (431 | ) | | | 886 | | | | 321 | | | | 1,207 | | | | (29 | ) | | | 40 | |
| Charlotte | | | NC | | | | 4/1/2008 | | | | (c)(l) | | | | 1,136 | | | | 524 | | | | (396 | ) | | | 859 | | | | 405 | | | | 1,264 | | | | (35 | ) | | | 40 | |
| Charlotte | | | NC | | | | 4/1/2008 | | | | (c)(l) | | | | 1,286 | | | | 457 | | | | (436 | ) | | | 959 | | | | 348 | | | | 1,307 | | | | (31 | ) | | | 40 | |
| Charlotte | | | NC | | | | 4/1/2008 | | | | (c)(l) | | | | 1,052 | | | | 836 | | | | (542 | ) | | | 741 | | | | 605 | | | | 1,346 | | | | (57 | ) | | | 40 | |
| Charlotte | | | NC | | | | 4/1/2008 | | | | (g)(l) | | | | 546 | | | | 2,748 | | | | (448 | ) | | | 468 | | | | 2,378 | | | | 2,846 | | | | (173 | ) | | | 40 | |
| Charlotte | | | NC | | | | 4/1/2008 | | | | (c)(l) | | | | 2,993 | | | | 1,367 | | | | (1,789 | ) | | | 1,738 | | | | 833 | | | | 2,571 | | | | (93 | ) | | | 40 | |
| Charlotte | | | NC | | | | 4/1/2008 | | | | (c)(l) | | | | 1,547 | | | | 442 | | | | (617 | ) | | | 1,060 | | | | 312 | | | | 1,372 | | | | (30 | ) | | | 40 | |
| Charlotte | | | NC | | | | 4/1/2008 | | | | (c)(l) | | | | 1,183 | | | | 312 | | | | (497 | ) | | | 784 | | | | 214 | | | | 998 | | | | (21 | ) | | | 40 | |
| Charlotte | | | NC | | | | 4/1/2008 | | | | (c)(l) | | | | 923 | | | | 728 | | | | (501 | ) | | | 634 | | | | 516 | | | | 1,150 | | | | (50 | ) | | | 40 | |
| Charlotte | | | NC | | | | 4/1/2008 | | | | 1,039 (l) | | | | 1,344 | | | | 880 | | | | (300 | ) | | | 1,158 | | | | 766 | | | | 1,924 | | | | (61 | ) | | | 40 | |
| Charlotte | | | NC | | | | 4/1/2008 | | | | 904 (l) | | | | 850 | | | | 773 | | | | (96 | ) | | | 798 | | | | 729 | | | | 1,527 | | | | (53 | ) | | | 40 | |
| Charlotte | | | NC | | | | 4/1/2008 | | | | (g)(l) | | | | 894 | | | | 942 | | | | (57 | ) | | | 865 | | | | 914 | | | | 1,779 | | | | (64 | ) | | | 40 | |
| Charlotte | | | NC | | | | 4/1/2008 | | | | (h)(l) | | | | 1,160 | | | | 573 | | | | (202 | ) | | | 1,021 | | | | 510 | | | | 1,531 | | | | (40 | ) | | | 40 | |
| Cherry Hill | | | NJ | | | | 4/1/2008 | | | | (g)(l) | | | | 661 | | | | 478 | | | | (72 | ) | | | 618 | | | | 449 | | | | 1,067 | | | | (33 | ) | | | 40 | |
| Cherryville | | | NC | | | | 4/1/2008 | | | | (c)(l) | | | | 633 | | | | 595 | | | | (275 | ) | | | 487 | | | | 466 | | | | 953 | | | | (40 | ) | | | 40 | |
| Chester | | | VA | | | | 4/1/2008 | | | | (j)(l) | | | | 310 | | | | 194 | | | | (67 | ) | | | 268 | | | | 169 | | | | 437 | | | | (13 | ) | | | 40 | |
| Chicago | | | IL | | | | 4/1/2008 | | | | (b)(l) | | | | 16,379 | | | | 81,513 | | | | (23,646 | ) | | | 12,002 | | | | 62,244 | | | | 74,246 | | | | (5,835 | ) | | | 40 | |
| China Grove | | | NC | | | | 4/1/2008 | | | | (g)(l) | | | | 205 | | | | 1,152 | | | | (597 | ) | | | 109 | | | | 651 | | | | 760 | | | | (79 | ) | | | 40 | |
| Christainsburg | | | VA | | | | 4/1/2008 | | | | (d)(l) | | | | 246 | | | | 653 | | | | (204 | ) | | | 184 | | | | 511 | | | | 695 | | | | (48 | ) | | | 40 | |
| Cincinnati | | | OH | | | | 4/1/2008 | | | | (g)(l) | | | | 216 | | | | 544 | | | | — | | | | 216 | | | | 544 | | | | 760 | | | | (37 | ) | | | 40 | |
| Cincinnati | | | OH | | | | 4/1/2008 | | | | (g)(l) | | | | 418 | | | | 351 | | | | (68 | ) | | | 380 | | | | 321 | | | | 701 | | | | (24 | ) | | | 40 | |
| Clarksdale | | | MS | | | | 4/1/2008 | | | | — (l) | | | | 95 | | | | 1,050 | | | | (854 | ) | | | 33 | | | | 258 | | | | 291 | | | | (30 | ) | | | 40 | |
| Clarkson | | | WA | | | | 4/1/2008 | | | | (e)(l) | | | | 671 | | | | 840 | | | | (347 | ) | | | 511 | | | | 653 | | | | 1,164 | | | | (57 | ) | | | 40 | |
| Clearwater | | | FL | | | | 4/1/2008 | | | | (b)(l) | | | | 1,634 | | | | 1,371 | | | | (968 | ) | | | 1,089 | | | | 948 | | | | 2,037 | | | | (98 | ) | | | 40 | |
| Clearwater | | | FL | | | | 4/1/2008 | | | | (g)(l) | | | | 2,364 | | | | 1,306 | | | | (891 | ) | | | 1,776 | | | | 1,003 | | | | 2,779 | | | | (90 | ) | | | 40 | |
| Clemmons | | | NC | | | | 4/1/2008 | | | | 443 (l) | | | | 825 | | | | 469 | | | | (306 | ) | | | 625 | | | | 363 | | | | 988 | | | | (32 | ) | | | 40 | |
| Clemmons | | | NC | | | | 4/1/2008 | | | | 1,074 (l) | | | | 1,424 | | | | 669 | | | | (207 | ) | | | 1,280 | | | | 606 | | | | 1,886 | | | | (46 | ) | | | 40 | |
| Clermont | | | FL | | | | 4/1/2008 | | | | (b)(l) | | | | 131 | | | | 426 | | | | (65 | ) | | | 115 | | | | 377 | | | | 492 | | | | (29 | ) | | | 40 | |
| Cleveland | | | OH | | | | 4/1/2008 | | | | — (l) | | | | 62 | | | | 298 | | | | 18 | | | | 62 | | | | 316 | | | | 378 | | | | (24 | ) | | | 40 | |
| Cleveland | | | OH | | | | 4/1/2008 | | | | — (l) | | | | 44 | | | | 482 | | | | (193 | ) | | | 27 | | | | 306 | | | | 333 | | | | (33 | ) | | | 40 | |
| Cleveland | | | OH | | | | 4/1/2008 | | | | (g)(l) | | | | 262 | | | | 330 | | | | — | | | | 262 | | | | 330 | | | | 592 | | | | (23 | ) | | | 40 | |
| Cleveland | | | OH | | | | 4/1/2008 | | | | (g)(l) | | | | 146 | | | | 690 | | | | (47 | ) | | | 137 | | | | 652 | | | | 789 | | | | (48 | ) | | | 40 | |
189
TABLE OF CONTENTS
| | | | | | | | | | | | | | | | | | | | | | |
| | State | | Acquisition
Date | | Encumbrances at
December 31,
2010 | | Initial Costs | | Net
Improvements
(Retirements)
Since
Acquisition | | Gross Amount at Which Carried
December 31, 2010(1) | | Accumulated
Depreciation
12/31/10(2) | | Average
Depreciable
Life |
| City | | Land | | Building and
Improvements | | Land | | Building and
Improvements | | Total |
| Cleveland | | | OH | | | | 4/1/2008 | | | | (g)(l) | | | | 151 | | | | 834 | | | | (123 | ) | | | 131 | | | | 731 | | | | 862 | | | | (57 | ) | | | 40 | |
| Cleveland | | | OH | | | | 4/1/2008 | | | | (g)(l) | | | | 486 | | | | 1,284 | | | | (341 | ) | | | 387 | | | | 1,042 | | | | 1,429 | | | | (89 | ) | | | 40 | |
| Cleveland | | | OH | | | | 4/1/2008 | | | | (g)(l) | | | | 66 | | | | 1,043 | | | | (198 | ) | | | 54 | | | | 857 | | | | 911 | | | | (72 | ) | | | 40 | |
| Cleveland | | | OH | | | | 4/1/2008 | | | | (g)(l) | | | | 212 | | | | 1,151 | | | | — | | | | 212 | | | | 1,151 | | | | 1,363 | | | | (79 | ) | | | 40 | |
| Cleveland | | | OH | | | | 4/1/2008 | | | | (g)(l) | | | | 212 | | | | 1,308 | | | | (298 | ) | | | 168 | | | | 1,054 | | | | 1,222 | | | | (90 | ) | | | 40 | |
| Clintwood | | | VA | | | | 4/1/2008 | | | | (d)(l) | | | | 16 | | | | 304 | | | | (40 | ) | | | 14 | | | | 266 | | | | 280 | | | | (21 | ) | | | 40 | |
| Clover | | | SC | | | | 4/1/2008 | | | | (g)(l) | | | | 209 | | | | 156 | | | | (354 | ) | | | — | | | | 11 | | | | 11 | | | | (11 | ) | | | 40 | |
| Cocoa | | | FL | | | | 4/1/2008 | | | | — (l) | | | | 267 | | | | 732 | | | | (992 | ) | | | 7 | | | | — | | | | 7 | | | | — | | | | 40 | |
| College Park | | | GA | | | | 4/1/2008 | | | | (a)(l) | | | | 636 | | | | 6,723 | | | | — | | | | 636 | | | | 6,723 | | | | 7,359 | | | | (462 | ) | | | 40 | |
| Collingswood | | | NJ | | | | 4/1/2008 | | | | (g)(l) | | | | 417 | | | | 435 | | | | (39 | ) | | | 397 | | | | 416 | | | | 813 | | | | (30 | ) | | | 40 | |
| Colombia | | | SC | | | | 4/1/2008 | | | | (d)(l) | | | | 2,662 | | | | 23,023 | | | | (4,457 | ) | | | 2,081 | | | | 19,147 | | | | 21,228 | | | | (1,672 | ) | | | 40 | |
| Columbia | | | MO | | | | 4/1/2008 | | | | (b)(l) | | | | 527 | | | | 1,503 | | | | (980 | ) | | | 259 | | | | 791 | | | | 1,050 | | | | (103 | ) | | | 40 | |
| Columbia | | | SC | | | | 4/1/2008 | | | | (a)(l) | | | | 377 | | | | 2,035 | | | | — | | | | 377 | | | | 2,035 | | | | 2,412 | | | | (140 | ) | | | 40 | |
| Columbia | | | SC | | | | 4/1/2008 | | | | (h)(l) | | | | 643 | | | | 505 | | | | (156 | ) | | | 553 | | | | 439 | | | | 992 | | | | (35 | ) | | | 40 | |
| Columbus | | | GA | | | | 4/1/2008 | | | | — (l) | | | | 399 | | | | 1,096 | | | | (565 | ) | | | 240 | | | | 690 | | | | 930 | | | | (75 | ) | | | 40 | |
| Columbus | | | GA | | | | 4/1/2008 | | | | (h)(l) | | | | 476 | | | | 62 | | | | (98 | ) | | | 389 | | | | 51 | | | | 440 | | | | (4 | ) | | | 40 | |
| Columbus | | | GA | | | | 4/1/2008 | | | | (d)(l) | | | | 4,175 | | | | 5,459 | | | | (4,437 | ) | | | 2,164 | | | | 3,033 | | | | 5,197 | | | | (358 | ) | | | 40 | |
| Columbus | | | IN | | | | 4/1/2008 | | | | (g)(l) | | | | 460 | | | | 758 | | | | (201 | ) | | | 381 | | | | 636 | | | | 1,017 | | | | (52 | ) | | | 40 | |
| Columbus | | | IN | | | | 4/1/2008 | | | | (g)(l) | | | | 260 | | | | 400 | | | | (115 | ) | | | 213 | | | | 332 | | | | 545 | | | | (27 | ) | | | 40 | |
| Columbus | | | NC | | | | 4/1/2008 | | | | (c)(l) | | | | 352 | | | | 304 | | | | (164 | ) | | | 261 | | | | 231 | | | | 492 | | | | (20 | ) | | | 40 | |
| Columbus | | | GA | | | | 4/1/2008 | | | | — (l) | | | | 187 | | | | 513 | | | | — | | | | 187 | | | | 513 | | | | 700 | | | | (35 | ) | | | 40 | |
| Compton | | | CA | | | | 4/1/2008 | | | | (b)(l) | | | | 820 | | | | 529 | | | | (387 | ) | | | 578 | | | | 384 | | | | 962 | | | | (36 | ) | | | 40 | |
| Conneaut | | | OH | | | | 4/1/2008 | | | | (g)(l) | | | | 344 | | | | 1,098 | | | | (783 | ) | | | 147 | | | | 512 | | | | 659 | | | | (76 | ) | | | 40 | |
| Conover | | | NC | | | | 4/1/2008 | | | | (g)(l) | | | | 184 | | | | 925 | | | | (544 | ) | | | 88 | | | | 477 | | | | 565 | | | | (64 | ) | | | 40 | |
| Conway | | | AR | | | | 4/1/2008 | | | | — (l) | | | | 274 | | | | 839 | | | | (120 | ) | | | 243 | | | | 750 | | | | 993 | | | | (55 | ) | | | 40 | |
| Cookeville | | | TN | | | | 4/1/2008 | | | | — (l) | | | | 464 | | | | 3,144 | | | | (665 | ) | | | 369 | | | | 2,574 | | | | 2,943 | | | | (217 | ) | | | 40 | |
| Cornelia | | | GA | | | | 4/1/2008 | | | | — (l) | | | | 104 | | | | 1,603 | | | | (224 | ) | | | 89 | | | | 1,394 | | | | 1,483 | | | | (108 | ) | | | 40 | |
| Cornelius | | | NC | | | | 4/1/2008 | | | | (c)(l) | | | | 1,392 | | | | 1,117 | | | | (751 | ) | | | 962 | | | | 796 | | | | 1,758 | | | | (76 | ) | | | 40 | |
| Cornelius | | | NC | | | | 4/1/2008 | | | | (g)(l) | | | | 1,300 | | | | 1,642 | | | | (541 | ) | | | 1,051 | | | | 1,350 | | | | 2,401 | | | | (112 | ) | | | 40 | |
| Coronado | | | CA | | | | 4/1/2008 | | | | (b)(l) | | | | 732 | | | | 1,692 | | | | (944 | ) | | | 423 | | | | 1,057 | | | | 1,480 | | | | (116 | ) | | | 40 | |
| Cottonwood | | | AL | | | | 4/1/2008 | | | | — (l) | | | | 37 | | | | 103 | | | | — | | | | 37 | | | | 103 | | | | 140 | | | | (7 | ) | | | 40 | |
| Crystal River | | | FL | | | | 4/1/2008 | | | | (e)(l) | | | | 600 | | | | 569 | | | | (234 | ) | | | 476 | | | | 459 | | | | 935 | | | | (38 | ) | | | 40 | |
| Dade City | | | FL | | | | 4/1/2008 | | | | (d)(l) | | | | 225 | | | | 690 | | | | (260 | ) | | | 158 | | | | 497 | | | | 655 | | | | (47 | ) | | | 40 | |
| Dallas | | | NC | | | | 4/1/2008 | | | | (c)(l) | | | | 1,096 | | | | 578 | | | | (350 | ) | | | 861 | | | | 463 | | | | 1,324 | | | | (38 | ) | | | 40 | |
190
TABLE OF CONTENTS
| | | | | | | | | | | | | | | | | | | | | | |
| | State | | Acquisition
Date | | Encumbrances at
December 31,
2010 | | Initial Costs | | Net
Improvements
(Retirements)
Since
Acquisition | | Gross Amount at Which Carried
December 31, 2010(1) | | Accumulated
Depreciation
12/31/10(2) | | Average
Depreciable
Life |
| City | | Land | | Building and
Improvements | | Land | | Building and
Improvements | | Total |
| Dallas | | | TX | | | | 4/1/2008 | | | | (f)(l) | | | | 2,342 | | | | 843 | | | | (629 | ) | | | 1,871 | | | | 685 | | | | 2,556 | | | | (57 | ) | | | 40 | |
| Dallas | | | GA | | | | 4/1/2008 | | | | — (l) | | | | 294 | | | | 603 | | | | (666 | ) | | | 190 | | | | 41 | | | | 231 | | | | (10 | ) | | | 40 | |
| Dalton | | | GA | | | | 4/1/2008 | | | | (g)(l) | | | | 444 | | | | 1,470 | | | | (30 | ) | | | 437 | | | | 1,447 | | | | 1,884 | | | | (101 | ) | | | 40 | |
| Dalton | | | GA | | | | 4/1/2008 | | | | (d)(l) | | | | 127 | | | | 1,286 | | | | (169 | ) | | | 92 | | | | 1,152 | | | | 1,244 | | | | (129 | ) | | | 40 | |
| Davie | | | FL | | | | 4/1/2008 | | | | (g)(l) | | | | 1,304 | | | | 970 | | | | (522 | ) | | | 996 | | | | 756 | | | | 1,752 | | | | (67 | ) | | | 40 | |
| Daytona Beach | | | FL | | | | 4/1/2008 | | | | (e)(l) | | | | 422 | | | | 1,246 | | | | (375 | ) | | | 292 | | | | 1,001 | | | | 1,293 | | | | (98 | ) | | | 40 | |
| Daytona Beach | | | FL | | | | 4/1/2008 | | | | (g)(l) | | | | 1,684 | | | | 1,585 | | | | (1,657 | ) | | | 801 | | | | 811 | | | | 1,612 | | | | (109 | ) | | | 40 | |
| Daytona Beach | | | FL | | | | 4/1/2008 | | | | — (l) | | | | 267 | | | | 732 | | | | (103 | ) | | | 267 | | | | 629 | | | | 896 | | | | (20 | ) | | | 40 | |
| Decatur | | | GA | | | | 4/1/2008 | | | | (g)(l) | | | | 2,225 | | | | 2,627 | | | | (943 | ) | | | 1,752 | | | | 2,157 | | | | 3,909 | | | | (174 | ) | | | 40 | |
| Decatur | | | GA | | | | 4/1/2008 | | | | — (l) | | | | 160 | | | | 439 | | | | — | | | | 160 | | | | 439 | | | | 599 | | | | (30 | ) | | | 40 | |
| Deer Park | | | TX | | | | 4/1/2008 | | | | (f)(l) | | | | 437 | | | | 547 | | | | (204 | ) | | | 343 | | | | 437 | | | | 780 | | | | (37 | ) | | | 40 | |
| Deerfield Beach | | | FL | | | | 4/1/2008 | | | | (k)(l) | | | | 758 | | | | 892 | | | | — | | | | 758 | | | | 892 | | | | 1,650 | | | | (62 | ) | | | 40 | |
| Deland | | | FL | | | | 4/1/2008 | | | | (g)(l) | | | | 1,039 | | | | 3,705 | | | | (1,491 | ) | | | 643 | | | | 2,610 | | | | 3,253 | | | | (285 | ) | | | 40 | |
| Deland | | | FL | | | | 4/1/2008 | | | | — (l) | | | | 196 | | | | 766 | | | | (246 | ) | | | 143 | | | | 573 | | | | 716 | | | | (54 | ) | | | 40 | |
| Delray Beach | | | FL | | | | 4/1/2008 | | | | (g)(l) | | | | 1,080 | | | | 450 | | | | (290 | ) | | | 871 | | | | 369 | | | | 1,240 | | | | (31 | ) | | | 40 | |
| Delray Beach | | | FL | | | | 4/1/2008 | | | | (d)(l) | | | | 892 | | | | 1,652 | | | | (1,117 | ) | | | 472 | | | | 955 | | | | 1,427 | | | | (115 | ) | | | 40 | |
| Denison | | | TX | | | | 4/1/2008 | | | | (b)(l) | | | | 107 | | | | 293 | | | | — | | | | 107 | | | | 293 | | | | 400 | | | | (20 | ) | | | 40 | |
| Denver | | | NC | | | | 4/1/2008 | | | | (c)(l) | | | | 413 | | | | 385 | | | | (192 | ) | | | 310 | | | | 296 | | | | 606 | | | | (26 | ) | | | 40 | |
| Dinuba | | | CA | | | | 4/1/2008 | | | | (e)(l) | | | | 274 | | | | 810 | | | | 26 | | | | 274 | | | | 836 | | | | 1,110 | | | | (540 | ) | | | 40 | |
| Dobbs Ferry | | | NY | | | | 4/1/2008 | | | | — (l) | | | | 187 | | | | 513 | | | | (380 | ) | | | 187 | | | | 133 | | | | 320 | | | | (11 | ) | | | 40 | |
| Dripping Springs | | | TX | | | | 4/1/2008 | | | | (g)(l) | | | | 208 | | | | 2,359 | | | | (2,090 | ) | | | 27 | | | | 450 | | | | 477 | | | | (162 | ) | | | 40 | |
| Dumas | | | TX | | | | 4/1/2008 | | | | (b)(l) | | | | 73 | | | | 201 | | | | (83 | ) | | | 73 | | | | 118 | | | | 191 | | | | (11 | ) | | | 40 | |
| Duncanville | | | TX | | | | 4/1/2008 | | | | (f)(l) | | | | 301 | | | | 304 | | | | (431 | ) | | | 79 | | | | 95 | | | | 174 | | | | (21 | ) | | | 40 | |
| Dunedin | | | FL | | | | 4/1/2008 | | | | — (l) | | | | 507 | | | | 1,392 | | | | (524 | ) | | | 429 | | | | 946 | | | | 1,375 | | | | (36 | ) | | | 40 | |
| Dunn | | | NC | | | | 4/1/2008 | | | | — (l) | | | | 281 | | | | 1,117 | | | | (653 | ) | | | 256 | | | | 489 | | | | 745 | | | | (27 | ) | | | 40 | |
| Dunwoody | | | GA | | | | 4/1/2008 | | | | (g)(l) | | | | 760 | | | | 727 | | | | (115 | ) | | | 699 | | | | 673 | | | | 1,372 | | | | (50 | ) | | | 40 | |
| Durham | | | NC | | | | 4/1/2008 | | | | (c)(l) | | | | 648 | | | | 218 | | | | (287 | ) | | | 430 | | | | 149 | | | | 579 | | | | (15 | ) | | | 40 | |
| Durham | | | NC | | | | 4/1/2008 | | | | (c)(l) | | | | 649 | | | | 436 | | | | (328 | ) | | | 447 | | | | 310 | | | | 757 | | | | (30 | ) | | | 40 | |
| East Alton | | | IL | | | | 4/1/2008 | | | | — (l) | | | | 26 | | | | 542 | | | | 143 | | | | 25 | | | | 686 | | | | 711 | | | | (55 | ) | | | 40 | |
| East Brunswick | | | NJ | | | | 4/1/2008 | | | | (e)(l) | | | | 941 | | | | 2,162 | | | | (779 | ) | | | 683 | | | | 1,641 | | | | 2,324 | | | | (157 | ) | | | 40 | |
| East Gadsden | | | AL | | | | 4/1/2008 | | | | — (l) | | | | 133 | | | | 366 | | | | — | | | | 133 | | | | 366 | | | | 499 | | | | (25 | ) | | | 40 | |
| East Meadow | | | NY | | | | 4/1/2008 | | | | (e)(l) | | | | 1,273 | | | | 5,380 | | | | (6,461 | ) | | | — | | | | 192 | | | | 192 | | | | (192 | ) | | | 40 | |
| East Point | | | GA | | | | 4/1/2008 | | | | (e)(l) | | | | 479 | | | | 696 | | | | (613 | ) | | | 219 | | | | 343 | | | | 562 | | | | (46 | ) | | | 40 | |
| Easton | | | PA | | | | 4/1/2008 | | | | — (l) | | | | 212 | | | | 388 | | | | (257 | ) | | | 212 | | | | 131 | | | | 343 | | | | (19 | ) | | | 40 | |
191
TABLE OF CONTENTS
| | | | | | | | | | | | | | | | | | | | | | |
| | State | | Acquisition
Date | | Encumbrances at
December 31,
2010 | | Initial Costs | | Net
Improvements
(Retirements)
Since
Acquisition | | Gross Amount at Which Carried
December 31, 2010(1) | | Accumulated
Depreciation
12/31/10(2) | | Average
Depreciable
Life |
| City | | Land | | Building and
Improvements | | Land | | Building and
Improvements | | Total |
| Eden | | | NC | | | | 4/1/2008 | | | | — (l) | | | | 63 | | | | 213 | | | | (186 | ) | | | 18 | | | | 72 | | | | 90 | | | | (15 | ) | | | 40 | |
| Eden | | | NC | | | | 4/1/2008 | | | | (c)(l) | | | | 1,230 | | | | 1,148 | | | | (479 | ) | | | 974 | | | | 925 | | | | 1,899 | | | | (76 | ) | | | 40 | |
| Edison Twp. | | | NJ | | | | 4/1/2008 | | | | 576 (l) | | | | 1,435 | | | | 419 | | | | (286 | ) | | | 1,210 | | | | 358 | | | | 1,568 | | | | (29 | ) | | | 40 | |
| Edmonds | | | WA | | | | 4/1/2008 | | | | (e)(l) | | | | 359 | | | | 546 | | | | (503 | ) | | | 127 | | | | 275 | | | | 402 | | | | (45 | ) | | | 40 | |
| El Dorado | | | AR | | | | 4/1/2008 | | | | — (l) | | | | 95 | | | | 3,168 | | | | 83 | | | | 95 | | | | 3,251 | | | | 3,346 | | | | (360 | ) | | | 40 | |
| El Dorado Hills | | | CA | | | | 4/1/2008 | | | | (k)(l) | | | | 704 | | | | 1,749 | | | | (467 | ) | | | 563 | | | | 1,423 | | | | 1,986 | | | | (120 | ) | | | 40 | |
| El Segundo | | | CA | | | | 4/1/2008 | | | | (b)(l) | | | | 1,052 | | | | 677 | | | | (590 | ) | | | 683 | | | | 456 | | | | 1,139 | | | | (47 | ) | | | 40 | |
| Elizabethtown | | | NC | | | | 4/1/2008 | | | | (c)(l) | | | | 448 | | | | 1,285 | | | | (316 | ) | | | 362 | | | | 1,055 | | | | 1,417 | | | | (85 | ) | | | 40 | |
| Elmhurst | | | IL | | | | 4/1/2008 | | | | — (l) | | | | 929 | | | | 1,026 | | | | 15 | | | | 929 | | | | 1,041 | | | | 1,970 | | | | (73 | ) | | | 40 | |
| Emmaus | | | PA | | | | 4/1/2008 | | | | 651 (l) | | | | 798 | | | | 987 | | | | (196 | ) | | | 707 | | | | 882 | | | | 1,589 | | | | (68 | ) | | | 40 | |
| Ennis | | | TX | | | | 4/1/2008 | | | | 1,663 (l) | | | | 1,348 | | | | 1,731 | | | | (1,380 | ) | | | 720 | | | | 979 | | | | 1,699 | | | | (119 | ) | | | 40 | |
| Enterprise | | | AL | | | | 4/1/2008 | | | | — (l) | | | | 133 | | | | 1,526 | | | | (593 | ) | | | 82 | | | | 984 | | | | 1,066 | | | | (103 | ) | | | 40 | |
| Escondido | | | CA | | | | 4/1/2008 | | | | (b)(l) | | | | 4,278 | | | | 5,664 | | | | (1,797 | ) | | | 3,471 | | | | 4,674 | | | | 8,145 | | | | (369 | ) | | | 40 | |
| Euclid | | | OH | | | | 4/1/2008 | | | | (g)(l) | | | | 355 | | | | 1,372 | | | | (714 | ) | | | 200 | | | | 813 | | | | 1,013 | | | | (94 | ) | | | 40 | |
| Euclid | | | OH | | | | 4/1/2008 | | | | (g)(l) | | | | 726 | | | | 449 | | | | (307 | ) | | | 531 | | | | 337 | | | | 868 | | | | (31 | ) | | | 40 | |
| Eureka | | | CA | | | | 4/1/2008 | | | | (e)(l) | | | | 84 | | | | 714 | | | | — | | | | 84 | | | | 714 | | | | 798 | | | | (50 | ) | | | 40 | |
| Eustis | | | FL | | | | 4/1/2008 | | | | (g)(l) | | | | 2,140 | | | | 3,289 | | | | (2,948 | ) | | | 927 | | | | 1,554 | | | | 2,481 | | | | (227 | ) | | | 40 | |
| Fairfax | | | VA | | | | 4/1/2008 | | | | (e)(l) | | | | 675 | | | | 1,992 | | | | (649 | ) | | | 495 | | | | 1,523 | | | | 2,018 | | | | (143 | ) | | | 40 | |
| Farmington | | | CT | | | | 4/1/2008 | | | | (e)(l) | | | | 3,189 | | | | 9,951 | | | | (3,663 | ) | | | 2,251 | | | | 7,226 | | | | 9,477 | | | | (688 | ) | | | 40 | |
| Farmville | | | NC | | | | 4/1/2008 | | | | (c)(l) | | | | 881 | | | | 1,937 | | | | (519 | ) | | | 711 | | | | 1,588 | | | | 2,299 | | | | (128 | ) | | | 40 | |
| Fayetteville | | | FL | | | | 4/1/2008 | | | | (g)(l) | | | | 545 | | | | 3,125 | | | | (549 | ) | | | 458 | | | | 2,663 | | | | 3,121 | | | | (213 | ) | | | 40 | |
| Fayetteville | | | GA | | | | 4/1/2008 | | | | (g)(l) | | | | 574 | | | | 427 | | | | (110 | ) | | | 509 | | | | 382 | | | | 891 | | | | (29 | ) | | | 40 | |
| Fayetteville | | | NC | | | | 4/1/2008 | | | | (c)(l) | | | | 641 | | | | 261 | | | | (304 | ) | | | 421 | | | | 177 | | | | 598 | | | | (18 | ) | | | 40 | |
| Fayetteville | | | NC | | | | 4/1/2008 | | | | (c)(l) | | | | 712 | | | | 284 | | | | (314 | ) | | | 483 | | | | 199 | | | | 682 | | | | (19 | ) | | | 40 | |
| Fayetteville | | | NC | | | | 4/1/2008 | | | | (c)(l) | | | | 559 | | | | 345 | | | | (291 | ) | | | 374 | | | | 239 | | | | 613 | | | | (23 | ) | | | 40 | |
| Fayetteville | | | TN | | | | 4/1/2008 | | | | — (l) | | | | 206 | | | | 1,190 | | | | (475 | ) | | | 131 | | | | 790 | | | | 921 | | | | (80 | ) | | | 40 | |
| Feasterville | | | PA | | | | 4/1/2008 | | | | 847 (l) | | | | 923 | | | | 1,702 | | | | (505 | ) | | | 737 | | | | 1,383 | | | | 2,120 | | | | (117 | ) | | | 40 | |
| Fitzgerald | | | GA | | | | 4/1/2008 | | | | — (l) | | | | 100 | | | | 275 | | | | (75 | ) | | | 100 | | | | 200 | | | | 300 | | | | (5 | ) | | | 40 | |
| Florence | | | SC | | | | 4/1/2008 | | | | — (l) | | | | 80 | | | | 220 | | | | (50 | ) | | | 80 | | | | 170 | | | | 250 | | | | (4 | ) | | | 40 | |
| Florissant | | | MO | | | | 4/1/2008 | | | | (b)(l) | | | | 336 | | | | 746 | | | | (333 | ) | | | 226 | | | | 523 | | | | 749 | | | | (51 | ) | | | 40 | |
| Folsum | | | CA | | | | 4/1/2008 | | | | (e)(l) | | | | 257 | | | | 415 | | | | (325 | ) | | | 114 | | | | 233 | | | | 347 | | | | (28 | ) | | | 40 | |
| Forest City | | | NC | | | | 4/1/2008 | | | | (g)(l) | | | | 509 | | | | 1,822 | | | | (1,205 | ) | | | 231 | | | | 895 | | | | 1,126 | | | | (126 | ) | | | 40 | |
| Forsyth | | | MO | | | | 4/1/2008 | | | | (e)(l) | | | | 93 | | | | 190 | | | | — | | | | 93 | | | | 190 | | | | 283 | | | | (13 | ) | | | 40 | |
| Fort Bragg | | | CA | | | | 4/1/2008 | | | | (e)(l) | | | | 359 | | | | 904 | | | | (626 | ) | | | 153 | | | | 484 | | | | 637 | | | | (87 | ) | | | 40 | |
192
TABLE OF CONTENTS
| | | | | | | | | | | | | | | | | | | | | | |
| | State | | Acquisition
Date | | Encumbrances at
December 31,
2010 | | Initial Costs | | Net
Improvements
(Retirements)
Since
Acquisition | | Gross Amount at Which Carried
December 31, 2010(1) | | Accumulated
Depreciation
12/31/10(2) | | Average
Depreciable
Life |
| City | | Land | | Building and
Improvements | | Land | | Building and
Improvements | | Total |
| Fort Dodge | | | IA | | | | 4/1/2008 | | | | (g)(l) | | | | 210 | | | | 822 | | | | (785 | ) | | | 41 | | | | 206 | | | | 247 | | | | (57 | ) | | | 40 | |
| Fort Lauderdale | | | FL | | | | 4/1/2008 | | | | (i)(l) | | | | 497 | | | | 1,159 | | | | (153 | ) | | | 449 | | | | 1,054 | | | | 1,503 | | | | (80 | ) | | | 40 | |
| Fort Myers | | | FL | | | | 4/1/2008 | | | | (i)(l) | | | | 641 | | | | 707 | | | | (91 | ) | | | 596 | | | | 661 | | | | 1,257 | | | | (49 | ) | | | 40 | |
| Fort Myers | | | FL | | | | 4/1/2008 | | | | (d)(l) | | | | 1,247 | | | | 1,453 | | | | (651 | ) | | | 907 | | | | 1,142 | | | | 2,049 | | | | (105 | ) | | | 40 | |
| Fort Worth | | | TX | | | | 4/1/2008 | | | | (b)(l) | | | | 187 | | | | 513 | | | | — | | | | 187 | | | | 513 | | | | 700 | | | | (35 | ) | | | 40 | |
| Frankfort | | | IN | | | | 4/1/2008 | | | | — (l) | | | | 198 | | | | 545 | | | | (255 | ) | | | 198 | | | | 290 | | | | 488 | | | | (9 | ) | | | 40 | |
| Fresno | | | CA | | | | 4/1/2008 | | | | (e)(l) | | | | 959 | | | | 1,983 | | | | (694 | ) | | | 722 | | | | 1,526 | | | | 2,248 | | | | (133 | ) | | | 40 | |
| Fresno | | | CA | | | | 4/1/2008 | | | | (b)(l) | | | | 716 | | | | 1,003 | | | | (559 | ) | | | 473 | | | | 687 | | | | 1,160 | | | | (69 | ) | | | 40 | |
| Fresno | | | CA | | | | 4/1/2008 | | | | (b)(l) | | | | 782 | | | | 1,067 | | | | (456 | ) | | | 581 | | | | 812 | | | | 1,393 | | | | (73 | ) | | | 40 | |
| Fresno | | | CA | | | | 4/1/2008 | | | | (b)(l) | | | | 593 | | | | 2,178 | | | | (848 | ) | | | 401 | | | | 1,522 | | | | 1,923 | | | | (150 | ) | | | 40 | |
| Frisco | | | TX | | | | 4/1/2008 | | | | (g)(l) | | | | 1,155 | | | | 1,438 | | | | (455 | ) | | | 944 | | | | 1,194 | | | | 2,138 | | | | (99 | ) | | | 40 | |
| Ft Walton Beach | | | FL | | | | 4/1/2008 | | | | (e)(l) | | | | 872 | | | | 845 | | | | (366 | ) | | | 653 | | | | 698 | | | | 1,351 | | | | (63 | ) | | | 40 | |
| Ft. Lauderdale | | | FL | | | | 4/1/2008 | | | | (e)(l) | | | | 313 | | | | 804 | | | | (270 | ) | | | 202 | | | | 645 | | | | 847 | | | | (65 | ) | | | 40 | |
| Ft. Lauderdale | | | FL | | | | 4/1/2008 | | | | (g)(l) | | | | 3,222 | | | | 1,566 | | | | (460 | ) | | | 2,906 | | | | 1,422 | | | | 4,328 | | | | (98 | ) | | | 40 | |
| Ft. Myers Beach | | | FL | | | | 4/1/2008 | | | | (e)(l) | | | | 323 | | | | 538 | | | | (570 | ) | | | 93 | | | | 198 | | | | 291 | | | | (40 | ) | | | 40 | |
| Gardena | | | CA | | | | 4/1/2008 | | | | (b)(l) | | | | 1,426 | | | | 1,500 | | | | (758 | ) | | | 1,043 | | | | 1,125 | | | | 2,168 | | | | (103 | ) | | | 40 | |
| Garfield Height | | | OH | | | | 4/1/2008 | | | | (g)(l) | | | | 132 | | | | 827 | | | | (354 | ) | | | 80 | | | | 525 | | | | 605 | | | | (57 | ) | | | 40 | |
| Garner | | | NC | | | | 4/1/2008 | | | | (c)(l) | | | | 5,784 | | | | 13,027 | | | | (2,079 | ) | | | 5,117 | | | | 11,615 | | | | 16,732 | | | | (773 | ) | | | 40 | |
| Garner | | | NC | | | | 4/1/2008 | | | | (j)(l) | | | | 307 | | | | 468 | | | | (21 | ) | | | 298 | | | | 456 | | | | 754 | | | | (33 | ) | | | 40 | |
| Gastonia | | | NC | | | | 4/1/2008 | | | | (c)(l) | | | | 1,153 | | | | 757 | | | | (403 | ) | | | 903 | | | | 604 | | | | 1,507 | | | | (50 | ) | | | 40 | |
| Gastonia | | | NC | | | | 4/1/2008 | | | | (c)(l) | | | | 594 | | | | 1,807 | | | | (638 | ) | | | 428 | | | | 1,335 | | | | 1,763 | | | | (123 | ) | | | 40 | |
| Gastonia | | | NC | | | | 4/1/2008 | | | | (c)(l) | | | | 5,318 | | | | 4,073 | | | | (1,352 | ) | | | 4,531 | | | | 3,508 | | | | 8,039 | | | | (251 | ) | | | 40 | |
| Geneva | | | OH | | | | 4/1/2008 | | | | (g)(l) | | | | 378 | | | | 1,791 | | | | (510 | ) | | | 284 | | | | 1,375 | | | | 1,659 | | | | (123 | ) | | | 40 | |
| Glendale | | | CA | | | | 4/1/2008 | | | | (b)(l) | | | | 1,490 | | | | 3,837 | | | | (1,651 | ) | | | 1,004 | | | | 2,672 | | | | 3,676 | | | | (264 | ) | | | 40 | |
| Goldsboro | | | NC | | | | 4/1/2008 | | | | (g)(l) | | | | 280 | | | | 545 | | | | (357 | ) | | | 153 | | | | 315 | | | | 468 | | | | (37 | ) | | | 40 | |
| Goldsboro | | | NC | | | | 4/1/2008 | | | | (d)(l) | | | | 483 | | | | 2,233 | | | | (2,091 | ) | | | 88 | | | | 537 | | | | 625 | | | | (154 | ) | | | 40 | |
| Goodwater | | | AL | | | | 4/1/2008 | | | | — (l) | | | | 60 | | | | 165 | | | | — | | | | 60 | | | | 165 | | | | 225 | | | | (11 | ) | | | 40 | |
| Graham | | | NC | | | | 4/1/2008 | | | | (g)(l) | | | | 555 | | | | 655 | | | | — | | | | 555 | | | | 655 | | | | 1,210 | | | | (45 | ) | | | 40 | |
| Grants Pass | | | OR | | | | 4/1/2008 | | | | (g)(l) | | | | 256 | | | | 1,049 | | | | (957 | ) | | | 57 | | | | 291 | | | | 348 | | | | (75 | ) | | | 40 | |
| Great Neck | | | NY | | | | 4/1/2008 | | | | (e)(l) | | | | 4,542 | | | | 8,970 | | | | (3,009 | ) | | | 3,488 | | | | 7,015 | | | | 10,503 | | | | (547 | ) | | | 40 | |
| Green Cove | | | FL | | | | 4/1/2008 | | | | (g)(l) | | | | 1,395 | | | | 2,960 | | | | (481 | ) | | | 1,233 | | | | 2,641 | | | | 3,874 | | | | (203 | ) | | | 40 | |
| Greensboro | | | NC | | | | 4/1/2008 | | | | (a)(l) | | | | 905 | | | | 11,601 | | | | — | | | | 905 | | | | 11,601 | | | | 12,506 | | | | (797 | ) | | | 40 | |
| Greensboro | | | NC | | | | 4/1/2008 | | | | (g)(l) | | | | 532 | | | | 552 | | | | (228 | ) | | | 416 | | | | 440 | | | | 856 | | | | (38 | ) | | | 40 | |
| Greensboro | | | NC | | | | 4/1/2008 | | | | (c)(l) | | | | 703 | | | | 802 | | | | (427 | ) | | | 496 | | | | 582 | | | | 1,078 | | | | (54 | ) | | | 40 | |
193
TABLE OF CONTENTS
| | | | | | | | | | | | | | | | | | | | | | |
| | State | | Acquisition
Date | | Encumbrances at
December 31,
2010 | | Initial Costs | | Net
Improvements
(Retirements)
Since
Acquisition | | Gross Amount at Which Carried
December 31, 2010(1) | | Accumulated
Depreciation
12/31/10(2) | | Average
Depreciable
Life |
| City | | Land | | Building and
Improvements | | Land | | Building and
Improvements | | Total |
| Greensboro | | | NC | | | | 4/1/2008 | | | | (c)(l) | | | | 820 | | | | 423 | | | | (370 | ) | | | 570 | | | | 303 | | | | 873 | | | | (29 | ) | | | 40 | |
| Greensboro | | | NC | | | | 4/1/2008 | | | | (g)(l) | | | | 496 | | | | 530 | | | | (139 | ) | | | 426 | | | | 461 | | | | 887 | | | | (36 | ) | | | 40 | |
| Greensboro | | | NC | | | | 4/1/2008 | | | | (g)(l) | | | | 442 | | | | 539 | | | | (105 | ) | | | 393 | | | | 483 | | | | 876 | | | | (37 | ) | | | 40 | |
| Greensboro | | | NC | | | | 4/1/2008 | | | | (i)(l) | | | | 399 | | | | 368 | | | | (76 | ) | | | 358 | | | | 333 | | | | 691 | | | | (25 | ) | | | 40 | |
| Greenville | | | NC | | | | 4/1/2008 | | | | (g)(l) | | | | 685 | | | | 501 | | | | (591 | ) | | | 333 | | | | 262 | | | | 595 | | | | (34 | ) | | | 40 | |
| Greenville | | | NC | | | | 4/1/2008 | | | | (g)(l) | | | | 718 | | | | 3,628 | | | | — | | | | 718 | | | | 3,628 | | | | 4,346 | | | | (247 | ) | | | 40 | |
| Greenville | | | NC | | | | 4/1/2008 | | | | (c)(l) | | | | 522 | | | | 712 | | | | (391 | ) | | | 350 | | | | 493 | | | | 843 | | | | (49 | ) | | | 40 | |
| Greenville | | | NC | | | | 4/1/2008 | | | | (c)(l) | | | | 371 | | | | 546 | | | | (288 | ) | | | 249 | | | | 380 | | | | 629 | | | | (37 | ) | | | 40 | |
| Greenwich | | | CT | | | | 4/1/2008 | | | | (e)(l) | | | | 2,380 | | | | 7,028 | | | | (1,673 | ) | | | 1,934 | | | | 5,801 | | | | 7,735 | | | | (487 | ) | | | 40 | |
| Gresham | | | OR | | | | 4/1/2008 | | | | (e)(l) | | | | 284 | | | | 353 | | | | 33 | | | | 284 | | | | 386 | | | | 670 | | | | (29 | ) | | | 40 | |
| Grove City | | | FL | | | | 4/1/2008 | | | | (j)(l) | | | | 621 | | | | 269 | | | | (58 | ) | | | 580 | | | | 252 | | | | 832 | | | | (19 | ) | | | 40 | |
| Gulfport* | | | MS | | | | 4/1/2008 | | | | (g)(l) | | | | 169 | | | | — | | | | — | | | | 169 | | | | — | | | | 169 | | | | — | | | | | |
| Hadden Township | | | NJ | | | | 4/1/2008 | | | | (d)(l) | | | | 2,395 | | | | 10,006 | | | | (2,079 | ) | | | 1,929 | | | | 8,393 | | | | 10,322 | | | | (686 | ) | | | 40 | |
| Haddonfield | | | NJ | | | | 4/1/2008 | | | | (j)(l) | | | | 129 | | | | 312 | | | | (29 | ) | | | 120 | | | | 292 | | | | 412 | | | | (22 | ) | | | 40 | |
| Hallandale | | | FL | | | | 4/1/2008 | | | | (b)(l) | | | | 1,153 | | | | 3,338 | | | | (2,684 | ) | | | 387 | | | | 1,420 | | | | 1,807 | | | | (290 | ) | | | 40 | |
| Hamilton Square | | | NJ | | | | 4/1/2008 | | | | (i)(l) | | | | 1,769 | | | | 216 | | | | (412 | ) | | | 1,399 | | | | 174 | | | | 1,573 | | | | (15 | ) | | | 40 | |
| Hammonton | | | NJ | | | | 4/1/2008 | | | | (e)(l) | | | | 553 | | | | 692 | | | | (705 | ) | | | 217 | | | | 323 | | | | 540 | | | | (52 | ) | | | 40 | |
| Hampton | | | VA | | | | 4/1/2008 | | | | (e)(l) | | | | 524 | | | | 580 | | | | — | | | | 524 | | | | 580 | | | | 1,104 | | | | (39 | ) | | | 40 | |
| Hampton | | | VA | | | | 4/1/2008 | | | | (b)(l) | | | | 1,560 | | | | 2,368 | | | | (1,661 | ) | | | 861 | | | | 1,406 | | | | 2,267 | | | | (167 | ) | | | 40 | |
| Hampton | | | VA | | | | 4/1/2008 | | | | — (l) | | | | 133 | | | | 366 | | | | (62 | ) | | | 133 | | | | 304 | | | | 437 | | | | (10 | ) | | | 40 | |
| Hanford | | | CA | | | | 4/1/2008 | | | | (e)(l) | | | | 2,888 | | | | 8,524 | | | | (1,842 | ) | | | 2,399 | | | | 7,171 | | | | 9,570 | | | | (529 | ) | | | 40 | |
| Hanover | | | PA | | | | 4/1/2008 | | | | — (l) | | | | 107 | | | | 293 | | | | — | | | | 107 | | | | 293 | | | | 400 | | | | (20 | ) | | | 40 | |
| Hapeville | | | GA | | | | 4/1/2008 | | | | 1,645 (l) | | | | 631 | | | | 1,656 | | | | (214 | ) | | | 569 | | | | 1,504 | | | | 2,073 | | | | (113 | ) | | | 40 | |
| Hapeville | | | GA | | | | 4/1/2008 | | | | — (l) | | | | 81 | | | | 603 | | | | (531 | ) | | | 14 | | | | 139 | | | | 153 | | | | (41 | ) | | | 40 | |
| Harriman | | | TN | | | | 4/1/2008 | | | | — (l) | | | | 55 | | | | 981 | | | | (191 | ) | | | 44 | | | | 801 | | | | 845 | | | | (69 | ) | | | 40 | |
| Harrisburg | | | NC | | | | 4/1/2008 | | | | (g)(l) | | | | 572 | | | | 514 | | | | (330 | ) | | | 392 | | | | 364 | | | | 756 | | | | (35 | ) | | | 40 | |
| Harrisinburg | | | VA | | | | 4/1/2008 | | | | (d)(l) | | | | 513 | | | | 827 | | | | (598 | ) | | | 254 | | | | 488 | | | | 742 | | | | (61 | ) | | | 40 | |
| Harrisonburg | | | VA | | | | 4/1/2008 | | | | (g)(l) | | | | 598 | | | | 631 | | | | (161 | ) | | | 517 | | | | 551 | | | | 1,068 | | | | (43 | ) | | | 40 | |
| Havelock | | | NC | | | | 4/1/2008 | | | | (g)(l) | | | | 99 | | | | 213 | | | | — | | | | 99 | | | | 213 | | | | 312 | | | | (15 | ) | | | 40 | |
| Havelock | | | NC | | | | 4/1/2008 | | | | — (l) | | | | 212 | | | | 401 | | | | — | | | | 212 | | | | 401 | | | | 613 | | | | (28 | ) | | | 40 | |
| Healdsburg | | | CA | | | | 4/1/2008 | | | | (e)(l) | | | | 1,102 | | | | 919 | | | | (542 | ) | | | 797 | | | | 682 | | | | 1,479 | | | | (62 | ) | | | 40 | |
| Helmet | | | CA | | | | 4/1/2008 | | | | (e)(l) | | | | 758 | | | | 1,303 | | | | (687 | ) | | | 494 | | | | 880 | | | | 1,374 | | | | (90 | ) | | | 40 | |
| Henderson | | | NC | | | | 4/1/2008 | | | | (c)(l) | | | | 738 | | | | 2,824 | | | | (395 | ) | | | 652 | | | | 2,515 | | | | 3,167 | | | | (169 | ) | | | 40 | |
| Henderson | | | NC | | | | 4/1/2008 | | | | (c)(l) | | | | 824 | | | | 982 | | | | (296 | ) | | | 684 | | | | 826 | | | | 1,510 | | | | (63 | ) | | | 40 | |
194
TABLE OF CONTENTS
| | | | | | | | | | | | | | | | | | | | | | |
| | State | | Acquisition
Date | | Encumbrances at
December 31,
2010 | | Initial Costs | | Net
Improvements
(Retirements)
Since
Acquisition | | Gross Amount at Which Carried
December 31, 2010(1) | | Accumulated
Depreciation
12/31/10(2) | | Average
Depreciable
Life |
| City | | Land | | Building and
Improvements | | Land | | Building and
Improvements | | Total |
| Hialeah | | | FL | | | | 4/1/2008 | | | | (b)(l) | | | | 1,005 | | | | 574 | | | | (628 | ) | | | 595 | | | | 356 | | | | 951 | | | | (39 | ) | | | 40 | |
| Hickory | | | NC | | | | 4/1/2008 | | | | 566 (l) | | | | 674 | | | | 570 | | | | (294 | ) | | | 510 | | | | 440 | | | | 950 | | | | (39 | ) | | | 40 | |
| Hickory | | | NC | | | | 4/1/2008 | | | | (g)(l) | | | | 779 | | | | 599 | | | | (472 | ) | | | 504 | | | | 402 | | | | 906 | | | | (41 | ) | | | 40 | |
| Hickory* | | | NC | | | | 4/1/2008 | | | | — (l) | | | | 164 | | | | — | | | | (59 | ) | | | 105 | | | | — | | | | 105 | | | | — | | | | 40 | |
| High Point | | | NC | | | | 4/1/2008 | | | | (c)(l) | | | | 689 | | | | 447 | | | | (298 | ) | | | 503 | | | | 335 | | | | 838 | | | | (30 | ) | | | 40 | |
| High Point | | | NC | | | | 4/1/2008 | | | | (c)(l) | | | | 766 | | | | 595 | | | | (429 | ) | | | 517 | | | | 415 | | | | 932 | | | | (40 | ) | | | 40 | |
| High Point | | | NC | | | | 4/1/2008 | | | | — (l) | | | | 305 | | | | 434 | | | | — | | | | 305 | | | | 434 | | | | 739 | | | | (30 | ) | | | 40 | |
| Highland Park | | | NJ | | | | 4/1/2008 | | | | 401 (l) | | | | 886 | | | | 407 | | | | (196 | ) | | | 749 | | | | 348 | | | | 1,097 | | | | (28 | ) | | | 40 | |
| Highland Sprngs | | | VA | | | | 4/1/2008 | | | | (g)(l) | | | | 136 | | | | 454 | | | | — | | | | 136 | | | | 454 | | | | 590 | | | | (31 | ) | | | 40 | |
| Hightstown | | | NJ | | | | 4/1/2008 | | | | (g)(l) | | | | 1,083 | | | | 589 | | | | (222 | ) | | | 935 | | | | 515 | | | | 1,450 | | | | (40 | ) | | | 40 | |
| Hillsboro | | | TX | | | | 4/1/2008 | | | | 732 (l) | | | | 303 | | | | 1,322 | | | | (466 | ) | | | 211 | | | | 948 | | | | 1,159 | | | | (90 | ) | | | 40 | |
| Hillsborough | | | NC | | | | 4/1/2008 | | | | (c)(l) | | | | 53 | | | | 158 | | | | (44 | ) | | | 40 | | | | 127 | | | | 167 | | | | (35 | ) | | | 40 | |
| Hilton Head | | | SC | | | | 4/1/2008 | | | | (e)(l) | | | | 437 | | | | 484 | | | | (205 | ) | | | 336 | | | | 380 | | | | 716 | | | | (34 | ) | | | 40 | |
| Hilton Head | | | SC | | | | 4/1/2008 | | | | 1,803 (l) | | | | 925 | | | | 1,688 | | | | (424 | ) | | | 768 | | | | 1,421 | | | | 2,189 | | | | (116 | ) | | | 40 | |
| Hilton Head | | | SC | | | | 4/1/2008 | | | | 2,599 (l) | | | | 192 | | | | 4,086 | | | | (776 | ) | | | 155 | | | | 3,347 | | | | 3,502 | | | | (283 | ) | | | 40 | |
| Hinsdale | | | IL | | | | 4/1/2008 | | | | (g)(l) | | | | 538 | | | | 5,074 | | | | (487 | ) | | | 488 | | | | 4,637 | | | | 5,125 | | | | (347 | ) | | | 40 | |
| Holiday | | | FL | | | | 4/1/2008 | | | | (j)(l) | | | | 2,035 | | | | 632 | | | | (353 | ) | | | 1,761 | | | | 553 | | | | 2,314 | | | | (44 | ) | | | 40 | |
| Holly Hill | | | FL | | | | 4/1/2008 | | | | (k)(l) | | | | 953 | | | | 118 | | | | (183 | ) | | | 789 | | | | 99 | | | | 888 | | | | (8 | ) | | | 40 | |
| Hollywood | | | FL | | | | 4/1/2008 | | | | (d)(l) | | | | 334 | | | | 295 | | | | (51 | ) | | | 306 | | | | 272 | | | | 578 | | | | (21 | ) | | | 40 | |
| Homestead | | | FL | | | | 4/1/2008 | | | | (e)(l) | | | | 2,072 | | | | 1,453 | | | | (1,299 | ) | | | 1,287 | | | | 939 | | | | 2,226 | | | | (96 | ) | | | 40 | |
| Horsham | | | PA | | | | 4/1/2008 | | | | (e)(l) | | | | 2,505 | | | | 7,629 | | | | (3,845 | ) | | | 1,503 | | | | 4,786 | | | | 6,289 | | | | (521 | ) | | | 40 | |
| Horton | | | AL | | | | 4/1/2008 | | | | — (l) | | | | 29 | | | | 89 | | | | — | | | | 29 | | | | 89 | | | | 118 | | | | (6 | ) | | | 40 | |
| Hot Springs | | | AR | | | | 4/1/2008 | | | | — (l) | | | | 378 | | | | 3,524 | | | | 15 | | | | 378 | | | | 3,539 | | | | 3,917 | | | | (250 | ) | | | 40 | |
| Houma | | | LA | | | | 4/1/2008 | | | | — (l) | | | | 25 | | | | 225 | | | | 326 | | | | 25 | | | | 551 | | | | 576 | | | | (43 | ) | | | 40 | |
| Houston | | | TX | | | | 4/1/2008 | | | | (e)(l) | | | | 316 | | | | 228 | | | | (118 | ) | | | 245 | | | | 181 | | | | 426 | | | | (16 | ) | | | 40 | |
| Houston | | | TX | | | | 4/1/2008 | | | | (b)(l) | | | | 806 | | | | 5,470 | | | | (1,363 | ) | | | 619 | | | | 4,294 | | | | 4,913 | | | | (396 | ) | | | 40 | |
| Houston | | | TX | | | | 4/1/2008 | | | | (f)(l) | | | | 1,088 | | | | 3,267 | | | | (627 | ) | | | 908 | | | | 2,820 | | | | 3,728 | | | | (215 | ) | | | 40 | |
| Houston | | | TX | | | | 4/1/2008 | | | | (f)(l) | | | | 3,736 | | | | 3,715 | | | | (896 | ) | | | 3,272 | | | | 3,283 | | | | 6,555 | | | | (236 | ) | | | 40 | |
| Houston | | | TX | | | | 4/1/2008 | | | | (f)(l) | | | | 720 | | | | 1,054 | | | | (820 | ) | | | 373 | | | | 581 | | | | 954 | | | | (73 | ) | | | 40 | |
| Houston | | | TX | | | | 4/1/2008 | | | | (f)(l) | | | | 1,152 | | | | 3,443 | | | | (571 | ) | | | 1,001 | | | | 3,023 | | | | 4,024 | | | | (223 | ) | | | 40 | |
| Houston | | | TX | | | | 4/1/2008 | | | | (f)(l) | | | | 1,074 | | | | 3,172 | | | | — | | | | 1,074 | | | | 3,172 | | | | 4,246 | | | | (220 | ) | | | 40 | |
| Houston | | | TX | | | | 4/1/2008 | | | | (f)(l) | | | | 548 | | | | 1,701 | | | | (402 | ) | | | 445 | | | | 1,402 | | | | 1,847 | | | | (116 | ) | | | 40 | |
| Houston | | | TX | | | | 4/1/2008 | | | | (f)(l) | | | | 589 | | | | 1,738 | | | | (421 | ) | | | 476 | | | | 1,430 | | | | 1,906 | | | | (120 | ) | | | 40 | |
| Houston | | | TX | | | | 4/1/2008 | | | | (f)(l) | | | | 707 | | | | 1,639 | | | | (297 | ) | | | 613 | | | | 1,436 | | | | 2,049 | | | | (106 | ) | | | 40 | |
195
TABLE OF CONTENTS
| | | | | | | | | | | | | | | | | | | | | | |
| | State | | Acquisition
Date | | Encumbrances at
December 31,
2010 | | Initial Costs | | Net
Improvements
(Retirements)
Since
Acquisition | | Gross Amount at Which Carried
December 31, 2010(1) | | Accumulated
Depreciation
12/31/10(2) | | Average
Depreciable
Life |
| City | | Land | | Building and
Improvements | | Land | | Building and
Improvements | | Total |
| Houston | | | TX | | | | 4/1/2008 | | | | (f)(l) | | | | 243 | | | | 177 | | | | — | | | | 243 | | | | 177 | | | | 420 | | | | (12 | ) | | | 40 | |
| Houston* | | | TX | | | | 4/1/2008 | | | | — (l) | | | | 400 | | | | 1,099 | | | | (1,399 | ) | | | 100 | | | | — | | | | 100 | | | | — | | | | | |
| Hudson | | | FL | | | | 4/1/2008 | | | | (h)(l) | | | | 954 | | | | 415 | | | | (84 | ) | | | 894 | | | | 391 | | | | 1,285 | | | | (29 | ) | | | 40 | |
| Humble | | | TX | | | | 4/1/2008 | | | | (f)(l) | | | | 1,402 | | | | 1,413 | | | | (500 | ) | | | 1,144 | | | | 1,171 | | | | 2,315 | | | | (96 | ) | | | 40 | |
| Huntersville | | | NC | | | | 4/1/2008 | | | | (g)(l) | | | | 1,113 | | | | 1,061 | | | | (334 | ) | | | 936 | | | | 904 | | | | 1,840 | | | | (73 | ) | | | 40 | |
| Huntsville | | | AL | | | | 4/1/2008 | | | | — (l) | | | | 767 | | | | 1,407 | | | | (304 | ) | | | 655 | | | | 1,215 | | | | 1,870 | | | | (93 | ) | | | 40 | |
| Independence | | | KS | | | | 4/1/2008 | | | | (b)(l) | | | | 42 | | | | 491 | | | | — | | | | 42 | | | | 491 | | | | 533 | | | | (34 | ) | | | 40 | |
| Independence | | | MO | | | | 4/1/2008 | | | | (e)(l) | | | | 647 | | | | 1,044 | | | | (978 | ) | | | 256 | | | | 457 | | | | 713 | | | | (71 | ) | | | 40 | |
| Independence | | | MO | | | | 4/1/2008 | | | | (b)(l) | | | | 112 | | | | 968 | | | | (553 | ) | | | 44 | | | | 483 | | | | 527 | | | | (91 | ) | | | 40 | |
| Indianola | | | IA | | | | 4/1/2008 | | | | — (l) | | | | 89 | | | | 586 | | | | — | | | | 89 | | | | 586 | | | | 675 | | | | (41 | ) | | | 40 | |
| Inglewood | | | CA | | | | 4/1/2008 | | | | (b)(l) | | | | 1,290 | | | | 1,683 | | | | (1,054 | ) | | | 814 | | | | 1,105 | | | | 1,919 | | | | (116 | ) | | | 40 | |
| Inverness | | | FL | | | | 4/1/2008 | | | | — (l) | | | | 559 | | | | 1,501 | | | | (1,716 | ) | | | 141 | | | | 203 | | | | 344 | | | | (37 | ) | | | 40 | |
| Irmo | | | SC | | | | 4/1/2008 | | | | (i)(l) | | | | 575 | | | | 607 | | | | (84 | ) | | | 533 | | | | 565 | | | | 1,098 | | | | (42 | ) | | | 40 | |
| Irvington | | | NJ | | | | 4/1/2008 | | | | (g)(l) | | | | 689 | | | | 764 | | | | (294 | ) | | | 544 | | | | 615 | | | | 1,159 | | | | (52 | ) | | | 40 | |
| Jacksonville | | | FL | | | | 4/1/2008 | | | | (b)(l) | | | | 2,260 | | | | 33,097 | | | | (10,942 | ) | | | 1,506 | | | | 22,909 | | | | 24,415 | | | | (2,278 | ) | | | 40 | |
| Jacksonville | | | FL | | | | 4/1/2008 | | | | (b)(l) | | | | 1,195 | | | | 14,942 | | | | (4,970 | ) | | | 803 | | | | 10,364 | | | | 11,167 | | | | (1,026 | ) | | | 40 | |
| Jacksonville | | | FL | | | | 4/1/2008 | | | | (b)(l) | | | | 1,132 | | | | 14,074 | | | | (4,670 | ) | | | 757 | | | | 9,779 | | | | 10,536 | | | | (969 | ) | | | 40 | |
| Jacksonville | | | FL | | | | 4/1/2008 | | | | (b)(l) | | | | 1,523 | | | | 21,656 | | | | (7,174 | ) | | | 1,007 | | | | 14,998 | | | | 16,005 | | | | (1,544 | ) | | | 40 | |
| Jacksonville | | | FL | | | | 4/1/2008 | | | | (b)(l) | | | | 1,093 | | | | 14,509 | | | | (4,803 | ) | | | 734 | | | | 10,065 | | | | 10,799 | | | | (998 | ) | | | 40 | |
| Jacksonville | | | FL | | | | 4/1/2008 | | | | (b)(l) | | | | 2,298 | | | | 36,643 | | | | (11,771 | ) | | | 1,555 | | | | 25,615 | | | | 27,170 | | | | (2,522 | ) | | | 40 | |
| Jacksonville | | | FL | | | | 4/1/2008 | | | | (b)(l) | | | | 1,069 | | | | 13,368 | | | | (4,648 | ) | | | 700 | | | | 9,089 | | | | 9,789 | | | | (920 | ) | | | 40 | |
| Jacksonville | | | FL | | | | 4/1/2008 | | | | (b)(l) | | | | 473 | | | | 2,431 | | | | (947 | ) | | | 309 | | | | 1,648 | | | | 1,957 | | | | (168 | ) | | | 40 | |
| Jacksonville | | | FL | | | | 4/1/2008 | | | | (b)(l) | | | | 4 | | | | 681 | | | | (249 | ) | | | 3 | | | | 433 | | | | 436 | | | | (47 | ) | | | 40 | |
| Jacksonville | | | FL | | | | 4/1/2008 | | | | (b)(l) | | | | 829 | | | | 2,145 | | | | (1,059 | ) | | | 518 | | | | 1,397 | | | | 1,915 | | | | (148 | ) | | | 40 | |
| Jacksonville | | | FL | | | | 4/1/2008 | | | | (b)(l) | | | | 283 | | | | 656 | | | | (252 | ) | | | 203 | | | | 484 | | | | 687 | | | | (45 | ) | | | 40 | |
| Jacksonville | | | FL | | | | 4/1/2008 | | | | (g)(l) | | | | 2,562 | | | | 11,801 | | | | (9,103 | ) | | | 841 | | | | 4,419 | | | | 5,260 | | | | (808 | ) | | | 40 | |
| Jacksonville | | | FL | | | | 4/1/2008 | | | | 2,258 (l) | | | | 2,366 | | | | 5,636 | | | | (1,403 | ) | | | 1,931 | | | | 4,668 | | | | 6,599 | | | | (376 | ) | | | 40 | |
| Jacksonville | | | FL | | | | 4/1/2008 | | | | (g)(l) | | | | 1,367 | | | | 692 | | | | (686 | ) | | | 901 | | | | 472 | | | | 1,373 | | | | (47 | ) | | | 40 | |
| Jacksonville | | | FL | | | | 4/1/2008 | | | | 539 (l) | | | | 585 | | | | 714 | | | | (310 | ) | | | 440 | | | | 549 | | | | 989 | | | | (48 | ) | | | 40 | |
| Jacksonville | | | FL | | | | 4/1/2008 | | | | (g)(l) | | | | 1,437 | | | | 2,988 | | | | (1,624 | ) | | | 884 | | | | 1,917 | | | | 2,801 | | | | (204 | ) | | | 40 | |
| Jacksonville | | | FL | | | | 4/1/2008 | | | | 1,674 (l) | | | | 2,164 | | | | 4,181 | | | | (996 | ) | | | 1,809 | | | | 3,540 | | | | 5,349 | | | | (277 | ) | | | 40 | |
| Jacksonville | | | FL | | | | 4/1/2008 | | | | (i)(l) | | | | 746 | | | | 317 | | | | (94 | ) | | | 678 | | | | 291 | | | | 969 | | | | (22 | ) | | | 40 | |
| Jacksonville | | | FL | | | | 4/1/2008 | | | | — (l) | | | | 160 | | | | 439 | | | | — | | | | 160 | | | | 439 | | | | 599 | | | | (30 | ) | | | 40 | |
| Jacksonville | | | FL | | | | 4/1/2008 | | | | — (l) | | | | 267 | | | | 732 | | | | (601 | ) | | | 267 | | | | 131 | | | | 398 | | | | (11 | ) | | | 40 | |
196
TABLE OF CONTENTS
| | | | | | | | | | | | | | | | | | | | | | |
| | State | | Acquisition
Date | | Encumbrances at
December 31,
2010 | | Initial Costs | | Net
Improvements
(Retirements)
Since
Acquisition | | Gross Amount at Which Carried
December 31, 2010(1) | | Accumulated
Depreciation
12/31/10(2) | | Average
Depreciable
Life |
| City | | Land | | Building and
Improvements | | Land | | Building and
Improvements | | Total |
| Jamaica | | | NY | | | | 4/1/2008 | | | | (e)(l) | | | | 4,550 | | | | 3,846 | | | | (1,611 | ) | | | 3,651 | | | | 3,134 | | | | 6,785 | | | | (241 | ) | | | 40 | |
| Jefferson | | | GA | | | | 4/1/2008 | | | | — (l) | | | | 154 | | | | 641 | | | | (80 | ) | | | 138 | | | | 577 | | | | 715 | | | | (43 | ) | | | 40 | |
| Jefferson | | | NC | | | | 4/1/2008 | | | | (g)(l) | | | | 215 | | | | 780 | | | | (225 | ) | | | 164 | | | | 606 | | | | 770 | | | | (54 | ) | | | 40 | |
| Jefferson | | | OH | | | | 4/1/2008 | | | | (g)(l) | | | | 483 | | | | 1,634 | | | | (1,085 | ) | | | 222 | | | | 810 | | | | 1,032 | | | | (113 | ) | | | 40 | |
| Jenkintown | | | PA | | | | 4/1/2008 | | | | 13,869 (l) | | | | 5,075 | | | | 14,209 | | | | (5,713 | ) | | | 3,454 | | | | 10,117 | | | | 13,571 | | | | (978 | ) | | | 40 | |
| Kalamazoo | | | MI | | | | 4/1/2008 | | | | (g)(l) | | | | 414 | | | | 2,824 | | | | (1,064 | ) | | | 269 | | | | 1,905 | | | | 2,174 | | | | (201 | ) | | | 40 | |
| Kannapolis | | | NC | | | | 4/1/2008 | | | | (g)(l) | | | | 642 | | | | 479 | | | | (410 | ) | | | 400 | | | | 311 | | | | 711 | | | | (33 | ) | | | 40 | |
| Kansas City | | | MO | | | | 4/1/2008 | | | | — (l) | | | | 3,965 | | | | 29,379 | | | | (14,117 | ) | | | 2,165 | | | | 17,062 | | | | 19,227 | | | | (2,195 | ) | | | 40 | |
| Kansas City | | | MO | | | | 4/1/2008 | | | | (e)(l) | | | | 952 | | | | 920 | | | | (780 | ) | | | 508 | | | | 584 | | | | 1,092 | | | | (77 | ) | | | 40 | |
| Kansas City | | | KS | | | | 4/1/2008 | | | | — (l) | | | | 40 | | | | 110 | | | | (150 | ) | | | — | | | | — | | | | — | | | | — | | | | 40 | |
| Kenansville | | | NC | | | | 4/1/2008 | | | | (c)(l) | | | | 467 | | | | 523 | | | | (239 | ) | | | 350 | | | | 401 | | | | 751 | | | | (35 | ) | | | 40 | |
| Kendall Park | | | NJ | | | | 4/1/2008 | | | | (g)(l) | | | | 860 | | | | 378 | | | | (115 | ) | | | 778 | | | | 345 | | | | 1,123 | | | | (26 | ) | | | 40 | |
| Kenilworth | | | NJ | | | | 4/1/2008 | | | | 392 (l) | | | | 1,084 | | | | 686 | | | | (469 | ) | | | 789 | | | | 512 | | | | 1,301 | | | | (47 | ) | | | 40 | |
| Kennett Square | | | PA | | | | 4/1/2008 | | | | (g)(l) | | | | 875 | | | | 2,064 | | | | (291 | ) | | | 784 | | | | 1,864 | | | | 2,648 | | | | (141 | ) | | | 40 | |
| Kennewick | | | WA | | | | 4/1/2008 | | | | (e)(l) | | | | 485 | | | | 435 | | | | (324 | ) | | | 290 | | | | 306 | | | | 596 | | | | (33 | ) | | | 40 | |
| Kent | | | OH | | | | 4/1/2008 | | | | (g)(l) | | | | 137 | | | | 100 | | | | — | | | | 137 | | | | 100 | | | | 237 | | | | (7 | ) | | | 40 | |
| Kilgore | | | TX | | | | 4/1/2008 | | | | — (l) | | | | 216 | | | | 420 | | | | — | | | | 216 | | | | 420 | | | | 636 | | | | (28 | ) | | | 40 | |
| King | | | NC | | | | 4/1/2008 | | | | 472 (l) | | | | 751 | | | | 833 | | | | (334 | ) | | | 587 | | | | 663 | | | | 1,250 | | | | (56 | ) | | | 40 | |
| Kinston | | | NC | | | | 4/1/2008 | | | | (c)(l) | | | | 1,400 | | | | 2,696 | | | | (688 | ) | | | 1,154 | | | | 2,254 | | | | 3,408 | | | | (175 | ) | | | 40 | |
| Knightdale | | | NC | | | | 4/1/2008 | | | | (g)(l) | | | | 280 | | | | 156 | | | | (56 | ) | | | 243 | | | | 137 | | | | 380 | | | | (11 | ) | | | 40 | |
| Lake Hiawatha | | | NJ | | | | 4/1/2008 | | | | (g)(l) | | | | 548 | | | | 366 | | | | (166 | ) | | | 446 | | | | 302 | | | | 748 | | | | (25 | ) | | | 40 | |
| Lake Mary | | | FL | | | | 4/1/2008 | | | | (g)(l) | | | | 1,023 | | | | 1,334 | | | | (155 | ) | | | 953 | | | | 1,249 | | | | 2,202 | | | | (91 | ) | | | 40 | |
| Lakeland | | | FL | | | | 4/1/2008 | | | | 450 (l) | | | | 648 | | | | 407 | | | | (271 | ) | | | 477 | | | | 307 | | | | 784 | | | | (28 | ) | | | 40 | |
| Lakeland | | | FL | | | | 4/1/2008 | | | | (d)(l) | | | | 573 | | | | 1,659 | | | | (1,701 | ) | | | 113 | | | | 418 | | | | 531 | | | | (113 | ) | | | 40 | |
| Lakeport | | | CA | | | | 4/1/2008 | | | | (i)(l) | | | | 818 | | | | 3,715 | | | | (892 | ) | | | 648 | | | | 2,993 | | | | 3,641 | | | | (251 | ) | | | 40 | |
| Lakewood | | | NJ | | | | 4/1/2008 | | | | (e)(l) | | | | 1,133 | | | | 943 | | | | (577 | ) | | | 808 | | | | 691 | | | | 1,499 | | | | (64 | ) | | | 40 | |
| Lancaster | | | PA | | | | 4/1/2008 | | | | (d)(l) | | | | 1,278 | | | | 7,408 | | | | (1,852 | ) | | | 966 | | | | 5,868 | | | | 6,834 | | | | (516 | ) | | | 40 | |
| Landing | | | NJ | | | | 4/1/2008 | | | | (g)(l) | | | | 959 | | | | 603 | | | | (302 | ) | | | 768 | | | | 492 | | | | 1,260 | | | | (41 | ) | | | 40 | |
| Lansing | | | MI | | | | 4/1/2008 | | | | (g)(l) | | | | 38 | | | | 741 | | | | — | | | | 38 | | | | 741 | | | | 779 | | | | (50 | ) | | | 40 | |
| Lantana | | | FL | | | | 4/1/2008 | | | | 910 (l) | | | | 1,600 | | | | 892 | | | | (500 | ) | | | 1,271 | | | | 721 | | | | 1,992 | | | | (60 | ) | | | 40 | |
| LaPorte | | | IN | | | | 4/1/2008 | | | | — (l) | | | | 101 | | | | 401 | | | | (226 | ) | | | 52 | | | | 224 | | | | 276 | | | | (32 | ) | | | 40 | |
| Largo | | | FL | | | | 4/1/2008 | | | | (g)(l) | | | | 631 | | | | 243 | | | | (342 | ) | | | 379 | | | | 153 | | | | 532 | | | | (17 | ) | | | 40 | |
| Largo | | | FL | | | | 4/1/2008 | | | | (i)(l) | | | | 1,079 | | | | 974 | | | | (104 | ) | | | 1,023 | | | | 926 | | | | 1,949 | | | | (67 | ) | | | 40 | |
| Las Cruces | | | NM | | | | 4/1/2008 | | | | (e)(l) | | | | 134 | | | | 557 | | | | — | | | | 134 | | | | 557 | | | | 691 | | | | (38 | ) | | | 40 | |
197
TABLE OF CONTENTS
| | | | | | | | | | | | | | | | | | | | | | |
| | State | | Acquisition
Date | | Encumbrances at
December 31,
2010 | | Initial Costs | | Net
Improvements
(Retirements)
Since
Acquisition | | Gross Amount at Which Carried
December 31, 2010(1) | | Accumulated
Depreciation
12/31/10(2) | | Average
Depreciable
Life |
| City | | Land | | Building and
Improvements | | Land | | Building and
Improvements | | Total |
| Las Vegas | | | NV | | | | 4/1/2008 | | | | (e)(l) | | | | 6,660 | | | | 6,475 | | | | (2,351 | ) | | | 5,410 | | | | 5,374 | | | | 10,784 | | | | (463 | ) | | | 40 | |
| Lawrenceville | | | GA | | | | 4/1/2008 | | | | (g)(l) | | | | 1,109 | | | | 861 | | | | — | | | | 1,109 | | | | 861 | | | | 1,970 | | | | (59 | ) | | | 40 | |
| Lawrenceville | | | NJ | | | | 4/1/2008 | | | | (g)(l) | | | | 1,623 | | | | 743 | | | | (437 | ) | | | 1,317 | | | | 612 | | | | 1,929 | | | | (51 | ) | | | 40 | |
| Lebanon | | | PA | | | | 4/1/2008 | | | | (g)(l) | | | | 362 | | | | 1,471 | | | | (162 | ) | | | 319 | | | | 1,352 | | | | 1,671 | | | | (106 | ) | | | 40 | |
| Lebanon | | | TN | | | | 4/1/2008 | | | | (e)(l) | | | | 66 | | | | 180 | | | | 97 | | | | 66 | | | | 277 | | | | 343 | | | | (19 | ) | | | 40 | |
| Leesburg | | | VA | | | | 4/1/2008 | | | | (g)(l) | | | | 3,221 | | | | 1,191 | | | | (884 | ) | | | 2,563 | | | | 965 | | | | 3,528 | | | | (82 | ) | | | 40 | |
| Lemnoir | | | NC | | | | 4/1/2008 | | | | — (l) | | | | 288 | | | | 298 | | | | — | | | | 288 | | | | 298 | | | | 586 | | | | (20 | ) | | | 40 | |
| Lemoore | | | CA | | | | 4/1/2008 | | | | (e)(l) | | | | 907 | | | | 1,132 | | | | (751 | ) | | | 550 | | | | 738 | | | | 1,288 | | | | (82 | ) | | | 40 | |
| Levittown | | | NY | | | | 4/1/2008 | | | | (e)(l) | | | | 321 | | | | 949 | | | | (195 | ) | | | 264 | | | | 811 | | | | 1,075 | | | | (178 | ) | | | 40 | |
| Lexington | | | MO | | | | 4/1/2008 | | | | (b)(l) | | | | 5 | | | | 160 | | | | 15 | | | | 5 | | | | 175 | | | | 180 | | | | (11 | ) | | | 40 | |
| Lexington | | | NC | | | | 4/1/2008 | | | | (g)(l) | | | | 477 | | | | 3,800 | | | | (2,197 | ) | | | 216 | | | | 1,864 | | | | 2,080 | | | | (262 | ) | | | 40 | |
| Lexington | | | TN | | | | 4/1/2008 | | | | — (l) | | | | 155 | | | | 933 | | | | (55 | ) | | | 145 | | | | 888 | | | | 1,033 | | | | (63 | ) | | | 40 | |
| LighthousePoint | | | FL | | | | 4/1/2008 | | | | (b)(l) | | | | 710 | | | | 1,382 | | | | (1,529 | ) | | | 163 | | | | 400 | | | | 563 | | | | (101 | ) | | | 40 | |
| Lilburn | | | GA | | | | 4/1/2008 | | | | (k)(l) | | | | 777 | | | | 418 | | | | (192 | ) | | | 649 | | | | 354 | | | | 1,003 | | | | (29 | ) | | | 40 | |
| Lincoln | | | IL | | | | 4/1/2008 | | | | — (l) | | | | 66 | | | | 530 | | | | 1 | | | | 66 | | | | 531 | | | | 597 | | | | (35 | ) | | | 40 | |
| Lincolnton | | | NC | | | | 4/1/2008 | | | | (c)(l) | | | | 415 | | | | 422 | | | | (250 | ) | | | 287 | | | | 300 | | | | 587 | | | | (29 | ) | | | 40 | |
| Lincolnton | | | NC | | | | 4/1/2008 | | | | (g)(l) | | | | 58 | | | | 1,656 | | | | (311 | ) | | | 47 | | | | 1,356 | | | | 1,403 | | | | (112 | ) | | | 40 | |
| Linden | | | NJ | | | | 4/1/2008 | | | | (e)(l) | | | | 629 | | | | 1,857 | | | | (628 | ) | | | 461 | | | | 1,397 | | | | 1,858 | | | | (129 | ) | | | 40 | |
| Linden | | | NJ | | | | 4/1/2008 | | | | (g)(l) | | | | 1,397 | | | | 1,066 | | | | (258 | ) | | | 1,246 | | | | 959 | | | | 2,205 | | | | (73 | ) | | | 40 | |
| Linden | | | NJ | | | | 4/1/2008 | | | | (g)(l) | | | | 1,580 | | | | 1,531 | | | | (288 | ) | | | 1,429 | | | | 1,394 | | | | 2,823 | | | | (104 | ) | | | 40 | |
| Linwood | | | PA | | | | 4/1/2008 | | | | — (l) | | | | 98 | | | | 187 | | | | (41 | ) | | | 98 | | | | 146 | | | | 244 | | | | (12 | ) | | | 40 | |
| Live Oak | | | FL | | | | 4/1/2008 | | | | (e)(l) | | | | 181 | | | | 620 | | | | 49 | | | | 181 | | | | 669 | | | | 850 | | | | (47 | ) | | | 40 | |
| Livermore | | | CA | | | | 4/1/2008 | | | | (e)(l) | | | | 1,194 | | | | 1,579 | | | | (833 | ) | | | 778 | | | | 1,162 | | | | 1,940 | | | | (118 | ) | | | 40 | |
| London | | | KY | | | | 4/1/2008 | | | | — (l) | | | | 439 | | | | 1,375 | | | | (990 | ) | | | 186 | | | | 638 | | | | 824 | | | | (95 | ) | | | 40 | |
| Long Beach | | | CA | | | | 4/1/2008 | | | | (b)(l) | | | | 957 | | | | 697 | | | | (545 | ) | | | 624 | | | | 485 | | | | 1,109 | | | | (50 | ) | | | 40 | |
| Long Beach | | | CA | | | | 4/1/2008 | | | | (b)(l) | | | | 1,232 | | | | 2,990 | | | | (1,675 | ) | | | 718 | | | | 1,829 | | | | 2,547 | | | | (206 | ) | | | 40 | |
| Long Beach | | | CA | | | | 4/1/2008 | | | | (b)(l) | | | | 1,983 | | | | 1,631 | | | | (1,128 | ) | | | 1,345 | | | | 1,141 | | | | 2,486 | | | | (109 | ) | | | 40 | |
| Longview | | | TX | | | | 4/1/2008 | | | | — (l) | | | | — | | | | 1,254 | | | | (538 | ) | | | — | | | | 716 | | | | 716 | | | | (85 | ) | | | 40 | |
| Los Angeles | | | CA | | | | 4/1/2008 | | | | (e)(l) | | | | 2,369 | | | | 12,153 | | | | (2,616 | ) | | | 1,910 | | | | 9,996 | | | | 11,906 | | | | (770 | ) | | | 40 | |
| Los Angeles | | | CA | | | | 4/1/2008 | | | | (e)(l) | | | | 1,973 | | | | 3,453 | | | | (1,168 | ) | | | 1,530 | | | | 2,728 | | | | 4,258 | | | | (227 | ) | | | 40 | |
| Los Angeles | | | CA | | | | 4/1/2008 | | | | (b)(l) | | | | 871 | | | | 913 | | | | (866 | ) | | | 433 | | | | 485 | | | | 918 | | | | (63 | ) | | | 40 | |
| Los Angeles | | | CA | | | | 4/1/2008 | | | | (b)(l) | | | | 510 | | | | 777 | | | | (435 | ) | | | 330 | | | | 522 | | | | 852 | | | | (53 | ) | | | 40 | |
| Lufkin | | | TX | | | | 4/1/2008 | | | | — (l) | | | | 241 | | | | 1,158 | | | | (665 | ) | | | 241 | | | | 493 | | | | 734 | | | | (15 | ) | | | 40 | |
| Lutcher | | | LA | | | | 4/1/2008 | | | | — (l) | | | | 45 | | | | 239 | | | | — | | | | 45 | | | | 239 | | | | 284 | | | | (16 | ) | | | 40 | |
198
TABLE OF CONTENTS
| | | | | | | | | | | | | | | | | | | | | | |
| | State | | Acquisition
Date | | Encumbrances at
December 31,
2010 | | Initial Costs | | Net
Improvements
(Retirements)
Since
Acquisition | | Gross Amount at Which Carried
December 31, 2010(1) | | Accumulated
Depreciation
12/31/10(2) | | Average
Depreciable
Life |
| City | | Land | | Building and
Improvements | | Land | | Building and
Improvements | | Total |
| Lutz | | | FL | | | | 4/1/2008 | | | | (h)(l) | | | | 1,175 | | | | 678 | | | | (79 | ) | | | 1,123 | | | | 651 | | | | 1,774 | | | | (47 | ) | | | 40 | |
| Lynden | | | WA | | | | 4/1/2008 | | | | (e)(l) | | | | 28 | | | | 61 | | | | — | | | | 28 | | | | 61 | | | | 89 | | | | (4 | ) | | | 40 | |
| Lynwood | | | CA | | | | 4/1/2008 | | | | (b)(l) | | | | 619 | | | | 924 | | | | (474 | ) | | | 406 | | | | 663 | | | | 1,069 | | | | (72 | ) | | | 40 | |
| Mabletown | | | GA | | | | 4/1/2008 | | | | (g)(l) | | | | 936 | | | | 3,032 | | | | (2,880 | ) | | | 219 | | | | 869 | | | | 1,088 | | | | (208 | ) | | | 40 | |
| Macon | | | GA | | | | 4/1/2008 | | | | 1,333 (l) | | | | 392 | | | | 2,330 | | | | (839 | ) | | | 265 | | | | 1,618 | | | | 1,883 | | | | (160 | ) | | | 40 | |
| Madison Heights | | | VA | | | | 4/1/2008 | | | | — (l) | | | | 191 | | | | 200 | | | | — | | | | 191 | | | | 200 | | | | 391 | | | | (14 | ) | | | 40 | |
| Malden | | | MA | | | | 4/1/2008 | | | | (e)(l) | | | | 9,165 | | | | 25,032 | | | | (7,925 | ) | | | 6,855 | | | | 19,417 | | | | 26,272 | | | | (1,702 | ) | | | 40 | |
| Manakin-Sabot | | | VA | | | | 4/1/2008 | | | | (k)(l) | | | | 619 | | | | 94 | | | | (60 | ) | | | 566 | | | | 87 | | | | 653 | | | | (7 | ) | | | 40 | |
| Manasquan | | | NJ | | | | 4/1/2008 | | | | — (l) | | | | 851 | | | | 649 | | | | (200 | ) | | | 734 | | | | 566 | | | | 1,300 | | | | (45 | ) | | | 40 | |
| Maplewood | | | NJ | | | | 4/1/2008 | | | | (e)(l) | | | | 212 | | | | 1,018 | | | | (172 | ) | | | 181 | | | | 877 | | | | 1,058 | | | | (68 | ) | | | 40 | |
| Marco Island | | | FL | | | | 4/1/2008 | | | | (h)(l) | | | | 1,222 | | | | 316 | | | | (155 | ) | | | 1,097 | | | | 286 | | | | 1,383 | | | | (22 | ) | | | 40 | |
| Marianna | | | FL | | | | 4/1/2008 | | | | — (l) | | | | 104 | | | | 571 | | | | (88 | ) | | | 89 | | | | 498 | | | | 587 | | | | (39 | ) | | | 40 | |
| Marietta | | | GA | | | | 4/1/2008 | | | | (g)(l) | | | | 756 | | | | 451 | | | | (404 | ) | | | 496 | | | | 307 | | | | 803 | | | | (31 | ) | | | 40 | |
| Marietta | | | GA | | | | 4/1/2008 | | | | (g)(l) | | | | 1,162 | | | | 722 | | | | (211 | ) | | | 1,031 | | | | 642 | | | | 1,673 | | | | (14 | ) | | | 40 | |
| Marietta | | | GA | | | | 4/1/2008 | | | | (i)(l) | | | | 688 | | | | 329 | | | | (129 | ) | | | 599 | | | | 289 | | | | 888 | | | | (23 | ) | | | 40 | |
| Marion | | | NC | | | | 4/1/2008 | | | | 725 (l) | | | | 944 | | | | 797 | | | | (395 | ) | | | 723 | | | | 623 | | | | 1,346 | | | | (54 | ) | | | 40 | |
| Marion | | | NC | | | | 4/1/2008 | | | | (c)(l) | | | | 748 | | | | 1,504 | | | | (642 | ) | | | 525 | | | | 1,085 | | | | 1,610 | | | | (102 | ) | | | 40 | |
| Martinez | | | GA | | | | 4/1/2008 | | | | (g)(l) | | | | 1,177 | | | | 1,388 | | | | (1,486 | ) | | | 469 | | | | 610 | | | | 1,079 | | | | (95 | ) | | | 40 | |
| Mason | | | OH | | | | 4/1/2008 | | | | (g)(l) | | | | 338 | | | | 230 | | | | (62 | ) | | | 300 | | | | 206 | | | | 506 | | | | (16 | ) | | | 40 | |
| Media | | | PA | | | | 4/1/2008 | | | | (d)(l) | | | | 309 | | | | 913 | | | | (204 | ) | | | 233 | | | | 785 | | | | 1,018 | | | | (133 | ) | | | 40 | |
| Medina | | | OH | | | | 4/1/2008 | | | | (g)(l) | | | | 254 | | | | 977 | | | | (238 | ) | | | 202 | | | | 791 | | | | 993 | | | | (67 | ) | | | 40 | |
| Melbourne | | | FL | | | | 4/1/2008 | | | | (g)(l) | | | | 638 | | | | 432 | | | | (33 | ) | | | 618 | | | | 419 | | | | 1,037 | | | | (30 | ) | | | 40 | |
| Mentor | | | OH | | | | 4/1/2008 | | | | (g)(l) | | | | 522 | | | | 643 | | | | (386 | ) | | | 342 | | | | 437 | | | | 779 | | | | (44 | ) | | | 40 | |
| Mentor | | | OH | | | | 4/1/2008 | | | | (g)(l) | | | | 1,401 | | | | 441 | | | | (470 | ) | | | 1,038 | | | | 334 | | | | 1,372 | | | | (30 | ) | | | 40 | |
| Merced | | | CA | | | | 4/1/2008 | | | | (g)(l) | | | | 835 | | | | 2,129 | | | | (891 | ) | | | 571 | | | | 1,502 | | | | 2,073 | | | | (147 | ) | | | 40 | |
| Merrick | | | NY | | | | 4/1/2008 | | | | (e)(l) | | | | 113 | | | | 1,110 | | | | (376 | ) | | | 72 | | | | 775 | | | | 847 | | | | (93 | ) | | | 40 | |
| Mesa | | | AZ | | | | 4/1/2008 | | | | (b)(l) | | | | 1,060 | | | | 1,865 | | | | (790 | ) | | | 712 | | | | 1,423 | | | | 2,135 | | | | (148 | ) | | | 40 | |
| Mexico | | | MO | | | | 4/1/2008 | | | | (b)(l) | | | | 87 | | | | 238 | | | | — | | | | 87 | | | | 238 | | | | 325 | | | | (16 | ) | | | 40 | |
| Miami | | | FL | | | | 4/1/2008 | | | | (e)(l) | | | | 50 | | | | 1,000 | | | | (741 | ) | | | 12 | | | | 297 | | | | 309 | | | | (69 | ) | | | 40 | |
| Miami | | | FL | | | | 4/1/2008 | | | | (e)(l) | | | | 1,161 | | | | 975 | | | | (620 | ) | | | 813 | | | | 703 | | | | 1,516 | | | | (67 | ) | | | 40 | |
| Miami Lakes | | | FL | | | | 4/1/2008 | | | | (b)(l) | | | | 7,624 | | | | 13,408 | | | | (5,362 | ) | | | 5,592 | | | | 10,078 | | | | 15,670 | | | | (913 | ) | | | 40 | |
| Midland | | | NC | | | | 4/1/2008 | | | | (g)(l) | | | | 306 | | | | 348 | | | | (101 | ) | | | 257 | | | | 296 | | | | 553 | | | | (24 | ) | | | 40 | |
| Midlothian | | | VA | | | | 4/1/2008 | | | | (g)(l) | | | | 979 | | | | 867 | | | | (230 | ) | | | 853 | | | | 763 | | | | 1,616 | | | | (59 | ) | | | 40 | |
| Midlothian | | | VA | | | | 4/1/2008 | | | | — (l) | | | | 160 | | | | 439 | | | | — | | | | 160 | | | | 439 | | | | 599 | | | | (30 | ) | | | 40 | |
199
TABLE OF CONTENTS
| | | | | | | | | | | | | | | | | | | | | | |
| | State | | Acquisition
Date | | Encumbrances at
December 31,
2010 | | Initial Costs | | Net
Improvements
(Retirements)
Since
Acquisition | | Gross Amount at Which Carried
December 31, 2010(1) | | Accumulated
Depreciation
12/31/10(2) | | Average
Depreciable
Life |
| City | | Land | | Building and
Improvements | | Land | | Building and
Improvements | | Total |
| Milford | | | OH | | | | 4/1/2008 | | | | (g)(l) | | | | 279 | | | | 1,083 | | | | (164 | ) | | | 244 | | | | 954 | | | | 1,198 | | | | (73 | ) | | | 40 | |
| Millburn | | | NJ | | | | 4/1/2008 | | | | 798 (l) | | | | 1,294 | | | | 1,136 | | | | (496 | ) | | | 1,021 | | | | 913 | | | | 1,934 | | | | (78 | ) | | | 40 | |
| Mission | | | TX | | | | 4/1/2008 | | | | (b)(l) | | | | 419 | | | | 1,395 | | | | (537 | ) | | | 288 | | | | 989 | | | | 1,277 | | | | (95 | ) | | | 40 | |
| Mission Hills | | | CA | | | | 4/1/2008 | | | | (b)(l) | | | | 1,590 | | | | 1,216 | | | | (915 | ) | | | 1,056 | | | | 835 | | | | 1,891 | | | | (83 | ) | | | 40 | |
| Monroe | | | NC | | | | 4/1/2008 | | | | (c)(l) | | | | 1,076 | | | | 1,047 | | | | (562 | ) | | | 781 | | | | 780 | | | | 1,561 | | | | (71 | ) | | | 40 | |
| Monticello | | | IA | | | | 4/1/2008 | | | | — (l) | | | | 64 | | | | 337 | | | | 1 | | | | 64 | | | | 338 | | | | 402 | | | | (23 | ) | | | 40 | |
| Montrose | | | CA | | | | 4/1/2008 | | | | (e)(l) | | | | 1,329 | | | | 1,075 | | | | (630 | ) | | | 970 | | | | 804 | | | | 1,774 | | | | (72 | ) | | | 40 | |
| Mooresville | | | NC | | | | 4/1/2008 | | | | (c)(l) | | | | 701 | | | | 1,717 | | | | (455 | ) | | | 563 | | | | 1,400 | | | | 1,963 | | | | (113 | ) | | | 40 | |
| Moosic | | | PA | | | | 4/1/2008 | | | | (g)(l) | | | | 320 | | | | 244 | | | | — | | | | 320 | | | | 244 | | | | 564 | | | | (17 | ) | | | 40 | |
| Morehead City | | | NC | | | | 4/1/2008 | | | | (g)(l) | | | | 257 | | | | 458 | | | | — | | | | 257 | | | | 458 | | | | 715 | | | | (31 | ) | | | 40 | |
| Morganton | | | NC | | | | 4/1/2008 | | | | 1,607 (l) | | | | 922 | | | | 3,002 | | | | (2,004 | ) | | | 425 | | | | 1,495 | | | | 1,920 | | | | (207 | ) | | | 40 | |
| Morristown | | | NJ | | | | 4/1/2008 | | | | (d)(l) | | | | 1,401 | | | | 4,139 | | | | (2,845 | ) | | | 636 | | | | 2,059 | | | | 2,695 | | | | (329 | ) | | | 40 | |
| Moultrie | | | GA | | | | 4/1/2008 | | | | (b)(l) | | | | 133 | | | | 366 | | | | — | | | | 133 | | | | 366 | | | | 499 | | | | (25 | ) | | | 40 | |
| Mount Carmel | | | PA | | | | 4/1/2008 | | | | — (l) | | | | 40 | | | | 110 | | | | (101 | ) | | | 40 | | | | 9 | | | | 49 | | | | — | | | | 40 | |
| Mount Olive | | | NC | | | | 4/1/2008 | | | | (c)(l) | | | | 604 | | | | 546 | | | | (260 | ) | | | 463 | | | | 427 | | | | 890 | | | | (37 | ) | | | 40 | |
| Mount Olive | | | MS | | | | 4/1/2008 | | | | — (l) | | | | 56 | | | | 327 | | | | (286 | ) | | | 12 | | | | 85 | | | | 97 | | | | (23 | ) | | | 40 | |
| Mountain Home | | | AR | | | | 4/1/2008 | | | | (e)(l) | | | | 220 | | | | 489 | | | | (169 | ) | | | 165 | | | | 375 | | | | 540 | | | | (36 | ) | | | 40 | |
| Mt. Pleasant | | | TX | | | | 4/1/2008 | | | | (b)(l) | | | | 107 | | | | 293 | | | | (140 | ) | | | 67 | | | | 193 | | | | 260 | | | | (20 | ) | | | 40 | |
| Munford | | | TN | | | | 4/1/2008 | | | | — (l) | | | | 155 | | | | 596 | | | | — | | | | 155 | | | | 596 | | | | 751 | | | | (40 | ) | | | 40 | |
| Murfreesboro | | | TN | | | | 4/1/2008 | | | | (b)(l) | | | | 229 | | | | 1,334 | | | | (990 | ) | | | 72 | | | | 501 | | | | 573 | | | | (98 | ) | | | 40 | |
| Muskogee | | | OK | | | | 4/1/2008 | | | | (b)(l) | | | | 159 | | | | 1,878 | | | | (1,126 | ) | | | 65 | | | | 846 | | | | 911 | | | | (129 | ) | | | 40 | |
| N. Little Rock | | | AR | | | | 4/1/2008 | | | | (j)(l) | | | | 331 | | | | 469 | | | | (65 | ) | | | 303 | | | | 432 | | | | 735 | | | | (32 | ) | | | 40 | |
| Nacogdoches | | | TX | | | | 4/1/2008 | | | | — (l) | | | | 295 | | | | 900 | | | | (555 | ) | | | 144 | | | | 496 | | | | 640 | | | | (62 | ) | | | 40 | |
| Naples | | | FL | | | | 4/1/2008 | | | | — (l) | | | | 44 | | | | 21 | | | | — | | | | 44 | | | | 21 | | | | 65 | | | | (1 | ) | | | 40 | |
| Nashua | | | NH | | | | 4/1/2008 | | | | (e)(l) | | | | 467 | | | | 1,070 | | | | (813 | ) | | | 197 | | | | 527 | | | | 724 | | | | (78 | ) | | | 40 | |
| Nashville | | | TN | | | | 4/1/2008 | | | | (g)(l) | | | | 180 | | | | 406 | | | | (437 | ) | | | 39 | | | | 110 | | | | 149 | | | | (28 | ) | | | 40 | |
| Nashville | | | IL | | | | 4/1/2008 | | | | — (l) | | | | 23 | | | | 304 | | | | (75 | ) | | | 23 | | | | 229 | | | | 252 | | | | (10 | ) | | | 40 | |
| Nassau Bay | | | FL | | | | 4/1/2008 | | | | 2,039 (l) | | | | 2,258 | | | | 3,668 | | | | (4,483 | ) | | | 458 | | | | 985 | | | | 1,443 | | | | (268 | ) | | | 40 | |
| Nederland | | | TX | | | | 4/1/2008 | | | | (e)(l) | | | | 247 | | | | 293 | | | | (49 | ) | | | 185 | | | | 306 | | | | 491 | | | | (29 | ) | | | 40 | |
| New Bern | | | NC | | | | 4/1/2008 | | | | (g)(l) | | | | 357 | | | | 1,111 | | | | — | | | | 357 | | | | 1,111 | | | | 1,468 | | | | (76 | ) | | | 40 | |
| New Bern | | | NC | | | | 4/1/2008 | | | | (c)(l) | | | | 575 | | | | 295 | | | | (261 | ) | | | 398 | | | | 211 | | | | 609 | | | | (20 | ) | | | 40 | |
| New Port Richey | | | FL | | | | 4/1/2008 | | | | (e)(l) | | | | 384 | | | | 439 | | | | (480 | ) | | | 135 | | | | 208 | | | | 343 | | | | (60 | ) | | | 40 | |
| New Port Richey | | | FL | | | | 4/1/2008 | | | | 445 (l) | | | | 714 | | | | 260 | | | | (275 | ) | | | 509 | | | | 190 | | | | 699 | | | | (16 | ) | | | 40 | |
| New Port Richey | | | FL | | | | 4/1/2008 | | | | — (l) | | | | 376 | | | | 224 | | | | — | | | | 376 | | | | 224 | | | | 600 | | | | (15 | ) | | | 40 | |
200
TABLE OF CONTENTS
| | | | | | | | | | | | | | | | | | | | | | |
| | State | | Acquisition
Date | | Encumbrances at
December 31,
2010 | | Initial Costs | | Net
Improvements
(Retirements)
Since
Acquisition | | Gross Amount at Which Carried
December 31, 2010(1) | | Accumulated
Depreciation
12/31/10(2) | | Average
Depreciable
Life |
| City | | Land | | Building and
Improvements | | Land | | Building and
Improvements | | Total |
| New Port Richey | | | FL | | | | 4/1/2008 | | | | — (l) | | | | 227 | | | | 623 | | | | (359 | ) | | | 227 | | | | 264 | | | | 491 | | | | (20 | ) | | | 40 | |
| New Smyrna Bch | | | FL | | | | 4/1/2008 | | | | — (l) | | | | 755 | | | | 665 | | | | (857 | ) | | | 270 | | | | 293 | | | | 563 | | | | (49 | ) | | | 40 | |
| New Smyrna Beac | | | FL | | | | 4/1/2008 | | | | (i)(l) | | | | 759 | | | | 398 | | | | (177 | ) | | | 640 | | | | 340 | | | | 980 | | | | (27 | ) | | | 40 | |
| Newark | | | DE | | | | 4/1/2008 | | | | (e)(l) | | | | 1,355 | | | | 10,502 | | | | (5,644 | ) | | | 668 | | | | 5,545 | | | | 6,213 | | | | (721 | ) | | | 40 | |
| Newnan | | | NC | | | | 4/1/2008 | | | | (g)(l) | | | | 413 | | | | 5,471 | | | | (3,096 | ) | | | 181 | | | | 2,607 | | | | 2,788 | | | | (376 | ) | | | 40 | |
| Newport Beach | | | CA | | | | 4/1/2008 | | | | (b)(l) | | | | 1,398 | | | | 1,646 | | | | (996 | ) | | | 923 | | | | 1,125 | | | | 2,048 | | | | (113 | ) | | | 40 | |
| Newport News | | | VA | | | | 4/1/2008 | | | | — (l) | | | | 80 | | | | 220 | | | | (22 | ) | | | 80 | | | | 198 | | | | 278 | | | | (4 | ) | | | 40 | |
| Newton | | | NC | | | | 4/1/2008 | | | | (g)(l) | | | | 235 | | | | 1,455 | | | | (874 | ) | | | 106 | | | | 710 | | | | 816 | | | | (100 | ) | | | 40 | |
| Newton | | | AL | | | | 4/1/2008 | | | | — (l) | | | | 27 | | | | 73 | | | | — | | | | 27 | | | | 73 | | | | 100 | | | | (5 | ) | | | 40 | |
| Norcorss | | | GA | | | | 4/1/2008 | | | | — (l) | | | | 267 | | | | 732 | | | | (311 | ) | | | 187 | | | | 501 | | | | 688 | | | | (23 | ) | | | 40 | |
| Norcross | | | GA | | | | 4/1/2008 | | | | (g)(l) | | | | 1,037 | | | | 1,827 | | | | (1,459 | ) | | | 484 | | | | 921 | | | | 1,405 | | | | (126 | ) | | | 40 | |
| Norcross | | | GA | | | | 4/1/2008 | | | | (g)(l) | | | | 1,317 | | | | 2,083 | | | | (1,813 | ) | | | 584 | | | | 1,003 | | | | 1,587 | | | | (143 | ) | | | 40 | |
| Norcross | | | GA | | | | 4/1/2008 | | | | (g)(l) | | | | 620 | | | | 876 | | | | (588 | ) | | | 366 | | | | 542 | | | | 908 | | | | (60 | ) | | | 40 | |
| Norcross | | | GA | | | | 4/1/2008 | | | | — (l) | | | | 460 | | | | 1,227 | | | | (848 | ) | | | 217 | | | | 622 | | | | 839 | | | | (82 | ) | | | 40 | |
| Norfolk | | | VA | | | | 4/1/2008 | | | | (a)(l) | | | | 3,152 | | | | 15,857 | | | | 1,064 | | | | 3,152 | | | | 16,921 | | | | 20,073 | | | | (1,218 | ) | | | 40 | |
| Norfolk | | | VA | | | | 4/1/2008 | | | | (a)(l) | | | | 1,309 | | | | 8,040 | | | | — | | | | 1,309 | | | | 8,040 | | | | 9,349 | | | | (565 | ) | | | 40 | |
| Norfolk* | | | VA | | | | 4/1/2008 | | | | (a)(l) | | | | 473 | | | | — | | | | — | | | | 473 | | | | — | | | | 473 | | | | — | | | | 40 | |
| Norristown | | | PA | | | | 4/1/2008 | | | | — (l) | | | | 253 | | | | 1,050 | | | | 100 | | | | 253 | | | | 1,150 | | | | 1,403 | | | | (124 | ) | | | 40 | |
| North Brunswick | | | NJ | | | | 4/1/2008 | | | | — (l) | | | | 326 | | | | 1,805 | | | | (447 | ) | | | 205 | | | | 1,479 | | | | 1,684 | | | | (186 | ) | | | 40 | |
| North Brunswick | | | NJ | | | | 4/1/2008 | | | | — (l) | | | | 3,576 | | | | 20,135 | | | | (3,928 | ) | | | 2,927 | | | | 16,856 | | | | 19,783 | | | | (1,377 | ) | | | 40 | |
| North Hollywood | | | CA | | | | 4/1/2008 | | | | (b)(l) | | | | 1,554 | | | | 1,870 | | | | (1,135 | ) | | | 1,005 | | | | 1,284 | | | | 2,289 | | | | (131 | ) | | | 40 | |
| North Kansas City | | | MO | | | | 4/1/2008 | | | | (b)(l) | | | | 623 | | | | 1,966 | | | | (1,636 | ) | | | 193 | | | | 760 | | | | 953 | | | | (160 | ) | | | 40 | |
| North Kingstown | | | RI | | | | 4/1/2008 | | | | (e)(l) | | | | 255 | | | | 1,568 | | | | (1,340 | ) | | | 56 | | | | 427 | | | | 483 | | | | (106 | ) | | | 40 | |
| North Plainfiel | | | NJ | | | | 4/1/2008 | | | | (g)(l) | | | | 93 | | | | 256 | | | | (315 | ) | | | 11 | | | | 23 | | | | 34 | | | | (7 | ) | | | 40 | |
| North Port | | | FL | | | | 4/1/2008 | | | | (g)(l) | | | | 2,348 | | | | 1,387 | | | | (1,542 | ) | | | 1,353 | | | | 840 | | | | 2,193 | | | | (96 | ) | | | 40 | |
| North Wilkesboro | | | NC | | | | 4/1/2008 | | | | (g)(l) | | | | 1,806 | | | | 5,471 | | | | (6,904 | ) | | | — | | | | 373 | | | | 373 | | | | (373 | ) | | | 40 | |
| North Wilkesboro | | | NC | | | | 4/1/2008 | | | | — (l) | | | | 423 | | | | 326 | | | | (309 | ) | | | 243 | | | | 197 | | | | 440 | | | | (22 | ) | | | 40 | |
| Norton | | | VA | | | | 4/1/2008 | | | | — (l) | | | | 40 | | | | 110 | | | | (151 | ) | | | (1 | ) | | | — | | | | (1 | ) | | | — | | | | 40 | |
| Ocala | | | FL | | | | 4/1/2008 | | | | (b)(l) | | | | 205 | | | | 1,490 | | | | 703 | | | | 205 | | | | 2,193 | | | | 2,398 | | | | (105 | ) | | | 40 | |
| Ocala | | | FL | | | | 4/1/2008 | | | | (j)(l) | | | | 634 | | | | 452 | | | | — | | | | 634 | | | | 452 | | | | 1,086 | | | | (31 | ) | | | 40 | |
| Ocean City | | | NJ | | | | 4/1/2008 | | | | — (l) | | | | 776 | | | | 334 | | | | 45 | | | | 776 | | | | 379 | | | | 1,155 | | | | (30 | ) | | | 40 | |
| Ontario | | | CA | | | | 4/1/2008 | | | | (e)(l) | | | | 285 | | | | 1,413 | | | | (356 | ) | | | 216 | | | | 1,126 | | | | 1,342 | | | | (99 | ) | | | 40 | |
| Ontario | | | CA | | | | 4/1/2008 | | | | (b)(l) | | | | 3,002 | | | | 7,589 | | | | (2,771 | ) | | | 2,158 | | | | 5,662 | | | | 7,820 | | | | (510 | ) | | | 40 | |
| Orange | | | VA | | | | 4/1/2008 | | | | (e)(l) | | | | 216 | | | | 3,210 | | | | (783 | ) | | | 164 | | | | 2,479 | | | | 2,643 | | | | (199 | ) | | | 40 | |
201
TABLE OF CONTENTS
| | | | | | | | | | | | | | | | | | | | | | |
| | State | | Acquisition
Date | | Encumbrances at
December 31,
2010 | | Initial Costs | | Net
Improvements
(Retirements)
Since
Acquisition | | Gross Amount at Which Carried
December 31, 2010(1) | | Accumulated
Depreciation
12/31/10(2) | | Average
Depreciable
Life |
| City | | Land | | Building and
Improvements | | Land | | Building and
Improvements | | Total |
| Orange City | | | FL | | | | 4/1/2008 | | | | (h)(l) | | | | 1,102 | | | | 473 | | | | (385 | ) | | | 827 | | | | 363 | | | | 1,190 | | | | (32 | ) | | | 40 | |
| Orangevale | | | CA | | | | 4/1/2008 | | | | (e)(l) | | | | 532 | | | | 439 | | | | 13 | | | | 470 | | | | 514 | | | | 984 | | | | (33 | ) | | | 40 | |
| Orlando | | | FL | | | | 4/1/2008 | | | | (g)(l) | | | | 1,882 | | | | 706 | | | | (492 | ) | | | 1,517 | | | | 579 | | | | 2,096 | | | | (49 | ) | | | 40 | |
| Orlando | | | FL | | | | 4/1/2008 | | | | — (l) | | | | 243 | | | | 667 | | | | — | | | | 243 | | | | 667 | | | | 910 | | | | (46 | ) | | | 40 | |
| Ormond Beach | | | FL | | | | 4/1/2008 | | | | (g)(l) | | | | 521 | | | | 835 | | | | — | | | | 521 | | | | 835 | | | | 1,356 | | | | (61 | ) | | | 40 | |
| Oroville | | | CA | | | | 4/1/2008 | | | | (e)(l) | | | | 293 | | | | 415 | | | | (243 | ) | | | 188 | | | | 277 | | | | 465 | | | | (28 | ) | | | 40 | |
| Overland Park | | | KS | | | | 4/1/2008 | | | | (b)(l) | | | | 331 | | | | 1,667 | | | | (730 | ) | | | 191 | | | | 1,077 | | | | 1,268 | | | | (124 | ) | | | 40 | |
| Oviedo | | | FL | | | | 4/1/2008 | | | | (g)(l) | | | | 764 | | | | 435 | | | | (884 | ) | | | 310 | | | | 5 | | | | 315 | | | | (5 | ) | | | 40 | |
| Palatka | | | FL | | | | 4/1/2008 | | | | 2,666 (l) | | | | 1,233 | | | | 3,646 | | | | (4,299 | ) | | | 88 | | | | 492 | | | | 580 | | | | (249 | ) | | | 40 | |
| Palm Coast | | | FL | | | | 4/1/2008 | | | | (h)(l) | | | | 858 | | | | 765 | | | | (97 | ) | | | 805 | | | | 721 | | | | 1,526 | | | | (53 | ) | | | 40 | |
| Palmdale | | | CA | | | | 4/1/2008 | | | | (b)(l) | | | | 936 | | | | 732 | | | | (1,048 | ) | | | 317 | | | | 303 | | | | 620 | | | | (53 | ) | | | 40 | |
| Paris | | | TN | | | | 4/1/2008 | | | | — (l) | | | | 510 | | | | 1,060 | | | | (759 | ) | | | 252 | | | | 559 | | | | 811 | | | | (71 | ) | | | 40 | |
| Paris | | | TX | | | | 4/1/2008 | | | | 1,038 (l) | | | | 1,306 | | | | 815 | | | | (1,015 | ) | | | 664 | | | | 442 | | | | 1,106 | | | | (56 | ) | | | 40 | |
| Paso Robles | | | CA | | | | 4/1/2008 | | | | (g)(l) | | | | 1,533 | | | | 1,271 | | | | (676 | ) | | | 1,152 | | | | 976 | | | | 2,128 | | | | (87 | ) | | | 40 | |
| Paso Robles | | | CA | | | | 4/1/2008 | | | | (g)(l) | | | | 1,549 | | | | 4,042 | | | | (1,196 | ) | | | 1,200 | | | | 3,195 | | | | 4,395 | | | | (276 | ) | | | 40 | |
| Peachtree City | | | GA | | | | 4/1/2008 | | | | (e)(l) | | | | 740 | | | | 2,611 | | | | (1,196 | ) | | | 459 | | | | 1,696 | | | | 2,155 | | | | (180 | ) | | | 40 | |
| Pembroke Pines | | | FL | | | | 4/1/2008 | | | | 1,294 (l) | | | | 1,433 | | | | 1,132 | | | | (1,123 | ) | | | 786 | | | | 656 | | | | 1,442 | | | | (78 | ) | | | 40 | |
| Pembroke Pines | | | FL | | | | 4/1/2008 | | | | — (l) | | | | 3,330 | | | | 1,461 | | | | (532 | ) | | | 2,910 | | | | 1,349 | | | | 4,259 | | | | (111 | ) | | | 40 | |
| Pennington | | | NJ | | | | 4/1/2008 | | | | (g)(l) | | | | 810 | | | | 623 | | | | (237 | ) | | | 672 | | | | 524 | | | | 1,196 | | | | (43 | ) | | | 40 | |
| Pennsauken | | | NJ | | | | 4/1/2008 | | | | (e)(l) | | | | 4,037 | | | | 6,133 | | | | (1,876 | ) | | | 3,222 | | | | 5,072 | | | | 8,294 | | | | (398 | ) | | | 40 | |
| Pensacola | | | FL | | | | 4/1/2008 | | | | (g)(l) | | | | 13 | | | | 32 | | | | — | | | | 13 | | | | 32 | | | | 45 | | | | (2 | ) | | | 40 | |
| Pensacola | | | FL | | | | 4/1/2008 | | | | (b)(l) | | | | 159 | | | | 1,394 | | | | (1,199 | ) | | | 28 | | | | 326 | | | | 354 | | | | (95 | ) | | | 40 | |
| Pensacola | | | FL | | | | 4/1/2008 | | | | (k)(l) | | | | 467 | | | | 606 | | | | (185 | ) | | | 383 | | | | 505 | | | | 888 | | | | (41 | ) | | | 40 | |
| Pensacola | | | FL | | | | 4/1/2008 | | | | (d)(l) | | | | 702 | | | | 2,417 | | | | (804 | ) | | | 500 | | | | 1,815 | | | | 2,315 | | | | (171 | ) | | | 40 | |
| Peoria | | | IL | | | | 4/1/2008 | | | | (g)(l) | | | | 171 | | | | 4,645 | | | | (704 | ) | | | 135 | | | | 3,977 | | | | 4,112 | | | | (372 | ) | | | 40 | |
| Pepper Pike | | | OH | | | | 4/1/2008 | | | | (g)(l) | | | | 1,018 | | | | 796 | | | | (514 | ) | | | 720 | | | | 580 | | | | 1,300 | | | | (55 | ) | | | 40 | |
| Petersburg | | | VA | | | | 4/1/2008 | | | | — (l) | | | | 17 | | | | 114 | | | | 1 | | | | 17 | | | | 115 | | | | 132 | | | | (8 | ) | | | 40 | |
| Philadelphia | | | PA | | | | 4/1/2008 | | | | (e)(l) | | | | 373 | | | | 1,101 | | | | (340 | ) | | | 277 | | | | 857 | | | | 1,134 | | | | (77 | ) | | | 40 | |
| Philadelphia | | | PA | | | | 4/1/2008 | | | | (g)(l) | | | | 792 | | | | 648 | | | | (1,283 | ) | | | 64 | | | | 93 | | | | 157 | | | | (45 | ) | | | 40 | |
| Philadelphia | | | PA | | | | 4/1/2008 | | | | 39,258 (l) | | | | 9,325 | | | | 32,013 | | | | (4,567 | ) | | | 8,100 | | | | 28,671 | | | | 36,771 | | | | (2,267 | ) | | | 40 | |
| Philadelphia | | | PA | | | | 4/1/2008 | | | | (g)(l) | | | | 277 | | | | 818 | | | | (129 | ) | | | 232 | | | | 734 | | | | 966 | | | | (67 | ) | | | 40 | |
| Philadelphia | | | PA | | | | 4/1/2008 | | | | (d)(l) | | | | 13,305 | | | | 47,583 | | | | (10,812 | ) | | | 10,372 | | | | 39,704 | | | | 50,076 | | | | (3,231 | ) | | | 40 | |
| Phoenix | | | AZ | | | | 4/1/2008 | | | | (b)(l) | | | | 159 | | | | 212 | | | | (340 | ) | | | 6 | | | | 25 | | | | 31 | | | | (16 | ) | | | 40 | |
| Phoenix | | | AZ | | | | 4/1/2008 | | | | (b)(l) | | | | — | | | | 9,263 | | | | (2,504 | ) | | | — | | | | 6,759 | | | | 6,759 | | | | (638 | ) | | | 40 | |
202
TABLE OF CONTENTS
| | | | | | | | | | | | | | | | | | | | | | |
| | State | | Acquisition
Date | | Encumbrances at
December 31,
2010 | | Initial Costs | | Net
Improvements
(Retirements)
Since
Acquisition | | Gross Amount at Which Carried
December 31, 2010(1) | | Accumulated
Depreciation
12/31/10(2) | | Average
Depreciable
Life |
| City | | Land | | Building and
Improvements | | Land | | Building and
Improvements | | Total |
| Phoenix | | | AZ | | | | 4/1/2008 | | | | (b)(l) | | | | — | | | | 28,605 | | | | (7,755 | ) | | | — | | | | 20,850 | | | | 20,850 | | | | (1,972 | ) | | | 40 | |
| Phoenix | | | AZ | | | | 4/1/2008 | | | | (b)(l) | | | | — | | | | 9,809 | | | | (2,959 | ) | | | — | | | | 6,850 | | | | 6,850 | | | | (676 | ) | | | 40 | |
| Phoenix | | | AZ | | | | 4/1/2008 | | | | (b)(l) | | | | — | | | | 9,208 | | | | (2,510 | ) | | | — | | | | 6,698 | | | | 6,698 | | | | (635 | ) | | | 40 | |
| Phoenix | | | AZ | | | | 4/1/2008 | | | | (b)(l) | | | | — | | | | 23,504 | | | | (6,667 | ) | | | — | | | | 16,837 | | | | 16,837 | | | | (1,623 | ) | | | 40 | |
| Phoenixville | | | PA | | | | 4/1/2008 | | | | (g)(l) | | | | 200 | | | | 549 | | | | (67 | ) | | | 200 | | | | 482 | | | | 682 | | | | (33 | ) | | | 40 | |
| Pine Bluff | | | AR | | | | 4/1/2008 | | | | (g)(l) | | | | 22 | | | | 90 | | | | — | | | | 22 | | | | 90 | | | | 112 | | | | (6 | ) | | | 40 | |
| Pinehurst | | | NC | | | | 4/1/2008 | | | | (c)(l) | | | | 638 | | | | 797 | | | | (344 | ) | | | 479 | | | | 612 | | | | 1,091 | | | | (54 | ) | | | 40 | |
| Pinellas Park | | | FL | | | | 4/1/2008 | | | | (g)(l) | | | | 1,060 | | | | 325 | | | | — | | | | 1,060 | | | | 325 | | | | 1,385 | | | | (22 | ) | | | 40 | |
| Placerville | | | CA | | | | 4/1/2008 | | | | (h)(l) | | | | 246 | | | | 1,096 | | | | (240 | ) | | | 199 | | | | 903 | | | | 1,102 | | | | (75 | ) | | | 40 | |
| Plantation | | | FL | | | | 4/1/2008 | | | | (e)(l) | | | | 4,397 | | | | 4,994 | | | | (1,779 | ) | | | 3,527 | | | | 4,085 | | | | 7,612 | | | | (319 | ) | | | 40 | |
| Plantation | | | FL | | | | 4/1/2008 | | | | (e)(l) | | | | 319 | | | | 410 | | | | (307 | ) | | | 179 | | | | 243 | | | | 422 | | | | (28 | ) | | | 40 | |
| Plantation | | | FL | | | | 4/1/2008 | | | | (g)(l) | | | | 1,964 | | | | 880 | | | | (923 | ) | | | 1,313 | | | | 608 | | | | 1,921 | | | | (60 | ) | | | 40 | |
| Plantation | | | FL | | | | 4/1/2008 | | | | (k)(l) | | | | 884 | | | | 653 | | | | (135 | ) | | | 804 | | | | 598 | | | | 1,402 | | | | (46 | ) | | | 40 | |
| Pleasant Garden | | | NC | | | | 4/1/2008 | | | | (c)(l) | | | | 733 | | | | 568 | | | | (255 | ) | | | 585 | | | | 461 | | | | 1,046 | | | | (37 | ) | | | 40 | |
| Pleasanton | | | CA | | | | 4/1/2008 | | | | (e)(l) | | | | 1,905 | | | | 1,202 | | | | (1,720 | ) | | | 797 | | | | 590 | | | | 1,387 | | | | (83 | ) | | | 40 | |
| Plymouth | | | NC | | | | 4/1/2008 | | | | (g)(l) | | | | 104 | | | | 963 | | | | — | | | | 104 | | | | 963 | | | | 1,067 | | | | (66 | ) | | | 40 | |
| Point Pleasant | | | NJ | | | | 4/1/2008 | | | | (g)(l) | | | | 938 | | | | 581 | | | | (155 | ) | | | 839 | | | | 525 | | | | 1,364 | | | | (40 | ) | | | 40 | |
| Pomona | | | CA | | | | 4/1/2008 | | | | (b)(l) | | | | 1,893 | | | | 2,317 | | | | (1,538 | ) | | | 1,174 | | | | 1,498 | | | | 2,672 | | | | (159 | ) | | | 40 | |
| Port Charlotte | | | FL | | | | 4/1/2008 | | | | (e)(l) | | | | 109 | | | | 224 | | | | (206 | ) | | | 38 | | | | 89 | | | | 127 | | | | (15 | ) | | | 40 | |
| Port Charlotte | | | FL | | | | 4/1/2008 | | | | (b)(l) | | | | 511 | | | | 701 | | | | (402 | ) | | | 331 | | | | 479 | | | | 810 | | | | (51 | ) | | | 40 | |
| Port Charlotte | | | FL | | | | 4/1/2008 | | | | (h)(l) | | | | 703 | | | | 155 | | | | (224 | ) | | | 517 | | | | 117 | | | | 634 | | | | (11 | ) | | | 40 | |
| Port St. Lucie | | | FL | | | | 4/1/2008 | | | | (g)(l) | | | | 877 | | | | 4,583 | | | | (2,997 | ) | | | 361 | | | | 2,102 | | | | 2,463 | | | | (313 | ) | | | 40 | |
| Port Townsend | | | WA | | | | 4/1/2008 | | | | (e)(l) | | | | 49 | | | | 258 | | | | — | | | | 49 | | | | 258 | | | | 307 | | | | (18 | ) | | | 40 | |
| Porterville | | | CA | | | | 4/1/2008 | | | | (e)(l) | | | | 419 | | | | 810 | | | | (316 | ) | | | 306 | | | | 607 | | | | 913 | | | | (55 | ) | | | 40 | |
| Portland | | | OR | | | | 4/1/2008 | | | | (e)(l) | | | | 25 | | | | 35 | | | | (5 | ) | | | 14 | | | | 41 | | | | 55 | | | | (3 | ) | | | 40 | |
| Portsmouth | | | NH | | | | 4/1/2008 | | | | (e)(l) | | | | 3,921 | | | | 4,062 | | | | (1,450 | ) | | | 3,185 | | | | 3,348 | | | | 6,533 | | | | (259 | ) | | | 40 | |
| Pottstown | | | PA | | | | 4/1/2008 | | | | (g)(l) | | | | 466 | | | | 1,241 | | | | (413 | ) | | | 347 | | | | 947 | | | | 1,294 | | | | (82 | ) | | | 40 | |
| Providence | | | RI | | | | 4/1/2008 | | | | (e)(l) | | | | 2,655 | | | | 12,527 | | | | (3,386 | ) | | | 2,019 | | | | 9,777 | | | | 11,796 | | | | (878 | ) | | | 40 | |
| Providence | | | RI | | | | 4/1/2008 | | | | 43,500 (l) | | | | — | | | | 41,413 | | | | (5,780 | ) | | | — | | | | 35,633 | | | | 35,633 | | | | (2,868 | ) | | | 40 | |
| Quincy | | | WA | | | | 4/1/2008 | | | | (e)(l) | | | | 192 | | | | 444 | | | | (198 | ) | | | 129 | | | | 309 | | | | 438 | | | | (32 | ) | | | 40 | |
| Raleigh | | | NC | | | | 4/1/2008 | | | | (c)(l) | | | | 1,052 | | | | 674 | | | | (496 | ) | | | 742 | | | | 488 | | | | 1,230 | | | | (46 | ) | | | 40 | |
| Raleigh | | | NC | | | | 4/1/2008 | | | | (c)(l) | | | | 686 | | | | 518 | | | | (392 | ) | | | 456 | | | | 356 | | | | 812 | | | | (35 | ) | | | 40 | |
| Raleigh | | | NC | | | | 4/1/2008 | | | | (c)(l) | | | | 681 | | | | 473 | | | | (315 | ) | | | 490 | | | | 349 | | | | 839 | | | | (32 | ) | | | 40 | |
| Raleigh | | | NC | | | | 4/1/2008 | | | | (c)(l) | | | | 1,066 | | | | 1,520 | | | | (627 | ) | | | 797 | | | | 1,162 | | | | 1,959 | | | | (102 | ) | | | 40 | |
203
TABLE OF CONTENTS
| | | | | | | | | | | | | | | | | | | | | | |
| | State | | Acquisition
Date | | Encumbrances at
December 31,
2010 | | Initial Costs | | Net
Improvements
(Retirements)
Since
Acquisition | | Gross Amount at Which Carried
December 31, 2010(1) | | Accumulated
Depreciation
12/31/10(2) | | Average
Depreciable
Life |
| City | | Land | | Building and
Improvements | | Land | | Building and
Improvements | | Total |
| Raleigh | | | NC | | | | 4/1/2008 | | | | 1,199 (l) | | | | 1,161 | | | | 986 | | | | (151 | ) | | | 1,077 | | | | 919 | | | | 1,996 | | | | (68 | ) | | | 40 | |
| Raleigh | | | NC | | | | 4/1/2008 | | | | (k)(l) | | | | 598 | | | | 536 | | | | (72 | ) | | | 559 | | | | 503 | | | | 1,062 | | | | (37 | ) | | | 40 | |
| Raleigh | | | NC | | | | 4/1/2008 | | | | (d)(l) | | | | 9,431 | | | | 49,130 | | | | (9,153 | ) | | | 7,869 | | | | 41,539 | | | | 49,408 | | | | (3,317 | ) | | | 40 | |
| Red Bank | | | NJ | | | | 4/1/2008 | | | | (d)(l) | | | | 679 | | | | 2,005 | | | | (1,206 | ) | | | 344 | | | | 1,134 | | | | 1,478 | | | | (189 | ) | | | 40 | |
| Red Bluff | | | CA | | | | 4/1/2008 | | | | (b)(l) | | | | 509 | | | | 980 | | | | (80 | ) | | | 475 | | | | 934 | | | | 1,409 | | | | (71 | ) | | | 40 | |
| Redding | | | CA | | | | 4/1/2008 | | | | (e)(l) | | | | 480 | | | | 652 | | | | (278 | ) | | | 321 | | | | 533 | | | | 854 | | | | (53 | ) | | | 40 | |
| Redding | | | CA | | | | 4/1/2008 | | | | (b)(l) | | | | 800 | | | | 1,748 | | | | (1,947 | ) | | | 148 | | | | 453 | | | | 601 | | | | (122 | ) | | | 40 | |
| Redmond | | | OR | | | | 4/1/2008 | | | | (e)(l) | | | | 121 | | | | 244 | | | | (46 | ) | | | 105 | | | | 214 | | | | 319 | | | | (18 | ) | | | 40 | |
| Reedley | | | CA | | | | 4/1/2008 | | | | (e)(l) | | | | 1,945 | | | | 3,552 | | | | (1,480 | ) | | | 1,377 | | | | 2,640 | | | | 4,017 | | | | (267 | ) | | | 40 | |
| Reidsville | | | NC | | | | 4/1/2008 | | | | (c)(l) | | | | 1,020 | | | | 751 | | | | (341 | ) | | | 818 | | | | 612 | | | | 1,430 | | | | (49 | ) | | | 40 | |
| Reno | | | NV | | | | 4/1/2008 | | | | 1,372 (l) | | | | 848 | | | | 1,235 | | | | (1,781 | ) | | | 93 | | | | 209 | | | | 302 | | | | (83 | ) | | | 40 | |
| Reseda | | | CA | | | | 4/1/2008 | | | | (e)(l) | | | | 1,545 | | | | 2,461 | | | | (1,272 | ) | | | 1,034 | | | | 1,700 | | | | 2,734 | | | | (164 | ) | | | 40 | |
| Richland | | | MO | | | | 4/1/2008 | | | | (b)(l) | | | | 282 | | | | 709 | | | | (228 | ) | | | 214 | | | | 549 | | | | 763 | | | | (51 | ) | | | 40 | |
| Richland | | | WA | | | | 4/1/2008 | | | | (b)(l) | | | | 944 | | | | 1,939 | | | | (449 | ) | | | 779 | | | | 1,655 | | | | 2,434 | | | | (136 | ) | | | 40 | |
| Richland | | | PA | | | | 4/1/2008 | | | | — (l) | | | | 30 | | | | 170 | | | | — | | | | 30 | | | | 170 | | | | 200 | | | | (12 | ) | | | 40 | |
| Richlands | | | NC | | | | 4/1/2008 | | | | — (l) | | | | 317 | | | | 334 | | | | (108 | ) | | | 262 | | | | 281 | | | | 543 | | | | (23 | ) | | | 40 | |
| Richmond | | | VA | | | | 4/1/2008 | | | | (e)(l) | | | | 3,395 | | | | 9,560 | | | | (2,844 | ) | | | 2,614 | | | | 7,497 | | | | 10,111 | | | | (587 | ) | | | 40 | |
| Richmond | | | VA | | | | 4/1/2008 | | | | (a)(l) | | | | 2,877 | | | | 15,085 | | | | 2,454 | | | | 2,877 | | | | 17,539 | | | | 20,416 | | | | (1,319 | ) | | | 40 | |
| Richmond | | | VA | | | | 4/1/2008 | | | | (a)(l) | | | | 3,035 | | | | 26,011 | | | | — | | | | 3,035 | | | | 26,011 | | | | 29,046 | | | | (1,786 | ) | | | 40 | |
| Richmond | | | VA | | | | 4/1/2008 | | | | (g)(l) | | | | 533 | | | | 594 | | | | (161 | ) | | | 454 | | | | 512 | | | | 966 | | | | (41 | ) | | | 40 | |
| Richmond | | | VA | | | | 4/1/2008 | | | | (g)(l) | | | | 886 | | | | 311 | | | | (691 | ) | | | 365 | | | | 141 | | | | 506 | | | | (21 | ) | | | 40 | |
| Richmond | | | VA | | | | 4/1/2008 | | | | (j)(l) | | | | 784 | | | | 263 | | | | (148 | ) | | | 671 | | | | 228 | | | | 899 | | | | (18 | ) | | | 40 | |
| Richmond* | | | VA | | | | 4/1/2008 | | | | (a)(l) | | | | 430 | | | | — | | | | — | | | | 430 | | | | — | | | | 430 | | | | — | | | | 40 | |
| Ridgecrest | | | CA | | | | 4/1/2008 | | | | (e)(l) | | | | 2,356 | | | | 5,003 | | | | (1,394 | ) | | | 1,879 | | | | 4,086 | | | | 5,965 | | | | (324 | ) | | | 40 | |
| Ridgewood | | | NJ | | | | 4/1/2008 | | | | — (l) | | | | 347 | | | | 952 | | | | (623 | ) | | | 347 | | | | 329 | | | | 676 | | | | (23 | ) | | | 40 | |
| Riverdale | | | GA | | | | 4/1/2008 | | | | — (l) | | | | 176 | | | | 293 | | | | — | | | | 176 | | | | 293 | | | | 469 | | | | (20 | ) | | | 40 | |
| Riverside | | | CA | | | | 4/1/2008 | | | | (b)(l) | | | | 2,758 | | | | 6,449 | | | | (2,015 | ) | | | 2,115 | | | | 5,077 | | | | 7,192 | | | | (439 | ) | | | 40 | |
| Roanoke | | | VA | | | | 4/1/2008 | | | | (d)(l) | | | | 4,554 | | | | 64,916 | | | | (9,313 | ) | | | 3,873 | | | | 56,284 | | | | 60,157 | | | | (4,407 | ) | | | 40 | |
| Robinson | | | IL | | | | 4/1/2008 | | | | — (l) | | | | 204 | | | | 626 | | | | — | | | | 204 | | | | 626 | | | | 830 | | | | (41 | ) | | | 40 | |
| Rochester | | | NY | | | | 4/1/2008 | | | | — (l) | | | | 41 | | | | 853 | | | | 112 | | | | 41 | | | | 965 | | | | 1,006 | | | | (67 | ) | | | 40 | |
| Rock Creek | | | OH | | | | 4/1/2008 | | | | (g)(l) | | | | 24 | | | | 174 | | | | — | | | | 24 | | | | 174 | | | | 198 | | | | (12 | ) | | | 40 | |
| Rock Hill | | | SC | | | | 4/1/2008 | | | | (e)(l) | | | | 3,400 | | | | 8,136 | | | | (2,037 | ) | | | 2,763 | | | | 6,736 | | | | 9,499 | | | | (505 | ) | | | 40 | |
| Rock Hill | | | SC | | | | 4/1/2008 | | | | (g)(l) | | | | 854 | | | | 828 | | | | (524 | ) | | | 579 | | | | 579 | | | | 1,158 | | | | (57 | ) | | | 40 | |
| Rockingham | | | NC | | | | 4/1/2008 | | | | (g)(l) | | | | 66 | | | | 935 | | | | (91 | ) | | | 60 | | | | 850 | | | | 910 | | | | (64 | ) | | | 40 | |
204
TABLE OF CONTENTS
| | | | | | | | | | | | | | | | | | | | | | |
| | State | | Acquisition
Date | | Encumbrances at
December 31,
2010 | | Initial Costs | | Net
Improvements
(Retirements)
Since
Acquisition | | Gross Amount at Which Carried
December 31, 2010(1) | | Accumulated
Depreciation
12/31/10(2) | | Average
Depreciable
Life |
| City | | Land | | Building and
Improvements | | Land | | Building and
Improvements | | Total |
| Rockledge | | | FL | | | | 4/1/2008 | | | | 539 (l) | | | | 894 | | | | 501 | | | | (347 | ) | | | 666 | | | | 382 | | | | 1,048 | | | | (34 | ) | | | 40 | |
| Rocky Mount | | | NC | | | | 4/1/2008 | | | | (g)(l) | | | | 449 | | | | 2,646 | | | | (1,107 | ) | | | 279 | | | | 1,709 | | | | 1,988 | | | | (181 | ) | | | 40 | |
| Rolla | | | MO | | | | 4/1/2008 | | | | (b)(l) | | | | 25 | | | | 124 | | | | 26 | | | | 25 | | | | 150 | | | | 175 | | | | (11 | ) | | | 40 | |
| Rome | | | GA | | | | 4/1/2008 | | | | (g)(l) | | | | 264 | | | | 4,109 | | | | (113 | ) | | | 256 | | | | 4,004 | | | | 4,260 | | | | (281 | ) | | | 40 | |
| Roseville | | | CA | | | | 4/1/2008 | | | | (i)(l) | | | | 988 | | | | 1,497 | | | | (432 | ) | | | 809 | | | | 1,244 | | | | 2,053 | | | | (102 | ) | | | 40 | |
| Roswell | | | GA | | | | 4/1/2008 | | | | (g)(l) | | | | 629 | | | | 800 | | | | (33 | ) | | | 614 | | | | 782 | | | | 1,396 | | | | (55 | ) | | | 40 | |
| Roxboro | | | NC | | | | 4/1/2008 | | | | 1,107 (l) | | | | 751 | | | | 1,369 | | | | (376 | ) | | | 612 | | | | 1,132 | | | | 1,744 | | | | (93 | ) | | | 40 | |
| Runnemede | | | NJ | | | | 4/1/2008 | | | | (g)(l) | | | | 99 | | | | 41 | | | | (137 | ) | | | — | | | | 3 | | | | 3 | | | | (3 | ) | | | 40 | |
| Russellville | | | AR | | | | 4/1/2008 | | | | — (l) | | | | 316 | | | | 3,161 | | | | (1,105 | ) | | | 209 | | | | 2,163 | | | | 2,372 | | | | (205 | ) | | | 40 | |
| Sacramento | | | CA | | | | 4/1/2008 | | | | (b)(l) | | | | 803 | | | | 1,202 | | | | (642 | ) | | | 535 | | | | 828 | | | | 1,363 | | | | (83 | ) | | | 40 | |
| Sacramento | | | CA | | | | 4/1/2008 | | | | (b)(l) | | | | 444 | | | | 878 | | | | (438 | ) | | | 290 | | | | 594 | | | | 884 | | | | (61 | ) | | | 40 | |
| Salinas | | | CA | | | | 4/1/2008 | | | | (b)(l) | | | | 592 | | | | 2,275 | | | | (808 | ) | | | 398 | | | | 1,661 | | | | 2,059 | | | | (170 | ) | | | 40 | |
| Salisbury | | | NC | | | | 4/1/2008 | | | | (c)(l) | | | | 603 | | | | 1,395 | | | | (486 | ) | | | 449 | | | | 1,063 | | | | 1,512 | | | | (94 | ) | | | 40 | |
| Salisbury | | | NC | | | | 4/1/2008 | | | | (c)(l) | | | | 369 | | | | 259 | | | | (195 | ) | | | 251 | | | | 182 | | | | 433 | | | | (18 | ) | | | 40 | |
| San Antonio | | | TX | | | | 4/1/2008 | | | | (e)(l) | | | | 228 | | | | 378 | | | | 126 | | | | 228 | | | | 504 | | | | 732 | | | | (42 | ) | | | 40 | |
| San Antonio | | | TX | | | | 4/1/2008 | | | | (e)(l) | | | | 255 | | | | 253 | | | | (239 | ) | | | 125 | | | | 144 | | | | 269 | | | | (22 | ) | | | 40 | |
| San Antonio | | | TX | | | | 4/1/2008 | | | | (b)(l) | | | | 323 | | | | 2,430 | | | | (827 | ) | | | 209 | | | | 1,717 | | | | 1,926 | | | | (186 | ) | | | 40 | |
| San Antonio | | | TX | | | | 4/1/2008 | | | | (f)(l) | | | | 898 | | | | 306 | | | | (244 | ) | | | 713 | | | | 247 | | | | 960 | | | | (21 | ) | | | 40 | |
| San Bernadino | | | CA | | | | 4/1/2008 | | | | (b)(l) | | | | 255 | | | | 5,374 | | | | (1,749 | ) | | | 169 | | | | 3,711 | | | | 3,880 | | | | (369 | ) | | | 40 | |
| San Francisco | | | CA | | | | 4/1/2008 | | | | (e)(l) | | | | 1,317 | | | | 2,503 | | | | (854 | ) | | | 998 | | | | 1,968 | | | | 2,966 | | | | (167 | ) | | | 40 | |
| San Jose | | | CA | | | | 4/1/2008 | | | | (e)(l) | | | | 157 | | | | 1,871 | | | | (899 | ) | | | 83 | | | | 1,046 | | | | 1,129 | | | | (126 | ) | | | 40 | |
| San Leandro | | | CA | | | | 4/1/2008 | | | | (e)(l) | | | | 1,571 | | | | 1,219 | | | | (1,261 | ) | | | 823 | | | | 706 | | | | 1,529 | | | | (141 | ) | | | 40 | |
| San Rafael | | | CA | | | | 4/1/2008 | | | | (g)(l) | | | | 1,124 | | | | 563 | | | | 137 | | | | 1,124 | | | | 700 | | | | 1,824 | | | | (49 | ) | | | 40 | |
| Santa Barbara | | | CA | | | | 4/1/2008 | | | | (b)(l) | | | | 682 | | | | 2,541 | | | | (966 | ) | | | 466 | | | | 1,791 | | | | 2,257 | | | | (175 | ) | | | 40 | |
| Santa Fe | | | NM | | | | 4/1/2008 | | | | (e)(l) | | | | 240 | | | | 362 | | | | 115 | | | | 240 | | | | 477 | | | | 717 | | | | (31 | ) | | | 40 | |
| Santa Maria | | | CA | | | | 4/1/2008 | | | | (b)(l) | | | | 1,290 | | | | 1,574 | | | | (944 | ) | | | 837 | | | | 1,083 | | | | 1,920 | | | | (111 | ) | | | 40 | |
| Santa Maria | | | CA | | | | 4/1/2008 | | | | (g)(l) | | | | 1,087 | | | | 883 | | | | (474 | ) | | | 817 | | | | 679 | | | | 1,496 | | | | (61 | ) | | | 40 | |
| Sarasota | | | FL | | | | 4/1/2008 | | | | — (l) | | | | 735 | | | | 1,004 | | | | (708 | ) | | | 424 | | | | 607 | | | | 1,031 | | | | (67 | ) | | | 40 | |
| Sarasota | | | FL | | | | 4/1/2008 | | | | (h)(l) | | | | 1,166 | | | | 557 | | | | (431 | ) | | | 868 | | | | 424 | | | | 1,292 | | | | (39 | ) | | | 40 | |
| Savannah | | | GA | | | | 4/1/2008 | | | | (b)(l) | | | | 120 | | | | 2,853 | | | | (560 | ) | | | 95 | | | | 2,318 | | | | 2,413 | | | | (208 | ) | | | 40 | |
| Savannah | | | GA | | | | 4/1/2008 | | | | 610 (l) | | | | 949 | | | | 528 | | | | (371 | ) | | | 705 | | | | 401 | | | | 1,106 | | | | (36 | ) | | | 40 | |
| Savannah | | | GA | | | | 4/1/2008 | | | | (g)(l) | | | | 529 | | | | 432 | | | | (404 | ) | | | 299 | | | | 258 | | | | 557 | | | | (30 | ) | | | 40 | |
| Scotch Plains | | | NJ | | | | 4/1/2008 | | | | 551 (l) | | | | 1,174 | | | | 653 | | | | (354 | ) | | | 941 | | | | 532 | | | | 1,473 | | | | (44 | )�� | | | 40 | |
| Sea Bright | | | NJ | | | | 4/1/2008 | | | | (g)(l) | | | | 1,506 | | | | 1,078 | | | | (531 | ) | | | 1,188 | | | | 865 | | | | 2,053 | | | | (72 | ) | | | 40 | |
205
TABLE OF CONTENTS
| | | | | | | | | | | | | | | | | | | | | | |
| | State | | Acquisition
Date | | Encumbrances at
December 31,
2010 | | Initial Costs | | Net
Improvements
(Retirements)
Since
Acquisition | | Gross Amount at Which Carried
December 31, 2010(1) | | Accumulated
Depreciation
12/31/10(2) | | Average
Depreciable
Life |
| City | | Land | | Building and
Improvements | | Land | | Building and
Improvements | | Total |
| Seattle | | | WA | | | | 4/1/2008 | | | | (e)(l) | | | | 112 | | | | 274 | | | | — | | | | 112 | | | | 274 | | | | 386 | | | | (19 | ) | | | 40 | |
| Seattle | | | WA | | | | 4/1/2008 | | | | (e)(l) | | | | 431 | | | | 119 | | | | — | | | | 431 | | | | 119 | | | | 550 | | | | (8 | ) | | | 40 | |
| Seattle | | | WA | | | | 4/1/2008 | | | | (b)(l) | | | | 123 | | | | 2,896 | | | | (686 | ) | | | 90 | | | | 2,243 | | | | 2,333 | | | | (205 | ) | | | 40 | |
| Selma | | | AL | | | | 4/1/2008 | | | | — (l) | | | | 245 | | | | 2,463 | | | | (813 | ) | | | 166 | | | | 1,729 | | | | 1,895 | | | | (164 | ) | | | 40 | |
| Sequim | | | WA | | | | 4/1/2008 | | | | (e)(l) | | | | 235 | | | | 241 | | | | (4 | ) | | | 233 | | | | 239 | | | | 472 | | | | (17 | ) | | | 40 | |
| Sesser | | | IL | | | | 4/1/2008 | | | | — (l) | | | | 56 | | | | 214 | | | | — | | | | 56 | | | | 214 | | | | 270 | | | | (14 | ) | | | 40 | |
| Seymour | | | IN | | | | 4/1/2008 | | | | (g)(l) | | | | 418 | | | | 507 | | | | (144 | ) | | | 350 | | | | 431 | | | | 781 | | | | (35 | ) | | | 40 | |
| Seymour | | | IN | | | | 4/1/2008 | | | | (g)(l) | | | | 333 | | | | 932 | | | | (182 | ) | | | 282 | | | | 801 | | | | 1,083 | | | | (64 | ) | | | 40 | |
| Shaker Heights | | | OH | | | | 4/1/2008 | | | | (g)(l) | | | | 1,492 | | | | 1,538 | | | | (1,509 | ) | | | 722 | | | | 799 | | | | 1,521 | | | | (106 | ) | | | 40 | |
| Shelbyville | | | TN | | | | 4/1/2008 | | | | — (l) | | | | 59 | | | | 686 | | | | 65 | | | | 59 | | | | 751 | | | | 810 | | | | (55 | ) | | | 40 | |
| Sherman Oaks | | | CA | | | | 4/1/2008 | | | | (e)(l) | | | | 1,256 | | | | 822 | | | | (576 | ) | | | 898 | | | | 604 | | | | 1,502 | | | | (56 | ) | | | 40 | |
| Silver Springs | | | MD | | | | 4/1/2008 | | | | (a)(l) | | | | 293 | | | | 930 | | | | — | | | | 293 | | | | 930 | | | | 1,223 | | | | (64 | ) | | | 40 | |
| Simpsonville | | | SC | | | | 4/1/2008 | | | | (k)(l) | | | | 2,686 | | | | 1,076 | | | | (872 | ) | | | 2,051 | | | | 839 | | | | 2,890 | | | | (70 | ) | | | 40 | |
| Smithfield | | | NC | | | | 4/1/2008 | | | | (d)(l) | | | | 130 | | | | 881 | | | | (366 | ) | | | 77 | | | | 568 | | | | 645 | | | | (60 | ) | | | 40 | |
| Smyra | | | GA | | | | 4/1/2008 | | | | — (l) | | | | 882 | | | | 602 | | | | (177 | ) | | | 750 | | | | 557 | | | | 1,307 | | | | (41 | ) | | | 40 | |
| Sneads | | | FL | | | | 4/1/2008 | | | | — (l) | | | | 47 | | | | 128 | | | | — | | | | 47 | | | | 128 | | | | 175 | | | | (9 | ) | | | 40 | |
| Snellville | | | GA | | | | 4/1/2008 | | | | — (l) | | | | 871 | | | | 994 | | | | (382 | ) | | | 686 | | | | 797 | | | | 1,483 | | | | (68 | ) | | | 40 | |
| Snellville | | | GA | | | | 4/1/2008 | | | | — (l) | | | | 120 | | | | 330 | | | | (13 | ) | | | 120 | | | | 317 | | | | 437 | | | | (10 | ) | | | 40 | |
| Somerdale | | | NJ | | | | 4/1/2008 | | | | (g)(l) | | | | 655 | | | | 438 | | | | (383 | ) | | | 419 | | | | 291 | | | | 710 | | | | (30 | ) | | | 40 | |
| Sonora | | | CA | | | | 4/1/2008 | | | | (j)(l) | | | | 477 | | | | 1,410 | | | | (392 | ) | | | 373 | | | | 1,122 | | | | 1,495 | | | | (98 | ) | | | 40 | |
| South Orange | | | NJ | | | | 4/1/2008 | | | | (e)(l) | | | | 560 | | | | 1,678 | | | | (997 | ) | | | 327 | | | | 914 | | | | 1,241 | | | | — | | | | 40 | |
| South Plainfiel | | | NJ | | | | 4/1/2008 | | | | 491 (l) | | | | 1,214 | | | | 451 | | | | (371 | ) | | | 938 | | | | 356 | | | | 1,294 | | | | (31 | ) | | | 40 | |
| South Portland | | | ME | | | | 4/1/2008 | | | | (e)(l) | | | | 3,283 | | | | 6,732 | | | | (1,962 | ) | | | 2,610 | | | | 5,443 | | | | 8,053 | | | | (445 | ) | | | 40 | |
| Southampton | | | PA | | | | 4/1/2008 | | | | (g)(l) | | | | 910 | | | | 949 | | | | — | | | | 910 | | | | 949 | | | | 1,859 | | | | (65 | ) | | | 40 | |
| Southern Piens | | | NC | | | | 4/1/2008 | | | | (c)(l) | | | | 691 | | | | 501 | | | | (355 | ) | | | 479 | | | | 358 | | | | 837 | | | | (34 | ) | | | 40 | |
| Sparta | | | IL | | | | 4/1/2008 | | | | — (l) | | | | 107 | | | | 1,035 | | | | (805 | ) | | | 107 | | | | 230 | | | | 337 | | | | (18 | ) | | | 40 | |
| Spokane | | | WA | | | | 4/1/2008 | | | | (b)(l) | | | | 1,900 | | | | 9,799 | | | | (3,647 | ) | | | 1,272 | | | | 6,780 | | | | 8,052 | | | | (672 | ) | | | 40 | |
| Spring Lake | | | NC | | | | 4/1/2008 | | | | (c)(l) | | | | 644 | | | | 866 | | | | (484 | ) | | | 429 | | | | 597 | | | | 1,026 | | | | (59 | ) | | | 40 | |
| Spring Lake | | | NJ | | | | 4/1/2008 | | | | (g)(l) | | | | 864 | | | | 191 | | | | (189 | ) | | | 707 | | | | 159 | | | | 866 | | | | (13 | ) | | | 40 | |
| Springfield | | | MO | | | | 4/1/2008 | | | | (b)(l) | | | | 918 | | | | 1,386 | | | | (637 | ) | | | 653 | | | | 1,014 | | | | 1,667 | | | | (97 | ) | | | 40 | |
| Springfield | | | MO | | | | 4/1/2008 | | | | (b)(l) | | | | 600 | | | | 1,110 | | | | (556 | ) | | | 372 | | | | 782 | | | | 1,154 | | | | (80 | ) | | | 40 | |
| Springfield Twp | | | OH | | | | 4/1/2008 | | | | (g)(l) | | | | 328 | | | | 247 | | | | (83 | ) | | | 271 | | | | 221 | | | | 492 | | | | (17 | ) | | | 40 | |
| Spruce Pine | | | NC | | | | 4/1/2008 | | | | (c)(l) | | | | 112 | | | | 330 | | | | (192 | ) | | | 59 | | | | 191 | | | | 250 | | | | (33 | ) | | | 40 | |
| St. Augustine | | | FL | | | | 4/1/2008 | | | | (g)(l) | | | | 601 | | | | 560 | | | | (165 | ) | | | 513 | | | | 483 | | | | 996 | | | | (38 | ) | | | 40 | |
206
TABLE OF CONTENTS
| | | | | | | | | | | | | | | | | | | | | | |
| | State | | Acquisition
Date | | Encumbrances at
December 31,
2010 | | Initial Costs | | Net
Improvements
(Retirements)
Since
Acquisition | | Gross Amount at Which Carried
December 31, 2010(1) | | Accumulated
Depreciation
12/31/10(2) | | Average
Depreciable
Life |
| City | | Land | | Building and
Improvements | | Land | | Building and
Improvements | | Total |
| St. Helena | | | CA | | | | 4/1/2008 | | | | (e)(l) | | | | 1,317 | | | | 956 | | | | (752 | ) | | | 832 | | | | 689 | | | | 1,521 | | | | (76 | ) | | | 40 | |
| St. Louis | | | MO | | | | 4/1/2008 | | | | (b)(l) | | | | 612 | | | | 4,503 | | | | (1,581 | ) | | | 408 | | | | 3,126 | | | | 3,534 | | | | (324 | ) | | | 40 | |
| St. Louis | | | MO | | | | 4/1/2008 | | | | (b)(l) | | | | 1,147 | | | | 2,137 | | | | (1,251 | ) | | | 690 | | | | 1,343 | | | | 2,033 | | | | (146 | ) | | | 40 | |
| St. Petersburg | | | FL | | | | 4/1/2008 | | | | (g)(l) | | | | 925 | | | | 286 | | | | (418 | ) | | | 600 | | | | 193 | | | | 793 | | | | (20 | ) | | | 40 | |
| St. Petersburg | | | FL | | | | 4/1/2008 | | | | — (l) | | | | — | | | | — | | | | — | | | | — | | | | — | | | | — | | | | — | | | | 40 | |
| Statesville | | | NC | | | | 4/1/2008 | | | | (c)(l) | | | | 627 | | | | 452 | | | | (318 | ) | | | 437 | | | | 324 | | | | 761 | | | | (31 | ) | | | 40 | |
| Statesville | | | NC | | | | 4/1/2008 | | | | (c)(l) | | | | 353 | | | | 1,042 | | | | (363 | ) | | | 256 | | | | 776 | | | | 1,032 | | | | (72 | ) | | | 40 | |
| Stephenville | | | TX | | | | 4/1/2008 | | | | 1,343 (l) | | | | 1,199 | | | | 1,638 | | | | (1,741 | ) | | | 433 | | | | 663 | | | | 1,096 | | | | (112 | ) | | | 40 | |
| Stockbridge | | | GA | | | | 4/1/2008 | | | | (g)(l) | | | | 509 | | | | 370 | | | | (121 | ) | | | 437 | | | | 321 | | | | 758 | | | | (25 | ) | | | 40 | |
| Stockton | | | CA | | | | 4/1/2008 | | | | (e)(l) | | | | 169 | | | | 285 | | | | 47 | | | | 169 | | | | 332 | | | | 501 | | | | (27 | ) | | | 40 | |
| Stockton | | | CA | | | | 4/1/2008 | | | | (e)(l) | | | | 315 | | | | 600 | | | | (523 | ) | | | 122 | | | | 270 | | | | 392 | | | | (44 | ) | | | 40 | |
| Stockton | | | CA | | | | 4/1/2008 | | | | (b)(l) | | | | 198 | | | | 1,698 | | | | (252 | ) | | | 170 | | | | 1,474 | | | | 1,644 | | | | (117 | ) | | | 40 | |
| Strongville | | | OH | | | | 4/1/2008 | | | | (g)(l) | | | | 563 | | | | 1,261 | | | | (545 | ) | | | 386 | | | | 893 | | | | 1,279 | | | | (87 | ) | | | 40 | |
| Stuart | | | FL | | | | 4/1/2008 | | | | (b)(l) | | | | 539 | | | | 3,071 | | | | (617 | ) | | | 439 | | | | 2,554 | | | | 2,993 | | | | (215 | ) | | | 40 | |
| Succasunna | | | NJ | | | | 4/1/2008 | | | | — (l) | | | | 147 | | | | 123 | | | | 41 | | | | 147 | | | | 164 | | | | 311 | | | | (24 | ) | | | 40 | |
| Summit | | | NJ | | | | 4/1/2008 | | | | (e)(l) | | | | 445 | | | | 1,314 | | | | (467 | ) | | | 320 | | | | 972 | | | | 1,292 | | | | (91 | ) | | | 40 | |
| Summit | | | NJ | | | | 4/1/2008 | | | | (e)(l) | | | | 515 | | | | 1,520 | | | | (506 | ) | | | 364 | | | | 1,165 | | | | 1,529 | | | | (111 | ) | | | 40 | |
| Sumter | | | SC | | | | 4/1/2008 | | | | — (l) | | | | 33 | | | | 191 | | | | 26 | | | | 33 | | | | 217 | | | | 250 | | | | (32 | ) | | | 40 | |
| Sun City | | | AZ | | | | 4/1/2008 | | | | (e)(l) | | | | 903 | | | | 1,393 | | | | (580 | ) | | | 665 | | | | 1,051 | | | | 1,716 | | | | (95 | ) | | | 40 | |
| Sunnyvale | | | CA | | | | 4/1/2008 | | | | (b)(l) | | | | 3,459 | | | | 1,295 | | | | (1,311 | ) | | | 2,439 | | | | 1,004 | | | | 3,443 | | | | (107 | ) | | | 40 | |
| Susanville | | | CA | | | | 4/1/2008 | | | | (e)(l) | | | | 856 | | | | 2,312 | | | | (667 | ) | | | 667 | | | | 1,834 | | | | 2,501 | | | | (152 | ) | | | 40 | |
| Sutter Creek | | | CA | | | | 4/1/2008 | | | | (k)(l) | | | | 252 | | | | 640 | | | | (169 | ) | | | 202 | | | | 521 | | | | 723 | | | | (44 | ) | | | 40 | |
| Swansboro | | | NC | | | | 4/1/2008 | | | | (c)(l) | | | | 356 | | | | 335 | | | | (166 | ) | | | 268 | | | | 257 | | | | 525 | | | | (22 | ) | | | 40 | |
| Sylvania | | | GA | | | | 4/1/2008 | | | | (g)(l) | | | | 8 | | | | 613 | | | | — | | | | 8 | | | | 613 | | | | 621 | | | | (42 | ) | | | 40 | |
| Tamaqua | | | PA | | | | 4/1/2008 | | | | (g)(l) | | | | 52 | | | | 303 | | | | — | | | | 52 | | | | 303 | | | | 355 | | | | (21 | ) | | | 40 | |
| Tampa | | | FL | | | | 4/1/2008 | | | | (b)(l) | | | | 4,008 | | | | 10,469 | | | | (2,196 | ) | | | 3,366 | | | | 8,915 | | | | 12,281 | | | | (771 | ) | | | 40 | |
| Tampa | | | FL | | | | 4/1/2008 | | | | (b)(l) | | | | 1,134 | | | | 2,211 | | | | (558 | ) | | | 936 | | | | 1,851 | | | | 2,787 | | | | (150 | ) | | | 40 | |
| Tampa | | | FL | | | | 4/1/2008 | | | | (g)(l) | | | | 2,851 | | | | 5,076 | | | | (1,767 | ) | | | 2,186 | | | | 3,974 | | | | 6,160 | | | | (346 | ) | | | 40 | |
| Tampa | | | FL | | | | 4/1/2008 | | | | (i)(l) | | | | 595 | | | | 823 | | | | (59 | ) | | | 569 | | | | 790 | | | | 1,359 | | | | (57 | ) | | | 40 | |
| Tarboro | | | NC | | | | 4/1/2008 | | | | — (l) | | | | 185 | | | | 115 | | | | (20 | ) | | | 172 | | | | 108 | | | | 280 | | | | (8 | ) | | | 40 | |
| Tarboro | | | NC | | | | 4/1/2008 | | | | — (l) | | | | 259 | | | | 913 | | | | (741 | ) | | | 86 | | | | 345 | | | | 431 | | | | (63 | ) | | | 40 | |
| Thomasville | | | NC | | | | 4/1/2008 | | | | — (l) | | | | 83 | | | | 392 | | | | (173 | ) | | | 51 | | | | 251 | | | | 302 | | | | (27 | ) | | | 40 | |
| Toccoa | | | GA | | | | 4/1/2008 | | | | — (l) | | | | 70 | | | | 686 | | | | (434 | ) | | | 70 | | | | 252 | | | | 322 | | | | (15 | ) | | | 40 | |
| Toms River | | | NJ | | | | 4/1/2008 | | | | (d)(l) | | | | 1,572 | | | | 2,956 | | | | (1,093 | ) | | | 1,166 | | | | 2,269 | | | | 3,435 | | | | (208 | ) | | | 40 | |
207
TABLE OF CONTENTS
| | | | | | | | | | | | | | | | | | | | | | |
| | State | | Acquisition
Date | | Encumbrances at
December 31,
2010 | | Initial Costs | | Net
Improvements
(Retirements)
Since
Acquisition | | Gross Amount at Which Carried
December 31, 2010(1) | | Accumulated
Depreciation
12/31/10(2) | | Average
Depreciable
Life |
| City | | Land | | Building and
Improvements | | Land | | Building and
Improvements | | Total |
| Torrance | | | CA | | | | 4/1/2008 | | | | (b)(l) | | | | 896 | | | | 1,131 | | | | (892 | ) | | | 486 | | | | 649 | | | | 1,135 | | | | (78 | ) | | | 40 | |
| Trenton | | | NJ | | | | 4/1/2008 | | | | (d)(l) | | | | 234 | | | | 1,663 | | | | (322 | ) | | | 185 | | | | 1,390 | | | | 1,575 | | | | (119 | ) | | | 40 | |
| Troutman | | | NC | | | | 4/1/2008 | | | | (c)(l) | | | | 602 | | | | 207 | | | | (262 | ) | | | 403 | | | | 144 | | | | 547 | | | | (14 | ) | | | 40 | |
| Tryon | | | NC | | | | 4/1/2008 | | | | (c)(l) | | | | 1,017 | | | | 4,763 | | | | (748 | ) | | | 878 | | | | 4,154 | | | | 5,032 | | | | (302 | ) | | | 40 | |
| Tucker | | | GA | | | | 4/1/2008 | | | | (a)(l) | | | | 503 | | | | 6,472 | | | | — | | | | 503 | | | | 6,472 | | | | 6,975 | | | | (445 | ) | | | 40 | |
| Tucker | | | GA | | | | 4/1/2008 | | | | (j)(l) | | | | 834 | | | | 682 | | | | (200 | ) | | | 721 | | | | 595 | | | | 1,316 | | | | (47 | ) | | | 40 | |
| Tulsa | | | OK | | | | 4/1/2008 | | | | (e)(l) | | | | 166 | | | | 228 | | | | (95 | ) | | | 123 | | | | 176 | | | | 299 | | | | (18 | ) | | | 40 | |
| Tulsa | | | OK | | | | 4/1/2008 | | | | (b)(l) | | | | 531 | | | | 1,237 | | | | (1,475 | ) | | | 66 | | | | 227 | | | | 293 | | | | (85 | ) | | | 40 | |
| Turlock | | | CA | | | | 4/1/2008 | | | | (e)(l) | | | | 677 | | | | 1,087 | | | | (363 | ) | | | 532 | | | | 869 | | | | 1,401 | | | | (74 | ) | | | 40 | |
| Union City | | | NJ | | | | 4/1/2008 | | | | (e)(l) | | | | 397 | | | | 1,834 | | | | (1,649 | ) | | | 87 | | | | 495 | | | | 582 | | | | (122 | ) | | | 40 | |
| Vacaville | | | CA | | | | 4/1/2008 | | | | (e)(l) | | | | 239 | | | | 538 | | | | (225 | ) | | | 166 | | | | 386 | | | | 552 | | | | (37 | ) | | | 40 | |
| Valdese | | | NC | | | | 4/1/2008 | | | | 931 (l) | | | | 542 | | | | 1,870 | | | | (381 | ) | | | 452 | | | | 1,579 | | | | 2,031 | | | | (125 | ) | | | 40 | |
| Valdosta | | | GA | | | | 4/1/2008 | | | | (b)(l) | | | | 415 | | | | 1,287 | | | | (244 | ) | | | 352 | | | | 1,106 | | | | 1,458 | | | | (85 | ) | | | 40 | |
| Valley Springs | | | CA | | | | 4/1/2008 | | | | (i)(l) | | | | 159 | | | | 1,191 | | | | (253 | ) | | | 127 | | | | 970 | | | | 1,097 | | | | (81 | ) | | | 40 | |
| Ventura | | | CA | | | | 4/1/2008 | | | | (b)(l) | | | | 1,308 | | | | 917 | | | | (779 | ) | | | 837 | | | | 609 | | | | 1,446 | | | | (63 | ) | | | 40 | |
| Vernon | | | CA | | | | 4/1/2008 | | | | (e)(l) | | | | 1,457 | | | | 1,307 | | | | (762 | ) | | | 1,042 | | | | 960 | | | | 2,002 | | | | (88 | ) | | | 40 | |
| Vero Beach | | | FL | | | | 4/1/2008 | | | | (k)(l) | | | | 799 | | | | 476 | | | | (218 | ) | | | 659 | | | | 398 | | | | 1,057 | | | | (33 | ) | | | 40 | |
| Vidalia | | | GA | | | | 4/1/2008 | | | | (g)(l) | | | | 317 | | | | 2,275 | | | | (503 | ) | | | 252 | | | | 1,837 | | | | 2,089 | | | | (156 | ) | | | 40 | |
| Vincennes | | | IN | | | | 4/1/2008 | | | | — (l) | | | | 133 | | | | 366 | | | | (14 | ) | | | 133 | | | | 352 | | | | 485 | | | | (11 | ) | | | 40 | |
| Virginia Beach | | | VA | | | | 4/1/2008 | | | | (i)(l) | | | | 554 | | | | 357 | | | | (75 | ) | | | 507 | | | | 329 | | | | 836 | | | | (25 | ) | | | 40 | |
| Virginia Beach | | | VA | | | | 4/1/2008 | | | | (d)(l) | | | | 554 | | | | 1,610 | | | | (590 | ) | | | 395 | | | | 1,179 | | | | 1,574 | | | | (111 | ) | | | 40 | |
| Virginia Beach | | | VA | | | | 4/1/2008 | | | | — (l) | | | | 299 | | | | 200 | | | | (14 | ) | | | 299 | | | | 186 | | | | 485 | | | | (13 | ) | | | 40 | |
| Mobile | | | AL | | | | 4/1/2008 | | | | — (l) | | | | — | | | | — | | | | — | | | | — | | | | — | | | | — | | | | — | | | | 40 | |
| Voorhees | | | NJ | | | | 4/1/2008 | | | | — (l) | | | | 107 | | | | 293 | | | | — | | | | 107 | | | | 293 | | | | 400 | | | | (20 | ) | | | 40 | |
| W. Los Angeles | | | CA | | | | 4/1/2008 | | | | (e)(l) | | | | 2,061 | | | | 2,614 | | | | (1,073 | ) | | | 1,570 | | | | 2,032 | | | | 3,602 | | | | (173 | ) | | | 40 | |
| Walla Walla | | | WA | | | | 4/1/2008 | | | | (b)(l) | | | | 280 | | | | 1,294 | | | | (939 | ) | | | 95 | | | | 540 | | | | 635 | | | | (101 | ) | | | 40 | |
| Waltham | | | MA | | | | 4/1/2008 | | | | (e)(l) | | | | 11,470 | | | | 30,943 | | | | (11,762 | ) | | | 8,000 | | | | 22,651 | | | | 30,651 | | | | (2,269 | ) | | | 40 | |
| Wantagh | | | NY | | | | 4/1/2008 | | | | (e)(l) | | | | 842 | | | | 1,010 | | | | (502 | ) | | | 605 | | | | 745 | | | | 1,350 | | | | (67 | ) | | | 40 | |
| Warminster | | | PA | | | | 4/1/2008 | | | | 651 (l) | | | | 867 | | | | 1,065 | | | | (938 | ) | | | 430 | | | | 564 | | | | 994 | | | | (73 | ) | | | 40 | |
| Warrenton | | | VA | | | | 4/1/2008 | | | | — (l) | | | | 271 | | | | 1,423 | | | | (215 | ) | | | 234 | | | | 1,245 | | | | 1,479 | | | | (97 | ) | | | 40 | |
| Washington | | | DC | | | | 4/1/2008 | | | | (a)(l) | | | | 5,884 | | | | 3,793 | | | | — | | | | 5,884 | | | | 3,793 | | | | 9,677 | | | | (260 | ) | | | 40 | |
| Washington | | | NC | | | | 4/1/2008 | | | | — (l) | | | | 139 | | | | 134 | | | | — | | | | 139 | | | | 134 | | | | 273 | | | | (9 | ) | | | 40 | |
| Waynesboro | | | GA | | | | 4/1/2008 | | | | (g)(l) | | | | 33 | | | | 963 | | | | — | | | | 33 | | | | 963 | | | | 996 | | | | (66 | ) | | | 40 | |
| Waynesville | | | NC | | | | 4/1/2008 | | | | 766 (l) | | | | 1,926 | | | | 445 | | | | (502 | ) | | | 1,513 | | | | 356 | | | | 1,869 | | | | (27 | ) | | | 40 | |
208
TABLE OF CONTENTS
| | | | | | | | | | | | | | | | | | | | | | |
| | State | | Acquisition
Date | | Encumbrances at
December 31,
2010 | | Initial Costs | | Net
Improvements
(Retirements)
Since
Acquisition | | Gross Amount at Which Carried
December 31, 2010(1) | | Accumulated
Depreciation
12/31/10(2) | | Average
Depreciable
Life |
| City | | Land | | Building and
Improvements | | Land | | Building and
Improvements | | Total |
| Wenatchee | | | WA | | | | 4/1/2008 | | | | (e)(l) | | | | 201 | | | | 600 | | | | (119 | ) | | | 166 | | | | 516 | | | | 682 | | | | (52 | ) | | | 40 | |
| West Chester | | | PA | | | | 4/1/2008 | | | | — (l) | | | | 525 | | | | 4,223 | | | | (414 | ) | | | 474 | | | | 3,860 | | | | 4,334 | | | | (291 | ) | | | 40 | |
| West Chester | | | PA | | | | 4/1/2008 | | | | (d)(l) | | | | 2,592 | | | | 4,062 | | | | (991 | ) | | | 2,190 | | | | 3,473 | | | | 5,663 | | | | (262 | ) | | | 40 | |
| West Hempstead | | | NY | | | | 4/1/2008 | | | | (e)(l) | | | | 2,031 | | | | 3,439 | | | | (1,377 | ) | | | 1,491 | | | | 2,602 | | | | 4,093 | | | | (237 | ) | | | 40 | |
| West Jefferson | | | NC | | | | 4/1/2008 | | | | (g)(l) | | | | 478 | | | | 758 | | | | (441 | ) | | | 300 | | | | 495 | | | | 795 | | | | (52 | ) | | | 40 | |
| West Palm Beach | | | FL | | | | 4/1/2008 | | | | (e)(l) | | | | 2,453 | | | | 3,335 | | | | (1,141 | ) | | | 1,940 | | | | 2,707 | | | | 4,647 | | | | (219 | ) | | | 40 | |
| West Palm Beach | | | FL | | | | 4/1/2008 | | | | (d)(l) | | | | 3,390 | | | | 2,209 | | | | (3,724 | ) | | | 1,075 | | | | 800 | | | | 1,875 | | | | (145 | ) | | | 40 | |
| West Palm Beach | | | FL | | | | 4/1/2008 | | | | (d)(l) | | | | 97 | | | | 72 | | | | (105 | ) | | | 29 | | | | 35 | | | | 64 | | | | (11 | ) | | | 40 | |
| West Seneca | | | NY | | | | 4/1/2008 | | | | (e)(l) | | | | 2,142 | | | | 9,447 | | | | (3,600 | ) | | | 1,428 | | | | 6,561 | | | | 7,989 | | | | (656 | ) | | | 40 | |
| Wheaton | | | MD | | | | 4/1/2008 | | | | (e)(l) | | | | 1,971 | | | | 2,062 | | | | (2,206 | ) | | | 855 | | | | 972 | | | | 1,827 | | | | (138 | ) | | | 40 | |
| Whittier | | | CA | | | | 4/1/2008 | | | | (b)(l) | | | | 1,787 | | | | 4,624 | | | | (2,658 | ) | | | 999 | | | | 2,754 | | | | 3,753 | | | | (312 | ) | | | 40 | |
| Wichita Falls | | | TX | | | | 4/1/2008 | | | | (e)(l) | | | | 186 | | | | 272 | | | | (37 | ) | | | 156 | | | | 265 | | | | 421 | | | | (32 | ) | | | 40 | |
| Wilkesboro | | | NC | | | | 4/1/2008 | | | | 489 (l) | | | | 566 | | | | 608 | | | | (263 | ) | | | 434 | | | | 477 | | | | 911 | | | | (41 | ) | | | 40 | |
| Williamsburg | | | VA | | | | 4/1/2008 | | | | — (l) | | | | 706 | | | | 1,252 | | | | (690 | ) | | | 446 | | | | 822 | | | | 1,268 | | | | (81 | ) | | | 40 | |
| Williamston | | | NC | | | | 4/1/2008 | | | | — (l) | | | | 53 | | | | 146 | | | | 40 | | | | 53 | | | | 186 | | | | 239 | | | | (13 | ) | | | 40 | |
| Wilmington | | | DE | | | | 4/1/2008 | | | | 38,591 (l) | | | | 10,664 | | | | 60,082 | | | | (13,995 | ) | | | 8,424 | | | | 48,327 | | | | 56,751 | | | | (4,123 | ) | | | 40 | |
| Wilmington | | | NC | | | | 4/1/2008 | | | | (c)(l) | | | | 976 | | | | 739 | | | | (558 | ) | | | 649 | | | | 508 | | | | 1,157 | | | | (50 | ) | | | 40 | |
| Wilmington | | | NC | | | | 4/1/2008 | | | | (g)(l) | | | | 262 | | | | 199 | | | | (83 | ) | | | 214 | | | | 164 | | | | 378 | | | | (14 | ) | | | 40 | |
| Wilmington | | | NC | | | | 4/1/2008 | | | | (c)(l) | | | | 1,109 | | | | 499 | | | | (528 | ) | | | 737 | | | | 343 | | | | 1,080 | | | | (34 | ) | | | 40 | |
| Wilmington | | | NC | | | | 4/1/2008 | | | | (g)(l) | | | | 939 | | | | 887 | | | | (314 | ) | | | 772 | | | | 740 | | | | 1,512 | | | | (61 | ) | | | 40 | |
| Wilson | | | NC | | | | 4/1/2008 | | | | (g)(l) | | | | 741 | | | | 11,112 | | | | — | | | | 741 | | | | 11,112 | | | | 11,853 | | | | (749 | ) | | | 40 | |
| Wilson | | | NC | | | | 4/1/2008 | | | | (g)(l) | | | | 1,697 | | | | 8,854 | | | | (307 | ) | | | 1,645 | | | | 8,599 | | | | 10,244 | | | | (600 | ) | | | 40 | |
| Wilson | | | NC | | | | 4/1/2008 | | | | (g)(l) | | | | 700 | | | | 2,974 | | | | — | | | | 700 | | | | 2,974 | | | | 3,674 | | | | (204 | ) | | | 40 | |
| Winder | | | GA | | | | 4/1/2008 | | | | (b)(l) | | | | 321 | | | | 453 | | | | (310 | ) | | | 187 | | | | 277 | | | | 464 | | | | (32 | ) | | | 40 | |
| Winstom Salem | | | NC | | | | 4/1/2008 | | | | (d)(l) | | | | 548 | | | | 35,554 | | | | (3,903 | ) | | | 482 | | | | 31,717 | | | | 32,199 | | | | (2,411 | ) | | | 40 | |
| Winstom Salem | | | NC | | | | 4/1/2008 | | | | (d)(l) | | | | 1,733 | | | | 22,658 | | | | (4,795 | ) | | | 1,370 | | | | 18,226 | | | | 19,596 | | | | (1,531 | ) | | | 40 | |
| Winston-Salem | | | NC | | | | 4/1/2008 | | | | (c)(l) | | | | 1,250 | | | | 984 | | | | (713 | ) | | | 839 | | | | 682 | | | | 1,521 | | | | (67 | ) | | | 40 | |
| Winston-Salem | | | NC | | | | 4/1/2008 | | | | (c)(l) | | | | 843 | | | | 264 | | | | (354 | ) | | | 569 | | | | 184 | | | | 753 | | | | (18 | ) | | | 40 | |
| Winston-Salem | | | NC | | | | 4/1/2008 | | | | (d)(l) | | | | 1,762 | | | | 12,567 | | | | (2,560 | ) | | | 1,428 | | | | 10,341 | | | | 11,769 | | | | (839 | ) | | | 40 | |
| Winter Garden | | | FL | | | | 4/1/2008 | | | | — (l) | | | | 858 | | | | 1,135 | | | | 43 | | | | 858 | | | | 1,178 | | | | 2,036 | | | | (78 | ) | | | 40 | |
| Winter Park | | | FL | | | | 4/1/2008 | | | | (b)(l) | | | | 1,099 | | | | 1,880 | | | | (1,824 | ) | | | 370 | | | | 785 | | | | 1,155 | | | | (169 | ) | | | 40 | |
| Winter Park | | | FL | | | | 4/1/2008 | | | | 941 (l) | | | | 834 | | | | 573 | | | | (154 | ) | | | 740 | | | | 513 | | | | 1,253 | | | | (39 | ) | | | 40 | |
| Winter Park | | | FL | | | | 4/1/2008 | | | | 625 (l) | | | | 694 | | | | 727 | | | | (307 | ) | | | 538 | | | | 576 | | | | 1,114 | | | | (50 | ) | | | 40 | |
| Winterville | | | NC | | | | 4/1/2008 | | | | (d)(l) | | | | 3,215 | | | | 10,698 | | | | (2,570 | ) | | | 2,581 | | | | 8,762 | | | | 11,343 | | | | (727 | ) | | | 40 | |
209
TABLE OF CONTENTS
| | | | | | | | | | | | | | | | | | | | | | |
| | State | | Acquisition
Date | | Encumbrances at
December 31,
2010 | | Initial Costs | | Net
Improvements
(Retirements)
Since
Acquisition | | Gross Amount at Which Carried
December 31, 2010(1) | | Accumulated
Depreciation
12/31/10(2) | | Average
Depreciable
Life |
| City | | Land | | Building and
Improvements | | Land | | Building and
Improvements | | Total |
| Wood River | | | IL | | | | 4/1/2008 | | | | — (l) | | | | 67 | | | | 299 | | | | — | | | | 67 | | | | 299 | | | | 366 | | | | (21 | ) | | | 40 | |
| Woodbury | | | NJ | | | | 4/1/2008 | | | | (g)(l) | | | | 877 | | | | 2,157 | | | | (544 | ) | | | 712 | | | | 1,778 | | | | 2,490 | | | | (147 | ) | | | 40 | |
| Woodbury | | | NJ | | | | 4/1/2008 | | | | — (l) | | | | 418 | | | | 1,081 | | | | — | | | | 418 | | | | 1,081 | | | | 1,499 | | | | (74 | ) | | | 40 | |
| Woodstock | | | GA | | | | 4/1/2008 | | | | (i)(l) | | | | 569 | | | | 659 | | | | (104 | ) | | | 519 | | | | 605 | | | | 1,124 | | | | (45 | ) | | | 40 | |
| York | | | PA | | | | 4/1/2008 | | | | (g)(l) | | | | 461 | | | | 247 | | | | (56 | ) | | | 424 | | | | 228 | | | | 652 | | | | (17 | ) | | | 40 | |
| York | | | PA | | | | 4/1/2008 | | | | (d)(l) | | | | 145 | | | | 2,642 | | | | (1,723 | ) | | | 45 | | | | 1,019 | | | | 1,064 | | | | (206 | ) | | | 40 | |
| Yuba City | | | CA | | | | 4/1/2008 | | | | (b)(l) | | | | 609 | | | | 1,562 | | | | (1,224 | ) | | | 248 | | | | 699 | | | | 947 | | | | (107 | ) | | | 40 | |
| Antioch | | | CA | | | | 1/21/2010 | | | | — | | | | 1,874 | | | | — | | | | 20 | | | | 1,874 | | | | 20 | | | | 1,894 | | | | (2 | ) | | | 40 | |
| Cape Coral | | | FL | | | | 7/1/2009 | | | | — | | | | 1,012 | | | | 4,049 | | | | — | | | | 1,012 | | | | 4,049 | | | | 5,061 | | | | (152 | ) | | | 40 | |
| Inido* | | | CA | | | | 11/12/2009 | | | | — | | | | 8,722 | | | | — | | | | 3 | | | | 8,725 | | | | — | | | | 8,725 | | | | — | | | | | |
| Lake Placid | | | NY | | | | 7/20/2010 | | | | — | | | | 628 | | | | 4,131 | | | | 23 | | | | 628 | | | | 4,154 | | | | 4,782 | | | | (43 | ) | | | 40 | |
| Mesa* | | | AZ | | | | 2/19/2010 | | | | — | | | | 21,677 | | | | — | | | | (11,322 | ) | | | 10,355 | | | | — | | | | 10,355 | | | | — | | | | | |
| Ontario | | | CA | | | | 10/20/2010 | | | | — | | | | 636 | | | | 4,205 | | | | — | | | | 636 | | | | 4,205 | | | | 4,841 | | | | (16 | ) | | | 40 | |
| Ontario | | | CA | | | | 10/20/2010 | | | | — | | | | 2,166 | | | | 4,928 | | | | — | | | | 2,166 | | | | 4,928 | | | | 7,094 | | | | (18 | ) | | | 40 | |
| Ontario | | | CA | | | | 10/20/2010 | | | | — | | | | 1,718 | | | | 5,491 | | | | 277 | | | | 1,718 | | | | 5,768 | | | | 7,486 | | | | (20 | ) | | | 40 | |
| | | | | | | | | | | $ | 261,875 | | | $ | 865,627 | | | $ | 2,426,427 | | | $ | (820,131 | ) | | $ | 634,941 | | | $ | 1,836,982 | | | $ | 2,471,923 | | | $ | (168,541 | ) | | | | |
Assets held for sale:
| | | | | | | | | | | | | | | | | | | | | | | | | | | | | | | | | | | | | | | | | | | | |
| Niagara Falls | | | NY | | | | 3/29/2010 | | | | — | | | | 5,450 | | | | 11,933 | | | | (541 | ) | | | 5,230 | | | | 11,612 | | | | 16,842 | | | | (202 | ) | | | 40 | |
| Kailua-Kona* | | | HI | | | | 7/20/2010 | | | | — | | | | 19,911 | | | | — | | | | (9,999 | ) | | | 9,912 | | | | — | | | | 9,912 | | | | — | | | | | |
| | | | | | | | | | | $ | — | | | $ | 25,361 | | | $ | 11,933 | | | $ | (10,540 | ) | | $ | 15,142 | | | $ | 11,612 | | | $ | 26,754 | | | $ | (202 | ) | | | | |
| | | | | | | | | | | $ | 261,875 | | | $ | 890,988 | | | $ | 2,438,360 | | | $ | (830,671 | ) | | $ | 650,083 | | | $ | 1,848,594 | | | $ | 2,498,677 | | | $ | (168,743 | ) | | | | |
NOTES:
| (a) | These properties collateralize a $180.0 million mortgage note payable of which $180.0 million was outstanding at December 31, 2010. |
| (b) | These properties collateralize a $381.7 million mortgage note payable of which $337.9 million was outstanding at December 31, 2010. |
| (c) | These properties collateralize a $65.0 million mortgage note payable of which $45.6 million was outstanding at December 31, 2010. |
| (d) | These properties collateralize a $240.0 million mortgage note payable of which $219.5 million was outstanding at December 31, 2010. |
| (e) | These properties collateralize a $304.0 million mortgage note payable of which $210.4 million was outstanding at December 31, 2010. |
| (f) | These properties collateralize a $19.9 million mortgage note payable of which $19.9 million was outstanding at December 31, 2010. |
| (g) | These properties collateralize a $250.0 million mortgage note payable of which $240.5 million was outstanding at December 31, 2010. |
| (h) | These properties collateralize a $26.4 million mortgage note payable of which $26.4 million was outstanding at December 31, 2010. |
| (i) | These properties collateralize a $30.0 million mortgage note payable of which $29.8 million was outstanding at December 31, 2010. |
210
TABLE OF CONTENTS
| (j) | These properties collateralize a $22.7 million mortgage note payable of which $22.7 million was outstanding at December 31, 2010. |
| (k) | These properties collateralize a $31.3 million mortgage note payable of which $31.1 million was outstanding at December 31, 2010. |
| (l) | These properties collateralize a $650.0 million mezzanine note payable of which $549.7 million was outstanding at December 31, 2010. |
211
TABLE OF CONTENTS
Gramercy Capital Corp.
Schedule IV
Mortgage Loans on Real Estate
(Amounts in thousands)
| | | | | | | | | | | | | | |
| | | | | | | | | | | | | | |
| Type of Loan | | Location | | Interest Rate(1) | | Final Maturity
Date(2) | | Periodic
Payment
Terms | | Prior
Liens | | Face
Amount of
Loans | | Carrying
Amount of
Loans |
| Office – CBD | | | New York, NY | | | | LIBOR + 2.50% | | | | 3/9/2016 | | | | Interest Only | | | $ | 95,000 | | | $ | 88,500 | | | $ | 83,673 | |
| Hotel | | | Las Vegas, NV | | | | LIBOR + 3.85% | | | | 12/31/2012 | | | | Interest Only | | | | 187,317 | | | | 69,000 | | | | 59,180 | |
| Land – Commercial | | | New York, NY | | | | LIBOR + 4.16% | | | | 2/11/2011 | | | | Interest Only | | | | 43,602 | | | | 67,458 | | | | 67,704 | |
| Office – CBD | | | California | | | | LIBOR + 3.50% | | | | 8/9/2011 | | | | Interest Only | | | | 1,030,427 | | | | 48,502 | | | | 5,224 | |
| Land – Residential | | | Various, California | | | | LIBOR + 7.25% | | | | 1/1/2011 | (3) | | | Interest Only | | | | 275,000 | | | | 45,000 | | | | — | |
| Retail | | | Mount Holyoke, MA | | | | LIBOR + 1.06% | | | | 2/9/2011 | | | | Interest Only | | | | 195,685 | | | | 44,318 | | | | 44,318 | |
| Whole Loans < 3% | | | | | | | 5.28% – 7.83%
LIBOR + 0.50% – 4.50% | | | | January 2011 –
April 2017 | | | | | | | | 25,160 | | | | 692,108 | | | | 580,806 | |
| Subordinate Loans < 3% | | | | | | | 4.00% – 15.40%
LIBOR + 5.25% – 9.00% | | | | January 2011 –
March 2017 | | | | | | | | 879,341 | | | | 92,322 | | | | 77,216 | |
| Mezzanine Loans < 3% | | | | | | | 10.25% – 15.00%
LIBOR + 0.96% – 10.00% | | | | February 2011 –
July 2016 | | | | | | | | 2,928,098 | | | | 254,128 | | | | 201,177 | |
| Preferred Equity < 3% | | | | | | | 10.00% | | | | August 1, 2011 | | | | | | | | 29,380 | | | | 12,166 | | | | 4,230 | |
| Total Portfolio | | | | | | | | | | | | | | | | | | $ | 5,689,009 | | | $ | 1,413,501 | | | $ | 1,123,528 | |
| (1) | All variable rate loans are based upon one month LIBOR or three month LIBOR and reprice every one or three months respectively. |
| (2) | Reflects the current maturity of the investment and does not consider any options to extend beyond the current maturity. |
1. Reconciliation of Mortgage Loans on Real Estate:
The following table reconciles Mortgage Loans for the years ended December 31, 2010, 2009 and 2008.
| | | | | | |
| | 2010 | | 2009 | | 2008 |
| Balance at January 1(1) | | | 1,383,832 | | | | 2,213,473 | | | | 2,636,746 | |
Additions during period:
| | | | | | | | | | | | |
| New mortgage loans | | | 114,456 | | | | 21,990 | | | | 96,281 | |
| Additional funding(2) | | | 13,653 | | | | 35,536 | | | | 81,975 | |
| Amortization of discount, net(3) | | | 1,033 | | | | 8,691 | | | | 20,745 | |
Deductions during period:
| | | | | | | | | | | | |
| Collections of principal | | | (183,439 | ) | | | (68,345 | ) | | | (393,143 | ) |
| Transfers to real estate held-for-sale | | | (80,581 | ) | | | (89,626 | ) | | | (35,836 | ) |
| Provision for loan losses | | | (84,390 | ) | | | (517,784 | ) | | | (80,334 | ) |
| Valuation allowance on loans held-for-sale | | | (2,000 | ) | | | (138,570 | ) | | | — | |
| Mortgage loan sold | | | (39,036 | ) | | | (81,533 | ) | | | (112,961 | ) |
| Loss on sale of mortgage loans | | | — | | | | — | | | | — | |
| Balance at December 31 | | | 1,123,528 | | | | 1,383,832 | | | | 2,213,473 | |
| (1) | All amounts include both loans receivable and loans held-for-sale. |
| (2) | Includes capitalized interest, which is non-cash addition to the balance of mortgage loans, of $6,519, $2,100 and $10,300 for the years ended December 31, 2010, 2009 and 2008, respectively. |
| (3) | Net discount amortization represents an entirely non-cash addition to the balance of mortgage loans. |
212
TABLE OF CONTENTS
ITEM 9. CHANGES IN AND DISAGREEMENTS WITH ACCOUNTANTS ON ACCOUNTING AND FINANCIAL DISCLOSURE
None.
ITEM 9A. CONTROLS AND PROCEDURES
Evaluation of Disclosure Controls and Procedures
We maintain disclosure controls and procedures that are designed to ensure that information required to be disclosed in our Exchange Act reports is recorded, processed, summarized and reported within the time frame specified in the SEC’s rules and forms, and that such information is accumulated and communicated to our management, including our Chief Executive Officer and Chief Financial Officer, as appropriate, to allow for timely decisions regarding required disclosure based closely on the definition of “disclosure controls and procedures” in Rule 13a-15(e). Notwithstanding the foregoing, a control system, no matter how well designed and operated, can provide only reasonable, not absolute, assurance that it will detect or uncover failures within our company to disclose material information otherwise required to be set forth in our periodic reports. Also, we may have investments in certain unconsolidated entities. As we do not control these entities, our disclosure controls and procedures with respect to such entities are necessarily substantially more limited than those we maintain with respect to our consolidated subsidiaries.
As of the end of the period covered by this report, we carried out an evaluation, under the supervision and with the participation of our management, including our Chief Executive Officer and our Chief Financial Officer, of the effectiveness of the design and operation of our disclosure controls and procedures. Based upon that evaluation, our Chief Executive Officer and Chief Financial Officer concluded that our disclosure controls and procedures were effective as of the end of the period covered by this report.
Management’s Annual Report on Internal Control over Financial Reporting
We are responsible for establishing and maintaining adequate internal control over financial reporting, as such term is defined in Exchange Act Rules 13a-15(f) and 15d-15(f). Under the supervision and with the participation of our management, including our Chief Executive Officer and Chief Financial Officer, we conducted an evaluation of the effectiveness of our internal control over financial reporting as of December 31, 2010 based on the framework in Internal Control — Integrated Framework issued by the Committee of Sponsoring Organizations of the Treadway Commission (COSO). Based on that evaluation, we concluded that our internal control over financial reporting was effective as of December 31, 2010.
Our internal control over financial reporting during the year ended December 31, 2010 has been audited by Ernst & Young LLP, an independent registered public accounting firm, as stated in their report, appearing on page 111, which expresses an unqualified opinion on the effectiveness of our internal control over financial reporting as of December 31, 2010.
Changes in Internal Control over Financial Reporting
There were no changes in our internal control over financial reporting identified in connection with the evaluation of such internal control that occurred during the year ended December 31, 2010 that have materially affected, or are reasonably likely to materially affect, our internal control over financial reporting.
ITEM 9B. OTHER INFORMATION
None.
213
TABLE OF CONTENTS
EITEM 10. DIRECTORS, EXECUTIVE OFFICERS OF THE REGISTRANT AND CORPORATE GOVERNANCE
The following table sets forth the respective names, ages and positions of our directors and executive officers:
| | | | |
| Name | | Age | | Position |
Class I Directors (terms will expire in 2014)
| | | | |
| Jeffrey E. Kelter | | 57 | | Director |
| Charles S. Laven | | 60 | | Director |
Class II Directors (terms will expire in 2012)
| | | | |
| Allan J. Baum | | 55 | | Director |
| Roger M. Cozzi | | 41 | | Director; Chief Executive Officer |
Class III Director (term will expire in 2013)
| | | | |
| Paul J. Konigsberg | | 75 | | Director |
| Marc Holliday(1) | | 45 | | Director |
Executive Officers
| | | | |
| Timothy J. O’Connor | | 56 | | President |
| Robert R. Foley | | 51 | | Chief Operating Officer |
| Jon W. Clark | | 42 | | Chief Financial Officer and Treasurer |
| Michael G. Kavourias | | 48 | | Executive Vice President and
Chief Legal Officer |
| (1) | On April 22, 2010, Marc Holliday notified our board of directors that he would not stand for election as a Class III director for a new term at our 2010 annual meeting of stockholders. However, Mr. Holliday agreed with our board of directors that he would remain as a director on an interim basis for an unspecified period of time following our 2010 annual meeting. Due to the time necessary to complete the resolution of the Goldman Mortgage Loan and Goldman Mezzanine Loans, which has been subject to many delays, Mr. Holliday has remained as a director in an interim role for much longer than we intended. Under Maryland law, a director continues as a director until he resigns or his successor is duly elected and appointed. |
Jeffrey E. Kelter. Mr. Kelter has served as one of our directors since August 2004. Mr. Kelter also serves as the Chairman for our Compensation Committee, as well as a member of the Nominating and Corporate Governance and Investment Committees. Mr. Kelter has been a senior partner of KTR Capital Partners since 2004. From 1997 to 2004, Mr. Kelter was President and Chief Executive Officer and a trustee of Keystone Property Trust, an industrial real estate investment trust (“REIT”). Keystone merged during the third quarter of 2004 with and into a joint venture between ProLogis and affiliates of investment companies managed by Eaton Vance Management. Mr. Kelter had been President and a trustee of Keystone from its formation in December 1997 and was appointed Chief Executive Officer in December 1998. He has over 20 years of experience in all phases of commercial real estate including development and third-party management. Prior to forming Keystone, he served as President and Chief Executive Officer of Penn Square Properties, Inc. in Philadelphia, Pennsylvania, a real estate company which he founded in 1982. At Penn Square, he developed, owned, managed and leased more than 4.5 million square feet of office and warehouse projects throughout the Pennsylvania and New Jersey markets. Mr. Kelter received a B.A. from Trinity College. Mr. Kelter’s qualifications to serve on our board of directors include his executive experience as President and Chief Executive Officer of Keystone and Penn Square, and his vast experience of over 20 years in commercial real estate.
Charles S. Laven. Mr. Laven has been one of our directors since August 2004. In addition, Mr. Laven is the Chairman of our Nominating and Corporate Governance Committee, as well as a member of our Audit and Compensation Committees. Mr. Laven has been the President of Forsyth Street Advisors LLC, a New York based company specializing in real estate finance and consulting, since July 2003. From 1991 to 2003, Mr. Laven was a partner of Hamilton, Rabinovitz, & Alschuler, Inc., or HR&A, a financial, policy and management consulting firm focusing on complex housing finance, real estate, economic development and
214
TABLE OF CONTENTS
strategic planning problems. Prior to his 12 years with HR&A, Mr. Laven served as principal of Caine Gressel Midgley Slater Incorporated and, from 1981 to 1982, served as principal of Charles Laven and Associates. Mr. Laven also currently serves as chairman of the Urban Homesteading Assistance Board and as a director for Citizens Housing and Planning Council. In addition, Mr. Laven served on the board of directors of Madison Harbor Balanced Strategies, Inc., a real estate fund, from December 2003 to October 2004. Mr. Laven holds a B.S. degree in Architectural Design from the Massachusetts Institute of Technology. From 1980 to 1981, Mr. Laven was a Loeb Fellow in Advanced Environmental Affairs at the Harvard University School of Design. Mr. Laven is an Adjunct Professor of Real Estate at Columbia University’s Graduate School of Architecture Planning and Preservation and has been a member of the faculty of Columbia University since 1981. Mr. Laven’s qualifications to serve on our board of directors include his extensive leadership skills and executive experience at Forsyth Street Advisers LLC and HR&A, his intellectual acumen as a Columbia faculty member and his prior board experience at various companies and organizations.
Allan J. Baum. Mr. Baum has served as one of our directors since August 2004. Mr. Baum also serves on our Audit and Compensation Committees. Mr. Baum retired from Credit Suisse First Boston, or CSFB, in 2002, where he was a Managing Director and head of the structured finance unit for commercial mortgage-backed securities. Prior to his ten years with CSFB, Mr. Baum served as a Vice President in the Real Estate Investment Bank of Citicorp, and held positions in the tax-exempt housing finance and taxable mortgage finance areas of Merrill Lynch. Mr. Baum also currently serves as a director of Community Development Trust, a for-profit, mission-oriented real estate investment trust. He previously served as Vice President of the Commercial Mortgage Securities Association. In addition, from May 2004 to May 2007, Mr. Baum served as a director for National Consumer Cooperative Bank, a cooperative financial institution which primarily provides financial services to eligible cooperative enterprises, and also served on its audit committee. Mr. Baum received a B.A. degree in Government/Urban Studies from Dartmouth College in 1978 and an M.B.A. in Finance from Columbia University Graduate School of Business in 1983. Mr. Baum’s qualifications to serve on our board of directors include his executive experience at CSFB and Citicorp, his relevant experience serving on the boards and audit committees for a real estate investment trust and a financial institution and his extensive experience of over 20 years in commercial real estate investment banking.
Roger M. Cozzi. Mr. Cozzi has been our Chief Executive Officer since October 2008. Mr. Cozzi had also been the Chief Executive Officer of our former external manager, GKK Manager LLC, or the Manager, from October 2008 until April 2009. In addition, Mr. Cozzi currently serves as Chairman of our Investment Committee. From March 2008 until October 2008, Mr. Cozzi worked as a consultant. From March 2007 to February 2008, Mr. Cozzi was a Managing Director of Fortress Investment Group, LLC, a hedge fund. Prior to working at Fortress Investment Group, Mr. Cozzi served as Executive Vice President — Investments and Chief Investment Officer of iStar Financial, Inc., a publicly traded real estate investment trust focused on the financing of commercial real estate. At iStar Financial, Mr. Cozzi served as Chief Investment Officer from January 2006 to February 2007, Executive Vice President — Investments from January 2002 through February 2007 and as a Senior Vice President — Investments from 1998 to January 2002. While at iStar, Mr. Cozzi served as Co-Head of the firm’s investment committee and was responsible for the structuring, pricing and origination of whole loan and subordinate debt positions, including B-notes, mezzanine loans and preferred equity investments. From 1995 to 1998, Mr. Cozzi was an investment officer of Starwood Mezzanine Investors, L.P. and Starwood Opportunity Fund IV, two private investment funds that specialized in structured real estate finance and opportunistic equity investments. Prior to joining Starwood, Mr. Cozzi spent three years at Goldman, Sachs & Co. While at Goldman Sachs, he was in the real estate department, where he focused on securitizing and selling investment grade and non-investment grade securities backed by pools of commercial mortgages, evaluating performing commercial mortgage loans for potential principal investment by the Whitehall funds and consulting large corporate tenants on lease alternatives. In addition, Mr. Cozzi spent one year in Goldman Sachs & Co.’s investment management group, where he worked on several merger transactions, created a conduit to lend directly to mutual funds and helped create a vehicle to securitize 12b-1 financing fees. Mr. Cozzi earned a B.S. in Economics and graduated magna cum laude from The Wharton School of the University of Pennsylvania in 1992. As our chief executive officer since 2008, Mr. Cozzi has demonstrated his ability to lead our company and serve on our board of directors through his leadership skills and executive experience at our company and iStar Financial, as well as his extensive experience working with real estate, finance, and investment businesses.
215
TABLE OF CONTENTS
Paul J. Konigsberg. Mr. Konigsberg has been one of our directors since August 2004. Mr. Konigsberg also serves as Chairman of our Audit Committee and as a member of our Nominating and Corporate Governance Committee. For the past 20 years, Mr. Konigsberg was a senior partner and President of Konigsberg Wolf and Co. PC, a New York-based accounting firm, which was reorganized in 2011 as KMR LLP and acquired in September 2011 by Citrin Cooperman, where Mr. Konigsberg now serves as a consultant. Previously, Mr. Konigsberg served on the boards of directors of two NYSE-listed companies, Savin Business Machines and Ipco Hospital Supplies. In addition, he served on the audit committees for Savin Business Machines and National Medical Health Card, also listed on the NYSE. Mr. Konigsberg is the former treasurer and board member of the UJA Federation of New York and a member of the Board of Overseers and on the finance committee of the Albert Einstein College of Medicine. He also serves as an officer and director for the Westlake Foundation, Inc. Mr. Konigsberg is a Certified Public Accountant, and a member of the New York State Society of CPAs and The American Institute of Certified Public Accountants. Mr. Konigsberg received a B.A. degree in Business Administration from New York University in 1958, a L.L.B. from Brooklyn Law School in 1961 and an L.L.M. in taxation from the New York University Law School in 1965. Mr. Konigsberg’s qualifications for election to our board of directors include his long-time executive experience as President and senior partner of Konigsberg Wolf and Co. PC, his extensive experience serving on the boards and audit committees for various public companies and his financial and accounting skills as a Certified Public Accountant.
Marc Holliday. Mr. Holliday has served as one of our directors since August 2004 and was our President and Chief Executive Officer from August 2004 until October 2008. Mr. Holliday also has served on our Investment Committee from August 2004 until June 2010. Mr. Holliday became a consultant to our company after stepping down from his positions as our President and Chief Executive Officer from October 2008 until April 2009. Mr. Holliday is the Chief Executive Officer and a director of SL Green Realty Corp. He served as Chief Investment Officer of SL Green Realty Corp. from July 1998, when he joined SL Green Realty Corp., through 2003 and was named its President until April 2007, when Andrew Mathias, our former Chief Investment Officer, was promoted to that position, and elected to its board of directors in 2001. Prior to joining SL Green Realty Corp., he was Managing Director and Head of Direct Originations for New York-based Capital Trust (NYSE: CT), a mezzanine finance company. While at Capital Trust, Mr. Holliday was in charge of originating direct principal investments for the firm, consisting of mezzanine debt, preferred equity and first mortgages. From 1991 to 1997, Mr. Holliday served in various management positions, including Senior Vice President at Capital Trust’s predecessor company, Victor Capital Group, a private real estate investment bank specializing in advisory services, investment management, and debt and equity placements. Mr. Holliday received a B.S. degree in Business and Finance from Lehigh University in 1988, and a M.S. degree in Real Estate Development from Columbia University in 1990. Mr. Holliday’s qualifications to serve on our board of directors include his extensive executive experience as Chief Executive Officer at SL Green Realty Corp., as former President and Chief Executive Officer of our company, his long-time leadership skills in various management positions of various companies, as well as his deep exposure in the real estate industry.
Timothy J. O’Connor. Mr. O’Connor has been our President since November 2008. Mr. O’Connor was the President of the Manager from November 2008 until April 2009. From June 2008 until November 2008, Mr. O’Connor worked as a consultant. Previously, Mr. O’Connor had served as Chief Operating Officer of iStar Financial Inc., a publicly traded real estate investment trust focused on the financing of commercial real estate. Mr. O’Connor served as Chief Operating Officer from March 1998 to June 2008. While at iStar Financial, Mr. O’Connor was responsible for developing and managing iStar Financial’s risk management and due diligence operations, participating in the evaluation and approval of new investments, coordinating iStar Financial’s information systems and managing the post-acquisition integration of several corporate acquisitions. Previously, Mr. O’Connor was a Vice President of Morgan Stanley & Co. responsible for the performance of over $2 billion of assets acquired by the Morgan Stanley Real Estate Funds. Prior to joining Morgan Stanley, Mr. O’Connor was a Vice President of Greystone Realty Corporation. Previously, Mr. O’Connor was employed by Exxon Co. USA in its real estate and engineering group. Mr. O’Connor earned a B.S. in Engineering from the United States Military Academy at West Point in 1979 and an M.B.A. from The Wharton School of the University of Pennsylvania in 1989. Mr. O’Connor is 56 years old.
216
TABLE OF CONTENTS
Robert R. Foley. Mr. Foley has been our Chief Operating Officer since April 2008 and our Secretary since October 2008. Previously, Mr. Foley had served as our Chief Financial Officer from August 2004 until April 2008. Mr. Foley was a Managing Director of the Manager from August 2004 until April 2009. From May 2004 until August 2004, he worked as an independent consultant advising SL Green Realty Corp. on the development of our business plan. Before working with SL Green Realty Corp., Mr. Foley was a Vice President in the Special Situations Group of Goldman Sachs & Co., or Goldman, where from 2000 until 2004, he directed that firm’s principal investment activities in commercial real estate B notes, mezzanine loans, preferred equity and distressed debt. From 1997 to 2000, Mr. Foley was responsible at Goldman for the structuring, capital commitment, pricing and distribution of mezzanine debt, non-securitized commercial mortgage loans and loans to real estate investment trusts and real estate operating companies. From 1988 until 1997, Mr. Foley held a range of senior capital markets, principal investing and client relationship management roles with Bankers Trust Company and BT Securities Corporation (now Deutsche Bank) in New York and Los Angeles. From 1981 to 1986, Mr. Foley was an accountant and consultant in the San Francisco office of Touche, Ross & Co. (now Deloitte & Touche), an international independent public accounting firm. Mr. Foley earned B.A. degrees in Economics and Political Science from Stanford University in 1981, and an M.B.A. from The Wharton School of the University of Pennsylvania in 1988. Mr. Foley is a Certified Public Accountant. Mr. Foley is 51 years old.
Jon W. Clark. Mr. Clark has been our Chief Financial Officer and Treasurer since April 24, 2009. He has also been our Chief Accounting Officer since March 2009. Prior to his election as our Chief Accounting Officer, Mr. Clark served as our Vice President and Controller from June 2007 until March 2009. Mr. Clark was previously employed by the Manager from June 2007 until April 24, 2009. Prior to joining the Manager, Mr. Clark was a Director at BlackRock Financial Management where he managed the accounting and finance department for real estate debt products. During that time, Mr. Clark also served as Assistant Treasurer at Anthracite Capital, Inc., which was a publicly traded mortgage REIT that specialized in subordinate commercial mortgage-backed securities. He joined Blackrock Financial Management in 2000. Prior to joining BlackRock Financial Management, Mr. Clark was a Vice President at Cornerstone Properties, Inc. (acquired by Equity Office Properties in 2000) where he established its internal audit department. Mr. Clark is a certified public accountant and obtained his public accountancy experience as a manager in the national real estate practices of Arthur Andersen LLP and BDO Seidman LLP. Mr. Clark holds a B.B.A. degree in Accountancy from Western Michigan University. Mr. Clark is 42 years old.
Michael G. Kavourias. Mr. Kavourias has been our Executive Vice President and Chief Legal Officer since April 2009. Mr. Kavourias is responsible for asset management, special servicing, enforcements and remedial actions, restructuring and workouts and the negotiation, documentation and closing of loan investments and managing our relationships with outside law firms. Prior to his election as our Executive Vice President and Chief Legal Officer, Mr. Kavourias served as our General Counsel of our commercial real estate finance business, which operates under the name Gramercy Finance. Previously, Mr. Kavourias had served as our Senior Vice President and Transaction Counsel from October 2005 until March 2008. Prior to that, Mr. Kavourias was a Special Counsel in the Real Estate Department in Cadwalader, Wickersham & Taft LLP’s New York office, where he concentrated on commercial real estate financing and representing major financial institutions, investment banks and commercial banks. Prior to joining Cadwalader in 2000, Mr. Kavourias was a Special Counsel in the Real Estate Structured Finance Department of Rosenman & Colin LLP. Prior to that, Mr. Kavourias was the managing partner in a boutique real estate law firm, which he co-founded in 1994. Mr. Kavourias began his career in 1989 as an associate at Thacher Proffitt & Wood’s Real Estate Group. He attended New York University and received his J.D. from St. John’s University, where he was aThomas More Scholar and member of theLaw Review. Mr. Kavourias is a Certified Public Accountant and practiced public accounting from 1984 to 1986 with Price Waterhouse prior to attending law school. Mr. Kavourias has substantial experience in the origination and sale and purchase of commercial mortgage loans and mezzanine financing, as well as a wide range of experience in the sale and acquisition of commercial and residential real estate. Mr. Kavourias is 48 years old.
217
TABLE OF CONTENTS
Section 16(a) Beneficial Ownership Reporting Compliance
Section 16(a) of the Securities Exchange Act of 1934, as amended, requires our executive officers and directors, and persons who own more than 10% of a registered class of our equity securities, to file reports of ownership and changes in ownership with the SEC and the NYSE. Officers, directors and persons who own more than 10% of a registered class of our equity securities are required to furnish us with copies of all Section 16(a) forms that they file. To our knowledge, based solely on review of the copies of such reports furnished to us, all Section 16(a) filing requirements applicable to our executive officers, directors and persons who own more than 10% of a registered class of our equity securities were filed on a timely basis in 2010, except that Allan J. Baum, Marc Holliday, Jeffrey E. Kelter, Paul J. Konigsberg and Charles S. Laven, our directors, each did not timely file one Form 4 to report a transaction.
Code of Business Conduct and Ethics
Our board of directors has adopted a Code of Business Conduct and Ethics as required by the listing standards of the NYSE that applies to our directors and executive officers and our employees. The Code of Business Conduct and Ethics was designed to assist our directors and executive officers and our employees in complying with the law, in resolving moral and ethical issues that may arise and in complying with our policies and procedures. Among the areas addressed by the Code of Business Conduct and Ethics are compliance with applicable laws, conflicts of interest, use and protection of our company’s assets, confidentiality, communications with the public, accounting matters, records retention, fair dealing, discrimination and harassment and health and safety.
Audit Committee and Audit Committee Financial Expert
We have a standing Audit Committee, consisting of Messrs. Konigsberg (Chairman), Baum and Laven, each of whom is “independent” within the meaning of the rules of the NYSE and the SEC and each of whom meet the financial literacy standard required by the rules of the NYSE. Our board of directors has determined that our Audit Committee has at least one “audit committee financial expert,” as defined in Item 407(d)(5) of SEC Regulation S-K, such expert being Mr. Konigsberg, and that he is “independent,” as that term is used in Item 7(d)(3)(iv) of Schedule 14A under the Securities Exchange Act of 1934, as amended. Mr. Konigsberg has agreed to serve as our audit committee financial expert.
ITEM 11. EXECUTIVE AND DIRECTOR COMPENSATION
Compensation Discussion and Analysis
Overview
On April 24, 2009, we acquired the Manager from SL Green Realty Corp., the parent company of the Manager. We refer to this acquisition as the Internalization. In connection with the Internalization, the Manager became a wholly-owned subsidiary of GKK Capital LP, or our Operating Partnership, and certain employees (including our current executive officers) of the Manager became our employees. In connection with the Internalization, we assumed, among other things, the obligations of the Manager under certain employment contracts between the Manager and Roger M. Cozzi, our Chief Executive Officer, Timothy J. O’Connor, our President, and Robert R. Foley, our Chief Operating Officer. On April 27, 2009, we entered into an employment contract with Jon W. Clark, our Chief Financial Officer, effective as of April 24, 2009. On July 28, 2011, we entered into amendments to the employment contracts of Messrs. Cozzi and O’Connor. On August 31, 2011, Michael G. Kavourias entered into a retention agreement, effective as of July 28, 2011, with our Company. The material terms of the employment and retention agreements with our executive officers are described under “— Employment and Retention Agreements” of this Item 11.
Prior to the Internalization, we did not pay, and were not involved in determining, any of our executive officers’ cash compensation. Subsequent to the Internalization, our Compensation Committee has reviewed the compensation program and policies of our company and has established a compensation program that is appropriate and adequate for an internally-managed company in our industry and under current market and company-specific conditions. This section of our Annual Report on Form 10-K discusses the principles underlying our executive compensation policies and decisions and the most important factors relevant to an
218
TABLE OF CONTENTS
analysis of these policies and decisions since the Internalization. It provides qualitative information regarding the manner and context in which compensation is awarded to, and earned by, our named executive officers (as defined below) and places in perspective the data presented in the tables and narrative that follow.
Throughout this Annual Report on Form 10-K, the individuals who served as our Chief Executive Officer and Chief Financial Officer during our 2010 fiscal year, as well as the other individuals included in the “Summary Compensation Table” on page 225, are referred to as the “named executive officers” or our “executives,” unless the context otherwise requires or indicates.
Objectives of Our Compensation Program
As an integrated commercial real estate finance and property management company, we operate in a highly competitive market. We seek to maintain a total compensation package that provides fair, reasonable and competitive compensation for our executives while allowing us the flexibility to differentiate actual pay based on individual and organizational performance.
Our Compensation Committee, in consultation with our Chief Executive Officer and external compensation consultant, sets our compensation philosophy, which has been structured to achieve the following objectives:
| • | To attract and retain talented individuals capable of performing at a high level in a market that remains highly competitive and who have the motivation, experience and skills necessary to lead our company effectively; |
| • | To provide performance-based compensation that creates a strong alignment of management and stockholder interest to create long-term stockholder value; |
| • | To motivate our executives to manage our business to meet and appropriately balance our short- and long-term objectives; |
| • | To hold executives accountable for their level of success in attaining specific goals set for them individually; |
| • | To maintain flexibility and discretion to allow us to recognize the unique characteristics of our operations and strategy, and our prevailing business environment, as well as changing labor market dynamics; and |
| • | To achieve an appropriate risk-reward balance in our compensation programs that does not incentivize unnecessary or excessive risk taking. |
Based on these objectives, we place significant emphasis on annual and long-term performance-based incentive compensation, including base salaries, annual cash and equity incentives and long-term equity-based incentive awards, which are designed to reward our executives based on the achievement of predetermined company and individual goals.
Our Compensation Committee is committed to the ongoing review and evaluation of the executive officer compensation levels and program. It is our Compensation Committee’s view that compensation decisions are complex and best made after a deliberate review of company and individual performance, as well as industry compensation levels. Consistent with this view, our Compensation Committee annually assesses our performance within the context of the industry’s overall performance and internal performance standards and evaluates individual executive officer performance relative to the performance expectations for their respective position and role within our company. In addition, our Compensation Committee benchmarks from time to time the total compensation provided to our executive officers to industry-based compensation practices. While it is our Compensation Committee’s goal to provide compensation opportunities that reflect company and individual performance and that are competitive within industry standards, a specific target market position for executive officer pay levels has not been established.
Setting Executive Compensation
Our Compensation Committee determines compensation for our named executive officers and is comprised of three independent directors: Jeffrey E. Kelter (Chairman), Allan J. Baum and Charles S. Laven. Our Compensation Committee exercises independent discretion in respect of executive compensation matters
219
TABLE OF CONTENTS
and administers our 2004 Equity Incentive Plan (including reviewing and approving equity grants to our executives pursuant to this plan). Our Compensation Committee operates under a written charter adopted by our board of directors, a copy of which is available on our website athttp://www.gkk.com.
Our Compensation Committee has retained FTI Consulting, Inc., or FTI, an outside compensation consulting firm. FTI provides our Compensation Committee and Chief Executive Officer with relevant market data concerning the marketplace, our peer group and other compensation developments. FTI participates in our Compensation Committee meetings and meets with our named executive officers and certain of our directors. Our Compensation Committee has the authority to replace FTI or hire additional consultants at any time. It is important to understand that the compensation market data and ranges provide only a reference point for our Compensation Committee. Depending upon our company’s business and individual performance results, a named executive officer’s total direct compensation may be within, below or above the market range for that position. FTI also provides additional professional services, including strategic advisory and tax planning, to our company and receives market-based compensation with respect to these services. In 2010, we paid approximately $60,445 to FTI in connection with such services.
Our Compensation Committee determines the total compensation and the allocation of such compensation among base salary, annual incentive awards and long-term incentive compensation as well as allocation of such items among cash and equity compensation for our Chief Executive Officer. With respect to the compensation of other named executive officers, our Compensation Committee solicits recommendations from our Chief Executive Officer regarding compensation and reviews his recommendations. We do not have a pre-established policy for the allocation between either cash and non-cash compensation or annual and long-term incentive compensation.
Our Compensation Committee met three times during 2010 to evaluate executive performance and to monitor market conditions in light of these goals and objectives, to solicit input from the compensation consultant on market practices and new developments and to review our compensation practices. During this decision making process, our Compensation Committee reviews tally sheets that detail the executive officer’s compensation history. The tally sheets help our Compensation Committee to track changes in an executive officer’s total direct compensation from year to year and to remain aware of the compensation historically paid to each executive officer. Ultimately, we rely upon our judgment about each of our named executive officers and not on formulas or short-term changes in business performance or our stock price. The key factors affecting our judgment are total return to stockholders, or TRS, change in earnings and funds from operations, actual performance against the financial, operational and strategic goals we set at the beginning of the year, the nature and level of responsibility of each executive officer and the integrity and effort with which such executive officer conducts his responsibilities. Our Compensation Committee regularly reports to our board of directors.
What Our Compensation Program is Designed to Reward
Our Compensation Committee has designed our compensation program to (i) attract and retain talented individuals capable of performing at a high level in a market that remains highly competitive and who have the motivation, experience and skills necessary to lead our company effectively, (ii) provide performance-based compensation that creates a strong alignment of management and stockholder interest to create long-term stockholder value, (iii) motivate our executives to manage our business to meet and appropriately balance our short- and long-term objectives, (iv) hold executives accountable for their level of success in attaining specific goals set for them individually, (v) maintain flexibility and discretion to allow us to recognize the unique characteristics of our operations and strategy, and our prevailing business environment, as well as changing labor market dynamics, and (vi) achieve an appropriate risk-reward balance in our compensation programs that does not incentivize unnecessary or excessive risk taking. We expect our company to perform at the highest levels of the diversified REIT sectors. Our Compensation Committee rewards the achievement of specific annual, long-term and strategic goals of both our company and the individual executive. Our Compensation Committee measures performance on an absolute basis against financial and other measures and on a relative basis by comparing our company’s performance against other diversified REITs and against the mortgage and office REIT industries generally. Comparative performance is an important metric since market conditions may affect the ability to meet specific performance criteria.
220
TABLE OF CONTENTS
Role of Executive Officers in Compensation Decisions
Our Chief Executive Officer annually reviews the performance of each of the other named executive officers. He also considers the recommendations of the compensation consultant. Based on this review and input, our Chief Executive Officer makes compensation recommendations to our Compensation Committee for all named executive officers other than himself, including recommendations for performance targets, base salary adjustments, the discretionary components of our short-term cash incentive compensation, and long-term equity-based incentive awards. Our Compensation Committee considers these recommendations along with data and input provided by its other advisors. Our Compensation Committee retains full discretion to set all compensation for the named executive officers.
Measuring 2010 Performance
During 2008 and 2009, the global capital markets experienced tremendous volatility and a wide-ranging lack of liquidity. The impact of the global credit crisis on our sector was acute. Despite signs of improvement in economic conditions in 2010 and to date in 2011, market conditions remain challenging and we continue to find it difficult to obtain cost-effective debt capital to finance new investment activity or to refinance maturing debt. Our stock price experienced a decrease of approximately 11% in 2010, and TRS was approximately 80% and -90% during the respective two- and three-year periods ended December 31, 2010.
Despite the adverse market conditions, we remained focused on improving our consolidated balance sheet by reducing leverage, generating liquidity from existing assets, actively managing portfolio credit, accretively re-investing repayments in loan and CMBS investments and renewing expired leases. As a result, we increased our unrestricted cash on our balance sheet during the year by approximately $82.5 million to $220.8 million at December 31, 2010, increased restricted cash available for portfolio investments within two of our three CDOs by approximately $63.1 million to approximately $90.0 million at December 31, 2010 and reduced our secured and other debt by approximately $187.9 million to approximately $4.9 billion at December 31, 2010. Specifically, we achieved the following select objectives in 2010:
| • | During 2010, we repurchased $39.0 million of CDO bonds previously issued by two of our three CDOs, generating gains on early extinguishment of debt of approximately $19.4 million. |
| • | In June 2010, we redeemed the remaining $52.5 million of junior subordinated notes liabilities by transferring to the holders of the junior subordinated notes an equivalent par value amount of various classes of bonds issued by our CDOs which were previously purchased by us in the open market and cash equivalents of $5.0 million. This redemption eliminated the liability for our junior subordinated notes from our consolidated financial statements, which had an original balance of $150.0 million. |
| • | In November 2010, we completed a tender offer for approximately 23.4% of the outstanding shares of our Series A preferred stock or 1,074,178 shares at $15.00 per preferred share. Subsequent to the tender, 3,525,822 shares remain outstanding. Net of expenses, the tender offer used approximately $16.6 million of unrestricted cash and resulted in the extinguishment of accrued preferred stock dividends of approximately $4.4 million for no additional proceeds. The excess of the carrying amount of tendered preferred stock over the consideration resulted in an increase in book value to the common stockholders of approximately $13.7 million. |
| • | In December 2010, we closed on the sale of certain investments to SL Green, including our 45 percent joint venture interests in the leased fee at 885 Third Avenue and 2 Herald Square, the entire leased fee interest in 292 Madison Avenue and a $38.7 million mezzanine loan secured by equity interests in 601 West 26th Street, New York, NY, also known as the Starrett-Lehigh Building, for an aggregate price of $390.8 million, including the assumption of $265.6 million of mortgage debt. Net of associated costs and including the release of approximately $6.0 million posted as cash collateral for related letters of credit, these transactions increased our unrestricted corporate liquidity by approximately $89.9 million and increased our restricted cash in one of our CDOs by approximately $38.9 million. |
221
TABLE OF CONTENTS
As discussed above, our Compensation Committee has designed our equity compensation program to (i) attract and retain talented individuals capable of performing at a high level in a market that remains highly competitive and who have the motivation, experience and skills necessary to lead our company effectively, (ii) provide performance-based compensation that creates a strong alignment of management and stockholder interest to create long-term stockholder value, (iii) motivate our executives to manage our business to meet and appropriately balance our short- and long-term objectives, (iv) hold executives accountable for their level of success in attaining specific goals set for them individually, (v) maintain flexibility and discretion to allow us to recognize the unique characteristics of our operations and strategy, and our prevailing business environment, as well as changing labor market dynamics, and (vi) achieve an appropriate risk-reward balance in our compensation programs that does not incentivize unnecessary or excessive risk taking. In 2010, we did not make any such equity awards to our named executive officers in respect of their 2010 performance, except for the January 2010 restricted shares grant made to Roger M. Cozzi, our Chief Executive Officer.
Elements of Our Compensation Program and Why We Chose Each Element
Our executive compensation program has been structured to provide short- and long-term incentives that promote continuing improvements in our financial performance and return to our stockholders. The elements of our executive compensation are primarily comprised of three elements: annual base salary; annual incentive awards, which include cash and equity bonuses; and long-term equity incentives:
| • | Annual Base Salaries. Our Compensation Committee pays our named executive officers’ annual base salaries to compensate them for services rendered during the fiscal year. In case of each of our named executive officers, except Robert R. Foley, our Chief Operating Officer, and Michael G. Kavourias, our Chief Legal Officer, annual base salaries are paid in accordance with the employment agreements between us and such named executive officers. Cash incentive bonuses and equity incentive awards are discretionary, thereby allowing for the opportunity for greater compensation when performance is superior and lower compensation when performance is less successful. |
| • | Annual Incentive Awards. Annual incentive awards are provided in the form of cash and equity bonuses designed to focus a named executive officer on achieving key corporate objectives (both individual and company-based), to motivate certain desired individual behaviors and to reward substantial achievement of these objectives and individual goals. While our Compensation Committee does not set specific fixed targets that entitle the executive officers to formulaic bonuses, the named executive officers are made aware, at the beginning of the year, of the financial, operational and strategic goals our Compensation Committee will consider when evaluating corporate and individual performance and determining annual incentive awards. Base salaries are reviewed annually, but are not automatically increased if we feel that incentive awards are more appropriate means of rewarding and incentivizing performance. |
| • | Long-Term Incentives. Long-term equity incentives have historically been provided to our named executive officers through the grant of restricted stock awards, stock options or performance awards pursuant to our 2004 Equity Incentive Plan. The grant of equity awards links a named executive officer’s compensation and net worth directly to the performance of our stock price. This encourages our named executive officers to make decisions with an ownership mentality. The vesting provisions of these equity awards (generally two to four years) are designed to act as a retention device and to provide a strong incentive to the executives to increase stockholder value long after they performed the services in the year for which the equity awards were granted. In January 2010, we granted 37,984 shares of restricted stock to Roger M. Cozzi as an incentive award for his performance during 2009. We did not make any other equity awards to the named executive officers in 2010. |
Our compensation program does not include any significant personal benefits or perquisites for our named executive officers beyond benefits offered to our employees generally. We do not maintain any retirement or pension plans for our named executive officers or other employees, other than our 401(k) plan that is available to our employees generally.
222
TABLE OF CONTENTS
Our Compensation Committee has full authority to administer and interpret our 2004 Equity Incentive Plan, to authorize the granting of awards, to determine the eligibility of employees, directors, executive officers, advisors, consultants and other personnel, to determine the terms, provisions and conditions of each award, and to take any other actions and make all determinations that it deems necessary or appropriate in connection with our 2004 Equity Incentive Plan or the administration or interpretation thereof.
How Each Element and Our Decisions Regarding Each Element Fit Into Our Overall Compensation Objectives and Affect Decisions Regarding Other Elements
Our compensation program seeks to reward our named executive officers for superior performance, which is competitive with the compensation paid to named executive officers at other public REITs and other private commercial real estate investors in the New York City commercial real estate market, while closely aligning the interests of our named executive officers with the interests of our stockholders. In making equity compensation decisions, our Compensation Committee considers various measures of company and industry performance, including (i) TRS (over the prior one-, two- and three-year periods), (ii) growth in FFO per share, (iii) leasing performance and occupancy levels, (iv) capital markets performance and maintenance of liquidity, and (v) certain material corporate events consummated during the applicable fiscal year. Consistent with this approach, our Compensation Committee grants equity awards to our named executive officers to reward our executives for achievement of financial and other performance (both company and individual based) during the last completed fiscal year. Our Compensation Committee also makes these awards to act as a retention tool and to provide continued and additional incentives to maximize our stock price and thereby more closely align the economic interests of our named executive officers with those of our stockholders. Through the elements of our compensation program, our Compensation Committee seeks to maintain a competitive compensation package for each executive, while being sensitive to our fiscal year budget and the impact of share dilution in making such compensation awards.
Other Matters
Tax and Accounting Treatment. Our Compensation Committee reviews and considers the deductibility of executive compensation under Section 162(m) of the Internal Revenue Code of 1986, as amended, or the Code. Section 162(m) limits the deductibility on our tax return of compensation over $1.0 million to any of our named executive officers unless, in general, the compensation is paid pursuant to a plan which is performance-related, non-discretionary and has been approved by our stockholders. Our Compensation Committee’s policy with respect to Section 162(m) is to make every reasonable effort to ensure that compensation is deductible to the extent permitted while simultaneously providing our executives with appropriate compensation for their performance. We paid compensation to certain of our named executive officers during 2010, a portion of which may be nondeductible under the limitations set forth in Section 162(m). Our Compensation Committee may make compensation payments that are not fully deductible if in its judgment such payments are necessary to achieve the objectives of our compensation program.
On October 22, 2004, the American Jobs Creation Act of 2004 was signed into law, changing the tax rules applicable to nonqualified deferred compensation arrangements. While the final regulations have not become effective yet, we believe we are operating in good faith compliance with the statutory provisions that were effective January 1, 2005.
Beginning on August 2, 2004 we began accounting for stock-based payments through our 2004 Equity Incentive Plan in accordance with the requirements of FASB ASC Topic 718.
Adjustments for Certain Items. Our Compensation Committee has not considered whether it would attempt to recover compensation awards or payments based on our financial performance where our financial statements are restated in a downward direction sufficient to reduce the amount of such awards or payments that should have been made or paid under applicable criteria.
223
TABLE OF CONTENTS
Other Policies
We do not have any policy in place regarding minimum ownership requirements for either our named executive officers or directors. We do not have any policy in place regarding the ability of our named executive officers or directors to engage in hedging activities with respect to our common stock.
Compensation Risk Assessment
Our Compensation Committee oversaw the performance of a risk assessment of our executive compensation programs to ascertain any potential material risks that may be created by the compensation program. Because performance-based incentives play a large role in our executive compensation program, it is important to ensure that these incentives do not result in our named executive officers (as defined below in “— Summary Compensation Table”) taking actions that may conflict with our long term interests. Our Compensation Committee considered the findings of the assessment conducted internally and concluded that our compensation programs are designed and administered with the appropriate balance of risk and reward in relation to its overall business strategy and do not encourage executives to take unnecessary or excessive risks. Our Compensation Committee considered the following attributes of the program:
| • | the balance between short- and long-term incentives; |
| • | consideration of qualitative as well as quantitative performance factors in determining compensation payouts, including minimum and maximum performance thresholds, funding that is based on actual results measured against pre-approved financial and operational goals and metrics that are clearly defined in all plans; |
| • | the use of different types of equity compensation awards that provide a balance of incentives; |
| • | incentive compensation with a large stock component where value is best realized through long-term appreciation of stockholder value; and |
| • | incentive compensation components that are paid or vest over an extended period. |
Our Compensation Committee focuses primarily on the compensation of our named executive officers because risk-related decisions depend predominantly on their judgment. Our Compensation Committee believes that risks arising from our policies and practices for compensation employees are not reasonably likely to have a material adverse effect on our company.
Compensation Committee Report
The Compensation Committee (the “Compensation Committee”) of the board of directors of Gramercy Capital Corp. (the “Company”) has reviewed and discussed the Compensation Discussion and Analysis required by Item 402(b) of Regulation S-K with management and, based on such review and discussions, the Compensation Committee recommended to the board of directors that the Compensation Discussion and Analysis be included in the Company’s annual proxy statement and the Company’s Annual Report on Form 10-K for the year ended December 31, 2010.
Submitted by the Compensation Committee
Jeffrey E. Kelter (Chairman)
Allan J. Baum
Charles S. Laven
September 22, 2011
224
TABLE OF CONTENTS
Summary Compensation Table
Prior to the Internalization, because the management agreement provided that the Manager assumed principal responsibility for managing our affairs, our executive officers, who were employees of the Manager, which was a wholly-owned subsidiary of SL Green Realty Corp. or its affiliates, generally did not receive cash compensation from us for serving as our executive officers. However, in their capacities as officers or employees of the Manager or its affiliates, under the terms of the management agreement, they devoted all of their time to our affairs as was required for the performance of the duties of the Manager. Prior to the Internalization, the Manager informed us that, because the services performed by its officers or employees in those capacities as such may not be performed exclusively for us, it may not be able to segregate and identify that portion of the compensation awarded to, earned by or paid to our executive officers by the Manager or its affiliates, including SL Green Realty Corp., that related to their services to us.
The following table* sets forth information regarding the compensation paid to, and the compensation expense we recognized with respect to, our named executive officers. It is noted that a number of the executive compensation arrangements described below may be subject to adjustment for changes to be made in light of Section 409A of the Code.
| | | | | | | | | | | | | | |
| | | | | | | | | | | | | | |
| Name And Principal Position | | Year | | Salary
($) | | Bonus
($) | | Stock
Awards(1) | | Option
Awards(2) | | All Other Compensation(3) | | Total |
Roger M. Cozzi
Chief Executive Officer | | | 2010 | | | $ | 500,000 | | | $ | 1,300,000 | | | $ | 105,000 | | | $ | — | | | $ | 4,860 | | | $ | 1,909,860 | |
| | | 2009 | | | | 326,923 | | | | 1,050,000 | | | | — | | | | — | | | | 4,860 | | | | 1,381,783 | |
| | | 2008 | | | | — | | | | — | | | | 278,000 | | | | 81,000 | | | | — | | | | 359,000 | |
Timothy J. O’Connor
President | | | 2010 | | | $ | 400,000 | | | $ | 575,000 | | | $ | — | | | $ | — | | | $ | — | | | $ | 975,000 | |
| | | 2009 | | | | 261,539 | | | | 575,000 | | | | — | | | | — | | | | — | | | | 836,539 | |
| | | 2008 | | | | — | | | | — | | | | 172,300 | | | | — | | | | — | | | | 172,300 | |
Robert R. Foley
Chief Operating Officer | | | 2010 | | | $ | 400,000 | | | $ | 325,000 | | | $ | — | | | $ | — | | | $ | — | | | $ | 725,000 | |
| | | 2009 | | | | 261,539 | | | | 275,000 | | | | — | | | | — | | | | — | | | | 536,539 | |
| | | 2008 | | | | — | | | | — | | | | 249,986 | | | | — | | | | — | | | | 249,986 | |
Jon W. Clark
Chief Financial Officer | | | 2010 | | | $ | 250,000 | | | $ | 300,000 | | | $ | — | | | $ | — | | | $ | — | | | $ | 550,000 | |
| | | 2009 | | | | 148,108 | | | | 255,000 | | | | — | | | | — | | | | — | | | | 403,108 | |
| | | 2008 | | | | — | | | | — | | | | — | | | | — | | | | — | | | | — | |
Michael G. Kavourias
Executive Vice President
and Chief Legal Officer | | | 2010 | | | $ | 385,000 | | | $ | 475,000 | | | $ | — | | | $ | — | | | $ | — | | | $ | 860,000 | |
| | | 2009 | | | | 241,346 | | | | 575,000 | | | | — | | | | — | | | | 16,565 | | | | 832,911 | |
| | | 2008 | | | | — | | | | — | | | | — | | | | — | | | | — | | | | — | |
| * | The columns for “Non-Equity Incentive Plan Compensation” and “Change in Pension Value and Nonqualified Deferred Compensation Earnings” have been omitted because they are not applicable. |
| (1) | Amounts shown do not reflect compensation actually received by the named executive officers. Instead, the amounts shown are the aggregate grant date fair value of the restricted stock awards and/or LTIP units issued to the executives in 2010, 2009 and 2008, respectively, as determined pursuant to FASB ASC Topic 718. The assumptions used to calculate the grant date value of such awards for 2010, 2009 and 2008 are set forth under Notes 2 and 15 of the Notes to Consolidated Financial Statements included in our Annual Reports on Form 10-K for the years ended December 31, 2010, 2009 and 2008, which were filed with the SEC on September 22, 2011, March 17, 2010 and March 16, 2009, respectively. |
| (2) | In accordance with SEC rules, amounts shown reflect the aggregate grant date fair value of stock options issued to Mr. Cozzi in 2008, as determined pursuant to FASB ASC Topic 718 and do not reflect the compensation costs recognized by us during the fiscal years ended December 31, 2009, 2008 and 2007. The assumptions used to calculate the value of option awards granted in 2008 are set forth under Note 2 of the Notes to Consolidated Financial Statements included in our Annual Report on Form 10-K for the year ended December 31, 2008, which was filed with the SEC on March 16, 2009. No stock option awards were issued to the named executive officers in 2009. |
225
TABLE OF CONTENTS
| (3) | Represents reimbursement of term life insurance premiums pursuant to Mr. Cozzi’s employment contract and cash payments made with respect to estimated tax payments due on the restricted stock awards to Mr. Kavourias. |
Grants of Plan-Based Awards
The following table sets forth certain information with respect to each grant of an award made to a named executive officer in the fiscal year ended December 31, 2010.
| | | | | | |
| Name | | Grant Date | | All Other
Stock Awards;
Number of Shares of
Stock or Units
(#) | | Grant Date
Fair Value of
Equity Awards
($) |
Roger M. Cozzi
| | | 01/05/2010 | | | | 37,984 | (1) | | $ | 105,000 | |
Timothy J. O’Connor
| | | — | | | | — | | | $ | — | |
Robert R. Foley
| | | — | | | | — | | | $ | — | |
Jon W. Clark
| | | — | | | | — | | | $ | — | |
Michael G. Kavourias
| | | — | | | | — | | | $ | — | |
| (1) | Reflects a restricted stock award granted to the named executive officer on January 5, 2010 in connection with Mr. Cozzi’s performance during 2009, which vests on January 20, 2011. |
Outstanding Equity Awards
The following table sets forth certain information with respect to all outstanding equity awards held by each named executive officer at the fiscal year ended December 31, 2010.
| | | | | | | | | | | | | | | | | | |
| | | | | | | | | | | | | | | | | | |
| | Option Awards | | Stock Awards |
| Name | | Number of
Securities
Underlying
Unexercised
Options (#)
Exercisable | | Number of
Securities
Underlying
Unexercised
Options (#)
Unexercisable | | Equity
Incentive
Plan Awards:
Number of
Securities
Underlying
Unexercised
Unearned
Options (#) | | Option
Exercise
Price ($) | | Option
Expiration
Date | | Number of
Shares or
Units of
Stock That
Have Not
Vested (#)
| | Market Value
of Shares or
Units of Stock
That Have Not
Vested ($)
| | Equity
Incentive Plan
Awards:
Number of
Unearned
Shares, Units
or Other
Rights That
Have Not
Vested (#) | | Equity
Incentive Plan
Awards:
Market or
Payout Value of
Unearned
Shares, Units or
Other Rights
That Have Not
Vested ($) |
| Roger M. Cozzi | | | 200,000 | (1) | | | 100,000 | (1) | | | | | | $ | 0.80 | | | | 10/27/2018 | | | | — | | | | — | | | | — | | | | — | |
| | | | — | | | | — | | | | — | | | | — | | | | — | | | | 43,334 | (2) | | $ | 100,102 | | | | — | | | | — | |
| | | | — | | | | — | | | | — | | | | — | | | | — | | | | 37,984 | (3) | | $ | 87,743 | | | | 43,334 | (2) | | $ | 100,102 | |
| | | | — | | | | — | | | | — | | | | — | | | | — | | | | — | | | | — | | | | 500,000 | (4) | | $ | 1,155,000 | |
| Timothy J. O’Connor | | | — | | | | — | | | | — | | | | — | | | | — | | | | 21,667 | (4) | | $ | 50,051 | | | | | | | | | |
| | | | — | | | | — | | | | — | | | | — | | | | — | | | | — | | | | — | | | | 21,667 | (5) | | $ | 50,051 | |
| | | | — | | | | — | | | | — | | | | — | | | | — | | | | — | | | | — | | | | 150,000 | (6) | | $ | 346,500 | |
| Robert R. Foley | | | 113,461 | (7) | | | — | | | | — | | | $ | 15.00 | | | | 08/02/2014 | | | | — | | | | — | | | | — | | | | — | |
| | | | 27,015 | (8) | | | — | | | | — | | | $ | 19.85 | | | | 04/20/2015 | | | | — | | | | — | | | | — | | | | — | |
| | | | 27,015 | (9) | | | — | | | | — | | | $ | 30.89 | | | | 01/02/2017 | | | | — | | | | — | | | | — | | | | — | |
| | | | 16,209 | (10) | | | — | | | | — | | | $ | 24.31 | | | | 12/31/2017 | | | | — | | | | — | | | | — | | | | — | |
| Jon W. Clark | | | 5,403 | (11) | | | — | | | | — | | | $ | 26.82 | | | | 06/25/2017 | | | | — | | | | — | | | | — | | | | — | |
| | | | 5,403 | (10) | | | | | | | | | | $ | 22.50 | | | | 12/31/2017 | | | | | | | | | | | | | | | | | |
| Michael G. Kavourias | | | 12,966 | (12) | | | — | | | | — | | | $ | 20.75 | | | | 10/17/2015 | | | | — | | | | — | | | | — | | | | — | |
| | | | 5,403 | (9) | | | — | | | | — | | | $ | 27.72 | | | | 01/03/2017 | | | | — | | | | — | | | | — | | | | — | |
| | | | 10,806 | (13) | | | — | | | | — | | | $ | 20.87 | | | | 08/01/2017 | | | | — | | | | — | | | | — | | | | — | |
| | | | 10,806 | (10) | | | — | | | | — | | | $ | 22.50 | | | | 12/31/2017 | | | | — | | | | — | | | | — | | | | — | |
| (1) | Includes an option award granted on October 27, 2008, which vests in three equal annual installments beginning on December 31, 2009. |
226
TABLE OF CONTENTS
| (2) | Includes restricted stock awards granted on October 27, 2008, which vests in three equal annual installments beginning on December 31, 2009. The vesting of one-half of the shares scheduled to vest each year is further conditioned upon the attainment of specified performance-based vesting criteria. For a discussion of the performance-based vesting criteria, see “— Potential Payments Upon Termination or Change of Control — Restricted Stock Award Agreements.” |
| (3) | Includes a restricted stock award granted on January 5, 2010, which vests on January 20, 2011. |
| (4) | Includes LTIP Units granted on October 27, 2008 pursuant to our Amended and Restated Equity Incentive Plan, which will vest on December 31, 2011 if our stock price on such date is equal to or greater than $5.00 per share. |
| (5) | Includes restricted stock awards granted on November 13, 2008, which vests in three equal annual installments beginning on December 31, 2009. The vesting of one-half of the shares scheduled to vest each year is further conditioned upon the attainment of specified performance-based vesting criteria. For a discussion of the performance-based vesting criteria, see “— Potential Payments Upon Termination or Change of Control — Restricted Stock Award Agreements.” |
| (6) | Includes LTIP Units granted on November 13, 2008 pursuant to our Amended and Restated 2004 Equity Incentive Plan, which will vest on December 31, 2011 if our stock price on such date is equal to or greater than $5.00 per share. |
| (7) | Includes an option award granted on August 8, 2004, which vested in four equal annual installments beginning on June 30, 2005. |
| (8) | Includes an option award granted on April 20, 2005, which vested in three equal annual installments beginning on April 20, 2006. |
| (9) | Includes an option award granted on January 2, 2007, which vested in three equal annual installments beginning on January 2, 2008. |
| (10) | Includes an option award granted on December 31, 2007, a third of which vested immediately upon grant and the remaining portion vested in two equal annual installments beginning on December 31, 2008. |
| (11) | Includes an option award granted on June 28, 2007, which vested in three equal annual installments beginning on June 28, 2008. |
| (12) | Includes an option award granted on October 17, 2005, which vested in three equal annual installments beginning on October 17, 2006. |
| (13) | Includes an option award granted on August 1, 2007, which vested in three equal annual installments beginning on December 31, 2008. |
Option Exercises and Stock Vested
The following table sets forth certain information with respect to the exercise of stock options, stock appreciation rights, or SARs, and similar instruments, and the vesting of stock, including restricted stock, restricted stock units and similar instruments for each named executive officer during the fiscal year ended December 31, 2010.
| | | | | | | | |
| | Option Awards | | Stock Awards |
| Name | | Number of
Shares
Acquired on
Exercise (#) | | Value
Realized on
Exercise(1)
($) | | Number of
Shares
Acquired on
Vesting (#) | | Value
Realized on
Vesting(2)
($) |
| Roger M. Cozzi | | | — | | | | — | | | | 86,666 | | | $ | 200,198 | |
| Timothy J. O’Connor | | | — | | | | — | | | | 43,332 | | | $ | 100,097 | |
| Robert R. Foley | | | — | | | | — | | | | 4,390 | | | $ | 13,038 | |
| Jon W. Clark | | | — | | | | — | | | | 833 | | | $ | 1,116 | |
| Michael G. Kavourias | | | — | | | | — | | | | — | | | $ | — | |
| (1) | Amounts reflect the difference between the exercise price of the option and the market price at the time of exercise. |
| (2) | Amounts reflect the market value of the stock on the day the stock vested. |
227
TABLE OF CONTENTS
Pension Benefits
Our named executive officers received no benefits in fiscal year 2010 from us under defined pension or defined contribution plans. See “— Summary Compensation Table.”
Nonqualified Deferred Compensation
Our company does not have a nonqualified deferred compensation plan that provides for deferral of compensation on a basis that is not tax-qualified for our named executive officers.
Potential Payments upon Termination or Change in Control
General
Our company maintains employment agreements with Messrs. Cozzi, O’Connor, and Clark, as well as separate severance agreements with Messrs. Cozzi and O’Connor and a separate retention agreement with Mr. Kavourias. This section of the proxy statement discusses the amount of compensation payable to each named executive officer upon termination of the executive officer (i) by us with “Cause,” (ii) by the named executive officer without “Good Reason,” (iii) by us without “Cause,” (iv) by the named executive officer with “Good Reason,” (v) in the event of death or “Disability” of the named executive officer or (vi) in connection with a “Change-in-Control” of our company (each, a “Triggering Event”) as described below. The following discussion assumes such termination was effective as of December 31, 2010 and estimates the amounts that would be paid out in such circumstances.
Our Compensation Committee believes that it is fair to provide accelerated vesting of equity grants upon a Change-in-Control. Very often, senior managers lose their jobs in connection with a Change-in-Control. By agreeing to accelerated vesting of equity grants in the event of a Change-in-Control, our Compensation Committee believes we can reinforce and encourage the continued attention and dedication of senior management to their assigned duties without distraction in the face of an actual or threatened Change-in-Control and ensure that management is motivated to negotiate the best merger consideration for our stockholders.
Employment and Retention Agreements
Each of Roger M. Cozzi, Timothy J. O’Connor and Jon W. Clark entered into employment agreements with our company. Each of Mr. Cozzi and Mr. O’Connor’s employment agreements were amended on July 28, 2011. On August 31, 2011, Michael G. Kavourias entered into a retention agreement, effective as of July 28, 2011, with our company. Illustrated below are the severance provisions associated with each Triggering Event discussed above.
Roger M. Cozzi. Mr. Cozzi’s employment agreement has a term commencing on October 28, 2008 and ending on June 30, 2012. The agreement provides for an annual salary of $500,000 and such discretionary annual bonuses as we, in our sole discretion, may deem appropriate to reward Mr. Cozzi for job performance. The target annual bonus for 2011 will be at least $1.3 million, to be paid in a lump sum on or prior to December 31, 2011, and for the period from January 1, 2012 through June 30, 2012 will be at least $650,000, to be paid within 30 days following June 30, 2012. Under the agreement, we are also obligated to maintain a life insurance policy for the benefit of Mr. Cozzi’s beneficiaries in the face amount of $5 million, or if not available at reasonable rates, to self-insure Mr. Cozzi up to the maximum cash severance payable under the agreement. If Mr. Cozzi is terminated for any reason prior to June 30, 2012, under the agreement he will be subject to the following obligations: (i) noncompetition with us for one year (or three months if his employment is terminated due to a non-renewal of the term of employment by us or terminated for Cause (as defined in Mr. Cozzi’s employment agreement) not related to our business, or six months if Mr. Cozzi terminates his employment after the payment of a discretionary bonus for any year in an amount less than $800,000); (ii) non-solicitation of our employees for two years; and (iii) non-disparagement of our company and non-interference with our business for one year. The employment agreement also provides for the following payments and benefits to Mr. Cozzi in connection with the termination of his employment with us:
| • | Termination with Cause or without Good Reason. If Mr. Cozzi’s employment is terminated by us with “Cause” or by Mr. Cozzi without Good Reason (as defined in Mr. Cozzi’s employment agreement), Mr. Cozzi shall be entitled to receive earned and accrued but unpaid base salary, but we shall have no further obligations following such termination. |
228
TABLE OF CONTENTS
| • | Termination without Cause or with Good Reason. If Mr. Cozzi’s employment is terminated by us without “Cause” or by Mr. Cozzi for Good Reason, Mr. Cozzi will receive (i) annual base salary for a period of 12 months following termination and (ii) a prorated annual bonus and an additional 12-month performance bonus, subject to certain formula. Mr. Cozzi will continue to receive his medical and welfare benefits for 12 months, and all of his unvested and unexercisable restricted stock, options or other equity-based awards that were granted as payment of a cash bonus will fully vest or become exercisable on the date of termination. Mr. Cozzi will also have 12 months of additional vesting for his outstanding restricted stock, options or other equity-based awards and any then vested unexercised stock options will remain exercisable until the earlier of the expiration of their term or the second January 1 following the termination date. If such termination occurs in connection with or within 18 months after a Change-in-Control (as defined in Mr. Cozzi’s employment agreement), then Mr. Cozzi will be entitled to (i) a single lump-sum payment of an amount equal to (a) 24 months of annual base salary and (b) a prorated bonus annual bonus and an additional 24-month performance bonus, subject to certain formula, and (ii) the other payments and benefits described above for a period of 24 months following termination. |
| • | Termination upon Death. If Mr. Cozzi’s employment is terminated by us upon his death, his estate will receive (i) annual base salary for a period of 12 months following termination and (ii) a prorated annual bonus, subject to certain conditions. In addition, all of Mr. Cozzi’s unvested and unexercisable restricted stock, options or other equity-based awards that were granted as payment of a cash bonus will fully vest or become exercisable on the date of termination and he will be entitled to 12 months of additional vesting of his outstanding restricted stock, options or other equity-based awards and any then vested unexercised stock options will remain exercisable until the earlier of the expiration of their term or the second January 1 following the termination date. |
| • | Termination upon Disability. If Mr. Cozzi’s employment is terminated by us upon his Disability (as defined in Mr. Cozzi’s employment agreement), Mr. Cozzi will receive (i) annual base salary for a period of 12 months following termination and (ii) a prorated annual bonus and an additional 12-month performance bonus, subject to certain conditions. Mr. Cozzi will continue to receive his medical and welfare benefits for 12 months, and all of his unvested and unexercisable restricted stock, options or other equity-based awards that were granted as payment of a cash bonus, will fully vest or become exercisable on the date of termination. Mr. Cozzi will also have 12 months of additional vesting for his outstanding restricted stock, options or other equity-based awards and any then vested unexercised stock options will remain exercisable until the earlier of the expiration of their term or the second January 1 following the termination date. |
The following table illustrates Mr. Cozzi’s potential payment and other benefits upon termination of his employment or Change-in-Control of our company under his employment agreement.
| | | | | | | | | | |
| Roger M. Cozzi | | Base
Salary | | Bonus | | Medical and
Welfare Benefits | | Accelerated
Equity(1) | | Total |
| With Cause or Without Good Reason | | | — | | | | — | | | | — | | | | — | | | | �� | |
| Without Cause or With Good Reason | | $ | 500,000 | | | $ | 1,300,000 | | | $ | 20,716 | | | $ | 828,602 | | | $ | 2,649,318 | |
| Death | | $ | 500,000 | | | $ | 1,300,000 | | | | — | | | $ | 828,602 | | | $ | 2,628,602 | |
| Disability | | $ | 500,000 | | | $ | 1,300,000 | | | $ | 20,716 | | | $ | 828,602 | | | $ | 2,649,318 | |
| Without Cause or With Good Reason Following Change-in-Control | | $ | 1,000,000 | | | $ | 2,600,000 | | | $ | 41,432 | | | $ | 828,602 | | | $ | 4,470,034 | |
| (1) | Upon a hypothetical termination on December 31, 2010, Mr. Cozzi would be entitled to 12 months of additional vesting of any outstanding time-based restricted stock, stock option awards or LTIP awards. Accordingly, Mr. Cozzi’s accelerated equity value includes the assumed acceleration of (i) 43,334 shares of time-based restricted stock, (ii) options to purchase 100,000 shares of our common stocks with an exercise price of $0.80 per share and (iii) 250,000 LTIP Units. |
229
TABLE OF CONTENTS
Timothy J. O’Connor. Mr. O’Connor’s employment agreement has a term commencing on November 13, 2008 and ending on June 30, 2012. The agreement provides for an annual salary of $400,000 and such discretionary annual bonuses as we, in our sole discretion, may deem appropriate to reward Mr. O’Connor for job performance. The target annual bonus for 2011 will be at least $575,000, to be paid in a lump sum on or prior to December 31, 2011, and for the period from January 1, 2012 through June 30, 2012 will be at least $287,500, to be paid within 30 days following June 30, 2012. If Mr. O’Connor is terminated for any reason prior to June 30, 2012, under the agreement he will be subject to the following obligations: (i) noncompetition with us for one year (or three months if his employment is terminated due to a non-renewal of the term of employment by us or terminated for Cause (as defined in Mr. O’Connor’s employment agreement) not related to our business, or six months if Mr. O’Connor terminates his employment after the payment of a discretionary bonus for any year in an amount less than $500,000); (ii) non-solicitation of our employees for two years; and (iii) non-disparagement of our company and non-interference with our business for one year. The employment agreement also provides for the following payments and benefits to Mr. O’Connor in connection with the termination of his employment with us:
| • | Termination with Cause or without Good Reason. If Mr. O’Connor’s employment is terminated by us with “Cause” or by Mr. O’Connor without Good Reason (as defined in Mr. O’Connor’s employment agreement), Mr. O’Connor shall be entitled to receive earned and accrued but unpaid base salary, but we shall have no further obligations following such termination. |
| • | Termination without Cause or with Good Reason. If Mr. O’Connor’s employment is terminated by us without “Cause” or by Mr. O’Connor for Good Reason, Mr. O’Connor will receive (i) annual base salary for a period of 12 months following termination and (ii) a prorated annual bonus and an additional 12-month performance bonus, subject to certain formula. Mr. O’Connor will continue to receive his medical and welfare benefits for 12 months, and all of his unvested and unexercisable restricted stock, options or other equity-based awards that were granted as payment of a cash bonus, will fully vest or become exercisable on the date of termination. Mr. O’Connor will also have 12 months of additional vesting for his outstanding restricted stock, option or other equity-based awards and any then vested unexercised stock options will remain exercisable until the earlier of the expiration of their term or the second January 1 following the termination date. If such termination occurs in connection with or within 18 months after a Change-in-Control (as defined in Mr. O’Connor’s employment agreement), then Mr. O’Connor will be entitled to (i) a single lump-sum payment of an amount equal to (a) 24 months of annual base salary and (b) a prorated bonus annual bonus and an additional 24-month performance bonus, subject to certain formula, and (ii) the other payments and benefits described above for a period of 24 months following termination. |
| • | Termination upon Death. If Mr. O’Connor’s employment is terminated by us upon his death, his estate will receive (i) annual base salary for a period of 12 months following termination and (ii) a prorated annual bonus, subject to certain conditions. In addition, all of Mr. O’Connor’s unvested and unexercisable restricted stock, options or other equity-based awards that were granted as payment of a cash bonus will fully vest or become exercisable on the date of termination and he will be entitled to 12 months of additional vesting of his outstanding restricted stock, options or other equity-based awards and any then vested unexercised stock options will remain exercisable until the earlier of the expiration of their term or the second January 1 following the termination date. |
| • | Termination upon Disability. If Mr. O’Connor’s employment is terminated by us upon his Disability (as defined in Mr. O’Connor’s employment agreement), Mr. O’Connor will receive (i) annual base salary for a period of 12 months following termination and (ii) a prorated annual bonus and an additional 12-month performance bonus, subject to certain conditions. Mr. O’Connor will continue to receive his medical and welfare benefits for 12 months, and all of his unvested and unexercisable restricted stock, options or other equity-based awards that were granted as payment of a cash bonus, will fully vest or become exercisable on the date of termination. Mr. O’Connor will also have 12 months of additional vesting for his outstanding restricted stock, options or other equity-based awards and any then vested unexercised stock options will remain exercisable until the earlier of the expiration of their term or the second January 1 following the termination date. |
230
TABLE OF CONTENTS
The following table illustrates Mr. O’Connor’s potential payments and other benefits upon termination of his employment or Change-in-Control of our company under his employment agreement.
| | | | | | | | | | |
| Timothy J. O’Connor | | Base Salary | | Bonus | | Medical and
Welfare Benefits | | Accelerated
Equity(1) | | Total |
| With Cause or Without Good Reason | | | — | | | | — | | | | — | | | | — | | | | — | |
| Without Cause or With Good Reason | | $ | 400,000 | | | $ | 575,000 | | | $ | 20,716 | | | $ | 223,301 | | | $ | 1,219,017 | |
| Death | | $ | 400,000 | | | $ | 575,000 | | | | — | | | $ | 223,301 | | | $ | 1,198,301 | |
| Disability | | $ | 400,000 | | | $ | 575,000 | | | $ | 20,716 | | | $ | 223,301 | | | $ | 1,219,017 | |
| Without Cause or With Good Reason Following Change-in-Control | | $ | 800,000 | | | $ | 1,150,000 | | | $ | 41,432 | | | $ | 223,301 | | | $ | 2,214,733 | |
| (1) | Upon a hypothetical termination on December 31, 2010, Mr. O’Connor would be entitled to 12 months of additional vesting of any outstanding time-based restricted stock, stock option awards or LTIP awards. Accordingly, Mr. O’Connor’s accelerated equity value includes the assumed acceleration of 21,667 shares of time-based restricted stock and 75,000 LTIP Units. |
Jon W. Clark. Mr. Clark’s employment agreement has an initial term of three years, commencing on April 24, 2009 and ending on April 30, 2012, which will automatically renew for successive one-year periods unless either party serves the required notice under the agreement. The agreement provides for an annual salary of $225,000 and such discretionary annual bonuses as we, in our sole discretion, may deem appropriate to reward Mr. Clark for job performance. The target annual bonus for each year after 2009 will be at least $200,000. If Mr. Clark is terminated for any reason prior to April 30, 2012, under the agreement he will be subject to the following obligations: (i) noncompetition with us for six months (or three months if his employment is terminated due to a non-renewal of the term of employment by us for Cause (as defined in Mr. Clark’s employment agreement) not related to our business or if Mr. Clark terminates his employment after the payment of a discretionary bonus for any year in an amount less than $200,000); (ii) non-solicitation of our employees for two years; and (iii) non-disparagement of our company and non-interference with our business for one year. The employment agreement also provides for the following payments and benefits to Mr. Clark in connection with the termination of his employment with us:
| • | Termination with Cause or without Good Reason. If Mr. Clark’s employment is terminated by us with “Cause” or by Mr. Clark without Good Reason (as defined in Mr. Clark’s employment agreement), Mr. Clark shall be entitled to receive earned and accrued but unpaid base salary, but we shall have no further obligations following such termination. |
| • | Termination without Cause or with Good Reason. If Mr. Clark’s employment is terminated by us without Cause or by Mr. Clark for Good Reason, Mr. Clark will receive (i) annual base salary for a period of six months following termination and (ii) a prorated annual bonus and an additional 6-month performance bonus, subject to certain formula. Mr. Clark will continue to receive his medical and welfare benefits for six months, and all of his unvested and unexercisable restricted stock, options or other equity-based awards that were granted as payment of a cash bonus, will fully vest or become exercisable on the date of termination. Mr. Clark will also have 12 months of additional vesting for his outstanding restricted stock, options or other equity-based awards and any then vested unexercised stock options will remain exercisable until the earlier of the expiration of their term or the second January 1 following the termination date. If such termination occurs in connection with or within 18 months after a Change-in-Control (as defined in Mr. Clark’s employment agreement), then Mr. Clark will be entitled to the payments and benefits described above for a period of 12 months following termination. |
| • | Termination upon Death. If Mr. Clark’s employment is terminated by us upon his death, his estate will receive (i) any earned and accrued by unpaid base salary and (ii) a prorated annual bonus, subject to certain conditions. In addition, all of Mr. Clark’s unvested and unexercisable restricted |
231
TABLE OF CONTENTS
| | stock, options or other equity-based awards that were granted as payment of a cash bonus will fully vest or become exercisable on the date of termination and he will be entitled to 12 months of additional vesting of his outstanding restricted stock, options or other equity-based awards and any then vested unexercised stock options will remain exercisable until the earlier of the expiration of their term or the second January 1 following the termination date. |
| • | Termination upon Disability. If Mr. Clark’s employment is terminated by us upon his Disability (as defined in Mr. Clark’s employment agreement), Mr. Clark will receive (i) annual base salary for a period of six months following termination and (ii) a prorated annual bonus and an additional six-month performance bonus, subject to certain conditions. Mr. Clark will continue to receive his medical and welfare benefits for six months, and all of his unvested and unexercisable restricted stock, options or other equity-based awards that were granted as payment of a cash bonus, will fully vest or become exercisable on the date of termination. Mr. Clark will also have 12 months of additional vesting for his outstanding restricted stock, options or other equity-based awards and any then vested unexercised stock options will remain exercisable until the earlier of the expiration of their term or the second January 1 following the termination date. |
The following table illustrates Mr. Clark’s potential payments and other benefits upon termination of employment or Change-in-Control of our company under his employment agreement.
| | | | | | | | | | |
| Jon W. Clark | | Base Salary | | Bonus | | Medical and
Welfare Benefits | | Accelerated
Equity(1) | | Total |
| With Cause or Without Good Reason | | | — | | | | — | | | | — | | | | — | | | | — | |
| Without Cause or With Reason | | $ | 125,000 | | | $ | 150,000 | | | $ | 10,192 | | | $ | 69,300 | | | $ | 354,492 | |
| Death | | | — | | | $ | 150,000 | | | | — | | | $ | 69,300 | | | $ | 219,300 | |
| Disability | | $ | 125,000 | | | $ | 150,000 | | | $ | 10,192 | | | $ | 69,300 | | | $ | 354,492 | |
| Without Cause or With Good Reason Following Change-in-Control | | $ | 250,000 | | | $ | 300,000 | | | $ | 20,384 | | | $ | 69,300 | | | $ | 639,684 | |
| (1) | Upon a hypothetical termination on December 31, 2010, Mr. Clark would be entitled to 12 months of additional vesting of any outstanding time-based restricted stock. Accordingly, Mr. Clark’s accelerated equity value includes the assumed acceleration of 30,000 shares of time-based restricted stock. |
Michael G. Kavourias. Mr. Kavourias’ retention agreement has a term commencing on July 28, 2011 and ending on July 28, 2013. If Mr. Kavourias is terminated with Cause during the term of the retention agreement, under the agreement he will be subject to noncompetition with us for six months; provided, however, that such six-month post-termination restricted period will not apply if Mr. Kavourias is paid aggregate discretionary bonuses for any year during the term of the agreement that are paid on or prior to February 28 of the following year in an amount less than $500,000 and Mr. Kavourias’ employment is terminated on or after February 28 of such following year. The retention agreement also provides for the following payments and benefits to Mr. Kavourias in connection with the termination of his employment with us without Cause (as defined in Mr. Kavourias’ retention agreement) within six months following a Change-in-Control (as defined in Mr. Kavourias’ retention agreement): (i) a severance payment equal to 50% of his prior year’s performance bonus payable in a single lump sum and (ii) 12 months of additional service for purposes of vesting and exercisability under any equity-based award granted to Mr. Kavourias that is subject only to time-based vesting.
The following table illustrates Mr. Kavourias’ potential payments and other benefits upon termination of his employment or Change-in-Control of our company under his retention agreement.
| | | | | | | | | | |
| Michael G. Kavourias | | Base Salary | | Bonus | | Medical and Welfare Benefits | | Accelerated Equity(1) | | Total |
| Without Cause Following Change-in-Control | | | — | | | $ | 237,500 | | | | — | | | $ | 115,500 | | | $ | 353,000 | |
| (1) | Upon a hypothetical termination on December 31, 2010, had his retention agreement been in effect on December 31, 2010, Mr. Kavourias would be entitled to 12 months of additional vesting of any |
232
TABLE OF CONTENTS
| | outstanding time-based restricted stock or stock option awards. Accordingly, Mr. Kavourias’ accelerated equity value includes the assumed acceleration of 50,000 shares of time-based restricted stock. |
Severance Agreements
Roger M. Cozzi. Mr. Cozzi entered into a severance agreement with us pursuant to which he will be entitled to receive certain benefits upon the termination of his employment with us. The severance agreement, as amended on July 28, 2011, provides for a term that will terminate on June 30, 2012. Pursuant to the severance agreement, if Mr. Cozzi’s employment with us is terminated by us without Cause (as defined in Mr. Cozzi’s employment agreement) or by Mr. Cozzi with Good Reason (as defined in Mr. Cozzi’s employment agreement), Mr. Cozzi will be credited with 12 months of additional vesting under all equity awards granted to him by us, other than the LTIP Units granted in connection with the severance agreement. In addition, if Mr. Cozzi’s employment with us is terminated due to his death or Disability (as defined in Mr. Cozzi’s employment agreement), he will be credited with 12 months of additional vesting under all equity awards granted to him by us, other than the LTIP Units granted in connection with the severance agreement. However, if Mr. Cozzi is terminated by us for “Cause” or if he voluntarily terminates his employment with us without “Good Reason”, all of the equity awards previously granted to him that have not yet vested, including restricted stock and options to purchase our common stock, will be forfeited.
Timothy J. O’Connor. Mr. O’Connor entered into a severance agreement with us pursuant to which he will be entitled to receive certain benefits upon the termination of his employment with us. The severance agreement, as amended on July 28, 2011, provides for a term that will terminate on June 30, 2012. Pursuant to the severance agreement, if Mr. O’Connor’s employment with us is terminated by us without Cause (as defined in Mr. O’Connor’s employment agreement) or by Mr. O’Connor with Good Reason (as defined in Mr. O’Connor’s employment agreement), Mr. O’Connor will be credited with 12 months of additional vesting under all equity awards granted to him by us, other than the LTIP Units granted in connection with the severance agreement. In addition, if Mr. O’Connor’s employment with us is terminated due to his death or Disability (as defined in Mr. O’Connor’s employment agreement), he will be credited with 12 months of additional vesting under all equity awards granted to him by us, other than the LTIP Units granted in connection with the severance agreement. However, if Mr. O’Connor is terminated by us for “Cause” or if he voluntarily terminates his employment with us without “Good Reason”, all of the equity awards previously granted to him that have not yet vested, including restricted stock and options to purchase our common stock, will be forfeited.
Equity Compensation Plan Information
The following table summarizes information, as of December 31, 2010, relating to our equity compensation plans pursuant to which shares of our common stock or other equity securities may be granted from time to time.
| | | | | | |
| Plan category | | (a)
Number of securities to be
issued upon exercise of
outstanding options,
warrants and rights | | (b)
Weighted average
exercise price of
outstanding options,
warrants and rights | | (c)
Number of securities
remaining available for
future issuance under equity
compensation plans
(excluding securities
reflected in column (a)) |
| Equity compensation plans approved by security holders(1) | | | 841,377 | | | $ | 11.82 | | | | 1,656,711 | |
| Equity compensation plans not approved by security holders | | | N/A | | | | N/A | | | | N/A | |
| Total | | | 841,377 | | | $ | 11.82 | | | | 1,656,711 | |
| (1) | Includes information related to our Amended and Restated 2004 Equity Incentive Plan. |
233
TABLE OF CONTENTS
Equity Incentive Plan
Prior to the Internalization, our board of directors adopted at the July 2004 meeting of our board of directors, and our stockholders ratified, a long-term, ten-year compensation program, which was later amended and restated, for certain employees, directors, officers, advisors, consultants and other personnel, including the Manager and employees of the Manager and SL Green Realty Corp., and any of our joint venture affiliates or those of SL Green Realty Corp. Of the options or stock that have not been granted at the time of our initial public offering, our Compensation Committee shall have the right to make such awards in the form of equity incentive compensation on such terms as our Compensation Committee may deem appropriate. Subsequent to the Internalization, our Compensation Committee has the authority to administer and interpret our 2004 Equity Incentive Plan, to authorize the granting of awards, to determine the eligibility of certain of our employees, directors, officers, advisors, consultants and other personnel and any of our joint venture affiliates to receive an award, to determine the number of shares of common stock to be converted by each award, to determine the terms, provisions and conditions of each award, to prescribe the form of instruments evidencing awards and to take any other actions and make all other determinations that it deems necessary or appropriate. Our Compensation Committee, in its discretion, may delegate to our Chief Executive Officer all or part of the Committee’s authority and duties with respect to awards; provided, however, that we may not delegate its authority and duties with respect to awards that have been, or will be, granted to our Chief Executive Officer, Chief Operating Officer, Chief Financial Officer, Chief Legal Officer or President or any Executive Vice President.
Subject to adjustment upon certain corporate transactions or events, up to a maximum of 6,250,000 shares, but not more than 10% of the common stock outstanding at the time of the grant, may be subject to stock options, restricted stock, phantom stock and dividend equivalent rights under our 2004 Equity Incentive Plan. The maximum number of shares of common stock that may underlie awards, other than options, to any eligible person in any one year, shall not exceed 200,000, to the extent such awards are intended to qualify as performance-based compensation under Section 162(m) of the Code, or 800,000, to the extent such awards are not intended to qualify as performance-based compensation under Section 162(m) of the Code. In addition, subject to adjustment upon certain corporate transactions or events, a participant may not receive options for more than 300,000 shares of our common stock in one year. Any common stock withheld or surrendered by plan participants in connection with the payment of an option exercise price or in connection with tax withholding will not count towards the share limitation and will be available for issuance under our 2004 Equity Incentive Plan. If an option or other award granted under our 2004 Equity Incentive Plan expires or terminates, the common stock subject to any portion of the award that expires or terminates without having been exercised or paid, as the case may be, will again become available for the issuance of additional awards. Unless our 2004 Equity Incentive Plan is previously terminated by our board of directors, no new award may be granted under our 2004 Equity Incentive Plan after the tenth anniversary of the date that such plan was initially approved by our board of directors. No award may be granted under our 2004 Equity Incentive Plan to any person who, assuming exercise of all options and payment of all awards held by such person, would own or be deemed to own more than 9.8% of our outstanding common stock. At December 31, 2010, approximately 1,656,711 shares of common stock were available for issuance under our 2004 Equity Incentive Plan.
Compensation Committee Interlocks and Insider Participation
There are no Compensation Committee interlocks and none of our employees participate on our Compensation Committee.
234
TABLE OF CONTENTS
ITEM 12. SECURITY OWNERSHIP OF CERTAIN BENEFICIAL OWNERS AND MANAGEMENT AND RELATED STOCKHOLDER MATTERS
Equity Compensation Plan Information
The following table summarizes information, as of December 31, 2010, relating to our equity compensation plans pursuant to which shares of our common stock or other equity securities may be granted from time to time.
| | | | | | |
| Plan category | | (a)
Number of securities to be
issued upon exercise of
outstanding options,
warrants and rights | | (b)
Weighted average
exercise price of
outstanding options,
warrants and rights | | (c)
Number of securities
remaining available for
future issuance under equity
compensation plans
(excluding securities
reflected in column (a)) |
| Equity compensation plans approved by security holders(1) | | | 841,377 | | | $ | 11.82 | | | | 1,656,711 | |
| Equity compensation plans not approved by security holders | | | N/A | | | | N/A | | | | N/A | |
| Total | | | 841,377 | | | $ | 11.82 | | | | 1,656,711 | |
| (1) | Includes information related to our Amended and Restated 2004 Equity Incentive Plan. |
Security Ownership of Certain Beneficial Owners and Management
The following table sets forth the beneficial ownership of our common stock, as of September 1, 2011, for (1) each person known to us to be the beneficial owner of more than 5% of our outstanding common stock based on the Schedule 13D, Schedule 13G, or any amendments thereto, filed with the SEC, (2) each of our directors and nominees for director, (3) each of our named executive officers who is not a director and (4) our directors, nominees for director and executive officers as a group. Except as otherwise described in the notes below, the following beneficial owners have sole voting power and sole investment power with respect to all shares of common stock set forth opposite their respective names.
In accordance with SEC rules, each listed person’s beneficial ownership includes:
| • | all shares the investor actually owns beneficially or of record; |
| • | all shares over which the investor has or shares voting or dispositive control (such as in the capacity as a general partner of an investment fund); and |
| • | all shares the investor has the right to acquire within 60 days (such as upon exercise of options that are currently vested or which are scheduled to vest within 60 days) after September 1, 2011. |
235
TABLE OF CONTENTS
Unless otherwise indicated, all shares are owned directly and the indicated person has sole voting and investment power.
| | | | |
| Name** | | Amount And
Nature of Beneficial
Ownership of
Common Stock | | Percent of
Total(1) |
| SL Green Realty Corp. and SL Green Operating Partnership, L.P. | | | 5,349,320 | (2) | | | 10.70 | % |
| Roger M. Cozzi | | | 704,355 | (3) | | | * | |
| Timothy J. O’Connor | | | 189,833 | | | | * | |
| Robert R. Foley | | | 219,871 | (4) | | | * | |
| Marc Holliday | | | 335,629 | (5) | | | * | |
| Allan J. Baum | | | 156,460 | (6) | | | * | |
| Jeffrey E. Kelter | | | 165,471 | (7) | | | * | |
| Paul J. Konigsberg | | | 156,305 | (8) | | | * | |
| Charles S. Laven | | | 153,831 | (9) | | | * | |
| Jon W. Clark | | | 13,306 | (10) | | | * | |
| Michael G. Kavourias | | | 39,982 | (11) | | | * | |
| All Directors and Executive Officers as a Group (10 Persons) | | | 2,135,043 | | | | 4.25 | % |
| He Zhengxu | | | 4,693,526 | (12) | | | 9.39 | % |
| Kwon Uk Choi | | | 3,800,000 | (13) | | | 7.60 | % |
| Brightline Capital Management, LLC. | | | 3,800,000 | (14) | | | 7.60 | % |
| ** | Unless otherwise indicated, the business address is 420 Lexington Avenue, New York, New York 10170-1881. |
| (1) | As of September 1, 2011, 50,207,365 shares of common stock were outstanding. |
| (2) | Based solely on information contained in Schedule 13G/A filed jointly by SL Green Realty Corp. and SL Green Operating Partnership, L.P. on February 2, 2011. SL Green Realty Corp. and SL Green Operating Partnership, L.P. have shared voting and dispositive power over these shares of common stock. |
| (3) | Includes 200,000 shares of common stock issuable upon exercise of options. |
| (4) | Includes 183,700 shares of common stock issuable upon exercise of options. |
| (5) | Includes 133,865 shares of common stock issuable upon exercise of options. On April 22, 2010, Marc Holliday notified our board of directors that he would not stand for election as a Class III director for a new term at our 2010 annual meeting of stockholders. However, Mr. Holliday agreed with our board of directors that he would remain as a director on an interim basis for an unspecified period of time following our 2010 annual meeting. Due to the time necessary to complete the resolution of the Goldman Mortgage Loan and Goldman Mezzanine Loans, which has been subject to many delays, Mr. Holliday has remained as a director in an interim role for much longer than we intended. Under Maryland law, a director continues as a director until he resigns or his successor is duly elected and appointed. |
| (6) | Includes 38,508 shares of common stock issuable upon exercise of options, 2,500 shares of restricted common stock and 115,452 phantom units. |
| (7) | Includes 38,508 shares of common stock issuable upon exercise of options, 2,500 shares of restricted common stock and 124,463 phantom units. |
| (8) | Includes 38,508 shares of common stock issuable upon exercise of options, 2,500 shares of restricted common stock and 115,297 phantom units. |
| (9) | Includes 38,508 shares of common stock issuable upon exercise of options, 2,500 shares of restricted common stock and 112,823 phantom units. |
| (10) | Includes 10,806 shares of common stock issuable upon exercise of options. |
| (11) | Includes 39,982 shares of common stock issuable upon exercise of options. |
| (12) | The address for this stockholder is Institution of Math, AMSS, CAS, Zhongguancun, Haidian District, Beijing 100080, People’s Republic of China. Based solely on information contained in Schedule 13G/A |
236
TABLE OF CONTENTS
| | filed jointly by this stockholder and He & Fang 2005 Revocable Living Trust on February 11, 2011. This stockholder has shared voting and dispositive power over these shares. |
| (13) | The address for this stockholder is Renaissance Villa 45, Ogeum-Tong, Song-Pa Gu, Seoul, Republic of Korea. Based solely on information contained in Schedule 13G filed on October 14, 2010. This stockholder has voting and dispositive power over these shares. |
| (14) | The address for this stockholder is 1120 Avenue of the Americas, Suite 1505, New York, NY 10036. Based solely on information contained in Schedule 13G filed on January 13, 2011. This stockholder has shared voting and dispositive power over these shares. |
ITEM 13. CERTAIN RELATIONSHIPS AND RELATED TRANSACTIONS AND DIRECTOR INDEPENDENCE
Policies and Procedures With Respect to Related Party Transactions
It is the policy of our board of directors that all related party transactions (generally, transactions involving amounts exceeding $120,000 in which a related party (directors and executive officers or their immediate family members, or stockholders owning 5% of more of our outstanding stock)) shall be subject to approval or ratification in accordance with the following procedures.
Our Nominating and Corporate Governance Committee shall review the material facts of all related party transactions that require its approval and either approve or disapprove of the entry into the related party transaction, subject to some exceptions. If advance approval of a related party transaction is not feasible, then the related party transaction shall be considered and, if our Nominating and Corporate Governance Committee determines it to be appropriate, ratified at the next regularly scheduled meeting of our Nominating and Corporate Governance Committee. In determining whether to approve or ratify a related party transaction, our Nominating and Corporate Governance Committee will take into account, among other factors it deems appropriate, whether the related party transaction is on terms no less favorable than terms generally available to an unaffiliated third-party under the same or similar circumstances and the extent of the related party’s interest in the transaction.
If a related party transaction will be ongoing, our Nominating and Corporate Governance Committee may establish guidelines for our management to follow in its ongoing dealings with the related party. Thereafter, our Nominating and Corporate Governance Committee, on at least an annual basis, shall review and assess ongoing relationships with the related party to see that they are in compliance with our Nominating and Corporate Governance Committee’s guidelines and that the related party transaction remains appropriate.
All related party transactions shall be disclosed in our applicable filings with the SEC as required under SEC rules.
Internalization
On April 24, 2009, in connection with the Internalization, we and our Operating Partnership entered into a securities transfer agreement with SL Green Operating Partnership, L.P., GKK Manager Member Corp. and SL Green Realty Corp. pursuant to which (i) SL Green Operating Partnership, L.P. and GKK Manager Member Corp. agreed to transfer to our Operating Partnership membership interests in the Manager and (ii) SL Green Operating Partnership, L.P. agreed to transfer to our Operating Partnership its Class B limited partner interests in our Operating Partnership, in exchange for certainde minimis cash consideration. The securities transfer agreement contains standard representations, warranties, covenants and indemnities. No distributions were due on the Class B limited partner interests in connection with the Internalization.
Concurrently with the execution of the securities transfer agreement, we also entered into a special rights agreement with SL Green Operating Partnership, L.P. and SL Green Realty Corp. (collectively, “SL Green”) pursuant to which SL Green agreed to provide us certain management information systems services from April 24, 2009 through the date that was 90 days thereafter and we agreed to pay SL Green Operating Partnership, L.P. a monthly cash fee of $25,000 in connection therewith. We also agreed to use our best efforts to operate as a real estate investment trust during each taxable year and to cause our tax counsel to provide legal opinions to SL Green Realty Corp. relating to our real estate investment trust status. Other than with respect to the transitional services provisions of the special rights agreement as set forth therein, the special rights agreement will terminate when SL Green Operating Partnership, L.P. ceases to own at least 7.5% of the shares of our common stock.
237
TABLE OF CONTENTS
We refer to this transaction as the Internalization.
Management Agreement
In connection with our initial public offering, we entered into a management agreement with the Manager, which was subsequently amended and restated in April 2006. The management agreement was further amended in September 2007, and amended and restated in October 2008, and was subsequently terminated in connection with the Internalization. Prior to the Internalization, the management agreement provided for a term through December 2009 with automatic one-year extension options and was subject to certain termination rights. We paid the Manager an annual management fee equal to 1.75% of our gross stockholders equity (as defined in the management agreement) inclusive of our trust preferred securities. In October 2008, we entered into the second amended and restated management agreement with the Manager which generally contained the same terms and conditions as the amended and restated management agreement, except for the following material changes: (1) reduced the annual base management fee to 1.50% of our gross stockholders equity; (2) reduced the termination fee to an amount equal to the management fee earned by the Manager during the 12 months preceding the termination date; and (3) commencing July 2008, all fees in connection with collateral management agreements were to be remitted by the Manager to us. We incurred expense to the Manager under the management agreement of an aggregate of an aggregate of $0, $7,534 and $21,058 for the years ended December 31, 2010, 2009 and 2008 respectively.
Prior to the Internalization, to provide an incentive to enhance the value of our common stock, the holders of the Class B limited partner interests of our Operating Partnership were entitled to an incentive return equal to 25% of the amount by which FFO plus certain accounting gains and losses (as defined in the partnership agreement of our Operating Partnership) exceed the product of the weighted average stockholders’ equity (as defined in the partnership agreement of our Operating Partnership) multiplied by 9.5% (divided by four to adjust for quarterly calculations). We recorded any distributions on the Class B limited partner interests as an incentive distribution expense in the period when earned and when payments of such amounts became probable and reasonably estimable in accordance with the partnership agreement. We incurred approximately $2,350,000 in incentive distributions with respect to such Class B limited partner interests for the year ended December 31, 2008. No incentive distribution was earned by the Class B limited partner interests for the year ended December 31, 2009.
Asset Servicing Agreement and Outsource Agreement
Prior to the Internalization, we were obligated to reimburse the Manager for its costs incurred under an asset servicing agreement between the Manager and an affiliate of SL Green and a separate outsource agreement between the Manager and SL Green Operating Partnership, L.P. The asset servicing agreement, which was amended and restated in April 2006, provided for an annual fee payable to SL Green Operating Partnership, L.P. by us of 0.05% of the book value of all credit tenant lease assets and non-investment grade bonds and 0.15% of the book value of all other assets. The outsource agreement provided for an annual fee payable by us, which became $2,814 per year subsequent to the closing of the American Financial merger to reflect higher costs resulting from the increased size and number of assets of the combined company, increasing 3% annually over the prior year on the anniversary date of the outsource agreement in August of each year. For the year ended December 31, 2008, we realized expense of $1,721,000 to the Manager under the outsource agreement. For the year ended December 31, 2008, we realized expense of approximately $4,022,000 to the Manager, under the asset servicing agreement. In October 2008, the outsource agreement was terminated and the asset servicing agreement was replaced with that certain interim asset servicing agreement between the Manager and an affiliate of SL Green Realty Corp., pursuant to which we were obligated to reimburse the Manager for its costs incurred thereunder from October 2008 until April 24, 2009 when such agreement was terminated in connection with the Internalization. Pursuant to that agreement, the SL Green Realty Corp. affiliate acted as the rated special servicer to our collateralized debt obligations, or CDOs, for a fee equal to two basis points per year on the carrying value of the specially serviced loans assigned to it. Concurrent with the Internalization, the interim asset servicing agreement was terminated and the Manager entered into a special servicing agreement with an affiliate of SL Green Realty Corp. pursuant to which the SL Green Realty Corp. affiliate agreed to act as the rated special servicer to our CDOs for a period beginning on April 24, 2009 through the date that is the earlier of (i) 60 days thereafter and (ii) a date on which a new special servicing agreement is entered into between the Manager and a rated third-party
238
TABLE OF CONTENTS
special servicer. The SL Green Realty Corp. affiliate was entitled to a servicing fee equal to (i) 25 basis points per year on the outstanding principal balance of assets with respect to certain specially serviced assets and (ii) two basis points per year on the outstanding principal balance of assets with respect to certain other assets. The April 24, 2009 agreement expired effective June 23, 2009. Effective May 2009, we entered into new special servicing arrangements with Situs Serve, L.P., which became the rated special servicer for our CDOs. An affiliate of SL Green Realty Corp. continues to provide special servicing services with respect to a limited number of loans owned by us that are secured by properties in New York City, or in which we and SL Green are co-investors. For the years ended December 31, 2010, 2009 and 2008 we incurred expense of $477, $1,014 and $0, respectively, pursuant to the special servicing arrangement.
Services Agreement
On October 27, 2008, we entered into a services agreement, or the Services Agreement, with SL Green Realty Corp. and SL Green Operating Partnership, L.P., which was subsequently terminated in connection with the Internalization. Pursuant to the Services Agreement, SL Green agreed to provide consulting and other services to us. SL Green would make Marc Holliday, Andrew Mathias and David Schonbraun available in connection with the provision of the services until the earliest of (i) September 30, 2009, (ii) the termination of the management agreement or (iii) with respect to a particular executive, the termination of any such executive’s employment with SL Green Realty Corp. In consideration for the consulting services, we paid a fee to SL Green of $200,000 per month, payable, at our option, in cash or, if permissible under applicable law or the requirements of the exchange on which the shares of our common stock trade, shares of our common stock. SL Green also provided us with certain other services described in the Services Agreement for a fee of $100,000 per month in cash and for a period terminating at the earlier of (i) three months after the date of the Services Agreement, subject to a one-time 30-day extension or (ii) the termination of the management agreement.
Collateral Management Agreements
In connection with the closing of our first CDO in July 2005, the 2005 Issuer, entered into a collateral management agreement with the Manager. Pursuant to the collateral management agreement, the Manager agreed to provide certain advisory and administrative services in relation to the collateral debt securities and other eligible investments securing the CDO notes. The collateral management agreement provides for a senior collateral management fee, payable quarterly in accordance with the priority of payments as set forth in the indenture, equal to 0.15% per annum of the net outstanding portfolio balance, and a subordinate collateral management fee, payable quarterly in accordance with the priority of payments as set forth in the indenture, equal to 0.25% per annum of the net outstanding portfolio balance. Net outstanding portfolio balance is the sum of the (i) aggregate principal balance of the collateral debt securities, excluding defaulted securities, (ii) aggregate principal balance of all principal proceeds held as cash and eligible investments in certain accounts, and (iii) with respect to the defaulted securities, the calculation amount of such defaulted securities. Prior to the Internalization, as compensation for the performance of its obligations as collateral manager under the first CDO, our board of directors had allocated to the Manager the subordinate collateral management fee paid on the CDO securities not held by us. In October 2008, pursuant to the second amended and restated management agreement, the Manager had, commencing July 1, 2008, agreed to remit this amount to us. For the year ended December 31, 2008, we realized expense of approximately $1,024,000 to the Manager under such collateral management agreement.
Prior to the Internalization, fees payable in connection with CDOs or other securitization vehicles, except for the 2005 CDO, were governed by the management agreement. Pursuant to the management agreement, if a collateral manager is retained as part of the formation of a CDO or other securitization vehicle, the Manager or an affiliate will be the collateral manager and will receive the following fees: (i) 0.25% per annum of the principal amount outstanding of bonds issued by a managed transitional CDO that are owned by third-party investors unaffiliated with us or the Manager, which CDO is structured to own loans secured by transitional properties, (ii) 0.15% per annum of the book value of the principal amount outstanding of bonds issued by a managed non-transitional CDO that are owned by third-party investors unaffiliated with us or the Manager, which CDOs structured to own loans secured by non-transitional properties, (iii) 0.10% per annum of the principal amount outstanding of bonds issued by a static CDO that are owned by third party investors unaffiliated with us or the Manager, which CDO is structured to own non-investment grade bonds, and
239
TABLE OF CONTENTS
(iv) 0.05% per annum of the principal amount outstanding of bonds issued by a static CDO that are owned by third-party investors unaffiliated with us or the Manager, which CDO is structured to own investment grade bonds. For the purposes of the management agreement, a “managed transitional” CDO means a CDO that is actively managed, has a reinvestment period and is structured to own debt collateral secured primarily by non-stabilized real estate assets that are expected to experience substantial net operating income growth, and a “managed non-transitional” CDO means a CDO that is actively managed, has a reinvestment period and is structured to own debt collateral secured primarily by stabilized real estate assets that are not expected to experience substantial net operating income growth. Both “managed transitional” and “managed non-transitional” CDOs may at any given time during the reinvestment period of the respective vehicles invest in and own non-debt collateral (in limited quantity) as defined by the respective indentures. If any fees are paid to the collateral manager in excess of the fee structure provided for above, such fees are paid to us. In October 2008, pursuant to the second amended and restated management agreement, the Manager, commencing July 1, 2008, agreed to remit this amount to us. For the year ended December 31, 2008, we realized expense of approximately $1,574,000 to the Manager under this agreement. In connection with the Internalization, the management agreement was terminated and the fees payable in connection with our 2006 and 2007 CDOs are governed by their respective collateral management agreements.
Leases
Commencing in May 2005, we are party to a lease agreement with SLG Graybar Sublease LLC, an affiliate of SL Green Realty Corp., for our corporate offices at 420 Lexington Avenue, New York, New York. The lease is for approximately 7,300 square feet and carries a term of 10 years with rents of approximately $249,000 per annum for year one rising to $315,000 per annum in year 10. In May and June 2009, we amended our lease with SLG Graybar Sublease LLC to increase the leased premises by approximately 2,260 square feet. The additional premises are leased on a co-terminus basis with the remainder of our leased premises and carry rents of approximately $103,000 per annum during the initial year and $123,000 per annum during the final lease year. For the years ended December 31, 2010, 2009 and 2008, we paid approximately $339,000, $437,000 and $423,000 under this lease, respectively.
SL Green Operating Partnership, L.P. and SL Green Realty Corp. Interests in Gramercy Investments
In July 2005, we closed on the purchase from an SL Green Realty Corp. affiliate of a $40,000,000 mezzanine loan which bears interest at 11.20%. As part of that sale, the seller retained an interest-only participation. The mezzanine loan is secured by the equity interests in an office property in New York, New York. In December 2010, the Company sold its entire interest to an affiliate of SL Green Realty Corp. for $38,893,000. As of December 31, 2009, the loan had a book value $39,285,000.
In March 2006, we closed on the purchase of a $25,000,000 mezzanine loan, which bore interest at one-month LIBOR plus 8.00%, to a joint venture in which SL Green Realty Corp. was an equity holder. The mezzanine loan was repaid in full on May 9, 2006, when we originated a $90,287,000 whole loan, which bears interest at one-month LIBOR plus 2.75%, to the joint venture. The whole loan is secured by office and industrial properties in northern New Jersey and has a book value of approximately $24,821,000 and $64,130,000 as of December 31, 2010 and December 31, 2009, respectively.
In June 2006, we closed on the acquisition of a 49.75% TIC interest in 55 Corporate Drive, located in Bridgewater, New Jersey with a 0.25% interest to be acquired in the future. The remaining 50% of the property was owned as a TIC interest by an affiliate of SL Green Operating Partnership, L.P. The property was comprised of three buildings totaling approximately 670,000 square feet which was 100% net leased to an entity whose obligations were guaranteed by Sanofi-Aventis Group through April 2023. The transaction was valued at $236,000,000 and was financed with a $190,000,000, 10-year, fixed-rate first mortgage loan. In January 2009, together with SL Green Realty Corp., we sold 100% of the respective interests in 55 Corporate.
In January 2007, we originated two mezzanine loans totaling $200,000,000. The $150,000,000 loan was secured by a pledge of cash flow distributions and partial equity interests in a portfolio of multi-family properties and bore interest at one-month LIBOR plus 6.00%. The $50,000,000 loan was initially secured by cash flow distributions and partial equity interests in an office property. On March 8, 2007, the $50,000,000 loan was increased by $31,000,000 when the existing mortgage loan on the property was defeased, upon which event our loan became secured by a first mortgage lien on the property and was
240
TABLE OF CONTENTS
reclassified as a whole loan. The whole loan currently bears interest at one-month LIBOR plus 6.00% for the initial funding and one-month LIBOR plus 1.00% for the subsequent funding. At closing, an affiliate of SL Green acquired from us and held a 15.15% pari-passu interest in the mezzanine loan and the whole loan. The investment in the mezzanine loan was repaid in full in September 2007. In September 2010, the whole loan was repaid at a discount. We received $56,093,000 and forgave the remaining balance outstanding. As of December 31, 2009, our interest in the whole loan had a carrying value of $63,894,000.
In April 2007, we purchased for $103,200,000 a 45% TIC interest to acquire the fee interest in a parcel of land located at 2 Herald Square, located along 34th Street in New York, New York. The acquisition was financed with $86,063,000 10-year fixed rate mortgage loan. The property is subject to a long-term ground lease with an unaffiliated third party for a term of 70 years. The remaining TIC interest is owned by a wholly-owned subsidiary of SL Green. The TIC interests are pari-passu. We sold our 45% interest in December 2010 to a wholly-owned subsidiary of SL Green for net proceeds of $25,350,000, resulting in a loss of $11,885,000. As of December 31, 2009, the investment had a carrying value of $31,557,000. We recorded our pro rata share of net income of $5,078,000, $4,988,000 and $5,228,000 for the years ended December 31, 2010, 2009 and 2008, respectively.
In July 2007, we purchased for $144,240,000 an investment in a 45% TIC interest to acquire a 79% fee interest and 21% leasehold interest in the fee position in a parcel of land located at 885 Third Avenue, on which is situated The Lipstick Building. The transaction was financed with a $120,443,000 10-year fixed rate mortgage loan. The property is subject to a 70-year leasehold ground lease with an unaffiliated third party. The remaining TIC interest is owned by a wholly-owned subsidiary of SL Green. The TIC interests are pari passu. We sold our 45% interest in December 2010 to a wholly-owned subsidiary of SL Green for net proceeds of $38,911,000, resulting in a loss of $15,407,000. As of December 31, 2009, the investment had a carrying value of $45,695,000. We recorded our pro rata share of net income of $5,926,000, $5,972,000 and $6,292,000 for the years ended December 31, 2010, 2009 and 2008, respectively.
In September 2007, we acquired a 50% interest in a $25,000,000 senior mezzanine loan from SL Green Realty Corp. Immediately thereafter we, along with SL Green Realty Corp., sold all of our interests in the loan to an unaffiliated third party. Additionally, we acquired from SL Green Realty Corp. a 100% interest in a $25,000,000 junior mezzanine loan associated with the same properties as the preceding senior mezzanine loan. Immediately thereafter we participated 50% of its interest in the loan to SL Green Realty Corp. As of December 31, 2010 and December 31, 2009, the loan has a book value of $0 and $0, respectively. In October 2007, we acquired a 50%pari-passu interest in $57,795,000 of two additional tranches in the senior mezzanine loan from an unaffiliated third party. At closing, an affiliate of SL Green Realty Corp. simultaneously acquired the other 50%pari-passu interest in the two tranches. As of December 31, 2010 and December 31, 2009, the loan has a book value of $0 and $319,000, respectively. We held a contingent interest in the property which was sold to SL Green Realty Corp. in December 2010 for $2,016,000.
In December 2007, we acquired a $52,000,000 interest in a senior mezzanine loan from a financial institution. Immediately thereafter, we participated 50% of our interest in the loan to an affiliate of SL Green Realty Corp. The investment, was secured by an office building in New York, New York, was purchased at a discount and bore interest at an effective spread to one-month LIBOR of 5.00%. In July 2009, we sold our remaining interest in the loan to an affiliate of SL Green Realty Corp. for $16,120,000 pursuant to purchase rights established when the loan was acquired. The sale included contingent participation in future net proceeds from SL Green Realty Corp. of up to $1,040,000 in excess of the purchase price upon their ultimate disposition of the loan, which was surrendered and cancelled in December 2010 in connection with certain transactions that we consummated with wholly-owned subsidiaries of SL Green.
241
TABLE OF CONTENTS
In December 2007, we acquired a 50% interest in a $200,000,000 senior mezzanine loan from a financial institution. Immediately thereafter, we participated 50% of our interest in the loan to an affiliate of SL Green. The investment was purchased at a discount and bears interest at an effective spread to one-month LIBOR of 6.50%. In December 2010, we subsequently purchased an affiliate of SL Green’s full participation in the senior mezzanine loan at a discount. As of December 31, 2010 and December 31, 2009, the original loan has a book value of $5,224,000 and $28,228,000 and the subsequently purchased loan has a book value of $13,586,000 and $0, respectively.
In August 2008, we closed on the purchase from an SL Green Realty Corp. affiliate of a $9,375,000pari-passu participation interest in a $18,750,000 first mortgage. The loan is secured by a retail shopping center located in Staten Island, New York. The investment bears interest at a fixed rate of 6.50%. In December 2010, the Company purchased the remaining 50% interest in the loan from an affiliate of SL Green Realty Corp. for a discount of $9,420,000. As of December 31, 2010 and December 31, 2009, the loan has a book value of approximately $19,367,000 and $9,926,000, respectively.
In September 2008, we closed on the purchase from an SL Green Realty Corp. affiliate of a $30,000,000 interest in a $135,000,000 mezzanine loan. The loan is secured by the borrower’s interests in a retail condominium located in New York, New York. The investment bears interest at an effective spread to one-month LIBOR of 10.00%. As of December 31, 2010 and 2009, the loan has a book value of $27,778,000 and $29,925,000, respectively. In December 2010, the Company sold its contingent interest to SL Green Realty Corp. for $300,000.
Director Independence
Our board of directors has affirmatively determined that Messrs. Allan J. Baum, Jeffrey E. Kelter, Paul J. Konigsberg and Charles S. Laven, representing a majority of its members, are independent of our management, as such term is defined by the rules of the NYSE and the SEC. In determining director independence, our board of directors considers all relevant facts and circumstances, the NYSE listing standards, as well as our director independence standards. Under the NYSE listing standards, no director qualifies as independent unless our board of directors affirmatively determines that the director has no material relationship with us, either directly or as a partner, stockholder or officer of an organization that has a relationship with us. Our director independence standards are available in the corporate governance section of the “Investor Relations — Corporate Governance” page of our corporate website atwww.gkk.com.
ITEM 14. PRINCIPAL ACCOUNTING FEES AND SERVICES
Audit Fees
Fees for audit services totaled approximately $2,479,804 in 2010 and $2,381,072 in 2009, of which $296,500 and $251,000 was attributable to Sarbanes-Oxley 404 planning and testing in 2010 and 2009, respectively. Audit fees include fees associated with our annual audit and the reviews of our quarterly reports on Form 10-Q. In addition, audit fees include fees for services relating to reporting requirements in connection with our mortgage and mezzanine loans. Audit fees also include fees for accounting research.
Audit-Related Fees
Fees for audit-related services totaled approximately $10,250 in 2010 and $35,250 in 2009. The audit-related services principally include fees for comfort letters and consents in connection with modifying debt arrangements and our November 2010 tender offer.
Tax Fees
Fees for tax compliance, tax advice and tax planning totaled approximately $156,000 in 2010 and $36,235 in 2009.
All Other Fees
We did not incur fees in 2010 and 2009 for other services not included above.
Our Audit Committee considers whether the provision by Ernst & Young LLP of the services that are required to be described under “All Other Fees” is compatible with maintaining Ernst & Young LLP’s independence from both management and our company.
242
TABLE OF CONTENTS
ITEM 15. EXHIBITS, FINANCIAL STATEMENTS AND SCHEDULES, AND REPORTS ON FORM 8-K
(a)(1) Consolidated Financial Statements
GRAMERCY CAPITAL CORP.
(a)(2) Financial Statement Schedules
Schedules other than those listed are omitted as they are not applicable or the required or equivalent information has been included in the financial statements or notes thereto.
(a)(3) Exhibits
See Index to Exhibits on following page
| (1) | Should be the most recent practicable date. |
243
TABLE OF CONTENTS
INDEX TO EXHIBITS
| | |
Exhibit
No. | | Description |
| 3.1 | | Articles of Incorporation of the Company, incorporated by reference to the Company’s Registration Statement on Form S-11 (No. 333-114673), filed with the SEC on July 26, 2004. |
| 3.2 | | Amended and Restated Bylaws of the Company, incorporated by reference to the Company’s Current Report on Form 8-K, filed with the SEC on December 14, 2007. |
| 3.3 | | Articles Supplementary designating the 8.125% Series A Cumulative Redeemable Preferred Stock, liquidation preference $25.00 per share, par value $0.001 per share, dated April 18, 2007, incorporated by reference to the Company’s Current Report on Form 8-K, filed with the SEC on April 18, 2007. |
| 4.1 | | Form of specimen stock certificate representing the common stock of the Company, par value $.001 per share, incorporated by reference to the Company’s Current Report on Form 8-K, filed with the Commission on April 18, 2007. |
| 4.2 | | Form of stock certificate evidencing the 8.125% Series A Cumulative Redeemable Preferred Stock of the Company, liquidation preference $25.00 per share, par value $0.001 per share, incorporated by reference to the Company’s Current Report on Form 8-K, filed with the SEC on April 18, 2007. |
| 10.1 | | Third Amended and Restated Agreement of Limited Partnership of GKK Capital LP, dated April 19, 2006, incorporated by reference to the Company’s Current Report on Form 8-K, dated April 19, 2006, filed with the SEC on April 20, 2006. |
| 10.2 | | First Amendment to the Third Amended and Restated Agreement of Limited Partnership of GKK Capital LP, dated as of April 18, 2007, incorporated by reference to the Company’s Current Report on Form 8-K, dated April 13, 2007, filed with the SEC on April 18, 2007. |
| 10.3 | | Second Amendment to the Third Amended and Restated Agreement of Limited Partnership of GKK Capital LP, dated as of October 27, 2008, incorporated by reference to the Company’s Quarterly Report on Form 10-Q, filed with the SEC on November 10, 2008. |
| 10.4 | | Collateral Management Agreement, by and between Gramercy Real Estate CDO 2005 1, Ltd., as issuer and GKK Manager LLC, as collateral manager, incorporated by reference to the Company’s Quarterly Report on Form 10-Q for the fiscal quarter ended June 30, 2005. |
| 10.5 | | Collateral Management Agreement, dated as of August 24, 2006, by and between Gramercy Real Estate CDO 2006-1, Ltd., as issuer and GKK Manager LLC, as collateral manager, incorporated by reference to the Company’s Quarterly Report on Form 10-Q for the fiscal quarter ended September 30, 2006. |
| 10.6 | | Collateral Management Agreement, dated as of August 8, 2007, by and between Gramercy Real Estate CDO 2007-1, Ltd. And GKK Manager LLC, incorporated by reference to the Company’s Quarterly Report on Form 10-Q for the fiscal quarter ended September 30, 2007. |
| 10.7 | | Indenture, by and among Gramercy Real Estate CDO 2005-1, Ltd., as issuer, Gramercy Real Estate CDO 2005-1 LLC, as co-issuer, GKK Liquidity LLC, as advancing agent and Wells Fargo Bank, National Association, as trustee, paying agent, calculation agent, transfer agent, custodial securities intermediary, backup advancing agent, notes registrar, incorporated by reference to the Company’s Quarterly Report on Form 10-Q for the fiscal quarter ended June 30, 2005. |
| 10.8 | | Indenture, dated as of August 24, 2006, by and among Gramercy Real Estate CDO 2006-1, Ltd., as issuer, Gramercy Real Estate CDO 2006-1 LLC, as co-issuer, GKK Liquidity LLC, as advancing agent, and Wells Fargo Bank, National Association, as trustee, paying agent, calculation agent, transfer agent, custodial securities intermediary, backup advancing agent and notes registrar, incorporated by reference to the Company’s Quarterly Report on Form 10-Q for the fiscal quarter ended September 30, 2006. |
244
TABLE OF CONTENTS
| | |
Exhibit
No. | | Description |
| 10.9 | | Indenture, dated as of August 8, 2007, by and among Gramercy Real Estate CDO 2007-1, Ltd., Gramercy Real Estate CDO 2007-1, LLC, GKK Liquidity LLC and Wells Fargo Bank, National Association, incorporated by reference to the Company’s Quarterly Report on Form 10-Q for the fiscal quarter ended September 30, 2007. |
| 10.10 | | Gramercy Capital Corp. Director’s Deferral Program, incorporated by reference to the Company’s Quarterly Report on Form 10-Q/A for the fiscal quarter ended June 30, 2005. |
| 10.11 | | Form of Gramercy Capital Corp. 2005 Long-Term Outperformance Program Award Agreement, incorporated by reference to the Company’s Current Report on Form 8-K, dated December 14, 2005, filed with the SEC on December 20, 2005. |
| 10.12 | | Second Amended and Restated Registration Rights Agreement by and between the Company and SL Green Operating Partnership, L.P., incorporated by reference to the Company’s Form 8-K, dated April 19, 2006, filed with the SEC on April 20, 2006. |
| 10.13 | | Registration Rights Agreement, by and between various holders of the Company’s common stock and the Company, incorporated by reference to the Company’s Form 8-K, dated December 3, 2004, filed with the SEC on December 9, 2004. |
| 10.14 | | Limited Partnership Unit Purchase Agreement, dated as of November 2, 2007, by and among GKK Capital LP, Nicholas S. Schorsch and Meadowcourt Trust, incorporated by reference to the Company’s Current Report on Form 8-K, dated November 2, 2007, filed with the SEC on November 8, 2007. |
| 10.15 | | Form of Restricted Stock Award Agreement, incorporated by reference to the Company’s Annual Report on Form 10-K for the fiscal year ended December 31, 2007, filed with the SEC on March 17, 2008. |
| 10.16 | | Form of Option Award Agreement, incorporated by reference to the Company’s Annual Report on Form 10-K for the fiscal year ended December 31, 2007, filed with the SEC on March 17, 2008. |
| 10.17 | | Form of Phantom Share Award Agreement, incorporated by reference to the Company’s Annual Report on Form 10-K for the fiscal year ended December 31, 2007, filed with the SEC on March 17, 2008. |
| 10.18 | | Amendment to Loan Agreement, dated as of August 22, 2008, among Goldman Sachs Mortgage Company, Citicorp North America, Inc. and SL Green Realty Corp., collectively, as lender, and certain subsidiaries of Gramercy Capital Corp., as borrower, incorporated by reference to the Company’s Form 8-K, dated August 22, 2008, filed with the SEC on August 28, 2008. |
| 10.19 | | Loan Agreement, dated as of April 1, 2008, between Goldman Sachs Commercial Mortgage Capital, L.P., Citicorp North America, Inc. and SL Green Realty Corp., as lenders, the required equity pledgors named therein and GKK Stars Acquisition LLC, American Financial Realty, First States Group, L.P. and various other borrowers named therein, as borrowers, incorporated by reference to the Company’s Form 8-K, dated April 1, 2008, filed with the SEC on April 7, 2008. |
| 10.20 | | Amended and Restated Senior Mezzanine Loan Agreement, dated as of August 22, 2008, among Goldman Sachs Mortgage Company and Citicorp North America, Inc., collectively, as lender, and American Financial Realty Trust, First States Group, L.P., GKK Stars Acquisition LLC, First States Group, LLC, and certain subsidiaries of Gramercy Capital Corp., as borrower, incorporated by reference to the Company’s Form 8-K, dated August 22, 2008, filed with the SEC on August 28, 2008. |
245
TABLE OF CONTENTS
| | |
Exhibit
No. | | Description |
| 10.21 | | Junior Mezzanine Loan Agreement, dated as of August 22, 2008, among Goldman Sachs Mortgage Company, Citicorp North America, Inc. and SL Green Realty Corp., collectively, as lender, and GKK Stars Junior Mezz 2 LLC, as borrower, incorporated by reference to the Company’s Form 8-K, dated August 22, 2008, filed with the SEC on August 28, 2008. |
| 10.22 | | Loan Agreement, dated as of April 1, 2008, among First States Investors 3300 B, L.P., as borrower, and PB Capital Corporation, as lender and agent, incorporated by reference to the Company’s Form 8-K, dated April 1, 2008, filed with the SEC on April 7, 2008. |
| 10.23 | | Amended and Restated Loan Agreement, dated as of April 1, 2008, by and among First States Investors DB I, L.P., First States Investors DB I B, L.P., First States Investors 4200, LLC, First States Investors DB I SP, L.P. and First States Investors DB I TRS, L.P., collectively as borrower, Deutsche Bank AG, Cayman Islands Branch, as agent, LaSalle Bank National Association, as collateral agent and each lender signatory thereto, incorporated by reference to the Company’s Form 8-K, dated April 1, 2008, filed with the SEC on April 7, 2008. |
| 10.24 | | Guaranty, dated as of April 1, 2008, by the Company to Deutsche Bank AG, Cayman Islands Branch, incorporated by reference to the Company’s Form 8-K, dated April 1, 2008, filed with the Commission on April 7, 2008. |
| 10.25 | | Loan Agreement, dated as of March 28, 2008, among First States Investors HFS, L.P., First States Investors FPC, L.P., and First States Investors TRS, L.P., as borrowers, and Gramercy Investment Trust, as lender, incorporated by reference to the Company’s Form 8-K, dated April 1, 2008, filed with the SEC on April 7, 2008. |
| 10.26 | | Separation Agreement, dated as of April 16, 2008, by and between the Company and Hugh F. Hall, incorporated by reference to the Company’s Form 8-K, dated April 16, 2008, filed with the SEC on April 22, 2008. |
| 10.27 | | First Amendment to Employment and Noncompetition Agreement, dated as of April 16, 2008, by and between GKK Manager LLC and Robert R. Foley, and agreed to by the Company as to the obligations of the Company therein, incorporated by reference to the Company’s Form 8-K, dated April 16, 2008, filed with the SEC on April 22, 2008. |
| 10.28 | | Severance Agreement, dated as of October 27, 2008, by and between Gramercy Capital Corp. and Roger M. Cozzi, incorporated by reference to the Company’s Form 8-K, dated October 27, 2008, filed with the SEC on October 31, 2008. |
| 10.29 | | Severance Agreement, dated as of November 13, 2008, by and between Gramercy Capital Corp. and Timothy O’Connor, incorporated by reference to the Company’s Form 8-K, dated November 13, 2008, filed with the SEC on November 17, 2008. |
| 10.30 | | Employment and Noncompetition Agreement, dated as of October 27, 2008, by and between GKK Manager LLC and Roger Cozzi, incorporated by reference to the Company’s Current Report on Form 8-K, filed with the Commission on April 28, 2009. |
| 10.31 | | Employment and Noncompetition Agreement, dated as of November 13, 2008, by and between GKK Manager LLC and Timothy O’Connor, incorporated by reference to the Company’s Current Report on Form 8-K, filed with the Commission on April 28, 2009. |
| 10.32 | | Employment and Noncompetition Agreement, dated as of July [ ], 2004, by and between GKK Manager LLC and Robert R. Foley, incorporated by reference to the Company’s Current Report on Form 8-K, filed with the Commission on April 28, 2009. |
| 10.33 | | Employment and Noncompetition Agreement, dated as of April 27, 2009, by and between Gramercy Capital Corp. and Jon W. Clark, incorporated by reference to the Company’s Current Report on Form 8-K, filed with the Commission on April 28, 2009. |
| 10.34 | | Amended and Restated 2004 Equity Incentive Plan, dated as of October 27, 2008, incorporated by reference to the Company’s Quarterly Report on Form 10-Q, filed with the SEC on November 10, 2008. |
246
TABLE OF CONTENTS
| | |
Exhibit
No. | | Description |
| 10.35 | | First Amendment to Amended and Restated 2004 Equity Incentive Plan, dated as of October 27, 2008, incorporated by reference to the Company’s Quarterly Report on Form 10-Q, filed with the SEC on November 10, 2008. |
| 10.36 | | Junior Subordinated Indenture, dated as of January 30, 2009, by and between GKK Capital LP and The Bank of New York Mellon Trust Company, National Association, as Trustee, incorporated by reference to the Company’s Current Report on Form 8-K, filed with the SEC on February 5, 2009. |
| 10.37 | | Lease Agreement, dated as of April 1, 2003, by and between Wachovia Bank, National Association and First States Investors 4000B, LLC, incorporated by reference to the Company’s Annual Report on Form 10-K for the fiscal year ended December 31, 2009, filed with the SEC on March 17, 2010. |
| 10.38 | | Amended and Restated Lease Agreement, dated as of May 23, 2003, by and between U.S. Bank National Association, and Patrick Thebado, as Lessor, and Bank of America, N.A., as Lessee, incorporated by reference to the Company’s Annual Report on Form 10-K for the fiscal year ended December 31, 2009, filed with the SEC on March 17, 2010. |
| 10.39 | | Lease Agreement, dated as of September 24, 2003, by and between Bank of America, N.A. and First States Investors 4100A, LLC, incorporated by reference to the Company’s Annual Report on Form 10-K for the fiscal year ended December 31, 2009, filed with the SEC on March 17, 2010. |
| 10.40 | | Office Lease, dated as of August 1, 2004, by and between First States Investors 104, LLC and Bank of America, N.A., incorporated by reference to the Company’s Annual Report on Form 10-K for the fiscal year ended December 31, 2009, filed with the SEC on March 17, 2010. |
| 10.41 | | Master Agreement Regarding Leases, dated as of September 22, 2004, by and between Wachovia Bank, National Association and First States Investors 3300, LLC, incorporated by reference to the Company’s Annual Report on Form 10-K for the fiscal year ended December 31, 2009, filed with the SEC on March 17, 2010. |
| 10.42 | | Form of Lease, by and between Wachovia Bank, National Association and First States Investors 3300, LLC, incorporated by reference to the Company’s Annual Report on Form 10-K for the fiscal year ended December 31, 2009, filed with the SEC on March 17, 2010. |
| 10.43 | | Master Lease Agreement, dated of October 1, 2004, by and between First States Investors 5200, LLC and Bank of America, N.A., incorporated by reference to the Company’s Annual Report on Form 10-K for the fiscal year ended December 31, 2009, filed with the SEC on March 17, 2010. |
| 10.44 | | Master Lease Agreement, dated of January 1, 2005, by and between First States Investors 5000A, LLC and Bank of America, N.A., incorporated by reference to the Company’s Annual Report on Form 10-K for the fiscal year ended December 31, 2009, filed with the SEC on March 17, 2010. |
| 10.45 | | Securities Transfer Agreement, dated as of April 24, 2009, by and among Gramercy Capital Corp., GKK Capital LP, SL Green Operating Partnership, L.P., GKK Manager Member Corp. and SL Green Realty Corp. (solely for the purpose of Sections 2.6, 5.4, 5.5, 5.6, 6.3, 6.4, 6.5, 7.1, 7.2, 7.3, 7.4(a), 7.4(b), 7.4(d), 7.4(e), 7.5, 7.6, 7.7 and Article VIII), incorporated by reference to the Company’s Current Report on Form 8-K, filed with the Commission on April 28, 2009. |
| 10.46 | | Special Rights Agreement, dated as of April 24, 2009, by and between Gramercy Capital Corp. and SL Green Operating Partnership, L.P., incorporated by reference to the Company’s Current Report on Form 8-K, filed with the Commission on April 28, 2009. |
| 10.47 | | Exchange Agreement, dated as of January 30, 2009, by and among GKK Capital LP, Taberna Preferred Funding II, Ltd., Taberna Preferred Funding III, Ltd., Taberna Preferred Funding IV, Ltd., Taberna Preferred Funding V, Ltd., Taberna Preferred Funding VII, Ltd. and Taberna Preferred Funding VIII, Ltd., incorporated by reference to the Company’s Quarterly Report on Form 10-Q, filed with the SEC on May 11, 2009. |
247
TABLE OF CONTENTS
| | |
Exhibit
No. | | Description |
| 10.48 | | Supplemental Indenture, dated as of October 14, 2009, by and between GKK Capital LP and The Bank of New York Mellon Trust Company, National Association, as Trustee, incorporated by reference to the Company’s Current Report on Form 8-K, filed with the SEC on October 20, 2009. |
| 10.49 | | Exchange Agreement, dated as of October 15, 2009, by and among GKK Capital LP, Gramercy Investment QRS Corp., Taberna Capital Management, LLC, Taberna Preferred Funding II, Ltd., Taberna Preferred Funding V, Ltd., Taberna Preferred Funding VII, Ltd., and Taberna Preferred Funding VIII, Ltd., incorporated by reference to the Company’s Current Report on Form 8-K, filed with the SEC on October 20, 2009. |
| 10.50 | | Termination Agreement, dated as of December 4, 2009, by and among Gramercy Warehouse Funding I LLC, GKK Trading Warehouse Funding I LLC, as borrowers, Gramercy Capital Corp., GKK Capital LP, Gramercy Investment Trust and GKK Trading Corp., as guarantors, and Wachovia Bank, National Association, as administrative agent, incorporated by reference to the Company’s Current Report on Form 8-K, filed with the SEC on December 9, 2009. |
| 10.51 | | Second Amendment to Loan Agreement, dated as of March 9, 2010, among Goldman Sachs Mortgage Company, Citicorp North America, Inc. and SL Green Realty Corp., collectively, as lender, and certain subsidiaries of Gramercy Capital Corp., as borrower, incorporated by reference to the Company’s Form 8-K, dated March 9, 2010, filed with the SEC on March 15, 2010. |
| 10.52 | | Amendment to Amended and Restated Senior Mezzanine Loan Agreement, dated as of March 9, 2010, among Goldman Sachs Mortgage Company and Citicorp North America, Inc., collectively, as lender, and American Financial Realty Trust, First States Group, L.P., GKK Stars Acquisition LLC, First States Group, LLC, and certain subsidiaries of Gramercy Capital Corp., as borrower, incorporated by reference to the Company’s Form 8-K, dated March 9, 2010, filed with the SEC on March 15, 2010. |
| 10.53 | | Amendment to Junior Mezzanine Loan Agreement, dated as of March 9, 2010, among Goldman Sachs Mortgage Company, Citicorp North America, Inc. and SL Green Realty Corp., collectively, as lender, and GKK Stars Junior Mezz 2 LLC, as borrower, incorporated by reference to the Company’s Form 8-K, dated March 9, 2010, filed with the SEC on March 15, 2010. |
| 10.54 | | Supplemental Indenture, dated as of June 14, 2010, by and between GKK Capital LP and The Bank of New York Mellon Trust Company, National Association, as Trustee, incorporated by reference to the Company’s Current Report on Form 8-K, dated June 14, 2010, filed with the SEC on June 17, 2010. |
| 21.1 | | Subsidiaries of the Registrant, filed herewith. |
| 23.1 | | Consent of Independent Registered Accounting Firm, filed herewith. |
| 31.1 | | Certification by the Chief Executive Officer pursuant to Section 302 of the Sarbanes-Oxley Act of 2002, filed herewith. |
| 31.2 | | Certification by the Chief Financial Officer pursuant to Section 302 of the Sarbanes-Oxley Act of 2002, filed herewith. |
| 32.1 | | Certification by the Chief Executive Officer pursuant to 18 U.S.C. section 1350, as adopted pursuant to Section 906 of the Sarbanes-Oxley Act of 2002, filed herewith. |
| 32.2 | | Certification by the Chief Financial Officer pursuant to 18 U.S.C. section 1350, as adopted pursuant to Section 906 of the Sarbanes-Oxley Act of 2002, file herewith. |
248
TABLE OF CONTENTS
SIGNATURES
Pursuant to the requirements of Section 13 or 15(d) of the Securities Exchange Act of 1934, the registrant has duly caused this report to be signed on its behalf by the undersigned, thereunto duly authorized.
| | |
| | GRAMERCY CAPITAL CORP. |
| Dated: September 22, 2011 | | By: /s/ JON W. CLARK
Name: Jon W. Clark
Title: Chief Financial Officer |
Pursuant to the requirements of the Securities Exchange Act of 1934, this report has been signed below by the following persons on behalf of the registrant and in the capacities and on the dates indicated:
| | | | |
| Signatures | | Title | | Date |
/s/ ROGER M. COZZI
Roger M. Cozzi | | Chief Executive Officer,
(Principal Executive Officer) | | September 22, 2011 |
/s/ JON W. CLARK
Jon W. Clark | | Chief Financial Officer,
(Principal Financial and Accounting Officer) | | September 22, 2011 |
/s/ ALLAN J. BAUM
Allan J. Baum | | Director | | September 22, 2011 |
/s/ MARC HOLLIDAY
Marc Holliday | | Director | | September 22, 2011 |
/s/ JEFFREY E. KELTER
Jeffrey E. Kelter | | Director | | September 22, 2011 |
/s/ PAUL J. KONIGSBERG
Paul J. Konigsberg | | Director | | September 22, 2011 |
/s/ CHARLES S. LAVEN
Charles S. Laven | | Director | | September 22, 2011 |
249