UNITED STATES
SECURITIES AND EXCHANGE COMMISSION
Washington, D.C. 20549
FORM 10-K
 | | |
| x | | ANNUAL REPORT PURSUANT TO SECTION 13 OR 15(d)
OF THE SECURITIES EXCHANGE ACT OF 1934 |
For the fiscal year ended December 31, 2011
or
| | |
| o | | TRANSITION REPORT PURSUANT TO SECTION 13 OR 15(d)
OF THE SECURITIES EXCHANGE ACT OF 1934 |
For the transition period from  to
to
Commission File No. 1-32248
GRAMERCY CAPITAL CORP.
(Exact name of registrant as specified in its charter)
| | |
| Maryland | | 06-1722127 |
(State or other jurisdiction
incorporation or organization) | | (I.R.S. Employer of
Identification No.) |
420 Lexington Avenue, New York, NY 10170
(Address of principal executive offices — zip code)
(212) 297-1000
(Registrant’s telephone number, including area code)
SECURITIES REGISTERED PURSUANT TO SECTION 12(b) OF THE ACT:
| | |
| Title of Each Class | | Name of Each Exchange on Which Registered |
| Common Stock, $0.001 Par Value | | New York Stock Exchange |
| Series A Cumulative Redeemable | | |
| Preferred Stock, $0.001 Par Value | | New York Stock Exchange |
SECURITIES REGISTERED PURSUANT TO SECTION 12(g) OF THE ACT:None
Indicate by check mark if the registrant is a well-known seasoned issuer, as defined in Rule 405 of the Securities Act.Yeso Nox
Indicate by check mark if the registrant is not required to file reports pursuant to Section 13 or Section 15(d) of the Act.Yeso Nox
Indicate by check mark whether the registrant (1) has filed all reports required to be filed by Section 13 or 15(d) of the Securities Exchange Act of 1934 during the preceding 12 months (or for such shorter period that the registrant was required to file such reports), and (2) has been subject to such filing requirements for the past 90 days.Yesx Noo
Indicate by check mark whether the registrant has submitted electronically and posted on its corporate Website, if any, every Interactive Data File required to be submitted and posted pursuant to Rule 405 of Regulation S-T (Section 232.405 of this chapter) during the preceding 12 months (or for such shorter period that the registrant was required to submit and post such files).Yesx Noo
Indicate by check mark if disclosure of delinquent filers pursuant to Item 405 of Regulation S-K is not contained herein, and will not be contained, to the best of the registrant’s knowledge, in definitive proxy or information statements incorporated by reference in Part III of this Form 10-K or any amendment to this Form 10-K.o
Indicate by check mark whether the registrant is a large accelerated filer, an accelerated filer, a non-accelerated filer or a small reporting company. See the definitions of “large accelerated filer,” “accelerated filer” and “small reporting company” in Rule 12b-2 of the Exchange Act.
| | | | | | |
| Large accelerated filero | | Accelerated filerx | | Non-accelerated filero
| | Smaller reporting companyo |
| | | (Do not check if a smaller reporting company) |
Indicate by check mark whether the registrant is a shell company (as defined in Rule 12b-2 of the Exchange Act).Yeso Nox
As of March 15, 2012, there were 51,355,921 shares of the Registrant’s common stock outstanding. The aggregate market value of common stock held by non-affiliates of the registrant (44,650,419 shares) at June 30, 2011, was $135,290,770. The aggregate market value was calculated by using the closing price of the common stock as of that date on the New York Stock Exchange, which was $3.03 per share.
DOCUMENTS INCORPORATED BY REFERENCE
Portions of the registrant's Definitive Proxy Statement for its 2012 Annual Meeting of Stockholders expected to be filed within 120 days after the close of the registrant's fiscal year are incorporated by reference into Part III of this Annual Report on Form 10-K.
TABLE OF CONTENTS
GRAMERCY CAPITAL CORP.
FORM 10-K
TABLE OF CONTENTS
10-K PART AND ITEM NO.
| | |
| | Page |
PART I
| |
1. Business | | | 1 | |
1A. Risk Factors | | | 18 | |
1B. Unresolved Staff Comments | | | 53 | |
2. Properties | | | 54 | |
3. Legal Proceedings | | | 56 | |
4. Mine Safety Disclosures | | | 56 | |
PART II
| |
5. Market for Registrant’s Common Equity, Related Stockholders Matters and Issuer Purchases of Equity Securities | | | 57 | |
6. Selected Financial Data | | | 59 | |
7. Management’s Discussion and Analysis of Financial Condition and Results of Operations | | | 61 | |
7A. Quantitative and Qualitative Disclosures About Market Risk | | | 95 | |
8. Financial Statements and Supplementary Data | | | 97 | |
9. Changes in and Disagreements with Accountants on Accounting and Financial Disclosure | | | 174 | |
9A. Controls and Procedures | | | 174 | |
9B. Other Information | | | 175 | |
PART III
| |
10. Directors, Executive Officers and Corporate Governance of the Registrant | | | 176 | |
11. Executive Compensation | | | 176 | |
12. Security Ownership of Certain Beneficial Owners and Management and Related Stockholder Matters | | | 176 | |
13. Certain Relationships and Related Transactions and Director Independence | | | 176 | |
14. Principal Accounting Fees and Services | | | 176 | |
PART IV
| |
15. Exhibits, Financial Statements and Schedules | | | 177 | |
| Signatures | | | 183 | |
i
TABLE OF CONTENTS
Part I
ITEM 1. BUSINESS
General
Gramercy Capital Corp. is a self-managed, integrated commercial real estate finance and property management and investment company. Our commercial real estate finance business, which operates under the name Gramercy Finance, focuses on the direct origination, acquisition and portfolio management of whole loans, bridge loans, subordinate interests in whole loans, mezzanine loans, preferred equity, commercial mortgage-backed securities, or CMBS, and other real estate related securities. Our property management and investment business, which operates under the name Gramercy Realty, focuses on third party property management of, and to a lesser extent, ownership and management of, commercial properties leased primarily to regulated financial institutions and affiliated users throughout the United States. Neither Gramercy Finance nor Gramercy Realty is a separate legal entity, but are divisions through which our commercial real estate finance and property management and investment businesses are conducted.
At December 31, 2011, we owned commercial real estate with an aggregate book value of approximately $121.1 million, in addition to $1.1 billion of loan investments, $775.8 million of CMBS, and $279.5 million in other assets. As of December 31, 2011, approximately 5.4% of our assets were comprised of commercial property, 47.9% of debt investments, 34.4% of commercial mortgage real estate securities and 12.4% of other assets.
During 2011, we remained focused on improving our consolidated balance sheet by reducing leverage, generating liquidity from existing assets, actively managing portfolio credit, and accretively re-investing repayments in loan and CMBS investments within our CDOs. We also sought to extend or restructure Gramercy Realty’s $240.5 million mortgage loan with Goldman Sachs Mortgage Company, or GSMC, Citicorp North America, Inc., or Citicorp, and SL Green Realty Corp. (NYSE: SLG), or SL Green, or the Goldman Mortgage Loan, and Gramercy Realty’s $549.7 million senior and junior mezzanine loans with KBS Real Estate Investment Trust, Inc., or KBS, GSMC, Citicorp and SL Green, or the Goldman Mezzanine Loans. The Goldman Mortgage Loan was collateralized by approximately 195 properties held by Gramercy Realty and the Goldman Mezzanine Loans were collateralized by the equity interest in substantially all of the entities comprising our Gramercy Realty division, including its cash and cash equivalents. Subsequent to the final maturity of the Goldman Mortgage Loan and the Goldman Mezzanine Loans, we entered into a series of short term extensions to provide additional time to exchange and consider proposals for an extension, modification, restructuring or refinancing of the Goldman Mortgage Loan and the Goldman Mezzanine Loans and to explore an orderly transition of the collateral to the lenders if such discussions failed. On May 9, 2011, we announced that the scheduled maturity of the Goldman Mortgage Loan and the Goldman Mezzanine Loans occurred without repayment and without an extension or restructuring of the loans by the lenders.
Notwithstanding the maturity and non-repayment of the loans, we maintained active communications with the lenders and in September 2011, we entered into a collateral transfer and settlement agreement, or the Settlement Agreement, for an orderly transition of substantially all of Gramercy Realty’s assets to KBS, Gramercy Realty’s senior mezzanine lender, in full satisfaction of Gramercy Realty’s obligations with respect to the Goldman Mortgage Loan and the Goldman Mezzanine Loans, in exchange for a mutual release of claims among us and the mortgage and mezzanine lenders and, subject to certain termination provisions, our continued management of Gramercy Realty’s assets on behalf of KBS for a fixed fee plus incentive fees. On September 1, 2011 and on December 1, 2011, we transferred to KBS or its affiliates, interests in entities owning 317 and 116, respectively, of the 867 Gramercy Realty properties that we agreed to transfer pursuant to the Settlement Agreement and the remaining ownership interests were transferred to KBS by December 15, 2011. The aggregate carrying value for the interests transferred to KBS was approximately $2.63 billion. In July 2011, the Dana portfolio, which consisted of 15 properties totaling approximately 3.8 million rentable square feet, was transferred to its mortgage lender through a deed in lieu of foreclosure. For further discussion of the impact of the Settlement Agreement and the transfer of the Dana portfolio, see Settlement and Extinguishment of Debt within Note 2 to the consolidated financial statements.
1
TABLE OF CONTENTS
Subsequent to the execution of the Settlement Agreement, the business of Gramercy Realty has changed from being primarily an owner of commercial properties to being primarily a third-party manager of commercial properties. The scale of Gramercy Realty’s revenues has declined as a substantial portion of rental revenues from properties owned by us have been replaced with fee revenues of a substantially smaller scale for managing properties on behalf of KBS. Additionally, as assets were transferred to KBS, our total assets and liabilities declined substantially.
During 2010, we recorded impairment charges totaling $912.1 million in continuing operations to reduce the carrying value of 692 properties to estimated fair value. All of the impaired properties were part of the Gramercy Realty portfolio and served as collateral for the Goldman Mezzanine Loans. Substantially all of the impaired properties were transferred to KBS pursuant to the Settlement Agreement. As a result of recording these impairments, our total stockholders’ equity, or book equity, was negative $493.9 million as of December 31, 2010. Subsequent to the impairment, the liabilities of the impaired properties exceed the carrying value of the assets and accordingly, the subsequent transfer of assets and liabilities pursuant to the Settlement Agreement generated gains. After all transfers under the Settlement Agreement were completed, such gains reduced our negative stockholders’ equity as of December 31, 2011.
In September 2011, we entered into an asset management arrangement upon the terms and conditions set forth in the Settlement Agreement, or the Interim Management Agreement, to provide for our continued management of Gramercy Realty’s assets through December 31, 2013 for a fixed fee of $10.0 million annually, the reimbursement of certain costs and incentive fees equal to 10.0% of the excess of the equity value, if any, of the transferred collateral over $375.0 million plus all new capital invested into the transferred collateral by KBS, its affiliates and/or joint venture partners, or the Threshold Value Participation, and 12.5% of the excess equity value, if any, of the transferred collateral over $468.5 million plus all new capital invested into the transferred collateral by KBS, its affiliates and/or joint venture partners, or the Excess Value Participation. The minimum amount of the Threshold Value Participation equals $3.5 million. The Threshold Value Participation and the Excess Value Participation will be valued and paid following the earlier of December 31, 2013, subject to extension to no later than December 31, 2015, or the sale by KBS of at least 90% (by value) of the transferred collateral. Under the terms of the Interim Management Agreement, we do not forfeit our incentive fee rights unless we resign as manager or are terminated as manager for cause and, with respect to the Excess Value Participation, in the event of a Failure to Agree Termination (as defined below). The Settlement Agreement obligates the parties to negotiate in good faith to replace the Interim Management Agreement with a more complete and definitive management services agreement on or before March 31, 2012 and provides that if the parties fail to complete a definitive agreement, the Interim Management Agreement will terminate by its terms on June 30, 2012, or a Failure to Agree Termination. We promptly commenced and continue to seek to negotiate a more complete and definitive agreement with KBS not later than March 31, 2012, but there can be no assurance a Failure to Agree Termination will not occur notwithstanding our efforts.
We rely on the credit and equity markets to finance and grow our business. Despite signs of improvement in 2011, market conditions remained difficult for us with limited, if any, availability of new debt or equity capital. Our stock price has remained low and we currently have limited, if any, access to the public or private equity capital markets. In this environment, we have sought to raise capital or maintain liquidity through other means, such as modifying debt arrangements, selling assets and aggressively managing our loan portfolio to encourage repayments, as well as reducing capital and overhead expenses and as a result, have engaged in limited new investment activity, other than reinvestment of available restricted cash within our CDOs.
We may need to modify our strategies, businesses or operations, and we may incur increased capital requirements and constraints to compete in a changed business environment. Our failure to do so could materially and adversely affect our business, financial condition, results of operations and prospects.
Notwithstanding the challenges which confront our company, our board of directors remains committed to identifying and pursuing strategies and transactions that could preserve or improve our cash flows from our CDOs, increase our net asset value per share of common stock, improve our future access to capital or otherwise potentially create value for our stockholders. In considering these alternatives (which could include additional repurchases, issuances of our debt or equity securities, a strategic combination of our company,
2
TABLE OF CONTENTS
strategic sale of our assets, or modifying our business plan), we expect our board of directors will carefully consider the potential impact of any such transaction on our liquidity position and our qualifications as a REIT and our exemption from the Investment Company Act of 1940, as amended, or the Investment Company Act, before deciding to pursue it. We expect our board of directors will only authorize us to take any of these actions if they can be accomplished on terms our board of directors finds attractive. Accordingly, there is a substantial possibility that not all such actions can or will be implemented.
In June 2011, our board of directors established a special committee to direct and oversee an exploration of strategic alternatives available to us subsequent to the execution of the Settlement Agreement for Gramercy Realty’s assets. The special committee is considering the feasibility of raising debt or equity capital, the possibility of a strategic combination of our company, a strategic sale of our assets, or modifying our business plan, including making additional debt repurchases or investing our available capital outside of our CDOs. At the direction of the special committee, we engaged Wells Fargo Securities, LLC to act as our financial advisor and to assist in the process.
Our corporate offices are located in midtown Manhattan at 420 Lexington Avenue, New York, New York 10170. As of December 31, 2011, we had 121 employees. We can be contacted at (212) 297-1000. We maintain a website atwww.gkk.com. On our website, you can obtain, free of charge, a copy of our annual report on Form 10-K, quarterly reports on Form 10-Q, current reports on Form 8-K, and amendments to those reports filed or furnished pursuant to Section 13(a) or 15(d) of the Securities Exchange Act of 1934, as amended, or the Exchange Act, as soon as practicable after we file such material electronically with, or furnish it to, the Securities and Exchange Commission, or the SEC. We have also made available on our website our audit committee charter, compensation committee charter, nominating and corporate governance committee charter, code of business conduct and ethics and corporate governance principles. Information on, or accessable through, our website is not part of, and is not incorporated into, this report. You can also read and copy materials we file with the SEC at its Public Reference Room at 100 F Street, NE, Washington, DC 20549 (1-800-SEC-0330). The SEC maintains an Internet site (www.sec.gov) that contains reports, proxy and information statements, and other information regarding the issuers that file electronically with the SEC.
Corporate Structure
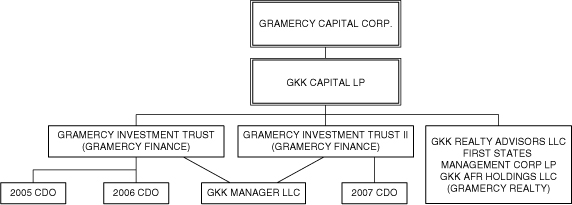
We were formed in April 2004 as a Maryland corporation and we completed our initial public offering in August 2004. We conduct substantially all of our operations through our operating partnership, GKK Capital LP, or our Operating Partnership. We are the sole general partner of our Operating Partnership. Our Operating Partnership conducts our finance business primarily through two private real estate investment trusts, or REITs, Gramercy Investment Trust and Gramercy Investment Trust II, and our commercial real estate investment and property management business through various wholly owned entities. The chart below summarizes the organizational structure of these entities as of December 31, 2011:
3
TABLE OF CONTENTS
Prior to the internalization of our management in April 2009, we were externally managed and advised by GKK Manager LLC, or the Manager, then a wholly-owned subsidiary of SL Green, which owned approximately 6.3% of the outstanding shares of our common stock as of December 31, 2011. On April 24, 2009, we completed the internalization of our management through the direct acquisition of the Manager from SL Green. As a result of the internalization, beginning in May 2009, management and incentive fees payable by us to the Manager ceased and we added the employees of the Manager to our own staff.
We have elected to be taxed as a REIT under the Internal Revenue Code of 1986, as amended, or the Internal Revenue Code, and generally will not be subject to U.S. federal income taxes to the extent we distribute our taxable income, if any, to our stockholders. We have in the past established, and may in the future establish, taxable REIT subsidiaries, or TRSs, to effect various taxable transactions. Those TRSs would incur U.S. federal, state and local taxes on the taxable income from their activities.
Unless the context requires otherwise, all references to “Gramercy,” “the Company,” “we,” “our,” and “us” in this Annual Report on Form 10-K mean Gramercy Capital Corp., a Maryland corporation, and one or more of its subsidiaries, including our Operating Partnership.
Business and Strategy
Property Management and Investment
Subsequent to the execution of the Settlement Agreement, the business of Gramercy Realty has changed from being primarily an owner of commercial properties to being primarily a third-party manager of commercial properties. The scale of Gramercy Realty’s revenues has declined as a substantial portion of rental revenues from properties owned by us, have been replaced with fee revenues of a substantially smaller scale for managing properties on behalf of KBS. Additionally, as assets were transferred to KBS, our total assets and liabilities declined substantially.
Our property management and investment business operates under the name Gramercy Realty. It focuses on third party property management of, and to a lesser extent, ownership and management of, commercial properties. Summarized in the table below are our key property portfolio statistics as of December 31, 2011 and December 31, 2010:
| | | | | | | | | | | | |
| | Number of Properties | | Rentable Square Feet | | Occupancy |
| Properties | | December 31,
2011 | | December 31,
2010(1) | | December 31,
2011 | | December 31,
2010(1) | | December 31,
2011 | | December 31, 2010(1) |
| Branches | | | 41 | | | | 571 | | | | 261,732 | | | | 3,689,190 | | | | 28.9 | % | | | 84.4 | % |
| Office Buildings | | | 15 | | | | 321 | | | | 491,084 | | | | 21,613,441 | | | | 44.7 | % | | | 82.3 | % |
| Land | | | — | | | | 2 | | | | — | | | | — | | | | — | | | | — | |
| Total | | | 56 | | | | 894 | | | | 752,816 | | | | 25,302,631 | | | | 39.2 | % | | | 82.6 | % |
| (1) | Excludes investments in unconsolidated joint ventures. Approximately 867 properties comprising approximately 20.9 million rentable square feet, or the KBS portfolio, were subject to the Settlement Agreement and ownership was transferred to KBS, in exchange for a mutual release of claims among us and the mortgage and mezzanine lenders and, subject to certain termination provisions, our continued management of the properties on behalf of KBS for a fixed fee plus incentive fees. In addition, the Dana portfolio, which consisted of 15 properties comprising approximately 3.8 million rentable square feet, was transferred to its mortgage lender through a deed in lieu of foreclosure. |
Gramercy Realty’s investment strategy was to acquire, operate and selectively dispose of commercial properties leased to investment-grade financial services companies for the purpose of generating stable earnings, substantial depreciation expense to shield us from taxes and the distribution requirements of earnings, and the potential for long-term capital appreciation in the value of the underlying real estate. After the execution of the Settlement Agreement, Gramercy Realty provides property and asset management services for the KBS portfolio in addition to operating its own portfolio of commercial real estate. We have an integrated asset management platform within Gramercy Realty to consolidate responsibility for, and control over, leasing, lease administration, property management, operations, construction management, tenant
4
TABLE OF CONTENTS
relationship management and property accounting. To the extent that we provide asset management services for third-party property owners, we provide such services in consultation with and at the direction of such owners.
Gramercy Realty seeks to capitalize on its knowledge of the market for bank branches and office properties occupied by financial institutions by applying a proactive approach to leasing, which includes: (i) identifying the most attractive and efficient use of vacant or low occupancy properties; (ii) renegotiating short-term leases to achieve longer lease terms at market rates; (iii) using market research; and (iv) utilizing a broad network of third-party brokers.
Gramercy Realty seeks to apply a customer-focused, hands-on approach to asset and property management, which includes: (i) focusing on tenant satisfaction by providing quality tenant services at affordable rental rates; (ii) hiring and closely overseeing third party property managers; and (iii) imposing strict return-on-investment procedures when evaluating capital expenditures, acquisitions, and dispositions.
In September 2011, we entered into the Interim Management Agreement to provide for our continued management of the KBS portfolio through December 31, 2013 for a fixed fee of $10.0 million annually, the reimbursement of certain costs and incentive fees equal to 10.0% of the excess of the equity value, if any, of the transferred collateral over $375.0 million plus all new capital invested into the transferred collateral by KBS, its affiliates and/or joint venture partners, or the Threshold Value Participation, and 12.5% of the excess equity value, if any, of the transferred collateral over $468.5 million plus all new capital invested into the transferred collateral by KBS, its affiliates and/or joint venture partners, or the Excess Value Participation. The minimum amount of the Threshold Value Participation equals $3.5 million. The Threshold Value Participation and the Excess Value Participation will be valued and paid following the earlier of December 13, 2013, subject to extension to no later than December 31, 2015, or the sale by KBS of at least 90% (by value) of the transferred collateral. Under the terms of the Interim Management Agreement, we do not forfeit our incentive fee rights unless we resign as manager or are terminated as manager for cause and, with respect to the Excess Value Participation, in the event of a Failure to Agree Termination (as defined below). The Settlement Agreement obligates the parties to negotiate in good faith to replace the Interim Management Agreement with a more complete and definitive management services agreement on or before March 31, 2012 and provides that if the parties fail to complete a definitive agreement, the Interim Management Agreement will terminate by its terms on June 30, 2012, or a Failure to Agree Termination. We promptly commenced and continue to seek to negotiate a more complete and definitive agreement with KBS not later than March 31, 2012, but there can be no assurance a Failure to Agree Termination will not occur notwithstanding our efforts.
Commercial Real Estate Finance
Our commercial real estate finance business operates under the name Gramercy Finance. We have invested in a diversified portfolio of real estate loans, including whole loans, bridge loans, subordinate interests in whole loans, mezzanine loans, CMBS and preferred equity involving commercial properties throughout the United States. As of December 31, 2011, Gramercy Finance also held interests in one credit tenant net lease investment, or CTL investment, and seven interests in real estate acquired through foreclosures. When evaluating transactions, we assess our risk-adjusted return and target transactions with yields that seek to provide excess returns for the risks being taken. In 2011, we engaged in a relatively small amount of new investment activity, primarily within our CDOs. In 2011, we had focused primarily on the asset management of our existing portfolio of real estate loans and CMBS within our CDOs.
We generate income principally from the spread between the yields on our assets and the cost of our borrowing and hedging activities. We have historically financed, or may finance in the future, assets through a variety of techniques, including repurchase agreements, secured and unsecured credit facilities, CDOs, unsecured junior subordinated corporate debt, issuances of CMBS, and other structured financings. In addition, we attempt to match fund interest rates with like-kind debt (i.e., fixed-rate assets are financed with fixed-rate debt, and floating rate assets are financed with floating rate debt), through the use of hedges such as interest rate swaps, caps, or through a combination of these strategies. This allows us to reduce the impact of changing interest rates on our cash flow and earnings. We actively manage our positions, using our credit, structuring and asset management resources to enhance returns.
5
TABLE OF CONTENTS
We attempt to actively manage and maintain the credit quality of our portfolio by using our management team’s expertise in structuring and repositioning investments to improve the quality and yield on managed investments. When investing in higher leverage transactions, we use guidelines and standards developed and employed by senior management, including the underwriting of collateral performance and valuation, reviewing the creditworthiness of the equity investors, securing additional forms of collateral and developing strategies to increase the likelihood of repayment. If defaults occur, we employ our asset management resources to mitigate the severity of any losses and seek to optimize the recovery from assets in the event that we foreclose upon them.
We seek to control the negotiation and structure of the debt transactions in which we invest, which enhances our ability to mitigate our losses, to negotiate loan documents that afford us appropriate rights and control over our collateral, and to have the right to control the debt that is senior to our position. We generally avoid investments where we cannot secure adequate control rights, unless we believe the default risk is very low and the transaction involves high-quality sponsors. Our flexibility to invest in all or any part of a debt capital structure enables us to participate in many transactions and to retain only the investments that meet our investment parameters.
Our commercial real estate finance investments include the following:
Whole Loans — We originate or have originated fixed-rate, permanent whole loans with terms of up to 15 years. We may separate certain of these loans into tranches, which can be securitized and resold. When we do so, we occasionally retain that component of the whole loan that we believe has the most advantageous risk-adjusted returns. The retained interest can be the senior interest, a subordinate interest, a mezzanine loan or a preferred equity interest created in connection with such whole loan origination. At origination, our whole loans typically had last-dollar loan-to-value ratios between 65% and 75%. The initial stated maturity of our whole loan investments range from five years to 15 years. We may sell these investments prior to maturity.
Bridge Loans — We offer or have offered floating rate bridge whole loans to borrowers who are seeking debt capital with a final term to maturity of not more than five years to be used in the acquisition, construction or redevelopment of a property. Typically, the borrower has identified a property in a favorable market that it believes to be poorly managed or undervalued. Bridge financing enables the borrower to employ short-term financing while improving the operating performance and physical aspects of the property and avoid burdening it with restrictive long-term debt. The bridge loans we originated are predominantly secured by first mortgage liens on the property. At origination, our bridge loans typically had last-dollar loan-to-value ratios between 70% and 80%. The initial stated maturity of our bridge loans range from two years to five years, and we frequently hold these investments to maturity.
Our bridge loans occasionally have led to additional financing opportunities since bridge facilities are often a first step toward permanent financing or a sale of the underlying real estate. We generally view securitization as a financing rather than a trading activity. We have pooled together smaller bridge loans with other loans and retained the resulting non-investment grade interests (and interest-only certificates, if any) resulting from these securitizations, which historically have taken the form of CDOs.
Subordinate Interests in Whole Loans — We purchase or have purchased from third parties, and may have retained from whole loans we originate and co-originate and securitize or sell, subordinate interests in whole loans. Subordinate interests are participation interests in mortgage notes or loans secured by a lien subordinated to a senior interest in the same loan. The subordination is generally evidenced by a co-lender or participation agreement between the holders of the related senior interest and the subordinate interest. In some instances, the subordinate interest lender may additionally require a security interest in the stock or partnership interests of the borrower as part of the transaction. When we originate whole loans, we may divide them, and securitize or sell the senior interest and keep a subordinate interest for investment, or the opposite.
At origination, our subordinate interests in whole loans typically had last-dollar loan-to-value ratios between 65% and 85%. Subordinate interest lenders have the same obligations, collateral and borrower as the senior interest lender, but typically are subordinated in recovery upon a default. Subordinate interests in whole loans share certain credit characteristics with second mortgages, in that both are subject to greater credit risk with respect to the underlying mortgage collateral than the corresponding senior interest.
6
TABLE OF CONTENTS
Subordinate interests created from bridge loans generally will have terms matching those of the whole loan of which they are a part, typically two to five years. Subordinate interests created from whole loans generally will have terms of five years to fifteen years. We expect to hold subordinate interests in whole loans to their maturity.
Upon co-origination or acquisition of subordinate interests in whole loans from third parties, we may have earned income on the investment, in addition to the interest payable on the subordinate piece, in the form of fees charged to the borrower under that note or by receiving principal payments in excess of the discounted price (below par value) we paid to acquire the note. When we create subordinate interests out of whole loans and then sell the senior interest, we allocate our basis in the whole loan among the two (or more) components to reflect the fair market value of the new instruments. We may realize a profit on sale if our allocated value is below the sale price or we may realize a loss on sale if our allocated value exceeds the sale price. Our ownership of a subordinate interest with controlling class rights, which typically means we have the ability to determine when, and in what manner, to exercise the rights and remedies afforded the holder of the senior interest, may, in the event the financing fails to perform according to its terms, cause us to elect to pursue our remedies as owner of the subordinate interest, which may include foreclosure on, or modification of, the note. In some cases, usually restricted to situations where the appraised value of the collateral for the debt falls below agreed levels relative to the total outstanding debt, the owner of the senior interest may be able to foreclose or modify the note against our wishes as holder of the subordinate interest. As a result, our economic and business interests may diverge from the interests of the holders of the senior interest. These divergent interests among the holders of each investment may result in conflicts of interest.
Mezzanine Loans — We acquire and originate or have acquired or originated mezzanine loans that are senior to the borrower’s equity in, and subordinate to a mortgage loan, on a property. These loans are secured by pledges of ownership interests, typically in whole but occasionally in part (but usually with effective sole control over all the ownership interests), in entities that directly or indirectly own the real property. In addition, we may require other collateral to secure mezzanine loans, including letters of credit, personal guarantees, or collateral unrelated to the property. We typically structure our mezzanine loans to receive a stated coupon (benchmarked usually against LIBOR, or occasionally against a Treasury index or a swap index). We may in certain select instances structure our mezzanine loans to receive a stated coupon plus a percentage of gross revenues and a percentage of the increase in the fair market value of the property securing the loan, payable upon maturity, refinancing or sale of the property.
At origination, these investments typically have initial terms from two to ten years. Some transactions entail the issuance of more than one tranche or class of mezzanine debt. At origination, our mezzanine loans usually had last-dollar loan-to-value ratios of between 65% and 90%, depending on their vintage. Mezzanine loans frequently have maturities that match the maturity of the related mortgage loan but may have shorter or longer terms. We expect to hold these investments to maturity.
Commercial Mortgage-Backed Securities (CMBS) — We acquire, or have acquired, CMBS that are created when commercial loans are pooled and securitized. CMBS are secured by or evidenced by ownership interests in a single commercial mortgage loan or a pool of mortgage loans secured by commercial properties. We expect a majority of our CMBS to be rated by at least one rating agency. CMBS are generally pass-through certificates that represent beneficial ownership interests in common law trusts whose assets consist of defined portfolios of one or more commercial mortgage loans. They are typically issued in multiple tranches whereby the more senior classes are entitled to priority distributions from the trust’s income to make specified interest and principal payments on such tranches. Losses and other shortfalls on the mortgage pool are borne by the most subordinate classes, which receive payments only after the more senior classes have received all principal and/or interest to which they are entitled.
The credit quality of CMBS depends on the credit quality of the underlying mortgage loans, which is a function of factors including but not limited to:
| • | the principal amount of loans relative to the value of the related properties; |
| • | the mortgage loan terms (e.g. amortization and remaining term); |
| • | market assessment and geographic location; |
7
TABLE OF CONTENTS
| • | construction quality and economic utility of the property; and |
| • | the creditworthiness of the tenants. |
Expected maturities of our CMBS investments range from several months to up to 15 years. We designate our CMBS investments as held to maturity or available for sale, on the date of acquisition of the investment. CMBS securities that we do not hold for the purpose of selling in the near-term but may dispose of prior to maturity, are designated as available-for-sale.
Preferred Equity — We originate or have originated preferred equity investments in entities that directly or indirectly own commercial real estate. Preferred equity is not secured, but holders have priority relative to common equity holders on cash flow distributions and proceeds from capital events. In addition, preferred holders can often enhance their position and protect their equity position with covenants that limit the entity’s activities and grant us the exclusive right to control the property after an event of default. Occasionally, the first mortgage on a property prohibits additional liens and a preferred equity structure provides an attractive financing alternative. With preferred equity investments, we may become a special limited partner or member in the ownership entity and may be entitled to take certain actions, or cause liquidation, upon a default. Preferred equity typically is more highly leveraged, with last-dollar loan-to-value ratios at origination of 85% to more than 90%. We expect our preferred equity to have mandatory redemption dates (that is, maturity dates) that range from three years to five years, and we expect to hold these investments to maturity.
The aggregate carrying values, allocated by product type and weighted average coupons of our loans, and other lending investments and CMBS investments as of December 31, 2011 and December 31, 2010, were as follows (dollars in thousands):
| | | | | | | | | | | | | | | | |
| | | | | | | | | | | | | | | | |
| | Carrying Value(1) | | Allocation by
Investment Type | | Fixed Rate
Average Yield | | Floating Rate Average
Spread over LIBOR(2) |
| | | 2011 | | 2010 | | 2011 | | 2010 | | 2011 | | 2010 | | 2011 | | 2010 |
| Whole loans, floating rate | | $ | 689,685 | | | $ | 659,095 | | | | 63.8 | % | | | 58.7 | % | | | — | | | | — | | | | 331 bps | | | | 330 bps | |
| Whole loans, fixed rate | | | 202,209 | | | | 132,268 | | | | 18.7 | % | | | 11.8 | % | | | 8.35 | % | | | 7.16 | % | | | — | | | | — | |
| Subordinate interests in whole loans, floating rate | | | 25,352 | | | | 75,066 | | | | 2.3 | % | | | 6.7 | % | | | — | | | | — | | | | 575 bps | | | | 297 bps | |
| Subordinate interests in whole loans, fixed rate | | | 89,914 | | | | 46,468 | | | | 8.3 | % | | | 4.1 | % | | | 10.50 | % | | | 6.01 | % | | | — | | | | — | |
| Mezzanine loans, floating rate | | | 46,002 | | | | 152,349 | | | | 4.3 | % | | | 13.5 | % | | | — | | | | — | | | | 860 bps | | | | 754 bps | |
| Mezzanine loans, fixed rate | | | 23,847 | | | | 48,828 | | | | 2.2 | % | | | 4.3 | % | | | 10.34 | % | | | 12.69 | % | | | — | | | | — | |
| Preferred equity, floating rate | | | 3,615 | | | | 5,224 | | | | 0.3 | % | | | 0.5 | % | | | — | | | | — | | | | 234 bps | | | | 350 bps | |
| Preferred equity, fixed rate | | | 1,295 | | | | 4,230 | | | | 0.1 | % | | | 0.4 | % | | | — | | | | 7.25 | % | | | — | | | | — | |
| Subtotal/Weighted average | | | 1,081,919 | | | | 1,123,528 | | | | 100.0 | % | | | 100.0 | % | | | 9.08 | % | | | 8.09 | % | | | 370 bps | | | | 400 bps | |
| CMBS, floating rate | | | 47,855 | | | | 50,798 | | | | 6.2 | % | | | 5.1 | % | | | — | | | | — | | | | 96 bps | | | | 394 bps | |
| CMBS, fixed rate | | | 727,957 | | | | 954,369 | | | | 93.8 | % | | | 94.9 | % | | | 8.22 | % | | | 8.37 | % | | | — | | | | — | |
| Subtotal/Weighted average | | | 775,812 | | | | 1,005,167 | | | | 100.0 | % | | | 100.0 | % | | | 8.22 | % | | | 8.37 | % | | | 96 bps | | | | 394 bps | |
| Total | | $ | 1,857,731 | | | $ | 2,128,695 | | | | 100.0 | % | | | 100.0 | % | | | 8.48 | % | | | 8.32 | % | | | 354 bps | | | | 400 bps | |
| (1) | Loans and other lending investments and CMBS investments are presented net of unamortized fees, discounts, unfunded commitments, reserves for loan losses and other adjustments. |
| (2) | Spreads over an index other than 30 day-LIBOR have been adjusted to a LIBOR based equivalent. In some cases, LIBOR is floored, giving rise to higher current effective spreads. |
8
TABLE OF CONTENTS
The percentage of non-performing loans and sub-performing loans were as follows (dollars in thousands):
| | | | | | | | | | | | |
| | Number of
Investments | | Unpaid
Principal
Balance | | Carrying
Value | | Weighted
Average Last Dollar Loan to Value(1) | | Non-performing | | Sub-performing |
| Whole loans | | | 32 | | | $ | 1,051,285 | | | $ | 891,895 | | | | 55.8 | % | | | 5.8 | % | | | 5.0 | % |
| Subordinate interests in whole loans | | | 5 | | | | 134,932 | | | | 115,265 | | | | 54.5 | % | | | — | | | | — | |
| Mezzanine loans | | | 7 | | | | 128,244 | | | | 69,849 | | | | 69.5 | % | | | — | | | | — | |
| Preferred equity | | | 3 | | | | 68,116 | | | | 4,910 | | | | 76.0 | % | | | — | | | | 26.3 | % |
| Total | | | 47 | | | $ | 1,382,577 | | | $ | 1,081,919 | | | | 56.6 | % | | | 5.8 | % | | | 4.2 | % |
| (1) | Loan to Value is based upon the carrying value as of December 31, 2011 and the appraised value at the date of origination. Interest only strips have no appraised value for the calculation. |
The period during which we are permitted to reinvest principal payments on the underlying assets into qualifying replacement collateral for our 2005 CDO and our 2006 CDO expired in July 2010 and July 2011, respectively, and will expire for our 2007 CDO in August 2012. In the past, our ability to reinvest has been instrumental in maintaining compliance with the overcollateralization and interest coverage tests for our CDOs. Following the conclusion of the reinvestment period in our CDOs, our ability to maintain compliance with such tests for that CDO will be negatively impacted. Additionally, the conclusion of the reinvestment period results in reduced investment activity for us as available cash in the CDOs will generally be used for the repayment of principal on the CDO bonds and will not be available for new investment activity.
As of December 31, 2011, Gramercy Finance also held interests in one CTL investment and seven interests in real estate acquired through foreclosures.
Financing Strategy
Our financing strategy historically had focused on the use of match-funded financing structures. This means that we sought whenever possible to match the maturities of our financial obligations with the maturities of our debt and CMBS investments to minimize the risk that we have to refinance our liabilities prior to the maturities of our assets, and to reduce the impact of changing interest rates on our cash flow and earnings. In addition, subject to maintaining our qualification as a REIT, we seek whenever possible to match fund interest rates with like-kind debt (i.e., fixed-rate assets are financed with fixed-rate debt, and floating rate assets are financed with floating rate debt), through the use of hedges such as interest rate swaps, caps, or through a combination of these strategies. This allowed us to reduce the impact on our cash flow and earnings of changing interest rates. We used short-term financing in the form of repurchase agreements, unsecured revolving credit facilities and bridge financings in conjunction with or prior to the implementation of longer-term match-funded financing.
Gramercy Realty properties subject to long-term remaining lease terms were typically financed with long-term, fixed rate mortgage loans issued by life insurance companies or other institutional lenders. However, we had entered into relatively short-term borrowing arrangements, such as the Goldman Mortgage Loan and Goldman Mezzanine Loans which are described more fully in Note 9 to the consolidated financial statements. For funding in our Gramercy Finance business, we have historically utilized securitization structures, including CDOs, as well as other match-funded financing structures. Our CDOs are multiple class debt securities, or bonds, secured by pools of assets, such as CMBS, bridge loans, permanent loans, subordinate interests in whole loans and mezzanine loans. In our CDOs, the assets are owned via sale, assignment or participation by the issuer and co-issuer of the applicable CDO and subject to trustee oversight for the benefit of the holders of the bonds. The bonds were rated by one or more rating agencies. One or more classes of the bonds were marketed to a wide variety of fixed income investors, which enabled us to achieve a relatively low cost of long-term financing. CDOs were a suitable long-term financing vehicle for our investments because they enabled us to maintain our strategy of funding substantially all of our assets and related liabilities using the same, or similar, LIBOR benchmark, lock-in a long-term cost of funds tied to LIBOR, and reduced the risk that we have to refinance our liabilities prior to the maturities of our investments.
9
TABLE OF CONTENTS
Each CDO may be replenished, pursuant to limitations imposed by the indenture (including compliance with certain financial covenants) and rating agency guidelines, with substitute collateral for debt investments that are repaid or sold during the first five years of the CDO. Thereafter, the CDO securities will be retired in sequential order from senior-most to junior-most as debt investments are repaid or sold. The financial statements of the issuers are consolidated in our financial statements. The originally rated investment grade notes in our CDOs are treated as a secured financing, and are non-recourse to us. Proceeds from the sale of the originally rated investment grade notes issued in each CDO were used to repay outstanding debt under our repurchase agreements and to fund additional investments.
Our charter and bylaws do not limit the amount of indebtedness we can incur. Our board of directors has discretion to deviate from or change our indebtedness policy at any time. However, we seek to maintain an adequate capital base to protect against various business environments in which our financing and hedging costs might exceed the interest income from our investments. These conditions could occur, for example, due to credit losses or when, due to interest rate fluctuations, interest income on our investment lags behind interest rate increases on our borrowings, which are predominantly variable rate. We use leverage for the sole purpose of financing our assets and not for the purpose of speculating on changes in interest rates.
We have historically relied on the securitization markets as a source of efficient match-funded financing structures for our portfolio of commercial real estate loans and CMBS investment portfolio. It is unlikely that in the near term we will be able to issue liabilities similar to our existing CDOs. In 2011, the capital markets environment remained difficult for us with limited, if any, availability of new debt or equity capital. Our stock price remained low and we currently have limited, if any, availability to the public or private equity capital markets. In this environment, we have sought to raise capital or maintain liquidity through other means, such as modifying debt arrangements, selling assets and aggressively managing our loan portfolio to encourage repayments, as well as reducing capital and overhead expenses and as a result, have engaged in limited new investment activity, other than reinvestment of available restricted cash with our CDOs.
Origination, Acquisition and Asset Management
Our origination, acquisition and asset management of investments are based on careful review and preparation, and generally proceeds as follows:
| • | potential investments are analyzed for consistency with investment parameters adopted by our board of directors; |
| • | potential investment transactions considered are presented at a pipeline meeting attended by our senior executive officers; and |
| • | prior to consummation, potential investment opportunities must receive the required level of approvals from our senior management and, when applicable, our board of directors as described more fully below. |
Investment transactions of $3.0 million or less must be approved by one of our senior executive officers. The affirmative vote of all members of a credit committee consisting, of our most senior officers, is necessary to approve all transactions over $3 million. The investment committee of our board of directors must unanimously approve all transactions involving investments of (i) $50 million or more with respect to CMBS investments, (ii) $35 million or more with respect to whole loans, (iii) $30 million or more with respect to subordinate interests in whole loans, and (iv) $20 million or over with respect to mezzanine loans, preferred equity, CTL and real estate investments. The full board of directors must approve investments (i) over $75 million with respect to whole loans and CMBS investments, (ii) over $65 million with respect to subordinate interests in whole loans, (iii) over $55 million with respect to mezzanine loans, and (iv) over $50 million with respect to preferred equity, CTL and other real estate investments.
Origination
We have an extensive national network of relationships with property owners, developers, mortgage loan brokers, commercial and investment banks and institutional investors. We may originate investments in direct transactions with borrowers, we co-originate with or acquire existing assets from third parties, primarily financial institutions and we may occasionally co-invest with other institutional partners.
10
TABLE OF CONTENTS
Acquisition
Once a potential investment has been identified, we perform comprehensive financial, structural, property, real estate market, operational and legal due diligence to assess the risks of the investment. We generally review the following criteria as part of the underwriting process, where applicable:
| • | the historic, in-place and projected property revenues and expenses; |
| • | the potential for near-term revenue growth and opportunity for expense reduction and increased operating efficiencies; |
| • | accountants may be engaged to audit operating expense recovery income; |
| • | the property’s location and its attributes; |
| • | the valuation of the property based upon financial projections prepared by us and confirmed by an independent “as is” and/or “as stabilized” appraisal; |
| • | market assessment, including, review of tenant lease files, surveys of property sales and leasing comparables based on conversations with local property owners, leasing brokers, investment sales brokers and other local market participants, and an analysis of area economic and demographic trends, and a review of an acceptable mortgagee’s title policy; |
| • | market rents, leasing projections for major vacant spaces and near-term vacancies, frequently prepared by commercial leasing brokers with local knowledge, or by members of our leasing and asset management group, and confirmed by discussion with other owners of competitive commercial properties in the same sub-market; |
| • | the terms and form of the leases at a property; |
| • | structural and environmental review of the property, including review of engineering and environmental reports and a site inspection, to determine future maintenance and capital expenditure requirements; |
| • | the requirements for any reserves, including those for immediate repairs or rehabilitation, replacement reserves, tenant improvement and leasing commission costs, real estate taxes and property, casualty and liability insurance; |
| • | the “Net Cash Flow” for a property, which is a set of calculations and adjustments prepared to assist in evaluating a property’s cash flows. The Net Cash Flow is generally the estimated stabilized annual revenue derived from the use and operation of the property (consisting primarily of rental income and reimbursement of expenses where applicable) after an allowance for vacancies, concessions and credit losses, less estimated stabilized annual expenses; |
| • | for financing transactions, credit quality of the borrower and sponsors through background checks and review of financial strength and real estate operating experience; and |
| • | for real estate investments, the credit quality and financial conditions of the financial institution that occupies all, or substantially all, of the property(ies) considered for acquisition. |
For debt investments at Gramercy Finance, additional key factors that are considered in credit decisions include, but are not limited to, debt service coverage, loan-to-value ratios and property and financial operating performance. Consideration is also given to other factors such as the experience, financial strength, reputation and investment track record of the borrower and individual sponsors, additional forms of collateral and identified likely strategies to effect repayment. Once diligence is completed, we determine the level in the capital structure at which an investment will be made, the pricing for such an investment, and the required legal and structural protections.
11
TABLE OF CONTENTS
Asset Management
Our leasing and asset management group within Gramercy Realty is organized by geographic region and provides: tenant relationship management, leasing, operations, property management, lease administration, property accounting and construction management. Regional heads are primarily accountable for the profitability and investment performance of their portfolios, and have control over income statements and capital expenditures, subject to oversight and approval of senior management. To the extent that we provide asset management services for third-party property owners, we provide such services in consultation with and at the direction of such owners. Our approach is intended to provide greater control over operations, capital expenditures, and return on investment.
Our loan servicing and asset management group within Gramercy Finance monitors our debt investments to identify any potential underperformance of the asset and work to remedy the situation in an expeditious manner in order to mitigate any effects of underperformance. The asset manager is responsible for understanding our business plan with respect to each investment and the borrower’s business plan with respect to each property underlying our debt investment and monitoring performance measured against that plan. We believe that asset management is a vital component of our business because it enables us to be responsive, timely, anticipate changes to financing requirements, develop a strong relationship that can lead to repeat business and improve the likelihood of recovering investment capital.
Operating Policies
Investment and Borrowing Guidelines
We operate pursuant to the following general guidelines for our investments and borrowings:
| • | no investments are made that we believe would cause us to fail to qualify as a REIT; |
| • | no investments are made that we believe would cause us to be regulated as an investment company under the Investment Company Act; |
| • | substantially all assets and investments are financed in whole or in part through mortgages, securitization, syndication and secured borrowings, and assets intended for inclusion in traditional securitization transactions will be hedged, where possible, against movements in the applicable swap yield through customary techniques; |
| • | we engage an outside advisory firm to assist in executing and monitoring hedges, advising management on the appropriateness of such hedges, and establishing the appropriate tax and accounting treatment of our hedges; and |
| • | we will not co-invest with SL Green or any of its affiliates unless the terms of such transaction are approved by a majority of our independent directors. |
These investment guidelines may be changed by our board of directors without the approval of our stockholders.
For debt investments, the affirmative vote of all members of a credit committee consisting of our most senior executive officers is necessary to approve all transactions over $3 million.
Hedging Activities
We use a variety of commonly used derivative instruments that are considered conventional, or “plain vanilla” derivatives, including interest rate swaps, caps, collars and floors, in our risk management strategy to limit the effects of changes in interest rates on our operations. Each of our CDOs maintains a minimum amount of allowable unhedged interest rate risk. The CDO that closed in 2005 permits a minimum amount of unhedged interest rate risk of 20% of the net outstanding principal balance and both the CDO that closed in 2006 and the CDO that closed in 2007 permit a minimum amount of unhedged interest rate risk of 5% of the net outstanding principal balance. Our hedging strategy consists of entering into interest rate swap and interest rate cap contracts. The value of our derivatives may fluctuate over time in response to changing market conditions, and will tend to change inversely with the value of the risk in our liabilities that we intend to hedge. Hedges are sometimes ineffective because the correlation between changes in value of the underlying
12
TABLE OF CONTENTS
investment and the derivative instrument is less than was expected when the hedging transaction was undertaken. We continuously monitor the effectiveness of our hedging strategies and we have retained the services of an outside financial services firm with expertise in the use of derivative instruments to advise us on our overall hedging strategy, to effect hedging trades, and to provide the appropriate designation and accounting of all hedging activities from a GAAP and tax accounting and reporting perspective.
These instruments are used to hedge as much of the interest rate risk as we determine is in the best interest of our stockholders, given the cost of such hedges. To the extent that we enter into a hedging contract to reduce interest rate risk on indebtedness incurred to acquire or carry real estate assets, any income that we derive from the contract is not considered income for purposes of the REIT 95% gross income test and is either non-qualifying for the 75% gross income test (hedges entered into prior to August 1, 2008), or is not considered income for purposes of the 75% gross income test (hedges entered into after July 31, 2008). This change in character for the 75% gross income test was included in the Housing and Economic Recovery Act of 2008. We can elect to bear a level of interest rate risk that could otherwise be hedged when we believe, based on all relevant facts, that bearing such risk is advisable.
Disposition Policies
We evaluate our assets on a regular basis to determine if they continue to satisfy our investment criteria. Subject to market conditions certain restrictions applicable to REITs, we may sell our investments opportunistically and use the proceeds of any such sale for debt reduction, additional acquisitions or working capital purposes.
Equity Capital Policies
Subject to applicable law, our board of directors has the authority, without further stockholder approval, to issue additional authorized common stock and preferred stock or otherwise raise capital, including through the issuance of senior securities, in any manner and on the terms and for the consideration it deems appropriate.
We may, under certain circumstances, repurchase our common or preferred stock in private transactions with our stockholders if those purchases are approved by our board of directors. Our board of directors has no present intention of causing us to repurchase any shares, and any action would only be taken in conformity with applicable federal and state laws and the applicable requirements for qualifying as a REIT, for so long as our board of directors concludes that we should remain a qualified REIT.
Other Policies
We operate in a manner that we believe will not subject us to regulation under the Investment Company Act. We may invest in the securities of other issuers for the purpose of exercising control over such issuers. We do not underwrite the securities of other issuers.
Future Revisions in Policies and Strategies
Our board of directors has the power to modify or waive our investment guidelines, policies and strategies. Among other factors, developments in the market that either affects the policies and strategies mentioned herein or that change our assessment of the market may cause our board of directors to revise our investment guidelines, policies and strategies.
Competition
In our investment activities, we compete with other REITs, specialty finance companies, savings and loan associations, banks, mortgage bankers, insurance companies, mutual funds, hedge funds, institutional investors, investment banking firms, private equity firms, other lenders, governmental bodies and other entities, which may have greater financial resources and lower costs of capital available to them than we have. We also compete with numerous commercial properties for tenants. Some of the properties we compete with may be newer or have more desirable locations or the competing properties’ owners may be willing to accept lower rents than are acceptable to us. In addition, the competitive environment for leasing is affected considerably by a number of factors including, among other things, changes in economic factors and supply and demand of space. These factors may make it difficult for us to lease existing vacant space and space associated with future lease expirations at rental rates that are sufficient to meeting our capital needs.
13
TABLE OF CONTENTS
To the extent that a competitor is willing to risk larger amounts of capital in a particular transaction or to employ more liberal standards when evaluating potential investments than we are, our origination volume and profit margins for our investment portfolio could be adversely affected. Our competitors may also be willing to accept lower returns on their investments and may succeed in originating or acquiring assets that we have targeted for acquisition. Although we believe that we are positioned to compete effectively in each facet of our business, there is considerable competition in our market sector and there can be no assurance that we will compete effectively or that we will not encounter further increased competition in the future that could limit our ability to conduct our business effectively.
Compliance With The Americans With Disabilities Act of 1990
Properties that we acquire, and the properties underlying our investments, are required to meet federal requirements related to access and use by disabled persons as a result of the Americans with Disabilities Act of 1990, or the Americans with Disabilities Act. In addition, a number of additional federal, state and local laws may require modifications to any properties we purchase, or may restrict further renovations of our properties, with respect to access by disabled persons. Noncompliance with these laws or regulations could result in the imposition of fines or an award of damages to private litigants. Additional legislation could impose additional financial obligations or restrictions with respect to access by disabled persons. If required changes involve greater expenditures than we currently anticipate, or if the changes must be made on a more accelerated basis, our ability to make distributions could be adversely affected.
Industry Segments
We have determined that we operate two reportable operating segments: Finance and Realty. The reportable segments were determined based on the management approach, which looks to our internal organizational structure. These two lines of business require different support infrastructures.
The Realty segment includes substantially all of our activities related to third party property management of, and investment and ownership of, commercial properties leased primarily to regulated financial institutions and affiliated users through-out the United States. The Realty segment generates revenues from fee income related to the Interim Management Agreement for properties owned by KBS and generates rental revenues from properties owned by us.
The Finance segment includes all of our activities related to origination, acquisition and portfolio management of whole loans, bridge loans, subordinate interests in whole loans, mezzanine loans, preferred equity, CMBS and other real estate related securities. The Finance segment primarily generates revenues from interest income on loans, other lending investments and CMBS owned in our CDOs.
Segment revenue and profit information is presented in Note 20 to the consolidated financial statements.
Employees
As of December 31, 2011, we had 121 employees. Our employees are not represented by a collective bargaining agreement.
Corporate Governance and Internet Address; Where Readers Can Find Additional Information
We emphasize the importance of professional business conduct and ethics through our corporate governance initiatives. Our board of directors consists of a majority of independent directors; the Audit, Nominating and Corporate Governance, and Compensation Committees of our board of directors are composed exclusively of independent directors. We have adopted corporate governance guidelines and a code of business conduct and ethics.
We file annual, quarterly and current reports, proxy statements and other information required by the Exchange Act with the SEC. Readers may read and copy any document that we file at the SEC’s Public Reference Room located at 100 F Street, N.E., Washington, D.C. 20549, U.S.A. Please call the SEC at 1-800-SEC-0330 for further information on the Public Reference Room. Our SEC filings are also available to the public from the SEC’s internet site atwww.sec.gov. Copies of these reports, proxy statements and other information can also be inspected at the offices of the New York Stock Exchange, Inc., 20 Broad Street, New York, New York 10005.
14
TABLE OF CONTENTS
Our internet site iswww.gkk.com. We make available free of charge through our internet site our annual reports on Form 10-K, quarterly reports on Form 10-Q, current reports on Form 8-K, proxy statements and Forms 3, 4 and 5 filed on behalf of directors and executive officers and any amendments to those reports filed or furnished pursuant to the Exchange Act as soon as reasonably practicable after we electronically file such material with, or furnish it to, the SEC. Also posted on our website in the “Investor Relations — Corporate Governance” section are charters for our Audit Committee, Compensation Committee and Nominating and Corporate Governance Committee as well as our Corporate Governance Guidelines and our Code of Business Conduct and Ethics governing our directors, officers and employees. Information on, or accessible through, our website is not a part of, and is not incorporated into, this report.
Investment Company Act Exemption
We have conducted our operations and intend to continue to conduct our operations so as not to become regulated as an investment company under the Investment Company Act. We believe that there are a number of exclusions or exemptions under the Investment Company Act that may be applicable to us. We will either be excluded from the definition of an investment company under Section 3(a)(1)(C) of the Investment Company Act, by owning or proposing to acquire “investment securities” having a value not exceeding 40% of the value of our total assets (exclusive of U.S. Government securities and cash items) on an unconsolidated basis, or by qualifying for the exclusions from registration provided by Sections 3(a)(1)(A), 3(c)(5)(C) and/or 3(c)(6) of the Investment Company Act. We will monitor our portfolio periodically and prior to each acquisition to confirm that we continue to qualify for the relevant exclusion or exemption.
Qualifying for the Section 3(c)(5)(C) exemption requires that at least 55% of our portfolio be comprised of “qualifying assets,” and a total of at least 80% of our portfolio be comprised of “qualifying assets” and “real estate-related assets,” a category that includes qualifying assets. We generally expect whole mortgage loans, real property investments, and Tier 1 mezzanine loans to be qualifying assets, in each case meeting certain qualifications based on SEC staff no-action letters. The treatment of distressed debt securities as qualifying assets is based on the characteristics of the particular type of loan, including its foreclosure rights. Although SEC staff no-action letters have not specifically addressed the categorization of these types of assets, we believe junior (first loss) interests in CMBS pools may constitute qualifying assets under Section 3(c)(5)(C), provided that we have the unilateral right to foreclose, directly or indirectly, on the mortgages in the pool and that we may act as the controlling class or directing holder of the pool. Tier 1 mezzanine loans are loans granted to a mezzanine borrower that directly owns interests in the entity that owns the property being financed. Subordinate interests in whole loans may constitute qualifying assets under Section 3(c)(5)(C), provided that we have, among other things, approval rights in connection with any material decisions pertaining to the administration and servicing of the relevant mortgage loan and, in the event that the mortgage loan becomes non-performing, we have effective control over the remedies relating to the enforcement of the loan, including ultimate control of the foreclosure process. We generally do not treat preferred equity investments as qualifying assets. In relying on the exemption provided by Section 3(c)(5)(C), we also make investments so that at least 80% of our portfolio is comprised of qualifying assets and real estate-related assets. We expect that all of these classes of investments will be considered real estate assets under the Investment Company Act for the purposes of the 80% investment threshold.
Qualification for the Section 3(a)(1)(C), Section 3(c)(5)(C) and/or Section 3(c)(6) exclusions or exemptions may limit our ability to make certain investments. No assurance can be given that the SEC staff will concur with our classification of our assets, or that the SEC staff will not, in the future, issue further guidance that may require us to reclassify those assets for purpose of qualifying for an exemption or exclusion from regulation under the Investment Company Act. To the extent that the staff of the SEC provides more specific guidance regarding any of the matters bearing upon the definition of investment company and the exceptions to that definition, we may be required to adjust our investment strategy accordingly. Any additional guidance from the staff of the SEC could provide additional flexibility to us, or it could further inhibit our ability to pursue the investment strategy we have chosen.
In August 2011, the SEC solicited public comment on a wide range of issues relating to Section 3(c)(5)(C) of the Investment Company Act, including the nature of the assets that qualify for purposes of the exemption and whether mortgage REITs should be regulated in a manner similar to investment companies. There can be no assurance that the laws and regulations governing the Investment Company Act
15
TABLE OF CONTENTS
status of REITs, including the Division of Investment Management of the SEC providing more specific or different guidance regarding these exemptions, will not change in a manner that adversely affects our operations. If we or our subsidiaries fail to maintain an exception or exemption from the Investment Company Act, we could, among other things, be required either to (a) change the manner in which we conduct our operations to avoid being required to register as an investment company, (b) effect sales of our assets in a manner that, or at a time when, we would not otherwise choose to do so, or (c) register as an investment company, any of which would negatively affect the value of our common stock, the sustainability of our business model, and our ability to make distributions which could have an adverse effect on our business and the market price for our shares of common stock.
Environmental Matters
Under various federal, state and local environmental laws, ordinances and regulations, a current or previous owner of real estate (including, in certain circumstances, a secured lender that succeeds to ownership or control of a property) may become liable for the costs of removal or remediation of certain hazardous or toxic substances at, on, under or in its property. Those laws typically impose cleanup responsibility and liability without regard to whether the owner or control party knew of or was responsible for the release or presence of such hazardous or toxic substances. The costs of investigation, remediation or removal of those substances may be substantial. The owner or control party of a site may be subject to common law claims by third parties based on damages and costs resulting from environmental contamination emanating from a site. Certain environmental laws also impose liability in connection with the handling of or exposure to asbestos-containing materials, pursuant to which third parties may seek recovery from owners of real properties for personal injuries associated with asbestos-containing materials. Absent succeeding to ownership or control of real property, a secured lender is not likely to be subject to any of these forms of environmental liability. We are not currently aware of any environmental issues which could materially affect us or our operations.
Federal regulations require building owners and those exercising control over a building’s management to identify and warn, via signs and labels, of potential hazards posed by workplace exposure to installed asbestos-containing materials and potentially asbestos-containing materials in the building. The regulations also set forth employee training, record keeping and due diligence requirements pertaining to asbestos- containing materials and potential asbestos-containing materials. Significant fines can be assessed for violation of these regulations. Building owners and those exercising control over a building’s management may be subject to an increased risk of personal injury lawsuits by workers and others exposed to asbestos-containing materials and potentially asbestos-containing materials as a result of these regulations. The regulations may affect the value of a building containing asbestos-containing materials and potential asbestos-containing materials in which we have invested. Federal, state and local laws and regulations also govern the removal, encapsulation, disturbance, handling and/or disposal of asbestos-containing materials and potential asbestos-containing materials when such materials are in poor condition or in the event of construction, remodeling, renovation or demolition of a building. Such laws may impose liability for improper handling or a release into the environment of asbestos-containing materials and potential asbestos-containing materials and may provide for fines to, and for third parties to seek recovery from, owners or operators of real properties for personal injury or improper work exposure associated with asbestos-containing materials and potentially asbestos-containing materials.
Prior to closing any property acquisition, we obtain environmental assessments in a manner we believe prudent in order to attempt to identify potential environmental concerns at such properties. These assessments are carried out in accordance with an appropriate level of due diligence and generally include a physical site inspection, a review of relevant federal, state and local environmental and health agency database records, one or more interviews with appropriate site-related personnel, review of the property’s chain of title and review of historic aerial photographs and other information on past uses of the property. We may also conduct limited subsurface investigations and test for substances of concern where the result of the first phase of the environmental assessments or other information indicates possible contamination or where our consultants recommend such procedures.
While we purchase many of our properties on an “as is” basis, our purchase contracts for such properties contain an environmental contingency clause, which permits us to reject a property because of any
16
TABLE OF CONTENTS
environmental hazard at such property. However, we do acquire properties which may have asbestos abatement requirements, for which we set aside appropriate reserves.
We believe that our portfolio is in compliance in all material respects with all federal and state regulations regarding hazardous or toxic substances and other environmental matters.
Insurance
We carry commercial liability and all risk property insurance, including flood, where required, earthquake, wind and terrorism coverage, on substantially all of the properties that we own. For certain net leased properties, however, we rely on our tenant’s insurance and do not maintain separate coverage. We continue to monitor the state of the insurance market and the scope and costs of specialty coverage, including flood, earthquake, wind and terrorism. However, we cannot anticipate what coverage will be available on commercially reasonable terms in future policy years.
17
TABLE OF CONTENTS
ITEM 1A. RISK FACTORS
Risks Related to Our Business
Focus on recapitalizing our Company has and may continue to reduce new investment activity.
Subsequent to the execution of the Settlement Agreement with respect to Gramercy Realty, our board of directors continues to explore various means by which we might improve our position and thereby potentially create value for our stockholders, and has created a special committee to evaluate strategic alternatives. The Company has engaged Wells Fargo Securities, LLC to act as financial adviser to assist in this process. It is not possible to predict whether or when any such actions can or will be implemented. During this period, new investment activity has and may continue to be limited. A reduction in new investment activity may have an adverse effect on our investment income and our net income available to stockholders.
A negative book equity balance may impair our ability to raise new debt or equity capital.
In September 2011, we entered into the Settlement Agreement for an orderly transition of substantially all of Gramercy Realty’s assets to KBS, in exchange for a mutual release of claims among us and the mortgage and mezzanine lenders and, subject to certain termination provisions, an arrangement for our continued management of Gramercy Realty’s assets on behalf of KBS for a fixed fee plus incentive fees. During 2010, we recorded impairment charges totaling $912.1 million in continuing operations to reduce the carrying value of 692 properties to estimated fair value. All of the impaired properties served as collateral for the Goldman Mezzanine Loans and were part of the Gramercy Realty portfolio. As a result of recording these impairments, our book equity balance is negative, although the negative balance improved after Gramercy Realty’s assets were transferred and the corresponding liabilities were removed from our balance sheet in connection with the Settlement Agreement. The capital markets may have a negative perception of our long-term and short-term financial prospects due to a negative book equity balance and accordingly, our ability to raise new debt or equity capital could be impaired.
Termination of our Interim Management Agreement could harm our business.
We have agreed to manage the Gramercy Realty assets on behalf KBS pursuant to an Interim Management Agreement through December 31, 2013 for a fixed fee of $10.0 million annually, the reimbursement of certain costs and the potential to earn certain incentive fees as therein provided. However, the Settlement Agreement obligates the parties to negotiate in good faith to replace the Interim Management Agreement with a more complete and definitive management services agreement on or before March 31, 2012 and provides that if the parties fail to complete a definitive agreement, the Interim Management Agreement will terminate by its terms on June 30, 2012, or a Failure to Agree Termination. We promptly commenced and continue to seek to negotiate a more complete and definitive agreement with KBS not later than March 31, 2012, but there can be no assurance a Failure to Agree Termination will not occur notwithstanding our efforts. Upon any termination of the Interim Management Agreement, our management fees, after payment of any termination payments required, would cease, thereby reducing our expected revenues, which could harm our business.
Failure to comply with CDO coverage tests may have a negative impact on our liquidity and net cash flows.
The terms of our CDOs include certain overcollateralization and interest coverage tests, which are used primarily to determine whether and to what extent principal and interest paid on the debt securities and other assets that serve as collateral underlying our CDOs may be used to pay principal and interest on the various classes of notes payable issued by our CDOs. If any of these CDO tests are not satisfied, distributions that we currently receive with respect to our equity interests in our CDOs, interest and principal payments that we currently receive on certain of the tranches of CDO notes that we hold, as well as the subordinate management fees that we currently receive, will instead be redirected to pay principal on the senior-most tranches of CDO notes. Because a substantial portion of our operating cash flow consists of cash distributions to us with respect to our equity interests in our 2006 CDO, and a lesser but still material portion of our operating cash flow for fiscal year 2011 was received from our 2005 CDO, failure to satisfy these tests for either or both CDOs could materially and adversely affect our liquidity and net cash flows. As of January 2012, the most recent distribution date, our 2005 CDO and our 2006 CDO were in compliance with
18
TABLE OF CONTENTS
interest coverage and asset overcollateralization covenants, and we received cash distributions from each in January 2012. The compliance margins were narrow, however, and relatively small declines in collateral performance and credit metrics could cause either or both CDOs to fall out of compliance. Our 2005 CDO failed its overcollateralization test at the October 2011, April 2011 and January 2011 distribution dates. Our 2007 CDO failed its overcollateralization test beginning with the November 2009 distribution date and remains out of compliance. We cannot be certain that the CDO tests will continue to be satisfied and that we will continue to receive cash flows relating to our 2005 CDO and 2006 CDO in the future. If the cash flow from our 2005 CDO and/or our 2006 CDO is redirected, our business, financial condition, and results of operations would be materially and adversely affected.
Liquidity in the capital markets is essential to our businesses and future growth and we rely on external sources to finance a significant portion of our operations. We have limited liquidity and we may be required to pursue certain measures in order to maintain or enhance our liquidity.
Liquidity is essential to our business and our ability to operate and grow and to fund existing obligations. A primary source of liquidity for us has been the equity and debt capital markets, including issuing common equity, perpetual preferred equity and trust preferred securities. We depend on external financing to fund the growth of our business mainly because, as a REIT, we are required under the Internal Revenue Code to distribute 90% of our taxable income to our stockholders, including taxable income where we do not receive corresponding cash. Our access to equity or debt financing depends on the willingness of third parties to make equity investments in us and provide us with corporate or asset level debt. It also depends on conditions in the capital markets generally. Companies in the real estate industry have at times historically experienced limited availability of capital, and new capital sources may not be available on acceptable terms, if at all. Our ability to raise capital could be impaired if the capital markets have a negative perception of our long-term and short-term financial prospects or the prospects for mortgage REITs and the commercial real estate market generally. We cannot be certain that sufficient funding or capital will be available to us in the future on terms that are acceptable to us, if at all. If we cannot obtain sufficient funding on acceptable terms, or at all, we will not be able to operate and/or grow our business, which would likely have a negative impact on the market price of our common stock and our ability to make distributions to our stockholders.
We may be required to pursue certain measures in order to maintain or enhance our liquidity, including seeking debt facilities, potentially selling assets at unfavorable prices and/or reducing our operating expenses. Sales of assets held in the CDOs do not generate unrestricted cash or further liquidity for us because proceeds from CDO asset sales are restricted and subject to compliance with various collateral qualification tests. We cannot assure you that we will be successful in measures to improve our liquidity. We currently do not have a corporate credit facility or any other debt source to fund liquidity needs.
For information about our available sources of funds, see “Management’s Discussion and Analysis of Financial Condition and Results of Operations — Liquidity and Capital Resources” and the notes to the consolidated financial statements in this Annual Report on Form 10-K.
Our CDOs could generate “phantom” income.
Our CDOs could continue to generate taxable income for us despite the fact that, if our CDOs fall out of compliance and cash flow is redirected, we will not receive cash distributions on our equity and subordinated note holdings from these CDOs. Should this occur, taxable income would continue to be recognized on each underlying investment in the relevant CDO. We would continue to be required to distribute 90% of our REIT taxable income (determined with regard to the dividends paid deduction and excluding net capital gain) from these transactions to continue to qualify as a REIT, despite the fact that we are not receiving cash distributions on our equity and subordinated note holdings from these CDOs.
We can be removed as Collateral Manager for our 2006 CDO or 2007 CDO if certain tests are breached.
Failure to satisfy the Class A/B overcollateralization test threshold, which is 101.87% and 92.00% for our 2006 and 2007 CDO, respectively, entitles a senior class or classes of CDO notes payable to remove us a collateral manager for the affected CDO, which could result in the loss of collateral management fee revenue paid to us by our CDOs. As of December 31, 2011, our 2006 CDO was in compliance with its Class A/B test,
19
TABLE OF CONTENTS
but the 2007 CDO breached its Class A/B test in November 2011. To the extent the senior class or classes act to remove the collateral manager, a majority vote of such classes is required. No such vote has occurred, or is expected to occur, based on a written agreement between us and a holder of a supermajority of the senior-most bonds. If we were removed as collateral manager of our CDOs, a different collateral manager appointed by the holders of the senior class or classes of notes may manage our CDOs or notes in a manner that is not our best interests as holder of the equity and subordinated classes of CDO securities.
A CDO event of default can cause an early termination of the reinvestment period for the 2007 CDO.
In addition to the overcollateralization and interest coverage tests, the operative documents for our CDOs provide for certain events of default, the occurrence of which would entitle a majority of the holders of a senior class or classes of notes payable to accelerate the notes payable of such CDO and, depending upon the circumstances, require a liquidation of the collateral under then-current market conditions, which could result in higher levels of losses on the collateral and the notes payable of such CDO than might otherwise occur. Our 2007 CDO will soon breach its Class A/B overcollateralization test threshold of 89% due to a growing volume of rating agency downgrades of CMBS held by our 2007 CDO, which would constitute an event of default under the operative documents for our 2007 CDO. Upon an event of default, the reinvestment period, which is scheduled to expire in August 2012, will immediately end and we will lose our ability to reinvest restricted cash held by our 2007 CDO. Furthermore, our ability to sell and actively manage our 2007 CDO underlying assets will be sharply restricted.
A CDO event of default in our 2006 CDO or our 2007 CDO may result in the acceleration of our CDO notes payable for the affected CDO.
A CDO event of default entitles a senior class or classes of CDO notes payable for our 2006 CDO or our 2007 CDO to accelerate the notes of such CDO and, depending upon the circumstances, force the prompt liquidation of the collateral which, depending upon then-current market conditions, could result in higher levels of losses on the collateral and the notes payable of such CDO than might otherwise occur.
Claims may arise under an indemnification provided by us to the trustee of our 2005 CDO and 2006 CDO in connection with note cancellations.
Our subsidiary, Gramercy Manager LLC, the collateral manager, has provided separate limited indemnities to the trustee of our 2005 CDO and 2006 CDO in connection with CDO note cancellations we undertook in 2011 in accordance with the operative documents of each CDO. These cancellations were undertaken to reduce the total debt owed by our 2005 CDO and our 2006 CDO and improve their compliance with certain overcollateralization tests. Payments made by us, if any, under these indemnities would reduce our liquidity available for general corporate purposes and investments.
The role of the Manager as collateral manager for our CDOs and GKK Realty Advisors’ role as property manager for the assets transferred to KBS may expose us to liabilities to CDO debt holders or KBS.
We are subject to potential liabilities to investors as a result of the Manager's role as collateral manager for our CDOs and our property management business generally. In serving in such roles, we could be subject to claims by CDO debt holders and KBS that we did not act in accordance with our duties under our CDO and property management documentation or that we were negligent in taking or refraining from taking actions with respect to the underlying collateral in our CDOs or in managing the assets transferred to KBS. In particular, the discretion that we exercise in managing the collateral for our CDOs and managing the assets transferred to KBS could result in a liability due to the current negative conditions in the commercial real estate market and the inherent uncertainties surrounding the course of action that will result in the best long term results with respect to such collateral and investments. This risk could be increased due to the affiliated nature of our roles. If we were found liable for our actions as collateral manager or property manager and we were required to pay significant damages to our CDOs or KBS, our financial condition could be materially adversely effected.
We are exposed to litigation risks in our role as property manager and special servicer.
GKK Realty Advisors' role as manager for the assets transferred to KBS and the Manager's role as collateral manager for our CDOs, as well as GKK Loan Servicing LLC's role as a special servicer expose us
20
TABLE OF CONTENTS
to litigation risks. In these roles, we make investment, asset management, loan work-out, and other decisions which could result in adverse financial impacts to third parties. These parties may pursue legal action against us as a result of these decisions, the outcomes of which cannot be certain.
We have historically utilized a significant amount of debt to finance our portfolios of debt investments and real estate investments, which may subject us to an increased risk of loss, adversely affecting the return on our investments and reducing cash available for distribution.
We have historically utilized a significant amount of debt to finance our operations, which can compound losses and reduce the cash available for distributions to our stockholders. We historically leveraged our portfolios through the use of securitizations, including the issuance of CDOs, mortgage and mezzanine borrowings and other borrowings. The leverage we employ varies depending on our ability to obtain financing, the loan-to-value and debt service coverage ratios of our assets, the yield on our assets, the targeted leveraged return we expect from our portfolios and our ability to meet ongoing covenants related to our asset mix and financial performance. Currently, neither our charter nor our bylaws impose any limitations on the extent to which we may leverage our assets. Substantially all of our loans and other lending investments and CMBS are pledged, as collateral for our secured borrowings under our CDOs. Our return on our investments and cash available for distribution to our stockholders may be reduced to the extent that changes in market conditions cause the cost of our financing to increase relative to the income that we can derive from the assets we acquire. For example, we have purchased, and may purchase in the future, both subordinate classes of bonds and certain investment grade classes of bonds in our CDOs which represent leveraged investments in the collateral debt securities and other underlying assets. The use of leverage through such CDOs creates the risk for the holders of these classes of bonds of increased exposure to losses on a leveraged basis as a result of defaults with respect to such collateral debt securities. As a result, the occurrence of defaults with respect to only a small portion of the collateral debt securities could result in the complete loss of the investment of the holders of the subordinate classes of bonds and defaults with respect to larger or a material portion of the collateral debt securities could result in complete or partial losses of the investment of the holders of certain investment grade classes of bonds.
Our debt service payments, including payments in connection with any CDOs, reduce our net income available for distributions. Moreover, we may not be able to meet our debt service obligations and, to the extent that we cannot, we risk the loss of some or all of our assets to foreclosure or sale to satisfy our debt obligations. Additionally, our ability to make scheduled payments of principal or interest on, or to refinance, our indebtedness depends on our future performance, which, to a certain extent, is subject to general economic, financial, competitive and other factors beyond our control. In particular, the credit crisis, which began in earnest in mid-2007 and spread throughout the global economy in 2008, 2009 and 2010, materially impacted our business. The credit crisis has, among other things, increased our costs of funds, eliminated our access to the unsecured debt markets and adversely affected our results of operations.
One of our three CDOs is currently in its reinvestment period which will expire in 2012.
The period during which we are permitted to reinvest principal payments on the underlying assets into qualifying replacement collateral for our 2005 CDO and our 2006 CDO expired in July 2010 and July 2011, respectively, and will expire for our 2007 CDO on or before August 2012. In the past, our ability to reinvest has been instrumental in maintaining compliance with the overcollateralization and interest coverage tests for our CDOs. Following the conclusion of the reinvestment period our ability to maintain compliance with such tests for that CDO will be negatively impacted. Additionally, the conclusion of the reinvestment period results in reduced investment activity for us as available cash in the CDOs will generally be used for the repayment of principal on the CDO bonds and will not be available for new investment activity.
Potential rating agency downgrades may adversely affect our ability to reinvest CDO proceeds.
To date, rating agency downgrades and impairments of our loan investments and CMBS investments have not impeded our right to reinvest CDO proceeds as provided in the operative CDO document. However, there can be no assurance that our right to reinvest CDO proceeds will not be impaired by future rating agency downgrades or investment impairments and, in such event, the cash flows that otherwise would have been payable to us, as the holder of certain junior and senior tranches of notes payable issued by our CDOs,
21
TABLE OF CONTENTS
may, depending on circumstances, instead be redirected to pay principal and interest on the most senior tranches of notes payable issued by our CDOs, which are owned by third parties. As a result, such downgrades could have a material adverse effect on our liquidity, results of operations and business.
We may be required to repurchase loans that we have sold or to indemnify holders of our CDOs.
If any of the loans we originate or acquire and sell or securitize do not comply with representations and warranties that we make about certain characteristics of the loans, the borrowers and the underlying properties, we may be required to repurchase those loans or replace them with substitute loans. In addition, in the case of loans that we have sold instead of retained, we may be required to indemnify persons for losses or expenses incurred as a result of a breach of a representation or warranty. Repurchased loans would likely require a significant allocation of working capital to carry on our balance sheet, and our ability to borrow against such assets is limited. Any significant repurchases or indemnification payments could adversely affect our financial condition and operating results.
We believe the Manager, the collateral manager of our CDOs is required to register under the Investment Advisers Act of 1940, or the Advisers Act, and is subject to regulation under that Act.
In light of provisions of the Dodd-Frank Wall Street Reform and Consumer Protection Act that modify the Advisers Act and eliminate certain exemptions from registration under the Advisers Act, we believe the Manager is required to register as an investment adviser under the Advisers Act and is subject to, and must comply with, the Advisers Act and the rules promulgated thereunder. Following the registration of the Manager under the Advisers Act, the SEC will oversee the Manager's activities as a registered investment adviser under this regulatory regime. A failure to comply with the obligations imposed by the Advisers Act, including record-keeping, advertising and operating requirements, disclosure obligations and prohibitions on fraudulent activities, could result in fines, censure, suspensions of personnel or investing activities or other sanctions, including revocation of the Manager's registration as an investment adviser. The regulations under the Advisers Act are designed primarily to protect investors in funds and clients advised by a registered investment adviser. They are not designed to protect holders of our publicly traded common stock. Even if a sanction imposed against the Manager or its personnel involves a small monetary amount, the adverse publicity related to such sanction could harm our reputation and our relationship with our investors and impede our ability to raise additional capital or new funds. In addition, compliance with the Advisers Act may require us to incur additional costs and these costs may be material.
We presently have virtually no additional borrowing capacity.
We currently do not have a corporate credit facility to draw against for liquidity purposes and substantially all of our loans and other lending investments are pledged as collateral for our CDOs. As a result, we must fund future funding commitments, if any, and capital expenditures with existing liquidity, including unrestricted cash and cash in our CDOs (if available), or future liquidity resulting from asset sales, which will have a significant impact on our liquidity position. If we are unable to meet future funding commitments or fund required capital expenditures, our borrowers or tenants may take legal action against us, which could have a material adverse effect.
Two of our subsidiaries have been named as defendant in two lawsuits and the uncertainty surrounding these cases or the adverse resolution of these matters could have a material adverse effect on us.
Two of our subsidiaries are named as defendants in a case captioned Colfin JIH Funding LLC and CDCF JIH Funding, LLC, or Colony, v. Gramercy Warehouse Funding I LLC and Gramercy Loan Services LLC, which is pending in New York State Supreme Court, New York County. The dispute arises from the financing of the Jameson Inns and Signature Inns. Colony has asserted a breach of contract claim against our subsidiaries and is seeking to recover at least $80 million, which represents the amounts of the mezzanine loans held by Colony, and at least $8 million in enforcement costs, plus attorneys’ fees. On January 23, 2012, our subsidiaries filed counterclaims against Colony for breach of contract, tortious interference with contract, breach of the covenant of good faith and fair dealing, and civil conspiracy, and our subsidiaries are seeking to recover at least $80 million in compensatory damages, as well as certain punitive damages and certain costs and fees. Our subsidiaries intend to vigorously defend the claims asserted against them and to pursue all
22
TABLE OF CONTENTS
counterclaims against Colony. Colony has moved to dismiss the counterclaims. Additionally, the same two subsidiaries are named as defendants in the case captioned U.S. Bank National Association, as Trustee et al v. Gramercy Warehouse Funding I LLC and Gramercy Loan Services LLC, which is pending in New York State Supreme Court, New York County. The dispute also arises from the same financing of the Jameson Inns and Signature Inns. U.S. Bank National Association, or U.S. Bank, by and through its attorney in fact, Wells Fargo Bank, N.A., has asserted a breach of contract claim against the subsidiaries and is seeking to recover at least $164 million, which represents the amount of U.S. Bank’s mortgage loan, plus attorneys’ fees and enforcement costs. On January 25, 2012, our subsidiaries filed an answer to U.S. Bank’s complaint. Our subsidiaries intend to vigorously defend the claims asserted against them. These matters are in their preliminary stages, and accordingly, we are not able to assess the likelihood of an unfavorable outcome or estimate the range of potential loss, if any. The uncertainty surrounding these cases or any adverse resolution of these matters could have an adverse effect on us.
We have incurred substantial impairments of our loans and other lending investments and may incur significant loan loss reserves/impairments in the future.
Due to a variety of factors, including adverse market conditions affecting the real estate market, we have recorded substantial loan loss provisions. For the years ended December 31, 2011 and 2010, we recorded approximately $48.2 million and $84.4 million, respectively, in loan loss provisions and impairment losses related to our loans and other lending investments. Our debt investments may suffer additional loan loss provisions/impairments in the future causing us to recognize significant losses. If we are unsuccessful in renegotiating, selling or otherwise resolving assets that are currently nonperforming or that we expect will become nonperforming, we may experience loss of principal or reduced income available for distributions. Investors and lenders alike could lose confidence in the quality and value of our assets. These impairments, or the perception that these impairments may occur, can depress our stock price, harm our liquidity and materially adversely impact our results of operations. We may be forced to sell substantial assets at a time when the market is depressed in order to support or enhance our liquidity. Despite our need to sell substantial assets, we may be unable to make such sales on favorable terms or at all, further materially damaging our liquidity and operations. If we are unable to maintain adequate liquidity as a result of these impairments or otherwise, our ability to continue as a going concern would be affected and you could lose some or all of your investment.
Our reserves for loan losses may prove inadequate, which could have a material adverse effect on us.
We maintain and regularly evaluate financial reserves to protect against potential future losses. Our reserves reflect management’s judgment of the probability and severity of losses. We cannot be certain that our judgment will prove to be correct and that reserves will be adequate over time to protect against potential future losses because of unanticipated adverse changes in the economy or events adversely affecting specific assets, borrowers, industries in which our borrowers operate or markets in which our borrowers or their properties are located. We must evaluate existing conditions on our debt investments to make determinations to record loan loss reserves on these specific investments. If our reserves for credit losses prove inadequate, we could suffer losses which would have a material adverse effect on our financial performance, the market price of our common stock and our ability to make distributions to our stockholders.
Loan loss reserves are particularly difficult to estimate in a turbulent economic environment.
Our loan loss reserves are evaluated on a quarterly basis. Our determination of loan loss reserves requires us to make certain estimates and judgments, which are particularly difficult to determine during the current economic environment. Our estimates and judgments are based on a number of factors, including projected cash flows from the collateral securing our commercial real estate loans, loan structure, including the availability of reserves and recourse guarantees, likelihood of repayment in full at the maturity of a loan, potential for a refinancing market returning to commercial real estate in the future and expected market discount rates for varying property types. If our estimates and judgments are not correct, our results of operations and financial condition could be severely impacted.
23
TABLE OF CONTENTS
There can be no assurance that the actions of the U.S. government, Federal Reserve and other governmental and regulatory bodies for the purpose of stabilizing the financial markets, or market response to those actions, will achieve the intended effect and our business may not benefit from, and may be adversely impacted by, these actions and further government or market developments could adversely impact us.
Since mid-2007 and particularly during the second half of 2008, the financial services industry and securities markets generally were materially and adversely affected by significant declines in the values of nearly all asset classes and by a serious lack of liquidity. This was initially triggered by declines in the values of subprime mortgages, but spread to all mortgage and real estate asset classes, to leveraged bank loans and to nearly all assets classes, including equities. The global markets have been characterized by substantially increased volatility and short-selling and an overall loss of investor confidence, initially in the financial institutions, but afterwards in companies in a number of other industries and in the broader markets. The decline in asset values has caused increases in margin calls for investors, requirements that derivatives counterparties post additional collateral and redemptions by mutual and hedge fund investors, all of which have increased the downward pressure on asset values and outflows of client funds across the financial services industry. In addition, the increased redemptions and unavailability of credit have required hedge funds and others to rapidly reduce leverage, which has increased volatility and further contributed to the decline of asset values.
In response to the recent unprecedented financial issues affecting the banking system and financial markets and going concern threats to investment banks and other financial institutions, the Emergency Economic Stabilization Act of 2008, or the EESA, was signed into law on October 3, 2008. The EESA provides the U.S. Secretary of Treasury with the authority to establish a Troubled Asset Relief Program, or TARP, to purchase from financial institutions up to $700 billion of residential or commercial mortgages and any securities, obligations, or other instruments that are based on, or related to, such mortgages, that in each case was originated or issued on or before March 14, 2008. The ESSA also provides for a program that would allow companies to insure their troubled assets. On February 17, 2009, President Obama signed the American Recovery and Reinvestment Act of 2009, or ARRA, a $787 billion stimulus bill for the purpose of stabilizing the economy by creating jobs among other things. As of February 12, 2010, the U.S. Treasury is managing or overseeing the following programs under TARP: the Capital Purchase Program, the Systemically Failing Institutions Program, the Auto Industry Financing Program and the Homeowner Affordability, the Legacy Public-Private Investment Program, and Stability Plan, which is partially financed by TARP.
There can be no assurance that the EESA, TARP or other programs will have a beneficial impact on the financial markets, including current extreme levels of volatility. In addition, the U.S. Government, Federal Reserve and other governmental and regulatory bodies have taken or are considering taking other actions to address the financial crisis. In November 2010, the Federal Reserve initiated a program to purchase up to $600 billion of long-term U.S. Treasury securities by mid-2011 as part of its continuing effort to help stimulate the economy by reducing mortgage and interest rates. We cannot predict whether or when such actions may occur or what impact, if any, such actions could have on our business, results of operations and financial condition.
We do not know what impact the Dodd-Frank Act will have on our business.
On July 21, 2010, the United States enacted the Dodd-Frank Wall Street Reform and Consumer Protection Act, or the Dodd-Frank Act. The Dodd-Frank Act affects almost every aspect of the U.S. financial services industry, including certain aspects of the markets in which we operate. The Dodd-Frank Act imposes new regulations on us and how we conduct our business. For example, the Dodd-Frank Act will impose additional disclosure requirements for public companies and generally require issuers or originators of asset-backed securities to retain at least five percent of the credit risk associated with the securitized assets. In addition, the Dodd-Frank Act will require us to register as an investment advisor with the SEC, which will increase our regulatory compliance costs and subject us to new restrictions as well as penalties for any future non-compliance with these regulations. Importantly, many key aspects of the changes imposed by the Dodd-Frank Act will be established by various regulatory bodies and other groups over the next several years. As a result, we do not know how significantly the Dodd-Frank Act will affect us. It is possible that the Dodd-Frank
24
TABLE OF CONTENTS
Act could, among other things, increase our costs of operating as a public company, impose restrictions on our ability to securitize assets and reduce our investment returns on securitized assets.
We are required to make a number of judgments in applying accounting policies and different estimates and assumptions in the application of these policies could result in changes to our reporting of financial condition and results of operations.
Material estimates that are particularly susceptible to significant change relate to the determination for loan losses, the effectiveness of derivatives and other hedging activities, the fair value of certain financial instruments (debt obligations, CMBS, loan assets, securities, derivatives, and privately held investments), CTL investments, deferred income tax assets or liabilities, share-based compensation, and accounting for acquisitions, including the fair value determinations and the analysis of goodwill impairment. While we have identified those accounting policies that are considered critical and have procedures in place to facilitate the associated judgments, different assumptions in the application of these policies could result in material changes to our reports of financial condition and results of operations.
We are dependent on key personnel whose continued service is not guaranteed.
We rely on a small number of persons who comprise our existing senior management team and our board of directors to implement our business and investment strategies. While we have entered into employment and/or retention agreements with certain members of our senior management team, they may nevertheless cease to provide services to us at any time. Some of these employment and/or retention agreements including agreements with each of our Chief Executive Officer and our President, expire in June 2012 and there can be no assurance that they may be renewed on similar terms or at all.
The loss of services of any of our key management personnel or directors or significant numbers of other employees, or our inability to recruit and retain qualified personnel or directors in the future, could have an adverse effect on our business.
Quarterly results may fluctuate and may not be indicative of future quarterly performance.
Our quarterly operating results could fluctuate; therefore, you should not rely on past quarterly results to be indicative of our performance in future quarters. Factors that could cause quarterly operating results to fluctuate include, among others, variations in our investment origination volume, loan loss reserves or impairments, loan maturities, variations in the timing of prepayments, the degree to which we encounter competition in our markets and general economic conditions.
Maintenance of our Investment Company Act exclusions and exemptions imposes limits on our operations.
We believe that there are a number of exclusions and exemptions under the Investment Company Act that may be applicable to us and we have conducted and intend to continue to conduct our operations so as not to become regulated as an investment company under the Investment Company Act. We will either be excluded from the definition of investment company under Section 3(a)(1)(C) of the Investment Company Act, by owning or proposing to acquire “investment securities” having a value not exceeding 40% of the value of our total assets (exclusive of U.S. Government securities and cash items) on an unconsolidated basis, or exempted by qualifying for the exemptions from registration provided by Sections 3(a)(1)(A), 3(c)(5)(C) and/or 3(c)(6) of the Investment Company Act. Section 3(a)(1)(A) of the Investment Company Act defines an investment company as any issuer which is or holds itself out as being engaged primarily, or proposed to engage primarily in the business of investing, reinvesting or trading in securities. We believe we will not be considered an investment company under Section 3(a)(1)(A) of the Investment Company Act because we will not engage primarily or hold ourselves out as being engaged primarily in the business of investing, reinvesting or trading in securities. Section 3(c)(5)(C) exempts from the definition of “investment company” any person who is “primarily engaged in the business of purchasing or otherwise acquiring mortgages and other liens on and interests in real estate.” Additionally, Section 3(c)(6) exempts from the definition of “investment company” any company primarily engaged, directly or through majority-owned subsidiaries, in the business of purchasing or otherwise acquiring mortgages and other liens on and interests in real estate. The assets that we have acquired and may acquire in the future, therefore, are limited by the provisions of the Investment
25
TABLE OF CONTENTS
Company Act and the exclusions and exemptions on which we rely. In addition, we could, among other things, be required either (a) to change the manner in which we conduct our operations to avoid being required to register as an investment company or (b) to register as an investment company, either of which could have an adverse effect on our business and our ability to pay dividends.
To maintain our qualification for an exclusion from registration under the Investment Company Act pursuant to Sections 3(c)(5)(C) and 3(c)(6) at least 55% of our portfolio, or the assets of our majority-owned subsidiaries, must be comprised of qualifying assets under Section 3(c)(5)(C) of the Investment Company Act, and 80% of our portfolio, or the assets of our majority-owned subsidiaries, must be comprised of qualifying assets and real estate-related assets under Section 3(c)(5)(C) of the Investment Company Act. In addition, we may not issue “redeemable securities.” To comply with the Section 3(c)(5)(C) exemption, we may from time to time buy RMBS and other qualifying assets. We generally expect that mortgage loans, junior (first loss) interests in whole pool CMBS, CTL and other real property investments, certain distressed debt securities and Tier 1 mezzanine loans to be qualifying assets under the Section 3(c)(5)(C) exemption from the Investment Company Act. Tier 1 mezzanine loans are loans granted to a mezzanine borrower that directly owns interests in the entity that owns the property being financed. The treatment of distressed debt securities as qualifying assets is, and will be, based on the characteristics of the particular type of loan, including its foreclosure rights. Although SEC staff no-action letters have not specifically addressed the categorization of these types of assets, we believe junior (first loss) interests in CMBS pools may constitute qualifying assets under Section 3(c)(5)(C) provided that we have the unilateral right to foreclose, directly or indirectly, on the mortgages in the pool and that we may act as the controlling class or directing holder of the pool. Similarly, subordinate interests in whole loans may constitute qualifying assets under Section 3(c)(5)(C) provided that, among other things, approval rights in connection with any material decisions pertaining to the administration and servicing of the relevant mortgage loan and, in the event that the mortgage loan becomes non-performing, we have effective control over the remedies relating to the enforcement of the loan, including ultimate control of the foreclosure process. We generally do not treat non-Tier 1 mezzanine loans and preferred equity investments as qualifying assets. Although we monitor our portfolio periodically and prior to each origination or acquisition of a new asset or disposition of an existing asset, there can be no assurance that we will be able to maintain an exclusion or exemption from registration under the Investment Company Act. Further, we may not be able to invest in sufficient qualifying and/or real estate-related assets and future revision or interpretations of the Investment Company Act may cause us to lose our exclusion or exemption or force us to re-evaluate our portfolio and our business strategy. Such changes may prevent us from operating our business successfully. No assurance can be given that the SEC staff will concur with our classification of our assets, or that the SEC staff will not, in the future, issue further guidance that may require us to reclassify those assets for purpose of qualifying for an exemption or exclusion from regulation under the Investment Company Act. To the extent that the staff of the SEC provides more specific guidance regarding any of the matters bearing upon the definition of investment company and the exceptions to that definition, we may be required to adjust our investment strategy accordingly. Any additional guidance from the staff of the SEC could provide additional flexibility to us, or it could further inhibit our ability to pursue the investment strategy we have chosen.
In August 2011, the SEC solicited public comment on a wide range of issues relating to Section 3(c)(5)(C) of the Investment Company Act, including the nature of the assets that qualify for purposes of the exemption and whether mortgage REITs should be regulated in a manner similar to investment companies. There can be no assurance that the laws and regulations governing the Investment Company Act status of REITs, including the Division of Investment Management of the SEC providing more specific or different guidance regarding these exemptions, will not change in a manner that adversely affects our operations. If we or our subsidiaries fail to maintain an exception or exemption from the Investment Company Act, we could, among other things, be required either to (a) change the manner in which we conduct our operations to avoid being required to register as an investment company, (b) effect sales of our assets in a manner that, or at a time when, we would not otherwise choose to do so, or (c) register as an investment company, any of which would negatively affect the value of our common stock, the sustainability of our business model, and our ability to make distributions which could have an adverse effect on our business and the market price for our shares of common stock.
26
TABLE OF CONTENTS
In consultation with legal and tax advisors, we periodically evaluate our assets, and also evaluate prior to an acquisition or origination the structure of each prospective investment or asset, to determine whether we avoid coming within the definition of investment company in Section 3(a)(1)(C) and/or whether we believe the investment will be a qualifying asset for purposes of maintaining the exemptions found in Sections 3(c)(5)(C) and/or 3(c)(6) from registration under the Investment Company Act. We consult with counsel to assist us with such determination as appropriate. If we are obligated to register as an investment company, we would have to comply with a variety of substantive requirements under the Investment Company Act, including limitations on capital structure, restrictions on specified investments, prohibitions on transactions with affiliates, changes in the composition of our board of directors and compliance with reporting, record keeping, voting, proxy disclosure and other rules and regulations that would significantly change our operations.
Rapid changes in the values of our CMBS and other real estate related investments may make it more difficult for us to maintain our qualification as a REIT or exemption from the Investment Company Act.
If the market value or income potential of our CMBS and other real estate-related investments declines as a result of increased interest rates, prepayment rates or other factors, we may need to increase our real estate investments and income and/or liquidate our non-qualifying assets in order to maintain our REIT qualification or exemption from the Investment Company Act. If the decline in real estate asset values and/or income occurs quickly, this may be especially difficult to accomplish. This difficulty may be exacerbated by the illiquid nature of many of our non-real estate assets. We may have to make investment decisions that we otherwise would not make absent the REIT qualification and Investment Company Act exemption considerations.
We may incur losses as a result of ineffective risk management processes and strategies.
We seek to monitor and control our risk exposure through a risk and control framework encompassing a variety of separate but complementary financial, credit, operational, compliance and legal reporting systems, internal controls, management review processes and other mechanisms. While we employ a broad and diversified set of risk monitoring and risk mitigation techniques, those techniques and the judgments that accompany their application cannot anticipate every economic and financial outcome or the specifics and timing of such outcomes. Thus, we may, in the course of our activities, incur losses. Recent market conditions have involved unprecedented dislocations and highlight the limitations inherent in using historical data to manage risk.
The models that we use to assess and control our risk exposures reflect assumptions about the degrees of correlation or lack thereof among prices of various asset classes or other market indicators. In times of market stress or other unforeseen circumstances, previously uncorrelated indicators may become correlated, or conversely previously correlated indicators may move in different directions. These types of market movements have at times limited the effectiveness of our hedging strategies and have caused us to incur significant losses, and they may do so in the future. These changes in correlation can be exacerbated where other market participants are using risk models with assumptions or algorithms that are similar to ours. In these and other cases, it may be difficult to reduce our risk positions due to the activity of other market participants or widespread market dislocations, including circumstances where asset values are declining significantly or no market exists for certain assets. To the extent that we make investments that do not have an established liquid trading market or are otherwise subject to restrictions on sale or hedging, we may not be able to reduce our positions and therefore reduce our risk associated with such positions.
We reported a material weakness in our internal control over financial reporting, and if we are unable to improve our internal controls, our financial results may not be accurately reported.
Management’s assessment of the effectiveness of our internal control over financial reporting as of December 31, 2011 identified a material weakness in its internal control over financial reporting as described in Item 9A, “Controls and Procedures.” This material weakness, or difficulties encountered in implementing new or improved controls or remediation, could prevent us from accurately reporting our financial results, result in material misstatements in our financial statements or cause us to fail to meet our reporting obligations. Failure to comply with Section 404 of the Sarbanes-Oxley Act of 2002 could negatively affect our business, the price of our common stock and market confidence in our reported financial information.
27
TABLE OF CONTENTS
We may experience reductions in portfolio income which would reduce our ability to make distributions over time.
Due to our status as a REIT, we are required to distribute at least 90% of our REIT taxable income, if any, to stockholders. We may experience declines in the size of the investment portfolio over time. A reduction in the size of our portfolio would also result in reduced income available for distribution and thereby lessen our ability to make distributions to our stockholders.
If we fail to achieve adequate operating cash flow, our ability to make distributions will be adversely affected.
As a REIT, we must distribute annually at least 90% of our REIT taxable income, if any, to our stockholders, determined without regard to the deduction for dividends paid and excluding net capital gain. Our ability to make and sustain cash distributions is based on many factors, including the return on our investments, operating expense levels, the extent of cash distributions from our CDOs, and certain restrictions imposed by Maryland law. Some of the factors are beyond our control and a change in any such factor could affect our ability to pay future dividends. No assurance can be given as to our ability to pay distributions to our stockholders.
Reduction of our gross assets pursuant to the transfers completed pursuant to the Settlement Agreement may jeopardize our qualification as a REIT or exemption from the Investment Company Act.
To continue to qualify as a REIT, we must comply with requirement regarding our assets and our sources of income. In connection with the Settlement Agreement, we transferred a significant amount of assets to KBS and we now comply with REIT requirements and exemptions from the Investment Company Act with a significantly smaller asset base and a significantly smaller compliance margin. If our number of qualified assets and the income generated from those assets continues to decline, we may be unable to comply with these requirements which may ultimately jeopardize our qualification as a REIT or exemption from the Investment Company Act, which could have a material adverse effect on our financial condition, results of operation and business.
The competitive pressures we face as a result of operating in a highly competitive market could have a material adverse effect on our business, financial condition, liquidity and results of operations.
The current state of the global credit markets has resulted in a lack of liquidity and significant volatility in the types of asset classes that we have historically invested. These disruptions are currently and are expected to continue to limit our ability and our competitors’ ability to execute on historical investment strategies. Upon the return of liquidity to the credit markets, we expect to continue to encounter significant competition in seeking investments. We have significant competition with respect to our acquisition and origination of assets with many other companies, including other REITs, insurance companies, commercial banks, private investment funds, hedge funds, specialty finance companies and other investors. Some competitors may have a lower cost of funds and access to funding sources that are not available to us. In addition, some of our competitors may have higher risk tolerances or different risk assessments, which could allow them to consider a wider variety of investments and establish more relationships than us. Furthermore, there is significant competition on a national, regional and local level with respect to property management services and in commercial real estate services generally and we are subject to competition from large national and multi-national firms as well as local or regional firms that offer similar services to ours. Some of our competitors may have greater financial and operational resources, larger customer bases, and more established relationships with their customers and suppliers than we do. The competitive pressures we face, if not effectively managed, may have a material adverse effect on our business, financial condition, liquidity and results of operations.
Also, as a result of this competition, we may not be able to take advantage of attractive origination and investment opportunities and therefore may not be able to identify and pursue opportunities that are consistent with our objectives. Competition may limit the number of suitable investment opportunities offered to us. It may also result in higher prices, lower yields and a narrower spread of yields over our borrowing costs, making it more difficult for us to acquire new investments on attractive terms. In addition, competition for
28
TABLE OF CONTENTS
desirable investments could delay the investment in desirable assets, which may in turn reduce our earnings per share and negatively affect our ability to declare distributions to our stockholders.
We may change our investment and operational policies without stockholder consent.
We may change our investment and operational policies, including our policies with respect to investments, acquisitions, growth, operations, indebtedness, capitalization and distributions, at any time without the consent of our stockholders, which could result in our making investments that are different from, and possibly riskier than, the types of investments described in this filing. A change in our investment strategy may increase our exposure to interest rate risk, default risk and real estate market fluctuations, all of which could adversely affect our ability to make distributions.
Terrorist attacks and other acts of violence or war may affect the market for our common stock, the industry in which we conduct our operations and our profitability.
Terrorist attacks may harm our results of operations and the stockholders’ investment. We cannot assure the stockholders that there will not be further terrorist attacks against the U.S. or U.S. businesses. These attacks or armed conflicts may directly impact the property underlying our asset-based securities or the securities markets in general. Losses resulting from these types of events are uninsurable.
More generally, any of these events could cause consumer confidence and spending to decrease or result in increased volatility in the U.S. and worldwide financial markets and economy. Adverse economic conditions could harm the value of our properties, the property underlying our asset-backed securities or the securities markets in general which could harm our operating results and revenues and may result in increased volatility of the value of our securities.
We are highly dependent on information systems and third parties, and systems failures could significantly disrupt our business, which may, in turn, negatively affect the market price of our common stock and our ability to make distributions to our stockholders.
Our business is highly dependent on communications and information systems, some of which are provided by third parties. Any failure or interruption of our systems could cause delays or other problems, which could have a material adverse effect on our operating results and negatively affect the market price of our common stock and our ability to make distributions to our stockholders.
Lack of diversification in number of investments increases our dependence on individual investments.
If we acquire larger loans or property interests, our portfolio will be concentrated in a smaller number of assets, increasing the risk of loss to stockholders if a default or other problem arises. Alternatively, if through loan repayments, loan resolutions or property sales we reduce the aggregate amount of our debt investment portfolio or our property investment portfolio, and number of investments in either or each, our portfolio may become concentrated in larger assets, thereby reducing the benefits of diversification by geography, property type, tenancy or other measures.
Risk Relating to Our Capital Structure and Access to Liquidity
Our CDO financing agreements may limit our ability to make investments.
Each CDO financing that we engage in contains certain eligibility criteria with respect to the collateral that we seek to acquire and sell to the CDO issuer. If the collateral does not meet the eligibility criteria for eligible collateral asset forth in the transaction documents of such CDO transaction, we may not be able to acquire and sell such collateral to the CDO issuer. The inability of the collateral to meet eligibility requirements with respect to our CDOs may limit our ability to execute our business plan. In the event that an investment that we believe is favorable to our company does not meet eligibility requirements for our CDOs, we may be unable to obtain alternative financing for such investment.
We may not be able to issue CDO securities on attractive terms or at all, which may require us to seek more costly financing for our investments or to liquidate assets.
Conditions in the capital markets have made the issuance of a CDO unavailable. Historically, we have relied, to a substantial extent, on CDO financings to obtain match funded financing for our investments.
29
TABLE OF CONTENTS
Unless and until the market for commercial real estate CDOs recovers, we may be unable to utilize CDOs to finance our investments and we may need to utilize less favorable sources of financing to finance our investments on a long-term basis, if available. If such other forms of long-term financing are unavailable, it may be necessary to fund our investments using shorter-term debt financing, in which case we would not meet our objective of match funding for substantially all of our investments. There can be no assurance as to whether or when demand for commercial real estate CDOs will return or the terms of such securities investors will demand or whether we will be able to issue CDOs to finance our investments on terms beneficial to us.
If we issue senior securities we will be exposed to additional restrictive covenants and limitations on our operating flexibility, which could adversely affect our ability to pay dividends.
If we decide to issue senior securities in the future, it is likely that they will be governed by an indenture or other instrument containing covenants restricting our operating flexibility. Holders of senior securities may be granted specific rights, including but not limited to: the right to hold a perfected security interest in certain of our assets, the right to accelerate payments due under the indenture, rights to restrict dividend payments and rights to require approval to sell assets. Additionally, any convertible or exchangeable securities that we issue in the future may have rights, preferences and privileges more favorable than those of our common stock. We, and indirectly our stockholders, will bear the cost of issuing and servicing such securities.
We may not be able to access financing sources on favorable terms, or at all, which could adversely affect our ability to execute our business plan and our ability to distribute dividends.
We have financed our assets through a variety of means, including mortgages, mezzanine loans, repurchase agreements, secured and unsecured credit facilities, CDOs, other structured financings and trust preferred securities. Our ability to execute this strategy depends on various conditions in the markets for financing in this manner which are beyond our control, including lack of liquidity and wider credit spreads. We cannot be certain that these markets, especially the structured finance markets, will provide an efficient source of long-term financing for our assets. Our ability to finance through CDOs is subject to a level of investor demand which has almost entirely been curtailed. If our strategy is not viable, we will have to attempt to find alternative forms of long-term financing for our assets, such as secured revolving credit facilities and repurchase facilities, if available. This could subject us to more recourse indebtedness and the risk that debt service on less efficient forms of financing would require a larger portion of our cash flows, to service our debt thereby reducing cash available for distribution to our stockholders, funds available for operations as well as for future business opportunities.
In addition, we depend upon the availability of adequate financing sources and capital for our operations. As a REIT, we are required to distribute at least 90% of our REIT taxable income, determined without regard to the deduction for dividends paid and excluding net capital gain, to our stockholders and are therefore not able to retain our earnings for new investments. We cannot be certain that any, or sufficient, funding or capital will be available to us in the future on terms that are acceptable to us.
Furthermore, if the minimum dividend distribution required to maintain our REIT qualification becomes large relative to our cash flow due to our taxable income exceeding our cash flow from operations, then we could be forced to borrow funds, sell assets or raise capital on unfavorable terms, if we are able to at all, in order to maintain our REIT qualification. In the event that we cannot obtain sufficient funding on acceptable terms, there may be a negative impact on the market price of our common shares and our ability to distribute dividends.
Interest rate fluctuations could reduce our ability to generate income on our investments.
The yield on our investments in real estate securities and loans is sensitive to changes in prevailing interest rates and changes in prepayment rates. Changes in interest rates can affect our net interest income, which is the difference between the interest income we earn on our interest-earning investments and the interest expense we incur in financing these investments. We tend to price loans at a spread to either United States Treasury obligations, swaps or LIBOR. A decrease in these indexes will lower the yield on our investments, except to the extent certain of our loans contain floors below which the interest rate cannot decline. Conversely, if these indexes rise materially, borrowers may be unable to meet their debt service
30
TABLE OF CONTENTS
requirements and borrow the higher-leverage loans that we target. For more information on interest rate risk, see Item 7A, “Quantitative and Qualitative Disclosure About Market Risk” in this Annual Report on Form 10-K.
In a period of rising interest rates, our interest expense could increase while the interest we earn on our fixed-rate investments would not change, which would adversely affect our profitability.
Our operating results depend in large part on differences between the income from our investments, net of financing costs. In most cases, for any period during which our investments are not match-funded, the income from such debt investments will respond more slowly to interest rate fluctuations than the cost of our borrowings. Consequently, changes in interest rates, particularly short-term interest rates, may significantly influence our net income. Increases in these rates will tend to decrease our net income and market value of our investments. Interest rate fluctuations resulting in our interest expense exceeding our interest income would result in operating losses for us and may limit or eliminate our ability to make distributions to our stockholders. For more information on interest rate risk, see Item 7A, “Quantitative and Qualitative Disclosure About Market Risk” in this Annual Report on Form 10-K.
If credit spreads widen before we obtain long-term financing for our assets, the value of our assets may suffer.
We price our assets based on our assumptions about future credit spreads for financing of those assets. We have obtained, and may obtain in the future, longer term financing for our assets using structured financing techniques. Such issuances entail interest rates set at a spread over a certain benchmark, such as the yield on United States Treasury obligations, swaps or LIBOR. If the spread that investors are paying on our current structured finance vehicles and will pay on future structured finance vehicles we may engage in over the benchmark widens and the rates we are charging or will charge on our securitized assets are not increased accordingly, our income may be reduced or we could suffer losses, which could affect our ability to make distributions to our stockholders.
Risks Related to Our Investments
Some of our portfolio investments may be recorded at fair value, as a result, there will be uncertainty as to the value of these investments.
Changes in the market values of our investments in securities available for sale will be directly charged or credited to stockholders’ equity. As a result, a decline in values may reduce the book value of our assets. Moreover, if the decline in value of a security is other-than-temporary, such decline will reduce earnings. Any such charges may result in volatility in our reported earnings and may adversely affect the market price of our common stock. Some of our portfolio investments may be in the form of securities, including CMBS, that are not publicly traded. The fair value of securities and other investments that are not publicly traded may not be readily determinable. We value these investments quarterly. Because such valuations are inherently uncertain, may fluctuate over short periods of time and may be based on estimates, our determinations of fair value may differ materially from the values that would have been used if a ready market for these securities existed. The value of our common stock could be adversely affected if our determinations regarding the fair value of these investments were materially higher than the values that we ultimately realize upon their disposal.
We may not realize gains or income from our investments.
We seek to generate both current income and capital appreciation. However, our investments may not appreciate in value and, in fact, may decline in value, and the debt securities we invest in may default on interest and/or principal payments. Accordingly, we may not be able to realize gains or income from our investments. Any gains that we do realize may not be sufficient to offset any other losses we experience. Any income that we realize may not be sufficient to offset our expenses.
We may be adversely affected by unfavorable economic changes in geographic areas where our properties or the properties underlying our investments are concentrated.
Adverse conditions in the areas where our properties or the properties underlying our investments are located (including business layoffs or downsizing, industry slowdowns, changing demographics and other
31
TABLE OF CONTENTS
factors) and local real estate conditions (such as oversupply of, or reduced demand for, office, industrial or retail properties) may have an adverse effect on the value of our properties. A material decline in the demand or the ability of tenants to pay rent for office, industrial or retail space in these geographic areas may result in a material decline in our cash available for distribution.
The commercial mortgage and mezzanine loans we originate or acquire and the commercial mortgage loans underlying the CMBS in which we invest are subject to delinquency, foreclosure and loss, which could result in losses to us.
Our commercial mortgage and mezzanine loans are secured by commercial property and are subject to risks of delinquency and foreclosure, and risks of loss that are greater than similar risks associated with loans made on the security of single-family residential property. The ability of a borrower to repay a loan secured by an income-producing property typically is dependent primarily upon the successful operation of the property rather than upon the existence of independent income or assets of the borrower. If the net operating income of the property is reduced, the borrower’s ability to repay the loan may be impaired. Net operating income of an income-producing property can be affected by, among other things, tenant mix, success of tenant businesses, property management decisions, property location and condition, competition from comparable types of properties, changes in laws that increase operating expenses or limit rents that may be charged, any need to address environmental contamination at the property, changes in national, regional or local economic conditions and/or specific industry segments, declines in regional or local real estate values, declines in regional or local rental or occupancy rates, increases in interest rates, real estate tax rates and other operating expenses, and changes in governmental rules, regulations and fiscal policies, including environmental legislation, acts of God, terrorism, social unrest and civil disturbances.
Joint investments could be adversely affected by our lack of sole decision-making authority and reliance upon a co-venturer’s financial condition.
We co-invest with third parties through partnerships, joint ventures, co-tenancies or other entities, acquiring non-controlling interests in, or sharing responsibility for managing the affairs of, a property, partnership, joint venture, co-tenancy or other entity. Therefore, we will not be in a position to exercise sole decision-making authority regarding that property, partnership, joint venture or other entity. Investments in partnerships, joint ventures, or other entities may involve risks not present were a third party not involved, including the possibility that our partners, co-tenants or co-venturers might become bankrupt or otherwise fail to fund their share of required capital contributions. Additionally, our partners or co-venturers might at any time have economic or other business interests or goals which are inconsistent with our business interests or goals. These investments may also have the potential risk of impasses on decisions such as a sale, because neither we nor the partner, co-tenant or co-venturer would have full control over the partnership or joint venture. Consequently, actions by such partner, co-tenant or co-venturer might result in subjecting properties owned by the partnership or joint venture to additional risk. In addition, we may in specific circumstances be liable for the actions of our third-party partners, co-tenants or co-venturers.
Some of our loans are participation interests in loans, or co-lender arrangements, in which we share the rights, obligations and benefits of the loan with other lenders. We may need the consent of these parties to exercise our rights under such loans, including rights with respect to amendment of loan documentation, enforcement proceedings in the event of default and the institution of, and control over, foreclosure proceedings. Similarly, a majority of the participants may be able to take actions to which we object but to which we will be bound if our participation interest represents a minority interest. We may be adversely affected by this lack of complete control.
We may in the future enter, into joint venture agreements that contain terms in favor of our partners that may have an adverse effect on the value of our investments in the joint ventures. For example, we may be entitled under a particular joint venture agreement to an economic share in the profits of the joint venture that is smaller than our ownership percentage in the joint venture, our partner may be entitled to a specified portion of the profits of the joint venture before we are entitled to any portion of such profits and our partner may have rights to buy our interest in the joint venture, to force us to buy the partner’s interest in the joint venture or to compel the sale of the property owned by such joint venture. These rights may permit our partner in a particular joint venture to obtain a greater benefit from the value or profits of the joint venture
32
TABLE OF CONTENTS
than us, which may have an adverse effect on the value of our investment in the joint venture and on our financial condition and results of operations.
Liability relating to environmental matters may impact the value of the properties that we may acquire or underlying our investments.
Under various U.S. federal, state and local laws, an owner or operator of real property may become liable for the costs of removal of certain hazardous substances released on its property. These laws often impose liability without regard to whether the owner or operator knew of, or was responsible for, the release of such hazardous substances. If we fail to disclose environmental issues, we could also be liable to a buyer or lessee of a property.
There may be environmental problems associated with our properties which we were unaware of at the time of acquisition. The presence of hazardous substances may adversely affect an owner’s ability to sell real estate or borrow using real estate as collateral. To the extent that an owner of a property underlying one of our debt investments becomes liable for removal costs, the ability of the owner to make debt payments to us may be reduced. This, in turn, may adversely affect the value of the relevant mortgage asset held by us and our ability to make distributions to stockholders.
The presence of hazardous substances, if any, on our properties may adversely affect our ability to sell an affected property and we may incur substantial remediation costs, thus harming our financial condition. In addition, although our leases, if any, will generally require our tenants to operate in compliance with all applicable laws and to indemnify us against any environmental liabilities arising from a tenant’s activities on the property, we nonetheless would be subject to strict liability by virtue of our ownership interest for environmental liabilities created by such tenants, and we cannot ensure the stockholders that any tenants we might have would satisfy their indemnification obligations under the applicable sales agreement or lease. The discovery of material environmental liabilities attached to such properties could have a material adverse effect on our results of operations and financial condition and our ability to make distributions to our stockholders.
Hedging instruments often are not traded on regulated exchanges, guaranteed by an exchange or its clearing house, or regulated by any U.S. or foreign governmental authorities and involve risks and costs.
The cost of using hedging instruments increases as the period covered by the instrument increases and during periods of rising and volatile interest rates. We may increase our hedging activity and thus increase our hedging costs during periods when interest rates are volatile or rising and hedging costs have increased.
In addition, hedging instruments involve risk since they often are not traded on regulated exchanges, guaranteed by an exchange or its clearing house, or regulated by any U.S. or foreign governmental authorities. Consequently, there are no requirements with respect to record keeping, financial responsibility or segregation of customer funds and positions. Furthermore, the enforceability of agreements underlying derivative transactions may depend on compliance with applicable statutory and commodity and other regulatory requirements and, depending on the identity of the counterparty, applicable international requirements. The business failure of a hedging counterparty with whom we enter into a hedging transaction will most likely result in a default. Default by a party with whom we enter into a hedging transaction may result in the loss of unrealized profits and force us to cover our resale commitments, if any, at the then current market price. Although generally we will seek to reserve the right to terminate our hedging positions, it may not always be possible to dispose of or close out a hedging position without the consent of the hedging counterparty, and we may not be able to enter into an offsetting contract in order to cover our risk. We cannot be assured that a liquid secondary market will exist for hedging instruments purchased or sold, and we may be required to maintain a position until exercise or expiration, which could result in losses.
We may enter into derivative contracts that could expose us to contingent liabilities in the future.
Part of our investment strategy may involve entering into derivative contracts that could require us to fund cash payments in the future under certain circumstances, e.g., the early termination of the derivative agreement caused by an event of default or other early termination event, or the decision by a counterparty to request margin securities it is contractually owed under the terms of the derivative contract. The amount due would be equal to the unrealized loss of the open swap positions with the respective counterparty and could
33
TABLE OF CONTENTS
also include other fees and charges. These economic losses would be reflected in our financial results of operations, and our ability to fund these obligations will depend on the liquidity of our assets and access to capital at the time, and the need to fund these obligations could adversely impact our financial condition.
Risks Relating Primarily to Gramercy Realty
A significant portion of our properties are leased to financial institutions, making us more economically vulnerable in the event of a downturn in the banking industry.
A significant portion of our 2011 revenue was derived from leases to financial institutions. Individual banks, as well as the banking industry in general, may be adversely affected by negative economic and market conditions throughout the United States or in the local economies in which regional or community banks operate, including negative conditions caused by the recent disruptions in the financial markets. In addition, changes in trade, monetary and fiscal policies and laws, including interest rate policies of the Board of Governors of the Federal Reserve System, may have an adverse impact on banks’ loan portfolios and allowances for loan losses. As a result, we may experience higher rates of lease default or terminations in the event of a downturn in the banking industry than we would if our tenant base was more diversified.
Rising operating expenses relating to our properties could reduce our cash flow and funds available for future distributions.
Our properties are subject to operating risks common to real estate in general, any or all of which may negatively affect us. If the properties do not generate revenue sufficient to meet expenses, including debt service, tenant improvements, leasing commissions and other capital expenditures, our cash flow will be negatively impacted and we may have to utilize our existing liquidity to cover these expenses or risk forfeiture of the assets if we default on any associated debt obligations.
The bankruptcy or insolvency of our tenants under their leases or delays by our tenants in making rental payments could seriously harm our operating results and financial condition.
Any bankruptcy filings by or relating to one of our tenants could bar us from collecting pre-bankruptcy debts from that tenant or its property, unless we receive an order permitting us to do so from the bankruptcy court. A tenant bankruptcy could delay our efforts to collect past due balances under the relevant leases, and could ultimately preclude full collection of these sums. If a lease is rejected by a tenant in bankruptcy, we would have only a general unsecured claim for damages. Any unsecured claim we hold against a bankrupt entity may be paid only to the extent that funds are available and only in the same percentage as is paid to all other holders of unsecured claims. We may recover substantially less than the full value of any unsecured claims, which would harm our financial condition.
Many of our tenants are banks that are not eligible to be debtors under the federal bankruptcy code, but would be subject to the liquidation and insolvency provisions of applicable banking laws and regulations. If the FDIC were appointed as receiver of a banking tenant because of a tenant’s insolvency, we would become an unsecured creditor of the tenant and be entitled to share with the other unsecured non-depositor creditors in the tenant’s assets on an equal basis after payment to the depositors of their claims. The FDIC has broad powers to reject any contract (including a lease) of a failed depository institution that the FDIC deems burdensome if the FDIC determines that such rejection is necessary to promise the orderly administration of the institution’s affairs. By federal statute, a landlord under a lease rejected by the FDIC is not entitled to claim any damages with respect to the disaffirmation, other than rent through the effective date of the disaffirmation. The amount paid on claims in respect of the lease would depend on, among other factors, the amount of assets of the insolvent tenant available for unsecured claims. We may recover substantially less than the full value of any unsecured claims, which could have a material adverse effect on our operating results and financial condition, as well as our ability to pay dividends to stockholders at historical levels or at all.
We structure many of our real property acquisitions using complex structures often based on forecasted results for the acquisitions, and if the acquired properties underperforms forecasted results, our financial condition and operating results may be harmed.
We may acquire some of our properties under complex structures that we tailor to meet the specific needs of the tenants and/or sellers. For instance, we may enter into transactions under which a portion of the
34
TABLE OF CONTENTS
properties are vacant or will be vacant following the completion of the acquisition. If we fail to accurately forecast the leasing of such properties following our acquisition, our operating results and financial condition, as well as our ability to pay dividends to stockholders, may be adversely impacted.
Our properties may contain or develop harmful mold, which could lead to liability for adverse health effects and costs of remediating the problem.
When excessive moisture accumulates in buildings or on building materials, mold growth may occur, particularly if the moisture problem remains undiscovered or is not addressed over a period of time. Some molds may produce airborne toxins or irritants. Concern about indoor exposure to mold has been increasing as exposure to mold may cause a variety of adverse health effects and symptoms, including allergic or other reactions. As a result, the presence of significant mold at any of our properties could require us to undertake a costly remediation program to contain or remove the mold from the affected property. In addition, the presence of significant mold could expose us to liability from our tenants, employees of our tenants and others if property damage or health concerns arise.
Our properties may contain asbestos which could lead to liability for adverse health effects and costs of remediating asbestos.
Certain laws and regulations govern the removal, encapsulation or disturbance of asbestos-containing materials, or ACMs, when those materials are in poor condition or in the event of building renovation or demolition, impose certain worker protection and notification requirements, and govern emissions of and exposure to asbestos fibers in the air. These laws may also impose liability for a release of ACMs and may enable third parties to seek recovery against us for personal injury associated with ACMs. There are or may be ACMs at certain of our properties. We have either developed and implemented or are in the process of developing and implementing operations and maintenance programs that establish operating procedures with respect to ACMs.
In March 2005, GAAP clarified that the term conditional asset retirement obligation as a legal obligation to perform an asset retirement activity in which the timing and (or) method of settlement are conditional on a future event that may or may not be within the control of the entity. The obligation to perform the asset retirement activity is unconditional even though uncertainty exists about the timing and (or) method of settlement. Thus, the timing and (or) method of settlement may be conditional on a future event. Accordingly, an entity is required to recognize a liability for the fair value of a conditional asset retirement obligation if the fair value of the liability can be reasonably estimated. The fair value of a liability for the conditional asset retirement obligation is recognized when incurred — generally upon acquisition, construction, or development and (or) through the normal operation of the asset.
To comply with GAAP we assessed the cost associated with our legal obligation to remediate asbestos in our properties known to contain asbestos. We believe that the majority of the costs associated with our remediation of asbestos have been identified and recorded in compliance with GAAP, however other obligations associated with asbestos in our properties may exist. Other obligations associated with asbestos in our properties will be recorded in our consolidated statement of operations in the future when/if the cost is incurred.
Compliance with the Americans with Disabilities Act and fire, safety and other regulations may require us to make unintended expenditures that adversely impact our ability to pay dividends to stockholders at historical levels or at all.
All of our properties are required to comply with the Americans with Disabilities Act. The Americans with Disabilities Act has separate compliance requirements for “public accommodations” and “commercial facilities,” but generally requires that buildings be made accessible to people with disabilities. Compliance with the Americans with Disabilities Act requirements could require removal of access barriers and non-compliance could result in imposition of fines by the U.S. government or an award of damages to private litigants or both. While the tenants to whom we lease properties are obligated by law to comply with the Americans with Disabilities Act provisions with respect to their operations, we could be required to expend our own funds to achieve such compliance should our tenants fail to do so. In addition, we (and not our
35
TABLE OF CONTENTS
tenants) are generally required to comply with Americans with Disabilities Act provisions within the parking lots, access ways and other common areas of the properties we own and to operate our properties in compliance with fire and safety regulations, building codes and other land use regulations, as they may be adopted by governmental agencies and bodies and become applicable to our properties. We may be required to make substantial capital expenditures to comply with those requirements and these expenditures could have a material adverse effect on our ability to pay dividends to stockholders at historical levels or at all.
An uninsured loss or a loss that exceeds the policies on our properties could subject us to lost capital or revenue on those properties.
Under the terms and conditions of the leases currently in force on our properties, tenants generally are required to indemnify and hold us harmless from liabilities resulting from injury to persons, air, water, land or property, on or off the premises, due to activities conducted on the properties, except for claims arising from the negligence or intentional misconduct of us or our agents. Additionally, tenants are generally required, at the tenants’ expense, to obtain and keep in full force during the term of the lease, liability and property damage insurance policies issued by companies holding general policyholder ratings of at least “A” as set forth in the most current issue of Best’s Insurance Guide. Insurance policies for property damage are generally in amounts not less than the full replacement cost of the improvements less slab, foundations, supports and other customarily excluded improvements and insure against all perils of fire, extended coverage, vandalism, malicious mischief and special extended perils (“all risk,” as that term is used in the insurance industry). Insurance policies are generally obtained by the tenant providing general liability coverage varying between $1.0 million and $10.0 million depending on the facts and circumstances surrounding the tenant and the industry in which it operates. These policies include liability coverage for bodily injury and property damage arising out of the ownership, use, occupancy or maintenance of the properties and all of their appurtenant areas.
In addition to the indemnities and required insurance policies identified above, many of our properties are also covered by flood and earthquake insurance policies obtained by and paid for by the tenants as part of their risk management programs. Additionally, we have obtained blanket liability and property damage insurance policies to protect us and our properties against loss should the indemnities and insurance policies provided by the tenants fail to restore the properties to their condition prior to a loss. All of these policies may involve substantial deductibles and certain exclusions. In certain areas, we may have to obtain earthquake and flood insurance on specific properties as required by our lenders or by law. We have also obtained terrorism insurance on some of our larger office buildings, but this insurance is subject to exclusions for loss or damage caused by nuclear substances, pollutants, contaminants and biological and chemical weapons. Should a loss occur that is uninsured or in an amount exceeding the combined aggregate limits for the policies noted above, or in the event of a loss that is subject to a substantial deductible under an insurance policy, we could lose all or part of our capital invested in, and anticipated revenue from, one or more of the properties, which could have a material adverse effect on our operating results and financial condition, as well as our ability to pay dividends to stockholders at historical levels or at all.
Our real estate investments are subject to risks particular to real property.
We own both assets secured by real estate and real estate directly. Real estate investments are subject to risks particular to real property, including:
| • | acts of God, including earthquakes floods and other natural disasters, which may result in uninsured losses; |
| • | acts of war or terrorism, including the consequences of terrorist attacks; |
| • | adverse changes in national and local economic and market conditions, including the credit and securitization markets; |
| • | changes in governmental laws and regulations, fiscal policies and zoning ordinances and the related costs of compliance with laws and regulations, fiscal policies and ordinances; |
| • | the perceptions of prospective tenants of the attractiveness of the properties; |
| • | costs of remediation and liabilities associated with environmental conditions; and |
36
TABLE OF CONTENTS
| • | the potential for uninsured or under-insured property losses. |
If any of these or similar events occur, it may reduce our return from an affected property or investment and reduce or eliminate our ability to make distributions to stockholders.
Our real estate investments may be illiquid, which could restrict our ability to respond rapidly to changes in economic conditions.
The real estate and real estate-related assets in which we invest are generally illiquid. In addition, the instruments that we purchase in connection with privately negotiated transactions are not registered under the relevant securities laws, resulting in a prohibition against their transfer, sale, pledge or other disposition except in a transaction that is exempt from the registration requirements of, or is otherwise in accordance with, those laws. As a result, our ability to sell under-performing assets in our portfolio or respond to changes in economic and other conditions may be relatively limited.
CTL and real estate investments may generate losses.
The value of our investments and the income from our real estate investments may be significantly adversely affected by a number of factors, including:
| • | national, state and local economic climates; |
| • | real estate conditions, such as an oversupply of or a reduction in demand for real estate space in the area; |
| • | the perceptions of tenants and prospective tenants of the convenience, attractiveness and safety of our properties; |
| • | competition from comparable properties; |
| • | the occupancy rate of our properties; |
| • | the ability to collect on a timely basis all rent from tenants; |
| • | the effects of any bankruptcies or insolvencies of major tenants; |
| • | the expense of re-leasing space; |
| • | changes in interest rates and in the availability, cost and terms of mortgage funding; |
| • | the impact of present or future environmental legislation and compliance with environmental laws; |
| • | cost of compliance with the Americans with Disabilities Act; |
| • | adverse changes in governmental rules and fiscal policies; |
| • | acts of nature, including earthquakes, hurricanes and other natural disasters (which may result in uninsured losses); |
| • | acts of terrorism or war; and |
| • | adverse changes in zoning laws; and other factors which are beyond our control. |
We may experience losses if the creditworthiness of our tenants deteriorates and they are unable to meet their obligations under our leases.
We own the properties leased to the tenants of our CTL and real estate investments and we receive rents from the tenants during the terms of our leases. A tenant’s ability to pay rent is determined by the creditworthiness of the tenant. If a tenant’s credit deteriorates, the tenant may default on its obligations under our lease and the tenant may also become bankrupt. The bankruptcy or insolvency of our tenants or other failure to pay is likely to adversely affect the income produced by our CTL and real estate investments. If a tenant defaults, we may experience delays and incur substantial costs in enforcing our rights as landlord. If a tenant files for bankruptcy, we may not be able to evict the tenant solely because of such bankruptcy or
37
TABLE OF CONTENTS
failure to pay. A court, however, may authorize a tenant to reject and terminate its lease with us. In such a case, our claim against the tenant for unpaid, future rent would be subject to a statutory cap that might be substantially less than the remaining rent owed under the lease. In addition, certain amounts paid to us within 90 days prior to the tenant’s bankruptcy filing could be required to be returned to the tenant’s bankruptcy estate. In any event, it is highly unlikely that a bankrupt or insolvent tenant would pay in full amounts it owes us under a lease. In other circumstances, where a tenant’s financial condition has become impaired, we may agree to partially or wholly terminate the lease in advance of the termination date in consideration for a lease termination fee that is likely less than the agreed rental amount. Without regard to the manner in which the lease termination occurs, we are likely to incur additional costs in the form of tenant improvements and leasing commissions in our efforts to lease the space to a new tenant. In any of the foregoing circumstances, our financial performance, the market prices of our securities and our ability to pay dividends could be materially adversely affected.
We may not be able to relet or renew leases at the properties held by us on terms favorable to us.
We are subject to risks that upon expiration or earlier termination of the leases for space located at our properties the space may not be relet or, if relet, the terms of the renewal or reletting (including the costs of required renovations or concessions to tenants) may be less favorable that current lease terms. Any of these situations may result in extended periods where there is a significant decline in revenues or no revenues generated by a property. If we are unable to relet or renew leases for all or substantially all of the spaces at these properties, if the rental rates upon such renewal or reletting are significantly lower than expected, or if our reserves for these purposes prove inadequate, we will experience a reduction in net income and may be required to reduce or eliminate distributions to our stockholders.
Lease defaults or terminations or landlord-tenant disputes may adversely reduce our income from our leased property portfolio.
Lease defaults or terminations by one or more of our significant tenants may reduce our revenues unless a default in cured or a suitable replacement tenant is found promptly. In addition, disputes may arise between the landlord and tenant that result in the tenant withholding rent payments, possibly for an extended period. These disputes may lead to litigation or other legal procedures to secure payment of the rent withheld or to evict the tenant. Any of these situations may result in extended periods during which there is a significant decline in revenues or no revenues generated by the property. If this were to occur, it could adversely affect our results of operations.
We are subject to risks and uncertainties associated with operating our property management business.
We will encounter risks and difficulties as we operate our property management business. In order to achieve our goals as a property manager, we must:
| • | actively manage the assets in such portfolios in order to realize targeted performance; and |
| • | create incentives for our management and professional staff to develop and operate the property management business. |
If we do not successfully operate our property management business to achieve the investment returns that we or the market anticipates, our operations may be adversely impacted.
Risks Relating Primarily to Gramercy Finance
Our borrowers may increasingly be unable to achieve their business plans due to the economic environment and strain on commercial real estate, which may cause stress in our commercial real estate loan portfolio.
Many of our commercial real estate loans were made to borrowers who had a business plan to improve the collateral property. The current economic environment has created a number of obstacles to borrowers attempting to achieve their business plans, including lower occupancy rates and lower lease rates across all property types, which continues to be exacerbated by high unemployment and overall financial uncertainty. If borrowers are unable achieve their business plans, the related commercial real estate loans could go into default and severely impact our operating results and cash flows.
38
TABLE OF CONTENTS
A prolonged economic slowdown, a lengthy or severe recession, a reduction in liquidity, or declining real estate values could harm our operations.
We believe the risk associated with our business is more severe during periods of economic slowdown or recession if these periods are accompanied by declining real estate values. Declining real estate values will likely reduce our level of new mortgage loan originations, since borrowers often use increases in the value of their existing properties to support the purchase or investment in additional properties. Borrowers may also be less able to pay principal and interest on our loans if the real estate economy weakens. Further, declining real estate values significantly increase the likelihood that we will incur losses on our loans in the event of default because the value of our collateral may be insufficient to recover the carrying value of the loan. A reduction in capital markets liquidity may cause difficulties for borrowers seeking to refinance existing loans at or prior to maturity, even in instances of satisfactory property cash flow and collateral value. Any sustained period of increased payment delinquencies, foreclosures or losses could adversely affect both our net interest income from loans in our portfolio as well as our ability to originate, sell and securitize loans, which would significantly harm our revenues, results of operations, financial condition, business prospects and our ability to make distributions to our stockholders.
Markets have experienced, and may continue to experience, periods of high volatility accompanied by reduced liquidity.
Financial markets are susceptible to severe events evidenced by rapid depreciation in asset values accompanied by a reduction in asset liquidity. Under these extreme conditions, hedging and other risk management strategies may not be as effective at mitigating investment portfolio losses as they would be under more normal market conditions. Severe market events have historically been difficult to predict, however, and we could realize significant losses if unprecedented extreme market events were to occur, such as the recent conditions in the global financial markets and global economy.
Many of our commercial real estate loans are funded with interest reserves and our borrowers may be unable to replenish those interest reserves once they are depleted.
Given the transitional nature of many of our commercial real estate loans, we required borrowers to pre-fund reserves to cover interest and operating expenses until the property cash flows were projected to increase sufficiently to cover debt service costs. We also generally require the borrower to replenish reserves if they became deficient due to underperformance or if the borrower wanted to exercise extension options under the loan. Despite low interest rates, revenues on the properties underlying any commercial real estate loan investments will likely decrease in the current economic environment, making it more difficult for borrowers to meet their payment obligations to us. We expect that in the future some of our borrowers may have difficulty servicing our debt and will not have sufficient capital to replenish reserves, which could have a significant impact on our operating results and cash flow.
We currently have certain debt investments that permit interest to be accrued until the loans’ maturity or refinancing.
We currently have several debt investments that provide for interest accrual, in whole or in part, through loan maturity or refinancing. For loans of this type, often referred to as PIK loans, the time period between interest accrual and collection (as additional loan principal) may extend for 12 months or longer, depending on the term of the PIK loan.
The loans we invest in and the commercial mortgage loans underlying the CMBS we invest in are subject to risks of delinquency, foreclosure and loss.
Commercial mortgage loans are secured by commercial property and are subject to risks of delinquency, foreclosure and loss. CMBS evidence interests in or are secured by a single commercial mortgage loan or a pool of commercial mortgage loans. These risks of loss are greater than similar risks associated with loans made on the security of single-family residential property. The ability of a borrower to pay principal and interest on a loan secured by an income-producing property typically is dependent primarily upon the successful operation of the property rather than upon the existence of independent income or assets of the
39
TABLE OF CONTENTS
borrower. If the net operating income of the property is reduced, the borrower’s ability to repay the loan may be impaired. Net operating income of an income-producing property can be affected by a number of conditions beyond our control, including:
| • | success of tenant businesses; |
| • | property management decisions; |
| • | property location and condition; |
| • | competition from comparable types of properties; |
| • | changes in laws that increase operating expense or limit rents that may be charged; |
| • | any need to address environmental contamination at the property; |
| • | the occurrence of any uninsured casualty at the property; |
| • | changes in national, regional or local economic conditions and/or specific industry segments; |
| • | declines in regional or local real estate values; |
| • | declines in regional or local rental or occupancy rates; |
| • | increases in interest rates, real estate tax rates and other operating expenses; and |
| • | changes in governmental rules, regulations and fiscal policies, including environmental legislation, acts of God, terrorism, social unrest and civil disturbances. |
Any of these factors could have an adverse affect on the ability of the borrower to make payments of principal and interest in a timely fashion, or at all, on the mortgage loans in which we invest and could adversely affect the cash flows we intend to receive from these investments.
In the event of any default under a mortgage loan held directly by us, we will bear the risk of loss of principal to the extent of any deficiency between the value of the collateral and the principal and accrued interest on the mortgage loan, which could have a material adverse effect on our cash flow from operations and our ability to make distributions to our stockholders. In the event of the bankruptcy of a mortgage loan borrower, the mortgage loan to the borrower will be deemed to be secured only to the extent of the value of the underlying collateral at the time of bankruptcy (as determined by the bankruptcy court), and the lien securing the mortgage loan will be subject to the avoidance powers of the bankruptcy trustee or debtor-in-possession to the extent the lien is unenforceable under state law. Foreclosure of a mortgage loan can be an expensive and lengthy process which could have a substantial negative effect on our anticipated return on the foreclosed mortgage loan.
The subordinate interests in whole loans in which we invest may be subject to additional risks relating to the privately negotiated structure and terms of the transaction, which may result in losses to us.
A subordinate interest in a whole loan is a mortgage loan typically (i) secured by a whole loan on a single large commercial property or group of related properties and (ii) subordinated to a senior interest secured by the same whole loan on the same collateral. As a result, if a borrower defaults, there may not be sufficient funds remaining for subordinate interest owners after payment to the senior interest owners. Subordinate interests reflect similar credit risks to comparably rated CMBS. However, since each transaction is privately negotiated, subordinate interests can vary in their structural characteristics and risks. For example, the rights of holders of subordinate interests to control the process following a borrower default may be limited in certain investments. We cannot predict the terms of each subordinate investment. Further, subordinate interests typically are secured by a single property, and so reflect the increased risks associated with a single property compared to a pool of properties. Subordinate interests also are less liquid than CMBS, thus we may be unable to dispose of underperforming or non-performing investments. The higher risks associated with our subordinate position in these investments could subject us to increased risk of losses.
40
TABLE OF CONTENTS
Investments in mezzanine loans involve greater risks of loss than senior loans.
Investments in mezzanine loans are secured by a pledge of the ownership interests in the entity that directly or indirectly owns the property. These types of investments involve a higher degree of risk than a senior mortgage loan because the investment may become unsecured as a result of foreclosure by the senior lender. Frequently, senior loans mature simultaneously and unless extended, the investments in the mezzanine loans may be severely impaired. In the event of a bankruptcy of the entity providing the pledge of its ownership interests as security, we may not have full recourse to the assets of the property owning entity, or the assets of the entity may not be sufficient to satisfy our mezzanine loan. If a borrower defaults on our mezzanine loan or debt senior to our loan, or in the event of a borrower bankruptcy, our mezzanine loan will be satisfied only after the senior debt is paid in full. As a result, we may not recover some or all of our investment, which could result in losses. In addition, mezzanine loans may have higher loan to value ratios than conventional mortgage loans, resulting in less equity in the property and increasing the risk of loss of principal.
We evaluate the collectability of both interest and principal of each of our loans, if circumstances warrant, to determine whether they are impaired. A loan is impaired when, based on current information and events, it is probable that we will be unable to collect all amounts due according to the existing contractual terms. When a loan is impaired, the amount of the loss provision is calculated by comparing the carrying amount of the investment to the value determined by discounting the expected future cash flows at the loan’s effective interest rate or, as a practical expedient, to the value of the collateral if the loan is collateral dependent. We cannot be certain that our estimates of collectible amounts will not change over time or that they will be representative of the amounts we actually collect, including amounts we would collect if we chose to sell these investments before their maturity. If we collect less than our estimates, we will record charges which could be material.
Investment in non-conforming and non-investment grade loans may involve increased risk of loss.
We have acquired or originated, and may continue to acquire or originate in the future, certain loans that do not conform to conventional loan criteria applied by traditional lenders and are not rated or are rated as non-investment grade (for example, for investments rated by Moody’s Investors Service, ratings lower than Baa3, and for Standard & Poor’s, BBB- or below). The non-investment grade ratings for these loans typically result from the overall leverage of the loans, the lack of a strong operating history for the properties underlying the loans, the borrowers’ credit history, the properties’ underlying cash flow or other factors. As a result, these loans have a higher risk of default and loss than conventional loans. Any loss we incur may reduce distributions to our stockholders. There are no limits on the percentage of unrated or non-investment grade assets we may hold in our portfolio.
Bridge loans involve a greater risk of loss than traditional mortgage loans.
We provide bridge loans secured by first lien mortgages on a property to borrowers who are typically seeking short-term capital to be used in an acquisition or renovation of real estate. The borrower has usually identified an undervalued asset that has been under-managed or is located in a recovering market. If the market in which the asset is located fails to recover according to the borrower’s projections, or if the borrower fails to improve the quality of the asset’s management or the value of the asset, the borrower may not receive a sufficient return on the asset to satisfy the bridge loan, and we may not recover some or all of our investment.
In addition, owners usually borrow funds under a conventional mortgage loan to repay a bridge loan. We may therefore be dependent on a borrower’s ability to obtain permanent financing to repay our bridge loan, which could depend on market conditions and other factors. Bridge loans are also subject to risks of borrower defaults, bankruptcies, fraud, losses and special hazard losses that are not covered by standard hazard insurance. In the event of any default under bridge loans held by us, we bear the risk of loss of principal and non-payment of interest and fees to the extent of any deficiency between the value of the mortgage collateral and the principal amount of the bridge loan. To the extent we suffer such losses with respect to our investments in bridge loans, the value of our company and the price of our common stock may be adversely affected.
41
TABLE OF CONTENTS
Preferred equity investments involve a greater risk of loss than traditional debt financing.
Preferred equity investments are subordinate to debt financing and are not secured. Should the issuer default on our investment, we would only be able to proceed against the entity that issued the preferred equity in accordance with the terms of the preferred security, and not any property owned by the entity. Furthermore, in the event of bankruptcy or foreclosure, we would only be able to recoup our investment after any lenders to the entity are paid. As a result, we may not recover some or all of our investment, which could result in losses.
We may not have control over certain of our loans and investments.
Our ability to manage our portfolio of loans and investments may be limited by the form in which they are made. In certain situations, we or our investment management vehicles may:
| • | acquire investments subject to rights of senior classes and servicers under inter-creditor or servicing agreements; |
| • | acquire only a minority and/or a non-controlling participation in an underlying investment; |
| • | co-invest with third parties through partnerships, joint ventures or other entities, thereby acquiring non-controlling interests; or |
| • | rely on independent third party management or strategic partners with respect to the management of an asset. |
We may make investments in assets with lower credit quality, which will increase our risk of losses.
Substantially all of our securities investments have explicit ratings assigned by at least one of the three leading nationally-recognized statistical rating agencies. However, we may invest in unrated securities or participate in unrated or distressed mortgage loans. An economic downturn, for example, could cause a decline in the price of lower credit quality investments and securities because the ability of the obligors of mortgages, including mortgages underlying CMBS, to make principal and interest payments may be impaired. If this were to occur, existing credit support in the securitization structure may be insufficient to protect us against loss of our principal on these investments and securities. We have not established and do not currently plan to establish any investment criteria to limit our exposure to these risks for future investments.
Our investments in subordinate loans and subordinated CMBS are subject to losses.
We acquire subordinated loans and may invest in subordinated CMBS. In the event a borrower defaults on a loan and lacks sufficient assets to satisfy our loan, we may suffer a loss of principal or interest. In the event a borrower declares bankruptcy, we may not have full recourse to the assets of the borrower, or the assets of the borrower may not be sufficient to satisfy the loan. In addition, certain of our loans may be subordinate to other debt of the borrower. If a borrower defaults on our loan or on debt senior to our loan, or in the event of a borrower bankruptcy, our loan will be satisfied only after the senior debt is paid in full. Where debt senior to our loan exists, the presence of intercreditor arrangements may limit our ability to amend our loan documents, assign our loans, accept prepayments, exercise our remedies (through “standstill periods”) and control decisions made in bankruptcy proceedings relating to borrowers.
In general, losses on a mortgage loan included in a securitization will be borne first by the equity holder of the property, then by a cash reserve fund or letter of credit, if any, and then by the “first loss” subordinated security holder. In the event of default and the exhaustion of any equity support, reserve fund, letter of credit and any classes of securities junior to those in which we invest, we will not be able to recover all of our investment in the securities we purchase. Likewise, we may not be able to recover some or all of our investment in certain subordinated loans in which we obtain interests. In addition, if the underlying mortgage portfolio has been overvalued by the originator, or if the value subsequently declines and, as a result, less collateral is available to satisfy interest and principal payments due on the related CMBS, the securities in which we invest may effectively become the “first loss” position behind the more senior securities, which may result in significant losses to us.
An economic slowdown or recession, such as we are experiencing, could increase the risk of loss on our investments in subordinated CMBS. The prices of lower credit-quality securities, such as the subordinated
42
TABLE OF CONTENTS
CMBS in which we may invest, are very sensitive to adverse economic downturns or individual property developments. An economic downturn or a projection of an economic downturn could cause a decline in the price of lower credit quality securities because the ability of obligors of mortgages underlying CMBS to make principal and interest payments may be impaired. In such event, existing credit support to a securitized structure may be insufficient to protect us against loss of our principal on these securities.
Our due diligence may not reveal all of a borrower’s liabilities and may not reveal other weaknesses in its business.
Before making a loan to a borrower, we assess the strength and skills of such entity’s management and other factors that we believe are material to the performance of the investment. In making the assessment and otherwise conducting customary due diligence, we rely on the resources available to us and, in some cases, an investigation by third parties. This process is particularly subjective with respect to newly organized entities because there may be little or no information publicly available about the entities. There can be no assurance that our due diligence processes will uncover all relevant facts or that any investment will be successful.
We are subject to the risk that provisions of our loan agreements may be unenforceable.
Our rights and obligations with respect to our loans are governed by written loan agreements and related documentation. It is possible that a court could determine that one or more provisions of a loan agreement are unenforceable, such as a loan prepayment provision or the provisions governing our security interest in the underlying collateral. If this were to happen with respect to a material asset or group of assets we could be adversely affected.
Credit ratings assigned to our CMBS investments are subject to ongoing evaluation and we cannot assure you that the ratings currently assigned to our investments will not be downgraded or that they accurately reflect the risks associated with those investments.
Some of the CMBS securities in which we invest are rated by S&P, Moody’s and/or Fitch. Rating agencies rate these investments based upon their assessment of the perceived safety of the receipt of principal and interest payments from the issuers of such debt securities. Credit ratings assigned by the rating agencies may not fully reflect the true risks of an investment in such securities. Also, rating agencies may fail to make timely adjustments to credit ratings based on recently available data or changes in economic outlook or may otherwise fail to make changes in credit ratings in response to subsequent events, so that our investments may in fact be better or worse than the ratings indicate. We try to reduce the impact of the risk that a credit rating may not accurately reflect the risks associated with a particular debt security by not relying solely on credit ratings as the indicator of the quality of an investment. We make our acquisition decisions after factoring in other information, such as the discounted value of a CMBS security’s projected future cash flows, and the value of the real estate collateral underlying the mortgage loans owned by the issuing Real Estate Mortgage Investment Conduit, or REMIC, trust. However, our assessment of the quality of a CMBS investment may also prove to be inaccurate and we may incur credit losses in excess of our initial expectations.
Credit rating agencies may also change their methods of evaluating credit risk and determining ratings on securities backed by real estate loans and securities. These changes have increased in frequency in recent years and in the future may occur quickly and often. Downgrades of CMBS could result in the failure of one or more of our CDOs to fail to comply with par value tests or other covenants, which in turn may result in the diversion of cash distributions by the affected CDO to its senior-most bondholders instead of to us, and the potential termination of us as the collateral manager of such CDO which may in turn reduce our liquidity. CMBS downgrades may also result in downgrades in the CDO liabilities issued by our CDOs. The commercial real estate mortgage finance, real estate and capital markets’ ability to understand and absorb these changes, and the impact to the securitization market in general, are difficult to predict, and such downgrades could have a material adverse effect on our business, financial condition, liquidity and results of operations.
Our returns will be adversely affected when investments held in CDOs are prepaid or sold subsequent to the reinvestment period.
Our loan and CMBS investments are subject to prepayment risk. In addition, we may sell, and realize gains (or losses) on, investments. To the extent such assets were held in CDOs subsequent to the end of the
43
TABLE OF CONTENTS
reinvestment period, the proceeds are fully utilized to pay down the related CDO’s debt which will cause the leverage on the CDO to decrease. A reduction in leverage will cause our return on equity to decline, which could have a material adverse effect on our business, financial condition, liquidity and results of operations. A decrease in our return on equity could make it more difficult to raise capital in the future.
Our investments in debt securities are subject to specific risks relating to the particular issuer of the securities and to the general risks of investing in subordinated real estate securities.
Our investments in debt securities involve special risks. REITs generally are required to invest substantially in real estate or real estate-related assets and are subject to the inherent risks associated with real estate-related investments discussed in this filing. Our investments in debt are subject to the risks described above with respect to mortgage loans and CMBS and similar risks, including:
| • | risks of delinquency and foreclosure, and risks of loss in the event thereof; |
| • | the dependence upon the successful operation of and net income from real property; |
| • | risks generally incident to interests in real property; and |
| • | risks that may be presented by the type and use of a particular commercial property. |
Debt securities may be unsecured and may also be subordinated to other obligations of the issuer. We may also invest in debt securities that are rated below investment grade. As a result, investments in debt securities are also subject to risks of:
| • | limited liquidity in the secondary trading market; |
| • | substantial market price volatility resulting from changes in prevailing interest rates or credit spreads; |
| • | subordination to the prior claims of banks and other senior lenders to the issuer; |
| • | the operation of mandatory sinking fund or call/redemption provisions during periods of declining interest rates that could cause the issuer to reinvest premature redemption proceeds in lower yielding assets; |
| • | the possibility that earnings of the debt security issuer may be insufficient to meet its debt service; and |
| • | the declining creditworthiness and potential for insolvency of the issuer of such debt securities during periods of rising interest rates and economic downturn. |
These risks may adversely affect the value of outstanding debt securities and the ability of the issuers thereof to repay principal and interest.
Our mortgage loans, mezzanine loans, participation interests in mortgage and mezzanine loans, real estate securities and preferred equity investments have been and may continue to be adversely affected by widening credit spreads, and if spreads continue to widen, the value of our loan and securities portfolios would decline further.
Our investments in commercial real estate loans and real estate securities are subject to changes in credit spreads. When credit spreads widen, the economic value of our existing loans decrease. If a lender were to originate a similar loan today, such loan would carry a greater credit spread than many existing loans, depending on their vintage. Even though a loan may be performing in accordance with its loan agreement and the underlying collateral has not changed, the economic value of the loan may be negatively impacted by the incremental interest foregone from the widened credit spread. The economic value of our commercial real estate loan portfolio and our real estate securities portfolio has been significantly impacted, and may continue to be significantly impacted, by credit spread widening.
Our hedging transactions may limit our gains or result in losses.
We use a variety of derivative instruments that are considered conventional “plain vanilla” derivatives, including interest rate swaps, caps, collars and floors, in our risk management strategy to limit the effects of
44
TABLE OF CONTENTS
changes in interest rates on our operations. The value of our derivatives may fluctuate over time in response to changing market conditions, and will tend to change inversely with the value of the risk in our liabilities that we intend to hedge. Hedges are sometimes ineffective because the correlation between changes in value of the underlying investment and the derivative instrument is less than was expected when the hedging transaction was undertaken. Our hedging transactions, which are intended to limit losses, may actually limit gains and increase our exposure to losses. The use of derivatives to hedge our liabilities carries certain risks, including the risk that losses on a hedge position will reduce the cash available for distribution to stockholders and that these losses may exceed the amount invested in such instruments. A hedge may not be effective in eliminating all of the risks inherent in any particular position and could result in higher interest rates than we would otherwise have. In addition, there will be various market risks against which we may not be able to hedge effectively. Moreover, no hedging activity can completely insulate us from the risks associated with changes in interest rates, and our qualification as a REIT may limit our ability to effectively hedge our interest rate exposure. Our profitability may be adversely affected during any period as a result of the use of derivatives.
We may be subject to lender liability claims.
In recent years, a number of judicial decisions have upheld the right of borrowers to sue lending institutions on the basis of various evolving legal theories, collectively termed “lender liability.” Generally, lender liability is founded on the premise that a lender has either violated a duty, whether implied or contractual, of good faith and fair dealing owed to the borrower or has assumed a degree of control over the borrower resulting in the creation of a fiduciary duty owed to the borrower or its other creditors or stockholders. There can be no assurance that such claims will not arise or that we will not be subject to significant liability if a claim of this type did arise.
Risks Related to Our Organization and Structure
Maryland takeover statutes may prevent a change of control of our company, which could depress our stock price.
Under Maryland law, certain “business combinations” between a Maryland corporation and an interested stockholder or an affiliate of an interested stockholder are prohibited for five years after the most recent date on which the interested stockholder becomes an interested stockholder. These business combinations include a merger, consolidation, share exchange, or asset transfers or issuance or reclassification of equity securities. An interested stockholder is defined as:
| • | any person who beneficially owns 10% or more of the voting power of the corporation’s shares; or |
| • | an affiliate or associate of the corporation who, at any time within the two-year period prior to the date in question, was the beneficial owner of 10% or more of the voting power of the then outstanding voting stock of the corporation. |
A person is not an interested stockholder under the statute if our board of directors approves in advance the transaction by which he otherwise would have become an interested stockholder.
After the five-year prohibition, any business combination between the Maryland corporation and an interested stockholder generally must be recommended by our board of directors of the corporation and approved by the affirmative vote of at least:
| • | 80% of the votes entitled to be cast by holders of outstanding shares of voting stock of the corporation; and |
| • | two-thirds of the votes entitled to be cast by holders of voting stock of the corporation other than shares held by the interested stockholder with whom or with whose affiliate the business combination is to be effected or by the interested stockholder’s affiliates or associates, voting together as a single group. |
The business combination statute may discourage others from trying to acquire control of us and increase the difficulty of consummating any offer, including potential acquisitions that might involve a premium price for our common stock or otherwise be in the best interest of our stockholders.
45
TABLE OF CONTENTS
We have opted out of these provisions of the Maryland General Corporation Law, or the MGCL, with respect to its business combination provisions and its control share provisions by resolution of our board of directors and a provision in our bylaws, respectively. However, in the future our board of directors may reverse its decision by resolution and elect to opt in to the MGCL’s business combination provisions, or amend our bylaws and elect to opt in to the MGCL’s control share provisions.
Additionally, Title 8, Subtitle 3 of the MGCL permits our board of directors, without stockholder approval and regardless of what is provided in our charter or bylaws, to implement takeover defenses, some of which we do not have. These provisions may have the effect of inhibiting a third party from making us an acquisition proposal or of delaying, deferring or preventing a change in our control under circumstances that otherwise could provide the stockholders with an opportunity to realize a premium over the then-current market price.
Our authorized but unissued preferred stock may prevent a change in our control which could be in the stockholders’ best interests.
Our charter authorizes us to issue additional authorized but unissued shares of our common stock or preferred stock. Any such issuance could dilute our existing stockholders’ interests. In addition, our board of directors may classify or reclassify any unissued shares of preferred stock and may set the preferences, rights and other terms of the classified or reclassified shares. As a result, our board of directors may establish a series of preferred stock that could delay or prevent a transaction or a change in control that might be in the best interest of our stockholders.
Our staggered board of directors and other provisions of our charter and bylaws may prevent a change in our control.
Our board of directors is divided into three classes of directors. The current terms of the directors expire in 2012, 2013 and 2014. Directors of each class are chosen for three-year terms upon the expiration of their current terms, and each year one class of directors is elected by the stockholders. On April 22, 2010, Marc Holliday notified our board of directors that he would not stand for election as a Class III director for a new term at our 2010 annual meeting of stockholders. However, Mr. Holliday agreed with our board of directors that he would remain as a director on an interim basis for an unspecified period of time following our 2010 annual meeting. Mr. Holliday has remained as a director in an interim role for much longer than anticipated. Under Maryland law, a director continues as a director until he resigns or his successor is duly elected and appointed.
The staggered terms of our directors may reduce the possibility of a tender offer or an attempt at a change in control, even though a tender offer or change in control might be in the best interest of our stockholders. In addition, our charter and bylaws also contain other provisions that may delay or prevent a transaction or a change in control that might be in the best interest of our stockholders.
Changes in market conditions could adversely affect the market price of our common stock.
As with other publicly traded equity securities, the value of our common stock depends on various market conditions which may change from time to time. Among the market conditions that may affect the value of our common stock are the following:
| • | the general reputation of REITs and the attractiveness of our equity securities in comparison to other equity securities, including securities issued by other real estate-based companies; |
| • | our financial performance; and |
| • | general stock and bond market conditions. |
The market value of our common stock is based primarily upon the market’s perception of our growth potential and our current and potential future earnings and cash distributions. Consequently, our common stock may trade at prices that are higher or lower than our net asset value per share of common stock. If our future earnings or cash dividends are less than expected, it is likely that the market price of our common stock will diminish.
46
TABLE OF CONTENTS
An increase in market interest rates may have an adverse effect on the market price of our common stock.
One of the factors that investors may consider in deciding whether to buy or sell shares of our common stock is our distribution rate as a percentage of our share price relative to market interest rates. If the market price of our common stock is based primarily on the earnings and return that we derive from our investments and income with respect to our investments and our related distributions to stockholders, and not from the market value of the investments themselves, then interest rate fluctuations and capital market conditions will likely affect the market price of our common stock. For instance, if market rates rise without an increase in our distribution rate, the market price of our common stock could decrease as potential investors may require a higher distribution yield on our common stock or seek other securities paying higher distributions or interest. In addition, rising interest rates would result in increased interest expense on our variable rate debt, thereby adversely affecting cash flow and our ability to service our indebtedness and pay distributions.
Risks Related to Our Taxation as a REIT
Our failure to qualify as a REIT would result in higher taxes and reduced cash available for stockholders.
We intend to continue to operate in a manner so as to qualify as a REIT for U.S. federal income tax purposes. Our continued qualification as a REIT depends on our satisfaction of certain asset, income, organizational, distribution and stockholder ownership requirements on a continuing basis. Our ability to satisfy some of the asset tests depends upon the fair market values of our assets, some of which are not able to be precisely determined and for which we will not obtain independent appraisals. If we were to fail to qualify as a REIT in any taxable year, and certain statutory relief provisions were not available, we would be subject to U.S. federal income tax, including any applicable alternative minimum tax, on our taxable income at regular corporate rates, and distributions to stockholders would not be deductible by us in computing our taxable income. Any such corporate tax liability could be substantial and would reduce the amount of cash available for distribution. Unless entitled to relief under certain Internal Revenue Code provisions, we also would be disqualified from taxation as a REIT for the four taxable years following the year during which we ceased to qualify as a REIT.
REIT distribution requirements could adversely affect our liquidity.
In order to qualify as a REIT, each year we must distribute to our stockholders at least 90% of our REIT taxable income, determined without regard to the dividends paid deduction, and not including any net capital gain. To the extent that we satisfy this distribution requirement, but distribute less than 100% of our net taxable income, we will be subject to U.S. federal corporate income tax on our undistributed net taxable income. In addition, we will be subject to a 4% nondeductible excise tax if the actual amount that we pay out to our stockholders in a calendar year is less than a minimum amount specified under U.S. federal tax laws.
When necessary, we intend to continue to make distributions to our stockholders to comply with the REIT distribution requirements and avoid corporate income tax and/or excise tax. However, differences in timing between the recognition of taxable income and the actual receipt of cash could require us to sell assets or borrow funds on a short-term or long-term basis to meet the 90% distribution requirement or avoid corporate income or excise tax. We may own assets that generate mismatches between taxable income and available cash. These assets may include (a) securities that have been financed through financing structures which require some or all of available cash flows to be used to service borrowings, (b) loans or CMBS we hold that have been issued at a discount and require the accrual of taxable economic interest in advance of receipt in cash (c) distressed debt on which we may be required to accrue taxable interest income even though the borrower is unable to make current debt service payments in cash and (d) debt investments that generate taxable income but are held by one or more of our CDOS which is not currently making cash distributions to us as the owner of the non-investment liabilities and equity of the CDO. As a result, the requirement to distribute a substantial portion of our net taxable income could cause us to: (a) sell assets in adverse market conditions, (b) borrow on unfavorable terms or (c) distribute amounts that would otherwise be invested in future acquisitions, capital expenditures or repayment of debt to comply with REIT requirements.
Further, amounts distributed will not be available to fund investment activities. We expect to fund our investments by raising equity capital and through borrowings from financial institutions and the debt capital
47
TABLE OF CONTENTS
markets. If we fail to obtain debt or equity capital in the future, it could limit our ability to grow, which could have a material adverse effect on the value of our common stock.
In January 2011, an “ownership change” for purposes of Section 382 of the Internal Revenue Code, of 1986, as amended, occurred which limits our ability to utilize our net operating losses and net capital losses against future taxable income, increasing our dividend distribution requirement which could adversely affect our liquidity.
We have substantial net operating and net capital loss carry forwards which we have used to offset our tax and/or distribution requirements. In January 2011, an “ownership change” for purposes of Section 382 of the Internal Revenue Code occurred, which will limit our ability to use these losses in the future. In general, an “ownership change” occurs if there is a change in ownership of more than 50% of our common stock during any cumulative three year period. For this purpose, determinations of ownership changes are generally limited to shareholders deemed to own 5% or more of our common stock. Such a change in ownership may be triggered by regular trading activity in our common stock, which is generally beyond our control. The provisions of Section 382, will impose an annual limit to the amount of net operating loss carryforward that can be used by us to offset future ordinary taxable income, beginning with our 2011 taxable year. Such limitations may increase our dividend distribution requirement in the future which could adversely affect our liquidity.
Complying with REIT requirements may limit our ability to hedge effectively.
The existing REIT provisions of the Internal Revenue Code may limit our ability to hedge our operations. Except to the extent provided by Treasury regulations, (i) for transactions entered into on or prior to July 30, 2008, any income from a hedging transaction we enter into in the normal course of our business primarily to manage risk of interest rate or price changes or currency fluctuations with respect to borrowings made or to be made, or ordinary obligations incurred or to be incurred, to acquire or carry real estate assets, including gain from the sale or disposition of such a transaction, will not constitute gross income for purposes of the 95% gross income test (and will generally constitute non-qualifying income for purposes of the 75% gross income test) and (ii) for transactions entered into after July 30, 2008, any income from a hedging transaction where the instrument hedges interest rate risk on liabilities used to carry or acquire real estate or hedges risk of currency fluctuations with respect to any item of income or gain that would be qualifying income under the 75% or 95% gross income tests will be excluded from gross income for purposes of the 75% and 95% gross income tests. To qualify under either (i) or (ii) of the preceding sentence, the hedging transaction must be clearly identified as specified in Treasury regulations before the close of the day on which it was acquired, originated or entered into. To the extent that we enter into other types of hedging transactions, the income from those transactions is likely to be treated as non-qualifying income for purposes of both of the gross income tests. In addition, we must limit our aggregate income from non-qualified hedging transactions, from our provision of services and from other non-qualifying sources, to less than 5% of our annual gross income (determined without regard to gross income from qualified hedging transactions). As a result, we may have to limit our use of certain hedging techniques or implement those hedges through TRSs. This could result in greater risks associated with changes in interest rates than we would otherwise want to incur or could increase the cost of our hedging activities. If we fail to satisfy the 75% or 95% limitations, we could lose our REIT qualification for U.S. federal income tax purposes, unless our failure was due to reasonable cause and not due to willful neglect, and we meet certain other technical requirements. Even if our failure was due to reasonable cause, we might incur a penalty tax.
We may in the future choose to pay dividends in our own stock, in which case you may be required to pay income taxes in excess of the cash dividends you receive.
We may in the future distribute taxable dividends that are payable in cash and shares of our common stock at the election of each stockholder. Taxable stockholders receiving such dividends will be required to include the full amount of the dividend as ordinary income to the extent of our current and accumulated earnings and profits for United States federal income tax purposes. As a result, a U.S. stockholder may be required to pay income taxes with respect to such dividends in excess of the cash dividends received. If a U.S. stockholder sells the stock it receives as a dividend in order to pay this tax, the sales proceeds may be
48
TABLE OF CONTENTS
less than the amount included in income with respect to the dividend, depending on the market price of our stock at the time of the sale. Furthermore, with respect to non-U.S. stockholders, we may be required to withhold U.S. tax with respect to such dividends, including in respect of all or a portion of such dividend that is payable in stock. In addition, if a significant number of our stockholders determine to sell shares of our common stock in order to pay taxes owed on dividends, it may put downward pressure on the trading price of our common stock.
The stock ownership limit imposed by the Internal Revenue Code for REITs and our charter may inhibit market activity in our stock and may restrict our business combination opportunities.
In order for us to maintain our qualification as a REIT under the Internal Revenue Code, not more than 50% in value of our outstanding stock may be owned, directly or indirectly, by five or fewer individuals (as defined in the Internal Revenue Code to include certain entities) at any time during the last half of each taxable year. Our charter, with certain exceptions, authorizes our directors to take such actions as are necessary and desirable to preserve our qualification as a REIT. Unless exempted by our board of directors, no person may own more than 9.8% of the aggregate value of the outstanding shares of our stock. Our board of directors may not grant such an exemption to any proposed transferee whose ownership of in excess of 9.8% of the value of our outstanding shares would result in the termination of our status as a REIT. Our board of directors has waived this provision in connection with SL Green’s purchase of our shares. We have also granted waivers to two other purchasers in connection with their purchase of our shares in a previous private placement. These ownership limits could delay or prevent a transaction or a change in our control that might be in the best interest of our stockholders.
The tax on prohibited transactions will limit our ability to engage in transactions, including certain methods of securitizing loans and selling our loans and real estate properties, that may be treated as sales for U.S. federal income tax purposes. In addition, as we have succeeded to any potential tax liability of American Financial in the merger, we may be subject to this tax on certain of its past dispositions. If the Internal Revenue Service were to successfully characterize those past dispositions as prohibited transactions, the resulting tax liability could have a material adverse effect on our results of operations.
A REIT’s gain from prohibited transactions is subject to a 100% tax. In general, prohibited transactions are sales or other dispositions of property, other than foreclosure property, but including mortgage loans and real estate, held primarily for sale to customers in the ordinary course of business.
We might be subject to this tax if we were to sell or securitize loans or dispose of loans or real estate in a manner that was treated as a sale of the loans or real estate for U.S. federal income tax purposes. Therefore, in order to avoid the prohibited transactions tax, we may choose not to engage in certain sales of loans or real estate and may limit the structures we utilize for our securitization transactions even though such sales or structures might otherwise be beneficial to us. It may be possible to reduce the impact of the prohibited transaction tax by engaging in securitization transactions treated as sales and loan and real estate dispositions through one or more of our TRSs, subject to certain limitations. Generally, to the extent that we engage in securitizations treated as sales or dispose of loans or real estate through one or more TRSs, the income associated with such activities would be subject to full corporate income tax at standard rates.
Prior to our merger with American Financial, American Financial disposed of properties that it deemed to be inconsistent with the investment parameters for its portfolio or for other reasons it deemed appropriate. If American Financial believed that a sale of a property would likely be subject to the prohibited transaction tax if sold by the parent REIT, it disposed of that property through its TRS, in which case the gain from the sale was subject to corporate income tax at standard rates but not the 100% prohibited transaction tax. We intend to continue to sell real estate in a manner similar to American Financial. If the Internal Revenue Service were to successfully characterize American Financial’s past dispositions (including the dispositions through its TRS) as prohibited transactions, we, as successor to American Financial’s tax liabilities and property disposition procedures, could be subject to a 100% tax on the gain from those dispositions, and the resulting tax liability could have a material adverse effect on our results of operations. In addition, we may be liable for the 100% prohibited transaction tax if the Internal Revenue Service were to successfully challenge our future dispositions of loans and real estate.
49
TABLE OF CONTENTS
The “taxable mortgage pool” rules may limit the manner in which we effect future securitizations and may subject us to U.S. federal income tax and increase the tax liability of our stockholders.
Certain of our current and future securitizations, such as our CDOs, could be considered to result in the creation of taxable mortgage pools for U.S. federal income tax purposes. As a REIT, so long as we or another private subsidiary REIT own 100% of the equity interests in a taxable mortgage pool, our qualification as a REIT would not be adversely affected by the characterization of the securitization as a taxable mortgage pool. We would generally be precluded, however, from holding equity interests in such securitizations through our operating partnership (unless held through a private subsidiary REIT), selling to outside investors equity interests in such securitizations or from selling any debt securities issued in connection with such securitizations that might be considered to be equity interests for tax purposes. These limitations will preclude us from using certain techniques to maximize our returns from securitization transactions.
Furthermore, we are taxable at the highest corporate income tax rate on a portion of the income arising from a taxable mortgage pool that is allocable to the percentage of our shares held by “disqualified organizations,” which are generally certain cooperatives, governmental entities and tax-exempt organizations that are exempt from unrelated business taxable income. We expect that disqualified organizations will own our shares from time to time.
In addition, if we realize excess inclusion income and allocate it to stockholders, this income cannot be offset by net operating losses of our stockholders. If the stockholder is a tax-exempt entity and not a disqualified organization, then this income would be fully taxable as unrelated business taxable income under Section 512 of the Internal Revenue Code. If the stockholder is a foreign person, it would be subject to U.S. federal income tax withholding on this. Nominees or other broker/dealers who hold our stock on behalf of disqualified organizations are subject to tax at the highest corporate income tax rate on a portion of our excess inclusion income allocable to the stock held on behalf of disqualified organizations. If the stockholder is a REIT, a regulated investment company, or RIC, common trust fund, or other pass-through entity, its allocable share of our excess inclusion income could be considered excess inclusion income of such entity and such entity will be subject to tax at the highest corporate tax rate on any excess inclusion income allocated to their owners that are disqualified organizations. Accordingly, such investors should be aware that a portion of our income may be considered excess inclusion income. Finally, if we fail to qualify as a REIT, our taxable mortgage pool securitizations will be treated as separate taxable corporations for U.S. federal income tax purposes.
We may be unable to generate sufficient revenue from operations to pay our operating expenses and to pay distributions to our stockholders.
As a REIT, we are generally required to distribute at least 90% of our REIT taxable income, determined without regard to the dividends paid deduction and not including net capital gains, each year to our stockholders. To qualify for the tax benefits accorded to REITs, we have and intend to continue to make distributions to our stockholders in amounts such that we distribute all or substantially all our net taxable income each year, subject to certain adjustments. However, our ability to make distributions may be adversely affected by the risk factors described in this Annual Report on Form 10-K. In the event of a downturn in our operating results and financial performance or unanticipated declines in the value of our asset portfolio, we may be unable to declare or pay quarterly distributions or make distributions to our stockholders. The timing and amount of distributions are in the sole discretion of our board of directors, which considers, among other factors, our earnings, financial condition, debt service obligations and applicable debt covenants, REIT qualification requirements and other tax considerations and capital expenditure requirements as our board may deem relevant from time to time.
Although our use of TRSs may be able to partially mitigate the impact of meeting the requirements necessary to maintain our qualification as a REIT, our ownership of and relationship with our TRSs will be limited and a failure to comply with the limits would jeopardize our REIT qualification and may result in the application of a 100% excise tax.
A REIT may own up to 100% of the stock of one or more TRSs. A TRS generally may hold assets and earn income that would not be qualifying assets or income if held or earned directly by a REIT. Both the subsidiary and the REIT must jointly elect to treat the subsidiary as a TRS. A corporation of which a TRS
50
TABLE OF CONTENTS
directly or indirectly owns more than 35% of the voting power or value of the stock will automatically be treated as a TRS. Overall, no more than 25% (20% for tax years commencing before January 1, 2009) of the value of a REIT’s assets may consist of stock or securities of one or more TRSs. In addition, the TRS rules limit the deductibility of interest paid or accrued by a TRS to its parent REIT to assure that the TRS is subject to an appropriate level of corporate taxation. The rules also impose a 100% excise tax on certain transactions between a TRS and its parent REIT that are not conducted on an arm’s-length basis.
Our TRSs, including GKK Management Co., LLC, GKK Trading Corp., GIT Trading Corp. and Whiteface Holdings, LLC will pay U.S. federal, state and local income tax on their taxable income, and their after-tax net income will be available for distribution to us but will not be required to be distributed to us. We anticipate that the aggregate value of TRS securities owned by us will be less than 25% of the value of our total assets (including such TRS securities). Furthermore, we will monitor the value of our respective investments in our TRSs for the purpose of ensuring compliance with the rule that no more than 25% of the value of a REIT’s assets may consist of TRS securities (which is applied at the end of each calendar quarter). In addition, we will scrutinize all of our transactions with our TRSs for the purpose of ensuring that they are entered into on arm’s-length terms in order to avoid incurring the 100% excise tax described above. The value of the securities that we hold in our TRSs may not be subject to precise valuation. Accordingly, there can be no complete assurance that we will be able to comply with the 25%, limitation discussed above or avoid application of the 100% excise tax discussed above.
Cautionary Note Regarding Forward-Looking Information
This report contains “forward-looking statements” within the meaning of Section 27A of the Securities Act and Section 21E of the Securities Exchange Act of 1934, as amended, or the Exchange Act. You can identify forward-looking statements by the use of forward-looking expressions such as “may,” “will,” “should,” “expect,” “believe,” “anticipate,” “estimate,” “intend,” “plan,” “project,” “continue,” or any negative or other variations on such expressions. Forward-looking statements include information concerning possible or assumed future results of our operations, including any forecasts, projections, plans and objectives for future operations. Although we believe that our plans, intentions and expectations as reflected in or suggested by those forward-looking statements are reasonable, we can give no assurance that the plans, intentions or expectations will be achieved. We have listed below some important risks, uncertainties and contingencies which could cause our actual results, performance or achievements to be materially different from the forward-looking statements we make in this report. These risks, uncertainties and contingencies include, but are not limited to, the following:
| • | the continuity of the management agreement for the KBS portfolio; |
| • | reduction in cash flows received from our investments, in particular our CDOs; |
| • | the adequacy of our cash reserves, working capital and other forms of liquidity; |
| • | the availability, terms and deployment of short-term and long-term capital; |
| • | the performance and financial condition of borrowers, tenants, and corporate customers; |
| • | the cost and availability of our financings, which depends in part on our asset quality, the nature of our relationships with our lenders and other capital providers, our business prospects and outlook and general market conditions; |
| • | availability of, and ability to retain, qualified personnel and directors; |
| • | our ability to satisfy all covenants in our CDOs and specifically compliance with overcollateralization and interest coverage tests; |
| • | changes to our management and board of directors; |
| • | the success or failure of our efforts to implement our current business strategy; |
| • | economic conditions generally and in the commercial finance and real estate markets and the banking industry specifically; |
51
TABLE OF CONTENTS
| • | the resolution of our non-performing and sub-performing assets and any losses we might recognize in connection with such investments; |
| • | unanticipated increases in financing and other costs, including a rise in interest rates; |
| • | availability of investment opportunities on real estate assets and real estate-related and other securities; |
| • | risks of structured finance investments; |
| • | risks of real estate acquisitions; |
| • | the actions of our competitors and our ability to respond to those actions; |
| • | the timing of cash flows, if any, from our investments; |
| • | demand for office space; |
| • | our ability to maintain our current relationships with financial institutions and to establish new relationships with additional financial institutions; |
| • | our ability to identify and complete additional property acquisitions; |
| • | our ability to profitably dispose of non-core assets; |
| • | changes in governmental regulations, tax rates and similar matters; |
| • | legislative and regulatory changes (including changes to laws governing the taxation of REITs or the exemptions from registration as an investment company); |
| • | environmental and/or safety requirements; |
| • | our ability to satisfy complex rules in order for us to qualify as a REIT, for federal income tax purposes and qualify for our exemption under the Investment Company Act, our operating partnership’s ability to satisfy the rules in order for it to qualify as a partnership for federal income tax purposes, and the ability of certain of our subsidiaries to qualify as REITs and certain of our subsidiaries to qualify as TRSs for federal income tax purposes, and our ability and the ability of our subsidiaries to operate effectively within the limitations imposed by these rules; |
| • | the continuing threat of terrorist attacks on the national, regional and local economies; and |
| • | other factors discussed under Item 1A, “Risk Factors” of this Annual Report on Form 10-K for the year ended December 31, 2011 and those factors that may be contained in any filing we make with the SEC, including Part II, Item 1A of the Quarterly Reports on Form 10-Q. |
We assume no obligation to update publicly any forward-looking statements, whether as a result of new information, future events, or otherwise. In evaluating forward-looking statements, you should consider these risks and uncertainties, together with the other risks described from time-to-time in our reports and documents which are filed with the SEC, and you should not place undue reliance on those statements.
The risks included here are not exhaustive. Other sections of this report may include additional factors that could adversely affect our business and financial performance. Moreover, we operate in a very competitive and rapidly changing environment. New risk factors emerge from time to time and it is not possible for management to predict all such risk factors, nor can it assess the impact of all such risk factors on our business or the extent to which any factor, or combination of factors, may cause actual results to differ materially from those contained in any forward-looking statements. Given these risks and uncertainties, investors should not place undue reliance on forward-looking statements as a prediction of actual results.
52
TABLE OF CONTENTS
SPECIAL NOTE REGARDING EXHIBITS
In reviewing the agreements included as exhibits to this Annual Report on Form 10-K, please remember they are included to provide you with information regarding their terms and are not intended to provide any other factual or disclosure information about our company or the other parties to the agreements. The agreements contain representations and warranties by each of the parties to the applicable agreement. These representations and warranties have been made solely for the benefit of the other parties to the applicable agreement and:
| • | should not in all instances be treated as categorical statements of fact, but rather as a way of allocating the risk tone of the parties if those statements provide to be inaccurate; |
| • | have been qualified by disclosures that were made to the other party in connection with the negotiation of the applicable agreement, which disclosures are not necessarily reflected in the agreement; |
| • | may apply standards of materiality in a way that is different from what may be viewed as material to you or other investors; and |
| • | were made only as of the date of the applicable agreement or such other date or dates as may be specified in the agreement and are subject to more recent developments. |
Accordingly, these representations and warranties may not describe the actual state of affairs as of the date they were made or at any other time. Additional information about our company may be found elsewhere in this Annual Report on Form 10-K and our other public filings, which are available without charge through the SEC’s website athttp://www.sec.gov. See Item 1, “Business — Corporate Governance and Internet Address: Where Readers Can Find Additional Information.”
ITEM 1B. UNRESOLVED STAFF COMMENTS
As of December 31, 2011, we did not have any unresolved comments with the staff of the SEC.
53
TABLE OF CONTENTS
ITEM 2. PROPERTIES
Our corporate headquarters are located in midtown Manhattan at 420 Lexington Avenue, New York, New York 10170. We also have regional offices located in Jenkintown, Pennsylvania, St. Louis, Missouri and Charlotte, North Carolina. We can be contacted at (212) 297-1000. We maintain a website atwww.gkk.com. Our reference to our website is intended to be an inactive textual reference only. Information contained in our website is not, and should not be interpreted to be, part of this Annual Report on Form 10-K.
As of December 31, 2011, Gramercy Finance held interests in one CTL investment, and seven interests in real estate acquired through foreclosures.
As of December 31, 2011, Gramercy Realty’s portfolio consisted of 56 properties, including 41 bank branches and 15 office buildings aggregating approximately 752,816 rentable square feet. As of December 31, 2011, the occupancy of Gramercy Realty’s consolidated properties was 39.2%. The weighted average remaining term of the leases in Gramercy Realty’s consolidated portfolio was 7.1 years. Approximately 15.9% of its contractual rent was derived from leases with financial institution tenants. Gramercy Realty’s two largest tenants are Bank of America and Wells Fargo Bank and for the year ended December 31, 2011, they represented approximately 42.3% and 15.9%, respectively, of the rental income of Gramercy’s consolidated portfolio which includes properties that are classified as discontinued operations, and occupied approximately 9.2% and 7.7%, respectively, of Gramercy Realty’s total consolidated rentable square feet.
The following table presents the Gramercy Realty consolidated portfolio as of December 31, 2011:
| | | | | | | | | | |
| Properties(1) | | Number of
Properties | | Rentable
Square Feet | | Occupancy | | Percentage
of 2012
Contractual
Rent | | Percentage
of Portfolio NOI(1) |
| Branches | | | 41 | | | | 261,732 | | | | 28.9 | % | | | 26.4 | % | | | 77.6 | % |
| Office Builidngs | | | 15 | | | | 491,084 | | | | 44.7 | % | | | 73.6 | % | | | 22.4 | % |
| | | | 56 | | | | 752,816 | | | | 39.2 | % | | | 100.0 | % | | | 100.0 | % |
| (1) | Net operating income is a non-GAAP financial measure that represents income before provision for taxes, minority interest and discontinued operations. We believe that net operating income provides an accurate measure of the operating performance of our operating assets because net operating income excludes certain items that are not associated with management of the properties. Additionally, we believe that net operating income is a widely accepted measure of comparative operating performance in the real estate community. Net operating income does not represent net income (loss) in accordance with GAAP and should not be considered as an alternative to net income (determined in accordance with GAAP), as an indication of our financial performance. Our calculation of net operating income may be different from the calculation used by other companies and, therefore, comparability may be limited. |
54
TABLE OF CONTENTS
Set forth below is information regarding lease expirations for Gramercy Realty’s consolidated properties as of December 31, 2011 (dollars in thousands):
| | | | | | | | | | |
| Year of Lease Expiration(1) | | Number of
Expiring
Leases | | Total Sq. Ft.
under
Expiring
Leases | | Percentage
of Total
Rentable
Sq. Ft. | | 2011
Contractual
Rent under
Expiring
Leases | | Percentage
of 2011 Contractual Rent |
| Monthly | | | 11 | | | | 11,259 | | | | 1.5 | % | | $ | 8 | | | | 0.4 | % |
| 2012 | | | 12 | | | | 35,267 | | | | 4.7 | % | | | 135 | | | | 6.5 | % |
| 2013 | | | 2 | | | | 11,068 | | | | 1.5 | % | | | 146 | | | | 7.0 | % |
| 2014 | | | 3 | | | | 8,524 | | | | 1.1 | % | | | 62 | | | | 3.0 | % |
| 2015 | | | 2 | | | | 6,148 | | | | 0.8 | % | | | 79 | | | | 3.8 | % |
| 2016 | | | 3 | | | | 14,054 | | | | 1.9 | % | | | 113 | | | | 5.4 | % |
| 2017 | | | 2 | | | | 7,325 | | | | 1.0 | % | | | 132 | | | | 6.4 | % |
| 2018 | | | 2 | | | | 4,766 | | | | 0.6 | % | | | 141 | | | | 6.8 | % |
| 2019 | | | 3 | | | | 65,643 | | | | 8.7 | % | | | 453 | | | | 21.8 | % |
| 2020 | | | 8 | | | | 67,479 | | | | 9.0 | % | | | 406 | | | | 19.6 | % |
| 2021 | | | 1 | | | | 1,666 | | | | 0.2 | % | | | 16 | | | | 0.8 | % |
| 2022 and thereafter | | | 11 | | | | 61,796 | | | | 8.2 | % | | | 383 | | | | 18.5 | % |
| Total | | | 60 | | | | 294,995 | | | | 39.2 | % | | $ | 2,074 | | | | 100.0 | % |
| (1) | Excludes leases for parking, signs and antennae. |
Leased Properties
Our corporate offices at 420 Lexington Avenue, New York, New York are subject to an operating lease agreement with SLG Graybar Sublease LLC, an affiliate of SL Green, effective May 1, 2005. The lease is for approximately 7,300 square feet and carries a term of 10 years with rents of approximately $249 per annum for year one rising to $315 per annum in year ten. In May and June 2009, we amended its lease with SLG Graybar Sublease LLC to increase the leased premises by approximately 2,260 square feet. The additional premises is leased on a co-terminus basis with the remainder of our leased premises and carries rents of approximately $103 per annum during the initial lease year and $123 per annum during the final lease year.
Development Plans
As of December 31, 2011, we have no plans for the renovation, improvement or development of our properties other than in connection with its on-going repair and maintenance and tenant leasing programs.
Set forth below is a rollforward of the carrying values for our real estate investments classified as Held for Investment:
| | | | | | |
| | Years Ended December 31 (in thousands) |
| | | 2011 | | 2010 | | 2009 |
Investment in real estate:
| | | | | | | | | | | | |
| Balance at beginning of year | | $ | 2,471,923 | | | $ | 3,338,540 | | | $ | 3,326,940 | |
| Improvements | | | 8,494 | | | | 14,308 | | | | 10,461 | |
| Business acquisitions | | | 61,626 | | | | 74,505 | | | | 65,978 | |
| Change in held for sale | | | (3,393 | ) | | | (25,911 | ) | | | 82,637 | |
| Impairments | | | (348 | ) | | | (822,645 | ) | | | — | |
| Property sales | | | (20,547 | ) | | | (106,874 | ) | | | (147,476 | ) |
| Transfer of foreclosed assets | | | (2,449,065 | ) | | | — | | | | — | |
| Balance at end of year | | $ | 68,690 | | | $ | 2,471,923 | | | $ | 3,338,540 | |
Accumulated depreciation:
| | | | | | | | | | | | |
| Balance at beginning of year | | $ | 168,541 | | | $ | 107,460 | | | $ | 47,071 | |
| Depreciation expense | | | 39,707 | | | | 62,436 | | | | 62,336 | |
| Change in held for sale | | | (296 | ) | | | (195 | ) | | | 478 | |
| Property sales | | | (412 | ) | | | (1,160 | ) | | | (2,425 | ) |
| Transfer of foreclosed assets | | | (204,557 | ) | | | — | | | | — | |
| Balance at end of year | | $ | 2,983 | | | $ | 168,541 | | | $ | 107,460 | |
55
TABLE OF CONTENTS
ITEM 3. LEGAL PROCEEDINGS
Two of our subsidiaries are named as defendants in a case captioned Colfin JIH Funding LLC and CDCF JIH Funding, LLC, or Colony, v. Gramercy Warehouse Funding I LLC and Gramercy Loan Services LLC, which is pending in New York State Supreme Court, New York County. The dispute arises from the financing of the Jameson Inns and Signature Inns. Colony has asserted a breach of contract claim against our subsidiaries and is seeking to recover at least $80 million, which represents the amounts of the mezzanine loans held by Colony, and at least $8 million in enforcement costs, plus attorneys’ fees. On January 23, 2012, our subsidiaries filed counterclaims against Colony for breach of contract, tortious interference with contract, breach of the covenant of good faith and fair dealing, and civil conspiracy, and our subsidiaries are seeking to recover at least $80 million in compensatory damages, as well as certain punitive damages and certain costs and fees. Our subsidiaries intend to vigorously defend the claims asserted against them and to pursue all counterclaims against Colony. Colony has moved to dismiss the counterclaims. This matter is in its preliminary stages, and accordingly, we are not able to assess the likelihood of an unfavorable outcome or estimate the range of potential loss, if any.
Additionally, the same two subsidiaries are named as defendants in the case captioned U.S. Bank National Association, as Trustee et al v. Gramercy Warehouse Funding I LLC and Gramercy Loan Services LLC, which is pending in New York State Supreme Court, New York County. The dispute arises from the financing of the Jameson Inns and Signature Inns. U.S. Bank, by and through its attorney in fact, Wells Fargo Bank, N.A., has asserted a breach of contract claim against the subsidiaries and is seeking to recover at least $164 million, which represents the amount of U.S. Bank’s mortgage loan, plus attorneys’ fees and enforcement costs. On January 25, 2012, our subsidiaries filed an answer to U.S. Bank’s complaint. Our subsidiaries intend to vigorously defend the claims asserted against them. This matter is in its preliminary stages, and accordingly, we are not able to assess the likelihood of an unfavorable outcome or estimate the range of potential loss, if any.
We and certain of our subsidiaries are also named as defendants in an action brought by a former consultant alleging breach of contract and other claims and seeking to recover certain payments alleged to be due under a now-terminated consulting arrangement between the company and the consultant. We intend to vigorously defend the claims asserted against us. We have assessed the likelihood of an unfavorable outcome and have accrued $600,000 which approximates our estimate of potential loss.
ITEM 4. MINE SAFETY DISCLOSURES
Not applicable.
56
TABLE OF CONTENTS
Part II
ITEM 5. MARKET FOR REGISTRANT’S COMMON EQUITY, RELATED STOCKHOLDER MATTERS AND ISSUER PURCHASES OF EQUITY SECURITIES
Our common stock began trading on the New York Stock Exchange, or the NYSE, on August 2, 2004 under the symbol “GKK.” On March 13, 2012, the reported closing sale price per share of common stock on the NYSE was $3.04 and there were approximately 214 holders of record of our common stock. The table below sets forth the quarterly high and low closing sales prices of our common stock on the NYSE for the years ended December 31, 2011 and 2010 and the distributions paid by us with respect to the periods indicated.
| | | | | | | | | | | | |
| | 2011 | | 2010 |
| Quarter Ended | | High | | Low | | Dividends | | High | | Low | | Dividends |
| March 31 | | $ | 5.31 | | | $ | 2.77 | | | $ | — | | | $ | 4.33 | | | $ | 2.50 | | | $ | — | |
| June 30 | | $ | 4.26 | | | $ | 2.02 | | | $ | — | | | $ | 3.36 | | | $ | 1.15 | | | $ | — | |
| September 30 | | $ | 3.72 | | | $ | 2.35 | | | $ | — | | | $ | 1.65 | | | $ | 1.25 | | | $ | — | |
| December 31 | | $ | 3.22 | | | $ | 2.50 | | | $ | — | | | $ | 2.84 | | | $ | 1.51 | | | $ | — | |
If dividends are declared in a quarter, those dividends will be paid during the subsequent quarter. Beginning with the third quarter of 2008, our board of directors elected to not pay a dividend on our common stock. Additionally our board of directors elected not to pay the Series A preferred stock dividend of $0.50781 per share beginning with the fourth quarter of 2008. The unpaid Series A preferred stock dividend has been accrued for thirteen quarters as of December 31, 2011. Based on current estimates of our taxable loss, we expect that we will have no distribution requirements in order to maintain our REIT status for the 2011 tax year and we expect that we will continue to elect to retain capital for liquidity purposes until the requirement to make a cash distribution to satisfy our REIT requirements arise. We may elect to pay dividends on our common stock in cash or a combination of cash and shares of common stock to the extent we are permitted under U.S. federal income tax laws governing REIT distribution requirements. However, in accordance with the provisions of our charter, we may not pay any dividends on our common stock until all accrued dividends and the dividend for the then current quarter on the Series A preferred stock are paid in full. We expect to continue our policy of generally distributing 100% of our taxable income through dividends, although there is no assurance as to future dividends because they depend on future earnings, capital requirements and financial condition. See Item 7 “Management’s Discussion and Analysis of Financial Condition and Results of Operations — Dividends” for additional information regarding our dividends.
57
TABLE OF CONTENTS
Stock Performance Graph
This graph compares the performance of our shares with the Standard & Poor’s 500 Composite Index and the NAREIT All REIT Index. This graph assumes $100 invested on January 1, 2007 and assumes the reinvestment of dividends.
COMPARISON OF 5-YEAR CUMULATIVE TOTAL RETURN AMONG GRAMERCY CAPITAL CORP., S&P 500 COMPOSITE INDEX AND NAREIT ALL REIT INDEX
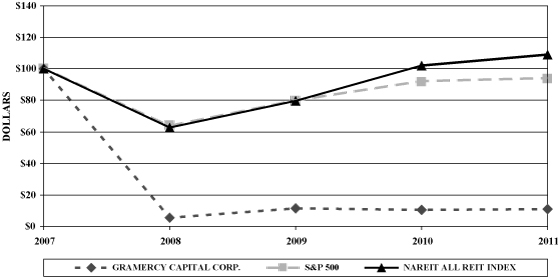
Equity Compensation Plan Information
The following table summarizes information, as of December 31, 2011, relating to our equity compensation plans pursuant to which shares of our common stock or other equity securities may be granted from time to time.
| | | | | | |
| Plan Category | | (a)
Number of securities to be issued upon exercise of outstanding options, warrants and rights | | (b)
Weighted-average exercise price of outstanding options, warrants and rights | | (c)
Number of securities remaining available for future issuance under equity compensation plans (excluding securities reflected in column (a)) |
| Equity compensation plans approved by security holders(1) | | | 565,026 | | | $ | 17.25 | | | | 1,123,197 | |
| Equity compensation plans not approved by security holders | | | N/A | | | | N/A | | | | N/A | |
| Total | | | 565,026 | | | $ | 17.25 | | | | 1,123,197 | |
| (1) | Includes information related to our 2004 Equity Incentive Plan. |
58
TABLE OF CONTENTS
ITEM 6. SELECTED FINANCIAL DATA
The following tables set forth our selected financial data and should be read in conjunction with our Financial Statements and notes thereto included in Item 8, “Financial Statements and Supplementary Data” and Item 7, “Management’s Discussion and Analysis of Financial Condition and Results of Operations” in this Form 10-K.
Operating Data (In thousands, except share and per share data)
| | | | | | | | | | |
| | For the year ended December 31, |
| | | 2011 | | 2010 | | 2009 | | 2008 | | 2007 |
| Total revenues | | $ | 211,210 | | | $ | 183,597 | | | $ | 191,632 | | | $ | 269,710 | | | $ | 312,509 | |
| Property operating expenses | | | 21,280 | | | | 16,910 | | | | 10,304 | | | | 17,658 | | | | — | |
| Property and leasehold impairments | | | — | | | | 1,331 | | | | 3,933 | | | | — | | | | — | |
| Interest expense | | | 81,643 | | | | 85,545 | | | | 110,804 | | | | 146,776 | | | | 170,421 | |
| Management fees | | | — | | | | — | | | | 7,787 | | | | 30,299 | | | | 22,671 | |
| Incentive fee | | | — | | | | — | | | | — | | | | 2,350 | | | | 32,235 | |
| Depreciation and amortization | | | 1,271 | | | | 1,694 | | | | 2,215 | | | | 194 | | | | 2,157 | |
| Management, general and administrative | | | 35,987 | | | | 33,293 | | | | 39,374 | | | | 16,537 | | | | 13,529 | |
| Impairment on loans held for sale and commercial mortgage backed securities | | | 18,423 | | | | 39,453 | | | | 151,081 | | | | — | | | | — | |
| Impairment on business combination, net | | | — | | | | 2,722 | | | | — | | | | — | | | | — | |
| Provision for loan loss | | | 48,180 | | | | 84,392 | | | | 517,784 | | | | 97,853 | | | | 9,398 | |
| Total expenses | | | 206,784 | | | | 265,340 | | | | 843,282 | | | | 311,667 | | | | 250,411 | |
| Income (loss) from continuing operations before equity in income (loss) from unconsolidated joint ventures, provision for taxes and non-controlling interest | | | 4,426 | | | | (81,743 | ) | | | (651,650 | ) | | | (41,957 | ) | | | 62,098 | |
| Equity in net income (loss) of unconsolidated joint ventures | | | 121 | | | | (1,255 | ) | | | 113 | | | | (340 | ) | | | 3,222 | |
| Income (loss) from continuing operations before provision for taxes, gain on extinguishment of debt, and discontinued operations | | | 4,547 | | | | (82,998 | ) | | | (651,537 | ) | | | (42,297 | ) | | | 65,320 | |
| Gain on extinguishment of debt | | | 15,275 | | | | 19,443 | | | | 119,305 | | | | 77,234 | | | | 3,806 | |
| Provision for taxes | | | (563 | ) | | | (966 | ) | | | (2,495 | ) | | | (53 | ) | | | (1,341 | ) |
| Net income (loss) from continuing operations | | | 19,259 | | | | (64,521 | ) | | | (534,727 | ) | | | 34,884 | | | | 67,785 | |
| Net income (loss) from discontinued operations | | | 318,218 | | | | (909,022 | ) | | | 14,328 | | | | 24,804 | | | | 93,812 | |
| Net income (loss) | | | 337,477 | | | | (973,543 | ) | | | (520,399 | ) | | | 59,688 | | | | 161,597 | |
| Net (income) loss attributable to non-controlling interest | | | — | | | | (145 | ) | | | 770 | | | | (385 | ) | | | — | |
| Net income (loss) attributable to Gramercy Capital Corp. | | | 337,477 | | | | (973,688 | ) | | | (519,629 | ) | | | 59,303 | | | | 161,597 | |
| Accrued preferred stock dividends | | | (7,162 | ) | | | (8,798 | ) | | | (9,414 | ) | | | (9,344 | ) | | | (6,567 | ) |
| Excess of carrying amount of tendered preferred stock over consideration paid | | | — | | | | 13,713 | | | | — | | | | — | | | | — | |
| Net income (loss) available to common stockholders | | $ | 330,315 | | | $ | (968,773 | ) | | $ | (529,043 | ) | | $ | 49,959 | | | $ | 155,030 | |
Net income (loss) per common
share – Basic | | $ | 6.58 | | | $ | (19.40 | ) | | $ | (10.61 | ) | | $ | 1.06 | | | $ | 5.54 | |
| Net income (loss) per common share – Diluted | | $ | 6.48 | | | $ | (19.40 | ) | | $ | (10.61 | ) | | $ | 1.06 | | | $ | 5.28 | |
| Basic weighted average common shares outstanding | | | 50,229,102 | | | | 49,923,930 | | | | 49,854,174 | | | | 47,205,078 | | | | 27,968,387 | |
| Diluted weighted average common shares and common share equivalents outstanding | | | 50,990,163 | | | | 49,923,930 | | | | 49,854,174 | | | | 47,330,182 | | | | 29,378,217 | |
59
TABLE OF CONTENTS
Balance Sheet Data (In thousands)
| | | | | | | | | | |
| | Year ended December 31, |
| | | 2011 | | 2010 | | 2009 | | 2008 | | 2007 |
| Total real estate investments, net | | $ | 86,025 | | | $ | 2,323,700 | | | $ | 3,231,080 | | | $ | 3,279,869 | | | $ | 71,933 | |
| Loans and other lending investments, net | | | 1,081,919 | | | | 1,123,528 | | | | 1,383,832 | | | | 2,213,473 | | | | 2,441,747 | |
| Commercial mortgage-backed securities | | | 775,812 | | | | 1,005,167 | | | | 984,709 | | | | 869,973 | | | | 791,983 | |
| Assets held for sale, net | | | 42,965 | | | | 28,660 | | | | 841 | | | | 192,780 | | | | 295,222 | |
| Investment in joint ventures | | | 496 | | | | 3,650 | | | | 108,465 | | | | 93,919 | | | | 49,440 | |
| Total assets | | | 2,258,330 | | | | 5,491,993 | | | | 6,765,437 | | | | 7,818,098 | | | | 4,205,078 | |
| Mortgage note payable | | | — | | | | 1,640,671 | | | | 1,743,668 | | | | 1,833,005 | | | | 59,099 | |
| Mezzanine notes payable | | | — | | | | 549,713 | | | | 553,522 | | | | 580,462 | | | | — | |
| Unsecured credit facility | | | — | | | | — | | | | — | | | | 172,301 | | | | — | |
| Term loan, credit facility and repurchase facility | | | — | | | | — | | | | — | | | | 95,897 | | | | 200,197 | |
| Collateralized debt obligations | | | 2,468,810 | | | | 2,682,321 | | | | 2,710,946 | | | | 2,608,065 | | | | 2,735,145 | |
| Junior subordinated notes | | | — | | | | — | | | | 52,500 | | | | — | | | | — | |
| Deferred interest debentures held by trusts that issued trust preferred securities | | | — | | | | — | | | | — | | | | 150,000 | | | | 150,000 | |
| Total liablilites | | | 2,698,760 | | | | 5,984,986 | | | | 6,197,919 | | | | 6,785,665 | | | | 3,456,343 | |
| Stockholders' equity | | | (440,430 | ) | | | (492,993 | ) | | | 567,518 | | | | 1,032,433 | | | | 748,735 | |
Other Data (In thousands)
| | | | | | | | | | |
| | For the year ended December 31, |
| | | 2011 | | 2010 | | 2009 | | 2008 | | 2007 |
| Funds from operations(1) | | $ | 395,288 | | | $ | 53,283 | | | $ | (417,610 | ) | | $ | 123,495 | | | $ | 89,056 | |
| Cash flows provided by operating activities | | $ | 87,105 | | | $ | 116,831 | | | $ | 86,960 | | | $ | 171,755 | | | $ | 59,574 | |
Cash flows provided by (used by)
investing activities | | $ | 51,133 | | | $ | 154,707 | | | $ | 131,121 | | | $ | (490,572 | ) | | $ | (1,229,382 | ) |
Cash flows provided by (used by)
financing activities | | $ | (195,358 | ) | | $ | (189,038 | ) | | $ | (216,564 | ) | | $ | 162,519 | | | $ | 1,443,620 | |
| (1) | We present FFO because we consider it an important supplemental measure of our operating performance and believe that it is frequently used by securities analysts, investors and other interested parties in the evaluation of REITS. We also use FFO as one of several criteria to determine performance-based incentive compensation for members of our senior management, which may be payable in cash or equity awards. The revised White Paper on FFO approved by the Board of Governors of the National Association of Real Estate Investment Trusts, or NAREIT, defines FFO as net income (loss) (determined in accordance with GAAP), excluding impairment writedowns of investments in depreciable real estate and investments in in-substance real estate investments, gains or losses from debt restructurings and sales of depreciable operating properties, plus real estate-related depreciation and amortization (excluding amortization of deferred financing costs), less distributions to non-controlling interests and gains/losses from discontinued operations and after adjustments for unconsolidated partnerships and joint ventures. FFO does not represent cash generated from operating activities in accordance with GAAP and should not be considered as an alternative to net income (determined in accordance with GAAP), as an indication of our financial performance, or to cash flow from operating activities (determined in accordance with GAAP) as a measure of our liquidity, nor is it entirely indicative of funds available to fund our cash needs, including our ability to make cash distributions. Our calculation of FFO may be different from the calculation used by other companies and, therefore, comparability may be limited. |
A reconciliation of FFO to net income computed in accordance with GAAP is provided under the heading of “Management’s Discussion and Analysis of Financial Condition and Results of Operations — Funds from Operations.”
60
TABLE OF CONTENTS
ITEM 7. MANAGEMENT’S DISCUSSION AND ANALYSIS OF FINANCIAL CONDITION AND RESULTS OF OPERATIONS (Amounts in thousands, except for share, per share data and Overview section)
Overview
Gramercy Capital Corp. is a self-managed, integrated commercial real estate finance and property management and investment company. We were formed in April 2004 and commenced operations upon the completion of our initial public offering in August 2004. Our commercial real estate finance business, which operates under the name Gramercy Finance, focuses on the direct origination, acquisition and portfolio management of whole loans, bridge loans, subordinate interests in whole loans, mezzanine loans, preferred equity, commercial mortgage-backed securities, or CMBS, and other real estate related securities. Our property management and investment business, which operates under the name Gramercy Realty, focuses on third party property management of, and to a lesser extent, ownership and management of, commercial properties leased primarily to regulated financial institutions and affiliated users throughout the United States. Neither Gramercy Finance nor Gramercy Realty is a separate legal entity, but are divisions through which our commercial real estate finance and property management and investment businesses are conducted.
We conduct substantially all of our operations through our operating partnership, GKK Capital LP, or our Operating Partnership. We are the sole general partner of our Operating Partnership. Our Operating Partnership conducts our finance business primarily through two private REITs, Gramercy Investment Trust and Gramercy Investment Trust II, and our commercial real estate investment and property management business through various wholly owned entities as of December 31, 2011.
We have elected to be taxed as a REIT under the Internal Revenue Code and generally will not be subject to U.S. federal income taxes to the extent we distribute our taxable income, if any, to our stockholders. We have in the past established, and may in the future establish TRSs, to effect various taxable transactions. Those TRSs would incur U.S. federal, state and local taxes on the taxable income from their activities.
Unless the context requires otherwise, all references to “Gramercy,” “our Company,” “we,” “our” and “us” mean Gramercy Capital Corp., a Maryland corporation, and one or more of its subsidiaries, including our Operating Partnership.
During 2011, we remained focused on improving our consolidated balance sheet by reducing leverage, generating liquidity from existing assets, actively managing portfolio credit, and accretively re-investing repayments in loan and CMBS investments within our CDOs. We also sought to extend or restructure the Goldman Mortgage Loan and the Goldman Mezzanine Loans. The Goldman Mortgage Loan was collateralized by approximately 195 properties held by Gramercy Realty and the Goldman Mezzanine Loans were collateralized by the equity interest in substantially all of the entities comprising our Gramercy Realty division, including its cash and cash equivalents. Subsequent to the final maturity of the Goldman Mortgage Loan and the Goldman Mezzanine Loans, we entered into a series of short term extensions to provide additional time to exchange and consider proposals for an extension, modification, restructuring or refinancing of the Goldman Mortgage Loan and the Goldman Mezzanine Loans and to explore an orderly transition of the collateral to the lenders if such discussions failed. On May 9, 2011, we announced that the scheduled maturity of the Goldman Mortgage Loan and the Goldman Mezzanine Loans occurred without repayment and without an extension or restructuring of the loans by the lenders.
Notwithstanding the maturity and non-repayment of the loans, we maintained active communications with the lenders and in September 2011, we entered into the Settlement Agreement, for an orderly transition of substantially all of Gramercy Realty’s assets to KBS, Gramercy Realty’s senior mezzanine lender, in full satisfaction of Gramercy Realty’s obligations with respect to the Goldman Mortgage Loan and the Goldman Mezzanine Loans, in exchange for a mutual release of claims among us and the mortgage and mezzanine lenders and, subject to certain termination provisions, our continued management of Gramercy Realty’s assets on behalf of KBS for a fixed fee plus incentive fees. On September 1, 2011 and on December 1, 2011, we transferred to KBS or its affiliates, interests in entities owning 317 and 116, respectively, of the 867 Gramercy Realty properties that we agreed to transfer pursuant to the Settlement Agreement and the remaining ownership interests were transferred to KBS by December 15, 2011. The aggregate carrying value for the
61
TABLE OF CONTENTS
interests transferred to KBS was approximately $2.63 billion. In July 2011, the Dana portfolio, which consisted of 15 properties totaling approximately 3.8 million rentable square feet, was transferred to its mortgage lender through a deed in lieu of foreclosure. For further discussion of the impact of the Settlement Agreement and the transfer of the Dana portfolio, see Settlement and Extinguishment of Debt within Note 2 to the consolidated financial statements.
Subsequent to the execution of the Settlement Agreement, the business of Gramercy Realty has changed from being primarily an owner of commercial properties to being primarily a third-party manager of commercial properties. The scale of Gramercy Realty’s revenues has declined as a substantial portion of rental revenues from properties owned by us, have been replaced with fee revenues of a substantially smaller scale for managing properties on behalf of KBS. Additionally, as assets were transferred to KBS, our total assets and liabilities declined substantially.
During 2010, we recorded impairment charges totaling $912.1 million in continuing operations to reduce the carrying value of 692 properties to estimated fair value. All of the impaired properties were part of the Gramercy Realty portfolio and served as collateral for the Goldman Mezzanine Loans. Substantially all of the impaired properties were transferred to KBS pursuant to the Settlement Agreement. As a result of recording these impairments, our total stockholders’ equity, or book equity, was negative $493.9 million as of December 31, 2010. Subsequent to the impairment, the liabilities of the impaired properties exceed the carrying value of the assets and accordingly, the subsequent transfer of assets and liabilities pursuant to the Settlement Agreement generated gains. After all transfers under the Settlement Agreement were completed, such gains reduced our negative stockholders’ equity as of December 31, 2011.
In September 2011, we entered into the Interim Management Agreement, to provide for our continued management of Gramercy Realty’s assets through December 31, 2013 for a fixed fee of $10.0 million annually, the reimbursement of certain costs and incentive fees equal to 10.0% of the excess of the equity value, if any, of the transferred collateral over $375.0 million plus all new capital invested into the transferred collateral by KBS, its affiliates and/or joint venture partners, or the Threshold Value Participation, and 12.5% of the excess equity value, if any, of the transferred collateral over $468.5 million plus all new capital invested into the transferred collateral by KBS, its affiliates and/or joint venture partners, or the Excess Value Participation. The minimum amount of the Threshold Value Participation equals $3.5 million. The Threshold Value Participation and the Excess Value Participation will be valued and paid following the earlier of December 13, 2013, subject to extension to no later than December 31, 2015, or the sale by KBS of at least 90% (by value) of the transferred collateral. Under the terms of the Interim Management Agreement, we do not forfeit our incentive fee rights unless we resign as manager or are terminated as manager for cause and, with respect to the Excess Value Participation, in the event of a Failure to Agree Termination (as defined below). The Settlement Agreement obligates the parties to negotiate in good faith to replace the Interim Management Agreement with a more complete and definitive management services agreement on or before March 31, 2012 and provides that if the parties fail to complete a definitive agreement, the Interim Management Agreement will terminate by its terms on June 30, 2012, or a Failure to Agree Termination. We promptly commenced and continue to seek to negotiate a more complete and definitive agreement with KBS not later than March 31, 2012, but there can be no assurance a Failure to Agree Termination will not occur notwithstanding our efforts.
We rely on the credit and equity markets to finance and grow our business. Despite signs of improvement in 2011, market conditions remained difficult for us with limited, if any, availability of new debt or equity capital. Our stock price has remained low and we currently have limited, if any, access to the public or private equity capital markets. In this environment, we have sought to raise capital or maintain liquidity through other means, such as modifying debt arrangements, selling assets and aggressively managing our loan portfolio to encourage repayments, as well as reducing capital and overhead expenses and as a result, have engaged in limited new investment activity, other than reinvestment of available restricted cash within our CDOs.
We may need to modify our strategies, businesses or operations, and we may incur increased capital requirements and constraints to compete in a changed business environment. Our failure to do so could materially and adversely affect our business, financial condition, results of operations and prospects.
62
TABLE OF CONTENTS
Notwithstanding the challenges which confront our company, our board of directors remains committed to identifying and pursuing strategies and transactions that could preserve or improve our cash flows from our CDOs, increase our net asset value per share of common stock, improve our future access to capital or otherwise potentially create value for our stockholders. In considering these alternatives (which could include additional repurchases, issuances of our debt or equity securities, a strategic combination of our company, strategic sale of our assets, or modifying our business plan), we expect our board of directors will carefully consider the potential impact of any such transaction on our liquidity position and our qualification as a REIT and our exemption from the Investment Company Act before deciding to pursue it. We expect our board of directors will only authorize us to take any of these actions if they can be accomplished on terms our board of directors finds attractive. Accordingly, there is a substantial possibility that not all such actions can or will be implemented.
In June 2011, our board of directors established a special committee to direct and oversee an exploration of strategic alternatives available to us subsequent to the execution of the Settlement Agreement for Gramercy Realty’s assets. The special committee is considering the feasibility of raising debt or equity capital, the possibility of a strategic combination of our company, a strategic sale of our assets, or modifying our business plan, including making additional debt repurchases or investing our available capital outside of our CDOs. At the direction of the special committee, we engaged Wells Fargo Securities, LLC to act as our financial advisor and to assist in the process.
The aggregate carrying values, allocated by product type and weighted average coupons of our loans, and other lending investments and CMBS investments as of December 31, 2011 and December 31, 2010, were as follows (dollars in thousands):
| | | | | | | | | | | | | | | | |
| | | | | | | | | | | | | | | | |
| | Carrying Value(1) | | Allocation by
Investment Type | | Fixed Rate
Average Yield | | Floating Rate Average Spread over LIBOR(2) |
| | | 2011 | | 2010 | | 2011 | | 2010 | | 2011 | | 2010 | | 2011 | | 2010 |
| Whole loans, floating rate | | $ | 689,685 | | | $ | 659,095 | | | | 63.8 | % | | | 58.7 | % | | | — | | | | — | | | | 331 bps | | | | 330 bps | |
| Whole loans, fixed rate | | | 202,209 | | | | 132,268 | | | | 18.7 | % | | | 11.8 | % | | | 8.35 | % | | | 7.16 | % | | | — | | | | — | |
| Subordinate interests in whole loans, floating rate | | | 25,352 | | | | 75,066 | | | | 2.3 | % | | | 6.7 | % | | | — | | | | — | | | | 575 bps | | | | 297 bps | |
| Subordinate interests in whole loans, fixed rate | | | 89,914 | | | | 46,468 | | | | 8.3 | % | | | 4.1 | % | | | 10.50 | % | | | 6.01 | % | | | — | | | | — | |
| Mezzanine loans, floating rate | | | 46,002 | | | | 152,349 | | | | 4.3 | % | | | 13.5 | % | | | — | | | | — | | | | 860 bps | | | | 754 bps | |
| Mezzanine loans, fixed rate | | | 23,847 | | | | 48,828 | | | | 2.2 | % | | | 4.3 | % | | | 10.34 | % | | | 12.69 | % | | | — | | | | — | |
| Preferred equity, floating rate | | | 3,615 | | | | 5,224 | | | | 0.3 | % | | | 0.5 | % | | | — | | | | — | | | | 234 bps | | | | 350 bps | |
| Preferred equity, fixed rate | | | 1,295 | | | | 4,230 | | | | 0.1 | % | | | 0.4 | % | | | — | | | | 7.25 | % | | | — | | | | — | |
| Subtotal/ Weighted average | | | 1,081,919 | | | | 1,123,528 | | | | 100.0 | % | | | 100.0 | % | | | 9.08 | % | | | 8.09 | % | | | 370 bps | | | | 400 bps | |
| CMBS, floating rate | | | 47,855 | | | | 50,798 | | | | 6.2 | % | | | 5.1 | % | | | — | | | | — | | | | 96 bps | | | | 394 bps | |
| CMBS, fixed rate | | | 727,957 | | | | 954,369 | | | | 93.8 | % | | | 94.9 | % | | | 8.22 | % | | | 8.37 | % | | | — | | | | — | |
| Subtotal/ Weighted average | | | 775,812 | | | | 1,005,167 | | | | 100.0 | % | | | 100.0 | % | | | 8.22 | % | | | 8.37 | % | | | 96 bps | | | | 394 bps | |
| Total | | $ | 1,857,731 | | | $ | 2,128,695 | | | | 100.0 | % | | | 100.0 | % | | | 8.48 | % | | | 8.32 | % | | | 354 bps | | | | 400 bps | |
| (1) | Loans and other lending investments and CMBS investments are presented net of unamortized fees, discounts, unfunded commitments, reserves for loan losses and other adjustments. |
| (2) | Spreads over an index other than 30 day-LIBOR have been adjusted to a LIBOR based equivalent. In some cases, LIBOR is floored, giving rise to higher current effective spreads. |
The period during which we are permitted to reinvest principal payments on the underlying assets into qualifying replacement collateral for our 2005 CDO and our 2006 CDO expired in July 2010 and July 2011, respectively, and will expire for our 2007 CDO in August 2012. In the past, our ability to reinvest has been instrumental in maintaining compliance with the overcollateralization and interest coverage tests for our CDOs. Following the conclusion of each CDO’s reinvestment period, our ability to maintain compliance with such tests for that CDO will be negatively impacted. Additionally, the conclusion of the reinvestment period
63
TABLE OF CONTENTS
results in reduced investment activity for us as available cash in the CDOs will generally be used for the repayment of principal on the CDO bonds and will not be available for new investment activity.
As of December 31, 2011, Gramercy Finance also held interests in one CTL investment and seven interests in real estate acquired through foreclosures.
As of December 31, 2011, Gramercy Realty owned a portfolio comprised of 41 bank branches, and 15 office buildings, aggregating approximately 752,816 rentable square feet. As of December 31, 2011, the occupancy of Gramercy Realty’s consolidated properties was 39.2%. The weighted average remaining term of the leases in Gramercy Realty’s consolidated portfolio was 7.1 years. Approximately 15.9% of its contractual rent was derived from leases with financial institution tenants. Gramercy Realty’s two largest tenants are Bank of America and Wells Fargo Bank and as of December 31, 2011, they represented approximately 42.3% and 15.9%, respectively, of the rental income of Gramercy Realty’s portfolio which includes properties classified as discontinued operations, and occupied approximately 9.2% and 7.7%, respectively, of its total rentable square feet.
Summarized in the table below are our Gramercy Realty’s property portfolio statistics as of December 31, 2011and 2010:
| | | | | | | | | | | | |
| | Number of Properties | | Rentable Square Feet | | Occupancy |
| Properties | | December 31,
2011 | | December 31,
2010(1) | | December 31,
2011 | | December 31,
2010(1) | | December 31,
2011 | | December 31,
2010(1) |
| Branches | | | 41 | | | | 571 | | | | 261,732 | | | | 3,689,190 | | | | 28.9 | % | | | 84.4 | % |
| Office Buildings | | | 15 | | | | 321 | | | | 491,084 | | | | 21,613,441 | | | | 44.7 | % | | | 82.3 | % |
| Land | | | — | | | | 2 | | | | — | | | | — | | | | — | | | | — | |
| Total | | | 56 | | | | 894 | | | | 752,816 | | | | 25,302,631 | | | | 39.2 | % | | | 82.6 | % |
| (1) | Excludes investments in unconsolidated joint ventures. Approximately 867 properties, comprising approximately 20.9 million rentable square feet, or the KBS portfolio, were subject to the Settlement Agreement and ownership was transferred to KBS, in exchange for a mutual release of claims among us and the mortgage and mezzanine lenders and, subject to certain termination provisions, our continued management of the properties on behalf of KBS for a fixed fee plus incentive fees. In addition, the Dana portfolio, which consisted of 15 properties comprising approximately 3.8 million rentable square feet, was transferred to its mortgage lender through a deed in lieu of foreclosure. |
Liquidity
Liquidity is a measurement of the ability to meet cash requirements, including ongoing commitments to repay borrowings, fund and maintain loans and other investments, pay dividends and other general business needs. In addition to cash on hand, our primary sources of funds for short-term (within the next 12 months) liquidity requirements, including working capital, distributions, if any, debt service and additional investments, if any, consists of (i) cash flow from operations; (ii) proceeds and management fees from our existing CDOs; (iii) proceeds from principal and interest payments and rents on our investments; (iv) proceeds from potential loan and asset sales; (v) proceeds from the Interim Management Agreement for the KBS portfolio; and, to a lesser extent, (vi) new financings or additional securitizations or CDO offerings and (vii) proceeds from additional common or preferred equity offerings. We believe these sources of financing will be sufficient to meet our short-term liquidity requirements. We do not anticipate having the ability in the near term to access new equity or debt capital through new warehouse lines, CDO issuances, term or credit facilities or trust preferred issuances, although we continue to explore capital raising options. In the event we are not able to successfully secure financing, we will rely primarily on cash on hand, cash flows from operations, principal, interest and lease payments on our investments, management fees and proceeds from asset and loan sales to satisfy our liquidity requirements. If we (i) are unable to renew, replace or expand our sources of financing, (ii) are unable to execute asset and loan sales in a timely manner or to receive anticipated proceeds from them or (iii) fully utilize available cash, it may have an adverse effect on our business, results of operations, and ability to make distributions to our stockholders.
Substantially all of our loan and other investments and CMBS are pledged as collateral for our CDO bonds and the income generated from these investments is used to fund interest obligations of our CDO bonds
64
TABLE OF CONTENTS
and the remaining income, if any, is retained by us. Our CDO bonds contain minimum interest coverage and asset overcollateralization covenants that must be met in order for us to receive cash flow on the interests retained by us in the CDOs and to receive the subordinate collateral management fee earned. If we fail these covenants in some or all of the CDOs, all cash flows from the applicable CDO, other than senior collateral management fees, would be diverted to repay principal and interest on the most senior outstanding CDO bonds and we may not receive some or all residual payments or the subordinate collateral management fee until that CDO regained compliance with such tests. As of January 2012, the most recent distribution date, our 2005 CDO and our 2006 CDO were in compliance with interest coverage and asset overcollateralization covenants, however the compliance margins were narrow and relatively small declines in collateral performance and credit metrics could cause the CDOs to fall out of compliance. Our 2005 CDO failed its overcollateralization test at the October 2011, April 2011 and January 2011 distribution dates and our 2007 CDO failed its overcollateralization test beginning with the November 2009 distribution date. We cannot be certain that the CDO tests will continue to be satisfied and that we will continue to receive cash flows relating to our CDOs in the future. If the cash flow from our 2005 CDO and our 2006 CDO is redirected, our business, financial condition, and results of operations would be materially and adversely affected. The chart below is a summary of our CDO compliance tests as of the most recent distribution date (January 25, 2012 for our 2005 CDO and our 2006 CDO and February 19, 2012 for our 2007 CDO):
| | | | | | |
| Cash Flow Triggers | | CDO 2005-1 | | CDO 2006-1 | | CDO 2007-1 |
Overcollateralization(1)
| | | | | | | | | | | | |
| Current | | | 118.0 | % | | | 106.95 | % | | | 84.11 | % |
| Limit | | | 117.9 | % | | | 105.15 | % | | | 102.05 | % |
| Compliance margin | | | 0.12 | % | | | 1.80 | % | | | -17.94 | % |
| Pass/Fail | | | Pass | | | | Pass | | | | Fail | |
Interest Coverage(2)
| | | | | | | | | | | | |
| Current | | | 447.36 | % | | | 672.02 | % | | | N/A | |
| Limit | | | 132.85 | % | | | 105.15 | % | | | N/A | |
| Compliance margin | | | 314.51 | % | | | 566.87 | % | | | N/A | |
| Pass/Fail | | | Pass | | | | Pass | | | | N/A | |
| (1) | The overcollateralization ratio divides the total principal balance of all collateral in the CDO by the total bonds outstanding for the classes senior to those retained by the Company. To the extent an asset is considered a defaulted security, the asset’s principal balance is multiplied by the asset’s recovery rate which is determined by the rating agencies. For a defaulted security with a CUSIP that is actively traded, the lower of market value or the product of the security’s principal balance multiplied by the asset’s recovery rate as determined by the rating agencies, is used for the overcollateralization ratio. |
| (2) | The interest coverage ratio divides interest income by interest expense for the classes senior to those retained by us. |
In the event of a breach of our CDO covenants that we could not cure in the near term, we would be required to fund our non-CDO expenses, with (i) cash on hand, (ii) cash distributions from any CDO not in default, if any, (iii) income from our real property and unencumbered loan assets, (iv) sale of assets, and (v) or accessing the equity or debt capital markets, if available.
The following discussion related to our consolidated financial statements should be read in conjunction with the financial statements appearing in Item 8 of this Annual Report on Form 10-K.
Critical Accounting Policies
Our discussion and analysis of financial condition and results of operations is based on our financial statements, which have been prepared in accordance with accounting principles generally accepted in the United States, known as GAAP. These accounting principles require us to make some complex and subjective decisions and assessments. Our most critical accounting policies involve decisions and assessments, which could significantly affect our reported assets, liabilities and contingencies, as well as our reported revenues and expenses. We believe that all of the decisions and assessments upon which our financial statements are based were reasonable at the time made based upon information available to us at that time. We evaluate these
65
TABLE OF CONTENTS
decisions and assessments on an ongoing basis. Actual results may differ from these estimates under different assumptions or conditions. We have identified our most critical accounting policies to be the following:
Variable Interest Entities
Consolidated VIEs
As of December 31, 2011, the consolidated balance sheet includes $1,990,922 of assets and $2,654,109 of liabilities related to three consolidated VIEs. Due to the non-recourse nature of these VIEs, and other factors discussed below, our net exposure to loss from investments in these entities is limited to its beneficial interests in these VIEs.
Collateralized Debt Obligations
We currently consolidate three collateralized debt obligations, or CDOs, which are VIEs. These CDOs invest in commercial real estate debt instruments, the majority of which we originated within the CDOs, and are financed by the debt and equity issued. We are the collateral manager of all three CDOs. As a result of consolidation, our subordinate debt and equity ownership interests in these CDOs have been eliminated, and the consolidated balance sheet reflects both the assets held and debt issued by these CDOs to third parties. Similarly, the operating results and cash flows include the gross amounts related to the assets and liabilities of the CDOs, as opposed to our net economic interests in these CDOs. Refer to Note 8 for further discussion of fees earned related to the management of the CDOs.
Our interest in the assets held by these CDOs is restricted by the structural provisions of these entities, and the recovery of these assets will be limited by the CDOs’ distribution provisions, which are subject to change due to non-compliance with covenants, which are described further in Note 8. The liabilities of the CDO trusts are non-recourse, and can generally only be satisfied from the respective asset pool of each CDO.
We are not obligated to provide any financial support to these CDOs. As of December 31, 2011, we have no exposure to loss as a result of the investment in these CDOs. Since we are the collateral manager of the three CDOs and can make decisions related to the collateral that would most significantly impact the economic outcome of the CDOs, we have concluded that we are the primary beneficiary of the CDOs.
Unconsolidated VIEs
Investment in Commercial Mortgage-Backed Securities
We have investments in CMBS, which are considered to be VIEs. These securities were acquired through investment, and are primarily comprised of securities that were originally investment grade securities, and do not represent a securitization or other transfer of our assets. We are not named as the special servicer or collateral manager of these investments, except as discussed further below.
We are not obligated to provide, nor have we provided, any financial support to these entities. The majority of our securities portfolio, with an aggregate face amount of $1,244,886, is financed by our CDOs, and our exposure to loss is therefore limited to our interests in these consolidated entities described above. We have not consolidated the aforementioned CMBS investments due to the determination that based on the structural provisions and nature of each investment, we do not directly control the activities that most significantly impact the VIEs’ economic performance.
We further analyzed our investment in controlling class CMBS to determine if we were the primary beneficiary. At December 31, 2011, we owned securities of one controlling non-investment grade CMBS investment, GS Mortgage Securities Trust 2007-GKK1, or the Trust. The total par amount of the investment was $624,592 at December 31, 2011. The total par amount of CMBS issued by the Trust was $633,654.
The Trust is a resecuritization of $633,654 of CMBS originally rated AA through BB. We purchased a portion of the below investment grade securities, totaling approximately $21,879. The Manager is the collateral administrator on the transaction and receives a total fee of 5.5 basis points on the par value of the underlying collateral. We have determined that we are the non-transferor sponsor of the Trust. As collateral administrator, the Manager has the right to purchase defaulted securities from the Trust at fair value if very specific triggers have been reached. We have no other rights or obligations that could impact the economics of the Trust and therefore have concluded that we are not the primary beneficiary. The Manager can be removed
66
TABLE OF CONTENTS
as collateral administrator, for cause only, with the vote of 66 2/3% of the certificate holders. There are no liquidity facilities or financing agreements associated with the Trust. Neither we nor the Manager has any on-going financial obligations, including advancing, funding or purchasing collateral in the Trust.
Our maximum exposure to loss as a result of its investment in controlling class CMBS totaled $0, which equals the book value of these investments as of December 31, 2011.
Real Estate and CTL Investments
We record acquired real estate and CTL investments at cost. Costs directly related to the acquisition of such investments are capitalized. Certain improvements are capitalized when they are determined to increase the useful life of the building. Depreciation is computed using the straight-line method over the shorter of the estimated useful life of the capitalized item or 40 years for buildings, five to ten years for building equipment and fixtures, and the lesser of the useful life or the remaining lease term for tenant improvements and leasehold interests. Maintenance and repair expenditures are charged to expense as incurred.
In leasing office space, we may provide funding to the lessee through a tenant allowance. In accounting for tenant allowances, we determine whether the allowance represents funding for the construction of leasehold improvements and evaluate the ownership of such improvements. If we are considered the owner of the leasehold improvements, we capitalize the amount of the tenant allowance and depreciate it over the shorter of the useful life of the leasehold improvements or the lease term. If the tenant allowance represents a payment for a purpose other than funding leasehold improvements, or in the event we are not considered the owner of the improvements for accounting purposes, the allowance is considered to be a lease incentive and is recognized over the lease term as a reduction of rental revenue. Factors considered during this evaluation usually include (i) who holds legal title to the improvements, (ii) evidentiary requirements concerning the spending of the tenant allowance, and (iii) other controlling rights provided by the lease agreement (e.g. unilateral control of the tenant space during the build-out process). Determination of the accounting for a tenant allowance is made on a case-by-case basis, considering the facts and circumstances of the individual tenant lease.
We also review the recoverability of the property’s carrying value when circumstances indicate a possible impairment of the value of a property. The review of recoverability is based on an estimate of the future undiscounted cash flows, excluding interest charges, expected to result from the property’s use and eventual disposition. These estimates consider factors such as changes in strategy resulting in an increased or decreased holding period, expected future operating income, market and other applicable trends and residual value, as well as the effects of leasing demand, competition and other factors. If management determines impairment exists due to the inability to recover the carrying value of a property, an impairment loss is recorded to the extent that the carrying value exceeds the estimated fair value of the property for properties to be held and used and for assets held for sale, an impairment loss is recorded to the extent that the carrying value exceeds the fair value less estimated cost to dispose for assets held for sale. These assessments are recorded as an impairment loss in our consolidated statements of operations in the period the determination is made. The estimated fair value of the asset becomes its new cost basis. For a depreciable long-lived asset, the new cost basis will be depreciated or amortized over the remaining useful life of that asset.
During 2011, impairment charges for properties classified as held for investment was $1,237. These properties were reclassified as discontinued operations.
During 2010, we recorded impairment charges of $933,884 related to our investments in real estate, including $85,294 of impairments on intangible assets. Impairment charges for properties classified as held for investment were $913,648 and $20,236 has been recorded on properties reclassified as discontinued operations. We recorded impairment charges totaling $912,147 in continuing operations during 2010 to reduce the carrying value of 692 properties to estimated fair value. All of the impaired properties served as collateral for the Goldman Mezzanine Loans and are part of the Gramercy Realty portfolio. We also recorded impairment charges on three leasehold properties totaling $1,501 based on the difference between estimated cash flow shortfalls over the sub-tenants’ lease term. No other real estate assets in the portfolio were determined to be impaired as of December 31, 2010 as a result of the analysis. The estimated fair values for the properties serving as collateral for the Goldman Mezzanine loans were calculated using discounted cash flows based on internally developed models and residual values calculated with capitalization rates utilizing a study completed by a third party property management provider for similar types of buildings.
67
TABLE OF CONTENTS
We identified several possible future outcomes and applied a probability-weighted approach to estimate the future undiscounted cash flows. We determined as of December 31, 2010, based on the likelihood of the possible outcomes and the probability-weighted undiscounted cash flows, that our investments in real estate were impaired.
The assessment as to whether a real estate investment is impaired is highly subjective. The calculations involve management’s best estimate of the holding period, market comparables, future occupancy levels, rental rates, capitalization rates, lease-up periods and capital requirements for each property. A change in any one or more of these factors could materially impact whether a property is impaired as of any given valuation date.
We allocate the purchase price of real estate to land, building and intangibles, such as the value of above- and below-market leases and origination costs associated with the in-place leases.
In April 2008, we acquired via a deed in lieu of foreclosure, a 40% interest in the Whiteface Lodge, a hotel and condominium located in Lake Placid, New York. In July 2010, we acquired the remaining 60% interest in Whiteface Lodge. In connection with this acquisition, we acquired 521 fractional residential condominium units. These fractional residential condominium units are included in Other Real Estate Investments on our consolidated balance sheets.
Leasehold Interests
Leasehold interest liabilities are recorded based on the difference between our estimate of the cash flows expected to be paid and earned from the subleases over the non-cancelable lease terms and any payments received in consideration for assuming the leasehold interests. Factors used in determining the net present value of cash flows include contractual rental amounts and amounts due under the corresponding operating lease assumed. Amounts allocated to leasehold interests, based on their respective fair values, are amortized on a straight-line basis over the remaining lease term.
Investments in Unconsolidated Joint Ventures
We account for our investments in unconsolidated joint ventures under the equity method of accounting since we exercise significant influence, but do not unilaterally control the entities, and we are not considered to be the primary beneficiary. In the joint ventures, the rights of the other investors are protective and participating. Unless we are determined to be the primary beneficiary, these rights preclude us from consolidating the investments. The investments are recorded initially at cost as an investment in unconsolidated joint ventures, and subsequently are adjusted for equity in net income (loss) and cash contributions and distributions. Any difference between the carrying amount of the investments on our balance sheet and the underlying equity in net assets is evaluated for impairment at each reporting period. None of the joint venture debt is recourse to us. As of December 31, 2011 and 2010, we had investments of $496 and $3,650 in unconsolidated joint ventures, respectively.
Assets Held for Sale
Real Estate and CTL Investments Held for Sale
Real estate investments or CTL investments to be disposed of are reported at the lower of carrying amount or estimated fair value, less cost to sell. Once an asset is classified as held for sale, depreciation expense is no longer recorded and current and prior periods are reclassified as “discontinued operations.” As of December 31, 2011 and 2010, we had real estate investments held for sale of $42,965 and $28,660, respectively. We recorded impairment charges of $1,237, $20,236 and $24,507 during the years ended December 31, 2011, 2010 and 2009, respectively, related to real estate investments classified as held-for-sale.
Loans and Other Lending Investments Held for Sale
Loans held for investment are intended to be held to maturity and, accordingly, are carried at cost, net of unamortized loan origination fees, discounts, repayments, sales of partial interests in loans, and unfunded commitments unless such loan or investment is deemed to be impaired. Loans held for sale are carried at the lower of cost or market value using available market information obtained through consultation with dealers or other originators of such investments. As of December 31, 2011 and 2010, we had no loans and other lending investments designated as held for sale. We recorded impairment charges of $0, $2,000, and $138,570, related to the mark-to-market of the loans designated as held-for-sale during the years ended December 31, 2011, 2010 and 2009, respectively.
68
TABLE OF CONTENTS
Commercial Mortgage-Backed Securities
We designate our CMBS investments on the date of acquisition of the investment. Held to maturity investments are stated at cost plus any premiums or discounts which are amortized through the consolidated statements of operations using the level yield method. CMBS securities that we do not hold for the purpose of selling in the near-term but may dispose of prior to maturity, are designated as available-for-sale and are carried at estimated fair value with the net unrealized gains or losses recorded as a component of accumulated other comprehensive income (loss) in stockholders’ equity. Upon the disposition of a CMBS investment designated as available for sale, the unrealized gain or loss recognized in accumulated other comprehensive income is reversed. A realized gain or loss is computed by comparing the amortized cost of the CMBS investment sold to the cash proceeds received, and the resultant gain or loss is recorded in other income on our consolidated statements of operations. Unrealized losses that are, in the judgment of management, an other-than-temporary impairment are bifurcated into (i) the amount related to credit losses, and (ii) the amount related to all other factors. The portion of the other-than-temporary impairment related to credit losses is computed by comparing the amortized cost of the investment to the present value of cash flows expected to be collected and is charged against earnings on the consolidated statement of operations. The portion of the other-than-temporary impairment related to all other factors is recognized as a component of other comprehensive loss on the consolidated balance sheet. The determination of an other-than-temporary impairment is a subjective process, and different judgments and assumptions could affect the timing of loss realization.
We determine the fair value of CMBS based on the types of securities in which we have invested. For liquid, investment-grade securities, we consult with dealers of such securities to periodically obtain updated market pricing for the same or similar instruments. For non-investment grade securities, we actively monitor the performance of the underlying properties and loans and update our pricing model to reflect changes in projected cash flows. The value of the securities is derived by applying discount rates to such cash flows based on current market yields. The yields employed are obtained from our own experience in the market, advice from dealers and/or information obtained in consultation with other investors in similar instruments. Because fair value estimates when available may vary to some degree, we must make certain judgments and assumptions about the appropriate price to use to calculate the fair values for financial reporting purposes. Different judgments and assumptions could result in materially different presentations of value.
During the year ended December 31, 2011, we sold eight CMBS investments due to credit events for a realized gain of $15,126. During the year ended December 31, 2010, we sold nine CMBS investments due to credit events for a realized loss of $294.
Tenant and Other Receivables
Tenant and other receivables are primarily derived from the rental income that each tenant pays in accordance with the terms of its lease, which is recorded on a straight-line basis over the initial term of the lease. Since many leases provide for rental increases at specified intervals, straight-line basis accounting requires us to record a receivable, and include in revenues, unbilled rent receivables that will only be received if the tenant makes all rent payments required through the expiration of the initial term of the lease. Tenant and other receivables also include receivables related to tenant reimbursements for common area maintenance expenses and certain other recoverable expenses that are recognized as revenue in the period in which the related expenses are incurred.
Tenant and other receivables are recorded net of the allowances for doubtful accounts, which as of December 31, 2011 and December 31, 2010 were $280 and $5,440, respectively. We continually review receivables related to rent, tenant reimbursements and unbilled rent receivables and determine collectability by taking into consideration the tenant’s payment history, the financial condition of the tenant, business conditions in the industry in which the tenant operates and economic conditions in the area in which the property is located. In the event that the collectability of a receivable is in doubt, we increase the allowance for doubtful accounts or record a direct write-off of the receivable in the consolidated statements of income.
Intangible Assets
We follow the purchase method of accounting for business combinations. We allocate the purchase price of acquired properties to tangible and identifiable intangible assets acquired based on their respective fair
69
TABLE OF CONTENTS
values. Tangible assets include land, buildings and improvements on an as-if-vacant basis. We utilize various estimates, processes and information to determine the as-if-vacant property value. Estimates of value are made using customary methods, including data from appraisals, comparable sales, discounted cash flow analysis and other methods. Identifiable intangible assets include amounts allocated to acquired leases for above- and below-market lease rates and the value of in-place leases.
Above-market and below-market lease values for properties acquired are recorded based on the present value (using an interest rate which reflects the risks associated with the leases acquired) of the difference between the contractual amount to be paid pursuant to each in-place lease and management’s estimate of the fair market lease rate for each such in-place lease, measured over a period equal to the remaining non-cancelable term of the lease. The capitalized above-market lease values are amortized as a reduction of rental income over the remaining non-cancelable terms of the respective leases. The capitalized below-market lease values are amortized as an increase to rental income over the initial term of the respective leases. If a tenant vacates its space prior to the contractual termination of the lease and no rental payments are being made on the lease, any unamortized balance of the related intangible will be written off.
The aggregate value of intangible assets related to in-place leases is primarily the difference between the property valued with existing in-place leases adjusted to market rental rates and the property valued as-if-vacant. Factors considered by management in its analysis of the in-place lease intangibles include an estimate of carrying costs during the expected lease-up period for each property taking into account current market conditions and costs to execute similar leases. In estimating carrying costs, we include real estate taxes, insurance and other operating expenses and estimates of lost rentals at market rates during the anticipated lease-up period, which is expected to average six months. We also estimate costs to execute similar leases including leasing commissions, legal and other related expenses.
The value of in-place leases is amortized to expense over the initial term of the respective leases, which range primarily from one to 20 years. In no event does the amortization period for intangible assets exceed the remaining depreciable life of the building. If a tenant terminates its lease, the unamortized portion of the in-place lease value is charged to expense.
In making estimates of fair values for purposes of allocating purchase price, we utilize a number of sources, including independent appraisals that may be obtained in connection with the acquisition or financing of the respective property and other market data. We also consider information obtained about each property as a result of its pre-acquisition due diligence, as well as subsequent marketing and leasing activities, in estimating the fair value of the tangible and intangible assets acquired and intangible liabilities assumed.
Valuation of Financial Instruments
ASC 820-10, “Fair Value Measurements and Disclosures,” among other things, establishes a hierarchical disclosure framework associated with the level of pricing observability utilized in measuring financial instruments at fair value. Considerable judgment is necessary to interpret market data and develop estimated fair values. Accordingly, fair values are not necessarily indicative of the amounts that we could realize on disposition of the financial instruments. Financial instruments with readily available active quoted prices or for which fair value can be measured from actively quoted prices generally will have a higher degree of pricing observability and will require a lesser degree of judgment to be utilized in measuring fair value. Conversely, financial instruments rarely traded or not quoted will generally have less, or no, pricing observability and will require a higher degree of judgment to be utilized in measuring fair value. Pricing observability is generally affected by such items as the type of financial instrument, whether the financial instrument is new to the market and not yet established, the characteristics specific to the transaction and overall market conditions. The use of different market assumptions and/or estimation methodologies may have a material effect on estimated fair value amounts.
Fair value is defined as the price that would be received to sell an asset or paid to transfer a liability in an orderly transaction between market participants at the measurement date, or an exit price. The level of pricing observability generally correlates to the degree of judgment utilized in measuring the fair value of financial instruments. The less judgment utilized in measuring fair value financial instruments such as with readily available active quoted prices or for which fair value can be measured from actively quoted prices in active markets generally have more pricing observability. Conversely, financial instruments rarely traded or not
70
TABLE OF CONTENTS
quoted have less observability and are measured at fair value using valuation models that require more judgment. Impacted by a number of factors, pricing observability is generally affected by such items as the type of financial instrument, whether the financial instrument is new to the market and not yet established, the characteristics specific to the transaction and overall market conditions.
The three broad levels defined are as follows:
Level I — This level is comprised of financial instruments that have quoted prices that are available in active markets for identical assets or liabilities. The types of financial instruments included in this category are highly liquid instruments with quoted prices.
Level II — This level is comprised of financial instruments that have pricing inputs other than quoted prices in active markets that are either directly or indirectly observable. The nature of these financial instruments includes instruments for which quoted prices are available but traded less frequently and instruments that are fair valued using other financial instruments, the parameters of which can be directly observed.
Level III — This level is comprised of financial instruments that have little to no pricing observability as of the reported date. These financial instruments do not have active markets and are measured using management’s best estimate of fair value, where the inputs into the determination of fair value require significant management judgment and assumptions. Instruments that are generally included in this category are derivatives, whole loans, subordinate interests in whole loans and mezzanine loans.
At December 31, 2011, we measured certain financial assets and financial liabilities at fair value on a recurring basis, including available-for-sale CMBS securities and derivative instruments. We calculated the fair value using Level III inputs that required management to make significant judgments and assumptions.
CMBS available for sale: The fair values of our available for sale CMBS securities are generally valued by a combination of (i) obtaining assessments from third-party dealers and (ii) in limited cases where such assessments are unavailable or, in the opinion of management, deemed not to be indicative of fair value, discounting expected cash flows using internal cash flow models and estimated market discount rates. In the case of internal models, expected cash flows of each security are based on management’s assumptions regarding the collection of principal and interest on the underlying loans and securities.
Derivative instruments: Fair values of our derivative instruments are valued using advice from a third party derivative specialist, based on a combination of observable market-based inputs, such as interest rate curves, and unobservable inputs such as credit valuation adjustments due to the risk of non-performance.
At December 31, 2011, we measured certain assets at fair value on a nonrecurring basis, including real estate investments, held to maturity CMBS securities, and lending investments.
Real Estate investments: The real estate investments identified for impairment are collateral under the Goldman Mezzanine Loans. The impairment is calculated by comparing our internally developed discounted cash flows to the carrying value of the respective property. The discounted cash flows require significant judgmental inputs on each property, which include assumptions regarding capitalization rates, lease-up periods, future occupancy rates, market rental rates, holding periods, capital improvements and other factors deemed necessary by management.
Loans subject to impairments or reserves for loan loss: The loans identified for impairment or reserves for loan loss are collateral dependent loans. Impairment or reserves for loan loss on these loans are measured by comparing management’s estimation of fair value of the underlying collateral to the carrying value of the respective loan. These valuations require significant judgments, which include assumptions regarding capitalization rates, leasing, creditworthiness of major tenants, occupancy rates, availability of financing, exit plan, loan sponsorship, actions of other lenders and other factors deemed necessary by management.
CMBS: CMBS securities which are other-than-temporarily impaired are generally valued by a combination of (i) obtaining assessments from third-party dealers and, (ii) in limited cases where such assessments are unavailable or, in the opinion of management deemed not to be indicative of fair value,
71
TABLE OF CONTENTS
discounting expected cash flows using internal cash flow models and estimated market discount rates. In the case of internal models, expected cash flows of each security are based on management’s assumptions regarding the collection of principal and interest on the underlying loans and securities.
The valuations derived from pricing models may include adjustments to the financial instruments. These adjustments may be made when, in management’s judgment, either the size of the position in the financial instrument or other features of the financial instrument such as its complexity, or the market in which the financial instrument is traded (such as counterparty, credit, concentration or liquidity) require that an adjustment be made to the value derived from the pricing models. Additionally, an adjustment from the price derived from a model typically reflects management’s judgment that other participants in the market for the financial instrument being measured at fair value would also consider such an adjustment in pricing that same financial instrument.
Assets and liabilities presented at fair value and categorized as Level III are generally those that are marked to model using relevant empirical data to extrapolate an estimated fair value. The models’ inputs reflect assumptions that market participants would use in pricing the instrument in a current period transaction and outcomes from the models represent an exit price and expected future cash flows. The parameters and inputs are adjusted for assumptions about risk and current market conditions. Changes to inputs in valuation models are not changes to valuation methodologies; rather, the inputs are modified to reflect direct or indirect impacts on asset classes from changes in market conditions. Accordingly, results from valuation models in one period may not be indicative of future period measurements.
Revenue Recognition
Real Estate and CTL Investments
Rental income from leases is recognized on a straight-line basis regardless of when payments are contractually due. Certain lease agreements also contain provisions that require tenants to reimburse us for real estate taxes, common area maintenance costs and the amortized cost of capital expenditures with interest. Such amounts are included in both revenues and operating expenses when we are the primary obligor for these expenses and assume the risks and rewards of a principal under these arrangements. Under leases where the tenant pays these expenses directly, such amounts are not included in revenues or expenses.
Deferred revenue represents rental revenue and management fees received prior to the date earned. Deferred revenue also includes rental payments received in excess of rental revenues recognized as a result of straight-line basis accounting.
Other income includes fees paid by tenants to terminate their leases, which are recognized when fees due are determinable, no further actions or services are required to be performed by us, and collectability is reasonably assured. In the event of early termination, the unrecoverable net book values of the assets or liabilities related to the terminated lease are recognized as depreciation and amortization expense in the period of termination.
We recognize sales of real estate properties only upon closing. Payments received from purchasers prior to closing are recorded as deposits. Profit on real estate sold is recognized using the full accrual method upon closing when the collectability of the sale price is reasonably assured and we are not obligated to perform significant activities after the sale. Profit may be deferred in whole or part until the sale meets the requirements of profit recognition on sale of real estate.
Finance Investments
Interest income on debt investments, which includes loan and CMBS investments, are recognized over the life of the investments using the effective interest method and recognized on the accrual basis. Fees received in connection with loan commitments are deferred until the loan is funded and are then recognized over the term of the loan using the effective interest method. Anticipated exit fees, whose collection is expected, are also recognized over the term of the loan as an adjustment to yield. Fees on commitments that expire unused are recognized at expiration. Fees received in exchange for the credit enhancement of another lender, either subordinate or senior to us, in the form of a guarantee are recognized over the term of that guarantee using the straight-line method.
72
TABLE OF CONTENTS
Income recognition is generally suspended for debt investments at the earlier of the date at which payments become 90 days past due or when, in our opinion, a full recovery of income and principal becomes doubtful. Income recognition is resumed when the loan becomes contractually current and performance is demonstrated to be resumed.
We designate loans as non-performing at such time as: (1) the loan becomes 90 days delinquent or (2) the loan has a maturity default. All non-performing loans are placed on non-accrual status and subsequent cash receipts are applied to principal or recognized as income when received. At December 31, 2011, we had one whole loan with a carrying value of $51,417 and two mezzanine loans with an aggregate carrying value of $0, which were classified as non-performing loans. At December 31, 2010, we had one second lien loan with a carrying value of $0 and one third lien loan with a carrying value of $0, which were classified as non-performing loans.
We classify loans as sub-performing if they are not performing in material accordance with their terms, but they do not qualify as non-performing loans and the specific facts and circumstances of these loans may cause them to develop into non-performing loans should certain events occur in the normal passage of time, which we consider to be 90 days from the measurement date. At December 31, 2011, we had two whole loans with an aggregate carrying value of $44,555 and one preferred equity investment with a carrying value of $1,295, which were classified as sub-performing. At December 31, 2010, we had one first mortgage loan with a carrying value of $13,222 and two mezzanine loans with an aggregate carrying value of $9,826, which were classified as sub-performing.
For the years ended December 31, 2011, 2010 and 2009, we recognized $0, $1,482 and $0, respectively, in net gains from the sale of loan investments or commitments.
Reserve for Loan Losses
Specific valuation allowances are established for loan losses on loans in instances where it is deemed probable that we may be unable to collect all amounts of principal and interest due according to the contractual terms of the loan. The reserve is increased through the provision for loan losses on our consolidated statements of operations and is decreased by charge-offs when losses are realized through sale, foreclosure, or when significant collection efforts have ceased.
We consider the present value of payments expected to be received, observable market prices, or the estimated fair value of the collateral (for loans that are dependent on the collateral for repayment), and compare it to the carrying value of the loan. The determination of the estimated fair value is based on the key characteristics of the collateral type, collateral location, quality and prospects of the sponsor, the amount and status of any senior debt, and other factors. We also include the evaluation of operating cash flow from the property during the projected holding period, and the estimated sales value of the collateral computed by applying an expected capitalization rate to the stabilized net operating income of the specific property, less selling costs, all of which are discounted at market discount rates. We also consider if the loan’s terms have been modified in a troubled debt restructuring. Because the determination of estimated value is based upon projections of future economic events, which are inherently subjective, amounts ultimately realized from loans and investments may differ materially from the carrying value at the balance sheet date.
If, upon completion of the valuation, the estimated fair value of the underlying collateral securing the loan is less than the net carrying value of the loan, an allowance is created with a corresponding charge to the provision for loan losses. The allowance for each loan is maintained at a level we believe is adequate to absorb losses. During the year ended December 31, 2011, we incurred charge-offs totaling $66,856 relating to realized losses on five loans. During the year ended December 31, 2010, we incurred charge-offs totaling $239,078 relating to realized losses on ten loans. We maintained a reserve for loan losses of $244,840 against 15 separate investments with an aggregate carrying value of $294,083 as of December 31, 2011 and a reserve for loan losses of $263,516 against 19 separate investments with an aggregate carrying value of $438,541 as of December 31, 2010.
73
TABLE OF CONTENTS
Rent Expense
Rent expense is recognized on a straight-line basis regardless of when payments are due. Accounts payable and accrued expenses in the accompanying consolidated balance sheets as of December 31, 2011 and 2010 includes an accrual for rental expense recognized in excess of amounts due at that time. Rent expense related to leasehold interests is included in property operating expenses, and rent expense related to office rentals is included in management, general and administrative expense.
Stock-Based Compensation Plans
We have a stock-based compensation plan, described more fully in Note 14. We account for this plan using the fair value recognition provisions.
We use the Black-Scholes option-pricing model to estimate the fair value of a stock option award. This model requires inputs such as expected term, expected volatility, and risk-free interest rate. Further, the forfeiture rate also impacts the amount of aggregate compensation cost. These inputs are highly subjective and generally require significant analysis and judgment to develop.
Compensation cost for stock options, if any, is recognized ratably over the vesting period of the award. Our policy is to grant options with an exercise price equal to the quoted closing market price of our stock on the business day preceding the grant date. Awards of stock or restricted stock are expensed as compensation on a current basis over the benefit period.
The fair value of each stock option granted is estimated on the date of grant for options issued to employees, and quarterly for options issued to non-employees, using the Black-Scholes option pricing model with the following weighted average assumptions for grants in 2011 and 2010.
| | | | |
| | 2011 | | 2010 |
| Dividend yield | | | 5.9 | % | | | 5.7 | % |
| Expected life of option | | | 5.0 years | | | | 5.0 years | |
| Risk-free interest rate | | | 2.02 | % | | | 2.65 | % |
| Expected stock price volatility | | | 105.0 | % | | | 75.0 | % |
Derivative Instruments
In the normal course of business, we use a variety of derivative instruments to manage, or hedge, interest rate risk. We require that hedging derivative instruments be effective in reducing the interest rate risk exposure that they are designated to hedge. This effectiveness is essential for qualifying for hedge accounting. Instruments that meet these hedging criteria are formally designated as hedges at the inception of the derivative contract. We use a variety of commonly used derivative products that are considered “plain vanilla” derivatives. These derivatives typically include interest rate swaps, caps, collars and floors. We expressly prohibit the use of unconventional derivative instruments and using derivative instruments for trading or speculative purposes. Further, we have a policy of only entering into contracts with major financial institutions based upon their credit ratings and other factors.
To determine the fair value of derivative instruments, we use a variety of methods and assumptions that are based on market conditions and risks existing at each balance sheet date. For the majority of financial instruments including most derivatives, long-term investments and long-term debt, standard market conventions and techniques such as discounted cash flow analysis, option-pricing models, replacement cost and termination cost are used to determine fair value. All methods of assessing fair value result in a general approximation of value, and such value may never actually be realized.
In the normal course of business, we are exposed to the effect of interest rate changes and limit these risks by following established risk management policies and procedures including the use of derivatives. To address exposure to interest rates, we use derivatives primarily to hedge cash flow variability caused by interest rate fluctuations of our liabilities. Each of our CDOs maintains a maximum amount of allowable unhedged interest rate risk. Our 2005 CDO permits 20% of the net outstanding principal balance and our 2006 and 2007 CDOs permits 5% of the net outstanding principal balance to be unhedged.
We recognize all derivatives on the balance sheet at fair value. Derivatives that are not hedges must be adjusted to fair value through income. If a derivative is a hedge, depending on the nature of the hedge,
74
TABLE OF CONTENTS
changes in the fair value of the derivative will either be offset against the change in fair value of the hedged asset, liability or firm commitment through earnings, or recognized in other comprehensive income until the hedged item is recognized in earnings. The ineffective portion of a derivative’s change in fair value will be immediately recognized in earnings. Derivative accounting may increase or decrease reported net income and stockholders’ equity prospectively, depending on future levels of LIBOR, swap spreads and other variables affecting the fair values of derivative instruments and hedged items, but will have no effect on cash flows, provided the contract is carried through to full term.
All hedges held by us are deemed effective based upon the hedging objectives established by our corporate policy governing interest rate risk management. The effect of our derivative instruments on our financial statements is discussed more fully in Note 17 to the consolidated financial statements.
Income Taxes
We elected to be taxed as a REIT, under Sections 856 through 860 of the Internal Revenue Code, beginning with our taxable year ended December 31, 2004. To qualify as a REIT, we must meet certain organizational and operational requirements, including a requirement to distribute at least 90% of our ordinary taxable income, if any, to stockholders. As a REIT, we generally will not be subject to U.S. federal income tax on taxable income that we distribute to our stockholders. If we fail to qualify as a REIT in any taxable year, we will then be subject to U.S. federal income taxes on our taxable income at regular corporate rates and we will not be permitted to qualify for treatment as a REIT for U.S. federal income tax purposes for four years following the year during which qualification is lost unless the Internal Revenue Service grants us relief under certain statutory provisions. Such an event could materially adversely affect our net income and net cash available for distributions to stockholders. However, we believe that we will be organized and operate in such a manner as to qualify for treatment as a REIT and we intend to operate in the foreseeable future in such a manner so that we will qualify as a REIT for U.S. federal income tax purposes. We may, however, be subject to certain state and local taxes. Our TRSs are subject to federal, state and local taxes.
For the years ended December 31, 2011, 2010 and 2009, we recorded $563, $966 and $2,495 of income tax expense, respectively. Tax expense for the year ended December 31, 2011 is comprised of federal, state and local taxes. Tax expense for the year ended December 31, 2010 is comprised entirely of state and local taxes. Included in tax expense for the year ended December 31, 2009 is an accrual for state income taxes on the gain on extinguishment of debt. Under federal law, we were allowed to defer these gains until 2014; however, not all states follow this federal rule.
Our policy for interest and penalties, if any, on material uncertain tax positions recognized in the financial statements is to classify these as interest expense and operating expense, respectively. As of December 31, 2011, 2010 and 2009, we did not incur any material interest or penalties.
Results of Operations
Comparison of the year ended December 31, 2011 to the year ended December 31, 2010
Revenues
| | | | | | |
| | 2011 | | 2010 | | $ Change |
| Rental revenue | | $ | 5,819 | | | $ | 4,986 | | | $ | 833 | |
| Investment income | | | 158,750 | | | | 166,642 | | | | (7,892 | ) |
| Operating expense reimbursements | | | 2,180 | | | | 2,077 | | | | 103 | |
| Other income | | | 44,461 | | | | 9,892 | | | | 34,569 | |
| Total revenues | | $ | 211,210 | | | $ | 183,597 | | | $ | 27,613 | |
| Equity in net income (loss) of joint ventures | | $ | 121 | | | $ | (1,255 | ) | | $ | 1,376 | |
| Gain on extinguishment of debt | | $ | 15,275 | | | $ | 19,443 | | | $ | (4,168 | ) |
Rental revenue was $5,819 for the year ended December 31, 2011, compared to $4,986 for the year ended December 31, 2010. The increase of $833 is primarily due to additional rental revenue from the Whiteface Lodge which we consolidated in July 2010.
75
TABLE OF CONTENTS
Investment income is generated on our whole loans, subordinate interests in whole loans, mezzanine loans, preferred equity interests and CMBS. For the year ended December 31, 2011, $106,168 was earned on fixed rate investments while the remaining $52,582 was earned on floating rate investments. For the year ended December 31, 2010, $99,392 was earned on fixed rate investments while the remaining $67,250 was earned on floating rate investments. The decrease of $7,892 over the prior period is primarily due to the suspension of interest income accruals on certain loans, a decrease in the size of our portfolio of loans and other leading instruments by approximately $271,000, and a decline in LIBOR interest rates in 2011 compared to 2010.
Operating expense reimbursements were $2,180 for the year ended December 31, 2011 and $2,077 for the year ended December 31, 2010. The increase of $103 was primarily related to an increase in property operating expenses which in turn caused an increase in reimbursement income. The remaining increase is due to prior year reimbursement adjustments for tenants adjusted in 2011.
Other income of $44,461 for the year ended December 31, 2011 is primarily comprised of operating income of $7,300 from the Whiteface Lodge which we acquired controlling interest in June 2010, property management fees related to our management from properties we foreclosed on since June 2009 of $304, management fee income of $5,603 pursuant to the Settlement Agreement, loan servicing fees of $1,968, $12,888 gain on settlement of loan investments, and $15,126 gain on sale of CMBS. Other income of $9,892 for the year ended December 31, 2010 is primarily composed of operating income from properties we foreclosed on since June 2009 of $1,527, operating income from the Whiteface Lodge which we acquired controlling interest in July 2010 of $3,460, interest earned on restricted cash balances and other cash balances held by us of $11, gain on sale of CMBS bonds of $1,397, and increase in loan servicing reimbursement and special servicing income of $2,318.
The equity in net income of joint ventures of $121 for the year ended December 31, 2011 represents our proportionate share of the income generated by one of our joint venture interests including $268 of real estate-related depreciation and amortization, which when added back, results in a contribution to Funds from Operations, or FFO, of $389. The equity in net loss of joint ventures of $1,255 for the year ended December 31, 2010 represents our proportionate share of the income generated by two of our joint venture interests including $268 of real estate-related depreciation and amortization, which when added back, results in a deduction to FFO of $987. As of December 31, 2011, we classified three investments in joint ventures as discontinued operations. These investments had a loss of $2,098 and FFO of $2,951 for the year ended December 31, 2011. These investments had income of $8,120 and FFO of $4,079 for the year ended December 31, 2010. Our use of FFO as an important non-GAAP financial measure is discussed in more detail below.
During the year ended December 31, 2011, we repurchased, at a discount, approximately $49,259 of notes previously issued by two of our three CDOs, generating a net gain on extinguishment of debt of $15,275. During the year ended December 31, 2010, we repurchased, at a discount, approximately $39,000 of notes previously issued by two of our three CDOs, generating a net gain on extinguishment of debt of $19,443.
Expenses
| | | | | | |
| | 2011 | | 2010 | | $ Change |
| Property operating expenses | | $ | 21,280 | | | $ | 18,241 | | | $ | 3,039 | |
| Interest expense | | | 81,643 | | | | 85,545 | | | | (3,902 | ) |
| Depreciation and amortization | | | 1,271 | | | | 1,694 | | | | (423 | ) |
| Management, general and administrative | | | 35,987 | | | | 33,293 | | | | 2,694 | |
| Management fees | | | — | | | | — | | | | — | |
| Net Impairment recognized in earnings | | | 18,423 | | | | 39,453 | | | | (21,030 | ) |
| Impairment on business acquisition, net | | | — | | | | 2,722 | | | | (2,722 | ) |
| Provision for loan loss | | | 48,180 | | | | 84,392 | | | | (36,212 | ) |
| Provision for taxes | | | 563 | | | | 966 | | | | (403 | ) |
| Total expenses | | $ | 207,347 | | | $ | 266,306 | | | $ | (58,959 | ) |
Property operating expenses increased $3,039 from the $18,241 recorded in the year ended December 31, 2010 to $21,280 recorded in the year ended December 31, 2011. The increase is attributable to $4,154 on the Whiteface Lodge which acquired a controlling interest in July 2010. These increases were partially offset by
76
TABLE OF CONTENTS
reductions property impairment charges of $1,331in real estate tax assessments of $392 and lower utilities costs of $491 due to the reduced over-time HVAC charges and energy saving improvements.
Interest expense was $81,643 for the year ended December 31, 2011 compared to $85,545 for the year ended December 31, 2010. The decrease of $3,902 is primarily attributed to reductions in the interest rate indexes, primarily LIBOR-based, charged on our variable rate debt over the year ended December 31, 2011 compared to the year ended December 31, 2010, as well as lower average principal balances outstanding over the same periods due to debt extinguishments, repayments using proceeds from additional cash repayments, sales of certain investments that served as collateral for these borrowings and reduced amortization of financing costs.
We recorded depreciation and amortization expenses of $1,271 for the year ended December 31, 2011, compared to $1,694 for the year ended December 31, 2010. The decrease of $423 is primarily due to $460 of lower amortization on loan costs offset by $37 of higher depreciation and amortization expense on building, equipment, and in-place lease intangible assets reflecting the expiration or termination of related leases.
Management, general and administrative expenses were $35,987 for the year ended December 31, 2011, compared to $33,293 for the same period in 2010. The increase of $2,694 includes $2,545 of higher legal fees in 2011. The increase in legal fees is primarily related to the Jameson Inns and Signature Inns dispute. These increases partially are offset primarily by approximately $66 of decreased salaries, benefits and other administrative costs.
During the year ended December 31, 2011, we recorded an other-than-temporary impairment charge of $18,423 due to adverse changes in expected cash flows related to credit losses for five CMBS investments. During the year ended December 31, 2010, we recorded impairment charges totaling $39,453, consisting of $2,000 on one loan previously classified as held for sale and an other-than-temporary impairment of $37,453 due to adverse changes in expected cash flows related to credit losses for 14 CMBS investments.
During the year ended December 31, 2010, we recorded an impairment charge of $2,722 related to the acquisition of the 60% interest in the Whiteface Lodge.
Provision for loan losses was $48,180 for the year ended December 31, 2011, compared to $84,392 for the year ended December 31, 2010, a decrease of $36,212. The provision was based upon periodic credit reviews of our loan portfolio, and reflects the challenging economic conditions, severe illiquidity in the capital markets and a difficult operating environment.
Provision for taxes was $563 for the year ended December 31, 2011, versus $966 for the year ended December 31, 2010. The decrease of $403 is primarily related to a lower state income tax accrual on the gain on extinguishment of debt in the year ended December 31, 2011.
Comparison of the year ended December 31, 2010 to the year ended December 31, 2009
Revenues
| | | | | | |
| | 2010 | | 2009 | | $ Change |
| Rental revenue | | $ | 4,986 | | | $ | 3,670 | | | $ | 1,316 | |
| Investment income | | | 166,642 | | | | 184,607 | | | | (17,965 | ) |
| Operating expense reimbursements | | | 2,077 | | | | 2,098 | | | | (21 | ) |
| Other income | | | 9,892 | | | | 1,257 | | | | 8,635 | |
| Total revenues | | $ | 183,597 | | | $ | 191,632 | | | $ | (8,035 | ) |
| Equity in net income (loss) of joint ventures | | $ | (1,255 | ) | | $ | 113 | | | $ | (1,368 | ) |
| Gain on extinguishment of debt | | $ | 19,443 | | | $ | 119,305 | | | $ | (99,862 | ) |
Rental revenue increased by $1,316 primarily due to additional rental revenue $659 on the Whiteface Lodge which we acquired controlling interest in July 2010 and $699 on a property we acquired controlling interest in July 2009.
Investment income is generated on our whole loans, subordinate interests in whole loans, mezzanine loans, preferred equity interests and CMBS. For the year ended December 31, 2010, $99,392 was earned on fixed rate investments while the remaining $67,250 was earned on floating rate investments. For the year
77
TABLE OF CONTENTS
ended December 31, 2009, $83,346 was earned on fixed rate investments while the remaining $101,261 was earned on floating rate investments. The decrease of $17,965 over the prior period is primarily due to the suspension of interest income accruals on certain payment-in-kind loans, a decrease in the size of our portfolio of loans and other lending instruments by approximately $239,846, and a decline in LIBOR interest rates in 2010 compared to 2009.
Operating expense reimbursements were $2,077 for the year ended December 31, 2010 and $2,098 for the year ended December 31, 2009. The decrease of $21 was primarily related to a decrease in occupancy causing a decrease in reimbursement income.
Other income of $9,892 for the year ended December 31, 2010 is primarily comprised of operating income from properties we foreclosed on since June 2009 of $1,527, operating income from the Whiteface Lodge which we acquired controlling interest in July 2010 of $3,460, interest earned on restricted cash balances and other cash balances held by us of $11, sale of CMBS bonds of $1,397, and increase in loan servicing reimbursement and special servicing income of $2,318. For the year ended December 31, 2009, other income of $1,257 is composed of $288 interest income on CDO bonds, $237 unrealized gains on securities, and $633 in loan servicing reimbursement and special servicing income.
The equity in net loss of joint ventures of $1,255 for the year ended December 31, 2010 represents our proportionate share of the income generated by three of our joint venture interests including $268 of real estate-related depreciation and amortization, which when added back, results in a contribution to or FFO, of $987. The equity in net income of joint ventures of $113 for the year ended December 31, 2009 represents our proportionate share of income generated by two of our joint venture interests including $388 of real estate-related depreciation and amortization, which when added back, results in a contribution to FFO of $1,823. As of December 31, 2010, we classified three investments in joint ventures as discontinued operations, which had income of $8,120 and $7,849 and FFO of $12,199 and $11,911, for the years ended December 31, 2010 and 2009, respectively. Our use of FFO as an important non-GAAP financial measure is discussed in more detail below.
During the year ended December 31, 2010, we repurchased, at a discount, approximately $39,000 of notes previously issued by two of our three CDOs, generating a net gain on extinguishment of debt of $19,443. In March 2009, we entered into an amendment and compromise agreement with KeyBank National Association, or KeyBank, to settle and satisfy the existing loan obligations under the $175,000 unsecured facility at a discount for a cash payment of $45,000, and a future maximum cash payment of up to $15,000 from 50% of all cash distributions received by us after May 2009 from certain junior tranches and preferred classes of securities under our CDOs, which was fully satisfied in January 2010. We recorded a net gain of $107,179 as a result of this agreement. In December 2009, we entered into a termination agreement with Wachovia, to settle and satisfy in full the pre-existing loan obligation of $44,542 under the secured term loan and credit facility. We made a one-time cash payment of $22,500 and executed and delivered to Wachovia a subordinate participation interest in our 50% interest in one of the four mezzanine loans formerly pledged under the credit facility. We recorded a gain on extinguishment of debt of $12,126 pursuant the termination agreement.
Expenses
| | | | | | |
| | 2010 | | 2009 | | $ Change |
| Property operating expenses | | $ | 18,241 | | | $ | 14,237 | | | $ | 4,004 | |
| Interest expense | | | 85,545 | | | | 110,804 | | | | (25,259 | ) |
| Depreciation and amortization | | | 1,694 | | | | 2,215 | | | | (521 | ) |
| Management, general and administrative | | | 33,293 | | | | 39,374 | | | | (6,081 | ) |
| Management fees | | | — | | | | 7,787 | | | | (7,787 | ) |
| Net impairment recognized in earnings | | | 39,453 | | | | 151,081 | | | | (111,628 | ) |
| Impairment on business acquisition, net | | | 2,722 | | | | — | | | | 2,722 | |
| Provision for loan loss | | | 84,392 | | | | 517,784 | | | | (433,392 | ) |
| Provision for taxes | | | 966 | | | | 2,495 | | | | (1,529 | ) |
| Total expenses | | $ | 266,306 | | | $ | 845,777 | | | $ | (579,471 | ) |
78
TABLE OF CONTENTS
Property operating expenses increased $4,004 from the $14,237 recorded in the year ended December 31, 2009 to $18,241 recorded in the year ended December 31, 2010. The increase is attributable to $2,556 of expenses related to properties we foreclosed on since June 2009, and $4,221 from the Whiteface Lodge which we acquired a controlling interest in July 2010. These are partially offset by reductions in real estate tax assessments of $163, lower utilities costs of $67 due to the reduced over-time HVAC charges and utility efficiencies and building improvements.
Interest expense was $85,545 for the year ended December 31, 2010 compared to $110,804 for the year ended December 31, 2009. The decrease of $25,259 is primarily attributed to reductions in the interest rate indexes, primarily LIBOR-based, charged on our variable rate debt over the year ended December 31, 2010 compared to the year ended December 31, 2009, as well as lower average principal balances outstanding over the same periods due to debt extinguishments, repayments using proceeds from additional cash repayments, sales of certain investments that served as collateral for these borrowings and reduced amortization of financing costs.
We recorded depreciation and amortization expenses of $1,694 for the year ended December 31, 2010, compared to $2,215 for the year ended December 31, 2009. The decrease of $521 is primarily due to $849 of lower amortization on loan costs offset by $255 of higher depreciation and amortization expense on building, equipment, and in-place lease intangible assets reflecting the expiration or termination of related leases.
Management, general and administrative expenses were $33,293 for the year ended December 31, 2010, compared to $39,374 for the same period in 2009. The decrease of $6,081 includes $5,042 of expense for costs incurred in connection with the internalization of the Manager, the acquisition costs were expensed in 2009, $1,795 of lower legal and audit fees in 2010. The decrease in legal and professional fees is primarily related to loan enforcement and restructurings completed during 2009, costs incurred in connection with modifications sought with respect to our CDOs. These decreases are offset by about $756 of increased salaries, benefits and other administrative costs previously borne by SL Green prior to the internalization of our management in May 2009.
Management fees of $7,787 were expensed for the year ended December 31, 2009. We did not incur any management fees for the year ended December 31, 2010. The decrease is due primarily to the internalization of the Manager, which took place on April 24, 2009. The internalization was completed through a direct acquisition of the Manager, which was previously then a wholly-owned subsidiary of SL Green. Upon completion of the internalization, all management fees payable by us to the Manager were eliminated.
During the year ended December 31, 2010, we recorded impairment charges totaling $39,453, consisting of $2,000 on one loan previously classified as held for sale and an other-than-temporary impairment of $37,453 due to adverse changes in expected cash flows related to credit losses for 14 CMBS investments. Impairment charges on loans were taken to reduce the carrying value of loans-held-for sale to their fair value based upon anticipated selling prices.
During the year ended December 31, 2010, we recorded an impairment charge of $2,722 related to the acquisition of the 60% interest in the Whiteface Lodge.
Provision for loan losses was $84,392 for the year ended December 31, 2010, compared to $517,784 for the year ended December 31, 2009, a decrease of $433,392. The provision was based upon periodic credit reviews of our loan portfolio, and reflects the challenging economic conditions, severe illiquidity in the capital markets and a difficult operating environment.
Provision for taxes was $966 for the year ended December 31, 2010, versus $2,495 for the year ended December 31, 2009. The decrease of $1,529 is primarily related to a lower state income tax accrual on the gain on extinguishment of debt in the year ended December 31, 2010.
Liquidity and Capital Resources
Liquidity is a measurement of the ability to meet cash requirements, including ongoing commitments to repay borrowings, fund and maintain loans and other investments, pay dividends and other general business needs. In addition to cash on hand, our primary sources of funds for short-term (within the next 12 months) liquidity requirements, including working capital, distributions, if any, debt service and additional investments,
79
TABLE OF CONTENTS
if any, consist of: (i) cash flow from operations; (ii) proceeds and management fees from our existing CDOs; (iii) proceeds from principal and interest payments and rents on our investments; (iv) proceeds from potential loan and asset sales; (v) proceeds from the Interim Management Agreement for the KBS portfolio; and, to a lesser extent; (vi) new financings or additional securitizations or CDO offerings; (vii) proceeds from additional common or preferred equity offerings. We believe these sources of financing will be sufficient to meet our short-term liquidity requirements. We do not anticipate having the ability in the near-term to access new equity or debt capital through new warehouse lines, CDO issuances, term or credit facilities or trust preferred issuances, although we continue to explore capital raising options. In the event we are not able to successfully secure financing, we will rely primarily on cash on hand, cash flows from operations, principal, interest and lease payments on our investments, management fees, and proceeds from asset and loan sales to satisfy our liquidity requirements. If we (i) are unable to renew, replace or expand our sources of financing, (ii) are unable to execute asset and loan sales in a timely manner or to receive anticipated proceeds from them or (iii) fully utilize available cash, it may have an adverse effect on our business, results of operations, and ability to make distributions to our stockholders.
Our ability to fund our short-term liquidity needs, including debt service and general operations (including employment related benefit expenses), through cash flow from operations can be evaluated through the consolidated statement of cash flows included in our financial statements. Beginning with the third quarter of 2008 our board of directors elected not to pay a dividend on our common stock. Additionally our board of directors elected not to pay the Series A preferred stock dividend of $0.50781 per share beginning with the fourth quarter of 2008. As of December 31, 2011 and 2010 we accrued $23,276 and $16,114, respectively, for the Series A preferred stock dividends. Based on current estimates of our taxable loss, we expect that we will have no distribution requirements in order to maintain our REIT status for the 2011 tax year and we expect that we will continue to elect to retain capital for liquidity purposes until the requirement to make a cash distribution to satisfy our REIT requirements arise. We may elect to pay dividends to satisfy our REIT distribution requirements on our common stock in cash or a combination of cash and shares of our common stock to the extent we are permitted under U.S. federal income tax laws. However, in accordance with the provisions of our charter, we may not pay any dividends on our common stock until all accrued dividends and the dividend for the then current quarter on the Series A preferred stock are paid in full.
Our ability to meet our long-term (beyond the next 12 months) liquidity and capital resource requirements will be subject to obtaining additional debt financing and equity capital. Our inability to renew, replace or expand our sources of financing on substantially similar terms, or any at all may have an adverse effect on our business and results of operations. Any indebtedness we incur will likely be subject to continuing or more restrictive covenants and we will likely be required to make continuing representations and warranties in connection with such debt. In addition, to the extent we increase our investment activity outside of our CDOs, including originating or acquiring certain “qualified assets” for the purposes of maintaining our REIT compliance or maintenance of our exemption from the Investment Company Act, our existing liquidity and capital resources would be reduced.
Our future borrowings may require us, among other restrictive covenants, to keep uninvested cash on hand, to maintain a certain minimum tangible net worth, to maintain a certain portion of our assets free from liens and to secure such borrowings with assets. These conditions could limit our ability to do further borrowings and may have a material adverse effect on our liquidity, the value of our common stock, and our ability to make distributions to our stockholders.
As of the date of this filing, we expect that our cash on hand and cash flow from operations will be sufficient to satisfy our current and our anticipated liquidity needs as well as our recourse liabilities, if any.
The majority of our loan and other investments are pledged as collateral for our CDO bonds and the income generated from these investments is used to fund interest obligations of our CDO bonds and the remaining income, if any, is retained by us. Our CDO indentures contain minimum interest coverage and asset overcollateralization covenants that must be met in order for us to receive cash flow on the CDO interests retained by us and to receive the subordinate collateral management fee earned. If some or all of our CDOs fail to comply with the covenants all cash flows from the applicable CDO other than senior collateral management fees would be diverted to repay principal and interest on the most senior outstanding CDO bonds
80
TABLE OF CONTENTS
and we may not receive some or all residual payments or the subordinate collateral management fee until that CDO regained compliance with such tests. As of January 2012, the most recent distribution date, our 2005 CDO and our 2006 CDO were in compliance with interest coverage and asset overcollateralization covenants, however the compliance margins were narrow and relatively small declines in collateral performance and credit metrics could cause the CDOs to fall out of compliance. Our 2005 CDO failed its overcollateralization test at the October 2011, April 2011 and January 2011 distribution dates and our 2007 CDO failed its overcollateralization test beginning with the November 2009 distribution date. We cannot be certain that the CDO tests will continue to be satisfied and that we will continue to receive cash flows relating to our CDOs in the future. If the cash flow from our 2005 CDO and our 2006 CDO is redirected, our business, financial condition, and results of operations would be materially and adversely affected.
Notwithstanding the challenges which confront our company, our board of directors remains committed to identifying and pursuing strategies and transactions that could preserve or improve our cash flows from our CDOs, increase our net asset value per share of common stock, improve our future access to capital or otherwise potentially create value for our stockholders. In considering these alternatives (which could include additional repurchases, issuances of our debt or equity securities a strategic combination of our company, strategic sale of our assets, or modifying our business plan), we expect our board of directors will carefully consider the potential impact of any such transaction on our liquidity position and our qualification as a REIT and our exemption from the Investment Company Act before deciding to pursue it. We expect our board of directors will only authorize us to take any of these actions if they can be accomplished on terms our board of directors finds attractive. Accordingly, there is a substantial possibility that not all such actions can or will be implemented.
In June 2011, our board of directors established a special committee to direct and oversee an exploration of strategic alternatives available to us subsequent to the execution of the Settlement Agreement for Gramercy Realty’s assets. The special committee is considering the feasibility of raising debt or equity capital, the possibility of a strategic combination of our company, a strategic sale of our assets, or modifying our business plan, including making additional debt repurchases or investing our available capital outside of our CDOs. At the direction of the special committee, we engaged Wells Fargo Securities, LLC to act as our financial advisor and to assist in the process.
To maintain our qualification as a REIT under the Internal Revenue Code, we must distribute annually at least 90% of our taxable income. This distribution requirement limits our ability to retain earnings and thereby replenish or increase capital for operations. We may elect to pay dividends on our common stock in cash or a combination of cash and shares of common stock to the extent we are permitted under U.S. federal income tax laws governing REIT distribution requirements. However, in accordance with the provisions of our charter, we may not pay any dividends on our common stock until all accrued dividends and the dividend for the then current quarter on the Series A Preferred Stock are paid in full.
Cash Flows
Net cash provided by operating activities decreased $29,726 to $87,105 for the year ended December 31, 2011 compared to $116,831 for the same period in 2010. Operating cash flow was generated primarily by net interest income from our commercial real estate finance segment and net rental income from our property management and investment segment. The decrease in operating cash flow for the year ended December 31, 2011 compared to the same period in 2010 was primarily due to a decrease in operating assets and liabilities of $41,018.
Net cash provided by investing activities for the year ended December 31, 2011 was $51,133 compared to $154,707 during the same period in 2010. The increase in cash flow from investing activities is primarily attributable to the, increase in principal collections on investments, increase in investment in CMBS, and an increase in new investment originations for the year ended December 31, 2011 as compared to the year ended December 31, 2010.
Net cash used by financing activities for the year ended December 31, 2011 was $195,358 as compared to $189,038 during the same period in 2010. The change is primarily attributable to the increase in restricted cash in the current period and the repayments and repurchase of liabilities issued by our CDOs.
81
TABLE OF CONTENTS
Capitalization
Our authorized capital stock consists of 125,000,000 shares, $0.001 par value, of which we have authorized the issuance of up to 100,000,000 shares of common stock, $0.001 par value per share, and 25,000,000 shares of preferred stock, par value $0.001 per share. As of December 31, 2011, 51,086,266 shares of common stock and 3,525,822 shares of preferred stock were issued and outstanding.
Preferred Stock
In April 2007, we issued 4,600,000 shares of our 8.125% Series A cumulative redeemable preferred stock (including the underwriters’ over-allotment option of 600,000 shares) with a mandatory liquidation preference of $25.00 per share. Holders of the Series A preferred stock are entitled to annual dividends of $2.03125 per share on a quarterly basis and dividends are cumulative, subject to certain provisions. On or after April 18, 2012, we may at our option redeem the Series A preferred stock at par for cash. Net proceeds (after deducting underwriting fees and expenses) from the offering were approximately $111,205.
In November 2010, we settled a tender offer to purchase up to 4,000,000 shares of our Series A preferred stock for $15.00 per preferred share, net to seller in cash. In the aggregate, we paid approximately $16,620 to acquire the 1,074,178 shares of the Series A preferred stock tendered and not withdrawn. The shares of Series A preferred stock acquired by us were retired upon receipt and accrued and unpaid dividends of $4,364 or $4.0625 per share of the acquired preferred stock, were eliminated. After settlement of the tender offer, 3,525,822 shares of Series A preferred stock remain outstanding for trading on the NYSE.
The $13,713 excess of the $30,332 carrying value of the tendered preferred stock, including accrued dividends of $4,364, over the $16,620 of consideration paid was recorded as a decrease to net loss available to common stockholders.
Beginning with the fourth quarter of 2008, our board of directors elected not to pay the quarterly Series A preferred stock dividends of $0.50781 per share. As of December 31, 2011 and 2010, we accrued Series A preferred stock dividends of $23,276 and $16,114, respectively.
Deferred Stock Compensation Plan for Directors
Under our Independent Director’s Deferral Program, which commenced April 2005, our independent directors may elect to defer up to 100% of their annual retainer fee, chairman fees and meeting fees. Unless otherwise elected by a participant, fees deferred under the program shall be credited in the form of phantom stock units. The phantom stock units are convertible into an equal number of shares of common stock upon such directors’ termination of service from the board of directors or a change in control by us, as defined by the program. Phantom stock units are credited to each independent director quarterly using the closing price of our common stock on the applicable dividend record date for the respective quarter. If dividends are declared by us, each participating independent director who elects to receive fees in the form of phantom stock units has the option to have their account credited for an equivalent amount of phantom stock units based on the dividend rate for each quarter or have dividends paid in cash.
As of December 31, 2011, there were approximately 499,143 phantom stock units outstanding, of which 499,143 units are vested.
Market Capitalization
At December 31, 2011, our CDOs represented 93.2% of our consolidated market capitalization of $2.7 billion (based on a common stock price of $2.50 per share, the closing price of our common stock on the New York Stock Exchange on December 31, 2011). Market capitalization includes our consolidated debt and common and preferred stock.
82
TABLE OF CONTENTS
Indebtedness
The table below summarizes secured and other debt at December 31, 2011 and 2010:
| | | | |
| | December 31,
2011(1) | | December 31,
2010(1) |
| Mortgage notes payable | | $ | — | | | $ | 1,640,671 | |
| Mezzanine notes payable | | | — | | | | 549,713 | |
| Collateralized debt obligations | | | 2,468,810 | | | | 2,682,321 | |
| Total | | $ | 2,468,810 | | | $ | 4,872,705 | |
| Cost of debt | | | — | | | | LIBOR+2.47 | % |
| (1) | Pursuant to the Settlement Agreement, the mortgage notes payable and the related collateral was transitioned to KBS, in exchange for a mutual release of claims among us and the mortgage KBS and, subject to certain termination provisions, an arrangement for our continued management of the assets on behalf of KBS for a fixed fee plus incentive fees. |
Unsecured Credit Facility
In May 2006, we closed on a $100,000 senior unsecured revolving credit facility with KeyBank, with an initial term of three years and a one-year extension option. In June 2007, the facility was increased to $175,000. In March 2009, we entered into an amendment and compromise agreement with KeyBank to settle and satisfy the loan obligations at a discount for a cash payment of $45,000 and a maximum amount of up to $15,000 from 50% of all payments from distributions after May 2009 from certain junior tranches and preferred classes of securities under our CDOs, which was fully paid in January 2010. We recorded a gain on extinguishment of debt of $107,229 as a result of this agreement.
Mortgage and Mezzanine Loans
Certain real estate assets were subject to mortgage and mezzanine liens. In September 2011, we entered into the Settlement Agreement for an orderly transition of substantially all of Gramercy Realty’s assets to KBS, in full satisfaction of Gramercy Realty’s obligations with respect to the Goldman Mortgage Loan and the Goldman Mezzanine Loans, in exchange for a mutual release of claims among us and the mortgage and mezzanine lenders and, subject to certain termination provisions, our continued management of Gramercy Realty’s assets on behalf of KBS for a fixed fee plus incentive fees. On September 1, 2011 and on December 1, 2011, we transferred to KBS or its affiliates, interests in entities owning 317 and 116, respectively, of the 867 Gramercy Realty properties that we agreed to transfer pursuant to the Settlement Agreement and the remaining ownership interests were transferred to KBS by December 15, 2011. The aggregate carrying value for the interests transferred to KBS was approximately $2.63 billion. In July 2011, the Dana portfolio, which consisted of 15 properties totaling approximately 3.8 million rentable square feet, was transferred to its mortgage lender through a deed in lieu of foreclosure. For further discussion of the impact of the Settlement Agreement and the transfer of the Dana portfolio, see Settlement and Extinguishment of Debt within Note 2 to the consolidated financial statements.
Goldman Mortgage Loan
On April 1, 2008, certain of our subsidiaries, collectively, the Goldman Loan Borrowers, entered into a mortgage loan agreement, the Goldman Mortgage Loan, with GSMC, Citicorp, and SL Green in connection with a mortgage loan in the amount of $250,000, which is secured by certain properties owned or ground leased by the Goldman Loan Borrowers. The Goldman Mortgage Loan had an initial maturity date of March 9, 2010, with a single one-year extension option. The Goldman Mortgage Loan bore interest at 4.35% over one-month LIBOR. The Goldman Mortgage Loan provided for customary events of default, the occurrence of which could result in an acceleration of all amounts payable under the Goldman Mortgage Loan. The Goldman Mortgage Loan allowed for prepayment under the terms of the agreement, as long as simultaneously therewith a proportionate prepayment of the Goldman Mezzanine Loan (discussed below) was also be pre-paid. In August 2008, an amendment to the loan agreement was entered into for the Goldman Mortgage Loan in conjunction with the bifurcation of the Goldman Mezzanine loan into two separate mezzanine loans. Under this loan agreement amendment, the Goldman Mortgage Loan bore interest at 1.99% over LIBOR. We had accrued interest of $256 and borrowings of $240,523 as of December 31, 2010.
83
TABLE OF CONTENTS
In March 2010, we extended the maturity date of the Goldman Mortgage Loan to March 2011, and amended certain terms of the loan agreement, including, among others, (i) a prohibition on distributions from the Goldman Loan Borrowers to us, other than to cover direct costs related to executing the extension and reimbursement of not more than $2,500 per quarter of corporate overhead actually incurred and allocated to Gramercy Realty, (ii) requirement of $5,000 of available cash on deposit in a designated account on the commencement date of the Goldman Mortgage Loan extension term, and (iii) within 90 days after the first day of the Goldman Mortgage Loan extension term, delivery by the Goldman Loan Borrowers to GSMC, Citicorp and SL Green of a comprehensive long-term business plan and restructuring proposal addressing repayment of the Goldman Mortgage Loan. Subsequent to the final maturity of the Goldman Mortgage Loan and the Goldman Mezzanine Loans, we entered into a series of short term extensions to provide additional time to exchange and consider proposals for an extension, modification, restructuring or refinancing of the Goldman Mortgage Loan and the Goldman Mezzanine Loans and to explore an orderly transition of the collateral to the lenders if such discussions failed. On May 9, 2011, we announced that the scheduled maturity of the Goldman Mortgage Loan and the Goldman Mezzanine Loans occurred without repayment and without an extension or restructuring of the loans by the lenders.
Notwithstanding the maturity and non-repayment of the loans, we maintained active communications with the lenders and in September 2011, we entered into the Settlement Agreement, for an orderly transition of substantially all of Gramercy Realty’s assets to KBS, Gramercy Realty’s senior mezzanine lender, in full satisfaction of Gramercy Realty’s obligations with respect to the Goldman Mortgage Loan and the Goldman Mezzanine Loans, in exchange for a mutual release of claims among us and the mortgage and mezzanine lenders and, subject to certain termination provisions, our continued management of Gramercy Realty’s assets on behalf of KBS for a fixed fee plus incentive fees. On September 1, 2011 and on December 1, 2011, we transferred to KBS or its affiliates, interests in entities owning 317 and 116, respectively, of the 867 Gramercy Realty properties that we agreed to transfer pursuant to the Settlement Agreement and the remaining ownership interests were transferred to KBS by December 15, 2011. The aggregate carrying value for the interests transferred to KBS was approximately $2.63 billion. In July 2011, the Dana portfolio, which consisted of 15 properties totaling approximately 3.8 million rentable square feet, was transferred to its mortgage lender through a deed in lieu of foreclosure. For further discussion of the impact of the Settlement Agreement and the transfer of the Dana portfolio, see Settlement and Extinguishment of Debt within Note 2 to the consolidated financial statements.
Secured Term Loan
On April 1, 2008 First States Investors 3300 B, L.P., an indirect wholly-owned subsidiary, or the PB Loan Borrower, entered into a loan agreement, the PB Loan Agreement, with PB Capital Corporation, as agent for itself and other lenders, in connection with a secured term loan in the amount of $240,000, or the PB Loan in part to refinance a portion of a portfolio known as the WBBD Portfolio. The PB Loan matures on April 1, 2013 and bears interest at a 1.65% over one-month LIBOR. The PB Loan is secured by mortgages on the 41 properties owned by the PB Loan Borrower and all other assets of the PB Loan Borrower. The PB Loan Agreement provided for customary events of default, the occurrence of which could result in an acceleration of all amounts payable under the PB Loan Agreement. The PB Loan Borrower may prepay the PB Loan, in whole or in part (in amounts equal to at least $1,000), on any date. We had accrued interest of $395 and borrowings of $219,513 as of December 31, 2010. Pursuant to the Settlement Agreement, the PB Loan and the related collateral was transitioned to KBS, in exchange for a mutual release of claims among us and the mortgage and mezzanine lenders and, subject to certain termination provisions, an arrangement for our continued management of the assets on behalf KBS in December 2011 for a fixed fee plus incentive fees.
Goldman Senior and Junior Mezzanine Loans
On April 1, 2008, certain of our subsidiaries, collectively, the Mezzanine Borrowers, entered into a mezzanine loan agreement with GSMC, Citicorp and SL Green in connection with a mezzanine loan in the amount of $600,000, or the Goldman Mezzanine Loan, which was secured by pledges of certain equity interests owned by the Mezzanine Borrowers and any amounts receivable by the Mezzanine Borrowers whether by way of distributions or other sources. The Goldman Mezzanine Loan had an initial maturity date of on March 9, 2010, with a single one-year extension option. The Goldman Mezzanine Loan bore interest at 4.35% over one-month LIBOR. The Goldman Mezzanine Loan provided for customary events of default, the
84
TABLE OF CONTENTS
occurrence of which could result in an acceleration of all amounts payable under the Goldman Mezzanine Loan. The Goldman Mezzanine Loan allowed for prepayment under the terms of the agreement, subject to a 1.00% prepayment fee during the first six months, payable to the lender, as long as simultaneously therewith a proportionate prepayment of the Goldman Mortgage Loan was also made on such date. In addition, under certain circumstances the Goldman Mezzanine Loan was cross-defaulted with events of default under the Goldman Mortgage Loan and with other mortgage loans pursuant to which an indirect wholly-owned subsidiary of ours is the mortgagor. In August 2008, the $600,000 mezzanine loan was bifurcated into two separate mezzanine loans, (the Junior Mezzanine Loan and the Senior Mezzanine Loan) by the lenders. Additional loan agreement amendments were entered into for the Goldman Mezzanine Loan and Goldman Mortgage Loan. Under these loan agreement amendments, the Junior Mezzanine Loan bore interest at 6.00% over LIBOR and the Senior Mezzanine Loan bore interest at 5.20% over LIBOR, and the Goldman Mortgage Loan bore interest at 1.99% over LIBOR. The weighted average of these interest rate spreads was equal to the combined weighted average of the interest rates spreads on the initial loans. We had accrued interest of $1,454 and borrowings of $549,713 as of December 31, 2010.
In March 2010, we extended the maturity date of the Goldman Mortgage Loan to March 2011, and amended certain terms of the loan agreement, including, among others, (i) a prohibition on distributions from the Goldman Loan Borrowers to us, other than to cover direct costs related to executing the extension and reimbursement of not more than $2,500 per quarter of corporate overhead actually incurred and allocated to Gramercy Realty, (ii) requirement of $5,000 of available cash on deposit in a designated account on the commencement date of the Goldman Mortgage Loan extension term, and (iii) within 90 days after the first day of the Goldman Mortgage Loan extension term, delivery by the Goldman Loan Borrowers to GSMC, Citicorp and SL Green of a comprehensive long-term business plan and restructuring proposal addressing repayment of the Goldman Mortgage Loan. Subsequent to the final maturity of the Goldman Mortgage Loan and the Goldman Mezzanine Loans, we entered into a series of short term extensions to provide additional time to exchange and consider proposals for an extension, modification, restructuring or refinancing of the Goldman Mortgage Loan and the Goldman Mezzanine Loans and to explore an orderly transition of the collateral to the lenders if such discussions failed. On May 9, 2011, we announced that the scheduled maturity of the Goldman Mortgage Loan and the Goldman Mezzanine Loans occurred without repayment and without an extension or restructuring of the loans by the lenders.
Notwithstanding the maturity and non-repayment of the loans, we maintained active communications with the lenders and in September 2011, we entered into the Settlement Agreement, for an orderly transition of substantially all of Gramercy Realty’s assets to KBS, in full satisfaction of Gramercy Realty’s obligations with respect to the Goldman Mortgage Loan and the Goldman Mezzanine Loans, in exchange for a mutual release of claims among us and the mortgage and mezzanine lenders and, subject to certain termination provisions, our continued management of Gramercy Realty’s assets on behalf of KBS for a fixed fee plus incentive fees. On September 1, 2011 and on December 1, 2011, we transferred to KBS or its affiliates, interests in entities owning 317 and 116, respectively, of the 867 Gramercy Realty properties that we agreed to transfer pursuant to the Settlement Agreement and the remaining ownership interests were transferred to KBS by December 15, 2011. The aggregate carrying value for the interests transferred to KBS was approximately $2.63 billion. In July 2011, the Dana portfolio, which consisted of 15 properties totaling approximately 3.8 million rentable square feet, was transferred to its mortgage lender through a deed in lieu of foreclosure. For further discussion of the impact of the Settlement Agreement and the transfer of the Dana portfolio, see Settlement and Extinguishment of Debt within Note 2 to the consolidated financial statements.
Collateralized Debt Obligations
During 2005 we issued approximately $1,000,000 of CDO bonds through two indirect subsidiaries, Gramercy Real Estate CDO 2005-1 Ltd., or the 2005 Issuer, and Gramercy Real Estate CDO 2005-1 LLC, or the 2005 Co-Issuer. At issuance, the CDO consisted of $810,500 of investment grade notes, $84,500 of non-investment grade notes, which were co-issued by the 2005 Issuer and the 2005 Co-Issuer, and $105,000 of preferred shares, which were issued by the 2005 Issuer. The investment grade notes were issued with floating rate coupons with a combined weighted average rate of three-month LIBOR plus 0.49%. We incurred approximately $11,957 of costs related to Gramercy Real Estate CDO 2005-1, which are amortized on a level- yield basis over the average life of the CDO.
85
TABLE OF CONTENTS
During 2006 we issued approximately $1,000,000 of CDO bonds through two indirect subsidiaries, Gramercy Real Estate CDO 2006-1 Ltd., or the 2006 Issuer, and Gramercy Real Estate CDO 2006-1 LLC, or the 2006 Co-Issuer. At issuance, the CDO consisted of $903,750 of investment grade notes, $38,750 of non-investment grade notes, which were co-issued by the 2006 Issuer and the 2006 Co-Issuer, and $57,500 of preferred shares, which were issued by the 2006 Issuer. The investment grade notes were issued with floating rate coupons with a combined weighted average rate of three-month LIBOR plus 0.37%. We incurred approximately $11,364 of costs related to Gramercy Real Estate CDO 2006-1, which are amortized on a level-yield basis over the average life of the CDO.
In August 2007, we issued $1,100,000 of CDO bonds through two indirect subsidiaries, Gramercy Real Estate CDO 2007-1 Ltd., or the 2007 Issuer, and Gramercy Real Estate CDO 2007-1 LLC, or the 2007 Co-Issuer. At issuance, the CDO consisted of $1,045,550 of investment grade notes, $22,000 of non-investment grade notes, which were co-issued by the 2007 Issuer and the 2007 Co-Issuer, and $32,450 of preferred shares, which were issued by the 2007 Issuer. The investment grade notes were issued with floating rate coupons with a combined weighted average rate of three-month LIBOR plus 0.46%. We incurred approximately $16,816 of costs related to Gramercy Real Estate CDO 2007-1, which are amortized on a level-yield basis over the average life of the CDO.
In connection with the closing of our first CDO in July 2005, pursuant to the collateral management agreement, the Manager agreed to provide certain advisory and administrative services in relation to the collateral debt securities and other eligible investments securing the CDO notes. The collateral management agreement provides for a senior collateral management fee, payable quarterly in accordance with the priority of payments as set forth in the indenture, equal to 0.15% per annum of the net outstanding portfolio balance, and a subordinate collateral management fee, payable quarterly in accordance with the priority of payments as set forth in the indenture, equal to 0.25% per annum of the net outstanding portfolio balance. Net outstanding portfolio balance is the sum of the (i) aggregate principal balance of the collateral debt securities, excluding defaulted securities, (ii) aggregate principal balance of all principal proceeds held as cash and eligible investments in certain accounts, and (iii) with respect to the defaulted securities, the calculation amount of such defaulted securities. The collateral management agreement for our 2006 CDO provides for a senior collateral management fee, payable quarterly in accordance with the priority of payments as set forth in the indenture, equal to 0.15% per annum of the net outstanding portfolio balance, and a subordinate collateral management fee, payable quarterly in accordance with the priority of payments as set forth in the indenture, equal to 0.25% per annum of the net outstanding portfolio balance. Net outstanding portfolio balance is the sum of the (i) aggregate principal balance of the collateral debt securities, excluding defaulted securities, (ii) aggregate principal balance of all principal proceeds held as cash and eligible investments in certain accounts, and (iii) with respect to the defaulted securities, the calculation amount of such defaulted securities. The collateral management agreement for our 2007 CDO provides for a senior collateral management fee, payable quarterly in accordance with the priority of payments as set forth in the indenture, equal to (i) 0.05% per annum of the aggregate principal balance of the CMBS securities, (ii) 0.10% per annum of the aggregate principal balance of loans, preferred equity securities, cash and certain defaulted securities, and (iii) a subordinate collateral management fee, payable quarterly in accordance with the priority of payments as set forth in the indenture, equal to 0.15% per annum of the aggregate principal balance of the loans, preferred equity securities, cash and certain defaulted securities.
We retained all non-investment grade securities, the preferred shares and the common shares in the Issuer of each CDO. The Issuers and Co-Issuers in each CDO holds assets, consisting primarily of whole loans, subordinate interests in whole loans, mezzanine loans, preferred equity investments and CMBS, which serve as collateral for the CDO. Each CDO may be replenished, pursuant to certain rating agency guidelines relating to credit quality and diversification, with substitute collateral using cash generated by debt investments that are repaid during the reinvestment periods (generally, five years from issuance) of the CDO. Thereafter, the CDO securities will be retired in sequential order from senior-most to junior-most as debt investments are repaid. The financial statements of the Issuer of each CDO are consolidated in our financial statements. The securities originally rated as investment grade at time of issuance are treated as a secured financing, and are non-recourse to us. Proceeds from the sale of the securities originally rated as investment grade in each CDO were used to repay substantially all outstanding debt under our repurchase agreements and to fund additional
86
TABLE OF CONTENTS
investments. Loans and other investments are owned by the Issuers and the Co-Issuers, serve as collateral for our CDO securities, and the income generated from these investments is used to fund interest obligations of our CDO securities and the remaining income, if any, is retained by us.
The CDO indentures contain minimum interest coverage and asset overcollateralization covenants that must be satisfied in order for us to receive cash flow on the interests retained by us in our CDOs and to receive the subordinate collateral management fee earned. If some or all of our CDOs fail these covenants, all cash flows from the applicable CDO other than senior collateral management fees would be diverted to repay principal and interest on the most senior outstanding CDO securities, and we may not receive some or all residual payments or the subordinate collateral management fee until the applicable CDO regained compliance with such tests. As of January 2012, the most recent distribution date, our 2005 CDO and our 2006 CDO were in compliance with interest coverage and asset overcollateralization covenants, however the compliance margins were narrow and relatively small declines in collateral performance and credit metrics could cause the CDOs to fall out of compliance. Our 2005 CDO failed its overcollateralization test at the October 2011, April 2011 and January 2011 distribution dates and our 2007 CDO failed its overcollateralization test beginning with the November 2009 distribution date. We cannot be certain that the CDO tests will continue to be satisfied and that we will continue to receive cash flows relating to our CDOs in the future. If the cash flow from our 2005 CDO and our 2006 CDO is redirected, our business, financial condition and results of operations would be materially and adversely affected.
During the year ended December 31, 2011, we repurchased, at a discount, $49,259 of notes previously issued by two of our three CDOs. We recorded a net gain on the early extinguishment of debt of $15,275 for the year ended December 31, 2011, in connection with the repurchase of notes of such Issuers. During the year ended December 31, 2010, we repurchased, at a discount, $39,000 of notes previously issued by two of our three CDOs. We recorded a net gain on the early extinguishment of debt of $19,443 for the year ended December 31, 2010, in connection with the repurchase of notes of such Issuers.
Junior Subordinated Notes
In May 2005, August 2005 and January 2006, we completed issuances of $50,000 each in unsecured trust preferred securities through three Delaware Statutory Trusts, or DSTs, Gramercy Capital Trust I, or GCTI, Gramercy Capital Trust II, or GCTII, and Gramercy Capital Trust III, or GCT III, that were also wholly-owned subsidiaries of our Operating Partnership. The securities issued in May 2005 bore interest at a fixed rate of 7.57% for the first ten years ending June 2015 and the securities issued in August 2005 bore interest at a fixed rate of 7.75% for the first ten years ending October 2015. Thereafter the rates were to float based on the three-month LIBOR plus 300 basis points. The securities issued in January 2006 bore interest at a fixed rate of 7.65% for the first ten years ending January 2016, with an effective rate of 7.43% when giving effect to the swap arrangement previously entered into in contemplation of this financing. Thereafter the rate was to float based on the three-month LIBOR plus 270 basis points.
In January 2009, our Operating Partnership entered into an exchange agreement with the holders of the securities, pursuant to which we and the holders agreed to exchange all of the previously issued trust preferred securities for newly issued unsecured junior subordinated notes, or our Junior Notes, in the aggregate principal amount of $150,000. Our Junior Notes will mature on June 30, 2035, or the Maturity Date, and will bear (i) a fixed interest rate of 0.50% per annum for the period beginning on January 30, 2009 and ending on January 29, 2012 and (ii) a fixed interest rate of 7.50% per annum for the period commencing on January 30, 2012 through and including the Maturity Date. We may redeem our Junior Notes in whole at any time, or in part from time to time, at a redemption price equal to 100% of the principal amount of the Junior Notes. The optional redemption of our Junior Notes in part must be made in at least $25,000 increments. The Junior Notes also contained additional covenants restricting, among other things, our ability to declare or pay any dividends during the calendar year 2009 (except to maintain our REIT qualification), or make any payment or redeem any debt securities ranked pari passu or junior to the Junior Notes. In connection with the exchange agreement, the final payment on the trust preferred securities for the period October 30, 2008 through January 29, 2009 was revised to be at a reduced interest rate of 0.50% per annum. In October 2009, a subsidiary of our Operating Partnership exchanged $97,500 of our Junior Notes for $97,533 face amount of the bonds issued by our CDOs that we had repurchased in the open market. In June 2010, we redeemed the remaining $52,500 of junior subordinated notes by transferring an equivalent par
87
TABLE OF CONTENTS
value amount of various classes of bonds issued by our CDOs previously purchased by us in the open market, and cash equivalents of $5,000. This redemption eliminates our junior subordinated notes from our consolidated financial statements, which had an original balance of $150,000.
Contractual Obligations
Combined aggregate principal maturities of our CDOs, and operating leases as of December 31, 2011 are as follows:
| | | | | | | | |
| | CDOs | | Interest
Payments | | Operating
Leases | | Total |
| 2012 | | $ | — | | | $ | 75,721 | | | $ | 332 | | | $ | 76,053 | |
| 2013 | | | — | | | | 71,002 | | | | 337 | | | | 71,339 | |
| 2014 | | | — | | | | 74,702 | | | | 343 | | | | 75,045 | |
| 2015 | | | — | | | | 83,239 | | | | 161 | | | | 83,400 | |
| 2016 | | | — | | | | 92,863 | | | | 3 | | | | 92,866 | |
| Thereafter | | | 2,468,810 | | | | 109,535 | | | | — | | | | 2,578,345 | |
| Total | | $ | 2,468,810 | | | $ | 507,062 | | | $ | 1,176 | | | $ | 2,977,048 | |
Additionally, one of our subsidiaries is a borrower under a $31,449 mortgage loan with our 2005 CDO and 2006 CDO acting as lenders, which bears interest at 5.0% and matures in June 2012. These intercompany borrowings are eliminated upon consolidation and therefore do not appear on our consolidated balance sheet.
Leasing Agreements
Our properties are leased and subleased to tenants under operating leases with expiration dates extending through the year 2031. These leases generally contain rent increases and renewal options. In September 2011, pursuant to the Settlement Agreement, substantially all of Gramercy Realty’s assets and liabilities, including its leasing agreements, was transitioned to KBS, in exchange for a mutual release of claims among us and the mortgage and mezzanine lenders and, subject to certain termination provisions, an arrangement for our continued management of Gramercy Realty’s assets on behalf of KBS for a fixed fee plus incentive fees.
Future minimum rental payments under non-cancelable leases, excluding reimbursements for operating expenses, as of December 31, 2011 are as follows:
| | |
| | Operating
Leases |
| 2012 | | $ | 3,181 | |
| 2013 | | | 1,984 | |
| 2014 | | | 1,908 | |
| 2015 | | | 1,886 | |
| 2016 | | | 1,795 | |
| Thereafter | | | 6,435 | |
| Total minimum lease payments | | $ | 17,189 | |
Off-Balance-Sheet Arrangements
We have off-balance-sheet investments, including a joint venture and structured finance investments. These investments all have varying ownership structures. Substantially all of our joint venture arrangements are accounted for under the equity method of accounting as we have the ability to exercise significant influence, but not control over the operating and financial decisions of these joint venture arrangements. Our off-balance-sheet arrangements are discussed in Note 6, “Investments in Unconsolidated Joint Ventures” in the accompanying financial statements.
88
TABLE OF CONTENTS
Dividends
To maintain our qualification as a REIT, we must pay annual dividends to our stockholders of at least 90% of our REIT taxable income, determined before taking into consideration the dividends paid deduction and net capital gains. Before we pay any dividend, whether for U.S. federal income tax purposes or otherwise, which would only be paid out of available cash, we must first meet both our operating requirements and scheduled debt service on our mortgages and loans payable. We may elect to pay dividends on our common stock in cash or a combination of cash and shares of common stock to the extent we are permitted under U.S. federal income tax laws governing REIT distribution requirements. However, in accordance with the provisions of our charter, we may not pay any dividends on our common stock until all accrued dividends and the dividend for the then current quarter on the Series A preferred stock are paid in full.
Beginning with the third quarter of 2008, our board of directors elected not to pay a dividend on our common stock. Our board of directors also elected not to pay the Series A preferred stock dividend of $0.50781 per share beginning with the fourth quarter of 2008. The unpaid preferred stock dividends have been accrued for thirteen quarters as of December 31, 2011. Based on current estimates of taxable loss, we believe we will have no distribution requirement in order to maintain our REIT status for the 2011 tax year.
Inflation
A majority of our assets and liabilities are interest rate sensitive in nature. As a result, interest rates and other factors influence our performance more so than inflation. Changes in interest rates do not necessarily correlate with inflation rates or changes in inflation rates.
Further, our financial statements are prepared in accordance with GAAP and our distributions are determined by our board of directors based primarily on our net income as calculated for tax purposes, in each case, our activities and balance sheet are measured with reference to historical costs or fair market value without considering inflation.
Related Party Transactions
In connection with our initial public offering, we entered into a management agreement with the Manager, which was subsequently terminated in April 2009 in connection with the internalization. The management agreement provided for a term through December 2009 with automatic one-year extension options and was subject to certain termination rights. We paid the Manager an annual management fee equal to 1.75% of our gross stockholders equity (as defined in the management agreement) inclusive of our trust preferred securities. In October 2008, we entered into the second amended and restated management agreement with the Manager which generally contained the same terms and conditions as the amended and restated management agreement, as amended, except for the following material changes: (1) reduced the annual base management fee to 1.50% of our gross stockholders equity; (2) reduces the termination fee to an amount equal to the management fee earned by the Manager during the 12 months preceding the termination date; and (3) commencing July 2008, all fees in connection with collateral management agreements were to be remitted by the Manager to us. We incurred expense to the Manager under this agreement of an aggregate of $0, $0 and $7,534 for the years ended December 31, 2011, 2010 and 2009, respectively.
Prior to the internalization, we were obligated to reimburse the Manager for its costs incurred under an asset servicing agreement between the Manager and an affiliate of SL Green OP and a separate outsource agreement between the Manager and SL Green OP. The asset servicing agreement, which was amended and restated in April 2006, provided for an annual fee payable to SL Green OP by us of 0.05% of the book value of all credit tenant lease assets and non-investment grade bonds and 0.15% of the book value of all other assets. The outsource agreement provided for an annual fee payable by us, which became $2,814 per year subsequent to the closing of the American Financial merger to reflect higher costs resulting from the increased size and number of assets of the combined company, increasing 3% annually over the prior year on the anniversary date of the outsource agreement in August of each year. For the year ended December 31, 2008, we realized expense of $1,721 to the Manager under the outsource agreement. For the year ended December 31, 2008, we realized expense of $4,022 to the Manager, under the asset servicing agreement. In October 2008, the outsource agreement was terminated and the asset servicing agreement was replaced with that certain interim asset servicing agreement between the Manager and an affiliate of SL Green, pursuant to
89
TABLE OF CONTENTS
which we were obligated to reimburse the Manager for its costs incurred there under from October 2008 until April 24, 2009 when such agreement was terminated in connection with the internalization. Pursuant to that agreement, the SL Green affiliate acted as the rated special servicer to our CDOs, for a fee equal to two basis points per year on the carrying value of the specially serviced loans assigned to it. Concurrent with the internalization, the interim asset servicing agreement was terminated and the Manager entered into a special servicing agreement with an affiliate of SL Green, pursuant to which the SL Green affiliate agreed to act as the rated special servicer to our CDOs for a period beginning on April 24, 2009 through the date that is the earlier of (i) 60 days thereafter and (ii) a date on which a new special servicing agreement is entered into between the Manager and a rated third-party special servicer. The SL Green affiliate was entitled to a servicing fee equal to (i) 25 basis points per year on the outstanding principal balance of assets with respect to certain specially serviced assets and (ii) two basis points per year on the outstanding principal balance of assets with respect to certain other assets. The April 24, 2009 agreement expired effective June 23, 2009. Effective May 2009, we entered into new special servicing arrangements with Situs Serve, L.P., which became the rated special servicer for our CDOs. An affiliate of SL Green continues to provide special servicing services with respect to a limited number of loans owned by us that are secured by properties in New York City, or in which we and SL Green are co-investors. For the years ended December 31, 2011, 2010 and 2009 we incurred expense of $3,058, $477 and $1,014, respectively, pursuant to the special servicing arrangement.
Commencing in May 2005, we are party to a lease agreement with SLG Graybar Sublease LLC, an affiliate of SL Green, for our corporate offices at 420 Lexington Avenue, New York, New York. The lease is for approximately 7,300 square feet and carries a term of 10 years with rents of approximately $249 per annum for year one rising to $315 per annum in year ten. In May and June 2009, we amended our lease with SLG Graybar Sublease LLC to increase the leased premises by approximately 2,260 square feet. The additional premises is leased on a co-terminus basis with the remainder of our leased premises and carries rents of approximately $103 per annum during the initial year and $123 per annum during the final lease year. For the years ended December 31, 2011, 2010 and 2009 we paid $307, $339 and $437 under this lease, respectively.
In March 2006, we closed on the purchase of a $25,000 mezzanine loan, which bears interest at one-month LIBOR plus 8.00%, to a joint venture in which SL Green was an equity holder. The mezzanine loan was repaid in full on May 9, 2006, when we originated a $90,287 whole loan, which bears interest at one-month LIBOR plus 2.75%, to the joint venture. The whole loan is secured by office and industrial properties in northern New Jersey and has a book value of $24,478 and $24,821 as of December 31, 2011 and 2010, respectively.
In April 2007, we purchased for $103,200 a 45% TIC interest to acquire the fee interest in a parcel of land located at 2 Herald Square, located along 34th Street in New York, New York. The acquisition was financed with $86,063 10-year fixed rate mortgage loan. The property is subject to a long-term ground lease with an unaffiliated third party for a term of 70 years. The remaining TIC interest is owned by a wholly-owned subsidiary of SL Green. The TIC interests are pari-passu. We sold our 45% interest in December 2010 to a wholly-owned subsidiary of SL Green for net proceeds of $25,350, resulting in a loss of $11,885. We recorded our pro rata share of net income of $5,078 and $4,988 for the years ended December 31, 2010 and 2009, respectively.
In July 2007, we purchased for $144,240 an investment in a 45% TIC interest to acquire a 79% fee interest and 21% leasehold interest in the fee position in a parcel of land located at 885 Third Avenue, on which is situated The Lipstick Building. The transaction was financed with a $120,443 10-year fixed rate mortgage loan. The property is subject to a 70-year leasehold ground lease with an unaffiliated third party. The remaining TIC interest is owned by a wholly-owned subsidiary of SL Green. The TIC interests are pari passu. We sold our 45% interest in December 2010 to a wholly-owned subsidiary of SL Green for net proceeds of $38,911, resulting in a loss of $15,407. We recorded our pro rata share of net income of $5,926 and $5,972 for the years ended December 31, 2010 and 2009, respectively.
In September 2007, we acquired a 50% interest in a $25,000 senior mezzanine loan from SL Green. Immediately thereafter, we, along with SL Green, sold all of our interests in the loan to an unaffiliated third party. Additionally, we acquired from SL Green a 100% interest in a $25,000 junior mezzanine loan associated
90
TABLE OF CONTENTS
with the same properties as the preceding senior mezzanine loan. Immediately thereafter we participated 50% of our interest in the loan back to SL Green. As of December 31, 2011 and 2010, the loan had a book value of $0 and $0, respectively. In October 2007, we acquired a 50% pari-passu interest in $57,795 of two additional tranches in the senior mezzanine loan from an unaffiliated third party. At closing, an affiliate of SL Green simultaneously acquired the other 50% pari-passu interest in the two tranches. As of December 31, 2011 and 2010, the loan has a book value of $0, and $0, respectively. We held a contingent interest in the property which was sold to SL Green in December 2010 for $2,016.
In December 2007, we acquired a $52,000 interest in a senior mezzanine loan from a financial institution. Immediately thereafter, we participated 50% of our interest in the loan to an affiliate of SL Green. The investment, which is secured by an office building in New York, New York, was purchased at a discount and bears interest at an effective spread to one-month LIBOR of 5.00%. In July 2009, we sold our remaining interest in the loan to an affiliate of SL Green for $16,120 pursuant to purchase rights established when the loan was acquired. The sale also included a contingent participation in future net proceeds from SL Green of up to $1,040 in excess of the purchase price upon their ultimate disposition of the loan, which was surrendered and cancelled in December 2010 in connection with certain transactions that we consummated with wholly-owned subsidiaries of SL Green.
In December 2007, we acquired a 50% interest in a $200,000 senior mezzanine loan from a financial institution. Immediately thereafter, we participated 50% of our interest in the loan to an affiliate of SL Green. The investment was purchased at a discount and bears interest at an effective spread to one-month LIBOR of 6.50%. In December 2010, we subsequently purchased from an affiliate of SL Green, its full participation in the senior mezzanine loan at a discount. As of December 31, 2011 and 2010, the original loan has a book value of $250 and $5,224, respectively, and the subsequently purchased mezzanine loan has a book value of $7,337 and $13,586, respectively and the preferred equity investment has a book value of $3.365 and $0, respectively.
In August 2008, we closed on the purchase from an SL Green affiliate of a $9,375 pari-passu participation interest in $18,750 first mortgage. The loan is secured by a retail shopping center located in Staten Island, New York. The investment bears interest at a fixed rate of 6.50%. In December 2010, we purchased the remaining 50% interest in the loan from an SL Green affiliate for a discount of $9,420. As of December 31, 2011 and 2010 the loan has a book value of $19,419 and $19,367, respectively.
In September 2008, we closed on the purchase from an SL Green affiliate of a $30,000 interest in a $135,000 mezzanine loan. The loan is secured by the borrower’s interests in a retail condominium located New York, New York. The investment bears interest at an effective spread to one-month LIBOR of 10.00%. As of December 31, 2010, the loan has a book value of approximately $27,778. In December 2010, we sold our contingent interest to SL Green for $300. In March 2011, the loan was paid in full by the borrower.
In December 2010, the Company sold its interest in a parcel of land located at 292 Madison Avenue in New York, New York to a wholly-owned subsidiary of SL Green. The Company received proceeds of $16,765 and recorded an impairment charge of $9,759.
Funds from Operations
We present FFO because we consider it an important supplemental measure of our operating performance and believe that it is frequently used by securities analysts, investors and other interested parties in the evaluation of REITS. We also use FFO as one of several criteria to determine performance-based incentive compensation for members of our senior management, which may be payable in cash or equity awards. The revised White Paper on FFO approved by the Board of Governors of the National Association of Real Estate Investment Trusts, or NAREIT, defines FFO as net income (loss) (determined in accordance with GAAP), excluding impairment writedowns of investments in depreciable real estate and investments in in-substance real estate investments, gains or losses from debt restructurings and sales of depreciable operating properties, plus real estate-related depreciation and amortization (excluding amortization of deferred financing costs), less distributions to non-controlling interests and gains/losses from discontinued operations and after adjustments for unconsolidated partnerships and joint ventures. FFO does not represent cash generated from operating activities in accordance with GAAP and should not be considered as an alternative to net income (determined in accordance with GAAP), as an indication of our financial performance, or to cash flow from operating
91
TABLE OF CONTENTS
activities (determined in accordance with GAAP) as a measure of our liquidity, nor is it entirely indicative of funds available to fund our cash needs, including our ability to make cash distributions. Our calculation of FFO may be different from the calculation used by other companies and, therefore, comparability may be limited.
FFO for the years ended December 31, 2011, 2010 and 2009 are as follows:
| | | | | | |
| | For the Year Ended December 31, |
| | | 2011 | | 2010 | | 2009 |
| Net income (loss) available to common shareholders | | $ | 330,315 | | | $ | (968,773 | ) | | $ | (529,043 | ) |
Add:
| | | | | | | | | | | | |
| Depreciation and amortization | | | 70,215 | | | | 115,051 | | | | 122,489 | |
| FFO adjustments for unconsolidated joint ventures | | | 3,219 | | | | 4,347 | | | | 4,450 | |
| Non-cash impairment of real estate investments | | | 1,296 | | | | 923,885 | | | | — | |
Less:
| | | | | | | | | | | | |
| Non real estate depreciation and amortization | | | (7,044 | ) | | | (7,925 | ) | | | (10,348 | ) |
| Gain on sale | | | (2,713 | ) | | | (13,302 | ) | | | (5,158 | ) |
| Funds from operations | | $ | 395,288 | | | $ | 53,283 | | | $ | (417,610 | ) |
| Funds from operations per share – basic | | $ | 7.87 | | | $ | 1.07 | | | $ | (8.38 | ) |
| Funds from operations per share – diluted | | $ | 7.75 | | | $ | 1.07 | | | $ | (8.38 | ) |
Recently Issued Accounting Pronouncements
In May 2009, the FASB issued new guidance that incorporates into authoritative accounting literature certain guidance that already existed within generally accepted auditing standards relative to the reporting of subsequent events, with the requirements concerning recognition and disclosure of subsequent events remaining essentially unchanged. This guidance addresses events which occur after the balance sheet date but before the issuance of financial statements. Under the new guidance, as under previous practice, an entity must record the effects of subsequent events that provide evidence about conditions that existed at the balance sheet date and must disclose but not record the effects of subsequent events which provide evidence about conditions that did not exist at the balance sheet date. This standard added an additional required disclosure relative to the date through which subsequent events have been evaluated and whether that is the date on which the financial statements were issued. We adopted this standard effective April 1, 2009. In February 2010, the FASB issued an Accounting Standards Update (ASU) clarifying the application of this guidance to entities, specifying that if an entity is an SEC filer then it should evaluate subsequent events through the date the financial statements are available to be issued. Additionally the ASU incorporates a definition of an SEC filer and states that an SEC filer is not required to disclose the date through which subsequent events have been evaluated. We have applied this update to our consolidated financial statements for the periods ended December 31, 2011 and 2010.
In June 2009, the FASB amended the guidance on transfers of financial assets to, among other things, eliminate the qualifying special-purpose entity concept, include a new unit of account definition that must be met for transfers of portions of financial assets to be eligible for sale accounting, clarify and change the derecognition criteria for a transfer to be accounted for as a sale, and require significant additional disclosure. This standard was effective January 1, 2010. The adoption of this guidance did not have a material impact on our consolidated financial statements.
In June 2009, the FASB issued new guidance which revised the consolidation guidance for variable-interest entities. The modifications include the elimination of the exemption for qualifying special purpose entities, a new approach for determining who should consolidate a variable-interest entity, and changes to when it is necessary to reassess who should consolidate a variable-interest entity. This standard was effective January 1, 2010. The adoption of this guidance did not have a material impact on our consolidated financial statements, other than presentation on our consolidated balance sheets.
92
TABLE OF CONTENTS
In January 2010, the FASB issued updated guidance on fair value measurements and disclosures, which requires disclosure of details of significant asset or liability transfers in and out of Level I and Level II measurements within the fair value hierarchy and inclusion of gross purchases, sales, issuances, and settlements in the rollforward of assets and liabilities valued using Level III inputs within the fair value hierarchy. The guidance also clarifies and expands existing disclosure requirements related to the disaggregation of fair value disclosures and inputs used in arriving at fair values for assets and liabilities using Level II and Level III inputs within the fair value hierarchy. These disclosure requirements were effective for interim and annual reporting periods beginning after December 15, 2009. Adoption of this guidance on January 1, 2010, excluding the Level III rollforward, resulted in additional disclosures in our consolidated financial statements. The gross presentation of the Level III rollforward is required for interim and annual reporting periods beginning after December 15, 2010. The adoption of the guidance on January 1, 2011 did not have a material effect on our consolidated financial statements.
In March 2010, the FASB issued a clarification of previous guidance that exempts certain credit related features from analysis as potential embedded derivatives subject to bifurcation and separate fair value accounting. This guidance specifies that an embedded credit derivative feature related to the transfer of credit risk that is only in the form of subordination of one financial instrument to another is not subject to bifurcation from a host contract. All other embedded credit derivative features should be analyzed to determine whether their economic characteristics and risks are “clearly and closely related” to the economic characteristics and risks of the host contract and whether bifurcation and separate fair value accounting is required. The adoption of this guidance by the Company on July 1, 2010 did not have a material effect on the Company’s consolidated financial statements.
In July 2010, FASB issued guidance which outlines specific disclosures that will be required for the allowance for credit losses and all finance receivables. Finance receivables includes loans, lease receivables and other arrangements with a contractual right to receive money on demand or on fixed or determinable dates that is recognized as an asset on an entity’s statement of financial position. This guidance will require companies to provide disaggregated levels of disclosure by portfolio segment and class to enable users of the financial statement to understand the nature of credit risk, how the risk is analyzed in determining the related allowance for credit losses and changes to the allowance during the reporting period. Required disclosures under this guidance as of the end of a reporting period are effective for the Company’s December 31, 2010. In January 2011, the FASB delayed the effective date of the new disclosures about troubled debt restructurings to allow the FASB the time needed to complete its deliberations about on what constitutes a troubled debt restructuring. The effective date of the new disclosures about and the guidance for determining what constitutes a troubled debt restructuring will then be coordinated. The guidance is effective for our September 30, 2011 reporting period. We have applied this update to our consolidated financial statements for the period ended December 31, 2011.
In December 2010, the FASB issued guidance on the disclosure of supplementary pro forma information for business combinations. The guidance specifies that if a public entity enters into business combinations that are material on an individual or aggregate basis and presents comparative financial statements, the entity must present pro forma revenue and earnings of the combined entity as though the business combination that occurred during the current period had occurred as of the beginning of the comparable annual period only. The adoption of this guidance for our annual reporting period ending December 31, 2011 will not have a material impact on our consolidated financial statements.
In April 2011, the FASB issued updated guidance on a creditor’s determination of whether a restructuring will be a troubled debt restructuring, which establishes new guidelines in evaluating whether a loan modification meets the criteria of a troubled debt restructuring. This guidance is effective as of the third quarter of 2011, applied retrospectively to the beginning of the fiscal year as required, and its adoption is not expected to have a material effect on our consolidated financial statements.
93
TABLE OF CONTENTS
In May 2011, the FASB issued updated guidance on fair value measurement which amends U.S. GAAP to conform to International Financial Reporting Standards, or IFRS, measurement and disclosure requirements. The amendment changes the wording used to describe the requirements in U.S. GAAP for measuring fair value, changes certain fair value measurement principles and enhances disclosure requirements. This guidance is effective as of January 1, 2012, applied prospectively, and its adoption did not have a material effect on our consolidated financial statements.
In June 2011, the FASB issued updated guidance on comprehensive income which amends U.S. GAAP to conform to the disclosure requirements of IFRS. The amendment eliminates the option to present components of other comprehensive income as part of the statement of stockholders’ equity and non-controlling interests and requires a separate statement of comprehensive income or two consecutive statements in the statement of operations and in a separate statement of comprehensive income. This guidance also requires the presentation of reclassification adjustments for each component of other comprehensive income on the face of the financial statements rather than in the notes to the financial statements. This guidance is effective as of January 1, 2012, except for the disclosure of reclassification adjustments which was postponed for re-deliberation by the FASB, and early adoption is permitted, and its adoption did not have a material effect on our consolidated financial statements.
94
TABLE OF CONTENTS
ITEM 7A. QUANTITATIVE AND QUALITATIVE DISCLOSURE ABOUT MARKET RISK
Market Risk
Market risk includes risks that arise from changes in interest rates, credit, commodity prices, equity prices and other market changes that affect market sensitive instruments. In pursuing our business plan, we expect that the primary market risks to which we will be exposed are real estate, interest rate and credit risks. These risks are highly sensitive to many factors, including governmental monetary and tax policies, domestic and international economic and political considerations and other factors that are beyond our control.
Real Estate Risk
Commercial and multi-family property values and net operating income derived from such properties are subject to volatility and may be affected adversely by a number of factors, including, but not limited to, national, regional and local economic conditions, local real estate conditions (such as an oversupply of retail, industrial, office or other commercial or multi-family space), changes or continued weakness in specific industry segments, construction quality, age and design, demographic factors, retroactive changes to building or similar codes, and increases in operating expenses (such as energy costs). In the event net operating income decreases, a borrower may have difficulty repaying our loans, which could result in losses to us. In addition, decreases in property values reduce the value of the collateral and the potential proceeds available to a borrower to repay our loans, which could also cause us to suffer losses. Even when a property’s net operating income is sufficient to cover the property’s debt service at the time a loan is made, there can be no assurance that this will continue in the future. We employ careful business selection, rigorous underwriting and credit approval processes and attentive asset management to mitigate these risks. These same factors pose risks to the operating income we receive from our portfolio of real estate investments, the valuation of our portfolio of owned properties, and our ability to refinance existing mortgage and mezzanine borrowings supported by the cash flow and value of our owned properties.
Interest Rate Risk
Interest rate risk is highly sensitive to many factors, including governmental monetary and tax policies, domestic and international economic and political considerations and other factors beyond our control. Our operating results will depend in large part on differences between the income from our assets and our borrowing costs. Most of our commercial real estate finance assets and borrowings are variable-rate instruments that we finance with variable rate debt. The objective of this strategy is to minimize the impact of interest rate changes on the spread between the yield on our assets and our cost of funds. We seek to enter into hedging transactions with respect to all liabilities relating to fixed rate assets. If we were to finance fixed rate assets with variable rate debt and the benchmark for our variable rate debt increased, our net income would decrease. Some of our loans are subject to various interest rate floors. As a result, if interest rates fall below the floor rates, the spread between the yield on our assets and our cost of funds will increase, which will generally increase our returns. Because we generate income on our commercial real estate finance assets principally from the spread between the yields on our assets and the cost of our borrowing and hedging activities, our net income on our commercial real estate finance assets will generally increase if LIBOR increases and decrease if LIBOR decreases. Our real estate assets generate income principally from fixed long-term leases and we are exposed to changes in interest rates primarily from our floating rate borrowing arrangements. We have used interest rate caps to manage our exposure to interest rate changes above 5.25% on $850,000 of borrowings, however, because our borrowing secured by our real estate assets is largely unhedged and because our real estate assets generate income from long-term leases, our net income from our real estate assets will generally decrease if LIBOR increases. The following chart shows a hypothetical 100 basis point increase in interest rates along the entire interest rate curve:
| | |
| Change in LIBOR | | Projected Increase (Decrease) in Net Income |
Base case
| | | | |
| +100 bps | | $ | (9,277 | ) |
| +200 bps | | $ | (15,907 | ) |
| +300 bps | | $ | (21,311 | ) |
95
TABLE OF CONTENTS
Our exposure to interest rates will also be affected by our overall corporate leverage, which may vary depending on our mix of assets.
In the event of a significant rising interest rate environment and/or economic downturn, delinquencies and defaults could increase and such delinquencies or defaults could have an adverse effect on the spreads between interest-earning assets and interest-bearing liabilities.
In the event of a rapidly rising interest rate environment, our operating cash flow from our real estate assets may be insufficient to cover the corresponding increase in interest expense on our variable rate borrowing secured by our real estate assets.
Credit Risk
Credit risk refers to the ability of each tenant in our portfolio of real estate investments to make contractual lease payments and each individual borrower under our loans and securities investments to make required interest and principal payments on the scheduled due dates. We seek to reduce credit risk of our real estate investments by entering into long-term leases with investment-grade financial services companies and financial institutions and we attempt to reduce credit risk of our loan and securities investments by actively managing our portfolio and the underlying credit quality of the subject collateral. If defaults occur, we employ our asset management resources to mitigate the severity of any losses and seek to optimize the recovery from assets in the event that we foreclose upon them. We seek to control the negotiation and structure of the debt transactions in which we invest, which enhances our ability to mitigate our losses, to negotiate loan documents that afford us appropriate rights and control over our collateral, and to have the right to control the debt that is senior to our position. We generally avoid investments where we cannot secure adequate control rights, unless we believe the default risk is very low and the transaction involves high-quality sponsors. In the event of a significant rising interest rate environment and/or economic downturn, tenant and borrower delinquencies and defaults may increase and result in credit losses that would materially and adversely affect our business, financial condition and results of operations.
96
TABLE OF CONTENTS
ITEM 8. FINANCIAL STATEMENTS AND SUPPLEMENTARY DATA
Index to Financial Statements and Schedules
All other schedules are omitted because they are not required or the required information is shown in the financial statements or notes thereto.
97
TABLE OF CONTENTS
Report of Independent Registered Public Accounting Firm
The Board of Directors and Stockholders of Gramercy Capital Corp.
We have audited the accompanying consolidated balance sheets of Gramercy Capital Corp. (the “Company”) as of December 31, 2011 and 2010, and the related consolidated statements of operations, stockholders’ equity and non-controlling interests, and cash flows for each of the three years in the period ended December 31, 2011. Our audits also included the financial statement schedules listed in the Index at Item 15(a). These financial statements and schedules are the responsibility of the Company’s management. Our responsibility is to express an opinion on these financial statements and schedules based on our audits.
We conducted our audits in accordance with the standards of the Public Company Accounting Oversight Board (United States). Those standards require that we plan and perform the audit to obtain reasonable assurance about whether the financial statements are free of material misstatement. An audit includes examining, on a test basis, evidence supporting the amounts and disclosures in the financial statements. An audit also includes assessing the accounting principles used and significant estimates made by management, as well as evaluating the overall financial statement presentation. We believe that our audits provide a reasonable basis for our opinion.
In our opinion, the financial statements referred to above present fairly, in all material respects, the consolidated financial position of Gramercy Capital Corp. at December 31, 2011 and 2010, and the consolidated results of its operations and its cash flows for each of the three years in the period ended December 31, 2011, in conformity with U.S. generally accepted accounting principles. Also, in our opinion, the related financial statement schedules, when considered in relation to the basic financial statements taken as a whole, present fairly in all material respects the information set forth therein.
We also have audited, in accordance with the standards of the Public Company Accounting Oversight Board (United States), Gramercy Capital Corp.’s internal control over financial reporting as of December 31, 2011, based on criteria established in Internal Control — Integrated Framework issued by the Committee of Sponsoring Organizations of the Treadway Commission and our report dated March 15, 2012 expressed an adverse opinion thereon.
/s/ ERNST & YOUNG LLP
New York, New York
March 15, 2012
98
TABLE OF CONTENTS
Report of Independent Registered Public Accounting Firm
The Board of Directors and Stockholders of Gramercy Capital Corp.
We have audited Gramercy Capital Corp.’s internal control over financial reporting as of December 31, 2011, based on criteria established in Internal Control — Integrated Framework issued by the Committee of Sponsoring Organizations of the Treadway Commission (the COSO criteria). Gramercy Capital Corp.’s management is responsible for maintaining effective internal control over financial reporting, and for its assessment of the effectiveness of internal control over financial reporting included in the accompanying Management’s Annual Report on Internal Control over Financial Reporting. Our responsibility is to express an opinion on the company’s internal control over financial reporting based on our audit.
We conducted our audit in accordance with the standards of the Public Company Accounting Oversight Board (United States). Those standards require that we plan and perform the audit to obtain reasonable assurance about whether effective internal control over financial reporting was maintained in all material respects. Our audit included obtaining an understanding of internal control over financial reporting, assessing the risk that a material weakness exists, testing and evaluating the design and operating effectiveness of internal control based on the assessed risk, and performing such other procedures as we considered necessary in the circumstances. We believe that our audit provides a reasonable basis for our opinion.
A company’s internal control over financial reporting is a process designed to provide reasonable assurance regarding the reliability of financial reporting and the preparation of financial statements for external purposes in accordance with generally accepted accounting principles. A company’s internal control over financial reporting includes those policies and procedures that (1) pertain to the maintenance of records that, in reasonable detail, accurately and fairly reflect the transactions and dispositions of the assets of the company; (2) provide reasonable assurance that transactions are recorded as necessary to permit preparation of financial statements in accordance with generally accepted accounting principles, and that receipts and expenditures of the company are being made only in accordance with authorizations of management and directors of the company; and (3) provide reasonable assurance regarding prevention or timely detection of unauthorized acquisition, use, or disposition of the company’s assets that could have a material effect on the financial statements.
Because of its inherent limitations, internal control over financial reporting may not prevent or detect misstatements. Also, projections of any evaluation of effectiveness to future periods are subject to the risk that controls may become inadequate because of changes in conditions, or that the degree of compliance with the policies or procedures may deteriorate.
A material weakness is a deficiency, or combination of deficiencies, in internal control over financial reporting, such that there is a reasonable possibility that a material misstatement of the company’s annual or interim financial statements will not be prevented or detected on a timely basis. The following material weakness has been identified and included in management’s assessment. Management has identified a material weakness in controls related to the company’s financial statement close process regarding the recognition of other than temporary impairment recorded on impaired commercial mortgage backed securities.
We also have audited, in accordance with the standards of the Public Company Accounting Oversight Board (United States), the consolidated balance sheet of Gramercy Capital Corp. as of December 31, 2011 and 2010, and the related consolidated statements of operations, stockholders’ equity and non-controlling interests, and cash flows for each of the three years in the period ended December 31, 2011. This material weakness was considered in determining the nature, timing and extend of audit tests applied in our audit of the 2011 financial statements and this report does not affect our report dated March 15, 2012, which expressed an unqualified opinion on those financial statements.
In our opinion, because of the effect of the material weakness described above on the achievement of the objectives of the control criteria, Gramercy Capital Corp. has not maintained, effective internal control over financial reporting as of December 31, 2011, based on the COSO criteria.
/s/ ERNST & YOUNG LLP
New York, New York
March 15, 2012
99
TABLE OF CONTENTS
Gramercy Capital Corp.
Consolidated Balance Sheets
(Amounts in thousands, except share and per share data)
| | | | |
| | December 31,
2011 | | December 31,
2010 |
Assets:
| | | | | | | | |
Real estate investments, at cost:
| | | | | | | | |
| Land | | $ | 11,915 | | | $ | 608,455 | |
| Building and improvements | | | 30,603 | | | | 1,818,012 | |
| Other real estate investments | | | 20,318 | | | | 20,318 | |
| Less: accumulated depreciation | | | (2,722 | ) | | | (168,333 | ) |
| Total real estate investments, net | | | 60,114 | | | | 2,278,452 | |
| Cash and cash equivalents | | | 163,629 | | | | 220,777 | |
| Restricted cash | | | 93 | | | | 128,806 | |
| Pledged government securities, net | | | — | | | | 92,918 | |
| Loans and other lending investments, net | | | 828 | | | | 1,512 | |
| Investment in joint ventures | | | 496 | | | | 3,650 | |
| Assets held for sale, net | | | 32,834 | | | | — | |
| Tenant and other receivables, net | | | 2,829 | | | | 44,788 | |
| Derivative instruments, at fair value | | | 6 | | | | 4 | |
| Acquired lease assets, net of accumulated amortization of $342 and $147,366 | | | 477 | | | | 310,207 | |
| Deferred costs, net of accumulated amortization of $4,899 and $29,929 | | | 1,961 | | | | 8,156 | |
| Other assets | | | 4,141 | | | | 15,210 | |
| Subtotal | | | 267,408 | | | | 3,104,480 | |
Assets of Consolidated Variable Interest Entities (“VIEs”):
| | | | | | | | |
Real estate investments, at cost:
| | | | | | | | |
| Land | | | 21,967 | | | | 26,486 | |
| Building and improvements | | | 4,205 | | | | 18,970 | |
| Less: accumulated depreciation | | | (261 | ) | | | (208 | ) |
| Total real estate investments directly owned | | | 25,911 | | | | 45,248 | |
| Cash and cash equivalents | | | 96 | | | | 68 | |
| Restricted cash | | | 34,122 | | | | 116,591 | |
| Loans and other lending investments, net | | | 1,081,091 | | | | 1,122,016 | |
| Commercial mortgage-backed securities – available for sale | | | 775,812 | | | | 31,889 | |
| Commercial mortgage-backed securities – held to maturity | | | — | | | | 973,278 | |
| Assets held for sale, net | | | 10,131 | | | | 28,660 | |
| Derivative instruments, at fair value | | | 913 | | | | 1,632 | |
| Accrued interest | | | 28,660 | | | | 29,784 | |
| Acquired lease assets, net of accumulated amortization of $0 and $153 | | | — | | | | 5,546 | |
| Deferred costs, net of accumulated amortization of $31,498 and $25,760 | | | 9,086 | | | | 14,744 | |
| Other assets | | | 25,100 | | | | 18,057 | |
| Subtotal | | | 1,990,922 | | | | 2,387,513 | |
| Total assets | | $ | 2,258,330 | | | $ | 5,491,993 | |
The accompanying notes are an integral part of these financial statements.
100
TABLE OF CONTENTS
Gramercy Capital Corp.
Consolidated Balance Sheets
(Amounts in thousands, except share and per share data)
| | | | |
| | December 31, 2011 | | December 31, 2010 |
Liabilities and Equity:
| | | | | | | | |
Liabilities:
| | | | | | | | |
| Mortgage notes payable | | $ | — | | | $ | 1,640,671 | |
| Mezzanine notes payable | | | — | | | | 549,713 | |
| Junior subordinated notes | | | — | | | | — | |
| Total secured and other debt | | | — | | | | 2,190,384 | |
| Accounts payable and accrued expenses | | | 14,992 | | | | 57,688 | |
| Dividends payable | | | 23,276 | | | | 16,114 | |
| Accrued interest payable | | | — | | | | 6,934 | |
| Deferred revenue | | | 2,392 | | | | 152,601 | |
| Below-market lease liabilities, net of accumulated amortization of $1,189 and $223,256 | | | 1,905 | | | | 691,592 | |
| Leasehold interests, net of accumulated amortization of $62 and $7,770 | | | — | | | | 17,027 | |
| Liabilities related to assets held for sale | | | 1,459 | | | | — | |
| Other liabilities | | | 627 | | | | 734 | |
| Subtotal | | | 44,651 | | | | 3,133,074 | |
Non-Recourse Liabilities of Consolidated VIEs:
| | | | | | | | |
| Mortgage notes payable | | | — | | | | — | |
| Collateralized debt obligations | | | 2,468,810 | | | | 2,682,321 | |
| Total secured and other debt | | | 2,468,810 | | | | 2,682,321 | |
| Accounts payable and accrued expenses | | | 4,554 | | | | 1,438 | |
| Accrued interest payable | | | 3,729 | | | | 4,818 | |
| Deferred revenue | | | 88 | | | | 188 | |
| Below-market lease liabilities, net of accumulated amortization of $0 and $26 | | | — | | | | 1,556 | |
| Liabilities related to assets held for sale | | | 249 | | | | 531 | |
| Derivative instruments, at fair value | | | 175,915 | | | | 157,932 | |
| Other liabilities | | | 764 | | | | 3,128 | |
| Subtotal | | | 2,654,109 | | | | 2,851,912 | |
| Total liabilities | | | 2,698,760 | | | | 5,984,986 | |
| Commitments and contingencies | | | — | | | | — | |
Equity:
| | | | | | | | |
Common stock, par value $0.001, 100,000,000 shares authorized,
51,086,266 and 49,984,559 shares issued and outstanding at December 31, 2011 and 2010, respectively. | | | 50 | | | | 50 | |
Series A cumulative redeemable preferred stock, par value $0.001, liquidation preference $88,146, 4,600,000 shares authorized,
3,525,822 shares issued and outstanding at December 31, 2011 and 2010. | | | 85,235 | | | | 85,235 | |
| Additional paid-in-capital | | | 1,080,600 | | | | 1,078,198 | |
| Accumulated other comprehensive loss | | | (440,939 | ) | | | (160,785 | ) |
| Accumulated deficit | | | (1,166,279 | ) | | | (1,496,594 | ) |
| Total Gramercy Capital Corp. stockholders' equity | | | (441,333 | ) | | | (493,896 | ) |
| Non-controlling interest | | | 903 | | | | 903 | |
| Total equity | | | (440,430 | ) | | | (492,993 | ) |
| Total liabilities and equity | | $ | 2,258,330 | | | $ | 5,491,993 | |
The accompanying notes are an integral part of these financial statements.
101
TABLE OF CONTENTS
Gramercy Capital Corp.
Consolidated Statements of Operations
(Amounts in thousands, except share and per share data)
| | | | | | |
| | Year Ended December 31, |
| | | 2011 | | 2010 | | 2009 |
Revenues
| | | | | | | | | | | | |
| Rental revenue | | $ | 5,819 | | | $ | 4,986 | | | $ | 3,670 | |
| Investment income | | | 158,750 | | | | 166,642 | | | | 184,607 | |
| Operating expense reimbursements | | | 2,180 | | | | 2,077 | | | | 2,098 | |
| Other income | | | 44,461 | | | | 9,892 | | | | 1,257 | |
| Total revenues | | | 211,210 | | | | 183,597 | | | | 191,632 | |
Expenses
| | | | | | | | | | | | |
Property operating expenses
| | | | | | | | | | | | |
| Real estate taxes | | | 1,782 | | | | 1,390 | | | | 1,389 | |
| Utilities | | | 2,164 | | | | 1,673 | | | | 1,318 | |
| Ground rent and leasehold obligations | | | 800 | | | | 778 | | | | 325 | |
| Property and leasehold impairments | | | — | | | | 1,331 | | | | 3,933 | |
| Direct billable expenses | | | 8 | | | | 21 | | | | 10 | |
| Other property operating expenses | | | 16,526 | | | | 13,048 | | | | 7,262 | |
| Total property operating expenses | | | 21,280 | | | | 18,241 | | | | 14,237 | |
| Other-than-temporary impairment | | | 52,679 | | | | 37,453 | | | | 12,511 | |
| Portion of impairment recognized in other comprehensive loss | | | (34,256 | ) | | | — | | | | — | |
| Impairment on loans held for sale | | | — | | | | 2,000 | | | | 138,570 | |
| Net impairment recognized in earnings | | | 18,423 | | | | 39,453 | | | | 151,081 | |
| Interest expense | | | 81,643 | | | | 85,545 | | | | 110,804 | |
| Depreciation and amortization | | | 1,271 | | | | 1,694 | | | | 2,215 | |
| Management, general and administrative | | | 35,987 | | | | 33,293 | | | | 39,374 | |
| Management fees | | | — | | | | — | | | | 7,787 | |
| Impairment on business acquisition, net | | | — | | | | 2,722 | | | | — | |
| Provision for loan loss | | | 48,180 | | | | 84,392 | | | | 517,784 | |
| Total expenses | | | 206,784 | | | | 265,340 | | | | 843,282 | |
| Income (loss) from continuing operations before equity in income from joint ventures, provisions for taxes and non-controlling interest | | | 4,426 | | | | (81,743 | ) | | | (651,650 | ) |
| Equity in net loss of joint ventures | | | 121 | | | | (1,255 | ) | | | 113 | |
| Loss from continuing operations before provision for taxes, gain on extinguishment of debt and discontinued operations | | | 4,547 | | | | (82,998 | ) | | | (651,537 | ) |
| Gain on extinguishment of debt | | | 15,275 | | | | 19,443 | | | | 119,305 | |
| Provision for taxes | | | (563 | ) | | | (966 | ) | | | (2,495 | ) |
| Net income (loss) from continuing operations | | | 19,259 | | | | (64,521 | ) | | | (534,727 | ) |
| Net income (loss) from discontinued operations | | | 29,872 | | | | (874,629 | ) | | | 2,831 | |
| Net loss from discontinued operations with a related party | | | — | | | | (9,759 | ) | | | — | |
| Income on sale of joint venture interests | | | — | | | | — | | | | 6,317 | |
| Loss on sale of joint venture interests to a related party | | | — | | | | (27,292 | ) | | | — | |
| Gain on settlement of debt | | | 285,634 | | | | — | | | | — | |
| Net gains from disposals | | | 2,712 | | | | 2,658 | | | | 5,180 | |
| Net income (loss) from discontinued operations | | | 318,218 | | | | (909,022 | ) | | | 14,328 | |
| Net income (loss) | | | 337,477 | | | | (973,543 | ) | | | (520,399 | ) |
| Net (income) loss attributable to non-controlling interest | | | — | | | | (145 | ) | | | 770 | |
| Net income (loss) attributable to Gramercy Capital Corp. | | | 337,477 | | | | (973,688 | ) | | | (519,629 | ) |
| Accrued preferred stock dividends | | | (7,162 | ) | | | (8,798 | ) | | | (9,414 | ) |
| Excess of carrying amount of tendered preferred stock over consideration paid | | | — | | | | 13,713 | | | | — | |
| Net income (loss) available to common stockholders | | $ | 330,315 | | | $ | (968,773 | ) | | $ | (529,043 | ) |
Basic earnings per share:
| | | | | | | | | | | | |
| Net income (loss) from continuing operations, net of non-controlling interest and after preferred dividends | | $ | 0.24 | | | $ | (1.19 | ) | | $ | (10.91 | ) |
| Net income (loss) from discontinued operations | | | 6.34 | | | | (18.21 | ) | | | 0.30 | |
| Net income (loss) available to common stockholders | | $ | 6.58 | | | $ | (19.40 | ) | | $ | (10.61 | ) |
Diluted earnings per share:
| | | | | | | | | | | | |
| Net income (loss) from continuing operations, net of non-controlling interest and after preferred dividends | | $ | 0.24 | | | $ | (1.19 | ) | | $ | (10.91 | ) |
| Net income (loss) from discontinued operations | | | 6.24 | | | | (18.21 | ) | | | 0.30 | |
| Net income (loss) available to common stockholders | | $ | 6.48 | | | $ | (19.40 | ) | | $ | (10.61 | ) |
| Basic weighted average common shares outstanding | | | 50,229,102 | | | | 49,923,930 | | | | 49,854,174 | |
| Diluted weighted average common shares and common share equivalents outstanding | | | 50,990,163 | | | | 49,923,930 | | | | 49,854,174 | |
The accompanying notes are an integral part of these financial statements.
102
TABLE OF CONTENTS
Gramercy Capital Corp.
Consolidated Statements of Stockholders’ Equity and Non-controlling Interests
(Amounts in thousands, except share data)
| | | | | | | | | | | | | | | | | | | | |
| |
Common Stock | | Series A
Preferred
Stock | | Additional
Paid-In-
Capital | | Accumulated
Other
Comprehensive
Income (Loss) | | Retained
Earnings/
(Accumulated
Deficit) | | Total
Gramercy
Capital
Corp | | Non-controlling
interest | | Total | | Comprehensive
Income (loss) |
| | | Shares | | Par Value |
| Balance at December 31, 2008 | | | 49,852,243 | | | | 50 | | | | 111,205 | | | | 1,077,983 | | | | (160,739 | ) | | | 1,222 | | | | 1,029,721 | | | | 2,712 | | | | 1,032,433 | | | $ | (35,778 | ) |
| Net loss | | | | | | | | | | | | | | | | | | | | | | | (519,629 | ) | | | (519,629 | ) | | | (770 | ) | | | (520,399 | ) | | $ | (519,629 | ) |
| Change in net unrealized loss on derivative instruments | | | | | | | | | | | | | | | | | | | 63,621 | | | | | | | | 63,621 | | | | | | | | 63,621 | | | | 63,621 | |
| Reclassification of adjustments of net unrealized loss on securities previously available for sale | | | | | | | | | | | | | | | | | | | 1,080 | | | | | | | | 1,080 | | | | | | | | 1,080 | | | | 1,080 | |
| Issuance of stock – stock purchase plan | | | 44,523 | | | | | | | | | | | | 27 | | | | | | | | | | | | 27 | | | | | | | | 27 | | | | | |
| Stock based compensation – fair value | | | (12,266 | ) | | | | | | | | | | | 937 | | | | | | | | | | | | 937 | | | | | | | | 937 | | | | | |
| Dividends accrued on preferred stock | | | | | | | | | | | | | | | | | | | | | | | (9,414 | ) | | | (9,414 | ) | | | | | | | (9,414 | ) | | | | |
| Contributions from non-controlling interests | | | | | | | | | | | | | | | | | | | | | | | | | | | — | | | | 7,227 | | | | 7,227 | | | | | |
| Distributions to non-controlling interests | | | | | | | | | | | | | | | (163 | ) | | | | | | | | | | | (163 | ) | | | (7,831 | ) | | | (7,994 | ) | | | | |
| Balance at December 31, 2009 | | | 49,884,500 | | | | 50 | | | | 111,205 | | | | 1,078,784 | | | | (96,038 | ) | | | (527,821 | ) | | | 566,180 | | | | 1,338 | | | | 567,518 | | | $ | (454,928 | ) |
| Net loss | | | | | | | | | | | | | | | | | | | | | | | (973,688 | ) | | | (973,688 | ) | | | 145 | | | | (973,543 | ) | | $ | (973,688 | ) |
| Change in net unrealized loss on derivative instruments | | | | | | | | | | | | | | | | | | | (70,603 | ) | | | | | | | (70,603 | ) | | | | | | | (70,603 | ) | | | (70,603 | ) |
| Change in unrealized gain or loss on securities available for sale | | | | | | | | | | | | | | | | | | | 5,495 | | | | | | | | 5,495 | | | | | | | | 5,495 | | | | 5,495 | |
| Reclassification of adjustments of net unrealized loss on securities previously available for sale | | | | | | | | | | | | | | | | | | | 361 | | | | | | | | 361 | | | | | | | | 361 | | | | 361 | |
| Issuance of stock – stock purchase plan | | | 25,211 | | | | | | | | | | | | 26 | | | | | | | | | | | | 26 | | | | | | | | 26 | | | | | |
| Stock based compensation – fair value | | | 74,848 | | | | | | | | | | | | 1,068 | | | | | | | | | | | | 1,068 | | | | | | | | 1,068 | | | | | |
| Acquisition of non-controlling interest | | | | | | | | | | | | | | | (1,680 | ) | | | | | | | | | | | (1,680 | ) | | | (580 | ) | | | (2,260 | ) | | | | |
| Tender of Series A Preferred Stock | | | | | | | | | | | (25,970 | ) | | | | | | | | | | | 13,713 | | | | (12,257 | ) | | | | | | | (12,257 | ) | | | | |
| Dividends accrued on preferred stock | | | | | | | | | | | | | | | | | | | | | | | (8,798 | ) | | | (8,798 | ) | | | | | | | (8,798 | ) | | | | |
| Balance at December 31, 2010 | | | 49,984,559 | | | $ | 50 | | | $ | 85,235 | | | $ | 1,078,198 | | | $ | (160,785 | ) | | $ | (1,496,594 | ) | | $ | (493,896 | ) | | $ | 903 | | | $ | (492,993 | ) | | $ | (1,038,435 | ) |
| Net income | | | | | | | | | | | | | | | | | | | | | | | 337,477 | | | | 337,477 | | | | | | | | 337,477 | | | $ | 337,477 | |
| Change in net unrealized loss on derivative instruments | | | | | | | | | | | | | | | | | | | (19,334 | ) | | | | | | | (19,334 | ) | | | | | | | (19,334 | ) | | | (19,334 | ) |
Change in unrealized gain or loss on securities
available for sale | | | | | | | | | | | | | | | | | | | (260,820 | ) | | | | | | | (260,820 | ) | | | | | | | (260,820 | ) | | | (260,820 | ) |
| Issuance of stock – stock purchase plan | | | 20,448 | | | | | | | | | | | | | | | | | | | | | | | | — | | | | | | | | — | | | | | |
| Stock based compensation – fair value | | | 1,081,259 | | | | | | | | | | | | 2,402 | | | | | | | | | | | | 2,402 | | | | | | | | 2,402 | | | | | |
| Acquisition of non-controlling interest | | | | | | | | | | | | | | | | | | | | | | | | | | | — | | | | | | | | — | | | | | |
| Tender of Series A Preferred Stock | | | | | | | | | | | | | | | | | | | | | | | | | | | — | | | | | | | | — | | | | | |
| Dividends accrued on preferred stock | | | | | | | | | | | | | | | | | | | | | | | (7,162 | ) | | | (7,162 | ) | | | | | | | (7,162 | ) | | | | |
| Balance at December 31, 2011 | | | 51,086,266 | | | $ | 50 | | | $ | 85,235 | | | $ | 1,080,600 | | | $ | (440,939 | ) | | $ | (1,166,279 | ) | | $ | (441,333 | ) | | $ | 903 | | | $ | (440,430 | ) | | $ | 57,323 | |
103
TABLE OF CONTENTS
Gramercy Capital Corp.
Consolidated Statements of Cash Flows
(Amounts in thousands)
| | | | | | |
| | Year ended December 31, |
| | | 2011 | | 2010 | | 2009 |
Operating Activities
| | | | | | | | | | | | |
| Net income (loss) | | $ | 337,477 | | | $ | (973,543 | ) | | $ | (520,399 | ) |
Adjustments to net cash provided by operating activities:
| | | | | | | | | | | | |
| Depreciation and amortization | | | 69,430 | | | | 114,485 | | | | 123,451 | |
| Amortization of leasehold interests | | | (2,698 | ) | | | (2,727 | ) | | | (2,860 | ) |
| Amortization of acquired leases to rental revenue | | | (54,420 | ) | | | (68,507 | ) | | | (80,666 | ) |
| Amortization of deferred costs | | | 4,749 | | | | 7,732 | | | | 11,580 | |
| Amortization of discount and other fees | | | (33,312 | ) | | | (28,140 | ) | | | (24,030 | ) |
| Payment of capitalized tenant leasing costs | | | (2,072 | ) | | | (2,939 | ) | | | (2,161 | ) |
| Straight-line rent adjustment | | | (6,772 | ) | | | 26,289 | | | | 24,641 | |
| Non-cash impairment charges | | | 19,492 | | | | 963,497 | | | | 194,286 | |
| Non-cash impairment charges with related party | | | — | | | | 9,759 | | | | — | |
| Net gain on sale of properties and lease terminations | | | (2,712 | ) | | | (2,737 | ) | | | (5,180 | ) |
| Impairment on business acquisition, net | | | (59 | ) | | | 2,722 | | | | — | |
| Net realized gain on loans | | | (16,643 | ) | | | 1,483 | | | | — | |
| Equity in net loss of joint ventures | | | 1,977 | | | | (6,865 | ) | | | (8,130 | ) |
| Gain on extinguishment of debt | | | (300,909 | ) | | | (19,443 | ) | | | (119,305 | ) |
| Amortization of stock compensation | | | 2,243 | | | | 1,094 | | | | 961 | |
| Provision for loan losses | | | 48,180 | | | | 84,392 | | | | 517,784 | |
| Unrealized gain on derivative instruments | | | 16 | | | | — | | | | (916 | ) |
| Net realized gain on sale of joint venture investment | | | — | | | | — | | | | (6,317 | ) |
Net realized loss on sale of joint venture investment to a
related party | | | — | | | | 27,292 | | | | — | |
Changes in operating assets and liabilities:
| | | | | | | | | | | | |
| Restricted cash | | | 2,803 | | | | 15,942 | | | | 8,836 | |
| Tenant and other receivables | | | 27,693 | | | | 4,576 | | | | (12,075 | ) |
| Accrued interest | | | 1,097 | | | | 37 | | | | (10,064 | ) |
| Other assets | | | 8,896 | | | | 1,517 | | | | 8,143 | |
| Management and incentive fees payable | | | — | | | | — | | | | (847 | ) |
| Accounts payable, accrued expenses and other liabities | | | 22,306 | | | | 1,909 | | | | (31,819 | ) |
| Deferred revenue | | | (39,657 | ) | | | (40,994 | ) | | | 22,047 | |
| Net cash provided by operating activities | | | 87,105 | | | | 116,831 | | | | 86,960 | |
Investing Activities
| | | | | | | | | | | | |
| Capital expenditures and leasehold costs | | | (7,752 | ) | | | (19,084 | ) | | | — | |
| Payment for acquistions of real estate investments | | | — | | | | (4,550 | ) | | | — | |
| Proceeds from sale of joint venture investment | | | 387 | | | | — | | | | (10,450 | ) |
| Proceeds from sale of securities available for sale | | | 65,584 | | | | — | | | | — | |
| Proceeds from sale of joint venture investment to a related party | | | — | | | | 64,203 | | | | — | |
| Deferred investment costs | | | — | | | | — | | | | (651 | ) |
| Proceeds from sale of real estate | | | 22,895 | | | | 37,709 | | | | 172,895 | |
| Proceeds from sale of real estate to a related party | | | — | | | | 16,765 | | | | — | |
| New investment originations and funded commitments | | | (293,450 | ) | | | (121,447 | ) | | | (55,374 | ) |
| Principal collections on investments | | | 329,975 | | | | 221,975 | | | | 89,106 | |
| Proceeds from loan syndications | | | — | | | | 25,617 | | | | 52,926 | |
| Investment in commercial mortgage-backed securities | | | (84,871 | ) | | | (63,562 | ) | | | (119,122 | ) |
| Distribution received from joint venture | | | 668 | | | | — | | | | — | |
104
TABLE OF CONTENTS
| | | | | | |
| | Year ended December 31, |
| | | 2011 | | 2010 | | 2009 |
| Investment in joint venture | | | 372 | | | | (3,168 | ) | | | (3,237 | ) |
| Change in accrued interest income | | | 71 | | | | (11 | ) | | | (32 | ) |
| Purchase of marketable investments | | | 3 | | | | 2 | | | | (7 | ) |
| Sale of marketable investments | | | 6,560 | | | | 6,139 | | | | 6,606 | |
| Change in restricted cash from investing activities | | | 8,268 | | | | (5,881 | ) | | | (1,539 | ) |
| Deferred investment costs | | | 2,423 | | | | — | | | | | |
| Net cash provided by investing activities | | | 51,133 | | | | 154,707 | | | | 131,121 | |
Financing Activities
| | | | | | | | | | | | |
| Distribution to non-controlling interests | | | — | | | | — | | | | (7,995 | ) |
| Payment for hedge termination | | | — | | | | — | | | | (4,452 | ) |
| Proceeds from repurchase facilities | | | — | | | | — | | | | 9,500 | |
| Repayments of repurchase facilities | | | — | | | | (85 | ) | | | (76,243 | ) |
| Purchase of interest rate caps | | | (1,277 | ) | | | (3,162 | ) | | | — | |
| Repayment of unsecured credit facility | | | — | | | | — | | | | (45,000 | ) |
| Repayment of collateralized debt obligations | | | (164,977 | ) | | | — | | | | — | |
| (Repurchase) issuance of collateralized debt obligations | | | (33,997 | ) | | | (19,557 | ) | | | — | |
| Payment for exchange of junior subordinate note | | | — | | | | (5,000 | ) | | | — | |
| Repayment of mortgage notes | | | (33,315 | ) | | | (43,529 | ) | | | (111,559 | ) |
| Proceeds from stock options exercised | | | 160 | | | | — | | | | — | |
| Cash transfer pursuant to Settlement Agreement | | | (37,148 | ) | | | — | | | | — | |
| Deferred financing costs and other liabilities | | | (3,742 | ) | | | (6,698 | ) | | | (3,205 | ) |
| Cash consideration paid to redeem preferred stock | | | — | | | | (16,620 | ) | | | — | |
| Dividends paid on common stock | | | — | | | | — | | | | (31 | ) |
| Change in restricted cash from financing activities | | | 78,938 | | | | (94,387 | ) | | | 22,421 | |
| Net cash used by financing activities | | | (195,358 | ) | | | (189,038 | ) | | | (216,564 | ) |
| Net (decrease) increase in cash and cash equivalents | | | (57,120 | ) | | | 82,500 | | | | 1,517 | |
| Cash and cash equivalents at beginning of period | | | 220,845 | | | | 138,345 | | | | 136,828 | |
| Cash and cash equivalents at end of period | | $ | 163,725 | | | $ | 220,845 | | | $ | 138,345 | |
Non-cash activity
| | | | | | | | | | | | |
Deferred gain (loss) and other non-cash activity related
to derivatives | | $ | (19,334 | ) | | $ | (70,707 | ) | | $ | 68,073 | |
| Mortgage loans, mezzanine loans and related interest satisfied in connection with deed-in-lieu of foreclosure and settlement agreement | | $ | 721,404 | | | $ | — | | | $ | — | |
| Non-cash assets transferred in connection with deed-in-lieu of foreclosure and settlement agreement | | $ | 2,776,447 | | | $ | — | | | $ | — | |
| Mortgages and liabilities transferred in connection with deed-in-lieu of foreclosure and settlement agreement | | $ | 2,378,324 | | | $ | — | | | $ | — | |
| Debt assumed by purchaser in sale of real estate | | $ | — | | | $ | — | | | $ | 103,621 | |
Supplemental cash flow disclosures
| | | | | | | | | | | | |
| Interest paid | | $ | 140,687 | | | $ | 205,441 | | | $ | 192,229 | |
| Income taxes paid | | $ | 955 | | | $ | 591 | | | $ | 513 | |
105
TABLE OF CONTENTS
Gramercy Capital Corp.
Notes To Consolidated Financial Statements
(Amounts in thousands, except share and per share data)
December 31, 2011
1. Business and Organization
Gramercy Capital Corp. (the “Company” or “Gramercy”) is a self-managed, integrated, commercial real estate finance and property management and investment company. The Company was formed in April 2004 and commenced operations upon the completion of its initial public offering in August 2004.
The Company’s commercial real estate finance business, which operates under the name Gramercy Finance, focuses on the direct origination, acquisition and portfolio management of whole loans, bridge loans, subordinate interests in whole loans, mezzanine loans, preferred equity, commercial mortgage-backed securities, or CMBS, and other real estate related securities. The Company’s property management and investment business, which operates under the name Gramercy Realty, focuses on third party property management of, and to a lesser extent, ownership and management of, commercial properties leased primarily to regulated financial institutions and affiliated users throughout the United States. Neither Gramercy Finance nor Gramercy Realty is a separate legal entity but are divisions of the Company through which the Company’s commercial real estate finance and property management and investment businesses are conducted.
Substantially all of the Company’s operations are conducted through GKK Capital LP, a Delaware limited partnership, or the Operating Partnership. The Company, as the sole general partner, has responsibility and discretion in the management and control of the Operating Partnership. Accordingly, the Company consolidates the accounts of the Operating Partnership. The Company qualified as a real estate investment trust, or REIT, under the Internal Revenue Code of 1986, as amended, or the Internal Revenue Code, commencing with its taxable year ended December 31, 2004 and the Company expects to qualify for the current fiscal year. To maintain the Company’s qualification as a REIT, the Company plans to distribute at least 90% of taxable income, if any. The Operating Partnership conducts its finance business primarily through the use of two private REITs, Gramercy Investment Trust and Gramercy Investment Trust II, and its commercial real estate investment and property management business through various other wholly owned entities.
During 2011, the Company remained focused on improving its consolidated balance sheet by reducing leverage, generating liquidity from existing assets, actively managing portfolio credit, and accretively re-investing repayments in loan and CMBS investments within our CDOs. The Company also sought to extend or restructure Gramercy Realty’s $240.5 million mortgage loan with Goldman Sachs Mortgage Company, or GSMC, Citicorp North America, Inc., or Citicorp, and SL Green Realty Corp., or SL Green, or the Goldman Mortgage Loan, and Gramercy Realty’s $549.7 million senior and junior mezzanine loans with KBS Real Estate Investment Trust, Inc., or KBS, GSMC, Citicorp and SL Green, or the Goldman Mezzanine Loans. The Goldman Mortgage Loan was collateralized by approximately 195 properties held by Gramercy Realty and the Goldman Mezzanine Loans were collateralized by the equity interest in substantially all of the entities comprising the Company’s Gramercy Realty division, including its cash and cash equivalents. Subsequent to the final maturity of the Goldman Mortgage Loan and the Goldman Mezzanine Loans, the Company entered into a series of short term extensions to provide additional time to exchange and consider proposals for an extension, modification, restructuring or refinancing of the Goldman Mortgage Loan and the Goldman Mezzanine Loans and to explore an orderly transition of the collateral to the lenders if such discussions failed. On May 9, 2011, the Company announced that the scheduled maturity of the Goldman Mortgage Loan and the Goldman Mezzanine Loans occurred without repayment and without an extension or restructuring of the loans by the lenders.
Notwithstanding the maturity and non-repayment of the loans, the Company maintained active communications with the lenders and in September 2011, the Company entered into a collateral transfer and settlement agreement, or the Settlement Agreement, for an orderly transition of substantially all of Gramercy Realty’s assets to KBS, Gramercy Realty’s senior mezzanine lender, in full satisfaction of Gramercy Realty’s obligations with respect to the Goldman Mortgage Loan and the Goldman Mezzanine Loans, in exchange for a mutual release of claims among the Company and the mortgage and mezzanine lenders and, subject to
106
TABLE OF CONTENTS
Gramercy Capital Corp.
Notes To Consolidated Financial Statements
(Amounts in thousands, except share and per share data)
December 31, 2011
1. Business and Organization – (continued)
certain termination provisions, the Company’s continued management of Gramercy Realty’s assets on behalf of KBS for a fixed fee plus incentive fees. On September 1, 2011 and on December 1, 2011, the Company transferred to KBS or its affiliates, interests in entities owning 317 and 116, respectively, of the 867 Gramercy Realty properties that it agreed to transfer pursuant to the Settlement Agreement and the remaining ownership interests were transferred to KBS by December 15, 2011. The aggregate carrying value for the interests transferred to KBS was $2,631,902. In July 2011, the Dana portfolio, which consisted of 15 properties totaling approximately 3.8 million rentable square feet, was transferred to its mortgage lender through a deed in lieu of foreclosure. For further discussion of the impact of the Settlement Agreement and the transfer of the Dana portfolio, see Settlement and Extinguishment of Debt within Note 2 of these consolidated financial statements.
Subsequent to the execution of the Settlement Agreement, the business of Gramercy Realty has changed from being primarily an owner of commercial properties to being primarily a third-party manager of commercial properties. The scale of Gramercy Realty’s revenues has declined as a substantial portion of rental revenues from properties owned by the Company, have been replaced with fee revenues of a substantially smaller scale for managing properties on behalf of KBS. Additionally, as assets were transferred to KBS, the Company’s total assets and liabilities declined substantially.
In September 2011, the Company entered into an asset management arrangement upon the terms and conditions set forth in the Settlement Agreement, or the Interim Management Agreement, to provide for the Company’s continued management of Gramercy Realty’s assets through December 31, 2013 for a fixed fee of $10,000 annually, the reimbursement of certain costs and incentive fees equal to 10.0% of the excess of the equity value, if any, of the transferred collateral over $375,000 plus all new capital invested into the transferred collateral by KBS, its affiliates and/or joint venture partners, or the Threshold Value Participation, and 12.5% of the excess equity value, if any, of the transferred collateral over $468,500 plus all new capital invested into the transferred collateral by KBS, its affiliates and/or joint venture partners, or the Excess Value Participation. The minimum amount of the Threshold Value Participation equals $3,500. The Threshold Value Participation and the Excess Value Participation will be valued and paid following the earlier of December 13, 2013, subject to extension to no later than December 31, 2015, or the sale by KBS of at least 90% (by value) of the transferred collateral. Under the terms of the Interim Management Agreement, the Company does not forfeit its incentive fee rights unless the Company resigns as manager or is terminated as manager for cause and, with respect to the Excess Value Participation, in the event of a Failure to Agree Termination (as defined below). The Settlement Agreement obligates the parties to negotiate in good faith to replace the Interim Management Agreement with a more complete and definitive management services agreement on or before March 31, 2012 and provides that if the parties fail to complete a definitive agreement, the Interim Management Agreement will terminate by its terms on June 30, 2012, or a Failure to Agree Termination. The Company promptly commenced and continues to seek to negotiate a more complete and definitive agreement with KBS not later than March 31, 2012, but there can be no assurance a Failure to Agree Termination will not occur notwithstanding the Company’s efforts.
The Company relies on the credit and equity markets to finance and grow its business. Despite signs of improvement in 2011, market conditions remained difficult for the Company with limited, if any, availability of new debt or equity capital. The Company’s stock price has remained low and it currently has limited, if any, access to the public or private equity capital markets. In this environment, the Company has sought to raise capital or maintain liquidity through other means, such as modifying debt arrangements, selling assets and aggressively managing its loan portfolio to encourage repayments, as well as reducing capital and overhead expenses and as a result, has engaged in limited new investment activity, other than reinvestment of available restricted cash within the Company’s CDOs. Nevertheless, the Company remains committed to identifying and pursuing strategies and transactions that could preserve or improve cash flows from its CDOs,
107
TABLE OF CONTENTS
Gramercy Capital Corp.
Notes To Consolidated Financial Statements
(Amounts in thousands, except share and per share data)
December 31, 2011
1. Business and Organization – (continued)
increase the Company’s net asset value per share of common stock, improve the Company’s future access to capital or otherwise potentially create value for the Company’s stockholders.
In June 2011, the Company’s Board of Directors established a special committee to direct and oversee an exploration of strategic alternatives available to the Company subsequent to the execution of the Settlement Agreement for the Gramercy Realty’s assets. The special committee is considering the feasibility of raising debt or equity capital, a strategic combination of the Company, strategic sale of our assets, or modifying our business plan. At the direction of the special committee, the Company engaged Wells Fargo Securities, LLC to act as its financial advisor to assist in the process.
As of December 31, 2011, Gramercy Finance held loans and other lending investments and CMBS of $1,857,731 net of unamortized fees, discounts, asset sales, unfunded commitments reserves for loan losses and other adjustments, with an average spread to 30-day LIBOR of 354 basis points for its floating rate investments, and an average yield of approximately 8.48% for its fixed rate investments. As of December 31, 2011, Gramercy Finance also held interests in one credit tenant net lease investment, or CTL investment and seven interests in real estate acquired through foreclosures.
As of December 31, 2011, Gramercy Realty’s portfolio consisted of 41 bank branches and 15 office buildings aggregating 752,816 rentable square feet. As of December 31, 2011, the occupancy of Gramercy Realty’s consolidated properties was 39.2%. The weighted average remaining term of the leases in Gramercy Realty’s consolidated portfolio was 7.1 years. Approximately 15.9% of its contractual rent was derived from leases with financial institution tenants. Gramercy Realty’s two largest tenants are Bank of America and Wells Fargo Bank and as of December 31, 2011, they represented approximately 42.3% and 15.9%, respectively, of the rental income of the Company’s portfolio which includes properties classified as discontinued operations and occupied approximately 9.2% and 7.7%, respectively, of Gramercy Realty’s total rentable square feet.
2. Significant Accounting Policies
Reclassification
Certain prior year balances have been reclassified to conform with the current year presentation for assets classified as discontinued operations.
Principles of Consolidation
The consolidated financial statements include the Company’s accounts and those of the Company’s subsidiaries which are wholly-owned or controlled by the Company, or entities which are variable interest entities, or VIE, in which the Company is the primary beneficiary. The primary beneficiary is the party that absorbs a majority of the VIE’s anticipated losses and/or a majority of the expected returns. The Company has evaluated its investments for potential classification as variable interests by evaluating the sufficiency of each entity’s equity investment at risk to absorb losses, and determined that the Company is the primary beneficiary for three VIE and has included the accounts of this entity in the consolidated financial statements.
Entities which the Company does not control and entities which are VIEs, but where the Company is not the primary beneficiary, are accounted for under the equity method. All significant intercompany balances and transactions have been eliminated.
108
TABLE OF CONTENTS
Gramercy Capital Corp.
Notes To Consolidated Financial Statements
(Amounts in thousands, except share and per share data)
December 31, 2011
2. Significant Accounting Policies – (continued)
Variable Interest Entities
The following is a summary of the Company’s involvement with VIEs as of December 31, 2011:
| | | | | | | | |
| | Company
carrying
value – assets | | Company
carrying
value – liabilities | | Face value of
assets held by
the VIE | | Face value of
liabilities issued
by the VIE |
Consolidated VIEs
| | | | | | | | | | | | | | | | |
| Collateralized debt obligations | | $ | 1,990,922 | | | $ | 2,654,109 | | | $ | 2,927,748 | | | $ | 2,880,953 | |
Unconsolidated VIEs
| | | | | | | | | | | | | | | | |
| CMBS-controlling class | | $ | — | (1) | | $ | — | | | $ | 624,592 | | | $ | 624,592 | |
| (1) | CMBS are assets held by the collateralized debt obligations classified on the Consolidated Balance Sheets as an Asset of Consolidated VIEs. |
The following is a summary of the Company’s involvement with VIEs as of December 31, 2010:
| | | | | | | | |
| | Company
carrying
value – assets | | Company
carrying
value – liabilities | | Face value of
assets held by
the VIE | | Face value of
liabilities issued
by the VIE |
Consolidated VIEs
| | | | | | | | | | | | | | | | |
| Collateralized debt obligations | | $ | 2,387,513 | | | $ | 2,851,912 | | | $ | 3,103,990 | | | $ | 3,063,802 | |
Unconsolidated VIEs
| | | | | | | | | | | | | | | | |
| CMBS-controlling class | | $ | — (1) | | | $ | — | | | $ | 633,654 | | | $ | 633,654 | |
| (1) | CMBS are assets held by the collateralized debt obligations classified on the Consolidated Balance Sheets as an Asset of Consolidated VIEs. |
Consolidated VIEs
As of December 31, 2011, the consolidated balance sheet includes $1,990,922 of assets and $2,654,109 of liabilities related to three consolidated VIEs. Due to the non-recourse nature of these VIEs, and other factors discussed below, the Company’s net exposure to loss from investments in these entities is limited to its beneficial interests in these VIEs.
Collateralized Debt Obligations
The Company currently consolidates three collateralized debt obligations, or CDOs, which are VIEs. These CDOs invest in commercial real estate debt instruments, the majority of which the Company originated within the CDOs, and are financed by the debt and equity issued. The Company is named as collateral manager of all three CDOs. As a result of consolidation, the Company’s subordinate debt and equity ownership interests in these CDOs have been eliminated, and the consolidated balance sheets reflect both the assets held and debt issued by these CDOs to third parties. Similarly, the operating results and cash flows include the gross amounts related to the assets and liabilities of the CDOs, as opposed to the Company’s net economic interests in these CDOs. Refer to Note 8 for further discussion of fees earned related to the management of the CDOs.
The Company’s interest in the assets held by these CDOs is restricted by the structural provisions of these entities, and the recovery of these assets will be limited by the CDOs’ distribution provisions, which are subject to change due to non-compliance with covenants, which are described further in Note 8. The liabilities of the CDO trusts are non-recourse, and can generally only be satisfied from the respective asset pool of each CDO.
109
TABLE OF CONTENTS
Gramercy Capital Corp.
Notes To Consolidated Financial Statements
(Amounts in thousands, except share and per share data)
December 31, 2011
2. Significant Accounting Policies – (continued)
The Company is not obligated to provide any financial support to these CDOs. As of December 31, 2011, the Company has no exposure to loss as a result of the investment in these CDOs. Since the Company is the collateral manager of the three CDOs and can make decisions related to the collateral that would most significantly impact the economic outcome of the CDOs, the Company has concluded that it is the primary beneficiary of the CDOs.
Unconsolidated VIEs
Investment in CMBS
The Company has investments in certain CMBS, which are considered to be VIEs. These securities were acquired through investment, and are primarily comprised of securities that were originally investment grade securities, and do not represent a securitization or other transfer of the Company’s assets. The Company is not named as the special servicer or collateral manager of these investments, except as discussed further below.
The Company is not obligated to provide, nor has it provided, any financial support to these entities. Substantially all of the Company’s securities portfolio, with an aggregate face amount of $1,244,886, is financed by the Company’s CDOs, and the Company’s exposure to loss is therefore limited to its interests in these consolidated entities described above. The Company has not consolidated the aforementioned CMBS investments due to the determination that based on the structural provisions and nature of each investment, the Company does not directly control the activities that most significantly impact the VIEs’ economic performance.
The Company further analyzed its investment in controlling class CMBS to determine if it was the primary beneficiary. At December 31, 2011, the Company owned securities of one controlling non-investment grade CMBS investment, GS Mortgage Securities Trust 2007-GKK1, or the Trust, with a carrying value of $0. The total par amount of the investment is $624,592 at December 31, 2011. The total par amount of CMBS issued by the Trust was $633,654.
The Trust is a resecuritization of $633,654 of CMBS originally rated AA through BB. The Company purchased a portion of the below investment grade securities, totaling approximately $21,879. The Manager is the collateral administrator on the transaction and receives a total fee of 5.5 basis points on the par value of the underlying collateral. The Company has determined that it is the non-transferor sponsor of the Trust. As collateral administrator, the Manager has the right to purchase defaulted securities from the Trust at fair value if very specific triggers have been reached. The Company has no other rights or obligations that could impact the economics of the Trust and therefore has concluded that it is not the primary beneficiary. The Manager can be removed as collateral administrator, for cause only, with the vote of 66 2/3% of the certificate holders. There are no liquidity facilities or financing agreements associated with the Trust. Neither the Company nor the Manager has any on-going financial obligations, including advancing, funding or purchasing collateral in the Trust.
The Company’s maximum exposure to loss as a result of its investment in controlling class CMBS totaled $0, which equals the book value of these investments as of December 31, 2011.
Real Estate and CTL Investments
The Company records acquired real estate and CTL investments at cost. Costs directly related to the acquisition of such investments are capitalized. Certain improvements are capitalized when they are determined to increase the useful life of the building. Depreciation is computed using the straight-line method over the shorter of the estimated useful life of the capitalized item or 40 years for buildings, five to ten years for building equipment and fixtures, and the lesser of the useful life or the remaining lease term for tenant improvements and leasehold interests. Maintenance and repair expenditures are charged to expense as incurred.
110
TABLE OF CONTENTS
Gramercy Capital Corp.
Notes To Consolidated Financial Statements
(Amounts in thousands, except share and per share data)
December 31, 2011
2. Significant Accounting Policies – (continued)
In leasing office space, the Company may provide funding to the lessee through a tenant allowance. In accounting for tenant allowances, the Company determines whether the allowance represents funding for the construction of leasehold improvements and evaluates the ownership of such improvements. If the Company is considered the owner of the leasehold improvements, the Company capitalizes the amount of the tenant allowance and depreciates it over the shorter of the useful life of the leasehold improvements or the lease term.
If the tenant allowance represents a payment for a purpose other than funding leasehold improvements, or in the event the Company is not considered the owner of the improvements for accounting purposes, the allowance is considered to be a lease incentive and is recognized over the lease term as a reduction of rental revenue. Factors considered during this evaluation usually include (i) who holds legal title to the improvements, (ii) evidentiary requirements concerning the spending of the tenant allowance, and (iii) other controlling rights provided by the lease agreement (e.g. unilateral control of the tenant space during the build-out process). Determination of the accounting for a tenant allowance is made on a case-by-case basis, considering the facts and circumstances of the individual tenant lease.
The Company also reviews the recoverability of the property’s carrying value when circumstances indicate a possible impairment of the value of a property. The review of recoverability is based on an estimate of the future undiscounted cash flows, excluding interest charges, expected to result from the property’s use and eventual disposition. These estimates consider factors such as changes in strategy resulting in an increased or decreased holding period, expected future operating income, market and other applicable trends and residual value, as well as the effects of leasing demand, competition and other factors. If management determines impairment exists due to the inability to recover the carrying value of a property, an impairment loss is recorded to the extent that the carrying value exceeds the estimated fair value of the property for properties to be held and used and for assets held for sale, an impairment loss is recorded to the extent that the carrying value exceeds the fair value less estimated cost to dispose for assets held for sale.
These assessments are recorded as an impairment loss in the consolidated statement of operations in the period the determination is made. The estimated fair value of the asset becomes its new cost basis. For a depreciable long-lived asset, the new cost basis will be depreciated or amortized over the remaining useful life of that asset.
During 2011, the Company recorded impairment charges for properties classified as held for investment of $1,237. These properties were reclassified as discontinued operations as part of the settlement agreement.
During 2010, the Company recorded impairment charges of $933,884 related to its investments in real estate, including $85,294 of impairments on intangible assets. Impairment charges for properties classified as held for investment were $913,648 and $20,236 has been recorded on properties reclassified as discontinued operations. The Company recorded impairment charges totaling $912,147 in continuing operations during 2010 to reduce the carrying value of 692 properties to the estimated fair value. All of the impaired properties served as collateral for the Goldman Mezzanine Loans and were part of the Gramercy Realty portfolio. The Company also recorded impairment charges on three leasehold properties totaling $1,501 based on the difference between estimated cash flow shortfalls over the sub-tenants’ lease term. No other real estate assets in the portfolio were determined to be impaired as of December 31, 2010 as a result of the analysis. The estimated fair values for the properties serving as collateral for the Goldman Mezzanine loans were calculated using discounted cash flows based on internally developed models and residual values calculated with capitalization rates utilizing a study completed by a third party property management provider for similar types of buildings. The Company used a range of possible future outcomes or a probability-weighted approach to determine the proper timing of the impairment. The Company determined that, as of December 31, 2010,
111
TABLE OF CONTENTS
Gramercy Capital Corp.
Notes To Consolidated Financial Statements
(Amounts in thousands, except share and per share data)
December 31, 2011
2. Significant Accounting Policies – (continued)
based on the likelihood of the range of possible outcomes and the probability-weighted cash flows, its investments in real estate were impaired.
During 2009, the Company recorded impairment charges of $43,440 related to its investments in real estate. Impairment charges for properties classified as held for investment were $18,932 and $24,507 has been recorded on properties reclassified as discontinued operations. The Company recorded impairment charges totaling $18,870 in continuing operations during 2009 to reduce the carrying value of the properties to their estimated fair value. The Company also recorded impairment charges on one leasehold property totaling $62 based on the difference between estimated cash flow shortfalls over the sub-tenant’s lease term. The estimated fair values for the properties was calculated using discounted cash flows based on internally developed models and residual values calculated with capitalization rates.
The Company allocates the purchase price of real estate to land, building and intangibles, such as the value of above- and below-market leases and origination costs associated with the leases in-place at the acquisition date.
Leasehold Interests
Leasehold interest liabilities are recorded based on the difference between management’s estimate of the cash flows expected to be paid and earned from the subleases over the non-cancelable lease terms and any payments received in consideration for assuming the leasehold interests. Factors used in determining the net present value of cash flows include contractual rental amounts and amounts due under the corresponding operating lease assumed. Amounts allocated to leasehold interests, based on their respective fair values, are amortized on a straight-line basis over the remaining lease term.
Investments in Unconsolidated Joint Ventures
The Company accounts for its investments in unconsolidated joint ventures under the equity method of accounting since it exercises significant influence, but does not unilaterally control the entities, and is not considered to be the primary beneficiary. In the joint ventures, the rights of the other investors are protective and participating. Unless the Company is determined to be the primary beneficiary, these rights preclude it from consolidating the investments. The investments are recorded initially at cost as an investment in unconsolidated joint ventures, and subsequently are adjusted for equity in net income (loss) and cash contributions and distributions. Any difference between the carrying amount of the investments on the Company’s balance sheet and the underlying equity in net assets is evaluated for impairment at each reporting period. None of the joint venture debt is recourse to the Company. As of December 31, 2011 and 2010, the Company had investments of $496 and $3,650 in unconsolidated joint ventures, respectively.
Cash and Cash Equivalents
The Company considers all highly liquid investments with maturities of three months or less when purchased to be cash equivalents.
Restricted Cash
Restricted cash at December 31, 2011 consists of $34,122 on deposit with the trustee of the Company’s collateralized debt obligations, or CDOs. The remaining balance consists of $8,517, which includes $8,424 related to assets held for sale, which represents amounts escrowed pursuant to mortgage agreements securing the Company’s real estate investments and CTL investments for insurance, taxes, repairs and maintenance, tenant improvements, interest, and debt service and amounts held as collateral under security and pledge agreements relating to leasehold interests.
112
TABLE OF CONTENTS
Gramercy Capital Corp.
Notes To Consolidated Financial Statements
(Amounts in thousands, except share and per share data)
December 31, 2011
2. Significant Accounting Policies – (continued)
Assets Held for Sale
Real Estate and CTL Investments Held for Sale
Real estate investments or CTL investments to be disposed of are reported at the lower of carrying amount or estimated fair value, less cost to sell. Once an asset is classified as held for sale, depreciation expense is no longer recorded and current and prior periods are reclassified as “discontinued operations.” As of December 31, 2011 and 2010, the Company had real estate investments held for sale of $42,965 and $28,660, respectively. The Company recorded impairment charges of $1,237, $20,236 and $24,507 during the years ended December 31, 2011, 2010 and 2009, respectively, related to real estate investments classified as held-for-sale.
Loans and Other Lending Investments Held for Sale
Loans held for investment are intended to be held to maturity and, accordingly, are carried at cost, net of unamortized loan origination fees, discounts, repayments, sales of partial interests in loans, and unfunded commitments unless such loan or investment is deemed to be impaired. Loans held for sale are carried at the lower of cost or market value using available market information obtained through consultation with dealers or other originators of such investments.
As of December 31, 2011 and 2010, the Company had no loans and other lending investments designated as held-for-sale. The Company recorded impairment charges of $0, $2,000 and $138,570, related to the mark-to-market of the loans designated as held-for-sale during the years ended December 31, 2011, 2010 and 2009, respectively.
Settlement and Extinguishment of Debt
A gain on settlement of debt is recorded when the carrying amount of the liability settled exceeds the fair value of the assets transferred to the lender or special servicer in accordance with GAAP. Pursuant to the execution of the Settlement Agreement, the transfer of 867 Gramercy Realty properties, with an aggregate carrying value of $2,631,902 and associated mortgage, mezzanine and other liabilities of $2,843,345, occurred in September and December 2011 and the Company recognized a gain on settlement of debt of $211,443 in connection with such transfer as part of discontinued operations on the Consolidated Statement of Operations. The gain on settlement of debt includes $54,083 of gain on disposal of assets. During the year ended December 31, 2011, the Company recorded $2,489 of legal and professional fees related to the restructuring of the Goldman Mortgage Loan and the Goldman Mezzanine Loans in the Consolidated Statement of Operations.
In July 2011, the Dana portfolio, which consisted of 15 properties totaling approximately 3.8 million rentable square feet, was transferred to its mortgage lender through a deed in lieu of foreclosure. The Company recognized gain on settlement of debt of $74,191 for each of the three and nine months ended September 30, 2011 as part of discontinued operations on the Condensed Consolidated Statement of Operations. The Company realized a $15,892 gain on the disposal the assets, which is included in the gain on settlement of debt.
During the year ended December 31, 2011 and 2010, the Company repurchased, at a discount, $49,259 and $39,000, respectively, of notes previously issued by the Company’s CDOs, and recorded a net gain on the early extinguishment of debt of $15,275 and $19,443 for the years ended December 31, 2011 and 2010, respectively.
113
TABLE OF CONTENTS
Gramercy Capital Corp.
Notes To Consolidated Financial Statements
(Amounts in thousands, except share and per share data)
December 31, 2011
2. Significant Accounting Policies – (continued)
Commercial Mortgage-Backed Securities
The Company designates its CMBS investments on the date of acquisition of the investment. Held to maturity investments are stated at cost plus any premiums or discounts which are amortized through the consolidated statement of operations using the level yield method. CMBS securities that the Company does not hold for the purpose of selling in the near-term but may dispose of prior to maturity, are designated as available-for-sale and are carried at estimated fair value with the net unrealized gains or losses recorded as a component of accumulated other comprehensive income (loss) in stockholders’ equity. Upon the disposition of a CMBS investment designated as available for sale, the unrealized gain or loss recognized in accumulated other comprehensive income is reversed. A realized gain or loss is computed by comparing the amortized cost of the CMBS investment sold to the cash proceeds received, and the resultant gain or loss is recorded in other income on the Consolidated Statement of Operations. Unrealized losses that are, in the judgment of management, an other-than-temporary impairment are bifurcated into (i) the amount related to credit losses and (ii) the amount related to all other factors. The evaluation includes a review of the credit status and the performance of the collateral supporting those securities, including key terms of the securities and the effect of local, industry and broader economic trends. The portion of the other-than-temporary impairment related to credit losses is computed by comparing the amortized cost of the investment to the present value of cash flows expected to be collected and is charged against earnings on the Consolidated Statement of Operations. The portion of the other-than-temporary impairment related to all other factors is recognized as a component of other comprehensive loss on the consolidated balance sheet. The determination of an other-than-temporary impairment is a subjective process, and different judgments and assumptions could affect the timing of loss realization.
On a quarterly basis, when significant changes in estimated cash flows from the cash flows previously estimated occur due to actual prepayment and credit loss experience, and the present value of the revised cash flow is less than the present value previously estimated, an other-than-temporary impairment is deemed to have occurred. The security is written down to fair value with the resulting charge against earnings and a new cost basis is established with the difference between the revised present value of cash flows and the security's fair value recognized as a component of other comprehensive loss on the Consolidated Balance Sheet.
The Company calculates a revised yield based on the current amortized cost of the investment (including any other-than-temporary impairments recognized to date) and the revised yield is then applied prospectively to recognize interest income. In January 2009, the FASB clarified the guidance for impairment by removing the requirement to place exclusive reliance on market participants’ assumptions about future cash flows when evaluating an asset for other-than-temporary impairment. The standard now requires that assumptions about future cash flows consider reasonable management judgment about the probability that the holder of an asset will be unable to collect all amounts due. As of December 31, 2011, 2010 and 2009, the Company recognized other-than-temporary impairments of $18,423, $37,453 and $12,511 respectively, due to adverse changes in expected cash flows related to credit losses for five, 14 and five CMBS investments, respectively, which are recorded in the Company’s Consolidated Statement of Operations.
The Company determines the fair value of CMBS based on the types of securities in which the Company has invested. For liquid, investment-grade securities, the Company consults with dealers of such securities to periodically obtain updated market pricing for the same or similar instruments. For non-investment grade securities, the Company actively monitors the performance of the underlying properties and loans and updates the Company’s pricing model to reflect changes in projected cash flows. The value of the securities is derived by applying discount rates to such cash flows based on current market yields. The yields employed are obtained from the Company’s own experience in the market, advice from dealers when available, and/or information obtained in consultation with other investors in similar instruments. Because fair value estimates,
114
TABLE OF CONTENTS
Gramercy Capital Corp.
Notes To Consolidated Financial Statements
(Amounts in thousands, except share and per share data)
December 31, 2011
2. Significant Accounting Policies – (continued)
when available, may vary to some degree, the Company must make certain judgments and assumptions about the appropriate price to use to calculate the fair values for financial reporting purposes. Different judgments and assumptions could result in materially different presentations of value.
During the year ended December 31, 2011, the Company sold eight CMBS investments for a realized gain of $15,126. During the year ended December 31, 2010, the Company sold nine CMBS investments for a realized loss of $294.
Tenant and Other Receivables
Tenant and other receivables are primarily derived from the rental income that each tenant pays in accordance with the terms of its lease, which is recorded on a straight-line basis over the initial term of the lease. Since many leases provide for rental increases at specified intervals, straight-line basis accounting requires the Company to record a receivable, and include in revenues, unbilled rent receivables that will only be received if the tenant makes all rent payments required through the expiration of the initial term of the lease. Tenant and other receivables also include receivables related to tenant reimbursements for common area maintenance expenses and certain other recoverable expenses that are recognized as revenue in the period in which the related expenses are incurred.
Tenant and other receivables are recorded net of the allowances for doubtful accounts, which as of December 31, 2011 and December 31, 2010, were $280 and $5,440, respectively. The Company continually reviews receivables related to rent, tenant reimbursements and unbilled rent receivables and determines collectability by taking into consideration the tenant’s payment history, the financial condition of the tenant, business conditions in the industry in which the tenant operates and economic conditions in the area in which the property is located. In the event that the collectability of a receivable is in doubt, the Company increases the allowance for doubtful accounts or records a direct write-off of the receivable in the consolidated statements of income.
Intangible Assets
The Company follows the purchase method of accounting for business combinations. The Company allocates the purchase price of acquired properties to tangible and identifiable intangible assets acquired based on their respective fair values. Tangible assets include land, buildings and improvements on an as-if vacant basis. The Company utilizes various estimates, processes and information to determine the as-if vacant property value. Estimates of value are made using customary methods, including data from appraisals, comparable sales, discounted cash flow analyses and other methods. Identifiable intangible assets include amounts allocated to acquired leases for above- and below-market lease rates and the value of in-place leases.
Above-market and below-market lease values for properties acquired are recorded based on the present value (using an interest rate which reflects the risks associated with the leases acquired) of the difference between the contractual amount to be paid pursuant to each in-place lease and management’s estimate of the fair market lease rate for each such in-place lease, measured over a period equal to the remaining non-cancelable term of the lease. The capitalized above-market lease values are amortized as a reduction of rental income over the remaining non-cancelable terms of the respective leases. The capitalized below-market lease values are amortized as an increase to rental income over the initial term of the respective leases. If a tenant vacates its space prior to the contractual termination of the lease and no rental payments are being made on the lease, any unamortized balance of the related intangible will be written off.
The aggregate value of intangible assets related to in-place leases is primarily the difference between the property valued with existing in-place leases adjusted to market rental rates and the property valued as-if vacant. Factors considered by management in its analysis of the in-place lease intangibles include an estimate of carrying costs during the expected lease-up period for each property taking into account current market
115
TABLE OF CONTENTS
Gramercy Capital Corp.
Notes To Consolidated Financial Statements
(Amounts in thousands, except share and per share data)
December 31, 2011
2. Significant Accounting Policies – (continued)
conditions and costs to execute similar leases. In estimating carrying costs, management includes real estate taxes, insurance and other operating expenses and estimates of lost rentals at market rates during the anticipated lease-up period, which is expected to average six months. Management also estimates costs to execute similar leases including leasing commissions, legal and other related expenses.
The value of in-place leases is amortized to expense over the initial term of the respective leases, which range primarily from one to 20 years. In no event does the amortization period for intangible assets exceed the remaining depreciable life of the building. If a tenant terminates its lease, the unamortized portion of the in-place lease value is charged to expense.
In making estimates of fair values for purposes of allocating purchase price, management utilizes a number of sources, including independent appraisals that may be obtained in connection with the acquisition or financing of the respective property and other market data. Management also considers information obtained about each property as a result of its pre-acquisition due diligence, as well as subsequent marketing and leasing activities, in estimating the fair value of the tangible and intangible assets acquired and intangible liabilities assumed.
Intangible assets and acquired lease obligations consist of the following:
| | | | |
| | December 31,
2011(1) | | December 31,
2010 |
Intangible assets:
| | | | | | | | |
In-place leases, net of accumulated amortization of $1,388
and $114,383 | | $ | 4,305 | | | $ | 248,021 | |
Above-market leases, net of accumulated amortization of $153
and $33,136 | | | 672 | | | | 67,732 | |
| Amounts related to assets held for sale, net of accumulated amortization of $1,199 and $0 | | | (4,500 | ) | | | — | |
| Total intangible assets | | $ | 477 | | | $ | 315,753 | |
Intangible liabilities:
| | | | | | | | |
Below-market leases, net of accumulated amortization of $1,469
and $223,282 | | $ | 3,207 | | | $ | 693,148 | |
| Amounts related to liabilities held for sale, net of accumulated amortization of $280 and $0 | | | (1,302 | ) | | | — | |
| Total intangible liabilities | | $ | 1,905 | | | $ | 693,148 | |
| (1) | Refer to footnote 5 of these consolidated financial statements for a further discussion of the impact of the settlement agreement. |
116
TABLE OF CONTENTS
Gramercy Capital Corp.
Notes To Consolidated Financial Statements
(Amounts in thousands, except share and per share data)
December 31, 2011
2. Significant Accounting Policies – (continued)
The following table provides the weighted-average amortization period as of December 31, 2011 for intangible assets and liabilities and the projected amortization expense for the next five years.
| | | | | | | | | | | | |
| | Weighted-
Average
Amortization
Period | | 2012 | | 2013 | | 2014 | | 2015 | | 2016 |
| In-Place Leases | | | 12.7 | | | $ | 51 | | | $ | 38 | | | $ | 38 | | | $ | 38 | | | $ | 38 | |
| Total to be included in Depreciation and Amorization Expense | | | | | | $ | 51 | | | $ | 38 | | | $ | 38 | | | $ | 38 | | | $ | 38 | |
| Above-Market Lease Assets | | | 16.2 | | | $ | 7 | | | $ | 7 | | | $ | 7 | | | $ | 7 | | | $ | 7 | |
| Below-Market Lease Liabilities | | | 14.2 | | | | (202 | ) | | | (166 | ) | | | (166 | ) | | | (166 | ) | | | (166 | ) |
Total to be included in Rental
Revenue | | | | | | $ | (195 | ) | | $ | (159 | ) | | $ | (159 | ) | | $ | (159 | ) | | $ | (159 | ) |
Deferred Costs
Deferred costs include deferred financing costs that represent commitment fees, legal and other third party costs associated with obtaining commitments for financing which result in a closing of such financing. These costs are amortized over the terms of the respective agreements and the amortization is reflected as interest expense. Unamortized deferred financing costs are expensed when the associated debt is refinanced or repaid before maturity. Costs incurred in seeking financing transactions that do not close are expensed in the period in which it is determined that the financing will not close. Deferred costs also consist of fees and direct costs incurred to originate new investments and are amortized using the effective yield method over the related term of the investment.
The Company has deferred certain expenditures related to the leasing of certain properties. Direct costs of leasing including internally capitalized payroll costs associated with leasing activities are deferred and amortized over the terms of the underlying leases.
Other Assets
The Company makes payments for certain expenses such as insurance and property taxes in advance of the period in which it receives the benefit. These payments are classified as other assets and amortized over the respective period of benefit relating to the contractual arrangement. The Company also escrows deposits related to pending acquisitions and financing arrangements, as required by a seller or lender, respectively. Costs prepaid in connection with securing financing for a property are reclassified into deferred financing costs at the time the transaction is completed.
Asset Retirement Obligation
Accounting for asset retirement obligations, refers to a legal obligation to perform an asset retirement activity in which the timing and (or) method of settlement are conditional on a future event that may or may not be within the control of the entity. The obligation to perform the asset retirement activity is unconditional even though uncertainty exists about the timing and (or) method of settlement. Thus, the timing and (or) method of settlement may be conditional on a future event. Accordingly, an entity is required to recognize a liability for the fair value of a conditional asset retirement obligation if the fair value of the liability can be reasonably estimated. The fair value of a liability for the conditional asset retirement obligation is recognized when incurred — generally upon acquisition, construction, or development and (or) through the normal operation of the asset.
The Company assessed the cost associated with its legal obligation to remediate asbestos in its properties known to contain asbestos and recorded the present value of the asset retirement obligation. As of
117
TABLE OF CONTENTS
Gramercy Capital Corp.
Notes To Consolidated Financial Statements
(Amounts in thousands, except share and per share data)
December 31, 2011
2. Significant Accounting Policies – (continued)
December 31, 2011 and December 31, 2010 the Company has recorded a liability of approximately $814 and $3,686, respectively. The Company recorded an expense of $139 of which $122 is within discontinued operations, $188, and $175 for the years ended December 31, 2011, 2010, and 2009, respectively.
Valuation of Financial Instruments
ASC 820-10, “Fair Value Measurements and Disclosures,” among other things, establishes a hierarchical disclosure framework associated with the level of pricing observability utilized in measuring financial instruments at fair value. Considerable judgment is necessary to interpret market data and develop estimated fair values. Accordingly, fair values are not necessarily indicative of the amounts the Company could realize on disposition of the financial instruments. Financial instruments with readily available active quoted prices or for which fair value can be measured from actively quoted prices generally will have a higher degree of pricing observability and will require a lesser degree of judgment to be utilized in measuring fair value. Conversely, financial instruments rarely traded or not quoted will generally have less, or no, pricing observability and will require a higher degree of judgment to be utilized in measuring fair value. Pricing observability is generally affected by such items as the type of financial instrument, whether the financial instrument is new to the market and not yet established, the characteristics specific to the transaction and overall market conditions. The use of different market assumptions and/or estimation methodologies may have a material effect on estimated fair value amounts.
Fair value is defined as the price that would be received to sell an asset or paid to transfer a liability in an orderly transaction between market participants at the measurement date, or an exit price. The level of pricing observability generally correlates to the degree of judgment utilized in measuring the fair value of financial instruments. The less judgment utilized in measuring fair value financial instruments such as with readily available active quoted prices or for which fair value can be measured from actively quoted prices in active markets generally have more pricing observability. Conversely, financial instruments rarely traded or not quoted have less observability and are measured at fair value using valuation models that require more judgment. Impacted by a number of factors, pricing observability is generally affected by such items as the type of financial instrument, whether the financial instrument is new to the market and not yet established, the characteristics specific to the transaction and overall market conditions.
The three broad levels defined are as follows:
Level I — This level is comprised of financial instruments that have quoted prices that are available in active markets for identical assets or liabilities. The type of financial instruments included in this category are highly liquid instruments with quoted prices.
Level II — This level is comprised of financial instruments that have pricing inputs other than quoted prices in active markets that are either directly or indirectly observable. The nature of these financial instruments includes instruments for which quoted prices are available but traded less frequently and instruments that are fair valued using other financial instruments, the parameters of which can be directly observed.
Level III — This level is comprised of financial instruments that have little to no pricing observability as of the reported date. These financial instruments do not have active markets and are measured using management’s best estimate of fair value, where the inputs into the determination of fair value require significant management judgment and assumptions. Instruments that are generally included in this category are derivatives, whole loans, subordinate interests in whole loans and mezzanine loans.
For a further discussion regarding the measurement of financial instruments see Note 13, “Fair Value of Financial Instruments.”
118
TABLE OF CONTENTS
Gramercy Capital Corp.
Notes To Consolidated Financial Statements
(Amounts in thousands, except share and per share data)
December 31, 2011
2. Significant Accounting Policies – (continued)
Revenue Recognition
Real Estate and CTL Investments
Rental income from leases is recognized on a straight-line basis regardless of when payments are contractually due. Certain lease agreements also contain provisions that require tenants to reimburse the Company for real estate taxes, common area maintenance costs and the amortized cost of capital expenditures with interest. Such amounts are included in both revenues and operating expenses when the Company is the primary obligor for these expenses and assumes the risks and rewards of a principal under these arrangements. Under leases where the tenant pays these expenses directly, such amounts are not included in revenues or expenses.
Deferred revenue represents rental revenue and management fees received prior to the date earned. Deferred revenue also includes rental payments received in excess of rental revenues recognized as a result of straight-line basis accounting.
Other income includes fees paid by tenants to terminate their leases, which are recognized when fees due are determinable, no further actions or services are required to be performed by the Company, and collectability is reasonably assured. In the event of early termination, the unrecoverable net book values of the assets or liabilities related to the terminated lease are recognized as depreciation and amortization expense in the period of termination.
The Company recognizes sales of real estate properties only upon closing. Payments received from purchasers prior to closing are recorded as deposits. Profit on real estate sold is recognized using the full accrual method upon closing when the collectability of the sale price is reasonably assured and the Company is not obligated to perform significant activities after the sale. Profit may be deferred in whole or part until the sale meets the requirements of profit recognition on sale of real estate.
Finance Investments
Interest income on debt investments, which includes loan and CMBS investments, are recognized over the life of the investments using the effective interest method and recognized on the accrual basis. Fees received in connection with loan commitments are deferred until the loan is funded and are then recognized over the term of the loan using the effective interest method.
Anticipated exit fees, whose collection is expected, are also recognized over the term of the loan as an adjustment to yield. Fees on commitments that expire unused are recognized at expiration. Fees received in exchange for the credit enhancement of another lender, either subordinate or senior to the Company, in the form of a guarantee are recognized over the term of that guarantee using the straight-line method.
Income recognition is generally suspended for debt investments at the earlier of the date at which payments become 90 days past due or when, in the opinion of management, a full recovery of income and principal becomes doubtful. Income recognition is resumed when the loan becomes contractually current and performance is demonstrated to be resumed.
The Company designates loans as non-performing at such time as: (1) the loan becomes 90 days delinquent or (2) the loan has a maturity default. All non-performing loans are placed on non-accrual status and subsequent cash receipts are applied to principal or recognized as income when received. At December 31, 2011, the Company had one whole loan with a carrying value of $51,417 and two mezzanine loans with an aggregate carrying value of $0, which were classified as non-performing loans. At December 31, 2010, the Company had one second lien loan with a carrying value of $0 and one third lien loan with a carrying value of $0, which were classified as non-performing loans.
119
TABLE OF CONTENTS
Gramercy Capital Corp.
Notes To Consolidated Financial Statements
(Amounts in thousands, except share and per share data)
December 31, 2011
2. Significant Accounting Policies – (continued)
The Company classifies loans as sub-performing if they are not performing in material accordance with their terms, but they do not qualify as non-performing loans and the specific facts and circumstances of these loans may cause them to develop into non-performing loans should certain events occur in the normal passage of time, which the Company considers to be 90 days from the measurement date. At December 31, 2011, two whole loans with an aggregate carrying value of $44,555 and one preferred equity investment with a carrying value of $1,295 were classified as sub-performing. At December 31, 2010, one first mortgage loan with a carrying value of $13,222 and two mezzanine loans with an aggregate carrying value of $9,826 were classified as sub-performing.
For the years ended December 31, 2011, 2010 and 2009, the Company recognized $0, $1,482 and $0, respectively, in net gains from the sale of debt investments or commitments.
Reserve for Loan Losses
Specific valuation allowances are established for loan losses on loans in instances where it is deemed probable that the Company may be unable to collect all amounts of principal and interest due according to the contractual terms of the loan. The reserve is increased through the provision for loan losses on the consolidated statement of operations and is decreased by charge-offs when losses are realized through sale, foreclosure, or when significant collection efforts have ceased.
The Company considers the present value of payments expected to be received, observable market prices or the estimated fair value of the collateral (for loans that are dependent on the collateral for repayment), and compares it to the carrying value of the loan. The determination of the estimated fair value is based on the key characteristics of the collateral type, collateral location, quality and prospects of the sponsor, the amount and status of any senior debt, and other factors. The Company also includes the evaluation of operating cash flow from the property during the projected holding period, and the estimated sales value of the collateral computed by applying an expected capitalization rate to the stabilized net operating income of the specific property, less selling costs, all of which are discounted at market discount rates. The Company also considers if the loan’s terms have been modified in a troubled debt restructuring. Because the determination of estimated value is based upon projections of future economic events, which are inherently subjective, amounts ultimately realized from loans and investments may differ materially from the carrying value at the balance sheet date.
If, upon completion of the valuation, the estimated fair value of the underlying collateral securing the loan is less than the net carrying value of the loan, an allowance is created with a corresponding charge to the provision for loan losses. The allowance for each loan is maintained at a level the Company believes is adequate to absorb losses. During the year ended December 31, 2011, the Company incurred charge-offs totaling $66,856 relating to realized losses on five loans. During the year ended December 31, 2010, the Company incurred charge-offs totaling $239,078 relating to realized losses on ten loans. The Company maintained a reserve for loan losses of $244,840 against 15 separate investments with an aggregate carrying value of $294,083 as of December 31, 2011, and a reserve for loan losses of $263,516 against 19 separate investments with an aggregate carrying value of $438,541 as of December 31, 2010.
Rent Expense
Rent expense is recognized on a straight-line basis regardless of when payments are due. Accounts payable and accrued expenses in the accompanying consolidated balance sheet as of December 31, 2011 and 2010 includes an accrual for rental expense recognized in excess of amounts due at that time. Rent expense related to leasehold interests is included in property operating expenses, and rent expense related to office rentals is included in management, general and administrative expense.
120
TABLE OF CONTENTS
Gramercy Capital Corp.
Notes To Consolidated Financial Statements
(Amounts in thousands, except share and per share data)
December 31, 2011
2. Significant Accounting Policies – (continued)
Stock-Based Compensation Plans
The Company has a stock-based compensation plan, described more fully in Note 14. The Company accounts for this plan using the fair value recognition provisions.
The Company uses the Black-Scholes option-pricing model to estimate the fair value of a stock option award. This model requires inputs such as expected term, expected volatility, and risk-free interest rate. Further, the forfeiture rate also impacts the amount of aggregate compensation cost. These inputs are highly subjective and generally require significant analysis and judgment to develop.
Compensation cost for stock options, if any, is recognized ratably over the vesting period of the award. The Company’s policy is to grant options with an exercise price equal to the quoted closing market price of its stock on the business day preceding the grant date. Awards of stock or restricted stock are expensed as compensation over the benefit period.
The fair value of each stock option granted is estimated on the date of grant for options issued to employees, and quarterly awards to non-employees, using the Black-Scholes option pricing model with the following weighted average assumptions for grants in 2011 and 2010.
| | | | |
| | 2011 | | 2010 |
| Dividend yield | | | 5.9% | | | | 5.7% | |
| Expected life of option | | | 5.0 years | | | | 5.0 years | |
| Risk free interest rate | | | 2.02% | | | | 2.65% | |
| Expected stock price volatility | | | 105.0% | | | | 75.0% | |
Derivative Instruments
In the normal course of business, the Company uses a variety of derivative instruments to manage, or hedge, interest rate risk. The Company requires that hedging derivative instruments be effective in reducing the interest rate risk exposure that they are designated to hedge. This effectiveness is essential for qualifying for hedge accounting. Instruments that meet these hedging criteria are formally designated as hedges at the inception of the derivative contract. The Company uses a variety of commonly used derivative products that are considered “plain vanilla” derivatives. These derivatives typically include interest rate swaps, caps, collars and floors. The Company expressly prohibits the use of unconventional derivative instruments and using derivative instruments for trading or speculative purposes. Further, the Company has a policy of only entering into contracts with major financial institutions based upon their credit ratings and other factors.
To determine the fair value of derivative instruments, the Company uses a variety of methods and assumptions that are based on market conditions and risks existing at each balance sheet date. For the majority of financial instruments including most derivatives, long-term investments and long-term debt, standard market conventions and techniques such as discounted cash flow analysis, option-pricing models, replacement cost and termination cost are used to determine fair value. All methods of assessing fair value result in a general approximation of value, and such value may never actually be realized.
In the normal course of business, the Company is exposed to the effect of interest rate changes and limits these risks by following established risk management policies and procedures including the use of derivatives. To address exposure to interest rates, the Company uses derivatives primarily to hedge the cash flow variability caused by interest rate fluctuations of its liabilities. Each of the Company’s CDOs maintains a maximum amount of allowable unhedged interest rate risk. The 2005 CDO permits 20% of the net outstanding principal balance and the 2006 CDO and the 2007 CDO permit 5% of the net outstanding principal balance to be unhedged.
121
TABLE OF CONTENTS
Gramercy Capital Corp.
Notes To Consolidated Financial Statements
(Amounts in thousands, except share and per share data)
December 31, 2011
2. Significant Accounting Policies – (continued)
The Company recognizes all derivatives on the balance sheet at fair value. Derivatives that are not hedges must be adjusted to fair value through income. If a derivative is a hedge, depending on the nature of the hedge, changes in the fair value of the derivative will either be offset against the change in fair value of the hedged asset, liability or firm commitment through earnings, or recognized in other comprehensive income until the hedged item is recognized in earnings. The ineffective portion of a derivative’s change in fair value will be immediately recognized in earnings. Derivative accounting may increase or decrease reported net income and stockholders’ equity prospectively, depending on future levels of LIBOR, swap spreads and other variables affecting the fair values of derivative instruments and hedged items, but will have no effect on cash flows, provided the contract is carried through to full term.
All hedges held by the Company are deemed effective based upon the hedging objectives established by the Company’s corporate policy governing interest rate risk management. The effect of the Company’s derivative instruments on its financial statements is discussed more fully in Note 17.
Income Taxes
The Company elected to be taxed as a REIT, under Sections 856 through 860 of the Internal Revenue Code, beginning with its taxable year ended December 31, 2004. To qualify as a REIT, the Company must meet certain organizational and operational requirements, including a requirement to distribute at least 90% of its ordinary taxable income, to stockholders. As a REIT, the Company generally will not be subject to U.S. federal income tax on taxable income that the Company distributes to its stockholders. If the Company fails to qualify as a REIT in any taxable year, it will then be subject to U.S. federal income taxes on taxable income at regular corporate rates and will not be permitted to qualify for treatment as a REIT for U.S. federal income tax purposes for four years following the year during which qualification is lost unless the Internal Revenue Service grants the Company relief under certain statutory provisions. Such an event could materially adversely affect the Company’s net income and net cash available for distributions to stockholders. However, the Company believes that it will be organized and operate in such a manner as to qualify for treatment as a REIT and the Company intends to operate in the foreseeable future in such a manner so that it will qualify as a REIT for U.S. federal income tax purposes. The Company is subject to certain state and local taxes.
For the years December 31, 2011, 2010 and 2009, the Company recorded $563, $966 and $2,495 of income tax expense, respectively. Tax expense for the year ended December 31, 2011 is comprised of federal, state and local taxes. Tax expense for the year ended December 31, 2010 is comprised entirely of state and local taxes. Included in tax expense for the year ended December 31, 2009 is an accrual for state income taxes on the gain on extinguishment of debt of $119,305. Under federal tax law, the Company is allowed to defer this gain until 2014; however not all states follow this federal rule.
The Company’s policy for interest and penalties, if any, on material uncertain tax positions recognized in the financial statements is to classify these as interest expense and operating expense, respectively. As of December 31, 2011, 2010 and 2009, the Company did not incur any material interest or penalties.
Earnings Per Share
The Company presents both basic and diluted earnings per share, or EPS. Basic EPS excludes dilution and is computed by dividing net income available to common stockholders by the weighted average number of common shares outstanding during the period. Diluted EPS reflects the potential dilution that could occur if securities or other contracts to issue common stock were exercised or converted into common stock, as long as their inclusion would not be anti-dilutive.
122
TABLE OF CONTENTS
Gramercy Capital Corp.
Notes To Consolidated Financial Statements
(Amounts in thousands, except share and per share data)
December 31, 2011
2. Significant Accounting Policies – (continued)
Use of Estimates
The preparation of financial statements in conformity with GAAP requires management to make estimates and assumptions that affect the amounts reported in the financial statements and accompanying notes. Actual results could differ from those estimates.
Concentrations of Credit Risk
Financial instruments that potentially subject the Company to concentrations of credit risk consist primarily of cash investments, debt investments and accounts receivable. The Company places its cash investments in excess of insured amounts with high quality financial institutions. The Company performs ongoing analysis of credit risk concentrations in its loan and other lending investment portfolio by evaluating exposure to various markets, underlying property types, investment structure, term, sponsors, tenants and other credit metrics.
Three investments accounted for approximately 21.1% of the total carrying value of the Company’s debt investments as of December 31, 2011 compared to four investments which accounted for approximately 24.2% of the total carrying value of the Company’s debt investments as of December 31, 2010. Seven investments accounted for approximately 16.3% of the revenue earned on the Company’s debt investments for the year ended December 31, 2011, seven investments accounted for approximately 17.2% of the revenue earned on the Company’s debt investments for the year ended December 31, 2010 and six investments which accounted for approximately 16.7% of the revenue earned on the Company’s debt investments for the year ended December 31, 2009. The largest sponsor accounted for approximately 14.1% and 10.7% of the total carrying value of the Company’s debt investments as of December 31, 2011 and 2010, respectively. The largest sponsor accounted for approximately 5.6% of the revenue earned on the Company’s debt investments for the year ended December 31, 2011, compared to approximately 5.8% and 5.9% of the revenue earned on the Company’s debt investments for the years ended December 31, 2010 and 2009, respectively.
Recently Issued Accounting Pronouncements
In May 2009, the FASB issued new guidance that incorporates into authoritative accounting literature certain guidance that already existed within generally accepted auditing standards relative to the reporting of subsequent events, with the requirements concerning recognition and disclosure of subsequent events remaining essentially unchanged. This guidance addresses events which occur after the balance sheet date but before the issuance of financial statements. Under the new guidance, as under previous practice, an entity must record the effects of subsequent events that provide evidence about conditions that existed at the balance sheet date and must disclose but not record the effects of subsequent events which provide evidence about conditions that did not exist at the balance sheet date. This standard added an additional required disclosure relative to the date through which subsequent events have been evaluated and whether that is the date on which the financial statements were issued. The Company adopted this standard effective April 1, 2009. In February 2010, the FASB issued an Accounting Standards Update (ASU) clarifying the application of this guidance to entities, specifying that if an entity is an SEC filer then it should evaluate subsequent events through the date the financial statements are available to be issued. Additionally the ASU incorporates a definition of an SEC filer and states that an SEC filer is not required to disclose the date through which subsequent events have been evaluated. The Company has applied this update to its consolidated financial statements for the periods ended December 31, 2011 and 2010.
In June 2009, the FASB amended the guidance on transfers of financial assets to, among other things, eliminate the qualifying special-purpose entity concept, include a new unit of account definition that must be met for transfers of portions of financial assets to be eligible for sale accounting, clarify and change the derecognition criteria for a transfer to be accounted for as a sale, and require significant additional disclosure.
123
TABLE OF CONTENTS
Gramercy Capital Corp.
Notes To Consolidated Financial Statements
(Amounts in thousands, except share and per share data)
December 31, 2011
2. Significant Accounting Policies – (continued)
This standard was effective January 1, 2010. The adoption of this guidance did not have a material impact on the Company’s consolidated financial statements.
In June 2009, the FASB issued new guidance which revised the consolidation guidance for variable-interest entities. The modifications include the elimination of the exemption for qualifying special purpose entities, a new approach for determining who should consolidate a variable-interest entity, and changes to when it is necessary to reassess who should consolidate a variable-interest entity. This standard was effective January 1, 2010. The adoption of this guidance did not have a material impact on the Company’s consolidated financial statements, other than presentation on the consolidated balance sheets.
In January 2010, the FASB issued updated guidance on fair value measurements and disclosures, which requires disclosure of details of significant asset or liability transfers in and out of Level I and Level II measurements within the fair value hierarchy and inclusion of gross purchases, sales, issuances, and settlements in the rollforward of assets and liabilities valued using Level III inputs within the fair value hierarchy. The guidance also clarifies and expands existing disclosure requirements related to the disaggregation of fair value disclosures and inputs used in arriving at fair values for assets and liabilities using Level II and Level III inputs within the fair value hierarchy. These disclosure requirements were effective for interim and annual reporting periods beginning after December 15, 2009. Adoption of this guidance on January 1, 2010, excluding the Level III rollforward, resulted in additional disclosures in the consolidated financial statements. The gross presentation of the Level III rollforward is required for interim and annual reporting periods beginning after December 15, 2010. The adoption of the guidance on January 1, 2011 did not have a material effect on the Company’s consolidated financial statements.
In March 2010, the FASB issued a clarification of previous guidance that exempts certain credit related features from analysis as potential embedded derivatives subject to bifurcation and separate fair value accounting. This guidance specifies that an embedded credit derivative feature related to the transfer of credit risk that is only in the form of subordination of one financial instrument to another is not subject to bifurcation from a host contract. All other embedded credit derivative features should be analyzed to determine whether their economic characteristics and risks are “clearly and closely related” to the economic characteristics and risks of the host contract and whether bifurcation and separate fair value accounting is required. The adoption of this guidance by the Company on July 1, 2010 did not have a material effect on the Company’s consolidated financial statements.
In July 2010, FASB issued guidance which outlines specific disclosures that will be required for the allowance for credit losses and all finance receivables. Finance receivables includes loans, lease receivables and other arrangements with a contractual right to receive money on demand or on fixed or determinable dates that is recognized as an asset on an entity’s statement of financial position. This guidance will require companies to provide disaggregated levels of disclosure by portfolio segment and class to enable users of the financial statement to understand the nature of credit risk, how the risk is analyzed in determining the related allowance for credit losses and changes to the allowance during the reporting period. Required disclosures under this guidance as of the end of a reporting period are effective for the Company’s December 31, 2010. In January 2011, the FASB delayed the effective date of the new disclosures about troubled debt restructurings to allow the FASB the time needed to complete its deliberations about on what constitutes a troubled debt restructuring. The effective date of the new disclosures about and the guidance for determining what constitutes a troubled debt restructuring will then be coordinated. The guidance is effective for the Company’s September 30, 2011 reporting period. The Company has applied this update to its consolidated financial statements for the period ended December 31, 2011.
124
TABLE OF CONTENTS
Gramercy Capital Corp.
Notes To Consolidated Financial Statements
(Amounts in thousands, except share and per share data)
December 31, 2011
2. Significant Accounting Policies – (continued)
In December 2010, the FASB issued guidance on the disclosure of supplementary pro forma information for business combinations. The guidance specifies that if a public entity enters into business combinations that are material on an individual or aggregate basis and presents comparative financial statements, the entity must present pro forma revenue and earnings of the combined entity as though the business combination that occurred during the current period had occurred as of the beginning of the comparable annual period only. The adoption of this guidance for the Company’s annual reporting period ending December 31, 2011 did not have a material impact on the Company’s consolidated financial statements.
In April 2011, the FASB issued updated guidance on a creditor’s determination of whether a restructuring will be a troubled debt restructuring, which establishes new guidelines in evaluating whether a loan modification meets the criteria of a troubled debt restructuring. This guidance is effective as of the third quarter of 2011, applied retrospectively to the beginning of the fiscal year as required, and its adoption did not have a material effect on the Company’s consolidated financial statements.
In May 2011, the FASB issued updated guidance on fair value measurement which amends U.S. GAAP to conform to International Financial Reporting Standards, or IFRS, measurement and disclosure requirements. The amendment changes the wording used to describe the requirements in U.S. GAAP for measuring fair value, changes certain fair value measurement principles and enhances disclosure requirements. This guidance is effective as of January 1, 2012, applied prospectively, and its adoption did not have a material effect on the Company’s consolidated financial statements.
In June 2011, the FASB issued updated guidance on comprehensive income which amends U.S. GAAP to conform to the disclosure requirements of IFRS. The amendment eliminates the option to present components of other comprehensive income as part of the Statement of Stockholders’ Equity and Non-Controlling Interests and requires a separate Statement of Comprehensive Income or two consecutive statements in the Statement of Operations and in a separate Statement of Comprehensive Income. This guidance also requires the presentation of reclassification adjustments for each component of other comprehensive income on the face of the financial statements rather than in the notes to the financial statements. This guidance is effective as of January 1, 2012, except for the disclosure of reclassification adjustments which was postponed for re-deliberation by the FASB, and early adoption is permitted, and its adoption did not have a material effect on the Company’s consolidated financial statements.
125
TABLE OF CONTENTS
Gramercy Capital Corp.
Notes To Consolidated Financial Statements
(Amounts in thousands, except share and per share data)
December 31, 2011
3. Loans and Other Lending Investments
The aggregate carrying values, allocated by product type and weighted-average coupons, of the Company’s loan, other lending investments, and CMBS investments as of December 31, 2011 and December 31, 2010, were as follows:
| | | | | | | | | | | | | | | | |
| | Carrying Value(1) | | Allocation by
Investment Type | | Fixed Rate
Average Yield | | Floating Rate Average
Spread over LIBOR(2) |
| | | 2011 | | 2010 | | 2011 | | 2010 | | 2011 | | 2010 | | 2011 | | 2010 |
| Whole loans, floating rate | | $ | 689,685 | | | $ | 659,095 | | | | 63.8 | % | | | 58.7 | % | | | — | | | | — | | | | 331 bps | | | | 330 bps | |
| Whole loans, fixed rate | | | 202,209 | | | | 132,268 | | | | 18.7 | % | | | 11.8 | % | | | 8.35 | % | | | 7.16 | % | | | — | | | | — | |
| Subordinate interests in whole loans, floating rate | | | 25,352 | | | | 75,066 | | | | 2.3 | % | | | 6.7 | % | | | — | | | | — | | | | 575 bps | | | | 297 bps | |
| Subordinate interests in whole loans, fixed rate | | | 89,914 | | | | 46,468 | | | | 8.3 | % | | | 4.1 | % | | | 10.50 | % | | | 6.01 | % | | | — | | | | — | |
| Mezzanine loans, floating rate | | | 46,002 | | | | 152,349 | | | | 4.3 | % | | | 13.5 | % | | | — | | | | — | | | | 860 bps | | | | 754 bps | |
| Mezzanine loans, fixed rate | | | 23,847 | | | | 48,828 | | | | 2.2 | % | | | 4.3 | % | | | 10.34 | % | | | 12.69 | % | | | — | | | | — | |
| Preferred equity, floating rate | | | 3,615 | | | | 5,224 | | | | 0.3 | % | | | 0.5 | % | | | — | | | | — | | | | 234 bps | | | | 350 bps | |
| Preferred equity, fixed rate | | | 1,295 | | | | 4,230 | | | | 0.1 | % | | | 0.4 | % | | | — | | | | 7.25 | % | | | — | | | | — | |
| Subtotal/Weighted average | | | 1,081,919 | | | | 1,123,528 | | | | 100.0 | % | | | 100.0 | % | | | 9.08 | % | | | 8.09 | % | | | 370 bps | | | | 400 bps | |
| CMBS, floating rate | | | 47,855 | | | | 50,798 | | | | 6.2 | % | | | 5.1 | % | | | — | | | | — | | | | 96 bps | | | | 394 bps | |
| CMBS, fixed rate | | | 727,957 | | | | 954,369 | | | | 93.8 | % | | | 94.9 | % | | | 8.22 | % | | | 8.37 | % | | | — | | | | — | |
| Subtotal/Weighted average | | | 775,812 | | | | 1,005,167 | | | | 100.0 | % | | | 100.0 | % | | | 8.22 | % | | | 8.37 | % | | | 96 bps | | | | 394 bps | |
| Total | | $ | 1,857,731 | | | $ | 2,128,695 | | | | 100.0 | % | | | 100.0 | % | | | 8.48 | % | | | 8.32 | % | | | 354 bps | | | | 400 bps | |
| (1) | Loans and other lending investments and CMBS investments are presented net of unamortized fees, discounts, asset sales, unfunded commitments, reserves for loan losses and other adjustments. |
| (2) | Spreads over an index other than 30 day-LIBOR have been adjusted to a LIBOR based equivalent. In some cases, LIBOR is floored, giving rise to higher current effective spreads. |
Whole loans are permanent first mortgage loans with initial terms of up to 15 years. Whole loans are first mortgage liens and senior in interest to subordinate mortgage interest in whole loans, mezzanine loan and preferred equity interest.
Subordinate mortgage interests in whole loans are participation interests in mortgage notes or loans secured by a lien subordinated to a senior interest in the same loan. Subordinate interests in whole loans are subject to greater credit risk with respect to the underlying mortgage collateral than the corresponding senior interest.
Mezzanine loans are senior to the borrower’s equity in, and subordinate to a whole loan and subordinate mortgage interest, on a property. These loans are secured by pledges of ownership interests in entities that directly or indirectly own the real property.
Preferred equity are investments in entities that directly or indirectly own commercial real estate. Preferred equity is not secured, but holders have priority relative to common equity holders.
126
TABLE OF CONTENTS
Gramercy Capital Corp.
Notes To Consolidated Financial Statements
(Amounts in thousands, except share and per share data)
December 31, 2011
3. Loans and Other Lending Investments – (continued)
For the years ended December 31, 2011 and 2010, the Company purchased $175,400 and $22,956 of loan investments, respectively.
Quarterly, the Company evaluates its loans for instances where specific valuation allowances are necessary, as described in Note 2. As a component of the Company’s quarterly policies and procedures for loan valuation and risk assessment, each loan is assigned a risk rating. Individual ratings range from one to six, with one being the lowest risk and six being the highest risk. Each credit risk rating has benchmark guidelines which pertain to debt-service coverage ratios, loan-to-value, or LTV ratio, borrower strength, asset quality, and funded cash reserves. Other factors such as guarantees, market strength, remaining loan term and borrower equity are also reviewed and factored into determining the credit risk rating assigned to each loan. Loans with a risk rating of one to three have characteristics of a lower risk loan and such loans are generally expected to perform through maturity. Loans with a risk rating of four to five generally have characteristics of a higher risk loan and may indicate instances of a higher likelihood of a contractual default or expectation of a principal loss. Loans with a risk rating of six are nonperforming and often times have been fully reserved.
A summary of the Company’s loans by loan class as of December 31, 2011 and 2010 are as follows:
| | | | | | | | | | | | |
| | Risk Ratings as of December 31, 2011 |
| | | One to Three | | Four to Six |
| | | Number of
Loans | | Unpaid
Principal
Balance | | Carrying
Value | | Number of
Loans | | Unpaid
Principal
Balance | | Carrying
Value |
| Whole Loans | | | 21 | | | $ | 610,533 | | | $ | 583,405 | | | | 11 | | | $ | 440,752 | | | $ | 308,491 | |
| Subordinate Mortgage Interests(1) | | | 5 | | | | 134,932 | | | | 115,265 | | | | — | | | | — | | | | — | |
| Mezzanine Loans | | | — | | | | — | | | | — | | | | 7 | | | | 128,244 | | | | 69,848 | |
| Preferred Equity | | | — | | | | — | | | | — | | | | 3 | | | | 68,116 | | | | 4,910 | |
| Total | | | 26 | | | $ | 745,465 | | | $ | 698,670 | | | | 21 | | | $ | 637,112 | | | $ | 383,249 | |
| (1) | Includes one Interest-Only Strip. |
| | | | | | | | | | | | |
| | Risk Ratings as of December 31, 2010 |
| | | One to Three | | Four to Six |
| | | Number of
Loans | | Unpaid
Principal
Balance | | Carrying
Value | | Number of
Loans | | Unpaid
Principal
Balance | | Carrying
Value |
| Whole Loans | | | 11 | | | $ | 412,837 | | | $ | 403,265 | | | | 18 | | | $ | 504,229 | | | $ | 388,098 | |
| Subordinate Mortgage Interests(1) | | | 6 | | | | 96,145 | | | | 96,073 | | | | 3 | | | | 85,494 | | | | 25,461 | |
| Mezzanine Loans | | | 2 | | | | 39,979 | | | | 40,342 | | | | 10 | | | | 214,151 | | | | 160,835 | |
| Preferred Equity | | | — | | | | — | | | | — | | | | 2 | | | | 60,668 | | | | 9,454 | |
| Total | | | 19 | | | $ | 548,961 | | | $ | 539,680 | | | | 33 | | | $ | 864,542 | | | $ | 583,848 | |
| (1) | Includes one Interest-Only Strip. |
127
TABLE OF CONTENTS
Gramercy Capital Corp.
Notes To Consolidated Financial Statements
(Amounts in thousands, except share and per share data)
December 31, 2011
3. Loans and Other Lending Investments – (continued)
As of December 31, 2011, the Company’s loans and other lending investments, excluding CMBS investments, had the following maturity characteristics:
| | | | | | |
| Year of Maturity | | Number of
Investments
Maturing | | Current
Carrying Value
(In thousands) | | % of Total |
| 2012 | | | 18 | (1) | | $ | 352,627 | | | | 32.6 | % |
| 2013 | | | 11 | | | | 242,254 | | | | 22.4 | % |
| 2014 | | | 6 | | | | 103,075 | | | | 9.5 | % |
| 2015 | | | 5 | | | | 102,479 | | | | 9.5 | % |
| 2016 | | | 2 | | | | 107,520 | | | | 9.9 | % |
| Thereafter | | | 5 | | | | 173,964 | | | | 16.1 | % |
| Total | | | 47 | | | $ | 1,081,919 | | | | 100.0 | % |
| Weighted average maturity | | | | | | | 2.3 | (2) | | | | |
| (1) | Of the loans maturing in 2012, four investments with an aggregate carrying value of $142,856 have extension options, which may be subject to performance criteria. |
| (2) | The calculation of weighted-average maturity is based upon the remaining initial term of the investment and does not include option or extension periods or the ability to prepay the investment after a negotiated lock-out period, which may be available to the borrower. |
For the years ended December 31, 2011, 2010 and 2009, the Company’s investment income from loan and other lending investments and CMBS investments, was generated by the following investment types:
| | | | | | | | | | | | |
| | For the year ended
December 31, 2011 | | For the year ended
December 31, 2010 | | For the year ended
December 31, 2009 |
| Investment Type | | Investment
Income | | % of Total | | Investment
Income | | % of Total | | Investment
Income | | % of Total |
| Whole loans | | $ | 50,227 | | | | 31.6 | % | | $ | 55,328 | | | | 33.2 | % | | $ | 74,536 | | | | 40.3 | % |
| Subordinate interest in whole loans | | | 9,961 | | | | 6.3 | % | | | 5,826 | | | | 3.5 | % | | | 4,863 | | | | 2.6 | % |
| Mezz loans | | | 15,864 | | | | 10.0 | % | | | 24,306 | | | | 14.6 | % | | | 38,169 | | | | 20.7 | % |
| Preferred equity | | | 2,478 | | | | 1.6 | % | | | 2,692 | | | | 1.6 | % | | | 1,941 | | | | 1.1 | % |
| CMBS | | | 80,220 | | | | 50.5 | % | | | 78,490 | | | | 47.1 | % | | | 65,098 | | | | 35.3 | % |
| Total | | $ | 158,750 | | | | 100.0 | % | | $ | 166,642 | | | | 100.0 | % | | $ | 184,607 | | | | 100.0 | % |
128
TABLE OF CONTENTS
Gramercy Capital Corp.
Notes To Consolidated Financial Statements
(Amounts in thousands, except share and per share data)
December 31, 2011
3. Loans and Other Lending Investments – (continued)
At December 31, 2011 and 2010, the Company’s loans and other lending investments, excluding CMBS investments, had the following geographic diversification:
| | | | | | | | |
| | December 31, 2011 | | December 31, 2010 |
| Region | | Carrying
Value | | % of Total | | Carrying
Value | | % of Total |
| Northeast | | $ | 306,428 | | | | 28.4 | % | | $ | 497,030 | | | | 44.2 | % |
| Midwest | | | 220,684 | | | | 20.4 | % | | | 50,298 | | | | 4.4 | % |
| West | | | 208,902 | | | | 19.3 | % | | | 277,478 | | | | 24.7 | % |
| South | | | 121,531 | | | | 11.2 | % | | | 119,841 | | | | 10.7 | % |
| Various(1) | | | 102,982 | | | | 9.5 | % | | | 32,365 | | | | 2.9 | % |
| Southwest | | | 63,773 | | | | 5.9 | % | | | 30,021 | | | | 2.7 | % |
| Mid-Atlantic | | | 57,619 | | | | 5.3 | % | | | 116,495 | | | | 10.4 | % |
| Total | | $ | 1,081,919 | | | | 100.0 | % | | $ | 1,123,528 | | | | 100.0 | % |
| (1) | Includes interest-only strips. |
At December 31, 2011 and 2010, the Company’s loans and other lending investments, excluding CMBS investments, by property type are as follows:
| | | | | | | | |
| | December 31, 2011 | | December 31, 2010 |
| Property Type | | Carrying
Value | | % of Total | | Carrying
Value | | % of Total |
| Office | | $ | 515,751 | | | | 47.7 | % | | $ | 425,773 | | | | 37.9 | % |
| Hotel | | | 240,380 | | | | 22.2 | % | | | 184,306 | | | | 16.4 | % |
| Retail | | | 128,055 | | | | 11.8 | % | | | 202,090 | | | | 18.0 | % |
| Land – Commercial | | | 84,431 | | | | 7.8 | % | | | 143,589 | | | | 12.8 | % |
| Multifamily | | | 51,065 | | | | 4.7 | % | | | 54,488 | | | | 4.8 | % |
| Other(1) | | | 24,859 | | | | 2.3 | % | | | 5,953 | | | | 0.5 | % |
| Condo | | | 18,041 | | | | 1.7 | % | | | 30,923 | | | | 2.8 | % |
| Industrial | | | 15,387 | | | | 1.4 | % | | | 47,784 | | | | 4.3 | % |
| Mixed-Use | | | 3,950 | | | | 0.4 | % | | | 28,622 | | | | 2.5 | % |
| Total | | $ | 1,081,919 | | | | 100.0 | % | | $ | 1,123,528 | | | | 100.0 | % |
| (1) | Includes interest-only strips. |
The Company recorded provisions for loan losses of $48,180, $84,392 and $517,784 for the years ended December 31, 2011, 2010 and 2009, respectively. These provisions represent increases in loan loss reserves based on management’s estimates considering delinquencies, loss experience, collateral quality by individual asset or category of asset and modifications that resulted in troubled debt restructurings.
For the year ended December 31, 2011, the Company incurred charge-offs of $66,856 related to realized losses on five loan investments. During the year ended December 31, 2010, the Company incurred charge-offs of $239,078 related to realized losses on ten loan investments. During the year ended December 31, 2009, the Company incurred charge-offs of $188,574 related to realized losses on 16 loan investments.
The interest income on impaired loans during the time within the financial statement period that they were impaired was $24,606, $42,169 and $38,966 for the years ended December 31, 2011, 2010 and 2009, respectively.
129
TABLE OF CONTENTS
Gramercy Capital Corp.
Notes To Consolidated Financial Statements
(Amounts in thousands, except share and per share data)
December 31, 2011
3. Loans and Other Lending Investments – (continued)
Changes in the reserve for possible loan losses were as follows:
| | | | | | | | | | |
| | Whole loans | | Subordinate
interest in
whole loans | | Mezzanine
loans | | Preferred
equity | | Total |
| Reserve for loan losses, December 31, 2008 | | $ | 20,992 | | | $ | 60,000 | | | $ | 8,000 | | | $ | — | | | $ | 88,992 | |
| Additional provision for loan losses | | | 267,686 | | | | — | | | | 221,698 | | | | 28,400 | | | | 517,784 | |
| Charge-offs | | | (122,773 | ) | | | — | | | | (65,801 | ) | | | — | | | | (188,574 | ) |
| Reserve for loan losses, December 31, 2009 | | | 165,905 | | | | 60,000 | | | | 163,897 | | | | 28,400 | | | | 418,202 | |
| Additional provision for loan losses | | | 53,379 | | | | — | | | | 8,013 | | | | 23,000 | | | | 84,392 | |
| Charge-offs | | | (92,461 | ) | | | 585 | | | | (147,202 | ) | | | — | | | | (239,078 | ) |
| Reserve for loan losses, December 31, 2010 | | | 126,823 | | | | 60,585 | | | | 24,708 | | | | 51,400 | | | | 263,516 | |
| Additional provision for loan losses | | | 18,530 | | | | 5,782 | | | | 11,859 | | | | 12,009 | | | | 48,180 | |
| Charge-offs | | | (403 | ) | | | (64,000 | ) | | | (2,453 | ) | | | — | | | | (66,856 | ) |
| Reserve for loan losses, December 31, 2011 | | $ | 144,950 | | | $ | 2,367 | | | $ | 34,114 | | | $ | 63,409 | | | $ | 244,840 | |
As of December 31, 2011 and 2010, the Company’s recorded investments in impaired loans were as follows:
| | | | | | | | | | |
| | For the year ended December 31, 2011 |
| | | Unpaid
Principal
Balance | | Carrying
Value
| | Allowance
for
Loan Losses | | Average
Recorded
Investment(1) | | Investment
Income
Recognized |
| Whole loans | | $ | 428,050 | | | $ | 285,659 | | | $ | 144,950 | | | $ | 298,251 | | | $ | 13,206 | |
Subordinate interests in whole
loans | | | 5,882 | | | | 3,514 | | | | 2,367 | | | | 5,041 | | | | 235 | |
| Mezzanine loans | | | 34,114 | | | | — | | | | 34,114 | | | | 9,399 | | | | 882 | |
| Preferred equity | | | 68,116 | | | | 4,910 | | | | 63,409 | | | | 9,268 | | | | 2,430 | |
| Total | | $ | 536,162 | | | $ | 294,083 | | | $ | 244,840 | | | $ | 321,959 | | | $ | 16,753 | |
| (1) | Represents the average of the month end balances for the year ended December 31, 2011 |
| | | | | | | | | | |
| | For the year ended December 31, 2010 |
| | | Unpaid
Principal
Balance | | Carrying
Value | | Allowance
for
Loan Losses | | Average
Recorded
Investment(1) | | Investment
Income
Recognized |
| Whole loans | | $ | 506,211 | | | $ | 382,272 | | | $ | 126,823 | | | $ | 428,618 | | | $ | 23,440 | |
Subordinate interests in whole
loans | | | 50,647 | | | | 5,062 | | | | 45,585 | | | | 3,091 | | | | 38 | |
| Mezzanine loans | | | 156,161 | | | | 94,312 | | | | 39,708 | | | | 96,589 | | | | 9,675 | |
| Preferred equity | | | 60,668 | | | | 9,454 | | | | 51,400 | | | | 30,748 | | | | 2,792 | |
| Total | | $ | 773,687 | | | $ | 491,100 | | | $ | 263,516 | | | $ | 559,046 | | | $ | 35,945 | |
| (1) | Represents the average of the month end balances for the year ended December 31, 2010 |
130
TABLE OF CONTENTS
Gramercy Capital Corp.
Notes To Consolidated Financial Statements
(Amounts in thousands, except share and per share data)
December 31, 2011
3. Loans and Other Lending Investments – (continued)
During the year ended December 31, 2011, the Company modified four loans which were considered troubled debt restructurings. A troubled debt restructuring is generally any modification of a loan to a borrower that is experiencing financial difficulties, where a lender agrees to terms that are more favorable to the borrower than is otherwise available in the current market. The Company reduced the interest rate on three of these loans by a combined weighted average rate of 0.9% and extended all of the loans by a combined weighted average of 1.1 years, with conditional extension options dependent upon pay down hurdles for one loan. As of December 31, 2011, the Company had no unfunded commitments on modified loans considered troubled debt restructurings.
These loans were modified to increase the total recovery of the combined principal and interest from the loan. Any loan modification is predicated upon a goal of maximizing the collection of the loan. The Company believes that the borrowers can perform under the new terms and therefore none of the loans which were modified and considered to be troubled debt restructurings were classified as non-performing as of December 31, 2011.
| | | | | | |
| | As of December 31, 2011 |
| | | Number of
Investments | | Pre-modification
Unpaid Principal
Balance(1) | | Post-modification
Unpaid Principal
Balance(2) |
| Whole loans | | | 3 | | | $ | 139,725 | | | $ | 140,404 | |
| Subordinate interests in whole loans | | | — | | | | — | | | | — | |
| Mezzanine loans | | | — | | | | — | | | | — | |
| Preferred equity | | | 1 | | | | 12,214 | | | | 12,214 | |
| Total | | | 4 | | | $ | 151,939 | | | $ | 152,618 | |
| (1) | Unpaid principal balance as of the last modification, but before any paydowns, not including payment in kind |
| (2) | This represents the UPB of the loan for the quarter end following the modification |
As of December 31, 2011 and 2010, the Company’s non-performing loans by class are as follows:
| | | | | | | | |
| | As of December 31, 2011 |
| | | Number of
Investments | | Carrying
value | | Less Than
90 Days
Past Due | | Greater Than
90 Days
Past Due |
| Whole loans | | | 1 | | | $ | 51,417 | | | $ | — | | | $ | 51,417 | |
| Subordinate interests in whole loans | | | — | | | | — | | | | — | | | | — | |
| Mezzanine loans | | | 2 | | | | — | | | | — | | | | — | |
| Preferred equity | | | — | | | | — | | | | — | | | | — | |
| Total | | | 3 | | | $ | 51,417 | | | $ | — | | | | 51,417 | |
| | | | | | | | |
| | As of December 31, 2010 |
| | | Number of
Investments | | Carrying
value | | Less Than
90 Days
Past Due | | Greater Than
90 Days
Past Due |
| Whole loans | | | — | | | $ | — | | | $ | — | | | $ | — | |
| Subordinate interests in whole loans | | | 1 | | | | — | | | | — | | | | — | |
| Mezzanine loans | | | 1 | | | | — | | | | — | | | | — | |
| Preferred equity | | | — | | | | — | | | | — | | | | — | |
| Total | | | 2 | | | $ | — | | | $ | — | | | $ | — | |
131
TABLE OF CONTENTS
Gramercy Capital Corp.
Notes To Consolidated Financial Statements
(Amounts in thousands, except share and per share data)
December 31, 2011
3. Loans and Other Lending Investments – (continued)
At December 31, 2011, the Company does not have any loans contractually past due 90 days or more that are still accruing interest. Also, the Company had no unfunded commitments on modified loans which were considered “troubled debt restructurings.” As of December 31, 2011 and 2010, there were no loans for which the collateral securing the loan was less than the carrying value of the loan for which the Company did not record a provision for loan loss.
To maintain flexibility and liquidity, and to improve risk adjusted returns in the Company's three CDOs, the Company has concluded that as of March 31, 2011, it no longer can express the intent and ability to hold its CMBS investments through maturity. As a result, as of March 31, 2011, the Company has designated all of its held-to-maturity CMBS investments to available-for-sale with a carrying value of $973,278 and recognized an unrealized gain of $11,515 and accordingly, such CMBS are carried on the Consolidated Balance Sheet at fair value. Changes in fair value are not necessarily indicative of current or future changes in cash flow, which are based on actual delinquencies, defaults and sales of the underlying collateral, and therefore, are not recognized in earnings. Changes in fair value are reflected in the Statement of Stockholders' Equity and Non-controlling Interests. The Company continues to monitor all of its CMBS investments for other-than-temporary impairments.
The following is a summary of the Company’s CMBS investments at December 31, 2011:
| | | | | | | | | | | | |
| Description | | Number of
Securities | | Face Value | | Amortized
Cost | | Fair Value | | Gross Unrealized Gain | | Gross Unrealized Loss |
Available for Sale:
| | | | | | | | | | | | | | | | | | | | | | | | |
| Floating rate | | | 3 | | | $ | 53,500 | | | $ | 51,848 | | | $ | 47,855 | | | $ | — | | | $ | (3,993 | ) |
| Fixed rate CMBS | | | 108 | | | | 1,185,777 | | | | 982,801 | | | | 727,957 | | | | 44,115 | (1) | | | (298,959 | ) |
| Total | | | 111 | | | $ | 1,239,277 | | | $ | 1,034,649 | | | $ | 775,812 | | | $ | 44,115 | | | $ | (302,952 | ) |
The following is a summary of the Company’s CMBS investments at December 31, 2010:
| | | | | | | | | | | | |
| Description | | Number of Securities | | Face Value | | Amortized Cost | | Fair Value | | Gross Unrealized Gain | | Gross Unrealized Loss |
Held to maturity:
| | | | | | | | | | | | | | | | | | | | | | | | |
| Floating rate CMBS | | | 2 | | | $ | 48,500 | | | $ | 47,698 | | | $ | 43,650 | | | $ | — | | | $ | (4,048 | ) |
| Fixed rate CMBS | | | 97 | | | | 1,133,574 | | | | 925,580 | | | | 825,275 | | | | 96,428 | | | | (196,733 | ) |
| Available for Sale: | |
| Floating rate CMBS | | | 1 | | | | 5,000 | | | | 3,100 | | | | 3,100 | | | | — | | | | — | |
| Fixed rate CMBS | | | 8 | | | | 43,444 | | | | 26,806 | | | | 28,789 | | | | 1,983 | (1) | | | — | |
| Total | | | 108 | | | $ | 1,230,518 | | | $ | 1,003,184 | | | $ | 900,814 | | | $ | 98,411 | | | $ | (200,781 | ) |
| (1) | Included in Other Comprehensive Income. |
The following table shows the Company’s fair value unrealized losses, aggregated by investment category and length of time that individual securities have been in a continuous unrealized loss position, at December 31, 2011:
| | | | | | | | | | | | |
| | Less than 12 Months | | 12 Months or More | | Total |
| Description | | Estimated
Fair Value | | Gross
Unrealized
Loss | | Estimated
Fair Value | | Gross
Unrealized
Loss | | Estimated
Fair Value | | Gross
Unrealized
Loss |
| Floating rate CMBS | | $ | 2,750 | | | $ | (598 | ) | | $ | 45,105 | | | $ | (3,395 | ) | | $ | 47,855 | | | $ | (3,993 | ) |
| Fixed rate CMBS | | | 79,258 | | | | (11,654 | ) | | | 439,045 | | | | (287,305 | ) | | | 518,303 | | | | (298,959 | ) |
| Total temporarily impaired securities | | $ | 82,008 | | | $ | (12,252 | ) | | $ | 484,150 | | | $ | (290,700 | ) | | $ | 566,158 | | | $ | (302,952 | ) |
132
TABLE OF CONTENTS
Gramercy Capital Corp.
Notes To Consolidated Financial Statements
(Amounts in thousands, except share and per share data)
December 31, 2011
3. Loans and Other Lending Investments – (continued)
The Company performed an assessment of all of its CMBS investments that are in an unrealized loss position (when a CMBS investment’s amortized cost basis, excluding the effect of other-than-temporary impairments, exceeds its fair value) and determined the following:
| | | | | | | | | | |
| | | | | | | | Unrealized losses |
| | | Number of
Investments | | Fair value | | Amortized
Cost Basis | | Credit | | Non-Credit |
| CMBS investments the Company intends to sell | | | — | | | $ | — | | | $ | — | | | $ | — | | | $ | — | |
| CMBS investments the Company is more likely than not to be required to sell | | | — | | | | — | | | | — | | | | — | | | | — | |
CMBS investments the Company has no intent to sell and is not more likely than not to be required to sell:
| | | | | | | | | | | | | | | | | | | | |
| Credit impaired CMBS investments | | | 7 | | | | 40,387 | | | | 81,968 | | | | (17,516 | ) | | | (41,581 | ) |
| Non credit impaired CMBS investments | | | 66 | | | | 525,771 | | | | 787,142 | | | | — | | | | (261,371 | ) |
| Total CMBS investments in an unrealized loss position | | | 73 | | | $ | 566,158 | | | $ | 869,110 | | | $ | (17,516 | ) | | $ | (302,952 | ) |
The following table summarizes the activity related to credit losses on CMBS investments for the year ended December 31, 2011:
| | |
| Balance as of December 31, 2010 of credit losses on CMBS investments for which a portion of an OTTI, was recognized in other comprehensive income | | $ | 23,085 | |
| Additions for credit losses on securities for which an OTTI was not previously recognized | | | 18,423 | |
| Increases to credit losses on securities for which an OTTI was previously recognized and a portion of an other-than-temporary impairment was recognized in other comprehensive income | | | — | |
| Additions for credit losses on securities for which an OTTI was previously recognized without any portion of other-than-temporary impairment recognized in other comprehensive income | | | — | |
| Reduction for credit losses on CMBS investments for which no other-than-temporary impairment was recognized in other comprehensive income at current measurement date | | | (1,359 | ) |
Reduction for CMBS investments sold during the period
| | | | |
| Reduction for securities charged off during the period | | | (1,786 | ) |
| Reduction for increases in cash flows expected to be collected that are recognized over the remaining life of the CMBS investments | | | — | |
| Balance as of December 31, 2011 of credit losses on CMBS investments for which a portion of an OTTI was recognized in other comprehensive income | | $ | 38,363 | |
133
TABLE OF CONTENTS
Gramercy Capital Corp.
Notes To Consolidated Financial Statements
(Amounts in thousands, except share and per share data)
December 31, 2011
3. Loans and Other Lending Investments – (continued)
As of December 31, 2011, the Company’s CMBS investments had the following maturity characteristics:
| | | | | | | | | | |
| Year of Maturity | | Number of
Investments
Maturing | | Amortized
Cost | | Percent of
Total Carrying
Value | | Fair
Value
| | Percent of
Total Fair
Value |
| Less than 1 year | | | 2 | | | $ | 48,501 | | | | 4.7 | % | | $ | 45,105 | | | | 5.8 | % |
| 1 – 5 years | | | 43 | | | | 289,636 | | | | 28.0 | % | | | 257,315 | | | | 33.2 | % |
| 5 – 10 years | | | 66 | | | | 696,512 | | | | 67.3 | % | | | 473,392 | | | | 61.0 | % |
| Total | | | 111 | | | $ | 1,034,649 | | | | 100.0 | % | | $ | 775,812 | | | | 100.0 | % |
The following is a summary of the underlying credit ratings of the Company’s CMBS investments at December 31, 2011 and 2010 (for split-rated securities, the higher rating was used):
| | | | | | | | |
| | December 31, 2011 | | December 31, 2010 |
| | | Carrying Value | | Percentage | | Carrying Value | | Percentage |
Investment grade:
| | | | | | | | | | | | | | | | |
| AAA | | $ | 97,550 | | | | 12.6 | % | | $ | 51,590 | | | | 5.1 | % |
| AA | | | 30,841 | | | | 4.0 | % | | | 76,484 | | | | 7.6 | % |
| AA- | | | 27,436 | | | | 3.5 | % | | | 67,717 | | | | 6.7 | % |
| A+ | | | 58,400 | | | | 7.5 | % | | | 2,103 | | | | 0.2 | % |
| A | | | 13,094 | | | | 1.7 | % | | | 57,314 | | | | 5.7 | % |
| BBB+ | | | 37,498 | | | | 4.8 | % | | | 29,775 | | | | 3.0 | % |
| BBB | | | 52,523 | | | | 6.8 | % | | | 57,663 | | | | 5.7 | % |
| BBB- | | | 126,771 | | | | 16.3 | % | | | 166,843 | | | | 16.6 | % |
| Total investment grade | | | 444,113 | | | | 57.2 | % | | | 509,489 | | | | 50.6 | % |
Non-investment grade:
| | | | | | | | | | | | | | | | |
| BB+ | | | 24,696 | | | | 3.2 | % | | | 69,733 | | | | 6.9 | % |
| BB | | | 53,579 | | | | 6.9 | % | | | 97,261 | | | | 9.7 | % |
| BB- | | | 12,700 | | | | 1.6 | % | | | 138,680 | | | | 13.8 | % |
| B+ | | | 54,076 | | | | 7.0 | % | | | 153,970 | | | | 15.3 | % |
| B | | | 103,764 | | | | 13.4 | % | | | 5,160 | | | | 0.6 | % |
| B- | | | 35,348 | | | | 4.6 | % | | | 30,613 | | | | 3.1 | % |
| CCC+ | | | 27,840 | | | | 3.6 | % | | | 261 | | | | 0.0 | % |
| CCC | | | 14,499 | | | | 1.9 | % | | | — | | | | — | |
| CCC- | | | 3,172 | | | | 0.4 | % | | | — | | | | — | |
| C | | | 2,025 | | | | 0.2 | % | | | — | | | | — | |
| Total non-investment grade | | | 331,699 | | | | 42.8 | % | | | 495,678 | | | | 49.4 | % |
| Total | | $ | 775,812 | | | | 100.0 | % | | $ | 1,005,167 | | | | 100.0 | % |
The Company evaluates CMBS investments to determine if there has been an other-than-temporary impairment. The Company’s unrealized losses are primarily the result of market factors other than credit impairment which is generally indicated by significant change in estimated cash flows from the cash flows previously estimated based on actual prepayments and credit loss experience. Unrealized losses can be caused by changes in interest rates, changes in credit spreads, realized losses in the underlying collateral, or general market conditions. The Company evaluates CMBS investments on a quarterly basis and has determined that there has been an adverse change in expected cash flows related to credit losses for five CMBS investments.
134
TABLE OF CONTENTS
Gramercy Capital Corp.
Notes To Consolidated Financial Statements
(Amounts in thousands, except share and per share data)
December 31, 2011
3. Loans and Other Lending Investments – (continued)
Therefore, the Company recognized an other-than-temporary impairment of $18,423 during the year ended December 31, 2011 that was recorded as an impairment in the Company’s Consolidated Statement of Operations. This other-than-temporary impairment relates entirely to expected credit losses which has been recorded through earnings. To determine the component of the other-than-temporary impairment related to expected credit losses, the Company compares the amortized cost basis of each other-than-temporarily impaired security to the present value of its revised expected cash flows, discounted using its pre-impairment yield. Significant judgment of management is required in this analysis that includes, but is not limited to, (i) assumptions regarding the collectability of principal and interest, net of related expenses, on the underlying loans, and (ii) current subordination levels at both the individual loans which serve as collateral under the Company’s securities and at the securities themselves.
The Company’s assessment of cash flows, which is supplemented by third-party research reports and dialogue with market participants, combined with the Company’s ability and intent to hold its CMBS investments to maturity, at which point the Company expects to recover book value, is the basis for its conclusion the remainder of these investments are not other-than-temporarily impaired, despite the difference between the carrying value and fair value. The Company has considered the rating downgrades in its evaluation and apart from the two bonds noted above, it believes that the book value of its CMBS investments is recoverable at December 31, 2011. The Company attributes the current difference between carrying value and market value to current market conditions including a decrease demand in structured financial products and commercial real estate. The Company has concluded that, excluding its securities classified as available-for-sale with a carrying value of $775,812 as of December 31, 2011, it does not intend to sell these securities and it is not more likely than not it will be required to sell the securities before recovering the amortized costs basis.
In connection with a preferred equity investment, which was repaid in October 2006, the Company has guaranteed a portion of the outstanding principal balance of the first mortgage loan that is a financial obligation of the entity in which the Company was previously a preferred equity investor invested in the event of a borrower default under such loan. The loan matures in 2012. This guarantee in the event of a borrower default under such loan is considered to be an off-balance-sheet arrangement and will survive until the repayment of the first mortgage loan. As compensation, the Company received a credit enhancement fee of $125 from the borrower, which is recognized as the fair value of the guarantee and has been recorded on its consolidated balance sheet as a liability. The liability is amortized over the life of the guarantee using the straight-line method and corresponding fee income will be recorded. The Company’s maximum exposure under this guarantee is approximately $1,343 as of December 31, 2011. Under the terms of the guarantee, the investment sponsor is required to reimburse the Company for the entire amount paid under the guarantee until the guarantee expires.
4. Acquisitions
Whiteface Lodge
In April 2008, the Company acquired via a deed in lieu of foreclosure, a 40% interest in the Whiteface Lodge, a hotel and condominium located in Lake Placid, New York. In July 2010, the Company acquired the remaining 60% joint venture interest in the Whiteface Lodge for $4,550. The Company acquired the remaining interest to effect the business plan of the investment. The Whiteface Lodge is a fractional residential condominium complex. The Company acquired 521 unsold fractional residential condominium units of a total of 1,104 units and the related amenities for use by the unit owners and guests. The Company accounted for the acquisition of the remaining joint venture interest utilizing the purchase method of accounting and recorded a net impairment of $2,722. The Company calculated the fair value of the property using a discounted cash flow model for the hotel operations and sales of the fractional residential condominium units.
135
TABLE OF CONTENTS
Gramercy Capital Corp.
Notes To Consolidated Financial Statements
(Amounts in thousands, except share and per share data)
December 31, 2011
4. Acquisitions – (continued)
Pro Forma
The following table summarizes, on an unaudited pro forma basis, the Company’s combined results of operations for the year ended December 31, 2010 as though the acquisition of the Whiteface Lodge was completed on January 1, 2010. The supplemental pro forma operating data is not necessarily indicative of what the actual results of operations would have been assuming the transaction had been completed as set forth above, nor do they purport to represent the Company’s results of operations for future periods. In addition, the following supplement pro forma operating data does not present the sale of assets through December 31, 2010.
| | |
| | 2010 |
| Pro forma revenues | | $ | 185,296 | |
| Pro forma net income (loss) available to common stockholders | | $ | (967,407 | ) |
| Pro forma earnings per common share – basic | | $ | (19.38 | ) |
| Pro forma earnings per common share – diluted | | $ | (19.38 | ) |
| Pro forma common shares – basic | | | 49,923,930 | |
| Pro forma common share – diluted | | | 49,923,930 | |
5. Dispositions and Assets Held for Sale
During the years ended December 31, 2011, the Company sold 8 properties and a partial condemnation compared to 17 properties during the year ended December 31, 2010, for net sales proceeds of $22,894 and $54,474, respectively. The sales transactions resulted in gains totaling $2,712 and $2,589 for the years ended December 31, 2011 and 2010, respectively.
The Company separately classifies properties held for sale in the consolidated balance sheets and consolidated statement of operations. In the normal course of business the Company identifies non-strategic assets for sale. Changes in the market may compel the Company to decide to classify a property held for sale or classify a property that was designated as held for sale back to held for investment. During the year ended December 31, 2010, the Company did not reclassify any properties previously identified as held for sale to held for investment. During the year ended December 31, 2011, the Company did not reclassify any properties previously identified as held for sale to held for investment.
On September 1, 2011 and on December 1, 2011, the Company transferred to KBS or its affiliates, interests in entities owning 317 and 116, respectively, of the 867 Gramercy Realty properties that it agreed to transfer pursuant to the Settlement Agreement and the remaining ownership interests were transferred to KBS by December 15, 2011. The aggregate carrying value for the interests transferred to KBS was $2,631,902. In July 2011, the Dana portfolio, which consisted of 15 properties totaling approximately 3.8 million rentable square feet, was transferred to its mortgage lender through a deed in lieu of foreclosure. For further discussion of the impact of the Settlement Agreement and the transfer of the Dana portfolio, see Note 1 to these consolidated financial statements.
136
TABLE OF CONTENTS
Gramercy Capital Corp.
Notes To Consolidated Financial Statements
(Amounts in thousands, except share and per share data)
December 31, 2011
5. Dispositions and Assets Held for Sale – (continued)
The Company classified two properties as held for sale as of December 31, 2011 and 2010. The following table summarizes information for these properties:
| | | | |
| | December 31, 2011 | | December 31, 2010 |
Assets held for sale:
| | | | | | | | |
Real estate investments, at cost:
| | | | | | | | |
| Land | | $ | 14,430 | | | $ | 15,142 | |
| Building and improvement | | | 15,717 | | | | 11,612 | |
| Total real estate investments, at cost | | | 30,147 | | | | 26,754 | |
| Less: accumulated depreciation | | | (498 | ) | | | (202 | ) |
| Real estate investments held for sale, net | | | 29,649 | | | | 26,552 | |
| Accrued interest and receivables | | | 244 | | | | 398 | |
| Acquired lease asets, net of accumulated amortization | | | 4,500 | | | | — | |
| Deferred costs | | | 60 | | | | — | |
| Other assets | | | 8,512 | | | | 1,710 | |
| Total assets held for sale | | | 42,965 | | | | 28,660 | |
Liabilities related to assets held for sale:
| | | | | | | | |
| Accrued expenses | | | 386 | | | | 474 | |
| Deferred revenue | | | 20 | | | | 57 | |
| Below market lease liabilities, net of accumulated amortization | | | 1,302 | | | | — | |
| Total liabilities related to assets held for sale | | | 1,708 | | | | 531 | |
| Net assets held for sale | | $ | 41,257 | | | $ | 28,129 | |
The following operating results of the assets held for sale as of December 31, 2011, and the assets sold during the years ended December 31, 2011, 2010 and 2009 are included in discontinued operations for all periods presented:
| | | | | | |
| | Year Ended December 31, |
| | | 2011 | | 2010 | | 2009 |
Operating Results:
| | | | | | | | | | | | |
| Revenues | | $ | 358,954 | | | $ | 451,326 | | | $ | 467,546 | |
| Operating expenses | | | (156,536 | ) | | | (1,110,618 | ) | | | (234,394 | ) |
| Marketing, general and administrative | | | (2,529 | ) | | | (316 | ) | | | (1,024 | ) |
| Interest expense | | | (104,977 | ) | | | (116,108 | ) | | | (125,120 | ) |
| Depreciation and amortization | | | (62,942 | ) | | | (107,033 | ) | | | (112,026 | ) |
| Equity in net income from joint venture | | | (2,098 | ) | | | 8,120 | | | | 7,849 | |
| Net income (loss) from operations | | | 29,872 | | | | (874,629 | ) | | | 2,831 | |
| Net income (loss) from operations with a related party | | | — | | | | (9,759 | ) | | | — | |
| Income on sale of joint venture interests | | | — | | | | — | | | | 6,317 | |
| Loss on sale of joint venture interests to a related party | | | — | | | | (27,292 | ) | | | — | |
| Gain on extinguishment of debt | | | 285,634 | | | | — | | | | — | |
| Net gains from disposals | | | 2,712 | | | | 2,658 | | | | 5,180 | |
| Net income (loss) from discontinued operations | | $ | 318,218 | | | $ | (909,022 | ) | | $ | 14,328 | |
137
TABLE OF CONTENTS
Gramercy Capital Corp.
Notes To Consolidated Financial Statements
(Amounts in thousands, except share and per share data)
December 31, 2011
5. Dispositions and Assets Held for Sale – (continued)
Subsequent to December 31, 2011, the Company entered into agreements of sale on one property for approximately $2,350 with a total carrying value of $984 as of December 31, 2011, and net income of $42 for the year the ended December 31, 2011.
Discontinued operations have not been segregated in the Consolidated Statements of Cash Flows.
6. Investments in Joint Ventures
200 Franklin Square Drive, Somerset, New Jersey
The Company owns a 25% interest in the equity owner of a fee interest in 200 Franklin Square Drive, a 200,000 square foot building located in Somerset, New Jersey which is 100% net leased to Philips Holdings, USA Inc, a wholly-owned subsidiary of Royal Phillips Electronics through December 2021. As of December 31, 2011 and December 31, 2010, the investment has a carrying value of $496 and $746, respectively. The Company recorded its pro rata share of net income of the joint venture of $121, $120 and $114 for the years ended December 31, 2011, 2010 and 2009, respectively.
101 S. Marengo Avenue, Pasadena, California
In November 2005, the Company closed on the purchase of a 50% interest in an office building in Pasadena, CA. The Company also acquired an interest in certain related assets as part of the transaction. The 345,000 square foot office property, which was net leased to Bank of America through September 2015, assuming the exercise of options, and related collateral were acquired for $52,000 plus closing costs, using a non-recourse, $50,000, ten-year fixed-rate first mortgage loan. The Company sold its 50% interest in April 2009 for a gain of $6,317. For the years ended December 31, 2009 and 2008, the Company recorded its pro rata share of net losses of the joint ventures of $474 and $1,306, respectively, within discontinued operations.
2 Herald Square, New York, New York
In April 2007, the Company purchased for $103,200 a 45% Tenant-In-Common, or TIC, interest to acquire the fee interest in a parcel of land located at 2 Herald Square, located along 34th Street in New York, New York. The acquisition was financed with a $86,063 ten-year fixed rate mortgage loan. The property is subject to a long-term ground lease with an unaffiliated third party for a term of 70 years. The remaining TIC interest is owned by a wholly-owned subsidiary of SL Green. The TIC interests are pari-passu. The Company sold its 45% interest in December 2010 for a loss of $11,885. For the years ended December 31, 2011, 2010 and 2009 the Company recorded its pro rata share of net income of $0, $5,078 and $4,987 respectively, within discontinued operations.
885 Third Avenue, New York, New York
In July 2007, the Company purchased for $144,240 an investment in a 45% TIC interest to acquire a 79% fee interest and 21% leasehold interest in the fee position in a parcel of land located at 885 Third Avenue, on which is situated The Lipstick Building. The transaction was financed with a $120,443 ten-year fixed-rate mortgage loan. The property is subject to a 70-year leasehold ground lease with an unaffiliated third party. The remaining TIC interest is owned by a wholly-owned subsidiary of SL Green. The TIC interests are pari-passu. The Company sold its 45% interest in December 2010 for a loss of $15,407. The Company recorded its pro rata share of net income of $0, $5,926 and $5,972 for the years ended December 31, 2011, 2010 and 2009 respectively, within discontinued operations.
138
TABLE OF CONTENTS
Gramercy Capital Corp.
Notes To Consolidated Financial Statements
(Amounts in thousands, except share and per share data)
December 31, 2011
6. Investments in Joint Ventures – (continued)
Citizens Portfolio
The Company, through its acquisition of American Financial on April 1, 2008, obtained an interest in a joint venture with UBS. In October 2011, UBS contributed its 1% ownership interest to the Company and the Company has consolidated 100% of the joint venture interests and has consolidated its accounts. In December 2011, pursuant to the Settlement Agreement, the Citizens Portfolio was transitioned to KBS, in exchange for a mutual release of claims among the Company and the mortgage and mezzanine lenders and, subject to certain termination provisions, an arrangement for the Company’s continued management of the assets on behalf of KBS. The Company transitioned 52 bank branches totaling approximately 237,000 square feet to the mezzanine lender. These branches are fully occupied, on a triple-net basis, by Citizens Bank, N.A. and Charter One Bank, N.A., two bank subsidiaries of Citizens Financial Group, Inc. As of December 31, 2010, the investment had a carrying value of $2,904. For the year ended December 31, 2011, the Company recorded its pro rata share of net losses of the joint ventures of $2,097, within discontinued operations. The Company recorded its pro rata share of net loss of $0, $2,884 and $2,637 for the years ended December 31, 2011, 2010 and 2009, respectively.
Whiteface, Lake Placid, New York
In April 2008, the Company acquired via a deed-in-lieu of foreclosure, a 40% interest in the Whiteface Lodge, a hotel and condominium located in Lake Placid, New York. In July 2010, the company purchased the remaining 60% interest from the joint venture partner. In connection with the acquisition, the Company controls 100% of the joint venture’s interest and has consolidated its accounts. As of December 31, 2010, the joint venture investment had a carrying value of $23,820. The Company recorded its pro rata share of net loss of $1,375 and $0 for the years ended December 31, 2010 and 2009, respectively.
The condensed combined balance sheets for the Company’s joint ventures at December 31, 2011 and 2010 are as follows:
| | | | |
| | 2011 | | 2010 |
Assets:
| | | | | | | | |
| Real estate assets, net | | $ | 49,796 | | | $ | 660,412 | |
| Other assets | | | 8,546 | | | | 131,605 | |
| Total assets | | $ | 58,342 | | | $ | 792,017 | |
Liabilities and members' equity:
| | | | | | | | |
| Mortgages payable | | $ | 41,000 | | | $ | 565,711 | |
| Other liabilities | | | 1,711 | | | | 4,925 | |
| Members' equity | | | 15,631 | | | | 221,381 | |
| Liabilities and members' equity | | $ | 58,342 | | | $ | 792,017 | |
| Company's net investment in joint ventures | | $ | 496 | | | $ | 3,650 | |
139
TABLE OF CONTENTS
Gramercy Capital Corp.
Notes To Consolidated Financial Statements
(Amounts in thousands, except share and per share data)
December 31, 2011
6. Investments in Joint Ventures – (continued)
The condensed combined statements of income for the joint ventures for the three years ended December 31, 2011, 2010 and 2009 or partial period for acquisitions or dispositions which closed during these periods, are as follows:
| | | | | | |
| | 2011 | | 2010 | | 2009 |
| Revenues | | $ | 8,148 | | | $ | 65,628 | | | $ | 71,859 | |
| Operating expenses | | | 454 | | | | 4,875 | | | | 9,235 | |
| Interest | | | 5,578 | | | | 34,620 | | | | 36,706 | |
| Depreciation | | | 4,082 | | | | 5,494 | | | | 7,430 | |
| Total expenses | | | 10,114 | | | | 44,989 | | | | 53,371 | |
| Net income from operations | | | (1,966 | ) | | | 20,639 | | | | 18,488 | |
| Net gain on disposals | | | — | | | | — | | | | 18,720 | |
| Net income | | $ | (1,966 | ) | | $ | 20,639 | | | $ | 37,208 | |
| Company's equity in net loss within continuing operations | | $ | 121 | | | $ | 1,255 | | | $ | 113 | |
| Company's equity in net income within discontinued operations | | $ | (2,098 | ) | | $ | 8,120 | | | $ | 7,849 | |
7. Junior Subordinated Notes
In May 2005, August 2005 and January 2006, the Company completed issuances of $50,000 each in unsecured trust preferred securities through three Delaware Statutory Trusts, or DSTs, Gramercy Capital Trust I, or GCTI, Gramercy Capital Trust II, or GCTII, and Gramercy Capital Trust III, or GCT III, that were also wholly-owned subsidiaries of the Operating Partnership. The securities issued in May 2005 bore interest at a fixed rate of 7.57% for the first ten years ending June 2015 and the securities issued in August 2005 bore interest at a fixed rate of 7.75% for the first ten years ending October 2015. Thereafter, the rates were to float based on the three-month LIBOR plus 300 basis points. The securities issued in January 2006 bore interest at a fixed rate of 7.65% for the first ten years ending January 2016, with an effective rate of 7.43% when giving effect to the swap arrangement previously entered into in contemplation of this financing. Thereafter, the rate was to float based on the three-month LIBOR plus 270 basis points.
In January 2009, the Operating Partnership entered into an exchange agreement with the holders of the securities, pursuant to which the Operating Partnership and the holders agreed to exchange all of the previously issued trust preferred securities for newly issued unsecured junior subordinated notes, or the Junior Notes, in the aggregate principal amount of $150,000. The Junior Notes will mature on June 30, 2035, or the Maturity Date, and will bear (i) a fixed interest rate of 0.50% per annum for the period beginning on January 30, 2009 and ending on January 29, 2012 and (ii) a fixed interest rate of 7.50% per annum for the period commencing on January 30, 2012 through and including the Maturity Date. The Company, at its option, may redeem the Junior Notes in whole at any time, or in part from time to time, at a redemption price equal to 100% of the principal amount of the Junior Notes. The optional redemption of the Junior Notes in part must be made in at least $25,000 increments. The Junior Notes also contained additional covenants restricting, among other things, the Company’s ability to declare or pay any dividends during the calendar year 2009, or make any payment or redeem any debt securities ranked pari passu or junior to the Junior Notes. In connection with the exchange agreement, the final payment on the trust preferred securities for the period October 30, 2008 through January 29, 2009 was revised to be at a reduced interest rate of 0.50% per annum. In October 2009, a subsidiary of the Operating Partnership exchanged $97,500 of the Junior Notes for $97,533 face amount of bonds issued by the Company’s CDOs that the Company had repurchased in the open market. In June 2010, the Company redeemed the remaining $52,500 of junior subordinated notes by
140
TABLE OF CONTENTS
Gramercy Capital Corp.
Notes To Consolidated Financial Statements
(Amounts in thousands, except share and per share data)
December 31, 2011
7. Junior Subordinated Notes – (continued)
transferring an equivalent par value amount of various classes of bonds issued by the Company’s CDOs previously purchased by the Company in the open market, and cash equivalents of $5,000. This redemption eliminates the Company’s junior subordinated notes from its consolidated financial statements, which had an original balance of $150,000.
8. Collateralized Debt Obligations
During 2005, the Company issued approximately $1,000,000 of CDO bonds through two indirect subsidiaries, Gramercy Real Estate CDO 2005-1 Ltd., or the 2005 Issuer, and Gramercy Real Estate CDO 2005-1 LLC, or the 2005 Co-Issuer. At issuance, the CDO consisted of $810,500 of investment grade notes, $84,500 of non-investment grade notes, which were co-issued by the 2005 Issuer and the 2005 Co-Issuer, and $105,000 of preferred shares, which were issued by the 2005 Issuer. The investment grade notes were issued with floating rate coupons with a combined weighted average rate of three-month LIBOR plus 0.49%. The Company incurred approximately $11,957 of costs related to Gramercy Real Estate CDO 2005-1, which are amortized on a level-yield basis over the average life of the CDO.
During 2006, the Company issued approximately $1,000,000 of CDO bonds through two indirect subsidiaries, Gramercy Real Estate CDO 2006-1 Ltd., or the 2006 Issuer, and Gramercy Real Estate CDO 2006-1 LLC, or the 2006 Co-Issuer. At issuance, the CDO consisted of $903,750 of investment grade notes, $38,750 of non-investment grade notes, which were co-issued by the 2006 Issuer and the 2006 Co-Issuer, and $57,500 of preferred shares, which were issued by the 2006 Issuer. The investment grade notes were issued with floating rate coupons with a combined weighted average rate of three-month LIBOR plus 0.37%. The Company incurred approximately $11,364 of costs related to Gramercy Real Estate CDO 2006-1, which are amortized on a level-yield basis over the average life of the CDO.
In August 2007, the Company issued $1,100,000 of CDO bonds through two indirect subsidiaries, Gramercy Real Estate CDO 2007-1 Ltd., or the 2007 issuer and Gramercy Real Estate CDO 2007-1 LLC, or the 2007 Co-Issuer. At issuance, the CDO consisted of $1,045,550 of investment grade notes, $22,000 of non-investment grade notes, which were co-issued by the 2007 Issuer and the 2007 Co-Issuer, and $32,450 of preferred shares, which were issued by the 2007 Issuer. The investment grade notes were issued with floating rate coupons with a combined weighted average rate of three-month LIBOR plus 0.46%. The Company incurred approximately $16,816 of costs related to Gramercy Real Estate CDO 2007-1, which are amortized on a level-yield basis over the average life of the CDO.
In connection with the closing of the Company’s first CDO in July 2005, pursuant to the collateral management agreement, the Manager agreed to provide certain advisory and administrative services in relation to the collateral debt securities and other eligible investments securing the CDO notes. The collateral management agreement provides for a senior collateral management fee, payable quarterly in accordance with the priority of payments as set forth in the indenture, equal to 0.15% per annum of the net outstanding portfolio balance, and a subordinate collateral management fee, payable quarterly in accordance with the priority of payments as set forth in the indenture, equal to 0.25% per annum of the net outstanding portfolio balance. Net outstanding portfolio balance is the sum of the (i) aggregate principal balance of the collateral debt securities, excluding defaulted securities, (ii) aggregate principal balance of all principal proceeds held as cash and eligible investments in certain accounts, and (iii) with respect to the defaulted securities, the calculation amount of such defaulted securities. The collateral management agreement for the Company’s 2006 CDO provides for a senior collateral management fee, payable quarterly in accordance with the priority of payments as set forth in the indenture, equal to 0.15% per annum of the net outstanding portfolio balance, and a subordinate collateral management fee, payable quarterly in accordance with the priority of payments as set forth in the indenture, equal to 0.25% per annum of the net outstanding portfolio balance. Net outstanding portfolio balance is the sum of the (i) aggregate principal balance of the collateral debt securities, excluding
141
TABLE OF CONTENTS
Gramercy Capital Corp.
Notes To Consolidated Financial Statements
(Amounts in thousands, except share and per share data)
December 31, 2011
8. Collateralized Debt Obligations – (continued)
defaulted securities, (ii) aggregate principal balance of all principal proceeds held as cash and eligible investments in certain accounts, and (iii) with respect to the defaulted securities, the calculation amount of such defaulted securities. The collateral management agreement for the Company’s 2007 CDO provides for a senior collateral management fee, payable quarterly in accordance with the priority of payments as set forth in the indenture, equal to (i) 0.05% per annum of the aggregate principal balance of the CMBS securities, (ii) 0.10% per annum of the aggregate principal balance of loans, preferred equity securities, cash and certain defaulted securities, and (iii) a subordinate collateral management fee, payable quarterly in accordance with the priority of payments as set forth in the indenture, equal to 0.15% per annum of the aggregate principal balance of the loans, preferred equity securities, cash and certain defaulted securities.
The Company retained all non-investment grade securities, the preferred shares and the common shares in the Issuer of each CDO. The Issuers and Co-Issuers in each CDO holds assets, consisting primarily of whole loans, subordinate interests in whole loans, mezzanine loans, preferred equity investments and CMBS, which serve as collateral for the CDO. Each CDO may be replenished, pursuant to certain rating agency guidelines relating to credit quality and diversification, with substitute collateral using cash generated by debt investments that are repaid during the reinvestment periods (generally, five years from issuance) of the CDO. Thereafter, the CDO securities will be retired in sequential order from senior-most to junior-most as debt investments are repaid. The financial statements of the Issuer of each CDO are consolidated in the Company’s financial statements. The securities originally rated as investment grade at time of issuance are treated as a secured financing, and are non-recourse to the Company. Proceeds from the sale of the securities originally rated as investment grade in each CDO were used to repay substantially all outstanding debt under the Company’s repurchase agreements and to fund additional investments.
Loans and other investments are owned by the Issuers and the Co-Issuers, serve as collateral for the Company’s CDO securities, and the income generated from these investments is used to fund interest obligations of the Company’s CDO securities and the remaining income, if any, is retained by the Company. The CDO indentures contain minimum interest coverage and asset overcollateralization covenants that must be satisfied in order for the Company to receive cash flow on the interests retained in its CDOs and to receive the subordinate collateral management fee earned. If some or all of the Company’s CDOs fail these covenants, all cash flows from the applicable CDO other than senior collateral management fees would be diverted to repay principal and interest on the most senior outstanding CDO securities, and the Company may not receive some or all residual payments or the subordinate collateral management fee until the applicable CDO regained compliance with such tests.. As of January 2012, the most recent distribution date, the Company’s 2005 CDO and our 2006 CDO were in compliance with interest coverage and asset overcollateralization covenants, however the compliance margins were narrow and relatively small declines in collateral performance and credit metrics could cause the CDOs to fall out of compliance. The Company’s 2005 CDO failed its overcollateralization test at the October 2011, April 2011 and January 2011 distribution dates and the Company’s 2007 CDO failed its overcollateralization test beginning with the November 2009 distribution date.
During the year ended December 31, 2011, the Company repurchased, at a discount, $49,259 of notes previously issued by two of its three CDOs. The Company recorded a net gain on the early extinguishment of debt of $15,275 for the year ended December 31, 2011, in connection with the repurchase of notes of such Issuers. During the year ended December 31, 2010, the Company repurchased, at a discount, $39,000 of notes previously issued by two of its three CDOs. The Company recorded a net gain on the early extinguishment of debt of $19,443 for the year ended December 31, 2010, in connection with the repurchase of notes of such Issuers.
142
TABLE OF CONTENTS
Gramercy Capital Corp.
Notes To Consolidated Financial Statements
(Amounts in thousands, except share and per share data)
December 31, 2011
9. Debt Obligations
Unsecured Credit Facility
In May 2006, the Company closed on a $100,000 senior unsecured revolving credit facility with KeyBank National Association, or KeyBank, with an initial term of three years and a one-year extension option. In June 2007, the facility was increased to $175,000. In March 2009, the Company entered into an amendment and compromise agreement with KeyBank to settle and satisfy the loan obligations at a discount for a current cash payment of $45,000, and a future cash payment in a maximum amount of up to $15,000 from 50% of all payments from distributions after May 2009 from certain junior tranches and preferred classes of securities in the Company’s CDOs. The remaining balance of $85 in potential cash distribution is recorded in other liabilities on the Company’s balance sheet as of December 31, 2009 and was fully paid in January 2010. The Company recorded a net gain on extinguishment of debt of $107,229 as a result of to this agreement.
Mortgage and Mezzanine Loans
Certain real estate assets were subject to mortgage and mezzanine liens. In September 2011, the Company entered into the Settlement Agreement, for an orderly transition of substantially all of Gramercy Realty’s assets to KBS, Gramercy Realty’s senior mezzanine lender, in full satisfaction of Gramercy Realty’s obligations with respect to the Goldman Mortgage Loan and the Goldman Mezzanine Loans, in exchange for a mutual release of claims among the Company and the mortgage and mezzanine lenders and, subject to certain termination provisions, the Company’s continued management of Gramercy Realty’s assets on behalf of KBS for a fixed fee plus incentive fees. On September 1, 2011 and on December 1, 2011, the Company transferred to KBS or its affiliates, interests in entities owning 317 and 116, respectively, of the 867 Gramercy Realty properties that it agreed to transfer pursuant to the Settlement Agreement and the remaining ownership interests were transferred to KBS by December 15, 2011. The aggregate carrying value for the interests transferred to KBS was $2,631,902. In July 2011, the Dana portfolio, which consists of 15 properties totaling approximately 3.8 million rentable square feet, was transferred to its mortgage lender through a deed in lieu of foreclosure. For further discussion of the impact of the Settlement Agreement and the transfer of the Dana portfolio, see Settlement and Extinguishment of Debt within Note 2 to the consolidated financial statements.
Goldman Mortgage Loan
On April 1, 2008, certain subsidiaries of the Company, collectively, the Goldman Loan Borrowers, entered into a mortgage loan agreement, with GSMC, Citicorp and SL Green in connection with a mortgage loan in the amount of $250,000, which is secured by certain properties owned or ground leased by the Goldman Loan Borrowers. The Goldman Mortgage Loan had an initial maturity date of March 9, 2010, with a single one-year extension option. The Goldman Mortgage Loan bore interest at 4.35% over one-month LIBOR. The Goldman Mortgage Loan provided for customary events of default, the occurrence of which could result in an acceleration of all amounts payable under the Goldman Mortgage Loan. The Goldman Mortgage Loan allowed for prepayment under the terms of the agreement, as long as simultaneously therewith a proportionate prepayment of the Goldman Mezzanine Loan (discussed below) was also pre-paid. In August 2008, an amendment to the loan agreement described below was entered into for the Goldman Mortgage Loan in conjunction with the bifurcation of the Goldman Mezzanine loan into two separate mezzanine loans. Under this loan agreement amendment, the Goldman Mortgage Loan bore interest at 1.99% over LIBOR. The Company had accrued interest of $256 and borrowings of $240,523 as of December 31, 2010.
In March 2010, the Company extended the maturity date of the Goldman Mortgage Loan to March 2011, and amended certain terms of the loan agreement, including, among others, (i) a prohibition on distributions from the Goldman Loan Borrowers to the Company, other than to cover direct costs related to executing the extension and reimbursement of not more than $2,500 per quarter of corporate overhead actually incurred and
143
TABLE OF CONTENTS
Gramercy Capital Corp.
Notes To Consolidated Financial Statements
(Amounts in thousands, except share and per share data)
December 31, 2011
9. Debt Obligations – (continued)
allocated to Gramercy Realty, (ii) requirement of $5,000 of available cash on deposit in a designated account on the commencement date of the Goldman Mortgage Loan extension term, and (iii) within 90 days after the first day of the Goldman Mortgage Loan extension term, delivery by the Goldman Loan Borrowers to GSMC, Citicorp and SL Green of a comprehensive long-term business plan and restructuring proposal addressing repayment of the Goldman Mortgage Loan. Subsequent to the final maturity of the Goldman Mortgage Loan and the Goldman Mezzanine Loans, the Company entered into a series of short term extensions to provide additional time to exchange and consider proposals for an extension, modification, restructuring or refinancing of the Goldman Mortgage Loan and the Goldman Mezzanine Loans and to explore an orderly transition of the collateral to the lenders if such discussions failed. On May 9, 2011, the Company announced that the scheduled maturity of the Goldman Mortgage Loan and the Goldman Mezzanine Loans occurred without repayment and without an extension or restructuring of the loans by the lenders.
Notwithstanding the maturity and non-repayment of the loans, the Company maintained active communications with the lenders and in September 2011, the Company entered into the Settlement Agreement for an orderly transition of substantially all of Gramercy Realty’s assets to KBS, Gramercy Realty’s senior mezzanine lender, in full satisfaction of Gramercy Realty’s obligations with respect to the Goldman Mortgage Loan and the Goldman Mezzanine Loans, in exchange for a mutual release of claims among the Company and the mortgage and mezzanine lenders and, subject to certain termination provisions, the Company’s continued management of Gramercy Realty’s assets on behalf of KBS for a fixed fee plus incentive fees. On September 1, 2011 and on December 1, 2011, the Company transferred to KBS or its affiliates, interests in entities owning 317 and 116, respectively, of the 867 Gramercy Realty properties that the Company agreed to transfer pursuant to the Settlement Agreement and the remaining ownership interests were transferred to KBS by December 15, 2011. The aggregate carrying value for the interests transferred to KBS was $2,631,902. In July 2011, the Dana portfolio, which consisted of 15 properties totaling approximately 3.8 million rentable square feet, was transferred to its mortgage lender through a deed in lieu of foreclosure. For further discussion of the impact of the Settlement Agreement and the transfer of the Dana portfolio, see Settlement and Extinguishment of Debt within Note 2 to the consolidated financial statements.
Secured Term Loan
On April 1, 2008, First States Investors 3300 B, L.P., an indirect wholly-owned subsidiary of the Company, or the PB Loan Borrower, entered into a loan agreement, or the PB Loan Agreement, with PB Capital Corporation, as agent for itself and other lenders, in connection with a secured term loan in the amount of $240,000, or the PB Loan in part to refinance a portion of a portfolio known as the WBBD Portfolio. The PB Loan matures on April 1, 2013 and bears interest at a 1.65% over one-month LIBOR. The PB Loan is secured by mortgages on the 41 properties owned by the PB Loan Borrower and all other assets of the PB Loan Borrower. The PB Loan Agreement provides for customary events of default, the occurrence of which could result in an acceleration of all amounts payable under the PB Loan Agreement. The PB Loan Borrower may prepay the PB Loan, in whole or in part (in amounts equal to at least $1,000), on any date. The Company had accrued interest of $395 and borrowings $219,513 as of December 31, 2010. In 2011, pursuant to the Settlement Agreement with respect to Gramercy Realty’s $240,523 mortgage loan and Gramercy Realty’s $549,713 senior and junior mezzanine loans, the PB Loan and the related collateral was transitioned to KBS in December 2011, in exchange for a mutual release of claims among the Company and the mortgage and mezzanine lenders and, subject to certain termination provisions, an arrangement for the Company’s continued management of the assets on behalf KBS for a fixed fee plus incentive fees.
Goldman Senior and Junior Mezzanine Loans
On April 1, 2008, certain subsidiaries of the Company, collectively, the Mezzanine Borrowers, entered into a mezzanine loan agreement with GSMC, Citicorp and SL Green in connection with a mezzanine loan in the amount of $600,000, or the Goldman Mezzanine Loan, which was secured by pledges of certain equity
144
TABLE OF CONTENTS
Gramercy Capital Corp.
Notes To Consolidated Financial Statements
(Amounts in thousands, except share and per share data)
December 31, 2011
9. Debt Obligations – (continued)
interests owned by the Mezzanine Borrowers and any amounts receivable by the Mezzanine Borrowers whether by way of distributions or other sources. The Goldman Mezzanine Loan had an initial maturity date of March 9, 2010, with a single one-year extension option. The Goldman Mezzanine Loan bore interest at 4.35% over one-month LIBOR. The Goldman Mezzanine Loan provided for customary events of default, the occurrence of which could result in an acceleration of all amounts payable under the Goldman Mezzanine Loan. The Goldman Mezzanine Loan allowed for prepayment under the terms of the agreement, subject to a 1.00% prepayment fee during the first six months, payable to the lender, as long as simultaneously therewith a proportionate prepayment of the Goldman Mortgage Loan was also made on such date. In addition, under certain circumstances the Goldman Mezzanine Loan was cross-defaulted with events of default under the Goldman Mortgage Loan and with other mortgage loans pursuant to which, an indirect wholly-owned subsidiary of the Company, is the mortgagor. In August 2008, the $600,000 mezzanine loan was bifurcated into two separate mezzanine loans (the Junior Mezzanine loan and the Senior Mezzanine Loan) by the lenders. Additional loan agreement amendments were entered into for the Goldman Mezzanine Loan and Goldman Mortgage Loan. Under these loan agreement amendments, the Junior Mezzanine Loan bore interest at 6.00% over LIBOR, the Senior Mezzanine Loan bore interest at 5.20% over LIBOR and the Goldman Mortgage Loan bore interest at 1.99% over LIBOR. The weighted average of these interest rate spreads was equal to the combined weighted average of the interest rates spreads on the initial loans. The Goldman Mezzanine loans encumber all properties held by Gramercy Realty. The Company had accrued interest of $1,454 and borrowings of $549,713 as of December 31, 2010.
In March 2010, the Company extended the maturity date of the Goldman Mezzanine Loans to March 2011, and amended certain terms of the Senior Mezzanine Loan agreement and the Junior Mezzanine Loan agreement, including, among others, with respect to the Senior Mezzanine Loan agreement, (i) a prohibition on distributions from the Senior Mezzanine Loan borrowers to the Company, other than to cover direct costs related to executing the extension and reimbursement of not more than $2,500 per quarter of corporate overhead actually incurred and allocated to Gramercy Realty, (ii) requirement of $5,000 of available cash on deposit in a designated account on the commencement date of the Senior Mezzanine Loan extension term and agreement, upon request, to grant a security interest in that account to KBS, and (iii) within 90 days after the first day of the Senior Mezzanine Loan extension term, delivery by the Senior Mezzanine Loan borrowers to KBS of a comprehensive long-term business plan and restructuring proposal addressing repayment of the Senior Mezzanine Loan, and with respect to the Junior Mezzanine Loan agreement, (i) a prohibition on distributions from the Junior Mezzanine Loan borrower to the Company, other than to cover direct costs related to executing the extension and reimbursement of not more than $2,500 per quarter of corporate overhead actually incurred and allocated to Gramercy Realty, (ii) requirement of $5,000 of available cash on deposit in a designated account on the commencement date of the Junior Mezzanine Loan extension term and agreement, upon request, to grant a security interest in that account to GSMC, Citicorp and SL Green, and (iii) within 90 days after the first day of the Junior Mezzanine Loan extension term, delivery by the Junior Mezzanine Loan borrower to GSMC, Citicorp and SL Green of a comprehensive long-term business plan and restructuring proposal addressing repayment of the Junior Mezzanine Loan. Subsequent to the final maturity of the Goldman Mortgage Loan and the Goldman Mezzanine Loans, the Company entered into a series of short term extensions to provide additional time to exchange and consider proposals for an extension, modification, restructuring or refinancing of the Goldman Mortgage Loan and the Goldman Mezzanine Loans and to explore an orderly transition of the collateral to the lenders if such discussions failed. On May 9, 2011, the Company announced that the scheduled maturity of the Goldman Mortgage Loan and the Goldman Mezzanine Loans occurred without repayment and without an extension or restructuring of the loans by the lenders.
Notwithstanding the maturity and non-repayment of the loans, the Company maintained active communications with the lenders and in September 2011, the Company entered into the Settlement
145
TABLE OF CONTENTS
Gramercy Capital Corp.
Notes To Consolidated Financial Statements
(Amounts in thousands, except share and per share data)
December 31, 2011
9. Debt Obligations – (continued)
Agreement, for an orderly transition of substantially all of Gramercy Realty’s assets to KBS, in full satisfaction of Gramercy Realty’s obligations with respect to the Goldman Mortgage Loan and the Goldman Mezzanine Loans, in exchange for a mutual release of claims among the Company and the mortgage and mezzanine lenders and, subject to certain termination provisions, the Company’s continued management of Gramercy Realty’s assets on behalf of KBS for a fixed fee plus incentive fees. On September 1, 2011 and on December 1, 2011, the Company transferred to KBS or its affiliates, interests in entities owning 317 and 116, respectively, of the 867 Gramercy Realty properties that the Company agreed to transfer pursuant to the Settlement Agreement and the remaining ownership interests were transferred to KBS by December 15, 2011. The aggregate carrying value for the interests transferred to KBS was $2,631,902. In July 2011, the Dana portfolio, which consists of 15 properties totaling approximately 3.8 million rentable square feet, was transferred to its mortgage lender through a deed in lieu of foreclosure. For further discussion of the impact of the Settlement Agreement and the transfer of the Dana portfolio, see Settlement and Extinguishment of Debt within Note 2 to the consolidated financial statements.
Combined aggregate principal maturities of the Company’s consolidated CDOs, as of December 31, 2011 are as follows:
| | | | | | |
| | CDOs | | Interest Payments | | Total |
| 2012 | | $ | — | | | $ | 75,721 | | | $ | 75,721 | |
| 2013 | | | — | | | | 71,002 | | | | 71,002 | |
| 2014 | | | — | | | | 74,702 | | | | 74,702 | |
| 2015 | | | — | | | | 83,239 | | | | 83,239 | |
| 2016 | | | — | | | | 92,863 | | | | 92,863 | |
| Thereafter | | | 2,468,810 | | | | 109,535 | | | | 2,578,345 | |
| Total | | $ | 2,468,810 | | | $ | 507,062 | | | $ | 2,975,872 | |
10. Leasing Agreements
The Company’s properties are leased and subleased to tenants under operating leases with expiration dates extending through the year 2031. These leases generally contain rent increases and renewal options. In September 2011, pursuant to the Settlement Agreement, substantially all of Gramercy Realty’s assets and liabilities, including its leasing agreements, were transitioned to KBS, in exchange for a mutual release of claims among the Company and the mortgage and mezzanine lenders and, subject to certain termination provisions, an arrangement for the Company’s continued management of Gramercy Realty’s assets on behalf of KBS for a fixed fee plus incentive fees.
Future minimum rental payments under non-cancelable leases, excluding reimbursements for operating expenses, as of December 31, 2011 are as follows:
| | |
| | Operating Leases |
| 2012 | | $ | 3,181 | |
| 2013 | | | 1,984 | |
| 2014 | | | 1,908 | |
| 2015 | | | 1,886 | |
| 2016 | | | 1,795 | |
| Thereafter | | | 6,435 | |
| Total minimum lease payments | | $ | 17,189 | |
146
TABLE OF CONTENTS
Gramercy Capital Corp.
Notes To Consolidated Financial Statements
(Amounts in thousands, except share and per share data)
December 31, 2011
11. Related Party Transactions
In connection with its initial public offering, the Company entered into a management agreement with the Manager, which was subsequently amended and restated in April 2006. The management agreement was further amended in September 2007, and amended and restated in October 2008 and was subsequently terminated in April 2009 in connection with the internalization. The management agreement provided for a term through December 2009 with automatic one-year extension options and was subject to certain termination rights. The Company paid the Manager an annual management fee equal to 1.75% of the Company’s gross stockholders equity (as defined in the management agreement) inclusive of the Company’s trust preferred securities. In October 2008, the Company entered into the second amended and restated management agreement with the Manager which generally contained the same terms and conditions as the amended and restated management agreement, as amended, except for the following material changes: (1) reduced the annual base management fee to 1.50% of the Company’s gross stockholders equity; (2) reduces the termination fee to an amount equal to the management fee earned by the Manager during the 12 months preceding the termination date; and (3) commencing July 2008, all fees in connection with collateral management agreements were to be remitted by the Manager to the Company. The Company incurred expense to the Manager under this agreement of an aggregate of $0, $0, and $7,534 for the years ended December 31, 2011, 2010 and 2009 respectively.
Prior to the internalization, the Company was obligated to reimburse the Manager for its costs incurred under an asset servicing agreement between the Manager and an affiliate of SL Green OP and a separate outsource agreement between the Manager and SL Green OP. The asset servicing agreement, which was amended and restated in April 2006, provided for an annual fee payable to SL Green OP by the Company of 0.05% of the book value of all credit tenant lease assets and non-investment grade bonds and 0.15% of the book value of all other assets. The outsource agreement provided for an annual fee payable by the Company, which became $2,814 per year subsequent to the closing of the American Financial merger to reflect higher costs resulting from the increased size and number of assets of the combined company, increasing 3% annually over the prior year on the anniversary date of the outsource agreement in August of each year. For the year ended December 31, 2008, the Company realized expense of $1,721 to the Manager under the outsource agreement. For the year ended December 31, 2008, the Company realized expense of $4,022 to the Manager, under the asset servicing agreement. In October 2008, the outsource agreement was terminated and the asset servicing agreement was replaced with that certain interim asset servicing agreement between the Manager and an affiliate of SL Green, pursuant to which the Company was obligated to reimburse the Manager for its costs incurred there under from October 2008 until April 24, 2009 when such agreement was terminated in connection with the internalization. Pursuant to that agreement, the SL Green affiliate acted as the rated special servicer to the Company’s CDOs, for a fee equal to two basis points per year on the carrying value of the specially serviced loans assigned to it. Concurrent with the internalization, the interim asset servicing agreement was terminated and the Manager entered into a special servicing agreement with an affiliate of SL Green, pursuant to which the SL Green affiliate agreed to act as the rated special servicer to the Company’s CDOs for a period beginning on April 24, 2009 through the date that is the earlier of (i) 60 days thereafter and (ii) a date on which a new special servicing agreement is entered into between the Manager and a rated third-party special servicer. The SL Green affiliate was entitled to a servicing fee equal to (i) 25 basis points per year on the outstanding principal balance of assets with respect to certain specially serviced assets and (ii) two basis points per year on the outstanding principal balance of assets with respect to certain other assets. The April 24, 2009 agreement expired effective June 23, 2009. Effective May 2009, the Company entered into new special servicing arrangements with Situs Serve, L.P., which became the rated special servicer for the Company’s CDOs. An affiliate of SL Green continues to provide special servicing services with respect to a limited number of loans owned by the Company that are secured by properties in New York
147
TABLE OF CONTENTS
Gramercy Capital Corp.
Notes To Consolidated Financial Statements
(Amounts in thousands, except share and per share data)
December 31, 2011
11. Related Party Transactions – (continued)
City, or in which the Company and SL Green are co-investors. For the years ended December 31, 2011, 2010 and 2009 the Company incurred expense of $3,058, $477 and $1,014, respectively, pursuant to the special servicing arrangement.
Commencing in May 2005, the Company is party to a lease agreement with SLG Graybar Sublease LLC, an affiliate of SL Green, for its corporate offices at 420 Lexington Avenue, New York, New York. The lease is for approximately 7,300 square feet and carries a term of 10 years with rents of approximately $249 per annum for year one rising to $315 per annum in year ten. In May and June 2009, the Company amended its lease with SLG Graybar Sublease LLC to increase the leased premises by approximately 2,260 square feet. The additional premises is leased on a co-terminus basis with the remainder of its leased premises and carries rents of approximately $103 per annum during the initial year and $123 per annum during the final lease year. For the years ended December 31, 2011, 2010 and 2009, the Company paid $307, $339 and $437 under this lease, respectively.
In March 2006, the Company closed on the purchase of a $25,000 mezzanine loan to a joint venture in which SL Green was an equity holder, which bears interest at one-month LIBOR plus 8.00%. The mezzanine loan was repaid in full on May 9, 2006, when the Company originated a $90,287 whole loan, which bears interest at one-month LIBOR plus 2.75%, to the joint venture. The whole loan is secured by office and industrial properties in northern New Jersey and has a book value of $24,478 and $24,821 as of December 31, 2011 and December 31, 2010, respectively.
In April 2007, the Company purchased for $103,200 a 45% TIC interest to acquire the fee interest in a parcel of land located at 2 Herald Square, located along 34th Street in New York, New York. The acquisition was financed with $86,063 10- year fixed rate mortgage loan. The property is subject to a long-term ground lease with an unaffiliated third party for a term of 70 years. The remaining TIC interest is owned by a wholly-owned subsidiary of SL Green. The TIC interests are pari-passu. The Company sold its 45% interest in December 2010 to a wholly-owned subsidiary of SL Green for net proceeds of $25,350, resulting in a loss of $11,885. The Company recorded its pro rata share of net income of $5,078 and $4,988 for the years ended December 31, 2010 and 2009, respectively.
In July 2007, the Company purchased for $144,240 an investment in a 45% TIC interest to acquire a 79% fee interest and 21% leasehold interest in the fee position in a parcel of land located at 885 Third Avenue, on which is situated The Lipstick Building. The transaction was financed with a $120,443 10-year fixed rate mortgage loan. The property is subject to a 70-year leasehold ground lease with an unaffiliated third party. The remaining TIC interest is owned by a wholly-owned subsidiary of SL Green. The TIC interests are pari passu. The Company sold its 45% interest in December 2010 to a wholly-owned subsidiary of SL Green for net proceeds of $38,911, resulting in a loss of $15,407. The Company recorded its pro rata share of net income of $5,926 and $5,972 for the years ended December 31, 2010 and 2009, respectively.
In September 2007, the Company acquired a 50% interest in a $25,000 senior mezzanine loan from SL Green. Immediately thereafter, the Company, along with SL Green, sold all of its interests in the loan to an unaffiliated third party. Additionally, the Company acquired from SL Green a 100% interest in a $25,000 junior mezzanine loan associated with the same properties as the preceding senior mezzanine loan. Immediately thereafter the Company participated 50% of its interest in the loan back to SL Green. As of December 31, 2011 and December 31, 2010, the loan had a book value of $0. In October 2007, the Company acquired a 50% pari-passu interest in $57,795 of two additional tranches in the senior mezzanine loan from an unaffiliated third party. At closing, an affiliate of SL Green simultaneously acquired the other 50% pari-passu interest in the two tranches. As of December 31, 2011 and December 31, 2010, the loan has a book value of $0. The Company held a contingent interest in the property which was sold to SL Green in December 2010 for $2,016.
148
TABLE OF CONTENTS
Gramercy Capital Corp.
Notes To Consolidated Financial Statements
(Amounts in thousands, except share and per share data)
December 31, 2011
11. Related Party Transactions – (continued)
In December 2007, the Company acquired a $52,000 interest in a senior mezzanine loan from a financial institution. Immediately thereafter, the Company participated 50% of its interest in the loan to an affiliate of SL Green. The investment, which is secured by an office building in New York, New York, was purchased at a discount and bears interest at an effective spread to one-month LIBOR of 5.00%. In July 2009, the Company sold its remaining interest in the loan to an affiliate of SL Green for $16,120 pursuant to purchase rights established when the loan was acquired. The sale also included a contingent participation in future net proceeds from SL Green of up to $1,040 in excess of the purchase price upon their ultimate disposition of the loan, which was surrendered and cancelled in December 2010 in connection with certain transactions that the Company consummated with wholly-owned subsidiaries of SL Green.
In December 2007, the Company acquired a 50% interest in a $200,000 senior mezzanine loan from a financial institution. Immediately thereafter, the Company participated 50% of the Company’s interest in the loan to an affiliate of SL Green. The investment was purchased at a discount and bears interest at an effective spread to one-month LIBOR of 6.50%. In December 2010, the Company subsequently purchased from an affiliate of SL Green, its full participation in the senior mezzanine loan at a discount. In September 2011, a portion of the subsequently purchased mezzanine loan was converted to preferred equity. As of December 31, 2011 and December 31, 2010, the original loan has a book value of $250 and $5,224, respectively, and the subsequently purchased mezzanine loan has a book value of $7,337 and $13,586, respectively, and the preferred equity investment has a book value of $3,365 and $0, respectively.
In August 2008, the Company closed on the purchase from an SL Green affiliate of a $9,375 pari-passu participation interest in $18,750 first mortgage. The loan is secured by a retail shopping center located in Staten Island, New York. The investment bears interest at a fixed rate of 6.50%. In December 2010, the Company purchased the remaining 50% interest in the loan from an SL Green affiliate for a discount of $9,420. As of December 31, 2011 and 2010 the loan has a book value of approximately $19,419 and $19,367, respectively.
In September 2008, the Company closed on the purchase from an SL Green affiliate of a $30,000 interest in a $135,000 mezzanine loan. The loan is secured by the borrower’s interests in a retail condominium located New York, New York. The investment bears interest at an effective spread to one-month LIBOR of 10.00%. As of December 31, 2010, the loan has a book value of $27,778. In December 2010, the Company sold its contingent interest to SL Green for $300. In March 2011, the loan was paid in full by the borrower.
In December 2010, the Company sold its interest in a parcel of land located at 292 Madison Avenue in New York, New York to a wholly-owned subsidiary of SL Green. The Company received proceeds of $16,765 and recorded an impairment charge of $9,759.
12. Deferred Costs
Deferred costs at December 31, 2011 and December 31, 2010 consisted of the following:
| | | | |
| | 2011 | | 2010 |
| Deferred Financing Costs | | $ | 47,035 | | | $ | 73,756 | |
| Deferred Acquisition Costs | | | 256 | | | | 132 | |
| Deferred Leasing Costs | | | 214 | | | | 4,701 | |
| | | | 47,505 | | | | 78,589 | |
| Accumulated Amortization | | | (36,398 | ) | | | (55,689 | ) |
| | | | 11,107 | | | | 22,900 | |
| Less: Held for Sale | | | (60 | ) | | | — | |
| | | $ | 11,047 | | | $ | 22,900 | |
149
TABLE OF CONTENTS
Gramercy Capital Corp.
Notes To Consolidated Financial Statements
(Amounts in thousands, except share and per share data)
December 31, 2011
12. Deferred Costs – (continued)
At December 31, 2011, deferred financing costs relate to the Company’s CDOs. At December 31, 2010, deferred financing costs relate to the Company’s CDOs, the Goldman Mortgage Loan, the Goldman Senior and Junior Mezzanine Loans the PB Loan Agreement and Mortgage Loans. These costs are amortized on a straight-line basis to interest expense based on the contractual term of the related financing.
Deferred acquisition costs consist of fees and direct costs incurred to originate the Company’s investments and are amortized using the effective yield method over the related term of the investment. Straight-line expense approximates the effective interest method.
Deferred leasing costs include direct costs incurred to initiate and renew operating leases and are amortized on a straight-line basis over the related lease term.
13. Fair Value of Financial Instruments
The Company discloses fair value information about financial instruments, whether or not recognized in the statement of financial condition, for which it is practicable to estimate that value. In cases where quoted market prices are not available, fair values are based upon the application of discount rates to estimated future cash flows based upon market yields or by using other valuation methodologies. Considerable judgment is necessary to interpret market data and develop estimated fair value. Accordingly, fair values are not necessarily indicative of the amounts the Company could realize on disposition of the financial instruments. The use of different market assumptions and/or estimation methodologies may have a material effect on estimated fair value amounts.
The following table presents the carrying value in the financial statements, and approximate fair value of other financial instruments at December 31, 2011 and 2010:
| | | | | | | | |
| | December 31, 2011 | | December 31, 2010 |
| | | Carrying Value | | Fair Value | | Carrying Value | | Fair Value |
Financial assets:
| | | | | | | | | | | | | | | | |
| Government securities | | $ | — | | | $ | — | | | $ | 92,918 | | | $ | 97,247 | |
| Lending investments(2) | | $ | 1,081,919 | | | $ | 1,060,646 | | | $ | 1,123,528 | | | $ | 1,117,743 | |
| CMBS(1) | | $ | 775,812 | | | $ | 775,812 | | | $ | 1,005,167 | | | $ | 900,815 | |
| Derivative instruments | | $ | 919 | | | $ | 919 | | | $ | 1,636 | | | $ | 1,636 | |
Financial liabilities:
| | | | | | | | | | | | | | | | |
| Mortgage note payable and senior and junior mezzanine loans | | $ | — | | | $ | — | | | $ | 2,190,384 | | | $ | 1,679,029 | |
| Collateralized debt obligations(2) | | $ | 2,468,810 | | | $ | 1,509,907 | | | $ | 2,682,321 | | | $ | 1,704,338 | |
| Derivative instruments | | $ | 175,915 | | | $ | 175,915 | | | $ | — | | | $ | — | |
| (1) | As of March 31, 2011, the Company changed its intent and may sell its CMBS investments prior to maturity. As a result, at March 31, 2011, the CMBS investments were reclassified to available-for-sale from held-to-maturity. As a result, on the consolidated balance sheet, the CMBS investments are recorded at fair value at December 31, 2011. |
| (2) | As December 31, 2011, lending investment and collateralized debt obligations are classified as Level III due to significance of unobservable inputs which are based upon management assumptions. |
150
TABLE OF CONTENTS
Gramercy Capital Corp.
Notes To Consolidated Financial Statements
(Amounts in thousands, except share and per share data)
December 31, 2011
13. Fair Value of Financial Instruments – (continued)
The following methods and assumptions were used to estimate the fair value of each class of financial instruments for which it is practicable to estimate the value:
Cash and cash equivalents, accrued interest, and accounts payable: These balances in the consolidated financial statements reasonably approximate their fair values due to the short maturities of these items.
Government Securities: The Company maintains a portfolio of treasury securities that are pledged to provide principal and interest payments for mortgage debt previously collateralized by properties in the Company’s real estate portfolio. These securities are presented in the consolidated financial statements on a held-to-maturity basis and not at fair value. The fair values were based upon valuations obtained from dealers of those securities.
Lending investments: These instruments are presented in the consolidated financial statements at the lower of cost or market value and not at fair value. The fair values were estimated by using market yields floating rate and fixed rate (as appropriate) loans with similar credit characteristics.
CMBS — held-to-maturity: These investments are presented in the consolidated financial statements on a held-to-maturity basis and not at fair value. The fair values were based upon valuations obtained from dealers of those securities, and internal models.
CMBS available for sale: These investments are presented in the consolidated financial statements at fair value, not held-to-maturity basis. The fair values were based upon valuations obtained from dealers of those securities, and internal models.
Mortgage note payable and senior and junior mezzanine loans: These obligations are presented in the consolidated financial statements based on the actual balance outstanding and not at fair value. The fair value was estimated using discounted cash flows methodology, using discount rates that best reflect current market interest rates for financing with similar characteristics and credit quality.
Collateralized debt obligations: These obligations are presented in the consolidated financial statements on the basis of proceeds received at issuance and not at fair value. The fair value was estimated based upon the amount at which similarly placed financial instruments would be valued today.
Derivative instruments: The Company’s derivative instruments, which are primarily comprised of interest rate swap agreements, are carried at fair value in the consolidated financial statements based upon third party valuations.
Disclosure about fair value of financial instruments is based on pertinent information available to the Company at December 31, 2011 and 2010. Although the Company is not aware of any factors that would significantly affect the reasonable fair value amounts, such amounts have not been comprehensively revalued for the purpose of these financial statements since December 31, 2011 and 2010 and current estimates of fair value may differ significantly from the amounts presented herein.
The following discussion of fair value was determined by the Company using available market information and appropriate valuation methodologies. Considerable judgment is necessary to interpret market data and develop estimated fair value. Accordingly, fair values are not necessarily indicative of the amounts the Company could realize on disposition of the financial instruments. Financial instruments with readily available active quoted prices or for which fair value can be measured from actively quoted prices generally will have a higher degree of pricing observability and a lesser degree of judgment utilized in measuring fair value. Conversely, financial instruments rarely traded or not quoted will generally have less, or no, pricing observability and a higher degree of judgment utilized in measuring fair value. The use of different market assumptions and/or estimation methodologies may have a material effect on estimated fair value amounts.
151
TABLE OF CONTENTS
Gramercy Capital Corp.
Notes To Consolidated Financial Statements
(Amounts in thousands, except share and per share data)
December 31, 2011
13. Fair Value of Financial Instruments – (continued)
Determining which category an asset or liability falls within the hierarchy requires significant judgment and the Company evaluates its hierarchy disclosures each quarter.
Fair Value on a Recurring Basis
Assets and liabilities measured at fair value on a recurring basis are categorized in the table below based upon the lowest level of significant input to the valuations.
| | | | | | | | |
| At December 31, 2011 | | Total | | Level I | | Level II | | Level III |
Financial Assets:
| | | | | | | | | | | | | | | | |
Derivative instruments:
| | | | | | | | | | | | | | | | |
| Interest rate caps | | $ | 919 | | | $ | — | | | $ | — | | | $ | 919 | |
| Interest rate swaps | | | — | | | | — | | | | — | | | | — | |
| | | $ | 919 | | | $ | — | | | $ | — | | | $ | 919 | |
CMBS available for sale:
| | | | | | | | | | | | | | | | |
| Investment grade | | $ | 444,113 | | | $ | — | | | $ | — | | | $ | 444,113 | |
| Non-investment grade | | | 331,699 | | | | — | | | | — | | | | 331,699 | |
| | | $ | 775,812 | | | $ | — | | | $ | — | | | $ | 775,812 | |
Financial Liabilities:
| | | | | | | | | | | | | | | | |
Derivative instruments:
| | | | | | | | | | | | | | | | |
| Interest rate caps | | $ | — | | | $ | — | | | $ | — | | | $ | — | |
| Interest rate swaps | | | 175,915 | | | | — | | | | — | | | | 175,915 | |
| | | $ | 175,915 | | | $ | — | | | $ | — | | | $ | 175,915 | |
| | | | | | | | |
| At December 31, 2010 | | Total | | Level I | | Level II | | Level III |
Financial Assets:
| | | | | | | | | | | | | | | | |
Derivative instruments:
| | | | | | | | | | | | | | | | |
| Interest rate caps | | $ | 1,636 | | | $ | — | | | $ | — | | | $ | 1,636 | |
| Interest rate swaps | | | — | | | | — | | | | — | | | | — | |
| | | $ | 1,636 | | | $ | — | | | $ | — | | | $ | 1,636 | |
CMBS available for sale:
| | | | | | | | | | | | | | | | |
| Investment grade | | $ | 20,607 | | | $ | — | | | $ | — | | | $ | 20,607 | |
| Non-investment grade | | | 11,282 | | | | — | | | | — | | | | 11,282 | |
| | | $ | 31,889 | | | $ | — | | | $ | — | | | $ | 31,889 | |
Financial Liabilities:
| | | | | | | | | | | | | | | | |
Derivative instruments:
| | | | | | | | | | | | | | | | |
| Interest rate caps | | $ | — | | | $ | — | | | $ | — | | | $ | — | |
| Interest rate swaps | | | 157,932 | | | | — | | | | — | | | | 157,932 | |
| | | $ | 157,932 | | | $ | — | | | $ | — | | | $ | 157,932 | |
Derivative instruments: Interest rate caps and swaps were valued using advice from a third party derivative specialist, based on a combination of observable market-based inputs, such as interest rate curves, and unobservable inputs such as credit valuation adjustments due to the risk of non-performance by both the Company and its counterparties. See Note 17 for additional details on the Company’s interest rate caps and swaps. Derivatives were classified as Level III due to the significance of the credit valuation allowance which is based upon less observable inputs.
152
TABLE OF CONTENTS
Gramercy Capital Corp.
Notes To Consolidated Financial Statements
(Amounts in thousands, except share and per share data)
December 31, 2011
13. Fair Value of Financial Instruments – (continued)
Total losses from derivatives for the year ended December 31, 2011 is $19,334 and is included in Accumulated Other Comprehensive Loss. During the year ended December 31, 2011, the Company entered into four interest rate caps for a total purchase price of $1,277.
CMBS available for sale: CMBS securities are generally valued by a combination of (i) obtaining assessments from third-party dealers and (ii) in limited cases where such assessments are unavailable or, in the opinion of management, deemed not to be indicative of fair value, discounting expected cash flows using internal cash flow models and estimated market discount rates. In the case of internal models, expected cash flows of each security are based on management’s assumptions regarding the collection of principal and interest on the underlying loans and securities. The table above includes only securities which were classified as available for sale as of December 31, 2011.
The following roll forward table reconciles the beginning and ending balances of financial assets measured at fair value on a recurring basis using Level III inputs:
| | | | | | |
| | CMBS
available for
sale – investment
grade | | CMBS
available for
sale – non-investment
grade | | Derivative
instruments |
| Balance as of December 31, 2010 | | $ | 20,607 | | | $ | 11,282 | | | $ | 1,636 | |
| Transfers from securites held to maturity | | | 461,602 | | | | 515,763 | | | | — | |
| Purchases of CMBS investments | | | 84,887 | | | | — | | | | — | |
| Change in CMBS investment status | | | (28,354 | ) | | | 28,354 | | | | — | |
| Purchases of derivative investments | | | — | | | | — | | | | 1,319 | |
| Amortization of discounts for securities available for sale in prior quarter | | | 6,707 | | | | 4,664 | | | | — | |
| Proceeds from sales of CMBS investments | | | (44,017 | ) | | | (21,567 | ) | | | — | |
Adjustments to fair value:
| | | | | | | | | | | | |
| Included in other comprehensive income | | | (62,518 | ) | | | (198,302 | ) | | | (2,036 | ) |
| Gain (loss) from sales of CMBS investments | | | 5,199 | | | | 9,927 | | | | — | |
| Other-than-temporary impairments | | | — | | | | (18,422 | ) | | | — | |
| Balance as of December 31, 2011 | | $ | 444,113 | | | $ | 331,699 | | | $ | 919 | |
The following roll forward table reconciles the beginning and ending balances of financial liabilities measured at fair value on a recurring basis using Level III inputs:
| | |
| | Derivative instruments –
interest rate swaps |
| Balance as of December 31, 2010 | | $ | 157,932 | |
| Purchases of derivative investments | | | — | |
Adjustments to fair value:
| | | | |
| Unrealized loss | | | 17,983 | |
| Balance as of December 31, 2011 | | $ | 175,915 | |
153
TABLE OF CONTENTS
Gramercy Capital Corp.
Notes To Consolidated Financial Statements
(Amounts in thousands, except share and per share data)
December 31, 2011
13. Fair Value of Financial Instruments – (continued)
Fair Value on a Non-Recurring Basis
The Company uses fair value measurements on a nonrecurring basis in its assessment of assets classified as loans and other lending investments, which are reported at cost and have been written down to fair value as a result of valuation allowances established for loan losses and commercial mortgage-backed securities which are reported at cost and have been written down to fair value due to other-than-temporary impairments. The following table shows the fair value hierarchy for those assets measured at fair value on a non-recurring basis based upon the lowest level of significant input to the valuations for which a non-recurring change in fair value has been recorded during the years ended December 31, 2011 and 2010:
| | | | | | | | |
| At December 31, 2011 | | Total | | Level I | | Level II | | Level III |
Financial Assets:
| | | | | | | | | | | | | | | | |
Lending investments:
| | | | | | | | | | | | | | | | |
| Whole loans | | $ | 132,261 | | | $ | — | | | $ | — | | | $ | 132,261 | |
| Subordinate interests in whole loans | | | 3,514 | | | | — | | | | — | | | | 3,514 | |
| Mezzanine loans | | | — | | | | — | | | | — | | | | — | |
| Preferred equity | | | 4,910 | | | | — | | | | — | | | | 4,910 | |
| | | $ | 140,685 | | | $ | — | | | $ | — | | | $ | 140,685 | |
CMBS available for sale:
| | | | | | | | | | | | | | | | |
| Investment grade | | $ | — | | | $ | — | | | $ | — | | | $ | — | |
| Non-investment grade | | | 59,738 | | | | — | | | | — | | | | 59,738 | |
| | | $ | 59,738 | | | $ | — | | | $ | — | | | $ | 59,738 | |
| | | | | | | | |
| At December 31, 2010 | | Total | | Level I | | Level II | | Level III |
Assets:
| | | | | | | | | | | | | | | | |
Real estate investments:
| | | | | | | | | | | | | | | | |
| Office | | $ | 1,097,535 | | | $ | — | | | $ | — | | | $ | 1,097,535 | |
| Branch | | | 484,629 | | | | — | | | | — | | | | 484,629 | |
| Land | | | — | | | | — | | | | — | | | | — | |
| | | $ | 1,582,164 | | | $ | — | | | $ | — | | | $ | 1,582,164 | |
Lending investments:
| | | | | | | | | | | | | | | | |
| Whole loans | | $ | 212,633 | | | $ | — | | | $ | — | | | $ | 212,633 | |
| Subordinate interests in whole loans | | | — | | | | — | | | | — | | | | — | |
| Mezzanine loans | | | 22,337 | | | | — | | | | — | | | | 22,337 | |
| Preferred equity | | | — | | | | — | | | | — | | | | — | |
| | | $ | 234,970 | | | $ | — | | | $ | — | | | $ | 234,970 | |
The total change in fair value of financial instruments for which a fair value adjustment has been included in the consolidated statement of operations for the years ended December 31, 2011 and 2010 were $48,180 and $84,392, respectively.
154
TABLE OF CONTENTS
Gramercy Capital Corp.
Notes To Consolidated Financial Statements
(Amounts in thousands, except share and per share data)
December 31, 2011
13. Fair Value of Financial Instruments – (continued)
Real Estate investments: The properties identified for impairment are collateral under the Goldman Mezzanine Loans. The impairment is calculated by comparing the company’s internally developed discounted cash flow methodology to the carrying value of the respective property. The discounted cash flows require significant judgmental inputs on each property, which include assumptions regarding capitalization rates, lease-up periods, future occupancy rates, market rental rates, holding periods, capital improvements and other factors deemed necessary by management.
Loans subject to impairments or reserves for loan loss: The loans identified for impairment or reserves for loan loss are collateral dependant loans. Impairment or reserves for loan loss on these loans are measured by comparing management’s estimation of fair value of the underlying collateral to the carrying value of the respective loan. These valuations require significant judgments, which include assumptions regarding capitalization rates, leasing, creditworthiness of major tenants, occupancy rates, availability of financing, exit plan, loan sponsorship, actions of other lenders and other factors deemed necessary by management.
CMBS: CMBS securities which are other-than-temporarily impaired are generally valued by a combination of (i) obtaining assessments from third-party dealers and, (ii) in limited cases where such assessments are unavailable or, in the opinion of management deemed not to be indicative of fair value, discounting expected cash flows using internal cash flow models and estimated market discount rates. In the case of internal models, expected cash flows of each security are based on management’s assumptions regarding the collection of principal and interest on the underlying loans and securities. The table above includes only securities which were impaired during the year ended December 31, 2010. Previously impaired securities have been subsequently adjusted for amortization, and are therefore no longer reported at fair value as of December 31, 2011.
The valuations derived from pricing models may include adjustments to the financial instruments. These adjustments may be made when, in management’s judgment, either the size of the position in the financial instrument or other features of the financial instrument such as its complexity, or the market in which the financial instrument is traded (such as counterparty, credit, concentration or liquidity) require that an adjustment be made to the value derived from the pricing models. Additionally, an adjustment from the price derived from a model typically reflects management’s judgment that other participants in the market for the financial instrument being measured at fair value would also consider such an adjustment in pricing that same financial instrument.
Assets and liabilities presented at fair value and categorized as Level III are generally those that are marked to model using relevant empirical data to extrapolate an estimated fair value. The models’ inputs reflect assumptions that market participants would use in pricing the instrument in a current period transaction and outcomes from the models represent an exit price and expected future cash flows. The parameters and inputs are adjusted for assumptions about risk and current market conditions. Changes to inputs in valuation models are not changes to valuation methodologies; rather, the inputs are modified to reflect direct or indirect impacts on asset classes from changes in market conditions. Accordingly, results from valuation models in one period may not be indicative of future period measurements.
14. Stockholders’ Equity
The Company’s authorized capital stock consists of 125,000,000 shares, $0.001 par value, of which the Company has authorized the issuance of up to 100,000,000 shares of common stock, $0.001 par value per share, and 25,000,000 shares of preferred stock, par value $0.001 per share. As of December 31, 2011, 51,086,266 shares of common stock and 3,525,822 shares of preferred stock were issued and outstanding.
155
TABLE OF CONTENTS
Gramercy Capital Corp.
Notes To Consolidated Financial Statements
(Amounts in thousands, except share and per share data)
December 31, 2011
14. Stockholders’ Equity – (continued)
Preferred Stock
In April 2007, the Company issued 4,600,000 shares of its 8.125% Series A cumulative redeemable preferred stock (including the underwriters’ over-allotment option of 600,000 shares) with a mandatory liquidation preference of $25.00 per share. Holders of the Series A cumulative redeemable preferred shares are entitled to receive annual dividends of $2.03125 per share on a quarterly basis and dividends are cumulative, subject to certain provisions. On or after April 18, 2012, the Company may at its option redeem the Series A cumulative redeemable preferred stock at par for cash. Net proceeds (after deducting underwriting fees and expenses) from the offering were approximately $111,205.
In November 2010, the Company settled a tender offer to purchase up to 4,000,000 shares of our Series A preferred stock for $15.00 per preferred share, net to seller in cash. In the aggregate, we paid approximately $16,620 to acquire the 1,074,178 shares of the Series A preferred stock tendered and not withdrawn. The shares of Series A preferred stock acquired by the Company were retired upon receipt and accrued and unpaid dividends of $4,364 or $4.0625 per share of the acquired preferred stock were eliminated. After settlement of the tender offer, 3,525,822 shares of Series A preferred stock remain outstanding for trading on the NYSE.
The $13,713 excess of the $30,332 carrying value of the tendered preferred stock, including accrued dividends of $4,364, over the $16,620 of consideration paid was recorded as a decrease to net loss available to common stockholders.
Beginning with the fourth quarter of 2008, the Company’s board of directors elected not to pay the quarterly Series A preferred stock dividends of $0.50781 per share. As of December 31, 2011 and 2010, the Company accrued Series A preferred stock dividends of $23,276 and $16,114, respectively.
Equity Incentive Plan
As part of the Company’s initial public offering, the Company instituted its Equity Incentive Plan. The Equity Incentive Plan, as amended, authorizes (i) the grant of stock options that qualify as incentive stock options under Section 422 of the Internal Revenue Code, or ISOs, (ii) the grant of stock options that do not qualify, or NQSOs, (iii) the grant of stock options in lieu of cash directors’ fees and (iv) grants of shares of restricted and unrestricted common stock. The exercise price of stock options will be determined by the compensation committee, but may not be less than 100% of the fair market value of the shares of common stock on the date of grant. At December 31, 2011, 1,123,197 shares of common stock were available for issuance under the Equity Incentive Plan.
Options granted under the Equity Incentive Plan to recipients who are employees of Gramercy are exercisable at the fair market value on the date of grant and, subject to termination of employment, expire ten years from the date of grant, are not transferable other than on death, and are exercisable in three to four annual installments commencing one year from the date of grant. In some instances, options may be granted under the Equity Incentive Plan to persons who provide significant services to the Company but are not employees of the Company. Options granted to recipients that are not employees have the same terms as those issued to employees except as it relates to any performance-based provisions within the grant. To the extent there are performance provisions associated with a grant to a recipient who is not an employee, an estimated expense related to these options is recognized over the vesting period and the final expense is reconciled at the point performance has been met, or the measurement date. If no performance based provision exists, the fair value of the options is calculated on a quarterly basis and the related expense is recognized over the vesting period.
156
TABLE OF CONTENTS
Gramercy Capital Corp.
Notes To Consolidated Financial Statements
(Amounts in thousands, except share and per share data)
December 31, 2011
14. Stockholders’ Equity – (continued)
A summary of the status of the Company’s stock options as of December 31, 2011 and 2010 are presented below:
| | | | | | | | |
| | December 31, 2011 | | December 31, 2010 |
| | | Options
Outstanding | | Weighted
Average
Excerise
Price | | Options
Outstanding | | Weighted
Average
Excerise Price |
| Balance at beginning of period | | | 841,377 | | | $ | 11.82 | | | | 1,516,394 | | | $ | 16.70 | |
| Granted | | | 25,000 | | | | 2.79 | | | | 25,000 | | | | 2.73 | |
| Exercised | | | (300,000 | ) | | | 0.80 | | | | — | | | | — | |
| Lapsed or cancelled | | | (1,351 | ) | | | 22.50 | | | | (700,017 | ) | | | 22.07 | |
| Balance at end of period | | | 565,026 | | | $ | 17.25 | | | | 841,377 | | | $ | 11.82 | |
For the year ended December 31, 2011, all options were granted with a price of $2.79. The remaining weighted average contractual life of the options was 4.3 years. Compensation expense of $138, $180 and $119 was recorded for the years ended December 31, 2011, 2010 and 2009, respectively, related to the issuance of stock options.
The Company has issued LTIP unit awards to certain executives. During 2011 the Company entered into an amendment to LTIP unit award agreement with two executives to cancel the vesting schedule of outstanding LTIP units in the Partnership (“LTIP Units”) and grant a new vesting schedule with respect to such LTIP Units. The new vesting schedule provides for 50% of each executive's LTIP Units to vest on June 30, 2012 subject to continued employment and an additional 50% of each Executive's LTIP Units to vest upon the satisfaction of certain vesting conditions relating to the settlement of the Company's mortgage and mezzanine loans. Compensation expense of $1,433, $266 and $306 was recorded for the years ended December 31, 2011, 2010 and 2009, respectively, related to the issuance and modification of LTIP units.
Through December 31, 2011, 1,727,988 restricted shares had been issued under the Equity Incentive Plan, of which 61% have vested. The vested and unvested shares are currently entitled to receive distributions on common stock if declared by the Company. Holders of restricted shares are prohibited from selling such shares until they vest but are provided the ability to vote such shares beginning on the date of grant. Compensation expense of $301, $369 and $333 was recorded for the years ended December 31, 2011, 2010 and 2009, respectively, related to the issuance of restricted shares.
Employee Stock Purchase Plan
In November 2007, the Company’s board of directors adopted, and the stockholders subsequently approved in June 2008, the 2008 Employee Stock Purchase Plan, or ESPP, to provide equity-based incentives to eligible employees. The ESPP is intended to qualify as an “employee stock purchase plan” under Section 423 of the Internal Revenue Code of 1986, as amended, and has been adopted by the board to enable the Company’s eligible employees to purchase its shares of common stock through payroll deductions. The ESPP became effective on January 1, 2008 with a maximum of 250,000 shares of the common stock available for issuance, subject to adjustment upon a merger, reorganization, stock split or other similar corporate change. The Company filed a registration statement on Form S-8 with the Securities and Exchange Commission with respect to the ESPP. The common stock is offered for purchase through a series of successive offering periods. Each offering period will be three months in duration and will begin on the first day of each calendar quarter, with the first offering period having commenced on January 1, 2008. The ESPP provides for eligible employees to purchase the common stock at a purchase price equal to 85% of the lesser of (1) the market value of the common stock on the first day of the offering period or (2) the market value of the common stock on the last day of the offering period.
157
TABLE OF CONTENTS
Gramercy Capital Corp.
Notes To Consolidated Financial Statements
(Amounts in thousands, except share and per share data)
December 31, 2011
14. Stockholders’ Equity – (continued)
Deferred Stock Compensation Plan for Directors
Under the Company’s Independent Director’s Deferral Program, which commenced April 2005, the Company’s independent directors may elect to defer up to 100% of their annual retainer fee, chairman fees and meeting fees. Unless otherwise elected by a participant, fees deferred under the program shall be credited in the form of phantom stock units. The phantom stock units are convertible into an equal number of shares of common stock upon such directors’ termination of service from the board of directors or a change in control by the Company, as defined by the program. Phantom stock units are credited to each independent director quarterly using the closing price of the Company’s common stock on the applicable dividend record date for the respective quarter. If dividends are declared by the Company, each participating independent director who elects to receive fees in the form of phantom stock units has the option to have their account credited for an equivalent amount of phantom stock units based on the dividend rate for each quarter or have dividends paid in cash.
As of December 31, 2011, there were approximately 499,143 phantom stock units outstanding, of which 499,143 units are vested.
Earnings per Share
Earnings per share for the years ended 2011, 2010 and 2009 are computed as follows:
| | | | | | |
| | For the Year Ended December 31,(1) |
| | | 2011 | | 2010 | | 2009 |
Numerator – Income (loss)
| | | | | | | | | | | | |
| Net income (loss) from continuing operations | | $ | 19,259 | | | $ | (64,521 | ) | | $ | (534,727 | ) |
| Net income (loss) from discontinued operations | | | 318,218 | | | | (909,167 | ) | | | 15,098 | |
| Net Income (loss) | | | 337,477 | | | | (973,688 | ) | | | (519,629 | ) |
| Preferred stock dividends | | | (7,162 | ) | | | (8,798 | ) | | | (9,414 | ) |
| Excess of carrying amount of tendered preferred stock over consideration paid | | | — | | | | 13,713 | | | | — | |
| Numerator for basic income per share – Net income (loss) available to common stockholders: | | | 330,315 | | | | (968,773 | ) | | | (529,043 | ) |
| Effect of dilutive securities | | | — | | | | — | | | | — | |
Diluted Earnings:
| | | | | | | | | | | | |
| Net income (loss) available to common stockholders | | $ | 330,315 | | | $ | (968,773 | ) | | $ | (529,043 | ) |
Denominator – Weighted Average shares:
| | | | | | | | | | | | |
| Denominator for basic income per share – weighted average shares | | | 50,229,102 | | | | 49,923,930 | | | | 49,854,174 | |
Effect of dilutive securities
| | | | | | | | | | | | |
| LTIP | | | 237,107 | | | | | | | | | |
| Stock based compensation plans | | | 24,811 | | | | — | | | | — | |
| Phantom stock units | | | 499,143 | | | | — | | | | — | |
| Diluted shares | | | 50,990,163 | | | | 49,923,930 | | | | 49,854,174 | |
| (1) | Net income (loss) adjusted for non-controlling interests. |
Diluted income (loss) per share assumes the conversion of all common share equivalents into an equivalent number of common shares if the effect is not anti-dilutive. For the year ended December 31, 2010,
158
TABLE OF CONTENTS
Gramercy Capital Corp.
Notes To Consolidated Financial Statements
(Amounts in thousands, except share and per share data)
December 31, 2011
14. Stockholders’ Equity – (continued)
208,821 share options and 414,108 phantom share units, respectively, were computed using the treasury share method, which due to the net loss were anti-dilutive. For the year ended December 31, 2009, 179,990 share options and 272,652 phantom share units, respectively, were computed using the treasury share method, which due to the net loss were anti-dilutive.
Accumulated other comprehensive income (loss) for the years ended December 31, 2011 and 2010 is comprised of the following:
| | | | |
| | December 31,
2011 | | December 31,
2010 |
| Net unrealized loss on held-to-maturity securities | | $ | — | | | $ | — | |
| Net realized and unrealized losses on interest rate swap and cap agreements accounted for as cash flow hedges | | | (182,102 | ) | | | — | |
| Net unrealized loss on available-for-sale securities | | | (258,837 | ) | | | (160,785 | ) |
| Total accumulated other comprehensive loss | | $ | (440,939 | ) | | $ | (160,785 | ) |
15. Benefit Plans
In June 2009, the Company implemented a 401(K) Savings/Retirement Plan, or the 401(K) Plan, to cover eligible employees of the Company, and any designated affiliate. The 401(K) Plan permits eligible employees to defer up to 15% of their annual compensation, subject to certain limitations imposed by the Code. The employees’ elective deferrals are immediately vested and non-forfeitable. The 401(K) Plan provides for discretionary matching contributions by the Company. Prior to the implementation of the 401(K) Plan, as an affiliate of SL Green, the Company’s employees were eligible to participate in a 401(K) Savings/Retirement Plan implemented by SL Green. Except for the 401(k) Plan, at December 31, 2011, the Company did not maintain a defined benefit pension plan, post-retirement health and welfare plan or other benefit plans. The expense associated with the Company’s matching contribution was $218, $367 and $62 for the years ended December 31, 2011, 2010 and 2009, respectively.
16. Commitments and Contingencies
Two of the Company’s subsidiaries are named as defendants in a case captioned Colfin JIH Funding LLC and CDCF JIH Funding, LLC, or Colony, v. Gramercy Warehouse Funding I LLC and Gramercy Loan Services LLC, which is pending in New York State Supreme Court, New York County. The dispute arises from the financing of the Jameson Inns and Signature Inns. Colony has asserted a breach of contract claim against the subsidiaries and is seeking to recover at least $80,000, which represents the amounts of the mezzanine loans held by Colony, and at least $8,000 in enforcement costs, plus attorneys’ fees. On January 23, 2012, the subsidiaries filed counterclaims against Colony for breach of contract, tortious interference with contract, breach of the covenant of good faith and fair dealing, and civil conspiracy, and are seeking to recover at least $80,000 in compensatory damages, as well as certain punitive damages and certain costs and fees. The Company’s subsidiaries intend to vigorously defend the claims asserted against them and to pursue all counterclaims against Colony. Colony has moved to dismiss the counterclaims. This matter is in its preliminary stages, and accordingly, the Company is not able to assess the likelihood of an unfavorable outcome or estimate the range of potential loss, if any.
The same two of the Company’s subsidiaries are named as defendants in the case captioned U.S. Bank National Association, as Trustee et al v. Gramercy Warehouse Funding I LLC and Gramercy Loan Services LLC, which is pending in New York State Supreme Court, New York County. The dispute arises from the same financing of the Jameson Inns and Signature Inns. U.S. Bank National Association, or U.S. Bank, by and through its attorney in fact, Wells Fargo Bank, N.A., has asserted a breach of contract claim against the subsidiaries and is seeking to recover at least $164,000 which represents the amount of U.S. Bank’s mortgage
159
TABLE OF CONTENTS
Gramercy Capital Corp.
Notes To Consolidated Financial Statements
(Amounts in thousands, except share and per share data)
December 31, 2011
16. Commitments and Contingencies – (continued)
loan, plus attorneys’ fees and enforcement costs. On January 25, 2012, the subsidiaries filed an answer to U.S. Bank’s complaint. The Company’s subsidiaries intend to vigorously defend the claims asserted against them. This matter is in its preliminary stages, and accordingly, the Company is not able to assess the likelihood of an unfavorable outcome or estimate the range of potential loss, if any.
The Company and certain of our subsidiaries are also named as defendants in an action brought by a former consultant alleging breach of contract and other claims and seeking to recover certain payments alleged to be due under a now-terminated consulting arrangement between the company and the consultant. The Company intends to vigorously defend the claims asserted against it. The Company has assessed the likelihood of an unfavorable outcome and has accrued $600 which approximates its estimate of potential loss.
The Company’s corporate offices at 420 Lexington Avenue, New York, New York are subject to an operating lease agreement with SLG Graybar Sublease LLC, an affiliate of SL Green, effective May 1, 2005. The lease is for approximately 7,300 square feet and carries a term of 10 years with rents of approximately $249 per annum for year one rising to $315 per annum in year ten. In May and June 2009, the Company amended its lease with SLG Graybar Sublease LLC to increase the leased premises by approximately 2,260 square feet. The additional premises is leased on a co-terminus basis with the remainder of the Company’s leased premises and carries rents of approximately $103 per annum during the initial lease year and $123 per annum during the final lease year.
As of December 31, 2011, the Company has a ground lease with an expiration date extending through 2016. These lease obligations generally contain rent increases and renewal options.
Future minimum lease payments under non-cancelable operating leases as of December 31, 2011 are as follows:
| | |
| | Operating
Leases |
| 2012 | | $ | 332 | |
| 2013 | | | 337 | |
| 2014 | | | 343 | |
| 2015 | | | 161 | |
| 2016 | | | 3 | |
| Thereafter | | | — | |
| Total minimum lease payments | | $ | 1,176 | |
The Company, through certain of its subsidiaries, may be required in its role in connection with its CDOs, to repurchase loans that it contributed to its CDOs in the event of breaches of certain representations or warranties provided at the time the CDOs were formed and the loans contributed. These obligations do not relate to the credit performance of the loans or other collateral contributed to the CDOs, but only to breaches of specific representations and warranties. Since inception, the Company has not been required to make any repurchases.
Certain real estate assets are pledged as collateral for mortgage loans held by two of its CDOs.
17. Financial Instruments: Derivatives and Hedging
The Company recognizes all derivatives on the balance sheet at fair value. Derivatives that are not hedges must be adjusted to fair value through income. If a derivative is a hedge, depending on the nature of the hedge, changes in the fair value of the derivative will either be offset against the change in fair value of the hedged asset, liability or firm commitment through earnings, or recognized in other comprehensive income until the hedged item is recognized in earnings. The ineffective portion of a derivative’s change in fair value
160
TABLE OF CONTENTS
Gramercy Capital Corp.
Notes To Consolidated Financial Statements
(Amounts in thousands, except share and per share data)
December 31, 2011
17. Financial Instruments: Derivatives and Hedging – (continued)
will be immediately recognized in earnings. Derivative accounting may increase or decrease reported net income and stockholders’ equity prospectively, depending on future levels of LIBOR interest rates and other variables affecting the fair values of derivative instruments and hedged items, but will have no effect on cash flows, provided the contract is carried through to full term.
The following table summarizes the notional and fair value of the Company’s derivative financial instruments at December 31, 2011. The notional value is an indication of the extent of the Company’s involvement in this instrument at that time, but does not represent exposure to credit, interest rate or market risks:
| | | | | | | | | | | | |
| | Benchmark Rate | | Notional
Value | | Strike Rate | | Effective
Date | | Expiration
Date | | Fair Value |
Assets of Non-VIEs:
| | | | | | | | | | | | | | | | | | | | | | | | |
| Interest Rate Cap | | | 3 month LIBOR | | | $ | 38,500 | | | | 6.00 | % | | | Jul-10 | | | | Jul-12 | | | $ | — | |
| Interest Rate Cap | | | 1 month LIBOR | | | | 24,000 | | | | 5.00 | % | | | Jul-11 | | | | Aug-14 | | | | 6 | |
| | | | | | | | 62,500 | | | | | | | | | | | | | | | | 6 | |
Assets of Consolidated VIEs:
| | | | | | | | | | | | | | | | | | | | | | | | |
| Interest Rate Cap | | | 3 month LIBOR | | | | 10,613 | | | | 4.73 | % | | | Dec-10 | | | | Feb-15 | | | | 9 | |
| Interest Rate Cap | | | 3 month LIBOR | | | | 8,877 | | | | 5.04 | % | | | Oct-10 | | | | Feb-16 | | | | 25 | |
| Interest Rate Cap | | | 3 month LIBOR | | | | 47,000 | | | | 7.95 | % | | | Jun-11 | | | | Feb-17 | | | | 144 | |
| Interest Rate Cap | | | 3 month LIBOR | | | | 12,300 | | | | 7.95 | % | | | Jul-11 | | | | Feb-17 | | | | 38 | |
| Interest Rate Cap | | | 3 month LIBOR | | | | 23,000 | | | | 4.96 | % | | | Jun-10 | | | | Apr-17 | | | | 89 | |
| Interest Rate Cap | | | 3 month LIBOR | | | | 48,945 | | | | 4.80 | % | | | Mar-10 | | | | Jul-17 | | | | 326 | |
| Interest Rate Cap | | | 3 month LIBOR | | | | 49,620 | | | | 4.92 | % | | | Jun-11 | | | | Jul-17 | | | | 282 | |
| | | | | | | | 200,355 | | | | | | | | | | | | | | | | 913 | |
Liabilities of Consolidated VIEs:
| | | | | | | | | | | | | | | | | | | | | | | | |
| Interest Rate Swap | | | 3 month LIBOR | | | | 4,700 | | | | 3.17 | % | | | Apr-08 | | | | Apr-12 | | | | (38 | ) |
| Interest Rate Swap | | | 3 month LIBOR | | | | 10,000 | | | | 3.92 | % | | | Oct-08 | | | | Oct-13 | | | | (556 | ) |
| Interest Rate Swap | | | 3 month LIBOR | | | | 17,500 | | | | 3.92 | % | | | Oct-08 | | | | Oct-13 | | | | (972 | ) |
| Interest Rate Swap | | | 1 month LIBOR | | | | 8,814 | | | | 4.26 | % | | | Aug-08 | | | | Jan-15 | | | | (868 | ) |
| Interest Rate Swap | | | 3 month LIBOR | | | | 14,650 | | | | 4.43 | % | | | Nov-07 | | | | Jul-15 | | | | (1,658 | ) |
| Interest Rate Swap | | | 3 month LIBOR | | | | 24,143 | | | | 5.11 | % | | | Feb-08 | | | | Jan-17 | | | | (4,100 | ) |
| Interest Rate Swap | | | 3 month LIBOR | | | | 279,604 | | | | 5.41 | % | | | Aug-07 | | | | May-17 | | | | (38,320 | ) |
| Interest Rate Swap | | | 3 month LIBOR | | | | 16,412 | | | | 5.20 | % | | | Feb-08 | | | | May-17 | | | | (2,972 | ) |
| Interest Rate Swap | | | 3 month LIBOR | | | | 699,442 | | | | 5.33 | % | | | Aug-07 | | | | Jan-18 | | | | (126,431 | ) |
| | | | | | | | 1,075,265 | | | | | | | | | | | | | | | | (175,915 | ) |
| Total | | | | | | $ | 1,338,120 | | | | | | | | | | | | | | | $ | (174,996 | ) |
The Company is hedging exposure to variability in future interest payments on its debt facilities. At December 31, 2011 and 2010, derivative instruments were reported at their fair value as a net liability of $174,996 and $156,269, respectively. Offsetting adjustments are represented as deferred gains in Accumulated Other Comprehensive Income of $19,334 and $70,603, which includes the amortization of gain or (loss) on terminated hedges of $400 and $201 for the years ended December 31, 2011 and 2010, respectively. The Company anticipates recognizing approximately $399 in amortization over the next 12 months. For the years ended December 31, 2011, 2010 and 2009, the Company recognized decreases to interest expense of $169,
161
TABLE OF CONTENTS
Gramercy Capital Corp.
Notes To Consolidated Financial Statements
(Amounts in thousands, except share and per share data)
December 31, 2011
17. Financial Instruments: Derivatives and Hedging – (continued)
$207 and $9, respectively, attributable to any ineffective component of its derivative instruments designated as cash flow hedges. Currently, all but two derivative instruments are designated as cash flow hedging instruments. Over time, the realized and unrealized gains and losses held in Accumulated Other Comprehensive Income will be reclassified into earnings in the same periods in which the hedged interest payments affect earnings.
18. Income Taxes
The Company has elected to be taxed as a REIT, under Sections 856 through 860 of the Internal Revenue Code beginning with its taxable year ended December 31, 2004. To qualify as a REIT, the Company must meet certain organizational and operational requirements, including a requirement to distribute at least 90% of its ordinary taxable income to stockholders. As a REIT, the Company generally will not be subject to U.S. federal income tax on taxable income that it distributes to its stockholders. If the Company fails to qualify as a REIT in any taxable year, it will then be subject to U.S. federal income taxes on taxable income at regular corporate rates and will not be permitted to qualify for treatment as a REIT for U.S. federal income tax purposes for four years following the year during which qualification is lost unless the Internal Revenue Service grants the Company relief under certain statutory provisions. Such an event could materially adversely affect the Company’s net income and net cash available for distributions to stockholders. However, the Company believes that it is organized and will operate in such a manner as to qualify for treatment as a REIT and the Company intends to operate in the foreseeable future in such a manner so that it will qualify as a REIT for U.S. federal income tax purposes. The Company may, however, be subject to certain state and local taxes.
Beginning with the third quarter of 2008, the Company’s board of directors elected to not pay dividend to common stockholders. The board of directors also elected not to pay the Series A preferred stock dividend of $0.50781 per share beginning with the fourth quarter of 2008. The unpaid preferred stock dividend has been accrued for thirteen quarters as of December 31, 2011. Based on current estimates of its taxable loss, the Company has no distribution requirements in order to maintain its REIT status for the 2011 tax year and it expects that it will continue to elect to retain capital for liquidity purposes until required to make a cash distribution to satisfy its REIT requirements. However, in accordance with the provisions of the Company’s charter, the Company may not pay any dividends on its common stock until all accrued dividends and the dividend for the then current quarter on the Series A preferred stock are paid in full.
For the years ended December 31, 2011, 2010 and 2009, the Company recorded $563, $966 and $2,495 of income tax expense, respectively. Tax expense for the year ended December 31, 2011 is comprised of federal, state and local taxes. Tax expense for the year ended December 31, 2010 is comprised entirely of state and local taxes. Included in tax expense for the years ended December 31, 2009 is an accrual for state income taxes on the gain from extinguishment of debt. Under federal law, the Company was allowed to defer those gains until 2014, however, not all states followed the federal rule.
As of December 31, 2011, the Company and each of its six subsidiaries which file corporate tax returns, had total net loss carryforwards, inclusive of net operating losses and capital losses, of approximately $498,000. Net operating loss carryforwards and capital loss carryforwards can generally be used to offset future ordinary income and capital gains of the entity originating the losses, for up to 20 years and 5 years, respectively. The amounts of net operating loss carryforwards and capital loss carryforwards as of December 31, 2011 are subject to the completion of the 2011 tax returns. In January 2011, the Company and two of its subsidiaries experienced an ownership change, as defined for purposes of Section 382 of the Internal Revenue Code of 1986, as amended. In general, an “ownership change” occurs if there is a change in ownership of more than 50% of its common stock during a cumulative three year period. For this purpose, determinations of ownership changes are generally limited to shareholders deemed to own 5% or more of the
162
TABLE OF CONTENTS
Gramercy Capital Corp.
Notes To Consolidated Financial Statements
(Amounts in thousands, except share and per share data)
December 31, 2011
18. Income Taxes – (continued)
Company’s common stock. The provisions of Section 382 will apply an annual limit to the amount of net loss carryforwards that can be used to offset future ordinary income and capital gains, beginning with the 2011 taxable year.
The Company’s policy for interest and penalties, if any, on material uncertain tax positions recognized in the financial statements is to classify these as interest expense and operating expense, respectively. As of December 31, 2011, 2010 and 2009, the Company did not incur any material interest or penalties.
19. Environmental Matters
The Company believes that it is in compliance in all material respects with applicable Federal, state and local ordinances and regulations regarding environmental issues. Its management is not aware of any environmental liability that it believes would have a materially adverse impact on the Company’s financial position, results of operations or cash flows.
20. Segment Reporting
The Company has determined that it has two reportable operating segments: Finance and Realty. The reportable segments were determined based on the management approach, which looks to the Company’s internal organizational structure. These two lines of business require different support infrastructures.
The Realty segment includes substantially all of the Company’s activities related to property management and investment of commercial properties leased primarily to regulated financial institutions and affiliated users through-out the United States. The Realty segment generates revenues from fee income related to the interim management agreement for properties owned by KBS and generates rental revenues from properties owned by the Company.
The Finance segment includes all of the Company’s activities related to origination, acquisition and portfolio management of whole loans, bridge loans, subordinate interests in whole loans, mezzanine loans, preferred equity, CMBS and other real estate related securities. The Finance segment primarily generates revenues from interest income on loans, other lending investments and CMBS owned in the Company’s CDOs.
163
TABLE OF CONTENTS
Gramercy Capital Corp.
Notes To Consolidated Financial Statements
(Amounts in thousands, except share and per share data)
December 31, 2011
20. Segment Reporting – (continued)
The Company evaluates performance based on the following financial measures for each segment:
| | | | | | | | |
| | Finance | | Realty | | Corporate/
Other(1) | | Total Company |
Year Ended December 31, 2011
| | | | | | | | | | | | | | | | |
| Total revenues | | $ | 201,414 | | | $ | 9,796 | | | $ | — | | | $ | 211,210 | |
| Equity in net loss from unconsolidated joint ventures | | | 121 | | | | — | | | | — | | | | 121 | |
| Total operating and interest expense(2) | | | (145,472 | ) | | | (10,611 | ) | | | (35,989 | ) | | | (192,072 | ) |
| Net income (loss) from continuing operations(3) | | $ | 56,063 | | | $ | (815 | ) | | $ | (35,989 | ) | | $ | 19,259 | |
| | | | | | | | |
| | Finance | | Realty(1) | | Corporate/ Other(2) | | Total Company |
Year Ended December 31, 2010
| | | | | | | | | | | | | | | | |
| Total revenues | | $ | 177,734 | | | $ | 5,863 | | | $ | — | | | $ | 183,597 | |
| Equity in net loss from unconsolidated joint ventures | | | (1,255 | ) | | | — | | | | — | | | | (1,255 | ) |
| Total operating and interest expense(2) | | | (195,900 | ) | | | (17,671 | ) | | | (33,292 | ) | | | (246,863 | ) |
| Net loss from continuing operations(3) | | $ | (19,421 | ) | | $ | (11,808 | ) | | $ | (33,292 | ) | | $ | (64,521 | ) |
| | | | | | | | |
| | Finance | | Realty(1) | | Corporate/
Other(2) | | Total Company |
Year Ended December 31, 2009
| | | | | | | | | | | | | | | | |
| Total revenues | | $ | 186,568 | | | $ | 5,064 | | | $ | — | | | $ | 191,632 | |
| Equity in net loss from unconsolidated joint ventures | | | 113 | | | | — | | | | — | | | | 113 | |
| Total operating and interest expense(2) | | | (660,862 | ) | | | (22,437 | ) | | | (43,173 | ) | | | (726,472 | ) |
| Net loss from continuing operations(3) | | $ | (474,181 | ) | | $ | (17,373 | ) | | $ | (43,173 | ) | | $ | (534,727 | ) |
Total Assets:
| | | | | | | | | | | | | | | | |
| December 31, 2011 | | $ | 3,117,008 | | | $ | 40,040 | | | $ | (898,718 | ) | | $ | 2,258,330 | |
| December 31, 2010 | | $ | 3,558,472 | | | $ | 2,834,035 | | | $ | (900,514 | ) | | $ | 5,491,993 | |
| (1) | Corporate and Other represents all corporate level items, including general and administrative expenses and any intercompany elimination necessary to reconcile to the consolidated Company totals. |
| (2) | Total operating and interest expense includes provision for loan losses for the Finance business and operating costs on commercial property assets for the realty business and as well as costs to perform required functions under the interim management agreement, and impairment charges relating to the Gramercy Realty properties collateralized under the Goldman Mezzanine Loans and interest expense and gain on early extinguishment of debt, specifically related to each segment. General and administrative expense is included in Corporate/Other for all periods. Depreciation and amortization of $1,271, $1,694 and $2,215 for the years ended December 31, 2011, 2010 and 2009, respectively, is included in the amounts presented above. |
| (3) | Net income (loss) from continuing operations represents loss before non-controlling interest and discontinued operations. |
164
TABLE OF CONTENTS
Gramercy Capital Corp.
Notes To Consolidated Financial Statements
(Amounts in thousands, except share and per share data)
December 31, 2011
21. Supplemental Disclosure of Non-Cash Investing and Financing Activities
The following table represents non-cash activities recognized in other comprehensive income for the years ended December 31, 2011, 2010 and 2009:
| | | | | | |
| | 2011 | | 2010 | | 2009 |
| Deferred losses and other non-cash activity related to derivatives | | $ | (19,334 | ) | | $ | (70,603 | ) | | $ | 63,621 | |
| Reclassification of adjustments of net unrealized loss on securities previously available for sale | | $ | — | | | $ | 361 | | | $ | 1,080 | |
| Change in unrealized gain or loss on securities available for sale | | $ | (260,820 | ) | | $ | 5,495 | | | $ | — | |
22. Restatement and Selected Quarterly Financial Data (unaudited)
This unaudited interim financial information has been adjusted to reflect the effects of the reclassification of assets between held for investment and discontinued operations during the years ended December 31, 2011 and 2010, respectively. In addition, the unaudited interim information for the three months ended September 30, 2011 has been adjusted to correct for an overstatement of the charge related to other-than-temporary impairment on CMBS investments. The Company identified and corrected an error in the discount rate used in the calculation of other-than-temporary impairment on CMBS investments and recorded an adjustment to correct the other-than-temporary impairment for the year ended December 31, 2011. This error resulted in a $15,048 overstatement of the other-than-temporary impairment charge reflected in our Condensed Consolidated Statement of Operations and a corresponding understatement of the charge reflected in Other Comprehensive Income (Loss) and an overstatement of accumulated deficit and a corresponding understatement in accumulated other comprehensive loss in our Condensed Consolidated Statement of Stockholders’ Equity and Non-Controlling Interests. In addition this error resulted in an understatement of income from continuing operations and net income for the three and nine months ended September 30, 2011.
165
TABLE OF CONTENTS
Gramercy Capital Corp.
Notes To Consolidated Financial Statements
(Amounts in thousands, except share and per share data)
December 31, 2011
22. Restatement and Selected Quarterly Financial Data (unaudited) – (continued)
| | | | | | | | |
| 2011 Quarter Ended | | December 31 | | September 30
(Restated) | | June 30 | | March 31 |
| Total Revenues | | $ | 49,508 | | | $ | 54,937 | | | $ | 60,581 | | | $ | 46,184 | |
| Income (loss) before equity in net income of joint ventures, provision for taxes, minority interest and discontinued operations | | | (2,461 | ) | | | 8,241 | | | | 2,952 | | | | (4,306 | ) |
| Equity in net loss of unconsolidated joint ventures | | | 31 | | | | 29 | | | | 31 | | | | 30 | |
| Income (loss) from continuing operations before provision for taxes and gain on extinguishment of debt and discontinued operations | | | (2,430 | ) | | | 8,270 | | | | 2,983 | | | | (4,276 | ) |
| Gain on extinguishment of debt | | | 750 | | | | — | | | | 10,869 | | | | 3,656 | |
| Provision for taxes | | | (490 | ) | | | — | | | | (3 | ) | | | (70 | ) |
| Net income (loss) from continuing operations | | | (2,170 | ) | | | 8,270 | | | | 13,849 | | | | (690 | ) |
| Net income (loss) from discontinued operations | | | 169,553 | | | | 137,812 | | | | 3,412 | | | | 7,441 | |
| Net income (loss) | | | 167,383 | | | | 146,082 | | | | 17,261 | | | | 6,751 | |
Net (income) loss attributable to
non-controlling interest | | | — | | | | — | | | | — | | | | — | |
Net income (loss) attributable to
Gramercy Capital Corp. | | | 167,383 | | | | 146,082 | | | | 17,261 | | | | 6,751 | |
| Preferred stock dividends | | | (1,792 | ) | | | (1,790 | ) | | | (1,790 | ) | | | (1,790 | ) |
| Excess of carrying amount of tendered preferred stock over consideration paid | | | — | | | | — | | | | — | | | | — | |
| Net income (loss) available to common stockholders | | $ | 165,591 | | | $ | 144,292 | | | $ | 15,471 | | | $ | 4,961 | |
Basic earnings per share:
| | | | | | | | | | | | | | | | |
| Net income (loss) from continuing operations, net of non-controlling interest and after preferred dividends | | $ | (0.08 | ) | | $ | 0.12 | | | $ | 0.24 | | | $ | (0.05 | ) |
| Net income (loss) from discontinued operations | | | 3.36 | | | | 2.74 | | | | 0.07 | | | | 0.15 | |
| Net income (loss) available to common stock holders | | $ | 3.28 | | | $ | 2.86 | | | $ | 0.31 | | | $ | 0.10 | |
Diluted earnings per share:
| | | | | | | | | | | | | | | | |
| Net income (loss) from continuing operations, net of non-controlling interest and after preferred dividends | | $ | (0.08 | ) | | $ | 0.13 | | | $ | 0.24 | | | $ | (0.05 | ) |
| Net income (loss) from discontinued operations | | | 3.31 | | | | 2.70 | | | | 0.07 | | | | 0.15 | |
| Net income (loss) available to common stockholders | | $ | 3.23 | | | $ | 2.83 | | | $ | 0.31 | | | $ | 0.10 | |
| Basic weighted average common shares outstanding | | | 50,532,836 | | | | 50,382,542 | | | | 49,998,728 | | | | 49,992,132 | |
| Diluted weighted average common shares and common share equivalents outstanding | | | 51,281,689 | | | | 50,954,776 | | | | 50,692,846 | | | | 50,718,574 | |
166
TABLE OF CONTENTS
Gramercy Capital Corp.
Notes To Consolidated Financial Statements
(Amounts in thousands, except share and per share data)
December 31, 2011
22. Restatement and Selected Quarterly Financial Data (unaudited) – (continued)
| | | | | | | | |
| 2010 Quarter Ended | | December 31 | | September 30 | | June 30 | | March 31 |
| Total Revenues | | $ | 44,957 | | | $ | 45,680 | | | $ | 46,763 | | | $ | 46,197 | |
| Loss before equity in net income of joint ventures, provision for taxes, minority interest and discontinued operations | | | (29,725 | ) | | | (8,152 | ) | | | (3,081 | ) | | | (40,785 | ) |
| Equity in net loss of unconsolidated joint ventures | | | 32 | | | | 58 | | | | (331 | ) | | | (1,014 | ) |
| Loss from continuing operations before provision for taxes and gain on extinguishment of debt and discontinued operations | | | (29,693 | ) | | | (8,094 | ) | | | (3,412 | ) | | | (41,799 | ) |
| Gain on extinguishment of debt | | | — | | | | 11,703 | | | | — | | | | 7,740 | |
| Provision for taxes | | | (842 | ) | | | (19 | ) | | | (66 | ) | | | (39 | ) |
| Net loss from continuing operations | | | (30,535 | ) | | | 3,590 | | | | (3,478 | ) | | | (34,098 | ) |
| Net income (loss) from discontinued operations | | | (936,862 | ) | | | 3,620 | | | | 12,510 | | | | 11,710 | |
| Net loss | | | (967,397 | ) | | | 7,210 | | | | 9,032 | | | | (22,388 | ) |
| Net (income) loss attributable to non-controlling interest | | | (61 | ) | | | (60 | ) | | | 20 | | | | (44 | ) |
| Net loss attributable to Gramercy Capital Corp. | | | (967,458 | ) | | | 7,150 | | | | 9,052 | | | | (22,432 | ) |
| Excess of carrying amount of tendered preferred stock over consideration paid | | | 13,713 | | | | — | | | | — | | | | — | |
| Preferred stock dividends | | | (1,790 | ) | | | (2,336 | ) | | | (2,336 | ) | | | (2,336 | ) |
| Net loss available to common stockholders | | $ | (955,535 | ) | | $ | 4,814 | | | $ | 6,716 | | | $ | (24,768 | ) |
Basic earnings per share:
| | | | | | | | | | | | | | | | |
| Net loss from continuing operations, net of non-controlling interest and after preferred dividends | | $ | (0.37 | ) | | $ | 0.03 | | | $ | (0.12 | ) | | $ | (0.73 | ) |
| Net income (loss) from discontinued operations | | | (18.75 | ) | | | 0.07 | | | | 0.25 | | | | 0.23 | |
| Net loss available to common stockholders | | $ | (19.12 | ) | | $ | 0.10 | | | $ | 0.13 | | | $ | (0.50 | ) |
Diluted earnings per share:
| | | | | | | | | | | | | | | | |
| Net loss from continuing operations, net of non-controlling interest and after preferred dividends | | $ | (0.37 | ) | | $ | 0.03 | | | $ | (0.12 | ) | | $ | (0.73 | ) |
| Net income (loss) from discontinued operations | | | (18.75 | ) | | | 0.07 | | | | 0.25 | | | | 0.23 | |
| Net loss available to common stockholders | | $ | (19.12 | ) | | $ | 0.10 | | | $ | 0.13 | | | $ | (0.50 | ) |
| Basic weighted average common shares outstanding | | | 49,976,237 | | | | 49,919,653 | | | | 49,905,648 | | | | 49,896,278 | |
| Diluted weighted average common shares and common share equivalents outstanding | | | 49,976,237 | | | | 50,422,669 | | | | 50,432,260 | | | | 49,896,278 | |
167
TABLE OF CONTENTS
Gramercy Capital Corp.
Notes To Consolidated Financial Statements
(Amounts in thousands, except share and per share data)
December 31, 2011
22. Restatement and Selected Quarterly Financial Data (unaudited) – (continued)
The following table presents the effects of the Company’s discontinued operations and the adjustment to correct other-than-temporary impairment on the Company’s previously reported Condensed Consolidated Statement of Operations, Condensed Consolidated Balance Sheet, Condensed Consolidated Statement of Stockholders' Equity and Non-controlling Interests and earnings per share for the three and nine months ended September 30, 2011.
| | | | | | | | |
| | Three months ended September 30, 2011 |
| | | As reported | | Error Correction | | Discontinued Operations | | As
restated |
| Revenues | | $ | 135,094 | | | $ | — | | | $ | (80,157 | ) | | $ | 54,937 | |
| Property operating expenses | | | 33,439 | | | | — | | | | (33,227 | ) | | | 212 | |
| Other than temporary impairment recognized in earnings | | | 20,701 | | | | (15,048 | ) | | | — | | | | 5,653 | |
| Interest expense | | | 43,798 | | | | — | | | | (23,479 | ) | | | 20,319 | |
| Depreciation and amortization | | | 14,411 | | | | — | | | | (14,094 | ) | | | 317 | |
| Management, general and administrative | | | 10,411 | | | | — | | | | (415 | ) | | | 9,996 | |
| Provision for loan loss | | | 10,199 | | | | — | | | | — | | | | 10,199 | |
| Total expenses | | | 132,959 | | | | (15,048 | ) | | | (71,215 | ) | | | 46,696 | |
| Income (loss) before equity in net income of joint ventures, provision for taxes, non-controlling interest and discontinued operations | | | 2,135 | | | | 15,048 | | | | (8,942 | ) | | | 8,241 | |
| Equity in net loss of joint venture | | | (413 | ) | | | — | | | | 442 | | | | 29 | |
| Income (loss) before provision for taxes, non-controlling interest and discontinued operations | | | 1,722 | | | | 15,048 | | | | (8,500 | ) | | | 8,270 | |
| Discontinued operations | | | 129,312 | | | | — | | | | 8,500 | | | | 137,812 | |
| Net income (loss) | | | 131,034 | | | | 15,048 | | | | — | | | | 146,082 | |
| Net income attributable to non-controlling interest | | | — | | | | — | | | | — | | | | — | |
| Net income attributable to Gramercy Capital Corp | | | 131,034 | | | | 15,048 | | | | — | | | | 146,082 | |
| Preferred stock dividends | | | (1,790 | ) | | | — | | | | — | | | | (1,790 | ) |
| Net income (loss) attributable to common stockholders | | $ | 129,244 | | | $ | 15,048 | | | $ | — | | | $ | 144,292 | |
Basic earnings per share:
| | | | | | | | | | | | | | | | |
| Net income (loss) from continuing operations, net of controlling interest and after preferred dividends | | $ | — | | | $ | 0.30 | | | $ | (0.17 | ) | | $ | 0.16 | |
| Net income (loss) from discontinued operations | | | 2.57 | | | | — | | | | 0.17 | | | | 2.74 | |
| Net income (loss) available to common stock holders | | $ | 2.57 | | | $ | 0.30 | | | $ | — | | | $ | 2.90 | |
Diluted earnings per share:
| | | | | | | | | | | | | | | | |
| Net income (loss) from continuing operations, net of controlling interest and after preferred dividends | | $ | — | | | $ | 0.30 | | | $ | (0.17 | ) | | $ | 0.16 | |
| Net income (loss) from discontinued operations | | | 2.54 | | | | — | | | | 0.17 | | | | 2.70 | |
| Net income (loss) available to common stock holders | | $ | 2.54 | | | $ | 0.30 | | | $ | — | | | $ | 2.87 | |
| Basic weighted average common shares outstanding | | | 50,382,542 | | | | | | | | | | | | 50,382,542 | |
| Diluted weighted average common shares and common share equivalents outstanding | | | 50,954,776 | | | | | | | | | | | | 50,954,776 | |
168
TABLE OF CONTENTS
Gramercy Capital Corp.
Notes To Consolidated Financial Statements
(Amounts in thousands, except share and per share data)
December 31, 2011
22. Restatement and Selected Quarterly Financial Data (unaudited) – (continued)
| | | | | | | | |
| | Nine months ended September 30, 2011 |
| | | As
reported | | Error Correction | | Discontinued Operations | | As
restated |
| Revenues | | $ | 402,408 | | | $ | — | | | $ | (240,707 | ) | | $ | 161,701 | |
| Property operating expenses | | | 111,885 | | | | — | | | | (100,251 | ) | | | 11,634 | |
| Other than temporary impairment recognized in earnings | | | 26,738 | | | | (15,048 | ) | | | — | | | | 11,690 | |
| Interest expense | | | 140,038 | | | | — | | | | (79,364 | ) | | | 60,674 | |
| Depreciation and amortization | | | 43,168 | | | | — | | | | (42,215 | ) | | | 953 | |
| Management, general and administrative | | | 24,524 | | | | — | | | | (1,142 | ) | | | 23,382 | |
| Provision for loan loss | | | 46,482 | | | | — | | | | — | | | | 46,482 | |
| Total expenses | | | 392,835 | | | | (15,048 | ) | | | (222,972 | ) | | | 154,815 | |
| Income (loss) before equity in net income of joint ventures, provision for taxes, non-controlling interest and discontinued operations | | | 9,573 | | | | 15,048 | | | | (17,735 | ) | | | 6,886 | |
| Equity in net loss of joint venture | | | (1,806 | ) | | | — | | | | 1,896 | | | | 90 | |
| Income (loss) before provision for taxes, non-controlling interest and discontinued operations | | | 7,767 | | | | 15,048 | | | | (15,839 | ) | | | 6,976 | |
| Discontinued operations | | | 132,825 | | | | — | | | | 15,839 | | | | 148,664 | |
| Gain on extinguishment of debt | | | 14,526 | | | | — | | | | — | | | | 14,526 | |
| Provision for taxes | | | (73 | ) | | | — | | | | — | | | | (73 | ) |
| Net income (loss) | | | 155,045 | | | | 15,048 | | | | — | | | | 170,093 | |
| Net income attributable to non-controlling interest | | | — | | | | — | | | | — | | | | — | |
| Net income attributable to Gramercy Capital Corp | | | 155,045 | | | | 15,048 | | | | — | | | | 170,093 | |
| Preferred stock dividends | | | (5,370 | ) | | | — | | | | — | | | | (5,370 | ) |
| Net income (loss) attributable to common stockholders | | $ | 149,675 | | | $ | 15,048 | | | $ | — | | | $ | 164,723 | |
Other Comprehensive Income/(Loss)
| | | | | | | | | | | | | | | | |
| Net income | | $ | 155,045 | | | $ | 15,048 | | | $ | — | | | $ | 170,093 | |
| Change in unrealized loss on derivative instruments | | | (19,821 | ) | | | — | | | | — | | | | (19,821 | ) |
| Net unrealized loss on available-for-sale securities | | | (236,820 | ) | | | (15,048 | ) | | | — | | | | (251,868 | ) |
| Balance at September 30, 2011 | | $ | (101,596 | ) | | $ | — | | | $ | — | | | $ | (101,596 | ) |
Basic earnings per share:
| | | | | | | | | | | | | | | | |
| Net income (loss) from continuing operations, net of controlling interest and after preferred dividends | | $ | 0.34 | | | $ | 0.30 | | | $ | (0.32 | ) | | $ | 0.14 | |
| Net income (loss) from discontinued operations | | | 2.65 | | | | — | | | | 0.32 | | | | 2.97 | |
| Net income (loss) available to common stock holders | | $ | 2.99 | | | $ | 0.30 | | | $ | — | | | $ | 3.10 | |
Diluted earnings per share:
| | | | | | | | | | | | | | | | |
| Net income (loss) from continuing operations, net of controlling interest and after preferred dividends | | $ | 0.33 | | | $ | 0.30 | | | $ | (0.31 | ) | | $ | 0.14 | |
| Net income (loss) from discontinued operations | | | 2.62 | | | | — | | | | 0.31 | | | | 2.93 | |
| Net income (loss) available to common stock holders | | $ | 2.95 | | | $ | 0.30 | | | $ | — | | | $ | 3.07 | |
| Basic weighted average common shares outstanding | | | 50,125,875 | | | | | | | | | | | | 50,125,875 | |
| Diluted weighted average common shares and common share equivalents outstanding | | | 50,708,486 | | | | | | | | | | | | 50,708,486 | |
Adjustment to consolidated condensed balance sheet and consolidated condensed statement of stockholders equity and non-controlling interests
| | | | | | | | | | | | | | | | |
| Accumulated other comprehensive loss | | $ | (417,426 | ) | | $ | (15,048 | ) | | $ | — | | | $ | (432,474 | ) |
| Accumulated deficit | | $ | (1,346,919 | ) | | $ | 15,048 | | | $ | — | | | $ | (1,331,871 | ) |
169
TABLE OF CONTENTS
Gramercy Capital Corp.
Notes To Consolidated Financial Statements
(Amounts in thousands, except share and per share data)
December 31, 2011
23. Subsequent Events
In January 2012, the Company sold a three-building commercial office complex classified in assets held for sale on the consolidated balance sheet at December 31, 2011, located in Ontario, California for a gross sales price of approximately $34,000. The property had been financed with a first mortgage by the Company’s 2006 CDO. In addition to the full repayment of the CDO loan, the sale generated incremental unrestricted cash of approximately $16,086.
On March 14, 2012, an interest payment due on a CMBS investment owned by the Company’s 2007 CDO was not received for the third consecutive interest payment date, which caused the CMBS investment to be classified as a Defaulted Security under the 2007 CDO’s indenture. This classification caused the Class A/B Par Value Ratio for the 2007 CDO notes to fall to 88.86% in breach of the Class A/B overcollateralization test threshold of 89%. This breach constitutes an event of default under the operative documents for the 2007 CDO. Upon such an event of default, the reinvestment period of the 2007 CDO, which is scheduled to expire in August 2012, will immediately end and the Company will lose its ability to reinvest restricted cash held by the 2007 CDO. Additionally, an event of default entitles the controlling class to direct the Trustee to accelerate the notes of the 2007 CDO and, depending on the circumstances, force the prompt liquidation of the collateral. Notwithstanding the foregoing, to the extent the controlling class of senior note holders acts to waive such event of default, the default will cease to exist.
170
TABLE OF CONTENTS
Gramercy Capital Corp.
SCHEDULE III
Real Estate Investments
(In thousands)
| | | | | | | | | | | | | | | | | | | | | | |
| | State | | Acquisition Date | | Encumbrances
at December 31, 2011 | | Initial Costs | | Net Improvements (Retirements) Since Acquisition | | Gross Amount at Which Carried December 31, 2011 | | Accumulated Depreciation 12/31/11 | | Average Depreciable
Life |
| City | | Land | | Building and Improvements | | Land | | Building and Improvements | | Total |
| Ocean City | | | NJ | | | | 4/1/2008 | | | | — | | | | 776 | | | | 334 | | | | 44 | | | | 775 | | | | 379 | | | | 1,154 | | | | (43 | ) | | | 40 | |
| Casselberry | | | FL | | | | 4/1/2008 | | | | — | | | | 355 | | | | 245 | | | | — | | | | 355 | | | | 245 | | | | 600 | | | | (23 | ) | | | 40 | |
| New Port Richey | | | FL | | | | 4/1/2008 | | | | — | | | | 376 | | | | 224 | | | | — | | | | 376 | | | | 224 | | | | 600 | | | | (21 | ) | | | 40 | |
| Snellville | | | GA | | | | 4/1/2008 | | | | — | | | | 120 | | | | 330 | | | | (13 | ) | | | 119 | | | | 318 | | | | 437 | | | | (19 | ) | | | 40 | |
| Daytona Beach | | | FL | | | | 4/1/2008 | | | | — | | | | 267 | | | | 732 | | | | (103 | ) | | | 267 | | | | 629 | | | | 896 | | | | (37 | ) | | | 40 | |
| Dunedin | | | FL | | | | 4/1/2008 | | | | — | | | | 507 | | | | 1,392 | | | | (524 | ) | | | 429 | | | | 946 | | | | 1,375 | | | | (61 | ) | | | 40 | |
| Naples | | | FL | | | | 4/1/2008 | | | | — | | | | 44 | | | | 21 | | | | — | | | | 44 | | | | 21 | | | | 65 | | | | (2 | ) | | | 40 | |
| Winter Garden | | | FL | | | | 4/1/2008 | | | | — | | | | 858 | | | | 1,135 | | | | 43 | | | | 858 | | | | 1,178 | | | | 2,036 | | | | (108 | ) | | | 40 | |
| Williamston | | | NC | | | | 4/1/2008 | | | | — | | | | 53 | | | | 146 | | | | 40 | | | | 53 | | | | 186 | | | | 239 | | | | (17 | ) | | | 40 | |
| Succasunna | | | NJ | | | | 4/1/2008 | | | | — | | | | 147 | | | | 123 | | | | 41 | | | | 147 | | | | 164 | | | | 311 | | | | (35 | ) | | | 40 | |
| Hanover | | | PA | | | | 4/1/2008 | | | | — | | | | 107 | | | | 293 | | | | — | | | | 107 | | | | 293 | | | | 400 | | | | (28 | ) | | | 40 | |
| Mount Carmel | | | PA | | | | 4/1/2008 | | | | — | | | | 40 | | | | 110 | | | | (101 | ) | | | 40 | | | | 9 | | | | 49 | | | | (1 | ) | | | 40 | |
| Norristown | | | PA | | | | 4/1/2008 | | | | — | | | | 253 | | | | 1,050 | | | | 100 | | | | 253 | | | | 1,150 | | | | 1,403 | | | | (160 | ) | | | 40 | |
| Petersburg | | | VA | | | | 4/1/2008 | | | | — | | | | 17 | | | | 114 | | | | 1 | | | | 17 | | | | 115 | | | | 132 | | | | (10 | ) | | | 40 | |
| Warrenton | | | VA | | | | 4/1/2008 | | | | — | | | | 271 | | | | 1,423 | | | | (215 | ) | | | 234 | | | | 1,245 | | | | 1,479 | | | | (129 | ) | | | 40 | |
| Easton | | | PA | | | | 4/1/2008 | | | | — | | | | 212 | | | | 388 | | | | (257 | ) | | | 212 | | | | 131 | | | | 343 | | | | (22 | ) | | | 40 | |
| Madison Heights | | | VA | | | | 4/1/2008 | | | | — | | | | 191 | | | | 200 | | | | — | | | | 191 | | | | 200 | | | | 391 | | | | (19 | ) | | | 40 | |
| High Point | | | NC | | | | 4/1/2008 | | | | — | | | | 305 | | | | 434 | | | | — | | | | 305 | | | | 434 | | | | 739 | | | | (41 | ) | | | 40 | |
| Avon Park | | | FL | | | | 4/1/2008 | | | | — | | | | 78 | | | | 432 | | | | (104 | ) | | | 78 | | | | 328 | | | | 406 | | | | (22 | ) | | | 40 | |
| Richland | | | PA | | | | 4/1/2008 | | | | — | | | | 30 | | | | 170 | | | | — | | | | 30 | | | | 170 | | | | 200 | | | | (16 | ) | | | 40 | |
| Hampton | | | VA | | | | 4/1/2008 | | | | — | | | | 133 | | | | 366 | | | | (62 | ) | | | 133 | | | | 304 | | | | 437 | | | | (18 | ) | | | 40 | |
| Virginia Beach | | | VA | | | | 4/1/2008 | | | | — | | | | 299 | | | | 200 | | | | (15 | ) | | | 298 | | | | 186 | | | | 484 | | | | (18 | ) | | | 40 | |
| Norcross | | | GA | | | | 4/1/2008 | | | | — | | | | 267 | | | | 732 | | | | (311 | ) | | | 187 | | | | 501 | | | | 688 | | | | (36 | ) | | | 40 | |
| Riverdale | | | GA | | | | 4/1/2008 | | | | — | | | | 176 | | | | 293 | | | | (1 | ) | | | 175 | | | | 293 | | | | 468 | | | | (28 | ) | | | 40 | |
| Lenoir | | | NC | | | | 4/1/2008 | | | | — | | | | 288 | | | | 298 | | | | — | | | | 288 | | | | 298 | | | | 586 | | | | (28 | ) | | | 40 | |
| Woodbury | | | NJ | | | | 4/1/2008 | | | | — | | | | 418 | | | | 1,081 | | | | — | | | | 418 | | | | 1,081 | | | | 1,499 | | | | (100 | ) | | | 40 | |
| Linwood | | | PA | | | | 4/1/2008 | | | | — | | | | 98 | | | | 187 | | | | (41 | ) | | | 98 | | | | 146 | | | | 244 | | | | (15 | ) | | | 40 | |
| Goodwater | | | AL | | | | 4/1/2008 | | | | — | | | | 60 | | | | 165 | | | | — | | | | 60 | | | | 165 | | | | 225 | | | | (15 | ) | | | 40 | |
| Newton | | | AL | | | | 4/1/2008 | | | | — | | | | 27 | | | | 73 | | | | — | | | | 27 | | | | 73 | | | | 100 | | | | (7 | ) | | | 40 | |
| Jacksonville | | | FL | | | | 4/1/2008 | | | | — | | | | 160 | | | | 439 | | | | — | | | | 160 | | | | 439 | | | | 599 | | | | (41 | ) | | | 40 | |
| Jacksonville | | | FL | | | | 4/1/2008 | | | | — | | | | 267 | | | | 732 | | | | (601 | ) | | | 267 | | | | 131 | | | | 398 | | | | (14 | ) | | | 40 | |
| Bremen | | | GA | | | | 4/1/2008 | | | | — | | | | 113 | | | | 311 | | | | — | | | | 113 | | | | 311 | | | | 424 | | | | (29 | ) | | | 40 | |
| Midlothian | | | VA | | | | 4/1/2008 | | | | — | | | | 160 | | | | 439 | | | | — | | | | 160 | | | | 439 | | | | 599 | | | | (41 | ) | | | 40 | |
| Newport News | | | VA | | | | 4/1/2008 | | | | — | | | | 80 | | | | 220 | | | | (22 | ) | | | 80 | | | | 198 | | | | 278 | | | | (9 | ) | | | 40 | |
| Cottonwood | | | AL | | | | 4/1/2008 | | | | — | | | | 37 | | | | 103 | | | | — | | | | 37 | | | | 103 | | | | 140 | | | | (10 | ) | | | 40 | |
171
TABLE OF CONTENTS
| | | | | | | | | | | | | | | | | | | | | | |
| | State | | Acquisition Date | | Encumbrances
at December 31, 2011 | | Initial Costs | | Net Improvements (Retirements) Since Acquisition | | Gross Amount at Which Carried December 31, 2011 | | Accumulated Depreciation 12/31/11 | | Average Depreciable
Life |
| City | | Land | | Building and Improvements | | Land | | Building and Improvements | | Total |
| Sneads | | | FL | | | | 4/1/2008 | | | | — | | | | 47 | | | | 128 | | | | — | | | | 47 | | | | 128 | | | | 175 | | | | (12 | ) | | | 40 | |
| Columbus | | | GA | | | | 4/1/2008 | | | | — | | | | 187 | | | | 513 | | | | — | | | | 187 | | | | 513 | | | | 700 | | | | (48 | ) | | | 40 | |
| Columbus | | | GA | | | | 4/1/2008 | | | | — | | | | 399 | | | | 1,096 | | | | (565 | ) | | | 240 | | | | 690 | | | | 930 | | | | (92 | ) | | | 40 | |
| Dobbs Ferry | | | NY | | | | 4/1/2008 | | | | — | | | | 187 | | | | 513 | | | | (380 | ) | | | 187 | | | | 133 | | | | 320 | | | | (15 | ) | | | 40 | |
| East Gadsden | | | AL | | | | 4/1/2008 | | | | — | | | | 133 | | | | 366 | | | | — | | | | 133 | | | | 366 | | | | 499 | | | | (34 | ) | | | 40 | |
| New Port Richey | | | FL | | | | 4/1/2008 | | | | — | | | | 227 | | | | 623 | | | | (359 | ) | | | 227 | | | | 264 | | | | 491 | | | | (27 | ) | | | 40 | |
| Buford | | | GA | | | | 4/1/2008 | | | | — | | | | 333 | | | | 915 | | | | (397 | ) | | | 333 | | | | 518 | | | | 851 | | | | (37 | ) | | | 40 | |
| Anniston | | | AL | | | | 4/1/2008 | | | | — | | | | 295 | | | | 1,215 | | | | — | | | | 295 | | | | 1,215 | | | | 1,510 | | | | (113 | ) | | | 40 | |
| Batesville | | | AR | | | | 4/1/2008 | | | | — | | | | 217 | | | | 825 | | | | 50 | | | | 217 | | | | 875 | | | | 1,092 | | | | (83 | ) | | | 40 | |
| El Dorado | | | AR | | | | 4/1/2008 | | | | — | | | | 95 | | | | 3,168 | | | | 97 | | | | 95 | | | | 3,265 | | | | 3,360 | | | | (495 | ) | | | 40 | |
| Bloomington | | | IL | | | | 4/1/2008 | | | | — | | | | 201 | | | | 552 | | | | 18 | | | | 201 | | | | 570 | | | | 771 | | | | (42 | ) | | | 40 | |
| Bedford | | | IN | | | | 4/1/2008 | | | | — | | | | 136 | | | | 373 | | | | (184 | ) | | | 136 | | | | 189 | | | | 325 | | | | (11 | ) | | | 40 | |
| Frankfort | | | IN | | | | 4/1/2008 | | | | — | | | | 198 | | | | 545 | | | | (255 | ) | | | 198 | | | | 290 | | | | 488 | | | | (17 | ) | | | 40 | |
| Munford | | | TN | | | | 4/1/2008 | | | | — | | | | 155 | | | | 596 | | | | — | | | | 155 | | | | 596 | | | | 751 | | | | (55 | ) | | | 40 | |
| Monticello | | | IA | | | | 4/1/2008 | | | | — | | | | 64 | | | | 337 | | | | 1 | | | | 64 | | | | 338 | | | | 402 | | | | (32 | ) | | | 40 | |
| Vincennes | | | IN | | | | 4/1/2008 | | | | — | | | | 133 | | | | 366 | | | | (14 | ) | | | 133 | | | | 352 | | | | 485 | | | | (21 | ) | | | 40 | |
| Elmhurst | | | IL | | | | 4/1/2008 | | | | — | | | | 929 | | | | 1,026 | | | | 15 | | | | 929 | | | | 1,041 | | | | 1,970 | | | | (103 | ) | | | 40 | |
| Norton | | | VA | | | | 4/1/2008 | | | | — | | | | 40 | | | | 110 | | | | (151 | ) | | | (1 | ) | | | — | | | | (1 | ) | | | — | | | | 40 | |
| Kansas City | | | KS | | | | 4/1/2008 | | | | — | | | | 40 | | | | 110 | | | | (150 | ) | | | — | | | | — | | | | — | | | | — | | | | 40 | |
| Rochester | | | NY | | | | 4/1/2008 | | | | — | | | | 41 | | | | 853 | | | | 117 | | | | 41 | | | | 970 | | | | 1,011 | | | | (100 | ) | | | 40 | |
| Florence | | | SC | | | | 4/1/2008 | | | | — | | | | 80 | | | | 220 | | | | (50 | ) | | | 80 | | | | 170 | | | | 250 | | | | (9 | ) | | | 40 | |
| Antioch | | | CA | | | | 1/21/2010 | | | | — | | | | 1,874 | | | | — | | | | 156 | | | | 1,874 | | | | 156 | | | | 2,030 | | | | (8 | ) | | | 40 | |
| Cape Coral | | | FL | | | | 7/1/2009 | | | | — | | | | 1,012 | | | | 4,049 | | | | — | | | | 1,012 | | | | 4,049 | | | | 5,061 | | | | (253 | ) | | | 40 | |
| Indio* | | | CA | | | | 11/12/2009 | | | | — | | | | 8,722 | | | | — | | | | 3 | | | | 8,725 | | | | — | | | | 8,725 | | | | — | | | | | |
| Lake Placid | | | NY | | | | 7/20/2010 | | | | — | | | | 628 | | | | 4,131 | | | | 956 | | | | 628 | | | | 5,087 | | | | 5,715 | | | | (153 | ) | | | 40 | |
| Mesa* | | | AZ | | | | 2/19/2010 | | | | — | | | | 21,677 | | | | — | | | | (11,322 | ) | | | 10,355 | | | | — | | | | 10,355 | | | | — | | | | | |
| | | | | | | | | | | $ | — | | | $ | 45,640 | | | $ | 37,565 | | | $ | (14,515 | ) | | $ | 33,882 | | | $ | 34,808 | | | $ | 68,690 | | | $ | (2,983 | ) | | | | |
Assets held for sale:
| | | | | | | | | | | | | | | | | | | | | | | | | | | | | | | | | | | | | | | | | | | | |
| Kailua-Kona* | | | HI | | | | 7/20/2010 | | | | — | | | | 19,911 | | | | — | | | | (9,883 | ) | | | 9,911 | | | | 117 | | | | 10,028 | | | | (10 | ) | | | | |
| Ontario | | | CA | | | | 10/20/2010 | | | | — | | | | 636 | | | | 4,205 | | | | 119 | | | | 635 | | | | 4,325 | | | | 4,960 | | | | (122 | ) | | | 40 | |
| Ontario | | | CA | | | | 10/20/2010 | | | | — | | | | 2,166 | | | | 4,928 | | | | — | | | | 2,166 | | | | 4,928 | | | | 7,094 | | | | (144 | ) | | | 40 | |
| Ontario | | | CA | | | | 10/20/2010 | | | | — | | | | 1,718 | | | | 5,491 | | | | 856 | | | | 1,718 | | | | 6,347 | | | | 8,065 | | | | (222 | ) | | | 40 | |
| | | | | | | | | | | $ | — | | | $ | 24,131 | | | $ | 14,624 | | | $ | (8,908 | ) | | $ | 14,430 | | | $ | 15,717 | | | $ | 30,147 | | | $ | (498 | ) | | | | |
| | | | | | | | | | | $ | — | | | $ | 70,071 | | | $ | 52,189 | | | $ | (23,423 | ) | | $ | 48,312 | | | $ | 50,525 | | | $ | 98,837 | | | $ | (3,481 | ) | | | | |
172
TABLE OF CONTENTS
Gramercy Capital Corp.
Schedule IV
Mortgage Loans on Real Estate
(Amounts in thousands)
| | | | | | | | | | | | | | |
| | | | | | | | | | | | | | |
| Type of Loan | | Location | | Interest Rate(1) | | Final Maturity Date(2) | | Periodic Payment
Terms | | Prior
Liens(3) | | Face
Amount of
Loans | | Carrying
Amount of
Loans |
| Office – CBD | | | Chicago, IL | | | | 6.27 | % | | | 2/11/2017 | | | | Interest Only | | | $ | 675,936 | | | $ | 99,402 | | | $ | 82,246 | |
| Office – CBD | | | New York, NY | | | | LIBOR + 3.25 | % | | | 3/9/2016 | | | | Interest Only | | | | 95,000 | | | | 88,500 | | | | 83,673 | |
| Hotel | | | Las Vegas, NV | | | | LIBOR + 4.85 | % | | | 12/31/2012 | | | | Interest Only | | | | 193,109 | | | | 69,000 | | | | 51,417 | |
| Office – CDB | | | Chicago, IL | | | | 6.27 | % | | | 2/11/2017 | | | | Interest Only | | | | 608,014 | | | | 67,922 | | | | 56,199 | |
| Office – CBD | | | California | | | | LIBOR + 3.50 | % | | | 8/9/2012 | | | | Interest Only | | | | 1,024,286 | | | | 48,226 | | | | 250 | |
| Office – CDB | | | San Mateo, CA | | | | LIBOR + 2.50 | % | | | 5/9/2012 | | | | Interest Only | | | | 1,157 | | | | 46,796 | | | | 46,796 | |
| Whole Loans < 3% | | | | | | | 5.28% – 7.83%
LIBOR + 2.00% – 5.75 | % | | | January 2012 –
April 2017 | | | | | | | | 3,004,953 | | | | 779,066 | | | | 653,810 | |
| Subordinate Loans < 3% | | | | | | | 4.00% – 15.40%
LIBOR + 5.75 | % | | | May 2012 –
March 2017 | | | | | | | | 118,684 | | | | 35,530 | | | | 33,019 | |
| Mezzanine Loans < 3% | | | | | | | 10.25% – 15.00%
LIBOR + 0.96% – 7.00 | % | | | January 2012 –
July 2016 | | | | | | | | 2,069,999 | | | | 128,244 | | | | 69,849 | |
| Preferred Equity < 3% | | | | | | | 10.00%
LIBOR + 2.25 | % | | | January 2012 –
August 2012 | | | | | | | | 997,243 | | | | 19,891 | | | | 4,660 | |
| Total Portfolio | | | | | | | | | | | | | | | | | | $ | 8,788,381 | | | $ | 1,382,577 | | | $ | 1,081,919 | |
| (1) | All variable rate loans are based upon one month LIBOR or three month LIBOR and reprice every one or three months respectively. |
| (2) | Reflects the current maturity of the investment and does not consider any options to extend beyond the current maturity. |
| (3) | Includes Liens that are Pari Parsu to the interests owned by the Company |
1. Reconciliation of Mortgage Loans on Real Estate:
The following table reconciles Mortgage Loans for the years ended December 31, 2011, 2010 and 2009.
| | | | | | |
| | 2011 | | 2010 | | 2009 |
| Balance at January 1(1) | | $ | 1,123,528 | | | $ | 1,383,832 | | | $ | 2,213,473 | |
Additions during period:
| | | | | | | | | | | | |
| New mortgage loans | | | 325,279 | | | | 114,456 | | | | 21,990 | |
| Additional funding(2) | | | 12,907 | | | | 13,653 | | | | 35,536 | |
| Amortization of discount, net(3) | | | 3,241 | | | | 1,033 | | | | 8,691 | |
Deductions during period:
| | | | | | | | | | | | |
| Collections of principal | | | (334,856 | ) | | | (183,439 | ) | | | (68,345 | ) |
| Transfers to real estate held-for-sale | | | — | | | | (80,581 | ) | | | (89,626 | ) |
| Provision for loan losses | | | (48,180 | ) | | | (84,390 | ) | | | (517,784 | ) |
| Valuation allowance on loans held-for-sale | | | — | | | | (2,000 | ) | | | (138,570 | ) |
| Mortgage loan sold | | | — | | | | (39,036 | ) | | | (81,533 | ) |
| Loss on sale of mortgage loans | | | — | | | | — | | | | — | |
| Balance at December 31 | | $ | 1,081,919 | | | $ | 1,123,528 | | | $ | 1,383,832 | |
| (1) | All amounts include both loans receivable and loans held-for-sale. |
| (2) | Includes capitalized interest, which is non-cash addition to the balance of mortgage loans, of $5.4 million, $6.5 million and $2.1 million for the years ended December 31, 2011, 2010 and 2009, respectively. |
| (3) | Net discount amortization represents an entirely non-cash addition to the balance of mortgage loans. |
173
TABLE OF CONTENTS
ITEM 9. CHANGES IN AND DISAGREEMENTS WITH ACCOUNTANTS ON ACCOUNTING AND FINANCIAL DISCLOSURE
None.
ITEM 9A. CONTROLS AND PROCEDURES
Evaluation of Disclosure Controls and Procedures
We maintain disclosure controls and procedures that are designed to ensure that information required to be disclosed in our Exchange Act reports is recorded, processed, summarized and reported within the time frame specified in the SEC’s rules and forms, and that such information is accumulated and communicated to our management, including our Chief Executive Officer and Chief Financial Officer, as appropriate, to allow for timely decisions regarding required disclosure based closely on the definition of “disclosure controls and procedures” in Rule 13a-15(e). Notwithstanding the foregoing, a control system, no matter how well designed and operated, can provide only reasonable, not absolute, assurance that it will detect or uncover failures within our company to disclose material information otherwise required to be set forth in our periodic reports. Also, we may have investments in certain unconsolidated entities. As we do not control these entities, our disclosure controls and procedures with respect to such entities are necessarily substantially more limited than those we maintain with respect to our consolidated subsidiaries.
As of the end of the period covered by this report, we carried out an evaluation, under the supervision and with the participation of our management, including our Chief Executive Officer and our Chief Financial Officer, of the effectiveness of the design and operation of our disclosure controls and procedures. Based upon that evaluation, our Chief Executive Officer and Chief Financial Officer concluded that a material weakness existed with regards to our financial statement close process and our calculation of the credit loss in our other than temporary impairment on CMBS as of the end of the period covered by this report. As a result of this material weakness, our Chief Executive Officer and Chief Financial Officer concluded that our disclosure controls and procedures were not effective as of December 31, 2011.
Management’s Annual Report on Internal Control over Financial Reporting
We are responsible for establishing and maintaining adequate internal control over financial reporting, as such term is defined in Exchange Act Rules 13a-15(f) and 15d-15(f). Under the supervision and with the participation of our management, including our Chief Executive Officer and Chief Financial Officer, we conducted an evaluation of the effectiveness of our internal control over financial reporting as of December 31, 2011 based on the framework in Internal Control — Integrated Framework issued by the Committee of Sponsoring Organizations of the Treadway Commission (COSO). Based on that evaluation, we concluded that a material weakness existed with regards to our financial statements close process and our calculation of the credit loss in our other than temporary impairment on CMBS as of December 31, 2011. The Company did not have an effectively designed review control to ensure that other than temporary impairment of CMBS was correctly calculated and recorded. As a result of the material weakness, there were misstatements in the third quarter condensed consolidated financial statements and preliminary consolidated draft financial statements that were corrected prior to the issuance of the Company’s consolidated financial statements. Additionally there is a reasonable possibility that a material misstatement of the Company’s annual or interim consolidated financial statements would not be prevented or detected on a timely basis.
Notwithstanding the material weakness described above, management believes that the consolidated financial statements included in this Annual Report on Form 10-K are fairly presented in all material respects in accordance with GAAP, and our Chief Executive Officer and Chief Financial Officer have certified that, based on their knowledge, the consolidated financial statements included in this report fairly present in all material respects our financial condition and results of operations for each of the periods presented in this report.
Our internal control over financial reporting during the year ended December 31, 2011 has been audited by Ernst & Young LLP, an independent registered public accounting firm, as stated in their report, appearing on page 99.
174
TABLE OF CONTENTS
Remediation Steps to Address Material Weakness
To remediate the material weakness in our internal control over financial reporting as described above, management is enhancing its controls over the preparation and the review of the other than temporary impairment calculations. We anticipate that the actions described above and the resulting improvements in controls will strengthen our internal control over financial reporting relating to the preparation of the consolidated statement of operations and will remediate the material weakness identified by December 31, 2012.
Changes in Internal Control over Financial Reporting
There were no changes in our internal control over financial reporting identified in connection with the evaluation of such internal control that occurred during the year ended December 31, 2011 that have materially affected, or are reasonably likely to materially affect, our internal control over financial reporting.
ITEM 9B. OTHER INFORMATION
None.
175
TABLE OF CONTENTS
Part III
ITEM 10. DIRECTORS, EXECUTIVE OFFICERS AND CORPORATE GOVERNANCE
The information required by Item 10 will be set forth in our Definitive Proxy Statement for our 2012 Annual Meeting of Stockholders, expected to be filed pursuant to Regulation 14A under the Exchange Act within 120 days after December 31, 2011 or the 2012 Proxy Statement, and is incorporated herein by reference.
ITEM 11. EXECUTIVE COMPENSATION
The information required by Item 11 will be set forth in the 2012 Proxy Statement and is incorporated herein by reference.
ITEM 12. SECURITY OWNERSHIP OF CERTAIN BENEFICIAL OWNERS AND MANAGEMENT AND RELATED STOCKHOLDER MATTERS
The information required by Item 12 will be set forth in the 2012 Proxy Statement and is incorporated herein by reference.
ITEM 13. CERTAIN RELATIONSHIPS AND RELATED TRANSACTIONS, AND DIRECTOR INDEPENDENCE
The information required by Item 13 will be set forth in the 2012 Proxy Statement and is incorporated herein by reference.
ITEM 14. PRINCIPAL ACCOUNTING FEES AND SERVICES
The information regarding principal accounting fees and services and the audit committee's pre-approval policies and procedures required by this Item 14 is incorporated herein by reference to the 2012 Proxy Statement.
176
TABLE OF CONTENTS
Part IV
ITEM 15. EXHIBITS, FINANCIAL STATEMENTS AND SCHEDULES
(a)(1) Consolidated Financial Statements
GRAMERCY CAPITAL CORP.
(a)(2) Financial Statement Schedules
Schedules other than those listed are omitted as they are not applicable or the required or equivalent information has been included in the financial statements or notes thereto.
(a)(3) Exhibits
See Index to Exhibits on following page
177
TABLE OF CONTENTS
INDEX TO EXHIBITS
| | |
| Exhibit No. | | Description |
| 3.1 | | Articles of Incorporation of the Company, incorporated by reference to the Company’s Registration Statement on Form S-11 (No. 333-114673), filed with the SEC on July 26, 2004. |
| 3.2 | | Amended and Restated Bylaws of the Company, incorporated by reference to the Company’s Current Report on Form 8-K, filed with the SEC on December 14, 2007. |
| 3.3 | | Articles Supplementary designating the 8.125% Series A Cumulative Redeemable Preferred Stock, liquidation preference $25.00 per share, par value $0.001 per share, dated April 18, 2007, incorporated by reference to the Company’s Current Report on Form 8-K, filed with the SEC on April 18, 2007. |
| 4.1 | | Form of specimen stock certificate representing the common stock of the Company, par value $.001 per share, incorporated by reference to the Company’s Current Report on Form 8-K, filed with the SEC on April 18, 2007. |
| 4.2 | | Form of stock certificate evidencing the 8.125% Series A Cumulative Redeemable Preferred Stock of the Company, liquidation preference $25.00 per share, par value $0.001 per share, incorporated by reference to the Company’s Current Report on Form 8-K, filed with the SEC on April 18, 2007. |
| 10.1 | | Third Amended and Restated Agreement of Limited Partnership of GKK Capital LP, dated April 19, 2006, incorporated by reference to the Company’s Current Report on Form 8-K, dated April 19, 2006, filed with the SEC on April 20, 2006. |
| 10.2 | | First Amendment to the Third Amended and Restated Agreement of Limited Partnership of GKK Capital LP, dated as of April 18, 2007, incorporated by reference to the Company’s Current Report on Form 8-K, dated April 13, 2007, filed with the SEC on April 18, 2007. |
| 10.3 | | Second Amendment to the Third Amended and Restated Agreement of Limited Partnership of GKK Capital LP, dated as of October 27, 2008, incorporated by reference to the Company’s Quarterly Report on Form 10-Q, filed with the SEC on November 10, 2008. |
| 10.4 | | Collateral Management Agreement, by and between Gramercy Real Estate CDO 2005 1, Ltd., as issuer and GKK Manager LLC, as collateral manager, incorporated by reference to the Company’s Quarterly Report on Form 10-Q for the fiscal quarter ended June 30, 2005. |
| 10.5 | | Collateral Management Agreement, dated as of August 24, 2006, by and between Gramercy Real Estate CDO 2006-1, Ltd., as issuer and GKK Manager LLC, as collateral manager, incorporated by reference to the Company’s Quarterly Report on Form 10-Q for the fiscal quarter ended September 30, 2006. |
| 10.6 | | Collateral Management Agreement, dated as of August 8, 2007, by and between Gramercy Real Estate CDO 2007-1, Ltd. And GKK Manager LLC, incorporated by reference to the Company’s Quarterly Report on Form 10-Q for the fiscal quarter ended September 30, 2007. |
| 10.7 | | Indenture, by and among Gramercy Real Estate CDO 2005-1, Ltd., as issuer, Gramercy Real Estate CDO 2005-1 LLC, as co-issuer, GKK Liquidity LLC, as advancing agent and Wells Fargo Bank, National Association, as trustee, paying agent, calculation agent, transfer agent, custodial securities intermediary, backup advancing agent, notes registrar, incorporated by reference to the Company’s Quarterly Report on Form 10-Q for the fiscal quarter ended June 30, 2005. |
| 10.8 | | Indenture, dated as of August 24, 2006, by and among Gramercy Real Estate CDO 2006-1, Ltd., as issuer, Gramercy Real Estate CDO 2006-1 LLC, as co-issuer, GKK Liquidity LLC, as advancing agent, and Wells Fargo Bank, National Association, as trustee, paying agent, calculation agent, transfer agent, custodial securities intermediary, backup advancing agent and notes registrar, incorporated by reference to the Company’s Quarterly Report on Form 10-Q for the fiscal quarter ended September 30, 2006. |
178
TABLE OF CONTENTS
| | |
| Exhibit No. | | Description |
| 10.9 | | Indenture, dated as of August 8, 2007, by and among Gramercy Real Estate CDO 2007-1, Ltd., Gramercy Real Estate CDO 2007-1, LLC, GKK Liquidity LLC and Wells Fargo Bank, National Association, incorporated by reference to the Company’s Quarterly Report on Form 10-Q for the fiscal quarter ended September 30, 2007. |
| 10.10 | | Gramercy Capital Corp. Director’s Deferral Program, incorporated by reference to the Company’s Quarterly Report on Form 10-Q/A for the fiscal quarter ended June 30, 2005. |
| 10.11 | | Second Amended and Restated Registration Rights Agreement by and between the Company and SL Green Operating Partnership, L.P., incorporated by reference to the Company’s Current Report on Form 8-K, dated April 19, 2006, filed with the SEC on April 20, 2006. |
| 10.12 | | Registration Rights Agreement, by and between various holders of the Company’s common stock and the Company, incorporated by reference to the Company’s Current Report on Form 8-K, dated December 3, 2004, filed with the SEC on December 9, 2004. |
| 10.13 | | Form of Restricted Stock Award Agreement, incorporated by reference to the Company’s Annual Report on Form 10-K for the fiscal year ended December 31, 2007, filed with the SEC on March 17, 2008. |
| 10.14 | | Form of Option Award Agreement, incorporated by reference to the Company’s Annual Report on Form 10-K for the fiscal year ended December 31, 2007, filed with the SEC on March 17, 2008. |
| 10.15 | | Form of Phantom Share Award Agreement, incorporated by reference to the Company’s Annual Report on Form 10-K for the fiscal year ended December 31, 2007, filed with the SEC on March 17, 2008. |
| 10.16 | | Severance Agreement, dated as of October 27, 2008, by and between Gramercy Capital Corp. and Roger M. Cozzi, incorporated by reference to the Company’s Current Report on Form 8-K, dated October 27, 2008, filed with the SEC on October 31, 2008. |
| 10.17 | | Severance Agreement, dated as of November 13, 2008, by and between Gramercy Capital Corp. and Timothy O’Connor, incorporated by reference to the Company’s Current Report on Form 8-K, dated November 13, 2008, filed with the SEC on November 17, 2008. |
| 10.18 | | Employment and Noncompetition Agreement, dated as of October 27, 2008, by and between GKK Manager LLC and Roger Cozzi, incorporated by reference to the Company’s Current Report on Current Report on Form 8-K, filed with the SEC on April 28, 2009. |
| 10.19 | | Employment and Noncompetition Agreement, dated as of November 13, 2008, by and between GKK Manager LLC and Timothy O’Connor, incorporated by reference to the Company’s Current Report on Form 8-K, filed with the SEC on April 28, 2009. |
| 10.20 | | Employment and Noncompetition Agreement, dated as of April 27, 2009, by and between Gramercy Capital Corp. and Jon W. Clark, incorporated by reference to the Company’s Current Report on Form 8-K, filed with the SEC on April 28, 2009. |
| 10.21 | | Amended and Restated 2004 Equity Incentive Plan, dated as of October 27, 2008, incorporated by reference to the Company’s Quarterly Report on Form 10-Q, filed with the SEC on November 10, 2008. |
| 10.22 | | First Amendment to Amended and Restated 2004 Equity Incentive Plan, dated as of October 27, 2008, incorporated by reference to the Company’s Quarterly Report on Form 10-Q, filed with the SEC on November 10, 2008. |
| 10.23 | | Junior Subordinated Indenture, dated as of January 30, 2009, by and between GKK Capital LP and The Bank of New York Mellon Trust Company, National Association, as Trustee, incorporated by reference to the Company’s Current Report on Form 8-K, filed with the SEC on February 5, 2009. |
179
TABLE OF CONTENTS
| | |
| Exhibit No. | | Description |
| 10.24 | | Lease Agreement, dated as of April 1, 2003, by and between Wachovia Bank, National Association and First States Investors 4000B, LLC, incorporated by reference to the Company’s Annual Report on Form 10-K for the fiscal year ended December 31, 2009, filed with the SEC on March 17, 2010. |
| 10.25 | | Amended and Restated Lease Agreement, dated as of May 23, 2003, by and between U.S. Bank National Association, and Patrick Thebado, as Lessor, and Bank of America, N.A., as Lessee, incorporated by reference to the Company’s Annual Report on Form 10-K for the fiscal year ended December 31, 2009, filed with the SEC on March 17, 2010. |
| 10.26 | | Lease Agreement, dated as of September 24, 2003, by and between Bank of America, N.A. and First States Investors 4100A, LLC, incorporated by reference to the Company’s Annual Report on Form 10-K for the fiscal year ended December 31, 2009, filed with the SEC on March 17, 2010. |
| 10.27 | | Office Lease, dated as of August 1, 2004, by and between First States Investors 104, LLC and Bank of America, N.A., incorporated by reference to the Company’s Annual Report on Form 10-K for the fiscal year ended December 31, 2009, filed with the SEC on March 17, 2010. |
| 10.28 | | Master Agreement Regarding Leases, dated as of September 22, 2004, by and between Wachovia Bank, National Association and First States Investors 3300, LLC, incorporated by reference to the Company’s Annual Report on Form 10-K for the fiscal year ended December 31, 2009, filed with the SEC on March 17, 2010. |
| 10.29 | | Form of Lease, by and between Wachovia Bank, National Association and First States Investors 3300, LLC, incorporated by reference to the Company’s Annual Report on Form 10-K for the fiscal year ended December 31, 2009, filed with the SEC on March 17, 2010. |
| 10.30 | | Master Lease Agreement, dated of October 1, 2004, by and between First States Investors 5200, LLC and Bank of America, N.A., incorporated by reference to the Company’s Annual Report on Form 10-K for the fiscal year ended December 31, 2009, filed with the SEC on March 17, 2010. |
| 10.31 | | Master Lease Agreement, dated of January 1, 2005, by and between First States Investors 5000A, LLC and Bank of America, N.A., incorporated by reference to the Company’s Annual Report on Form 10-K for the fiscal year ended December 31, 2009, filed with the SEC on March 17, 2010. |
| 10.32 | | Supplemental Indenture, dated as of October 14, 2009, by and between GKK Capital LP and The Bank of New York Mellon Trust Company, National Association, as Trustee, incorporated by reference to the Company’s Current Report on Form 8-K, filed with the SEC on October 20, 2009. |
| 10.33 | | Second Amendment to Loan Agreement, dated as of March 9, 2010, among Goldman Sachs Mortgage Company, Citicorp North America, Inc. and SL Green Realty Corp., collectively, as lender, and certain subsidiaries of Gramercy Capital Corp., as borrower, incorporated by reference to the Company’s Form 8-K, dated March 9, 2010, filed with the SEC on March 15, 2010. |
| 10.34 | | Amendment to Amended and Restated Senior Mezzanine Loan Agreement, dated as of March 9, 2010, among Goldman Sachs Mortgage Company and Citicorp North America, Inc., collectively, as lender, and American Financial Realty Trust, First States Group, L.P., GKK Stars Acquisition LLC, First States Group, LLC, and certain subsidiaries of Gramercy Capital Corp., as borrower, incorporated by reference to the Company’s Form 8-K, dated March 9, 2010, filed with the SEC on March 15, 2010. |
180
TABLE OF CONTENTS
| | |
| Exhibit No. | | Description |
| 10.35 | | Amendment to Junior Mezzanine Loan Agreement, dated as of March 9, 2010, among Goldman Sachs Mortgage Company, Citicorp North America, Inc. and SL Green Realty Corp., collectively, as lender, and GKK Stars Junior Mezz 2 LLC, as borrower, incorporated by reference to the Company’s Form 8-K, dated March 9, 2010, filed with the SEC on March 15, 2010. |
| 10.36 | | Supplemental Indenture, dated as of June 14, 2010, by and between GKK Capital LP and The Bank of New York Mellon Trust Company, National Association, as Trustee, incorporated by reference to the Company’s Current Report on Form 8-K, dated June 14, 2010, filed with the SEC on June 17, 2010. |
| 10.37 | | Letter Agreement, dated March 13, 2011, by and among the Company, as guarantor, GKK Stars Junior Mezz I, LLC, as guarantor, the Borrowers, the Mortgage Lenders, the Mezzanine Lenders, KBS GKK Participation Holdings I, LLC and KBS GKK Participation Holdings II, LLC, incorporated by reference to the Company’s Current Report on Form 8-K, dated March 13, 2011, filed with the SEC on March 14, 2011. |
| 10.38 | | Letter Agreement, dated April 15, 2011, by and among the Company, as guarantor, GKK Stars Junior Mezz I, LLC, as guarantor, the Borrowers, the Mortgage Lenders, the Mezzanine Lenders, KBS GKK Participation Holdings I, LLC and KBS GKK Participation Holdings II, LLC, incorporated by reference to the Company’s Current Report on Form 8-K, dated April 15, 2011, filed with the SEC on April 19, 2011. |
| 10.39 | | Amendment, dated as of July 28, 2011, by and among the Company, GKK Capital LP and Roger M. Cozzi, incorporated by reference to the Company’s Current Report on Form 8-K, dated July 28, 2011, filed with the SEC on August 3, 2011. |
| 10.40 | | Amendment to LTIP Unit Award Agreement, dated as of July 28, 2011, by and among the Company, GKK Capital LP and Roger M. Cozzi, incorporated by reference to the Company’s Current Report on Form 8-K, dated July 28, 2011, filed with the SEC on August 3, 2011. |
| 10.41 | | Amendment, dated as of July 28, 2011, by and among the Company, GKK Capital LP and Timothy J. O'Connor, incorporated by reference to the Company’s Current Report on Form 8-K, dated July 28, 2011, filed with the SEC on August 3, 2011. |
| 10.42 | | Amendment to LTIP Unit Award Agreement, dated as of July 28, 2011, by and among the Company, GKK Capital LP and Timothy J. O'Connor, incorporated by reference to the Company’s Current Report on Form 8-K, dated July 28, 2011, filed with the SEC on August 3, 2011. |
| 10.43 | | Collateral Transfer and Settlement Agreement, dated as of September 1, 2011, by and among GKK Stars Acquisition LLC, KBS Acquisition Sub, LLC, KBS Debt Holdings Mezz Holder, LLC, KBS GKK Participation Holdings I, LLC, KBS GKK Participation Holdings II, LLC and KBS Acquisition Holdings, LLC, incorporated by reference to the Company’s Current Report on Form 8-K, dated September 1, 2011, filed with the SEC on September 8, 2011. |
| 10.44 | | Restricted Stock Award, dated as of January 5, 2012, by the Company to Roger M. Cozzi, filed herewith. |
| 10.45 | | Amendment, dated as of January 1, 2012, by and between GKK Capital LP and Jon W. Clark, filed herewith. |
| 21.1 | | Subsidiaries of the Registrant, filed herewith. |
| 23.1 | | Consent of Independent Registered Accounting Firm, filed herewith. |
| 31.1 | | Certification by the Chief Executive Officer pursuant to Section 302 of the Sarbanes-Oxley Act of 2002, filed herewith. |
| 31.2 | | Certification by the Chief Financial Officer pursuant to Section 302 of the Sarbanes-Oxley Act of 2002, filed herewith. |
181
TABLE OF CONTENTS
| | |
| Exhibit No. | | Description |
| 32.1 | | Certification by the Chief Executive Officer pursuant to 18 U.S.C. section 1350, as adopted pursuant to Section 906 of the Sarbanes-Oxley Act of 2002, filed herewith. |
| 32.2 | | Certification by the Chief Financial Officer pursuant to 18 U.S.C. section 1350, as adopted pursuant to Section 906 of the Sarbanes-Oxley Act of 2002, file herewith. |
| 101.INS | | XBRL Instance Document, filed herewith. |
| 101.SCH | | XBRL Taxonomy Extension Schema, filed herewith. |
| 101.CAL | | XBRL Taxonomy Extension Calculation Linkbase, filed herewith. |
| 101.DEF | | XBRL Taxonomy Extension Definition Linkbase, filed herewith. |
| 101.LAB | | XBRL Taxonomy Extension Label Linkbase, filed herewith. |
| 101.PRE | | XBRL Taxonomy Extension Presentation Linkbase, filed herewith. |
182
TABLE OF CONTENTS
SIGNATURES
Pursuant to the requirements of Section 13 or 15(d) of the Securities Exchange Act of 1934, the registrant has duly caused this report to be signed on its behalf by the undersigned, thereunto duly authorized.
| | |
| | GRAMERCY CAPITAL CORP. |
| Dated: March 15, 2012 | | By: /s/ JON W. CLARK
Name: Jon W. Clark
Title: Chief Financial Officer |
Pursuant to the requirements of the Securities Exchange Act of 1934, this report has been signed below by the following persons on behalf of the registrant and in the capacities and on the dates indicated:
| | | | |
| Signatures | | Title | | Date |
/s/ ROGER M. COZZI
Roger M. Cozzi | | Chief Executive Officer,
(Principal Executive Officer) | | March 15, 2012 |
/s/ JON W. CLARK
Jon W. Clark | | Chief Financial Officer,
(Principal Financial and Accounting Officer) | | March 15, 2012 |
/s/ ALLAN J. BAUM
Allan J. Baum | | Director | | March 15, 2012 |
/s/ MARC HOLLIDAY
Marc Holliday | | Director | | March 15, 2012 |
/s/ JEFFREY E. KELTER
Jeffrey E. Kelter | | Director | | March 15, 2012 |
/s/ PAUL J. KONIGSBERG
Paul J. Konigsberg | | Director | | March 15, 2012 |
/s/ CHARLES S. LAVEN
Charles S. Laven | | Director | | March 15, 2012 |
/s/ WILLIAM H. LENEHAN
William H. Lenehan | | Director | | March 15, 2012 |
183