 1 Goldman Sachs Insurance Symposium May 16, 2013 Michael Lee Bill Hitselberger President and CEO Executive VP and CFO Exhibit 99.1 |
 2 Forward-Looking Statements The Private Securities Litigation Reform Act of 1995 provides a "safe harbor" for forward-looking statements. This presentation and any other written or oral statements made by or on behalf of Tower may include forward-looking statements that reflect Tower's current views with respect to future events and financial performance. All statements other than statements of historical fact included in this presentation are forward-looking statements. Forward-looking statements can generally be identified by the use of forward- looking terminology such as "may," "will," "plan," "expect," "project," "intend," "estimate," "anticipate," "believe" and "continue" or their negative or variations or similar terminology. All forward-looking statements address matters that involve risks and uncertainties. Accordingly, there are or will be important factors that could cause the actual results of Tower to differ materially from those indicated in these statements. Please refer to Tower’s filings with the SEC, including among others Tower’s Form 10-K for the year ended December 31, 2012 and Form 10-Q for the quarter ended March 31, 2013, for a description of the important factors that could cause the actual results of Tower to differ materially from those indicated in these statements. Forward-looking statements speak only as of the date on which they are made, and Tower undertakes no obligation to update publicly or revise any forward-looking statement, whether as a result of new information, future developments or otherwise. Notes on Non-GAAP Financial Measures Operating income (loss) excludes realized gains and losses, acquisition-related transaction costs and the results of the reciprocal business, net of tax. Operating income is a common measurement for property and casualty insurance companies. We believe this presentation enhances the understanding of our results of operations by highlighting the underlying profitability of our insurance business. Additionally, these measures are a key internal management performance standard. Operating earnings (loss) per share is operating income (loss) divided by diluted weighted average shares outstanding. Net income (loss) attributable to Tower Group International, Ltd. is the most directly comparable GAAP measure. Operating return on equity is annualized operating income (loss) divided by average common equity, and operating return on equity excluding the impact of catastrophes and reserve development is calculated by eliminating the impact of catastrophes and reserve development on operating income (loss). See footnote 2 for additional discussion of the exclusion of catastrophes and reserve development. A reconciliation of net income (loss) attributable to Tower Group International, Ltd. to operating income (loss) and return on average equity to operating return on average equity is provided in an accompanying table. Combined ratio excluding the impact of catastrophes and reserve development is the sum of the loss and loss adjustment expense ratio and the expense ratio excluding the impact of catastrophes and reserve development. We believe this presentation enhances the understanding of our results by eliminating what we believe are volatile and unusual events and presenting the ratios with what we believe are the underlying run rates of the business. A reconciliation of combined ratio to combined ratio excluding the impact of catastrophes and reserve development is provided in an accompanying table. Book value per share is calculated as Tower Group International, Ltd. stockholders’ equity divided by the number of shares outstanding. We believe that book value per share is an important measure of our ability to grow shareholder value. The computation of book value per share is provided in an accompanying table. Total premiums include gross premiums written through our insurance subsidiaries and produced as managing general agent on behalf of other insurance companies, including the reciprocal exchanges. |
 3 Overview of Tower • Global diversified P&C insurance company – Bermuda-based holding company formed through merger on March 13, 2013 – Tower’s U.S. companies founded in 1990 – Top 50 P&C insurer in U.S. with $2.0 billion GPW and managed in 2012 – Rated “A-” by A.M. Best – 20+ offices across U.S., in Bermuda and London, with over 1,400 employees • Diversified product offering in U.S. – Commercial General: 36%* - Comprehensive product offering to small business owners – Commercial Specialty: 32%* - Narrowly focused specialty products – Personal Lines: 32%* - Home and auto • Expanding international business through Bermuda platform – Affiliated reinsurance to support Tower U.S. operations – Specialty reinsurance to third party clients - Lloyd’s syndicates and small insurance companies in U.S – Lloyd’s operation in development – special purpose syndicate owned and managed by Canopius Group * Percentage of total premium for the year ended 12/31/12 |
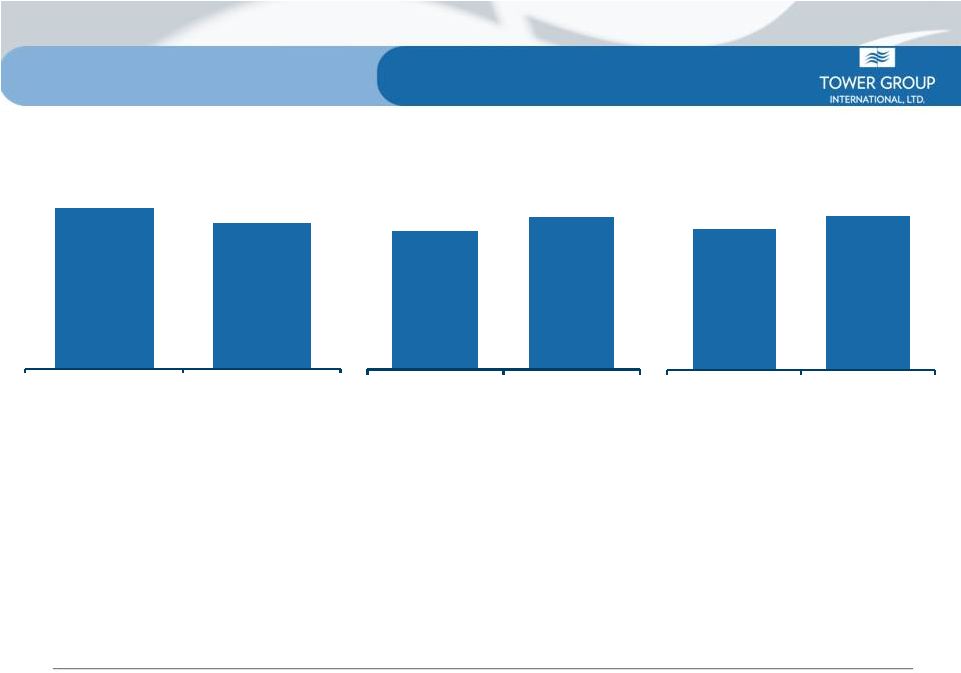
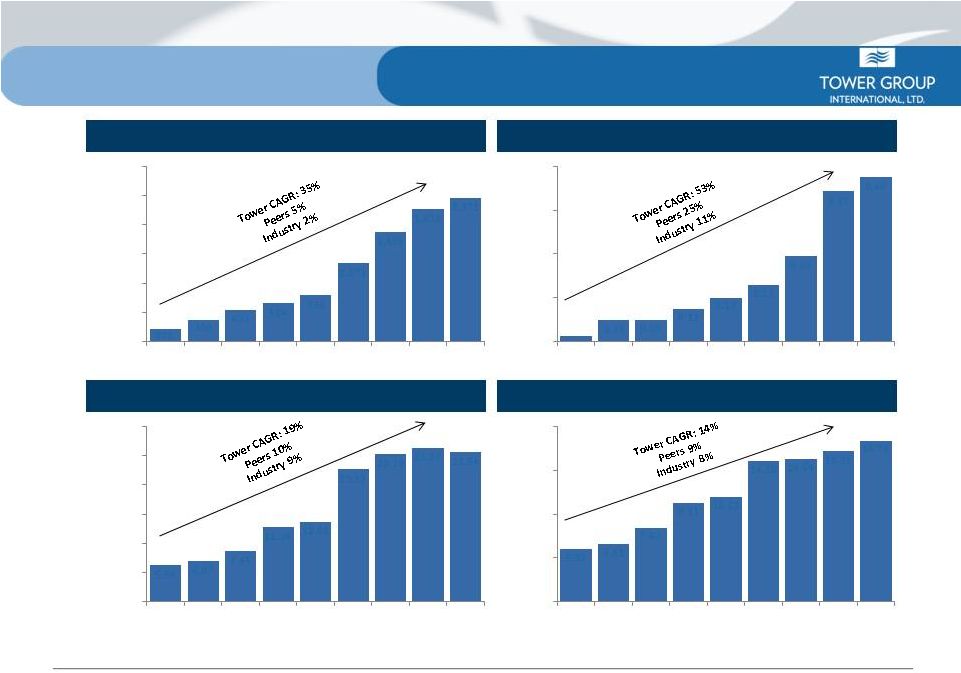 4 Source: SNL Financial. Industry data based upon SNL U.S. Insurance P&C Index. Peers include AFG, AFSI, HCC, MKL, NAVG, RLI, SIGI, THG, UFCS, WRB. Tower numbers for BVPS and TBVPS adjusted to reflect merger conversion ratio. Book Value per Share Tangible Book Value per Share Gross Written Premiums ($MM) Dividends Per Share Consistent Track Record of Profitable Growth 5.54 6.07 7.65 11.24 12.01 19.99 22.19 23.26 22.54 - 5 10 15 20 25 30 2004 2005 2006 2007 2008 2009 2010 2011 2012 178 300 433 524 635 1,071 1,496 1,811 1,971 - 400 800 1,200 1,600 2,000 2,400 2004 2005 2006 2007 2008 2009 2010 2011 2012 5.32 5.81 7.40 9.91 10.52 14.20 14.54 15.35 14.70 - 5 10 15 20 2004 2005 2006 2007 2008 2009 2010 2011 2012 0.02 0.09 0.09 0.13 0.18 0.23 0.34 0.61 0.66 - 0.20 0.40 0.60 0.80 2004 2005 2006 2007 2008 2009 2010 2011 2012 |
 5 Canopius Bermuda Merger Highlights • Transformational merger completed on March 13, 2013 – Tower Group, Inc. (TGI) merged with Canopius Holdings Bermuda Limited, creating a new holding company called Tower Group International, Ltd. listed under the same TWGP symbol – TGI shareholders own 76% of new company, former owners of Canopius Bermuda own 24% – Tower Group considered as accounting acquirer, and therefore prior year results are only those of TGI • Merger impact on shares (in 000's) Shares Outstanding at 12-31-2012 (pre-merger) 38,406 Shares Outstanding at 12-31-2012 (post-merger) * 43,514 Restricted stock grants and shares withheld for taxes -107 New Shares Issued in Merger 14,026 Shares Outstanding at 3-31-2013 57,432 *Adjusted for merger conversion ratio of 1.133 to 1 |
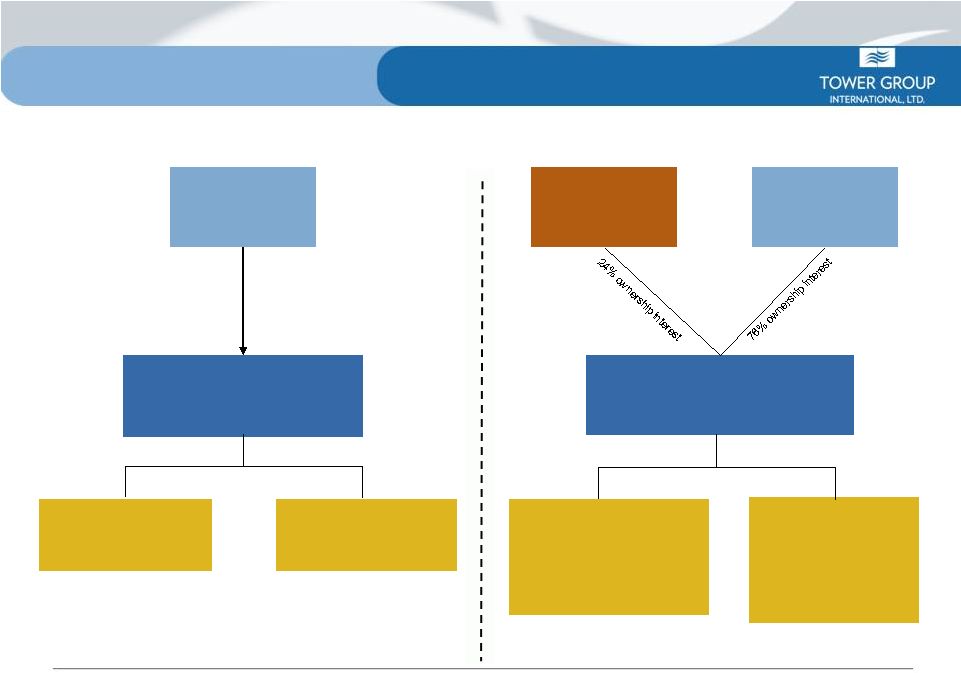 6 High Level Corporate Structure Tower Group, Inc. Delaware Holding Company *CP Re used solely to reinsure US Pool Tower Stockholders 100% US Pool* Castle Point Re* (“CP Re”) PRE MERGER Post Merger New Stockholders Pre Merger Tower Stockholders Tower Group International, Ltd. Bermuda Holding Company Bermuda Operations Tower Reinsurance, Ltd to assume CP Re’s operations U.S. Operations Tower and its Subsidiaries POST MERGER |
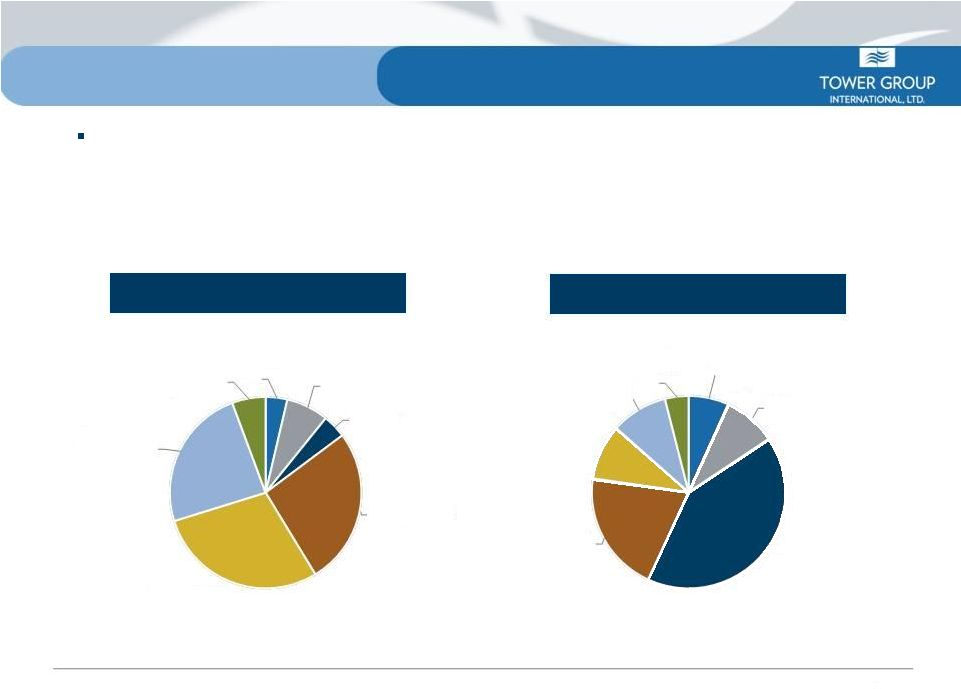
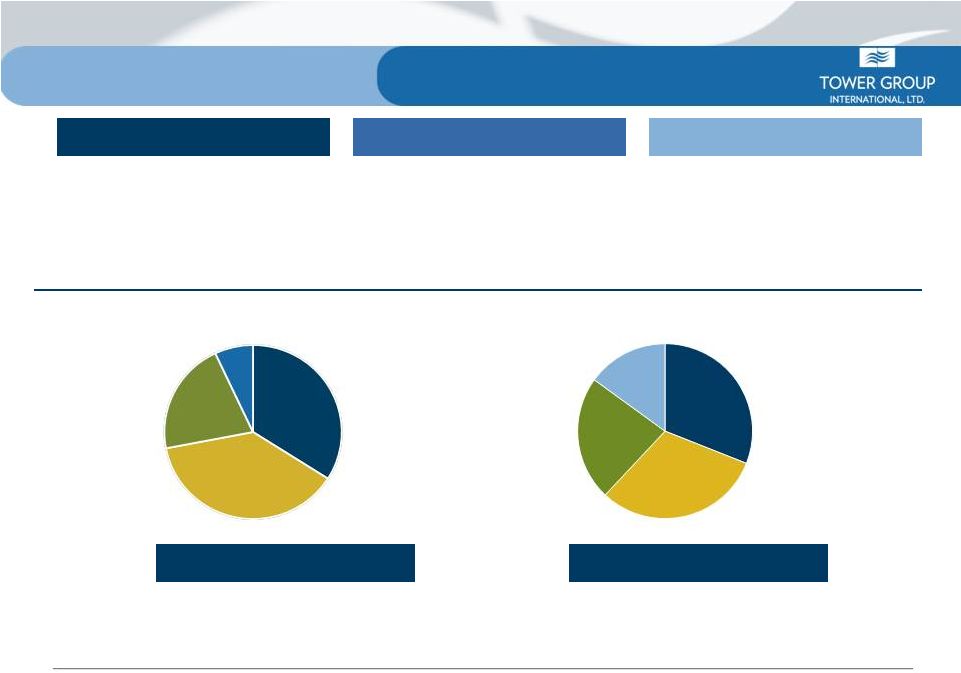 7 Pre-Merger Tower* 2013 Pro Forma Global Diversified Insurance Company U.S. Bermuda Lloyd’s • Continue expansion of commercial, personal and specialty businesses • Establish Tower Reinsurance Ltd. as efficient reinsurance platform to support U.S. and international business • Expand existing relationships with Lloyd’s syndicates to access $38B market • Expect to acquire or develop Tower’s own Lloyd’s syndicate * Percentage of total premium for the year ended 12/31/12 Commercial General 34% Personal Lines 38% Commercial Specialty 21% Assumed Re 7% Commercial General 31% Commercial Specialty 23% Quota share of Lloyd's business 15% Personal Lines 31% |
 8 Impact of Post Merger Restructuring • Bermuda: – Established Tower Reinsurance, Ltd. (Tower Re) to replace CastlePoint Re – GPW projected to be $850 million to $950 million in 2013 from affiliated and third party specialty reinsurance – Strong balance sheet with approximately $500 million in surplus and strong reserve position • U.S.: – Reduced short term profitability due to technology projects and transfer of assumed reinsurance from U.S to Bermuda – GPW projected to be $1.4 billion to $1.6 billion ($450 million to $550 million ceded to Tower Re) with $600 to $700 million in surplus • Impact on operating results: – Higher than expected earnings in Bermuda offset by weaker operating results in U.S. due to restructuring – Profitability of U.S operations should gradually improve throughout 2013 and 2014 with completion of technology projects and increased scale |
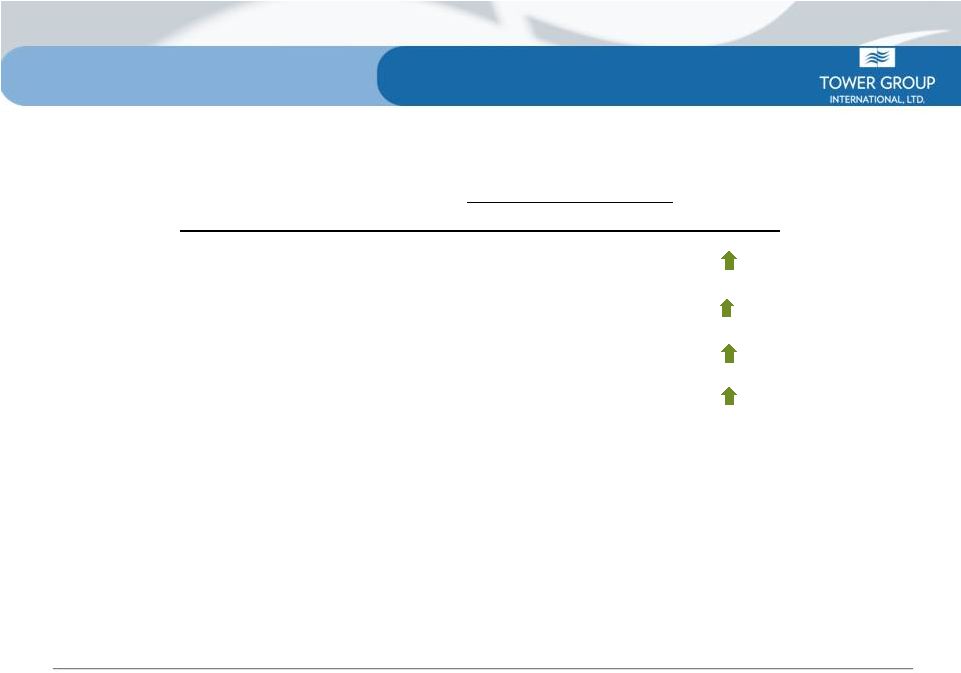
 9 • Products – Goal: Develop and customize products for different industries and customer groups as well as key clients • Expected expansion into affluent personal lines market and various commercial niche markets expected in 2013 • People – Goal: Improve existing and create new business franchises • Recently hired highly experienced underwriting managers with national markets and product experience • Assumed reinsurance and customized solutions generated $195 million of new written premiums in 2012, up from $158 MM in 2011 • Process – Goal: Improve technical expertise in functions related to generating organic growth (e.g. product and business development) • Currently developing a pipeline of customized products for select agents • Recently formed strategic alliances with Lloyd’s syndicates and key business partners to significantly improve product and analytical expertise in specialty markets Organic Growth Initiative |
 10 U.S Business Strategy • Overall U.S Strategy – Achieve profitability (92%- 96% CR) through increased scale and automation – Establish strong separate and distinct management teams for each of these businesses – Mitigate Northeast exposure through geographical diversification • Personal – Expand personal lines product offerings through personal package policies – Utilize reciprocal insurance exchanges to provide additional capacity and generate fees • Commercial – Focus on underwriting small policies using automated web platform – Leverage existing products throughout the country – Offer products in multiple pricing and coverage tiers • Specialty – Focus on narrowly defined homogeneous classes of business – Acquire or develop specialized underwriting expertise requiring industry insight, regional knowledge or understanding of specific risks |
 11 International Business Strategy • Bermuda – Efficient source of capital to support growth in U.S. and Lloyd’s – Third party reinsurance • Currently comprised of participation in established business from Lloyd’s syndicates; opportunity to re-establish partnerships with small insurance companies (reinsurance business previously underwritten by CastlePoint) • Lloyd’s – Development of third party reinsurance business (qualifying quota share arrangements) • Delayed plans to acquire own syndicate and gained entry through strategic relationship with Canopius and other well established syndicates led by underwriting managers with a strong underwriting track record – Established a special purpose syndicate for Tower owned and operated by Canopius with the goal of becoming independent within 2 years – Continue to evaluate opportunities to either acquire or assume significant ownership interest in established Lloyd’s syndicates |
 12 (in 000's except per share data) Three months ended 3/31/2013 3/31/2012 GPW and managed $550,423 $467,362 18% Operating income $25,900 $20,618 26% Operating EPS $0.56 $0.46 22% WASO 45,984 44,535 3% Operating ROE 9.8% 7.9% Insurance Ratios Loss ratio 63.1% 64.2% Expense ratio 36.0% 34.6% Combined ratio 99.1% 98.8% 1Q 2013 Financial Highlights (Tower only – excludes reciprocals) |
 13 1Q 2013 Balance Sheet Highlights (in millions except per share data) 3/31/2013 12/31/2012 Total assets $6,395 $4,749 35% Debt 451 450 0% Tower Stockholders' equity 1,197 981 22% Tower Capital $1,648 $1,431 15% Tower debt to capital ratio 27% 31% Book value per share $20.85 $22.54 -7% Shares outstanding 57,432 43,515 32% |
 14 1Q 2013 Consolidated Loss Ratio • No adverse development in first quarter 2013 • Currently accident year 2012 is developing better than original expectations • Acquisitions reserved at high end of the actuarial range; Canopius Bermuda risk premium of $20 million included in loss reserves • Major events have consistently been reserved conservatively (Irene, Sandy) with no adverse development noted (Tower only – excludes reciprocals) 63.1 64.2 1Q 2013 1Q 2012 Loss Ratio (%) |
 15 1Q 2013 Expense Ratio • As systems initiatives relating to personal lines are completed, we expect scale advantage to drive expense ratio down 18.2% 18.6% 14.0% 12.3% 3.8% 3.7% 36.0% 34.6% 1Q13 1Q12 Commissions, net of ceding commissions OUE, net of fees BB&T expenses (Tower only – excludes reciprocals) |
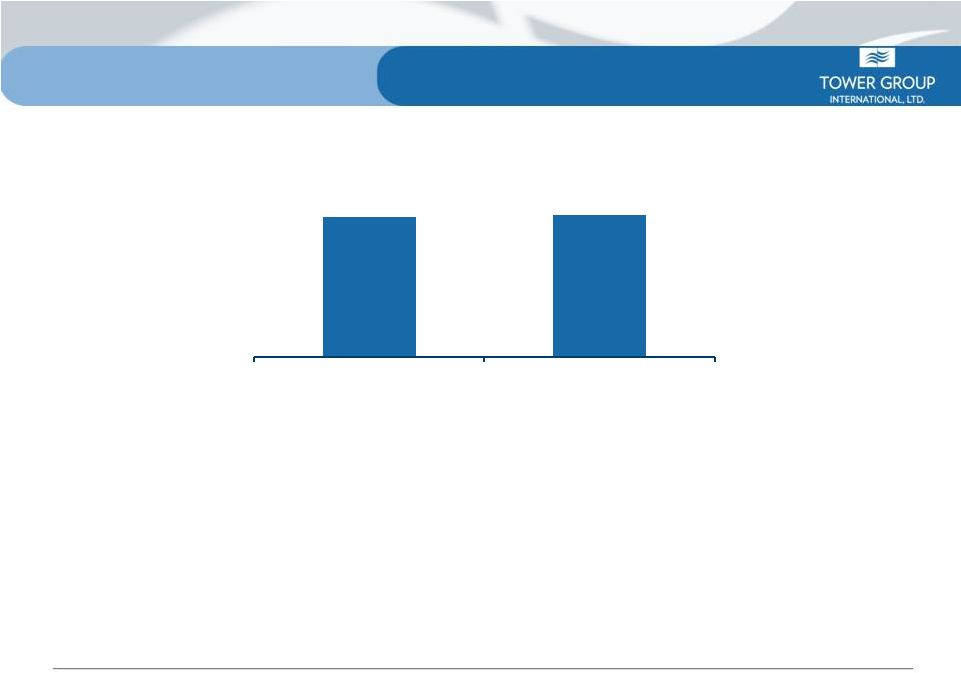
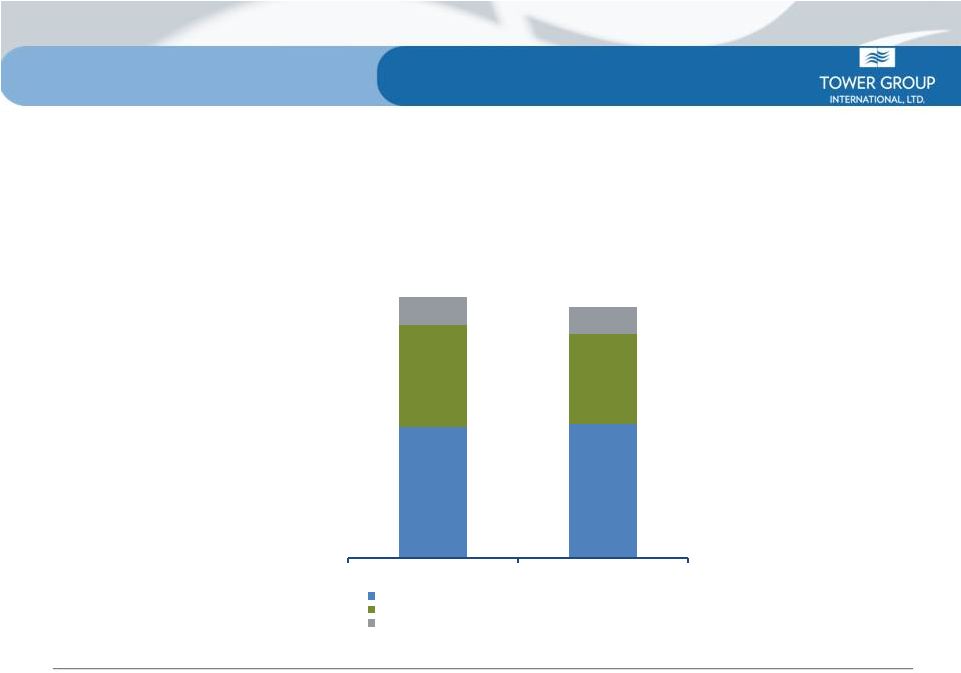
 16 1Q 2013 Investment Performance • Portfolio yield impacted at 1Q 2013 by large cash balances obtained through merger and by portfolio sales to fund Sandy losses • Bermuda platform will provide a better after tax return environment on reinsurance portfolio assets • Continuing to look at real estate and alternative investments as classes to enhance investment returns Note: Cash & Invested Assets, Tax–Equivalent Fixed Income Yield and Net Investment Income exclude reciprocals $2,589 $2,359 03-31-2013 03-31-2012 Cash and Invested Assets ($millions) 4.1 4.5 1Q 2013 1Q 2012 Tax- Equivalent Fixed Income Yield (%) $30 $32 03-31-2013 03-31-2012 Net Investment Income ($millions) |
 Asset Allocation Asset Quality Note: All numbers exclude the reciprocal exchanges. Data as of December 31, 2012 Our high-quality investment portfolio had net unrealized pre-tax gains of $135 million at December 31, 2012 attributable to Tower shareholders • Fixed income average quality of A+ • Duration of 4.6 years • Tax equivalent book yield of 4.5% Highly Rated Investments Cash and cash equivalents 4% U.S. Treasury securities 7% U.S. Agency securities 4% Municipal bonds 26% Corporate and other bonds 29% Commercial, residential and securities 24% Equity securities 5% U.S. Treasury securities 7% AAA 8% AA 42% A 18% BBB 10% Below BBB 11% Cash and cash equivalents 4% 17 asset-backed |
 18 Capital Management Strategy • Capital increase due to $206 million from the merger and should also increase from anticipated 2013 earnings growth • Capital management strategy will be utilized to balance support of business production and to achieve targeted return on equity • Dividends – Maintained 1Q 2013 dividend at pre-merger level of 16.5 cents (adjusted for merger conversion ratio) • Share repurchase plan – $50 million authorization approved |
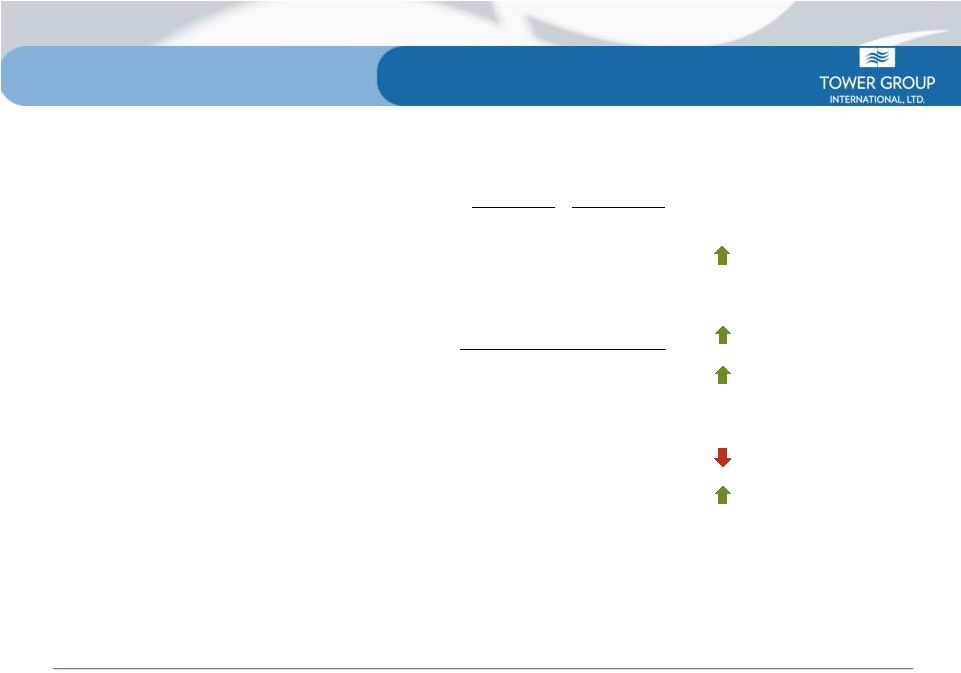
 19 Positive Outlook for Remainder of 2013 Original Forecast 1Q13 2013 Target* 1 quarter analysis and outlook for the rest of 2013 GWP & Managed Growth Rate 5% - 10% 18.0% 5% - 10% Higher than expected growth rate in 1Q due to continued growth from specialty reinsurance business in Bermuda. Loss Ratio 62.3% 63.1% 62% - 63% Overall loss ratio slightly higher due restructuring of business segments that increased loss ratio in U.S offset partially by lower loss ratio in Bermuda. Expense Ratio 35.5% 36.0% 34.5% - 35.5% Higher expense ratio in U.S due to technology costs. Expense should gradually trend lower as technology projected are completed. Combined Ratio 97.8% 99.1% 96.5% - 98.5% Higher gross premiums written offset by higher combined ratio from higher expense and loss ratios Investment Yield 4.6% 4.1% 4.3% - 4.6% Investment returns lower due to payout for Sandy claims and higher capital from merger. Tax Rate Operating ROE Operating EPS 11.5% 12% $2.40 - $2.60 (12.5%) 9.8% $0.56 2% - 4% 10% - 12% $2.40 - $2.60 Lower tax rate due to restructuring of business in U.S and Bermuda. ROE should improve close to target as full impact of merger is realized throughout 2013. *Excludes reciprocals st |
 20 Summary • New and improved business model created through Canopius Bermuda merger – Gained access to Bermuda platform to provide efficient source of capital – Anticipated further growth of profitable international and specialty business – Goal to achieve 13% - 15% ROE in 2014 • Improving profitability of personal, commercial and specialty businesses in U.S. – Reduced profitability in the short-term as a result of significant investment in technology and transfer of assumed reinsurance business from U.S. to Bermuda – Gradual improvement in profitability in 2013 and 2014 with increased scale and completion of technology projects • Attractive entry point for new investors – 0.9x Price/Book Value* – 3.4% dividend yield vs. 1.2% yield of the SNL U.S. Insurance P&C Index* • Significant insider ownership – 8.3% ownership by executive officers and directors** * Source: SNL Financial. Market data as of May 13, 2013; Tower financial data as of 3/31/2013 **From Tower Group International, Ltd. 2013 proxy, data as of March 19, 2013 |