OMB APPROVAL
OMB Number: 3235-0570
Expires: July 31, 2022
Estimated average burden hours per response...20.6
UNITED STATES SECURITIES AND EXCHANGE COMMISSION
Washington, DC 20549
FORM N-CSRS
CERTIFIED SHAREHOLDER REPORT OF REGISTERED
MANAGEMENT INVESTMENT COMPANIES
Investment Company Act file number 811-21582
Madison Covered Call & Equity Strategy Fund
(Exact name of registrant as specified in charter)
550 Science Drive, Madison, WI 53711
(Address of principal executive offices)(Zip code)
Steven J. Fredricks
Chief Legal Officer & Chief Compliance Officer
Madison Asset Management, LLC
550 Science Drive
Madison, WI 53711
(Name and address of agent for service)
Registrant's telephone number, including area code: 608-274-0300
Date of fiscal year end: December 31
Date of reporting period: June 30, 2020
Form N-CSRS is to be used by management investment companies to file reports with the Commission not later than 10 days after the transmission to stockholders of any report that is required to be transmitted to stockholders under Rule 30e-1 under the Investment Company Act of 1940 (17 CFR 270.30e-1). The Commission may use the information provided on Form N-CSRS in its regulatory, disclosure review, inspection, and policymaking roles.
A registrant is required to disclose the information specified by Form N-CSRS, and the Commission will make this information public. A registrant is not required to respond to the collection of information contained in Form N-CSRS unless the Form displays a currently valid Office of Management and Budget (“OMB”) control number. Please direct comments concerning the accuracy of the information collection burden estimate and any suggestions for reducing the burden to Secretary, Securities and Exchange Commission, 450 Fifth Street, NW, Washington, DC 20549-0609. The OMB has reviewed this collection of information under the clearance requirements of 44 U.S.C. § 3507.
Item 1. Certified Financial Statement

| | MADISON COVERED CALL & |
| | EQUITY STRATEGY FUND (MCN) |
| | |
| | Active Equity Management combined |
| | with a Covered Call Option Strategy |
Beginning March 1, 2021, as permitted by regulations adopted by the Securities and Exchange Commission, we will no longer mail paper copies of the Fund’s shareholder reports like this one, unless you specifically request paper copies from the Fund or your financial intermediary, such as a broker-dealer or bank. Instead, the reports will be made available on the Fund’s website and we will notify you by mail each time a report is posted and provide you with a website link to access the report. If you have already elected to receive shareholder reports electronically, you will not be affected by this change and do not need to take any action. If you prefer to receive shareholder reports and other communications electronically, you may update your mailing preferences with your financial intermediary, or enroll in e-delivery at www.computershare.com/investor (for shares held directly with our transfer agent, Computershare).
You may elect to receive all future reports in paper free of charge by calling Computershare at (877) 373-6374 if you hold shares direct. If your fund shares are held through a financial intermediary, please contact them directly to make your request and to determine whether your election will apply to all funds in which you own shares through that intermediary.
MCN | Madison Covered Call & Equity Strategy Fund | June 30, 2020
Table of Contents
MCN | Madison Covered Call & Equity Strategy Fund | June 30, 2020
Review of Period
What happened in the market during the first half of 2020?
For many quarters, we have been concerned that equity markets refused to recognize any negative news. As the New Year began, markets continued to surge higher despite weak economic growth, slowing earnings growth, increasingly expensive valuations, an uncertain political landscape, etc. Having experienced our fair share of “market events” over the past 30+ years, we’ve noted that what tips the market into a significant downturn is typically a rather innocuous event or data point; the proverbial straw that broke the bull market’s back. Well, this time around it was not a straw but a massive boulder that has shaken the foundation of the global economy and broken the back of the equity bull market. The COVID-19 virus brought the global economy to a virtual standstill and changed everyone’s lives as we adjusted to a new world of uncertainty. The global medical infrastructure came under intense stress and other industries converted, now excess, production capacity to producing much needed medical equipment and protective gear. With much of the world under quarantine or “stay-at-home” orders, the service sector has been decimated. In the U.S., unemployment claims have skyrocketed and reached historic highs. As many struggle with the loss of income and the inability to pay their bills, the government very quickly passed a $2.2 trillion spending package geared toward supporting individuals through this crisis. More will likely be required. The Federal Reserve has also enacted numerous market support mechanisms in order to ensure the access and functionality of the funding system so that individuals, small and large business, municipalities and states have access to liquidity in order to bridge the gap to more normal economic activity.
The market reaction was severe. From the start of the year through the February 19th peak, the S&P 500® Index rose more than 5% despite the fact that news of the virus impact in China and other parts of the world was fairly prominent. To be honest, it was puzzling to us that up to that point, that the market seemingly had little concern about COVID-19. That changed when it was announced that a major outbreak had occurred in Italy. Faced with the reality of a large global pandemic, investors finally took the virus spread seriously and markets plunged. From that
historic peak on February 19th, the S&P 500 fell almost 34% through March 23rd. The market rallied off the bottom to the end of March by more than 15% but a great deal of uncertainty prevailed.
After bottoming in late March, the index rallied to within 4.5% of its all-time highs by early June before pausing as COVID-19 hotspots popped up again. Immediately after suffering its worst quarterly decline since 2007, the S&P 500 posted its best quarterly return since the 4th quarter of 1998, gaining 20.5%. Ongoing and unprecedented government and Federal Reserve stimulus along with economic data which was “less dire” led to the belief that things will get back to normal faster than previously expected. However, the V-shaped market recovery is missing one key ingredient … earnings. Expectations appear to be quite high regarding an earnings rebound but as we soon enter 2nd quarter earnings reporting season, we should get a clearer picture about whether expectations have been too high or too low. With market levels again near all-time highs, any disappointment on the earnings front will likely lead to more volatility and downside risk while much of any potential upside appears to be already priced in. So it may be a little early to assess the quality of the market’s recent performance. In other word, it may turn out to be a true V-shaped recovery but it also could end up being the first half of a W-shaped environment. With face masks fully in place, we cautiously await the results.
A Quick Word on Volatility
Market volatility was extremely high during the first quarter market decline. In the 29 trading days since the market peak, we witnessed 19 days in which the market has had a daily move of more than +/- 3% with 11 days negative and 8 days positive. The largest single daily decline was 12% and the largest increase was 9.5%. In mid-March, the VIX Index, which measures the 30 day expected volatility of the S&P 500, spiked to within a breath of the 2008 all-time highs before retreating to the still high level in the low 50’s by quarter end. As reference, the VIX has only occasionally traded at levels above 20 since 2012. Also, as in most dramatic market events, correlations move toward 1 for most assets, meaning that everything moves together regardless of their underlying
MCN | Madison Covered Call & Equity Strategy Fund | Review of Period (unaudited) - continued | June 30, 2020
properties. Although volatility has declined during the second quarter as the market rebounded, it remains fairly elevated. The average volatility during the 2nd quarter was 2.3 times higher than the 5 year average ending December 2019. As such, option pricing remains attractive across most sectors of the market. This allows us the flexibility to write call options further out-of-the-money while receiving higher option premiums that would otherwise be available during periods of lower volatility. To be sure, the daily market swings have subsided significantly compared to the extreme moves of the 1st quarter. With most of the 1st quarter daily moves being driven by fear, the mainly positive upward moves during the most recent quarter appear to be mainly driven by hope. Unfortunately, fear and hope are not particularly sound investment strategies but rather periods during which strategies with solid foundations can be opportunistic while remaining level headed.
How did the Fund perform given the marketplace conditions during the first six months of 2020?
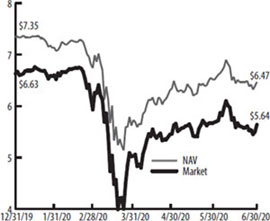
It was really a tale of two very different market environments between the 1st and 2nd quarters. Over the full six months ending June 30, 2020, the Fund’s market price fell -9.09%, ahead of the CBOE S&P BuyWrite Index (BXM) decline of -15.11%. The S&P 500 dropped -3.09% during the period. The Fund’s Net Asset Value (NAV) lost -6.66%. The Fund’s discount to NAV widened during the market decline from -9.8% at the beginning of the year to -23.9% at the market bottom but recovered to -12.8% by the end of the period with the market experiencing a still high level of volatility.
For the totality of the first quarter, MCN (NAV) fell 20%, outperforming the CBOE S&P 500 Buy-Write Index’s (BXM) -22.2% return while slightly trailing the S&P 500 Index’s -19.6% decline. During the initial part of the quarter through February’s peak, the Fund trailed the S&P 500 by over 600 basis points as the Fund’s defensive position did not allow it to participate in the run-up in the market. However, during the period from mid- February through the market’s bottoming in late March, the Fund outperformed the S&P 500 by almost 700 basis points. During the rally off the bottom through the quarter end, the fund participated in the rally but lagged the overall market. Given the extreme volatility of the quarter, the fund reacted as one would expect, lagging during periods
of market strength but outperforming during market declines.
The market continued to strongly rebound in the 2nd quarter. Given the 20.5% surge in the S&P 500 during the 2nd quarter, the MCN (NAV) participated very well, rising 16.9%. This represented significant outperformance relative to the CBOE S&P 500 Buy-Write Index’s (BXM) return of 9.1%.
SHARE PRICE AND NAV PERFORMANCE FOR MADISON COVERED CALL & EQUITY STRATEGY FUND
Call option coverage remained fairly consistent during the period, starting at 78.7% and ending at 82.2%. With concerns heightened that the market may have recovered too quickly without confirmation from economic data, we have remained defensively postured. Cash levels have risen later in the period as the markets have become more challenged from a valuation perspective. As expected, both cash and option coverage were positive performance contributors during the 1st quarter but turned to headwinds as the market rallied in the 2nd quarter.
Over the full period, stock performance was additive to overall performance however it followed a very volatile path. During the market fall, stocks underperformed, particularly in the economically sensitive areas of Energy and Materials. These same areas outperformed significantly, however, as the market recovered leading to a net positive influence on performance. Energy holdings were quite volatile with strong performance from natural gas producer Range Resources but weaker results from Transocean although it recovered strongly in the 2nd quarter. Similarly, communications companies had divergent performance with T-Mobile up very strongly
MCN | Madison Covered Call & Equity Strategy Fund | Review of Period (unaudited) - continued | June 30, 2020
but Discovery Networks lagging on a weaker advertising environment. Gold holdings Newmont Mining, Barrick Gold and the Van Eck Gold Miners Fund performed very well as the price of the metal rose from $1520/oz to over $1780/oz ( and continuing higher into July). On the Consumer side, Lowes outperformed while General Motors lagged.
During the period, the top performing sectors were Information Technology and Consumer Discretionary, the only sectors to achieve positive returns. In both case, the largest components generated the most returns and overall performance was relatively narrow. Energy and Financials were the most significant laggards with Energy getting decimated in the market downturn before recovering in the 2nd quarter. Financials are suffering from persistent low interest rates which hurts their net interest margins and concerns that the economic shutdown will lead to an increase in loan delinquencies. The Fund has been underweighted in the Technology and Consumer Discretionary areas for a significant period of time given what we believe are elevated valuations and less compelling growth opportunities. Given their continued strong performance, particularly weighted toward the only a handful of the very largest companies, the Fund did not fully participate in these returns. The Energy sector, where the Fund is over weighted, has been very volatile as global growth, related trade concerns and the Covid shock have impacted oil demand expectations. These positions led to sector allocation detracting from relative performance.
Describe the Fund’s portfolio equity and option structure.
As of June 30, 2020, the Fund held 36 equity securities and unexpired call options had been written against 82.2% of the Fund’s stock holdings. It is the strategy of the Fund to write “out-of-the-money” call options, as of June 30, 89% of the Fund’s call options (41 of 46 different options) remained “out-of-the-money.” (Out-of-the-money means the stock price is below the strike price at which the shares could be called away by the option holder). On average, the Fund’s call options had 41.5 days to expiration.
Which sectors are prevalent in the Fund?
From a sector perspective, MCN’s largest exposure as of June 30, 2020 was to the Health Care sector followed by the, Materials, Financial, Energy and Consumer Staples
sectors. This was followed by smaller exposure in the Technology, Industrial, Consumer Discretionary, and Utilities sectors. The Fund had no exposure to the Real Estate sector.
ALLOCATION AS A PERCENTAGE OF TOTAL INVESTMENTS AS OF 6/30/20
| Communication Services | 5.7% | | Health Care | 12.6% |
| Consumer Discretionary | 4.1% | | Industrials | 6.0% |
| Consumer Staples | 8.1% | | Information Technology | 6.3% |
| Energy | 8.3% | | Materials | 11.0% |
| Exchange Traded Funds | 6.7% | | Short-Term Investments | 20.3% |
| Financials | 8.6% | | Utilities | 2.3% |
Discuss the Fund’s security and option selection process:
The Fund is managed by primarily focusing on active stock selection before adding the call option overlay utilizing individual equity call options rather than index options. We use Fundamental analysis to select solid companies with good growth prospects and attractive valuations. We then seek attractive call options to write on those stocks. It is our belief that this partnership of active management of the equity and option strategies provides investors with an innovative, risk-moderated approach to equity investing. The Fund’s portfolio managers seek to invest in a portfolio of common stocks that have favorable “PEG” ratios (Price-Earnings ratio to Growth rate) as well as financial strength and industry leadership. As bottom-up investors, we focus on the Fundamental businesses of our companies. Our stock selection philosophy strays away from the “beat the street” mentality, as we seek companies that have sustainable competitive advantages, predictable cash flows, solid balance sheets and high-quality management teams. By concentrating on long-term prospects and circumventing the “instant gratification” school of thought, we believe we bring elements of consistency, stability and predictability to our shareholders.
Once we have selected attractive and solid names for the Fund, we employ our call writing strategy. This procedure entails selling calls that are primarily out-of the-money, meaning that the strike price is higher than the common stock price, so that the Fund can participate in some stock appreciation. By receiving option premiums, the Fund receives a high level of investment income and adds an element of downside protection. Call options may be written over a number of time periods and at differing
MCN | Madison Covered Call & Equity Strategy Fund | Review of Period (unaudited) - concluded | June 30, 2020
strike prices in an effort to maximize the protective value to the strategy and spread income evenly throughout the year.
What is the management’s outlook for the market and Fund for the remainder of 2020?
We noted earlier that up until COVID-19 caused the market to correct, there was a lack of risk awareness with investors. Now that we’ve been through a severe correction, the subsequent recovery in the market makes us feel that risk awareness is lacking once again. Forecasting things like sales, earnings and cash flow are a difficult task at the best of times but currently, the future course of economic revival remains extremely murky. On the positive side, we have seemingly ever-present and growing monetary and fiscal stimulus. For many years now, this has been a significant catalyst for stocks and other risky assets to move higher. Whether this wall of artificial support can continue to offset growing structural economic problems is up for debate. It seems at some point the rate of U.S. government, corporate and personal debt will become a serious problem but the ultimate timing is unknown. The economy seems to be improving slowly from the unprecedented COVID-19 shutdown but getting back to a normalized environment is highly unlikely over the near term. A potential vaccine is likely six months away at best and we will be entering another flu season well before that happens. The high unemployment rate has yet to manifest itself in significant debt defaults but that will likely become an issue relatively soon, particularly if government support is curtailed. Political uncertainty is also very high. The November election will likely be a very confusing and divisive event with results possibly unknown for days or weeks following the election. Also, investor friendly policies may become significantly less friendly under a new administration and those risks, at some point, will begin to be reflected in stock prices.
So, to say that we remain concerned about the future would be an understatement. We have become increasingly defensive within the Fund, the further the market has rebounded. Stimulus may be enough to continue the uptrend for a while, the V-shaped recovery may ultimately become reality or a vaccine comes sooner rather than later. We truly hope that these things occur but our strategy tells us to be level-headed and always look to protect capital. We believe it is prudent to follow our beliefs and remain conservatively positioned.
With significant market uncertainty and yields that will likely remain subdued for some time, equity income investing provides a less volatile approach to asset allocation structuring while also providing an attractive alternative income source for investors. We see covered call writing as an attractive solution given the current investment environment.
| TOP TEN EQUITY HOLDINGS AS OF 6/30/20 |
| | % of Total Investments |
| VanEck Vectors Gold Miners ETF | 3.6% |
| Berkshire Hathaway Inc. | 3.2% |
| Freeport-McMoRan Inc. | 3.2% |
| Invesco DB Gold Fund | 3.1% |
| Becton Dickinson and Co. | 2.9% |
| PepsiCo Inc. | 2.9% |
| Range Resources Corp. | 2.8% |
| Xilinx Inc. | 2.8% |
| Gilead Sciences Inc. | 2.7% |
| Barrick Gold Corp. | 2.6% |
INDEX DEFINITIONS
Indices are unmanaged and reflect no expenses. It is not possible to invest directly in an index.
The S&P 500® Index is an unmanaged, capitalization-weighted index of 500 stocks. The index is designed to measure performance of the broad domestic economy through changes in the aggregate market value of 500 stocks representing all major industries.
The Chicago Board Options Exchange (CBOE) Market Volatility Index, often referred to as the VIX (its ticker symbol), the fear index or the fear gauge, is a measure of the implied volatility of S&P 500® Index options. It represents a measure of the market’s expectation of stock market volatility over the next 30-day period. Quoted in percentage points, the VIX represents the expected daily movement in the S&P 500® Index over the next 30-day period, which is then annualized.
The CBOE S&P 500 Buy/Write Index (BXM) is a benchmark index designed to show the hypothetical performance of a portfolio that purchases all the constituents of the S&P 500® Index and then sells at-the-money (meaning same as purchase price) call options of one-month duration against those positions.
Past performance is no guarantee of future results.
MCN | Madison Covered Call & Equity Strategy Fund | June 30, 2020
Portfolio of Investments (unaudited)
| | | Shares | | | Value (Note 2) | |
| COMMON STOCKS - 78.8% | | | | | | | | |
| | | | | | | | | |
| Communication Services - 6.1% | | | | | | | | |
| Alphabet Inc., Class C * (A) | | | 2,500 | | | $ | 3,534,025 | |
| CenturyLink Inc. (A) | | | 214,000 | | | | 2,146,420 | |
| Discovery Inc., Class C * (A) | | | 136,100 | | | | 2,621,286 | |
| | | | | | | | 8,301,731 | |
| Consumer Discretionary - 4.5% | | | | | | | | |
| Amazon.com Inc. * (A) | | | 1,000 | | | | 2,758,820 | |
| General Motors Co. (A) | | | 129,200 | | | | 3,268,760 | |
| | | | | | | | 6,027,580 | |
| Consumer Staples - 8.7% | | | | | | | | |
| Archer-Daniels-Midland Co. (A) | | | 94,000 | | | | 3,750,600 | |
| JM Smucker Co./The | | | 35,400 | | | | 3,745,674 | |
| PepsiCo Inc. (A) | | | 32,700 | | | | 4,324,902 | |
| | | | | | | | 11,821,176 | |
| Energy - 8.9% | | | | | | | | |
| Apache Corp. (A) | | | 95,300 | | | | 1,286,550 | |
| Baker Hughes Co. | | | 141,100 | | | | 2,171,529 | |
| Canadian Natural Resources Ltd. | | | 125,700 | | | | 2,190,951 | |
| EOG Resources Inc. (A) | | | 35,000 | | | | 1,773,100 | |
| Range Resources Corp. (A) | | | 717,000 | | | | 4,036,710 | |
| Transocean Ltd. * (B) | | | 345,000 | | | | 631,350 | |
| | | | | | | | 12,090,190 | |
| Financials - 9.3% | | | | | | | | |
| Bank of America Corp. (A) | | | 128,000 | | | | 3,040,000 | |
| Berkshire Hathaway Inc., Class B * (A) | | | 26,300 | | | | 4,694,813 | |
| JPMorgan Chase & Co. (A) | | | 23,000 | | | | 2,163,380 | |
| Regions Financial Corp. (A) | | | 246,200 | | | | 2,737,744 | |
| | | | | | | | 12,635,937 | |
| Health Care - 13.6% | | | | | | | | |
| Baxter International Inc. (A) | | | 43,000 | | | | 3,702,300 | |
| Becton, Dickinson and Co. (A) | | | 18,000 | | | | 4,306,860 | |
| CVS Health Corp. (A) | | | 44,800 | | | | 2,910,656 | |
| Gilead Sciences Inc. (A) | | | 52,100 | | | | 4,008,574 | |
| Zimmer Biomet Holdings Inc. (A) | | | 29,200 | | | | 3,485,312 | |
| | | | | | | | 18,413,702 | |
| Industrials - 6.5% | | | | | | | | |
| 3M Co. (A) | | | 18,000 | | | | 2,807,820 | |
| FedEx Corp. (A) | | | 18,900 | | | | 2,650,158 | |
| General Dynamics Corp. (A) | | | 22,000 | | | | 3,288,120 | |
| | | | | | | | 8,746,098 | |
| | | Shares | | | Value (Note 2) | |
| Information Technology - 6.8% | | | | | | |
| Texas Instruments Inc. (A) | | | 24,000 | | | $ | 3,047,280 | |
| Visa Inc., Class A (A) | | | 11,000 | | | | 2,124,870 | |
| Xilinx Inc. (A) | | | 41,000 | | | | 4,033,990 | |
| | | | | | | | 9,206,140 | |
| Materials - 11.9% | | | | | | | | |
| Alcoa Corp. * (A) | | | 172,500 | | | | 1,938,900 | |
| Barrick Gold Corp. (A) | | | 142,000 | | | | 3,825,480 | |
| Freeport-McMoRan Inc. (A) | | | 407,900 | | | | 4,719,403 | |
| Newmont Corp. (A) | | | 45,000 | | | | 2,778,300 | |
| Steel Dynamics Inc. (A) | | | 111,500 | | | | 2,909,035 | |
| | | | | | | | 16,171,118 | |
| Utilities - 2.5% | | | | | | | | |
| AES Corp. (A) | | | 238,000 | | | | 3,448,620 | |
| Total Common Stocks | | | | | | | | |
| (Cost $151,694,674) | | | | | | | 106,862,292 | |
| EXCHANGE TRADED FUNDS - 7.2% | | | | | | | | |
| Stock Funds - 7.2% | | | | | | | | |
| Invesco DB Gold Fund | | | 86,000 | | | | 4,574,340 | |
| VanEck Vectors Gold Miners ETF (A) | | | 142,600 | | | | 5,230,568 | |
| Total Exchange Traded Funds | | | | | | | | |
| (Cost $7,074,742) | | | | | | | 9,804,908 | |
| SHORT-TERM INVESTMENTS - 21.9% | | | | | | | | |
| State Street Institutional U.S. Government Money Market Fund, 0.12%, Premier Class (C) | | | 29,351,063 | | | | 29,351,063 | |
| State Street Navigator Securities Lending Government Money Market Portfolio, 0.13% (C) (D) | | | 307,328 | | | | 307,328 | |
| Total Short-Term Investments | | | | | | | | |
| (Cost $29,658,391) | | | | | | | 29,658,391 | |
| TOTAL PUT OPTIONS PURCHASED - 0.3% | | | | | | | | |
| (Cost $4,607,432) | | | | | | | 449,400 | |
| TOTAL INVESTMENTS - 108.2% (Cost $193,035,239**) | | | | 146,774,991 | |
| TOTAL CALL & PUT OPTIONS WRITTEN - (2.4%) | | | | | | | (3,198,416 | ) |
| NET OTHER ASSETS AND LIABILITIES - (5.8%) | | | | | | | (7,947,196 | ) |
| TOTAL NET ASSETS - 100.0% | | | | | | $ | 135,629,379 | |
See accompanying Notes to Financial Statements.
MCN | Madison Covered Call & Equity Strategy Fund | Portfolio of Investments (unaudited) - continued | June 30, 2020
| ** | Aggregate cost for Federal tax purposes was $193,035,239. |
| (A) | All or a portion of these securities’ positions, with a value of $103,353,356, represent covers (directly or through conversion rights) for outstanding options written. |
| (B) | All or a portion of these securities, with an aggregate fair value of $448,144, are on loan as part of a securities lending program. See footnote (D) and Note 4 for details on the securities lending program. |
| (D) | Represents investments of cash collateral received in connection with securities lending. |
Purchased Option Contracts Outstanding at June 30, 2020
| Description | | Exercise
Price | | | Expiration
Date | | Number of
Contracts | | | Notional
Amount | | | Fair
Value | | | Premiums
Paid | | | Unrealized
Appreciation
(Depreciation) | |
| Put Option Purchased | | | | | | | | | | | | | | | | | | | | | | | | | | |
| S&P 500 Index | | $ | 2,800.00 | | | 07/17/2020 | | | 420 | | | $ | 117,600,000 | | | $ | 449,400 | | | $ | 4,607,432 | | | $ | (4,158,032 | ) |
| Total Put Options Purchased | | | | | | | | | | | | | | | | $ | 449,400 | | | $ | 4,607,432 | | | $ | (4,158,032 | ) |
Written Option Contracts Outstanding at June 30, 2020
| Description | | Exercise
Price | | | Expiration
Date | | Number of
Contracts | | | Notional
Amount | | | Fair
Value | | | Premiums
(Received) | | | Unrealized
Appreciation
(Depreciation) | |
| Call Options Written | | | | | | | | | | | | | | | | | | | | | | | | | | |
| 3M Co. | | $ | 165.00 | | | 08/21/2020 | | | (180 | ) | | $ | (2,970,000 | ) | | $ | (68,400 | ) | | $ | (70,512 | ) | | $ | 2,112 | |
| AES Corp. | | | 15.00 | | | 08/21/2020 | | | (800 | ) | | | (1,200,000 | ) | | | (62,000 | ) | | | (35,168 | ) | | | (26,832 | ) |
| AES Corp. | | | 16.00 | | | 08/21/2020 | | | (1,580 | ) | | | (2,528,000 | ) | | | (63,200 | ) | | | (92,957 | ) | | | 29,757 | |
| Alcoa Corp. | | | 15.00 | | | 08/21/2020 | | | (978 | ) | | | (1,467,000 | ) | | | (24,450 | ) | | | (52,773 | ) | | | 28,323 | |
| Alphabet Inc. | | | 1,450.00 | | | 08/21/2020 | | | (25 | ) | | | (3,625,000 | ) | | | (129,375 | ) | | | (124,971 | ) | | | (4,404 | ) |
| Amazon.com Inc. | | | 2,800.00 | | | 08/21/2020 | | | (10 | ) | | | (2,800,000 | ) | | | (131,200 | ) | | | (102,987 | ) | | | (28,213 | ) |
| Apache Corp. | | | 20.00 | | | 07/17/2020 | | | (475 | ) | | | (950,000 | ) | | | (2,850 | ) | | | (51,950 | ) | | | 49,100 | |
| Archer-Daniels-Midland Co. | | | 40.00 | | | 09/18/2020 | | | (341 | ) | | | (1,364,000 | ) | | | (75,873 | ) | | | (42,270 | ) | | | (33,603 | ) |
| Archer-Daniels-Midland Co. | | | 45.00 | | | 09/18/2020 | | | (599 | ) | | | (2,695,500 | ) | | | (34,143 | ) | | | (77,905 | ) | | | 43,762 | |
| Bank of America Corp. | | | 25.00 | | | 07/17/2020 | | | (640 | ) | | | (1,600,000 | ) | | | (32,960 | ) | | | (41,958 | ) | | | 8,998 | |
| Bank of America Corp. | | | 26.00 | | | 07/17/2020 | | | (485 | ) | | | (1,261,000 | ) | | | (13,580 | ) | | | (38,300 | ) | | | 24,720 | |
| Barrick Gold Corp. | | | 30.00 | | | 07/17/2020 | | | (710 | ) | | | (2,130,000 | ) | | | (15,265 | ) | | | (105,895 | ) | | | 90,630 | |
| Barrick Gold Corp. | | | 28.00 | | | 08/21/2020 | | | (710 | ) | | | (1,988,000 | ) | | | (107,920 | ) | | | (92,909 | ) | | | (15,011 | ) |
| Baxter International Inc. | | | 90.00 | | | 08/21/2020 | | | (380 | ) | | | (3,420,000 | ) | | | (75,430 | ) | | | (72,184 | ) | | | (3,246 | ) |
| Becton, Dickinson and Co. | | | 260.00 | | | 07/17/2020 | | | (180 | ) | | | (4,680,000 | ) | | | (11,250 | ) | | | (57,766 | ) | | | 46,516 | |
| Berkshire Hathaway Inc. | | | 185.00 | | | 07/17/2020 | | | (185 | ) | | | (3,422,500 | ) | | | (15,817 | ) | | | (48,133 | ) | | | 32,316 | |
| Berkshire Hathaway Inc. | | | 190.00 | | | 08/21/2020 | | | (38 | ) | | | (722,000 | ) | | | (8,759 | ) | | | (10,220 | ) | | | 1,461 | |
| CenturyLink Inc. | | | 13.00 | | | 08/21/2020 | | | (1,070 | ) | | | (1,391,000 | ) | | | (5,885 | ) | | | (25,178 | ) | | | 19,293 | |
| CVS Health Corp. | | | 72.50 | | | 08/21/2020 | | | (448 | ) | | | (3,248,000 | ) | | | (25,088 | ) | | | (70,098 | ) | | | 45,010 | |
| Discovery Inc. | | | 27.50 | | | 09/18/2020 | | | (680 | ) | | | (1,870,000 | ) | | | (8,500 | ) | | | (38,533 | ) | | | 30,033 | |
| EOG Resources Inc. | | | 60.00 | | | 07/17/2020 | | | (350 | ) | | | (2,100,000 | ) | | | (6,825 | ) | | | (51,155 | ) | | | 44,330 | |
| FedEx Corp. | | | 150.00 | | | 07/17/2020 | | | (189 | ) | | | (2,835,000 | ) | | | (49,707 | ) | | | (65,007 | ) | | | 15,300 | |
| Freeport-McMoRan Inc. | | | 10.00 | | | 07/17/2020 | | | (1,400 | ) | | | (1,400,000 | ) | | | (235,900 | ) | | | (76,944 | ) | | | (158,956 | ) |
| Freeport-McMoRan Inc. | | | 12.00 | | | 08/21/2020 | | | (1,137 | ) | | | (1,364,400 | ) | | | (102,899 | ) | | | (49,983 | ) | | | (52,916 | ) |
| Freeport-McMoRan Inc. | | | 13.00 | | | 08/21/2020 | | | (1,542 | ) | | | (2,004,600 | ) | | | (84,039 | ) | | | (67,077 | ) | | | (16,962 | ) |
See accompanying Notes to Financial Statements.
MCN | Madison Covered Call & Equity Strategy Fund | Portfolio of Investments (unaudited) - concluded | June 30, 2020
| Description | | Exercise
Price | | | Expiration
Date | | Number of
Contracts | | | Notional
Amount | | | Fair
Value | | | Premiums
(Received) | | | Unrealized
Appreciation
(Depreciation) | |
| Call Options Written | | | | | | | | | | | | | | | | | | | | | | | | | | |
| General Dynamics Corp. | | $ | 150.00 | | | 07/17/2020 | | | (110 | ) | | $ | (1,650,000 | ) | | $ | (41,250 | ) | | $ | (27,385 | ) | | $ | (13,865 | ) |
| General Dynamics Corp. | | | 170.00 | | | 08/21/2020 | | | (110 | ) | | | (1,870,000 | ) | | | (13,200 | ) | | | (26,835 | ) | | | 13,635 | |
| General Motors Co. | | | 25.00 | | | 07/17/2020 | | | (647 | ) | | | (1,617,500 | ) | | | (84,757 | ) | | | (66,938 | ) | | | (17,819 | ) |
| General Motors Co. | | | 30.00 | | | 07/17/2020 | | | (645 | ) | | | (1,935,000 | ) | | | (6,127 | ) | | | (67,054 | ) | | | 60,927 | |
| Gilead Sciences Inc. | | | 80.00 | | | 08/21/2020 | | | (521 | ) | | | (4,168,000 | ) | | | (134,158 | ) | | | (119,318 | ) | | | (14,840 | ) |
| JPMorgan Chase & Co. | | | 110.00 | | | 08/21/2020 | | | (230 | ) | | | (2,530,000 | ) | | | (24,150 | ) | | | (59,031 | ) | | | 34,881 | |
| Newmont Corp. | | | 60.00 | | | 07/17/2020 | | | (250 | ) | | | (1,500,000 | ) | | | (80,625 | ) | | | (39,002 | ) | | | (41,623 | ) |
| Newmont Corp. | | | 65.00 | | | 08/21/2020 | | | (200 | ) | | | (1,300,000 | ) | | | (59,900 | ) | | | (44,591 | ) | | | (15,309 | ) |
| PepsiCo Inc. | | | 135.00 | | | 07/17/2020 | | | (257 | ) | | | (3,469,500 | ) | | | (40,863 | ) | | | (64,334 | ) | | | 23,471 | |
| Pepsico Inc. | | | 140.00 | | | 08/21/2020 | | | (70 | ) | | | (980,000 | ) | | | (10,010 | ) | | | (19,124 | ) | | | 9,114 | |
| Range Resources Corp. | | | 10.00 | | | 09/18/2020 | | | (3,600 | ) | | | (3,600,000 | ) | | | (54,000 | ) | | | (193,068 | ) | | | 139,068 | |
| Regions Financial Corp. | | | 12.00 | | | 08/21/2020 | | | (1,231 | ) | | | (1,477,200 | ) | | | (73,860 | ) | | | (50,250 | ) | | | (23,610 | ) |
| Regions Financial Corp. | | | 14.00 | | | 08/21/2020 | | | (1,231 | ) | | | (1,723,400 | ) | | | (29,544 | ) | | | (58,534 | ) | | | 28,990 | |
| Steel Dynamics Inc. | | | 28.00 | | | 08/21/2020 | | | (375 | ) | | | (1,050,000 | ) | | | (47,813 | ) | | | (52,109 | ) | | | 4,296 | |
| Steel Dynamics Inc. | | | 29.00 | | | 08/21/2020 | | | (375 | ) | | | (1,087,500 | ) | | | (34,687 | ) | | | (49,484 | ) | | | 14,797 | |
| Steel Dynamics Inc. | | | 30.00 | | | 08/21/2020 | | | (365 | ) | | | (1,095,000 | ) | | | (24,637 | ) | | | (41,595 | ) | | | 16,958 | |
| Texas Instruments Inc. | | | 120.00 | | | 07/17/2020 | | | (240 | ) | | | (2,880,000 | ) | | | (200,400 | ) | | | (39,350 | ) | | | (161,050 | ) |
| VanEck Vectors Gold Miners ETF | | | 35.00 | | | 08/21/2020 | | | (713 | ) | | | (2,495,500 | ) | | | (224,595 | ) | | | (121,486 | ) | | | (103,109 | ) |
| VanEck Vectors Gold Miners ETF | | | 37.00 | | | 08/21/2020 | | | (713 | ) | | | (2,638,100 | ) | | | (153,295 | ) | | | (126,356 | ) | | | (26,939 | ) |
| Visa Inc. | | | 195.00 | | | 08/21/2020 | | | (110 | ) | | | (2,145,000 | ) | | | (86,350 | ) | | | (82,084 | ) | | | (4,266 | ) |
| Xilinx Inc. | | | 100.00 | | | 07/17/2020 | | | (410 | ) | | | (4,100,000 | ) | | | (101,270 | ) | | | (63,725 | ) | | | (37,545 | ) |
| Zimmer Biomet Holdings Inc. | | | 140.00 | | | 07/17/2020 | | | (148 | ) | | | (2,072,000 | ) | | | (3,330 | ) | | | (49,331 | ) | | | 46,001 | |
| Zimmer Biomet Holdings Inc. | | | 140.00 | | | 08/21/2020 | | | (144 | ) | | | (2,016,000 | ) | | | (26,280 | ) | | | (39,995 | ) | | | 13,715 | |
| Total Call Options Written | | | | | | | | | | | | | | | $ | (2,946,416 | ) | | $ | (3,063,812 | ) | | $ | 117,396 | |
| Put Options Written | | | | | | | | | | | | | | | | | | | | | |
| S&P 500 Index | | $ | 2,700.00 | | | 07/17/2020 | | | (420 | ) | | $ | (113,400,000 | ) | | $ | (252,000 | ) | | $ | (3,593,268 | ) | | $ | 3,341,268 | |
| Total Options Written, at Value | | | | | | | | | | | | | | | $ | (3,198,416 | ) | | $ | (6,657,080 | ) | | $ | 3,458,664 | |
See accompanying Notes to Financial Statements.
MCN | Madison Covered Call & Equity Strategy Fund | June 30, 2020
Statement of Assets and Liabilities as of June 30, 2020 (unaudited)
| Assets: | | | |
| Investments in unaffiliated securities, at fair value†§ | | $ | 146,774,991 | |
| Receivables: | | | | |
| Dividends and interest | | | 129,312 | |
| Total assets | | | 146,904,303 | |
| Liabilities: | | | | |
| Payables: | | | | |
| Investments purchased | | | 7,580,310 | |
| Upon return of securities loaned | | | 307,328 | |
| Advisory agreement fees | | | 89,886 | |
| Administrative services agreement fees | | | 29,213 | |
| Dividends | | | 69,771 | |
| Options written, at value (premium received $6,657,080) (Note 7) | | | 3,198,416 | |
| Total liabilities | | | 11,274,924 | |
| Net assets | | $ | 135,629,379 | |
| Net assets consist of: | | | | |
| Common Stock/Shares: | | | | |
| Paid-in capital in excess of par | | | 180,248,722 | |
| Accumulated distributable earnings (loss) | | | (44,619,343 | ) |
| Net Assets | | $ | 135,629,379 | |
| | | | | |
| Capital Shares Issued and Outstanding (Note 6) | | | 20,946,924 | |
| Net Asset Value per share | | | 6.47 | |
| | | | | |
| †Cost of Investments in unaffiliated securities | | $ | 193,035,239 | |
| §Fair Value of securities on loan | | $ | 448,144 | |
See accompanying Notes to Financial Statements.
MCN | Madison Covered Call & Equity Strategy Fund | June 30, 2020
Statement of Operations For the Period Ended June 30, 2020 (unaudited)
| Investment Income: | | | |
| Interest | | $ | 103,363 | |
| Dividends | | | | |
| Unaffiliated issuers | | | 1,222,590 | |
| Less: Foreign taxes withheld/reclaimed | | | (14,437 | ) |
| Income from securities lending | | | 4,891 | |
| Total investment income | | | 1,316,407 | |
| Expenses (Note 3): | | | | |
| Advisory agreement fees | | | 546,875 | |
| Administrative Services agreement fees | | | 177,734 | |
| Total expenses | | | 724,609 | |
| Net Investment Income | | | 591,798 | |
| Net Realized and Unrealized Gain (Loss) on Investments | | | | |
| Net realized gain (loss) on investments (including net realized gain (loss) on foreign currency related transactions) | | | | |
| Options purchased | | | 17,255,788 | |
| Options written | | | (14,020,327 | ) |
| Unaffiliated issuers | | | 2,007,095 | |
| Net change in unrealized appreciation (depreciation) on investments (including net unrealized appreciation (depreciation) on foreign currency related transactions) | | | | |
| Options purchased | | | (2,215,257 | ) |
| Options written | | | 3,654,329 | |
| Unaffiliated issuers | | | (18,065,977 | ) |
| Net Realized and Unrealized Loss on Investments | | | (11,384,349 | ) |
| Net Decrease in Net Assets from Operations | | $ | (10,792,551 | ) |
See accompanying Notes to Financial Statements.
MCN | Madison Covered Call & Equity Strategy Fund | June 30, 2020
Statements of Changes in Net Assets
| | | (unaudited)
Six-Months
Ended 6/30/20 | | | Year
Ended
12/31/19 | |
| Net Assets at beginning of period | | $ | 153,962,823 | | | $ | 144,686,325 | |
| Increase (decrease) in net assets from operations: | | | | | | | | |
| Net investment income | | | 591,798 | | | | 1,736,475 | |
| Net realized gain | | | 5,242,556 | | | | 8,937,716 | |
| Net change in unrealized appreciation (depreciation) | | | (16,626,905 | ) | | | 13,684,092 | |
| Net increase (decrease) in net assets from operations | | | (10,792,551 | ) | | | 24,358,283 | |
| Distributions to shareholders from: | | | | | | | | |
| Return of capital | | | – | | | | (5,261,554 | ) |
| Accumulated earnings (combined net investment income and net realized gains) | | | (7,540,893 | ) | | | (9,820,231 | ) |
| Total distributions | | | (7,540,893 | ) | | | (15,081,785 | ) |
| Total increase (decrease) in net assets | | | (18,333,444 | ) | | | 9,276,498 | |
| Net Assets at end of period | | $ | 135,629,379 | | | $ | 153,962,823 | |
See accompanying Notes to Financial Statements.
MCN | Madison Covered Call & Equity Strategy Fund | June 30, 2020
Financial Highlights for a Share of
Beneficial Interest Outstanding
| | | (unaudited) | | | | | | | | | | | | | | | | |
| | | Six-Months | | | | | | | | | | | | | | | | |
| | | Ended | | | Year Ended December 31, | |
| | | 6/30/20 | | | 2019 | | | 2018 | | | 2017 | | | 2016 | | | 2015 | |
| Net Asset Value at beginning of period | | $ | 7.35 | | | $ | 6.91 | | | $ | 8.27 | | | $ | 8.41 | | | $ | 8.48 | | | $ | 9.28 | |
| Income from Investment Operations: | | | | | | | | | | | | | | | | | | | | | | | | |
| Net investment income | | | 0.03 | | | | 0.08 | | | | 0.10 | | | | 0.09 | | | | 0.03 | 1 | | | 0.04 | 1 |
| Net realized and unrealized gain (loss) on investments | | | (0.55 | ) | | | 1.08 | | | | (0.74 | ) | | | 0.49 | | | | 0.62 | | | | (0.12 | ) |
| Total from investment operations | | | (0.52 | ) | | | 1.16 | | | | (0.64 | ) | | | 0.58 | | | | 0.65 | | | | (0.08 | ) |
| Less Distributions From: | | | | | | | | | | | | | | | | | | | | | | | | |
| Net investment income | | | (0.36 | ) | | | (0.47 | ) | | | (0.51 | ) | | | (0.55 | ) | | | (0.46 | ) | | | (0.70 | ) |
| Return of capital | | | – | | | | (0.25 | ) | | | (0.21 | ) | | | (0.17 | ) | | | (0.26 | ) | | | (0.02 | ) |
| Total distributions | | | (0.36 | ) | | | (0.72 | ) | | | (0.72 | ) | | | (0.72 | ) | | | (0.72 | ) | | | (0.72 | ) |
| Net increase (decrease) in net asset value | | | (0.88 | ) | | | 0.44 | | | | (1.36 | ) | | | (0.14 | ) | | | (0.07 | ) | | | (0.80 | ) |
| Net Asset Value at end of period | | $ | 6.47 | | | $ | 7.35 | | | $ | 6.91 | | | $ | 8.27 | | | $ | 8.41 | | | $ | 8.48 | |
| Market Value at end of period | | $ | 5.64 | | | $ | 6.63 | | | $ | 6.16 | | | $ | 7.72 | | | $ | 7.70 | | | $ | 7.38 | |
| Total Return | | | | | | | | | | | | | | | | | | | | | | | | |
| Net asset value (%) | | | (6.66 | )2 | | | 17.39 | | | | (8.37 | ) | | | 7.14 | | | | 7.92 | | | | (0.91 | ) |
| Market value (%)3 | | | (9.09 | )2 | | | 19.83 | | | | (11.79 | ) | | | 9.77 | | | | 14.51 | | | | (0.48 | ) |
| Ratios/Supplemental Data: | | | | | | | | | | | | | | | | | | | | | | | | |
| Net Assets at end of period (in 000’s) | | $ | 135,629 | | | $ | 153,963 | | | $ | 144,686 | | | $ | 159,377 | | | $ | 162,087 | | | $ | 163,366 | |
| Ratios of expenses to average net assets(%) | | | 1.06 | 5 | | | 1.07 | 4 | | | 1.17 | 4 | | | 1.13 | 4 | | | 1.06 | | | | 1.06 | |
| Ratio of net investment income (loss) to average net assets (%) | | | 0.87 | 5 | | | 1.15 | | | | 0.75 | | | | 1.13 | | | | 0.38 | | | | 0.41 | |
| Portfolio turnover (%) | | | 54 | 2 | | | 114 | | | | 114 | | | | 152 | | | | 134 | | | | 125 | |
1Based on average shares outstanding during the period.
2Not annualized.
3Total investment return is calculated assuming a purchase of a share of common stock at the market price on the first day and a sale of a share of common stock at the market price on the last day of each period reported. Dividends and distributions, if any, are assumed, for purposes of this calculation, to be reinvested at prices obtained under the Fund’s dividend reinvestment plan. Total investment return does not reflect brokerage commissions or sales charges in connection with the purchase or sale of Fund stock.
4Includes Board approved expenses related to special and annual meetings that took place during the period. See Note 3.
5Annualized.
See accompanying Notes to Financial Statements.
MCN | Madison Covered Call & Equity Strategy Fund | June 30, 2020
Notes to Financial Statements (unaudited)
1. ORGANIZATION
Madison Covered Call & Equity Strategy Fund (the “Fund”) was organized as a Delaware statutory trust on May 6, 2004. The Fund is registered as a diversified, closed-end management investment company under the Investment Company Act of 1940 (“1940 Act”), as amended, and the Securities Act of 1933, as amended.
The Fund’s primary investment objective is to provide a high level of current income and current gains, with a secondary objective of long-term capital appreciation. The Fund will pursue its investment objectives by investing primarily in large and mid-capitalization common stocks that are, in the view of Madison Asset Management, LLC, the Fund’s investment adviser (the “Adviser”), selling at a reasonable price in relation to their long-term earnings growth rates. Under normal market conditions, the Fund will seek to generate current earnings from option premiums by writing (selling) covered call options on a substantial portion of its portfolio securities. There can be no assurance that the Fund will achieve its investment objectives. The Fund’s investment objectives are considered fundamental and may not be changed without shareholder approval.
2. SIGNIFICANT ACCOUNTING POLICIES
The Fund is an investment company that applies the accounting and reporting guidance in the Financial Accounting Standards Board (FASB) Accounting Standards Codification Topic 946, Financial Services - Investment Companies (ASC 946). The following is a summary of significant accounting policies consistently followed by the Fund in the preparation of its financial statements.
Use of Estimates: The preparation of financial statements in conformity with accounting principles generally accepted in the United States of America requires management to make estimates and assumptions. Such estimates affect the reported amounts of assets and liabilities and reported amounts of increases and decreases in net assets from operations during the reporting period. Actual results could differ from those estimates.
Portfolio Valuation: Securities traded on a national securities exchange are valued at their closing sale price,
except for securities traded on the National Association of Securities Dealers Automated Quotation System (“NASDAQ”), which are valued at the NASDAQ official closing price (“NOCP”). If no sale occurs, equities traded on a U.S. exchange or on NASDAQ are valued at the bid price. Options are valued at the mean between the best bid and best ask price across all option exchanges. Debt securities having maturities of 60 days or less are valued at amortized cost, which approximates market value. Debt securities having longer maturities are valued on the basis of the last available bid prices or current market quotations provided by dealers or pricing services approved by the Fund. Mutual funds are valued at their net asset value (“NAV”). Securities for which market quotations are not readily available are valued at their fair value as determined in good faith under procedures approved by the Board of Trustees.
At times, the Fund maintains cash balances at financial institutions in excess of federally insured limits. The Fund monitors this credit risk and has not experienced any losses related to this risk.
Fair Value Measurements: The Fund has adopted FASB applicable guidance on fair value measurements. Fair value is defined as the price that each fund would receive upon selling an investment in a timely transaction to an independent buyer in the principal or most advantageous market of the investment. A three-tier hierarchy is used to maximize the use of observable market data “inputs” and minimize the use of unobservable “inputs” and to establish classification of fair value measurements for disclosure purposes. Inputs refer broadly to the assumptions that market participants would use in pricing the asset or liability, including assumptions about risk (for example, the risk inherent in a particular valuation technique used to measure fair value including such a pricing model and/or the risk inherent in the inputs to the valuation technique). Inputs may be observable or unobservable.
Observable inputs are inputs that reflect the assumptions market participants would use in pricing the asset or liability developed based on market data obtained from sources independent of the reporting entity. Unobservable inputs are inputs that reflect the reporting entity’s own
MCN | Madison Covered Call & Equity Strategy Fund | NOTES TO FINANCIAL STATEMENTS - continued | June 30, 2020
assumptions about the assumptions market participants would use in pricing the asset or liability developed based on the best information available under the circumstances. The three-tier hierarchy of inputs is summarized in the three broad Levels listed below:
Level 1 - unadjusted quoted prices in active markets for identical investments
Level 2 - other significant observable inputs (including quoted prices for similar investments, interest rate volatilities, prepayment speeds, credit risk, benchmark yields, transactions, bids, offers, new issues, spreads and other relationships observed in the markets among comparable securities, underlying equity of the issuer; and proprietary pricing models such as yield measures calculated using factors such as cash flows, financial or collateral performance and other reference data, etc.)
Level 3 - significant unobservable inputs (including the Fund’s own assumptions in determining the fair value of investments)
The valuation techniques used by the Fund to measure fair value for the period ended June 30, 2020, maximized the use of observable inputs and minimized the use of unobservable inputs.
There were no transfers between classifications levels during the period ended June 30, 2020. As of and during the period ended June 30, 2020, the Fund did not hold securities deemed as a Level 3.
The following is a summary of the inputs used as of June 30, 2020, in valuing the Fund’s investments carried at fair value:
| Description | | Quoted Prices in
Active Markets for
Identical Investments
(Level 1) | | | Significant Other
Observable
Inputs
(Level 2) | | | Significant
Unobservable
Inputs
(Level 3) | | | Value at
6/30/20 | |
| Assets:1 | | | | | | | | | | | | |
| Common Stocks | | $ | 106,862,292 | | | $ | – | | | $ | – | | | $ | 106,862,292 | |
| Exchange Traded Funds | | | 9,804,908 | | | | – | | | | – | | | | 9,804,908 | |
| Short-Term Investments | | | 29,658,391 | | | | | | | | | | | | 29,658,391 | |
| Put Options Purchased | | | 449,400 | | | | – | | | | – | | | | 449,400 | |
| | | $ | 146,774,991 | | | $ | – | | | $ | – | | | $ | 146,774,991 | |
| Liabilities:1 | | | | | | | | | | | | | | | | |
| Options Written | | $ | (3,198,416 | ) | | $ | – | | | $ | – | | | $ | (3,198,416 | ) |
1Please see the Portfolio of Investments for a listing of all securities within each category.
Derivatives: The FASB issued guidance intended to enhance financial statement disclosure for derivative instruments and enable investors to understand: a) how and why a fund uses derivative investments, b) how derivative instruments are accounted for, and c) how
derivative instruments affect a fund’s financial position, and results of operations.
The following table presents the types of derivatives in the fund by location and as presented on the Statement of Assets and Liabilities as of June 30, 2020.
| | | Statements of Asset & Liability Presentation of Fair Values of Derivative Instruments | | | |
| | | Asset Derivatives | | | Liability Derivatives | |
| Underlying Risk | | Statement of Assets and Liabilities Location | | | Fair Value | | | Statement of Assets and Liabilities Location | | | Fair Value | |
| Equity | | Options purchased* | | | $ 449,400 | | | Options written | | | $ (3,198,416) | |
*Included in Investments in unaffiliated securities on Statement of Assets & Liabilities.
The following table presents the effect of derivative instruments on the Statement of Operations for the period ended June 30, 2020.
MCN | Madison Covered Call & Equity Strategy Fund | NOTES TO FINANCIAL STATEMENTS - continued | June 30, 2020
| Statement of Operations | | Underlying Risk | | Realized Gain
(Loss) on Derivatives: | | | Change in Unrealized Appreciation
(Depreciation) on Derivatives | |
| Options Purchased | | Equity | | $ | 17,255,788 | | | $ | (2,215,257 | ) |
| Options Written | | Equity | | | (14,020,327 | ) | | | 3,654,329 | |
| Total | | | | $ | 3,235,461 | | | $ | 1,439,072 | |
The average volume (based on the open positions at each month-end) of derivative activity during the period ended June 30, 2020.
| | | Options Purchased
Contracts(1) | | | Options Written Contracts(1) | |
| Madison Covered Call & | | | | | | |
| Equity Strategy Fund | | | 178 | | | | 7,946 | |
(1) Number of Contracts
Recently Issued Accounting Pronouncements. There is no impact on the financial statements of the other funds as they did not hold derivative investments during the period ended June 30, 2020.
Investment Transactions and Investment Income: Investment transactions are recorded on a trade date basis. The cost of investments sold is determined on the identified cost basis for financial statement and federal income tax purposes. Dividend income is recorded on the ex-dividend date and interest income is recorded on an accrual basis.
Distributions to Shareholders: The Fund declares and pays quarterly distributions to shareholders. Distributions to shareholders are recorded on the ex-dividend date. The amount and timing of distributions are determined in accordance with federal income tax regulations, which may differ from Generally Accepted Accounting Principles (“GAAP”). These distributions consist of investment company taxable income, which generally includes qualified dividend income, ordinary income and short-term capital gains, including premiums received on written options. Distributions may also include a return of capital. Any net realized long-term capital gains are distributed annually to shareholders. The character of the distributions are determined annually in accordance with federal income tax regulations.
In March 2020, the FASB issued ASU 2020-04, which provides optional expedients and exceptions for contracts, hedging relationships and other transactions affected by reference rate reform if certain criteria are met. The adoption of the ASU is elective. At this time, management
is evaluating the implications of these changes on the financial statements.
3. ADVISORY, ADMINISTRATIVE SERVICES AND OTHER EXPENSES
Pursuant to an Investment Advisory Agreement with the Fund, the Adviser, under the supervision of the Fund’s Board of Trustees, provides a continuous investment program for the Fund’s portfolio; provides investment research and makes and executes recommendations for the purchase and sale of securities; and provides certain facilities and personnel, including officers required for the Fund’s administrative management and compensation of all officers and interested trustees of the Fund. For these services, the Fund pays the Adviser a fee, payable monthly, in an amount equal to an annualized rate of 0.80% of the Fund’s average daily net assets.
Under a separate Administrative Services Agreement, the Adviser also provides or arranges to have a third party provide the Fund with such services as it may require in the ordinary course of its business. Services to the Fund include: compliance services, custodial services, Fund administration services, Fund accounting services, and such other services necessary to conduct the Fund’s business. In addition, the Adviser shall arrange and pay for independent public accounting services for audit and tax purposes, legal services, the services of independent Trustees of the Fund, a fidelity bond, and directors and officers/errors and omissions insurance. In exchange for these services, the Fund pays the Adviser a service fee, payable monthly, equal to an annualized rate of 0.26% of the Fund’s average daily net assets. Not included in this fee and, therefore, the responsibility of the Fund are “excluded expenses” and “transitional expenses.” Excluded expenses consist of (i) any fees and expenses relating to portfolio holdings (e.g., brokerage commissions, interest on loans, etc.); (ii) extraordinary and non-recurring fees and expenses (e.g., costs relating to any borrowing costs, overdrafts or taxes the Fund may owe, etc.); and (iii) the costs associated with
MCN | Madison Covered Call & Equity Strategy Fund | NOTES TO FINANCIAL STATEMENTS - continued | June 30, 2020
investment by the Trust in other investment companies (i.e., acquired fund fees and expenses). Through period ended June 30, 2020 the Fund has not paid any extraordinary expenses the first half of the year.
Certain officers and Trustees of the Fund may also be officers, directors and/or employees of the Adviser or its affiliates. The Fund does not compensate its officers or Trustees who are officers, directors and/or employees of the Adviser or its affiliates. The fees for the independent Trustees are paid out of the Services Agreement fee and totaled $18,000 for the period ended June 30, 2020, which is included in the “Administrative services agreement fees” on the Statement of Operations.
4. SECURITIES LENDING
The Board of Trustees has authorized the Fund to engage in securities lending with State Street Bank and Trust Company as securities lending agent pursuant to a Securities Lending Authorization Agreement (the “Agreement”) and subject to the Fund’s securities lending policies and procedures. Under the terms of the Agreement, and subject to the policies and procedures, the Fund may lend portfolio securities to qualified borrowers in order to generate additional income, while managing risk associated with the securities lending program. The Agreement requires that loans are collateralized at all times by cash or U.S. government securities, initially equal to at least 102% of the value of the domestic securities and 105% of non-domestic securities, based upon the prior days market value for securities loaned. The loaned securities and collateral are marked to market daily to maintain collateral at 102% of the total loaned portfolio. Amounts earned as interest on investments of cash collateral, net of rebates and fees, if any, are included in the Statement of Operations. The primary risk associated with securities lending is loss associated with investment of cash and non-cash collateral. A secondary risk is if the borrower defaults on its obligation to return the securities loaned because of insolvency or other reasons. The Fund could experience delays and costs in recovering securities loaned or in gaining access to the collateral. Under the Agreement, the securities lending agent has provided a limited indemnification in the event of a borrower default. The Fund does not have a master netting agreement.
Cash collateral received for securities on loan are reinvested into the State Street Navigator Securities Lending Government Money Market Portfolio. Non-cash collateral is invested in U.S. treasuries or government securities. See below for fair value on loan and collateral breakout for fund and portfolio of investments for individual securities identified on loan.
| | | Fair Value | | | Cash
Collateral* | | | Non-Cash
Collateral* | |
| Covered Call & | | | | | | | | | | | | |
| Equity Strategy | | $ | 448,144 | | | $ | 307,328 | | | $ | 171,268 | |
*Represents minimum 102% of the value of domestic securities and 105% of non-domestic securities on loan, based upon the prior days market value for securities loaned.
5. FEDERAL INCOME TAX INFORMATION
No provision is made for federal income taxes since it is the intention of the Fund to comply with the provisions of Subchapter M of the Internal Revenue Code of 1986 as amended, applicable to regulated investment companies and to make the requisite distribution to shareholders of taxable income, which will be sufficient to relieve it from all or substantially all federal income taxes.
At June 30, 2020, the aggregate gross unrealized appreciation (depreciation) and net unrealized depreciation for all securities, as computed on a federal income tax basis for the fund were as follows:
| Cost | | $ | 193,035,239 | |
| Gross appreciation | | | 8,776,847 | |
| Gross depreciation | | | (51,578,431 | ) |
| Net depreciation | | $ | (42,801,584 | ) |
Net realized gains or losses may differ for financial reporting and tax purposes primarily as a result of the deferral of losses relating to wash sale transactions.
6. INVESTMENT TRANSACTIONS
During the period ended June 30, 2020, the cost of purchases and proceeds from sales of investments, excluding short-term investments, were $65,634,616 and $75,464,112 respectively. No long-term U.S. government securities were purchased or sold during the period.
7. COVERED CALL AND PUT OPTIONS
An option on a security is a contract that gives the holder of the option, in return for a premium, the right to buy from (in
MCN | Madison Covered Call & Equity Strategy Fund | NOTES TO FINANCIAL STATEMENTS - continued | June 30, 2020
the case of a call) or sell to (in the case of a put) the writer of the option the security underlying the option at a specified exercise or “strike” price. The writer of an option on a security has an obligation upon exercise of the option to deliver the underlying security upon payment of the exercise price (in the case of a call) or pay the exercise price upon delivery of the underlying security (in the case of a put).
The number of call options the Fund can write (sell) is limited by the amount of equity securities the Fund holds in its portfolio. The Fund will not write (sell) “naked” or uncovered call options. The Fund seeks to produce a high level of current income and gains generated from option writing premiums and, to a lesser extent, from dividends.
When an option is written, a liability is recorded equal to the premium received. This liability for options written is marked-to-market on a daily basis to reflect the current market value of the option written. These liabilities are reflected as options written in the Statement of Assets and Liabilities. Premiums received from writing options that expire unexercised are recorded on the expiration date as a realized gain. The difference between the premium received and the amount paid on effecting a closing purchase transaction, including brokerage commissions, is also treated as a realized gain, or if the premium is less than the amount paid for the closing purchase transactions, as a realized loss. If a call option is exercised, the premium is added to the proceeds from the sale of the underlying security in determining whether there has been a realized gain or loss.
8. CAPITAL
The Fund has an unlimited amount of common shares, $0.01 par value, authorized and 20,946,924 shares issued and outstanding as of June 30, 2020. Additionally, no capital stock activity occurred for the period ended June 30, 2020 and for the year ended December 2019, respectively.
In connection with the Fund’s dividend reinvestment plan, there were no shares reinvested for the period ended June 30, 2020 and for the year ended December 2019, respectively.
9. INDEMNIFICATIONS
In the normal course of business, the Fund enters into contracts that provide general indemnifications. The Fund’s maximum exposure under these arrangements is dependent upon claims that may be made against the Fund in the future and therefore cannot be estimated; however, the Fund considers the risk of material loss from such claims as remote.
10. DISCUSSION OF RISKS
Equity Risk: The value of the securities held by the Fund may decline due to general market and economic conditions, perceptions regarding the industries in which the issuers of securities held by the Fund participate, or factors relating to specific companies in which the Fund invests.
Option Risk: There are several risks associated with transactions in options on securities. For example, there are significant differences between the securities and options markets that could result in an imperfect correlation between these markets, causing a given transaction not to achieve its objectives. A decision as to whether, when and how to use options involves the exercise of skill and judgment, and even a well-conceived transaction may be unsuccessful to some degree because of market behavior or unexpected events.
As the writer of a covered call option, the Fund forgoes, during the option’s life, the opportunity to profit from increases in the market value of the security covering the call option above the sum of the premium and the strike price of the call, but retains the risk of loss should the price of the underlying security decline. The writer of an option has no control over the time when it may be required to fulfill its obligation as a writer of the option. Once an option writer has received an exercise notice, it cannot effect a closing purchase transaction in order to terminate its obligation under the option and must deliver the underlying security at the exercise price.
When the Fund writes covered put options, it bears the risk of loss if the value of the underlying stock declines below the exercise price. If the option is exercised, the Fund could incur a loss if it is required to purchase the stock underlying the put option at a price greater than the market price of
MCN | Madison Covered Call & Equity Strategy Fund | NOTES TO FINANCIAL STATEMENTS - continued | June 30, 2020
the stock at the time of exercise. While the Fund’s potential gain in writing a covered put option is limited to the interest earned on the liquid assets securing the put option plus the premium received from the purchaser of the put option, the Fund risks a loss equal to the entire value of the stock.
Derivatives Risk: The risk that loss may result from investments in options, forwards, futures, swaps and other derivatives instruments. These instruments may be illiquid, difficult to price and leveraged so that small changes in the value of the underlying instruments may produce disproportionate losses to the fund. Derivatives are also subject to counterparty risk, which is the risk that the other party to the transaction will not fulfill its contractual obligations.
Industry Concentration Risk: To the extent that the Fund makes substantial investments in a single industry, the Fund will be more susceptible to adverse economic or regulatory occurrences affecting those sectors.
Fund Distribution Risk: In order to make regular quarterly distributions on its common shares, the Fund may have to sell a portion of its investment portfolio at a time when independent investment judgment may not dictate such action. In addition, the Fund’s ability to make distributions more frequently than annually from any net realized capital gains by the Fund is subject to the Fund obtaining exemptive relief from the SEC, which cannot be assured. To the extent the total quarterly distributions for a year exceed the Fund’s net investment company income and net realized capital gain for that year, the excess will generally constitute a return of the Fund’s capital to its common shareholders. Such return of capital distributions generally are tax-free up to the amount of a common shareholder’s tax basis in the common shares (generally, the amount paid for the common shares). In addition, such excess distributions will decrease the Fund’s total assets and may increase the Fund’s expense ratio.
Cybersecurity Risk: The Fund is also subject to cybersecurity risk, which includes the risks associated with computer systems, networks and devices to carry out routine business operations. These systems, networks and devices employ a variety of protections that are designed to prevent
cyberattacks. Despite the various cyber protections utilized by the Fund, the Adviser, and other service providers, their systems, networks, or devices could potentially be breached. The Fund, its shareholders, and the Adviser could be negatively impacted as a result of a cybersecurity breach. The Fund cannot control the cybersecurity plans and systems put in place by service providers or any other third parties whose operations may affect the Fund.
Recent Market Developments Risk: Global and domestic financial markets periodically experience episodes of turmoil. Recently, markets have witnessed mostly growing economic activity in developed countries as expectations for continued economic growth have persisted. However, risks to continued economic growth remain. Long-term effects of the UK withdrawal from the European Union, along with ongoing challenges among weaker EU countries, are among risks to growth and currency market stability. The U.S. Federal Reserve continues to pursue a policy of monetary normalization after many years of highly accommodative monetary conditions in the wake of the financial crisis. Any unforeseen departure from expected economic growth or inflation could result in a meaningful change in Fed policy, possibly destabilizing financial markets. Domestic political and global geopolitical risks remain a flashpoint that could ignite market turmoil. Likewise, the ongoing trade war between the U.S. and China has contributed to market volatility. Fears of terror-related attacks in developed markets, and concerns over geopolitical conflict, especially in Southeast Asia, could contribute to increased market volatility and may have long-term effects on the United States and worldwide financial markets and cause further economic uncertainties or deterioration in the United States and worldwide. The Adviser does not know how long the financial markets will continue to be affected by these events and cannot predict the effects of these or similar events in the future on the United States and global economies and securities markets.
Foreign Investment Risk: Investing in non-U.S. issuers may involve unique risks such as currency, political, and economic risks, as well as lower market liquidity, generally greater market volatility and less complete financial information than for U.S. issuers.
MCN | Madison Covered Call & Equity Strategy Fund | NOTES TO FINANCIAL STATEMENTS - concluded | June 30, 2020
Mid-Cap Company Risk: Mid-Cap companies often are newer or less established companies than larger companies. Investments in mid-cap companies carry additional risks because earnings of these companies tend to be less predictable; they often have limited product lines, markets, distribution channels or financial resources; and the management of such companies may be dependent upon one or a few key people. The market movements of equity securities of mid-cap companies may be more abrupt or erratic than the market movements of equity securities of larger, more established companies or the stock market in general.
Financial Leverage Risk: The Fund is authorized to utilize leverage through the issuance of preferred shares and/ or the Fund may borrow or issue debt securities for financial leveraging purposes and for temporary purposes such as settlement of transactions. Although the use of any financial leverage by the Fund may create an opportunity for increased net income, gains and capital appreciation for common shares, it also results in additional risks and can magnify the effect of any losses. If the income and gains earned on securities purchased with financial leverage proceeds are greater than the cost of financial leverage, the Fund’s return will be greater than if financial leverage had not been used. Conversely, if the income or gain from the securities purchased with such proceeds does not cover the cost of financial leverage, the return to the Fund will be less than if financial leverage had not been used. Financial leverage also increases the likelihood of greater volatility of the NAV and market price of, and dividends on,
the common shares than a comparable portfolio without leverage.
Additional Risks: While investments in securities have been keystones in wealth building and management, at times these investments have produced surprises. Those who enjoyed growth and income of their investments generally were rewarded for the risks they took by investing in the markets. Although the Adviser seeks to appropriately address and manage the risks identified and disclosed to you in connection with the management of the securities in the Fund, you should understand that the very nature of the securities markets includes the possibility that there may be additional risks of which we are not aware. We certainly seek to identify all applicable risks and then appropriately address them, take appropriate action to reasonably manage them and to make you aware of them so you can determine if they exceed your risk tolerance. Nevertheless, the often volatile nature of the securities markets and the global economy in which we work suggests that the risk of the unknown is something to consider in connection with an investment in securities. Unforeseen events could under certain circumstances produce a material loss of the value of some or all of the securities we manage for you in the Fund.
11. SUBSEQUENT EVENTS
Management has evaluated all subsequent events through the date the financial statements were available for issue. No events have taken place that meet the definition of a subsequent event that requires adjustment to, or disclosure in, the financial statements.
MCN | Madison Covered Call & Equity Strategy Fund | June 30, 2020
Other Information (unaudited)
ADDITIONAL INFORMATION
Notice is hereby given in accordance with Section 23(c) of the 1940 Act that from time to time, the Fund may purchase shares of its common stock in the open market at prevailing market prices.
This report is sent to shareholders of the Fund for their information. It is not a prospectus, circular or representation intended for use in the purchase or sale of shares of the Fund or any securities mentioned in this report.
AVAILABILITY OF QUARTERLY PORTFOLIO SCHEDULES
The fund file its complete schedule of portfolio holdings with the SEC for the first and third quarters of each fiscal year on Form NPORT-EX. Form NPORT-EX is available to shareholders at no cost by calling 1-800-877-6089 or on the SEC’s website at www.sec.gov. Form NPORT-EX may also be reviewed and copied at the SEC’s Public Reference Room in Washington, DC. More information on the operation of the Public Reference Room may be obtained by calling 1-800-SEC-0330.
PROXY VOTING POLICIES, PROCEDURES AND RECORDS
A description of the policies and procedures used by the funds to vote proxies related to portfolio securities is
available to shareholders at no cost on the funds’ website at www.madisonfunds.com or by calling 1-800-877-6089 or on the SEC’s website at www.sec.gov. The proxy voting records for the Funds for the most recent twelvemonth period ended June 30 are available to shareholders at no cost 1-800-SEC-0330 on the SEC’s website at www.sec.gov.
FORWARD-LOOKING STATEMENT DISCLOSURE
One of our most important responsibilities as investment company managers is to communicate with shareholders in an open and direct manner. Some of our comments in the “Management’s Discussion of Fund Performance” are based on current management expectations and are considered “forward-looking statements.” Actual future results, however, may prove to be different from our expectations. You can identify forward-looking statements by words such as estimate, may, will, expect, believe, plan and other similar terms. We cannot promise future returns. Our opinions are a reflection of our best judgment at the time this report is compiled, and we disclaim any obligation to update or alter forward-looking statements as a result of new information, future events, or otherwise.
MCN | Madison Covered Call & Equity Strategy Fund | June 30, 2020
Dividend Reinvestment Plan (unaudited)
Unless the registered owner of common shares elects to receive cash by contacting Computershare Trust Company, Inc. (the “Plan Administrator”), all distributions declared on common shares of the Fund will be automatically reinvested by the Plan Administrator in the Fund’s Dividend Reinvestment Plan (the “Plan”) in additional common shares of the Fund. Participation in the Plan is completely voluntary and may be terminated or resumed at any time without penalty by notice if received and processed by the Plan Administrator prior to the distribution record date; otherwise such termination or resumption will be effective with respect to any subsequently declared dividend or other distribution. Some brokers may automatically elect to receive cash on your behalf and may re-invest that cash in additional common shares of the Fund for you. If you wish for all distributions declared on your common shares of the Fund to be automatically reinvested pursuant to the Plan, please contact your broker.
The Plan Administrator will open an account for each common shareholder under the Plan in the same name in which such common shareholder’s common shares are registered. Whenever the Fund declares a dividend or other distribution (together, a “Distribution”) payable in cash, non-participants in the Plan will receive cash and participants in the Plan will receive the equivalent in common shares. The common shares will be acquired by the Plan Administrator for the participants’ accounts, depending upon the circumstances described below, either (i) through receipt of additional unissued but authorized common shares from the Fund (“Newly Issued Common Shares”) or (ii) by purchase of outstanding common shares on the open market (“Open-Market Purchases”) on the New York Stock Exchange or elsewhere. If, on the payment date for any Distribution, the closing market price plus estimated brokerage commission per common share is equal to or greater than the net asset value per common share, the Plan Administrator will invest the Distribution amount in Newly Issued Common Shares on behalf of the participants. The number of Newly Issued Common Shares to be credited to each participant’s account will be determined by dividing the dollar amount of the Distribution by the net asset
value per common share on the payment date; provided that, if the net asset value is less than or equal to 95% of the closing market value on the payment date, the dollar amount of the Distribution will be divided by 95% of the closing market price per common share on the payment date. If, on the payment date for any Distribution, the net asset value per common share is greater than the closing market value plus estimated brokerage commission, the Plan Administrator will invest the Distribution amount in common shares acquired on behalf of the participants in Open-Market Purchases.
If, before the Plan Administrator has completed its Open-Market Purchases, the market price per common share exceeds the net asset value per common share, the average per common share purchase price paid by the Plan Administrator may exceed the net asset value of the common shares, resulting in the acquisition of fewer common shares than if the Distribution had been paid in Newly Issued Common Shares on the Distribution payment date. Because of the foregoing difficulty with respect to Open-Market Purchases, the Plan provides that if the Plan Administrator is unable to invest the full Distribution amount in Open-Market Purchases during the purchase period or if the market discount shifts to a market premium during the purchase period, the Plan Administrator may cease making Open-Market Purchases and may invest the uninvested portion of the Distribution amount in Newly Issued Common Shares at net asset value per common share at the close of business on the Last Purchase Date provided that, if the net asset value is less than or equal to 95% of the then current market price per common share; the dollar amount of the Distribution will be divided by 95% of the market price on the payment date.
The Plan Administrator maintains all shareholders’ accounts in the Plan and furnishes written confirmation of all transactions in the accounts, including information needed by shareholders for tax records. Common shares in the account of each Plan participant will be held by the Plan Administrator on behalf of the Plan participant, and each shareholder proxy will include those shares purchased or received pursuant to the Plan. The Plan Administrator will
MCN | Madison Covered Call & Equity Strategy Fund | Dividend Reinvestment Plan - concluded | June 30, 2020
forward all proxy solicitation materials to participants and vote proxies for shares held under the Plan in accordance with the instruction of the participants.
There will be no brokerage charges with respect to common shares issued directly by the Fund. However, each participant will pay a pro rata share of brokerage commission incurred in connection with Open-Market Purchases. The automatic reinvestment of Distributions will not relieve participants of any Federal, state or local income tax that may be payable (or required to be withheld) on such Distributions.
The Fund reserves the right to amend or terminate the Plan. There is no direct service charge to participants with regard to purchases in the Plan; however, the Fund reserves the right to amend the Plan to include a service charge payable by the participants
All correspondence or questions concerning the Plan should be directed to the Plan Administrator, Computershare Trust Company, N.A., P.O. Box 505000, Louisville, KY 40233, Phone Number: 1-781-575-4523.
MCN | Madison Covered Call & Equity Strategy Fund | June 30, 2020
Board of Trustees Richard E. Struthers James R. Imhoff, Jr. Steven P. Riege Officers Patrick F. Ryan President Paul Lefurgey Vice President Greg D. Hoppe Vice President & Chief Financial Officer | | Holly S. Baggot Secretary & Assistant Treasurer Steven J. Fredricks Chief Compliance Officer & Assistant Secretary Trey D. Edgerle Assistant Secretary | | Investment Adviser and Administrator Madison Asset Management, LLC 550 Science Drive Madison, WI 53711 Custodian State Street Bank Kansas City, Missouri | | Transfer Agent Computershare Investor Services, LLC Canton, Massachusetts Independent Registered Public Accounting Firm Deloitte & Touche LLP Chicago, Illinois |
Question concerning your shares of Madison Covered Call & Equity Strategy Fund?
| ● | If your shares are held in a Brokerage Account, contact your Broker |
| ● | If you have physical possession of your shares in certificate form, contact the Fund’s Transfer Agent: |
| | Computershare Trust Company, N.A., P.O. Box 505000, Louisville, KY 40233 |
This report is sent to shareholders of Madison Covered Call & Equity Strategy Fund for their information. It is not a Prospectus, circular or representation intended for use in the purchase or sale of shares of the Fund or of any securities mentioned in this report.
A description of the Fund’s proxy voting policies and procedures related to portfolio securities is available without charge, upon request, by calling the Fund at (800) 368-3195 and is available on the SEC’s website at www.sec.gov.
Information regarding how the Fund voted proxies for portfolio securities, if applicable, during the most recent 12-month period ended June 30, is also available, without charge and upon request by calling the Fund at (800) 368-3195 or by accessing the Fund’s Form N-PX on the SEC’s website at www.sec.gov.
In September 2019, the Fund submitted a CEO annual certification to the NYSE in which the Fund’s principal executive officer certified that they were not aware, as of the date of the certification, of any violation by the Fund of the NYSE’s Corporate Governance listing standards. In addition, as required by Section 302 of the Sarbanes-Oxley Act of 2002 and related SEC rules, the Fund’s principal executive and principal financial officers have made quarterly certifications, including in filings with the SEC on forms N-CSR and N-PORT, relating to, among other things, the Fund’s disclosure controls and procedures and internal control over financial reporting.
MCN | Madison Covered Call & Equity Strategy Fund | June 30, 2020
This page was intentionally left blank.

Item 2. Code of Ethics.
Not applicable in semi-annual report.
Item 3. Audit Committee Financial Expert.
Not applicable in semi-annual report.
Item 4. Principal Accountant Fees and Services.
Not applicable in semi-annual report.
Item 5. Audit Committee of Listed Registrants.
Not applicable in semi-annual report.
Item 6. Schedule of Investments
Included in report to shareholders (Item 1) above.
Item 7. Disclosure of Proxy Voting Policies and Procedures for Closed-End Management Investment Companies.
Not applicable in semi-annual report.
Item 8. Portfolio Managers of Closed-End Management Investment Companies.
Not applicable in semi-annual report.
Item 9. Purchases of Equity Securities by Closed-End Management Investment Company and Affiliated Purchasers
(a) None*
(b) None*
*Note to Item 9: As announced and disclosed in the registrant’s prospectus, the registrant maintains a Dividend Reinvestment Plan. The plan has no expiration date and no limits on the dollar amount of securities that may be purchased by the registrant to satisfy the plan’s dividend reinvestment requirements.
Item 10. Submission of Matters to a Vote of Security Holders.
Not applicable.
Item 11. Controls and Procedures.
(a) The Trust’s principal executive officer and principal financial officer determined that the registrant’s disclosure controls and procedures are effective, based on their evaluation of these controls and procedures within 90 days of the date of this report. There were no significant changes in the registrant’s internal controls or in other factors that could significantly affect these controls subsequent to the date of their evaluation. The officers identified no significant deficiencies or material weaknesses.
(b) There have been no changes in the registrant’s internal control over financial reporting that occurred during the second fiscal quarter of the period covered by this report that has materially affected, or is reasonably likely to materially affect, the registrant’s internal control over financial reporting.
Item 12. Disclosure of Securities Lending Activities for Closed-End Management Investment Companies.
Not applicable in semi-annual report.
Item 13. Exhibits.
| (a) | (1) Code of Ethics – See Item 2 |
(2) Certifications of principal executive and principal financial officers as required by Rule 30a-2(a) under the Act – filed herewith
(3) Not applicable
(4) There was no change in the registrant’s independent accountant for the period covered by this report
(b) Certification of principal executive and principal financial officers as required by Rule 30a-2(b) under the Act – Filed herewith
SIGNATURES
Pursuant to the requirements of the Securities Exchange Act of 1934 and the Investment Company Act of 1940, the Registrant has duly caused this Report to be signed on its behalf by the undersigned, thereunto duly authorized.
Madison Covered Call & Equity Strategy Fund
/s/ Steven J. Fredricks
Steven J. Fredricks, Chief Compliance Officer
Date: September 3, 2020
Pursuant to the requirements of the Securities Exchange Act of 1934 and the Investment Company Act of 1940, this Report has been signed below by the following persons on behalf of the Registrant and in the capacities and on the dates indicated.
/s/ Patrick F. Ryan
Patrick F. Ryan, Principal Executive Officer
Date: September 3, 2020
/s/ Greg Hoppe
Greg Hoppe, Principal Financial Officer
Date: September 3, 2020