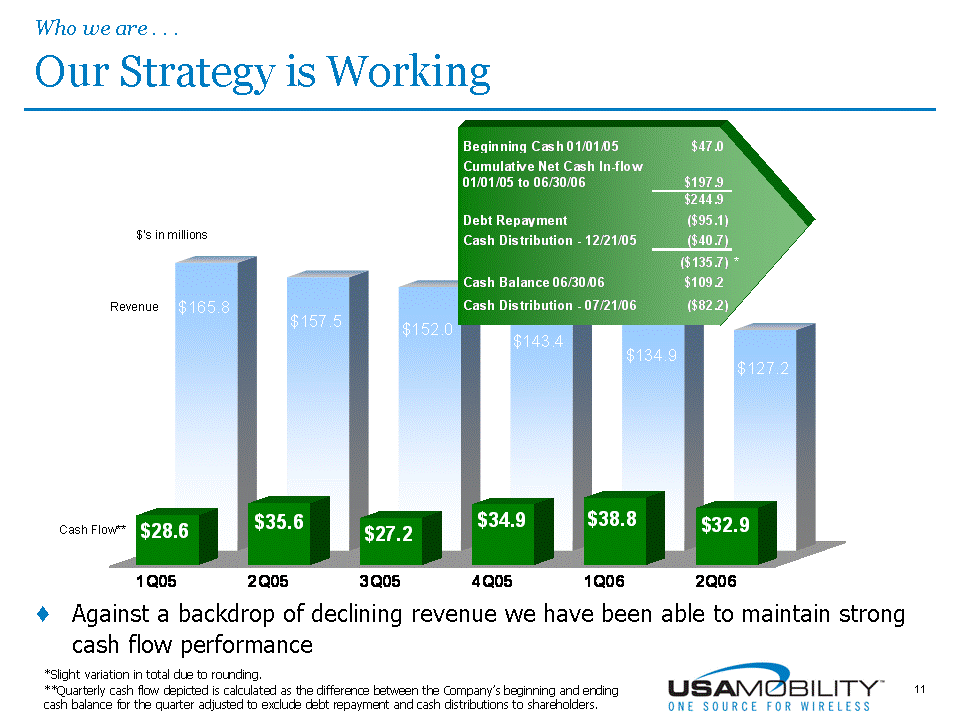
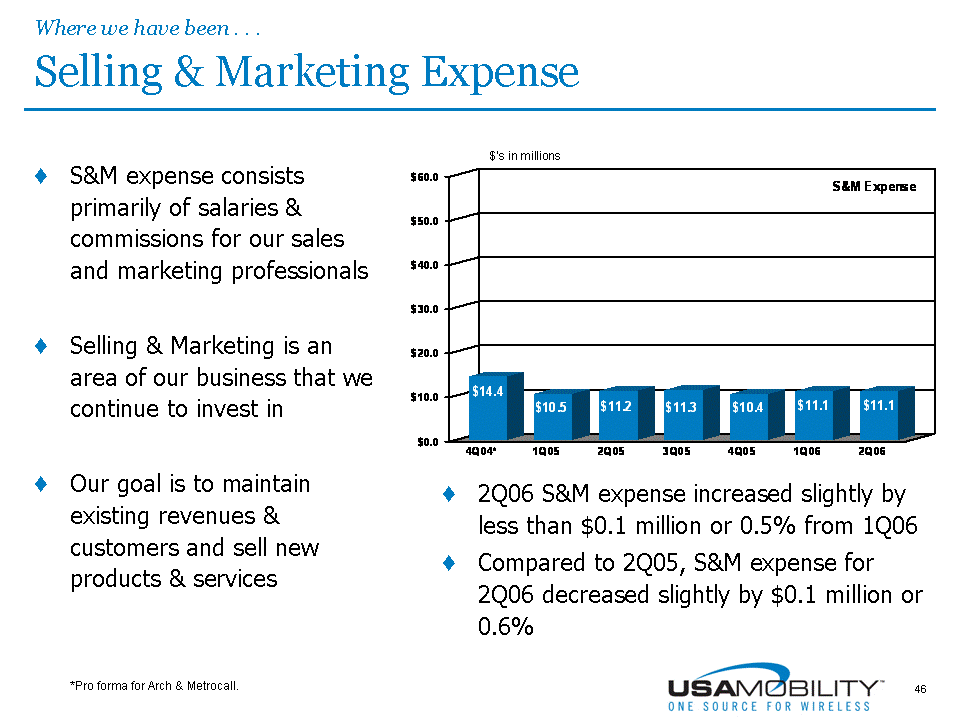
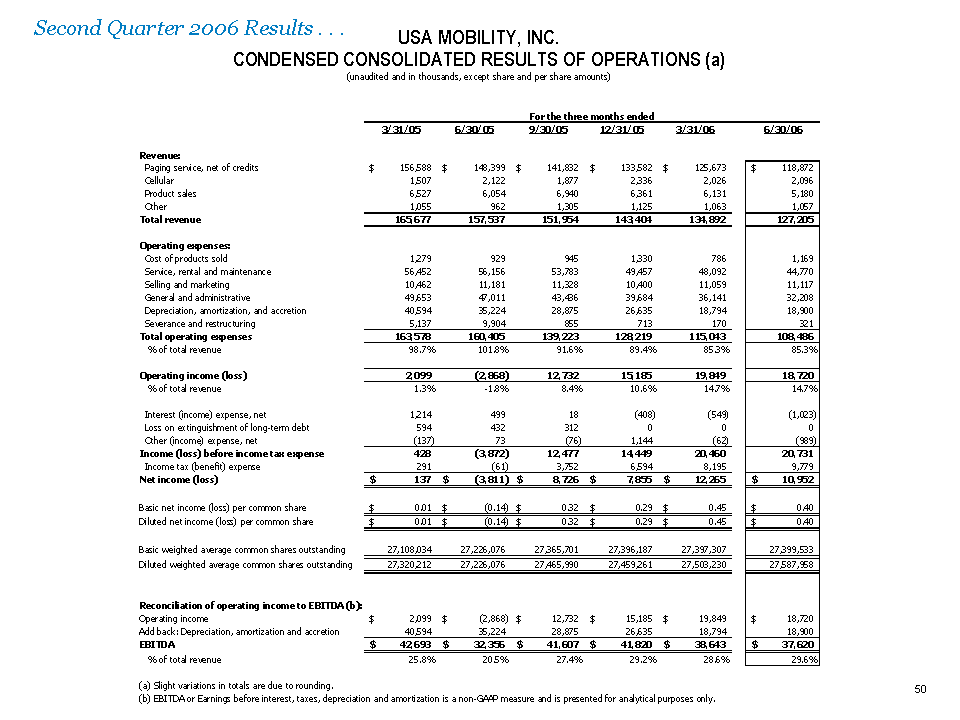
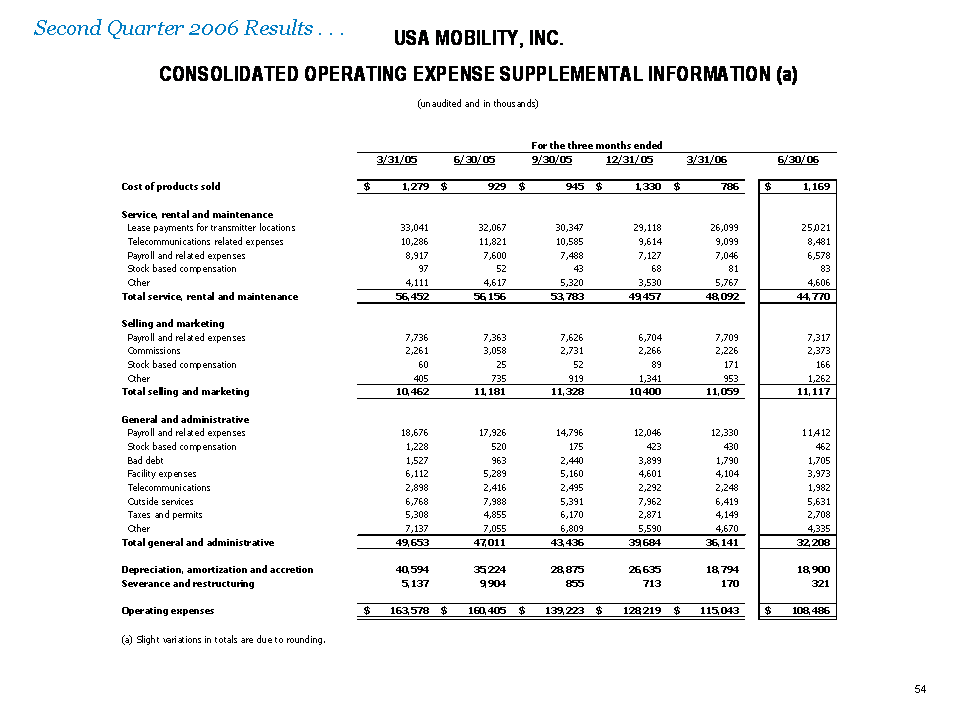
| Second Quarter 2006 Results . . .USA MOBILITY, INC. CONDENSED CONSOLIDATED RESULTS OF OPERATIONS (a) (unaudited and in thousands, except share and per share amounts) For the three months ended 3/31/05 6/30/05 9/30/05 12/31/05 3/31/06 6/30/06 Revenue: Paging service, net of credits $156,588 $148,399 $141,832 $133,582 $125,673 $118,872 Cellular 1,507 2,122 1,877 2,336 2,026 2,096 Product sales 6,527 6,054 6,940 6,361 6,131 5,180 Other 1,055 962 1,305 1,125 1,063 1,057 Total revenue 165,677 157,537 151,954 143,404 134,892 127,205 Operating expenses: Cost of products sold 1,279 929 945 1,330 786 1,169 Service, rental and maintenance 56,452 56,156 53,783 49,457 48,092 44,770 Selling and marketing 10,462 11,181 11,328 10,400 11,059 11,117 General and administrative 49,653 47,011 43,436 39,684 36,141 32,208 Depreciation, amortization, and accretion 40,594 35,224 28,875 26,635 18,794 18,900 Severance and restructuring 5,137 9,904 855 713 170 321 Total operating expenses 163,578 160,405 139,223 128,219 115,043 108,486 % of total revenue 98.7% 101.8% 91.6% 89.4% 85.3% 85.3% Operating income (loss) 2,099 (2,868) 12,732 15,185 19,849 18,720 % of total revenue 1.3% -1.8% 8.4% 10.6% 14.7% 14.7% Interest (income) expense, net 1,214 499 18 (408) (549) (1,023) Loss on extinguishment of long-term debt 594 432 312 0 0 0 Other (income) expense, net (137) 73 (76) 1,144 (62) (989) Income (loss) before income tax expense 428 (3,872) 12,477 14,449 20,460 20,731 Income tax (benefit) expense 291 (61) 3,752 6,594 8,195 9,779 Net income (loss) $137 $ (3,811) $8,726 $7,855 $12,265 $10,952 Basic net income (loss) per common share $0.01 $ (0.14) $0.32 $0.29 $0.45 $0.40 Diluted net income (loss) per common share $0.01 $ (0.14) $0.32 $0.29 $0.45 $0.40 Basic weighted average common shares outstanding 27,108,034 27,226,076 27,365,701 27,396,187 27,397,307 27,399,533 Diluted weighted average common shares outstanding 27,320,212 27,226,076 27,465,990 27,459,261 27,503,230 27,587,958 Reconciliation of operating income to EBITDA (b): Operating income $2,099 $ (2,868) $12,732 $15,185 $19,849 $18,720 Add back: Depreciation, amortization and accretion 40,594 35,224 28,875 26,635 18,794 18,900 EBITDA $42,693 $32,356 $41,607 $41,820 $38,643 $37,620 % of total revenue 25.8% 20.5% 27.4% 29.2% 28.6% 29.6% (a) Slight variations in totals are due to rounding. (b) EBITDA or Earnings before interest, taxes, depreciation and amortization is a non-GAAP measure and is presented for analytical purposes only. |
