UNITED STATES
SECURITIES AND EXCHANGE COMMISSION
Washington, D.C. 20549
FORM N-CSR
CERTIFIED SHAREHOLDER REPORT OF REGISTERED
MANAGEMENT INVESTMENT COMPANIES
Investment Company Act file number | 811-21589 |
|
CREDIT SUISSE COMMODITY RETURN STRATEGY FUND |
(Exact name of registrant as specified in charter) |
|
Eleven Madison Avenue, New York, New York | | 10010 |
(Address of principal executive offices) | | (Zip code) |
|
J. Kevin Gao, Esq. Credit Suisse Commodity Return Strategy Fund Eleven Madison Avenue New York, New York 10010 |
(Name and address of agent for service) |
|
Registrant’s telephone number, including area code: | (212) 325-2000 | |
|
Date of fiscal year end: | October 31st | |
|
Date of reporting period: | November 1, 2008 to October 31, 2009 | |
| | | | | | | | |
Item 1. Reports to Stockholders.
2

CREDIT SUISSE FUNDS
Annual Report
October 31, 2009
n CREDIT SUISSE
COMMODITY RETURN STRATEGY FUND
The Fund's investment objectives, risks, charges and expenses (which should be considered carefully before investing), and more complete information about the Fund, are provided in the Prospectus, which should be read carefully before investing. You may obtain additional copies by calling 877-870-2874 or by writing to Credit Suisse Funds, P.O. Box 55030, Boston, MA 02205-5030.
Credit Suisse Asset Management Securities, Inc., Distributor, is located at Eleven Madison Avenue, New York, NY 10010. Credit Suisse Funds are advised by Credit Suisse Asset Management, LLC.
Investors in the Credit Suisse Funds should be aware that they may be eligible to purchase Common Class and/or Advisor Class shares (where offered) directly or through certain intermediaries. Such shares are not subject to a sales charge but may be subject to an ongoing service and distribution fee of up to 0.50% of average daily net assets. Investors in the Credit Suisse Funds should also be aware that they may be eligible for a reduction or waiver of the sales charge with respect to Class A, B or C shares (where offered). For more information, please review the relevant prospectuses or consult your financial representative.
The views of the Fund's management are as of the date of the letter and the Fund holdings described in this document are as of October 31, 2009; these views and Fund holdings may have changed subsequent to these dates. Nothing in this document is a recommendation to purchase or sell securities.
Fund shares are not deposits or other obligations of Credit Suisse Asset Management, LLC ("Credit Suisse") or any affiliate, are not FDIC-insured and are not guaranteed by Credit Suisse or any affiliate. Fund investments are subject to investment risks, including loss of your investment.
Credit Suisse Commodity Return Strategy Fund
Annual Investment Adviser's Report
October 31, 2009 (unaudited)
December 9, 2009
Dear Shareholder:
Performance Summary
11/1/08 – 10/31/09
| Fund and Benchmark | | Performance | |
| Common1 | | | 1.02 | % | |
| Class A1,2 | | | 0.68 | % | |
| Class C1,2 | | | -0.07 | % | |
| Dow Jones-UBS Commodity Index Total Return3,5 | | | 0.10 | % | |
| Standard & Poor's 500 Index4,5 | | | 9.80 | % | |
Performance for the Fund's Class A and Class C Shares does not reflect sales charges, which are a maximum of 3.00% and 1.00%, respectively.2
Market Review: Optimism on the rise
Though the annual period ended October 31, 2009 was a volatile one, commodities posted gains for the year. The Dow Jones-UBS Commodity Index Total Return gained 0.10% for the period, generally less than the gains of equity indexes. The S&P 500 Index gained 9.80%, the Dow Jones Industrial Average rose by 7.72%, and the Barclays Capital U.S. Aggregate Bond Index rose 0.49%.
Historically, commodity index returns have tended to exhibit long-term positive returns with low correlations to other asset classes, creating potential risk/return benefits within a diversified portfolio. Over the first half of the year, we saw the pace of decline slow in conjunction with increased global efforts to stimulate the economy. The second half of the period resulted in gains. This transition was based on a more optimistic global economic outlook and views that inflation may be on the horizon. Furthermore, we think that current low inflation expectations may be understated, especially if demand for raw materials continues to follow increased investor confidence. Additionally, as official inflation projections continue to remain low, potential unexpected inflation should be all the more worrisome to investors seeking real return. Within this type of scenario, commodities have the potential for large gains. In addition, as markets h ave now begun to benefit from government stimulus and financial institutions move toward normalcy, an increased flow of credit will allow for the ongoing "reflation" of economies — and commodities will benefit directly from these conditions.
Outlook and Strategy: Diversification and potential upside
The DJ-UBS Index is a broadly diversified futures index composed of futures contracts on 19 physical commodities. The Index is weighted among commodity
1
Credit Suisse Commodity Return Strategy Fund
Annual Investment Adviser's Report (continued)
October 31, 2009 (unaudited)
sectors using dollar-adjusted liquidity and production data. Currently, four energy products, six metals and nine agricultural products are represented in the Index.
The Fund seeks total return and is designed to achieve positive return relative to the performance of the DJ-UBS Index. To do so, the Fund invests in commodity-linked derivative instruments and fixed-income securities. The Fund gains exposure to commodities markets by investing in structured notes whose principal and/or coupon payments are linked to the DJ-UBS Index and swap agreements on the DJ-UBS Index.
For the 12-month period ended October 31, 2009, the Fund outperformed the Dow Jones-UBS Commodity Total Return Index. Industrial metals was the top performing commodity group for the year, gaining 59.91%, due to a surge in performance near the end of the period. This momentum in industrial metals was a result of a combination of items: a relatively weaker dollar, low interest rates, and stockpiling by countries such as China. In fact, copper was the strongest commodity for the period, returning 104.77% on a total return basis. Zinc, nickel, and aluminum also produced positive results, up 68.83%, 42.75%, and 15.65%, respectively. Precious metals maintained its positive performance from last year and was the second strongest sector for the period, gaining 23.41% as gold and silver continued to lure risk-averse investors. Agriculture was up slightly, gaining 5.21% for the period — mostly a result of strong performance by sugar, which was u p 57.63% due to lower-than-expected supplies from Brazil and increased imports to India. Wheat, however, was down 29.87% as a result of increased planting and better than expected weather conditions.
Energy and livestock were the worst performing commodity groups over the annual period. Energy fell 5.07% due to the poor returns of natural gas (down 51.85%). All other commodities within the sector posted positive results: crude oil was up 6.11%, heating oil gained 18.49%, and gasoline was up 71.73%. Natural gas suffered losses because of unexpected surpluses and lower-than-expected industrial demand, while gasoline rebounded when prices increased due to larger than expected reductions in stored gasoline. Livestock fell 14.97%, with declines in both lean hogs and live cattle — lean hogs' most recent price decline can be explained by investor fears of the swine flu. Additionally, the recent increase in feed prices, such as wheat and corn, affected the prices of hogs and cattle.
In the fixed income portion of the portfolio, holdings maintained a bias toward high quality, short-term assets, especially bonds issued by U.S. Government-Sponsored Enterprises (GSEs) and U.S Treasury issued debt.
2
Credit Suisse Commodity Return Strategy Fund
Annual Investment Adviser's Report (continued)
October 31, 2009 (unaudited)
In the current credit environment, we remain confident in our high quality fixed income positions, which performed well during the past twelve months.
Thus far in 2009, the daily correlation between commodities and equities has been higher than in recent years. However, we believe that, as recent production cuts become absorbed by the market, the correlation between commodities and equities may decrease and there may be more dispersion between individual commodity index constituents. We think that this will be particularly true in the industrial metals market, where reduced supplies combined with Chinese demand have resulted in generally positive year-to-date performance. We continue to believe that current commodities prices may represent a strong value for investors.
The Credit Suisse Commodities Management Team
Andrew Karsh
Christopher Burton
This Fund is non-diversified, which means it may invest a greater proportion of its assets in the securities of a smaller number of issuers than a diversified mutual fund and may therefore be subject to greater volatility. Exposure to commodity markets should only form a small part of a diversified portfolio. Investment in commodity markets may not be suitable for all investors. The Fund's investment in commodity-linked derivative instruments may subject the Fund to greater volatility than investment in traditional securities, particularly in investments involving leverage.
The use of derivatives such as commodity-linked structured notes, swaps and futures entails substantial risks, including risk of loss of a significant portion of their principal value, lack of a secondary market, increased volatility, correlation risk, liquidity risk, interest-rate risk, market risk, credit risk, valuation risk and tax risk. Gains and losses from speculative positions in derivatives may be much greater than the derivative's cost.
At any time, the risk of loss of any individual security held by the Fund could be significantly higher than 50% of the security's value. For a detailed discussion of these and other risks, please refer to the Fund's Prospectus, which should be read carefully before investing.
In addition to historical information, this report contains forward-looking statements, which may concern, among other things, domestic and foreign market, industry and
3
Credit Suisse Commodity Return Strategy Fund
Annual Investment Adviser's Report (continued)
October 31, 2009 (unaudited)
economic trends and developments and government regulation and their potential impact on the Fund's investments. These statements are subject to risks and uncertainties and actual trends, developments and regulations in the future, and their impact on the Fund could be materially different from those projected, anticipated or implied. The Fund has no obligation to update or revise forward-looking statements.
4
Credit Suisse Commodity Return Strategy Fund
Annual Investment Adviser's Report (continued)
October 31, 2009 (unaudited)
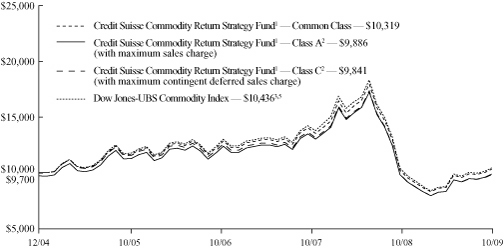
Comparison of Change in Value of $10,000 Investment in the
Credit Suisse Commodity Return Strategy Fund1 Common Class
shares, Class A shares2, Class C shares2 and the
Dow Jones-UBS Commodity Index3,5 from Inception (12/30/04)
Average Annual Returns as of September 30, 20091
| | | 1 Year | | Since
Inception | |
| Common Class | | | (22.93 | )% | | | (0.03 | )% | |
| Class A Without Sales Charge | | | (23.13 | )% | | | (0.29 | )% | |
| Class A With Maximum Sales Charge | | | (25.45 | )% | | | (0.93 | )% | |
| Class C Without CDSC | | | (23.76 | )% | | | (1.01 | )% | |
| Class C With CDSC | | | (24.52 | )% | | | (1.01 | )% | |
Average Annual Returns as of October 31, 20091
| | | 1 Year | | Since
Inception | |
| Common Class | | | 1.02 | % | | | 0.65 | % | |
| Class A Without Sales Charge | | | 0.68 | % | | | 0.39 | % | |
| Class A With Maximum Sales Charge | | | (2.38 | )% | | | (0.24 | )% | |
| Class C Without CDSC | | | (0.07 | )% | | | (0.33 | )% | |
| Class C With CDSC | | | (1.07 | )% | | | (0.33 | )% | |
5
Credit Suisse Commodity Return Strategy Fund
Annual Investment Adviser's Report (continued)
October 31, 2009 (unaudited)
Returns represent past performance and include change in share price and reinvestment of dividends and capital gains. Past performance cannot guarantee future results. The current performance of the Fund may be lower or higher than the figures shown. Returns and share price will fluctuate, and redemption value may be more or less than original cost. The performance results do not reflect the deduction of taxes that a shareholder would pay on fund distributions or the redemption of fund shares. Performance information current to the most recent month-end is available at www.credit-suisse.com/us.
The annualized gross expense ratios are 0.85% for Common Class shares, 1.10% for Class A shares and 1.85% for Class C shares. The annualized net expense ratios after fee waivers and/or expense reimbursements are 0.70% for Common Class shares, 0.95% for Class A shares and 1.70% for Class C shares.
1 Fee waivers and/or expense reimbursements may reduce expenses for the Fund, without which performance would be lower. Waivers and/or reimbursements may be discontinued at any time.
2 Total return for the Fund's Class A shares for the reporting period, based on offering price (including maximum sales charge of 3.00%), was (2.38)%. Total return for the Fund's Class C shares for the reporting period, based on redemption value (including maximum contingent deferred sales charge of 1.00%), was (1.07)%.
3 The Dow Jones-UBS Commodity Index Total Return is composed of futures contracts on 19 physical commodities. Investors cannot invest directly in an index.
4 The Standard & Poor's 500 Index is an unmanaged index (with no defined investment objective) of common stocks, includes reinvestment of dividends, and is a registered trademark of The McGraw-Hill Companies, Inc. Investors cannot invest directly in an index.
5 An index does not have transaction costs; investors may not invest directly in an index.
6
Credit Suisse Commodity Return Strategy Fund
Annual Investment Adviser's Report (continued)
October 31, 2009 (unaudited)
Information About Your Fund's Expenses
As an investor of the Fund, you incur two types of costs: ongoing expenses and transaction costs. Ongoing expenses include management fees, distribution and service (12b-1) fees and other Fund expenses. Examples of transaction costs include sales charges (loads), redemption fees and account maintenance fees, which are not shown in this section and which would result in higher total expenses. The following table is intended to help you understand your ongoing expenses of investing in the Fund and to help you compare these expenses with the ongoing expenses of investing in other mutual funds. The table is based on an investment of $1,000 made at the beginning of the six month period ended October 31, 2009.
The table illustrates your Fund's expenses in two ways:
• Actual Fund Return. This helps you estimate the actual dollar amount of ongoing expenses paid on a $1,000 investment in the Fund using the Fund's actual return during the period. To estimate the expenses you paid over the period, simply divide your account value by $1,000 (for example, an $8,600 account value divided by $1,000 = 8.6), then multiply the result by the number in the "Expenses Paid per $1,000" line under the share class you hold.
• Hypothetical 5% Fund Return. This helps you to compare your Fund's ongoing expenses with those of other mutual funds using the Fund's actual expense ratio and a hypothetical rate of return of 5% per year before expenses. Examples using a 5% hypothetical fund return may be found in the shareholder reports of other mutual funds. The hypothetical account values and expenses may not be used to estimate the actual ending account balance or expenses you paid for the period.
Please note that the expenses shown in these tables are meant to highlight your ongoing expenses only and do not reflect any transaction costs, such as sales charges (loads) or redemption fees. If these transaction costs had been included, your costs would have been higher. The "Expenses Paid per $1,000" line of the tables is useful in comparing ongoing expenses only and will not help you determine the relative total expenses of owning different funds.
7
Credit Suisse Commodity Return Strategy Fund
Annual Investment Adviser's Report (continued)
October 31, 2009 (unaudited)
Expenses and Value for a $1,000 Investment
for the six month period ended October 31, 2009
| Actual Fund Return | | Common
Class | | Class A | | Class C | |
| Beginning Account Value 5/1/09 | | $ | 1,000.00 | | | $ | 1,000.00 | | | $ | 1,000.00 | | |
| Ending Account Value 10/31/09 | | $ | 1,191.70 | | | $ | 1,190.60 | | | $ | 1,185.30 | | |
| Expenses Paid per $1,000* | | $ | 3.87 | | | $ | 5.25 | | | $ | 9.36 | | |
| Hypothetical 5% Fund Return | |
| Beginning Account Value 5/1/09 | | $ | 1,000.00 | | | $ | 1,000.00 | | | $ | 1,000.00 | | |
| Ending Account Value 10/31/09 | | $ | 1,021.68 | | | $ | 1,020.42 | | | $ | 1,016.64 | | |
| Expenses Paid per $1,000* | | $ | 3.57 | | | $ | 4.84 | | | $ | 8.64 | | |
| | | Common
Class | | Class A | | Class C | |
| Annualized Expense Ratios* | | | 0.70 | % | | | 0.95 | % | | | 1.70 | % | |
* Expenses are equal to the Fund's annualized expense ratio for each share class, multiplied by the average account value over the period, multiplied by the number of days in the most recent fiscal half year period, then divided by 365.
The "Expenses Paid per $1,000" and the "Annualized Expense Ratios" in the tables are based on actual expenses paid by the Fund during the period, net of fee waivers and/or expense reimbursements. If those fee waivers and/or expense reimbursements had not been in effect, the Fund's actual expenses would have been higher.
For more information, please refer to the Fund's prospectus.
8
Credit Suisse Commodity Return Strategy Fund
Annual Investment Adviser's Report (continued)
October 31, 2009 (unaudited)
| Sector Breakdown* | |
| United States Agency Obligations | | | 65.85 | % | |
| Wholly-Owned Subsidiary | | | 19.58 | % | |
| Commodity Indexed Structured Notes | | | 8.71 | % | |
| United States Treasury Obligations | | | 5.80 | % | |
| Short-Term Investment | | | 0.06 | % | |
| Total | | | 100.00 | % | |
* Expressed as a percentage of total investments (excluding securities lending collateral if applicable) and may vary over time.
9
Credit Suisse Commodity Return Strategy Fund
Schedule of Investments
October 31, 2009
Par
(000) | |
| | Ratings†
(S&P/Moody's) | | Maturity | | Rate% | | Value | |
| COMMODITY INDEXED STRUCTURED NOTES (8.8%) | |
| $ | 16,000 | | | BNP Paribas, Commodity Index Linked
Senior Unsecured Notes# | | (AA, Aa1) | | 01/13/11 | | | 0.014 | | | $ | 18,955,200 | | |
| | 50,000 | | | BNP Paribas, Commodity Index Linked
Senior Unsecured Notes# | | (AA, Aa1) | | 11/26/10 | | | 0.147 | | | | 56,130,000 | | |
| | 22,000 | | | Deutsche Bank AG London, Commodity Index
Linked Senior Unsecured Notes# | | (A+, Aa1) | | 03/23/10 | | | 0.085 | | | | 40,726,840 | | |
| | 15,800 | | | Deutsche Bank AG London, Commodity Index
Linked Senior Unsecured Notes# | | (A+, Aa1) | | 01/13/10 | | | 0.085 | | | | 25,221,066 | | |
| | 20,000 | | | Svensk AB Exportkredit, Commodity Index
Linked Senior Unsecured Notes# | | (AA+, Aa1) | | 01/13/10 | | | 0.014 | | | | 31,896,966 | | |
| | 12,000 | | | Svensk AB Exportkredit, Commodity Index
Linked Senior Unsecured Notes# | | (AA+, Aa1) | | 01/13/10 | | | 0.014 | | | | 19,138,179 | | |
| | 5,300 | | | Svensk AB Exportkredit, Commodity Index
Linked Senior Unsecured Notes# | | (AA+, Aa1) | | 01/13/10 | | | 0.014 | | | | 8,452,696 | | |
| TOTAL COMMODITY INDEXED STRUCTURED NOTES (Cost $141,100,000) | | | 200,520,947 | | |
| UNITED STATES AGENCY OBLIGATIONS (66.4%) | |
| | 50,000 | | | Fannie Mae# | | (AAA, Aaa) | | 02/12/10 | | | 0.404 | | | | 50,013,300 | | |
| | 12,000 | | | Fannie Mae Discount Notes | | (AAA, Aaa) | | 11/02/09 | | | 0.240 | | | | 11,999,920 | | |
| | 25,000 | | | Fannie Mae Discount Notes | | (AAA, Aaa) | | 11/16/09 | | | 0.250 | | | | 24,997,396 | | |
| | 25,000 | | | Fannie Mae Discount Notes | | (AAA, Aaa) | | 11/23/09 | | | 0.250 | | | | 24,996,181 | | |
| | 25,000 | | | Fannie Mae Discount Notes | | (AAA, Aaa) | | 12/21/09 | | | 0.240 | | | | 24,991,667 | | |
| | 10,000 | | | Fannie Mae Discount Notes | | (AAA, Aaa) | | 12/31/09 | | | 0.120 | | | | 9,999,750 | | |
| | 48,000 | | | Fannie Mae Discount Notes | | (AAA, Aaa) | | 01/05/10 | | | 0.110 | | | | 47,997,888 | | |
| | 25,000 | | | Fannie Mae Discount Notes | | (AAA, Aaa) | | 01/11/10 | | | 0.270 | | | | 24,998,775 | | |
| | 15,000 | | | Fannie Mae Discount Notes | | (AAA, Aaa) | | 01/19/10 | | | 0.240 | | | | 14,999,190 | | |
| | 6,000 | | | Fannie Mae Discount Notes | | (AAA, Aaa) | | 01/27/10 | | | 0.300 | | | | 5,999,640 | | |
| | 20,000 | | | Federal Farm Credit Bank# | | (AAA, Aaa) | | 06/22/11 | | | 0.295 | | | | 20,027,980 | | |
| | 55,000 | | | Federal Farm Credit Bank# | | (AAA, Aaa) | | 01/13/12 | | | 0.545 | | | | 55,355,685 | | |
| | 27,000 | | | Federal Home Loan Bank Discount Notes | | (AAA, Aaa) | | 11/12/09 | | | 0.093 | | | | 26,999,235 | | |
| | 13,500 | | | Federal Home Loan Bank Discount Notes | | (AAA, Aaa) | | 11/18/09 | | | 0.300 | | | | 13,498,087 | | |
| | 36,000 | | | Federal Home Loan Bank Discount Notes | | (AAA, Aaa) | | 12/18/09 | | | 0.220 | | | | 35,989,660 | | |
| | 8,500 | | | Federal Home Loan Bank Discount Notes | | (AAA, Aaa) | | 12/29/09 | | | 0.285 | | | | 8,496,097 | | |
| | 24,250 | | | Federal Home Loan Bank Discount Notes | | (AAA, Aaa) | | 01/07/10 | | | 0.340 | | | | 24,248,884 | | |
| | 18,000 | | | Federal Home Loan Bank Discount Notes | | (AAA, Aaa) | | 01/20/10 | | | 0.295 | | | | 17,999,010 | | |
| | 50,000 | | | Federal Home Loan Banks# | | (AAA, Aaa) | | 02/10/10 | | | 0.394 | | | | 50,010,650 | | |
| | 25,000 | | | Federal Home Loan Banks | | (AAA, Aaa) | | 06/10/10 | | | 0.550 | | | | 25,035,525 | | |
| | 20,000 | | | Federal Home Loan Banks | | (AAA, Aaa) | | 06/25/10 | | | 0.600 | | | | 20,034,920 | | |
| | 15,500 | | | Federal Home Loan Banks | | (AAA, Aaa) | | 09/17/10 | | | 0.500 | | | | 15,505,146 | | |
| | 25,000 | | | Federal Home Loan Banks | | (AAA, Aaa) | | 10/25/10 | | | 0.500 | | | | 25,019,175 | | |
| | 38,925 | | | Federal Home Loan Banks | | (AAA, Aaa) | | 11/15/10 | | | 1.050 | | | | 39,042,982 | | |
| | 15,835 | | | Federal Home Loan Banks | | (AAA, Aaa) | | 02/03/11 | | | 0.950 | | | | 15,907,841 | | |
| | 65,000 | | | Federal Home Loan Banks | | (AAA, Aaa) | | 02/07/11 | | | 1.000 | | | | 65,239,850 | | |
| | 27,000 | | | Federal Home Loan Banks | | (AAA, Aaa) | | 02/28/11 | | | 1.000 | | | | 27,137,484 | | |
| | 34,000 | | | Federal Home Loan Banks Series 1# | | (AAA, Aaa) | | 01/14/11 | | | 0.234 | | | | 34,033,218 | | |
| | 32,900 | | | Federal Home Loan Mortgage Corp.# | | (AAA, Aaa) | | 07/12/10 | | | 0.184 | | | | 32,932,834 | | |
| | 14,065 | | | Federal Home Loan Mortgage Corp.# | | (AAA, Aaa) | | 01/14/11 | | | 0.264 | | | | 14,083,861 | | |
See Accompanying Notes to Financial Statements.
10
Credit Suisse Commodity Return Strategy Fund
Schedule of Investments (continued)
October 31, 2009
Par
(000) | |
| | Ratings†
(S&P/Moody's) | | Maturity | | Rate% | | Value | |
| UNITED STATES AGENCY OBLIGATIONS | |
| $ | 27,164 | | | Federal Home Loan Mortgage Corp.# | | (AAA, Aaa) | | 04/01/11 | | | 0.350 | | | $ | 27,216,399 | | |
| | 38,190 | | | Federal Home Loan Mortgage Corp.# | | (AAA, Aaa) | | 04/07/11 | | | 0.334 | | | | 38,258,284 | | |
| | 25,000 | | | Federal Home Loan Mortgage Corp.# | | (AAA, Aaa) | | 06/17/11 | | | 0.393 | | | | 25,066,925 | | |
| | 10,482 | | | Federal National Mortgage Association | | (AAA, Aaa) | | 02/15/10 | | | 3.875 | | | | 10,590,730 | | |
| | 13,000 | | | Freddie Mac Discount Notes | | (AAA, Aaa) | | 11/02/09 | | | 0.195 | | | | 12,999,930 | | |
| | 11,500 | | | Freddie Mac Discount Notes | | (AAA, Aaa) | | 11/09/09 | | | 0.210 | | | | 11,499,463 | | |
| | 28,000 | | | Freddie Mac Discount Notes | | (AAA, Aaa) | | 11/16/09 | | | 0.240 | | | | 27,997,200 | | |
| | 16,200 | | | Freddie Mac Discount Notes | | (AAA, Aaa) | | 11/23/09 | | | 0.270 | | | | 16,197,327 | | |
| | 15,000 | | | Freddie Mac Discount Notes | | (AAA, Aaa) | | 12/14/09 | | | 0.275 | | | | 14,995,073 | | |
| | 25,000 | | | Freddie Mac Discount Notes | | (AAA, Aaa) | | 12/15/09 | | | 0.230 | | | | 24,992,972 | | |
| | 18,159 | | | Freddie Mac Discount Notes | | (AAA, Aaa) | | 01/05/10 | | | 0.310 | | | | 18,158,201 | | |
| | 66,000 | | | Freddie Mac Discount Notes | | (AAA, Aaa) | | 01/11/10 | | | 0.210 | | | | 65,996,766 | | |
| | 8,365 | | | Freddie Mac Discount Notes‡ | | (AAA, Aaa) | | 01/19/10 | | | 0.297 | | | | 8,364,548 | | |
| | 21,000 | | | Freddie Mac Discount Notes | | (AAA, Aaa) | | 01/20/10 | | | 0.229 | | | | 20,998,845 | | |
| | 36,000 | | | Freddie Mac Discount Notes | | (AAA, Aaa) | | 01/25/10 | | | 0.240 | | | | 35,997,912 | | |
| | 10,700 | | | Freddie Mac Discount Notes | | (AAA, Aaa) | | 01/26/10 | | | 0.220 | | | | 10,699,369 | | |
| | 38,318 | | | Freddie Mac Discount Notes | | (AAA, Aaa) | | 01/28/10 | | | 0.196 | | | | 38,315,701 | | |
| | 60,000 | | | Freddie Mac Discount Notes | | (AAA, Aaa) | | 02/02/10 | | | 0.120 | | | | 59,991,540 | | |
| | 34,300 | | | Freddie Mac Discount Notes | | (AAA, Aaa) | | 02/16/10 | | | 0.234 | | | | 34,294,443 | | |
| | 25,000 | | | Freddie Mac Discount Notes | | (AAA, Aaa) | | 02/23/10 | | | 0.125 | | | | 24,995,675 | | |
| | 30,000 | | | Freddie Mac Discount Notes | | (AAA, Aaa) | | 02/25/10 | | | 0.115 | | | | 29,994,720 | | |
| | 25,000 | | | Freddie Mac Discount Notes | | (AAA, Aaa) | | 03/15/10 | | | 0.205 | | | | 24,993,075 | | |
| | 46,750 | | | Freddie Mac Discount Notes | | (AAA, Aaa) | | 03/22/10 | | | 0.235 | | | | 46,736,349 | | |
| | 35,000 | | | Freddie Mac Discount Notes | | (AAA, Aaa) | | 05/17/10 | | | 0.430 | | | | 34,974,275 | | |
| | 43,950 | | | Freddie Mac Discount Notes | | (AAA, Aaa) | | 05/26/10 | | | 0.210 | | | | 43,916,202 | | |
| TOTAL UNITED STATES AGENCY OBLIGATIONS (Cost $1,515,165,797) | | | 1,515,833,755 | | |
| UNITED STATES TREASURY OBLIGATIONS (5.8%) | |
| | 25,000 | | | United States Cash Management Bills | | (AAA, Aaa) | | 04/01/10 | | | 0.275 | | | | 24,986,975 | | |
| | 27,500 | | | United States Cash Management Bills | | (AAA, Aaa) | | 07/15/10 | | | 0.350 | | | | 27,455,780 | | |
| | 34,500 | | | United States Treasury Bills | | (AAA, Aaa) | | 02/11/10 | | | 0.255 | | | | 34,494,687 | | |
| | 25,000 | | | United States Treasury Bills | | (AAA, Aaa) | | 02/25/10 | | | 0.250 | | | | 24,994,800 | | |
| | 21,500 | | | United States Treasury Bills | | (AAA, Aaa) | | 04/22/10 | | | 0.160 | | | | 21,484,993 | | |
| TOTAL UNITED STATES TREASURY OBLIGATIONS (Cost $133,341,218) | | | 133,417,235 | | |
| SHORT-TERM INVESTMENT (0.1%) | |
| | 1,270 | | | State Street Bank and Trust Co. Euro Time
Deposit (Cost $1,270,000) | | | | 11/02/09 | | | 0.010 | | | | 1,270,000 | | |
See Accompanying Notes to Financial Statements.
11
Credit Suisse Commodity Return Strategy Fund
Schedule of Investments (continued)
October 31, 2009
Number of
Shares | |
| |
| |
| |
| |
Value | |
| WHOLLY-OWNED SUBSIDIARY (19.7%) | |
| | 128,930,400 | | | Credit Suisse Cayman Commodity Fund I, Ltd.^
(Cost $288,165,827) | | | | | | | | $ | 450,808,278 | | |
| TOTAL INVESTMENTS AT VALUE (100.8%) (Cost $2,079,042,842) | | | 2,301,850,215 | | |
| LIABILITIES IN EXCESS OF OTHER ASSETS (-0.8%) | | | (18,520,237 | ) | |
| NET ASSETS (100.0%) | | $ | 2,283,329,978 | | |
† Credit ratings given by the Standard & Poor's Division of The McGraw-Hill Companies, Inc. ("S&P") and Moody's Investors Service, Inc. ("Moody's") are unaudited.
# Variable rate obligations — The interest rate is the rate as of October 31, 2009.
‡ Collateral segregated at broker.
^ Affiliated issuer. See Note 3.
See Accompanying Notes to Financial Statements.
12
Credit Suisse Commodity Return Strategy Fund
Statement of Assets and Liabilities
October 31, 2009
| Assets | |
| Investments at value (Cost $1,790,877,015) (Note 2) | | $ | 1,851,041,937 | | |
| Investment in wholly-owned subsidiary at value (Cost $288,165,827) (Note 2) | | | 450,808,278 | | |
| Cash | | | 454 | | |
| Receivable for fund shares sold | | | 12,974,358 | | |
| Interest receivable | | | 1,093,014 | | |
| Prepaid expenses and other assets | | | 214,934 | | |
| Total Assets | | | 2,316,132,975 | | |
| Liabilities | |
| Advisory fee payable (Note 3) | | | 275,656 | | |
| Administrative services fee payable (Note 3) | | | 263,508 | | |
| Shareholder servicing/Distribution fee payable (Note 3) | | | 90,556 | | |
| Payable for investments purchased | | | 29,988,979 | | |
| Payable for fund shares redeemed | | | 1,741,047 | | |
| Trustees' fee payable | | | 5,657 | | |
| Other accrued expenses payable | | | 437,594 | | |
| Total Liabilities | | | 32,802,997 | | |
| Net Assets | |
| Capital stock, $.001 par value (Note 6) | | | 264,361 | | |
| Paid-in capital (Note 6) | | | 2,376,136,311 | | |
| Accumulated net investment loss | | | (5,444,616 | ) | |
| Accumulated net realized loss on investments | | | (310,433,451 | ) | |
| Net unrealized appreciation from investments | | | 222,807,373 | | |
| Net Assets | | $ | 2,283,329,978 | | |
| Common Shares | |
| Net assets | | $ | 1,911,091,029 | | |
| Shares outstanding | | | 221,161,208 | | |
| Net asset value, offering price and redemption price per share | | $ | 8.64 | | |
| A Shares | |
| Net assets | | $ | 350,204,169 | | |
| Shares outstanding | | | 40,630,079 | | |
| Net asset value and redemption price per share | | $ | 8.62 | | |
| Maximum offering price per share (net asset value/(1-3.00%)) | | $ | 8.89 | | |
| C Shares | |
| Net assets | | $ | 22,034,780 | | |
| Shares outstanding | | | 2,569,785 | | |
| Net asset value and offering price per share | | $ | 8.57 | | |
See Accompanying Notes to Financial Statements.
13
Credit Suisse Commodity Return Strategy Fund
Statement of Operations
For the Year Ended October 31, 2009
| Investment Income (Note 2) | |
| Interest | | $ | 7,534,812 | | |
| Total investment income | | | 7,534,812 | | |
| Expenses | |
| Investment advisory fees (Note 3) | | | 6,620,452 | | |
| Administrative services fees (Note 3) | | | 1,861,929 | | |
| Shareholder servicing/Distribution fees (Note 3) | |
| Class A | | | 548,950 | | |
| Class C | | | 137,157 | | |
| Transfer agent fees (Note 3) | | | 2,030,898 | | |
| Registration fees | | | 189,677 | | |
| Printing fees (Note 3) | | | 170,631 | | |
| Insurance expense | | | 86,861 | | |
| Audit and tax fees | | | 82,968 | | |
| Legal fees | | | 54,629 | | |
| Custodian fees | | | 53,779 | | |
| Commitment fees (Note 4) | | | 40,853 | | |
| Trustees' fees | | | 16,296 | | |
| Miscellaneous expense | | | 24,728 | | |
| Total expenses | | | 11,919,808 | | |
| Less: fees waived (Note 3) | | | (1,965,055 | ) | |
| Net expenses | | | 9,954,753 | | |
| Net investment loss | | | (2,419,941 | ) | |
| Net Realized and Unrealized Gain (Loss) from Investments | |
| Net realized loss from investments | | | (76,615,759 | ) | |
| Net realized loss from investment in wholly-owned subsidiary | | | (207,436,521 | ) | |
| Net change in unrealized appreciation (depreciation) from investments | | | 83,566,298 | | |
| Net change in unrealized appreciation (depreciation) from investments in wholly-owned subsidiary1 | | | 368,453,804 | | |
| Net realized and unrealized gain from investments | | | 167,967,822 | | |
| Net increase in net assets resulting from operations | | $ | 165,547,881 | | |
1 There was no income recognized from the investments in wholly-owned subsidiary.
See Accompanying Notes to Financial Statements.
14
Credit Suisse Commodity Return Strategy Fund
Statements of Changes in Net Assets
| | | For the Year Ended October 31, | |
| | | 2009 | | 2008 | |
| From Operations | |
| Net investment income (loss) | | $ | (2,419,941 | ) | | $ | 19,477,531 | | |
| Net realized loss from investments and futures contracts | | | (284,052,280 | ) | | | (24,763,171 | ) | |
Net change in unrealized appreciation (depreciation)
from investments and futures contracts | | | 452,020,102 | | | | (291,242,412 | ) | |
| Net increase (decrease) in net assets resulting from operations | | | 165,547,881 | | | | (296,528,052 | ) | |
| From Dividends and Distributions | |
| Dividends from net investment income | |
| Common Class shares | | | (4,735,065 | ) | | | (16,903,757 | ) | |
| Class A shares | | | (912,653 | ) | | | (6,152,728 | ) | |
| Class C shares | | | (43,429 | ) | | | (259,429 | ) | |
| Distributions from net realized gains | |
| Common Class shares | | | — | | | | (2,783,387 | ) | |
| Class A shares | | | — | | | | (1,267,330 | ) | |
| Class C shares | | | — | | | | (83,565 | ) | |
| Net decrease in net assets resulting from dividends and distributions | | | (5,691,147 | ) | | | (27,450,196 | ) | |
| From Capital Share Transactions (Note 6) | |
| Proceeds from sale of shares | | | 1,960,402,738 | | | | 768,631,714 | | |
| Reinvestment of dividends and distributions | | | 4,254,612 | | | | 15,375,532 | | |
| Net asset value of shares redeemed | | | (541,391,872 | )1 | | | (577,532,354 | )2 | |
| Net increase in net assets from capital share transactions | | | 1,423,265,478 | | | | 206,474,892 | | |
| Net increase (decrease) in net assets | | | 1,583,122,212 | | | | (117,503,356 | ) | |
| Net Assets | |
| Beginning of year | | | 700,207,766 | | | | 817,711,122 | | |
| End of year | | $ | 2,283,329,978 | | | $ | 700,207,766 | | |
| Undistributed (accumulated) net investment income (loss) | | $ | (5,444,616 | ) | | $ | 2,445,456 | | |
1 Net of $125,715 of redemption fees retained by the Fund.
2 Net of $178,959 of redemption fees retained by the Fund.
See Accompanying Notes to Financial Statements.
15
Credit Suisse Commodity Return Strategy Fund
Financial Highlights
(For a Common Class Share of the Fund Outstanding Throughout Each Period)
| | | For the Year Ended October 31, | | For the Period
Ended | |
| | | 2009 | | 2008 | | 2007 | | 2006 | | October 31, 20051 | |
| Per share data | |
| Net asset value, beginning of period | | $ | 8.61 | | | $ | 12.16 | | | $ | 10.98 | | | $ | 11.47 | | | $ | 10.00 | | |
| INVESTMENT OPERATIONS | |
| Net investment income (loss)2 | | | (0.01 | ) | | | 0.25 | | | | 0.50 | | | | 0.48 | | | | 0.23 | | |
Net gain (loss) on investments, futures contracts and
swap contracts (both realized and unrealized) | | | 0.09 | | | | (3.44 | ) | | | 1.11 | | | | 0.05 | | | | 1.39 | | |
| Total from investment operations | | | 0.08 | | | | (3.19 | ) | | | 1.61 | | | | 0.53 | | | | 1.62 | | |
| REDEMPTION FEES | | | 0.003 | | | | 0.003 | | | | 0.003 | | | | 0.003 | | | | — | | |
| LESS DIVIDENDS AND DISTRIBUTIONS | |
| Dividends from net investment income | | | (0.05 | ) | | | (0.30 | ) | | | (0.43 | ) | | | (0.40 | ) | | | (0.15 | ) | |
| Distributions from net realized gains | | | — | | | | (0.06 | ) | | | — | | | | (0.62 | ) | | | — | | |
| Total dividends and distributions | | | (0.05 | ) | | | (0.36 | ) | | | (0.43 | ) | | | (1.02 | ) | | | (0.15 | ) | |
| Net asset value, end of period | | $ | 8.64 | | | $ | 8.61 | | | $ | 12.16 | | | $ | 10.98 | | | $ | 11.47 | | |
| Total return4 | | | 1.02 | % | | | (27.08 | )% | | | 15.07 | % | | | 4.72 | % | | | 16.25 | % | |
| RATIOS AND SUPPLEMENTAL DATA | |
| Net assets, end of period (000s omitted) | | $ | 1,911,091 | | | $ | 515,476 | | | $ | 537,211 | | | $ | 125,163 | | | $ | 48,207 | | |
| Ratio of expenses to average net assets | | | 0.70 | % | | | 0.70 | % | | | 0.70 | % | | | 0.70 | % | | | 0.70 | %5 | |
Ratio of net investment income (loss)
to average net assets | | | (0.15 | )% | | | 1.92 | % | | | 4.37 | % | | | 4.29 | % | | | 2.53 | %5 | |
Decrease reflected in above operating expense
ratios due to waivers/reimbursements | | | 0.15 | % | | | 0.07 | % | | | 0.11 | % | | | 0.25 | % | | | 0.80 | %5 | |
| Portfolio turnover rate | | | 43 | % | | | 109 | % | | | 32 | % | | | 60 | % | | | 0 | % | |
1 For the period December 30, 2004 (inception date) through October 31, 2005.
2 Per share information is calculated using the average shares outstanding method.
3 This amount represents less than $0.01 per share.
4 Total returns are historical and assume changes in share price and reinvestment of all dividends and distributions. Had certain expenses not been reduced during the periods shown, total returns would have been lower. Total returns for periods less than one year are not annualized.
5 Annualized.
See Accompanying Notes to Financial Statements.
16
Credit Suisse Commodity Return Strategy Fund
Financial Highlights
(For a Class A Share of the Fund Outstanding Throughout Each Period)
| | | For the Year Ended October 31, | | For the Period
Ended | |
| | | 2009 | | 2008 | | 2007 | | 2006 | | October 31, 20051 | |
| Per share data | |
| Net asset value, beginning of period | | $ | 8.61 | | | $ | 12.15 | | | $ | 10.97 | | | $ | 11.45 | | | $ | 10.00 | | |
| INVESTMENT OPERATIONS | |
| Net investment income (loss)2 | | | (0.02 | ) | | | 0.23 | | | | 0.46 | | | | 0.45 | | | | 0.23 | | |
Net gain (loss) on investments, futures contracts and
swap contracts (both realized and unrealized) | | | 0.07 | | | | (3.44 | ) | | | 1.13 | | | | 0.06 | | | | 1.36 | | |
| Total from investment operations | | | 0.05 | | | | (3.21 | ) | | | 1.59 | | | | 0.51 | | | | 1.59 | | |
| REDEMPTION FEES | | | 0.003 | | | | 0.003 | | | | 0.003 | | | | 0.003 | | | | — | | |
| LESS DIVIDENDS AND DISTRIBUTIONS | |
| Dividends from net investment income | | | (0.04 | ) | | | (0.27 | ) | | | (0.41 | ) | | | (0.37 | ) | | | (0.14 | ) | |
| Distributions from net realized gains | | | — | | | | (0.06 | ) | | | — | | | | (0.62 | ) | | | — | | |
| Total dividends and distributions | | | (0.04 | ) | | | (0.33 | ) | | | (0.41 | ) | | | (0.99 | ) | | | (0.14 | ) | |
| Net asset value, end of period | | $ | 8.62 | | | $ | 8.61 | | | $ | 12.15 | | | $ | 10.97 | | | $ | 11.45 | | |
| Total return4 | | | 0.68 | % | | | (27.20 | )% | | | 14.80 | % | | | 4.51 | % | | | 15.91 | % | |
| RATIOS AND SUPPLEMENTAL DATA | |
| Net assets, end of period (000s omitted) | | $ | 350,204 | | | $ | 171,619 | | | $ | 263,657 | | | $ | 223,377 | | | $ | 108,431 | | |
| Ratio of expenses to average net assets | | | 0.95 | % | | | 0.95 | % | | | 0.95 | % | | | 0.95 | % | | | 0.95 | %5 | |
Ratio of net investment income (loss)
to average net assets | | | (0.29 | )% | | | 1.76 | % | | | 4.13 | % | | | 4.04 | % | | | 2.28 | %5 | |
Decrease reflected in above operating expense
ratios due to waivers/reimbursements | | | 0.15 | % | | | 0.08 | % | | | 0.11 | % | | | 0.25 | % | | | 0.80 | %5 | |
| Portfolio turnover rate | | | 43 | % | | | 109 | % | | | 32 | % | | | 60 | % | | | 0 | % | |
1 For the period December 30, 2004 (inception date) through October 31, 2005.
2 Per share information is calculated using the average shares outstanding method.
3 This amount represents less than $0.01 per share.
4 Total returns are historical and assume changes in share price, reinvestment of all dividends and distributions and no sales charge. Had certain expenses not been reduced during the periods shown, total returns would have been lower. Total returns for periods less than one year are not annualized.
5 Annualized.
See Accompanying Notes to Financial Statements.
17
Credit Suisse Commodity Return Strategy Fund
Financial Highlights
(For a Class C Share of the Fund Outstanding Throughout Each Period)
| | | For the Year Ended October 31, | | For the Period
Ended | |
| | | 2009 | | 2008 | | 2007 | | 2006 | | October 31, 20051 | |
| Per share data | |
| Net asset value, beginning of period | | $ | 8.61 | | | $ | 12.15 | | | $ | 10.97 | | | $ | 11.43 | | | $ | 10.00 | | |
| INVESTMENT OPERATIONS | |
| Net investment income (loss)2 | | | (0.08 | ) | | | 0.12 | | | | 0.38 | | | | 0.37 | | | | 0.17 | | |
Net gain (loss) on investments, futures contracts and
swap contracts (both realized and unrealized) | | | 0.07 | | | | (3.43 | ) | | | 1.12 | | | | 0.06 | | | | 1.36 | | |
| Total from investment operations | | | (0.01 | ) | | | (3.31 | ) | | | 1.50 | | | | 0.43 | | | | 1.53 | | |
| REDEMPTION FEES | | | 0.003 | | | | 0.003 | | | | 0.003 | | | | 0.003 | | | | — | | |
| LESS DIVIDENDS AND DISTRIBUTIONS | |
| Dividends from net investment income | | | (0.03 | ) | | | (0.17 | ) | | | (0.32 | ) | | | (0.27 | ) | | | (0.10 | ) | |
| Distributions from net realized gains | | | — | | | | (0.06 | ) | | | — | | | | (0.62 | ) | | | — | | |
| Total dividends and distributions | | | (0.03 | ) | | | (0.23 | ) | | | (0.32 | ) | | | (0.89 | ) | | | (0.10 | ) | |
| Net asset value, end of period | | $ | 8.57 | | | $ | 8.61 | | | $ | 12.15 | | | $ | 10.97 | | | $ | 11.43 | | |
| Total return4 | | | (0.07 | )% | | | (27.76 | )% | | | 13.94 | % | | | 3.78 | % | | | 15.29 | % | |
| RATIOS AND SUPPLEMENTAL DATA | |
| Net assets, end of period (000s omitted) | | $ | 22,035 | | | $ | 13,113 | | | $ | 16,843 | | | $ | 14,577 | | | $ | 5,094 | | |
| Ratio of expenses to average net assets | | | 1.70 | % | | | 1.70 | % | | | 1.70 | % | | | 1.70 | % | | | 1.70 | %5 | |
Ratio of net investment income (loss)
to average net assets | | | (0.97 | )% | | | 0.97 | % | | | 3.38 | % | | | 3.29 | % | | | 1.53 | %5 | |
Decrease reflected in above operating expense
ratios due to waivers/reimbursements | | | 0.15 | % | | | 0.07 | % | | | 0.11 | % | | | 0.25 | % | | | 0.80 | %5 | |
| Portfolio turnover rate | | | 43 | % | | | 109 | % | | | 32 | % | | | 60 | % | | | 0 | % | |
1 For the period December 30, 2004 (inception date) through October 31, 2005.
2 Per share information is calculated using the average shares outstanding method.
3 This amount represents less than $0.01 per share.
4 Total returns are historical and assume changes in share price, reinvestment of all dividends and distributions and no sales charge. Had certain expenses not been reduced during the periods shown, total returns would have been lower. Total returns for periods less than one year are not annualized.
5 Annualized.
See Accompanying Notes to Financial Statements.
18
Credit Suisse Commodity Return Strategy Fund
Notes to Financial Statements
October 31, 2009
Note 1. Organization
Credit Suisse Commodity Return Strategy Fund (the "Fund") is registered under the Investment Company Act of 1940, as amended (the "1940 Act"), as a non-diversified open-end management investment company that seeks total return. The Fund was organized as a statutory trust under the laws of the State of Delaware on May 19, 2004.
The Fund is authorized to offer three classes of shares: Common Class shares, Class A shares and Class C shares. The Fund's Common Class shares are closed to new investors, with certain exceptions as set forth in the prospectus. Each class of shares in the Fund represents an equal pro rata interest in the Fund, except that they bear different expenses, which reflect the differences in the range of services provided to them. Class A shares are sold subject to a front-end sales charge of 3.00%. Class C shares are sold subject to a contingent deferred sales charge of 1.00% if the shares are redeemed within the first year of purchase.
Note 2. Significant Accounting Policies
A) SECURITY VALUATION — The net asset value of the Fund is determined daily as of the close of regular trading on the New York Stock Exchange, Inc. (the "Exchange") on each day the Exchange is open for business. Debt securities with a remaining maturity greater than 60 days are valued in accordance with the price supplied by a pricing service, which may use a matrix, formula or other objective method that takes into consideration market indices, yield curves and other specific adjustments. Debt obligations that will mature in 60 days or less are valued on the basis of amortized cost, which approximates market value, unless it is determined that using this method would not represent fair value. Equity investments are valued at market value, which is generally determined using the closing price on the exchange or market on which the security is primarily traded at the time of valuation (the "Valuation Time"). If no sales are reported, equ ity investments are generally valued at the most recent bid quotation as of the Valuation Time or at the lowest asked quotation in the case of a short sale of securities. Investments in mutual funds are valued at the mutual fund's closing net asset value per share on the day of valuation. Swap contracts are generally valued at a price at which the counterparty to such contract would repurchase the instrument or terminate the contract. Structured note agreements are valued in accordance with a dealer-supplied valuation based on changes in the value of the underlying index. Securities, options, futures contracts and other assets (including swaps and structured note agreements), for which market quotations are not readily
19
Credit Suisse Commodity Return Strategy Fund
Notes to Financial Statements (continued)
October 31, 2009
Note 2. Significant Accounting Policies
available, or whose values have been materially affected by events occurring before the Fund's Valuation Time but after the close of the securities' primary markets, are valued at fair value as determined in good faith by, or under the direction of, the Board of Trustees under procedures established by the Board of Trustees. The Fund may utilize a service provided by an independent third party which has been approved by the Board of Trustees to fair value certain securities. When fair-value pricing is employed, the prices of securities used by a fund to calculate its net asset value may differ from quoted or published prices for the same securities.
In accordance with the authoritative guidance on fair value measurements and disclosures under accounting principles generally accepted in the United States of America ("GAAP"), the Fund discloses the fair value of its investments in a hierarchy that prioritizes the inputs to valuation techniques used to measure the fair value. In accordance with GAAP, fair value is defined as the price that the Fund would receive upon selling an investment in a timely transaction to an independent buyer in the principal or most advantageous market of the investment. GAAP established a three-tier hierarchy to maximize the use of observable market data and minimize the use of unobservable inputs and to establish classification of fair value measurements for disclosure purposes. Inputs refer broadly to the assumptions that market participants would use in pricing the asset or liability, including assumptions about risk, for example, the risk inherent in a part icular valuation technique used to measure fair value including such a pricing model and/or the risk inherent in the inputs to the valuation technique. Inputs may be observable or unobservable. Observable inputs are inputs that reflect the assumptions market participants would use in pricing the asset or liability developed based on market data obtained from sources independent of the reporting entity. Unobservable inputs are inputs that reflect the reporting entity's own assumptions about the assumptions market participants would use in pricing the asset or liability developed based on the best information available in the circumstances. The three-tier hierarchy of inputs is summarized in the three broad Levels listed below.
• Level 1 – quoted prices in active markets for identical investments
• Level 2 – other significant observable inputs (including quoted prices for similar investments, interest rates, prepayment speeds, credit risk, etc.)
• Level 3 – significant unobservable inputs (including the Fund's own assumptions in determining the fair value of investments)
20
Credit Suisse Commodity Return Strategy Fund
Notes to Financial Statements (continued)
October 31, 2009
Note 2. Significant Accounting Policies
The inputs or methodology used for valuing securities are not necessarily an indication of the risk associated with investing in those securities.
The following is a summary of the inputs used as of October 31, 2009 in valuing the Fund's investments carried at value:
| | | Level 1 | | Level 2 | | Level 3 | | Total | |
| Investments in Securities | |
| Commodity Indexed Structured Notes | | $ | — | | | $ | 200,520,947 | | | $ | — | | | $ | 200,520,947 | | |
| United States Agency Obligations | | | — | | | | 1,515,833,755 | | | | — | | | | 1,515,833,755 | | |
| United States Treasury Obligations | | | — | | | | 133,417,235 | | | | — | | | | 133,417,235 | | |
| Short-Term Investment | | | — | | | | 1,270,000 | | | | — | | | | 1,270,000 | | |
| Wholly-Owned Subsidiary | | | — | | | | 450,808,278 | | | | — | | | | 450,808,278 | | |
| Other Financial Instruments* | | | — | | | | — | | | | — | | | | — | | |
| | | $ | — | | | $ | 2,301,850,215 | | | $ | — | | | $ | 2,301,850,215 | | |
*Other financial instruments include futures, forwards and swap contracts.
B) DERIVATIVE INSTRUMENTS AND HEDGING ACTIVITIES — Effective October 31, 2009, the Fund adopted amendments to authoritative guidance on disclosures about derivative instruments and hedging activities which require that the Fund disclose (a) how and why an entity uses derivative instruments, (b) how derivative instruments and hedging activities are accounted for, and (c) how derivative instruments and related hedging activities affect a fund's financial position, financial performance, and cash flows. The Fund has not entered into any derivative or hedging activities during the period covered by this report.
C) SECURITY TRANSACTIONS AND INVESTMENT INCOME — Security transactions are accounted for on a trade date basis. Interest income is recorded on the accrual basis. The Fund amortizes premiums and accretes discounts using the effective interest method. Dividends are recorded on the ex-dividend date. Certain expenses are class-specific expenses and vary by class. Income, expenses (excluding class-specific expenses) and realized/unrealized gains/losses are allocated proportionately to each class of shares based upon the relative net asset value of the outstanding shares of that class. The cost of investments sold is determined by use of the specific identification method for both financial reporting and income tax purposes.
D) DIVIDENDS AND DISTRIBUTIONS TO SHAREHOLDERS — Dividends from net investment income are declared and paid quarterly. Distributions of net realized capital gains, if any, are declared and paid at least annually. However, to the extent that a net realized capital gain can be reduced by a capital loss carryforward, such gain will not be distributed. Income and capital
21
Credit Suisse Commodity Return Strategy Fund
Notes to Financial Statements (continued)
October 31, 2009
Note 2. Significant Accounting Policies
gain distributions are determined in accordance with federal income tax regulations, which may differ from GAAP.
E) FEDERAL INCOME TAXES — No provision is made for federal taxes as it is the Fund's intention to continue to qualify for and elect the tax treatment applicable to regulated investment companies ("RIC") under the Internal Revenue Code of 1986, as amended (the "Code"), and to make the requisite distributions to its shareholders, which will be sufficient to relieve it from federal income and excise taxes.
In order to qualify as a RIC under the Code, the Fund must meet certain requirements regarding the source of its income, the diversification of its assets and the distribution of its income. One of these requirements is that the Fund derive at least 90% of its gross income for each taxable year from dividends, interest, payments with respect to certain securities loans, gains from the sale or other disposition of stock, securities or foreign currencies, other income derived with respect to its business of investing in such stock, securities or currencies or net income derived from interests in certain publicly traded partnerships ("Qualifying Income"). The Fund may seek to track the performance of the Dow Jones-UBS Commodity Index ("DJ-UBS Index") through investing in structured notes designed to track the performance of the DJ-UBS Index. The Fund has received a private letter ruling from the IRS which confirms that the Fund's use of certain types of structured notes designed to track the performance of the DJ-UBS Index produce Qualifying Income. In addition, the Fund may, through its investment in the Credit Suisse Cayman Commodity Fund I, Ltd., a wholly owned and controlled Cayman Islands subsidiary, ("the Subsidiary"), seek to track the performance of the DJ-UBS Index by the Subsidiary's investments in commodity-linked swaps and/or futures contracts. The Fund has obtained a private letter ruling from the IRS that its investment in the Subsidiary will produce Qualifying Income. If the Fund is unable to ensure continued qualification as a RIC, the Fund may be required to change its investment objective, policies or techniques, or may be liquidated. If the Fund fails to qualify as a RIC, the Fund will be subject to federal income tax on its net income and capital gains at regular corporate rates (without reduction for distributions to shareholders). If the Fund were to fail to qualify as a RIC and become subject to federal income tax, sharehold ers of the Fund would be subject to the risk of diminished returns.
The Fund adopted the authoritative guidance for uncertainty in income taxes and recognizes a tax benefit from an uncertain position only if it is more likely than not that the position is sustainable based solely on its technical merits
22
Credit Suisse Commodity Return Strategy Fund
Notes to Financial Statements (continued)
October 31, 2009
Note 2. Significant Accounting Policies
and consideration of the relevant taxing authority's widely understood administrative practices and procedures. The Fund has reviewed its current tax positions and has determined that no provision for income tax is required in the Fund's financial statements. The Fund's federal tax returns for the prior three fiscal years remain subject to examination by the Internal Revenue Service.
F) USE OF ESTIMATES — The preparation of financial statements in conformity with GAAP requires management to make estimates and assumptions that affect the reported amounts of assets and liabilities and disclosure of contingent assets and liabilities at the date of the financial statements and the reported amounts of income and expenses during the reporting period. Actual results could differ from these estimates.
G) SHORT-TERM INVESTMENTS — The Fund, together with other funds/portfolios advised by Credit Suisse Asset Management, LLC ("Credit Suisse"), an indirect, wholly-owned subsidiary of Credit Suisse Group AG, pools available cash into a short-term variable rate time deposit issued by State Street Bank and Trust Company ("SSB"), the Fund's custodian. The short-term time deposit issued by SSB is a variable rate account classified as a short-term investment.
H) FUTURES — The Fund may enter into futures contracts to the extent permitted by its investment policies and objectives. The Fund may use futures contracts to gain exposure to, or hedge against changes in commodities. Upon entering into a futures contract, the Fund is required to deposit cash and/or pledge U.S. Government securities as initial margin. Subsequent payments, which are dependent on the daily fluctuations in the value of the underlying instrument, are made or received by the Fund each day (daily variation margin) and are recorded as unrealized gains or losses until the contracts are closed. When the contracts are closed, the Fund records a realized gain or loss equal to the difference between the proceeds from (or cost of) the closing transactions and the Fund's basis in the contract. Risks of entering into futures contracts for hedging purposes include the possibility that a change in the value of the contract may not corr elate with the changes in the value of the underlying instruments. With futures, there is minimal counterparty credit risk to the Fund since futures are exchange traded and the exchange's clearinghouse, as counterparty to all exchange traded futures, guarantees the futures against default. In addition, the purchase of a futures contract involves the risk that the Fund could lose more than the original margin deposit and subsequent payments may be required for a futures transaction. At October 31, 2009, the Fund had no open futures contracts.
23
Credit Suisse Commodity Return Strategy Fund
Notes to Financial Statements (continued)
October 31, 2009
Note 2. Significant Accounting Policies
I) SWAPS — The Fund may enter into commodity index swaps for hedging purposes or to seek to increase total return. A swap is an agreement that obligates two parties to exchange a series of cash flows at specified intervals based upon or calculated by reference to changes in specified prices or rates for a specified amount of an underlying asset or notional principal amount. The Fund will enter into commodity index swaps only on a net basis, which means that the two payment streams are netted out, with the Fund receiving or paying, as the case may be, only the net amount of the two payments. Risks may arise as a result of the failure of the counterparty to the swap contract to comply with the terms of the swap contract. The Fund's maximum risk of loss from counterparty credit risk is the discontinued net value of the cash flows to be received from/paid to the counterparty over the contract's remaining life, to the extent that the amount is positive. This risk is mitigated by having a master netting arrangement between the Fund and the counterparty and by the posting of collateral by the counterparty to the Fund to cover the Fund's exposure to the counterparty. Therefore, the Fund considers the creditworthiness of each counterparty to a swap contract in evaluating potential credit risk. Additionally, risks may arise from unanticipated movements in interest rates or in the value of the underlying reference asset or index.
The Fund may enter into total return swap contracts, involving commitments to pay interest in exchange for a market-linked return, both based on notional amounts. To the extent the total return of the security or index underlying the transactions exceeds or falls short of the offsetting interest rate obligation, the Fund will receive a payment from or make a payment to the counterparty.
The Fund records unrealized gains or losses on a daily basis representing the value and the current net receivable or payable relating to open swap contracts. Net amounts received or paid on the swap contract are recorded as realized gains or losses. Fluctuations in the value of swap contracts are recorded for financial statement purposes as unrealized appreciation or depreciation on swap contracts. Realized gains and losses from terminated swaps are included in net realized gains/losses on swap contracts transactions. At October 31, 2009, the Fund had no outstanding swap contracts.
J) COMMODITY INDEXED-LINKED NOTES — The Fund may invest in structured notes whose value is based on the price movements of a commodity index. The structured notes are often leveraged, increasing the volatility of each note's value relative to the change in the underlying linked financial element. The value of these notes will rise and fall in response to changes in the underlying commodity index. Structured notes may entail a greater degree of market risk than other types of debt securities because the investor bears the risk of the underlying commodity index. Structured notes may also be more
24
Credit Suisse Commodity Return Strategy Fund
Notes to Financial Statements (continued)
October 31, 2009
Note 2. Significant Accounting Policies
volatile, less liquid, and more difficult to accurately price than less complex securities or more traditional debt securities. Fluctuations in the value of the structured notes are recorded as unrealized gains and losses in the accompanying financial statements. Net payments are recorded as interest income. These notes are subject to prepayment, credit and interest risks. The Fund has the option to request prepayment from the issuer. At maturity, or when a note is sold, the Fund records a realized gain or loss. At October 31, 2009, the value of these securities comprised 8.8% of the Fund's net assets and resulted in unrealized appreciation of $59,420,947.
K) SECURITIES LENDING — Loans of securities are required at all times to be secured by collateral at least equal to 102% of the market value of domestic securities on loan (including any accrued interest thereon) and 105% of the market value of foreign securities on loan (including any accrued interest thereon). Cash collateral received by the Fund in connection with securities lending activity may be pooled together with cash collateral for other funds/portfolios advised by Credit Suisse and may be invested in a variety of investments, including funds advised by SSB, the Fund's securities lending agent, or money market instruments. However, in the event of default or bankruptcy by the other party to the agreement, realization and/or retention of the collateral may be subject to legal proceedings.
SSB has been engaged by the Fund to act as the Fund's securities lending agent. The Fund's securities lending arrangement provides that the Fund and SSB will share the net income earned from securities lending activities. During the year ended October 31, 2009, the Fund had no securities out on loan.
L) OTHER — The Fund may invest in securities of foreign countries and governments which involve certain risks in addition to those inherent in domestic investments. Such risks generally include, among others, currency risk (fluctuations in currency exchange rates), information risk (key information may be inaccurate or unavailable) and political risk (expropriation, nationalization or the imposition of capital or currency controls or punitive taxes). Other risks of investing in foreign securities include liquidity and valuation risks.
In the normal course of business the Fund trades financial instruments and enters into financial transactions where risk of potential loss exists due to changes in the market (market risk) or failure of the other party to a transaction to perform (credit risk). Similar to credit risk, the Fund may be exposed to counterparty risk, or the risk that an institution or other entity with which the Fund has unsettled or open transactions will default. The potential loss could exceed the value of the financial assets recorded in the financial statements. Financial assets, which potentially expose the Fund to credit risk, consist principally of cash due
25
Credit Suisse Commodity Return Strategy Fund
Notes to Financial Statements (continued)
October 31, 2009
Note 2. Significant Accounting Policies
from counterparties and investments. The extent of the Fund's exposure to credit and counterparty risks in respect to these financial assets approximates their carrying value as recorded in the Fund's Statement of Assets and Liabilities.
The Fund may be subject to taxes imposed by countries in which it invests with respect to its investments in issuers existing or operating in such countries. Such taxes are generally based on income earned or repatriated and capital gains realized on the sale of such investments. The Fund accrues such taxes when the related income is earned or gains are realized.
Note 3. Transactions with Affiliates and Related Parties
Credit Suisse serves as investment adviser for the Fund. For its investment advisory services, Credit Suisse is entitled to receive a fee from the Fund at an annual rate of 0.50% of the Fund's average daily net assets. For the year ended October 31, 2009, investment advisory fees earned and voluntarily waived were $6,620,452 and $1,965,055, respectively. Credit Suisse will not recapture from the Fund any fees it waived during the year ended October 31, 2009. Fee waivers and reimbursements are voluntary and may be discontinued by Credit Suisse at any time.
Credit Suisse Asset Management Securities, Inc. ("CSAMSI"), an affiliate of Credit Suisse, and SSB serve as co-administrators to the Fund. For its co-administrative services, CSAMSI currently receives a fee calculated at an annual rate of 0.09% of the Fund's average daily net assets. For the year ended October 31, 2009, co-administrative services fees earned by CSAMSI were $1,191,682.
For its co-administrative services, SSB receives a fee, exclusive of out-of-pocket expenses, calculated in total for all the Credit Suisse funds/portfolios co-administered by SSB and allocated based upon the relative average net assets of each fund/portfolio, subject to an annual minimum fee. For the year ended October 31, 2009, co-administrative services fees earned by SSB (including out-of-pocket expenses) were $670,247.
In addition to serving as the Fund's co-administrator, CSAMSI currently serves as distributor of the Fund's shares. Pursuant to distribution plans adopted by the Fund pursuant to Rule 12b-1 under the 1940 Act, CSAMSI receives fees for its distribution services. These fees are calculated at an annual rate of 0.25% of the average daily net assets of the Class A shares and 1.00% of the average daily net assets of the Class C shares. Common Class shares of the Fund are not subject to distribution fees.
26
Credit Suisse Commodity Return Strategy Fund
Notes to Financial Statements (continued)
October 31, 2009
Note 3. Transactions with Affiliates and Related Parties
Certain brokers, dealers and financial representatives provide transfer agent related services to the Fund and receive compensation from Credit Suisse. Credit Suisse is then reimbursed by the Fund. For the year ended October 31, 2009, the Fund reimbursed Credit Suisse $616,259, which is included in the Fund's transfer agent expense.
For the year ended October 31, 2009, CSAMSI and its affiliates advised the Fund that it retained $98,042 from commissions earned on the sale of the Fund's Class A shares.
Merrill Corporation ("Merrill"), an affiliate of Credit Suisse, has been engaged by the Fund to provide certain financial printing services. For the year ended October 31, 2009, Merrill was paid $122,408 for its services by the Fund.
Investment in Cayman Commodity Fund I, Ltd. The Fund may invest up to 25% of its total assets in the Subsidiary, which invests primarily in commodity and financial futures and options contracts, as well as fixed income securities and other investments intended to serve as margin or collateral for the Subsidiary's derivatives positions. The Fund wholly owns and controls the Subsidiary, and the Fund and Subsidiary are both managed by Credit Suisse.
The Fund does not consolidate the assets, liabilities, capital or operations of the Subsidiary into its financial statements. Rather, the Subsidiary is separately presented as an investment in the Fund's Schedule of Investments. Unrealized appreciation or depreciation on the Fund's investment in the Subsidiary is recorded in the Fund's Statement of Assets and Liabilities and Fund's Statement of Operations.
For tax purposes, the Subsidiary is an exempted Cayman investment company. The Subsidiary has received an undertaking from the Government of the Cayman Islands exempting it from all local income, profits and capital gains taxes through June of 2027. No such taxes are levied in the Cayman Islands at the present time. For U.S. income tax purposes, the Subsidiary is a Controlled Foreign Corporation and as such is not subject to U.S. income tax. However, as a wholly-owned Controlled Foreign Corporation, the Subsidiary's net income and capital gain, to the extent of its earnings and profits, will be included each year in the Fund's investment company taxable income.
| | | Beginning
Shares | | Subscriptions | | Redemptions | | Ending
Shares | | Dividend
Income | | Value
of affiliates
at 10/31/09 | |
Credit Suisse Cayman
Commodity Fund I, Ltd. | | | 49,006,452 | | | | 110,035,096 | | | | (30,111,148 | ) | | | 128,930,400 | | | $ | — | | | $ | 450,808,278 | | |
27
Credit Suisse Commodity Return Strategy Fund
Notes to Financial Statements (continued)
October 31, 2009
Note 4. Line of Credit
The Fund, together with other funds/portfolios advised by Credit Suisse (collectively, the "Participating Funds"), participates in a $50 million committed, unsecured line of credit facility ("Credit Facility") for temporary or emergency purposes with SSB. Under the terms of the Credit Facility, the Participating Funds pay an aggregate commitment fee on the average unused amount of the Credit Facility, which is allocated among the Participating Funds in such manner as is determined by the governing Boards of the Participating Funds. In addition, the Participating Funds pay interest on borrowings at either the Overnight Federal Funds rate or the Overnight LIBOR rate plus a spread. At October 31, 2009, and during the year ended October 31, 2009, the Fund had no borrowings under the Credit Facility.
Note 5. Purchases and Sales of Securities
For the year ended October 31, 2009, purchases and sales of investment securities (excluding short-term investments) and U.S. Government and Agency Obligations were as follows:
| Investment Securities | | U.S. Government/
Agency Obligations | |
| Purchases | | Sales | | Purchases | | Sales | |
| $ | 367,100,000 | | | $ | 176,498,333 | | | $ | 564,167,498 | | | $ | 106,526,388 | | |
Note 6. Capital Share Transactions
The Fund is authorized to issue an unlimited number of full and fractional shares of beneficial interest, $.001 par value per share. The Fund currently offers Common Class, Class A and Class C shares. Transactions in capital shares for each class of the Fund were as follows:
| | | Common Class | |
| | | For the Year Ended
October 31, 2009 | | For the Year Ended
October 31, 2008 | |
| | | Shares | | Value | | Shares | | Value | |
| Shares sold | | | 219,915,883 | | | $ | 1,696,647,731 | | | | 48,965,305 | | | $ | 611,420,787 | | |
Shares issued in reinvestment
of dividends and distributions | | | 449,506 | | | | 3,404,412 | | | | 743,407 | | | | 9,033,819 | | |
| Shares redeemed | | | (59,057,353 | ) | | | (448,651,647 | ) | | | (34,018,595 | ) | | | (400,006,282 | ) | |
| Net increase | | | 161,308,036 | | | $ | 1,251,400,496 | | | | 15,690,117 | | | $ | 220,448,324 | | |
28
Credit Suisse Commodity Return Strategy Fund
Notes to Financial Statements (continued)
October 31, 2009
Note 6. Capital Share Transactions
| | | Class A | |
| | | For the Year Ended
October 31, 2009 | | For the Year Ended
October 31, 2008 | |
| | | Shares | | Value | | Shares | | Value | |
| Shares sold | | | 32,257,668 | | | $ | 252,181,796 | | | | 11,553,171 | | | $ | 149,151,878 | | |
Shares issued in reinvestment
of dividends and distributions | | | 106,738 | | | | 811,209 | | | | 494,587 | | | | 6,036,476 | | |
| Shares redeemed | | | (11,671,507 | ) | | | (89,700,882 | ) | | | (13,812,455 | ) | | | (171,388,834 | ) | |
| Net increase (decrease) | | | 20,692,899 | | | $ | 163,292,123 | | | | (1,764,697 | ) | | $ | (16,200,480 | ) | |
| | | Class C | |
| | | For the Year Ended
October 31, 2009 | | For the Year Ended
October 31, 2008 | |
| | | Shares | | Value | | Shares | | Value | |
| Shares sold | | | 1,435,019 | | | $ | 11,573,211 | | | | 611,211 | | | $ | 8,059,049 | | |
Shares issued in reinvestment
of dividends and distributions | | | 5,131 | | | | 38,991 | | | | 25,369 | | | | 305,237 | | |
| Shares redeemed | | | (392,859 | ) | | | (3,039,343 | ) | | | (500,527 | ) | | | (6,137,238 | ) | |
| Net increase | | | 1,047,291 | | | $ | 8,572,859 | | | | 136,053 | | | $ | 2,227,048 | | |
A redemption fee of 2% of the value of Common Class shares, Class A shares and Class C shares redeemed or exchanged within 30 days from the date of purchase is charged to shareholders. Reinvested dividends and distributions are not subject to the fee. The fee is charged based on the value of shares at redemption, is paid directly to the Fund and becomes part of the Fund's daily net asset value calculation. When shares are redeemed that are subject to the fee, reinvested dividends and distributions are redeemed first, followed by the shares held longest.
On October 31, 2009, the number of shareholders that held 5% or more of the outstanding shares of each class of the Fund was as follows:
| | | Number of
Shareholders | | Approximate Percentage
of Outstanding Shares | |
| Common Class | | | 2 | | | | 61 | % | |
| Class A | | | 2 | | | | 45 | % | |
| Class C | | | 1 | | | | 31 | % | |
Some of the shareholders are omnibus accounts, which hold shares on behalf of individual shareholders.
29
Credit Suisse Commodity Return Strategy Fund
Notes to Financial Statements (continued)
October 31, 2009
Note 7. Federal Income Taxes
Income and capital gain distributions are determined in accordance with federal income tax regulations, which may differ from GAAP.
The tax characteristics of dividends and distributions paid during the years ended October 31, 2009 and 2008, respectively, by the Fund were as follows:
| Ordinary Income | | Long-Term Capital Gain | |
| 2009 | | 2008 | | 2009 | | 2008 | |
| $ | 5,691,147 | | | $ | 23,315,974 | | | $ | 0 | | | $ | 4,134,222 | | |
The tax basis components of distributable earnings differ from the amounts reflected in the Statement of Assets and Liabilities by temporary book/tax differences. These differences are primarily due to losses deferred on wash sales and investment in the wholly-owned, affiliated subsidiary. At October 31, 2009, the components of distributable earnings on a tax basis were as follows:
| Undistributed net investment income | | $ | 156,238,231 | | |
| Accumulated realized loss | | | (102,974,979 | ) | |
| Unrealized depreciation | | | (146,333,946 | ) | |
| | | $ | (93,070,694 | ) | |
At October 31, 2009, the Fund had capital loss carryforwards available to offset possible future capital gains.
| | | Expires October 31, | |
| | 2016 | | 2017 | |
| | | $ | 26,381,171 | | | $ | 76,593,808 | | |
During the tax year ended October 31, 2009, the Fund did not utilize any of the capital loss carryforwards.
It is uncertain whether the Fund will be able to realize the benefits of the capital loss carryforwards before they expire.
At October 31, 2009, the identified cost for federal income tax purposes, as well as the gross unrealized appreciation from investments for those securities having an excess of value over cost, gross unrealized depreciation from investments for those securities having an excess of cost over value and the net unrealized depreciation from investments were $2,448,184,161, $222,853,516, $(369,187,462) and $(146,333,946), respectively.
At October 31, 2009, the Fund reclassified $221,016 from accumulated net realized loss from investments to undistributed net investment income, to adjust for current period permanent book/tax differences. These permanent
30
Credit Suisse Commodity Return Strategy Fund
Notes to Financial Statements (continued)
October 31, 2009
Note 7. Federal Income Taxes
differences are due to differing book/tax treatments of defaulted bonds. Net assets were not affected by these reclassifications.
Note 8. Contingencies
In the normal course of business, the Fund may provide general indemnifications pursuant to certain contracts and organizational documents. The Fund's maximum exposure under these arrangements is dependent on future claims that may be made against the Fund and, therefore, cannot be estimated; however, based on experience, the risk of loss from such claims is considered remote.
Note 9. Subsequent Events
Effective October 31, 2009, the Fund adopted the FASB amendments to general standards on accounting for and disclosures of subsequent events. Management has evaluated the possibility of subsequent events existing in the Fund's financial statements through December 23, 2009. Management has determined that there are no material events that would require disclosure in the Fund's financial statements through this date.
31
Credit Suisse Commodity Return Strategy Fund
Report of Independent Registered Public Accounting Firm
To the Board of Trustees and Shareholders of
Credit Suisse Commodity Return Strategy Fund:
In our opinion, the accompanying statement of assets and liabilities, including the schedule of investments, and the related statements of operations and of changes in net assets and the financial highlights present fairly, in all material respects, the financial position of Credit Suisse Commodity Return Strategy Fund (the "Fund") at October 31, 2009, the results of its operations for the year then ended and the changes in its net assets and financial highlights for the periods presented, in conformity with accounting principles generally accepted in the United States of America. These financial statements and financial highlights (hereafter referred to as "financial statements") are the responsibility of the Fund's management. Our responsibility is to express an opinion on these financial statements based on our audit. We conducted our audit of these financial statements in accordance with the standards of the Public Company Accounting Ove rsight Board (United States). Those standards require that we plan and perform the audit to obtain reasonable assurance about whether the financial statements are free of material misstatement. An audit includes examining, on a test basis, evidence supporting the amounts and disclosures in the financial statements, assessing the accounting principles used and significant estimates made by management, and evaluating the overall financial statement presentation. We believe that our audit, which included confirmation of securities at October 31, 2009 by correspondence with the custodian and brokers, provides a reasonable basis for our opinion.
PricewaterhouseCoopers LLP
Boston, Massachusetts
December 23, 2009
32
Credit Suisse Commodity Return Strategy Fund
Information Concerning Trustees and Officers (unaudited)
Name, Address
(Year of Birth) | | Position(s)
Held with
Fund | | Term
of Office1
and
Length
of Time
Served | | Principal
Occupation(s) During
Past Five Years | | Number of
Portfolios in
Fund
Complex
Overseen by
Trustee | | Other
Directorships
Held by Trustee | |
| Independent Trustees | | | | | | | | | | | |
|
Enrique Arzac
c/o Credit Suisse Asset
Management, LLC
Attn: General Counsel
Eleven Madison Avenue
New York, New York
10010
(1941) | | Trustee,
Audit Committee Chairman and Nominating Committee Member | | Since 2005 | | Professor of Finance and Economics, Graduate School of Business, Columbia University since 1971. | | | 13 | | | Director of Epoch Holding Corporation (an investment management and investment advisory services company); Director of The Adams Express Company, Petroleum and Resources Corporation, The Chile Fund, Inc., The Indonesia Fund, Inc., The First Israel Fund, Inc., The Latin America Equity Fund, Inc. and The Emerging Markets Telecommunications Fund, Inc. (each a
closed-end investment company). | |
|
Jeffrey E. Garten
Box 208200
New Haven, Connecticut
06520-8200
(1946) | | Trustee,
Audit and Nominating Committee Member | | Since Fund Inception | | The Juan Trippe Professor in the Practice of International Trade, Finance and Business from July 2005 to present; Partner and Chairman of Garten Rothkopf (consulting firm) from October 2005 to present; Dean of Yale School of Management from November 1995 to June 2005. | | | 11 | | | Director of Aetna, Inc. (insurance company); Director of CarMax Group (used car dealers). | |
|
1 Each Trustee and Officer serves until his or her respective successor has been duly elected and qualified.
33
Credit Suisse Commodity Return Strategy Fund
Information Concerning Trustees and Officers (unaudited) (continued)
Name, Address
(Year of Birth) | | Position(s)
Held with
Fund | | Term
of Office1
and
Length
of Time
Served | | Principal
Occupation(s) During
Past Five Years | | Number of
Portfolios in
Fund
Complex
Overseen by
Trustee | | Other
Directorships
Held by Trustee | |
| Independent Trustees | | | | | | | | | | | |
|
Peter F. Krogh
SFS/ICC 702
Georgetown University
Washington, DC 20057
(1937) | | Trustee,
Audit and Nominating Committee Member | | Since Fund Inception | | Dean Emeritus and Distinguished Professor of International Affairs at the Edmund A. Walsh School of Foreign Service, Georgetown University from June 1995 to present. | | | 11 | | | Director of Carlisle Companies Incorporated (diversified manufacturing company). | |
|
Steven N. Rappaport
Lehigh Court, LLC
555 Madison Avenue
29th Floor
New York, New York
10022
(1948) | | Chairman of the Board of Trustees, Audit Committee Member and Nominating Committee Chairman | | Trustee since Fund Inception and Chairman since 2005 | | Partner of Lehigh Court, LLC and RZ Capital (private investment firms) from July 2002 to present. | | | 13 | | | Director of iCAD, Inc. (surgical and medical instruments and apparatus company); Director of Presstek, Inc. (digital imaging technologies company); Director of Wood Resources, LLC. (plywood manufacturing company); Director of The Chile Fund, Inc., The Indonesia Fund, Inc., The First Israel Fund, Inc., The Latin America Equity Fund, Inc. and The Emerging Markets Telecommunications Fund, Inc. (each a closed-end investment company). | |
|
34
Credit Suisse Commodity Return Strategy Fund
Information Concerning Trustees and Officers (unaudited) (continued)
Name, Address
(Year of Birth) | | Position(s)
Held with
Fund | | Term
of Office1
and
Length
of Time
Served | | Principal Occupation(s) During Past Five Years | |
| Officers** | | | | | | | |
|
George R. Hornig
Credit Suisse Asset
Management, LLC
Eleven Madison Avenue
New York, New York
10010
(1954) | | Chief Executive Officer and President | | Since 2008 | | Managing Director of Credit Suisse; Co-Chief Operating Officer of Asset Management and Head of Asset Management Americas; Associated with Credit Suisse since 1999; Officer of other Credit Suisse Funds. | |
|
Michael A. Pignataro
Credit Suisse Asset
Management, LLC
Eleven Madison Avenue
New York, New York
10010
(1959) | | Chief Financial Officer | | Since Fund Inception | | Director and Director of Fund Administration of Credit Suisse; Associated with Credit Suisse or its predecessor since 1984; Officer of other Credit Suisse Funds. | |
|
Emidio Morizio
Credit Suisse Asset
Management, LLC
Eleven Madison Avenue
New York, New York
10010
(1966) | | Chief Compliance Officer | | Since Fund Inception | | Director and Global Head of Compliance of Credit Suisse; Associated with Credit Suisse since July 2000; Officer of other Credit Suisse Funds. | |
|
J. Kevin Gao
Credit Suisse Asset
Management, LLC
Eleven Madison Avenue
New York, New York
10010
(1967) | | Chief Legal Officer since 2006, Vice President and Secretary since fund inception | | Since Fund Inception | | Director and Legal Counsel of Credit Suisse; Associated with Credit Suisse since July 2003; Officer of other Credit Suisse Funds. | |
|
Cecilia Chau
Credit Suisse Asset
Management, LLC
Eleven Madison Avenue
New York, New York
10010
(1973) | | Treasurer | | Since 2008 | | Vice President of Credit Suisse since 2009; Assistant Vice President of Credit Suisse from June 2007 to December 2008; Associated with Alliance Bernstein L.P. from January 2007 to May 2007; Associated with Credit Suisse from August 2000 to December 2006; Officer of other Credit Suisse Funds. | |
|
** The officers of the Fund shown are officers that make policy decisions.
The Statement of Additional Information includes additional information about the Trustees and is available, without charge, upon request, by calling 877-870-2874.
35
Credit Suisse Commodity Return Strategy Fund
Proxy Voting and Portfolio Holdings Information (unaudited)
Information regarding how the Fund voted proxies related to its portfolio securities during the 12 month period ended June 30 of each year, as well as the policies and procedures that the Fund uses to determine how to vote proxies relating to its portfolio securities are available:
• By calling 1-877-870-2874
• On the Fund's website, www.credit-suisse.com/us
• On the website of the Securities and Exchange Commission, www.sec.gov.
The Fund files a complete schedule of its portfolio holdings for the first and third quarters of its fiscal year with the SEC on Form N-Q. The Fund's Forms N-Q are available on the SEC's website at www.sec.gov and may be reviewed and copied at the SEC's Public Reference Room in Washington, DC. Information on the operation of the SEC's Public Reference Room may be obtained by calling 1-202-551-8090.
36

n CREDIT SUISSE
CAYMAN COMMODITY FUND I, LTD.
for the Year Ended October 31, 2009
37
Credit Suisse Cayman Commodity Fund I, Ltd.
Schedule of Investments
October 31, 2009
Par
(000) | |
| | Ratings†
(S&P/Moody's) | | Maturity | | Rate% | | Value | |
| UNITED STATES AGENCY OBLIGATIONS (82.4%) | |
| $ | 2,000 | | | Fannie Mae Discount Notes | | (AAA, Aaa) | | 12/01/09 | | | 0.270 | | | $ | 1,999,550 | | |
| | 11,000 | | | Fannie Mae Discount Notes | | (AAA, Aaa) | | 01/05/10 | | | 0.110 | | | | 10,999,516 | | |
| | 14,000 | | | Fannie Mae Discount Notes | | (AAA, Aaa) | | 01/06/10 | | | 0.300 | | | | 13,999,370 | | |
| | 4,000 | | | Fannie Mae Discount Notes | | (AAA, Aaa) | | 01/19/10 | | | 0.300 | | | | 3,999,784 | | |
| | 8,000 | | | Federal Farm Credit Bank# | | (AAA, Aaa) | | 06/22/11 | | | 0.295 | | | | 8,011,192 | | |
| | 14,000 | | | Federal Farm Credit Bank# | | (AAA, Aaa) | | 01/13/12 | | | 0.545 | | | | 14,090,538 | | |
| | 38,610 | | | Federal Home Loan Bank Discount Notes | | (AAA, Aaa) | | 11/02/09 | | | 0.026 | | | | 38,609,972 | | |
| | 10,000 | | | Federal Home Loan Bank Discount Notes | | (AAA, Aaa) | | 11/20/09 | | | 0.220 | | | | 9,998,839 | | |
| | 14,256 | | | Federal Home Loan Bank Discount Notes | | (AAA, Aaa) | | 12/18/09 | | | 0.148 | | | | 14,253,244 | | |
| | 1,146 | | | Federal Home Loan Bank Discount Notes | | (AAA, Aaa) | | 12/29/09 | | | 0.285 | | | | 1,145,474 | | |
| | 2,000 | | | Federal Home Loan Bank Discount Notes | | (AAA, Aaa) | | 01/07/10 | | | 0.340 | | | | 1,999,908 | | |
| | 11,000 | | | Federal Home Loan Banks | | (AAA, Aaa) | | 02/07/11 | | | 1.000 | | | | 11,040,590 | | |
| | 7,000 | | | Federal Home Loan Banks | | (AAA, Aaa) | | 02/28/11 | | | 1.000 | | | | 7,035,644 | | |
| | 2,000 | | | Federal Home Loan Mortgage Corp.# | | (AAA, Aaa) | | 01/14/11 | | | 0.264 | | | | 2,002,682 | | |
| | 10,000 | | | Federal Home Loan Mortgage Corp.# | | (AAA, Aaa) | | 03/09/11 | | | 0.379 | | | | 10,020,590 | | |
| | 5,000 | | | Federal Home Loan Mortgage Corp.# | | (AAA, Aaa) | | 04/01/11 | | | 0.350 | | | | 5,009,645 | | |
| | 5,000 | | | Federal Home Loan Mortgage Corp.# | | (AAA, Aaa) | | 06/17/11 | | | 0.393 | | | | 5,013,385 | | |
| | 22,000 | | | Freddie Mac Discount Notes | | (AAA, Aaa) | | 11/02/09 | | | 0.195 | | | | 21,999,881 | | |
| | 13,000 | | | Freddie Mac Discount Notes | | (AAA, Aaa) | | 11/09/09 | | | 0.210 | | | | 12,999,393 | | |
| | 6,400 | | | Freddie Mac Discount Notes | | (AAA, Aaa) | | 12/01/09 | | | 0.250 | | | | 6,398,667 | | |
| | 1,000 | | | Freddie Mac Discount Notes | | (AAA, Aaa) | | 12/14/09 | | | 0.275 | | | | 999,672 | | |
| | 2,250 | | | Freddie Mac Discount Notes | | (AAA, Aaa) | | 01/04/10 | | | 0.340 | | | | 2,249,901 | | |
| | 800 | | | Freddie Mac Discount Notes‡‡ | | (AAA, Aaa) | | 01/06/10 | | | 0.190 | | | | 799,964 | | |
| | 17,700 | | | Freddie Mac Discount Notes‡‡ | | (AAA, Aaa) | | 01/19/10 | | | 0.277 | | | | 17,699,044 | | |
| | 21,500 | | | Freddie Mac Discount Notes | | (AAA, Aaa) | | 01/20/10 | | | 0.223 | | | | 21,498,817 | | |
| | 13,500 | | | Freddie Mac Discount Notes | | (AAA, Aaa) | | 01/25/10 | | | 0.240 | | | | 13,499,217 | | |
| | 29,000 | | | Freddie Mac Discount Notes | | (AAA, Aaa) | | 01/28/10 | | | 0.115 | | | | 28,998,260 | | |
| | 15,000 | | | Freddie Mac Discount Notes | | (AAA, Aaa) | | 02/02/10 | | | 0.120 | | | | 14,997,885 | | |
| | 11,000 | | | Freddie Mac Discount Notes | | (AAA, Aaa) | | 02/16/10 | | | 0.130 | | | | 10,998,218 | | |
| | 4,062 | | | Freddie Mac Discount Notes | | (AAA, Aaa) | | 02/23/10 | | | 0.125 | | | | 4,061,297 | | |
| | 35,000 | | | Freddie Mac Discount Notes | | (AAA, Aaa) | | 02/25/10 | | | 0.115 | | | | 34,993,840 | | |
| | 18,300 | | | Freddie Mac Discount Notes | | (AAA, Aaa) | | 04/27/10 | | | 0.260 | | | | 18,291,509 | | |
| | 1,800 | | | Freddie Mac Discount Notes | | (AAA, Aaa) | | 05/17/10 | | | 0.430 | | | | 1,798,677 | | |
| TOTAL UNITED STATES AGENCY OBLIGATIONS (Cost $371,386,388) | | | 371,514,165 | | |
| UNITED STATES TREASURY OBLIGATIONS (7.5%) | | | |
| | 5,000 | | | United States Cash Management Bills | | (AAA, Aaa) | | 07/15/10 | | | 0.350 | | | | 4,991,960 | | |
| | 15,000 | | | United States Treasury Bills | | (AAA, Aaa) | | 02/11/10 | | | 0.255 | | | | 14,997,690 | | |
| | 14,000 | | | United States Treasury Bills | | (AAA, Aaa) | | 04/15/10 | | | 0.158 | | | | 13,990,746 | | |
| TOTAL UNITED STATES TREASURY OBLIGATIONS (Cost $33,966,612) | | | 33,980,396 | | |
See Accompanying Notes to Financial Statements.
38
Credit Suisse Cayman Commodity Fund I, Ltd.
Schedule of Investments (continued)
October 31, 2009
Par
(000) | |
| |
| | Maturity | | Rate% | | Value | |
| SHORT-TERM INVESTMENT (0.6%) | |
| $ | 2,479 | | | State Street Bank and Trust Co. Euro Time Deposit
(Cost $2,479,000) | | | | 11/02/09 | | | 0.010 | | | $ | 2,479,000 | | |
| TOTAL INVESTMENTS AT VALUE (90.5%) (Cost $407,832,000) | | | 407,973,561 | | |
| OTHER ASSETS IN EXCESS OF LIABILITIES (9.5%) | | | 42,834,717 | | |
| NET ASSETS (100.0%) | | $ | 450,808,278 | | |
† Credit ratings given by the Standard & Poor's Division of The McGraw-Hill Companies, Inc. ("S&P") and Moody's Investors Service, Inc. ("Moody's") are unaudited.
# Variable rate obligations — The interest rate is the rate as of October 31, 2009.
‡‡ Collateral segregated for futures contracts.
See Accompanying Notes to Financial Statements.
39
Credit Suisse Cayman Commodity Fund I, Ltd.
Statement of Assets and Liabilities
October 31, 2009
| Assets | |
| Investments at value (Cost $407,832,000) (Note 2) | | $ | 407,973,561 | | |
| Cash | | | 32 | | |
| Cash segregated at brokers for futures contracts and swap contracts | | | 94,934,072 | | |
| Receivable from investment adviser (Note 3) | | | 221,497 | | |
| Variation margin receivable (Note 2) | | | 163,830 | | |
| Interest receivable | | | 52,076 | | |
| Total Assets | | | 503,345,068 | | |
| Liabilities | |
| Administrative services fee payable (Note 3) | | | 30,194 | | |
| Unrealized depreciation on open swap contracts | | | 42,503,934 | | |
| Payable for investments purchased | | | 9,996,326 | | |
| Other accrued expenses payable | | | 6,336 | | |
| Total Liabilities | | | 52,536,790 | | |
| Net Assets | |
| Par value of participating shares (Note 4) | | | 128,930 | | |
| Paid-in capital (Note 4) | | | 495,271,070 | | |
| Undistributed net investment income | | | 2,714,874 | | |
| Accumulated net realized loss on investments, futures contracts and swap contracts | | | (5,273,179 | ) | |
| Net unrealized depreciation from investments, futures contracts and swap contracts | | | (42,033,417 | ) | |
| Net Assets | | $ | 450,808,278 | | |
| Shares outstanding | | | 128,930,400 | | |
| Net asset value, offering price and redemption price per share | | $ | 3.50 | | |
See Accompanying Notes to Financial Statements.
40
Credit Suisse Cayman Commodity Fund I, Ltd.
Statement of Operations
For the Year Ended October 31, 2009
| Investment Income (Note 2) | |
| Interest | | $ | 953,051 | | |
| Total investment income | | | 953,051 | | |
| Expenses | |
| Administrative services fees (Note 3) | | | 140,031 | | |
| Audit fees | | | 24,000 | | |
| Total expenses | | | 164,031 | | |
| Less: fees reimbursed (Note 3) | | | (164,031 | ) | |
| Net expenses | | | — | | |
| Net investment income | | | 953,051 | | |
| Net Realized and Unrealized Gain (Loss) from Investments, Futures Contracts and Swap Contracts | |
| Net realized gain from investments | | | 177,778 | | |
| Net realized loss from futures contracts | | | (25,605,109 | ) | |
| Net realized gain from swap contracts | | | 221,633,150 | | |
Net change in unrealized appreciation (depreciation) from investments, futures contracts
and swap contracts | | | (36,141,577 | ) | |
| Net realized and unrealized gain from investments, futures contracts and swap contracts | | | 160,064,242 | | |
| Net increase in net assets resulting from operations | | $ | 161,017,293 | | |
See Accompanying Notes to Financial Statements.
41
Credit Suisse Cayman Commodity Fund I, Ltd.
Statements of Changes in Net Assets
| | | For the Year
Ended
October 31, 2009 | | For the Year
Ended
October 31, 2008 | |
| From Operations | |
| Net investment income | | $ | 953,051 | | | $ | 1,751,100 | | |
Net realized gain (loss) from investments, futures contracts
and swap contracts | | | 196,205,819 | | | | (202,044,615 | ) | |
Net change in unrealized appreciation (depreciation)
from investments, futures contracts and swap contracts | | | (36,141,577 | ) | | | (6,122,615 | ) | |
| Net increase (decrease) in net assets resulting from operations | | | 161,017,293 | | | | (206,416,130 | ) | |
| From Capital Share Transactions (Note 4) | |
| Proceeds from sale of shares | | | 205,000,000 | | | | 359,000,008 | | |
| Net asset value of shares redeemed | | | (70,000,000 | ) | | | — | | |
| Net increase in net assets from capital share transactions | | | 135,000,000 | | | | 359,000,008 | | |
| Net increase in net assets | | | 296,017,293 | | | | 152,583,878 | | |
| Net Assets | |
| Beginning of year | | | 154,790,985 | | | | 2,207,107 | | |
End of year (including undistributed net investment income
of $2,714,874, and $1,761,823, respectively) | | $ | 450,808,278 | | | $ | 154,790,985 | | |
See Accompanying Notes to Financial Statements.
42
Credit Suisse Cayman Commodity Fund I, Ltd.
Notes to Financial Statements
October 31, 2009
Note 1. Organization
Credit Suisse Cayman Commodity Fund I, Ltd. (the "Fund") is organized as a Cayman Islands Company. The Fund intends to carry on the business of an investment company. The Fund's investment manager is Credit Suisse Asset Management, LLC ("Credit Suisse"). As of October 31, 2009, 100% of the Fund's participating shares were owned by Credit Suisse Commodity Return Strategy Fund.
Note 2. Significant Accounting Policies
A) SECURITY VALUATION — The net asset value of the Fund is determined daily as of the close of regular trading on the New York Stock Exchange, Inc. (the "Exchange") on each day the Exchange is open for business. Debt securities with a remaining maturity greater than 60 days are valued in accordance with the price supplied by a pricing service, which may use a matrix, formula or other objective method that takes into consideration market indices, yield curves and other specific adjustments. Debt obligations that will mature in 60 days or less are valued on the basis of amortized cost, which approximates market value, unless it is determined that using this method would not represent fair value. Equity investments are valued at market value, which is generally determined using the closing price on the exchange or market on which the security is primarily traded at the time of valuation (the "Valuation Time"). If no sales are reported, equ ity investments are generally valued at the most recent bid quotation as of the Valuation Time or at the lowest asked quotation in the case of a short sale of securities. Investments in mutual funds are valued at the mutual fund's closing net asset value per share on the day of valuation. Swap contracts are generally valued at a price at which the counterparty to such contract would repurchase the instrument or terminate the contract. Structured note agreements are valued in accordance with a dealer-supplied valuation based on changes in the value of the underlying index. Securities, options, futures contracts and other assets (including swaps and structured note agreements), for which market quotations are not readily available, or whose values have been materially affected by events occurring before the Fund's Valuation Time but after the close of the securities' primary markets, are valued at fair value as determined in good faith by, or under the direction of, the Board of Directors under procedures esta blished by the Board of Directors. The Fund may utilize a service provided by an independent third party which has been approved by the Board of Directors to fair value certain securities. When fair-value pricing is employed, the prices of securities used by
43
Credit Suisse Cayman Commodity Fund I, Ltd.
Notes to Financial Statements (continued)
October 31, 2009
Note 2. Significant Accounting Policies
a fund to calculate its net asset value may differ from quoted or published prices for the same securities.
In accordance with the authoritative guidance on fair value measurements and disclosures under accounting principles generally accepted in the United States of America ("GAAP"), the Fund discloses the fair value of its investments in a hierarchy that prioritizes the inputs to valuation techniques used to measure the fair value. In accordance with GAAP, fair value is defined as the price that the Fund would receive upon selling an investment in a timely transaction to an independent buyer in the principal or most advantageous market of the investment. GAAP established a three-tier hierarchy to maximize the use of observable market data and minimize the use of unobservable inputs and to establish classification of fair value measurements for disclosure purposes. Inputs refer broadly to the assumptions that market participants would use in pricing the asset or liability, including assumptions about risk, for example, the risk inherent in a part icular valuation technique used to measure fair value including such a pricing model and/or the risk inherent in the inputs to the valuation technique. Inputs may be observable or unobservable. Observable inputs are inputs that reflect the assumptions market participants would use in pricing the asset or liability developed based on market data obtained from sources independent of the reporting entity. Unobservable inputs are inputs that reflect the reporting entity's own assumptions about the assumptions market participants would use in pricing the asset or liability developed based on the best information available in the circumstances. The three-tier hierarchy of inputs is summarized in the three broad Levels listed below.
• Level 1 – quoted prices in active markets for identical investments
• Level 2 – other significant observable inputs (including quoted prices for similar investments, interest rates, prepayment speeds, credit risk, etc.)
• Level 3 – significant unobservable inputs (including the Fund's own assumptions in determining the fair value of investments)
The inputs or methodology used for valuing securities are not necessarily an indication of the risk associated with investing in those securities.
44
Credit Suisse Cayman Commodity Fund I, Ltd.
Notes to Financial Statements (continued)
October 31, 2009
Note 2. Significant Accounting Policies
The following is a summary of the inputs used as of October 31, 2009 in valuing the Fund's investments carried at value:
| | | Level 1 | | Level 2 | | Level 3 | | Total | |
| Investments in Securities | |
| United States Agency Obligations | | $ | — | | | $ | 371,514,165 | | | $ | — | | | $ | 371,514,165 | | |
| United States Treasury Obligations | | | — | | | | 33,980,396 | | | | — | | | | 33,980,396 | | |
| Short-Term Investment | | | — | | | | 2,479,000 | | | | — | | | | 2,479,000 | | |
| Other Financial Instruments* | |
| Futures | | | 328,956 | | | | — | | | | — | | | | 328,956 | | |
| Swaps | | | — | | | | (42,503,934 | ) | | | — | | | | (42,503,934 | ) | |
| | | $ | 328,956 | | | $ | 365,469,627 | | | | — | | | $ | 365,798,583 | | |
*Other financial instruments include futures, forwards and swap contracts.
B) DERIVATIVE INSTRUMENTS AND HEDGING ACTIVITIES — Effective October 31, 2009, the Fund adopted amendments to authoritative guidance on disclosures about derivative instruments and hedging activities which require that the Fund disclose (a) how and why an entity uses derivative instruments, (b) how derivative instruments and hedging activities are accounted for, and (c) how derivative instruments and related hedging activities affect a fund's financial position, financial performance, and cash flows.
Fair Values of Derivative Instruments as of October 31, 2009
| | | Asset Derivatives | | Liability Derivatives | |
| | | Balance Sheet
Location | | Fair Value | | Balance Sheet
Location | | Fair Value | |
Futures Contracts
on Commodities | | Variation margin receivable,
Net Assets - Unrealized
Appreciation | | $ | 328,956 | * | | Variation margin payable,
Liabilities - Unrealized
Depreciation | | $ | 0 | | |
Commodity Index
Swaps | | Net Assets - Unrealized
Appreciation | | | 0 | | | Liabilities - Unrealized
Depreciation | | | 42,503,934 | | |
| Total | | | | $ | 328,956 | | | | | $ | 42,503,934 | | |
*Includes cumulative appreciation/depreciation of futures contracts as reported in the Statement of Assets and Liabilities and Notes to Financial Statements. Only the current day's variation margin is reported within the Statement of Assets and Liabilities.
Effect of Derivative Instruments on the Statement of Operations
Amount of Realized Gain (Loss) on Derivatives Recognized in Income
Futures Contracts on Commodities | | $ | (25,605,109 | ) | |
| Commodity Index Swaps | | | 221,633,150 | | |
| Total | | $ | 196,028,041 | | |
Change in Unrealized Appreciation (Depreciation) on Derivatives Recognized in Income
Futures Contracts on Commodities | | $ | 26,941,777 | | |
| Commodity Index Swaps | | | (63,224,915 | ) | |
| Total | | $ | (36,283,138 | ) | |
45
Credit Suisse Cayman Commodity Fund I, Ltd.
Notes to Financial Statements (continued)
October 31, 2009
Note 2. Significant Accounting Policies
The notional amount of futures contracts and commodity index swaps at period end are reflected in the Notes to Financial Statements and the volume of these open positions relative to the net assets of the Fund is generally representative of open positions throughout the reporting period for the Fund.
C) SECURITY TRANSACTIONS AND INVESTMENT INCOME — Security transactions are accounted for on a trade date basis. Interest income is recorded on the accrual basis. The Fund amortizes premiums and accretes discounts using the effective interest method. Dividends are recorded on the ex-dividend date. The cost of investments sold is determined by use of the specific identification method for both financial reporting and income tax purposes.
D) INCOME TAXES — The Fund has received an undertaking from the Government of the Cayman Islands exempting it from all local income, profits and capital gains taxes through June of 2027. No such taxes are levied in the Cayman Islands at the present time. The Fund is a Controlled Foreign Corporation under U.S. tax laws and as such is not subject to U.S. income tax. Therefore, the Fund is not required to record a tax provision.
The Fund adopted the authoritative guidance for uncertainty in income taxes and recognizes a tax benefit from an uncertain position only if it is more likely than not that the position is sustainable based solely on its technical merits and consideration of the relevant taxing authority's widely understood administrative practices and procedures. The Fund has reviewed its current tax positions and has determined that no provision for income tax is required in the Fund's financial statements.
E) USE OF ESTIMATES — The preparation of financial statements in conformity with GAAP requires management to make estimates and assumptions that affect the reported amounts of assets and liabilities and disclose of contingent assets and liabilities at the date of the financial statements and the reported amounts of income and expenses during the reporting period. Actual results could differ from these estimates.
F) FUTURES — The Fund may enter into futures contracts to the extent permitted by its investment policies and objectives. The Fund may use futures contracts to gain exposure to, or hedge against changes in commodities. Upon entering into a futures contract, the Fund is required to deposit cash and/or pledge U.S. Government securities as initial margin. Subsequent payments, which are dependent on the daily fluctuations in the value of the underlying instrument, are made or received by the Fund each day (daily variation margin) and are recorded as unrealized gains or losses until the contracts are closed.
46
Credit Suisse Cayman Commodity Fund I, Ltd.
Notes to Financial Statements (continued)
October 31, 2009
Note 2. Significant Accounting Policies
When the contracts are closed, the Fund records a realized gain or loss equal to the difference between the proceeds from (or cost of) the closing transactions and the Fund's basis in the contract. Risks of entering into futures contracts for hedging purposes include the possibility that a change in the value of the contract may not correlate with the changes in the value of the underlying instruments. With futures, there is minimal counterparty credit risk to the Fund since futures are exchange traded and the exchange's clearinghouse, as counterparty to all exchange traded futures, guarantees the futures against default. In addition, the purchase of a futures contract involves the risk that the Fund could lose more than the original margin deposit and subsequent payments may be required for a futures transaction. At October 31, 2009, the Fund had the following open futures contracts:
| Contract Description | | Notional
Value | | Unrealized
Appreciation (Depreciation) | |
| Contracts to Purchase | | | | | |
| Energy | | | 4,877,000 | | | $ | (267,996 | ) | |
| | | $ | (267,996 | ) | |
| Contracts to Sell | | | | | |
| Energy | | | (4,877,000 | ) | | $ | 596,952 | | |
| | | $ | 596,952 | | |
| Net unrealized appreciation | | $ | 328,956 | | |
G) SWAPS — The Fund may enter into commodity index swaps for hedging purposes or to seek to increase total return. A swap is an agreement that obligates two parties to exchange a series of cash flows at specified intervals based upon or calculated by reference to changes in specified prices or rates for a specified amount of an underlying asset or notional principal amount. The Fund will enter into commodity index swaps only on a net basis, which means that the two payment streams are netted out, with the Fund receiving or paying, as the case may be, only the net amount of the two payments. Risks may arise as a result of the failure of the counterparty to the swap contract to comply with the terms of the swap contract. The Fund's maximum risk of loss from counterparty credit risk is the discontinued net value of the cash flows to be received from/paid to the counterparty over the contract's remaining life, to the extent that the amount is positive. This risk is mitigated by having a master netting arrangement between the Fund and the counterparty and by the posting of collateral by the counterparty to the Fund to cover the Fund's exposure to the counterparty. Therefore, the Fund considers the creditworthiness of each
47
Credit Suisse Cayman Commodity Fund I, Ltd.
Notes to Financial Statements (continued)
October 31, 2009
Note 2. Significant Accounting Policies
counterparty to a swap contract in evaluating potential credit risk. Additionally, risks may arise from unanticipated movements in interest rates or in the value of the underlying reference asset or index.
The Fund may enter into total return swap contracts, involving commitments to pay interest in exchange for a market-linked return, both based on notional amounts. To the extent the total return of the security or index underlying the transactions exceeds or falls short of the offsetting interest rate obligation, the Fund will receive a payment from or make a payment to the counterparty.
The Fund records unrealized gains or losses on a daily basis representing the value and the current net receivable or payable relating to open swap contracts. Net amounts received or paid on the swap contract are recorded as realized gains or losses. Fluctuations in the value of swap contracts are recorded for financial statement purposes as unrealized appreciation or depreciation on swap contracts. Realized gains and losses from terminated swaps are included in net realized gains/losses on swap contracts transactions. At October 31, 2009, the Fund had the following outstanding swap contracts:
| Currency | | Notional
Amount | | Expiration
Date | | Counterparty | | Receive | | Pay | | Unrealized
Appreciation/
(Depreciation) | |
| USD | | | | $ | 555,680,061 | | | 11/23/09 | | Barclays | | Commodity
Index Return | | Fee plus
Treasury Bill Rate | | $ | (12,759,470 | ) | |
| USD | | | | $ | 104,062,802 | | | 11/23/09 | | Barclays | | Commodity
Index Return | | Fee plus
Treasury Bill Rate | | | (2,526,765 | ) | |
| USD | | | | $ | 602,798,780 | | | 11/23/09 | | Bank of America | | Commodity
Index Return | | Fee plus
Treasury Bill Rate | | | (13,841,405 | ) | |
| USD | | | | $ | 14,983,159 | | | 11/23/09 | | Bank of America | | Commodity
Index Return | | Fee plus
Treasury Bill Rate | | | (363,726 | ) | |
| USD | | | | $ | 332,895,508 | | | 11/25/09 | | Societe Generale | | Commodity
Index Return | | Fee plus
Treasury Bill Rate | | | (7,639,536 | ) | |
| USD | | | | $ | 221,384,004 | | | 11/25/09 | | Societe Generale | | Commodity
Index Return | | Fee plus
Treasury Bill Rate | | | (5,373,032 | ) | |
| | | $ | (42,503,934 | ) | |
Note 3. Transactions with Affiliates and Related Parties
Credit Suisse recognizes that it receives compensation for performing investment advisory services for the Credit Suisse Commodity Return Strategy Fund pursuant to a separate investment advisory agreement and agrees to receive no additional compensation for rendering its services to the Fund. During the period ended October 31, 2009, Credit Suisse voluntarily reimbursed the Fund $164,031 in Fund expenses. Credit Suisse will not
48
Credit Suisse Cayman Commodity Fund I, Ltd.
Notes to Financial Statements (continued)
October 31, 2009
Note 3. Transactions with Affiliates and Related Parties
recapture from the Fund any fees it waived or expenses it reimbursed during the year ended October 31, 2009. Fee waivers and reimbursements are voluntary and may be discontinued by Credit Suisse at any time.
State Street Bank and Trust Company ("SSB") serves as administrator to the Fund. For its administrative services, SSB receives a fee, exclusive of out-of-pocket expenses, calculated in total for all the Credit Suisse funds/portfolios co-administered by SSB and allocated based upon the relative average net assets for each fund/portfolio, subject to an annual minimum fee. For the year ended October 31, 2009, administrative services fees earned by SSB were $140,031.
Note 4. Capital Share Transactions
The Fund issued 750,000 participating shares for $7,500,000 on September 27, 2007 in conjunction with the initial capitalization of the Fund. Capital transactions were as follows:
| | | For the Year Ended
October 31, 2009 | | For the Year Ended
October 31, 2008 | |
| | | Shares | | Value | | Shares | | Value | |
| Shares sold | | | 110,035,096 | | | $ | 205,000,000 | | | | 48,846,217 | | | $ | 359,000,008 | | |
| Shares redeemed | | | (30,111,148 | ) | | | (70,000,000 | ) | | | — | | | | — | | |
| Net Increase | | | 79,923,948 | | | $ | 135,000,000 | | | | 48,846,217 | | | $ | 359,000,008 | | |
Note 5. Financial Highlights
The following represents the total return of the Fund for the year ended October 31, 2009 and the year ended October 31, 2008, respectively. Total returns were calculated based upon the daily returns of the Fund during the periods represented.
| | | For the Year Ended
October 31, 2009 | | For the Year Ended
October 31, 2008 | |
| Total Return | | | 10.76 | % | | | (77.07 | )% | |
The following represents certain financial ratios of the Fund for the years noted. The computation of the net investment income and total expense ratios was based upon the daily net assets of the Fund during these years.
| | | For the Year Ended
October 31, 2009 | | For the Year Ended
October 31, 2008 | |
| Ratio to Average Net Assets: | |
| Net investment income | | | 0.37 | % | | | 2.24 | % | |
| Total expenses (before expense reimbursement) | | | 0.06 | % | | | 0.09 | % | |
| Total expenses (after expense reimbursement) | | | 0.00 | % | | | 0.00 | % | |
49
Credit Suisse Cayman Commodity Fund I, Ltd.
Notes to Financial Statements (continued)
October 31, 2009
Note 6. Contingencies
In the normal course of business, the Fund may provide general indemnifications pursuant to certain contracts and organizational documents. The Fund's maximum exposure under these arrangements is dependent on future claims that may be made against the Fund and, therefore, cannot be estimated; however, based on experience, the risk of loss from such claims is considered remote.
Note 7. Subsequent Events
Effective October 31, 2009, the Fund adopted the FASB amendments to general standards on accounting for and disclosures of subsequent events. Management has evaluated the possibility of subsequent events existing in the Fund's financial statements through December 23, 2009. Management has determined that there are no material events that would require disclosure in the Fund's financial statements through this date.
50
Credit Suisse Cayman Commodity Fund I, Ltd.
Report of Independent Registered Public Accounting Firm
To the Board of Directors and Shareholders of
Credit Suisse Cayman Commodity Fund I, Ltd:
In our opinion, the accompanying statement of assets and liabilities, including the schedule of investments, and the related statements of operations and of changes in net assets, present fairly, in all material respects, the financial position of Credit Suisse Cayman Commodity Fund I, Ltd. (the "Fund") at October 31, 2009, the results of its operations for the year then ended and the changes in its net assets for the periods presented, in conformity with accounting principles generally accepted in the United States of America. These financial statements (hereafter referred to as "financial statements") are the responsibility of the Fund's management. Our responsibility is to express an opinion on these financial statements based on our audit. We conducted our audit of these financial statements in accordance with the standards of the Public Company Accounting Oversight Board (United States). Those standards require that we plan and perform the audit to obtain reasonable assurance about whether the financial statements are free of material misstatement. An audit includes examining, on a test basis, evidence supporting the amounts and disclosures in the financial statements, assessing the accounting principles used and significant estimates made by management, and evaluating the overall financial statement presentation. We believe that our audit, which included confirmation of securities at October 31, 2009 by correspondence with the custodian and brokers, provides a reasonable basis for our opinion.
PricewaterhouseCoopers LLP
Boston, Massachusetts
December 23, 2009
51
This page intentionally left blank

P.O. BOX 55030, BOSTON, MA 02205-5030
877-870-2874 n www.credit-suisse.com/us
CREDIT SUISSE ASSET MANAGEMENT SECURITIES, INC., DISTRIBUTOR. COM-AR-1009
Item 2. Code of Ethics.
The registrant has adopted a code of ethics applicable to its Chief Executive Officer, President, Chief Financial Officer and Chief Accounting Officer, or persons performing similar functions. A copy of the code is filed as Exhibit 12(a)(1) to this Form. There were no amendments to the code during the fiscal year ended October 31, 2009. There were no waivers or implicit waivers from the code granted by the registrant during the fiscal year ended October 31, 2009.
Item 3. Audit Committee Financial Expert.
The registrant’s governing board has determined that it has two audit committee financial experts serving on its audit committee: Enrique R. Arzac and Steven N. Rappaport. Each audit committee financial expert is “independent” for purposes of this item.
Item 4. Principal Accountant Fees and Services.
(a) through (d). The information in the table below is provided for services rendered to the registrant by its independent registered public accounting firm, PricewaterhouseCoopers LLP (“PwC”), for its fiscal years ended October 31, 2008 and October 31, 2009.
| | 2008 | | 2009 | |
Audit Fees | | $ | 59,000 | | $ | 59,000 | |
Audit-Related Fees(1) | | $ | 3,400 | | $ | 3,400 | |
Tax Fees(2) | | $ | 3,400 | | $ | 2,800 | |
All Other Fees | | — | | — | |
Total | | $ | 65,800 | | $ | 65,200 | |
(1) Services include agreed-upon procedures in connection with the registrant’s semi-annual financial statements ($3,400 in 2008 and $3,400 in 2009).
(2) Tax services in connection with the registrant’s excise tax calculations and review of the registrant’s applicable tax returns.
The information in the table below is provided with respect to non-audit services that directly relate to the registrant’s operations and financial reporting and that were rendered by PwC to the registrant’s
3
investment adviser, Credit Suisse Asset Management, LLC (“Credit Suisse”), and any service provider to the registrant controlling, controlled by or under common control with Credit Suisse that provided ongoing services to the registrant (“Covered Services Provider”), for the registrant’s fiscal years ended October 31, 2008 and October 31, 2009.
| | 2008 | | 2009 | |
Audit-Related Fees | | N/A | | N/A | |
Tax Fees | | N/A | | N/A | |
All Other Fees | | N/A | | N/A | |
Total | | N/A | | N/A | |
(e)(1) Pre-Approval Policies and Procedures. The Audit Committee (“Committee”) of the registrant is responsible for pre-approving (i) all audit and permissible non-audit services to be provided by the independent registered public accounting firm to the registrant and (ii) all permissible non-audit services to be provided by the independent registered public accounting firm to Credit Suisse and any Covered Services Provider if the engagement relates directly to the operations and financial reporting of the registrant. The Committee may delegate its responsibility to pre-approve any such audit and permissible non-audit services to the Chairperson of the Committee, and the Chairperson shall report to the Committee, at its next regularly scheduled meeting after the Chairperson’s pre-approval of such services, his or her decision(s). The Committee may also establish detailed pre-approval policies and procedures for pre-approval of such services in accordance with applicable laws, including the delegation of some or all of the Committee’s pre-approval responsibilities to other persons (other than Credit Suisse or the registrant’s officers). Pre-approval by the Committee of any permissible non-audit services shall not be required so long as: (i) the aggregate amount of all such permissible non-audit services provided to the registrant, Credit Suisse and any Covered Services Provider constitutes not more than 5% of the total amount of revenues paid by the registrant to its independent registered public accounting firm during the fiscal year in which the permissible non-audit services are provided; (ii) the permissible non-audit services were not recognized by the registrant at the time of the engagement to be non-audit services; and (iii) such services are promptly brought to the attention of the Committee and approved by the Committee (or its delegate(s)) prior to the completion of the audit.
(e)(2) The information in the table below sets forth the percentages of fees for services (other than audit, review or attest services) rendered by PwC to the registrant for which the pre-approval requirement was waived pursuant to Rule 2-01(c)(7)(i)(C) of Regulation S-X:
4
| | 2008 | | 2009 | |
Audit-Related Fees | | N/A | | N/A | |
Tax Fees | | N/A | | N/A | |
All Other Fees | | N/A | | N/A | |
Total | | N/A | | N/A | |
The information in the table below sets forth the percentages of fees for services (other than audit, review or attest services) rendered by PwC to Credit Suisse and any Covered Services Provider required to be approved pursuant to Rule 2-01(c)(7)(ii) of Regulation S-X, for the registrant’s fiscal years ended October 31, 2008 and October 31, 2009:
| | 2008 | | 2009 | |
Audit-Related Fees | | N/A | | N/A | |
Tax Fees | | N/A | | N/A | |
All Other Fees | | N/A | | N/A | |
Total | | N/A | | N/A | |
(f) Not Applicable.
(g) The aggregate fees billed by PwC for non-audit services rendered to the registrant, Credit Suisse and Covered Service Providers for the fiscal years ended October 31, 2008 and October 31, 2009 were $6,800 and $6,200, respectively.
(h) Not Applicable.
Item 5. Audit Committee of Listed Registrants.
Form N-CSR disclosure requirement is not applicable to the registrant.
5
Item 6. Schedule of Investments.
Included as part of the report to shareholders filed under Item 1 of this Form.
Item 7. Disclosure of Proxy Voting Policies and Procedures for Closed-End Management Investment Companies.
Form N-CSR disclosure requirement is not applicable to the registrant.
Item 8. Portfolio Managers of Closed-End Management Investment Companies.
Form N-CSR disclosure requirement is not applicable to the registrant.
Item 9. Purchases of Equity Securities by Closed-End Management Investment Company and Affiliated Purchasers.
Form N-CSR disclosure requirement is not applicable to the registrant.
Item 10. Submission of Matters to a Vote of Security Holders.
None.
Item 11. Controls and Procedures.
(a) As of a date within 90 days from the filing date of this report, the principal executive officer and principal financial officer concluded that the registrant’s disclosure controls and procedures (as defined in Rule 30a-3(c) under the Investment Company Act of 1940 (the “Act”)) were effective based on their evaluation of the disclosure controls and procedures required by Rule 30a-3(b) under the Act and Rules 13a-15(b) or 15d-15(b) under the Securities Exchange Act of 1934.
(b) There were no changes in registrant’s internal control over financial reporting (as defined in Rule 30a-3(d) under the Act) that occurred during the second fiscal quarter of the period covered by this report that have materially affected, or are reasonably likely to materially affect, the registrant’s internal control over financial reporting.
Item 12. Exhibits.
(a)(1) Registrant’s Code of Ethics is an exhibit to this report.
(a)(2) The certifications of the registrant as required by Rule 30a-2(a) under the Act are exhibits to this report.
(a)(3) Not applicable.
6
(b) The certifications of the registrant as required by Rule 30a-2(b) under the Act are an exhibit to this report.
7
SIGNATURES
Pursuant to the requirements of the Securities Exchange Act of 1934 and the Investment Company Act of 1940, the registrant has duly caused this report to be signed on its behalf by the undersigned, thereunto duly authorized.
CREDIT SUISSE COMMODITY RETURN STRATEGY FUND |
| |
/s/ George R. Hornig | |
Name: George R. Hornig | |
Title: Chief Executive Officer | |
Date: January 4, 2010 | |
Pursuant to the requirements of the Securities Exchange Act of 1934 and the Investment Company Act of 1940, this report has been signed below by the following persons on behalf of the registrant and in the capacities and on the dates indicated.
/s/ George R. Hornig | |
Name: George R. Hornig | |
Title: Chief Executive Officer | |
Date: January 4, 2010 | |
| |
/s/ Michael A. Pignataro | |
Name: Michael A. Pignataro | |
Title: Chief Financial Officer | |
Date: January 4, 2010 | |
8