UNITED STATES
SECURITIES AND EXCHANGE COMMISSION
Washington, D.C. 20549
FORM N-CSR
CERTIFIED SHAREHOLDER REPORT OF REGISTERED
MANAGEMENT INVESTMENT COMPANIES
Investment Company Act file number | 811-21589 |
|
CREDIT SUISSE COMMODITY STRATEGY FUNDS |
(Exact name of registrant as specified in charter) |
|
One Madison Avenue, New York, New York | | 10010 |
(Address of principal executive offices) | | (Zip code) |
|
John G. Popp Credit Suisse Commodity Strategy Funds One Madison Avenue New York, New York 10010 |
(Name and address of agent for service) |
|
Registrant’s telephone number, including area code: | (212) 325-2000 | |
|
Date of fiscal year end: | October 31st | |
|
Date of reporting period: | November 1, 2012 to October 31, 2013 | |
| | | | | | | | | |
EXPLANATORY NOTE – The Registrant is filing this amendment to its Form N-CSR for the fiscal year ended October 31, 2013, originally filed with the Securities and Exchange Commission on January 7, 2014 (Accession Number 0001104659-14-000777) to include the Iran Related Activities Disclosure below. Other than the aforementioned revision, this Form N-CSR/A does not reflect events occurring after the filing of the original Form N-CSR, or modify or update the disclosures therein in any way.
Item 1. Reports to Stockholders.

CREDIT SUISSE FUNDS
Annual Report
October 31, 2013
n CREDIT SUISSE
COMMODITY ACCESS STRATEGY FUND
The Fund's investment objectives, risks, charges and expenses (which should be considered carefully before investing), and more complete information about the Fund, are provided in the Prospectus, which should be read carefully before investing. You may obtain additional copies by calling 877-870-2874 or by writing to Credit Suisse Funds, P.O. Box 55030, Boston, MA 02205-5030.
Credit Suisse Securities (USA) LLC, Distributor, is located at One Madison Avenue, New York, NY 10010. Credit Suisse Funds are advised by Credit Suisse Asset Management, LLC.
Investors in the Credit Suisse Funds should be aware that they may be eligible to purchase Class I shares (where offered) directly or through certain intermediaries. Such shares are not subject to a sales charge. Investors in the Credit Suisse Funds should also be aware that they may be eligible for a reduction or waiver of the sales charge with respect to Class A or C shares (where offered). For more information, please review the relevant prospectuses or consult your financial representative.
Fund shares are not deposits or other obligations of Credit Suisse Asset Management, LLC ("Credit Suisse") or any affiliate, are not FDIC-insured and are not guaranteed by Credit Suisse or any affiliate. Fund investments are subject to investment risks, including loss of your investment.
Credit Suisse Commodity ACCESS Strategy Fund
Annual Investment Adviser's Report
October 31, 2013 (unaudited)
December 24, 2013
Dear Shareholder:
We are pleased to present this Annual Report covering the activities of the Credit Suisse Commodity ACCESS Strategy Fund (the "Fund") for the annual period ended October 31, 2013.
Performance Summary
11/01/12 – 10/31/13
Fund & Benchmark | | Performance | |
| Class I1 | | | -1.06 | % | |
| Class A1,2 | | | -1.38 | % | |
| Class C1,2 | | | -2.13 | % | |
| Credit Suisse Commodity Benchmark Total Return3 | | | -1.62 | % | |
Performance shown for the Fund's Class A and Class C Shares does not reflect sales charges, which are a maximum of 4.75% and 1.00%, respectively.2
Market and Strategy Review: A mixed period for commodities
Commodities were lower for the annual period ended October 31, 2013. The Credit Suisse Commodity Benchmark Total Return Index lost 1.62%, with 23 out of 34 Index constituents trading lower.
The Credit Suisse Commodity Benchmark Total Return Index, the Fund's benchmark, is designed to be an investable, diversified benchmark for commodities as an asset class. The Index is an unmanaged index composed of (i) futures contracts on physical commodities within the following five commodity sectors: energy, industrial metals, precious metals, agriculture and livestock, and (ii) short maturity Treasury bills. The commodities represented in the Index are determined annually based on world production levels and global exchange market liquidity and the portion represented by each commodity sector and commodity within the sector will vary depending on market conditions. The Index is rebalanced monthly, which is intended to provide diversification across commodities and commodity sectors over time, but the Index, and thereby the Fund, could have large exposures to a single commodity or a small number of commodities at any particular time.
For the annual period ended October 31, 2013, the Fund underperformed the benchmark, net of fees and expenses. Positioning in the precious metals sector contributed positively to performance. Underweight positions in gold, silver and corn also contributed positively to performance, as did short positions in coffee, soybean oil, aluminum and an overweight to lean hogs.
1
Credit Suisse Commodity ACCESS Strategy Fund
Annual Investment Adviser's Report (continued)
October 31, 2013 (unaudited)
Agriculture was the worst performing sector, down 16.39%, with Arabica coffee declining the most, down 38.72% due to ample coffee supplies out of Brazil combined with a weak Brazilian Real and expectations of a record coffee crop out of Vietnam. Corn also ended the period lower, down 31.16%. Supply expectations increased throughout the period as reduced export demand, improved weather conditions in key South American producing regions, higher stocks, and larger-than-expected U.S. acreages planted weighed on Corn prices. Meanwhile, Cocoa gained 10.05% due to increased Western demand and weather related supply-side concerns out of Africa.
Precious Metals declined 14.86% on persistent worries over the U.S. Federal Reserve's plan to wind down its monetary stimulus program. The volatility in the U.S. dollar and sharp increase in interest rates also weighed on the sector. Additionally, silver declined 33.01%, as multiple iterations of upbeat data from the world's top economies suggested a global recovery was gaining traction over the period.
Although industrial metals ended the period 6.28% lower on concerns over Chinese growth, palladium was the best performing commodity in the index, up 19.66% on increased demand for catalytic converters used in automobile production.
Livestock increased 1.82% for the period, led by lean hogs. While lean hogs initially increased in late 2012 as a result of unexpected gains in pork prices during a time of typically sluggish demand, they continued to climb on the back of a lower USDA forecast for 2013 pork production amid already tight supplies and strong demand.
Energy was the best performing sector, up 6.41%. Crude oil and petroleum products led the sector higher as Middle East supply was curtailed due to both growing unrest in Egypt and Syria and continued production issues in Iraq and Libya. WTI crude oil gained 12.35% due to a sharp reduction in inventories in Cushing, Oklahoma, the delivery point for this contract. New transportation infrastructure helped to narrow the discount for WTI relative to Brent and other crude oil grades.
Outlook: As economy recovers, cautiously optimistic for the future
After 12 quarters of deceleration, global GDP growth appears to have accelerated. In August, new global manufacturing orders, as represented by the Purchasing Managers Index, reached the highest level since 2011. Traditionally, this tends to lead to global GDP growth.
2
Credit Suisse Commodity ACCESS Strategy Fund
Annual Investment Adviser's Report (continued)
October 31, 2013 (unaudited)
Additionally, for the past five years, the global economy and global markets have faced extraordinarily high levels of macroeconomic uncertainty as a function of the financial crisis, the deep global recession and the Euro-area crisis. Recently, however, the improvements in the global economy have led macroeconomic uncertainty to fall back to pre-crisis levels for the first time since the failure of Lehman Brothers in September 2008 (as reported by the University of Stanford's Economic Policy Uncertainty Index).
As the overall economies recover, attention has turned towards the actions of fiscal and monetary policy makers. We expect that the future of US fiscal policy will most likely hinge on whether or not the federal government can avert another shutdown in mid-January. Separately, the Federal Reserve has gone to great lengths to ensure the marketplace that it will err on the side of tightening too late rather than too early — as indicated when the October shutdown forced them to delay tapering despite telecasting it in the early summer.
While most are not currently concerned with inflation, it may materialize faster than expected should economic growth exceed expectations. We believe the possible acceleration in global growth and potential threat of higher than expected inflation may lead to improved commodity demand. Additionally, the trend in the reduction of economic uncertainty across the globe may help reduce cross-asset class correlations and improve the diversification benefits of commodities. Finally, we continue to expect supply-side fundamentals to play an increasing role in individual commodity returns.
The Credit Suisse Commodities Management Team
Nelson Louie
Christopher Burton
Timothy Boss
This Fund is non-diversified, which means it may invest a greater proportion of its assets in the securities of a smaller number of issuers than a diversified mutual fund and may therefore be subject to greater volatility. The Fund's investment in commodity-linked derivative instruments may subject the Fund to greater volatility than investment in traditional securities, particularly in investments involving leverage.
The use of derivatives such as commodity-linked structured notes, swaps and futures entails substantial risks, including risk of loss of a significant portion of their principal value, commodity exposure risks, correlation risk, liquidity risk, interest-rate risk, market risk, credit risk and tax risk. Gains and losses from speculative positions in derivatives
3
Credit Suisse Commodity ACCESS Strategy Fund
Annual Investment Adviser's Report (continued)
October 31, 2013 (unaudited)
may be much greater than the derivative's cost. At any time, the risk of loss of any individual security held by the Fund could be significantly higher than 50% of the security's value. For a detailed discussion of these and other risks, please refer to the Fund's Prospectus, which should be read carefully before investing.
In addition to historical information, this report contains forward-looking statements, which may concern, among other things, domestic and foreign market, industry and economic trends and developments and government regulation and their potential impact on the Fund's investments. These statements are subject to risks and uncertainties and actual trends, developments and regulations in the future, and their impact on the Fund could be materially different from those projected, anticipated or implied. The Fund has no obligation to update or revise forward-looking statements.
The views of the Fund's management are as of the date of the letter and the Fund holdings described in this document are as of October 31, 2013; these views and Fund holdings may have changed subsequent to these dates. Nothing in this document is a recommendation to purchase or sell securities.
4
Credit Suisse Commodity ACCESS Strategy Fund
Annual Investment Adviser's Report (continued)
October 31, 2013 (unaudited)
Comparison of Change in Value of $10,000 Investment in the
Credit Suisse Commodity ACCESS Strategy Fund1 Class I
shares, Class A shares2, Class C shares2 and the Credit Suisse
Commodity Benchmark Total Return Index3 from Inception (9/28/12).
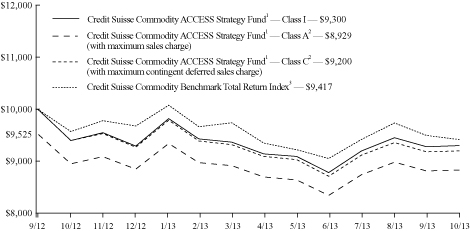
1 Fee waivers and/or expense reimbursements may reduce expenses for the Fund, without which performance would be lower.
2 Total return for the Fund's Class A shares for the reporting period, based on offering price (including maximum sales charge of 4.75%), was (6.08%). Total return for the Fund's Class C shares for the reporting period, based on redemption value (including maximum contingent deferred sales charge of 1.00%), was (3.11%).
3 Credit Suisse Commodity Benchmark Total Return Index is composed of futures contracts on five physical commodity asset classes and short term Treasury Bills. An index does not have transactions costs; investors may not invest directly in an index.
5
Credit Suisse Commodity ACCESS Strategy Fund
Annual Investment Adviser's Report (continued)
October 31, 2013 (unaudited)
Average Annual Returns as of October 31, 20131
| | | 1 Year | | Since
Inception2 | |
Class I | | | (1.06 | )% | | | (6.42 | )% | |
Class A Without Sales Charge | | | (1.38 | )% | | | (6.70 | )% | |
Class A With Maximum Sales Charge | | | (6.08 | )% | | | (10.77 | )% | |
Class C Without CDSC | | | (2.13 | )% | | | (7.34 | )% | |
Class C With CDSC | | | (3.11 | )% | | | (7.34 | )% | |
Returns represent past performance and include change in share price and reinvestment of dividends and capital gains. Past performance cannot guarantee future results. The current performance of the Fund may be lower or higher than the figures shown. Returns and share price will fluctuate, and redemption value may be more or less than original cost. The performance results do not reflect the deduction of taxes that a shareholder would pay on fund distributions or the redemption of fund shares. Performance information current to the most recent month-end is available at www.credit-suisse.com/us/funds.
The annualized gross expense ratios are 2.46% for Class I shares, 2.71% for Class A shares and 3.46% for Class C shares. The annualized net expense ratios after fee waivers and/or expense reimbursements are 0.90% for Class I shares, 1.15% for Class A shares and 1.90% for Class C shares.
1 Fee waivers and/or expense reimbursements may reduce expenses for the Fund, without which performance would be lower.
2 Inception Date September 28, 2012.
6
Credit Suisse Commodity ACCESS Strategy Fund
Annual Investment Adviser's Report (continued)
October 31, 2013 (unaudited)
Information About Your Fund's Expenses
As an investor of the Fund, you incur two types of costs: ongoing expenses and transaction costs. Ongoing expenses include management fees, distribution and service (12b-1) fees and other Fund expenses. Examples of transaction costs include sales charges (loads), redemption fees and account maintenance fees, which are not shown in this section and which would result in higher total expenses. The following table is intended to help you understand your ongoing expenses of investing in the Fund and to help you compare these expenses with the ongoing expenses of investing in other mutual funds. The table is based on an investment of $1,000 made at the beginning of the six month period ended October 31, 2013.
The table illustrates your Fund's expenses in two ways:
• Actual Fund Return. This helps you estimate the actual dollar amount of ongoing expenses paid on a $1,000 investment in the Fund using the Fund's actual return during the period. To estimate the expenses you paid over the period, simply divide your account value by $1,000 (for example, an $8,600 account value divided by $1,000 = 8.6), then multiply the result by the number in the "Expenses Paid per $1,000" line under the share class you hold.
• Hypothetical 5% Fund Return. This helps you to compare your Fund's ongoing expenses with those of other mutual funds using the Fund's actual expense ratio and a hypothetical rate of return of 5% per year before expenses. Examples using a 5% hypothetical fund return may be found in the shareholder reports of other mutual funds. The hypothetical account values and expenses may not be used to estimate the actual ending account balance or expenses you paid for the period.
Please note that the expenses shown in these tables are meant to highlight your ongoing expenses only and do not reflect any transaction costs, such as sales charges (loads) or redemption fees. If these transaction costs had been included, your costs would have been higher. The "Expenses Paid per $1,000" line of the tables is useful in comparing ongoing expenses only and will not help you determine the relative total expenses of owning different funds.
7
Credit Suisse Commodity ACCESS Strategy Fund
Annual Investment Adviser's Report (continued)
October 31, 2013 (unaudited)
Expenses and Value for a $1,000 Investment
for the six month period ended October 31, 2013
Actual Fund Return | | Class I | | Class A | | Class C | |
Beginning Account Value 05/01/13 | | $ | 1,000.00 | | | $ | 1,000.00 | | | $ | 1,000.00 | | |
Ending Account Value 10/31/13 | | $ | 1,017.50 | | | $ | 1,015.30 | | | $ | 1,012.10 | | |
Expenses Paid per $1,000* | | $ | 4.58 | | | $ | 5.84 | | | $ | 9.64 | | |
Hypothetical 5% Fund Return | |
Beginning Account Value 05/01/13 | | $ | 1,000.00 | | | $ | 1,000.00 | | | $ | 1,000.00 | | |
Ending Account Value 10/31/13 | | $ | 1,020.67 | | | $ | 1,019.41 | | | $ | 1,015.63 | | |
Expenses Paid per $1,000* | | $ | 4.58 | | | $ | 5.85 | | | $ | 9.65 | | |
| | | Class I | | Class A | | Class C | |
Annualized Expense Ratios* | | | 0.90 | % | | | 1.15 | % | | | 1.90 | % | |
* Expenses are equal to the Fund's annualized expense ratio for each share class, multiplied by the average account value over the period, multiplied by the number of days in the most recent fiscal half year period, then divided by 365.
The "Expenses Paid per $1,000" and the "Annualized Expense Ratios" in the tables are based on actual expenses paid by the Fund during the period, net of fee waivers and/or expense reimbursements. If those fee waivers and/or expense reimbursements had not been in effect, the Fund's actual expenses would have been higher.
For more information, please refer to the Fund's prospectus.
Sector Breakdown*
United States Agency Obligations | | | 79.98 | % | |
United States Treasury Obligations | | | 7.94 | % | |
Short-Term Investment | | | 12.08 | % | |
Total | | | 100.00 | % | |
* Expressed as a percentage of total investments (excluding securities lending collateral if applicable) and may vary over time.
8
Credit Suisse Commodity ACCESS Strategy Fund
Consolidated Schedule of Investments
October 31, 2013
Par
(000) | |
| | Ratings†
(S&P/Moody's) | | Maturity | | Rate% | | Value | |
| UNITED STATES AGENCY OBLIGATIONS (71.1%) | | | |
$ | 500 | | | Fannie Mae Discount Notes | | (AA+, Aaa) | | 01/21/14 | | | 0.099 | | | $ | 499,978 | | |
| | 1,000 | | | Fannie Mae Discount Notes | | (AA+, Aaa) | | 05/01/14 | | | 0.118 | | | | 999,698 | | |
| | 500 | | | Fannie Mae Discount Notes | | (AA+, Aaa) | | 06/02/14 | | | 0.099 | | | | 499,793 | | |
| | 1,000 | | | Federal Farm Credit Banks# | | (AA+, Aaa) | | 03/04/15 | | | 0.220 | | | | 1,001,881 | | |
| | 500 | | | Federal Farm Credit Banks# | | (AA+, Aaa) | | 05/05/15 | | | 0.220 | | | | 500,957 | | |
| | 500 | | | Federal Farm Credit Banks# | | (AA+, Aaa) | | 07/20/15 | | | 0.203 | | | | 500,668 | | |
| | 1,000 | | | Federal Farm Credit Banks# | | (AA+, Aaa) | | 08/03/15 | | | 0.280 | | | | 1,002,841 | | |
| | 400 | | | Federal Farm Credit Banks# | | (AA+, Aaa) | | 09/21/15 | | | 0.250 | | | | 400,387 | | |
| | 500 | | | Federal Farm Credit Banks# | | (AA+, Aaa) | | 01/19/16 | | | 0.183 | | | | 500,404 | | |
| | 300 | | | Federal Farm Credit Banks# | | (AA+, Aaa) | | 04/11/16 | | | 0.260 | | | | 300,174 | | |
| | 500 | | | Federal Farm Credit Banks# | | (AA+, Aaa) | | 04/19/16 | | | 0.263 | | | | 501,313 | | |
| | 300 | | | Federal Farm Credit Banks# | | (AA+, Aaa) | | 06/09/16 | | | 0.280 | | | | 300,252 | | |
| | 400 | | | Federal Farm Credit Banks# | | (AA+, Aaa) | | 07/20/16 | | | 0.280 | | | | 400,266 | | |
| | 300 | | | Federal Farm Credit Banks# | | (AA+, Aaa) | | 11/07/16 | | | 0.300 | | | | 300,214 | | |
| | 300 | | | Federal Home Loan Bank Discount Notes | | (AA+, Aaa) | | 01/10/14 | | | 0.120 | | | | 299,988 | | |
| | 500 | | | Federal Home Loan Banks | | (AA+, Aaa) | | 09/16/14 | | | 0.125 | | | | 499,913 | | |
| | 500 | | | Federal Home Loan Banks | | (AA+, Aaa) | | 10/15/14 | | | 0.230 | | | | 500,406 | | |
| | 300 | | | Federal Home Loan Banks | | (AA+, Aaa) | | 12/12/14 | | | 0.875 | | | | 302,393 | | |
| | 500 | | | Federal Home Loan Banks# | | (AA+, Aaa) | | 08/19/15 | | | 0.200 | | | | 500,063 | | |
| | 500 | | | Federal Home Loan Banks# | | (AA+, Aaa) | | 08/19/15 | | | 0.220 | | | | 500,242 | | |
| | 800 | | | Federal Home Loan Banks# | | (AA+, Aaa) | | 10/07/15 | | | 0.220 | | | | 800,292 | | |
| | 300 | | | Federal Home Loan Banks# | | (AA+, Aaa) | | 11/07/16 | | | 1.000 | | | | 300,304 | | |
| | 500 | | | Federal Home Loan Mortgage Corp. | | (AA+, Aaa) | | 07/30/14 | | | 1.000 | | | | 503,268 | | |
| | 500 | | | Federal Home Loan Mortgage Corp. | | (AA+, Aaa) | | 12/29/14 | | | 0.330 | | | | 500,809 | | |
| | 500 | | | Federal Home Loan Mortgage Corp. | | (AA+, Aaa) | | 01/02/15 | | | 0.305 | | | | 500,655 | | |
| | 500 | | | Federal Home Loan Mortgage Corp. | | (AA+, Aaa) | | 02/23/15 | | | 0.305 | | | | 500,594 | | |
| | 500 | | | Federal Home Loan Mortgage Corp. | | (AA+, Aaa) | | 04/29/15 | | | 0.320 | | | | 500,083 | | |
| | 200 | | | Federal Home Loan Mortgage Corp. | | (AA+, Aaa) | | 04/30/15 | | | 0.400 | | | | 200,101 | | |
| | 300 | | | Federal Home Loan Mortgage Corp. | | (AA+, Aaa) | | 09/18/15 | | | 0.550 | | | | 300,347 | | |
| | 500 | | | Federal National Mortgage Association# | | (AA+, Aaa) | | 06/23/14 | | | 0.360 | | | | 500,856 | | |
| | 400 | | | Federal National Mortgage Association | | (AA+, Aaa) | | 12/19/14 | | | 0.750 | | | | 402,584 | | |
| | 500 | | | Federal National Mortgage Association# | | (AA+, Aaa) | | 07/25/16 | | | 0.180 | | | | 500,221 | | |
| | 500 | | | Federal National Mortgage Association# | | (AA+, Aaa) | | 08/12/16 | | | 0.196 | | | | 500,330 | | |
| | 300 | | | Federal National Mortgage Association# | | (AA+, Aaa) | | 08/15/16 | | | 0.194 | | | | 300,196 | | |
| | 500 | | | Freddie Mac Discount Notes | | (AA+, Aaa) | | 04/24/14 | | | 0.100 | | | | 499,879 | | |
| TOTAL UNITED STATES AGENCY OBLIGATIONS (Cost $17,105,783) | | | 17,122,350 | | |
| UNITED STATES TREASURY OBLIGATIONS (7.1%) | | | |
| | 500 | | | United States Treasury Notes | | (AA+, Aaa) | | 01/31/15 | | | 0.250 | | | | 500,488 | | |
| | 500 | | | United States Treasury Notes | | (AA+, Aaa) | | 04/30/15 | | | 0.125 | | | | 499,317 | | |
| | 400 | | | United States Treasury Notes | | (AA+, Aaa) | | 07/15/15 | | | 0.250 | | | | 399,953 | | |
| | 300 | | | United States Treasury Notes | | (AA+, Aaa) | | 08/31/15 | | | 0.375 | | | | 300,539 | | |
| TOTAL UNITED STATES TREASURY OBLIGATIONS (Cost $1,697,464) | | | 1,700,297 | | |
See Accompanying Notes to Consolidated Financial Statements.
9
Credit Suisse Commodity ACCESS Strategy Fund
Consolidated Schedule of Investments (continued)
October 31, 2013
Par
(000) | |
| |
| | Maturity | | Rate% | | Value | |
| SHORT-TERM INVESTMENT (10.7%) | |
$ | 2,585 | | | State Street Bank and Trust Co. Euro Time Deposit
(Cost $2,585,000) | | | | 11/01/13 | | | 0.010 | | | $ | 2,585,000 | | |
| TOTAL INVESTMENTS AT VALUE (88.9%) (Cost $21,388,247) | | | 21,407,647 | | |
| OTHER ASSETS IN EXCESS OF LIABILITIES (11.1%) | | | 2,662,868 | | |
| NET ASSETS (100.0%) | | $ | 24,070,515 | | |
† Credit ratings given by the Standard & Poor's Division of The McGraw-Hill Companies, Inc. ("S&P") and Moody's Investors Service, Inc. ("Moody's") are unaudited.
# Variable rate obligations — The interest rate is the rate as of October 31, 2013.
See Accompanying Notes to Consolidated Financial Statements.
10
Credit Suisse Commodity ACCESS Strategy Fund
Consolidated Statement of Assets and Liabilities
October 31, 2013
Assets | |
Investments at value (Cost $21,388,247) (Note 2) | | $ | 21,407,647 | | |
Cash | | | 13,013 | | |
Cash segregated at brokers for futures contracts and swap contracts | | | 3,498,352 | | |
Variation margin receivable on futures contracts (Note 2) | | | 34,085 | | |
Receivable from investment adviser (Note 3) | | | 21,548 | | |
Interest receivable | | | 8,424 | | |
Receivable for fund shares sold | | | 5,000 | | |
Prepaid expenses and other assets | | | 16,392 | | |
Total Assets | | | 25,004,461 | | |
Liabilities | |
Administrative services fee payable (Note 3) | | | 7,366 | | |
Shareholder servicing/Distribution fee payable (Note 3) | | | 155 | | |
Payable for investments purchased | | | 599,977 | | |
Unrealized depreciation on open swap contracts (Note 2) | | | 239,756 | | |
Accrued expenses | | | 86,692 | | |
Total Liabilities | | | 933,946 | | |
Net Assets | |
Capital stock, $.001 par value (Note 6) | | | 2,589 | | |
Paid-in capital (Note 6) | | | 24,249,654 | | |
Accumulated net investment loss | | | (143,261 | ) | |
Accumulated net realized loss on investments, futures contracts and swap contracts | | | (24,241 | ) | |
Net unrealized depreciation from investments, futures contracts and swap contracts | | | (14,226 | ) | |
Net Assets | | $ | 24,070,515 | | |
I Shares | |
Net assets | | $ | 23,711,300 | | |
Shares outstanding | | | 2,550,489 | | |
Net asset value and offering price per share | | $ | 9.30 | | |
A Shares | |
Net assets | | $ | 237,458 | | |
Shares outstanding | | | 25,608 | | |
Net asset value and redemption price per share | | $ | 9.27 | | |
Maximum offering price per share (net asset value/(1-4.75%)) | | $ | 9.73 | | |
C Shares | |
Net assets | | $ | 121,757 | | |
Shares outstanding | | | 13,239 | | |
Net asset value, offering price and redemption price per share | | $ | 9.20 | | |
See Accompanying Notes to Consolidated Financial Statements.
11
Credit Suisse Commodity ACCESS Strategy Fund
Consolidated Statement of Operations
For the Year Ended October 31, 2013
| Investment Income (Note 2) | |
Interest | | $ | 49,973 | | |
Total investment income | | | 49,973 | | |
Expenses | |
Investment advisory fees (Note 3) | | | 185,861 | | |
Administrative services fees (Note 3) | | | 32,436 | | |
Shareholder servicing/Distribution fees (Note 3) | |
Class A | | | 405 | | |
Class C | | | 1,080 | | |
Offering costs (Note 3) | | | 105,985 | | |
Legal fees | | | 97,013 | | |
Audit and tax fees | | | 50,600 | | |
Trustees' fees | | | 24,997 | | |
Registration fees | | | 24,322 | | |
Printing fees (Note 3) | | | 17,696 | | |
Custodian fees | | | 11,665 | | |
Transfer agent fees (Note 3) | | | 8,299 | | |
Insurance expense | | | 1,100 | | |
Miscellaneous expense | | | 11,087 | | |
Total expenses | | | 572,546 | | |
Less: fees waived and expenses reimbursed (Note 3) | | | (361,968 | ) | |
Net expenses | | | 210,578 | | |
Net investment loss | | | (160,605 | ) | |
Net Realized and Unrealized Gain (Loss) from Investments, Futures Contracts and Swap Contracts | |
Net realized loss from investments | | | (24,175 | ) | |
Net realized gain from futures contracts | | | 600,710 | | |
Net realized loss from swap contracts | | | (824,464 | ) | |
Net change in unrealized appreciation (depreciation) from investments | | | 15,765 | | |
Net change in unrealized appreciation (depreciation) from futures contracts | | | 296,849 | | |
Net change in unrealized appreciation (depreciation) from swap contracts | | | (189,027 | ) | |
Net realized and unrealized loss from investments, futures contracts and swap contracts | | | (124,342 | ) | |
Net decrease in net assets resulting from operations | | $ | (284,947 | ) | |
See Accompanying Notes to Consolidated Financial Statements.
12
Credit Suisse Commodity ACCESS Strategy Fund
Consolidated Statement of Changes in Net Assets
| | | For the Year
Ended
October 31, 2013 | | For the Period
Ended
October 31, 20121 | |
From Operations | |
Net investment loss | | $ | (160,605 | ) | | $ | (14,419 | ) | |
Net realized loss from investments, futures contracts and swap contracts | | | (247,929 | ) | | | (1,189,625 | ) | |
Net change in unrealized appreciation (depreciation) from investments,
futures contracts and swap contracts | | | 123,587 | | | | (137,813 | ) | |
Net decrease in net assets resulting from operations | | | (284,947 | ) | | | (1,341,857 | ) | |
| From Capital Share Transactions (Note 6) | |
Proceeds from sale of shares | | | 3,144,796 | | | | 22,554,011 | | |
Net asset value of shares redeemed | | | (1,488 | ) | | | — | | |
Net increase in net assets from capital share transactions | | | 3,143,308 | | | | 22,554,011 | | |
Net increase in net assets | | | 2,858,361 | | | | 21,212,154 | | |
Net Assets | |
Beginning of year | | | 21,212,154 | | | | — | | |
End of year | | $ | 24,070,515 | | | $ | 21,212,154 | | |
Accumulated net investment loss | | $ | (143,261 | ) | | $ | — | | |
1 For the period September 28, 2012 (commencement of operations) through October 31, 2012.
See Accompanying Notes to Consolidated Financial Statements.
13
Credit Suisse Commodity ACCESS Strategy Fund
Consolidated Financial Highlights
(For a Class I Share of the Fund Outstanding Throughout Each Period)
| | | For the Year
Ended
October 31, 2013 | | For the Period
Ended
October 31, 20121 | |
Per share data | |
Net asset value, beginning of year | | $ | 9.40 | | | $ | 10.00 | | |
INVESTMENT OPERATIONS | |
Net investment loss2 | | | (0.06 | ) | | | (0.01 | ) | |
Net loss on investments, futures contracts and swap contracts
(both realized and unrealized) | | | (0.04 | ) | | | (0.59 | ) | |
Total from investment operations | | | (0.10 | ) | | | (0.60 | ) | |
Net asset value, end of year | | $ | 9.30 | | | $ | 9.40 | | |
Total return3 | | | (1.06 | )% | | | (6.00 | )% | |
RATIOS AND SUPPLEMENTAL DATA | |
Net assets, end of year (000s omitted) | | $ | 23,711 | | | $ | 21,020 | | |
Ratio of net expenses to average net assets | | | 0.90 | % | | | 0.90 | %4 | |
Ratio of net investment loss to average net assets | | | (0.69 | )% | | | (0.77 | )%4 | |
Decrease reflected in above operating expense ratios due to
waivers/reimbursements | | | 1.56 | % | | | 3.64 | %4 | |
Portfolio turnover rate | | | 79 | % | | | — | % | |
1 For the period September 28, 2012 (commencement of operations) through October 31, 2012.
2 Per share information is calculated using the average shares outstanding method.
3 Total returns are historical and assume changes in share price. Had certain expenses not been reduced during the years shown, total returns would have been lower. Total returns for periods less than one year are not annualized.
4 Annualized.
See Accompanying Notes to Consolidated Financial Statements.
14
Credit Suisse Commodity ACCESS Strategy Fund
Consolidated Financial Highlights
(For a Class A Share of the Fund Outstanding Throughout Each Period)
| | | For the Year
Ended
October 31, 2013 | | For the Period
Ended
October 31, 20121 | |
Per share data | |
Net asset value, beginning of year | | $ | 9.40 | | | $ | 10.00 | | |
INVESTMENT OPERATIONS | |
Net investment loss2 | | | (0.09 | ) | | | (0.01 | ) | |
Net loss on investments, futures contracts and swap contracts
(both realized and unrealized) | | | (0.04 | ) | | | (0.59 | ) | |
Total from investment operations | | | (0.13 | ) | | | (0.60 | ) | |
Net asset value, end of year | | $ | 9.27 | | | $ | 9.40 | | |
Total return3 | | | (1.38 | )% | | | (6.00 | )% | |
RATIOS AND SUPPLEMENTAL DATA | |
Net assets, end of year (000s omitted) | | $ | 237 | | | $ | 94 | | |
Ratio of net expenses to average net assets | | | 1.15 | % | | | 1.15 | %4 | |
Ratio of net investment loss to average net assets | | | (0.93 | )% | | | (1.02 | )%4 | |
Decrease reflected in above operating expense ratios due to
waivers/reimbursements | | | 1.56 | % | | | 3.64 | %4 | |
Portfolio turnover rate | | | 79 | % | | | — | % | |
1 For the period September 28, 2012 (commencement of operations) through October 31, 2012.
2 Per share information is calculated using the average shares outstanding method.
3 Total returns are historical and assume changes in share price and no sales charge. Had certain expenses not been reduced during the years shown, total returns would have been lower. Total returns for periods less than one year are not annualized.
4 Annualized.
See Accompanying Notes to Consolidated Financial Statements.
15
Credit Suisse Commodity ACCESS Strategy Fund
Consolidated Financial Highlights
(For a Class C Share of the Fund Outstanding Throughout Each Period)
| | For the Year
Ended
October 31, 2013 | | For the Period
Ended
October 31, 20121 | |
Per share data | |
Net asset value, beginning of year | | $ | 9.40 | | | $ | 10.00 | | |
INVESTMENT OPERATIONS | |
Net investment loss2 | | | (0.16 | ) | | | (0.01 | ) | |
Net loss on investments, futures contracts and swap contracts
(both realized and unrealized) | | | (0.04 | ) | | | (0.59 | ) | |
Total from investment operations | | | (0.20 | ) | | | (0.60 | ) | |
Net asset value, end of year | | $ | 9.20 | | | $ | 9.40 | | |
Total return3 | | | (2.13 | )% | | | (6.00 | )% | |
RATIOS AND SUPPLEMENTAL DATA | |
Net assets, end of year (000s omitted) | | $ | 122 | | | $ | 98 | | |
Ratio of net expenses to average net assets | | | 1.90 | % | | | 1.90 | %4 | |
Ratio of net investment loss to average net assets | | | (1.68 | )% | | | (1.77 | )%4 | |
Decrease reflected in above operating expense ratios due to
waivers/reimbursements | | | 1.56 | % | | | 3.64 | %4 | |
Portfolio turnover rate | | | 79 | % | | | — | % | |
1 For the period September 28, 2012 (commencement of operations) through October 31, 2012.
2 Per share information is calculated using the average shares outstanding method.
3 Total returns are historical and assume changes in share price and no sales charge. Had certain expenses not been reduced during the years shown, total returns would have been lower. Total returns for periods less than one year are not annualized.
4 Annualized.
See Accompanying Notes to Consolidated Financial Statements.
16
Credit Suisse Commodity ACCESS Strategy Fund
Notes to Consolidated Financial Statements
October 31, 2013
Credit Suisse Commodity ACCESS Strategy Fund (the "Fund"), a series of the Credit Suisse Commodity Strategy Funds (the "Trust"), a Delaware statutory trust, is registered under the Investment Company Act of 1940, as amended (the "1940 Act"), as a non-diversified open-end management investment company that seeks total return. The Trust was organized under the laws of the State of Delaware as a statutory trust on May 19, 2004. Effective September 20, 2012, the name of the Trust has changed from Credit Suisse Commodity Return Strategy Fund.
The Fund is registered as a Commodity Pool Operator with the Commodity Futures Trading Commission. The Fund intends to gain exposure to commodities derivatives through investing in a wholly-owned subsidiary, Credit Suisse Cayman Commodity ACCESS Strategy Fund I, Ltd., organized under the laws of the Cayman Islands (the "Subsidiary"). The Subsidiary invests in commodity-linked derivative instruments, such as swaps and futures. The Subsidiary may also invest in debt securities, some of which are intended to serve as margin or collateral for the Subsidiary's derivatives positions.
The Subsidiary is managed by the same portfolio managers that manage the Fund and the accompanying financial statements reflect the financial position of the Fund and its Subsidiary and the results of operations on a consolidated basis. The consolidated financial statements include portfolio holdings of the Fund and the Subsidiary and all intercompany transactions and balances have been eliminated. The Fund may invest up to 25% of its total net assets in the Subsidiary, as of October 31, 2013, the Fund held $5,385,973 in the Subsidiary, representing 22.4% of the Fund's net assets.
The Fund offers three classes of shares: Class I shares, Class A shares and Class C shares. Each class of shares represents an equal pro rata interest in the Fund, except they bear different expenses, which reflect the differences in the range of services provided to them. Class A shares are sold subject to a front-end sales charge of up to 4.75%. Class C shares are sold subject to a contingent deferred sales charge of 1.00% if the shares are redeemed within the first year of purchase.
Note 2. Significant Accounting Policies
The following is a summary of significant accounting policies followed by the Funds in the preparation of their financial statements. The policies are in accordance with accounting principles generally accepted in the United States
17
Credit Suisse Commodity ACCESS Strategy Fund
Notes to Consolidated Financial Statements (continued)
October 31, 2013
Note 2. Significant Accounting Policies
of America ("GAAP"). The preparation of financial statements requires management to make estimates and assumptions that affect the reported amounts and disclosures in the financial statements. Actual results could differ from those estimates.
A) SECURITY VALUATION — The net asset value of the Fund is determined daily as of the close of regular trading on the New York Stock Exchange, Inc. (the "Exchange") on each day the Exchange is open for business. The valuations for fixed income securities (which may include, but are not limited to, corporate, government, municipal, mortgage-backed, collateralized mortgage obligations and asset-backed securities) and certain derivative instruments are typically the prices supplied by independent third party pricing services, which may use market prices or broker/dealer quotations or a variety of valuation techniques and methodologies. The independent third party pricing services use inputs that are observable such as issuer details, interest rates, yield curves, prepayment speeds, credit risks/spreads, default rates and quoted prices for similar securities. Short-term fixed income securities that will mature in 60 days or less are valued at amortized cost unless it is determined that using this method would not reflect an investment's fair value. Structured note agreements are valued in accordance with a dealer-supplied valuation based on changes in the value of the underlying index. Futures contracts are valued daily at the settlement price established by the board of trade or exchange on which they are traded. Equity securities for which market quotations are available are valued at the last reported sales price or official closing price on the primary market or exchange on which they trade. The Fund may utilize a service provided by an independent third party which has been approved by the Board of Trustees to fair value certain securities. When fair value pricing is employed, the prices of securities used by the Fund to calculate its net asset value may differ from quoted or published prices for the same securities. If independent third party pricing services are unable to supply prices for a portfolio investment, or if the prices supplied are deemed by the investment adviser to be unreliable, the market price may be determined by the investment adviser using quotations from one or more broker/dealers or at the transaction price if the security has recently been purchased and no value has yet been obtained from a pricing service or pricing broker. When reliable prices are not readily available, such as when the value of a security has been significantly affected by events after the close of the exchange or market on which the security is principally traded, but before the Fund calculates its net asset value, the Fund values these securities as determined in accordance with procedures approved by the Fund's Board of Trustees.
18
Credit Suisse Commodity ACCESS Strategy Fund
Notes to Consolidated Financial Statements (continued)
October 31, 2013
Note 2. Significant Accounting Policies
The Fund uses valuation techniques to measure fair value that are consistent with the market approach and/or income approach, depending on the type of security and the particular circumstance. The market approach uses prices and other relevant information generated by market transactions involving identical or comparable securities. The income approach uses valuation techniques to discount estimated future cash flows to present value.
GAAP established a disclosure hierarchy that categorizes the inputs to valuation techniques used to value assets and liabilities at measurement date. These inputs are summarized in the three broad levels listed below:
• Level 1 – quoted prices in active markets for identical investments
• Level 2 – other significant observable inputs (including quoted prices for similar investments, interest rates, prepayment speeds, credit risk, etc.)
• Level 3 – significant unobservable inputs (including the Fund's own assumptions in determining the fair value of investments)
The inputs or methodologies used to value securities are not necessarily an indication of the risk associated with investing in those securities.
The following is a summary of the inputs used as of October 31, 2013 in valuing the Fund's assets and liabilities carried at fair value:
| | | Level 1 | | Level 2 | | Level 3 | | Total | |
Investments in Securities | |
United States Agency Obligations | | $ | — | | | $ | 17,122,350 | | | $ | — | | | $ | 17,122,350 | | |
United States Treasury Obligations | | | — | | | | 1,700,297 | | | | — | | | | 1,700,297 | | |
Short-Term Investment | | | — | | | | 2,585,000 | | | | — | | | | 2,585,000 | | |
Other Financial Instruments* | |
Futures Contracts | | | 206,130 | | | | — | | | | — | | | | 206,130 | | |
Swap Contracts | | | — | | | | (239,756 | ) | | | — | | | | (239,756 | ) | |
| | | $ | 206,130 | | | $ | 21,167,891 | | | $ | — | | | $ | 21,374,021 | | |
*Other financial instruments include futures and swap contracts.
The Fund adopted Financial Accounting Standards Board ("FASB") amendments to authoritative guidance which require the Fund to disclose details of transfers in and out of Level 1 and Level 2 measurements and Level 2 and Level 3 measurements and the reasons for the transfers. For the year ended October 31, 2013, there were no transfers in and out of Level 1, Level 2 and Level 3. All transfers are assumed to occur at the end of the reporting period.
B) DERIVATIVE INSTRUMENTS AND HEDGING ACTIVITIES — The Fund adopted amendments to authoritative guidance on disclosures about
19
Credit Suisse Commodity ACCESS Strategy Fund
Notes to Consolidated Financial Statements (continued)
October 31, 2013
Note 2. Significant Accounting Policies
derivative instruments and hedging activities which require that the Fund disclose (a) how and why an entity uses derivative instruments, (b) how derivative instruments and hedging activities are accounted for, and (c) how derivative instruments and related hedging activities affect a fund's financial position, financial performance, and cash flows. The Fund has not entered into any derivative or hedging activities during the period covered by this report. However, the Fund does invest indirectly in derivative instruments through the Subsidiary.
Fair Values of Derivative Instruments as of October 31, 2013
| | | Asset Derivatives | | Liability Derivatives | |
| | | Balance Sheet
Location | | Fair Value | | Balance Sheet
Location | | Fair Value | |
Commodity Index
Return Contracts | | Unrealized appreciation
on futures contracts | | $ | 402,267 | * | | Unrealized depreciation
on futures contracts | | $ | 196,137 | * | |
| | | Unrealized appreciation
on open swap contracts | | | — | | | Unrealized depreciation
on open swap contracts | | | 239,756 | | |
| | | | | $ | 402,267 | | | | | | | $ | 435,893 | | |
*Includes cumulative appreciation/depreciation of futures contracts as reported in the Consolidated Statement of Assets and Liabilities and Notes to Consolidated Financial Statements. Only the current day's variation margin is reported within the Consolidated Statement of Assets and Liabilities.
Effect of Derivative Instruments on the Consolidated Statement of Operations
| | | Location | | Realized
Gain/Loss | | Location | | Net Unrealized
Appreciation/
Depreciation | |
Commodity Index
Return Contracts
| | Net realized gain
from futures
contracts | | $ | 600,710 | | | Net change in unrealized
appreciation (depreciation) from
futures contracts | | $ | 296,849 | | |
| | | Net realized loss
from swap
contracts | | | (824,464 | ) | | Net change in unrealized
appreciation (depreciation) from
swap contracts | | | (189,027 | ) | |
| | | | | $ | (223,754 | ) | | | | | | $ | 107,822 | | |
The notional amount of futures contracts and swap contracts at year ended October 31, 2013 are reflected in the Notes to Consolidated Financial Statements. The notional amounts of long and short open positions of futures contracts and swap contracts at each month ended throughout the reporting period averaged approximately 72.9% and 138%, respectively of net assets of the Fund.
C) SECURITY TRANSACTIONS AND INVESTMENT INCOME/EXPENSE — Security transactions are accounted for on a trade date basis. Interest income/expense is recorded on the accrual basis. The Fund amortizes
20
Credit Suisse Commodity ACCESS Strategy Fund
Notes to Consolidated Financial Statements (continued)
October 31, 2013
Note 2. Significant Accounting Policies
premiums and accretes discounts using the effective interest method. Dividend income/expense is recorded on the ex-dividend date. Certain expenses are class-specific expenses, vary by class and are charged only to that class. Income, expenses (excluding class-specific expenses) and realized/unrealized gains/losses are allocated proportionately to each class of shares based upon the relative net asset value of the outstanding shares of that class. The cost of investments sold is determined by use of the specific identification method for both financial reporting and income tax purposes.
D) DIVIDENDS AND DISTRIBUTIONS TO SHAREHOLDERS — Dividends from net investment income, if any, are declared and paid quarterly. Distributions of net realized capital gains, if any, are declared and paid at least annually. However, to the extent that a net realized capital gain can be reduced by a capital loss carryforward, such gain will not be distributed. Income and capital gain distributions are determined in accordance with federal income tax regulations, which may differ from GAAP.
E) FEDERAL INCOME TAXES — No provision is made for federal taxes as it is the Fund's intention to continue to qualify for and elect the tax treatment applicable to regulated investment companies ("RIC") under the Internal Revenue Code of 1986, as amended (the "Code"), and to make the requisite distributions to its shareholders, which will be sufficient to relieve it from federal income and excise taxes.
In order to qualify as a RIC under the Code, the Fund must meet certain requirements regarding the source of its income, the diversification of its assets and the distribution of its income. One of these requirements is that the Fund derive at least 90% of its gross income for each taxable year from dividends, interest, payments with respect to certain securities loans, gains from the sale or other disposition of stock, securities or foreign currencies, other income derived with respect to its business of investing in such stock, securities or currencies or net income derived from interests in certain publicly traded partnerships ("Qualifying Income"). The IRS has issued a ruling that income realized from certain types of commodity-linked derivatives would not be Qualifying Income. As a result, the Fund's ability to realize income from investments in such commodity-linked derivatives as part of its investment strategy would be limited to a maximum of 10% of its gross income. The IRS has issued private letter rulings to registered investment companies concluding that income derived from their investment in a wholly-owned subsidiary would constitute Qualifying Income to the fund. The IRS has indicated that
21
Credit Suisse Commodity ACCESS Strategy Fund
Notes to Consolidated Financial Statements (continued)
October 31, 2013
Note 2. Significant Accounting Policies
the granting of these types of private letter rulings is currently suspended, pending further internal discussion. As a result, the Fund has not received and there can be no assurance that the IRS will grant, such a private letter ruling to the Fund. If the Fund does not request and receive such a private letter ruling, there is a risk that the IRS could assert that the income derived from the Fund's investment in the Subsidiary will not be considered Qualifying Income for purposes of the fund remaining qualified as a RIC for U.S. federal income tax purposes. If the Fund is unable to ensure continued qualification as a RIC, the Fund may be required to change its investment objective, policies or techniques, or may be liquidated. If the Fund fails to qualify as a RIC, the Fund will be subject to federal income tax on its net income and capital gains at regular corporate rates (without reduction for distributions to shareholders). If the Fund were to fail to qualify as a RIC and become subject to federal income tax, shareholders of the Fund would be subject to the risk of diminished returns.
The Fund adopted the authoritative guidance for uncertainty in income taxes and recognizes a tax benefit or liability from an uncertain position only if it is more likely than not that the position is sustainable based solely on its technical merits and consideration of the relevant taxing authority's widely understood administrative practices and procedures. The Fund has reviewed its current tax positions and has determined that no provision for income tax is required in the Fund's financial statements. The Fund's federal tax returns for the prior fiscal year remain subject to examination by the Internal Revenue Service.
F) SHORT-TERM INVESTMENTS — The Fund, together with other funds/portfolios advised by Credit Suisse Asset Management, LLC ("Credit Suisse"), an indirect, wholly-owned subsidiary of Credit Suisse Group AG, pools available cash into a short-term variable rate time deposit issued by State Street Bank and Trust Company ("SSB"), the Fund's custodian. The short-term time deposit issued by SSB is a variable rate account classified as a short-term investment.
G) FUTURES — The Fund may enter into futures contracts to the extent permitted by its investment policies and objectives. The Fund may use futures contracts to gain exposure to, or hedge against changes in commodities. Upon entering into a futures contract, the Fund is required to deposit cash and/or pledge U.S. Government securities as initial margin. Subsequent payments, which are dependent on the daily fluctuations in the value of the underlying instrument, are made or received by the Fund each day (daily variation margin) and are recorded as unrealized gains or losses until the contracts are closed.
22
Credit Suisse Commodity ACCESS Strategy Fund
Notes to Consolidated Financial Statements (continued)
October 31, 2013
Note 2. Significant Accounting Policies
When the contracts are closed, the Fund records a realized gain or loss equal to the difference between the proceeds from (or cost of) the closing transactions and the Fund's basis in the contract. Risks of entering into futures contracts for hedging purposes include the possibility that a change in the value of the contract may not correlate with the changes in the value of the underlying instruments. With futures, there is minimal counterparty credit risk to the Fund since futures are exchange traded and the exchange's clearinghouse, as counterparty to all exchange traded futures, guarantees the futures against default. In addition, the purchase of a futures contract involves the risk that the Fund could lose more than the original margin deposit and subsequent payments may be required for a futures transaction. At October 31, 2013, the Fund had the following open futures contracts and the amount of restricted cash held at brokers was $988,352:
Contract Description | | Currency | | Expiration
Date | | Notional
Value | | Net Unrealized
Appreciation/
(Depreciation) | |
Contracts to Purchase | |
Energy | |
| | | USD | | | | Jan 2014 | | $ | 1,412,190 | | | $ | (9,639 | ) | |
| | | USD | | | | Feb 2014 | | | 193,320 | | | | (7,803 | ) | |
| | | USD | | | | Mar 2014 | | | 3,569,390 | | | | 12,237 | | |
| | | USD | | | | Apr 2014 | | | 763,350 | | | | (127,546 | ) | |
| | | USD | | | | Dec 2014 | | | 3,946,110 | | | | (1,106 | ) | |
| | | | | | | | | $ | (133,857 | ) | |
Industrial Metal | |
| | | USD | | | | Dec 2013 | | | 546,675 | | | $ | (4,335 | ) | |
Livestock | |
| | | USD | | | | Jan 2014 | | | 654,700 | | | $ | (9,020 | ) | |
Contracts to Sell | |
Energy | |
| | | USD | | | | Dec 2013 | | | (2,023,980 | ) | | $ | 122,830 | | |
| | | USD | | | | Jan 2014 | | | (2,126,300 | ) | | | 40,478 | | |
| | | USD | | | | Jan 2014 | | | (1,157,500 | ) | | | 22,480 | | |
| | | USD | | | | Mar 2014 | | | (3,983,790 | ) | | | (10,583 | ) | |
| | | USD | | | | Mar 2014 | | | (768,180 | ) | | | 204,242 | | |
| | | | | | | | | $ | 379,447 | | |
Livestock | |
| | | USD | | | | Feb 2014 | | | (957,060 | ) | | $ | (26,105 | ) | |
Net unrealized appreciation (depreciation) | | $ | 206,130 | | |
H) SWAPS — The Fund may enter into commodity index swap contracts either for hedging purposes or to seek to increase total return. A swap contract is an agreement that obligates two parties to exchange a series of cash flows at specified intervals based upon or calculated by reference to changes in specified
23
Credit Suisse Commodity ACCESS Strategy Fund
Notes to Consolidated Financial Statements (continued)
October 31, 2013
Note 2. Significant Accounting Policies
prices or rates for a specified amount of an underlying asset or notional principal amount. The Fund will enter into swap contracts only on a net basis, which means that the two payment streams are netted out, with the Fund receiving or paying, as the case may be, only the net amount of the two payments. Risks may arise as a result of the failure of the counterparty to the swap contract to comply with the terms of the swap contract. The extent of the Fund's exposure to credit and counterparty risks is the discounted net value of the cash flows to be received from/paid to the counterparty over the contract's remaining life, to the extent that the amount is positive. These risks are mitigated by having a master netting arrangement between the Fund and the counterparty and by the posting of collateral by the counterparty to the Fund to cover the Fund's exposure to the counterparty. Therefore, the Fund considers the creditworthiness of each counterparty to a swap contract in evaluating potential credit risk. Additionally, risks may arise from unanticipated movements in interest rates or in the value of the underlying reference asset or index.
The Fund may enter into total return swap contracts, involving commitments to pay interest in exchange for a market-linked return, both based on notional amounts. To the extent the total return of the security or index underlying the transactions exceeds or falls short of the offsetting interest rate obligation, the Fund will receive a payment from or make a payment to the counterparty.
The Fund records unrealized gains or losses on a daily basis representing the value and the current net receivable or payable relating to open swap contracts. Net amounts received or paid on the swap contract are recorded as realized gains or losses. Fluctuations in the value of swap contracts are recorded for financial statement purposes as unrealized appreciation or depreciation on swap contracts. Realized gains and losses from terminated swaps are included in net realized gains/losses on swap contracts transactions. At October 31, 2013, the Fund had the following outstanding swap contracts and the amount of restricted cash held at brokers was $2,510,000:
Currency | | Notional
Amount | | Expiration
Date | | Counterparty | | Receive | | Pay | | Net Unrealized
Appreciation/
(Depreciation) | |
USD |
| | | $ | 4,546,655
| | | 11/22/13
| | Barclays
| | Commodity Index
Return1 | | Fee Plus Treasury
Bill Rate | | $ | (34,999
| ) | |
USD |
| | | $ | 5,000,000
| | | 11/01/13
| | Goldman Sachs
| | Commodity Index
Return1 | | Fee Plus Treasury
Bill Rate | | | (29,244
| ) | |
USD |
| | | $ | 7,170,965
| | | 11/22/13
| | Goldman Sachs
| | Commodity Index
Return1 | | Fee Plus Treasury
Bill Rate | | | (55,177
| ) | |
24
Credit Suisse Commodity ACCESS Strategy Fund
Notes to Consolidated Financial Statements (continued)
October 31, 2013
Note 2. Significant Accounting Policies
Currency | | Notional
Amount | | Expiration
Date | | Counterparty | | Receive | | Pay | | Net Unrealized
Appreciation/
(Depreciation) | |
USD |
| | | $ | 4,744,664
| | | 11/22/13
| | JPMorgan Chase
| | Commodity Index
Return1 | | Fee Plus Treasury
Bill Rate | | $ | (36,518
| ) | |
USD |
| | | $ | 11,524,700
| | | 11/01/13
| | UBS
| | Commodity Index
Return1 | | Fee Plus Treasury
Bill Rate | | | (83,818
| ) | |
| | | | | | | | | | | | | | | $ | (239,756 | ) | |
1 The Commodity Index Return is comprised of futures contracts on physical commodities.
I) SECURITIES LENDING — Loans of securities are required at all times to be secured by collateral at least equal to 102% of the market value of domestic securities on loan (including any accrued interest thereon) and 105% of the market value of foreign securities on loan (including any accrued interest thereon). Cash collateral received by the Fund in connection with securities lending activity may be pooled together with cash collateral for other funds/portfolios advised by Credit Suisse and may be invested in a variety of investments, including funds advised by SSB, the Fund's securities lending agent, or money market instruments. However, in the event of default or bankruptcy by the other party to the agreement, realization and/or retention of the collateral may be subject to legal proceedings.
SSB has been engaged by the Fund to act as the Fund's securities lending agent. The Fund's securities lending arrangement provides that the Fund and SSB will share the net income earned from securities lending activities. During the year ended October 31, 2013, there were no securities out on loan. Securities lending income is accrued as earned.
J) OTHER — In the normal course of business the Fund trades financial instruments and enters into financial transactions where risk of potential loss exists due to changes in the market (market risk) or failure of the other party to a transaction to perform (credit risk). Similar to credit risk, the Fund may be exposed to counterparty risk, or the risk that an institution or other entity with which the Fund has unsettled or open transactions will default. The potential loss could exceed the value of the financial assets recorded in the financial statements. Financial assets, which potentially expose the Fund to credit risk, consist principally of cash due from counterparties and investments. The extent of the Fund's exposure to credit and counterparty risks in respect to these financial assets approximates their carrying value as recorded in the Fund's Consolidated Statement of Assets and Liabilities.
K) NEW ACCOUNTING PRONOUNCEMENTS — In December 2011, the Financial Accounting Standards Board issued Accounting Standards Update
25
Credit Suisse Commodity ACCESS Strategy Fund
Notes to Consolidated Financial Statements (continued)
October 31, 2013
Note 2. Significant Accounting Policies
(ASU) No. 2013-1, Balance Sheet (Topic 210): Disclosures about Offsetting Assets and Liabilities. The amendments in the ASU enhance disclosures about offsetting of financial assets and liabilities to enable investors to understand the effect of these arrangements on a fund's financial position. The ASU is effective for interim and annual reporting periods beginning on or after January 1, 2013. The Fund believes the adoption of this ASU will not have a material impact on its financial statements.
L) SUBSEQUENT EVENTS — In preparing the financial statements as of October 31, 2013, management considered the impact of subsequent events for potential recognition or disclosure in these financial statements through the date of release of this report. No such events requiring recognition or disclosure were identified through the date of the release of this report.
Note 3. Transactions with Affiliates and Related Parties
Credit Suisse serves as investment adviser for the Fund. For its investment advisory services, Credit Suisse is entitled to receive a fee from the Fund at an annual rate of 0.80% of the Fund's average daily net assets. For the year ended October 31, 2013, investment advisory fees earned and fees waived/expenses reimbursed were $185,861 and $361,968, respectively. The Fund is authorized to reimburse Credit Suisse for management fees previously limited and/or for expenses previously paid by Credit Suisse, provided, however, that any reimbursements must be paid at a date not more than three years after the end of the fiscal year during which such fees were limited or expenses were reimbursed by Credit Suisse and the reimbursements do not cause a class to exceed the applicable expense limitation in the contract at the time the fees were limited or expenses are paid. This contract may not be terminated before February 28, 2014. Credit Suisse contractually waives fees and reimburses expenses so that the Fund's annual operating expenses will not exceed 0.90% of the Fund's average daily net assets for Class I shares, 1.15% of the Fund's average daily net assets for Class A shares, and 1.90% of the Fund's average daily net assets for Class C shares.
Credit Suisse and SSB serve as co-administrators to the Fund. For its co-administrative services, Credit Suisse received a fee calculation at an annual rate of 0.09% of the Fund's average daily net assets. For the year ended October 31, 2013, co-administrative services fees earned by Credit Suisse were $20,909.
26
Credit Suisse Commodity ACCESS Strategy Fund
Notes to Consolidated Financial Statements (continued)
October 31, 2013
Note 3. Transactions with Affiliates and Related Parties
For its co-administrative services, SSB receives a fee, exclusive of out-of-pocket expenses, calculated in total for all the Credit Suisse funds/portfolios co-administered by SSB and allocated based upon the relative average net assets of each fund/portfolio, subject to an annual minimum fee. For the year ended October 31, 2013, co-administrative services fees earned by SSB (including out-of-pocket expenses) with respect to the Fund were $11,527.
Credit Suisse Securities (USA) LLC ("CSSU"), an affiliate of Credit Suisse, serves as distributor of the Fund's shares. Pursuant to distribution plans adopted by the Fund pursuant to Rule 12b-1 under the 1940 Act, CSSU received fees for its distribution services. These fees were calculated at an annual rate of 0.25% of the average daily net assets of the Class A shares. For the Class C shares, the fee is calculated at an annual rate of 1.00% of the average daily net assets. For the year ended October 31, 2013, the Fund's paid Rule 12b-1 distribution fees were $405 for Class A shares and $1,080 for Class C shares. Class I shares are not subject to distribution fees.
Certain brokers, dealers and financial representatives provide transfer agent related services to the Fund and receive compensation from Credit Suisse. Credit Suisse is then reimbursed by the Fund. For the year ended October 31, 2013, the Fund reimbursed Credit Suisse $6,085, which is included in the Fund's transfer agent expense.
For the year ended October 31, 2013, CSSU and its affiliates advised the Fund that it retained $154 from commissions earned on the sale of the Fund's Class A shares.
Merrill Corporation ("Merrill"), an affiliate of Credit Suisse, has been engaged by the Fund to provide certain financial printing services. For the year ended October 31, 2013, Merrill was paid $19,797 for its services by the Fund. This amount was included in the printing fees presented on the Consolidated Statement of Operations.
Offering costs, including initial registration costs, were deferred and were charged to expenses over the 12 months of Fund operations. For the year ended October 31, 2013, $105,985 has been expensed to the Fund.
Note 4. Line of Credit
The Fund, together with other funds/portfolios advised by Credit Suisse (collectively, the "Participating Funds"), participates in a committed, unsecured line of credit facility ("Credit Facility"), in an aggregated amount of $20 million
27
Credit Suisse Commodity ACCESS Strategy Fund
Notes to Consolidated Financial Statements (continued)
October 31, 2013
for temporary or emergency purposes with SSB. Under the terms of the Credit Facility, the Participating Funds pay an aggregate commitment fee on the average unused amount of the Credit Facility, which is allocated among the Participating Funds in such manner as is determined by the governing Boards of the Participating Funds. In addition, the Participating Funds pay interest on borrowings at either the Overnight Federal Funds rate or the Overnight LIBOR rate plus a spread. At October 31, 2013, and during the year ended October 31, 2013, the Fund had no borrowings outstanding under the Credit Facility.
Note 5. Purchases and Sales of Securities
For the year ended October 31, 2013, purchases and sales of investment securities (excluding short-term investments) and U.S. Government and Agency Obligations were as follows:
Investment Securities | | U.S. Government/
Agency Obligations | |
| Purchases | | Sales | | Purchases | | Sales | |
| $ | — | | | $ | — | | | $ | 19,054,855 | | | $ | 8,052,959 | | |
Note 6. Capital Share Transactions
The Fund is authorized to issue an unlimited number of full and fractional shares of beneficial interest, $.001 par value per share. The Fund offers Class I, Class A and Class C shares. Transactions in capital shares for each class of the Fund were as follows:
| | | Class I | |
| | | For the Year Ended
October 31, 2013 | | For the Period Ended
October 31, 20121 | |
| | | Shares | | Value | | Shares | | Value | |
Shares sold | | | 315,651 | | | $ | 2,977,135 | | | | 2,235,001 | | | $ | 22,350,011 | | |
Shares redeemed | | | (163 | ) | | | (1,488 | ) | | | — | | | | — | | |
Net increase | | | 315,488 | | | $ | 2,975,647 | | | | 2,235,001 | | | $ | 22,350,011 | | |
| | | Class A | |
| | | For the Year Ended
October 31, 2013 | | For the Period Ended
October 31, 20121 | |
| | | Shares | | Value | | Shares | | Value | |
Shares sold | | | 15,608 | | | $ | 142,161 | | | | 10,000 | | | $ | 100,000 | | |
Net increase | | | 15,608 | | | $ | 142,161 | | | | 10,000 | | | $ | 100,000 | | |
28
Credit Suisse Commodity ACCESS Strategy Fund
Notes to Consolidated Financial Statements (continued)
October 31, 2013
Note 6. Capital Share Transactions
| | | Class C | |
| | | For the Year Ended
October 31, 2013 | | For the Period Ended
October 31, 20121 | |
| | | Shares | | Value | | Shares | | Value | |
Shares sold | | | 2,813 | | | $ | 25,500 | | | | 10,426 | | | $ | 104,000 | | |
Net increase | | | 2,813 | | | $ | 25,500 | | | | 10,426 | | | $ | 104,000 | | |
1 For the period September 28, 2012 (commencement of operations) through October 31, 2012.
The Fund imposes a redemption fee of 2% of the value of all classes of shares currently being offered that are redeemed or exchanged within 30 days from the date of purchase. Reinvested dividends and distributions are not subject to the fee. The fee is charged based on the value of shares at redemption, is paid directly to the Fund and becomes part of the Fund's daily net asset value calculation. When shares are redeemed that are subject to the fee, reinvested dividends and distributions are redeemed first, followed by the shares held longest. For the year ended October 31, 2013 and the period ended October 31, 2012, the Fund did not receive any redemption fees. On or about January 31, 2014, the redemption fee will be eliminated.
On October 31, 2013, the number of shareholders that held 5% or more of the outstanding shares of each class of the Fund was as follows:
| | | Number of
Shareholders | | Approximate Percentage
of Outstanding Shares | |
Class I | | | 1 | * | | | 98 | % | |
Class A | | | 3 | * | | | 100 | % | |
Class C | | | 2 | * | | | 98 | % | |
*This includes the seed money from Merchant Holdings, Inc., an affiliate of Credit Suisse.
Some of the shareholders are omnibus accounts, which hold shares on behalf of individual shareholders.
Note 7. Federal Income Taxes
Income and capital gain distributions are determined in accordance with federal income tax regulations, which may differ from GAAP.
There were no dividends paid by the fund to shareholders during the year ended October 31, 2013 and the period ended October 31, 2012.
The tax basis components of distributable earnings differ from the amounts reflected in the Consolidated Statement of Assets and Liabilities by temporary book/tax differences. This difference is primarily due to differing treatments
29
Credit Suisse Commodity ACCESS Strategy Fund
Notes to Consolidated Financial Statements (continued)
October 31, 2013
Note 7. Federal Income Taxes
of offering expenses. At October 31, 2013, the components of distributable earnings on a tax basis were as follows:
Late year ordinary loss deferral | | $ | (106,879 | ) | |
Accumulated realized loss | | | (24,241 | ) | |
Unrealized depreciation | | | (14,226 | ) | |
| | $ | (145,346 | ) | |
At October 31, 2013, the Fund had $24,241 of unlimited short-term capital loss carryforwards available to offset possible future capital gains.
Under the Regulated Investment Company Modernization Act of 2010, the Fund will be permitted to carry forward capital losses incurred in taxable years beginning after December 22, 2010 for an unlimited period. However, any losses incurred during those future taxable years will be required to be utilized prior to the losses incurred in pre-enactment taxable years. As a result of this ordering rule, pre-enactment capital loss carryforwards may be more likely to expire unused. Additionally, post-enactment capital losses that are carried forward will retain their character as either short-term or long-term capital losses rather than being considered all short-term as under previous law. It is uncertain whether the Fund will be able to realize the full benefits of the capital loss carryforwards before they expire. The Fund has no pre-enactment capital loss carryforwards.
During the tax year ended October 31, 2013, the Fund elected to defer Late-Year ordinary losses of $106,879. These losses are deemed to arise on the first day of the fund's next taxable year.
At October 31, 2013, the cost of investments (excluding foreign currency related transactions) and net unrealized appreciation (depreciation) for income tax purposes were as follows:
Cost of Investments | | $ | 21,388,247 | | |
Unrealized appreciation | | $ | 19,400 | | |
Unrealized depreciation | | | — | | |
Net unrealized appreciation (depreciation) | | $ | 19,400 | | |
At October 31, 2013, the Fund reclassified $17,344 from accumulated net investment loss and $223,754 from accumulated net realized loss to paid in capital, to adjust for current period permanent book/tax differences. These permanent differences are due to differing book/tax treatment of net operating
30
Credit Suisse Commodity ACCESS Strategy Fund
Notes to Consolidated Financial Statements (continued)
October 31, 2013
losses, non-deductible 12b-1 & blue sky expenses and subsidiary cumulative income/loss. Net assets were not affected by these reclassifications.
Note 8. Contingencies
In the normal course of business, the Fund may provide general indemnifications pursuant to certain contracts and organizational documents. The Fund's maximum exposure under these arrangements is dependent on future claims that may be made against the Fund and, therefore, cannot be estimated; however, based on experience, the risk of loss from such claims is considered remote.
31
Credit Suisse Commodity ACCESS Strategy Fund
Report of Independent Registered Public Accounting Firm
To the Board of Directors and Shareholders of Credit Suisse Commodity ACCESS Strategy Fund:
In our opinion, the accompanying consolidated statement of assets and liabilities, including the consolidated schedule of investments, and the related consolidated statements of operations and of changes in net assets and the financial highlights present fairly, in all material respects, the financial position of Credit Suisse Commodity ACCESS Strategy Fund and its subsidiary (the "Fund") at October 31, 2013, the results of their operations for the year then ended, and the changes in their net assets and the financial highlights for the year then ended and for the period September 28, 2012 (commencement of operations) through October 31, 2012, in conformity with accounting principles generally accepted in the United States of America. These financial statements and financial highlights (hereafter referred to as "financial statements") are the responsibility of the Fund's management; our responsibility is to express an opinion on these financial statements based on our audits. We conducted our audits of these financial statements in accordance with the standards of the Public Company Accounting Oversight Board (United States). Those standards require that we plan and perform the audit to obtain reasonable assurance about whether the financial statements are free of material misstatement. An audit includes examining, on a test basis, evidence supporting the amounts and disclosures in the financial statements, assessing the accounting principles used and significant estimates made by management, and evaluating the overall financial statement presentation. We believe that our audits, which included confirmation of securities at October 31, 2013 by correspondence with the custodian and brokers, provide a reasonable basis for our opinion.
PricewaterhouseCoopers LLP
New York, New York
December 27, 2013
32
Credit Suisse Commodity ACCESS Strategy Fund
Information Concerning Trustees and Officers (unaudited)
Name, Address
(Year of Birth) | | Position(s)
Held with
Fund | | Term
of Office1
and
Length
of Time
Served | | Principal
Occupation(s) During
Past Five Years | | Number of
Portfolios
in Fund
Complex
Overseen
by Trustee | | Other
Directorships
Held by Trustee | |
Independent Trustees | | | | | | | | | | | |
Enrique Arzac
c/o Credit Suisse Asset
Management, LLC
Attn: General Counsel
Eleven Madison Avenue
New York, New York
10010
(1941) | | Trustee, Audit Committee Chairman and Nominating Committee Member | | Since Fund Inception | | Professor of Finance and Economics, Graduate School of Business, Columbia University since 1971. | | | 11 | | | Director of The Adams Express Company, Petroleum and Resources Corporation, Aberdeen Chile Fund, Inc., Aberdeen Emerging Markets Smaller Company Opportunities Fund, Inc., Aberdeen Israel Fund, Inc., Aberdeen Indonesia Fund, Inc. and Aberdeen Latin America Equity Fund, Inc. (each a closed-end investment company); Director of Aberdeen Asia-Pacific Income Investment Company Limited (a Canadian closed-end fund); Trustee of Mirae Asset Discovery Funds (6 open-end portfolios); Director of Starcomms PLC. (telecommunications company) from 2008 to 2011; Director of Epoch Holding Corporation (an investment management and investment advisory services company) from 2006 to March 2013. | |
33
Credit Suisse Commodity ACCESS Strategy Fund
Information Concerning Trustees and Officers (unaudited) (continued)
Name, Address
(Year of Birth) | | Position(s)
Held with
Fund | | Term
of Office1
and
Length
of Time
Served | | Principal
Occupation(s) During
Past Five Years | | Number of
Portfolios
in Fund
Complex
Overseen
by Trustee | | Other
Directorships
Held by Trustee | |
Independent Trustees | | | | | | | | | | | |
Jeffrey E. Garten
Box 208200
New Haven, Connecticut
06520-8200
(1946) | | Trustee, Audit and Nominating Committee Member | | Since Fund Inception | | The Juan Trippe Professor in the Practice of International Trade, Finance and Business, Yale School of Management, from July 2005 to present; Partner and Chairman of Garten Rothkopf (consulting firm) from October 2005 to present. | | | 9 | | | Director of Aetna, Inc. (insurance company); Director of CarMax Group (used car dealers); Director of Alcan (aluminum production) from February 2007 to November 2007; Member of Standard & Poor's Board of Managers (credit rating agency); Director of Miller Buckfire & Co., LLC (financial restructuring). | |
Steven N. Rappaport
Lehigh Court, LLC
555 Madison Avenue
29th Floor
New York, New York
10022
(1948) | | Chairman of the Board of Trustees, Audit Committee Member and Nominating Committee Chairman | | Since Fund Inception | | Partner of Lehigh Court, LLC and RZ Capital (private investment firms) from July 2002 to present. | | | 11 | | | Director of iCAD, Inc. (surgical and medical instruments and apparatus company); Director of Wood Resources, LLC. (plywood manufacturing company); Director of Aberdeen Chile Fund, Inc., Aberdeen Emerging Markets Smaller Company Opportunities Fund, Inc., Aberdeen Israel Fund, Inc., Aberdeen Indonesia Fund, Inc. and Aberdeen Latin America Equity Fund, Inc. (each a closed-end investment company); Director of Presstek, Inc. (digital imaging technologies company) from 2003 to 2012. | |
1 Each Trustee and Officer serves until his or her respective successor has been duly elected and qualified.
34
Credit Suisse Commodity ACCESS Strategy Fund
Information Concerning Trustees and Officers (unaudited) (continued)
Name, Address
(Year of Birth) | | Position(s)
Held with
Fund | | Term of
Office1
and
Length of
Time
Served | | Principal Occupation(s) During Past Five Years | |
Officers* | | | | | | | |
John G. Popp
Credit Suisse Asset
Management, LLC
One Madison Avenue
New York, New York 10010
(1956) | | Chief Executive Officer and President | | Since Fund Inception | | Managing Director of Credit Suisse; Global Head and Chief Investment Officer of the Credit Investment Group; Associated with Credit Suisse or its predecessor since 1997; Officer of other Credit Suisse Funds; Trustee of Credit Suisse High Yield Bond Fund; Director of Credit Suisse Asset Management Income Fund, Inc. | |
Bruce Rosenberg
Credit Suisse Asset
Management, LLC
One Madison Avenue
New York, New York 10010
(1961) | | Chief Financial Officer | | Since 2012 | | Director of Credit Suisse; Director of Liquid Accounting of Credit Suisse; Associated with Credit Suisse since 2008; Officer of other Credit Suisse Funds. | |
Emidio Morizio
Credit Suisse Asset
Management, LLC
Eleven Madison Avenue
New York, New York 10010
(1966) | | Chief Compliance Officer | | Since Fund Inception | | Managing Director and Global Head of Compliance of Credit Suisse since 2010; Director and Global Head of Compliance of Credit Suisse from January 2005 to December 2009; Associated with Credit Suisse since July 2000; Officer of other Credit Suisse Funds. | |
Joanne Doldo
Credit Suisse Asset
Management, LLC
Eleven Madison Avenue
New York, New York 10010
(1959) | | Chief Legal Officer | | Since 2013 | | Vice President of Credit Suisse; Associated with Credit Suisse since September 2011; Officer of other Credit Suisse Funds; Associated with Morgan Stanley Investment Management from 2002-2008. | |
Rocco DelGuercio
Credit Suisse Asset
Management, LLC
One Madison Avenue
New York, New York 10010
(1963) | | Treasurer | | Since 2013 | | Vice President of Credit Suisse since 2013; Independent Consultant from February 2012 to April 2013; Director of Legg Mason & Co., LLC from March 2004 to January 2012; Associated with Credit Suisse from June 1996 to March 2004; Officer of other Credit Suisse Funds. | |
Karen Regan
Credit Suisse Asset
Management, LLC
Eleven Madison Avenue
New York, New York 10010
(1963) | | Senior Vice President and Secretary | | Since Fund Inception | | Vice President of Credit Suisse; Associated with Credit Suisse since December 2004; Officer of other Credit Suisse Funds. | |
* The officers of the Fund shown are officers that make policy decisions.
The Statement of Additional Information includes additional information about the Trustees and is available, without charge, upon request, by calling 877-870-2874.
35
Credit Suisse Commodity ACCESS Strategy Fund
Proxy Voting and Portfolio Holdings Information (unaudited)
Information regarding how the Fund voted proxies related to its portfolio securities during the 12 month period ended June 30 of each year, as well as the policies and procedures that the Fund uses to determine how to vote proxies relating to its portfolio securities are available:
• By calling 1-877-870-2874
• On the Fund's website, www.credit-suisse.com/us/funds
• On the website of the Securities and Exchange Commission, www.sec.gov.
The Fund files a complete schedule of its portfolio holdings for the first and third quarters of its fiscal year with the SEC on Form N-Q. The Fund's Forms N-Q are available on the SEC's website at www.sec.gov and may be reviewed and copied at the SEC's Public Reference Room in Washington, DC. Information on the operation of the SEC's Public Reference Room may be obtained by calling 1-202-551-8090.
36

P.O. BOX 55030, BOSTON, MA 02205-5030
877-870-2874 n www.credit-suisse.com/us/funds
CREDIT SUISSE SECURITIES (USA) LLC, DISTRIBUTOR. CAS-AR-1013

CREDIT SUISSE FUNDS
Annual Report
October 31, 2013
n CREDIT SUISSE
COMMODITY RETURN STRATEGY FUND
The Fund's investment objectives, risks, charges and expenses (which should be considered carefully before investing), and more complete information about the Fund, are provided in the Prospectus, which should be read carefully before investing. You may obtain additional copies by calling 877-870-2874 or by writing to Credit Suisse Funds, P.O. Box 55030, Boston, MA 02205-5030.
Credit Suisse Securities (USA) LLC, Distributor, is located at One Madison Avenue, New York, NY 10010. Credit Suisse Funds are advised by Credit Suisse Asset Management, LLC.
Investors in the Credit Suisse Funds should be aware that they may be eligible to purchase Class I shares (where offered) directly or through certain intermediaries. Such shares are not subject to a sales charge. Investors in the Credit Suisse Funds should also be aware that they may be eligible for a reduction or waiver of the sales charge with respect to Class A or C shares (where offered). For more information, please review the relevant prospectuses or consult your financial representative.
Fund shares are not deposits or other obligations of Credit Suisse Asset Management, LLC ("Credit Suisse") or any affiliate, are not FDIC-insured and are not guaranteed by Credit Suisse or any affiliate. Fund investments are subject to investment risks, including loss of your investment.
Credit Suisse Commodity Return Strategy Fund
Annual Investment Adviser's Report
October 31, 2013 (unaudited)
December 24, 2013
Dear Shareholder:
We are pleased to present this Annual Report covering the activities of the Credit Suisse Commodity Return Strategy Fund (the "Fund") for the annual period ended October 31, 2013.
Performance Summary
11/01/12 – 10/31/13
Fund & Benchmark | | Performance | |
| Class I1 | | | -12.29 | % | |
| Class A1,2 | | | -12.53 | % | |
| Class C1,2 | | | -13.16 | % | |
| Dow Jones-UBS Commodity Index Total Return3 | | | -12.21 | % | |
| Standard & Poor's 500 Index4 | | | 27.18 | % | |
Performance shown for the Fund's Class A and Class C Shares does not reflect sales charges, which are a maximum of 4.75% and 1.00%, respectively.2
Market and Strategy Review: A mixed period for commodities
Commodities were lower for the annual period ended October 31, 2013. The Dow Jones-UBS Commodity Index Total Return ("DJ-UBS Index") was down 12.21%, with 17 out of 22 Index constituents trading lower.
The DJ-UBS Index, the Fund's benchmark, is a broadly diversified futures index composed of futures contracts on 22 physical commodities. The DJ-UBS Index is weighted among commodity sectors using dollar-adjusted liquidity and production data and is rebalanced as of the beginning of each calendar year. The Fund seeks total return and is designed to achieve positive performance relative to the DJ-UBS Index. To do so, the Fund invests in commodity linked derivative instruments and fixed-income securities.
For the annual period ended October 31, 2013, the Fund underperformed the benchmark net of fees and fund expenses. Commodity strategies and underlying cash management both positively contributed to relative performance. Within the portfolio's commodity exposure, forward curve positioning in energy and agricultural had a positive impact on performance.
Precious metals was the worst performing sector, down 26.00%, on persistent worries over the U.S. Federal Reserve's plan to wind down its monetary stimulus program. The volatility in the U.S. dollar and sharp increase in interest rates also weighed on the sector. Additionally, silver declined 33.08%, as multiple iterations
1
Credit Suisse Commodity Return Strategy Fund
Annual Investment Adviser's Report (continued)
October 31, 2013 (unaudited)
of upbeat data from the world's top economies suggested a global recovery was gaining traction over the period.
Agriculture decreased 18.23%, with coffee declining the most, down 38.84% due to ample coffee supplies out of Brazil combined with a weak Brazilian Real and expectations of a record coffee crop out of Vietnam. Corn also ended the period lower, down 33.16%. Supply expectations increased throughout the period as reduced export demand, improved weather conditions in key South American producing regions, higher stocks, and larger-than-expected U.S. acreages planted weighed on Corn prices.
Industrial metals ended the period 8.15% lower on concerns over Chinese growth. Nickel and Aluminum were the worst performing sector constituents of the index due to expectations of increased global supplies.
Energy lost 4.87%, led lower by expectations of rising supplies and low seasonal demand for natural gas. Crude oil and petroleum products were positive for the period as Middle East supply was curtailed due to both growing unrest in Egypt and Syria and continued production issues in Iraq and Libya. Brent crude oil increased 8.21%, while WTI crude oil gained 10.26% due to a sharp reduction in inventories in Cushing, Oklahoma, the delivery point for this contract. New transportation infrastructure helped to narrow the discount for WTI relative to Brent and other crude oil grades.
Livestock was the best performing sector, up 1.50%, led by lean hogs. While lean hogs initially increased in late 2012 as a result of unexpected gains in pork prices during a time of typically sluggish demand, they continued to climb on the back of a lower USDA forecast for 2013 pork production amid already tight supplies and strong demand.
Outlook: As economy recovers, cautiously optimistic for the future
After 12 quarters of deceleration, global GDP growth appears to have accelerated. In August, new global manufacturing orders, as represented by the Purchasing Managers Index, reached the highest level since 2011. Traditionally, this tends to lead to global GDP growth.
Additionally, for the past five years, the global economy and global markets have faced extraordinarily high levels of macroeconomic uncertainty as a function of the financial crisis, the deep global recession and the Euro-area crisis. Recently, however, the improvements in the global economy have led macroeconomic uncertainty to fall back to pre-crisis levels for the first time since the failure of Lehman Brothers in September 2008 (as reported by the University of Stanford's Economic Policy Uncertainty Index).
2
Credit Suisse Commodity Return Strategy Fund
Annual Investment Adviser's Report (continued)
October 31, 2013 (unaudited)
As the overall economies recover, attention has turned towards the actions of fiscal and monetary policy makers. We expect that the future of US fiscal policy will most likely hinge on whether or not the federal government can avert another shutdown in mid-January. Separately, the Federal Reserve has gone to great lengths to ensure the marketplace that it will err on the side of tightening too late rather than too early — as indicated when the October shutdown forced them to delay tapering despite telecasting it in the early summer.
While most are not currently concerned with inflation, it may materialize faster than expected should economic growth exceed expectations. We believe the possible acceleration in global growth and potential threat of higher than expected inflation may lead to improved commodity demand. Additionally, the trend in the reduction of economic uncertainty across the globe may help reduce cross-asset class correlations and improve the diversification benefits of commodities. Finally, we continue to expect supply-side fundamentals to play an increasing role in individual commodity returns.
The Credit Suisse Commodities Management Team
Nelson Louie
Christopher Burton
This Fund is non-diversified, which means it may invest a greater proportion of its assets in the securities of a smaller number of issuers than a diversified mutual fund and may therefore be subject to greater volatility. The Fund's investment in commodity-linked derivative instruments may subject the Fund to greater volatility than investment in traditional securities, particularly in investments involving leverage.
The use of derivatives such as commodity-linked structured notes, swaps and futures entails substantial risks, including risk of loss of a significant portion of their principal value, commodity exposure risks, correlation risk, liquidity risk, interest-rate risk, market risk, credit risk and tax risk. Gains and losses from speculative positions in derivatives may be much greater than the derivative's cost. At any time, the risk of loss of any individual security held by the Fund could be significantly higher than 50% of the security's value. For a detailed discussion of these and other risks, please refer to the Fund's Prospectus, which should be read carefully before investing.
In addition to historical information, this report contains forward-looking statements, which may concern, among other things, domestic and foreign market, industry and economic trends and developments and government regulation and their potential
3
Credit Suisse Commodity Return Strategy Fund
Annual Investment Adviser's Report (continued)
October 31, 2013 (unaudited)
impact on the Fund's investments. These statements are subject to risks and uncertainties and actual trends, developments and regulations in the future, and their impact on the Fund could be materially different from those projected, anticipated or implied. The Fund has no obligation to update or revise forward-looking statements.
The views of the Fund's management are as of the date of the letter and the Fund holdings described in this document are as of October 31, 2013; these views and Fund holdings may have changed subsequent to these dates. Nothing in this document is a recommendation to purchase or sell securities.
4
Credit Suisse Commodity Return Strategy Fund
Annual Investment Adviser's Report (continued)
October 31, 2013 (unaudited)
Comparison of Change in Value of $10,000 Investment in the
Credit Suisse Commodity Return Strategy Fund1 Class I shares,
Class A shares2, Class C shares2, the Dow Jones-UBS
Commodity Index3 and the Standard & Poor's 500 Index4
from Inception (12/30/04).
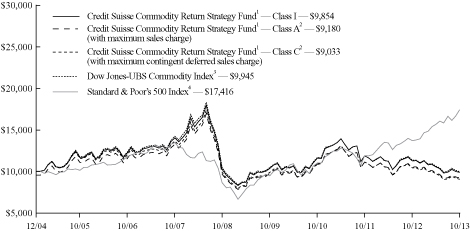
1 Fee waivers and/or expense reimbursements may reduce expenses for the Fund, without which performance would be lower. Voluntary waivers and/or reimbursements may be discontinued at any time.
2 Total return for the Fund's Class A shares for the reporting period, based on offering price (including maximum sales charge of 4.75%), was (16.73)%. Total return for the Fund's Class C shares for the reporting period, based on redemption value (including maximum contingent deferred sales charge of 1.00%), was (14.03)%.
3 The Dow Jones-UBS Commodity Index Total Return is composed of futures contracts on 22 physical commodities. An index does not have transaction costs; investors may not invest directly in an index.
4 The Standard & Poor's 500 Index is an unmanaged index (with no defined investment objective) of common stocks, includes reinvestment of dividends, and is a registered trademark of The McGraw-Hill Companies, Inc. Investors. An index does not have transaction costs; investors may not invest directly in an index.
5
Credit Suisse Commodity Return Strategy Fund
Annual Investment Adviser's Report (continued)
October 31, 2013 (unaudited)
Average Annual Returns as of October 31, 20131
| | | 1 Year | | 5 Years | | Since
Inception2 | |
Class I | | | (12.29 | )% | | | (0.72 | )% | | | (0.17 | )% | |
Class A Without Sales Charge | | | (12.53 | )% | | | (0.98 | )% | | | (0.42 | )% | |
Class A With Maximum Sales Charge | | | (16.73 | )% | | | (1.94 | )% | | | (0.96 | )% | |
Class C Without CDSC | | | (13.16 | )% | | | (1.71 | )% | | | (1.14 | )% | |
Class C With CDSC | | | (14.03 | )% | | | (1.71 | )% | | | (1.14 | )% | |
Returns represent past performance and include change in share price and reinvestment of dividends and capital gains. Past performance cannot guarantee future results. The current performance of the Fund may be lower or higher than the figures shown. Returns and share price will fluctuate, and redemption value may be more or less than original cost. The performance results do not reflect the deduction of taxes that a shareholder would pay on fund distributions or the redemption of fund shares. Performance information current to the most recent month-end is available at www.credit-suisse.com/us/funds.
The annualized expense ratios are 0.78% for Class I shares, 1.03% for Class A shares and 1.78% for Class C shares.
1 Fee waivers and/or expense reimbursements may reduce expenses for the Fund, without which performance would be lower. Voluntary waivers and/or reimbursements may be discontinued at any time.
2 Inception Date December 30, 2004.
6
Credit Suisse Commodity Return Strategy Fund
Annual Investment Adviser's Report (continued)
October 31, 2013 (unaudited)
Information About Your Fund's Expenses
As an investor of the Fund, you incur two types of costs: ongoing expenses and transaction costs. Ongoing expenses include management fees, distribution and service (12b-1) fees and other Fund expenses. Examples of transaction costs include sales charges (loads), redemption fees and account maintenance fees, which are not shown in this section and which would result in higher total expenses. The following table is intended to help you understand your ongoing expenses of investing in the Fund and to help you compare these expenses with the ongoing expenses of investing in other mutual funds. The table is based on an investment of $1,000 made at the beginning of the six month period ended October 31, 2013.
The table illustrates your Fund's expenses in two ways:
• Actual Fund Return. This helps you estimate the actual dollar amount of ongoing expenses paid on a $1,000 investment in the Fund using the Fund's actual return during the period. To estimate the expenses you paid over the period, simply divide your account value by $1,000 (for example, an $8,600 account value divided by $1,000 = 8.6), then multiply the result by the number in the "Expenses Paid per $1,000" line under the share class you hold.
• Hypothetical 5% Fund Return. This helps you to compare your Fund's ongoing expenses with those of other mutual funds using the Fund's actual expense ratio and a hypothetical rate of return of 5% per year before expenses. Examples using a 5% hypothetical fund return may be found in the shareholder reports of other mutual funds. The hypothetical account values and expenses may not be used to estimate the actual ending account balance or expenses you paid for the period.
Please note that the expenses shown in these tables are meant to highlight your ongoing expenses only and do not reflect any transaction costs, such as sales charges (loads) or redemption fees. If these transaction costs had been included, your costs would have been higher. The "Expenses Paid per $1,000" line of the tables is useful in comparing ongoing expenses only and will not help you determine the relative total expenses of owning different funds.
7
Credit Suisse Commodity Return Strategy Fund
Annual Investment Adviser's Report (continued)
October 31, 2013 (unaudited)
Expenses and Value for a $1,000 Investment
for the six month period ended October 31, 2013
Actual Fund Return | | Class I | | Class A | | Class C | |
Beginning Account Value 05/01/13 | | $ | 1,000.00 | | | $ | 1,000.00 | | | $ | 1,000.00 | | |
Ending Account Value 10/31/13 | | $ | 936.40 | | | $ | 936.80 | | | $ | 932.10 | | |
Expenses Paid per $1,000* | | $ | 3.71 | | | $ | 4.98 | | | $ | 8.57 | | |
Hypothetical 5% Fund Return | |
Beginning Account Value 05/01/13 | | $ | 1,000.00 | | | $ | 1,000.00 | | | $ | 1,000.00 | | |
Ending Account Value 10/31/13 | | $ | 1,021.37 | | | $ | 1,020.06 | | | $ | 1,016.33 | | |
Expenses Paid per $1,000* | | $ | 3.87 | | | $ | 5.19 | | | $ | 8.94 | | |
| | | Class I | | Class A | | Class C | |
Annualized Expense Ratios* | | | 0.76 | % | | | 1.02 | % | | | 1.76 | % | |
* Expenses are equal to the Fund's annualized expense ratio for each share class, multiplied by the average account value over the period, multiplied by the number of days in the most recent fiscal half year period, then divided by 365.
The "Expenses Paid per $1,000" and the "Annualized Expense Ratios" in the tables are based on actual expenses paid by the Fund during the period, net of fee waivers and/or expense reimbursements. If those fee waivers and/or expense reimbursements had not been in effect, the Fund's actual expenses would have been higher.
For more information, please refer to the Fund's prospectus.
Sector Breakdown*
United States Agency Obligations | | | 79.65 | % | |
United States Treasury Obligations | | | 15.78 | % | |
Commodity Indexed Structured Notes | | | 2.78 | % | |
Short-term Investment | | | 1.79 | % | |
Total | | | 100.00 | % | |
* Expressed as a percentage of total investments (excluding securities lending collateral if applicable) and may vary over time.
8
Credit Suisse Commodity Return Strategy Fund
Consolidated Schedule of Investments
October 31, 2013
Par
(000) | |
| | Ratings†
(S&P/Moody's) | | Maturity | | Rate% | | Value | |
| COMMODITY INDEXED STRUCTURED NOTES (2.7%) | |
$ | 26,000 | | | BNP Paribas, Commodity Index Linked
Senior Unsecured Notes# | | (A+, A2) | | 04/17/14 | | | 0.254 | | | $ | 18,774,600 | | |
| | 62,800 | | | BNP Paribas, Commodity Index Linked
Senior Unsecured Notes# | | (A+, A2) | | 04/25/14 | | | 0.250 | | | | 45,052,720 | | |
| | 29,700 | | | Deutsche Bank AG London, Commodity
Index Linked Senior Unsecured Notes# | | (A, A2) | | 01/29/14 | | | 0.008 | | | | 19,625,760 | | |
| | 32,000 | | | Deutsche Bank AG London, Commodity
Index Linked Senior Unsecured Notes# | | (A, A2) | | 02/13/14 | | | 0.020 | | | | 23,008,000 | | |
| | 49,000 | | | International Bank for Reconstruction &
Development# | | (AAA, Aaa) | | 12/20/13 | | | 0.249 | | | | 32,455,477 | | |
| TOTAL COMMODITY INDEXED STRUCTURED NOTES (Cost $199,500,000) | | | 138,916,557 | | |
| UNITED STATES AGENCY OBLIGATIONS (78.7%) | |
| | 115,000 | | | Fannie Mae Discount Notes | | (AA+, Aaa) | | 01/21/14 | | | 0.100 | | | | 114,994,825 | �� | |
| | 130,000 | | | Fannie Mae Discount Notes | | (AA+, Aaa) | | 05/01/14 | | | 0.119 | | | | 129,960,740 | | |
| | 75,200 | | | Fannie Mae Discount Notes | | (AA+, Aaa) | | 06/02/14 | | | 0.100 | | | | 75,168,867 | | |
| | 51,500 | | | Federal Farm Credit Banks# | | (AA+, Aaa) | | 12/11/14 | | | 0.300 | | | | 51,592,752 | | |
| | 80,000 | | | Federal Farm Credit Banks# | | (AA+, Aaa) | | 02/13/15 | | | 0.204 | | | | 80,096,560 | | |
| | 26,800 | | | Federal Farm Credit Banks# | | (AA+, Aaa) | | 03/16/15 | | | 0.230 | | | | 26,824,763 | | |
| | 79,950 | | | Federal Farm Credit Banks# | | (AA+, Aaa) | | 05/05/15 | | | 0.220 | | | | 80,103,024 | | |
| | 95,000 | | | Federal Farm Credit Banks# | | (AA+, Aaa) | | 06/22/15 | | | 0.192 | | | | 95,110,580 | | |
| | 80,000 | | | Federal Farm Credit Banks# | | (AA+, Aaa) | | 07/20/15 | | | 0.203 | | | | 80,106,960 | | |
| | 87,500 | | | Federal Farm Credit Banks# | | (AA+, Aaa) | | 09/21/15 | | | 0.250 | | | | 87,584,700 | | |
| | 12,000 | | | Federal Farm Credit Banks# | | (AA+, Aaa) | | 11/19/15 | | | 0.173 | | | | 12,008,208 | | |
| | 62,000 | | | Federal Farm Credit Banks# | | (AA+, Aaa) | | 01/19/16 | | | 0.183 | | | | 62,050,096 | | |
| | 65,000 | | | Federal Farm Credit Banks# | | (AA+, Aaa) | | 02/10/16 | | | 0.174 | | | | 65,035,360 | | |
| | 50,000 | | | Federal Farm Credit Banks# | | (AA+, Aaa) | | 02/24/16 | | | 0.220 | | | | 50,084,250 | | |
| | 50,000 | | | Federal Farm Credit Banks# | | (AA+, Aaa) | | 04/11/16 | | | 0.260 | | | | 50,028,950 | | |
| | 83,000 | | | Federal Farm Credit Banks# | | (AA+, Aaa) | | 04/19/16 | | | 0.263 | | | | 83,217,958 | | |
| | 82,200 | | | Federal Farm Credit Banks# | | (AA+, Aaa) | | 05/02/16 | | | 0.204 | | | | 82,281,542 | | |
| | 50,000 | | | Federal Farm Credit Banks# | | (AA+, Aaa) | | 06/09/16 | | | 0.280 | | | | 50,042,050 | | |
| | 90,800 | | | Federal Farm Credit Banks# | | (AA+, Aaa) | | 07/20/16 | | | 0.280 | | | | 90,860,473 | | |
| | 70,000 | | | Federal Farm Credit Banks# | | (AA+, Aaa) | | 11/07/16 | | | 0.300 | | | | 70,049,910 | | |
| | 152,000 | | | Federal Farm Credit Banks# | | (AA+, Aaa) | | 11/21/16 | | | 0.268 | | | | 152,418,152 | | |
| | 100,000 | | | Federal Farm Credit Banks# | | (AA+, Aaa) | | 12/06/16 | | | 0.269 | | | | 100,274,200 | | |
| | 15,000 | | | Federal Farm Credit Banks# | | (AA+, Aaa) | | 01/17/17 | | | 0.224 | | | | 15,021,165 | | |
| | 75,500 | | | Federal Home Loan Bank Discount Notes | | (AA+, Aaa) | | 01/10/14 | | | 0.120 | | | | 75,497,055 | | |
| | 25,200 | | | Federal Home Loan Bank Discount Notes | | (AA+, Aaa) | | 04/01/14 | | | 0.160 | | | | 25,194,708 | | |
| | 50,000 | | | Federal Home Loan Bank Discount Notes | | (AA+, Aaa) | | 05/01/14 | | | 0.167 | | | | 49,984,900 | | |
| | 20,000 | | | Federal Home Loan Banks | | (AA+, Aaa) | | 11/12/13 | | | 0.100 | | | | 19,999,929 | | |
| | 70,000 | | | Federal Home Loan Banks# | | (AA+, Aaa) | | 06/11/14 | | | 0.220 | | | | 70,077,350 | | |
| | 29,000 | | | Federal Home Loan Banks | | (AA+, Aaa) | | 06/13/14 | | | 2.500 | | | | 29,425,517 | | |
| | 75,000 | | | Federal Home Loan Banks | | (AA+, Aaa) | | 10/15/14 | | | 0.230 | | | | 75,060,825 | | |
| | 60,000 | | | Federal Home Loan Banks# | | (AA+, Aaa) | | 08/14/15 | | | 0.220 | | | | 60,029,640 | | |
| | 110,000 | | | Federal Home Loan Banks# | | (AA+, Aaa) | | 08/19/15 | | | 0.200 | | | | 110,013,860 | | |
| | 74,600 | | | Federal Home Loan Banks# | | (AA+, Aaa) | | 08/19/15 | | | 0.220 | | | | 74,636,032 | | |
| | 10,000 | | | Federal Home Loan Banks# | | (AA+, Aaa) | | 10/01/15 | | | 0.210 | | | | 10,001,900 | | |
See Accompanying Notes to Consolidated Financial Statements.
9
Credit Suisse Commodity Return Strategy Fund
Consolidated Schedule of Investments (continued)
October 31, 2013
Par
(000) | |
| | Ratings†
(S&P/Moody's) | | Maturity | | Rate% | | Value | |
UNITED STATES AGENCY OBLIGATIONS | | | |
$ | 173,600 | | | Federal Home Loan Banks# | | (AA+, Aaa) | | 10/07/15 | | | 0.220 | | | $ | 173,663,364 | | |
| | 55,250 | | | Federal Home Loan Banks# | | (AA+, Aaa) | | 11/07/16 | | | 1.000 | | | | 55,305,913 | | |
| | 75,000 | | | Federal Home Loan Mortgage Corp. | | (AA+, Aaa) | | 04/28/14 | | | 0.375 | | | | 75,100,800 | | |
| | 19,077 | | | Federal Home Loan Mortgage Corp. | | (AA+, Aaa) | | 08/20/14 | | | 1.000 | | | | 19,203,767 | | |
| | 107,650 | | | Federal Home Loan Mortgage Corp. | | (AA+, Aaa) | | 12/03/14 | | | 0.320 | | | | 107,833,866 | | |
| | 51,161 | | | Federal Home Loan Mortgage Corp.§ | | (AA+, Aaa) | | 12/05/14 | | | 0.350 | | | | 51,265,010 | | |
| | 100,000 | | | Federal Home Loan Mortgage Corp. | | (AA+, Aaa) | | 12/29/14 | | | 0.330 | | | | 100,161,800 | | |
| | 10,000 | | | Federal Home Loan Mortgage Corp. | | (AA+, Aaa) | | 12/29/14 | | | 0.625 | | | | 10,050,380 | | |
| | 100,000 | | | Federal Home Loan Mortgage Corp. | | (AA+, Aaa) | | 01/02/15 | | | 0.305 | | | | 100,131,000 | | |
| | 100,000 | | | Federal Home Loan Mortgage Corp. | | (AA+, Aaa) | | 02/23/15 | | | 0.305 | | | | 100,118,900 | | |
| | 85,725 | | | Federal Home Loan Mortgage Corp. | | (AA+, Aaa) | | 04/29/15 | | | 0.320 | | | | 85,739,145 | | |
| | 43,000 | | | Federal Home Loan Mortgage Corp. | | (AA+, Aaa) | | 04/30/15 | | | 0.400 | | | | 43,021,758 | | |
| | 35,000 | | | Federal Home Loan Mortgage Corp. | | (AA+, Aaa) | | 09/04/15 | | | 0.550 | | | | 35,032,970 | | |
| | 69,885 | | | Federal Home Loan Mortgage Corp. | | (AA+, Aaa) | | 09/18/15 | | | 0.550 | | | | 69,965,857 | | |
| | 15,700 | | | Federal National Mortgage Association# | | (AA+, Aaa) | | 11/08/13 | | | 0.143 | | | | 15,699,910 | | |
| | 107,686 | | | Federal National Mortgage Association§ | | (AA+, Aaa) | | 12/19/14 | | | 0.750 | | | | 108,381,759 | | |
| | 63,000 | | | Federal National Mortgage Association | | (AA+, Aaa) | | 03/16/15 | | | 0.375 | | | | 63,140,994 | | |
| | 137,900 | | | Federal National Mortgage Association# | | (AA+, Aaa) | | 07/25/16 | | | 0.180 | | | | 137,960,952 | | |
| | 117,000 | | | Federal National Mortgage Association# | | (AA+, Aaa) | | 08/12/16 | | | 0.196 | | | | 117,077,103 | | |
| | 92,500 | | | Federal National Mortgage Association# | | (AA+, Aaa) | | 08/15/16 | | | 0.194 | | | | 92,560,310 | | |
| | 110,000 | | | Freddie Mac Discount Notes | | (AA+, Aaa) | | 04/24/14 | | | 0.118 | | | | 109,973,380 | | |
| TOTAL UNITED STATES AGENCY OBLIGATIONS (Cost $3,972,695,750) | | | 3,976,226,739 | | |
| UNITED STATES TREASURY OBLIGATIONS (15.6%) | |
| | 25,000 | | | United States Treasury Bills | | (AA+, Aaa) | | 11/07/13 | | | 0.300 | | | | 24,998,750 | | |
| | 21,000 | | | United States Treasury Bills | | (AA+, Aaa) | | 02/06/14 | | | 0.047 | | | | 20,997,585 | | |
| | 35,000 | | | United States Treasury Bills | | (AA+, Aaa) | | 03/20/14 | | | 0.025 | | | | 34,992,895 | | |
| | 35,000 | | | United States Treasury Bills | | (AA+, Aaa) | | 09/18/14 | | | 0.107 | | | | 34,973,085 | | |
| | 30,000 | | | United States Treasury Notes | | (AA+, Aaa) | | 01/15/14 | | | 1.000 | | | | 30,058,020 | | |
| | 17,500 | | | United States Treasury Notes | | (AA+, Aaa) | | 01/31/14 | | | 0.250 | | | | 17,509,573 | | |
| | 15,000 | | | United States Treasury Notes | | (AA+, Aaa) | | 04/30/14 | | | 0.250 | | | | 15,010,845 | | |
| | 25,000 | | | United States Treasury Notes | | (AA+, Aaa) | | 05/15/14 | | | 1.000 | | | | 25,120,600 | | |
| | 25,000 | | | United States Treasury Notes | | (AA+, Aaa) | | 07/15/14 | | | 0.625 | | | | 25,090,325 | | |
| | 30,000 | | | United States Treasury Notes | | (AA+, Aaa) | | 07/31/14 | | | 2.625 | | | | 30,560,730 | | |
| | 25,000 | | | United States Treasury Notes | | (AA+, Aaa) | | 08/15/14 | | | 4.250 | | | | 25,811,025 | | |
| | 107,300 | | | United States Treasury Notes | | (AA+, Aaa) | | 01/31/15 | | | 0.250 | | | | 107,404,832 | | |
| | 100,000 | | | United States Treasury Notes | | (AA+, Aaa) | | 04/30/15 | | | 0.125 | | | | 99,863,300 | | |
| | 100,000 | | | United States Treasury Notes§ | | (AA+, Aaa) | | 06/15/15 | | | 0.375 | | | | 100,214,800 | | |
| | 100,000 | | | United States Treasury Notes | | (AA+, Aaa) | | 07/15/15 | | | 0.250 | | | | 99,988,300 | | |
| | 95,000 | | | United States Treasury Notes | | (AA+, Aaa) | | 08/31/15 | | | 0.375 | | | | 95,170,715 | | |
| TOTAL UNITED STATES TREASURY OBLIGATIONS (Cost $786,802,806) | | | 787,765,380 | | |
Number of
Shares | |
| |
| |
| |
| |
| |
| SHORT-TERM INVESTMENTS (2.1%) | |
| | 16,044,900 | | | State Street Navigator Prime Portfolio, 0.16%§§ | | | | | | | | | | | | | | | 16,044,900 | | |
See Accompanying Notes to Consolidated Financial Statements.
10
Credit Suisse Commodity Return Strategy Fund
Consolidated Schedule of Investments (continued)
October 31, 2013
Par
(000) | |
| | | | Maturity | | Rate% | | Value | |
SHORT-TERM INVESTMENTS | |
$ | 89,256 | | | State Street Bank and Trust Co. Euro Time Deposit | | | | 11/01/13 | | | 0.010 | | | $ | 89,256,000 | | |
| TOTAL SHORT-TERM INVESTMENTS (Cost $105,300,900) | | | 105,300,900 | | |
| TOTAL INVESTMENTS AT VALUE (99.1%) (Cost $5,064,299,456) | | | 5,008,209,576 | | |
| OTHER ASSETS IN EXCESS OF LIABILITIES (0.9%) | | | 47,160,003 | | |
| NET ASSETS (100.0%) | | $ | 5,055,369,579 | | |
† Credit ratings given by the Standard & Poor's Division of The McGraw-Hill Companies, Inc. ("S&P") and Moody's Investors Service, Inc. ("Moody's") are unaudited.
# Variable rate obligations — The interest rate is the rate as of October 31, 2013.
§ Security or portion thereof is out on loan.
§§ Represents security purchased with cash collateral received for securities on loan. The rate shown is the annualized one-day yield at October 31, 2013.
See Accompanying Notes to Consolidated Financial Statements.
11
Credit Suisse Commodity Return Strategy Fund
Consolidated Statement of Assets and Liabilities
October 31, 2013
Assets | |
Investments at value, including collateral for securities on loan of $16,044,900
(Cost $5,064,299,456) (Note 2) | | $ | 5,008,209,5761 | | |
Cash | | | 217,281 | | |
Cash segregated at brokers for futures contracts and swap contracts | | | 223,057,477 | | |
Receivable for fund shares sold | | | 21,110,792 | | |
Interest receivable | | | 2,956,444 | | |
Unrealized appreciation on open swap contracts (Note 2) | | | 1,797,694 | | |
Variation margin receivable on futures contracts (Note 2) | | | 216,240 | | |
Prepaid expenses and other assets | | | 201,714 | | |
Total Assets | | | 5,257,767,218 | | |
Liabilities | |
Advisory fee payable (Note 3) | | | 2,205,689 | | |
Administrative services fee payable (Note 3) | | | 539,968 | | |
Shareholder servicing/Distribution fee payable (Note 3) | | | 83,434 | | |
Payable for investments purchased | | | 125,244,697 | | |
Unrealized depreciation on open swap contracts (Note 2) | | | 49,635,460 | | |
Payable upon return of securities loaned (Note 2) | | | 16,044,900 | | |
Payable for fund shares redeemed | | | 6,032,943 | | |
Trustees' fee payable | | | 10,938 | | |
Accrued expenses | | | 2,599,610 | | |
Total Liabilities | | | 202,397,639 | | |
Net Assets | |
Capital stock, $.001 par value (Note 6) | | | 701,660 | | |
Paid-in capital (Note 6) | | | 5,205,450,514 | | |
Accumulated net investment loss | | | (27,440,052 | ) | |
Accumulated net realized loss on investments, futures contracts and swap contracts | | | (26,221,130 | ) | |
Net unrealized depreciation from investments, futures contracts and swap contracts | | | (97,121,413 | ) | |
Net Assets | | $ | 5,055,369,579 | | |
I Shares | |
Net assets | | $ | 4,730,827,694 | | |
Shares outstanding | | | 655,986,964 | | |
Net asset value, offering price and redemption price per share | | $ | 7.21 | | |
A Shares | |
Net assets | | $ | 304,274,442 | | |
Shares outstanding | | | 42,719,555 | | |
Net asset value and redemption price per share | | $ | 7.12 | | |
Maximum offering price per share (net asset value/(1-4.75%)) | | $ | 7.48 | | |
C Shares | |
Net assets | | $ | 20,267,443 | | |
Shares outstanding | | | 2,953,824 | | |
Net asset value and offering price per share | | $ | 6.86 | | |
1 Including $15,722,358 of securities on loan.
See Accompanying Notes to Consolidated Financial Statements.
12
Credit Suisse Commodity Return Strategy Fund
Consolidated Statement of Operations
For the Year Ended October 31, 2013
| Investment Income (Note 2) | |
Interest | | $ | 12,258,825 | | |
Securities lending (net of rebates) | | | 69,747 | | |
Total investment income | | | 12,328,572 | | |
Expenses | |
Investment advisory fees (Note 3) | | | 26,891,054 | | |
Administrative services fees (Note 3) | | | 5,664,171 | | |
Shareholder servicing/Distribution fees (Note 3) | |
Class A | | | 1,384,017 | | |
Class C | | | 262,013 | | |
Transfer agent fees (Note 3) | | | 7,638,135 | | |
Printing fees (Note 3) | | | 450,436 | | |
Registration fees | | | 362,291 | | |
Custodian fees | | | 269,966 | | |
Insurance expense | | | 206,357 | | |
Legal fees | | | 110,439 | | |
Audit and tax fees | | | 62,700 | | |
Trustees' fees | | | 28,576 | | |
Commitment fees (Note 4) | | | 17,193 | | |
Miscellaneous expense | | | 67,776 | | |
Total expenses | | | 43,415,124 | | |
Net investment loss | | | (31,086,552 | ) | |
Net Realized and Unrealized Gain (Loss) from Investments, Futures Contracts and Swap Contracts | |
Net realized loss from investments | | | (22,917,733 | ) | |
Net realized gain from futures contracts | | | 1,157,490 | | |
Net realized loss from swap contracts | | | (594,421,251 | ) | |
Net change in unrealized appreciation (depreciation) from investments | | | (48,397,246 | ) | |
Net change in unrealized appreciation (depreciation) from futures contracts | | | 6,646,387 | | |
Net change in unrealized appreciation (depreciation) from swap contracts | | | (7,591,825 | ) | |
Net realized and unrealized loss from investments, futures contracts and swap contracts | | | (665,524,178 | ) | |
Net decrease in net assets resulting from operations | | $ | (696,610,730 | ) | |
See Accompanying Notes to Consolidated Financial Statements.
13
Credit Suisse Commodity Return Strategy Fund
Consolidated Statement of Changes in Net Assets
| | | For the Year
Ended
October 31, 2013 | | For the Year
Ended
October 31, 2012 | |
From Operations | |
Net investment loss | | $ | (31,086,552 | ) | | $ | (33,853,342 | ) | |
Net realized loss from investments, futures contracts
and swap contracts | | | (616,181,494 | ) | | | (206,570,241 | ) | |
Net change in unrealized appreciation (depreciation) from
investments, futures contracts and swap contracts | | | (49,342,684 | ) | | | (94,940,222 | ) | |
Net decrease in net assets resulting from operations | | | (696,610,730 | ) | | | (335,363,805 | ) | |
From Dividends and Distributions | |
Distributions from net realized gains | |
Class I | | | — | | | | (6,882,755 | ) | |
Class A | | | — | | | | (1,499,022 | ) | |
Class C | | | — | | | | (66,401 | ) | |
Net decrease in net assets resulting from dividends and distributions | | | — | | | | (8,448,178 | ) | |
| From Capital Share Transactions (Note 6) | |
Proceeds from sale of shares | | | 3,099,077,263 | | | | 3,275,434,008 | | |
Reinvestment of dividends and distributions | | | — | | | | 6,171,593 | | |
Net asset value of shares redeemed | | | (2,789,351,279 | )1 | | | (3,430,273,269 | )2 | |
Net increase (decrease) in net assets from capital share transactions | | | 309,725,984 | | | | (148,667,668 | ) | |
Net decrease in net assets | | | (386,884,746 | ) | | | (492,479,651 | ) | |
Net Assets | |
Beginning of year | | | 5,442,254,325 | | | | 5,934,733,976 | | |
End of year | | $ | 5,055,369,579 | | | $ | 5,442,254,325 | | |
Accumulated net investment loss | | $ | (27,440,052 | ) | | $ | (29,217,296 | ) | |
1 Net of $282,590 of redemption fees retained by the Fund.
2 Net of $433,448 of redemption fees retained by the Fund.
See Accompanying Notes to Consolidated Financial Statements.
14
Credit Suisse Commodity Return Strategy Fund
Consolidated Financial Highlights
(For a Class I Share of the Fund Outstanding Throughout Each Year)
| | | For the Year Ended October 31, | |
| | | 2013 | | 2012 | | 2011 | | 2010 | | 2009 | |
Per share data | |
Net asset value, beginning of year | | $ | 8.22 | | | $ | 8.69 | | | $ | 9.12 | | | $ | 8.64 | | | $ | 8.61 | | |
INVESTMENT OPERATIONS | |
Net investment loss1 | | | (0.04 | ) | | | (0.05 | ) | | | (0.05 | )4 | | | (0.04 | )4 | | | (0.01 | )4 | |
Net gain (loss) on investments,
futures contracts and swap contracts
(both realized and unrealized) | | | (0.97 | ) | | | (0.41 | ) | | | 0.294 | | | | 1.064 | | | | 0.094 | | |
Total from investment operations | | | (1.01 | ) | | | (0.46 | ) | | | 0.24 | | | | 1.02 | | | | 0.08 | | |
REDEMPTION FEES2 | | | 0.00 | | | | 0.00 | | | | 0.00 | | | | 0.00 | | | | 0.00 | | |
LESS DIVIDENDS AND DISTRIBUTIONS | |
Dividends from net investment income | | | — | | | | — | | | | (0.67 | ) | | | (0.54 | ) | | | (0.05 | ) | |
Distributions from net realized gains | | | — | | | | (0.01 | ) | | | — | | | | — | | | | — | | |
Total dividends and distributions | | | — | | | | (0.01 | ) | | | (0.67 | ) | | | (0.54 | ) | | | (0.05 | ) | |
Net asset value, end of year | | $ | 7.21 | | | $ | 8.22 | | | $ | 8.69 | | | $ | 9.12 | | | $ | 8.64 | | |
Total return3 | | | (12.29 | )% | | | (5.26 | )% | | | 2.47 | % | | | 12.14 | % | | | 1.02 | % | |
RATIOS AND SUPPLEMENTAL DATA | |
Net assets, end of year (000s omitted) | | $ | 4,730,828 | | | $ | 4,818,146 | | | $ | 4,779,638 | | | $ | 3,099,449 | | | $ | 1,911,091 | | |
Ratio of net expenses to average net assets | | | 0.78 | % | | | 0.80 | % | | | 0.79 | %4 | | | 0.70 | %4 | | | 0.70 | %4 | |
Ratio of net investment loss to average
net assets | | | (0.55 | )% | | | (0.56 | )% | | | (0.59 | )%4 | | | (0.47 | )%4 | | | (0.15 | )%4 | |
Decrease reflected in above operating expense
ratios due to waivers/reimbursements | | | — | % | | | 0.01 | % | | | 0.03 | %4 | | | 0.13 | %4 | | | 0.15 | %4 | |
Portfolio turnover rate | | | 99 | % | | | 84 | % | | | 165 | % | | | 104 | % | | | 43 | % | |
1 Per share information is calculated using the average shares outstanding method.
2 This amount represents less than $0.01 per share.
3 Total returns are historical and assume changes in share price and reinvestment of all dividends and distributions. Had certain expenses not been reduced during the years shown, total returns would have been lower.
4 Effective October 31, 2012, the Fund began reporting operations of its wholly-owned subsidiary on a consolidated basis. Had the Fund reported on a consolidated basis in prior periods, ratio of net expenses to average net assets without fee waivers and/or expense reimbursements would have increased by 0.01%, 0.01% and 0.01% for the years ended October 31, 2009, 2010, and 2011, respectively. The ratio of net expenses to average net assets with fee waivers and/or expense reimbursements would have increased 0.00%, 0.00% and 0.00%, respectively for the same time period. The ratio of net investment income (loss) to average net assets would have increased 0.07%, 0.04% and 0.03% for the years ended October 31, 2009, 2010 and 2011, respectively. This change did not have material impact to net investment income (loss) per share or net realized and unrealized gain (loss) per share.
See Accompanying Notes to Consolidated Financial Statements.
15
Credit Suisse Commodity Return Strategy Fund
Consolidated Financial Highlights
(For a Class A Share of the Fund Outstanding Throughout Each Year)
| | | For the Year Ended October 31, | |
| | | 2013 | | 2012 | | 2011 | | 2010 | | 2009 | |
Per share data | |
Net asset value, beginning of year | | $ | 8.14 | | | $ | 8.62 | | | $ | 9.07 | | | $ | 8.62 | | | $ | 8.61 | | |
INVESTMENT OPERATIONS | |
Net investment loss1 | | | (0.06 | ) | | | (0.07 | ) | | | (0.08 | )4 | | | (0.06 | )4 | | | (0.02 | )4 | |
Net gain (loss) on investments,
futures contracts and swap contracts
(both realized and unrealized) | | | (0.96 | ) | | | (0.40 | ) | | | 0.304 | | | | 1.054 | | | | 0.074 | | |
Total from investment operations | | | (1.02 | ) | | | (0.47 | ) | | | 0.22 | | | | 0.99 | | | | 0.05 | | |
REDEMPTION FEES2 | | | 0.00 | | | | 0.00 | | | | 0.00 | | | | 0.00 | | | | 0.00 | | |
LESS DIVIDENDS AND DISTRIBUTIONS | |
Dividends from net investment income | | | — | | | | — | | | | (0.67 | ) | | | (0.54 | ) | | | (0.04 | ) | |
Distributions from net realized gains | | | — | | | | (0.01 | ) | | | — | | | | — | | | | — | | |
Total dividends and distributions | | | — | | | | (0.01 | ) | | | (0.67 | ) | | | (0.54 | ) | | | (0.04 | ) | |
Net asset value, end of year | | $ | 7.12 | | | $ | 8.14 | | | $ | 8.62 | | | $ | 9.07 | | | $ | 8.62 | | |
Total return3 | | | (12.53 | )% | | | (5.42 | )% | | | 2.24 | % | | | 11.80 | % | | | 0.68 | % | |
RATIOS AND SUPPLEMENTAL DATA | |
Net assets, end of year (000s omitted) | | $ | 304,274 | | | $ | 591,661 | | | $ | 1,108,846 | | | $ | 705,895 | | | $ | 350,204 | | |
Ratio of net expenses to average net assets | | | 1.03 | % | | | 1.05 | % | | | 1.04 | %4 | | | 0.95 | %4 | | | 0.95 | %4 | |
Ratio of net investment loss to average
net assets | | | (0.80 | )% | | | (0.82 | )% | | | (0.84 | )%4 | | | (0.72 | )%4 | | | (0.29 | )%4 | |
Decrease reflected in above operating expense
ratios due to waivers/reimbursements | | | — | % | | | 0.01 | % | | | 0.03 | %4 | | | 0.13 | %4 | | | 0.15 | %4 | |
Portfolio turnover rate | | | 99 | % | | | 84 | % | | | 165 | % | | | 104 | % | | | 43 | % | |
1 Per share information is calculated using the average shares outstanding method.
2 This amount represents less than $0.01 per share.
3 Total returns are historical and assume changes in share price and reinvestment of all dividends and distributions. Had certain expenses not been reduced during the years shown, total returns would have been lower.
4 Effective October 31, 2012, the Fund began reporting operations of its wholly-owned subsidiary on a consolidated basis. Had the Fund reported on a consolidated basis in prior periods, ratio of net expenses to average net assets without fee waivers and/or expense reimbursements would have increased by 0.01%, 0.02% and 0.01% for the years ended October 31, 2009, 2010, and 2011, respectively. The ratio of net expenses to average net assets with fee waivers and/or expense reimbursements would have increased 0.00%, 0.00% and 0.00%, respectively for the same time period. The ratio of net investment income (loss) to average net assets would have increased 0.08%, 0.04% and 0.04% for the years ended October 31, 2009, 2010 and 2011, respectively. This change did not have material impact to net investment income (loss) per share or net realized and unrealized gain (loss) per share.
See Accompanying Notes to Consolidated Financial Statements.
16
Credit Suisse Commodity Return Strategy Fund
Consolidated Financial Highlights
(For a Class C Share of the Fund Outstanding Throughout Each Year)
| | | For the Year Ended October 31, | |
| | | 2013 | | 2012 | | 2011 | | 2010 | | 2009 | |
Per share data | |
Net asset value, beginning of year | | $ | 7.90 | | | $ | 8.44 | | | $ | 8.96 | | | $ | 8.57 | | | $ | 8.61 | | |
INVESTMENT OPERATIONS | |
Net investment loss1 | | | (0.11 | ) | | | (0.12 | ) | | | (0.14 | )4 | | | (0.12 | )4 | | | (0.08 | )4 | |
Net gain (loss) on investments,
futures contracts and swap contracts
(both realized and unrealized) | | | (0.93 | ) | | | (0.41 | ) | | | 0.294 | | | | 1.054 | | | | 0.074 | | |
Total from investment operations | | | (1.04 | ) | | | (0.53 | ) | | | 0.15 | | | | 0.93 | | | | (0.01 | ) | |
REDEMPTION FEES2 | | | 0.00 | | | | 0.00 | | | | 0.00 | | | | 0.00 | | | | 0.00 | | |
LESS DIVIDENDS AND DISTRIBUTIONS | |
Dividends from net investment income | | | — | | | | — | | | | (0.67 | ) | | | (0.54 | ) | | | (0.03 | ) | |
Distributions from net realized gains | | | — | | | | (0.01 | ) | | | — | | | | — | | | | — | | |
Total dividends and distributions | | | — | | | | (0.01 | ) | | | (0.67 | ) | | | (0.54 | ) | | | (0.03 | ) | |
Net asset value, end of year | | $ | 6.86 | | | $ | 7.90 | | | $ | 8.44 | | | $ | 8.96 | | | $ | 8.57 | | |
Total return3 | | | (13.16 | )% | | | (6.25 | )% | | | 1.44 | % | | | 11.14 | % | | | (0.07 | )% | |
RATIOS AND SUPPLEMENTAL DATA | |
Net assets, end of year (000s omitted) | | $ | 20,267 | | | $ | 32,447 | | | $ | 46,250 | | | $ | 31,852 | | | $ | 22,035 | | |
Ratio of net expenses to average net assets | | | 1.78 | % | | | 1.80 | % | | | 1.79 | %4 | | | 1.70 | %4 | | | 1.70 | %4 | |
Ratio of net investment loss
to average net assets | | | (1.55 | )% | | | (1.57 | )% | | | (1.59 | )%4 | | | (1.47 | )%4 | | | (0.97 | )%4 | |
Decrease reflected in above operating expense
ratios due to waivers/reimbursements | | | — | % | | | 0.01 | % | | | 0.03 | %4 | | | 0.13 | %4 | | | 0.15 | %4 | |
Portfolio turnover rate | | | 99 | % | | | 84 | % | | | 165 | % | | | 104 | % | | | 43 | % | |
1 Per share information is calculated using the average shares outstanding method.
2 This amount represents less than $0.01 per share.
3 Total returns are historical and assume changes in share price and reinvestment of all dividends and distributions. Had certain expenses not been reduced during the years shown, total returns would have been lower.
4 Effective October 31, 2012, the Fund began reporting operations of its wholly-owned subsidiary on a consolidated basis. Had the Fund reported on a consolidated basis in prior periods, ratio of net expenses to average net assets without fee waivers and/or expense reimbursements would have increased by 0.01%, 0.01% and 0.01% for the years ended October 31, 2009, 2010, and 2011, respectively. The ratio of net expenses to average net assets with fee waivers and/or expense reimbursements would have increased 0.00%, 0.00% and 0.00%, respectively for the same time period. The ratio of net investment income (loss) to average net assets would have increased 0.07%, 0.04% and 0.03% for the years ended October 31, 2009, 2010 and 2011, respectively. This change did not have material impact to net investment income (loss) per share or net realized and unrealized gain (loss) per share.
See Accompanying Notes to Consolidated Financial Statements.
17
Credit Suisse Commodity Return Strategy Fund
Notes to Consolidated Financial Statements
October 31, 2013
Credit Suisse Commodity Return Strategy Fund (the "Fund"), a series of the Credit Suisse Commodity Strategy Funds (the "Trust"), a Delaware statutory trust, is registered under the Investment Company Act of 1940, as amended (the "1940 Act"), as a non-diversified open-end management investment company that seeks total return. The Trust was organized under the laws of the State of Delaware as a statutory trust on May 19, 2004. Effective September 20, 2012, the name of the Trust was changed from Credit Suisse Commodity Return Strategy Fund.
The Fund is registered as a Commodity Pool Operator with the Commodity Futures Trading Commission. The Fund intends to gain exposure to commodities derivatives through investing in a wholly-owned subsidiary, Credit Suisse Cayman Commodity Fund I, Ltd., organized under the laws of the Cayman Islands (the "Subsidiary"). The Subsidiary invests in commodity-linked derivative instruments, such as swaps and futures. The Subsidiary may also invest in debt securities, some of which are intended to serve as margin or collateral for the Subsidiary's derivatives positions.
The Subsidiary is managed by the same portfolio managers that manage the Fund and the accompanying financial statements reflect the financial position of the Fund and its Subsidiary and the results of operations on a consolidated basis. The consolidated financial statements include portfolio holdings of the Fund and the Subsidiary and all intercompany transactions and balances have been eliminated. The Fund may invest up to 25% of its total net assets in the Subsidiary, as of October 31, 2013, the Fund held $891,600,190 in the Subsidiary, representing 17.6% of the Fund's net assets.
The Fund offers three classes of shares: Class I shares, Class A shares and Class C shares. Each class of shares represents an equal pro rata interest in the Fund, except they bear different expenses, which reflect the differences in the range of services provided to them. Class A shares are sold subject to a front-end sales charge of up to 4.75%. Class C shares are sold subject to a contingent deferred sales charge of 1.00% if the shares are redeemed within the first year of purchase.
Note 2. Significant Accounting Policies
The following is a summary of significant accounting policies followed by the Funds in the preparation of their financial statements. The policies are in accordance with accounting principles generally accepted in the United States of America ("GAAP"). The preparation of financial statements requires
18
Credit Suisse Commodity Return Strategy Fund
Notes to Consolidated Financial Statements (continued)
October 31, 2013
Note 2. Significant Accounting Policies
management to make estimates and assumptions that affect the reported amounts and disclosures in the financial statements. Actual results could differ from those estimates.
A) SECURITY VALUATION — The net asset value of the Fund is determined daily as of the close of regular trading on the New York Stock Exchange, Inc. (the "Exchange") on each day the Exchange is open for business. The valuations for fixed income securities (which may include, but are not limited to, corporate, government, municipal, mortgage-backed, collateralized mortgage obligations and asset-backed securities) and certain derivative instruments are typically the prices supplied by independent third party pricing services, which may use market prices or broker/dealer quotations or a variety of valuation techniques and methodologies. The independent third party pricing services use inputs that are observable such as issuer details, interest rates, yield curves, prepayment speeds, credit risks/spreads, default rates and quoted prices for similar securities. Short-term fixed income securities that will mature in 60 days or less are valued at amortized cost unless it is determined that using this method would not reflect an investment's fair value. Structured note agreements are valued in accordance with a dealer-supplied valuation based on changes in the value of the underlying index. Futures contracts are valued daily at the settlement price established by the board of trade or exchange on which they are traded. Equity securities for which market quotations are available are valued at the last reported sales price or official closing price on the primary market or exchange on which they trade. The Fund may utilize a service provided by an independent third party which has been approved by the Board of Trustees to fair value certain securities. When fair value pricing is employed, the prices of securities used by the Fund to calculate its net asset value may differ from quoted or published prices for the same securities. If independent third party pricing services are unable to supply prices for a portfolio investment, or if the prices supplied are deemed by the investment adviser to be unreliable, the market price may be determined by the investment adviser using quotations from one or more broker/dealers or at the transaction price if the security has recently been purchased and no value has yet been obtained from a pricing service or pricing broker. When reliable prices are not readily available, such as when the value of a security has been significantly affected by events after the close of the exchange or market on which the security is principally traded, but before the Fund calculates its net asset value, the Fund values these securities as determined in accordance with procedures approved by the Fund's Board of Trustees.
19
Credit Suisse Commodity Return Strategy Fund
Notes to Consolidated Financial Statements (continued)
October 31, 2013
Note 2. Significant Accounting Policies
The Fund uses valuation techniques to measure fair value that are consistent with the market approach and/or income approach, depending on the type of security and the particular circumstance. The market approach uses prices and other relevant information generated by market transactions involving identical or comparable securities. The income approach uses valuation techniques to discount estimated future cash flows to present value.
GAAP established a disclosure hierarchy that categorizes the inputs to valuation techniques used to value assets and liabilities at measurement date. These inputs are summarized in the three broad levels listed below:
• Level 1 – quoted prices in active markets for identical investments
• Level 2 – other significant observable inputs (including quoted prices for similar investments, interest rates, prepayment speeds, credit risk, etc.)
• Level 3 – significant unobservable inputs (including the Fund's own assumptions in determining the fair value of investments)
The inputs or methodologies used to value securities are not necessarily an indication of the risk associated with investing in those securities.
The following is a summary of the inputs used as of October 31, 2013 in valuing the Fund's assets and liabilities carried at fair value:
| | | Level 1 | | Level 2 | | Level 3 | | Total | |
Investments in Securities | |
Commodity Indexed Structured Notes | | $ | — | | | $ | 138,916,557 | | | $ | — | | | $ | 138,916,557 | | |
United States Agency Obligations | | | — | | | | 3,976,226,739 | | | | — | | | | 3,976,226,739 | | |
United States Treasury Obligations | | | — | | | | 787,765,380 | | | | — | | | | 787,765,380 | | |
Short-Term Investments | | | — | | | | 105,300,900 | | | | — | | | | 105,300,900 | | |
Other Financial Instruments* | |
Futures Contracts | | | 6,806,233 | | | | — | | | | — | | | | 6,806,233 | | |
Swap Contracts | | | — | | | | (47,837,766 | ) | | | — | | | | (47,837,766 | ) | |
| | | $ | 6,806,233 | | | $ | 4,960,371,810 | | | $ | — | | | $ | 4,967,178,043 | | |
*Other financial instruments include futures and swap contracts.
The Fund adopted Financial Accounting Standards Board ("FASB") amendments to authoritative guidance which require the Fund to disclose details of transfers in and out of Level 1 and Level 2 measurements and Level 2 and Level 3 measurements and the reasons for the transfers. For the year ended October 31, 2013, there were no transfers in and out of Level 1, Level 2 and Level 3. All transfers are assumed to occur at the end of the reporting period.
20
Credit Suisse Commodity Return Strategy Fund
Notes to Consolidated Financial Statements (continued)
October 31, 2013
Note 2. Significant Accounting Policies
B) DERIVATIVE INSTRUMENTS AND HEDGING ACTIVITIES — The Fund adopted amendments to authoritative guidance on disclosures about derivative instruments and hedging activities which require that the Fund disclose (a) how and why an entity uses derivative instruments, (b) how derivative instruments and hedging activities are accounted for, and (c) how derivative instruments and related hedging activities affect a fund's financial position, financial performance, and cash flows. The Fund has not entered into any derivative or hedging activities during the period covered by this report. However, the Fund does invest indirectly in derivative instruments through the Subsidiary. For the year ended October 31, 2013, the Fund's derivatives did not qualify for hedge accounting as they are held at fair value.
Fair Values of Derivative Instruments as of October 31, 2013
| | | Asset Derivatives | | Liability Derivatives | |
| | | Balance Sheet
Location | | Fair Value | | Balance Sheet
Location | | Fair Value | |
Commodity Index
Return Contracts | | Unrealized appreciation
on futures contracts | | $ | 10,331,087 | * | | Unrealized depreciation
on futures contracts | | $ | 3,524,854 | * | |
| | | Unrealized appreciation
on open swap contracts | | | 1,797,694 | | | Unrealized depreciation
on open swap contracts | | | 49,635,460 | | |
| | | | | | $ | 12,128,781 | | | | | | | $ | 53,160,314 | | |
*Includes cumulative appreciation/depreciation of futures contracts as reported in the Consolidated Statement of Assets and Liabilities and Notes to Consolidated Financial Statements. Only the current day's variation margin is reported within the Consolidated Statement of Assets and Liabilities.
Effect of Derivative Instruments on the Consolidated Statement of Operations
| | | Location | | Realized
Gain/Loss | | Location | | Net Unrealized
Appreciation/
Depreciation | |
Commodity Index
Return Contracts | | Net realized gain from
futures contracts | | $ | 1,157,490 | | | Net change in unrealized
appreciation
(depreciation) from
futures contracts | | $ | 6,646,387 | | |
| | | Net realized loss from
swap contracts | | | (594,421,251 | ) | | Net change in unrealized
appreciation
(depreciation) from
swap contracts | | | (7,591,825 | ) | |
| | | | | | | $ | (593,263,761 | ) | | | | | | $ | (945,438 | ) | |
The notional amount of futures contracts and swap contracts at year ended October 31, 2013, are reflected in the Notes to Consolidated Financial Statements. The notional amounts of long and short open positions of futures contracts and swap contracts at each month ended throughout the reporting
21
Credit Suisse Commodity Return Strategy Fund
Notes to Consolidated Financial Statements (continued)
October 31, 2013
Note 2. Significant Accounting Policies
period averaged approximately 6.4% and 90.3%, respectively of net assets of the Fund.
C) SECURITY TRANSACTIONS AND INVESTMENT INCOME/EXPENSE — Security transactions are accounted for on a trade date basis. Interest income/expense is recorded on the accrual basis. The Fund amortizes premiums and accretes discounts using the effective interest method. Dividend income/expense is recorded on the ex-dividend date. Certain expenses are class-specific expenses vary by class and are charged only to that class. Income, expenses (excluding class-specific expenses) and realized/unrealized gains/losses are allocated proportionately to each class of shares based upon the relative net asset value of the outstanding shares of that class. The cost of investments sold is determined by use of the specific identification method for both financial reporting and income tax purposes.
D) DIVIDENDS AND DISTRIBUTIONS TO SHAREHOLDERS — Dividends from net investment income, if any, are declared and paid quarterly. Distributions of net realized capital gains, if any, are declared and paid at least annually. However, to the extent that a net realized capital gain can be reduced by a capital loss carryforward, such gain will not be distributed. Income and capital gain distributions are determined in accordance with federal income tax regulations, which may differ from GAAP.
E) FEDERAL INCOME TAXES — No provision is made for federal taxes as it is the Fund's intention to continue to qualify for and elect the tax treatment applicable to regulated investment companies ("RIC") under the Internal Revenue Code of 1986, as amended (the "Code"), and to make the requisite distributions to its shareholders, which will be sufficient to relieve it from federal income and excise taxes.
In order to qualify as a RIC under the Code, the Fund must meet certain requirements regarding the source of its income, the diversification of its assets and the distribution of its income. One of these requirements is that the Fund derive at least 90% of its gross income for each taxable year from dividends, interest, payments with respect to certain securities loans, gains from the sale or other disposition of stock, securities or foreign currencies, other income derived with respect to its business of investing in such stock, securities or currencies or net income derived from interests in certain publicly traded partnerships ("Qualifying Income"). The Fund may seek to track the performance of the Dow Jones-UBS Commodity Index Total Return ("DJ-UBS Index") through investing in structured notes designed to track the
22
Credit Suisse Commodity Return Strategy Fund
Notes to Consolidated Financial Statements (continued)
October 31, 2013
Note 2. Significant Accounting Policies
performance of the DJ-UBS Index. The Fund has received a private letter ruling from the IRS which confirms that the Fund's use of certain types of structured notes designed to track the performance of the DJ-UBS Index produce Qualifying Income. In addition, the Fund may, through its investment in the Subsidiary, seek to track the performance of the DJ-UBS Index by the Subsidiary's investments in commodity-linked swaps and/or futures contracts. The Fund has obtained a private letter ruling from the IRS that its investment in the Subsidiary will produce Qualifying Income. If the Fund is unable to ensure continued qualification as a RIC, the Fund may be required to change its investment objective, policies or techniques, or may be liquidated. If the Fund fails to qualify as a RIC, the Fund will be subject to federal income tax on its net income and capital gains at regular corporate rates (without reduction for distributions to shareholders). If the Fund were to fail to qualify as a RIC and become subject to federal income tax, shareholders of the Fund would be subject to the risk of diminished returns.
The Fund adopted the authoritative guidance for uncertainty in income taxes and recognizes a tax benefit or liability from an uncertain position only if it is more likely than not that the position is sustainable based solely on its technical merits and consideration of the relevant taxing authority's widely understood administrative practices and procedures. The Fund has reviewed its current tax positions and has determined that no provision for income tax is required in the Fund's financial statements. The Fund's federal tax returns for the prior three fiscal years remain subject to examination by the Internal Revenue Service.
F) SHORT-TERM INVESTMENTS — The Fund, together with other funds/portfolios advised by Credit Suisse Asset Management, LLC ("Credit Suisse"), an indirect, wholly-owned subsidiary of Credit Suisse Group AG, pools available cash into a short-term variable rate time deposit issued by State Street Bank and Trust Company ("SSB"), the Fund's custodian. The short-term time deposit issued by SSB is a variable rate account classified as a short-term investment.
G) FUTURES — The Fund may enter into futures contracts to the extent permitted by its investment policies and objectives. The Fund may use futures contracts to gain exposure to, or hedge against changes in commodities. Upon entering into a futures contract, the Fund is required to deposit cash and/or pledge U.S. Government securities as initial margin. Subsequent payments, which are dependent on the daily fluctuations in the value of the underlying instrument, are made or received by the Fund each day (daily variation margin)
23
Credit Suisse Commodity Return Strategy Fund
Notes to Consolidated Financial Statements (continued)
October 31, 2013
Note 2. Significant Accounting Policies
and are recorded as unrealized gains or losses until the contracts are closed. When the contracts are closed, the Fund records a realized gain or loss equal to the difference between the proceeds from (or cost of) the closing transactions and the Fund's basis in the contract. Risks of entering into futures contracts for hedging purposes include the possibility that a change in the value of the contract may not correlate with the changes in the value of the underlying instruments. With futures, there is minimal counterparty credit risk to the Fund since futures are exchange traded and the exchange's clearinghouse, as counterparty to all exchange traded futures, guarantees the futures against default. In addition, the purchase of a futures contract involves the risk that the Fund could lose more than the original margin deposit and subsequent payments may be required for a futures transaction. At October 31, 2013, the Fund had the following open futures contracts and the amount of restricted cash due to the brokers was $216,108:
Contract Description | | Currency | | Expiration
Date | | Notional
Value | | Net Unrealized
Appreciation/
(Depreciation) | |
Contracts to Purchase | |
Energy | | | | | | | | | | | | | | | | | |
| | | USD | | | | Apr 2014 | | $ | 22,318,900 | | | $ | (3,516,014 | ) | |
| | | USD | | | | Dec 2014 | | | 109,940,460 | | | | (8,840 | ) | |
| | | | | | | | | $ | (3,524,854 | ) | |
Contracts to Sell | |
Energy | | | | | | | | | | | | | | | | | |
| | | USD | | | | Dec 2013 | | $ | (57,731,620 | ) | | $ | 3,612,997 | | |
| | | USD | | | | Jan 2014 | | | (57,893,350 | ) | | | 1,102,122 | | |
| | | USD | | | | Mar 2014 | | | (22,460,120 | ) | | | 5,615,968 | | |
| | | | | | | | | $ | 10,331,087 | | |
Net unrealized appreciation (depreciation) | | | | | | | | $ | 6,806,233 | | |
H) SWAPS — The Fund may enter into commodity index swaps either for hedging purposes or to seek to increase total return. A swap contract is an agreement that obligates two parties to exchange a series of cash flows at specified intervals based upon or calculated by reference to changes in specified prices or rates for a specified amount of an underlying asset or notional principal amount. The Fund will enter into swap contracts only on a net basis, which means that the two payment streams are netted out, with the Fund receiving or paying, as the case may be, only the net amount of the two payments. Risks may arise as a result of the failure of the counterparty to the swap contract to comply with the terms of the swap contract. The extent of the
24
Credit Suisse Commodity Return Strategy Fund
Notes to Consolidated Financial Statements (continued)
October 31, 2013
Note 2. Significant Accounting Policies
Fund's exposure to credit and counterparty risks is the discounted net value of the cash flows to be received from/paid to the counterparty over the contract's remaining life, to the extent that the amount is positive. These risks are mitigated by having a master netting arrangement between the Fund and the counterparty and by the posting of collateral by the counterparty to the Fund to cover the Fund's exposure to the counterparty. Therefore, the Fund considers the creditworthiness of each counterparty to a swap contract in evaluating potential credit risk. Additionally, risks may arise from unanticipated movements in interest rates or in the value of the underlying reference asset or index.
The Fund may enter into total return swap contracts, involving commitments to pay interest in exchange for a market-linked return, both based on notional amounts. To the extent the total return of the security or index underlying the transactions exceeds or falls short of the offsetting interest rate obligation, the Fund will receive a payment from or make a payment to the counterparty.
The Fund records unrealized gains or losses on a daily basis representing the value and the current net receivable or payable relating to open swap contracts. Net amounts received or paid on the swap contract are recorded as realized gains or losses. Fluctuations in the value of swap contracts are recorded for financial statement purposes as unrealized appreciation or depreciation on swap contracts. Realized gains and losses from terminated swaps are included in net realized gains/losses on swap contracts transactions. At October 31, 2013, the Fund had the following outstanding swap contracts and the amount of restricted cash held at brokers was $223,273,585:
Currency | | Notional
Amount | | Expiration
Date | | Counterparty | | Receive | | Pay | | Net Unrealized
Appreciation/
(Depreciation) | |
USD | | | | $ | 87,400,114 | | | 11/22/13 | | Bank of America | | Commodity
Index Return1 | | Fee Plus
Treasury Bill Rate | | $ | (874,563 | ) | |
USD | | | | $ | 355,694,197 | | | 11/22/13 | | Bank of America | | Commodity
Index Return1 | | Fee Plus
Treasury Bill Rate | | | (3,222,436 | ) | |
USD | | | | $ | 98,305,243 | | | 11/22/13 | | Bank of America | | Commodity
Index Return1 | | Fee Plus
Treasury Bill Rate | | | (893,519 | ) | |
USD | | | | $ | 49,641,148 | | | 11/22/13 | | Bank of America | | Commodity
Index Return1 | | Fee Plus
Treasury Bill Rate | | | (412,755 | ) | |
USD | | | | $ | 200,809,099 | | | 11/22/13 | | Bank of America | | Commodity
Index Return1 | | Fee Plus
Treasury Bill Rate | | | (2,009,712 | ) | |
USD | | | | $ | 42,021,727 | | | 11/22/13 | | Barclays | | Commodity
Index Return1 | | Fee Plus
Treasury Bill Rate | | | (420,625 | ) | |
USD | | | | $ | 364,978,771 | | | 11/22/13 | | Barclays | | Commodity
Index Return1 | | Fee Plus
Treasury Bill Rate | | | (3,306,951 | ) | |
25
Credit Suisse Commodity Return Strategy Fund
Notes to Consolidated Financial Statements (continued)
October 31, 2013
Note 2. Significant Accounting Policies
Currency | | Notional
Amount | | Expiration
Date | | Counterparty | | Receive | | Pay | | Net Unrealized
Appreciation/
(Depreciation) | |
USD | | | | $ | 54,530,365 | | | 11/22/13 | | BNP Paribas | | Commodity
Index Return1 | | Fee Plus
Treasury Bill Rate | | $ | (546,113 | ) | |
USD | | | | $ | 52,219,328 | | | 11/22/13 | | BNP Paribas | | Commodity
Index Return1 | | Fee Plus
Treasury Bill Rate | | | (473,038 | ) | |
USD | | | | $ | 202,784,248 | | | 11/22/13 | | CIBC | | Commodity
Index Return1 | | Fee Plus
Treasury Bill Rate | | | (2,029,813 | ) | |
USD | | | | $ | 162,854,662 | | | 11/22/13 | | CIBC | | Commodity
Index Return1 | | Fee Plus
Treasury Bill Rate | | | (1,475,125 | ) | |
USD | | | | $ | 491,250,651 | | | 11/22/13 | | Citigroup | | Commodity
Index Return1 | | Fee Plus
Treasury Bill Rate | | | (4,449,443 | ) | |
USD | | | | $ | 174,152,063 | | | 11/22/13 | | Goldman Sachs | | Commodity
Index Return1 | | Fee Plus
Treasury Bill Rate | | | (1,743,022 | ) | |
| | | | | | | | | | | Commodity | | Fee Plus | | | | | |
USD | | | | $ | 105,973,035 | | | 11/22/13 | | Goldman Sachs | | Index Return1 | | Treasury Bill Rate | | | (959,954 | ) | |
USD | | | | $ | 24,254,949 | | | 11/22/13 | | JPMorgan Chase | | Commodity
Index Return1 | | Fee Plus
Treasury Bill Rate | | | (242,772 | ) | |
USD | | | | $ | 486,614,685 | | | 11/22/13 | | JPMorgan Chase | | Commodity
Index Return1 | | Fee Plus
Treasury Bill Rate | | | (4,407,186 | ) | |
USD | | | | $ | 19,858,762 | | | 11/22/13 | | Macquarie | | Commodity
Index Return1 | | Fee Plus
Treasury Bill Rate | | | (198,759 | ) | |
USD | | | | $ | 278,817,961 | | | 11/22/13 | | Macquarie | | Commodity
Index Return1 | | Fee Plus
Treasury Bill Rate | | | (2,524,290 | ) | |
USD | | | | $ | 179,594,934 | | | 11/22/13 | | Morgan Stanley | | Fee Plus
Treasury Bill Rate | | Commodity
Index Return1 | | | 1,797,694 | | |
USD | | | | $ | 44,113,394 | | | 11/22/13 | | Morgan Stanley | | Commodity
Index Return1 | | Fee Plus
Treasury Bill Rate | | | (399,576 | ) | |
USD | | | | $ | 515,333,957 | | | 12/23/13 | | Morgan Stanley | | Commodity
Index Return1 | | Fee Plus
Treasury Bill Rate | | | (7,661,594 | ) | |
USD | | | | $ | 109,894,273 | | | 12/23/13 | | Morgan Stanley | | Commodity
Index Return1 | | Fee Plus
Treasury Bill Rate | | | (1,447,089 | ) | |
USD | | | | $ | 232,964,360 | | | 11/22/13 | | Societe Generale | | Commodity
Index Return1 | | Fee Plus
Treasury Bill Rate | | | (2,331,779 | ) | |
USD | | | | $ | 212,144,082 | | | 11/22/13 | | Societe Generale | | Commodity
Index Return1 | | Fee Plus
Treasury Bill Rate | | | (1,922,167 | ) | |
USD | | | | $ | 249,613,727 | | | 11/22/13 | | UBS | | Commodity
Index Return1 | | Fee Plus
Treasury Bill Rate | | | (3,711,067 | ) | |
USD | | | | $ | 149,640,839 | | | 11/22/13 | | UBS | | Commodity
Index Return1 | | Fee Plus
Treasury Bill Rate | | | (1,972,112 | ) | |
| | | $ | (47,837,766 | ) | |
1 The Commodity Index Return is comprised of futures contracts on physical commodities.
26
Credit Suisse Commodity Return Strategy Fund
Notes to Consolidated Financial Statements (continued)
October 31, 2013
Note 2. Significant Accounting Policies
I) COMMODITY INDEXED STRUCTURED NOTES — The Fund may invest in structured notes whose value is based on the price movements of the DJ-UBS Index. The structured notes are often leveraged, increasing the volatility of each note's value relative to the change in the underlying linked financial element. The value of these notes will rise and fall in response to changes in the underlying commodity index. Structured notes may entail a greater degree of market risk than other types of debt securities because the investor bears the risk of the underlying commodity index. Structured notes may also be more volatile, less liquid, and more difficult to accurately price than less complex securities or more traditional debt securities. Fluctuations in the value of the structured notes are recorded as unrealized gains and losses in the accompanying financial statements. Net payments are recorded as interest income. These notes are subject to prepayment, credit and interest risks. The Fund has the option to request prepayment from the issuer. At maturity, or when a note is sold, the Fund records a realized gain or loss. At October 31, 2013, the value of these securities comprised 2.7% of the Fund's net assets and resulted in unrealized appreciation (depreciation) of $60,583,443.
J) SECURITIES LENDING — Loans of securities are required at all times to be secured by collateral at least equal to 102% of the market value of domestic securities on loan (including any accrued interest thereon) and 105% of the market value of foreign securities on loan (including any accrued interest thereon). Cash collateral received by the Fund in connection with securities lending activity may be pooled together with cash collateral for other funds/portfolios advised by Credit Suisse and may be invested in a variety of investments, including funds advised by SSB, the Fund's securities lending agent, or money market instruments. However, in the event of default or bankruptcy by the other party to the agreement, realization and/or retention of the collateral may be subject to legal proceedings.
SSB has been engaged by the Fund to act as the Fund's securities lending agent. As of October 31, 2013, the Fund had investment securities on loan with a fair value of $15,722,358 and a related liability of $16,044,900 for collateral received on securities loaned, both of which are presented gross on the Consolidated Statement of Assets and Liabilities. The carrying value of the collateral for securities loaned approximates fair value which would have been considered level 2 under the fair value hierarchy if the collateral for securities loaned were carried at fair value.
The Fund's securities lending arrangement provides that the Fund and SSB will share the net income earned from securities lending activities. During the
27
Credit Suisse Commodity Return Strategy Fund
Notes to Consolidated Financial Statements (continued)
October 31, 2013
Note 2. Significant Accounting Policies
year ended October 31, 2013, total earnings from the Fund's investment in cash collateral received in connection with securities lending arrangements was $123,144, of which $41,631 was rebated to borrowers (brokers). The Fund retained $69,747 in income from the cash collateral investment, and SSB, as lending agent, was paid $11,766. Securities lending income is accrued as earned.
K) OTHER — In the normal course of business the Fund trades financial instruments and enters into financial transactions where risk of potential loss exists due to changes in the market (market risk) or failure of the other party to a transaction to perform (credit risk). Similar to credit risk, the Fund may be exposed to counterparty risk, or the risk that an institution or other entity with which the Fund has unsettled or open transactions will default. The potential loss could exceed the value of the financial assets recorded in the financial statements. Financial assets, which potentially expose the Fund to credit risk, consist principally of cash due from counterparties and investments. The extent of the Fund's exposure to credit and counterparty risks in respect to these financial assets approximates their carrying value as recorded in the Fund's Consolidated Statement of Assets and Liabilities.
L) NEW ACCOUNTING PRONOUNCEMENTS — In December 2011, the Financial Accounting Standards Board issued Accounting Standards Update ("ASU") No. 2013-1, Balance Sheet (Topic 210): Disclosures about Offsetting Assets and Liabilities. The amendments in the ASU enhance disclosures about offsetting of financial assets and liabilities to enable investors to understand the effect of these arrangements on a fund's financial position. The ASU is effective for interim and annual reporting periods beginning on or after January 1, 2013. The Fund believes the adoption of this ASU will not have a material impact on its financial statements.
M) SUBSEQUENT EVENTS — In preparing the financial statements as of October 31, 2013, management considered the impact of subsequent events for potential recognition or disclosure in these financial statements through the date of release of this report. No such events requiring recognition or disclosure were identified through the date of the release of this report.
Note 3. Transactions with Affiliates and Related Parties
Credit Suisse serves as investment adviser for the Fund. For its investment advisory services, Credit Suisse is entitled to receive a fee from the Fund at an annual rate of 0.50% of the Fund's average daily net assets. For the year ended
28
Credit Suisse Commodity Return Strategy Fund
Notes to Consolidated Financial Statements (continued)
October 31, 2013
Note 3. Transactions with Affiliates and Related Parties
October 31, 2013, investment advisory fees earned were $26,891,054. Effective January 1, 2011, Credit Suisse contractually waives fees and reimburses expenses so that the Fund's annual operating expenses will not exceed 0.80% of the Fund's average daily net assets for Class I shares, 1.05% of the Fund's average daily net assets for Class A shares, and 1.80% of the Fund's average daily net assets for Class C shares. Fee waivers and expense reimbursements are voluntary and may be discontinued by Credit Suisse at any time.
Credit Suisse and SSB serve as co-administrators to the Fund. For its co-administrative services, Credit Suisse received a fee calculation at an annual rate of 0.09% of the Fund's average daily net assets. For the year ended October 31, 2013, co-administrative services fees earned by Credit Suisse were $4,840,390.
For its co-administrative services, SSB receives a fee, exclusive of out-of-pocket expenses, calculated in total for all the Credit Suisse funds/portfolios co-administered by SSB and allocated based upon the relative average net assets of each fund/portfolio, subject to an annual minimum fee. For the year ended October 31, 2013, co-administrative services fees earned by SSB (including out-of-pocket expenses) with respect to the Fund were $823,781.
Credit Suisse Securities (USA) LLC ("CSSU"), an affiliate of Credit Suisse, serves as distributor of the Fund's shares. Pursuant to distribution plans adopted by the Fund pursuant to Rule 12b-1 under the 1940 Act, CSSU received fees for its distribution services. These fees were calculated at an annual rate of 0.25% of the average daily net assets of the Class A shares. For the Class C shares, the fee is calculated at an annual rate of 1.00% of the average daily net assets. For the year ended October 31, 2013, the Fund's paid Rule 12b-1 distribution fees were $1,384,017 for Class A shares and $262,013 for Class C shares. Class I shares are not subject to distribution fees.
Certain brokers, dealers and financial representatives provide transfer agent related services to the Fund and receive compensation from Credit Suisse. Credit Suisse is then reimbursed by the Fund. For the year ended October 31, 2013, the Fund reimbursed Credit Suisse $6,178,605, which is included in the Fund's transfer agent expense.
For the year ended October 31, 2013, CSSU and its affiliates advised the Fund that it retained $3,291 from commissions earned on the sale of the Fund's Class A shares.
29
Credit Suisse Commodity Return Strategy Fund
Notes to Consolidated Financial Statements (continued)
October 31, 2013
Note 3. Transactions with Affiliates and Related Parties
Merrill Corporation ("Merrill"), an affiliate of Credit Suisse, has been engaged by the Fund to provide certain financial printing services. For the year ended October 31, 2013, Merrill was paid $118,929 for its services by the Fund. This amount was included in the printing fees presented on the Consolidated Statement of Operations.
Note 4. Line of Credit
The Fund, together with other funds/portfolios advised by Credit Suisse (collectively, the "Participating Funds"), participates in a committed, unsecured line of credit facility ("Credit Facility"), in an aggregated amount of $20 million for temporary or emergency purposes with SSB. Under the terms of the Credit Facility, the Participating Funds pay an aggregate commitment fee on the average unused amount of the Credit Facility, which is allocated among the Participating Funds in such manner as is determined by the governing Boards of the Participating Funds. In addition, the Participating Funds pay interest on borrowings at either the Overnight Federal Funds rate or the Overnight LIBOR rate plus a spread. At October 31, 2013, and during the year ended October 31, 2013, the Fund had no borrowings outstanding under the Credit Facility.
Note 5. Purchases and Sales of Securities
For the year ended October 31, 2013, purchases and sales of investment securities (excluding short-term investments) and U.S. Government and Agency Obligations were as follows:
Investment Securities | | U.S. Government/
Agency Obligations | |
| Purchases | | Sales | | Purchases | | Sales | |
| $ | 199,500,000 | | | $ | 181,501,143 | | | $ | 5,229,583,584 | | | $ | 3,722,324,918 | | |
30
Credit Suisse Commodity Return Strategy Fund
Notes to Consolidated Financial Statements (continued)
October 31, 2013
Note 6. Capital Share Transactions
The Fund is authorized to issue an unlimited number of full and fractional shares of beneficial interest, $.001 par value per share. The Fund offers Class I, Class A and Class C shares. Transactions in capital shares for each class of the Fund were as follows:
| | | Class I | |
| | | For the Year Ended
October 31, 2013 | | For the Year Ended
October 31, 2012 | |
| | | Shares | | Value | | Shares | | Value | |
Shares sold | | | 376,472,288 | | | $ | 2,854,250,011 | | | | 352,980,055 | | | $ | 2,887,759,989 | | |
Shares issued in reinvestment
of dividends and distributions | | | — | | | | — | | | | 620,146 | | | | 4,942,561 | | |
Shares redeemed | | | (306,308,717 | ) | | | (2,322,678,327 | ) | | | (317,603,036 | ) | | | (2,593,267,517 | ) | |
Net increase | | | 70,163,571 | | | $ | 531,571,684 | | | | 35,997,165 | | | $ | 299,435,033 | | |
| | | Class A | |
| | | For the Year Ended
October 31, 2013 | | For the Year Ended
October 31, 2012 | |
| | | Shares | | Value | | Shares | | Value | |
Shares sold | | | 31,707,716 | | | $ | 240,394,114 | | | | 46,731,389 | | | $ | 382,720,738 | | |
Shares issued in reinvestment
of dividends and distributions | | | — | | | | — | | | | 151,835 | | | | 1,199,498 | | |
Shares redeemed | | | (61,703,647 | ) | | | (453,780,698 | ) | | | (102,741,567 | ) | | | (821,263,940 | ) | |
Net decrease | | | (29,995,931 | ) | | $ | (213,386,584 | ) | | | (55,858,343 | ) | | $ | (437,343,704 | ) | |
| | | Class C | |
| | | For the Year Ended
October 31, 2013 | | For the Year Ended
October 31, 2012 | |
| | | Shares | | Value | | Shares | | Value | |
Shares sold | | | 597,627 | | | $ | 4,433,138 | | | | 615,769 | | | $ | 4,953,281 | | |
Shares issued in reinvestment
of dividends and distributions | | | — | | | | — | | | | 3,826 | | | | 29,534 | | |
Shares redeemed | | | (1,749,181 | ) | | | (12,892,254 | ) | | | (1,995,124 | ) | | | (15,741,812 | ) | |
Net decrease | | | (1,151,554 | ) | | $ | (8,459,116 | ) | | | (1,375,529 | ) | | $ | (10,758,997 | ) | |
The Fund imposes a redemption fee of 2% of the value of all classes of shares currently being offered that are redeemed or exchanged within 30 days from the date of purchase. Reinvested dividends and distributions are not subject to the fee. The fee is charged based on the value of shares at redemption, is paid directly to the Fund and becomes part of the Fund's daily net asset value calculation. When shares are redeemed that are subject to the fee, reinvested dividends and distributions are redeemed first, followed by the shares held
31
Credit Suisse Commodity Return Strategy Fund
Notes to Consolidated Financial Statements (continued)
October 31, 2013
Note 6. Capital Share Transactions
longest. For the years ended October 31, 2013 and 2012, respectively, the redemption fees received by the Fund were $282,590 and $433,448. On or about January 31, 2014, the redemption fee will be eliminated.
On October 31, 2013, the number of shareholders that held 5% or more of the outstanding shares of each class of the Fund was as follows:
| | | Number of
Shareholders | | Approximate Percentage
of Outstanding Shares | |
Class I | | | 4 | | | | 61 | % | |
Class A | | | 4 | | | | 74 | % | |
Class C | | | 4 | | | | 72 | % | |
Some of the shareholders are omnibus accounts, which hold shares on behalf of individual shareholders.
Note 7. Federal Income Taxes
Income and capital gain distributions are determined in accordance with federal income tax regulations, which may differ from GAAP.
The tax characteristics of dividends paid during the years ended October 31, 2013 and 2012, respectively, by the Fund were as follows:
Long-Term Capital Gain | |
| 2013 | | 2012 | |
| $ | — | | | $ | 8,448,178 | | |
At October 31, 2013, the components of distributable earnings on a tax basis were as follows:
Late year ordinary loss deferral | | $ | (27,440,052 | ) | |
Accumulated realized loss | | | (26,221,130 | ) | |
Unrealized depreciation | | | (97,121,413 | ) | |
| | $ | (150,782,595 | ) | |
At October 31, 2013, the Fund had $26,221,130 of unlimited long-term capital loss carryforwards available to offset possible future capital gains.
Under the Regulated Investment Company Modernization Act of 2010, the Fund will be permitted to carry forward capital losses incurred in taxable years beginning after December 22, 2010 for an unlimited period. However, any losses incurred during those future taxable years will be required to be utilized prior to the losses incurred in pre-enactment taxable years. As a result of this
32
Credit Suisse Commodity Return Strategy Fund
Notes to Consolidated Financial Statements (continued)
October 31, 2013
Note 7. Federal Income Taxes
ordering rule, pre-enactment capital loss carryforwards may be more likely to expire unused. Additionally, post-enactment capital losses that are carried forward will retain their character as either short-term or long-term capital losses rather than being considered all short-term as under previous law. It is uncertain whether the Fund will be able to realize the full benefits of the capital loss carryforwards before they expire.
During the tax year ended October 31, 2013, the Fund did not utilize any of the capital loss carryforwards.
At October 31, 2013, the cost of investments (excluding foreign currency related transactions) and net unrealized appreciation (depreciation) for income tax purposes were as follows:
Cost of Investments | | $ | 5,064,299,456 | | |
Unrealized appreciation | | $ | 4,497,290 | | |
Unrealized depreciation | | | (60,587,170 | ) | |
Net unrealized appreciation (depreciation) | | $ | (56,089,880 | ) | |
At October 31, 2013, the Fund reclassified $32,863,796 from accumulated net investment loss and $593,097,193 from accumulated net realized loss to paid in capital, to adjust for current period permanent book/tax differences. These permanent differences are due to differing book/tax treatment of net operating losses. Net assets were not affected by these reclassifications.
Note 8. Contingencies
In the normal course of business, the Fund may provide general indemnifications pursuant to certain contracts and organizational documents. The Fund's maximum exposure under these arrangements is dependent on future claims that may be made against the Fund and, therefore, cannot be estimated; however, based on experience, the risk of loss from such claims is considered remote.
33
Credit Suisse Commodity Return Strategy Fund
Report of Independent Registered Public Accounting Firm
To the Board of Directors and Shareholders of Credit Suisse Commodity Return Strategy Fund:
In our opinion, the accompanying consolidated statement of assets and liabilities, including the consolidated schedule of investments, and the related consolidated statements of operations and of changes in net assets and the financial highlights present fairly, in all material respects, the financial position of Credit Suisse Commodity Return Strategy Fund and its subsidiary (the "Fund") at October 31, 2013, the results of their operations for the year then ended, the changes in their net assets for each of the two years in the period then ended and the financial highlights for each of the five years in the period then ended, in conformity with accounting principles generally accepted in the United States of America. These financial statements and financial highlights (hereafter referred to as "financial statements") are the responsibility of the Fund's management; our responsibility is to express an opinion on these financial statements based on our audits. We conducted our audits of these financial statements in accordance with the standards of the Public Company Accounting Oversight Board (United States). Those standards require that we plan and perform the audit to obtain reasonable assurance about whether the financial statements are free of material misstatement. An audit includes examining, on a test basis, evidence supporting the amounts and disclosures in the financial statements, assessing the accounting principles used and significant estimates made by management, and evaluating the overall financial statement presentation. We believe that our audits, which included confirmation of securities at October 31, 2013 by correspondence with the custodian and brokers, provide a reasonable basis for our opinion.
PricewaterhouseCoopers LLP
New York, New York
December 27, 2013
34
Credit Suisse Commodity Return Strategy Fund
Information Concerning Trustees and Officers (unaudited)
Name, Address
(Year of Birth) | | Position(s)
Held with
Fund | | Term
of Office1
and
Length
of Time
Served | | Principal
Occupation(s) During
Past Five Years | | Number of
Portfolios
in Fund
Complex
Overseen
by Trustee | | Other
Directorships
Held by Trustee | |
Independent Trustees | | | | | | | | | | | |
Enrique Arzac
c/o Credit Suisse Asset
Management, LLC
Attn: General Counsel
Eleven Madison Avenue
New York, New York
10010
(1941) | | Trustee, Audit Committee Chairman and Nominating Committee Member | | Since 2005 | | Professor of Finance and Economics, Graduate School of Business, Columbia University since 1971. | | | 11 | | | Director of The Adams Express Company, Petroleum and Resources Corporation, Aberdeen Chile Fund, Inc., Aberdeen Emerging Markets Smaller Company Opportunities Fund, Inc., Aberdeen Israel Fund, Inc., Aberdeen Indonesia Fund, Inc. and Aberdeen Latin America Equity Fund, Inc. (each a closed-end investment company); Director of Aberdeen Asia-Pacific Income Investment Company Limited (a Canadian closed-end fund); Trustee of Mirae Asset Discovery Funds (6 open-end portfolios); Director of Starcomms PLC. (telecommunications company) from 2008 to 2011; Director of Epoch Holding Corporation (an investment management and investment advisory services company) from 2006 to March 2013. | |
35
Credit Suisse Commodity Return Strategy Fund
Information Concerning Trustees and Officers (unaudited) (continued)
Name, Address
(Year of Birth) | | Position(s)
Held with
Fund | | Term
of Office1
and
Length
of Time
Served | | Principal
Occupation(s) During
Past Five Years | | Number of
Portfolios
in Fund
Complex
Overseen
by Trustee | | Other
Directorships
Held by Trustee | |
Independent Trustees | | | | | | | | | | | |
Jeffrey E. Garten
Box 208200
New Haven, Connecticut
06520-8200
(1946) | | Trustee, Audit and Nominating Committee Member | | Since Fund Inception | | The Juan Trippe Professor in the Practice of International Trade, Finance and Business, Yale School of Management, from July 2005 to present; Partner and Chairman of Garten Rothkopf (consulting firm) from October 2005 to present. | | | 9 | | | Director of Aetna, Inc. (insurance company); Director of CarMax Group (used car dealers); Director of Alcan (aluminum production) from February 2007 to November 2007; Member of Standard & Poor's Board of Managers (credit rating agency); Director of Miller Buckfire & Co., LLC (financial restructuring). | |
Steven N. Rappaport
Lehigh Court, LLC
555 Madison Avenue
29th Floor
New York, New York
10022
(1948) | | Chairman of the Board of Trustees, Audit Committee Member and Nominating Committee Chairman | | Trustee since Fund Inception and Chairman since 2005 | | Partner of Lehigh Court, LLC and RZ Capital (private investment firms) from July 2002 to present. | | | 11 | | | Director of iCAD, Inc. (surgical and medical instruments and apparatus company); Director of Wood Resources, LLC. (plywood manufacturing company); Director of Aberdeen Chile Fund, Inc., Aberdeen Emerging Markets Smaller Company Opportunities Fund, Inc., Aberdeen Israel Fund, Inc., Aberdeen Indonesia Fund, Inc. and Aberdeen Latin America Equity Fund, Inc. (each a closed-end investment company); Director of Presstek, Inc. (digital imaging technologies company) from 2003 to 2012. | |
1 Each Trustee and Officer serves until his or her respective successor has been duly elected and qualified.
36
Credit Suisse Commodity Return Strategy Fund
Information Concerning Trustees and Officers (unaudited) (continued)
Name, Address
(Year of Birth) | | Position(s)
Held with
Fund | | Term of
Office1
and
Length of
Time
Served | | Principal Occupation(s) During Past Five Years | |
Officers* | | | | | | | |
John G. Popp
Credit Suisse Asset
Management, LLC
One Madison Avenue
New York, New York 10010
(1956) | | Chief Executive Officer and President | | Since 2010 | | Managing Director of Credit Suisse; Global Head and Chief Investment Officer of the Credit Investment Group; Associated with Credit Suisse or its predecessor since 1997; Officer of other Credit Suisse Funds; Trustee of Credit Suisse High Yield Bond Fund; Director of Credit Suisse Asset Management Income Fund, Inc. | |
Bruce Rosenberg
Credit Suisse Asset
Management, LLC
One Madison Avenue
New York, New York 10010
(1961) | | Chief Financial Officer | | Since 2012 | | Director of Credit Suisse; Director of Liquid Accounting of Credit Suisse; Associated with Credit Suisse since 2008; Officer of other Credit Suisse Funds. | |
Emidio Morizio
Credit Suisse Asset
Management, LLC
Eleven Madison Avenue
New York, New York 10010
(1966) | | Chief Compliance Officer | | Since 2004 | | Managing Director and Global Head of Compliance of Credit Suisse since 2010; Director and Global Head of Compliance of Credit Suisse from January 2005 to December 2009; Associated with Credit Suisse since July 2000; Officer of other Credit Suisse Funds. | |
Joanne Doldo
Credit Suisse Asset
Management, LLC
Eleven Madison Avenue
New York, New York 10010
(1959) | | Chief Legal Officer | | Since 2013 | | Vice President of Credit Suisse; Associated with Credit Suisse since September 2011; Officer of other Credit Suisse Funds; Associated with Morgan Stanley Investment Management from 2002-2008. | |
Rocco DelGuercio
Credit Suisse Asset
Management, LLC
One Madison Avenue
New York, New York 10010
(1963) | | Treasurer | | Since 2013 | | Vice President of Credit Suisse since 2013; Independent Consultant from February 2012 to April 2013; Director of Legg Mason & Co., LLC from March 2004 to January 2012; Associated with Credit Suisse from June 1996 to March 2004; Officer of other Credit Suisse Funds. | |
Karen Regan
Credit Suisse Asset
Management, LLC
Eleven Madison Avenue
New York, New York 10010
(1963) | | Senior Vice President and Secretary | | Since 2010 | | Vice President of Credit Suisse; Associated with Credit Suisse since December 2004; Officer of other Credit Suisse Funds. | |
* The officers of the Fund shown are officers that make policy decisions.
The Statement of Additional Information includes additional information about the Trustees and is available, without charge, upon request, by calling 877-870-2874.
37
Credit Suisse Commodity Return Strategy Fund
Proxy Voting and Portfolio Holdings Information (unaudited)
Information regarding how the Fund voted proxies related to its portfolio securities during the 12 month period ended June 30 of each year, as well as the policies and procedures that the Fund uses to determine how to vote proxies relating to its portfolio securities are available:
• By calling 1-877-870-2874
• On the Fund's website, www.credit-suisse.com/us/funds
• On the website of the Securities and Exchange Commission, www.sec.gov.
The Fund files a complete schedule of its portfolio holdings for the first and third quarters of its fiscal year with the SEC on Form N-Q. The Fund's Forms N-Q are available on the SEC's website at www.sec.gov and may be reviewed and copied at the SEC's Public Reference Room in Washington, DC. Information on the operation of the SEC's Public Reference Room may be obtained by calling 1-202-551-8090.
38
This page intentionally left blank
This page intentionally left blank
This page intentionally left blank
This page intentionally left blank
This page intentionally left blank
This page intentionally left blank

P.O. BOX 55030, BOSTON, MA 02205-5030
877-870-2874 n www.credit-suisse.com/us/funds
CREDIT SUISSE SECURITIES (USA) LLC, DISTRIBUTOR. COM-AR-1013
Item 2. Code of Ethics.
The registrant has adopted a code of ethics applicable to its Chief Executive Officer, President, Chief Financial Officer and Chief Accounting Officer, or persons performing similar functions. A copy of the code is filed as Exhibit 12(a)(1) to this Form. There were no amendments to the code during the fiscal year ended October 31, 2013. There were no waivers or implicit waivers from the code granted by the registrant during the fiscal year ended October 31, 2013.
Item 3. Audit Committee Financial Expert.
The registrant’s governing board has determined that it has two audit committee financial experts serving on its audit committee: Enrique R. Arzac and Steven N. Rappaport. Each audit committee financial expert is “independent” for purposes of this item.
Item 4. Principal Accountant Fees and Services.
(a) through (d). The information in the table below is provided for services rendered to the registrant by its independent registered public accounting firm, PricewaterhouseCoopers LLP (“PwC”), for its fiscal years ended October 31, 2012 and October 31, 2013.
| | 2012 | | 2013 | |
Audit Fees | | $ | 79,635 | | $ | 96,600 | |
Audit-Related Fees(1) | | $ | 7,334 | | $ | 7,200 | |
Tax Fees(2) | | $ | 9,000 | | $ | 6,000 | |
All Other Fees | | — | | — | |
Total | | $ | 95,969 | | $ | 109,800 | |
(1) Services include agreed-upon procedures in connection with the registrant’s semi-annual financial statements ($7,334 in 2012 and $7,200 in 2013).
(2) Tax services in connection with the registrant’s excise tax calculations and review of the registrant’s applicable tax returns.
The information in the table below is provided with respect to non-audit services that directly relate to the registrant’s operations and financial reporting and that were rendered by PwC to the registrant’s investment adviser, Credit Suisse Asset Management, LLC (“Credit Suisse”), and any service provider to the registrant controlling, controlled by or under common control with Credit Suisse that provided ongoing services to the registrant (“Covered Services Provider”), for the registrant’s fiscal years ended October 31, 2012 and October 31, 2013.
| | 2012 | | 2013 | |
Audit-Related Fees | | N/A | | N/A | |
Tax Fees | | N/A | | N/A | |
All Other Fees | | N/A | | N/A | |
Total | | N/A | | N/A | |
1
(e)(1) Pre-Approval Policies and Procedures. The Audit Committee (“Committee”) of the registrant is responsible for pre-approving (i) all audit and permissible non-audit services to be provided by the independent registered public accounting firm to the registrant and (ii) all permissible non-audit services to be provided by the independent registered public accounting firm to Credit Suisse and any Covered Services Provider if the engagement relates directly to the operations and financial reporting of the registrant. The Committee may delegate its responsibility to pre-approve any such audit and permissible non-audit services to the Chairperson of the Committee, and the Chairperson shall report to the Committee, at its next regularly scheduled meeting after the Chairperson’s pre-approval of such services, his or her decision(s). The Committee may also establish detailed pre-approval policies and procedures for pre-approval of such services in accordance with applicable laws, including the delegation of some or all of the Committee’s pre-approval responsibilities to other persons (other than Credit Suisse or the registrant’s officers). Pre-approval by the Committee of any permissible non-audit services shall not be required so long as: (i) the aggregate amount of all such permissible non-audit services provided to the registrant, Credit Suisse and any Covered Services Provider constitutes not more than 5% of the total amount of revenues paid by the registrant to its independent registered public accounting firm during the fiscal year in which the permissible non-audit services are provided; (ii) the permissible non-audit services were not recognized by the registrant at the time of the engagement to be non-audit services; and (iii) such services are promptly brought to the attention of the Committee and approved by the Committee (or its delegate(s)) prior to the completion of the audit.
(e)(2) The information in the table below sets forth the percentages of fees for services (other than audit, review or attest services) rendered by PwC to the registrant for which the pre-approval requirement was waived pursuant to Rule 2-01(c)(7)(i)(C) of Regulation S-X:
| | 2012 | | 2013 | |
Audit-Related Fees | | N/A | | N/A | |
Tax Fees | | N/A | | N/A | |
All Other Fees | | N/A | | N/A | |
Total | | N/A | | N/A | |
The information in the table below sets forth the percentages of fees for services (other than audit, review or attest services) rendered by PwC to Credit Suisse and any Covered Services Provider required to be approved pursuant to Rule 2-01(c)(7)(ii) of Regulation S-X, for the registrant’s fiscal years ended October 31, 2012 and October 31, 2013:
2
| | 2012 | | 2013 | |
Audit-Related Fees | | N/A | | N/A | |
Tax Fees | | N/A | | N/A | |
All Other Fees | | N/A | | N/A | |
Total | | N/A | | N/A | |
(f) Not Applicable.
(g) The aggregate fees billed by PwC for non-audit services rendered to the registrant, Credit Suisse and Covered Service Providers for the fiscal years ended October 31, 2012 and October 31, 2013 were $0 and $0, respectively.
(h) Not Applicable.
Item 5. Audit Committee of Listed Registrants.
Form N-CSR disclosure requirement is not applicable to the registrant.
Item 6. Schedule of Investments.
Included as part of the report to shareholders filed under Item 1 of this Form.
Item 7. Disclosure of Proxy Voting Policies and Procedures for Closed-End Management Investment Companies.
Form N-CSR disclosure requirement is not applicable to the registrant.
Item 8. Portfolio Managers of Closed-End Management Investment Companies.
Form N-CSR disclosure requirement is not applicable to the registrant.
Item 9. Purchases of Equity Securities by Closed-End Management Investment Company and Affiliated Purchasers.
Form N-CSR disclosure requirement is not applicable to the registrant.
Item 10. Submission of Matters to a Vote of Security Holders.
None.
3
Item 11. Controls and Procedures.
(a) As of a date within 90 days from the filing date of this report, the principal executive officer and principal financial officer concluded that the registrant’s disclosure controls and procedures (as defined in Rule 30a-3(c) under the Investment Company Act of 1940 (the “Act”)) were effective based on their evaluation of the disclosure controls and procedures required by Rule 30a-3(b) under the Act and Rules 13a-15(b) or 15d-15(b) under the Securities Exchange Act of 1934.
(b) There were no changes in registrant’s internal control over financial reporting (as defined in Rule 30a-3(d) under the Act) that occurred during the second fiscal quarter of the period covered by this report that have materially affected, or are reasonably likely to materially affect, the registrant’s internal control over financial reporting.
Item 12. Exhibits.
(a)(1) Registrant’s Code of Ethics is an exhibit to this report.
(a)(2) The certifications of the registrant as required by Rule 30a-2(a) under the Act are exhibits to this report.
(a)(3) Not applicable.
(b) The certifications of the registrant as required by Rule 30a-2(b) under the Act are an exhibit to this report.
(other) Iran related activities disclosure requirement.
4
SIGNATURES
Pursuant to the requirements of the Securities Exchange Act of 1934 and the Investment Company Act of 1940, the registrant has duly caused this report to be signed on its behalf by the undersigned, thereunto duly authorized.
| CREDIT SUISSE COMMODITY STRATEGY FUNDS | |
| | |
| /s/ John G. Popp | |
| Name: | John G. Popp | |
| Title: | Chief Executive Officer and President | |
| Date: | August 19, 2014 | |
Pursuant to the requirements of the Securities Exchange Act of 1934 and the Investment Company Act of 1940, this report has been signed below by the following persons on behalf of the registrant and in the capacities and on the dates indicated.
| /s/ John G. Popp | |
| Name: | John G. Popp | |
| Title: | Chief Executive Officer and President | |
| Date: | August 19, 2014 | |
| /s/ Bruce S. Rosenberg | |
| Name: | Bruce S. Rosenberg | |
| Title: | Chief Financial Officer | |
| Date: | August 19, 2014 | |
5