SECURITIES AND EXCHANGE COMMISSION
Washington, D.C. 20549
FORM 6-K
REPORT OF FOREIGN ISSUER
PURSUANT TO RULE 13a-16 OR 15d-16 OF THE
SECURITIES EXCHANGE ACT OF 1934
For the month of April 2021
(Commission File No. 001-32221)
GOL LINHAS AÉREAS INTELIGENTES S.A.
(Exact name of registrant as specified in its charter)
GOL INTELLIGENT AIRLINES INC.
(Translation of registrant’s name into English)
Praça Comandante Linneu Gomes, Portaria 3, Prédio 24
Jd. Aeroporto
04630-000 São Paulo, São Paulo
Federative Republic of Brazil
(Address of registrant’s principal executive offices)
Indicate by check mark whether the registrant files or will file
annual reports under cover Form 20-F or Form 40-F.
Form 20-F ___X___ Form 40-F ______
Indicate by check mark whether the registrant by furnishing the
information contained in this Form is also thereby furnishing the
information to the Commission pursuant to Rule 12g3-2(b) under
the Securities Exchange Act of 1934.
Yes ______ No ___X___
Parent Company and Consolidated
Quarterly Information (ITR)
GOL Linhas Aéreas Inteligentes S.A.
March 31, 2021
with Review Report on the Quarterly Information
Gol Linhas Aéreas Inteligentes S.A.
Parent Company and Consolidated Quarterly Information (ITR)
March 31, 2021
Contents
Comments on the Performance | 3 |
Report of the Statutory Audit Committee (SAC) | 8 |
Statement of the Executive officers on the Parent Company and Consolidated Quarterly Information (ITR) | 9 |
Statement of the Executive officers on the Independent Auditors’ Review Report | 10 |
| Review Report of the Independent Auditors on the Quarterly Information (ITR) | 11 |
| Balance Sheets | 13 |
Income Statements | 15 |
Statements of Comprehensive Income (SCI) | 16 |
Statements of Changes in Shareholders’ Equity (SCSE) | 17 |
Statements of Cash Flows (SCF) | 18 |
Statements of Value Added (SVA) | 20 |
Notes to the Parent Company and Consolidated Quarterly Information (ITR) | 21 |
Comments on the Performance
On January 15, 2021, GOL passed the milestone of 20 years in operation, characterized by innovation and the democratization of air transport in Brazil.
“Despite the quiet celebrations due to the Covid-19 pandemic, we reinforce our sincere thanks to our Customers and our Team of Eagles, who are central to the Company’s journey. We know that the challenges will always exist, but we will continue to provide this essential service to Brazilians, whether for leisure travel, business or, more recently, with the transport of health professionals and distribution of vaccines,” commented Kakinoff.
Customer experience and personal Safety: GOL’s Net Promoter Score (NPS) was 38 in the quarter, a solid metric resulting from the best-in-market product and a highly engaged Customer service team. GOL won the Top of Mind award for the fourth consecutive year as the most remembered airline in the country. “The investments in our product and in our Customer experience over the years made technological innovations aimed at simplifying and improving the process for traveling with GOL possible,” said Eduardo Bernardes, Vice president of Sales and Marketing.
In March, the Brazilian Administrative Council for Economic Defense (Cade) released the terms and conditions established by the commercial partnership between GOL and American Airlines, an important milestone towards international recovery, bringing more products, services and innovation to the US-Brazil air corridor, in addition to the best connectivity and Customer experience in the Brazil’s main hubs.
Sustainability as a strategic driver: GOL is committed to reaching zero net carbon emissions by 2050 with the use of sustainable aviation fuel alternatives, or SAFs (Sustainable Aviation Fuels), and through operational and technical improvements that reduce greenhouse gas (GHG) emissions, in line with IATA guideline and to comply with the Carbon Offsetting and Reduction Scheme for International Aviation (CORSIA). The projections for next three years and a comprehensive path on getting to net zero in 2050 can be found in the expanded ESG section of the Company’s IR website (https://ir.voegol.com.br).
“We hope to encourage the airline industry as a whole to tackle environmental, social and governance issues by becoming more sustainable and transparent,” added Eduardo Bernardes. “At the same time, we are working on building a more robust sustainability policy, in addition to leading on technological and infrastructure advances, necessary to enable the transition to a low-carbon future.”
Sales: In the first quarter, consolidated gross sales reached approximately R$1.6 billion, GOL’s average daily sales reached R$18 million, which represents around 54% of pre-pandemic sales levels. The beginning of the quarter was very positive for the Company, which captured the resumption after the “first wave” of Covid-19. In January, GOL reached a new record of passengers transported since the beginning of the pandemic, with more than 93,000 Customers served in a single day. However, due to the decline in demand for travel due to the increase in Covid-19 cases in Brazil, combined with the transition to the low season, there was a 25% drop in the search for airline tickets compared to 4Q20, with a 53% reduction in the volume of daily sales in the period.
Smiles: Revenue in 1Q21 was reduced in 11.8%, compared to 1Q20, to R$151.1 million. The operating result in 1Q21 decreased R$19.6 million to R$58.9 million, mainly due to the reduction in the volume of miles redeemed by participants in the Loyalty Program and due to the Covid-19 pandemic restrictions. Operating margin was 39.0% and net income in 1Q21 was R$47.7 million, a decrease of R$8.6 million compared to 1Q20.
Cargo: GOLLOG launched Super Expresso in January/21, a service that enables same-day parcel delivery, using the capillarity and national reach of the Company’s efficient network. In February/21, GOLLOG entered into a partnership with the Comporte group, formed by the companies Tex, União, Itamarati, Cruz and Elux, to increase multimodal delivery services and strengthen the concept of “last mile”, combining the efficiency of road transportation with the capillarity of the Company’s network.
Adjustments of network and fleet: Compared to 4Q20, GOL reduced daily operations by 10%, reaching 364 in 1Q21, to serve 159 markets, representing 53% of the daily frequency in 1Q20, 144 of which are operated by the Company and 15 via GOL's partners, which include the bases Passo Fundo (PFB), Joinville (JOI), Juiz de Fora (IZA), Presidente Prudente (PPB) and Cabo Frio (CFB), operated in high season by GOL. The Company remains attentive to the determinations of the governments of other countries and the behavior of the demand to act again with its international network. GOL ended 1Q21 with a total fleet of 127 B737s, of which 8 MAX and 77 aircraft in operation, a reduction of 13 aircraft compared to the end of December/20.
| 2 |
“Matching capacity to demand has always been a competitive advantage of our fleet management. The Company returned the most aircraft in recent years among its regional peers, which demonstrates our flexibility to meet the market conditions of demand almost instantly,” said Celso Ferrer, Vice President of Operations. “Most of the aircraft returns occurred organically, as they followed our renewal schedule, which provides for the return of NGs and the arrival of 737 MAXs. As a result, we were able to better balance our supply without the need to pressure unit fares, in order to be able to dilute the cost pressure in case of aircraft excess in the fleet. We also do not face the same concerns as our competitors with fleet complexity or large aircraft exposure exclusively destined for specific markets. During the pandemic, we continued to lead the industry in capacity management, maintaining high load factors, consistent with the pre-pandemic period.”
Synergies from GLA and Smiles Merger: On March 24, 2021, shareholders of GOL and the majority of Smiles’ minority shareholders approved, in extraordinary meeting, the corporate reorganization to combine the Company’s two operating subsidiaries: GLA and Smiles. The merger makes the GOL Group more competitive and substantially reduces the risks that each company faces in this pandemic.
At the end of March, the Company announced through its subsidiary Smiles, the distribution of R$500 million in dividends. Thus, the value of the exchange ratio for the options to be chosen by Smiles’ minority shareholders was automatically adjusted and the amount due in national currency was consequently reduced by R$4.027 per share. Upcoming events and deadlines will be timely disclosed in the respective notice of confirmation.
Liquidity and financial obligations: On March 31, 2021, the Company’s short-term debt was R$2.3 billion, of which approximately R$1.2 billion corresponds to working capital loans with local banks, which GOL maintains a good relationship and that represent low amortization pressure. In addition, the Company has preserved the capacity of its collateral pool program, part of which was used to issue Secured Senior Notes 2026 at the end of December/2020, and with the potential to generate additional liquidity.
The merger with Smiles increases GOL’s creditworthiness, and the frequent flyer program can be utilized as an unencumbered asset. Considering the financeable values of deposits and unencumbered assets, the Company's potential sources of liquidity exceed R$5 billion. The average maturity of GOL's long-term debt, excluding aircraft leases and perpetual notes, is approximately 3.2 years, with the main obligations already addressed in our cash flow.
“We have obtained incredible support from our main lessor partners and working capital providers who have supported us in rebalancing our financial commitments in line with our working capital volume,” said Richard Lark, Chief Financial Officer. During the quarter, GOL fully honored the interest payments on its capital market debt in the amount of R$215 million and used approximately R$230 million of its restricted cash to amortize working capital debt that exceeded credit limits with local banks, due to the exchange rate devaluation of the period. Additionally, the level of accounts receivable decreased by R$197 million when compared to the end of 4Q20 due to the temporary reduction in the level of the supply, that reflects the lower volume of forward bookings and if the level of receivables in 4Q20 was maintained, would result in stable liquidity.
“Even in an atypical year, the Company stands out among few airlines in the world that has amortized more than R$4.1 billion of debt over the past 12 months, by its conscious liquidity management and the extraction of value from its current assets. This discipline will allow GOL to focus its operation on growth and profitability more efficiently, with a stronger balance sheet and with fewer operating and financial liabilities compared to its competitors,” concluded Lark.
| 3 |
Operating and Financial Indicators
| Traffic Data – GOL (in Millions) | 1Q21 | 1Q20 | % Var. |
| RPK GOL – Total | 5,592 | 9,948 | -43.8% |
| RPK GOL –Domestic | 5,592 | 8,660 | -35.4% |
| RPK GOL – International | - | 1,288 | NM |
| ASK GOL – Total | 6,999 | 12,462 | -43.8% |
| ASK GOL – Domestic | 6,999 | 10,682 | -34.5% |
| ASK GOL – International | - | 1,780 | NM |
| GOL Load Factor – Total | 79.9% | 79.8% | 0.1 p.p. |
| GOL Load Factor – Domestic | 79.9% | 81.1% | -1.2 p.p. |
| GOL Load Factor – International | - | 72.3% | NM |
| Operating Data | 1Q21 | 1Q20 | % Var. |
| Revenue Passengers - Pax on Board ('000) | 4,495 | 8,346 | -46.1% |
| Aircraft Utilization (Block Hours/Day) | 9,7 | 12.1 | -19.8% |
| Departures | 32,797 | 62,956 | -47.9% |
| Total Seats (‘000) | 5,744 | 10,834 | -47.0% |
| Average Stage Length (km) | 1,205 | 1,136 | 6.1% |
| Fuel Consumption (mm liters) | 192 | 363 | -47.1% |
| Full-time Employees (at Period End) | 13,999 | 16,345 | -14.4% |
| Average Operating Fleet(6) | 77 | 114 | -32.5% |
| On-time Departures | 96.3% | 92.6% | 3.7 p.p. |
| Flight Completion | 98.4% | 97.5% | 0.9 p.p. |
| Passenger Complaints (per 1,000 pax) | 0.71 | 1.02 | -30.4% |
| Lost Baggage (per 1,000 pax) | 1.84 | 2.22 | -17.1% |
| Financial Data | 1Q21 | 1Q20 | % Var. |
| Net YIELD (R$ cents) | 25.33 | 29.57 | -14.3% |
| Net PRASK (R$ cents) | 20.24 | 23.60 | -14.2% |
| Net RASK (R$ cents) | 22.40 | 25.26 | -11.3% |
| CASK (R$ cents)(4) | 27.34 | 17.73 | 54.2% |
| CASK Ex-Fuel (R$ cents)(4) | 19.25 | 9.70 | 98.5% |
| Adjusted CASK(6) | 19.42 | 17.73 | 9.5% |
| Adjusted CASK(6) Ex-Fuel (R$ cents)(4) | 11.96 | 9.70 | 23.3% |
| Breakeven Load Factor(4) | 97.5% | 56.0% | 41.5 p.p. |
| Average Exchange Rate(1) | 5.6461 | 4.4657 | 26.4% |
| End of Period Exchange Rate(1) | 5.6973 | 5.1987 | 9.6% |
| WTI (Average per Barrel. US$)(2) | 57.84 | 45.78 | 26.3% |
| Price per Liter Fuel (R$)(3) | 2.80 | 2.78 | 0.7% |
| Gulf Coast Jet Fuel (Average per Liter, US$)(2) | 0.28 | 0.37 | -24.3% |
(1) Source: Brazilian Central Bank; (2) Source: Bloomberg; (3) Fuel expenses excluding hedge results and PIS/COFINS credits/liters consumed; (4) Excluding non-recurring expenses and Idle expenses. (5) Average operating fleet excluding aircraft in sub-leasing and MRO. Certain calculations may not match with the financial statements due to rounding. (6) Considers only expenses related to current operating levels (1Q21).
Domestic market
GOL’s domestic demand was 5,592 million RPK, a decrease by 43.8%, while ASK supply reduced 43.8% in comparison to 1Q20, and the load factor reached 79.9% in the quarter. The Company transported 4.5 million Clients during the quarter, a decrease of 46.1% compared with the same quarter in 2020.
International market
In 1Q21, the Company carried out non-regular charter flights for soccer teams in championships. As most country borders were closed, GOL did not offer regular international flights.
Volume of Departures and Total Seats
The total volume of the Company’s departures was 32,797, a decrease of 47.9% over 1Q20. The total number of seats available to the market was 5.7 million in the first quarter of 2021, a decrease of 47.0% quarter-over-quarter.
PRASK, Yield and RASK
Net PRASK decreased by 14.2% in the quarter when compared to 1Q20, reaching 20.24 cents (R$), due to the decline of the levels of net passenger revenue and the ASK reduction of 43.8% in the quarter. GOL’s net RASK was 22.40 cents (R$) in 1Q21, a decrease of 11.3% over 1Q20. Net yield decreased 14.3% over 1Q20, reaching 25.33 cents (R$).
| 4 |
Net revenue
Quarterly net revenue totaled R$1.6 billion, representing a decrease of 50.2% when compared to 1Q20, mainly due to a sharper reduction in demand, due to the second wave of COVID-19 cases with pressure on hospital network that impacted the increase in the number of cancellations and no-shows. Despite the significant decrease in the number of flights operated, cargo transportation revenues had a lower level of decrease, at 15.2%, mainly due to the readjustment in the prices of certain products and the launch of CHEGOL, a new fast and efficient delivery service. Loyalty program revenues decreased 11.8% compared to 1Q20.
Operating results
Adjusted EBIT for the quarter was R$208.3 million. Operating margin was 13.3%. On an available seat-kilometer basis, adjusted EBIT was 2.98 cents (R$).
Adjusted EBITDA totaled R$353.8 million in the period. EBITDA margin was 22.6%. Adjusted EBITDA per available seat-kilometer was 5.06 cents (R$).
| EBIT and EBITDA reconciliation (R$ MM)* | 1Q21 | 1Q20 | % Var. |
| Net Loss before NCI | (2,505.8) | (2,261.6) | 10.8% |
| (-) Financial Result | 1,962.3 | 3,243.6 | -39.5% |
| (-) Income Taxes | 21.0 | 43.4 | -51.6% |
| (-) Non-Recurring Expenses, Net (1) | 176.8 | (87.5) | NM |
| EBIT(1) | (345.7) | 938.0 | NM |
| EBIT Margin(1) | -22.1% | 29.8% | NM |
| (-) Depreciation and Amortization | 273.8 | 502.1 | -45.5% |
| EBITDA(1) | (72.1) | 1,440.0 | NM |
| EBITDA Margin(1) | -4.6% | 45.7% | NM |
| Adjusted EBIT(2) | 208.3 | 938.0 | -77.8% |
| Adjusted EBIT Margin(2) | 13.3% | 29.8% | -16.5 p.p. |
| Adjusted EBITDA(2) | 353.8 | 1,440.0 | -75.4% |
| Adjusted EBITDA Margin(2) | 22.6% | 45.7% | -23.1 p.p. |
| EBITDA Calculation (R$ cents/ASK) | 1Q21 | 1Q20 | % Var. |
| Net Revenues | 22.40 | 25.26 | -11.5% |
| Operating Expenses(1) | (27.34) | (17.73) | 54.2% |
| EBIT(1) | (4.94) | 7.53 | NM |
| Depreciation and Amortization | (3.91) | (4.03) | -2.5% |
| EBITDA(1) | (1.03) | 11.55 | NM |
| Adjusted EBIT(2) | 2.98 | 7.53 | -60.0% |
| Adjusted EBITDA(2) | 5.06 | 11.55 | -56.0% |
(1) Excluding non-recurring expenses and related to fleet idleness. * In accordance with CVM Instruction n.527, the Company presents the reconciliation of EBIT and EBITDA, whereby: EBIT = net income (loss) (+) income tax and social contribution (+) net financial result; and EBITDA = net income (loss) (+) income tax and social contributions (+) net financial result (+) depreciation and amortization. Some report values may differ from the financial statements due to rounding. (2) Considers expenses strictly related to current operating levels (1Q21).
Fleet
At the end of 1Q21, GOL's total fleet was 127 Boeing 737 aircraft, comprised of 119 NGs and eight (8) MAXs (operational). At the end of 1Q20, GOL's total fleet was 131 aircraft, of which seven (7) were MAXs (non-operational). The average age of the Company's fleet was 11.2 years at the end of 1Q21.
GOL does not operate widebody aircraft, and has no aircraft financed via the capital markets, EETCs or finance leases. Its operating fleet is 100% composed of narrowbody aircraft financed via operating leases.
| Total Fleet at the End of Period | 1Q21 | 1Q20 | % Var. | 4Q20 | % Var. |
| B737s | 127 | 131 | -4 | 127 | 0 |
| B737-7 NG | 23 | 23 | 0 | 23 | 0 |
| B737-8 NG | 96 | 101 | -5 | 97 | -1 |
| B737-8 MAX | 8 | 7 | +1 | 7 | +1 |
As of March 31, 2021, GOL had 95 firm orders for the acquisition of Boeing 737 MAX aircraft, of which 73 were orders for 737 MAX-8 and 22 orders were for 737 MAX-10. The Company's fleet plan returns up to eleven (11) operational aircraft by the end of 2021, with the flexibility to return even more aircraft if necessary.
| Fleet Plan | 2021E | 2022E | 2023E | >2024E | Total |
| Operating Fleet at the End of the Year | 129 | 132 | |||
| Aircraft Commitments (R$ MM) | - | 1,024.2 | 4,573.5 | 21,260.0 | 26,857.7 |
| 5 |
During the first quarter, GOL maintained flexibility for the duration of its fixed monthly payments contracts remaining variable (power-by-the-hour). The agreements signed by GOL with its lessors allow the extension of the deferrals in order to be adjusted proportionally to the recovery of capacity during the year 2021, in order to allow a lower volume of payments. Leasing remeasurement took into account the new payment flows, the discount rate and the exchange rate on the date of the contractual changes. The calculated effects were recorded as a reduction in the lease liability in the amount of R$26.6 million, with a corresponding increase in fixed assets of R$2.5 million and a loss of R$16.7 million in the operating result.
Glossary of Industry Terms
| · | AIRCRAFT LEASING: an agreement through which a company (the lessor) acquires a resource chosen by its client (the lessee) for subsequent rental to the latter for a determined period. |
| · | AVAILABLE SEAT KILOMETERS (ASK): The aircraft seating capacity is multiplied by the number of kilometers flown. |
| · | BARREL OF WEST TEXAS INTERMEDIATE (WTI): Intermediate oil from Texas, a region that serves as a reference to the name for concentrating oil exploration in the USA. WTI is used as a reference point in oil for the US derivatives markets. |
| · | BRENT: Oil produced in the North Sea, traded on the London Stock Exchange and used as a reference in the European and Asian derivatives markets. |
| · | TOTAL CASH: Total cash, financial investments, and restricted cash in the short- and long-term. |
| · | OPERATING COST PER AVAILABLE SEAT KILOMETER (CASK): operating expenses divided by the total number of available seat kilometers. |
| · | OPERATING COST PER AVAILABLE SEAT KILOMETER EX-FUEL (CASK EX-FUEL): operating cost divided by the total number of available seat kilometers excluding fuel expenses. |
| · | AVERAGE STAGE LENGTH: It is the average number of kilometers flown per stage performed. |
| · | EXCHANGEABLE SENIOR NOTES (ESN): Securities convertible into shares. |
| · | AIRCRAFT CHARTER: Flight operated by a Company that is out of its normal or regular operation. |
| · | BLOCK HOURS: Time in which the aircraft is in flight, plus taxi time. |
| · | LESSOR: The party renting a property or other asset to another party, the lessee. |
| · | LONG-HAUL FLIGHTS: Long-distance flights (in GOL’s case, flights of more than four hours’ duration). |
| · | REVENUE PASSENGERS: total number of passengers on board who have paid more than 25% of the full flight fare. |
| · | REVENUE PASSENGER KILOMETERS PAID (RPK): sum of the products of the number of paying passengers on a given flight and the length of the flight. |
| · | PDP: Credit for financing prepayments for the acquisition of aircraft. |
| · | Load Factor: Percentage of the aircraft’s capacity used in terms of seats (calculated by dividing the RPK/ASK). |
| · | Break-Even Load Factor: Load factor required for operating revenues to correspond to operating expenses. |
| · | Aircraft Utilization Rate: Average number of hours per day that the aircraft was in operation. |
| · | Passenger Revenue per Available Seat Kilometer (PRASK): total passenger revenue divided by the total number of available seat kilometers. |
| · | Operating Revenue per Available Seat Kilometers (RASK): The operating revenue is divided by the total number of available seat kilometers. |
| · | Sale-leaseback: A financial transaction whereby a resource is sold and then leased back, enabling the use of the resource without owning it. |
| · | SLOT: The right of an aircraft to take off or land at a given airport for a determined period. |
| · | Sub-Lease: An arrangement whereby a lessor in a rent agreement leases the item rented to a fourth party. |
| · | Freight Load Factor (FLF): Measure of capacity utilization (% of AFTKs used). Calculated by dividing FTK by AFTK. |
| · | Freight Tonne Kilometers (FTK): The demand for cargo transportation, calculated as the weight of the cargo in tons multiplied by the total distance traveled. |
| · | Available Freight Tonne Kilometer (AFTK): Weight of the cargo in tons multiplied by the kilometers flown. |
| · | Yield per Passenger Kilometer: The average value paid by a passenger to fly one kilometer. |
| 6 |
Disclaimer
This release contains forward-looking statements relating to the prospects of the business, estimates for operating and financial income (expenses), and those related to growth prospects of GOL, which are, by nature, subject to significant risks and uncertainties. The estimates and forecasts in this document involve known and unknown risks, uncertainties, contingencies, and other factors, many of which are beyond GOL’s control and which may lead the results, performances, or events to be substantially different from those expressed or implied in these statements. The forward-looking statements in this document are based on several assumptions related to GOL’s current and future business strategies and GOL’s future operating environment and are not a guarantee of future performance. GOL does not issue any statement or provide any guarantee that the results anticipated by the estimates in this document will be equivalent to those effectively achieved by GOL. Although GOL believes that the estimates here are reasonable, they may prove incorrect, and the final results may differ. These are merely estimates and projections and, as such, are based exclusively on management’s expectations for GOL. Such forward-looking statements depend, substantially, on external factors and risks presented in the disclosure documents filed by GOL, apply exclusively to the date they were issued and are, therefore, subject to change without prior notice.
Non-Accounting Measures
To be consistent with industry practice, the Company discloses so-called non-GAAP financial measures, which are not recognized under IFRS or other accounting standards, including “Net Debt”, “Total Liquidity” and “EBITDA”. GOL’s Management believes that disclosure of non-GAAP measures provides useful information to investors, financial analysts, and the public in their review of its operating performance and their comparison of its operating performance to the operating performance of other airlines and other industries. However, these non-GAAP items do not have standardized meanings and may not be directly comparable to similarly-titled items adopted by other companies. Potential investors should not rely on information not recognized under IFRS as a substitute for the GAAP measures of earnings or liquidity in making an investment decision.
| 7 |
Report of the Statutory Audit Committee (“SAC”)
The Statutory Audit Committee of Gol Linhas Aéreas Inteligentes S.A., in compliance with its legal and statutory obligations, has reviewed the Parent Company and Consolidated Quarterly Information (ITR) for the three-month period ended on March 31, 2021. Based on the procedures we have undertaken and considering the independent auditors’ review report issued by Grant Thornton Auditores Independentes and the information and explanations we have received during the quarter, we conclude that these documents can be submitted to the assessment of the Board of Directors.
São Paulo, April 27, 2021
André Béla Jánszky
Member of the Statutory Audit Committee
Antônio Kandir
Member of the Statutory Audit Committee
Francis James Leahy Meaney
Member of the Statutory Audit Committee
| 8 |
Statement of the Executive Officers on the Parent Company and Consolidated Quarterly Information (ITR)
Under the provisions of CVM Instruction 480/09, the executive officers state that they have discussed, reviewed, and approved the Parent Company and Consolidated Quarterly Information (ITR) for the three-month period ended on March 31, 2021.
São Paulo, April 27, 2021
Paulo Sérgio Kakinoff
Chief Executive Officer
Richard Freeman Lark Jr.
Executive Vice President, Chief Financial Officer, and Investor Relations Officer
| 9 |
Statement of the Executive officers on the Independent Auditors’ Review Report
Under the provisions of CVM Instruction 480/09, the Executive Board states that it has discussed, reviewed, and agreed with the conclusion of the review report from the independent auditor, Grant Thornton Auditores Independentes, on the Parent Company and Consolidated Quarterly Information (ITR) for the three-month period ended on March 31, 2021.
São Paulo, April 27, 2021
Paulo Sérgio Kakinoff
Chief Executive Officer
Richard Freeman Lark Jr.
Executive Vice President, Chief Financial Officer, and Investor Relations Officer
| 10 |

(Free translation from the original issued in Portuguese. In the event of any discrepancies, the Portuguese language version shall prevail.)
Independent auditor’s report on review of interim financial information
Grant Thornton Auditores Independentes
Av. Eng. Luís Carlos Berrini, 105 - 12o andar Itaim Bibi, São Paulo (SP) Brasil
T +55 11 3886-5100 |
To the Board of directors and shareholders of
Gol Linhas Aéreas Inteligentes S.A.
São Paulo – SP
Introduction
We have reviewed the accompanying individual and consolidated interim financial information of Gol Linhas Aéreas Inteligentes S.A. (the Company), comprised in the Quarterly Information Form for the quarter ended March 31, 2021, comprising the balance sheet as of March 31, 2021 and the respective statements of income, of comprehensive income, of changes in shareholders’ equity and of cash flows for the period of three months then ended, including the footnotes.
Management is responsible for the preparation of the individual interim financial information in accordance with the NBC TG 21 – Interim Financial Reporting and of the consolidated interim financial information in accordance with the NBC TG 21 and with the international standard IAS 34 – Interim Financial Reporting, as issued by the International Accounting Standards Board (Iasb), such as for the presentation of these information in accordance with the standards issued by the Brazilian Exchange Securities Commission, applicable to the preparation of interim financial information. Our responsibility is to express a conclusion on this interim financial information based on our review.
Review scope
We conducted our review in accordance with the Brazilian and International standards on reviews of interim information (NBC TR 2410 – Review of Interim Financial Information Performed by the Independent Auditor of the Entity and ISRE 2410 – Review of Interim Financial Information Performed by the Independent Auditor of the Entity, respectively). The review of interim information consists of making inquiries, primarily of persons responsible for the financial and accounting matters and applying analytical and other review procedures. A review is substantially less in scope than an audit conducted in accordance with the audit standards and, consequently, does not enable us to obtain assurance that we would become aware of all significant matters that might be identified in an audit. Accordingly, we do not express an audit opinion.
Conclusion on the individual interim financial information
Based on our review, nothing has come to our attention that causes us to believe that the individual interim financial information included in the quarterly information form referred to above has not been prepared, in all material respects, in accordance with NBC TG 21 applicable to the preparation of interim financial information, and presented in accordance with the standards issued by the Brazilian Securities and Exchange Commission.
Conclusion on the consolidated interim financial information
Based on our review, nothing has come to our attention that causes us to believe that the consolidated interim financial information included in the quarterly information form referred to above has not been prepared, in all material respects, in accordance with NBC TG 21 and IAS 34 applicable to the preparation of interim financial information, and presented in accordance with the standards issued by the Brazilian Securities and Exchange Commission.
| 11 |
Emphasis of matter
Significant uncertainty as to the ability to continue as a going concern
We draw attention to Note 1, which states that the individual and consolidated interim financial information were prepared under the assumption of going concern. As described in the aforementioned note, the Company has faced recurring reductions in operations, mainly due to the effects of the COVID-19 pandemic, with a significant decrease in demand (a 52% reduction in passengers revenues in the first quarter of 2021 compared to the first quarter of 2020), and recorded net working capital deficit and equity deficiency as of March 31, 2021 which, together with other events and conditions, indicate the existence of material uncertainty that may cast significant doubt about the Company’s ability to continue as a going concern. The plans and actions being developed by Management to restore the Company’s financial economic balance and financial position are described in Note 1. The individual and consolidated interim financial information do not include any adjustment that may arise from the result of such uncertainty. Our review conclusion is not qualified regarding this matter.
Other matters
Statements of value added
The quarterly information referred to above includes the individual and consolidated statements of value added for the period of three months ended March 31, 2021, prepared under the responsibility of the Company's management and presented as supplementary information for the purposes of IAS 34.
These statements were submitted to the same review procedures in conjunction with the review of the Company's interim financial information in order to conclude they are reconciliated to the interim financial information and to the accounting records, as applicable, and whether the structure and content are in accordance with the criteria established in the NBC TG 09 - Statement of Value Added. Based on our review, nothing has come to our attention that causes us to believe that the accompanying statements of value added were not prepared, in all material respects, in accordance with the individual and consolidated interim financial information taken as a whole.
Review of figures corresponding to the comparative period
The review of the individual and consolidated interim financial information for the period of three months ended March 31, 2020 was conducted under the responsibility of other independent auditor, which issued a review report thereon, without qualifications, on June 29, 2020.
São Paulo, April 27, 2021
Daniel Gomes Maranhão Junior
Assurance Partner
Grant Thornton Auditores Independentes
| 12 |
 | Balance Sheets March 31, 2021 and December 31, 2020 (In thousand of Reais) |
| Parent Company | Consolidated | ||||
| Assets | Note | March 31, 2021 | December 31, 2020 | March 31, 2021 | December 31, 2020 |
| Current | |||||
| Cash and Cash Equivalents | 6 | 655 | 423,937 | 404,713 | 662,830 |
| Financial Investments | 7 | 124 | 236 | 535,538 | 628,343 |
| Restricted Cash | 8 | 4,237 | 4,194 | 265,192 | 355,769 |
| Trade Receivables | 9 | - | - | 542,804 | 739,699 |
| Inventories | 10 | - | - | 188,336 | 195,638 |
| Advances to Suppliers and Third-Parties | 11 | 11,446 | 10,441 | 155,945 | 318,769 |
| Taxes to Recover | 12 | 6,517 | 6,295 | 364,702 | 186,955 |
| Rights from Derivative Transactions | 34.2 | - | - | 17 | 12,526 |
| Dividends and Interest on Shareholders’ Equity to Receive | 28.1 | 263,009 | 24,120 | - | - |
| Other Credits | 12,684 | 9,640 | 139,172 | 144,822 | |
| Total Current | 298,672 | 478,863 | 2,596,419 | 3,245,351 | |
| Noncurrent | |||||
| Financial Investments | 7 | - | - | - | 992 |
| Restricted Cash | 8 | 5 | 7 | 49,435 | 188,838 |
| Deposits | 14 | 124,181 | 118,261 | 2,221,374 | 2,058,455 |
| Advances to Suppliers | 11 | - | - | 89,530 | 89,701 |
| Taxes to Recover | 12 | 11,283 | 12,102 | 111,864 | 318,404 |
| Deferred Taxes | 13 | 57,630 | 53,492 | 57,704 | 53,563 |
| Other Credits | - | - | 35,340 | 34,338 | |
| Credits with Related Parties | 28.1 | 5,344,476 | 4,897,331 | - | - |
| Rights from Derivative Transactions | 34.2 | 47,907 | 87,663 | 47,907 | 116,283 |
| Investments | 15 | 349,674 | 574,717 | - | 815 |
| Property, Plant & Equipment | 16 | 180,089 | 68,660 | 4,931,331 | 4,960,288 |
| Intangible Assets | 17 | - | - | 1,748,456 | 1,747,108 |
| Total Noncurrent | 6,115,245 | 5,812,233 | 9,292,941 | 9,568,785 | |
| Total | 6,413,917 | 6,291,096 | 11,889,360 | 12,814,136 | |
The accompanying notes are an integral part of the Parent Company and Consolidated Quarterly Information (ITR).
| 13 |
| | Balance Sheets March 31, 2021 and December 31, 2020 (In thousand of Reais) |
| Parent Company | Consolidated | |||||
| Liabilities | Note | March 31, 2021 | December 31, 2020 | March 31, 2021 | December 31, 2020 | |
| Current | ||||||
| Loans and Financing | 18 | 534,273 | 638,964 | 2,304,032 | 2,353,279 | |
| Leases to Pay | 19 | - | - | 1,933,152 | 1,317,008 | |
| Suppliers | 20 | 47,981 | 72,702 | 1,538,228 | 1,612,536 | |
| Labor Obligations | 185 | 181 | 298,675 | 334,670 | ||
| Taxes to Collect | 21 | 552 | 292 | 54,433 | 73,614 | |
| Landing Fees | - | - | 940,608 | 907,958 | ||
| Advance Ticket Sales | 22 | - | - | 1,662,039 | 2,050,799 | |
| Frequent-Flyer Program | 23 | - | - | 1,309,652 | 1,258,502 | |
| Advances from Customers | - | - | 80,779 | 27,897 | ||
| Provisions | 24 | - | - | 298,125 | 169,381 | |
| Obligations with Derivative Transactions | 34.2 | - | - | - | 5,297 | |
| Other Liabilities | 53 | - | 590,220 | 287,275 | ||
| Total Current | 583,044 | 712,139 | 11,009,943 | 10,398,216 | ||
| Noncurrent | ||||||
| Loans and Financing | 18 | 7,589,506 | 6,990,749 | 8,102,790 | 7,623,687 | |
| Leases to Pay | 19 | - | - | 6,643,369 | 6,267,184 | |
| Suppliers | 20 | - | - | 23,730 | 32,658 | |
| Labor Obligations | - | - | 32,399 | - | ||
| Taxes to Collect | 21 | - | - | 30,185 | 32,362 | |
| Frequent-Flyer Program | 23 | - | - | 335,290 | 322,460 | |
| Provisions | 24 | - | - | 1,445,587 | 1,353,515 | |
| Deferred Taxes | 13 | - | - | 215,910 | 219,634 | |
| Obligations to Related Parties | 28.1 | 9,666 | 8,791 | - | - | |
| Provision for Investment Losses | 15 | 14,637,866 | 12,670,479 | - | - | |
| Other Liabilities | 427,582 | 316,030 | 458,077 | 331,479 | ||
| Total Noncurrent | 22,664,620 | 19,986,049 | 17,287,337 | 16,182,979 | ||
| Shareholders’ Equity | ||||||
| Share Capital | 25.1 | 3,009,436 | 3,009,436 | 3,009,436 | 3,009,436 | |
| Shares to Issue | 1,180 | 1,180 | 1,180 | 1,180 | ||
| Treasury Shares | 25.2 | (62,215) | (62,215) | (62,215) | (62,215) | |
| Capital Reserves | 212,256 | 207,246 | 212,256 | 207,246 | ||
| Equity Valuation Adjustments | (480,631) | (577,369) | (480,631) | (577,369) | ||
| Accumulated Losses | (19,513,773) | (16,985,370) | (19,513,773) | (16,985,370) | ||
| Negative Shareholders’ Equity (Deficit) Attributable to the Parent Company | (16,833,747) | (14,407,092) | (16,833,747) | (14,407,092) | ||
| Non-Controlling Shareholders | - | - | 425,827 | 640,033 | ||
| Total Shareholders’ Equity (Deficit) | (16,833,747) | (14,407,092) | (16,407,920) | (13,767,059) | ||
| Total | 6,413,917 | 6,291,096 | 11,889,360 | 12,814,136 | ||
The accompanying notes are an integral part of the Parent Company and Consolidated Quarterly Information (ITR).
| 14 |
| | Income Statement Quarters ended March 31, 2021 and 2020 (In thousands of Brazilian reais - R$, except basic and diluted earnings (loss) per share) |
| Parent Company | Consolidated | |||||
| Note | March 31, 2021 | March 31, 2020 | March 31, 2021 | March 31, 2020 | ||
| Net Revenue | ||||||
| Passenger Transportation | - | - | 1,416,278 | 2,941,333 | ||
| Cargo and Others | - | - | 151,349 | 206,394 | ||
| Total Net Revenue | 29 | - | - | 1,567,627 | 3,147,727 | |
| Cost from Services | 30 | - | - | (1,635,245) | (2,579,910) | |
| Gross Profit (Loss) | - | - | (67,618) | 567,817 | ||
| Operating Revenue (Expenses) | ||||||
| Selling Expenses | - | - | (103,779) | (168,957) | ||
| Administrative Expenses | (27,580) | (4,999) | (363,193) | (328,277) | ||
| Other Revenues and Expenses, Net | 489 | 376,308 | 12,086 | 954,838 | ||
| Total Operating Expenses | 30 | (27,091) | 371,309 | (454,886) | 457,604 | |
| Equity Income (Expenses) | 15 | (2,097,170) | (2,217,639) | - | - | |
| Operating Profit (Loss) before Financial Income (Expenses) and Income Taxes | (2,124,261) | (1,846,330) | (522,504) | 1,025,421 | ||
| Financial Income (Expenses) | ||||||
| Financial Revenue | 151,820 | 616,916 | 143,420 | 698,246 | ||
| Financial Expenses | (235,351) | (334,259) | (568,498) | (998,456) | ||
| Financial Revenues (Expenses), Net | 31 | (83,531) | 282,657 | (425,078) | (300,210) | |
| Financial Income (Expenses) before Exchange Rate Change, Net and before Income Tax and Social Contribution | (2,207,792) | (1,563,673) | (947,582) | 725,211 | ||
| Exchange Rate Change, Net | 31 | (324,749) | (721,263) | (1,537,240) | (2,943,404) | |
| Loss before Income Tax and Social Contribution | (2,532,541) | (2,284,936) | (2,484,822) | (2,218,193) | ||
| Income Tax and Social Contribution | ||||||
| Current | - | (1,048) | (28,831) | (24,273) | ||
| Deferred | 4,138 | (2,285) | 7,862 | (19,143) | ||
| Total Income Tax and Social Contribution | 13 | 4,138 | (3,333) | (20,969) | (43,416) | |
| Loss for the Period | (2,528,403) | (2,288,269) | (2,505,791) | (2,261,609) | ||
| Net Profit (Loss) attributable to: | ||||||
| Shareholders of the Parent Company | (2,528,403) | (2,288,269) | (2,528,403) | (2,288,269) | ||
| Non-Controlling Shareholders | - | - | 22,612 | 26,660 | ||
| Basic and Diluted Loss | 26 | |||||
| Per Common Share | (0.203) | (0.184) | (0.203) | (0.184) | ||
| Per Preferred Share | (7.105) | (6.433) | (7.105) | (6.433) | ||
The accompanying notes are an integral part of the parent company and consolidated interim financial information.
| 15 |
| | Statements of Comprehensive Income (Expenses) Quarters ended March 31, 2021 and 2020 (In thousands of Brazilian Reais - R$) |
| Parent Company | Consolidated | ||||
| March 31, 2021 | March 31, 2020 | March 31, 2021 | March 31, 2020 | ||
| Loss for the Period | (2,528,403) | (2,288,269) | (2,505,791) | (2,261,609) | |
| Other Comprehensive Income that will be Reversed to Income (Expenses) | |||||
| Cash Flow Hedge, Net of Income Tax and Social Contribution | 96,722 | (1,077,289) | 96,722 | (1,077,289) | |
| Cumulative Adjustment of Conversion into Subsidiaries | 16 | - | 29 | - | |
| 96,738 | (1,077,289) | 96,751 | (1,077,289) | ||
| Total Comprehensive Income (Expenses) for the Period | (2,431,665) | (3,365,558) | (2,409,040) | (3,338,898) | |
| Comprehensive Income (Expenses) Attributed to: | |||||
| Shareholders of the Parent Company | (2,431,665) | (3,365,558) | (2,431,665) | (3,365,558) | |
| Non-Controlling Shareholders | - | - | 22,625 | 26,660 | |
The accompanying notes are an integral part of the parent company and consolidated interim financial information.
| 16 |
| | Statements of Changes in Shareholders’ Equity Quarters ended March 31, 2021 and 2020 (In thousands of Brazilian Reais - R$) |
| Parent Company and Consolidated | ||||||||||||||
| Capital Reserves | Equity Valuation Adjustments | |||||||||||||
| Share Capital | Shares to Issue | Treasury Shares | Bonus on transfer Shares | Special Premium Reserve of the Subsidiary | Share-Based Compensation | Unrealized hedge gains (losses) | Post-Employment Benefit | Other Comprehensive Income | Effects from Changes in the Equity Interest | Accumulated Losses | Negative Shareholders’ Equity (Deficit) Attributable to the Parent Company | Smiles non-controlling shareholders | Total | |
| Balances on December 31, 2019 | 3,008,178 | 584 | (102,543) | 17,497 | 83,229 | 124,550 | (530,043) | (41,045) | - | 759,335 | (10,996,413) | (7,676,671) | 571,254 | (7,105,417) |
| Other Comprehensive Income (Expenses), Net | - | - | - | - | - | - | (1,077,289) | - | - | - | - | (1,077,289) | - | (1,077,289) |
| Net Income (Loss) for the Period | - | - | - | - | - | - | - | - | - | - | (2,288,269) | (2,288,269) | 26,660 | (2,261,609) |
| Total Comprehensive Income (Expenses) for the Period | - | - | - | - | - | - | (1,077,289) | - | - | - | (2,288,269) | (3,365,558) | 26,660 | (3,338,898) |
| Capital Increase by Stock Option Period | - | 143 | - | - | - | - | - | - | - | - | - | 143 | - | 143 |
| Stock Option | - | - | - | - | - | 5,005 | - | - | - | - | - | 5,005 | (58) | 4,947 |
| Effects from Dilution in the Equity Interest | - | - | - | - | 470 | - | - | - | - | - | (690) | (220) | - | (220) |
| Balances on March 31, 2020 | 3,008,178 | 727 | (102,543) | 17,497 | 83,699 | 129,555 | (1,607,332) | (41,045) | - | 759,335 | (13,285,372) | (11,037,301) | 597,856 | (10,439,445) |
| Balances on December 31, 2020 | 3,009,436 | 1,180 | (62,215) | 17,497 | 83,229 | 106,520 | (1,311,076) | (26,669) | 564 | 759,812 | (16,985,370) | (14,407,092) | 640,033 | (13,767,059) |
| Other Comprehensive Income (Expenses), Net | - | - | - | - | - | - | 96,722 | - | 16 | - | - | 96,738 | 13 | 96,751 |
| Net Income (Loss) for the Period | - | - | - | - | - | - | - | - | - | - | (2,528,403) | (2,528,403) | 22,612 | (2,505,791) |
| Total Comprehensive Income (Expenses) for the Period | - | - | - | - | - | - | 96,722 | - | 16 | - | (2,528,403) | (2,431,665) | 22,625 | (2,409,040) |
| Stock Option | - | - | - | - | - | 5,010 | - | - | - | - | - | 5,010 | 161 | 5,171 |
| Interim Dividends Distributed by the Subsidiary Smiles (Note 25.3) | - | - | - | - | - | - | - | - | - | - | - | - | (236,992) | (236,992) |
| Balances on March 31, 2021 | 3,009,436 | 1,180 | (62,215) | 17,497 | 83,229 | 111,530 | (1,214,354) | (26,669) | 580 | 759,812 | (19,513,773) | (16,833,747) | 425,827 | (16,407,920) |
The accompanying notes are an integral part of the parent company and consolidated interim financial information.
| 17 |
| | Cash Flow Statements Quarters ended March 31, 2021 and 2020 (In thousands of Brazilian Reais - R$) |
| Parent Company | Consolidated | |||
| March 31, 2021 | March 31, 2020 | March 31, 2021 | March 31, 2020 | |
| Net Loss for the Period | (2,528,403) | (2,288,269) | (2,505,791) | (2,261,609) |
| Adjustments to Reconcile the Net Loss to Cash Generated from Operating Activities | ||||
| Depreciation and Amortization | - | - | 336,299 | 528,036 |
| Provision for Doubtful Accounts | - | - | (815) | 2,518 |
| Provision for Legal Proceedings | - | - | 70,147 | 74,502 |
| Provisions for Inventory Obsolescence | - | - | 50 | 45 |
| Provision for Loss on Advances from Suppliers | - | - | (4,640) | - |
| Recovery of Overdue Credits | - | - | (57,422) | (126,675) |
| Adjustment to Present Value of Assets and Liabilities | - | - | 18,870 | - |
| Deferred Taxes | (4,138) | 2,285 | (7,862) | 19,143 |
| Equity Income (Loss) | 2,097,170 | 2,217,639 | - | - |
| Share-Based Compensation | - | - | 5,171 | 4,947 |
| Expense Recovery | - | - | - | (309,980) |
| Sale-Leaseback | - | - | - | (112,590) |
| Actuarial Losses from Post-Employment Benefits | - | - | 4,353 | 4,750 |
| Exchange Rate and Cash Changes, Net | 318,496 | 1,226,130 | 1,503,093 | 3,810,587 |
| Interest on Loans and Leases and Amortization of Costs and Goodwill | 136,805 | 81,041 | 421,967 | 304,163 |
| Provision for Aircraft and Engine Return | - | - | 113,894 | 31,906 |
| Provision (Reversal) for Deposit Reduction and Maintenance Reserve | - | - | 9,678 | 53,871 |
| Income (Expenses) from Derivatives Recognized in Income (Expenses) | 46,107 | 148,500 | 89,443 | 130,200 |
| Unrealized Income (Expenses) on Derivatives – ESN (*) | (116,546) | (575,357) | (116,546) | (575,357) |
| Extinction of Obligation due to the Reduced Contractual Term | - | - | - | (20,968) |
| Provision for Labor Obligations | - | - | 50,348 | 70,461 |
| Write-off of Property, Plant & Equipment, and Intangible Assets | - | 108,538 | 500 | 15,478 |
| Other Provisions | (16) | - | (1,007) | (2,209) |
| Adjusted Net Income (Expenses) | (50,525) | 920,507 | (70,270) | 1,641,219 |
| Changes in Operating Assets and Liabilities: | ||||
| Trade Receivables | - | - | 201,276 | 449,475 |
| Financial Investments | 165 | 3,204 | 13,820 | (11,775) |
| Inventories | - | - | 7,252 | (16,612) |
| Advances to Suppliers and Third-Parties | (1,005) | (11) | 167,636 | (45,268) |
| Deposits | 671 | (2,248) | (36,742) | (159,717) |
| Taxes to Recover | 597 | 3,388 | 86,215 | (12,139) |
| Variable Leases | - | - | 12,353 | - |
| Suppliers | (23,605) | (2,104) | (117,066) | (54,202) |
| Suppliers - Forfaiting | - | - | - | 227,552 |
| Advance Ticket Sales | - | - | (388,760) | (362,042) |
| Frequent-Flyer Program | - | - | 63,980 | 161,301 |
| Advances from Customers | - | - | 52,882 | 3,267 |
| Labor Obligations | 4 | (103) | (53,944) | (59,876) |
| Landing Fees | - | - | 32,650 | 51,600 |
| Taxes to Collect | 260 | (12,836) | 2,148 | 25,822 |
| Obligations with Derivative Transactions | - | - | 133,331 | (329,438) |
| Payments for Lawsuits and Aircraft Return | - | - | (83,492) | (72,686) |
| Other Credits (Obligations) | 108,577 | (1,345) | 220,338 | (83,056) |
| Interest Paid | (191,018) | (207,971) | (215,462) | (234,352) |
| Income Tax Paid | - | (2,040) | (23,506) | (28,468) |
| Net Cash Flows (Used in) from Operating Activities | (155,879) | 698,441 | 4,639 | 1,090,605 |
| 18 |
| | Cash Flow Statements Quarters ended March 31, 2021 and 2020 (In thousands of Brazilian Reais - R$) |
| Parent Company | Consolidated | |||
| March 31, 2021 | March 31, 2020 | March 31, 2021 | March 31, 2020 | |
| Loans Receivable from Related Parties | (31,626) | (985,402) | - | - |
| Financial Investments in subsidiary | - | - | 95,735 | (241,810) |
| Restricted Cash | (41) | (146) | 31,710 | (839,593) |
| Dividends and Interest on Shareholders’ Equity Received through Subsidiary | 24,120 | 15,002 | - | - |
| Advances for Future Capital Increase in Subsidiary | (66,000) | - | - | - |
| Advances for Property, Plant & Equipment Acquisition, Net | - | - | (65,574) | (56,851) |
| Acquisition of Property, Plant & Equipment | (111,429) | (5,662) | (56,426) | (232,457) |
| Acquisition of Intangible Assets | - | - | (26,084) | (18,610) |
| Net Cash Flows (Used in) from Investment Activities | (184,976) | (976,208) | (20,639) | (1,389,321) |
| Funding of Borrowings | - | - | 10,952 | 60,156 |
| Loan Payments | (103,179) | (405,878) | (123,541) | (501,570) |
| Lease Payments | - | - | (128,528) | (421,713) |
| Derivatives Paid (Received) | - | - | - | 21,800 |
| Dividends and Interest on Shareholders’ Equity Paid to Non-Controlling Shareholders | - | - | (23,139) | (14,811) |
| Shares to Issue | - | 143 | - | 143 |
| Net Cash from Financing Activities | (103,179) | (405,735) | (264,256) | (855,995) |
| Exchange Rate Change of the Cash of Subsidiaries Abroad | 20,752 | 105,419 | 22,139 | 168,313 |
Net cash (decrease) increase and cash equivalents | (423,282) | (578,083) | (258,117) | (986,398) |
| Cash and Cash Equivalents at the Start of the Period | 423,937 | 1,016,746 | 662,830 | 1,645,425 |
| Cash and Cash Equivalents at the End of the Period | 655 | 438,663 | 404,713 | 659,027 |
(*) Exchangeable Senior Notes
Transactions that do not affect cash are presented in Note 35 of this Quarterly Information.
The accompanying notes are an integral part of the parent company and consolidated interim financial information.
| 19 |
| | Statement of Value Added Quarters ended March 31, 2021 and 2020 (In thousands of Brazilian Reais - R$) |
| Parent Company | Consolidated | |||
| March 31, 2021 | March 31, 2020 | March 31, 2021 | March 31, 2020 | |
| Revenues | ||||
| Passenger, Cargo, and Other Transportation | - | - | 1,643,979 | 3,267,055 |
| Other Operational Revenues | 489 | 376,308 | 74,761 | 305,915 |
| Provision for Doubtful Accounts | - | - | (1,095) | (2,518) |
| 489 | 376,308 | 1,717,645 | 3,570,452 | |
| Inputs Acquired from Third Parties (includes ICMS and IPI) | ||||
| Fuel and Lubricant Suppliers | - | - | (581,517) | (1,001,138) |
| Materials, Energy, Third-Party Services, and Others | (24,076) | (3,424) | (681,532) | (176,154) |
| Aircraft Insurance | - | - | (15,945) | (8,546) |
| Sales and Marketing | - | (367) | (67,026) | (118,012) |
| Gross Added Value | (23,587) | 372,517 | 371,625 | 2,266,602 |
| Depreciation and Amortization | - | - | (336,299) | (528,036) |
| Net Added Value Produced by the Company | (23,587) | 372,517 | 35,326 | 1,738,566 |
| Added Value Received on Transfers | ||||
| Equity Income (Expenses) | (2,097,170) | (2,217,639) | - | - |
| Financial Revenue | 154,910 | 616,916 | 150,886 | 698,246 |
| Total Value Added (Distributed) to Distribute | (1,965,847) | (1,228,206) | 186,212 | 2,436,812 |
| Distribution of Value Added: | ||||
| Direct Compensation | 3,353 | 770 | 329,443 | 432,448 |
| Benefits | - | - | 53,110 | 50,774 |
| FGTS | - | - | 20,421 | 29,993 |
| Employees | 3,353 | 770 | 402,974 | 513,215 |
| Federal | (3,536) | 3,771 | 146,045 | 228,524 |
| State | - | - | 3,721 | 4,964 |
| Municipal | - | - | 610 | 1,331 |
| Taxes, Fees, and Contributions | (3,536) | 3,771 | 150,376 | 234,819 |
| Interest and Exchange Rate Change | 562,739 | 1,055,522 | 2,107,115 | 3,929,575 |
| Rents | - | - | 31,448 | 19,669 |
| Others | - | - | 90 | 1,143 |
| Third-Party Capital Compensation | 562,739 | 1,055,522 | 2,138,653 | 3,950,387 |
| Net Loss for the Period | (2,528,403) | (2,288,269) | (2,528,403) | (2,288,269) |
| Net Profit of the Period Attributed to Non-Controlling Shareholders | - | - | 22,612 | 26,660 |
| Shareholders’ Equity Compensation | (2,528,403) | (2,288,269) | (2,505,791) | (2,261,609) |
| Total Value Added Distributed (to Distribute) | (1,965,847) | (1,228,206) | 186,212 | 2,436,812 |
The accompanying notes are an integral part of the parent company and consolidated interim financial information.
| 20 |
| | Notes on the Parent Company and Consolidated Quarterly Information (ITR) March 31, 2021 (In thousands of Brazilian Reais - R$, except when otherwise indicated) |
1. | Operating Context |
Gol Linhas Aéreas Inteligentes S.A. (“Company” or “GOL”) is a limited liability company incorporated on March 12, 2004, under Brazilian laws. The Company’s bylaws state that the corporate purpose is exercising the equity control of GOL Linhas Aéreas S.A. (“GLA”), which provides scheduled and non-scheduled air transportation services for passengers, develops frequent-flyer programs, among others.
The Company’s shares are traded on B3 S.A. - Brasil, Bolsa, Balcão (“B3”) and the New York Stock Exchange (“NYSE”) under the ticker GOLL4 and GOL, respectively. The Company adopts B3’s Special Corporate Governance Practices Level 2 and is part of the Special Corporate Governance (“IGC”) and Special Tag-Along (“ITAG”) indexes, created to distinguish companies that commit to special corporate governance practices.
The Company’s official headquarters are located at Praça Comandante Linneu Gomes, s/n, Portaria 3, Prédio 24, Jardim Aeroporto, São Paulo, Brazil.
| 1.1. | Impacts and Management’s Measures regarding Covid-19 |
The Covid-19 pandemic continues to significantly impact global economic activity in 2021. In Brazil, the recent increase in cases and deaths, coupled with new variants, has led state and municipal authorities to expand restrictions on circulation and operation of non-essential activities, directly affecting the demand for airline tickets.
The Company, through its Executive Committee, with its entire management body, works promptly to support society, monitor demand, and define financial and operational strategies.
In 2021, the Company has the initiative to transport Covid-19 vaccines for free – with GOLLOG – and health professionals to work directly in the fight against the pandemic, besides crediting 1,000 Smiles miles to each GOL segment flown at no cost. There are also active and strict protocols for aircraft hygiene and safety and health, besides actions to reduce human contact throughout the entire chain.
Since the pandemic started, GOL, readjusting its airline network, has had consistent occupancy rates at a level close to 80%. The flexible business model based on a single type of fleet is key to follow the drop of over 90% in passenger demand during the lockdown and sanitary barriers. In February and March 2021, there was a drop in the search for the Company’s airline tickets, compared to January 2021, and a lower sales volume due to the persistent decrease in the demand for travel due to the pandemic’s advance in the country. Responding to the sudden drop in sales and the increase in cancellations and no-shows, GOL’s airline network was reduced to bring costs up to the demand level.
The Management works continuously towards people’s health and integrity and manages the cash and has enough funds to meet financial obligations in the next twelve months. However, the scenario remains challenging due to uncertainties on the pandemic, recovery of the Brazilian economy, and demand in the airline industry.
The Company’s greatest commitment will continue to be people’s integrity and health. Following WHO guidelines to the letter, the Company is currently working with its ecosystem to help advance the vaccination calendar, which should lead to the resumption of economic activity, as seen in initial forecasts in countries with advanced immunization
| 21 |
| | Notes on the Parent Company and Consolidated Quarterly Information (ITR) March 31, 2021 (In thousands of Brazilian Reais - R$, except when otherwise indicated) |
| 1.1.1 | Impacts on the Parent Company and Consolidated Quarterly Information |
As already mentioned, the pandemic’s impacts were immediate and severe for the Company. The main consequence was the reduction in the operational air network, verified by the drop in the Company’s net revenue and margins. The table below details the reclassifications made in the period, which are directly related to the Covid-19 pandemic and additional disclosures:
| Consolidated | |||
| Income Statement - Reclassifications | Cost of Services | Other Revenues and Expenses, Net | |
| Flight Equipment Depreciation - Idleness | (a) | 62,675 | (62,675) |
| (a) | Due to the drop in the number of flights operated, where the Company incurred with the burden of time, by analogy to the provisions of CPC 16 (R1) - Inventories, equivalent to IAS 2, expenses and depreciation of flight equipment not directly related to the revenues generated in the period, called idleness, were reclassified from the group of costs of services to the group of other revenues and expenses, net. |
Like all other business organizations, the Company cannot foresee the duration of the pandemic and the extent of the impacts caused by it on future business, results, and cash generation. For this reason, when preparing this quarterly information, the Management considered the most recent forecasts available, duly reflected in the Company’s business plans. In the period ended March 31, 2021, no adjustment was needed regarding impairments on the Company’s recoverable taxes, deferred tax assets, Property, Plant & Equipment, and intangible assets.
| 1.2. | Capital Structure and Net Current Capital |
Net current capital on March 31, 2021, is negative by R$284,372 in the parent company and R$8,413,524 in the consolidated (R$233,276 and R$7,152,865 negative on December 31, 2020, in the parent company and the consolidated, respectively). The variation is mainly due to the lower balance of cash and cash equivalents and accounts receivable, totaling R$258,117 and R$196,895, respectively, and a higher balance of leases payable totaling R$616,144, due to the drop in operation due to the economic crisis from the pandemic and liquidity management. Of the consolidated negative net current capital, on March 31, 2021, R$2,971,691 refers to advances from ticket sales and the frequent-flyer program, which are expected to be substantially recognized with the Company’s services.
On March 31, 2021, the Company also had a negative shareholders’ equity position attributed to the controlling shareholders of R$16,833,747 (R$14,407,092 on December 31, 2020). The variation in the three-month period ended March 31, 2021, is mainly due to the pandemic’s impacts on the Company’s operations, detailed in the previous note, and by the devaluation of Real against the US Dollar, by around 9.6 %, which negatively affected the period’s consolidated result due to exchange variations totaling R$1,537,240.
The Company is highly sensitive to the domestic macroeconomic scenario and the U.S. dollar, as approximately 95.6% of the indebtedness (loans and financing and leases) is linked to US dollars (“US$”) and 40.0% of costs are also linked to US dollars. In contrast, the capacity to adjust ticket prices charged to its customers to offset the U.S. dollar appreciation depends on the capacity (offer) and ticket prices practiced by the competitors.
Over the past four years, the Management has taken many measures to adapt the size of its fleet to demand, matching the supply of seats to the demand level, thus promoting high occupancy rates, reducing costs, and adjusting the capital structure, as well as implementing initiatives to restructure its balance sheet.
| 22 |
| | Notes on the Parent Company and Consolidated Quarterly Information (ITR) March 31, 2021 (In thousands of Brazilian Reais - R$, except when otherwise indicated) |
With the pandemic’s outbreak, leading to a never-seen-before economic crisis, the Management reorganized the Company’s business. By continuously monitoring Covid-19’s impacts on economic activity, the Company works promptly to ensure business sustainability, considering the market’s management and the Company’s financial position.
Besides monitoring operations and sales, given the uncertainty, the Management monitors possible measures to rebalance the current net capital for 2021, which, if necessary, may involve: issuing debt notes with long-term maturity to settle short-term liabilities; new renegotiations with financial institutions and suppliers and reducing the fleet and firm orders with Boeing. These measures, if adopted, have the purpose of optimizing the capital structure, and the definition will be based on a rigorous assessment of the economic situation and current prospects.
Our Parent Company and Consolidated Quarterly Information have been prepared on an accounting base of continuity, which includes the continuity of operations, realization of assets and compliance with liabilities and commitments in the usual course of business, in compliance with the business plan prepared by Management, reviewed and approved, at least annually, by GOL’s Board of Directors.
Although there is still significant uncertainty about how long it will take for the airline industry to recover, and this leads to a material uncertainty about our ability to remain in operation, on March 31, 2021, the parent company and consolidated quarterly information do not include any adjustments that may result from the inability to continue operating.
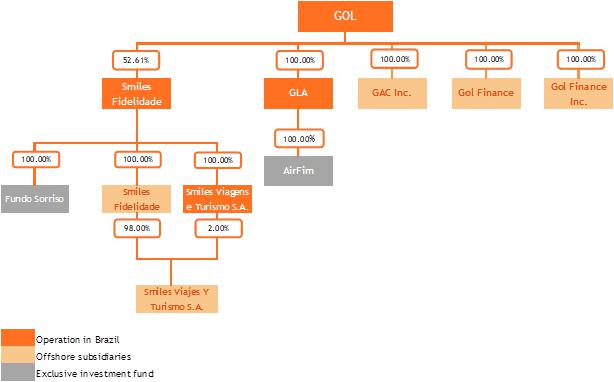
| 1.3. | Corporate Structure |
The corporate structure of the Company and its subsidiaries, on March 31, 2021, is shown below:
| 23 |
| | Notes on the Parent Company and Consolidated Quarterly Information (ITR) March 31, 2021 (In thousands of Brazilian Reais - R$, except when otherwise indicated) |
The Company’s equity interest in the share capital of its subsidiaries, on March 31, 2021, is shown below:
| Entity | Incorporation Date | Location | Principal Activity | Type of Control | % of Interest in the share capital | |
| Mar 31, 2021 | Dec 31, 2020 | |||||
| GAC | March 23, 2006 | Cayman Islands | Aircraft acquisition | Direct | 100.00 | 100.00 |
| Gol Finance Inc. | March 16, 2006 | Cayman Islands | Fundraising | Direct | 100.00 | 100.00 |
| Gol Finance | June 21, 2013 | Luxembourg | Fundraising | Direct | 100.00 | 100.00 |
| GLA | April 9, 2007 | Brazil | Flight Transportation | Direct | 100.00 | 100.00 |
| AirFim | November 7, 2003 | Brazil | Investment Fund | Indirect | 100.00 | 100.00 |
| Smiles Fidelidade | August 1, 2011 | Brazil | Frequent-Flyer Program | Direct | 52.60 | 52.60 |
| Smiles Viagens | August 10, 2017 | Brazil | Tourism Agency | Indirect | 52.60 | 52.60 |
| Smiles Fidelidade Argentina (a) | November 7, 2018 | Argentina | Frequent-Flyer Program | Indirect | 52.60 | 52.60 |
| Smiles Viagens Argentina (a) | November 20, 2018 | Argentina | Tourism Agency | Indirect | 52.60 | 52.60 |
| Fundo Sorriso | July 14, 2014 | Brazil | Investment Fund | Indirect | 52.60 | 52.60 |
| Companies in Shareholding: | ||||||
| SCP Trip (b) | April 27, 2012 | Brazil | On-Board Magazine | - | - | 60.00 |
| (a) | Companies with functional currency in Argentine pesos (ARS). |
| (b) | In the period ended March 31, 2021, GLA discontinued the investment in Trip. |
The subsidiaries GAC Inc., GOL Finance, and GOL Finance Inc. are entities created for the specific purpose of continuing financial operations and related to the Company’s fleet. They do not have their own governing body and decision-making autonomy. Therefore, their assets and liabilities are consolidated in the Parent Company.
The subsidiaries Smiles Fidelidade S.A. and Smiles Viajes Y Turismo S.A., incorporated and controlled by Smiles Fidelidade S.A., both headquartered in Buenos Aires, Argentina, have the purpose of promoting Smiles Program’s operations and the sale of airline tickets in this country.
The subsidiary Smiles Fidelidade also controls Smiles Viagens e Turismo S.A. (“Smiles Viagens”), which has as its main purpose intermediating travel organization services by booking or selling airline tickets, accommodation, tours, among others.
The investment funds AirFim and Fundo Sorriso, controlled by GLA and Smiles Fidelidade, respectively, have the characteristic of an exclusive fund and act as an extension of the subsidiaries to carry out operations with derivatives and financial investments so that the Company consolidates the assets and liabilities of this fund.
| 1.4. | Stock Merger Plan |
On March 24, 2021, the shareholders of Smiles Fidelidade S.A. (“Smiles”) and GOL approved the proposal for the merger of shares involving Smiles.
The incorporation proposal includes the following steps, which will be implemented concurrently and interdependently:
· the Company incorporating Smiles Fidelidade’s shares and issuing the Company’s preferred shares and redeemable preferred shares for Smiles Fidelidade’s shareholders;
· the Company incorporating GLA’s shares and issuing the Company’s preferred shares and redeemable preferred shares for GLA’s shareholders; and
· Redeeming the GLA’s and Company’s redeemable preferred shares paying in cash based on redeeming the Company’s redeemable preferred shares to Smiles Fidelidade’s shareholders.
| 24 |
| | Notes on the Parent Company and Consolidated Quarterly Information (ITR) March 31, 2021 (In thousands of Brazilian Reais - R$, except when otherwise indicated) |
Whit the merger of shares, Smiles Fidelidade will become a wholly owned subsidiary of GLA, with the purpose to maximize value for all shareholders by aligning the interests of the two companies while ensuring the airline’s and miles program’s continuity, simplifying the corporate governance, strengthening the capital structure, and reducing operating, administrative, and financial costs, as well as tax inefficiencies.
The merger’s development is in line with the deadlines defined in the approved proposal, and the evolution of this process is timely communicated at the Company’s electronic address. On March 31, 2021, there is no impact of this transaction on the quarterly information.
| 1.5. | Compliance Program |
In December 2016, as a result of the investigations involving the Company, GOL signed an agreement with the Federal Public Prosecution’s Office (“Agreement”), in which the Company agreed to pay fines and improve its compliance program, in exchange for the Office’s commitment to not file a lawsuit of any nature related to activities under the Agreement, as disclosed in the financial statements for the fiscal years ended December 31, 2017, 2018, 2019, and 2020.
The Company voluntarily informed the U.S. Department of Justice (“DOJ”), the Securities and Exchange Commission (“SEC”) and the Brazilian Securities and Exchange Commission (“CVM”) about the Agreement and the independent external investigation hired by the Company, and about the Agreement.
The investigation, completed in April 2017, revealed that immaterial payments were made to politically exposed people and were duly reported to the authorities. None of the Company’s current employees, representatives or members of the Board of Directors and Management was aware of any illegal purpose behind the transactions identified or any illegal benefit for the Company from the transactions under investigation.
The Company will continue to report any developments on the matter, following the analyses already started by these bodies, imposing new fines and sanctions on the Company.
Since 2016, the Company took several steps to strengthen and expand its internal control and compliance programs, detailed in the annual financial statements. Besides, the Management is constantly reinforcing to its employees, customers, and suppliers its commitment to continue improving its internal control and compliance programs.
There were no new developments on the matter during the period ended March 31, 2021.
| 2. | Message from the Management, base to Prepare and Present the Parent Company and Consolidated Quarterly Information (ITR) |
The Company’s consolidated quarterly information (ITR) was prepared under accounting practices adopted in Brazil and the International Financial Reporting Standards (“IFRS”) issued by the International Accounting Standards Board (“IASB”). The accounting practices adopted in Brazil include those outlined in Brazilian Corporate Law and the technical pronouncements, guidelines and interpretations issued by the Accounting Pronouncements Committee (“CPC”) and approved by the Federal Accounting Council (“CFC”) and the Brazilian Securities and Exchange Commission (“CVM”).
| 25 |
| | Notes on the Parent Company and Consolidated Quarterly Information (ITR) March 31, 2021 (In thousands of Brazilian Reais - R$, except when otherwise indicated) |
The Company’s Parent Company and Consolidated Quarterly Information (ITR) was prepared using the Brazilian real (“R$”) as the functional and presentation currency. Figures are expressed in thousands of Brazilian reais, except when stated otherwise. The items disclosed in foreign currencies are duly identified when applicable.
The Parent Company and Consolidated Quarterly Information (ITR) preparation requires the Management to make judgments, use estimates, and adopt assumptions affecting the amounts presented of revenues, expenses, assets, and liabilities. However, the uncertainty inherent in these judgments, assumptions and estimates could give rise to results that require a significant adjustment to the book value of certain assets and liabilities in future reporting periods.
The Company is continually reviewing its judgments, estimates, and assumptions.
When preparing this Parent Company and Consolidated Quarterly Information (ITR), the Management used disclosure criteria, considering regulatory aspects and the relevance of the transactions to understand the changes in the Company’s economic and financial position and its performance since the end of the fiscal year ended December 31, 2020, as well as the restatement of relevant information included in the annual financial statements disclosed on March 17, 2021.
The Management confirms that all material information in this Parent Company and Consolidated Quarterly Information (ITR) is being demonstrated and corresponds to the information used by the Management in the development of its business management activities.
The Parent Company and Consolidated Quarterly Information (ITR) has been prepared based on historical cost, except for the following material items recognized in the statements of financial position:
| · | financial investments classified as cash and cash equivalents measured at fair value; |
| · | financial investments mainly comprising exclusive investment funds, measured at fair value; |
| · | restricted cash measured at fair value; |
| · | derivative financial instruments measured at fair value; and |
| · | investments accounted for using the equity method. |
The Company’s Parent Company and Consolidated Quarterly Information (ITR) for the three-month period ended March 31, 2021, has been prepared considering that the Company will continue as a going concern, realizing assets, and settling liabilities in the normal course of business, as per Note 1.2.
| 3. | Approval of the Parent Company and Consolidated Quarterly Information |
The Board of Directors authorized this Parent Company and Consolidated Quarterly Information (ITR) at a Meeting held on April 27, 2021.
| 4. | Summary of Significant Accounting Practices |
The Parent Company and Consolidated Quarterly Information (ITR) presented herein was prepared based on policies, accounting practices and estimate calculation methods adopted and presented in detail in the annual financial statements for the year ended December 31, 2020, released on March 17, 2021.
| 26 |
| | Notes on the Parent Company and Consolidated Quarterly Information (ITR) March 31, 2021 (In thousands of Brazilian Reais - R$, except when otherwise indicated) |
| 4.1. | New Accounting Standards and Pronouncements Adopted in the Current Year |
On the first quarter of 2021, CPC issued the Standards Technical Review Nr. 17 resulting from the “Reform of Reference Interest Rate - Phase 2”, duly approved by CVM, through CVM Resolution 18/2021, effective for fiscal years beginning after January 1, 2021.
On March 31, 2021, IASB extended the possibility of applying the practical expedient with benefits granted to tenants in lease agreements for years beginning on or after April 1, 2021, with early adoption allowed.
Both changes did not impact the Company’s quarterly information. Additionally, in the period ended March 31, 2021, standards or pronouncements issued in previous periods with an impact on the Company’s quarterly information did not enter into force.
| 4.2. | Foreign Currency Transactions |
Foreign currency transactions are recorded at the exchange rate change prevailing on the transactions' date. Monetary assets and liabilities designated in foreign currency are calculated based on the exchange rate change on the balance sheet date. Any difference resulting from the translation of currencies is recorded under the item “Exchange rate change, net” in the income statement for the period.
The main exchange rates in reais in effect on the base date of this Parent Company and Consolidated Quarterly Information (ITR) are as follows:
| Final Rate | Average Rate | |||
| March 31, 2021 | December 31, 2020 | March 31, 2021 | December 31, 2020 | |
| U.S. Dollar | 5.6973 | 5.1967 | 5.6383 | 5.1425 |
| Argentinian Peso | 0.0619 | 0.0617 | 0.0619 | 0.0622 |
| 5. | Seasonality |
Under normal economic and social conditions, the Company expects revenues and operating income (expense) from its flights to be at their highest levels in the summer and winter months of January and July, respectively, and during the last weeks of December and in the year-end holiday period. Given the high proportion of fixed costs, this seasonality tends to drive changes in operating income (expense) across the fiscal-year quarters. In the current context, considering all current unpredictability and uncertainty, operations have shown a behavior negatively correlated with cases and deaths by Covid-19. That is, periods of high demand are seen when there are fewer cases and deaths.
| 6. | Cash and Cash Equivalents |
| Parent Company | Consolidated | |||
| March 31, 2021 | December 31, 2020 | March 31, 2021 | December 31, 2020 | |
| Cash and Bank Deposits | 264 | 374,271 | 39,818 | 428,812 |
| Cash Equivalents | 391 | 49,666 | 364,895 | 234,018 |
| Total | 655 | 423,937 | 404,713 | 662,830 |
| 27 |
| | Notes on the Parent Company and Consolidated Quarterly Information (ITR) March 31, 2021 (In thousands of Brazilian Reais - R$, except when otherwise indicated) |
The breakdown of cash equivalents is as follows:
| Parent Company | Consolidated | |||
| March 31, 2021 | December 31, 2020 | March 31, 2021 | December 31, 2020 | |
| Domestic Currency | ||||
| Private Bonds | - | 49,014 | 340,627 | 170,359 |
| Automatic Investments | 391 | 652 | 24,236 | 59,936 |
| Total Domestic Currency | 391 | 49,666 | 364,863 | 230,295 |
| Foreign Currency | ||||
| Private Bonds | - | - | - | 3,723 |
| Automatic Investments | - | - | 32 | - |
| Total Foreign Currency | - | - | 32 | 3,723 |
| Total | 391 | 49,666 | 364,895 | 234,018 |
| 7. | Financial Investments |
| Parent Company | Consolidated | ||||
| Weighted Average Profitability (p.a.) | March 31, 2021 | December 31, 2020 | March 31, 2021 | December 31, 2020 | |
| Domestic Currency | |||||
| Government Bonds | 84.1% of CDI | - | - | 18,333 | 22,465 |
| Investment Funds | 124.1% of CDI | 124 | 236 | 514,523 | 603,698 |
| Total Domestic Currency | 124 | 236 | 532,856 | 626,163 | |
| Foreign Currency | |||||
| Private Bonds | 3.0% | - | - | 2,665 | 2,415 |
| Investment Funds | 29.6% | - | - | 17 | 757 |
| Total Foreign Currency | - | - | 2,682 | 3,172 | |
| Total | 124 | 236 | 535,538 | 629,335 | |
| Current | 124 | 236 | 535,538 | 628,343 | |
| Noncurrent | - | - | - | 992 | |
| 28 |
| | Notes on the Parent Company and Consolidated Quarterly Information (ITR) March 31, 2021 (In thousands of Brazilian Reais - R$, except when otherwise indicated) |
| 8. | Restricted Cash |
| Parent Company | Consolidated | ||||
Weighted average weighted (p.a.) | March 31, 2021 | December 31, 2020 | March 31, 2021 | December 31, 2020 | |
| Domestic Currency | |||||
| Import Financing | 98.0% of CDI | - | - | 60,369 | 213,153 |
| Letter of Guarantee - Legal Proceedings | 82.7% of CDI | 4,242 | 4,201 | 52,956 | 56,440 |
| Letter of Credit – Maintenance Deposit | 97.7% of CDI | - | - | 155,563 | 155,184 |
| Working Capital Loan | 101.6% of CDI | - | - | 9,635 | 52,927 |
| Total Domestic Currency | 4,242 | 4,201 | 278,523 | 477,704 | |
| Foreign Currency | |||||
| Financing with Ex-lm Bank Collateral | 0.2% | - | - | 34,227 | 31,206 |
| Letter of Guarantee - Legal Proceedings | - | - | - | 1,877 | - |
| Hedge Margin | - | - | - | - | 35,697 |
| Total Foreign Currency | - | - | 36,104 | 66,903 | |
| Total | 4,242 | 4,201 | 314,627 | 544,607 | |
| Current | 4,237 | 4,194 | 265,192 | 355,769 | |
| Noncurrent | 5 | 7 | 49,435 | 188,838 | |
The decrease in restricted cash linked to import financing and working capital loan, in the period ended March 31, 2021, refers to using the asset to pay for debt operations to which they were linked.
| 9. | Trade Receivables |
| Consolidated | ||
| March 31, 2021 | December 31, 2020 | |
| Domestic Currency | ||
| Credit Card Administrators | 261,761 | 318,869 |
| Travel Agencies | 170,044 | 266,086 |
| Cargo Agencies | 28,211 | 29,902 |
| Partner Airlines | 16,222 | 8,877 |
| Others | 3,462 | 13,845 |
| Total Domestic Currency | 479,700 | 637,579 |
| Foreign Currency | ||
| Credit Card Administrators | 40,301 | 77,616 |
| Travel Agencies | 15,069 | 13,960 |
| Cargo Agencies | 54 | 122 |
| Partner Airlines | 5,274 | 19,464 |
| Others | 19,638 | 9,005 |
| Total Foreign Currency | 80,336 | 120,167 |
| Total | 560,036 | 757,746 |
| Estimated Losses from Doubtful Accounts | (17,232) | (18,047) |
| Total Trade Receivables | 542,804 | 739,699 |
| 29 |
| | Notes on the Parent Company and Consolidated Quarterly Information (ITR) March 31, 2021 (In thousands of Brazilian Reais - R$, except when otherwise indicated) |
The aging list of trade receivables, net of allowance for expected loss on trade receivables accounts, is as follows:
| Consolidated | ||
| March 31, 2021 | December 31, 2020 | |
| To be Due | ||
| Until 30 days | 294,451 | 459,338 |
| From 31 to 60 days | 82,692 | 88,893 |
| From 61 to 90 days | 26,405 | 33,121 |
| From 91 to 180 days | 50,425 | 54,832 |
| From 181 to 360 days | 31,729 | 41,484 |
| Over 360 days | 137 | 256 |
| Total to be Due | 485,839 | 677,924 |
| Overdue | ||
| Until 30 days | 17,481 | 10,278 |
| From 31 to 60 days | 10,085 | 21,677 |
| From 61 to 90 days | 10,081 | 13,501 |
| From 91 to 180 days | 13,820 | 11,474 |
| From 181 to 360 days | 1,456 | 785 |
| Over 360 days | 4,042 | 4,060 |
| Total Overdue | 56,965 | 61,775 |
| Total | 542,804 | 739,699 |
The changes in the expected loss on trade receivables are as follows:
| Consolidated | ||
| March 31, 2021 | December 31, 2020 | |
| Balance at the Beginning of the Fiscal Year | (18,047) | (16,952) |
| (Additions) reversals | 815 | (1,095) |
| Balance at the End of the Period | (17,232) | (18,047) |
| 10. | Inventories |
| Consolidated | ||
| March 31, 2021 | December 31, 2020 | |
| Consumables | 20,633 | 14,533 |
| Parts and Maintenance Materials | 167,703 | 181,105 |
| Total | 188,336 | 195,638 |
The changes in the provision for obsolescence are as follows:
| Consolidated | ||
| March 31, 2021 | December 31, 2020 | |
| Balances at the Beginning of the Fiscal Year | (12,862) | (14,302) |
| Additions | (50) | (702) |
| Write-Offs | 64 | 2,142 |
| Balances at the End of the Period | (12,848) | (12,862) |
| 30 |
| | Notes on the Parent Company and Consolidated Quarterly Information (ITR) March 31, 2021 (In thousands of Brazilian Reais - R$, except when otherwise indicated) |
| 11. | Advances to Suppliers and Third-Parties |
| Parent Company | Consolidated | |||
| March 31, 2021 | December 31, 2020 | March 31, 2021 | December 31, 2020 | |
| Advance to Domestic Suppliers | - | - | 167,141 | 290,664 |
| Advances to Foreign Suppliers | 11,446 | 10,441 | 29,401 | 68,873 |
| Advance for Materials and Repairs | - | - | 48,933 | 48,933 |
| Total Advances to Suppliers | 11,446 | 10,441 | 245,475 | 408,470 |
| Current | 11,446 | 10,441 | 155,945 | 318,769 |
| Noncurrent | - | - | 89,530 | 89,701 |
| 12. | Taxes to Recover |
| Parent Company | Consolidated | |||
| March 31, 2021 | December 31, 2020 | March 31, 2021 | December 31, 2020 | |
| Prepaid Income Tax and Social Contribution to Recover | 17,727 | 18,335 | 98,071 | 109,231 |
| PIS and COFINS to recover (*) | - | - | 367,494 | 387,033 |
| Value Added Tax (VAT), Abroad | - | - | 3,649 | 3,998 |
| Others | 73 | 62 | 7,352 | 5,097 |
| Total | 17,800 | 18,397 | 476,566 | 505,359 |
| Current | 6,517 | 6,295 | 364,702 | 186,955 |
| Noncurrent | 11,283 | 12,102 | 111,864 | 318,404 |
(*) During the three-month period ended March 31, 2021, the subsidiary GLA recorded PIS and COFINS extemporaneous tax credits in the total amount of R$57,422 (R$126,675 in the fiscal year ended December 31, 2020).
| 31 |
| | Notes on the Parent Company and Consolidated Quarterly Information (ITR) March 31, 2021 (In thousands of Brazilian Reais - R$, except when otherwise indicated) |
| 13. | Deferred Taxes |
| 13.1. | Deferred Tax Assets (Liabilities) |
The positions of deferred assets and liabilities are presented below and comply with the enforceable offset legal rights that consider taxes levied by the same tax authority under the same tax entity.
| Parent Company | Consolidated | ||||||
| December 31, 2020 | Income (Expenses) | March 31, 2021 | December 31, 2020 | Income (Expenses) | Shareholders’ Equity (*) | March 31, 2021 | |
| Deferred Assets | |||||||
| Tax Losses | 37,921 | 1,451 | 39,372 | 37,921 | 1,451 | - | 39,372 |
| Negative Basis of Social Contribution | 13,650 | 523 | 14,173 | 13,650 | 523 | - | 14,173 |
| Temporary Differences: | |||||||
| Provision for Losses on Other Credits | 2,004 | 2,165 | 4,169 | 2,004 | 2,165 | - | 4,169 |
| Provision for Legal Proceedings and Tax Liabilities | (83) | (1) | (84) | (83) | (1) | - | (84) |
| Others | - | - | - | 71 | - | 3 | 74 |
| Total Income Tax and Social Contribution Deferred - Assets | 53,492 | 4,138 | 57,630 | 53,563 | 4,138 | 3 | 57,704 |
| Deferred Liabilities | |||||||
| Temporary Differences: | |||||||
| Breakage Provision | - | - | - | (193,498) | (649) | - | (194,147) |
| Flight Rights | - | - | - | (353,226) | - | - | (353,226) |
| Depreciation of Engines and Parts for Aircraft Maintenance | - | - | - | (194,789) | (1,875) | - | (196,664) |
| Reversal of Goodwill Amortization for Tax Purposes | - | - | - | (127,659) | - | - | (127,659) |
| Derivative Transactions | - | - | - | (28,902) | 44,789 | - | 15,887 |
| Allowance for doubtful accounts and other credits | - | - | - | 201,446 | (6,931) | - | 194,515 |
| Provision for Legal Proceedings and Tax Liabilities | - | - | - | 124,723 | 9,176 | - | 133,899 |
| Aircraft Return | - | - | - | 190,778 | (11,924) | - | 178,854 |
| Aircraft Leases and Others | - | - | - | 10,586 | (4,549) | - | 6,037 |
| Unrealized Profits | - | - | - | 69,843 | (6,532) | - | 63,311 |
| Others | - | - | - | 81,064 | (17,781) | - | 63,283 |
| Total Income Tax and Social Contribution Deferred - Liabilities | - | - | - | (219,634) | 3,724 | - | (215,910) |
| Total Effect of Deferred Taxes in the Income (Expenses) | - | 4,138 | - | - | 7,862 | - | - |
(*) Exchange rate change recognized in other comprehensive income.
| 32 |
| | Notes on the Parent Company and Consolidated Quarterly Information (ITR) March 31, 2021 (In thousands of Brazilian Reais - R$, except when otherwise indicated) |
The Company’s Management considers that the deferred assets and liabilities recognized on March 31, 2021, arising from temporary differences, will be realized in proportion to the realization of their bases and the expectation of future results.
The Management estimates that active deferred tax credits, recorded on tax losses and a negative social contribution base, may be realized as follows:
| Year | Amount |
| 2021 | 1,438 |
| 2022 | 9,128 |
| 2023 | 12,657 |
| 2024 | 13,191 |
| 2025 | 14,342 |
| 2025 onwards | 2,789 |
| Total | 53,545 |
The direct subsidiary GLA has tax losses and negative bases of social contribution in the determination of taxable profit, to be offset against 30% of future annual tax profits, with no prescription period, not recorded in the balance sheet, in the following amounts:
| GLA | ||
| March 31, 2021 | December 31, 2020 | |
| Income Tax Loss | 9,175,733 | 8,401,388 |
| Negative Basis of Social Contribution | 9,175,733 | 8,401,388 |
| Potential Tax Credit | 3,119,749 | 2,856,472 |
The reconciliation between tax expense and multiplying the accounting profit by the nominal tax rate for the three-month periods ended March 31, 2021, and 2020 is shown below:
| Parent Company | Consolidated | |||
| March 31, 2021 | March 31, 2020 | March 31, 2021 | March 31, 2020 | |
| Loss before Income Tax and Social Contribution | (2,532,541) | (2,284,936) | (2,484,822) | (2,218,193) |
| Combined Nominal Tax Rate | 34% | 34% | 34% | 34% |
| Income Tax and Social Contribution by the Combined Tax Rate | 861,064 | 776,878 | 844,839 | 754,186 |
| Adjustments to Calculate the Actual Tax Rate: | ||||
| Equity Income (Loss) | (713,038) | (753,997) | - | - |
| Tax Rate Difference of the Income (Expenses) of Subsidiaries | (32,225) | 160,843 | (35,386) | 160,843 |
| Nondeductible Expenses, Net | (1,723) | (204) | (35,119) | 50,194 |
| Exchange Rate Change on Foreign Investments | (109,940) | (186,853) | (99,770) | (131,967) |
| Benefit Not Constituted on Tax Losses, Negative Basis and Temporary Differences | - | - | (695,533) | (876,672) |
| Total Income Tax and Social Contribution | 4,138 | (3,333) | (20,969) | (43,416) |
| Income Tax and Social Contribution | ||||
| Current | - | (1,048) | (28,831) | (24,273) |
| Deferred | 4,138 | (2,285) | 7,862 | (19,143) |
| Total Income Tax and Social Contribution | 4,138 | (3,333) | (20,969) | (43,416) |
| 33 |
| | Notes on the Parent Company and Consolidated Quarterly Information (ITR) March 31, 2021 (In thousands of Brazilian Reais - R$, except when otherwise indicated) |
| 14. | Deposits |
| Parent Company | Consolidated | |||
| March 31, 2021 | December 31, 2020 | March 31, 2021 | December 31, 2020 | |
| Maintenance deposits | - | - | 1,153,172 | 1,032,418 |
| Court Deposits | 49,166 | 49,838 | 667,350 | 667,565 |
| Deposit in Guarantee for Lease Agreements | 75,015 | 68,423 | 400,852 | 358,472 |
| Total | 124,181 | 118,261 | 2,221,374 | 2,058,455 |
| 14.1. | Maintenance deposits |
The Company makes deposits in US dollars for aircraft and engine overhauling, which will be used in future events as established in certain lease agreements.
Maintenance deposits do not exempt the Company, as a lessee, from contractual obligations related to the maintenance or the risk associated with operating activities. These deposits can be replaced by bank guarantees or letters of credit (SBLC - stand by letter of credit) as established in the aircraft lease. The Company has the right to choose to carry out the maintenance internally or through its suppliers.
The Company has two categories of maintenance deposits:
· Maintenance Guarantee: Refers to one-time deposits that are refunded at the end of the lease and can also be used in maintenance events, depending on negotiations with lessors. The balance of these deposits on March 31, 2021, was R$299,914 (R$273,311 on December 31, 2020).
· Maintenance Reserve: Refers to amounts paid monthly based on the use of components and can be used in maintenance events as set by an agreement. On March 31, 2021, the balance of these reserves was R$853,257 (R$759,108 on December 31, 2020).
| 14.2. | Court Deposits |
Court deposits and blocks represent guarantees of tax, civil and labor lawsuits, kept in court until resolving the disputes to which they are related. Part of the court deposits refers to civil and labor lawsuits arising from succession requests in lawsuits filed against Varig S.A. or also labor lawsuits filed by employees who do not belong to GLA or any related party. Bearing in mind that the Company is not a legitimate party to appear on the liability side of the said lawsuits, their exclusion and respective release of the retained funds are demanded whenever blocks occur.
| 14.3. | Deposits in guarantee for lease agreements |
As required by the lease agreements, the Company guarantees deposits (in US dollars) to the leasing companies, which may be redeemed if replaced by other bank guarantees or fully redeemed at maturity.
| 34 |
| | Notes on the Parent Company and Consolidated Quarterly Information (ITR) March 31, 2021 (In thousands of Brazilian Reais - R$, except when otherwise indicated) |
| 15. | Investments |
| 15.1. | Breakdown of Investments |
The investment information is shown below:
| Parent Company | Consolidated | |||
| GLA | Smiles Fidelidade | Trip | ||
| Relevant Information of the Subsidiaries on March 31, 2021 | ||||
| Total Number of Shares | 5,262,335,049 | 124,158,953 | - | |
| Share Capital | 4,554,280 | 254,610 | - | |
| Interest % | 100.0% | 52.60% | - | |
| Shareholders’ Equity (Deficit) | (14,637,866) | 898,402 | - | |
| Unrealized Gains (a) | - | (122,899) | - | |
| Adjusted Shareholders’ Equity (b) | (14,637,866) | 349,674 | - | |
| Net Income (Loss) for the Period | (2,134,944) | 47,707 | - | |
| Unrealized Gains for the Period (a) | - | 12,679 | - | |
| Adjusted Net Income (Expenses) for the Period (b) | (2,134,944) | 37,774 | - | |
| Relevant Information of the Subsidiaries on December 31, 2020 | ||||
| Total Number of Shares | 5,262,335,049 | 124,158,953 | - | |
| Share Capital | 4,554,280 | 254,610 | 1,318 | |
| Interest % | 100.0% | 52.60% | 60.0% | |
| Shareholders’ Equity (Deficit) | (12,670,479) | 1,350,329 | 1,359 | |
| Unrealized Gains (a) | - | (135,578) | - | |
| Adjusted Shareholders’ Equity (b) | (12,670,479) | 574,717 | 815 | |
| Relevant Information of the Subsidiaries on March 31, 2020 | ||||
| Net Income (Loss) for the Period | (2,261,376) | 56,252 | - | |
| Unrealized Gains for the Period (a) | - | 14,144 | - | |
| Adjusted Net Income (Expenses) for the Period (b) | (2,261,376) | 43,737 | - | |
(a) Corresponds to transactions involving revenue from mileage redemption for airline tickets by members in the Smiles Program, which, for consolidated statements, are only accrued when GLA transports program members.
(b) Adjusted shareholders’ equity and net profit (loss) for the adjusted period corresponds to the percentage of total equity and net profit (loss) for unrealized profits.
| 15.2. | Changes in Investments |
| Parent Company | Consolidated | |||
| GLA | Smiles Fidelidade | Total | Trip | |
| Balances on December 31, 2020 | (12,670,479) | 574,717 | (12,095,761) | 815 |
| Advances for Future Capital Increase | 66,000 | - | 66,000 | - |
| Equity Income (Expenses) | (2,134,944) | 37,774 | (2,097,170) | - |
| Unrealized Income (Expenses) on Hedge | 96,722 | - | 96,722 | - |
| Foreign Exchange Rate Change on Investment Conversion Abroad | - | 16 | 16 | - |
| Dividends and Interest on Shareholders’ Equity | - | (263,008) | (263,008) | - |
| Share-Based Compensation | 4,835 | 175 | 5,010 | - |
| Investment Write-Off | - | - | - | (815) |
| Balances on March 31, 2021 | (14,637,866) | 349,674 | (14,288,191) | - |
| 16. | Property, Plant & Equipment |
| 16.1. | Parent Company |
On March 31, 2021, the balance of property, plant and equipment was R$180,089 in subsidiary GAC (R$68,660 on December 31, 2020), mainly due to advances in aircraft acquisition.
| 35 |
| | Notes on the Parent Company and Consolidated Quarterly Information (ITR) March 31, 2021 (In thousands of Brazilian Reais - R$, except when otherwise indicated) |
| 16.2. | Consolidated |
| December 31, 2020 | March 31, 2021 | |||||||||||
| Weighted Average Rate (p.a.) | Historical Cost | Accumulated Depreciation | Net Opening Balance | Additions | Contractual Amendment | Depreciation | Write-Offs | Transfers | Net Closing Balance | Historical Cost | Accumulated Depreciation | |
| Flight Equipment | ||||||||||||
| Aircraft – ROU (1) with no Purchase Option | 21.67% | 4,020,709 | (1,420,648) | 2,600,061 | 153,126 | 2,500 | (135,921) | - | - | 2,619,766 | 4,169,622 | (1,549,856) |
| Spare Parts and Engines - Own (4) (5) | 7.00% | 1,964,411 | (837,048) | 1,127,363 | 16,037 | - | (33,388) | (324) | - | 1,109,688 | 1,979,245 | (869,557) |
| Spare Parts and Engines – ROU | 31.09% | 84,329 | (47,940) | 36,389 | - | - | (4,103) | - | - | 32,286 | 80,691 | (48,405) |
| Aircraft and Engine Overhauling | 51.08% | 3,206,385 | (2,282,042) | 924,343 | 43,092 | - | (128,123) | - | 40,037 | 879,349 | 3,204,499 | (2,325,150) |
| Tools | 10.00% | 55,821 | (28,697) | 27,124 | 354 | - | (1,003) | - | - | 26,475 | 56,180 | (29,705) |
| 9,331,655 | (4,616,375) | 4,715,280 | 212,609 | 2,500 | (302,538) | (324) | 40,037 | 4,667,564 | 9,490,237 | (4,822,673) | ||
| Property, Plant & Equipment in Use | ||||||||||||
| Vehicles | 20.00% | 11,264 | (9,572) | 1,692 | 381 | - | (146) | - | - | 1,927 | 11,645 | (9,718) |
| Machinery and Equipment | 10.00% | 62,841 | (48,417) | 14,424 | 30 | - | (783) | - | - | 13,671 | 62,865 | (49,194) |
| Furniture and Fixtures | 10.00% | 32,790 | (20,483) | 12,307 | 26 | - | (501) | (1) | - | 11,831 | 32,805 | (20,974) |
| Computers and Peripherals – Own | 20.00% | 47,487 | (35,837) | 11,650 | 90 | - | (940) | (5) | - | 10,795 | 47,349 | (36,554) |
| Computers and Peripherals – ROU | 33.75% | 21,992 | (15,460) | 6,532 | - | - | (1,844) | - | - | 4,688 | 21,992 | (17,304) |
| Communication Equipment | 10.00% | 2,233 | (1,871) | 362 | 6 | - | (67) | - | - | 301 | 2,225 | (1,924) |
| Security Equipment | 10.00% | 55 | (32) | 23 | - | - | (1) | - | - | 22 | 55 | (33) |
| Third-Party Property Improvements - CMA (3) | 12.05% | 107,637 | (107,637) | - | - | - | - | - | - | - | 107,637 | (107,637) |
| Leasehold Improvements | 20.31% | 75,714 | (49,328) | 26,386 | 39 | - | (2,466) | - | - | 23,959 | 75,739 | (51,780) |
| Third-Party Properties – ROU | 34.71% | 27,867 | (15,834) | 12,033 | - | - | (2,277) | - | - | 9,756 | 27,867 | (18,111) |
| Construction in Progress | 14,837 | - | 14,837 | - | - | - | (170) | - | 14,667 | 14,667 | - | |
| 404,717 | (304,471) | 100,246 | 572 | - | (9,025) | (176) | - | 91,617 | 404,846 | (313,229) | ||
| Impairment Losses (2) | - | (34,330) | - | (34,330) | 1,851 | - | - | - | - | (32,479) | (32,479) | - |
| Total | 9,702,042 | (4,920,846) | 4,781,196 | 215,032 | 2,500 | (311,563) | (500) | 40,037 | 4,726,702 | 9,862,604 | (5,135,902) | |
| Advances to Suppliers | - | 179,092 | - | 179,092 | 65,574 | - | - | - | (40,037) | 204,629 | 204,629 | - |
| Total Property, Plant & Equipment | 9,881,134 | (4,920,846) | 4,960,288 | 280,606 | 2,500 | (311,563) | (500) | - | 4,931,331 | 10,067,233 | (5,135,902) | |
| (1) | ROU – Right of use |
| (2) | Refers to provisions for impairment losses for rotable items (spare parts), classified under “Parts and spare engines”, recorded by the Company to present its assets according to the actual capacity for the generation of expected future benefits. |
| (3) | CMA - Maintenance Center - Confins/MG |
| (4) | On March 31, 2021, the balance of spare parts is granted as a guarantee to the Secured Senior Notes 2026, as per Note 18. |
| (5) | On March 31, 2021, 19 Company’s engines are granted as a guarantee to the Spare Engine Facility and the Loan Facility, according to Note 18. |
| 36 |
| | Notes on the Parent Company and Consolidated Quarterly Information (ITR) March 31, 2021 (In thousands of Brazilian Reais - R$, except when otherwise indicated) |
| 17. | Intangible Assets |
The breakdown of and changes in intangible assets are as follows:
| Consolidated | |||||||||
| December 31, 2020 | March 31, 2021 | ||||||||
| Weighted Average Rate (p.a.) | Historical Cost | Accumulated Amortization | Net Opening Balance | Additions | Amortization | Net Closing Balance | Historical Cost | Accumulated Amortization | |
| Cost | |||||||||
| Goodwill | - | 542,302 | - | 542,302 | - | - | 542,302 | 542,302 | - |
| Slots | - | 1,038,900 | - | 1,038,900 | - | - | 1,038,900 | 1,038,900 | - |
| Software | 25.73% | 507,734 | (345,661) | 162,073 | 26,084 | (24,236) | 163,921 | 522,619 | (358,698) |
| Others | 20.00% | 10,000 | (6,167) | 3,833 | - | (500) | 3,333 | 10,000 | (6,667) |
| Total | 2,098,936 | (351,828) | 1,747,108 | 26,084 | (24,736) | 1,748,456 | 2,113,821 | (365,365) | |
The balances of goodwill and airport operating rights (slots) were tested for impairment on December 31, 2020, through the discounted cash flow for each cash-generating unit, giving rise to the value in use, not resulting in impairment.
To assess the recoverable value, assets are grouped at the lowest levels for which there are separately identifiable cash flows (Cash-Generating Units – “CGUs”). To determine the carrying amount of each cash-generating unit, the Company considers the intangible assets recorded and all necessary tangible assets to conduct the business, given that it will only generate economic benefits by using the combination of both.
| 37 |
| | Notes on the Parent Company and Consolidated Quarterly Information (ITR) March 31, 2021 (In thousands of Brazilian Reais - R$, except when otherwise indicated) |
| 18. | Loans and financing |
The breakdown of and changes in short and long-term debt are as follows:
| Parent Company | ||||||||||||||
| December 31, 2020 | March 31, 2021 | |||||||||||||
| Maturity | Interest Rate p.a. | Current | Noncurrent | Total | Unrealized Income (Expenses) on ESN | Principal Payment | Interest Incurred | Interest Paid | Exchange Rate Change | Amortization of Costs and Goodwill | Total | Current | Noncurrent | |
| In US$: | ||||||||||||||
| Guaranteed Funding | 12/2021 | 9.50% | 484,113 | - | 484,113 | - | (103,179) | 10,428 | (4,370) | 42,949 | - | 429,941 | 429,941 | - |
| ESN 2024 (1) | 07/2024 | 3.75% | 37,960 | 1,896,854 | 1,934,814 | (116,546) | - | 49,208 | (43,636) | 182,042 | (217) | 2,005,665 | 18,917 | 1,986,748 |
| Senior Notes 2025 | 01/2025 | 7.00% | 98,521 | 3,340,316 | 3,438,837 | - | - | 61,537 | (124,577) | 332,393 | 2,299 | 3,710,489 | 42,484 | 3,668,005 |
| Senior Secured Notes 2026 | 06/2026 | 8.00% | 1,848 | 953,802 | 955,650 | - | - | 21,877 | - | 101,211 | 4,011 | 1,082,749 | 24,815 | 1,057,934 |
| Perpetual Bonds | - | 8.75% | 16,522 | 799,777 | 816,299 | - | - | 18,424 | (18,435) | 78,647 | - | 894,935 | 18,116 | 876,819 |
| Total | 638,964 | 6,990,749 | 7,629,713 | (116,546) | (103,179) | 161,474 | (191,018) | 737,242 | 6,093 | 8,123,779 | 534,273 | 7,589,506 | ||
(1) Exchangeable Senior Notes see Note 34.2.
| 38 |
| | Notes on the Parent Company and Consolidated Quarterly Information (ITR) March 31, 2021 (In thousands of Brazilian Reais - R$, except when otherwise indicated) |
| Consolidated | |||||||||||||||
| December 31, 2020 | March 31, 2021 | ||||||||||||||
| Maturity | Interest Rate p.a. | Current | Noncurrent | Total | Funding | Unrealized Income (Expenses) on ESN | Principal Payment | Interest Incurred | Interest Paid | Exchange Rate Change | Amortization of Costs and Goodwill | Total | Current | Noncurrent | |
| In R$: | |||||||||||||||
| Debentures VII | 03/2022 | 5.20% (3) | 440,918 | 146,170 | 587,088 | - | - | - | 5,987 | (8,201) | - | 1,400 | 586,274 | 586,274 | - |
| Working Capital | 10/2025 | 9.06% | 239,615 | 17,275 | 256,890 | - | - | (48,808) | 5,139 | (2,392) | - | - | 210,829 | 195,703 | 15,126 |
| In US$: | |||||||||||||||
| Import Financing | 07/2021 | 5.04% | 783,659 | - | 783,659 | - | - | (152,258) | 8,307 | (10,600) | 71,376 | - | 700,484 | 700,484 | - |
| Guaranteed Funding | 06/2021 | 9.50% | 484,113 | - | 484,113 | - | - | (103,179) | 10,428 | (4,370) | 42,949 | - | 429,941 | 429,941 | - |
| Financing with Ex-lm Bank Collateral | 12/2022 | 0.84% | 194,786 | 49,958 | 244,744 | - | - | (15,746) | 749 | (351) | 23,099 | 1,357 | 253,852 | 212,799 | 41,053 |
| ESN 2024 (1) | 07/2024 | 3.75% | 37,960 | 1,896,854 | 1,934,814 | - | (116,546) | - | 49,208 | (43,636) | 182,042 | (217) | 2,005,665 | 18,917 | 1,986,748 |
| Spare Engine Facility | 09/2024 | 2.49% | 22,771 | 197,009 | 219,780 | - | - | - | 1,452 | (1,524) | 21,350 | 70 | 241,128 | 31,346 | 209,782 |
| Senior Notes 2025 | 01/2025 | 7.00% | 98,521 | 3,340,316 | 3,438,837 | - | - | - | 61,537 | (124,577) | 332,393 | 2,299 | 3,710,489 | 42,484 | 3,668,005 |
| Senior Secured Notes 2026 | 06/2026 | 8.00% | 1,848 | 953,802 | 955,650 | - | - | - | 21,877 | - | 101,211 | 4,011 | 1,082,749 | 24,815 | 1,057,934 |
| Loan Facility | 03/2028 | 4.73% | 32,566 | 233,135 | 265,701 | - | - | (1,820) | 2,604 | (1,660) | 25,587 | 64 | 290,476 | 43,153 | 247,323 |
| Perpetual Bonds (2) | - | 8.75% | 16,522 | 789,168 | 805,690 | 10,952 | - | - | 18,368 | (18,151) | 78,076 | - | 894,935 | 18,116 | 876,819 |
| Total | 2,353,279 | 7,623,687 | 9,976,966 | 10,952 | (116,546) | (321,811) | 185,656 | (215,462) | 878,083 | 8,984 | 10,406,822 | 2,304,032 | 8,102,790 | ||
(1) Exchangeable Senior Notes see Note 34.2.
(2) On December 31, 2020, includes removing related parties, considering the securities issued by Gol Finance, held by GLA, totaling R$10,609. These securities were resold in the period ended March 31, 2021. Therefore there is no removal on this base date.
(3) The securities are divided into three series: Series 1 with a CDI rate of 120%, Series 2 with CDI rate + 5.40% and Series 3 with CDI rate + 3.50%.
| 39 |
| | Notes on the Parent Company and Consolidated Quarterly Information (ITR) March 31, 2021 (In thousands of Brazilian Reais - R$, except when otherwise indicated) |
The total parent company and consolidated loans and financing on March 31, 2021, includes funding costs and premiums totaling R$126,136 and R$139,355, respectively (R$173,086 and R$189,195 on December 31, 2020) that will be amortized over the term of their loans and financing. The total also includes amortized goodwill and fair value of the derivative financial instrument, referring to ESN 2024, totaling R$39,231 and R$257,429, respectively, on March 31, 2021 (R$42,226 and R$346,030, respectively, on December 31, 2020).
| 18.1. | New Loans and Financing Contracted and Renegotiated during the three-month period ended on March 31, 2021 |
The renegotiations detailed below were evaluated under CPC 48 - “Financial Instruments”, corresponding to IFRS 9, and did not meet the definitions to derecognize the liabilities (with the original financial liability extinguished and a new financial liability recognized).
| 18.1.1. | Working Capital |
During the three-month period ended March 31, 2021, the Company, through its subsidiary GLA, renegotiated the due dates of this type of agreement, keeping promissory notes as collateral for the transactions. The purpose of these operations is to keep and manage the Company's working capital, and the main change was the maturity date and interest rate, as disclosed in the previous table.
| 18.1.2. | Import Financing |
During the three-month period ended March 31, 2021, the Company, through its subsidiary GLA, renegotiated the due dates of this type of agreement, impacting the interest rate, disclosed in table above, and keeping promissory notes as collateral for the transactions, which are part of a credit line for engine maintenance, import financing in order to purchase spare parts and aircraft equipment.
| 18.1.3. | Spare Engine Facility |
In March 2021, the Company renegotiated the payment flow for this operation, with the installment postponed from March 2021 to June 2021. All other operating conditions remain unchanged.
| 18.1.4. | Guaranteed Funding |
In February 2021, the Company renegotiated the postponement of monthly amortization installments from February and March 2021 to May 2021 and, due to the prepayments previously made, the new maturity will be in June 2021. All other conditions of the transaction remained unchanged.
| 18.1.5. | Debentures |
On March 26, 2021, the Annual Debenture Holders' Meeting decided to postpone the payment of series 3 with maturity on March 28, 2021, to April 7, 2021, totaling R$147,913, and suspend the early maturity of the installment of series 1, also maturing on March 28, 2021, and also totaling R$147,920.
| 40 |
| | Notes on the Parent Company and Consolidated Quarterly Information (ITR) March 31, 2021 (In thousands of Brazilian Reais - R$, except when otherwise indicated) |
On April 6, 2021, an Annual Debenture Holders’ Meeting decided to transfer the installment of series 1 that matured in March 2021 to series 3. And the postponement of the maturity of series 3 from April 7, 2021, to May 12, 2021, with a new compensation of CDI + 4.90%, totaling R$295,833.
| 18.2. | Loans and Financing – Non-Current |
On March 31, 2021, the maturities of loans and financing recorded in non-current liabilities were as follows:
| 2022 | 2023 | 2024 | 2025 | 2025 onwards | Without Maturity Date | Total | |
| Parent Company | |||||||
| In US$: | |||||||
| ESN 2024 | - | - | 1,986,748 | - | - | - | 1,986,748 |
| Senior Notes 2025 | - | - | - | 3,668,005 | - | - | 3,668,005 |
| Senior Secured Notes 2026 | - | - | - | - | 1,057,934 | - | 1,057,934 |
| Perpetual Bonds | - | - | - | - | - | 876,819 | 876,819 |
| Total | - | - | 1,986,748 | 3,668,005 | 1,057,934 | 876,819 | 7,589,506 |
| Consolidated | |||||||
| In R$: | |||||||
| Working Capital | 5,705 | 4,752 | 2,500 | 2,169 | - | - | 15,126 |
| In US$: | |||||||
| Financing with Ex-lm Bank Collateral | 41,053 | - | - | - | - | - | 41,053 |
| Spare Engine Facility | 18,984 | 25,312 | 165,486 | - | - | - | 209,782 |
| ESN 2024 | - | - | 1,986,748 | - | - | - | 1,986,748 |
| Senior Notes 2025 | - | - | - | 3,668,005 | - | - | 3,668,005 |
| Senior Secured Notes 2026 | - | - | - | - | 1,057,934 | - | 1,057,934 |
| Loan Facility | 25,674 | 35,248 | 36,437 | 37,714 | 112,250 | - | 247,323 |
| Perpetual Bonds | - | - | - | - | - | 876,819 | 876,819 |
| Total | 91,416 | 65,312 | 2,191,171 | 3,707,888 | 1,170,184 | 876,819 | 8,102,790 |
The fair value of debt on March 31, 2021, is as follows:
| Parent Company | Consolidated | |||
| Accounting (*) | Fair Value | Accounting (*) | Fair Value | |
| Debentures VII | - | - | 586,274 | 591,666 |
| Guaranteed Funding | 429,941 | 429,941 | 429,941 | 429,941 |
| ESN 2024 | 2,005,665 | 2,017,429 | 2,005,665 | 2,017,429 |
| Perpetual Notes and Other Senior Notes | 5,688,173 | 4,924,481 | 5,688,173 | 4,938,737 |
| Other Existing Loans | - | - | 1,696,769 | 1,696,769 |
| Total | 8,123,779 | 7,371,851 | 10,406,822 | 9,674,542 |
(*) Net Total of Funding Costs.
| 18.3. | Covenants |
The Company has financial covenants in Guaranteed financing and Debentures VII.
Within the scope of guaranteed financing, the Company has the observance of complying with specific guaranteed conditions in the bilateral contract with Delta Airlines. On March 31, 2021, the Company had Smiles shares and other assets placed in guarantee by GLAI regarding this agreement, which meet the covenants.
In Debentures VII, the measurement of such indicators is mandatory every six months. Therefore, we will have the measurement in June 2021.
| 41 |
| | Notes on the Parent Company and Consolidated Quarterly Information (ITR) March 31, 2021 (In thousands of Brazilian Reais - R$, except when otherwise indicated) |
| 19. | Leases Payable |
On March 31, 2021, the balance of leases payable included: (i) R$26,626 for variable payments, not included in the measurement of liabilities, and short-term leases (R$16,252 on December 31, 2020), which fall under the exemption provided for in CPC 06 (R2) - Leases, equivalent to IFRS 16; and (ii) R$8,549,895 referring to the present value on this date of future lease payments (R$7,567,940 on December 31, 2020).
The breakdown and changes in the present value of future lease payments are shown below:
| Consolidated | |||||||||||||
| December 31, 2020 | March 31, 2021 | ||||||||||||
| Weighted Average Rate (p.a.) | Current | Noncurrent | Total | Additions | Contractual Amendment | Payments | Deposit in Guarantee | Interest incurred | Exchange Rate Change | Total | Current | No current | |
| In R$: | |||||||||||||
| Leases without Purchase Option | 13.13% | 32,530 | 14,985 | 47,515 | - | - | (3,226) | - | 1,758 | - | 46,047 | 33,247 | 12,800 |
| Total | 32,530 | 14,985 | 47,515 | - | - | (3,226) | - | 1,758 | - | 46,047 | 33,247 | 12,800 | |
| In US$: | |||||||||||||
| Leases without Purchase Option | 12.06% | 1,268,226 | 6,252,199 | 7,520,425 | 153,126 | 2,500 | (125,302) | (859) | 225,569 | 728,389 | 8,503,848 | 1,873,279 | 6,630,569 |
| Total | 1,268,226 | 6,252,199 | 7,520,425 | 153,126 | 2,500 | (125,302) | (859) | 225,569 | 728,389 | 8,503,848 | 1,873,279 | 6,630,569 | |
| Total Leases | 1,300,756 | 6,267,184 | 7,567,940 | 153,126 | 2,500 | (128,528) | (859) | 227,327 | 728,389 | 8,549,895 | 1,906,526 | 6,643,369 | |
In the three-month period ended March 31, 2021, the Company recognized R$16,685 directly in the cost of services related to short-term leases and variable payments.
| 42 |
| | Notes on the Parent Company and Consolidated Quarterly Information (ITR) March 31, 2021 (In thousands of Brazilian Reais - R$, except when otherwise indicated) |
The future payments of lease agreements are detailed as follows:
| Without Purchase Option | ||
| March 31, 2021 | December 31, 2020 | |
| 2021 | 2,201,733 | 2,102,771 |
| 2022 | 2,195,882 | 1,982,685 |
| 2023 | 1,823,908 | 1,642,264 |
| 2024 | 1,403,989 | 1,260,405 |
| 2025 | 1,151,922 | 1,018,896 |
| 2026 Onwards | 3,102,094 | 2,701,509 |
| Total Minimum Lease Payments | 11,879,528 | 10,708,530 |
| Less Total Interest | (3,303,007) | (3,124,338) |
| Present Value of Minimum Lease Payments | 8,576,521 | 7,584,192 |
| Less Current Portion | (1,933,152) | (1,317,008) |
| Noncurrent Portion | 6,643,369 | 6,267,184 |
| 19.1. | Sale-Leaseback Transactions |
During the three-month period ended March 31, 2021, the Company did not carry out sale-leaseback transactions. In the quarter ended March 31, 2020, the Company carried out 11 sale-leaseback transactions with a gain totaling R$372,712 and R$594,587 in the parent company and consolidated, respectively, recognized in the income statement under “Sale-Leaseback Transactions” in the group other operating revenues and expenses, net, as per Note 30.
| 20. | Suppliers |
| Parent Company | Consolidated | |||
| March 31, 2021 | December 31, 2020 | March 31, 2021 | December 31, 2020 | |
| Domestic Currency | 28,961 | 48,345 | 1,061,044 | 1,164,193 |
| Foreign Currency | 19,020 | 24,357 | 500,914 | 481,001 |
| Total | 47,981 | 72,702 | 1,561,958 | 1,645,194 |
| Current | 47,981 | 72,702 | 1,538,228 | 1,612,536 |
| Noncurrent | - | - | 23,730 | 32,658 |
| 21. | Taxes to Collect |
| Parent Company | Consolidated | |||
| March 31, 2021 | December 31, 2020 | March 31, 2021 | December 31, 2020 | |
| PIS and COFINS | 462 | 216 | 11,375 | 23,647 |
| Installments | - | - | 39,464 | 41,641 |
| Income Tax on Salaries | 46 | 43 | 21,333 | 33,011 |
| ICMS | - | - | 226 | 472 |
| Income Tax and Social Contribution to Collect | - | - | 2,739 | 13 |
| Others | 44 | 33 | 9,481 | 7,192 |
| Total | 552 | 292 | 84,618 | 105,976 |
| Current | 552 | 292 | 54,433 | 73,614 |
| Noncurrent | - | - | 30,185 | 32,362 |
| 43 |
| | Notes on the Parent Company and Consolidated Quarterly Information (ITR) March 31, 2021 (In thousands of Brazilian Reais - R$, except when otherwise indicated) |
| 22. | Advance Ticket Sales |
On March 31, 2021, the balance of Advance from ticket sales classified in current liabilities was R$1,662,039 (R$2,050,799 on December 31, 2020) and is represented by 4,749,655 tickets sold and not yet used (6,691,911 on December 31, 2020) with an average use of 121 days (102 days on December 31, 2020).
Balances of advance from ticket sales are shown net of breakage corresponding to R$281,445 on March 31, 2021 (R$299,188 on December 31, 2020).
On March 31, 2021, the Company has reimbursements payable for advance air tickets totaling R$314,264 (R$253,963 on December 31, 2020), recorded as Other liabilities in current liabilities.
| 23. | Frequent-Flyer Program |
| Consolidated | ||
| March 31, 2021 | December 31, 2020 | |
| Frequent-Flyer Program | 2,211,250 | 2,145,097 |
| Others | 5,891 | 5,817 |
| Breakage | (572,199) | (569,952) |
| Total | 1,644,942 | 1,580,962 |
| Current | 1,309,652 | 1,258,502 |
| Noncurrent | 335,290 | 322,460 |
Breakage consists of the estimate of miles with a high potential to expire without being used. CPC 47 - “Revenue from Agreement with Client”, corresponding to IFRS 15, provides for the recognition of revenue by the estimate (breakage) over the contractual period, therefore, before the miles are redeemed, given that this is not expected before expiration.
| 24. | Provisions |
| Consolidated | ||||
| Post-Employment Benefit | Provisions for Aircraft and Engine Return | Legal Proceedings (a) | Total | |
| Balances on December 31, 2020 | 99,549 | 1,030,915 | 392,432 | 1,522,896 |
| Recognition (Reversal) of Provision | 4,353 | 117,523 | 70,147 | 192,023 |
| Provisions Used | - | (42,725) | (40,767) | (83,492) |
| Present Value Adjustment | - | 18,870 | - | 18,870 |
| Exchange Rate Change | - | 95,448 | (2,033) | 93,415 |
| Balances on March 31, 2021 | 103,902 | 1,220,031 | 419,779 | 1,743,712 |
| On March 31, 2021 | ||||
| Current | - | 298,125 | - | 298,125 |
| Noncurrent | 103,902 | 921,906 | 419,779 | 1,445,587 |
| Total | 103,902 | 1,220,031 | 419,779 | 1,743,712 |
| On December 31, 2020 | ||||
| Current | - | 169,381 | - | 169,381 |
| Noncurrent | 99,549 | 861,534 | 392,432 | 1,353,515 |
| Total | 99,549 | 1,030,915 | 392,432 | 1,522,896 |
| (a) | The provisions used consider write-offs due to the revaluation of estimates and settled processes. |
| 44 |
| | Notes on the Parent Company and Consolidated Quarterly Information (ITR) March 31, 2021 (In thousands of Brazilian Reais - R$, except when otherwise indicated) |
| 24.1. | Post-Employment Benefit |
The Company offers to its employees’ health care plans that, due to complying with current laws, generate obligations with post-employment benefits.
The actuarial assumptions applied to measure the post-employment benefit remain the same as those disclosed in the annual financial statements.
| Consolidated | |
| March 31, 2021 | |
| Current Service Cost Recognized in Income (Expenses) | 2,392 |
| Cost of Interests Recognized in Income (Expenses) | 1,961 |
| Total | 4,353 |
| 24.2. | Provisions for Aircraft and Engine Return |
Such provision considers the costs that meet the contractual conditions for the return of engines maintained under operating leases and the costs to reconfigure aircraft when returned as described in the return conditions of the lease agreements. The initial recognition is capitalized as property, plant & equipment under “Aircraft and Engine Overhauling”.
| 24.3. | Provision for Legal Proceedings |
On March 31, 2021, the Company and its subsidiaries are involved in certain legal matters arising from the regular course of their business, which includes civil, administrative, tax, social security, and labor lawsuits.
The Company classifies the risk of loss in legal proceedings as probable, possible, or remote. The provision recorded for these lawsuits is calculated by the Company’s Management, based on its legal counsels’ analysis, and reasonably reflects estimated probable losses.
If the Company has lawsuits whose values are not known or reasonably estimated, but the likelihood of loss is probable, these claims will have their nature disclosed.
The Company's Management believes that the provision for tax, civil and labor risks, recorded under CPC 25 – “Provisions, Contingent Liabilities and Contingent Assets”, equivalent to IAS 37, is sufficient to cover possible losses on administrative and judicial proceedings, as shown below:
| Consolidated | ||||
| Probable Loss | Possible Loss | |||
| March 31, 2021 | December 31, 2020 | March 31, 2021 | December 31, 2020 | |
| Civil | 100,228 | 100,806 | 70,859 | 64,181 |
| Labor | 297,250 | 269,297 | 232,218 | 238,702 |
| Tax | 22,301 | 22,329 | 609,788 | 574,356 |
| Total | 419,779 | 392,432 | 912,865 | 877,239 |
Details on the relevant lawsuits were disclosed in the financial statements for the year ended December 31, 2020. In the period ended March 31, 2021, there were no changes regarding new proceedings or reclassification of the relevant risk of loss.
| 45 |
| | Notes on the Parent Company and Consolidated Quarterly Information (ITR) March 31, 2021 (In thousands of Brazilian Reais - R$, except when otherwise indicated) |
| 25. | Shareholders’ Equity |
| 25.1. | Share Capital |
On March 31, 2021, the Company’s share capital was R$3,009,436, represented by 3,137,706,967 shares, comprised by 2,863,682,710 common shares and 274,024,257 preferred shares. The share capital presented is reduced by the costs to issue shares totaling R$155,618 on March 31, 2021, and December 31, 2020.
The Company’s shares are held as follows:
| March 31, 2021 | December 31, 2020 | |||||
| Common Shares | Preferred Shares | Total | Common Shares | Preferred Shares | Total | |
| Fundo Volluto | 100.00% | - | 22.99% | 100.00% | - | 22.99% |
| Mobi FIA (1) | - | 37.57% | 28.93% | - | 37.57% | 28.93% |
| AirFrance - KLM | - | 1.55% | 1.19% | - | 1.55% | 1.19% |
| Others | - | 1.90% | 1.46% | - | 1.91% | 1.47% |
| Market | - | 58.98% | 45.42% | - | 58.97% | 45.41% |
| Total | 100.00% | 100.00% | 100.00% | 100.00% | 100.00% | 100.00% |
| (1) | In March 2019, within the Exchangeable Senior Notes 2024, due to transactions related to the ADS lending facility, Bank of America Corporation acquired 33,863,549 preferred shares, representing 12.36% of the total preferred shares. |
The authorized share capital on March 31, 2021, is R$6 billion. Within the authorized limit, the Company can, once approved by the Board of Directors, increase its share capital regardless of any amendment to its bylaws by issuing shares, without necessarily maintaining the proportion between the different types of shares. Under the law terms, in case of capital increase within the authorized limit, the Board of Directors will define the issuance conditions, including pricing and payment terms.
| 25.2. | Treasury Shares |
On March 31, 2021, the Company had 1,798,608 treasury shares, totaling R$62,215 (1,824,034 shares totaling R$62,215 on December 31, 2020). On March 31, 2021, the closing price of the Company's shares was R$21.51 (R$24.94 on December 31, 2020).
| 25.3. | Interim dividends – Smiles Fidelidade |
On March 25, 2021, the Smiles Fidelidade’s Board of Directors decided to distribute interim dividends in the amount of R$500,000, of which R$236,992 is intended to minority shareholders, recorded in “Other liabilities”. On April 16, 2021, the Smiles Fidelidade full settlement this obligation.
| 46 |
| | Notes on the Parent Company and Consolidated Quarterly Information (ITR) March 31, 2021 (In thousands of Brazilian Reais - R$, except when otherwise indicated) |
| 26. | Earnings (Loss) per Share |
The Company's earnings (loss) per share was determined as follows:
| Parent Company and Consolidated | ||||||
| March 31, 2021 | March 31, 2020 | |||||
| Common Shares | Preferred Shares | Total | Common Shares | Preferred Shares | Total | |
| Numerator | ||||||
| Net Loss for the Period Attributed to Controlling Shareholders | (581,358) | (1,947,045) | (2,528,403) | (526,378) | (1,761,891) | (2,288,269) |
| Denominator | ||||||
| Weighted Average Number of Shares Outstanding (in thousands) | 2,863,683 | 274,024 | 2,863,683 | 273,866 | ||
| Adjusted Weighted Average Number of Shares Outstanding and Conversions Presumed as Diluted (in thousands) | 2,863,683 | 274,024 | 2,863,683 | 273,866 | ||
| Basic Loss per Share | (0.203) | (7.105) | (0.184) | (6.433) | ||
| Diluted Loss per Share | (0.203) | (7.105) | (0.184) | (6.433) | ||
| 27. | Share-Based Compensation |
The conditions stock option and of the restricted share plans granted to the Company’s Executive Officers were disclosed in detail in the financial statements for the year ended December 31, 2020, and did not change during the three-month period ended on March 31, 2021.
The changes in plans for the three-month period ended on March 31, 2021, are as follows:
| 27.1. | Stock Option Plan – GOL |
Number of Stock Shares | Average Price Weighted - Period | |
| Outstanding Shares on December 31, 2020 | 7,529,612 | 11.59 |
| Options canceled and adjustments in estimated prescribed rights | 57,664 | 20.87 |
| Outstanding Options on March 31, 2021 | 7,587,276 | 11.55 |
| Number of Options Exercisable on: | ||
| December 31, 2020 | 5,752,726 | 10.32 |
| March 31, 2021 | 6,013,195 | 10.74 |
The expense recognized in the income statement for the period corresponding to the stock option plans in the three-month period ended March 31, 2021, was R$2,788 (R$3,100 in the three-month period ended March 31, 2020).
| 27.2. | Restricted Share Plan – GOL |
There was no movement in restricted transferable shares in the period. On March 31, 2021, and December 31, 2020, the Company has 1,203,483 restricted shares.
The expense recognized in the income statement for the period corresponding to restricted share plans in the three-month period ended March 31, 2021, was R$2,047 (R$1,592 in the three-month period ended March 31, 2020).
| 47 |
| | Notes on the Parent Company and Consolidated Quarterly Information (ITR) March 31, 2021 (In thousands of Brazilian Reais - R$, except when otherwise indicated) |
| 27.3. | Stock Option Plan – Smiles Fidelidade |
There were no changes to options outstanding in the period ended March 31, 2021. On this date, the average exercise price, adjusted for earnings allocations, is R$43.69 (R$48.42 on December 31, 2020).
During the three-month period ended March 31, 2021, the Company recorded R$336 in equity related to share-based compensation with a corresponding entry in the income statement under “Personnel expenses” (R$598 in the period ended March 31, 2020).
Additionally, management and employees are granted an additional bonus paid through cash, referenced to Company shares, to enhance these executives’ productivity and commitment to the results. On March 31, 2021, the obligation balance was R$1,345 (R$1,881 on December 31, 2020) recognized under “Labor obligations”, in the amount equivalent to 67,506 Company shares. In the fiscal year, the Company recognized the same amount under “Personnel expenses” (R$702 in the three-month period ended March 31, 2020) to grant the said right.
| 28. | Transactions with Related Parties |
| 28.1. | Loan Agreements - Noncurrent Assets and Liabilities |
The parent company maintains assets and liabilities from loan agreements with its subsidiary GLA without interest, as shown in the table below:
| Assets | Liabilities | ||||||
| Creditor | Debtor | Type of Transaction | Interest Rate (p.a.) | March 31, 2021 | December 31, 2020 | March 31, 2021 | December 31, 2020 |
| GOL | GLA | Loan | 3.42% | 917,923 | 915,226 | - | - |
| GAC | GLA | Loan | (*) | 1,477,554 | 1,347,546 | 9,666 | 8,791 |
| Gol Finance | GLA | Loan | 4.21% | 2,948,999 | 2,634,559 | - | - |
| Total | 5,344,476 | 4,897,331 | 9,666 | 8,791 | |||
(*) According to the local legislation, the Company applies symbolic interest rates.
Additionally, on March 31, 2021, the Company has a balance of dividends, and interest on shareholders’ equity receivable, which was paid in April 2021, deliberated by the subsidiary Smiles Fidelidade, totaling R$263,008 (R$24,120 on December 31, 2020).
In addition to the values above, the following table shows the other balances between the Companies eliminated in the Consolidated:
| 48 |
| | Notes on the Parent Company and Consolidated Quarterly Information (ITR) March 31, 2021 (In thousands of Brazilian Reais - R$, except when otherwise indicated) |
| Balances | ||||||
| Creditor | Debtor | Type of Transaction | Maturity of the Agreements | Interest Rate (p.a.) | March 31, 2021 | December 31, 2020 |
| Gol Finance | GOL | Subscription Bonus (*) | 07/2024 | - | 602,350 | 602,350 |
| Gol Finance Inc. | GAC | Loan | 01/2023 | 8.64% | 1,278,994 | 1,149,501 |
| Gol Finance | GAC | Loan | 03/2025 | 4.19% | 1,282,397 | 1,157,009 |
| Gol Finance | Gol Finance Inc. | Loan | 04/2023 | 1.92% | 548,811 | 305,702 |
| Gol Finance Inc. | Gol Finance | Loan | 07/2020 | 11.70% | 1,978 | 1,805 |
| Smiles Fidelidade | GLA | Advance Ticket Purchases | 12/2032 | 3.40% | 2,202,044 | 2,011,291 |
| Smiles Fidelidade | GLA | Miles Sold | 12/2032 | - | 16,673 | 9,627 |
| Smiles Fidelidade | GLA | Management Fees | 12/2032 | - | 359 | 308 |
| Smiles Fidelidade | GLA | Letter of Indemnity Agreement | - | - | 530 | 530 |
| GLA | Smiles Fidelidade | Shared Services | 12/2032 | - | 6,706 | 6,363 |
| GLA | Smiles Fidelidade | Onlending | 12/2032 | - | 21,866 | 15,683 |
| Smiles Fidelidade | Smiles Viagens | Dividends | - | - | 267 | 267 |
| Smiles Viagens | Smiles Fidelidade | Onlendings | - | - | 1,358 | 414 |
| Smiles Argentina | Smiles Fidelidade | Onlendings | - | - | 4,534 | 5,152 |
| Total | 5,968,867 | 5,266,002 | ||||
(*) Through Gol Equity Finance, the subsidiary Gol Finance acquired warrants issued by the Company in the context of the issue of Exchangeable Senior Notes.
| 28.2. | Transportation and Consulting Services |
In the course of its operations, the Company, by itself and through its subsidiaries, entered into agreements with the companies listed below, part of the Company’s economic group:
· Expresso Caxiense S.A.: Provision of passenger transportation services in case of an interrupted flight, effective until March 9, 2023; and
· Viação Piracicabana Ltda.: Provision of passenger, baggage, crew, and employee transportation services between airports, effective until September 30, 2021.
On March 31, 2021, the GLA subsidiary recognized a total expense related to these services totaling R$13 (R$2,009 on March 31, 2020). On the same date, the balance payable to related companies, under “suppliers”, was R$3,349 (R$3,344 on December 31, 2020), and refers mainly to transportation services with Viação Piracicabana Ltda.
| 28.3. | Contracts Account Opening UATP (“Universal Air Transportation Plan”) to Grant Credit Limit |
The subsidiary GLA entered into UATP account opening agreements with the related parties indicated below: Aller Participações S.A.; BR Mobilidade Baixada Santista S.A. SPE; Breda Transportes e Serviços S.A.; Comporte Participações S.A.; Empresa Cruz de Transportes Ltda.; Empresa de Ônibus Pássaro Marrom S.A.; Empresa Princesa do Norte S.A.; Expresso Itamarati S.A.; Expresso Maringá do Vale S.A.; Expresso União Ltda.; Glarus Serviços Tecnologia e Participações S.A.; Limmat Participações S.A.; Quality Bus Comércio de Veículos S.A.; Super Quadra Empreendimentos Imobiliários S.A.; Thurgau Participações S.A.; Transporte Coletivo Cidade Canção Ltda.; Turb Transporte Urbano S.A.; Vaud Participações S.A.; and Viação Piracicabana Ltda.; all with no expiration date, whose purpose is to issue credits to purchase airline tickets issued by the Company. The UATP account (virtual card) is accepted as a payment means on the purchase of airline tickets and related services, seeking to simplify billing and make feasible payment between the participating companies.
The companies indicated above are owned by the individuals who control FIP Volutto and Mobi FIA, the company's main shareholders.
| 49 |
| | Notes on the Parent Company and Consolidated Quarterly Information (ITR) March 31, 2021 (In thousands of Brazilian Reais - R$, except when otherwise indicated) |
| 28.4. | Commercial Partnership and Maintenance Agreement |
On February 19, 2014, the Company signed an exclusive strategic partnership agreement for business cooperation with AirFrance-KLM. On January 1, 2017, the Company signed an extension of the scope to include maintenance services. During the three-month period ended March 31, 2021, expenses with component maintenance incurred at the AirFrance-KLM workshop were R$32,572 (R$171,290 in the three-month period ended March 31, 2020). On March 31, 2021, the Company has R$98,312 in the “Suppliers” account under current liabilities (R$72,519 on December 31, 2020).
| 28.5. | Guarantee-Provision Compensation Agreement |
On October 27, 2020, the Company, through its subsidiary Gol Finance, issued a debt (guaranteed financing) totaling US$250 million, with a guarantee granted by Mobi FIA, which pledged US$20 million in preferred shares issued by GOL Linhas Aéreas Inteligentes S.A., by signing the Shares, Assets, and Credit Rights Pledge Agreement and, as a result, will receive a compensation from the Company, as per the agreement. For additional information, see Note 18.
| 28.6. | Compensation of the Key Management Personnel |
| Consolidated | ||
| March 31, 2021 | March 31, 2020 | |
| Salaries, Bonus and Benefits (*) | 9,638 | 12,968 |
| Payroll Charges | 1,500 | 1,828 |
| Share-Based Compensation | 4,969 | 2,554 |
| Total | 16,107 | 17,350 |
(*) Includes compensation for members of the management, audit committee, and fiscal council.
| 50 |
| | Notes on the Parent Company and Consolidated Quarterly Information (ITR) March 31, 2021 (In thousands of Brazilian Reais - R$, except when otherwise indicated) |
| 29. | Revenue |
| Consolidated | ||
| March 31, 2021 | March 31, 2020 | |
| Passenger (*) | 1,462,845 | 3,026,498 |
| Cargo | 85,144 | 100,356 |
| Mileage Revenue | 88,264 | 109,887 |
| Other Revenues | 7,726 | 30,314 |
| Gross Revenue | 1,643,979 | 3,267,055 |
| Related Tax | (76,352) | (119,328) |
| Net Revenue | 1,567,627 | 3,147,727 |
(*) Of the total amount, the total of R$112,147 for the three-month period ended on March 31, 2021, is made up of the revenue from non-attendance of passengers, rescheduling, ticket cancellation (R$139,257 for the three-month period ended March 31, 2020).
Revenue by geographical location is as follows:
| Consolidated | ||||
| March 31, 2021 | % | March 31, 2020 | % | |
| Domestic | 1,518,363 | 96.9 | 2,652,079 | 84.3 |
| Foreign | 49,264 | 3.1 | 495,648 | 15.7 |
| Net Revenue | 1,567,627 | 100.0 | 3,147,727 | 100.0 |
| 51 |
| | Notes on the Parent Company and Consolidated Quarterly Information (ITR) March 31, 2021 (In thousands of Brazilian Reais - R$, except when otherwise indicated) |
| 30. | Costs of Services and Operational Expenses |
| Parent Company | Consolidated | |||
| March 31, 2021 | March 31, 2020 | March 31, 2021 | March 31, 2020 | |
| Cost of Services | ||||
| Employees | - | - | (312,046) | (453,316) |
| Fuels and Lubricants | - | - | (566,128) | (1,001,138) |
| Maintenance, Material and Repairs | - | - | (153,366) | (144,321) |
| Passenger Costs | - | - | (108,016) | (176,041) |
| Services | - | - | (43,039) | (45,493) |
| Landing Fees | - | - | (114,065) | (201,742) |
| Depreciation and Amortization | - | - | (239,904) | (496,290) |
| Recovery of Depreciation Costs | - | - | - | 25,962 |
| Other Operating Costs | - | - | (98,681) | (87,531) |
| Total Cost of Services | - | - | (1,635,245) | (2,579,910) |
| Selling Expenses | ||||
| Employees | - | - | (6,122) | (9,429) |
| Services | - | - | (23,513) | (35,330) |
| Sales and Marketing | - | - | (66,361) | (118,012) |
| Other Selling Expenses | - | - | (7,783) | (6,186) |
| Total Selling Expenses | - | - | (103,779) | (168,957) |
| Administrative Expenses | ||||
| Salaries (a) | (3,460) | (1,121) | (146,264) | (132,478) |
| Services | (18,167) | (2,178) | (120,550) | (93,145) |
| Depreciation and Amortization | - | - | (33,720) | (31,746) |
| Other administrative expenses | (5,953) | (1,700) | (62,659) | (70,908) |
| Total Administrative Expenses | (27,580) | (4,999) | (363,193) | (328,277) |
| Other Operational Revenues (Expenses) | ||||
| Sale-Leaseback Transactions (b) | - | 372,712 | - | 594,587 |
| Boeing Agreement Expense Recovery | - | - | - | 193,503 |
| Recovery of Taxes Paid | - | - | 59,874 | 143,293 |
| Idleness - depreciation and amortization (c) | - | - | (62,675) | - |
| Other Operating Expenses | 489 | 3,596 | 14,887 | 23,455 |
| Total Other Operating Revenues and (Expenses), Net | 489 | 376,308 | 12,086 | 954,838 |
| Total | (27,091) | 371,309 | (2,090,131) | (2,122,306) |
(a) The Company recognizes compensation paid to members of the Audit Committee, the Board of Directors, and the Fiscal Council in the "Salaries" line item.
(b) See Note 19.1.
(c) See Note 1.1.1.
| 52 |
| | Notes on the Parent Company and Consolidated Quarterly Information (ITR) March 31, 2021 (In thousands of Brazilian Reais - R$, except when otherwise indicated) |
| 31. | Financial Income (Expenses) |
| Parent Company | Consolidated | |||
| March 31, 2021 | March 31, 2020 | March 31, 2021 | March 31, 2020 | |
| Financial Revenue | ||||
| Gain from Derivatives | - | - | 2,959 | - |
| Gains from Financial Investments | 57 | 5,226 | 6,912 | 119,479 |
| Cash Changes | 183 | 316 | 5,015 | 4,651 |
| (-) Taxes on Financial Revenues (a) | (412) | (539) | (4,791) | (13,112) |
| Unrealized Gains - Conversion Right – ESN | 118,596 | 575,357 | 118,596 | 575,357 |
| Interest Assets | 30,401 | 32,727 | - | - |
| Others | 2,995 | 3,829 | 14,729 | 11,871 |
| Total Financial Revenues | 151,820 | 616,916 | 143,420 | 698,246 |
| Financial Expenses | ||||
| Losses with Derivatives | - | - | (581) | (354,528) |
| Derivative losses - capped call | (46,107) | (148,500) | (46,107) | (148,500) |
| Interest on Loans, Financing and Others | (162,521) | (131,033) | (212,545) | (206,556) |
| Banking Commissions and Expenses | (15,131) | (45,386) | (26,948) | (51,285) |
| Losses with Financial Investments | - | - | (74) | (57,248) |
| Interest on Leases | - | - | (227,323) | (138,389) |
| Others | (11,592) | (9,340) | (54,920) | (41,950) |
| Total Financial Expenses | (235,351) | (334,259) | (568,498) | (998,456) |
| Exchange Rate Change, Net | (324,749) | (721,263) | (1,537,240) | (2,943,404) |
| Total | (408,280) | (438,606) | (1,962,318) | (3,243,614) |
(a) Relative to taxes on Financial Revenues (PIS and COFINS), according to Decree 8,426 of April 1, 2015.
| 32. | Information by Segment |
The information below presents the summarized financial position of the reportable operating segments on March 31, 2021, and December 31, 2020:
| 32.1. | Assets and liabilities of the operating segments |
| March 31, 2021 | |||||
| Flight Transportation | Smiles Frequent-Flyer Program | Combined Operating Segments | Eliminations | Total Consolidated | |
| Assets | |||||
| Current | 1,785,880 | 2,091,525 | 3,877,405 | (1,280,986) | 2,596,419 |
| Noncurrent | 9,550,754 | 1,324,323 | 10,875,077 | (1,582,136) | 9,292,941 |
| Total Assets | 11,336,634 | 3,415,848 | 14,752,482 | (2,863,122) | 11,889,360 |
| Liabilities | |||||
| Current | 10,129,827 | 1,996,756 | 12,126,583 | (1,116,640) | 11,009,943 |
| Noncurrent | 18,040,554 | 520,690 | 18,561,244 | (1,273,907) | 17,287,337 |
| Shareholders’ Equity (Deficit) | (16,833,747) | 898,402 | (15,935,345) | (472,575) | (16,407,920) |
| Total Liabilities and Shareholders’ Equity (Deficit) | 11,336,634 | 3,415,848 | 14,752,482 | (2,863,122) | 11,889,360 |
| 53 |
| | Notes on the Parent Company and Consolidated Quarterly Information (ITR) March 31, 2021 (In thousands of Brazilian Reais - R$, except when otherwise indicated) |
| December 31, 2020 | |||||
| Flight Transportation | Smiles Frequent-Flyer Program | Combined Operating Segments | Eliminations | Total Consolidated | |
| Assets | |||||
| Current | 2,059,655 | 2,453,838 | 4,513,493 | (1,268,142) | 3,245,351 |
| Noncurrent | 10,040,986 | 908,246 | 10,949,232 | (1,380,447) | 9,568,785 |
| Total Assets | 12,100,641 | 3,362,084 | 15,462,725 | (2,648,589) | 12,814,136 |
| Liabilities | |||||
| Current | 9,975,367 | 1,502,179 | 11,477,546 | (1,079,330) | 10,398,216 |
| Noncurrent | 16,532,366 | 509,577 | 17,041,943 | (858,964) | 16,182,979 |
| Shareholders’ Equity (Deficit) | (14,407,092) | 1,350,328 | (13,056,764) | (710,295) | (13,767,059) |
| Total Liabilities and Shareholders’ Equity (Deficit) | 12,100,641 | 3,362,084 | 15,462,725 | (2,648,589) | 12,814,136 |
| 32.2. | Income (Expenses) of the Operating Segments |
| March 31, 2021 | |||||
Flight Transportation | Smiles Frequent-Flyer Program | Combined Operating Segments | Eliminations | Total Consolidated | |
| Net Revenue | |||||
| Passenger Transportation | 1,335,229 | - | 1,335,229 | 81,049 | 1,416,278 |
| Cargo and Others | 83,131 | - | 83,131 | (5,532) | 77,599 |
| Revenue with Miles Redeemed | - | 151,117 | 151,117 | (77,367) | 73,750 |
| Total Net Revenue (a) | 1,418,360 | 151,117 | 1,569,477 | (1,850) | 1,567,627 |
| Cost of Services (b) | (1,619,312) | (24,809) | (1,644,121) | 8,876 | (1,635,245) |
| Gross Profit | (200,952) | 126,308 | (74,644) | 7,026 | (67,618) |
| Operating Revenue (Expenses) | |||||
| Selling Expenses | (96,557) | (29,774) | (126,331) | 22,552 | (103,779) |
| Administrative Expenses (c) | (311,749) | (41,073) | (352,822) | (10,371) | (363,193) |
| Other Operating (Expenses) Revenues, Net (d) | 8,688 | 3,399 | 12,087 | (1) | 12,086 |
| Total Operating Expenses | (399,618) | (67,448) | (467,066) | 12,180 | (454,886) |
| Equity Income (Expenses) | 37,774 | - | 37,774 | (37,774) | - |
Operating Income (Expenses) before Income (Expenses) Financial Income (Expenses) and Income Taxes | (562,796) | 58,860 | (503,936) | (18,568) | (522,504) |
| Financial Income (Expenses) | |||||
| Financial Revenue | 139,498 | 19,873 | 159,371 | (15,951) | 143,420 |
| Financial Expenses | (584,126) | (328) | (584,454) | 15,956 | (568,498) |
| Financial Revenues (Expenses), Net | (444,628) | 19,545 | (425,083) | 5 | (425,078) |
| Financial Income (Expenses) before Exchange Rate Change, Net and before Income Tax and Social Contribution | (1,007,424) | 78,405 | (929,019) | (18,563) | (947,582) |
| Exchange Rate Change, Net | (1,535,090) | (2,150) | (1,537,240) | - | (1,537,240) |
| Income (Loss) before Income Tax and Social Contribution | (2,542,514) | 76,255 | (2,466,259) | (18,563) | (2,484,822) |
| Income Tax and Social Contribution | 14,111 | (28,548) | (14,437) | (6,532) | (20,969) |
| Net Income (Loss) for the Period | (2,528,403) | 47,707 | (2,480,696) | (25,095) | (2,505,791) |
| Income (Expenses) Attributed to the Parent Company | (2,528,403) | 25,095 | (2,503,308) | (25,095) | (2,528,403) |
| Income (Expenses) Attributed to Non-Controlling Shareholders | - | 22,612 | 22,612 | - | 22,612 |
| 54 |
| | Notes on the Parent Company and Consolidated Quarterly Information (ITR) March 31, 2021 (In thousands of Brazilian Reais - R$, except when otherwise indicated) |
| March 31, 2020 | |||||
Flight transportation | Frequent-Flyer Program Smiles | Combined Operating Segments | Eliminations | Total Consolidated | |
| Net Revenue | |||||
| Passenger Transportation | 2,877,677 | - | 2,877,677 | 63,656 | 2,941,333 |
| Cargo and Others | 118,385 | - | 118,385 | (21,878) | 96,507 |
| Revenue with Miles Redeemed | - | 171,331 | 171,331 | (61,444) | 109,887 |
| Total net revenue (a) | 2,996,062 | 171,331 | 3,167,393 | (19,666) | 3,147,727 |
| Cost of Services (b) | (2,585,498) | (24,002) | (2,609,500) | 29,590 | (2,579,910) |
| Gross Profit | 410,564 | 147,329 | 557,893 | 9,924 | 567,817 |
| Operating Expenses | |||||
| Selling Expenses | (135,699) | (33,258) | (168,957) | - | (168,957) |
| Administrative Expenses (c) | (300,669) | (39,053) | (339,722) | 11,445 | (328,277) |
| Other Operating (Expenses) Revenues, Net | 951,342 | 3,496 | 954,838 | - | 954,838 |
| Total Operating Expenses | 514,974 | (68,815) | 446,159 | 11,445 | 457,604 |
| Equity Income (Expenses) | 43,737 | - | 43,737 | (43,737) | - |
Operating Income (Expenses) before Financial Income (Expenses) and Income Taxes | 969,275 | 78,514 | 1,047,789 | (22,368) | 1,025,421 |
Financial Income (Expenses) | |||||
| Financial Revenue | 689,137 | 22,591 | 711,728 | (13,482) | 698,246 |
| Financial Expenses | (1,004,086) | (9,852) | (1,013,938) | 15,482 | (998,456) |
| Financial Revenues (Expenses), Net | (314,949) | 12,739 | (302,210) | 2,000 | (300,210) |
| Financial Income (Expenses) before Exchange Rate Change, Net and before Income Tax and Social Contribution | 654,326 | 91,253 | 745,579 | (20,368) | 725,211 |
| Exchange Rate Change, Net | (2,938,694) | (2,772) | (2,941,466) | (1,938) | (2,943,404) |
| Income (Loss) before Income Tax and Social Contribution | (2,284,368) | 88,481 | (2,195,887) | (22,306) | (2,218,193) |
| Income Tax and Social Contribution | (3,901) | (32,229) | (36,130) | (7,286) | (43,416) |
| Net Income (Loss) for the Period | (2,288,269) | 56,252 | (2,232,017) | (29,592) | (2,261,609) |
| Income (Expenses) Attributed to the Parent Company | (2,288,269) | 29,592 | (2,258,677) | (29,592) | (2,288,269) |
| Income (Expenses) Attributed to Non-Controlling Shareholders | - | 26,660 | 26,660 | - | 26,660 |
| (a) | Eliminations are related to transactions between GLA and Smiles Fidelidade. |
| (b) | Includes depreciation and amortization expenses in the amount of R$264,804 in the three-month period ended March 31, 2021, allocated to the following segments: R$239,904 for air transportation and R$24,900 for Smiles frequent-flyer program (R$489,703 and R$6,587 in the three-month period ended March 31, 2020, respectively). |
| (c) | Includes depreciation and amortization expenses in the amount of R$29,005 in the three-month period ended March 31, 2021, allocated to the following segments: R$25,328 for air transportation and R$3,677 for Smiles frequent-flyer program (R$30,578 and R$898 in the three-month period ended March 31, 2020, respectively). |
| (d) | Includes depreciation and amortization charges (idleness) totaling R$62,675 for the three-month period ended March 31, 2021, allocated entirely in the air transportation segment. |
In the stand-alone financial statements of the subsidiary Smiles Fidelidade, which represents the segment Smiles Frequent-Flyer Program, and in the information provided to the relevant decision-makers, the revenue recognition occurs upon redemption of miles by the participants. Under the perspective of Smiles Fidelidade, this measurement is appropriate given that this is when the revenue recognition cycle is complete. At this point, Smiles has transferred to its suppliers the obligation to provide services or deliver products to its customers.
However, from a consolidated perspective, the revenue recognition cycle related to miles exchanged for the Company’s tickets is only complete when the passengers are effectively transported. Therefore, for purposes of reconciliation with the consolidated assets, liabilities and income and expenses, and purposes of the equity method of accounting and consolidation purposes, the Company performed, in addition to elimination entries, consolidating adjustments to adjust the accounting practices related to Smiles’ revenues. Under the perspective of the consolidated financial statements, the mileages used to redeem airline tickets are only recognized as revenue when passengers are transported, under accounting practices and policies adopted by the Company.
| 55 |
| | Notes on the Parent Company and Consolidated Quarterly Information (ITR) March 31, 2021 (In thousands of Brazilian Reais - R$, except when otherwise indicated) |
| 33. | Commitments |
On March 31, 2021, the Company had 95 firm orders (95 on December 31, 2020) for aircraft acquisitions with Boeing. These aircraft acquisition commitments include estimates for contractual price increases during the construction phase. The approximate amount of firm orders in the current period considers estimated contractual discounts and corresponds to around R$26,857,747 (R$23,269,198 on December 31, 2020) corresponding to US$4,714,118 on March 31, 2021 (US$4,447,687 on December 31, 2020) and are segregated as follows:
| Consolidated | ||
| March 31, 2021 | December 31, 2020 | |
| 2022 | 1,024,231 | - |
| 2023 | 4,573,470 | 3,353,702 |
| 2024 onwards | 21,260,046 | 19,915,496 |
| Total | 26,857,747 | 23,269,198 |
Of the total commitments presented above, the Company should disburse the amount of R$10,493,205 (corresponding to US$1,841,786 on March 31, 2021) as advances for aircraft acquisition, according to the financial flow below:
| Consolidated | ||
| March 31, 2021 | December 31, 2020 | |
| 2021 | 202,768 | 184,951 |
| 2022 | 2,156,012 | 1,287,077 |
| 2023 | 3,544,375 | 2,657,000 |
| 2024 onwards | 4,590,050 | 4,186,740 |
| Total | 10,493,205 | 8,315,768 |
The Company leases its entire aircraft fleet through a combination of leases without a purchase option. On March 31, 2021, the total fleet consisted of 127 aircraft, including commercial leases with no purchase option.
| 34. | Financial Instruments and Risk Management |
Operational activities expose the Company and its subsidiaries to market risk (fuel prices, foreign currency, and interest rate), credit risk and liquidity risk. These risks can be mitigated by using exchange swap derivatives, futures and options contracts based on oil, U.S. dollar and interest markets.
Financial instruments are managed by the Risk Policy Committee in line with the Risk Management Policy and submitted to the Board of Directors.
The details regarding how the company manages risks have been widely presented in the financial statements related to the year ended December 31, 2020. Since then, there have been no changes.
| 56 |
| | Notes on the Parent Company and Consolidated Quarterly Information (ITR) March 31, 2021 (In thousands of Brazilian Reais - R$, except when otherwise indicated) |
| 34.1. | Accounting Classifications of Financial Instruments |
The accounting classifications of the Company's consolidated financial instruments on March 31, 2021, and December 31, 2020, are shown below:
| Parent Company | Consolidated | |||||||
| Measured at Fair Value through Income (Expenses) | Cost amortized | Measured at Fair Value through Income (Expenses) | Cost amortized | |||||
| March 31, 2021 | December 31, 2020 | March 31, 2021 | December 31, 2020 | March 31, 2021 | December 31, 2020 | March 31, 2021 | December 31, 2020 | |
| Assets | March 31, 2021 | December 31, 2020 | ||||||
| Cash and Bank Deposits | 264 | 374,271 | - | - | 39,818 | 428,812 | - | - |
| Cash Equivalents | 391 | 49,666 | - | - | 364,895 | 234,018 | - | - |
| Financial Investments | 124 | 236 | - | - | 535,538 | 629,335 | - | - |
| Restricted Cash | 4,242 | 4,201 | - | - | 314,627 | 544,607 | - | - |
| Trade Receivables | - | - | - | - | - | - | 542,804 | 739,699 |
| Rights from Derivative Transactions | 47,907 | 87,663 | - | - | 47,924 | 128,809 | - | - |
| Deposits (a) | - | - | 75,015 | 68,423 | - | - | 1,554,024 | 1,390,890 |
| Dividends and Interest on Shareholders’ Equity to Receive | - | - | 263,009 | 24,120 | - | - | - | - |
| Credits with Related Companies | - | - | 5,344,476 | 4,897,331 | - | - | - | - |
| Other Credits | - | - | 12,684 | 9,640 | - | - | 174,512 | 179,160 |
| Liabilities | ||||||||
| Loans and Financing (b) | 257,428 | 346,030 | 7,866,351 | 7,283,683 | 257,428 | 346,030 | 10,149,394 | 9,630,936 |
| Leases to Pay | - | - | - | - | - | - | 8,576,521 | 7,584,192 |
| Suppliers | - | - | 47,981 | 72,702 | - | - | 1,561,958 | 1,645,194 |
| Obligations with Derivative Transactions | - | - | - | - | - | 5,297 | - | - |
| Obligations to Related Parties | - | - | 9,666 | 8,791 | - | - | - | - |
| Other Liabilities | - | - | 427,635 | 316,030 | - | - | 1,048,297 | 618,754 |
| (a) | Excludes judicial deposits, as described in Note 13. |
| (b) | The amounts on March 31, 2021, and December 31, 2020, classified as measured at fair value through income (expense), are related to the derivative contracted through Exchange Senior Notes. |
| 57 |
| | Notes on the Parent Company and Consolidated Quarterly Information (ITR) March 31, 2021 (In thousands of Brazilian Reais - R$, except when otherwise indicated) |
In the three-month period ended March 31, 2021, financial instruments were not reclassified.
| 34.2. | Derivative and Non-Derivative Financial Instruments |
The Company's derivative financial instruments were recognized as follows in the Balance sheet:
| Derivatives | Non-Derivative | ||||||
| Fuel | Interest Rate | Exchange Rate | Capped Call | ESN 2024 | Revenue Hedge | Total | |
| Fair Value Changes | |||||||
| Rights (Obligations) with Derivatives on December 31, 2020 | 34,166 | - | 1,683 | 87,663 | (346,030) | - | (222,518) |
| Gains (Losses) Recognized in Income (Expenses) | - | - | 635 | (46,107) | 118,596 | - | 73,124 |
| Gains (Losses) Recognized as Exchange Rate Change | - | - | - | 6,351 | (29,995) | - | (23,644) |
| Gains Recognized in Equity Valuation Adjustments | 96,864 | - | - | - | - | - | 96,864 |
| Received During the Period | (131,013) | - | (2,318) | - | - | - | (133,331) |
| Rights (Obligations) with Derivatives on March 31, 2021 | 17 | - | - | 47,907 | (257,429) | - | (209,505) |
| Rights from Derivative Transactions | 17 | - | - | 47,907 | - | - | 47,924 |
| Debt | - | - | - | - | (257,429) | - | (257,429) |
| Changes in the adjustment of equity valuation | |||||||
| Balance on December 31, 2020 | (164,789) | (303,207) | - | - | - | (843,080) | (1,311,076) |
| Fair Value Adjustments during the Period | 96,864 | - | - | - | - | - | 96,864 |
| Adjustments of Hedge Accounting of Revenue | - | - | - | - | - | (44,314) | (44,314) |
| Net Reversal to Income (Expenses) | 41,712 | 1,624 | - | - | - | 836 | 44,172 |
| Balances on March 31, 2021 | (26,213) | (301,583) | - | - | - | (886,558) | (1,214,354) |
| Effects on Income (Expenses) | (41,712) | (1,624) | 635 | (39,756) | 88,602 | 43,478 | 49,623 |
| Cost of Services | (43,965) | - | - | - | - | - | (43,965) |
| Financial Income (Expenses) | 2,253 | (1,624) | - | (46,107) | 118,596 | - | 73,118 |
| Exchange Rate Change | - | - | 635 | 6,351 | (29,994) | 43,478 | 20,470 |
The Company may adopt hedge accounting for derivatives contracted to hedge cash flow and qualify for this classification as per CPC 48 - Financial Instruments (equivalent to IFRS 9).
On March 31, 2021, the Company adopts a cash flow hedge for the interest rate (mainly the Libor interest rates) and aeronautical fuel protection and future revenue in US Dollar.
As a result of the lower volume of flights and disruption of international operations, the Company discontinued hedging relationships of part of the fuel hedges designated as cash flow hedges and hedge accounting used to hedge future revenues foreign currency (hedged), as disclosed in note 1.1.
The schedule for realizing the balance of equity valuation adjustments on March 31, 2021, referring to cash flow hedges, is as follows:
| 2021 | 2022 | 2023 | 2024 | 2024 onwards | |
| Fuel | 16,986 | 9,227 | - | - | - |
| Interest Rate | 12,514 | 21,129 | 25,996 | 25,834 | 216,110 |
| Revenue Hedge | 45,944 | 288,695 | 338,320 | 213,599 | - |
| Total | 75,444 | 319,051 | 364,316 | 239,433 | 216,110 |
| 58 |
| | Notes on the Parent Company and Consolidated Quarterly Information (ITR) March 31, 2021 (In thousands of Brazilian Reais - R$, except when otherwise indicated) |
| 34.3. | Market Risks |
| 34.3.1. | Fuel |
The aircraft fuel prices fluctuate due to the volatility of the price of crude oil by product price fluctuations. On March 31, 2021, the Company held Brent, WTI and Collar derivatives, whose strategies are purchase options, Collar, Swap, and futures to mitigate the risk of fuel price.
The table below shows the sensitivity analysis considering the fluctuation of prices of air fuel priced in US dollars, based on the barrel price on March 31, 2021 at US$59.16:
| Fuel | ||
Barrel Price (in USD) | Impact (In thousand of Reais) | |
| Decline in Prices/Barrel (-25%) | 46.16 | (17) |
| Decline in Prices/Barrel (-10%) | 53.24 | (17) |
| Increase in Prices/Barrel (+10%) | 65.10 | 96 |
| Increase in Prices/Barrel (+25%) | 76.94 | 1,029 |
| 34.3.2. | Interest Rate |
The Company is mainly exposed to lease transactions indexed to changes in the LIBOR rate until the aircraft is received. To mitigate such risks, the Company can use derivative financial instruments.
On March 31, 2021, the Company held financial investments and debts with different types of fees. Its sensitivity analysis of non-derivative financial instruments examined the impact on annual interest rates only for positions with material amounts on March 31, 2021 that were exposed to fluctuations in interest rates, as the scenarios below show. The amounts show the impacts on Income (Expenses) according to the scenarios adopted below:
| Short-Term Investments Net of Financial Debt (a) | ||
| Risk | CDI Rate Drop | Libor Rate Increase |
| Reference Rates | 2.65% | 0.08% |
| Exposure Amount (Probable Scenario) (b) | (407,321) | 3,235,142 |
| Remote Favorable Scenario (-25%) | 2,659 | (653) |
| Possible Favorable Scenario (-10%) | 1,064 | (261) |
| Possible Adverse Scenario (+10%) | (1,064) | 261 |
| Remote Adverse Scenario (+25%) | (2,659) | 653 |
| (a) | Refers to the sum of the amounts invested and raised in the financial market and indexed to the CDI and Libor rates. |
| (b) | Book balances recorded as of March 31, 2021. |
| 34.3.3. | Exchange Rate |
Foreign currency risk derives from the possibility of unfavorable foreign currency fluctuation to which the Company’s liabilities or cash flows are exposed. The Company is mainly exposed to the exchange rate change of the U.S. dollar.
| 59 |
| | Notes on the Parent Company and Consolidated Quarterly Information (ITR) March 31, 2021 (In thousands of Brazilian Reais - R$, except when otherwise indicated) |
The Company’s foreign currency exposure is summarized below:
| Parent Company | Consolidated | |||
| March 31, 2021 | December 31, 2020 | March 31, 2021 | December 31, 2020 | |
| Assets | ||||
| Cash, Financial Investments and Restricted Cash | 1,543 | 374,979 | 87,583 | 491,258 |
| Trade Receivables | - | - | 61,204 | 120,167 |
| Deposits | 75,014 | 68,423 | 1,554,024 | 1,390,890 |
| Rights from Derivative Transactions | 47,907 | 87,663 | 47,924 | 128,809 |
| Total Assets | 124,464 | 531,065 | 1,750,735 | 2,131,124 |
| Liabilities | ||||
| Loans and Financing | (8,123,779) | (7,629,713) | (9,609,719) | (9,132,988) |
| Leases to Pay | - | - | (8,503,848) | (7,536,677) |
| Suppliers | (19,020) | (24,357) | (500,914) | (481,001) |
| Provision for Aircraft and Engine Return | - | - | (1,220,031) | (1,030,915) |
| Obligations with Derivative Transactions | - | - | - | (5,297) |
| Total Liabilities | (8,142,799) | (7,654,070) | (19,834,512) | (18,186,878) |
| Exchange Rate Exposure Liabilities | (8,018,335) | (7,123,005) | (18,083,777) | (16,055,754) |
| Commitments Not Recorded in the Statements of Financial Position | ||||
| Future Obligations Resulting from Firm Aircraft Orders | (26,857,747) | (23,269,198) | (26,857,747) | (23,269,198) |
| Total | (26,857,747) | (23,269,198) | (26,857,747) | (23,269,198) |
| Total Exchange Rate Exposure - R$ | (34,876,082) | (30,392,203) | (44,941,524) | (39,324,952) |
| Total Exchange Rate Exposure - US$ | (6,121,511) | (5,848,366) | (7,888,214) | (7,567,293) |
| Exchange Rate (R$/US$) | 5.6973 | 5.1967 | 5.6973 | 5.1967 |
On March 31, 2021, the Company adopted the R$5.6973/US$1.00 exchange rate, corresponding to the month's closing rate announced by the Central Bank of Brazil as a probable scenario. The table below shows the sensitivity analysis and the effect on profit or loss of exchange rate fluctuations in the exposure amount of the period on March 31, 2021:
| Effect on Income (Expenses) | |||
| Exchange Rate | Parent Company | Consolidated | |
| Net Liabilities Exposed to the Risk of Appreciation of the U.S. dollar | 5.6973 | 8,018,335 | 18,083,777 |
| Dollar Depreciation (-25%) | 4.2730 | 2,004,584 | 4,520,944 |
| Dollar Depreciation (-10%) | 5.1276 | 801,834 | 1,808,378 |
| Dollar Appreciation (+10%) | 6.2670 | (801,834) | (1,808,378) |
| Dollar Appreciation (+25%) | 7.1216 | (2,004,584) | (4,520,944) |
| 34.3.4. | Capped Call |
The Company, through Gol Equity Finance, in the context of the pricing of the ESN issued on March 26, April 17 and July 17, 2019, contracted private derivative transactions (Capped call) with part of the note subscribers to minimize the potential dilution of the Company’s preferred shares and ADSs.
| 60 |
| | Notes on the Parent Company and Consolidated Quarterly Information (ITR) March 31, 2021 (In thousands of Brazilian Reais - R$, except when otherwise indicated) |
| 34.4. | Credit Risk |
The credit risk is inherent in the Company’s operating and financing activities, mainly in cash and cash equivalents, financial investments, and trade receivables. Financial assets classified as cash, cash equivalents, and financial investments are deposited with counterparties rated investment grade or higher by S&P or Moody's (between AAA and AA-) under risk management policies.
Credit limits are set for all customers based on internal credit rating criteria, and carrying amounts represent the maximum credit risk exposure. Customer creditworthiness is assessed based on an internal system of extensive credit ratings. The Company frequently monitors outstanding trade receivables.
Derivative financial instruments are contracted in the over-the-counter market (OTC) with counterparties rated investment grade or higher or in a commodities and futures exchange (B3 or NYMEX), thus substantially mitigating credit risk. The Company must evaluate counterparty risk involved in financial instruments and periodically diversify its exposure.
| 34.5. | Liquidity risk |
The Company is exposed to liquidity risk in two distinct ways: (i) market prices, which vary under the types of assets and markets where they are traded, and (ii) cash flow liquidity risk related to difficulties in meeting the contracted operating obligations at maturity. In order to manage liquidity risk, the Company invests its funds in liquid assets (government bonds, CDBs and investment funds with daily liquidity), and its Cash Management Policy requires the weighted average maturity of its debt to be longer than the weighted average term of its investment portfolio term.
The schedules of financial liabilities held by the Company's consolidated financial liabilities on March 31, 2021, and December 31, 2020, are as follows:
| Parent Company | |||||
| Less than 6 months | 6 - 12 months | 1 - 5 years | More than 5 years | Total | |
| Debt | 534,273 | - | 5,573,227 | 2,016,279 | 8,123,779 |
| Suppliers | 47,981 | - | - | - | 47,981 |
| Obligations to Related Parties | - | - | 9,666 | - | 9,666 |
| Other Liabilities | 53 | - | 427,582 | - | 427,635 |
| On March 31, 2021 | 582,307 | - | 6,010,475 | 2,016,279 | 8,609,061 |
| Debt | 638,965 | - | 6,201,580 | 789,168 | 7,629,713 |
| Suppliers | 72,702 | - | - | - | 72,702 |
| Obligations to Related Parties | 8,791 | - | - | - | 8,791 |
| Other Liabilities | - | - | 316,030 | - | 316,030 |
| On December 31, 2020 | 720,458 | - | 6,517,610 | 789,168 | 8,027,236 |
| 61 |
| | Notes on the Parent Company and Consolidated Quarterly Information (ITR) March 31, 2021 (In thousands of Brazilian Reais - R$, except when otherwise indicated) |
| Consolidated | |||||
| Less than 6 months | 6 - 12 months | 1 - 5 years | More than 5 years | Total | |
| Debt | 2,077,850 | 226,182 | 5,985,773 | 2,117,017 | 10,406,822 |
| Leases Payable | 1,193,723 | 739,429 | 5,093,200 | 1,550,169 | 8,576,521 |
| Suppliers | 1,538,228 | - | 23,730 | - | 1,561,958 |
| Other Liabilities | 590,220 | - | 458,077 | - | 1,048,297 |
| On March 31, 2021 | 5,400,021 | 965,611 | 11,560,780 | 3,667,186 | 21,593,598 |
| Debt | 2,120,462 | 232,817 | 6,804,167 | 819,520 | 9,976,966 |
| Leases Payable | 647,850 | 669,158 | 4,763,614 | 1,503,570 | 7,584,192 |
| Suppliers | 1,612,536 | - | 32,658 | - | 1,645,194 |
| Obligations with Derivative Transactions | 5,297 | - | - | - | 5,297 |
| Other Liabilities | 287,275 | - | 331,479 | - | 618,754 |
| On December 31, 2020 | 4,673,420 | 901,975 | 11,931,918 | 2,323,090 | 19,830,403 |
| 34.6. | Capital Management |
The Company seeks alternatives to capital to meet its operational needs, aiming at a capital structure that considers suitable parameters for the financial costs, the maturities of funding, and its guarantees. The Company monitors its financial leverage ratio, which corresponds to net debt, including short and long-term debt. The following table shows the financial leverage:
| Consolidated | ||
| March 31, 2021 | December 31, 2020 | |
| Total Loans and Financing | 10,406,822 | 9,976,966 |
| Total Leases Payable | 8,576,521 | 7,584,192 |
| (-) Cash and Cash Equivalents | (404,713) | (662,830) |
| (-) Financial Investments | (535,538) | (629,335) |
| (-) Restricted cash | (314,627) | (544,607) |
| Net Debt | 17,728,465 | 15,724,386 |
| 35. | Non-Cash Transactions |
| Parent Company | ||
| March 31, 2021 | March 31, 2020 | |
| Dividends Receivable (Investments/Dividends Receivable) | 263,008 | - |
| Share-Based Compensation (Investments/Share-Based Payment) | 5,010 | 5,475 |
| Unrealized Income (Expenses) of Derivatives (Investments/Equity Valuation Adjustment) | 96,722 | 1,077,289 |
| Boeing Agreement - Exchange Rate Change (Exchange Rate Change / Related Parties / Receivables / Property, Plant & Equipment) | - | 446,942 |
| Consolidated | ||
| March 31, 2021 | March 31, 2020 | |
| Dividends Payable (Non-Controlling Interests / Dividends Payable) | 236,992 | - |
| Write-off of financial lease agreements | - | (58,402) |
| Acquisition of Property, Plant & Equipment Through Financing (Property, Plant & Equipment / Loans And Financing) | - | 25,794 |
| Amortization of debt with Restricted Cash (restricted cash / loans and financing) | 198,270 | - |
| Amortization of debt with Deposits Invested (Deposits / Leases Payable) | 2,838 | - |
| Right of Use of Flight Equipment (Property, Plant & Equipment / Leases Payable) | 153,126 | 45,653 |
| Financial Lease Agreement Renegotiation (Property, Plant & Equipment / Leases Payable) | 2,500 | 880,412 |
| Provision for Aircraft Return (Property, Plant & Equipment / Provisions) | (3,629) | (78,062) |
| Boeing Agreement - Exchange Rate Change (Exchange Rate Change / Property, Plant & Equipment) | - | 446,942 |
| 62 |
| | Notes on the Parent Company and Consolidated Quarterly Information (ITR) March 31, 2021 (In thousands of Brazilian Reais - R$, except when otherwise indicated) |
| 36. | Liabilities from Financing Activities |
The changes in and equity instruments issued liabilities from the Company’s financing activities in the periods ended March 31, 2021, and 2020 are as follows:
| 36.1. | Parent Company |
| March 31, 2021 | |||||||
| Adjustment to Profit | |||||||
| Opening Balance | Net Cash Flows (Used in) from Financing Activities | Net Cash Flows from Operating Activities | Exchange Rate Changes, Net | Provision for Interest and Cost Amortization | Unrealized Income (Expenses) on Derivatives | Closing Balance | |
| Loans and Financing | 7,629,713 | (103,179) | (191,018) | 737,242 | 167,567 | (116,546) | 8,123,779 |
| March 31, 2020 | |||||||
| Adjustment to Profit | |||||||
| Opening Balance | Net Cash Flows (Used in) from Financing Activities | Net Cash Flows from Operating Activities | Exchange Rate Changes, Net | Provision for Interest and Cost Amortization | Unrealized Income (Expenses) on Derivatives | Closing Balance | |
| Loans and Financing | 6,595,140 | (405,878) | (207,971) | 1,817,034 | 133,781 | (575,357) | 7,356,749 |
| 63 |
| | Notes on the Parent Company and Consolidated Quarterly Information (ITR) March 31, 2021 (In thousands of Brazilian Reais - R$, except when otherwise indicated) |
| 36.2. | Consolidated |
| March 31, 2021 | |||||||||||||
| Non-Cash Transactions | Adjustments to Profit | ||||||||||||
| Opening Balance | Net Cash from Financing Activities | Net Cash Used in Operating Activities | Acquisition of Property, Plant & Equipment under New Agreements | Liability Variation of Variable and Short-Term Leases | Amortization with related assets | Distribution of Interim Dividends | Exchange Rate Changes, Net | Provision for Interest and Cost Amortization | Contractual Amendment | Unrealized Income (Expenses) on Derivatives | Closing Balance | ||
| Loans and Financing | 9,976,966 | (112,589) | (215,462) | - | - | (198,270) | - | 878,083 | 194,640 | - | (116,546) | 10,406,822 | |
| Leases to Pay | 7,584,192 | (128,528) | - | 153,126 | 12,353 | (2,838) | - | 728,389 | 227,327 | 2,500 | - | 8,576,521 | |
| Dividends and ISE to Pay (1) | 23,139 | (23,139) | - | - | - | - | 236,992 | - | - | - | - | 236,992 | |
| (1) | The amount is recorded in the Other Liabilities group, in current liabilities. |
| March 31, 2020 | ||||||||||||
| Non-Cash Transactions | Adjustment to Profit | |||||||||||
| Opening Balance | Net Cash Flows (Used in) from Financing Activities | Net Cash Flows from Operating Activities | Property, plant, and equipment acquisition through financing | Gains (losses) recognized in the adjustment of equity valuation | Write-Offs | Exchange Rate Changes, Net | Provision for Interest and Cost Amortization | Write-offs and contractual amendments | Unrealized Income (Expenses) on Derivatives | Closing Balance | ||
| Loans and Financing | 8,409,841 | (441,414) | (229,822) | 25,974 | - | - | 2,172,016 | 162,451 | - | (575,357) | 9,523,689 | |
| Leases to Pay | 6,052,780 | (421,713) | (4,592) | 104,055 | - | (206,308) | 1,694,498 | 141,532 | 58,402 | - | 7,418,654 | |
| Derivatives | (127,119) | 21,800 | (132,561) | - | 880,412 | - | (18,658) | - | - | 130,200 | 754,074 | |
| 64 |
SIGNATURE
Pursuant to the requirements of the Securities Exchange Act of 1934, the registrant has duly caused this report to be signed on its behalf by the undersigned, thereunto duly authorized.
Date: April 27, 2021
| GOL LINHAS AÉREAS INTELIGENTES S.A. | ||
| By: | /s/ Richard F. Lark, Jr. | |
Name: Richard F. Lark, Jr. Title: Investor Relations Officer | ||