UNITED STATES
SECURITIES AND EXCHANGE COMMISSION
Washington, D.C. 20549
FORM N-CSR
CERTIFIED SHAREHOLDER REPORT OF REGISTERED
MANAGEMENT INVESTMENT COMPANIES
| | | | | | | | | | | | | | | | | | | | |
| Investment Company Act file number | 811-21591 |
| |
| AMERICAN CENTURY ASSET ALLOCATION PORTFOLIOS, INC. |
| (Exact name of registrant as specified in charter) |
| |
| 4500 MAIN STREET, KANSAS CITY, MISSOURI | 64111 |
| (Address of principal executive offices) | (Zip Code) |
| |
JOHN PAK
4500 MAIN STREET, KANSAS CITY, MISSOURI 64111 |
| (Name and address of agent for service) |
| |
| Registrant’s telephone number, including area code: | 816-531-5575 |
| |
| Date of fiscal year end: | 07-31 |
| |
| Date of reporting period: | 07-31-2023 |
ITEM 1. REPORTS TO STOCKHOLDERS.
(a) Provided under separate cover.

| | | | | | | | |
| | |
| Annual Report | |
| | |
| July 31, 2023 | |
| | |
| One Choice® Blend+ 2015 Portfolio | One Choice® Blend+ 2045 Portfolio |
| Investor Class (AAAFX) | Investor Class (AADHX) |
| I Class (AAAHX) | I Class (AADJX) |
| A Class (AAAJX) | A Class (AADKX) |
| R Class (AAAKX) | R Class (AADLX) |
| R6 Class (AAALX) | R6 Class (AADMX) |
| One Choice® Blend+ 2020 Portfolio | One Choice® Blend+ 2050 Portfolio |
| Investor Class (AAAMX) | Investor Class (AADNX) |
| I Class (AAAOX) | I Class (AADOX) |
| A Class (AABEX) | A Class (AADPX) |
| R Class (AABGX) | R Class (AADQX) |
| R6 Class (AABHX) | R6 Class (AADUX) |
| One Choice® Blend+ 2025 Portfolio | One Choice® Blend+ 2055 Portfolio |
| Investor Class (AABJX) | Investor Class (AADVX) |
| I Class (AABKX) | I Class (AADWX) |
| A Class (AABQX) | A Class (AADZX) |
| R Class (AABRX) | R Class (AAEDX) |
| R6 Class (AABVX) | R6 Class (AAEEX) |
| One Choice® Blend+ 2030 Portfolio | One Choice® Blend+ 2060 Portfolio |
| Investor Class (AABWX) | Investor Class (AAEFX) |
| I Class (AAEWX) | I Class (AAEGX) |
| A Class (AABZX) | A Class (AAEHX) |
| R Class (AACHX) | R Class (AAEIX) |
| R6 Class (AACJX) | R6 Class (AAEJX) |
| One Choice® Blend+ 2035 Portfolio | One Choice® Blend+ 2065 Portfolio |
| Investor Class (AACKX) | Investor Class (AAEKX) |
| I Class (AACLX) | I Class (AAELX) |
| A Class (AACMX) | A Class (AAEOX) |
| R Class (AACPX) | R Class (AAEUX) |
| R6 Class (AACQX) | R6 Class (AAEVX) |
| One Choice® Blend+ 2040 Portfolio | |
| Investor Class (AACSX) | |
| I Class (AACUX) | |
| A Class (AACVX) | |
| R Class (AACWX) | |
| R6 Class (AACZX) | |
| | | | | |
| President’s Letter | |
| Performance | |
| Portfolio Commentary | |
| Portfolio Characteristics | |
| Shareholder Fee Examples | |
| Schedules of Investments | |
| Statements of Assets and Liabilities | |
| Statements of Operations | |
| Statements of Changes in Net Assets | |
| Notes to Financial Statements | |
| Financial Highlights | |
| Report of Independent Registered Public Accounting Firm | |
| Management | |
| |
| Liquidity Risk Management Program | |
| Proxy Voting Results | |
| Additional Information | |
| |
Any opinions expressed in this report reflect those of the author as of the date of the report, and do not necessarily represent the opinions of American Century Investments® or any other person in the American Century Investments organization. Any such opinions are subject to change at any time based upon market or other conditions and American Century Investments disclaims any responsibility to update such opinions. These opinions may not be relied upon as investment advice and, because investment decisions made by American Century Investments funds are based on numerous factors, may not be relied upon as an indication of trading intent on behalf of any American Century Investments fund. Security examples are used for representational purposes only and are not intended as recommendations to purchase or sell securities. Performance information for comparative indices and securities is provided to American Century Investments by third party vendors. To the best of American Century Investments’ knowledge, such information is accurate at the time of printing.
 Jonathan Thomas
Dear Investor:
Thank you for reviewing this annual report for the period ended July 31, 2023. Annual reports help convey important information about fund returns, including market factors that affected performance. For additional investment insights, please visit americancentury.com.
Stocks Rallied Despite Ongoing Challenges
After delivering modest gains early in the fiscal year, global stocks—most notably U.S. stocks—rallied through the first seven months of 2023. This bounce back, which occurred despite ongoing volatility and rising interest rates, led to strong 12-month performance for most broad stock indices. Investor expectations for the Federal Reserve (Fed) to conclude its rate-hike campaign largely fueled the optimism.
Inflation’s steady slowdown, mounting recession worries and a series of U.S. regional bank failures prompted investors to regularly recalibrate their monetary policy outlooks. However, with inflation still higher than central bank targets, the Fed and its developed markets peers continued to raise rates through period-end.
In June, the Fed bucked the trend of developed markets central banks and paused after 10 consecutive rate hikes. But the break was short-lived. The central bank resumed its tightening campaign in July, raising rates another quarter point to a range of 5.25% to 5.5%, a 22-year high. Citing still-higher-than-target inflation and still-strong economic data, policymakers left their tightening options open. Inflation remained even higher in the eurozone and the U.K., prompting central bankers there to steadily raise interest rates.
Despite the inflation and rate backdrops, better-than-expected corporate earnings helped the S&P 500 Index return 21% for the seven months ended July 31, 2023. For the 12-month period, the S&P 500 Index returned 13%. Global and style-focused stock index returns were even stronger. Meanwhile, amid high inflation and central bank tightening, government bond yields surged, and global and U.S. bond returns declined for the period.
Remaining Diligent in Uncertain Times
We expect market volatility to linger as investors navigate a complex environment of persistent inflation, tighter financial conditions, banking industry turbulence and recession risk. In addition, increasingly tense geopolitical considerations complicate the market backdrop.
We appreciate your confidence in us during these extraordinary times. American Century Investments has a long history of helping clients weather unpredictable and volatile markets, and we’re confident we will continue to meet today’s challenges.
Sincerely,
Jonathan Thomas
President and Chief Executive Officer
American Century Investments
| | | | | | | | | | | | | | |
| Total Returns as of July 31, 2023 |
| | | Average Annual Returns | |
| Ticker
Symbol | 1 year | Since
Inception | Inception
Date |
| One Choice Blend+ 2015 Portfolio |
| Investor Class | AAAFX | 2.78% | -0.52% | 3/10/21 |
| S&P Target Date 2015 Index | — | 4.17% | 0.57% | — |
| I Class | AAAHX | 2.87% | -0.37% | 3/10/21 |
| A Class | AAAJX | | | 3/10/21 |
| No sales charge | | 2.41% | -0.80% | |
| With sales charge | | -3.48% | -3.22% | |
| R Class | AAAKX | 2.15% | -1.07% | 3/10/21 |
| R6 Class | AAALX | 3.03% | -0.21% | 3/10/21 |
Fund returns would have been lower if a portion of the fees had not been waived.
Sales charges include initial sales charges and contingent deferred sales charges (CDSCs), as applicable. A Class shares have a 5.75% maximum initial sales charge and may be subject to a maximum CDSC of 1.00%. The SEC requires that mutual funds provide performance information net of maximum sales charges in all cases where charges could be applied.
A One Choice Target Date Portfolio's target date is the approximate year when investors plan to retire or start withdrawing their money. The principal value of the investment is not guaranteed at any time, including at the target date.
Data presented reflect past performance. Past performance is no guarantee of future results. Current performance may be higher or lower than the performance shown. Total returns for periods less than one year are not annualized. Investment return and principal value will fluctuate, and redemption value may be more or less than original cost. Data assumes reinvestment of dividends and capital gains, and none of the charts reflect the deduction of taxes that a shareholder would pay on fund distributions or the redemption of fund shares. To obtain performance data current to the most recent month end, please call 1-800-345-2021 or visit americancentury.com. For additional information about the funds, please consult the prospectus.
| | | | | | | | | | | | | | |
| Total Returns as of July 31, 2023 |
| | | Average Annual Returns | |
| Ticker
Symbol | 1 year | Since
Inception | Inception
Date |
| One Choice Blend+ 2020 Portfolio |
| Investor Class | AAAMX | 2.87% | -0.33% | 3/10/21 |
| S&P Target Date To 2020 Index | — | 3.53% | 0.30% | — |
| I Class | AAAOX | 3.08% | -0.17% | 3/10/21 |
| A Class | AABEX | | | 3/10/21 |
| No sales charge | | 2.61% | -0.61% | |
| With sales charge | | -3.29% | -3.04% | |
| R Class | AABGX | 2.35% | -0.88% | 3/10/21 |
| R6 Class | AABHX | 3.23% | -0.02% | 3/10/21 |
Fund returns would have been lower if a portion of the fees had not been waived.
Sales charges include initial sales charges and contingent deferred sales charges (CDSCs), as applicable. A Class shares have a 5.75% maximum initial sales charge and may be subject to a maximum CDSC of 1.00%. The SEC requires that mutual funds provide performance information net of maximum sales charges in all cases where charges could be applied.
A One Choice Target Date Portfolio's target date is the approximate year when investors plan to retire or start withdrawing their money. The principal value of the investment is not guaranteed at any time, including at the target date.
Data presented reflect past performance. Past performance is no guarantee of future results. Current performance may be higher or lower than the performance shown. Total returns for periods less than one year are not annualized. Investment return and principal value will fluctuate, and redemption value may be more or less than original cost. Data assumes reinvestment of dividends and capital gains, and none of the charts reflect the deduction of taxes that a shareholder would pay on fund distributions or the redemption of fund shares. To obtain performance data current to the most recent month end, please call 1-800-345-2021 or visit americancentury.com. For additional information about the funds, please consult the prospectus.
| | | | | | | | | | | | | | |
| Total Returns as of July 31, 2023 |
| | | Average Annual Returns | |
| Ticker
Symbol | 1 year | Since
Inception | Inception
Date |
| One Choice Blend+ 2025 Portfolio |
| Investor Class | AABJX | 3.72% | -0.37% | 3/10/21 |
| S&P Target Date To 2025 Index | — | 5.16% | 1.03% | — |
| I Class | AABKX | 3.93% | -0.17% | 3/10/21 |
| A Class | AABQX | | | 3/10/21 |
| No sales charge | | 3.58% | -0.60% | |
| With sales charge | | -2.38% | -3.03% | |
| R Class | AABRX | 3.20% | -0.88% | 3/10/21 |
| R6 Class | AABVX | 4.09% | -0.01% | 3/10/21 |
Fund returns would have been lower if a portion of the fees had not been waived.
Sales charges include initial sales charges and contingent deferred sales charges (CDSCs), as applicable. A Class shares have a 5.75% maximum initial sales charge and may be subject to a maximum CDSC of 1.00%. The SEC requires that mutual funds provide performance information net of maximum sales charges in all cases where charges could be applied.
A One Choice Target Date Portfolio's target date is the approximate year when investors plan to retire or start withdrawing their money. The principal value of the investment is not guaranteed at any time, including at the target date.
Data presented reflect past performance. Past performance is no guarantee of future results. Current performance may be higher or lower than the performance shown. Total returns for periods less than one year are not annualized. Investment return and principal value will fluctuate, and redemption value may be more or less than original cost. Data assumes reinvestment of dividends and capital gains, and none of the charts reflect the deduction of taxes that a shareholder would pay on fund distributions or the redemption of fund shares. To obtain performance data current to the most recent month end, please call 1-800-345-2021 or visit americancentury.com. For additional information about the funds, please consult the prospectus.
| | | | | | | | | | | | | | |
| Total Returns as of July 31, 2023 |
| | | Average Annual Returns | |
| | Ticker
Symbol | 1 year | Since
Inception | Inception
Date |
| One Choice Blend+ 2030 Portfolio |
| Investor Class | AABWX | 5.04% | -0.12% | 3/10/21 |
| S&P Target Date To 2030 Index | — | 6.68% | 1.75% | — |
| I Class | AAEWX | 5.14% | 0.07% | 3/10/21 |
| A Class | AABZX | | | 3/10/21 |
| No sales charge | | 4.78% | -0.36% | |
| With sales charge | | -1.24% | -2.79% | |
| R Class | AACHX | 4.41% | -0.63% | 3/10/21 |
| R6 Class | AACJX | 5.41% | 0.23% | 3/10/21 |
Fund returns would have been lower if a portion of the fees had not been waived.
Sales charges include initial sales charges and contingent deferred sales charges (CDSCs), as applicable. A Class shares have a 5.75% maximum initial sales charge and may be subject to a maximum CDSC of 1.00%. The SEC requires that mutual funds provide performance information net of maximum sales charges in all cases where charges could be applied.
A One Choice Target Date Portfolio's target date is the approximate year when investors plan to retire or start withdrawing their money. The principal value of the investment is not guaranteed at any time, including at the target date.
Data presented reflect past performance. Past performance is no guarantee of future results. Current performance may be higher or lower than the performance shown. Total returns for periods less than one year are not annualized. Investment return and principal value will fluctuate, and redemption value may be more or less than original cost. Data assumes reinvestment of dividends and capital gains, and none of the charts reflect the deduction of taxes that a shareholder would pay on fund distributions or the redemption of fund shares. To obtain performance data current to the most recent month end, please call 1-800-345-2021 or visit americancentury.com. For additional information about the funds, please consult the prospectus.
| | | | | | | | | | | | | | |
| Total Returns as of July 31, 2023 |
| | | Average Annual Returns | |
| Ticker
Symbol | 1 year | Since
Inception | Inception
Date |
| One Choice Blend+ 2035 Portfolio |
| Investor Class | AACKX | 6.18% | 0.00% | 3/10/21 |
| S&P Target Date To 2035 Index | — | 8.22% | 2.51% | — |
| I Class | AACLX | 6.39% | 0.19% | 3/10/21 |
| A Class | AACMX | | | 3/10/21 |
| No sales charge | | 6.03% | -0.24% | |
| With sales charge | | -0.06% | -2.68% | |
| R Class | AACPX | 5.66% | -0.52% | 3/10/21 |
| R6 Class | AACQX | 6.55% | 0.35% | 3/10/21 |
Fund returns would have been lower if a portion of the fees had not been waived.
Sales charges include initial sales charges and contingent deferred sales charges (CDSCs), as applicable. A Class shares have a 5.75% maximum initial sales charge and may be subject to a maximum CDSC of 1.00%. The SEC requires that mutual funds provide performance information net of maximum sales charges in all cases where charges could be applied.
A One Choice Target Date Portfolio's target date is the approximate year when investors plan to retire or start withdrawing their money. The principal value of the investment is not guaranteed at any time, including at the target date.
Data presented reflect past performance. Past performance is no guarantee of future results. Current performance may be higher or lower than the performance shown. Total returns for periods less than one year are not annualized. Investment return and principal value will fluctuate, and redemption value may be more or less than original cost. Data assumes reinvestment of dividends and capital gains, and none of the charts reflect the deduction of taxes that a shareholder would pay on fund distributions or the redemption of fund shares. To obtain performance data current to the most recent month end, please call 1-800-345-2021 or visit americancentury.com. For additional information about the funds, please consult the prospectus.
| | | | | | | | | | | | | | |
| Total Returns as of July 31, 2023 |
| | | Average Annual Returns | |
| Ticker
Symbol | 1 year | Since
Inception | Inception
Date |
| One Choice Blend+ 2040 Portfolio |
| Investor Class | AACSX | 7.33% | 0.37% | 3/10/21 |
| S&P Target Date To 2040 Index | — | 9.69% | 3.14% | — |
| I Class | AACUX | 7.54% | 0.57% | 3/10/21 |
| A Class | AACVX | | | 3/10/21 |
| No sales charge | | 7.07% | 0.09% | |
| With sales charge | | 0.91% | -2.35% | |
| R Class | AACWX | 6.80% | -0.14% | 3/10/21 |
| R6 Class | AACZX | 7.70% | 0.73% | 3/10/21 |
Sales charges include initial sales charges and contingent deferred sales charges (CDSCs), as applicable. A Class shares have a 5.75% maximum initial sales charge and may be subject to a maximum CDSC of 1.00%. The SEC requires that mutual funds provide performance information net of maximum sales charges in all cases where charges could be applied.
A One Choice Target Date Portfolio's target date is the approximate year when investors plan to retire or start withdrawing their money. The principal value of the investment is not guaranteed at any time, including at the target date.
Data presented reflect past performance. Past performance is no guarantee of future results. Current performance may be higher or lower than the performance shown. Total returns for periods less than one year are not annualized. Investment return and principal value will fluctuate, and redemption value may be more or less than original cost. Data assumes reinvestment of dividends and capital gains, and none of the charts reflect the deduction of taxes that a shareholder would pay on fund distributions or the redemption of fund shares. To obtain performance data current to the most recent month end, please call 1-800-345-2021 or visit americancentury.com. For additional information about the funds, please consult the prospectus.
| | | | | | | | | | | | | | |
| Total Returns as of July 31, 2023 |
| | | Average Annual Returns | |
| Ticker
Symbol | 1 year | Since
Inception | Inception
Date |
| One Choice Blend+ 2045 Portfolio |
| Investor Class | AADHX | 8.47% | 0.84% | 3/10/21 |
| S&P Target Date To 2045 Index | — | 11.07% | 3.74% | — |
| I Class | AADJX | 8.69% | 1.04% | 3/10/21 |
| A Class | AADKX | | | 3/10/21 |
| No sales charge | | 8.10% | 0.56% | |
| With sales charge | | 1.88% | -1.90% | |
| R Class | AADLX | 7.83% | 0.32% | 3/10/21 |
| R6 Class | AADMX | 8.74% | 1.15% | 3/10/21 |
Sales charges include initial sales charges and contingent deferred sales charges (CDSCs), as applicable. A Class shares have a 5.75% maximum initial sales charge and may be subject to a maximum CDSC of 1.00%. The SEC requires that mutual funds provide performance information net of maximum sales charges in all cases where charges could be applied.
A One Choice Target Date Portfolio's target date is the approximate year when investors plan to retire or start withdrawing their money. The principal value of the investment is not guaranteed at any time, including at the target date.
Data presented reflect past performance. Past performance is no guarantee of future results. Current performance may be higher or lower than the performance shown. Total returns for periods less than one year are not annualized. Investment return and principal value will fluctuate, and redemption value may be more or less than original cost. Data assumes reinvestment of dividends and capital gains, and none of the charts reflect the deduction of taxes that a shareholder would pay on fund distributions or the redemption of fund shares. To obtain performance data current to the most recent month end, please call 1-800-345-2021 or visit americancentury.com. For additional information about the funds, please consult the prospectus.
| | | | | | | | | | | | | | |
| Total Returns as of July 31, 2023 |
| | | Average Annual Returns | |
| Ticker
Symbol | 1 year | Since
Inception | Inception
Date |
| One Choice Blend+ 2050 Portfolio |
| Investor Class | AADNX | 9.20% | 1.19% | 3/10/21 |
| S&P Target Date To 2050 Index | — | 11.71% | 3.97% | — |
| I Class | AADOX | 9.42% | 1.39% | 3/10/21 |
| A Class | AADPX | | | 3/10/21 |
| No sales charge | | 8.93% | 0.95% | |
| With sales charge | | 2.67% | -1.52% | |
| R Class | AADQX | 8.67% | 0.67% | 3/10/21 |
| R6 Class | AADUX | 9.58% | 1.54% | 3/10/21 |
Sales charges include initial sales charges and contingent deferred sales charges (CDSCs), as applicable. A Class shares have a 5.75% maximum initial sales charge and may be subject to a maximum CDSC of 1.00%. The SEC requires that mutual funds provide performance information net of maximum sales charges in all cases where charges could be applied.
A One Choice Target Date Portfolio's target date is the approximate year when investors plan to retire or start withdrawing their money. The principal value of the investment is not guaranteed at any time, including at the target date.
Data presented reflect past performance. Past performance is no guarantee of future results. Current performance may be higher or lower than the performance shown. Total returns for periods less than one year are not annualized. Investment return and principal value will fluctuate, and redemption value may be more or less than original cost. Data assumes reinvestment of dividends and capital gains, and none of the charts reflect the deduction of taxes that a shareholder would pay on fund distributions or the redemption of fund shares. To obtain performance data current to the most recent month end, please call 1-800-345-2021 or visit americancentury.com. For additional information about the funds, please consult the prospectus.
| | | | | | | | | | | | | | |
| Total Returns as of July 31, 2023 |
| | | Average Annual Returns | |
| Ticker
Symbol | 1 year | Since
Inception | Inception
Date |
| One Choice Blend+ 2055 Portfolio |
| Investor Class | AADVX | 9.69% | 1.40% | 3/10/21 |
| S&P Target Date To 2055 Index | — | 11.80% | 4.05% | — |
| I Class | AADWX | 9.90% | 1.59% | 3/10/21 |
| A Class | AADZX | | | 3/10/21 |
| No sales charge | | 9.54% | 1.16% | |
| With sales charge | | 3.24% | -1.31% | |
| R Class | AAEDX | 9.16% | 0.88% | 3/10/21 |
| R6 Class | AAEEX | 10.17% | 1.80% | 3/10/21 |
Sales charges include initial sales charges and contingent deferred sales charges (CDSCs), as applicable. A Class shares have a 5.75% maximum initial sales charge and may be subject to a maximum CDSC of 1.00%. The SEC requires that mutual funds provide performance information net of maximum sales charges in all cases where charges could be applied.
A One Choice Target Date Portfolio's target date is the approximate year when investors plan to retire or start withdrawing their money. The principal value of the investment is not guaranteed at any time, including at the target date.
Data presented reflect past performance. Past performance is no guarantee of future results. Current performance may be higher or lower than the performance shown. Total returns for periods less than one year are not annualized. Investment return and principal value will fluctuate, and redemption value may be more or less than original cost. Data assumes reinvestment of dividends and capital gains, and none of the charts reflect the deduction of taxes that a shareholder would pay on fund distributions or the redemption of fund shares. To obtain performance data current to the most recent month end, please call 1-800-345-2021 or visit americancentury.com. For additional information about the funds, please consult the prospectus.
| | | | | | | | | | | | | | |
| Total Returns as of July 31, 2023 |
| | | Average Annual Returns | |
| Ticker
Symbol | 1 year | Since
Inception | Inception
Date |
| One Choice Blend+ 2060 Portfolio |
| Investor Class | AAEFX | 10.08% | 1.55% | 3/10/21 |
| S&P Target Date To 2060 Index | — | 12.01% | 4.12% | — |
| I Class | AAEGX | 10.18% | 1.71% | 3/10/21 |
| A Class | AAEHX | | | 3/10/21 |
| No sales charge | | 9.71% | 1.23% | |
| With sales charge | | 3.40% | -1.25% | |
| R Class | AAEIX | 9.43% | 0.99% | 3/10/21 |
| R6 Class | AAEJX | 10.46% | 1.87% | 3/10/21 |
Sales charges include initial sales charges and contingent deferred sales charges (CDSCs), as applicable. A Class shares have a 5.75% maximum initial sales charge and may be subject to a maximum CDSC of 1.00%. The SEC requires that mutual funds provide performance information net of maximum sales charges in all cases where charges could be applied.
A One Choice Target Date Portfolio's target date is the approximate year when investors plan to retire or start withdrawing their money. The principal value of the investment is not guaranteed at any time, including at the target date.
Data presented reflect past performance. Past performance is no guarantee of future results. Current performance may be higher or lower than the performance shown. Total returns for periods less than one year are not annualized. Investment return and principal value will fluctuate, and redemption value may be more or less than original cost. Data assumes reinvestment of dividends and capital gains, and none of the charts reflect the deduction of taxes that a shareholder would pay on fund distributions or the redemption of fund shares. To obtain performance data current to the most recent month end, please call 1-800-345-2021 or visit americancentury.com. For additional information about the funds, please consult the prospectus.
| | | | | | | | | | | | | | |
| Total Returns as of July 31, 2023 |
| | | Average Annual Returns | |
| Ticker
Symbol | 1 year | Since
Inception | Inception
Date |
| One Choice Blend+ 2065 Portfolio |
| Investor Class | AAEKX | 10.06% | 1.76% | 3/10/21 |
| S&P Target Date To 2065+ Index | — | 12.03% | 4.44% | — |
| I Class | AAELX | 10.17% | 1.92% | 3/10/21 |
| A Class | AAEOX | | | 3/10/21 |
| No sales charge | | 9.80% | 1.48% | |
| With sales charge | | 3.49% | -1.00% | |
| R Class | AAEUX | 9.53% | 1.24% | 3/10/21 |
| R6 Class | AAEVX | 10.33% | 2.08% | 3/10/21 |
Sales charges include initial sales charges and contingent deferred sales charges (CDSCs), as applicable. A Class shares have a 5.75% maximum initial sales charge and may be subject to a maximum CDSC of 1.00%. The SEC requires that mutual funds provide performance information net of maximum sales charges in all cases where charges could be applied.
A One Choice Target Date Portfolio's target date is the approximate year when investors plan to retire or start withdrawing their money. The principal value of the investment is not guaranteed at any time, including at the target date.
Data presented reflect past performance. Past performance is no guarantee of future results. Current performance may be higher or lower than the performance shown. Total returns for periods less than one year are not annualized. Investment return and principal value will fluctuate, and redemption value may be more or less than original cost. Data assumes reinvestment of dividends and capital gains, and none of the charts reflect the deduction of taxes that a shareholder would pay on fund distributions or the redemption of fund shares. To obtain performance data current to the most recent month end, please call 1-800-345-2021 or visit americancentury.com. For additional information about the funds, please consult the prospectus.
| | |
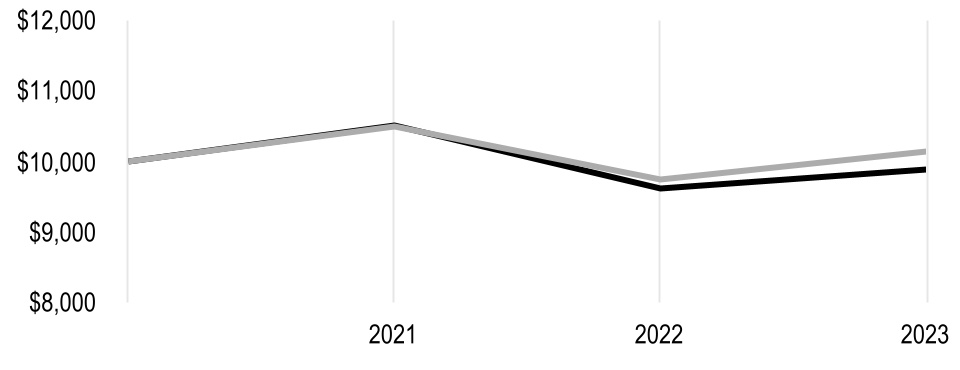
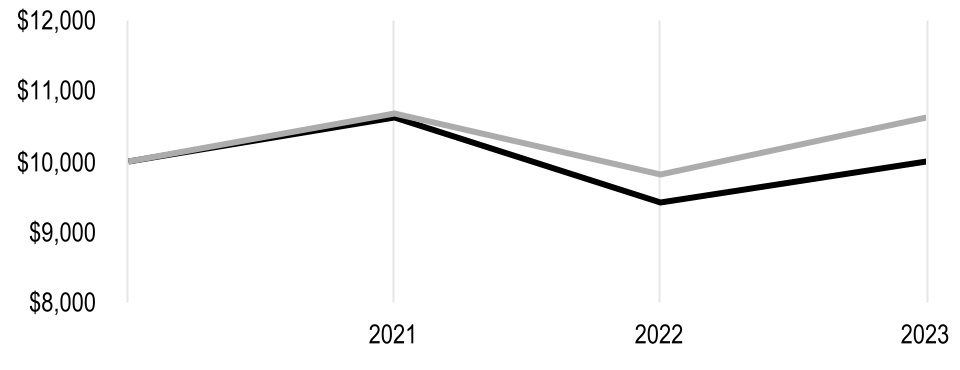
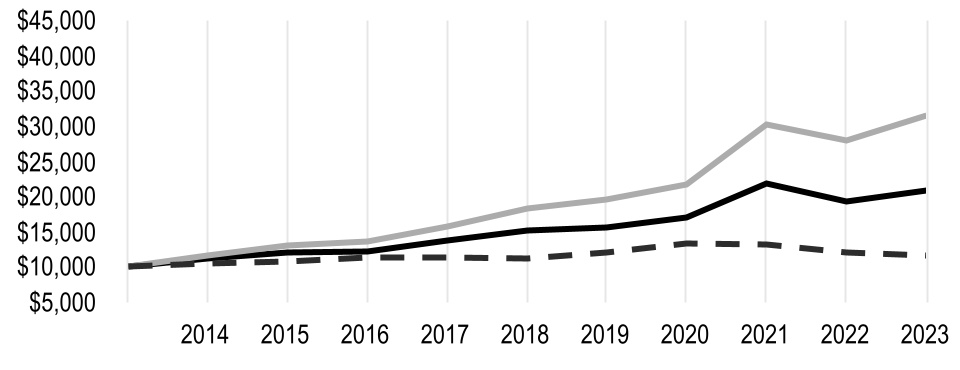
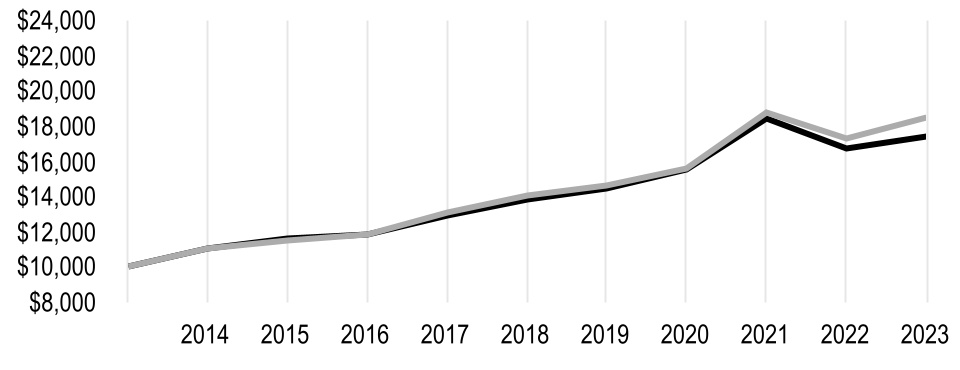
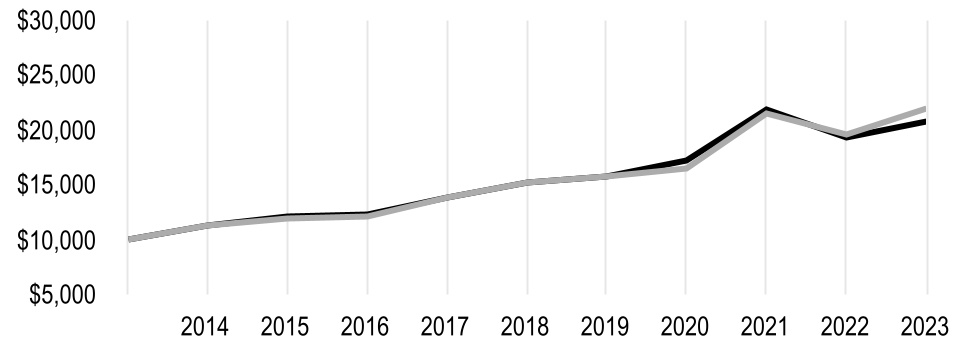
| Growth of $10,000 Over Life of One Choice Blend+ 2015 Portfolio — Investor Class |
| $10,000 investment made March 10, 2021 |
| Performance for other share classes will vary due to differences in fee structure. |
| | | | | |
| Value on July 31, 2023 |
| Investor Class — $9,876 |
|
| S&P Target Date 2015 Index — $10,138 |
|
Ending value of Investor Class would have been lower if a portion of the fees had not been waived.
| | |
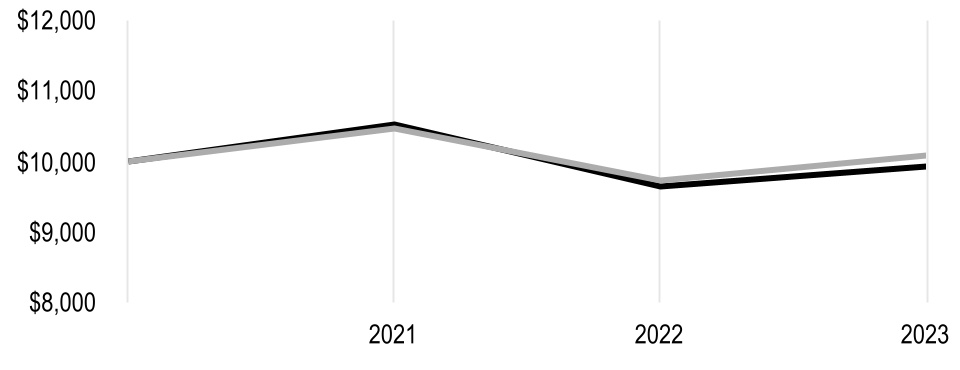
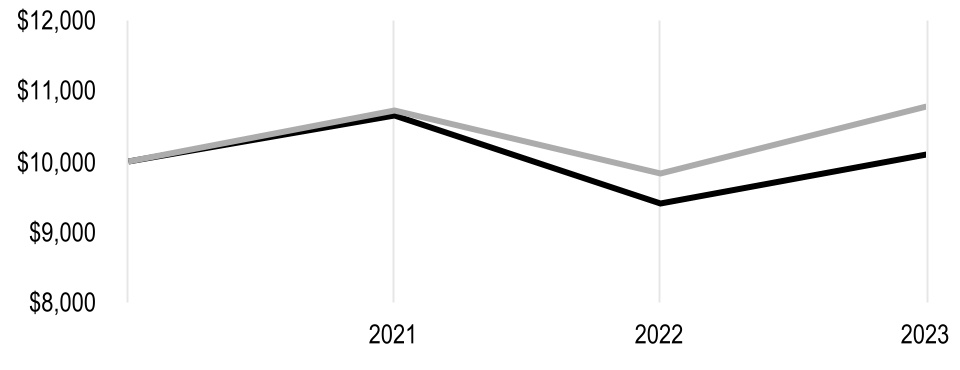
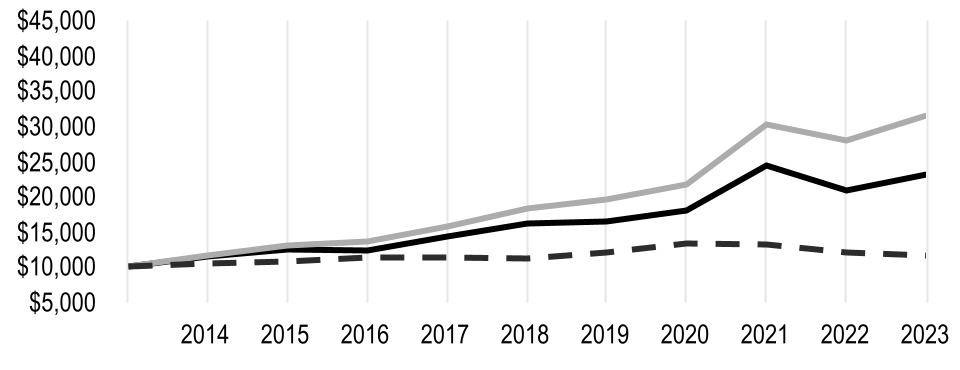
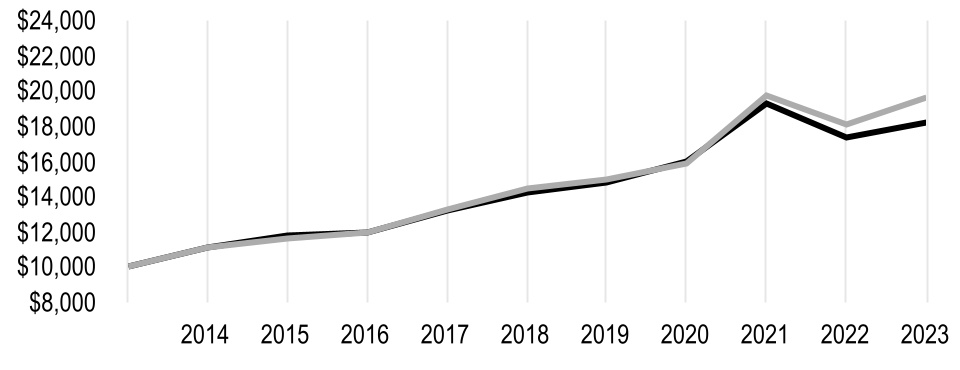
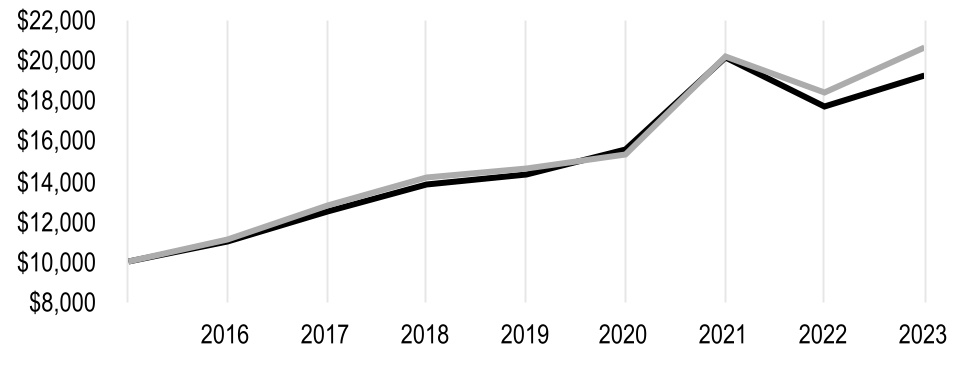
| Growth of $10,000 Over Life of One Choice Blend+ 2020 Portfolio — Investor Class |
| $10,000 investment made March 10, 2021 |
| Performance for other share classes will vary due to differences in fee structure. |
| | | | | |
| Value on July 31, 2023 |
| Investor Class — $9,922 |
|
| S&P Target Date To 2020 Index — $10,071 |
|
Ending value of Investor Class would have been lower if a portion of the fees had not been waived.
A One Choice Target Date Portfolio's target date is the approximate year when investors plan to retire or start withdrawing their money. The principal value of the investment is not guaranteed at any time, including at the target date.
Data presented reflect past performance. Past performance is no guarantee of future results. Current performance may be higher or lower than the performance shown. Total returns for periods less than one year are not annualized. Investment return and principal value will fluctuate, and redemption value may be more or less than original cost. Data assumes reinvestment of dividends and capital gains, and none of the charts reflect the deduction of taxes that a shareholder would pay on fund distributions or the redemption of fund shares. To obtain performance data current to the most recent month end, please call 1-800-345-2021 or visit americancentury.com. For additional information about the funds, please consult the prospectus.
| | |
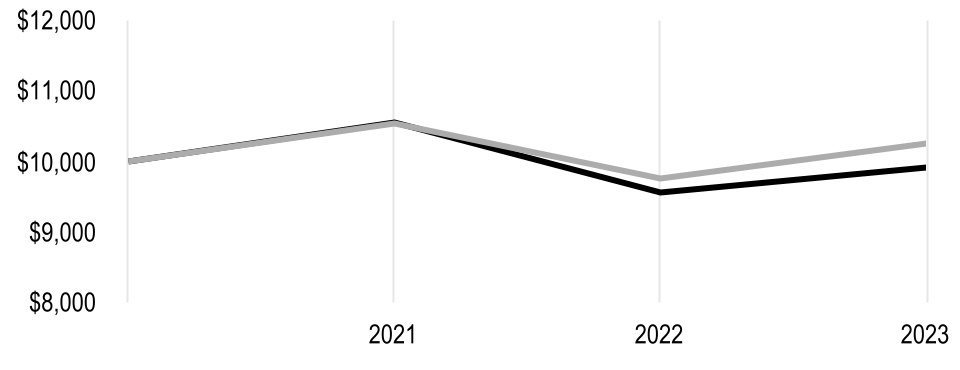
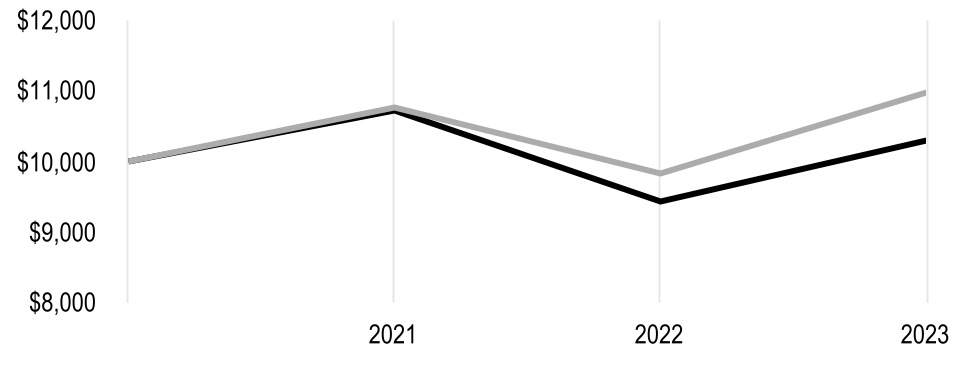
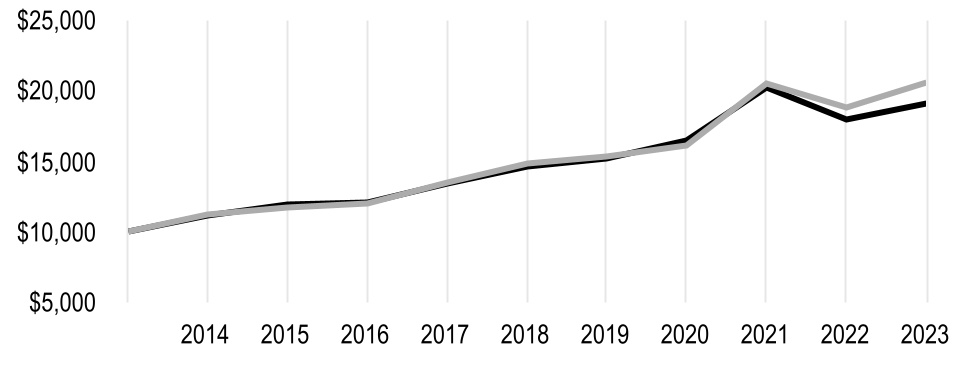
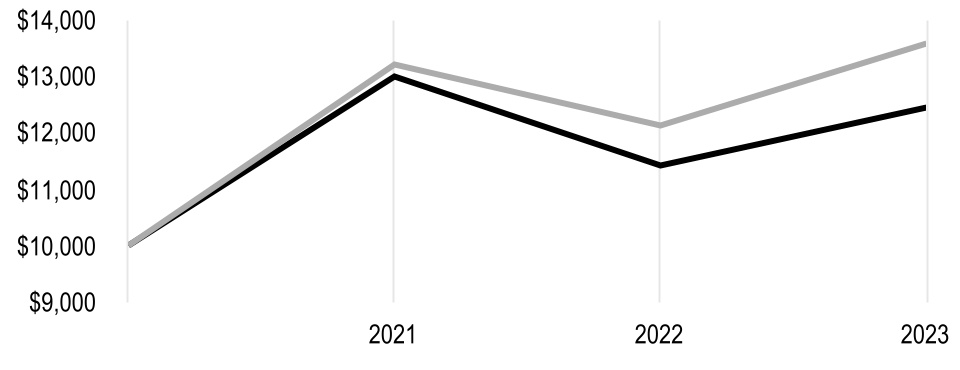
| Growth of $10,000 Over Life of One Choice Blend+ 2025 Portfolio — Investor Class |
| $10,000 investment made March 10, 2021 |
| Performance for other share classes will vary due to differences in fee structure. |
| | | | | |
| Value on July 31, 2023 |
| Investor Class — $9,913 |
|
| S&P Target Date To 2025 Index — $10,249 |
|
Ending value of Investor Class would have been lower if a portion of the fees had not been waived.
| | |
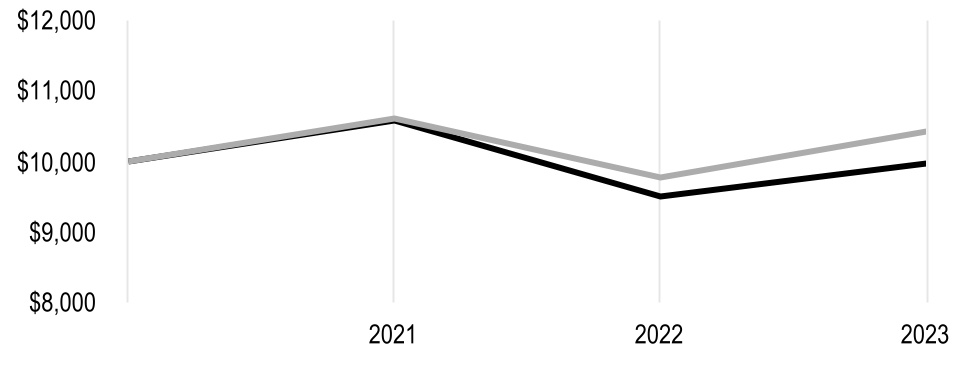
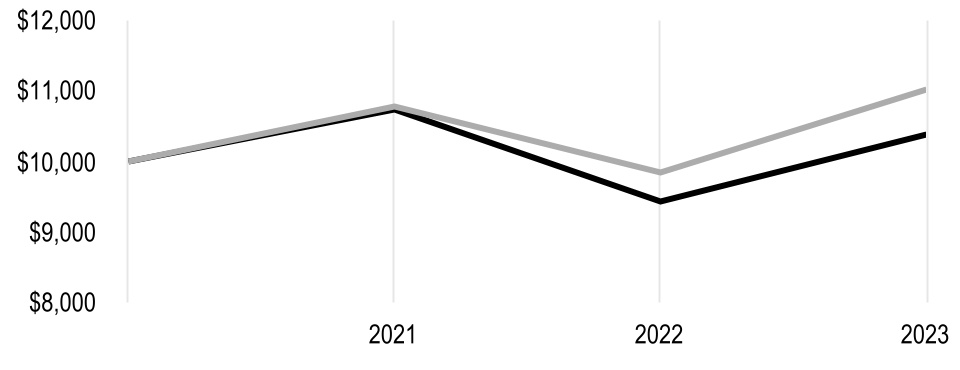
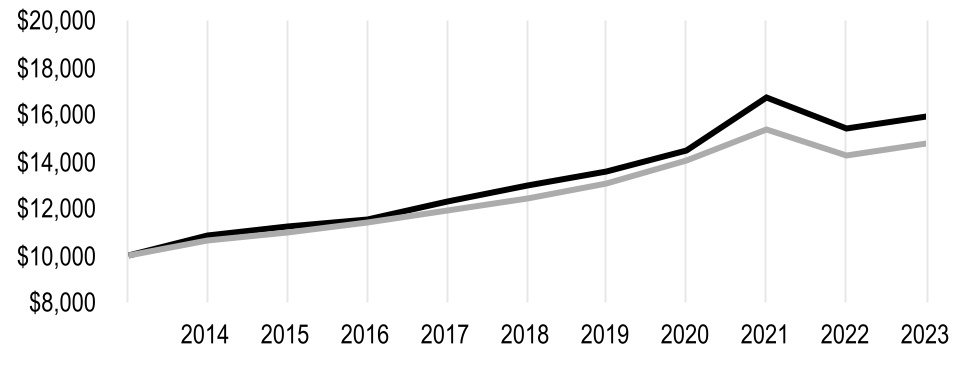
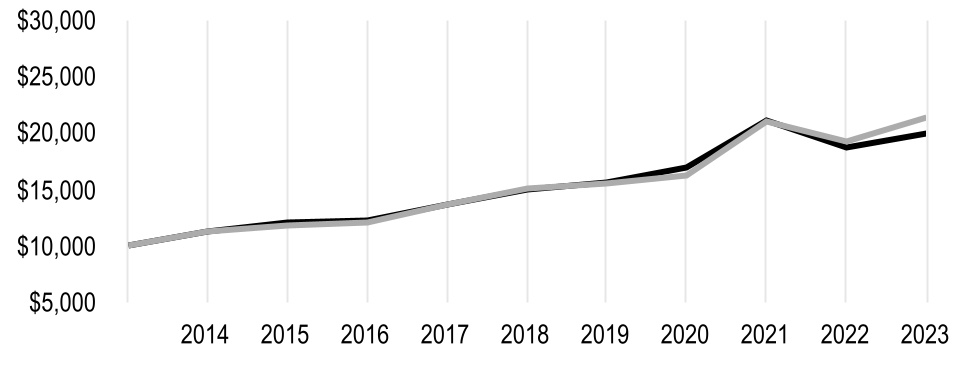
| Growth of $10,000 Over Life of One Choice Blend+ 2030 Portfolio — Investor Class |
| $10,000 investment made March 10, 2021 |
| Performance for other share classes will vary due to differences in fee structure. |
| | | | | |
| Value on July 31, 2023 |
| Investor Class — $9,971 |
|
| S&P Target Date To 2030 Index — $10,423 |
|
Ending value of Investor Class would have been lower if a portion of the fees had not been waived.
A One Choice Target Date Portfolio's target date is the approximate year when investors plan to retire or start withdrawing their money. The principal value of the investment is not guaranteed at any time, including at the target date.
Data presented reflect past performance. Past performance is no guarantee of future results. Current performance may be higher or lower than the performance shown. Total returns for periods less than one year are not annualized. Investment return and principal value will fluctuate, and redemption value may be more or less than original cost. Data assumes reinvestment of dividends and capital gains, and none of the charts reflect the deduction of taxes that a shareholder would pay on fund distributions or the redemption of fund shares. To obtain performance data current to the most recent month end, please call 1-800-345-2021 or visit americancentury.com. For additional information about the funds, please consult the prospectus.
| | |
| Growth of $10,000 Over Life of One Choice Blend+ 2035 Portfolio — Investor Class |
| $10,000 investment made March 10, 2021 |
| Performance for other share classes will vary due to differences in fee structure. |
| | | | | |
| Value on July 31, 2023 |
| Investor Class — $9,999 |
|
| S&P Target Date To 2035 Index — $10,610 |
|
Ending value of Investor Class would have been lower if a portion of the fees had not been waived.
| | |
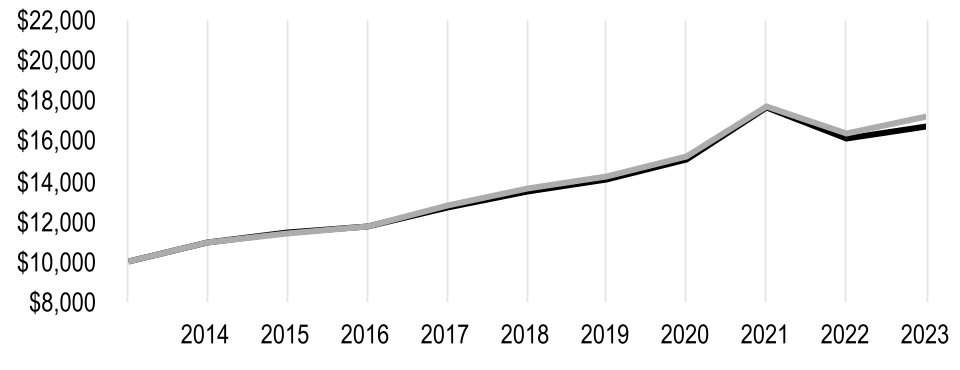
| Growth of $10,000 Over Life of One Choice Blend+ 2040 Portfolio — Investor Class |
| $10,000 investment made March 10, 2021 |
| Performance for other share classes will vary due to differences in fee structure. |
| | | | | |
| Value on July 31, 2023 |
| Investor Class — $10,089 |
|
| S&P Target Date To 2040 Index — $10,767 |
|
A One Choice Target Date Portfolio's target date is the approximate year when investors plan to retire or start withdrawing their money. The principal value of the investment is not guaranteed at any time, including at the target date.
Data presented reflect past performance. Past performance is no guarantee of future results. Current performance may be higher or lower than the performance shown. Total returns for periods less than one year are not annualized. Investment return and principal value will fluctuate, and redemption value may be more or less than original cost. Data assumes reinvestment of dividends and capital gains, and none of the charts reflect the deduction of taxes that a shareholder would pay on fund distributions or the redemption of fund shares. To obtain performance data current to the most recent month end, please call 1-800-345-2021 or visit americancentury.com. For additional information about the funds, please consult the prospectus.
| | |
| Growth of $10,000 Over Life of One Choice Blend+ 2045 Portfolio — Investor Class |
| $10,000 investment made March 10, 2021 |
| Performance for other share classes will vary due to differences in fee structure. |
| | | | | |
| Value on July 31, 2023 |
| Investor Class — $10,201 |
|
| S&P Target Date To 2045 Index — $10,918 |
|
| | |
| Growth of $10,000 Over Life of One Choice Blend+ 2050 Portfolio — Investor Class |
| $10,000 investment made March 10, 2021 |
| Performance for other share classes will vary due to differences in fee structure. |
| | | | | |
| Value on July 31, 2023 |
| Investor Class — $10,286 |
|
| S&P Target Date To 2050 Index — $10,976 |
|
A One Choice Target Date Portfolio's target date is the approximate year when investors plan to retire or start withdrawing their money. The principal value of the investment is not guaranteed at any time, including at the target date.
Data presented reflect past performance. Past performance is no guarantee of future results. Current performance may be higher or lower than the performance shown. Total returns for periods less than one year are not annualized. Investment return and principal value will fluctuate, and redemption value may be more or less than original cost. Data assumes reinvestment of dividends and capital gains, and none of the charts reflect the deduction of taxes that a shareholder would pay on fund distributions or the redemption of fund shares. To obtain performance data current to the most recent month end, please call 1-800-345-2021 or visit americancentury.com. For additional information about the funds, please consult the prospectus.
| | |
| Growth of $10,000 Over Life of One Choice Blend+ 2055 Portfolio — Investor Class |
| $10,000 investment made March 10, 2021 |
| Performance for other share classes will vary due to differences in fee structure. |
| | | | | |
| Value on July 31, 2023 |
| Investor Class — $10,337 |
|
| S&P Target Date To 2055 Index — $10,995 |
|
| | |
| Growth of $10,000 Over Life of One Choice Blend+ 2060 Portfolio — Investor Class |
| $10,000 investment made March 10, 2021 |
| Performance for other share classes will vary due to differences in fee structure. |
| | | | | |
| Value on July 31, 2023 |
| Investor Class — $10,375 |
|
| S&P Target Date To 2060 Index — $11,013 |
|
A One Choice Target Date Portfolio's target date is the approximate year when investors plan to retire or start withdrawing their money. The principal value of the investment is not guaranteed at any time, including at the target date.
Data presented reflect past performance. Past performance is no guarantee of future results. Current performance may be higher or lower than the performance shown. Total returns for periods less than one year are not annualized. Investment return and principal value will fluctuate, and redemption value may be more or less than original cost. Data assumes reinvestment of dividends and capital gains, and none of the charts reflect the deduction of taxes that a shareholder would pay on fund distributions or the redemption of fund shares. To obtain performance data current to the most recent month end, please call 1-800-345-2021 or visit americancentury.com. For additional information about the funds, please consult the prospectus.
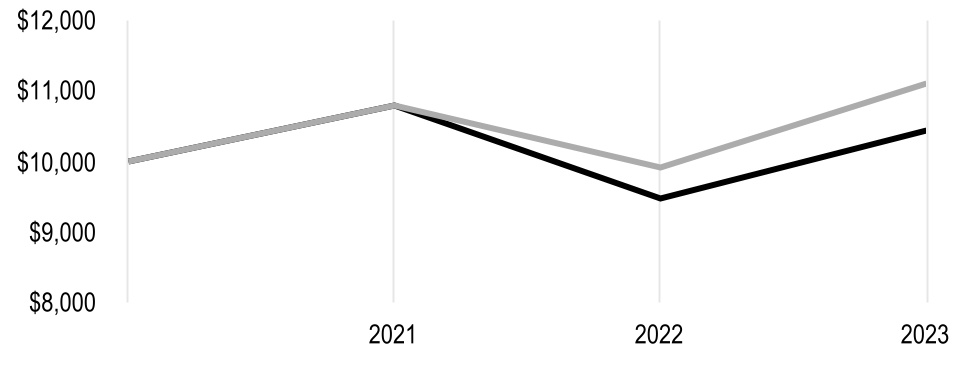
| | |
| Growth of $10,000 Over Life of One Choice Blend+ 2065 Portfolio — Investor Class |
| $10,000 investment made March 10, 2021 |
| Performance for other share classes will vary due to differences in fee structure. |
| | | | | |
| Value on July 31, 2023 |
| Investor Class — $10,426 |
|
| S&P Target Date To 2065+ Index — $11,094 |
|
A One Choice Target Date Portfolio's target date is the approximate year when investors plan to retire or start withdrawing their money. The principal value of the investment is not guaranteed at any time, including at the target date.
Data presented reflect past performance. Past performance is no guarantee of future results. Current performance may be higher or lower than the performance shown. Total returns for periods less than one year are not annualized. Investment return and principal value will fluctuate, and redemption value may be more or less than original cost. Data assumes reinvestment of dividends and capital gains, and none of the charts reflect the deduction of taxes that a shareholder would pay on fund distributions or the redemption of fund shares. To obtain performance data current to the most recent month end, please call 1-800-345-2021 or visit americancentury.com. For additional information about the funds, please consult the prospectus.
| | | | | | | | | | | | | | | | | |
| Total Annual Fund Operating Expenses |
| Investor Class | I
Class | A
Class | R
Class | R6
Class |
| One Choice Blend+ 2015 Portfolio | 0.60% | 0.40% | 0.85% | 1.10% | 0.25% |
| One Choice Blend+ 2020 Portfolio | 0.60% | 0.40% | 0.85% | 1.10% | 0.25% |
| One Choice Blend+ 2025 Portfolio | 0.60% | 0.40% | 0.85% | 1.10% | 0.25% |
| One Choice Blend+ 2030 Portfolio | 0.59% | 0.39% | 0.84% | 1.09% | 0.24% |
| One Choice Blend+ 2035 Portfolio | 0.59% | 0.39% | 0.84% | 1.09% | 0.24% |
| One Choice Blend+ 2040 Portfolio | 0.58% | 0.38% | 0.83% | 1.08% | 0.23% |
| One Choice Blend+ 2045 Portfolio | 0.58% | 0.38% | 0.83% | 1.08% | 0.23% |
| One Choice Blend+ 2050 Portfolio | 0.58% | 0.38% | 0.83% | 1.08% | 0.23% |
| One Choice Blend+ 2055 Portfolio | 0.58% | 0.38% | 0.83% | 1.08% | 0.23% |
| One Choice Blend+ 2060 Portfolio | 0.58% | 0.38% | 0.83% | 1.08% | 0.23% |
| One Choice Blend+ 2065 Portfolio | 0.58% | 0.38% | 0.83% | 1.08% | 0.23% |
The total annual fund operating expenses shown is as stated in the fund's prospectus current as of the date of this report. The prospectus may vary from the expense ratio shown elsewhere in this report because it is based on a different time period, includes acquired fund fees and expenses, and, if applicable, does not include fee waivers or expense reimbursements.
A One Choice Target Date Portfolio's target date is the approximate year when investors plan to retire or start withdrawing their money. The principal value of the investment is not guaranteed at any time, including at the target date.
Data presented reflect past performance. Past performance is no guarantee of future results. Current performance may be higher or lower than the performance shown. Total returns for periods less than one year are not annualized. Investment return and principal value will fluctuate, and redemption value may be more or less than original cost. Data assumes reinvestment of dividends and capital gains, and none of the charts reflect the deduction of taxes that a shareholder would pay on fund distributions or the redemption of fund shares. To obtain performance data current to the most recent month end, please call 1-800-345-2021 or visit americancentury.com. For additional information about the funds, please consult the prospectus.
Portfolio Managers: Richard Weiss, Scott Wilson, Radu Gabudean, Vidya Rajappa and Brian Garbe
John Donner left the management team and Brian Garbe joined during the reporting period.
Performance Summary
Each of the One Choice® Blend+ Portfolios (the Portfolios) gained in value during the fiscal year ended July 31, 2023, ranging from 2.78%* for the One Choice Blend+ 2015 Portfolio to 10.08% for the One Choice Blend+ 2060 Portfolio. See pages 3-19 for more detailed performance information. The period was characterized by a hawkish approach in U.S. Federal Reserve (Fed) policy that impacted rates, the economy and markets. As interest rates rose and economic growth slowed, global bonds lost value and global equity markets sold off initially before both reversed course later in the period.
Because of the Portfolios’ strategic exposure to a variety of asset classes, a review of the financial markets helps explain much of their performance.
Market Overview
Global stocks rose over the past 12 months. After falling sharply in the second half of 2022 due to rising inflation, the Fed’s interest rate increases and the ongoing war in Ukraine, stocks staged a strong rebound from October 2022 through period-end. They benefited as inflation eased, concerns about a possible recession faded and corporate earnings mostly beat consensus expectations. Bonds finished down, having declined substantially early in the 12-month period before rebounding early in 2023. Nevertheless, stronger-than-expected economic data and the debt ceiling crisis weighed on U.S. government bonds in particular.
Portfolio Information
Each One Choice Blend+ Portfolio is a fund of funds that invests in American Century Investments mutual funds and exchange-traded funds and Avantis Investors® mutual funds to achieve its investment objective and target asset allocation. The Schedules of Investments within this report provide underlying fund allocations for each Portfolio. A Portfolio’s target date is the approximate year when investors plan to retire and likely would stop making new investments in the fund. There is no guarantee that an investment in any of the funds will provide adequate income at or through an investor’s retirement.
Each target-date Portfolio seeks the highest total return consistent with its asset mix. Over time, the asset mix and weightings are adjusted to be more conservative. In general, as the target year approaches, each Portfolio’s allocation becomes more conservative by decreasing the allocation to stock funds and increasing the allocation to bond and short-term investments until reaching its most conservative allocation approximately five years after the target date, when its target asset mix becomes fixed.
Portfolio Performance
The Portfolios gained in value against a shifting backdrop for financial markets. Virtually all equity holdings across the Portfolios delivered positive absolute returns, led by Non-U.S. Intrinsic Value Fund, International Value Fund, Growth Fund and Focused Dynamic Growth Fund. Global Real Estate Fund was the only equity holding with negative returns. On the bond side, several funds detracted on an absolute basis, most notably Inflation-Adjusted Bond Fund and Avantis Core Fixed Income Fund.
*All fund returns referenced in this commentary are for Investor Class shares. Fund returns would have been lower if a portion of the fees had not been waived. Performance for other share classes will vary due to differences in fee structure; when Investor Class performance exceeds that of the fund’s benchmark, other share classes may not. See pages 3-13 for returns for all share classes.
Conversely, Emerging Markets Debt Fund and High Income Fund posted positive returns. Focused International Growth Fund and International Small-Mid Cap Fund underperformed their benchmarks by the widest margin, while Non-U.S. Intrinsic Value Fund and Avantis U.S. Small Cap Value Fund performed best on a relative basis.
Dynamic Risk Management Process
As of July 31, the long-term strategic glide path weightings in the in- and near-retirement vintages of the One Choice Blend+ Portfolios remained conservatively positioned. Specifically, equity allocations for 2015 through 2045 vintages were moderately underweight equities reflecting concerns over looming recession risks.
| | |
| Portfolio Characteristics |
| | | | | | | | | | | | | | |
| Portfolio Composition as a % of net assets as of July 31, 2023 |
| One Choice
Blend+ 2015
Portfolio | One Choice
Blend+ 2020
Portfolio | One Choice
Blend+ 2025
Portfolio | One Choice
Blend+ 2030
Portfolio |
| Domestic Fixed Income Funds | 49.1% | 48.2% | 43.2% | 36.2% |
| Domestic Equity Funds | 27.3% | 27.9% | 31.5% | 36.8% |
| International Fixed Income Funds | 14.0% | 13.9% | 13.2% | 11.9% |
| International Equity Funds | 9.6% | 10.0% | 12.1% | 15.1% |
| Other Assets and Liabilities | — | — | — | — |
| | | | | | | | | | | | | | |
| One Choice
Blend+ 2035
Portfolio | One Choice
Blend+ 2040
Portfolio | One Choice
Blend+ 2045
Portfolio | One Choice
Blend+ 2050
Portfolio |
| Domestic Fixed Income Funds | 28.9% | 22.5% | 16.6% | 11.8% |
| Domestic Equity Funds | 42.2% | 47.2% | 53.0% | 57.4% |
| International Fixed Income Funds | 10.3% | 8.5% | 6.2% | 4.4% |
| International Equity Funds | 18.6% | 21.8% | 24.2% | 26.4% |
| Other Assets and Liabilities | —(1) | — | — | — |
| | | | | | | | | | | |
| One Choice
Blend+ 2055
Portfolio | One Choice
Blend+ 2060
Portfolio | One Choice
Blend+ 2065
Portfolio |
| Domestic Fixed Income Funds | 9.1% | 7.2% | 7.2% |
| Domestic Equity Funds | 59.9% | 61.8% | 61.7% |
| International Fixed Income Funds | 3.4% | 2.7% | 2.7% |
| International Equity Funds | 27.6% | 28.3% | 28.4% |
| Other Assets and Liabilities | — | — | —(1) |
(1)Category is less than 0.05% of total net assets.
Fund shareholders may incur two types of costs: (1) transaction costs, including sales charges (loads) on purchase payments and redemption/exchange fees; and (2) ongoing costs, including management fees; distribution and service (12b-1) fees; and other fund expenses. This example is intended to help you understand your ongoing costs (in dollars) of investing in your fund and to compare these costs with the ongoing cost of investing in other mutual funds.
The example is based on an investment of $1,000 made at the beginning of the period and held for the entire period from February 1, 2023 to July 31, 2023.
Actual Expenses
The table provides information about actual account values and actual expenses for each class. You may use the information, together with the amount you invested, to estimate the expenses that you paid over the period. First, identify the share class you own. Then simply divide your account value by $1,000 (for example, an $8,600 account value divided by $1,000 = 8.6), then multiply the result by the number under the heading “Expenses Paid During Period” to estimate the expenses you paid on your account during this period.
If you hold Investor Class shares of any American Century Investments mutual fund, or I Class shares of the American Century Diversified Bond Fund, in an American Century Investments account (i.e., not through a financial intermediary or employer-sponsored retirement plan account), American Century Investments may charge you a $25 annual account maintenance fee if the value of those shares is less than $10,000. We will redeem shares automatically in one of your accounts to pay the $25 fee. In determining your total eligible investment amount, we will include your investments in all personal accounts (including American Century Investments brokerage accounts) registered under your Social Security number. Personal accounts include individual accounts, joint accounts, UGMA/UTMA accounts, personal trusts, Coverdell Education Savings Accounts and IRAs (including traditional, Roth, Rollover, SEP-, SARSEP- and SIMPLE-IRAs), and certain other retirement accounts. If you have only business, business retirement, employer-sponsored or American Century Investments brokerage accounts, you are currently not subject to this fee. If you are subject to the account maintenance fee, your account value could be reduced by the fee amount.
Hypothetical Example for Comparison Purposes
The table also provides information about hypothetical account values and hypothetical expenses based on the actual expense ratio of each class of your fund and an assumed rate of return of 5% per year before expenses, which is not the actual return of a fund’s share class. The hypothetical account values and expenses may not be used to estimate the actual ending account balance or expenses you paid for the period. You may use this information to compare the ongoing costs of investing in your fund and other funds. To do so, compare this 5% hypothetical example with the 5% hypothetical examples that appear in the shareholder reports of the other funds.
Please note that the expenses shown in the table are meant to highlight your ongoing costs only and do not reflect any transactional costs, such as sales charges (loads) or redemption/exchange fees. Therefore, the table is useful in comparing ongoing costs only, and will not help you determine the relative total costs of owning different funds. In addition, if these transactional costs were included, your costs would have been higher.
| | | | | | | | | | | | | | |
| Beginning
Account Value
2/1/23 | Ending
Account Value
7/31/23 | Expenses Paid During Period(1) 2/1/23 - 7/31/23 | Annualized Expense Ratio(1) |
| One Choice Blend+ 2015 Portfolio |
| Actual | | | | |
| Investor Class | $1,000 | $1,025.10 | $2.86 | 0.57% |
| I Class | $1,000 | $1,025.10 | $1.86 | 0.37% |
| A Class | $1,000 | $1,022.90 | $4.11 | 0.82% |
| R Class | $1,000 | $1,021.80 | $5.36 | 1.07% |
| R6 Class | $1,000 | $1,026.20 | $1.11 | 0.22% |
| Hypothetical | | | | |
| Investor Class | $1,000 | $1,021.97 | $2.86 | 0.57% |
| I Class | $1,000 | $1,022.96 | $1.86 | 0.37% |
| A Class | $1,000 | $1,020.73 | $4.11 | 0.82% |
| R Class | $1,000 | $1,019.49 | $5.36 | 1.07% |
| R6 Class | $1,000 | $1,023.70 | $1.10 | 0.22% |
| One Choice Blend+ 2020 Portfolio |
| Actual | | | | |
| Investor Class | $1,000 | $1,025.00 | $2.86 | 0.57% |
| I Class | $1,000 | $1,025.00 | $1.86 | 0.37% |
| A Class | $1,000 | $1,023.90 | $4.11 | 0.82% |
| R Class | $1,000 | $1,021.80 | $5.36 | 1.07% |
| R6 Class | $1,000 | $1,026.10 | $1.11 | 0.22% |
| Hypothetical | | | | |
| Investor Class | $1,000 | $1,021.97 | $2.86 | 0.57% |
| I Class | $1,000 | $1,022.96 | $1.86 | 0.37% |
| A Class | $1,000 | $1,020.73 | $4.11 | 0.82% |
| R Class | $1,000 | $1,019.49 | $5.36 | 1.07% |
| R6 Class | $1,000 | $1,023.70 | $1.10 | 0.22% |
| One Choice Blend+ 2025 Portfolio |
| Actual | | | | |
| Investor Class | $1,000 | $1,029.70 | $2.87 | 0.57% |
| I Class | $1,000 | $1,030.80 | $1.86 | 0.37% |
| A Class | $1,000 | $1,028.60 | $4.12 | 0.82% |
| R Class | $1,000 | $1,026.40 | $5.38 | 1.07% |
| R6 Class | $1,000 | $1,031.90 | $1.11 | 0.22% |
| Hypothetical | | | | |
| Investor Class | $1,000 | $1,021.97 | $2.86 | 0.57% |
| I Class | $1,000 | $1,022.96 | $1.86 | 0.37% |
| A Class | $1,000 | $1,020.73 | $4.11 | 0.82% |
| R Class | $1,000 | $1,019.49 | $5.36 | 1.07% |
| R6 Class | $1,000 | $1,023.70 | $1.10 | 0.22% |
(1)Expenses are equal to the class's annualized expense ratio listed in the table above, multiplied by the average account value over the period, multiplied by 181, the number of days in the most recent fiscal half-year, divided by 365, to reflect the one-half year period. Annualized expense ratio reflects actual expenses, including any applicable fee waivers or expense reimbursements and excluding any acquired fund fees and expenses.
| | | | | | | | | | | | | | |
| Beginning
Account Value
2/1/23 | Ending
Account Value
7/31/23 | Expenses Paid During Period(1) 2/1/23 - 7/31/23 | Annualized Expense Ratio(1) |
| One Choice Blend+ 2030 Portfolio |
| Actual | | | | |
| Investor Class | $1,000 | $1,036.40 | $2.93 | 0.58% |
| I Class | $1,000 | $1,037.50 | $1.92 | 0.38% |
| A Class | $1,000 | $1,035.30 | $4.19 | 0.83% |
| R Class | $1,000 | $1,033.10 | $5.44 | 1.08% |
| R6 Class | $1,000 | $1,038.60 | $1.16 | 0.23% |
| Hypothetical | | | | |
| Investor Class | $1,000 | $1,021.92 | $2.91 | 0.58% |
| I Class | $1,000 | $1,022.91 | $1.91 | 0.38% |
| A Class | $1,000 | $1,020.68 | $4.16 | 0.83% |
| R Class | $1,000 | $1,019.44 | $5.41 | 1.08% |
| R6 Class | $1,000 | $1,023.65 | $1.15 | 0.23% |
| One Choice Blend+ 2035 Portfolio |
| Actual | | | | |
| Investor Class | $1,000 | $1,042.10 | $2.94 | 0.58% |
| I Class | $1,000 | $1,043.20 | $1.93 | 0.38% |
| A Class | $1,000 | $1,041.00 | $4.20 | 0.83% |
| R Class | $1,000 | $1,038.80 | $5.46 | 1.08% |
| R6 Class | $1,000 | $1,044.30 | $1.17 | 0.23% |
| Hypothetical | | | | |
| Investor Class | $1,000 | $1,021.92 | $2.91 | 0.58% |
| I Class | $1,000 | $1,022.91 | $1.91 | 0.38% |
| A Class | $1,000 | $1,020.68 | $4.16 | 0.83% |
| R Class | $1,000 | $1,019.44 | $5.41 | 1.08% |
| R6 Class | $1,000 | $1,023.65 | $1.15 | 0.23% |
| One Choice Blend+ 2040 Portfolio |
| Actual | | | | |
| Investor Class | $1,000 | $1,047.40 | $2.94 | 0.58% |
| I Class | $1,000 | $1,048.50 | $1.93 | 0.38% |
| A Class | $1,000 | $1,045.20 | $4.21 | 0.83% |
| R Class | $1,000 | $1,044.10 | $5.47 | 1.08% |
| R6 Class | $1,000 | $1,049.60 | $1.17 | 0.23% |
| Hypothetical | | | | |
| Investor Class | $1,000 | $1,021.92 | $2.91 | 0.58% |
| I Class | $1,000 | $1,022.91 | $1.91 | 0.38% |
| A Class | $1,000 | $1,020.68 | $4.16 | 0.83% |
| R Class | $1,000 | $1,019.44 | $5.41 | 1.08% |
| R6 Class | $1,000 | $1,023.65 | $1.15 | 0.23% |
(1)Expenses are equal to the class's annualized expense ratio listed in the table above, multiplied by the average account value over the period, multiplied by 181, the number of days in the most recent fiscal half-year, divided by 365, to reflect the one-half year period. Annualized expense ratio reflects actual expenses, including any applicable fee waivers or expense reimbursements and excluding any acquired fund fees and expenses.
| | | | | | | | | | | | | | |
| Beginning
Account Value
2/1/23 | Ending
Account Value
7/31/23 | Expenses Paid During Period(1) 2/1/23 - 7/31/23 | Annualized Expense Ratio(1) |
| One Choice Blend+ 2045 Portfolio |
| Actual | | | | |
| Investor Class | $1,000 | $1,052.50 | $2.95 | 0.58% |
| I Class | $1,000 | $1,053.60 | $1.93 | 0.38% |
| A Class | $1,000 | $1,051.50 | $4.22 | 0.83% |
| R Class | $1,000 | $1,050.40 | $5.49 | 1.08% |
| R6 Class | $1,000 | $1,053.60 | $1.17 | 0.23% |
| Hypothetical | | | | |
| Investor Class | $1,000 | $1,021.92 | $2.91 | 0.58% |
| I Class | $1,000 | $1,022.91 | $1.91 | 0.38% |
| A Class | $1,000 | $1,020.68 | $4.16 | 0.83% |
| R Class | $1,000 | $1,019.44 | $5.41 | 1.08% |
| R6 Class | $1,000 | $1,023.65 | $1.15 | 0.23% |
| One Choice Blend+ 2050 Portfolio |
| Actual | | | | |
| Investor Class | $1,000 | $1,056.70 | $2.96 | 0.58% |
| I Class | $1,000 | $1,057.80 | $1.94 | 0.38% |
| A Class | $1,000 | $1,055.60 | $4.23 | 0.83% |
| R Class | $1,000 | $1,053.40 | $5.50 | 1.08% |
| R6 Class | $1,000 | $1,058.90 | $1.17 | 0.23% |
| Hypothetical | | | | |
| Investor Class | $1,000 | $1,021.92 | $2.91 | 0.58% |
| I Class | $1,000 | $1,022.91 | $1.91 | 0.38% |
| A Class | $1,000 | $1,020.68 | $4.16 | 0.83% |
| R Class | $1,000 | $1,019.44 | $5.41 | 1.08% |
| R6 Class | $1,000 | $1,023.65 | $1.15 | 0.23% |
| One Choice Blend+ 2055 Portfolio |
| Actual | | | | |
| Investor Class | $1,000 | $1,060.00 | $2.96 | 0.58% |
| I Class | $1,000 | $1,061.10 | $1.94 | 0.38% |
| A Class | $1,000 | $1,059.00 | $4.24 | 0.83% |
| R Class | $1,000 | $1,056.80 | $5.51 | 1.08% |
| R6 Class | $1,000 | $1,062.20 | $1.18 | 0.23% |
| Hypothetical | | | | |
| Investor Class | $1,000 | $1,021.92 | $2.91 | 0.58% |
| I Class | $1,000 | $1,022.91 | $1.91 | 0.38% |
| A Class | $1,000 | $1,020.68 | $4.16 | 0.83% |
| R Class | $1,000 | $1,019.44 | $5.41 | 1.08% |
| R6 Class | $1,000 | $1,023.65 | $1.15 | 0.23% |
(1)Expenses are equal to the class's annualized expense ratio listed in the table above, multiplied by the average account value over the period, multiplied by 181, the number of days in the most recent fiscal half-year, divided by 365, to reflect the one-half year period. Annualized expense ratio reflects actual expenses, including any applicable fee waivers or expense reimbursements and excluding any acquired fund fees and expenses.
| | | | | | | | | | | | | | |
| Beginning
Account Value
2/1/23 | Ending
Account Value
7/31/23 | Expenses Paid During Period(1) 2/1/23 - 7/31/23 | Annualized Expense Ratio(1) |
| One Choice Blend+ 2060 Portfolio |
| Actual | | | | |
| Investor Class | $1,000 | $1,061.60 | $2.96 | 0.58% |
| I Class | $1,000 | $1,062.80 | $1.94 | 0.38% |
| A Class | $1,000 | $1,059.50 | $4.24 | 0.83% |
| R Class | $1,000 | $1,058.40 | $5.51 | 1.08% |
| R6 Class | $1,000 | $1,063.90 | $1.18 | 0.23% |
| Hypothetical | | | | |
| Investor Class | $1,000 | $1,021.92 | $2.91 | 0.58% |
| I Class | $1,000 | $1,022.91 | $1.91 | 0.38% |
| A Class | $1,000 | $1,020.68 | $4.16 | 0.83% |
| R Class | $1,000 | $1,019.44 | $5.41 | 1.08% |
| R6 Class | $1,000 | $1,023.65 | $1.15 | 0.23% |
| One Choice Blend+ 2065 Portfolio |
| Actual | | | | |
| Investor Class | $1,000 | $1,061.20 | $2.96 | 0.58% |
| I Class | $1,000 | $1,062.40 | $1.94 | 0.38% |
| A Class | $1,000 | $1,060.20 | $4.24 | 0.83% |
| R Class | $1,000 | $1,059.10 | $5.51 | 1.08% |
| R6 Class | $1,000 | $1,063.50 | $1.18 | 0.23% |
| Hypothetical | | | | |
| Investor Class | $1,000 | $1,021.92 | $2.91 | 0.58% |
| I Class | $1,000 | $1,022.91 | $1.91 | 0.38% |
| A Class | $1,000 | $1,020.68 | $4.16 | 0.83% |
| R Class | $1,000 | $1,019.44 | $5.41 | 1.08% |
| R6 Class | $1,000 | $1,023.65 | $1.15 | 0.23% |
(1)Expenses are equal to the class's annualized expense ratio listed in the table above, multiplied by the average account value over the period, multiplied by 181, the number of days in the most recent fiscal half-year, divided by 365, to reflect the one-half year period. Annualized expense ratio reflects actual expenses, including any applicable fee waivers or expense reimbursements and excluding any acquired fund fees and expenses.
JULY 31, 2023
One Choice Blend+ 2015 Portfolio
| | | | | | | | |
| Shares | Value |
UNDERLYING FUNDS(1) — 100.0% | | |
| Domestic Fixed Income Funds — 49.1% | | |
| Avantis Core Fixed Income Fund G Class | 151,016 | | $ | 1,257,963 | |
| Avantis Short-Term Fixed Income Fund G Class | 30,852 | | 286,926 | |
| High Income Fund G Class | 21,216 | | 176,730 | |
| Inflation-Adjusted Bond Fund G Class | 21,491 | | 226,944 | |
| Short Duration Inflation Protection Bond Fund G Class | 28,287 | | 285,980 | |
| | 2,234,543 | |
| Domestic Equity Funds — 27.3% | | |
| American Century Low Volatility ETF | 4,483 | | 205,860 | |
| Avantis U.S. Equity Fund G Class | 23,641 | | 356,508 | |
| Avantis U.S. Small Cap Value Fund G Class | 2,558 | | 39,364 | |
| Focused Large Cap Value Fund G Class | 27,810 | | 280,046 | |
| Growth Fund G Class | 4,752 | | 233,137 | |
Heritage Fund G Class(2) | 748 | | 18,798 | |
| Mid Cap Value Fund G Class | 4,275 | | 68,952 | |
| Small Cap Growth Fund G Class | 1,783 | | 36,694 | |
| | 1,239,359 | |
| International Fixed Income Funds — 14.0% | | |
| Emerging Markets Debt Fund G Class | 6,614 | | 59,458 | |
| Global Bond Fund G Class | 66,985 | | 576,073 | |
| | 635,531 | |
| International Equity Funds — 9.6% | | |
| Avantis International Equity Fund G Class | 15,688 | | 181,826 | |
| Focused International Growth Fund G Class | 5,686 | | 95,294 | |
| Global Real Estate Fund G Class | 3,446 | | 41,183 | |
| International Value Fund G Class | 13,912 | | 117,970 | |
| | 436,273 | |
TOTAL INVESTMENT SECURITIES — 100.0% (Cost $4,577,910) | | 4,545,706 | |
| OTHER ASSETS AND LIABILITIES | | — | |
| TOTAL NET ASSETS — 100.0% | | $ | 4,545,706 | |
| | | | | | | | |
| NOTES TO SCHEDULE OF INVESTMENTS |
(1)Investments are funds within the American Century Investments family of funds and are considered affiliated funds.
(2)Non-income producing.
See Notes to Financial Statements.
JULY 31, 2023
One Choice Blend+ 2020 Portfolio
| | | | | | | | |
| Shares | Value |
UNDERLYING FUNDS(1) — 100.0% | | |
| Domestic Fixed Income Funds — 48.2% | | |
| Avantis Core Fixed Income Fund G Class | 424,709 | | $ | 3,537,826 | |
| Avantis Short-Term Fixed Income Fund G Class | 75,349 | | 700,742 | |
| High Income Fund G Class | 65,911 | | 549,034 | |
| Inflation-Adjusted Bond Fund G Class | 58,777 | | 620,685 | |
| Short Duration Inflation Protection Bond Fund G Class | 73,456 | | 742,639 | |
| | 6,150,926 | |
| Domestic Equity Funds — 27.9% | | |
| American Century Low Volatility ETF | 11,772 | | 540,572 | |
| Avantis U.S. Equity Fund G Class | 69,143 | | 1,042,672 | |
| Avantis U.S. Small Cap Value Fund G Class | 7,597 | | 116,921 | |
| Focused Large Cap Value Fund G Class | 79,727 | | 802,852 | |
| Growth Fund G Class | 13,845 | | 679,226 | |
Heritage Fund G Class(2) | 2,747 | | 69,022 | |
| Mid Cap Value Fund G Class | 12,370 | | 199,536 | |
| Small Cap Growth Fund G Class | 5,189 | | 106,782 | |
| | 3,557,583 | |
| International Fixed Income Funds — 13.9% | | |
| Emerging Markets Debt Fund G Class | 21,460 | | 192,929 | |
| Global Bond Fund G Class | 184,336 | | 1,585,292 | |
| | 1,778,221 | |
| International Equity Funds — 10.0% | | |
| Avantis Emerging Markets Equity Fund G Class | 2,526 | | 28,622 | |
| Avantis International Equity Fund G Class | 44,541 | | 516,232 | |
| Focused International Growth Fund G Class | 16,128 | | 270,300 | |
| Global Real Estate Fund G Class | 10,056 | | 120,168 | |
| International Small-Mid Cap Fund G Class | 901 | | 8,751 | |
| International Value Fund G Class | 39,005 | | 330,766 | |
| | 1,274,839 | |
TOTAL INVESTMENT SECURITIES — 100.0% (Cost $12,781,313) | | 12,761,569 | |
| OTHER ASSETS AND LIABILITIES | | — | |
| TOTAL NET ASSETS — 100.0% | | $ | 12,761,569 | |
| | | | | | | | |
| NOTES TO SCHEDULE OF INVESTMENTS |
(1)Investments are funds within the American Century Investments family of funds and are considered affiliated funds.
(2)Non-income producing.
See Notes to Financial Statements.
JULY 31, 2023
One Choice Blend+ 2025 Portfolio
| | | | | | | | |
| Shares | Value |
UNDERLYING FUNDS(1) — 100.0% | | |
| Domestic Fixed Income Funds — 43.2% | | |
| Avantis Core Fixed Income Fund G Class | 851,363 | | $ | 7,091,857 | |
| Avantis Short-Term Fixed Income Fund G Class | 96,017 | | 892,955 | |
| High Income Fund G Class | 167,317 | | 1,393,753 | |
| Inflation-Adjusted Bond Fund G Class | 119,609 | | 1,263,073 | |
| Short Duration Inflation Protection Bond Fund G Class | 123,918 | | 1,252,808 | |
| | 11,894,446 | |
| Domestic Equity Funds — 31.5% | | |
| American Century Low Volatility ETF | 20,787 | | 954,541 | |
| Avantis U.S. Equity Fund G Class | 180,084 | | 2,715,662 | |
| Avantis U.S. Small Cap Value Fund G Class | 17,437 | | 268,352 | |
| Focused Large Cap Value Fund G Class | 198,168 | | 1,995,557 | |
| Growth Fund G Class | 36,223 | | 1,777,079 | |
Heritage Fund G Class(2) | 9,812 | | 246,583 | |
| Mid Cap Value Fund G Class | 29,597 | | 477,397 | |
| Small Cap Growth Fund G Class | 12,476 | | 256,762 | |
| | 8,691,933 | |
| International Fixed Income Funds — 13.2% | | |
| Emerging Markets Debt Fund G Class | 62,138 | | 558,622 | |
| Global Bond Fund G Class | 359,082 | | 3,088,106 | |
| | 3,646,728 | |
| International Equity Funds — 12.1% | | |
| Avantis Emerging Markets Equity Fund G Class | 23,454 | | 265,729 | |
| Avantis International Equity Fund G Class | 107,162 | | 1,242,007 | |
| Focused International Growth Fund G Class | 39,923 | | 669,106 | |
| Global Real Estate Fund G Class | 26,470 | | 316,319 | |
| International Small-Mid Cap Fund G Class | 7,522 | | 73,037 | |
| International Value Fund G Class | 90,687 | | 769,026 | |
| | 3,335,224 | |
TOTAL INVESTMENT SECURITIES — 100.0% (Cost $27,268,205) | | 27,568,331 | |
| OTHER ASSETS AND LIABILITIES | | — | |
| TOTAL NET ASSETS — 100.0% | | $ | 27,568,331 | |
| | | | | | | | |
| NOTES TO SCHEDULE OF INVESTMENTS |
(1)Investments are funds within the American Century Investments family of funds and are considered affiliated funds.
(2)Non-income producing.
See Notes to Financial Statements.
JULY 31, 2023
One Choice Blend+ 2030 Portfolio
| | | | | | | | |
| Shares | Value |
UNDERLYING FUNDS(1) — 100.0% | | |
| Domestic Equity Funds — 36.8% | | |
| American Century Low Volatility ETF | 17,747 | | $ | 814,944 | |
| Avantis U.S. Equity Fund G Class | 260,118 | | 3,922,577 | |
| Avantis U.S. Small Cap Value Fund G Class | 24,620 | | 378,908 | |
Focused Dynamic Growth Fund G Class(2) | 7,228 | | 361,638 | |
| Focused Large Cap Value Fund G Class | 271,567 | | 2,734,675 | |
| Growth Fund G Class | 45,077 | | 2,211,500 | |
Heritage Fund G Class(2) | 18,436 | | 463,294 | |
| Mid Cap Value Fund G Class | 40,962 | | 660,723 | |
| Small Cap Growth Fund G Class | 17,770 | | 365,704 | |
| | 11,913,963 | |
| Domestic Fixed Income Funds — 36.2% | | |
| Avantis Core Fixed Income Fund G Class | 901,762 | | 7,511,678 | |
| Avantis Short-Term Fixed Income Fund G Class | 46,953 | | 436,666 | |
| High Income Fund G Class | 200,750 | | 1,672,247 | |
| Inflation-Adjusted Bond Fund G Class | 111,468 | | 1,177,099 | |
| Short Duration Inflation Protection Bond Fund G Class | 89,037 | | 900,164 | |
| | 11,697,854 | |
| International Equity Funds — 15.1% | | |
| Avantis Emerging Markets Equity Fund G Class | 51,268 | | 580,869 | |
| Avantis International Equity Fund G Class | 143,690 | | 1,665,367 | |
| Emerging Markets Fund G Class | 9,373 | | 101,321 | |
| Focused International Growth Fund G Class | 53,460 | | 895,986 | |
| Global Real Estate Fund G Class | 39,008 | | 466,149 | |
| International Small-Mid Cap Fund G Class | 18,652 | | 181,113 | |
| International Value Fund G Class | 104,913 | | 889,658 | |
| Non-U.S. Intrinsic Value Fund G Class | 10,434 | | 111,016 | |
| | 4,891,479 | |
| International Fixed Income Funds — 11.9% | | |
| Emerging Markets Debt Fund G Class | 83,235 | | 748,282 | |
| Global Bond Fund G Class | 361,183 | | 3,106,172 | |
| | 3,854,454 | |
TOTAL INVESTMENT SECURITIES — 100.0% (Cost $31,908,107) | | 32,357,750 | |
| OTHER ASSETS AND LIABILITIES | | — | |
| TOTAL NET ASSETS — 100.0% | | $ | 32,357,750 | |
| | | | | | | | |
| NOTES TO SCHEDULE OF INVESTMENTS |
(1)Investments are funds within the American Century Investments family of funds and are considered affiliated funds.
(2)Non-income producing.
See Notes to Financial Statements.
JULY 31, 2023
One Choice Blend+ 2035 Portfolio
| | | | | | | | |
| Shares | Value |
UNDERLYING FUNDS(1) — 100.0% | | |
| Domestic Equity Funds — 42.2% | | |
| American Century Low Volatility ETF | 8,228 | | $ | 377,831 | |
| Avantis U.S. Equity Fund G Class | 314,355 | | 4,740,480 | |
| Avantis U.S. Small Cap Value Fund G Class | 28,192 | | 433,880 | |
Focused Dynamic Growth Fund G Class(2) | 33,025 | | 1,652,230 | |
| Focused Large Cap Value Fund G Class | 318,065 | | 3,202,915 | |
| Growth Fund G Class | 30,168 | | 1,480,022 | |
Heritage Fund G Class(2) | 26,518 | | 666,409 | |
| Mid Cap Value Fund G Class | 47,214 | | 761,555 | |
| Small Cap Growth Fund G Class | 20,889 | | 429,900 | |
| | 13,745,222 | |
| Domestic Fixed Income Funds — 28.9% | | |
| Avantis Core Fixed Income Fund G Class | 788,087 | | 6,564,761 | |
| Avantis Short-Term Fixed Income Fund G Class | 15,652 | | 145,563 | |
| High Income Fund G Class | 193,578 | | 1,612,503 | |
| Inflation-Adjusted Bond Fund G Class | 73,133 | | 772,284 | |
| Short Duration Inflation Protection Bond Fund G Class | 30,060 | | 303,909 | |
| | 9,399,020 | |
| International Equity Funds — 18.6% | | |
| Avantis Emerging Markets Equity Fund G Class | 66,430 | | 752,657 | |
| Avantis International Equity Fund G Class | 159,984 | | 1,854,212 | |
| Emerging Markets Fund G Class | 41,348 | | 446,968 | |
| Focused International Growth Fund G Class | 61,485 | | 1,030,481 | |
| Global Real Estate Fund G Class | 47,655 | | 569,473 | |
| International Small-Mid Cap Fund G Class | 32,577 | | 316,327 | |
| International Value Fund G Class | 69,297 | | 587,640 | |
| Non-U.S. Intrinsic Value Fund G Class | 45,026 | | 479,081 | |
| | 6,036,839 | |
| International Fixed Income Funds — 10.3% | | |
| Emerging Markets Debt Fund G Class | 89,744 | | 806,801 | |
| Global Bond Fund G Class | 297,529 | | 2,558,750 | |
| | 3,365,551 | |
TOTAL INVESTMENT SECURITIES — 100.0% (Cost $31,800,852) | | 32,546,632 | |
OTHER ASSETS AND LIABILITIES† | | 2,437 | |
| TOTAL NET ASSETS — 100.0% | | $ | 32,549,069 | |
| | | | | | | | |
| NOTES TO SCHEDULE OF INVESTMENTS |
†Category is less than 0.05% of total net assets.
(1)Investments are funds within the American Century Investments family of funds and are considered affiliated funds.
(2)Non-income producing.
See Notes to Financial Statements.
JULY 31, 2023
One Choice Blend+ 2040 Portfolio
| | | | | | | | |
| Shares | Value |
UNDERLYING FUNDS(1) — 100.0% | | |
| Domestic Equity Funds — 47.2% | | |
| Avantis U.S. Equity Fund G Class | 337,746 | | $ | 5,093,212 | |
| Avantis U.S. Small Cap Value Fund G Class | 30,021 | | 462,029 | |
Focused Dynamic Growth Fund G Class(2) | 54,354 | | 2,719,337 | |
| Focused Large Cap Value Fund G Class | 331,175 | | 3,334,931 | |
| Growth Fund G Class | 13,542 | | 664,374 | |
Heritage Fund G Class(2) | 31,869 | | 800,880 | |
| Mid Cap Value Fund G Class | 49,219 | | 793,907 | |
| Small Cap Growth Fund G Class | 22,263 | | 458,173 | |
| | 14,326,843 | |
| Domestic Fixed Income Funds — 22.5% | | |
| Avantis Core Fixed Income Fund G Class | 608,821 | | 5,071,475 | |
| High Income Fund G Class | 154,428 | | 1,286,387 | |
| Inflation-Adjusted Bond Fund G Class | 43,985 | | 464,486 | |
| | 6,822,348 | |
| International Equity Funds — 21.8% | | |
| Avantis Emerging Markets Equity Fund G Class | 74,603 | | 845,258 | |
| Avantis International Equity Fund G Class | 161,496 | | 1,871,738 | |
| Emerging Markets Fund G Class | 69,936 | | 756,012 | |
| Focused International Growth Fund G Class | 62,225 | | 1,042,897 | |
| Global Real Estate Fund G Class | 51,822 | | 619,278 | |
| International Small-Mid Cap Fund G Class | 43,161 | | 419,094 | |
| International Value Fund G Class | 31,244 | | 264,951 | |
| Non-U.S. Intrinsic Value Fund G Class | 73,801 | | 785,248 | |
| | 6,604,476 | |
| International Fixed Income Funds — 8.5% | | |
| Emerging Markets Debt Fund G Class | 76,929 | | 691,591 | |
| Global Bond Fund G Class | 217,774 | | 1,872,853 | |
| | 2,564,444 | |
TOTAL INVESTMENT SECURITIES — 100.0% (Cost $29,453,176) | | 30,318,111 | |
| OTHER ASSETS AND LIABILITIES | | — | |
| TOTAL NET ASSETS — 100.0% | | $ | 30,318,111 | |
| | | | | | | | |
| NOTES TO SCHEDULE OF INVESTMENTS |
(1)Investments are funds within the American Century Investments family of funds and are considered affiliated funds.
(2)Non-income producing.
See Notes to Financial Statements.
JULY 31, 2023
One Choice Blend+ 2045 Portfolio
| | | | | | | | |
| Shares | Value |
UNDERLYING FUNDS(1) — 100.0% | | |
| Domestic Equity Funds — 53.0% | | |
| Avantis U.S. Equity Fund G Class | 421,128 | | $ | 6,350,615 | |
| Avantis U.S. Small Cap Value Fund G Class | 39,905 | | 614,133 | |
Focused Dynamic Growth Fund G Class(2) | 83,809 | | 4,192,961 | |
| Focused Large Cap Value Fund G Class | 409,628 | | 4,124,955 | |
Heritage Fund G Class(2) | 39,780 | | 999,663 | |
| Mid Cap Value Fund G Class | 61,999 | | 1,000,044 | |
| Small Cap Growth Fund G Class | 27,984 | | 575,914 | |
| | 17,858,285 | |
| International Equity Funds — 24.2% | | |
| Avantis Emerging Markets Equity Fund G Class | 69,638 | | 788,997 | |
| Avantis International Equity Fund G Class | 199,497 | | 2,312,169 | |
| Emerging Markets Fund G Class | 109,020 | | 1,178,511 | |
| Focused International Growth Fund G Class | 76,865 | | 1,288,257 | |
| Global Real Estate Fund G Class | 63,867 | | 763,206 | |
| International Small-Mid Cap Fund G Class | 53,152 | | 516,103 | |
| Non-U.S. Intrinsic Value Fund G Class | 123,471 | | 1,313,732 | |
| | 8,160,975 | |
| Domestic Fixed Income Funds — 16.6% | | |
| Avantis Core Fixed Income Fund G Class | 501,001 | | 4,173,342 | |
| High Income Fund G Class | 125,905 | | 1,048,786 | |
| Inflation-Adjusted Bond Fund G Class | 35,584 | | 375,763 | |
| | 5,597,891 | |
| International Fixed Income Funds — 6.2% | | |
| Emerging Markets Debt Fund G Class | 62,127 | | 558,522 | |
| Global Bond Fund G Class | 177,999 | | 1,530,791 | |
| | 2,089,313 | |
TOTAL INVESTMENT SECURITIES — 100.0% (Cost $32,181,218) | | 33,706,464 | |
| OTHER ASSETS AND LIABILITIES | | — | |
| TOTAL NET ASSETS — 100.0% | | $ | 33,706,464 | |
| | | | | | | | |
| NOTES TO SCHEDULE OF INVESTMENTS |
(1)Investments are funds within the American Century Investments family of funds and are considered affiliated funds.
(2)Non-income producing.
See Notes to Financial Statements.
JULY 31, 2023
One Choice Blend+ 2050 Portfolio
| | | | | | | | |
| Shares | Value |
UNDERLYING FUNDS(1) — 100.0% | | |
| Domestic Equity Funds — 57.4% | | |
| Avantis U.S. Equity Fund G Class | 342,511 | | $ | 5,165,070 | |
| Avantis U.S. Small Cap Value Fund G Class | 31,393 | | 483,133 | |
Focused Dynamic Growth Fund G Class(2) | 68,030 | | 3,403,547 | |
| Focused Large Cap Value Fund G Class | 336,114 | | 3,384,670 | |
Heritage Fund G Class(2) | 32,092 | | 806,482 | |
| Mid Cap Value Fund G Class | 49,638 | | 800,655 | |
| Small Cap Growth Fund G Class | 22,545 | | 463,970 | |
| | 14,507,527 | |
| International Equity Funds — 26.4% | | |
| Avantis Emerging Markets Equity Fund G Class | 56,719 | | 642,624 | |
| Avantis International Equity Fund G Class | 162,880 | | 1,887,780 | |
| Emerging Markets Fund G Class | 89,098 | | 963,153 | |
| Focused International Growth Fund G Class | 62,172 | | 1,042,005 | |
| Global Real Estate Fund G Class | 52,567 | | 628,178 | |
| International Small-Mid Cap Fund G Class | 43,401 | | 421,420 | |
| Non-U.S. Intrinsic Value Fund G Class | 101,306 | | 1,077,896 | |
| | 6,663,056 | |
| Domestic Fixed Income Funds — 11.8% | | |
| Avantis Core Fixed Income Fund G Class | 268,191 | | 2,234,027 | |
| High Income Fund G Class | 66,500 | | 553,947 | |
| Inflation-Adjusted Bond Fund G Class | 18,474 | | 195,081 | |
| | 2,983,055 | |
| International Fixed Income Funds — 4.4% | | |
| Emerging Markets Debt Fund G Class | 32,801 | | 294,882 | |
| Global Bond Fund G Class | 95,143 | | 818,231 | |
| | 1,113,113 | |
TOTAL INVESTMENT SECURITIES — 100.0% (Cost $24,001,644) | | 25,266,751 | |
| OTHER ASSETS AND LIABILITIES | | — | |
| TOTAL NET ASSETS — 100.0% | | $ | 25,266,751 | |
| | | | | | | | |
| NOTES TO SCHEDULE OF INVESTMENTS |
(1)Investments are funds within the American Century Investments family of funds and are considered affiliated funds.
(2)Non-income producing.
See Notes to Financial Statements.
JULY 31, 2023
One Choice Blend+ 2055 Portfolio
| | | | | | | | |
| Shares | Value |
UNDERLYING FUNDS(1) — 100.0% | | |
| Domestic Equity Funds — 59.9% | | |
| Avantis U.S. Equity Fund G Class | 203,546 | | $ | 3,069,476 | |
| Avantis U.S. Small Cap Value Fund G Class | 18,417 | | 283,430 | |
Focused Dynamic Growth Fund G Class(2) | 40,679 | | 2,035,180 | |
| Focused Large Cap Value Fund G Class | 199,432 | | 2,008,281 | |
Heritage Fund G Class(2) | 19,114 | | 480,333 | |
| Mid Cap Value Fund G Class | 29,639 | | 478,071 | |
| Small Cap Growth Fund G Class | 13,281 | | 273,321 | |
| | 8,628,092 | |
| International Equity Funds — 27.6% | | |
| Avantis Emerging Markets Equity Fund G Class | 33,635 | | 381,090 | |
| Avantis International Equity Fund G Class | 96,700 | | 1,120,752 | |
| Emerging Markets Fund G Class | 53,139 | | 574,433 | |
| Focused International Growth Fund G Class | 37,410 | | 626,989 | |
| Global Real Estate Fund G Class | 31,369 | | 374,857 | |
| International Small-Mid Cap Fund G Class | 26,021 | | 252,663 | |
| Non-U.S. Intrinsic Value Fund G Class | 59,997 | | 638,367 | |
| | 3,969,151 | |
| Domestic Fixed Income Funds — 9.1% | | |
| Avantis Core Fixed Income Fund G Class | 117,132 | | 975,712 | |
| High Income Fund G Class | 29,242 | | 243,590 | |
| Inflation-Adjusted Bond Fund G Class | 8,250 | | 87,124 | |
| | 1,306,426 | |
| International Fixed Income Funds — 3.4% | | |
| Emerging Markets Debt Fund G Class | 14,454 | | 129,942 | |
| Global Bond Fund G Class | 41,747 | | 359,025 | |
| | 488,967 | |
TOTAL INVESTMENT SECURITIES — 100.0% (Cost $13,456,111) | | 14,392,636 | |
| OTHER ASSETS AND LIABILITIES | | — | |
| TOTAL NET ASSETS — 100.0% | | $ | 14,392,636 | |
| | | | | | | | |
| NOTES TO SCHEDULE OF INVESTMENTS |
(1)Investments are funds within the American Century Investments family of funds and are considered affiliated funds.
(2)Non-income producing.
See Notes to Financial Statements.
JULY 31, 2023
One Choice Blend+ 2060 Portfolio
| | | | | | | | |
| Shares | Value |
UNDERLYING FUNDS(1) — 100.0% | | |
| Domestic Equity Funds — 61.8% | | |
| Avantis U.S. Equity Fund G Class | 145,517 | | $ | 2,194,392 | |
| Avantis U.S. Small Cap Value Fund G Class | 13,163 | | 202,584 | |
Focused Dynamic Growth Fund G Class(2) | 29,041 | | 1,452,914 | |
| Focused Large Cap Value Fund G Class | 143,102 | | 1,441,033 | |
Heritage Fund G Class(2) | 13,773 | | 346,109 | |
| Mid Cap Value Fund G Class | 21,402 | | 345,222 | |
| Small Cap Growth Fund G Class | 9,573 | | 197,020 | |
| | 6,179,274 | |
| International Equity Funds — 28.3% | | |
| Avantis Emerging Markets Equity Fund G Class | 23,944 | | 271,286 | |
| Avantis International Equity Fund G Class | 69,419 | | 804,564 | |
| Emerging Markets Fund G Class | 37,670 | | 407,212 | |
| Focused International Growth Fund G Class | 26,789 | | 448,975 | |
| Global Real Estate Fund G Class | 22,570 | | 269,714 | |
| International Small-Mid Cap Fund G Class | 18,794 | | 182,490 | |
| Non-U.S. Intrinsic Value Fund G Class | 42,274 | | 449,796 | |
| | 2,834,037 | |
| Domestic Fixed Income Funds — 7.2% | | |
| Avantis Core Fixed Income Fund G Class | 64,502 | | 537,305 | |
| High Income Fund G Class | 16,292 | | 135,713 | |
| Inflation-Adjusted Bond Fund G Class | 4,649 | | 49,090 | |
| | 722,108 | |
| International Fixed Income Funds — 2.7% | | |
| Emerging Markets Debt Fund G Class | 8,101 | | 72,827 | |
| Global Bond Fund G Class | 23,082 | | 198,503 | |
| | 271,330 | |
TOTAL INVESTMENT SECURITIES — 100.0% (Cost $9,225,202) | | 10,006,749 | |
| OTHER ASSETS AND LIABILITIES | | — | |
| TOTAL NET ASSETS — 100.0% | | $ | 10,006,749 | |
| | | | | | | | |
| NOTES TO SCHEDULE OF INVESTMENTS |
(1)Investments are funds within the American Century Investments family of funds and are considered affiliated funds.
(2)Non-income producing.
See Notes to Financial Statements.
JULY 31, 2023
One Choice Blend+ 2065 Portfolio
| | | | | | | | |
| Shares | Value |
UNDERLYING FUNDS(1) — 100.0% | | |
| Domestic Equity Funds — 61.7% | | |
| Avantis U.S. Equity Fund G Class | 53,542 | | $ | 807,409 | |
| Avantis U.S. Small Cap Value Fund G Class | 4,793 | | 73,769 | |
Focused Dynamic Growth Fund G Class(2) | 10,719 | | 536,280 | |
| Focused Large Cap Value Fund G Class | 52,662 | | 530,307 | |
Heritage Fund G Class(2) | 5,062 | | 127,196 | |
| Mid Cap Value Fund G Class | 7,851 | | 126,630 | |
| Small Cap Growth Fund G Class | 3,519 | | 72,413 | |
| | 2,274,004 | |
| International Equity Funds — 28.4% | | |
| Avantis Emerging Markets Equity Fund G Class | 8,875 | | 100,555 | |
| Avantis International Equity Fund G Class | 25,517 | | 295,738 | |
| Emerging Markets Fund G Class | 14,035 | | 151,713 | |
| Focused International Growth Fund G Class | 9,882 | | 165,628 | |
| Global Real Estate Fund G Class | 8,270 | | 98,831 | |
| International Small-Mid Cap Fund G Class | 6,870 | | 66,712 | |
| Non-U.S. Intrinsic Value Fund G Class | 15,658 | | 166,605 | |
| | 1,045,782 | |
| Domestic Fixed Income Funds — 7.2% | | |
| Avantis Core Fixed Income Fund G Class | 23,691 | | 197,345 | |
| High Income Fund G Class | 5,993 | | 49,918 | |
| Inflation-Adjusted Bond Fund G Class | 1,683 | | 17,776 | |
| | 265,039 | |
| International Fixed Income Funds — 2.7% | | |
| Emerging Markets Debt Fund G Class | 2,952 | | 26,537 | |
| Global Bond Fund G Class | 8,444 | | 72,616 | |
| | 99,153 | |
TOTAL INVESTMENT SECURITIES — 100.0% (Cost $3,337,710) | | 3,683,978 | |
OTHER ASSETS AND LIABILITIES† | | 9 | |
| TOTAL NET ASSETS — 100.0% | | $ | 3,683,987 | |
| | | | | | | | |
| NOTES TO SCHEDULE OF INVESTMENTS |
†Category is less than 0.05% of total net assets.
(1)Investments are funds within the American Century Investments family of funds and are considered affiliated funds.
(2)Non-income producing.
See Notes to Financial Statements.
| | |
| Statements of Assets and Liabilities |
| | | | | | | | |
| JULY 31, 2023 | | |
| One Choice
Blend+
2015 Portfolio | One Choice
Blend+
2020 Portfolio |
| Assets | | |
| Investment securities in affiliates, at value (cost of $4,577,910 and $12,781,313, respectively) | $ | 4,545,706 | | $ | 12,761,569 | |
| Cash | 1,443 | | — | |
| Receivable for investments sold | 20,082 | | 13,825 | |
| Receivable for capital shares sold | 735 | | 3,088 | |
| Distributions receivable from affiliates | 5,706 | | 15,985 | |
| 4,573,672 | | 12,794,467 | |
| | |
| Liabilities | | |
| Payable for investments purchased | 7,136 | | 15,985 | |
| Payable for capital shares redeemed | 19,798 | | 14,173 | |
| Accrued management fees | 1,029 | | 2,732 | |
| Distribution and service fees payable | 3 | | 8 | |
| 27,966 | | 32,898 | |
| | |
| Net Assets | $ | 4,545,706 | | $ | 12,761,569 | |
| | |
| Net Assets Consist of: | | |
| Capital (par value and paid-in surplus) | $ | 4,732,375 | | $ | 13,112,979 | |
| Distributable earnings (loss) | (186,669) | | (351,410) | |
| $ | 4,545,706 | | $ | 12,761,569 | |
| | | | | | | | | | | |
| Fund/Class | Net Assets | Shares Outstanding | Net Asset Value Per Share* |
| One Choice Blend+ 2015 Portfolio |
| Investor Class, $0.01 Par Value | $512,355 | 54,532 | $9.40 |
| I Class, $0.01 Par Value | $340,611 | 36,231 | $9.40 |
| A Class, $0.01 Par Value | $4,905 | 523 | $9.38 |
| R Class, $0.01 Par Value | $5,047 | 539 | $9.36 |
| R6 Class, $0.01 Par Value | $3,682,788 | 391,311 | $9.41 |
| One Choice Blend+ 2020 Portfolio |
| Investor Class, $0.01 Par Value | $1,309,662 | 138,954 | $9.43 |
| I Class, $0.01 Par Value | $10,937 | 1,160 | $9.43 |
| A Class, $0.01 Par Value | $9,854 | 1,047 | $9.41 |
| R Class, $0.01 Par Value | $13,083 | 1,393 | $9.39 |
| R6 Class, $0.01 Par Value | $11,418,033 | 1,209,025 | $9.44 |
*Maximum offering price per share was equal to the net asset value per share for all share classes, except A Class, for which the maximum offering price per share was $9.95 and $9.98 (net asset value divided by 0.9425) for One Choice Blend+ 2015 Portfolio and One Choice Blend+ 2020 Portfolio, respectively. A contingent deferred sales charge may be imposed on redemptions of A Class.
See Notes to Financial Statements.
| | | | | | | | |
| JULY 31, 2023 | | |
| One Choice
Blend+
2025 Portfolio | One Choice
Blend+
2030 Portfolio |
| Assets | | |
| Investment securities in affiliates, at value (cost of $27,268,205 and $31,908,107, respectively) | $ | 27,568,331 | | $ | 32,357,750 | |
| Receivable for investments sold | — | | 165,552 | |
| Receivable for capital shares sold | 14,119 | | 175,397 | |
| Distributions receivable from affiliates | 33,417 | | 35,499 | |
| 27,615,867 | | 32,734,198 | |
| | |
| Liabilities | | |
| Payable for investments purchased | 38,278 | | 35,499 | |
| Payable for capital shares redeemed | 2,816 | | 333,572 | |
| Accrued management fees | 6,429 | | 7,313 | |
| Distribution and service fees payable | 13 | | 64 | |
| 47,536 | | 376,448 | |
| | |
| Net Assets | $ | 27,568,331 | | $ | 32,357,750 | |
| | |
| Net Assets Consist of: | | |
| Capital (par value and paid-in surplus) | $ | 28,085,232 | | $ | 33,127,280 | |
| Distributable earnings (loss) | (516,901) | | (769,530) | |
| $ | 27,568,331 | | $ | 32,357,750 | |
| | | | | | | | | | | |
| Fund/Class | Net Assets | Shares Outstanding | Net Asset Value Per Share* |
| One Choice Blend+ 2025 Portfolio |
| Investor Class, $0.01 Par Value | $4,323,223 | 461,814 | $9.36 |
| I Class, $0.01 Par Value | $5,051 | 539 | $9.37 |
| A Class, $0.01 Par Value | $4,927 | 527 | $9.35 |
| R Class, $0.01 Par Value | $28,307 | 3,033 | $9.33 |
| R6 Class, $0.01 Par Value | $23,206,823 | 2,474,871 | $9.38 |
| One Choice Blend+ 2030 Portfolio |
| Investor Class, $0.01 Par Value | $4,126,033 | 439,121 | $9.40 |
| I Class, $0.01 Par Value | $5,008 | 532 | $9.41 |
| A Class, $0.01 Par Value | $6,453 | 687 | $9.39 |
| R Class, $0.01 Par Value | $159,890 | 17,056 | $9.37 |
| R6 Class, $0.01 Par Value | $28,060,366 | 2,978,710 | $9.42 |
*Maximum offering price per share was equal to the net asset value per share for all share classes, except A Class, for which the maximum offering price per share was $9.92 and $9.96 (net asset value divided by 0.9425) for One Choice Blend+ 2025 Portfolio and One Choice Blend+ 2030 Portfolio, respectively. A contingent deferred sales charge may be imposed on redemptions of A Class.
See Notes to Financial Statements.
| | | | | | | | |
| JULY 31, 2023 | | |
| One Choice
Blend+
2035 Portfolio | One Choice
Blend+
2040 Portfolio |
| Assets | | |
| Investment securities in affiliates, at value (cost of $31,800,852 and $29,453,176, respectively) | $ | 32,546,632 | | $ | 30,318,111 | |
| Cash | 453 | | — | |
| Receivable for capital shares sold | 37,592 | | 47,616 | |
| Distributions receivable from affiliates | 30,563 | | 23,857 | |
| 32,615,240 | | 30,389,584 | |
| | |
| Liabilities | | |
| Payable for investments purchased | 55,855 | | 62,137 | |
| Payable for capital shares redeemed | 2,738 | | 2,497 | |
| Accrued management fees | 7,485 | | 6,726 | |
| Distribution and service fees payable | 93 | | 113 | |
| 66,171 | | 71,473 | |
| | |
| Net Assets | $ | 32,549,069 | | $ | 30,318,111 | |
| | |
| Net Assets Consist of: | | |
| Capital (par value and paid-in surplus) | $ | 33,594,709 | | $ | 30,260,314 | |
| Distributable earnings (loss) | (1,045,640) | | 57,797 | |
| $ | 32,549,069 | | $ | 30,318,111 | |
| | | | | | | | | | | |
| Fund/Class | Net Assets | Shares Outstanding | Net Asset Value Per Share* |
| One Choice Blend+ 2035 Portfolio |
| Investor Class, $0.01 Par Value | $4,817,366 | 511,848 | $9.41 |
| I Class, $0.01 Par Value | $29,132 | 3,092 | $9.42 |
| A Class, $0.01 Par Value | $5,718 | 608 | $9.40 |
| R Class, $0.01 Par Value | $222,583 | 23,721 | $9.38 |
| R6 Class, $0.01 Par Value | $27,474,270 | 2,913,757 | $9.43 |
| One Choice Blend+ 2040 Portfolio |
| Investor Class, $0.01 Par Value | $2,875,609 | 302,445 | $9.51 |
| I Class, $0.01 Par Value | $5,067 | 532 | $9.52 |
| A Class, $0.01 Par Value | $32,622 | 3,436 | $9.49 |
| R Class, $0.01 Par Value | $250,734 | 26,436 | $9.48 |
| R6 Class, $0.01 Par Value | $27,154,079 | 2,849,838 | $9.53 |
*Maximum offering price per share was equal to the net asset value per share for all share classes, except A Class, for which the maximum offering price per share was $9.97 and $10.07 (net asset value divided by 0.9425) for One Choice Blend+ 2035 Portfolio and One Choice Blend+ 2040 Portfolio, respectively. A contingent deferred sales charge may be imposed on redemptions of A Class.
See Notes to Financial Statements.
| | | | | | | | |
| JULY 31, 2023 | | |
| One Choice
Blend+
2045 Portfolio | One Choice
Blend+
2050 Portfolio |
| Assets | | |
| Investment securities in affiliates, at value (cost of $32,181,218 and $24,001,644, respectively) | $ | 33,706,464 | | $ | 25,266,751 | |
| Receivable for capital shares sold | 12,181 | | 38,228 | |
| Distributions receivable from affiliates | 19,303 | | 10,167 | |
| 33,737,948 | | 25,315,146 | |
| | |
| Liabilities | | |
| Payable for investments purchased | 20,560 | | 31,963 | |
| Payable for capital shares redeemed | 3,483 | | 10,931 | |
| Accrued management fees | 7,329 | | 5,407 | |
| Distribution and service fees payable | 112 | | 94 | |
| 31,484 | | 48,395 | |
| | |
| Net Assets | $ | 33,706,464 | | $ | 25,266,751 | |
| | |
| Net Assets Consist of: | | |
| Capital (par value and paid-in surplus) | $ | 33,434,053 | | $ | 24,713,468 | |
| Distributable earnings (loss) | 272,411 | | 553,283 | |
| $ | 33,706,464 | | $ | 25,266,751 | |
| | | | | | | | | | | |
| Fund/Class | Net Assets | Shares Outstanding | Net Asset Value Per Share* |
| One Choice Blend+ 2045 Portfolio |
| Investor Class, $0.01 Par Value | $2,792,097 | 290,298 | $9.62 |
| I Class, $0.01 Par Value | $14,780 | 1,535 | $9.63 |
| A Class, $0.01 Par Value | $5,068 | 528 | $9.60 |
| R Class, $0.01 Par Value | $268,767 | 28,026 | $9.59 |
| R6 Class, $0.01 Par Value | $30,625,752 | 3,178,946 | $9.63 |
| One Choice Blend+ 2050 Portfolio |
| Investor Class, $0.01 Par Value | $1,859,236 | 191,813 | $9.69 |
| I Class, $0.01 Par Value | $5,169 | 533 | $9.70 |
| A Class, $0.01 Par Value | $5,113 | 528 | $9.68 |
| R Class, $0.01 Par Value | $230,615 | 23,867 | $9.66 |
| R6 Class, $0.01 Par Value | $23,166,618 | 2,385,755 | $9.71 |
*Maximum offering price per share was equal to the net asset value per share for all share classes, except A Class, for which the maximum offering price per share was $10.19 and $10.27 (net asset value divided by 0.9425) for One Choice Blend+ 2045 Portfolio and One Choice Blend+ 2050 Portfolio, respectively. A contingent deferred sales charge may be imposed on redemptions of A Class.
See Notes to Financial Statements.
| | | | | | | | |
| JULY 31, 2023 | | |
| One Choice
Blend+
2055 Portfolio | One Choice
Blend+
2060 Portfolio |
| Assets | | |
| Investment securities in affiliates, at value (cost of $13,456,111 and $9,225,202, respectively) | $ | 14,392,636 | | $ | 10,006,749 | |
| Receivable for capital shares sold | 11,372 | | 41,302 | |
| Distributions receivable from affiliates | 4,419 | | 2,402 | |
| 14,408,427 | | 10,050,453 | |
| | |
| Liabilities | | |
| Payable for investments purchased | 11,115 | | 39,945 | |
| Payable for capital shares redeemed | 1,416 | | 1,414 | |
| Accrued management fees | 3,173 | | 2,310 | |
| Distribution and service fees payable | 87 | | 35 | |
| 15,791 | | 43,704 | |
| | |
| Net Assets | $ | 14,392,636 | | $ | 10,006,749 | |
| | |
| Net Assets Consist of: | | |
| Capital (par value and paid-in surplus) | $ | 14,364,890 | | $ | 9,572,559 | |
| Distributable earnings (loss) | 27,746 | | 434,190 | |
| $ | 14,392,636 | | $ | 10,006,749 | |
| | | | | | | | | | | |
| Fund/Class | Net Assets | Shares Outstanding | Net Asset Value Per Share* |
| One Choice Blend+ 2055 Portfolio |
| Investor Class, $0.01 Par Value | $1,296,098 | 133,500 | $9.71 |
| I Class, $0.01 Par Value | $5,193 | 534 | $9.72 |
| A Class, $0.01 Par Value | $5,139 | 530 | $9.70 |
| R Class, $0.01 Par Value | $211,556 | 21,854 | $9.68 |
| R6 Class, $0.01 Par Value | $12,874,650 | 1,322,306 | $9.74 |
| One Choice Blend+ 2060 Portfolio |
| Investor Class, $0.01 Par Value | $1,534,948 | 156,377 | $9.82 |
| I Class, $0.01 Par Value | $12,118 | 1,234 | $9.82 |
| A Class, $0.01 Par Value | $5,983 | 611 | $9.79 |
| R Class, $0.01 Par Value | $87,261 | 8,921 | $9.78 |
| R6 Class, $0.01 Par Value | $8,366,439 | 851,212 | $9.83 |
*Maximum offering price per share was equal to the net asset value per share for all share classes, except A Class, for which the maximum offering price per share was $10.29 and $10.39 (net asset value divided by 0.9425) for One Choice Blend+ 2055 Portfolio and One Choice Blend+ 2060 Portfolio, respectively. A contingent deferred sales charge may be imposed on redemptions of A Class.
See Notes to Financial Statements.
| | | | | |
| JULY 31, 2023 | |
| One Choice
Blend+
2065 Portfolio |
| Assets | |
| Investment securities in affiliates, at value (cost of $3,337,710) | $ | 3,683,978 | |
| Receivable for capital shares sold | 3,701 | |
| Distributions receivable from affiliates | 890 | |
| 3,688,569 | |
| |
| Liabilities | |
| Payable for investments purchased | 2,992 | |
| Payable for capital shares redeemed | 113 | |
| Accrued management fees | 1,356 | |
| Distribution and service fees payable | 121 | |
| 4,582 | |
| |
| Net Assets | $ | 3,683,987 | |
| |
| Net Assets Consist of: | |
| Capital (par value and paid-in surplus) | $ | 3,665,706 | |
| Distributable earnings (loss) | 18,281 | |
| $ | 3,683,987 | |
| | | | | | | | | | | |
| Fund/Class | Net Assets | Shares Outstanding | Net Asset Value Per Share* |
| One Choice Blend+ 2065 Portfolio |
| Investor Class, $0.01 Par Value | $2,032,080 | 209,265 | $9.71 |
| I Class, $0.01 Par Value | $5,234 | 539 | $9.71 |
| A Class, $0.01 Par Value | $5,177 | 534 | $9.69 |
| R Class, $0.01 Par Value | $296,977 | 30,695 | $9.68 |
| R6 Class, $0.01 Par Value | $1,344,519 | 138,266 | $9.72 |
*Maximum offering price per share was equal to the net asset value per share for all share classes, except A Class, for which the maximum offering price per share was $10.28 (net asset value divided by 0.9425) for One Choice Blend+ 2065 Portfolio. A contingent deferred sales charge may be imposed on redemptions of A Class.
See Notes to Financial Statements.
| | | | | | | | |
| YEAR ENDED JULY 31, 2023 |
| One Choice
Blend+
2015 Portfolio | One Choice
Blend+
2020 Portfolio |
| Investment Income (Loss) | | |
| Income from Affiliates: | | |
| Income distributions from underlying funds | $ | 141,587 | | $ | 350,878 | |
| | |
| Expenses: | | |
| Management fees | 11,235 | | 29,385 | |
| Distribution and service fees: | | |
| A Class | 11 | | 24 | |
| R Class | 32 | | 65 | |
| Directors' fees and expenses | 132 | | 329 | |
| Other expenses | 22 | | 33 | |
| 11,432 | | 29,836 | |
| Fees waived | (557) | | (1,334) | |
| 10,875 | | 28,502 | |
| | |
| Net investment income (loss) | 130,712 | | 322,376 | |
| | |
| Realized and Unrealized Gain (Loss) on Affiliates | | |
| Net realized gain (loss) on: | | |
| Sales of investments in underlying funds | (187,489) | | (373,113) | |
| Capital gain distributions received from underlying funds | 20,663 | | 50,688 | |
| (166,826) | | (322,425) | |
| | |
| Change in net unrealized appreciation (depreciation) on investments in underlying funds | 150,990 | | 526,641 | |
| | |
| Net realized and unrealized gain (loss) on affiliates | (15,836) | | 204,216 | |
| | |
| Net Increase (Decrease) in Net Assets Resulting from Operations | $ | 114,876 | | $ | 526,592 | |
See Notes to Financial Statements.
| | | | | | | | |
| YEAR ENDED JULY 31, 2023 |
| One Choice
Blend+
2025 Portfolio | One Choice
Blend+
2030 Portfolio |
| Investment Income (Loss) | | |
| Income from Affiliates: | | |
| Income distributions from underlying funds | $ | 800,264 | | $ | 882,993 | |
| | |
| Expenses: | | |
| Management fees | 69,472 | | 78,150 | |
| Distribution and service fees: | | |
| A Class | 11 | | 12 | |
| R Class | 94 | | 560 | |
| Directors' fees and expenses | 765 | | 875 | |
| Other expenses | 107 | | 139 | |
| 70,449 | | 79,736 | |
| Fees waived | (2,462) | | (1,972) | |
| 67,987 | | 77,764 | |
| | |
| Net investment income (loss) | 732,277 | | 805,229 | |
| | |
| Realized and Unrealized Gain (Loss) on Affiliates | | |
| Net realized gain (loss) on: | | |
| Sales of investments in underlying funds | (964,886) | | (1,410,901) | |
| Capital gain distributions received from underlying funds | 136,844 | | 176,676 | |
| (828,042) | | (1,234,225) | |
| | |
| Change in net unrealized appreciation (depreciation) on investments in underlying funds | 1,277,824 | | 2,089,579 | |
| | |
| Net realized and unrealized gain (loss) on affiliates | 449,782 | | 855,354 | |
| | |
| Net Increase (Decrease) in Net Assets Resulting from Operations | $ | 1,182,059 | | $ | 1,660,583 | |
See Notes to Financial Statements.
| | | | | | | | |
| YEAR ENDED JULY 31, 2023 |
| One Choice
Blend+
2035 Portfolio | One Choice
Blend+
2040 Portfolio |
| Investment Income (Loss) | | |
| Income from Affiliates: | | |
| Income distributions from underlying funds | $ | 763,348 | | $ | 678,694 | |
| | |
| Expenses: | | |
| Management fees | 72,445 | | 64,664 | |
| Distribution and service fees: | | |
| A Class | 11 | | 75 | |
| R Class | 771 | | 813 | |
| Directors' fees and expenses | 822 | | 781 | |
| Other expenses | 164 | | 115 | |
| 74,213 | | 66,448 | |
| Fees waived | (780) | | — | |
| 73,433 | | 66,448 | |
| | |
| Net investment income (loss) | 689,915 | | 612,246 | |
| | |
| Realized and Unrealized Gain (Loss) on Affiliates | | |
| Net realized gain (loss) on: | | |
| Sales of investments in underlying funds | (1,887,921) | | (1,031,481) | |
| Capital gain distributions received from underlying funds | 167,451 | | 168,339 | |
| (1,720,470) | | (863,142) | |
| | |
| Change in net unrealized appreciation (depreciation) on investments in underlying funds | 2,726,631 | | 2,393,003 | |
| | |
| Net realized and unrealized gain (loss) on affiliates | 1,006,161 | | 1,529,861 | |
| | |
| Net Increase (Decrease) in Net Assets Resulting from Operations | $ | 1,696,076 | | $ | 2,142,107 | |
See Notes to Financial Statements.
| | | | | | | | |
| YEAR ENDED JULY 31, 2023 |
| One Choice
Blend+
2045 Portfolio | One Choice
Blend+
2050 Portfolio |
| Investment Income (Loss) | | |
| Income from Affiliates: | | |
| Income distributions from underlying funds | $ | 669,968 | | $ | 455,923 | |
| | |
| Expenses: | | |
| Management fees | 70,466 | | 51,507 | |
| Distribution and service fees: | | |
| A Class | 11 | | 11 | |
| R Class | 747 | | 1,001 | |
| Directors' fees and expenses | 858 | | 623 | |
| Other expenses | 127 | | 148 | |
| 72,209 | | 53,290 | |
| | |
| Net investment income (loss) | 597,759 | | 402,633 | |
| | |
| Realized and Unrealized Gain (Loss) on Affiliates | | |
| Net realized gain (loss) on: | | |
| Sales of investments in underlying funds | (1,378,385) | | (863,489) | |
| Capital gain distributions received from underlying funds | 188,777 | | 150,552 | |
| (1,189,608) | | (712,937) | |
| | |
| Change in net unrealized appreciation (depreciation) on investments in underlying funds | 3,130,638 | | 2,417,276 | |
| | |
| Net realized and unrealized gain (loss) on affiliates | 1,941,030 | | 1,704,339 | |
| | |
| Net Increase (Decrease) in Net Assets Resulting from Operations | $ | 2,538,789 | | $ | 2,106,972 | |
See Notes to Financial Statements.
| | | | | | | | |
| YEAR ENDED JULY 31, 2023 |
| One Choice
Blend+
2055 Portfolio | One Choice
Blend+
2060 Portfolio |
| Investment Income (Loss) | | |
| Income from Affiliates: | | |
| Income distributions from underlying funds | $ | 248,983 | | $ | 147,890 | |
| | |
| Expenses: | | |
| Management fees | 30,199 | | 19,901 | |
| Distribution and service fees: | | |
| A Class | 11 | | 13 | |
| R Class | 807 | | 338 | |
| Directors' fees and expenses | 364 | | 218 | |
| Other expenses | 184 | | 199 | |
| 31,565 | | 20,669 | |
| | |
| Net investment income (loss) | 217,418 | | 127,221 | |
| | |
| Realized and Unrealized Gain (Loss) on Affiliates | | |
| Net realized gain (loss) on: | | |
| Sales of investments in underlying funds | (920,292) | | (360,966) | |
| Capital gain distributions received from underlying funds | 89,395 | | 55,819 | |
| (830,897) | | (305,147) | |
| | |
| Change in net unrealized appreciation (depreciation) on investments in underlying funds | 1,728,502 | | 1,079,240 | |
| | |
| Net realized and unrealized gain (loss) on affiliates | 897,605 | | 774,093 | |
| | |
| Net Increase (Decrease) in Net Assets Resulting from Operations | $ | 1,115,023 | | $ | 901,314 | |
See Notes to Financial Statements.
| | | | | |
| YEAR ENDED JULY 31, 2023 | |
| One Choice
Blend+
2065 Portfolio |
| Investment Income (Loss) | |
| Income from Affiliates: | |
| Income distributions from underlying funds | $ | 48,455 | |
| |
| Expenses: | |
| Management fees | 11,778 | |
| Distribution and service fees: | |
| A Class | 11 | |
| R Class | 1,147 | |
| Directors' fees and expenses | 84 | |
| Other expenses | 257 | |
| 13,277 | |
| |
| Net investment income (loss) | 35,178 | |
| |
| Realized and Unrealized Gain (Loss) on Affiliates | |
| Net realized gain (loss) on: | |
| Sales of investments in underlying funds | (283,525) | |
| Capital gain distributions received from underlying funds | 17,131 | |
| (266,394) | |
| |
| Change in net unrealized appreciation (depreciation) on investments in underlying funds | 529,517 | |
| |
| Net realized and unrealized gain (loss) on affiliates | 263,123 | |
| |
| Net Increase (Decrease) in Net Assets Resulting from Operations | $ | 298,301 | |
See Notes to Financial Statements.
| | |
| Statements of Changes in Net Assets |
| | | | | | | | | | | | | | |
| YEARS ENDED JULY 31, 2023 AND JULY 31, 2022 |
| One Choice
Blend+
2015 Portfolio | One Choice
Blend+
2020 Portfolio |
| Increase (Decrease) in Net Assets | July 31, 2023 | July 31, 2022 | July 31, 2023 | July 31, 2022 |
| Operations | | | | |
| Net investment income (loss) | $ | 130,712 | | $ | 32,769 | | $ | 322,376 | | $ | 98,821 | |
| Net realized gain (loss) | (166,826) | | (27,440) | | (322,425) | | (130,635) | |
| Change in net unrealized appreciation (depreciation) | 150,990 | | (185,890) | | 526,641 | | (549,434) | |
| Net increase (decrease) in net assets resulting from operations | 114,876 | | (180,561) | | 526,592 | | (581,248) | |
| | | | |
| Distributions to Shareholders | | | | |
| From earnings: | | | | |
| Investor Class | (11,157) | | (8,642) | | (41,607) | | (33,063) | |
| I Class | (139) | | (119) | | (304) | | (256) | |
| A Class | (117) | | (99) | | (234) | | (217) | |
| R Class | (148) | | (116) | | (328) | | (196) | |
| R6 Class | (103,090) | | (125) | | (224,312) | | (269) | |
| Decrease in net assets from distributions | (114,651) | | (9,101) | | (266,785) | | (34,001) | |
| | | | |
| Capital Share Transactions | | | | |
| Net increase (decrease) in net assets from capital share transactions (Note 5) | 357,198 | | 4,203,786 | | 5,035,005 | | 8,024,295 | |
| | | | |
| Net increase (decrease) in net assets | 357,423 | | 4,014,124 | | 5,294,812 | | 7,409,046 | |
| | | | |
| Net Assets | | | | |
| Beginning of period | 4,188,283 | | 174,159 | | 7,466,757 | | 57,711 | |
| End of period | $ | 4,545,706 | | $ | 4,188,283 | | $ | 12,761,569 | | $ | 7,466,757 | |
See Notes to Financial Statements.
| | | | | | | | | | | | | | |
| YEARS ENDED JULY 31, 2023 AND JULY 31, 2022 |
| One Choice
Blend+
2025 Portfolio | One Choice
Blend+
2030 Portfolio |
| Increase (Decrease) in Net Assets | July 31, 2023 | July 31, 2022 | July 31, 2023 | July 31, 2022 |
| Operations | | | | |
| Net investment income (loss) | $ | 732,277 | | $ | 215,105 | | $ | 805,229 | | $ | 232,354 | |
| Net realized gain (loss) | (828,042) | | (181,383) | | (1,234,225) | | (66,434) | |
| Change in net unrealized appreciation (depreciation) | 1,277,824 | | (1,012,713) | | 2,089,579 | | (1,693,272) | |
| Net increase (decrease) in net assets resulting from operations | 1,182,059 | | (978,991) | | 1,660,583 | | (1,527,352) | |
| | | | |
| Distributions to Shareholders | | | | |
| From earnings: | | | | |
| Investor Class | (115,870) | | (79,040) | | (130,061) | | (77,258) | |
| I Class | (145) | | (152) | | (158) | | (145) | |
| A Class | (124) | | (133) | | (136) | | (126) | |
| R Class | (423) | | (1,127) | | (2,701) | | (1,133) | |
| R6 Class | (566,153) | | (159) | | (746,796) | | (152) | |
| Decrease in net assets from distributions | (682,715) | | (80,611) | | (879,852) | | (78,814) | |
| | | | |
| Capital Share Transactions | | | | |
| Net increase (decrease) in net assets from capital share transactions (Note 5) | 4,393,157 | | 22,078,009 | | 7,546,685 | | 23,608,775 | |
| | | | |
| Net increase (decrease) in net assets | 4,892,501 | | 21,018,407 | | 8,327,416 | | 22,002,609 | |
| | | | |
| Net Assets | | | | |
| Beginning of period | 22,675,830 | | 1,657,423 | | 24,030,334 | | 2,027,725 | |
| End of period | $ | 27,568,331 | | $ | 22,675,830 | | $ | 32,357,750 | | $ | 24,030,334 | |
See Notes to Financial Statements.
| | | | | | | | | | | | | | |
| YEARS ENDED JULY 31, 2023 AND JULY 31, 2022 |
| One Choice
Blend+
2035 Portfolio | One Choice
Blend+
2040 Portfolio |
| Increase (Decrease) in Net Assets | July 31, 2023 | July 31, 2022 | July 31, 2023 | July 31, 2022 |
| Operations | | | | |
| Net investment income (loss) | $ | 689,915 | | $ | 216,549 | | $ | 612,246 | | $ | 143,871 | |
| Net realized gain (loss) | (1,720,470) | | (86,219) | | (863,142) | | 79,389 | |
| Change in net unrealized appreciation (depreciation) | 2,726,631 | | (2,026,724) | | 2,393,003 | | (1,557,088) | |
| Net increase (decrease) in net assets resulting from operations | 1,696,076 | | (1,896,394) | | 2,142,107 | | (1,333,828) | |
| | | | |
| Distributions to Shareholders | | | | |
| From earnings: | | | | |
| Investor Class | (110,586) | | (62,283) | | (45,457) | | (30,962) | |
| I Class | (930) | | (869) | | (146) | | (159) | |
| A Class | (139) | | (130) | | (818) | | (903) | |
| R Class | (3,695) | | (575) | | (3,493) | | (1,900) | |
| R6 Class | (714,197) | | (156) | | (696,210) | | (165) | |
| Decrease in net assets from distributions | (829,547) | | (64,013) | | (746,124) | | (34,089) | |
| | | | |
| Capital Share Transactions | | | | |
| Net increase (decrease) in net assets from capital share transactions (Note 5) | 7,816,280 | | 24,146,924 | | 7,655,433 | | 21,795,891 | |
| | | | |
| Net increase (decrease) in net assets | 8,682,809 | | 22,186,517 | | 9,051,416 | | 20,427,974 | |
| | | | |
| Net Assets | | | | |
| Beginning of period | 23,866,260 | | 1,679,743 | | 21,266,695 | | 838,721 | |
| End of period | $ | 32,549,069 | | $ | 23,866,260 | | $ | 30,318,111 | | $ | 21,266,695 | |
See Notes to Financial Statements.
| | | | | | | | | | | | | | |
| YEARS ENDED JULY 31, 2023 AND JULY 31, 2022 |
| One Choice
Blend+
2045 Portfolio | One Choice
Blend+
2050 Portfolio |
| Increase (Decrease) in Net Assets | July 31, 2023 | July 31, 2022 | July 31, 2023 | July 31, 2022 |
| Operations | | | | |
| Net investment income (loss) | $ | 597,759 | | $ | 137,938 | | $ | 402,633 | | $ | 99,287 | |
| Net realized gain (loss) | (1,189,608) | | 26,337 | | (712,937) | | 94,957 | |
| Change in net unrealized appreciation (depreciation) | 3,130,638 | | (1,614,496) | | 2,417,276 | | (1,180,048) | |
| Net increase (decrease) in net assets resulting from operations | 2,538,789 | | (1,450,221) | | 2,106,972 | | (985,804) | |
| | | | |
| Distributions to Shareholders | | | | |
| From earnings: | | | | |
| Investor Class | (60,832) | | (23,979) | | (39,876) | | (28,443) | |
| I Class | (425) | | (450) | | (140) | | (171) | |
| A Class | (127) | | (136) | | (119) | | (151) | |
| R Class | (1,996) | | (562) | | (5,182) | | (3,333) | |
| R6 Class | (736,554) | | (162) | | (517,760) | | (178) | |
| Decrease in net assets from distributions | (799,934) | | (25,289) | | (563,077) | | (32,276) | |
| | | | |
| Capital Share Transactions | | | | |
| Net increase (decrease) in net assets from capital share transactions (Note 5) | 7,798,966 | | 25,181,867 | | 7,005,527 | | 16,793,129 | |
| | | | |
| Net increase (decrease) in net assets | 9,537,821 | | 23,706,357 | | 8,549,422 | | 15,775,049 | |
| | | | |
| Net Assets | | | | |
| Beginning of period | 24,168,643 | | 462,286 | | 16,717,329 | | 942,280 | |
| End of period | $ | 33,706,464 | | $ | 24,168,643 | | $ | 25,266,751 | | $ | 16,717,329 | |
See Notes to Financial Statements.
| | | | | | | | | | | | | | |
| YEARS ENDED JULY 31, 2023 AND JULY 31, 2022 |
| One Choice
Blend+
2055 Portfolio | One Choice
Blend+
2060 Portfolio |
| Increase (Decrease) in Net Assets | July 31, 2023 | July 31, 2022 | July 31, 2023 | July 31, 2022 |
| Operations | | | | |
| Net investment income (loss) | $ | 217,418 | | $ | 62,354 | | $ | 127,221 | | $ | 27,300 | |
| Net realized gain (loss) | (830,897) | | 5,601 | | (305,147) | | (11,708) | |
| Change in net unrealized appreciation (depreciation) | 1,728,502 | | (805,092) | | 1,079,240 | | (307,513) | |
| Net increase (decrease) in net assets resulting from operations | 1,115,023 | | (737,137) | | 901,314 | | (291,921) | |
| | | | |
| Distributions to Shareholders | | | | |
| From earnings: | | | | |
| Investor Class | (26,304) | | (19,309) | | (19,913) | | (11,161) | |
| I Class | (151) | | (174) | | (283) | | (291) | |
| A Class | (130) | | (154) | | (110) | | (150) | |
| R Class | (3,758) | | (1,760) | | (715) | | (796) | |
| R6 Class | (311,208) | | (181) | | (151,110) | | (176) | |
| Decrease in net assets from distributions | (341,551) | | (21,578) | | (172,131) | | (12,574) | |
| | | | |
| Capital Share Transactions | | | | |
| Net increase (decrease) in net assets from capital share transactions (Note 5) | 3,150,885 | | 10,778,001 | | 4,605,313 | | 4,635,724 | |
| | | | |
| Net increase (decrease) in net assets | 3,924,357 | | 10,019,286 | | 5,334,496 | | 4,331,229 | |
| | | | |
| Net Assets | | | | |
| Beginning of period | 10,468,279 | | 448,993 | | 4,672,253 | | 341,024 | |
| End of period | $ | 14,392,636 | | $ | 10,468,279 | | $ | 10,006,749 | | $ | 4,672,253 | |
See Notes to Financial Statements.
| | | | | | | | |
| YEARS ENDED JULY 31, 2023 AND JULY 31, 2022 |
| One Choice
Blend+
2065 Portfolio |
| Increase (Decrease) in Net Assets | July 31, 2023 | July 31, 2022 |
| Operations | | |
| Net investment income (loss) | $ | 35,178 | | $ | 33,674 | |
| Net realized gain (loss) | (266,394) | | (26,662) | |
| Change in net unrealized appreciation (depreciation) | 529,517 | | (201,882) | |
| Net increase (decrease) in net assets resulting from operations | 298,301 | | (194,870) | |
| | |
| Distributions to Shareholders | | |
| From earnings: | | |
| Investor Class | (48,349) | | (22,091) | |
| I Class | (190) | | (174) | |
| A Class | (169) | | (154) | |
| R Class | (8,700) | | (5,230) | |
| R6 Class | (17,451) | | (180) | |
| Decrease in net assets from distributions | (74,859) | | (27,829) | |
| | |
| Capital Share Transactions | | |
| Net increase (decrease) in net assets from capital share transactions (Note 5) | 1,179,034 | | 1,897,393 | |
| | |
| Net increase (decrease) in net assets | 1,402,476 | | 1,674,694 | |
| | |
| Net Assets | | |
| Beginning of period | 2,281,511 | | 606,817 | |
| End of period | $ | 3,683,987 | | $ | 2,281,511 | |
See Notes to Financial Statements.
| | |
| Notes to Financial Statements |
JULY 31, 2023
1. Organization
American Century Asset Allocation Portfolios, Inc. (the corporation) is registered under the Investment Company Act of 1940, as amended (the 1940 Act), as an open-end management investment company and is organized as a Maryland corporation. One Choice Blend+ 2015 Portfolio, One Choice Blend+ 2020 Portfolio, One Choice Blend+ 2025 Portfolio, One Choice Blend+ 2030 Portfolio, One Choice Blend+ 2035 Portfolio, One Choice Blend+ 2040 Portfolio, One Choice Blend+ 2045 Portfolio, One Choice Blend+ 2050 Portfolio, One Choice Blend+ 2055 Portfolio, One Choice Blend+ 2060 Portfolio and One Choice Blend+ 2065 Portfolio (collectively, the funds) are eleven funds in a series issued by the corporation. The funds operate as “funds of funds,” meaning substantially all of the funds’ assets will be invested in varying combinations of other mutual funds and exchange-traded funds advised by American Century Investments (the underlying funds). Each fund’s assets are allocated among underlying funds that represent major asset classes, including equity securities, fixed-income securities and short-term investments. The funds will assume the risks associated with their underlying funds. Additional information and attributes of each underlying fund are available at americancentury.com or avantisinvestors.com. Each fund's investment objective is to seek the highest total return consistent with its asset mix.
The funds offer the Investor Class, I Class, A Class, R Class and R6 Class. The A Class may incur an initial sales charge and may be subject to a contingent deferred sales charge.
2. Significant Accounting Policies
The following is a summary of significant accounting policies consistently followed by the funds in preparation of their financial statements. Each fund is an investment company and follows accounting and reporting guidance in accordance with accounting principles generally accepted in the United States of America. This may require management to make certain estimates and assumptions at the date of the financial statements. Actual results could differ from these estimates. Management evaluated the impact of events or transactions occurring through the date the financial statements were issued that would merit recognition or disclosure.
Investment Valuations — The funds determine the fair value of their investments and compute their net asset value (NAV) per share at the close of regular trading (usually 4 p.m. Eastern time) on the New York Stock Exchange (NYSE) on each day the NYSE is open. The value of investments of the funds are determined by American Century Investment Management, Inc. (ACIM) (the investment advisor), as the valuation designee, pursuant to its valuation policies and procedures. The Board of Directors oversees the valuation designee and reviews its valuation policies and procedures at least annually.
Open-end management investment companies are valued at their reported NAV. Exchange-traded funds are listed or traded on a domestic securities exchange and are valued at the last reported sales price or at the official closing price as provided by the exchange.
Security Transactions — Security transactions are accounted for as of the trade date. Net realized gains and losses are determined on the identified cost basis, which is also used for federal income tax purposes.
Investment Income — Income and capital gain distributions, if any, from the underlying funds are recorded as of the ex-dividend date. Long-term capital gain distributions, if any, from the underlying funds are a component of net realized gain (loss).
Income Tax Status — It is each fund's policy to distribute substantially all net investment income and net realized gains to shareholders and to otherwise qualify as a regulated investment company under provisions of the Internal Revenue Code. Accordingly, no provision has been made for income taxes. The funds file U.S. federal, state, local and non-U.S. tax returns as applicable. The funds' tax returns are subject to examination by the relevant taxing authority until expiration of the applicable statute of limitations, which is generally three years from the date of filing but can be longer in certain jurisdictions. At this time, management believes there are no uncertain tax positions which, based on their technical merit, would not be sustained upon examination and for which it is reasonably possible that the total amounts of unrecognized tax benefits will significantly change in the next twelve months.
Multiple Class — All shares of each fund represent an equal pro rata interest in the net assets of the class to which such shares belong, and have identical voting, dividend, liquidation and other rights and the same terms and conditions, except for class specific expenses and exclusive rights to vote on matters affecting only individual classes. Income, non-class specific expenses, and realized and unrealized capital gains and losses of the funds are allocated to each class of shares based on their relative net assets.
Distributions to Shareholders — Distributions from net investment income and net realized gains, if any, are generally declared and paid annually.
Indemnifications — Under the corporation’s organizational documents, its officers and directors are indemnified against certain liabilities arising out of the performance of their duties to the funds. In addition, in the normal course of business, the funds enter into contracts that provide general indemnifications. The maximum exposure under these arrangements is unknown as this would involve future claims that may be made against a fund. The risk of material loss from such claims is considered by management to be remote.
3. Fees and Transactions with Related Parties
Certain officers and directors of the corporation are also officers and/or directors of American Century Companies, Inc. (ACC). The corporation's investment advisor, ACIM, the corporation's distributor, American Century Investment Services, Inc. (ACIS), and the corporation's transfer agent, American Century Services, LLC, are wholly owned, directly or indirectly, by ACC. ACIM serves as the investment advisor for the underlying funds.
Management Fees — The corporation has entered into a management agreement with ACIM, under which ACIM provides the funds with investment advisory and management services in exchange for a single, unified management fee (the fee) per class. The agreement provides that ACIM will pay all expenses of managing and operating the funds, except brokerage expenses, taxes, interest, fees and expenses of the independent directors (including legal counsel fees), extraordinary expenses, and expenses incurred in connection with the provision of shareholder services and distribution services under a plan adopted pursuant to Rule 12b-1 under the 1940 Act. The fee is computed and accrued daily based on the daily net assets of each class of each fund and paid monthly in arrears. The difference in the fee among the classes of each fund is a result of their separate arrangements for non-Rule 12b-1 shareholder services. It is not the result of any difference in advisory or custodial fees or other expenses related to the management of each fund’s assets, which do not vary by class.
The annual management fee for each class of each fund is as follows:
| | | | | | | | |
Investor, A and R Classes | I Class | R6 Class |
| 0.58% | 0.38% | 0.23% |
The investment advisor will waive the portion of each fund's management fee equal to the expenses attributable to the management fees of the underlying funds in which the funds invest. The amount of this waiver will fluctuate depending on each fund's daily allocation to the underlying funds. This waiver is expected to remain in effect permanently and it cannot be terminated without the approval of the Board of Directors.
For the period ended July 31, 2023, the fee waiver and the effective annual management fee after waiver for each class of each fund listed below are as follows:
| | | | | | | | | | | | | | |
| | Effective Annual Management Fee After Waiver |
| Fee Waiver | Investor, A and R Classes | I Class | R6 Class |
| One Choice Blend+ 2015 Portfolio | 0.01% | 0.57% | 0.37% | 0.22% |
| One Choice Blend+ 2020 Portfolio | 0.01% | 0.57% | 0.37% | 0.22% |
| One Choice Blend+ 2025 Portfolio | 0.01% | 0.57% | 0.37% | 0.22% |
| One Choice Blend+ 2030 Portfolio | 0.01% | 0.57% | 0.37% | 0.22% |
| One Choice Blend+ 2035 Portfolio | 0.00%* | 0.58% | 0.38% | 0.23% |
*Fee waiver was less than 0.005%.
The total amount of the waiver for each class of each fund listed below for the period ended July 31, 2023 is as follows:
| | | | | | | | | | | | | | | | | |
| Investor Class | I Class* | A Class* | R Class* | R6 Class |
| One Choice Blend+ 2015 Portfolio | $61 | $17 | — | — | $479 |
| One Choice Blend+ 2020 Portfolio | $182 | — | — | $1 | $1,151 |
| One Choice Blend+ 2025 Portfolio | $407 | — | — | $2 | $2,053 |
| One Choice Blend+ 2030 Portfolio | $288 | — | — | $8 | $1,676 |
| One Choice Blend+ 2035 Portfolio | $106 | — | — | $5 | $669 |
*Amounts shown as "—" were less than $0.50.
Distribution and Service Fees — The Board of Directors has adopted a separate Master Distribution and Individual Shareholder Services Plan for each of the A Class and R Class (collectively the plans), pursuant to Rule 12b-1 of the 1940 Act. The plans provide that the A Class will pay ACIS an annual distribution and service fee of 0.25%. The plans provide that the R Class will pay ACIS an annual distribution and service fee of 0.50%. The fees are computed and accrued daily based on each class’s daily net assets and paid monthly in arrears. These fees are used to pay financial intermediaries for distribution and individual shareholder services. Fees incurred under the plans during the period ended July 31, 2023 are detailed in the Statements of Operations.
Directors' Fees and Expenses — The Board of Directors is responsible for overseeing the investment advisor’s management and operations of the funds. The directors receive detailed information about the funds and their investment advisor regularly throughout the year, and meet at least quarterly with management of the investment advisor to review reports about fund operations. The funds' officers do not receive compensation from the funds.
4. Investment Transactions
Investment transactions for the period ended July 31, 2023 were as follows:
| | | | | | | | | | | | | | |
| One Choice
Blend+
2015 Portfolio | One Choice
Blend+
2020 Portfolio | One Choice
Blend+
2025 Portfolio | One Choice
Blend+
2030 Portfolio |
| Purchases | $1,854,791 | | $8,237,129 | | $14,293,212 | | $17,649,824 | |
| Sales | $1,460,861 | | $3,095,836 | | $9,713,640 | | $10,001,089 | |
| | | | | | | | | | | | | | |
| One Choice
Blend+
2035 Portfolio | One Choice
Blend+
2040 Portfolio | One Choice
Blend+
2045 Portfolio | One Choice
Blend+
2050 Portfolio |
| Purchases | $17,001,353 | | $12,888,856 | | $14,340,134 | | $11,050,943 | |
| Sales | $9,159,700 | | $5,198,970 | | $6,554,574 | | $4,055,312 | |
| | | | | | | | | | | |
| One Choice
Blend+
2055 Portfolio | One Choice
Blend+
2060 Portfolio | One Choice
Blend+
2065 Portfolio |
| Purchases | $6,992,070 | | $6,276,389 | | $2,874,434 | |
| Sales | $3,875,924 | | $1,660,167 | | $1,717,959 | |
5. Capital Share Transactions
The corporation is authorized to issue 6,000,000,000 shares. Transactions in shares of the funds were as follows:
| | | | | | | | | | | | | | |
| Year ended
July 31, 2023 | Year ended
July 31, 2022 |
| Shares | Amount | Shares | Amount |
| One Choice Blend+ 2015 Portfolio | | | | |
| Investor Class | | | | |
| Sold | 28,256 | | $ | 257,663 | | 29,334 | | $ | 307,041 | |
| Issued in reinvestment of distributions | 1,274 | | 11,157 | | 832 | | 8,642 | |
| Redeemed | (15,675) | | (143,305) | | (4,065) | | (40,423) | |
| 13,855 | | 125,515 | | 26,101 | | 275,260 | |
| I Class | | | | |
| Sold | 35,704 | | 322,408 | | 957 | | 9,950 | |
| Issued in reinvestment of distributions | 16 | | 139 | | 11 | | 119 | |
| Redeemed | — | | — | | (957) | | (10,007) | |
| 35,720 | | 322,547 | | 11 | | 62 | |
| A Class | | | | |
| Issued in reinvestment of distributions | 13 | | 117 | | 10 | | 99 | |
| R Class | | | | |
| Sold | 143 | | 1,292 | | 293 | | 2,976 | |
| Issued in reinvestment of distributions | 17 | | 148 | | 11 | | 116 | |
| Redeemed | (321) | | (2,943) | | (104) | | (1,020) | |
| (161) | | (1,503) | | 200 | | 2,072 | |
| R6 Class | | | | |
| Sold | 92,426 | | 845,707 | | 469,331 | | 4,571,586 | |
| Issued in reinvestment of distributions | 11,768 | | 103,090 | | 12 | | 125 | |
| Redeemed | (114,793) | | (1,038,275) | | (67,933) | | (645,418) | |
| (10,599) | | (89,478) | | 401,410 | | 3,926,293 | |
| Net increase (decrease) | 38,828 | | $ | 357,198 | | 427,732 | | $ | 4,203,786 | |
| | | | | | | | | | | | | | |
| Year ended
July 31, 2023 | Year ended
July 31, 2022 |
| Shares | Amount | Shares | Amount |
| One Choice Blend+ 2020 Portfolio | | | | |
| Investor Class | | | | |
| Sold | 102,868 | | $ | 948,599 | | 157,301 | | $ | 1,661,090 | |
| Issued in reinvestment of distributions | 4,739 | | 41,607 | | 3,164 | | 33,063 | |
| Redeemed | (85,254) | | (784,059) | | (45,324) | | (421,011) | |
| 22,353 | | 206,147 | | 115,141 | | 1,273,142 | |
| I Class | | | | |
| Sold | — | | — | | 101 | | 976 | |
| Issued in reinvestment of distributions | 35 | | 304 | | 24 | | 256 | |
| 35 | | 304 | | 125 | | 1,232 | |
| A Class | | | | |
| Issued in reinvestment of distributions | 26 | | 234 | | 21 | | 217 | |
| R Class | | | | |
| Sold | 533 | | 4,687 | | 274 | | 2,537 | |
| Issued in reinvestment of distributions | 37 | | 328 | | 19 | | 196 | |
| Redeemed | (464) | | (4,225) | | (6) | | (57) | |
| 106 | | 790 | | 287 | | 2,676 | |
| R6 Class | | | | |
| Sold | 779,601 | | 6,976,215 | | 792,578 | | 7,916,422 | |
| Issued in reinvestment of distributions | 25,548 | | 224,312 | | 26 | | 269 | |
| Redeemed | (266,966) | | (2,372,997) | | (122,762) | | (1,169,663) | |
| 538,183 | | 4,827,530 | | 669,842 | | 6,747,028 | |
| Net increase (decrease) | 560,703 | | $ | 5,035,005 | | 785,416 | | $ | 8,024,295 | |
| | | | | | | | | | | | | | |
| Year ended
July 31, 2023 | Year ended
July 31, 2022 |
| Shares | Amount | Shares | Amount |
| One Choice Blend+ 2025 Portfolio | | | | |
| Investor Class | | | | |
| Sold | 173,105 | | $ | 1,578,887 | | 273,091 | | $ | 2,786,933 | |
| Issued in reinvestment of distributions | 13,411 | | 115,870 | | 7,607 | | 79,040 | |
| Redeemed | (56,025) | | (505,050) | | (103,721) | | (1,041,359) | |
| 130,491 | | 1,189,707 | | 176,977 | | 1,824,614 | |
| I Class | | | | |
| Sold | 8 | | 69 | | — | | — | |
| Issued in reinvestment of distributions | 16 | | 145 | | 15 | | 152 | |
| 24 | | 214 | | 15 | | 152 | |
| A Class | | | | |
| Issued in reinvestment of distributions | 14 | | 124 | | 13 | | 133 | |
| R Class | | | | |
| Sold | 1,480 | | 13,317 | | 5,338 | | 54,840 | |
| Issued in reinvestment of distributions | 49 | | 423 | | 108 | | 1,127 | |
| Redeemed | (186) | | (1,681) | | (4,961) | | (49,162) | |
| 1,343 | | 12,059 | | 485 | | 6,805 | |
| R6 Class | | | | |
| Sold | 1,309,364 | | 11,657,875 | | 2,383,054 | | 22,904,859 | |
| Issued in reinvestment of distributions | 65,527 | | 566,153 | | 15 | | 159 | |
| Redeemed | (1,000,855) | | (9,032,975) | | (282,734) | | (2,658,713) | |
| 374,036 | | 3,191,053 | | 2,100,335 | | 20,246,305 | |
| Net increase (decrease) | 505,908 | | $ | 4,393,157 | | 2,277,825 | | $ | 22,078,009 | |
| | | | | | | | | | | | | | |
| Year ended
July 31, 2023 | Year ended
July 31, 2022 |
| Shares | Amount | Shares | Amount |
| One Choice Blend+ 2030 Portfolio | | | | |
| Investor Class | | | | |
| Sold | 279,207 | | $ | 2,518,740 | | 275,586 | | $ | 2,802,570 | |
| Issued in reinvestment of distributions | 15,176 | | 130,061 | | 7,400 | | 77,258 | |
| Redeemed | (233,394) | | (2,113,495) | | (94,183) | | (931,007) | |
| 60,989 | | 535,306 | | 188,803 | | 1,948,821 | |
| I Class | | | | |
| Issued in reinvestment of distributions | 18 | | 158 | | 14 | | 145 | |
| A Class | | | | |
| Sold | 159 | | 1,445 | | — | | — | |
| Issued in reinvestment of distributions | 16 | | 136 | | 12 | | 126 | |
| 175 | | 1,581 | | 12 | | 126 | |
| R Class | | | | |
| Sold | 10,073 | | 90,499 | | 7,165 | | 72,518 | |
| Issued in reinvestment of distributions | 315 | | 2,701 | | 109 | | 1,133 | |
| Redeemed | (1,352) | | (12,089) | | (168) | | (1,658) | |
| 9,036 | | 81,111 | | 7,106 | | 71,993 | |
| R6 Class | | | | |
| Sold | 1,525,978 | | 13,600,958 | | 2,446,874 | | 23,955,298 | |
| Issued in reinvestment of distributions | 87,141 | | 746,796 | | 15 | | 152 | |
| Redeemed | (839,377) | | (7,419,225) | | (242,421) | | (2,367,760) | |
| 773,742 | | 6,928,529 | | 2,204,468 | | 21,587,690 | |
| Net increase (decrease) | 843,960 | | $ | 7,546,685 | | 2,400,403 | | $ | 23,608,775 | |
| | | | | | | | | | | | | | |
| Year ended
July 31, 2023 | Year ended
July 31, 2022 |
| Shares | Amount | Shares | Amount |
| One Choice Blend+ 2035 Portfolio | | | | |
| Investor Class | | | | |
| Sold | 224,642 | | $ | 2,028,853 | | 262,874 | | $ | 2,638,852 | |
| Issued in reinvestment of distributions | 13,056 | | 110,586 | | 5,949 | | 62,283 | |
| Redeemed | (59,234) | | (527,635) | | (88,154) | | (882,461) | |
| 178,464 | | 1,611,804 | | 180,669 | | 1,818,674 | |
| I Class | | | | |
| Issued in reinvestment of distributions | 110 | | 930 | | 83 | | 869 | |
| A Class | | | | |
| Sold | 79 | | 729 | | — | | — | |
| Issued in reinvestment of distributions | 17 | | 139 | | 12 | | 130 | |
| 96 | | 868 | | 12 | | 130 | |
| R Class | | | | |
| Sold | 23,644 | | 207,577 | | 8,725 | | 82,957 | |
| Issued in reinvestment of distributions | 436 | | 3,695 | | 54 | | 575 | |
| Redeemed | (10,571) | | (91,394) | | (302) | | (3,038) | |
| 13,509 | | 119,878 | | 8,477 | | 80,494 | |
| R6 Class | | | | |
| Sold | 1,609,818 | | 14,214,223 | | 2,476,842 | | 24,299,869 | |
| Issued in reinvestment of distributions | 84,321 | | 714,197 | | 15 | | 156 | |
| Redeemed | (1,032,182) | | (8,845,620) | | (225,557) | | (2,053,268) | |
| 661,957 | | 6,082,800 | | 2,251,300 | | 22,246,757 | |
| Net increase (decrease) | 854,136 | | $ | 7,816,280 | | 2,440,541 | | $ | 24,146,924 | |
| | | | | | | | | | | | | | |
| Year ended
July 31, 2023 | Year ended
July 31, 2022 |
| Shares | Amount | Shares | Amount |
| One Choice Blend+ 2040 Portfolio | | | | |
| Investor Class | | | | |
| Sold | 168,755 | | $ | 1,500,892 | | 100,859 | | $ | 1,027,733 | |
| Issued in reinvestment of distributions | 5,373 | | 45,457 | | 2,946 | | 30,962 | |
| Redeemed | (32,247) | | (288,309) | | (17,431) | | (177,326) | |
| 141,881 | | 1,258,040 | | 86,374 | | 881,369 | |
| I Class | | | | |
| Issued in reinvestment of distributions | 17 | | 146 | | 15 | | 159 | |
| A Class | | | | |
| Sold | — | | — | | 2,753 | | 30,208 | |
| Issued in reinvestment of distributions | 97 | | 818 | | 86 | | 903 | |
| 97 | | 818 | | 2,839 | | 31,111 | |
| R Class | | | | |
| Sold | 17,266 | | 154,434 | | 13,729 | | 136,758 | |
| Issued in reinvestment of distributions | 413 | | 3,493 | | 181 | | 1,900 | |
| Redeemed | (3,418) | | (31,070) | | (4,810) | | (45,509) | |
| 14,261 | | 126,857 | | 9,100 | | 93,149 | |
| R6 Class | | | | |
| Sold | 1,329,519 | | 11,708,579 | | 2,280,688 | | 22,083,742 | |
| Issued in reinvestment of distributions | 82,294 | | 696,210 | | 16 | | 165 | |
| Redeemed | (708,582) | | (6,135,217) | | (134,597) | | (1,293,804) | |
| 703,231 | | 6,269,572 | | 2,146,107 | | 20,790,103 | |
| Net increase (decrease) | 859,487 | | $ | 7,655,433 | | 2,244,435 | | $ | 21,795,891 | |
| | | | | | | | | | | | | | |
| Year ended
July 31, 2023 | Year ended
July 31, 2022 |
| Shares | Amount | Shares | Amount |
| One Choice Blend+ 2045 Portfolio | | | | |
| Investor Class | | | | |
| Sold | 105,273 | | $ | 930,248 | | 164,993 | | $ | 1,633,369 | |
| Issued in reinvestment of distributions | 7,182 | | 60,832 | | 2,266 | | 23,979 | |
| Redeemed | (9,883) | | (88,787) | | (19,864) | | (196,913) | |
| 102,572 | | 902,293 | | 147,395 | | 1,460,435 | |
| I Class | | | | |
| Sold | — | | — | | 942 | | 10,000 | |
| Issued in reinvestment of distributions | 50 | | 425 | | 43 | | 450 | |
| 50 | | 425 | | 985 | | 10,450 | |
| A Class | | | | |
| Issued in reinvestment of distributions | 15 | | 127 | | 13 | | 136 | |
| R Class | | | | |
| Sold | 22,527 | | 201,586 | | 6,620 | | 64,025 | |
| Issued in reinvestment of distributions | 236 | | 1,996 | | 53 | | 562 | |
| Redeemed | (1,341) | | (12,141) | | (1,510) | | (14,013) | |
| 21,422 | | 191,441 | | 5,163 | | 50,574 | |
| R6 Class | | | | |
| Sold | 1,592,289 | | 14,052,672 | | 2,567,009 | | 24,836,124 | |
| Issued in reinvestment of distributions | 87,063 | | 736,554 | | 15 | | 162 | |
| Redeemed | (939,848) | | (8,084,546) | | (128,082) | | (1,176,014) | |
| 739,504 | | 6,704,680 | | 2,438,942 | | 23,660,272 | |
| Net increase (decrease) | 863,563 | | $ | 7,798,966 | | 2,592,498 | | $ | 25,181,867 | |
| | | | | | | | | | | | | | |
| Year ended
July 31, 2023 | Year ended
July 31, 2022 |
| Shares | Amount | Shares | Amount |
| One Choice Blend+ 2050 Portfolio | | | | |
| Investor Class | | | | |
| Sold | 95,387 | | $ | 860,903 | | 97,949 | | $ | 941,829 | |
| Issued in reinvestment of distributions | 4,708 | | 39,876 | | 2,683 | | 28,443 | |
| Redeemed | (70,359) | | (633,022) | | (15,321) | | (152,197) | |
| 29,736 | | 267,757 | | 85,311 | | 818,075 | |
| I Class | | | | |
| Issued in reinvestment of distributions | 17 | | 140 | | 16 | | 171 | |
| A Class | | | | |
| Issued in reinvestment of distributions | 14 | | 119 | | 14 | | 151 | |
| R Class | | | | |
| Sold | 10,421 | | 92,955 | | 14,026 | | 133,137 | |
| Issued in reinvestment of distributions | 612 | | 5,182 | | 315 | | 3,333 | |
| Redeemed | (8,526) | | (76,928) | | (2,775) | | (27,366) | |
| 2,507 | | 21,209 | | 11,566 | | 109,104 | |
| R6 Class | | | | |
| Sold | 1,289,910 | | 11,391,181 | | 1,710,626 | | 16,533,446 | |
| Issued in reinvestment of distributions | 61,201 | | 517,760 | | 17 | | 178 | |
| Redeemed | (606,611) | | (5,192,639) | | (69,888) | | (667,996) | |
| 744,500 | | 6,716,302 | | 1,640,755 | | 15,865,628 | |
| Net increase (decrease) | 776,774 | | $ | 7,005,527 | | 1,737,662 | | $ | 16,793,129 | |
| | | | | | | | | | | | | | |
| Year ended
July 31, 2023 | Year ended
July 31, 2022 |
| Shares | Amount | Shares | Amount |
| One Choice Blend+ 2055 Portfolio | | | | |
| Investor Class | | | | |
| Sold | 77,381 | | $ | 695,015 | | 58,266 | | $ | 585,196 | |
| Issued in reinvestment of distributions | 3,117 | | 26,304 | | 1,818 | | 19,309 | |
| Redeemed | (23,213) | | (213,392) | | (22,416) | | (202,882) | |
| 57,285 | | 507,927 | | 37,668 | | 401,623 | |
| I Class | | | | |
| Issued in reinvestment of distributions | 18 | | 151 | | 16 | | 174 | |
| A Class | | | | |
| Issued in reinvestment of distributions | 15 | | 130 | | 15 | | 154 | |
| R Class | | | | |
| Sold | 13,141 | | 116,363 | | 21,321 | | 211,607 | |
| Issued in reinvestment of distributions | 445 | | 3,758 | | 166 | | 1,760 | |
| Redeemed | (12,012) | | (110,230) | | (3,022) | | (27,561) | |
| 1,574 | | 9,891 | | 18,465 | | 185,806 | |
| R6 Class | | | | |
| Sold | 780,629 | | 6,904,601 | | 1,141,573 | | 11,110,629 | |
| Issued in reinvestment of distributions | 36,829 | | 311,208 | | 17 | | 181 | |
| Redeemed | (540,626) | | (4,583,023) | | (96,616) | | (920,566) | |
| 276,832 | | 2,632,786 | | 1,044,974 | | 10,190,244 | |
| Net increase (decrease) | 335,724 | | $ | 3,150,885 | | 1,101,138 | | $ | 10,778,001 | |
| | | | | | | | | | | | | | |
| Year ended
July 31, 2023 | Year ended
July 31, 2022 |
| Shares | Amount | Shares | Amount |
| One Choice Blend+ 2060 Portfolio | | | | |
| Investor Class | | | | |
| Sold | 104,499 | | $ | 949,784 | | 52,889 | | $ | 524,978 | |
| Issued in reinvestment of distributions | 2,340 | | 19,913 | | 994 | | 10,577 | |
| Redeemed | (25,578) | | (230,516) | | (7,078) | | (70,536) | |
| 81,261 | | 739,181 | | 46,805 | | 465,019 | |
| I Class | | | | |
| Sold | — | | — | | 674 | | 7,130 | |
| Issued in reinvestment of distributions | 33 | | 283 | | 27 | | 291 | |
| 33 | | 283 | | 701 | | 7,421 | |
| A Class | | | | |
| Sold | 63 | | 565 | | 16 | | 140 | |
| Issued in reinvestment of distributions | 13 | | 110 | | 15 | | 150 | |
| 76 | | 675 | | 31 | | 290 | |
| R Class | | | | |
| Sold | 6,287 | | 57,864 | | 10,884 | | 105,523 | |
| Issued in reinvestment of distributions | 84 | | 715 | | 75 | | 796 | |
| Redeemed | (8,228) | | (73,029) | | (2,153) | | (19,550) | |
| (1,857) | | (14,450) | | 8,806 | | 86,769 | |
| R6 Class | | | | |
| Sold | 676,752 | | 6,026,038 | | 468,475 | | 4,506,850 | |
| Issued in reinvestment of distributions | 17,778 | | 151,110 | | 17 | | 176 | |
| Redeemed | (265,723) | | (2,297,524) | | (46,587) | | (430,801) | |
| 428,807 | | 3,879,624 | | 421,905 | | 4,076,225 | |
| Net increase (decrease) | 508,320 | | $ | 4,605,313 | | 478,248 | | $ | 4,635,724 | |
| | | | | | | | | | | | | | |
| Year ended
July 31, 2023 | Year ended
July 31, 2022 |
| Shares | Amount | Shares | Amount |
| One Choice Blend+ 2065 Portfolio | | | | |
| Investor Class | | | | |
| Sold | 96,807 | | $ | 870,407 | | 83,912 | | $ | 842,382 | |
| Issued in reinvestment of distributions | 5,742 | | 48,349 | | 2,060 | | 22,019 | |
| Redeemed | (17,808) | | (158,025) | | (11,632) | | (120,966) | |
| 84,741 | | 760,731 | | 74,340 | | 743,435 | |
| I Class | | | | |
| Issued in reinvestment of distributions | 23 | | 190 | | 16 | | 174 | |
| A Class | | | | |
| Issued in reinvestment of distributions | 20 | | 169 | | 14 | | 154 | |
| R Class | | | | |
| Sold | 21,166 | | 189,228 | | 27,795 | | 288,450 | |
| Issued in reinvestment of distributions | 1,035 | | 8,700 | | 489 | | 5,230 | |
| Redeemed | (13,971) | | (127,976) | | (10,386) | | (103,620) | |
| 8,230 | | 69,952 | | 17,898 | | 190,060 | |
| R6 Class | | | | |
| Sold | 217,518 | | 1,915,455 | | 102,821 | | 992,817 | |
| Issued in reinvestment of distributions | 2,075 | | 17,451 | | 17 | | 180 | |
| Redeemed | (181,396) | | (1,584,914) | | (3,269) | | (29,427) | |
| 38,197 | | 347,992 | | 99,569 | | 963,570 | |
| Net increase (decrease) | 131,211 | | $ | 1,179,034 | | 191,837 | | $ | 1,897,393 | |
6. Fair Value Measurements
The funds' investment valuation process is based on several considerations and may use multiple inputs to determine the fair value of the investments held by the funds. In conformity with accounting principles generally accepted in the United States of America, the inputs used to determine a valuation are classified into three broad levels.
•Level 1 valuation inputs consist of unadjusted quoted prices in an active market for identical investments.
•Level 2 valuation inputs consist of direct or indirect observable market data (including quoted prices for comparable investments, evaluations of subsequent market events, interest rates, prepayment speeds, credit risk, etc.). These inputs also consist of quoted prices for identical investments initially expressed in local currencies that are adjusted through translation into U.S. dollars.
•Level 3 valuation inputs consist of unobservable data (including a fund’s own assumptions).
The level classification is based on the lowest level input that is significant to the fair valuation measurement. The valuation inputs are not necessarily an indication of the risks associated with investing in these securities or other financial instruments.
As of period end, the funds' investment securities were classified as Level 1. The Schedules of Investments provide additional information on the funds' portfolio holdings.
7. Federal Tax Information
The tax character of distributions paid during the years ended July 31, 2023 and July 31, 2022 were as follows:
| | | | | | | | | | | | | | |
| 2023 | 2022 |
| Distributions Paid From: | Distributions Paid From: |
| Ordinary
Income | Long-term Capital Gains | Ordinary
Income | Long-term Capital Gains |
| One Choice Blend+ 2015 Portfolio | $ | 111,580 | | $ | 3,071 | | $ | 9,101 | | — | |
| One Choice Blend+ 2020 Portfolio | $ | 266,785 | | — | | $ | 34,001 | | — | |
| One Choice Blend+ 2025 Portfolio | $ | 619,194 | | $ | 63,521 | | $ | 80,611 | | — | |
| One Choice Blend+ 2030 Portfolio | $ | 688,551 | | $ | 191,301 | | $ | 78,814 | | — | |
| One Choice Blend+ 2035 Portfolio | $ | 621,419 | | $ | 208,128 | | $ | 64,013 | | — | |
| One Choice Blend+ 2040 Portfolio | $ | 538,075 | | $ | 208,049 | | $ | 34,089 | | — | |
| One Choice Blend+ 2045 Portfolio | $ | 552,047 | | $ | 247,887 | | $ | 25,289 | | — | |
| One Choice Blend+ 2050 Portfolio | $ | 380,154 | | $ | 182,923 | | $ | 32,276 | | — | |
| One Choice Blend+ 2055 Portfolio | $ | 216,113 | | $ | 125,438 | | $ | 21,578 | | — | |
| One Choice Blend+ 2060 Portfolio | $ | 118,399 | | $ | 53,732 | | $ | 12,574 | | — | |
| One Choice Blend+ 2065 Portfolio | $ | 35,844 | | $ | 39,015 | | $ | 27,829 | | — | |
The book-basis character of distributions made during the year from net investment income or net realized gains may differ from their ultimate characterization for federal income tax purposes. These differences reflect the differing character of certain income items and net realized gains and losses for financial statement and tax purposes, and may result in reclassification among certain capital accounts on the financial statements.
As of period end, the federal tax cost of investments and the components of distributable earnings on a tax-basis were as follows:
| | | | | | | | | | | | | | |
| One Choice
Blend+
2015 Portfolio | One Choice
Blend+
2020 Portfolio | One Choice
Blend+
2025 Portfolio | One Choice
Blend+
2030 Portfolio |
| Federal tax cost of investments | $ | 4,701,034 | | $ | 13,096,384 | | $ | 28,012,239 | | $ | 32,975,161 | |
| Gross tax appreciation of investments | $ | 87,453 | | $ | 258,011 | | $ | 679,469 | | $ | 798,670 | |
| Gross tax depreciation of investments | (242,781) | | (592,826) | | (1,123,377) | | (1,416,081) | |
| Net tax appreciation (depreciation) of investments | $ | (155,328) | | $ | (334,815) | | $ | (443,908) | | $ | (617,411) | |
| Undistributed ordinary income | $ | 42,872 | | $ | 121,440 | | $ | 256,285 | | $ | 273,152 | |
| Accumulated short-term capital losses | $ | (74,213) | | $ | (138,035) | | $ | (301,865) | | $ | (410,320) | |
| Accumulated long-term capital losses | — | | — | | $ | (27,413) | | $ | (14,951) | |
| | | | | | | | | | | | | | |
| One Choice
Blend+
2035 Portfolio | One Choice
Blend+
2040 Portfolio | One Choice
Blend+
2045 Portfolio | One Choice
Blend+
2050 Portfolio |
| Federal tax cost of investments | $ | 33,447,739 | | $ | 30,414,967 | | $ | 33,686,598 | | $ | 24,944,936 | |
| Gross tax appreciation of investments | $ | 441,642 | | $ | 893,894 | | $ | 857,883 | | $ | 821,830 | |
| Gross tax depreciation of investments | (1,342,749) | | (990,750) | | (838,017) | | (500,015) | |
| Net tax appreciation (depreciation) of investments | $ | (901,107) | | $ | (96,856) | | $ | 19,866 | | $ | 321,815 | |
| Undistributed ordinary income | $ | 222,894 | | $ | 184,230 | | $ | 157,850 | | $ | 89,246 | |
| Accumulated short-term capital losses | $ | (367,427) | | $ | (29,577) | | — | | — | |
| Accumulated long-term gains | — | | — | | $ | 94,695 | | $ | 142,222 | |
| | | | | | | | | | | |
| One Choice
Blend+
2055 Portfolio | One Choice
Blend+
2060 Portfolio | One Choice
Blend+
2065 Portfolio |
| Federal tax cost of investments | $ | 14,369,992 | | $ | 9,651,629 | | $ | 3,503,648 | |
| Gross tax appreciation of investments | $ | 209,813 | | $ | 400,605 | | $ | 186,466 | |
| Gross tax depreciation of investments | (187,169) | | (45,485) | | (6,136) | |
| Net tax appreciation (depreciation) of investments | $ | 22,644 | | $ | 355,120 | | $ | 180,330 | |
| Undistributed ordinary income | $ | 41,913 | | $ | 24,803 | | $ | 5,283 | |
| Accumulated short-term capital losses | $ | (36,811) | | — | | $ | (95,349) | |
| Accumulated long-term capital losses | — | | — | | $ | (71,983) | |
| Accumulated long-term gains | — | | $ | 54,267 | | — | |
The difference between book-basis and tax-basis unrealized appreciation (depreciation) is attributable primarily to the tax deferral of losses on wash sales.
Accumulated capital losses represent net capital loss carryovers that may be used to offset future realized capital gains for federal income tax purposes. The capital loss carryovers may be carried forward for an unlimited period. Future capital loss carryover utilization in any given year may be subject to Internal Revenue Code limitations.
8. Investments in Underlying Funds
The funds do not invest in the underlying funds for the purpose of exercising management or control; however, investments by the funds within their investment strategies may represent a significant portion of the underlying funds’ net assets.
9. Risk Factors
The value of the funds’ shares will go up and down based on the performance of the underlying funds in which they invest. The value of the underlying funds’ shares will, in turn, fluctuate based on the performance of the securities they own and other factors generally affecting the securities market. Market risks, including political, regulatory, economic and social developments, can affect the value of the funds’ investments. Natural disasters, public health emergencies, war, terrorism and other unforeseeable events may lead to increased market volatility and may have adverse long-term effects on world economies and markets generally.
10. Affiliated Fund Transactions
A summary of transactions for each underlying fund for the period ended July 31, 2023 follows:
| | | | | | | | | | | | | | | | | | | | | | | | | | |
Fund/Underlying Fund(1) | Beginning
Value | Purchase
Cost | Sales
Cost | Change in Net Unrealized
Appreciation (Depreciation) | Ending
Value | Ending
Shares | Net Realized
Gain (Loss) | Distributions Received(2) |
| One Choice Blend+ 2015 Portfolio (Amounts in thousands) |
| Avantis Core Fixed Income Fund | $ | 1,095 | | $ | 540 | | $ | 356 | | $ | (21) | | $ | 1,258 | | 151 | | $ | (53) | | $ | 41 | |
| Avantis Short-Term Fixed Income Fund | 245 | | 100 | | 57 | | (1) | | 287 | | 31 | | (4) | | 5 | |
| High Income Fund | 151 | | 63 | | 42 | | 5 | | 177 | | 21 | | (6) | | 11 | |
| Inflation-Adjusted Bond Fund | 199 | | 84 | | 38 | | (18) | | 227 | | 21 | | (6) | | 12 | |
| Short Duration Inflation Protection Bond Fund | 246 | | 107 | | 51 | | (16) | | 286 | | 28 | | (3) | | 13 | |
| American Century Low Volatility ETF | 211 | | 39 | | 62 | | 18 | | 206 | | 4 | | (5) | | 3 | |
| Avantis U.S. Equity Fund | 362 | | 106 | | 163 | | 52 | | 357 | | 24 | | (17) | | 5 | |
| Avantis U.S. Small Cap Value Fund | 37 | | 9 | | 11 | | 4 | | 39 | | 3 | | (1) | | 3 | |
| Focused Large Cap Value Fund | 282 | | 78 | | 95 | | 15 | | 280 | | 28 | | (11) | | 19 | |
| Growth Fund | — | | 252 | | 61 | | 42 | | 233 | | 5 | | 4 | | 6 | |
Heritage Fund(3) | 20 | | 3 | | 8 | | 4 | | 19 | | 1 | | (1) | | — | |
| Mid Cap Value Fund | 70 | | 15 | | 18 | | 2 | | 69 | | 4 | | (3) | | 5 | |
| Small Cap Growth Fund | 37 | | 6 | | 11 | | 5 | | 37 | | 2 | | (2) | | — | |
| Emerging Markets Debt Fund | 50 | | 17 | | 11 | | 3 | | 59 | | 7 | | (2) | | 3 | |
| Global Bond Fund | 495 | | 232 | | 131 | | (20) | | 576 | | 67 | | (20) | | 27 | |
| Avantis International Equity Fund | 186 | | 38 | | 71 | | 29 | | 182 | | 16 | | (10) | | 5 | |
| Focused International Growth Fund | 101 | | 15 | | 33 | | 12 | | 95 | | 6 | | (7) | | 1 | |
| Global Real Estate Fund | 43 | | 5 | | 6 | | (1) | | 41 | | 3 | | (2) | | — | |
| International Value Fund | — | | 125 | | 21 | | 14 | | 118 | | 14 | | 1 | | 3 | |
Focused Dynamic Growth Fund(3) | 242 | | 20 | | 277 | | 15 | | — | | — | | (33) | | — | |
| Non-U.S. Intrinsic Value Fund | 116 | | 1 | | 125 | | 8 | | — | | — | | (6) | | — | |
| $ | 4,188 | | $ | 1,855 | | $ | 1,648 | | $ | 151 | | $ | 4,546 | | 436 | | $ | (187) | | $ | 162 | |
(1)Underlying fund investments represent G Class, except American Century Low Volatility ETF.
(2)Distributions received includes distributions from net investment income and from capital gains, if any.
(3)Non-income producing.
| | | | | | | | | | | | | | | | | | | | | | | | | | |
Fund/Underlying Fund(1) | Beginning
Value | Purchase
Cost | Sales
Cost | Change in Net Unrealized
Appreciation (Depreciation) | Ending
Value | Ending
Shares | Net Realized
Gain (Loss) | Distributions Received(2) |
| One Choice Blend+ 2020 Portfolio (Amounts in thousands) |
| Avantis Core Fixed Income Fund | $ | 1,899 | | $ | 2,227 | | $ | 520 | | $ | (68) | | $ | 3,538 | | 425 | | $ | (71) | | $ | 106 | |
| Avantis Short-Term Fixed Income Fund | 342 | | 453 | | 94 | | — | | 701 | | 75 | | (6) | | 11 | |
| High Income Fund | 303 | | 319 | | 86 | | 13 | | 549 | | 66 | | (13) | | 31 | |
| Inflation-Adjusted Bond Fund | 337 | | 392 | | 68 | | (40) | | 621 | | 59 | | (9) | | 30 | |
| Short Duration Inflation Protection Bond Fund | 382 | | 479 | | 89 | | (29) | | 743 | | 73 | | (5) | | 29 | |
| American Century Low Volatility ETF | 345 | | 249 | | 102 | | 48 | | 540 | | 12 | | (9) | | 7 | |
| Avantis U.S. Equity Fund | 708 | | 578 | | 389 | | 146 | | 1,043 | | 69 | | (27) | | 13 | |
| Avantis U.S. Small Cap Value Fund | 73 | | 60 | | 28 | | 12 | | 117 | | 8 | | (2) | | 6 | |
| Focused Large Cap Value Fund | 531 | | 435 | | 197 | | 34 | | 803 | | 80 | | (20) | | 48 | |
| Growth Fund | — | | 743 | | 209 | | 145 | | 679 | | 14 | | 6 | | 14 | |
Heritage Fund(3) | 51 | | 28 | | 23 | | 13 | | 69 | | 3 | | (4) | | — | |
| Mid Cap Value Fund | 132 | | 100 | | 38 | | 5 | | 199 | | 12 | | (5) | | 13 | |
| Small Cap Growth Fund | 71 | | 49 | | 30 | | 17 | | 107 | | 5 | | (6) | | 1 | |
| Emerging Markets Debt Fund | 106 | | 107 | | 30 | | 10 | | 193 | | 21 | | (5) | | 8 | |
| Global Bond Fund | 836 | | 1,013 | | 222 | | (42) | | 1,585 | | 184 | | (32) | | 62 | |
| Avantis Emerging Markets Equity Fund | 15 | | 18 | | 8 | | 4 | | 29 | | 3 | | (1) | | 1 | |
| Avantis International Equity Fund | 352 | | 254 | | 174 | | 84 | | 516 | | 45 | | (20) | | 10 | |
| Focused International Growth Fund | 192 | | 139 | | 105 | | 44 | | 270 | | 16 | | (22) | | 3 | |
| Global Real Estate Fund | 84 | | 58 | | 25 | | 3 | | 120 | | 10 | | (7) | | 1 | |
| International Small-Mid Cap Fund | 9 | | 3 | | 4 | | 1 | | 9 | | 1 | | (1) | | — | |
| International Value Fund | — | | 339 | | 50 | | 42 | | 331 | | 39 | | 3 | | 8 | |
Focused Dynamic Growth Fund(3) | 471 | | 131 | | 661 | | 59 | | — | | — | | (101) | | — | |
| Non-U.S. Intrinsic Value Fund | 217 | | 62 | | 301 | | 22 | | — | | — | | (12) | | — | |
| Emerging Markets Fund | 11 | | 1 | | 16 | | 4 | | — | | — | | (4) | | — | |
| $ | 7,467 | | $ | 8,237 | | $ | 3,469 | | $ | 527 | | $ | 12,762 | | 1,220 | | $ | (373) | | $ | 402 | |
(1)Underlying fund investments represent G Class, except American Century Low Volatility ETF.
(2)Distributions received includes distributions from net investment income and from capital gains, if any.
(3)Non-income producing.
| | | | | | | | | | | | | | | | | | | | | | | | | | |
Fund/Underlying Fund(1) | Beginning
Value | Purchase
Cost | Sales
Cost | Change in Net Unrealized
Appreciation (Depreciation) | Ending
Value | Ending
Shares | Net Realized
Gain (Loss) | Distributions Received(2) |
| One Choice Blend+ 2025 Portfolio (Amounts in thousands) |
| Avantis Core Fixed Income Fund | $ | 5,409 | | $ | 3,700 | | $ | 1,894 | | $ | (123) | | $ | 7,092 | | 851 | | $ | (232) | | $ | 227 | |
| Avantis Short-Term Fixed Income Fund | 556 | | 429 | | 87 | | (5) | | 893 | | 96 | | (5) | | 14 | |
| High Income Fund | 1,075 | | 602 | | 317 | | 34 | | 1,394 | | 167 | | (43) | | 84 | |
| Inflation-Adjusted Bond Fund | 924 | | 596 | | 158 | | (99) | | 1,263 | | 120 | | (16) | | 63 | |
| Short Duration Inflation Protection Bond Fund | 862 | | 599 | | 146 | | (62) | | 1,253 | | 124 | | (6) | | 52 | |
| American Century Low Volatility ETF | 822 | | 268 | | 213 | | 77 | | 954 | | 21 | | (12) | | 12 | |
| Avantis U.S. Equity Fund | 2,495 | | 1,049 | | 1,170 | | 342 | | 2,716 | | 180 | | (51) | | 38 | |
| Avantis U.S. Small Cap Value Fund | 250 | | 119 | | 128 | | 27 | | 268 | | 17 | | (6) | | 16 | |
| Focused Large Cap Value Fund | 1,802 | | 755 | | 646 | | 84 | | 1,995 | | 198 | | (55) | | 128 | |
| Growth Fund | — | | 2,054 | | 630 | | 353 | | 1,777 | | 36 | | 21 | | 40 | |
Heritage Fund(3) | 258 | | 82 | | 143 | | 50 | | 247 | | 10 | | (15) | | — | |
| Mid Cap Value Fund | 446 | | 173 | | 158 | | 16 | | 477 | | 30 | | (18) | | 35 | |
| Small Cap Growth Fund | 244 | | 85 | | 114 | | 42 | | 257 | | 12 | | (14) | | 2 | |
| Emerging Markets Debt Fund | 426 | | 208 | | 108 | | 33 | | 559 | | 62 | | (16) | | 25 | |
| Global Bond Fund | 2,296 | | 1,556 | | 672 | | (92) | | 3,088 | | 359 | | (90) | | 135 | |
| Avantis Emerging Markets Equity Fund | 144 | | 168 | | 82 | | 36 | | 266 | | 23 | | (14) | | 9 | |
| Avantis International Equity Fund | 1,156 | | 406 | | 511 | | 191 | | 1,242 | | 107 | | (50) | | 25 | |
| Focused International Growth Fund | 642 | | 218 | | 281 | | 90 | | 669 | | 40 | | (49) | | 8 | |
| Global Real Estate Fund | 303 | | 99 | | 90 | | 4 | | 316 | | 26 | | (21) | | 2 | |
| International Small-Mid Cap Fund | 81 | | 20 | | 39 | | 11 | | 73 | | 8 | | (10) | | 1 | |
| International Value Fund | — | | 820 | | 146 | | 95 | | 769 | | 91 | | 3 | | 21 | |
Focused Dynamic Growth Fund(3) | 1,665 | | 226 | | 1,985 | | 94 | | — | | — | | (205) | | — | |
| Non-U.S. Intrinsic Value Fund | 691 | | 52 | | 795 | | 52 | | — | | — | | (30) | | — | |
| Emerging Markets Fund | 129 | | 9 | | 166 | | 28 | | — | | — | | (31) | | — | |
| $ | 22,676 | | $ | 14,293 | | $ | 10,679 | | $ | 1,278 | | $ | 27,568 | | 2,578 | | $ | (965) | | $ | 937 | |
(1)Underlying fund investments represent G Class, except American Century Low Volatility ETF.
(2)Distributions received includes distributions from net investment income and from capital gains, if any.
(3)Non-income producing.
| | | | | | | | | | | | | | | | | | | | | | | | | | |
Fund/Underlying Fund(1) | Beginning
Value | Purchase
Cost | Sales
Cost | Change in Net Unrealized Appreciation (Depreciation) | Ending
Value | Ending
Shares | Net Realized
Gain (Loss) | Distributions Received(2) |
| One Choice Blend+ 2030 Portfolio (Amounts in thousands) |
| American Century Low Volatility ETF | $ | 578 | | $ | 271 | | $ | 95 | | $ | 61 | | $ | 815 | | 18 | | $ | (9) | | $ | 11 | |
| Avantis U.S. Equity Fund | 3,165 | | 1,547 | | 1,311 | | 522 | | 3,923 | | 260 | | (124) | | 53 | |
| Avantis U.S. Small Cap Value Fund | 302 | | 157 | | 118 | | 38 | | 379 | | 25 | | (10) | | 22 | |
Focused Dynamic Growth Fund(3) | 2,130 | | 589 | | 2,642 | | 285 | | 362 | | 7 | | (369) | | — | |
| Focused Large Cap Value Fund | 2,161 | | 1,139 | | 676 | | 111 | | 2,735 | | 272 | | (83) | | 174 | |
| Growth Fund | — | | 2,274 | | 497 | | 434 | | 2,211 | | 45 | | 16 | | 46 | |
Heritage Fund(3) | 407 | | 156 | | 183 | | 83 | | 463 | | 18 | | (25) | | — | |
| Mid Cap Value Fund | 528 | | 251 | | 132 | | 14 | | 661 | | 41 | | (20) | | 48 | |
| Small Cap Growth Fund | 294 | | 113 | | 90 | | 49 | | 366 | | 18 | | (15) | | 2 | |
| Avantis Core Fixed Income Fund | 5,182 | | 4,376 | | 1,948 | | (98) | | 7,512 | | 902 | | (267) | | 234 | |
| Avantis Short-Term Fixed Income Fund | 250 | | 239 | | 50 | | (2) | | 437 | | 47 | | (3) | | 7 | |
| High Income Fund | 1,171 | | 800 | | 337 | | 38 | | 1,672 | | 201 | | (51) | | 100 | |
| Inflation-Adjusted Bond Fund | 760 | | 632 | | 123 | | (92) | | 1,177 | | 111 | | (14) | | 59 | |
| Short Duration Inflation Protection Bond Fund | 525 | | 516 | | 98 | | (43) | | 900 | | 89 | | (4) | | 37 | |
| Avantis Emerging Markets Equity Fund | 272 | | 337 | | 95 | | 67 | | 581 | | 51 | | (18) | | 17 | |
| Avantis International Equity Fund | 1,328 | | 564 | | 478 | | 251 | | 1,665 | | 144 | | (70) | | 32 | |
| Emerging Markets Fund | 298 | | 61 | | 338 | | 80 | | 101 | | 9 | | (82) | | 3 | |
| Focused International Growth Fund | 739 | | 336 | | 297 | | 118 | | 896 | | 53 | | (65) | | 10 | |
| Global Real Estate Fund | 383 | | 170 | | 92 | | 5 | | 466 | | 39 | | (28) | | 3 | |
| International Small-Mid Cap Fund | 170 | | 39 | | 42 | | 14 | | 181 | | 19 | | (12) | | 1 | |
| International Value Fund | — | | 862 | | 80 | | 108 | | 890 | | 105 | | 1 | | 23 | |
| Non-U.S. Intrinsic Value Fund | 775 | | 181 | | 946 | | 101 | | 111 | | 10 | | (52) | | 7 | |
| Emerging Markets Debt Fund | 522 | | 331 | | 150 | | 45 | | 748 | | 83 | | (24) | | 34 | |
| Global Bond Fund | 2,090 | | 1,709 | | 594 | | (99) | | 3,106 | | 361 | | (83) | | 137 | |
| $ | 24,030 | | $ | 17,650 | | $ | 11,412 | | $ | 2,090 | | $ | 32,358 | | 2,928 | | $ | (1,411) | | $ | 1,060 | |
(1)Underlying fund investments represent G Class, except American Century Low Volatility ETF.
(2)Distributions received includes distributions from net investment income and from capital gains, if any.
(3)Non-income producing.
| | | | | | | | | | | | | | | | | | | | | | | | | | |
Fund/Underlying Fund(1) | Beginning
Value | Purchase
Cost | Sales
Cost | Change in Net Unrealized Appreciation (Depreciation) | Ending
Value | Ending
Shares | Net Realized
Gain (Loss) | Distributions Received(2) |
| One Choice Blend+ 2035 Portfolio (Amounts in thousands) |
| American Century Low Volatility ETF | $ | 210 | | $ | 181 | | $ | 41 | | $ | 28 | | $ | 378 | | 8 | | $ | (7) | | $ | 4 | |
| Avantis U.S. Equity Fund | 3,699 | | 1,825 | | 1,396 | | 612 | | 4,740 | | 314 | | (196) | | 59 | |
| Avantis U.S. Small Cap Value Fund | 343 | | 161 | | 113 | | 43 | | 434 | | 28 | | (14) | | 23 | |
Focused Dynamic Growth Fund(3) | 2,503 | | 955 | | 2,400 | | 594 | | 1,652 | | 33 | | (470) | | — | |
| Focused Large Cap Value Fund | 2,437 | | 1,402 | | 772 | | 136 | | 3,203 | | 318 | | (120) | | 185 | |
| Growth Fund | — | | 1,400 | | 192 | | 272 | | 1,480 | | 30 | | 5 | | 27 | |
Heritage Fund(3) | 556 | | 226 | | 236 | | 120 | | 666 | | 27 | | (48) | | — | |
| Mid Cap Value Fund | 589 | | 309 | | 156 | | 20 | | 762 | | 47 | | (29) | | 50 | |
| Small Cap Growth Fund | 333 | | 148 | | 116 | | 65 | | 430 | | 21 | | (29) | | 2 | |
| Avantis Core Fixed Income Fund | 4,475 | | 4,116 | | 1,981 | | (45) | | 6,565 | | 788 | | (277) | | 190 | |
| Avantis Short-Term Fixed Income Fund | 68 | | 96 | | 18 | | — | | 146 | | 16 | | (1) | | 2 | |
| High Income Fund | 1,093 | | 794 | | 311 | | 37 | | 1,613 | | 194 | | (53) | | 88 | |
| Inflation-Adjusted Bond Fund | 489 | | 450 | | 115 | | (52) | | 772 | | 73 | | (15) | | 36 | |
| Short Duration Inflation Protection Bond Fund | 140 | | 209 | | 32 | | (13) | | 304 | | 30 | | (2) | | 11 | |
| Avantis Emerging Markets Equity Fund | 405 | | 387 | | 127 | | 88 | | 753 | | 66 | | (30) | | 21 | |
| Avantis International Equity Fund | 1,415 | | 712 | | 547 | | 274 | | 1,854 | | 160 | | (108) | | 32 | |
| Emerging Markets Fund | 548 | | 183 | | 420 | | 136 | | 447 | | 41 | | (128) | | 10 | |
| Focused International Growth Fund | 795 | | 444 | | 344 | | 135 | | 1,030 | | 61 | | (91) | | 10 | |
| Global Real Estate Fund | 450 | | 230 | | 120 | | 9 | | 569 | | 48 | | (39) | | 4 | |
| International Small-Mid Cap Fund | 273 | | 104 | | 93 | | 32 | | 316 | | 33 | | (30) | | 2 | |
| International Value Fund | — | | 532 | | 13 | | 69 | | 588 | | 69 | | — | | 14 | |
| Non-U.S. Intrinsic Value Fund | 798 | | 252 | | 756 | | 185 | | 479 | | 45 | | (94) | | 21 | |
| Emerging Markets Debt Fund | 552 | | 355 | | 146 | | 46 | | 807 | | 90 | | (27) | | 34 | |
| Global Bond Fund | 1,695 | | 1,530 | | 602 | | (64) | | 2,559 | | 298 | | (85) | | 106 | |
| $ | 23,866 | | $ | 17,001 | | $ | 11,047 | | $ | 2,727 | | $ | 32,547 | | 2,838 | | $ | (1,888) | | $ | 931 | |
(1)Underlying fund investments represent G Class, except American Century Low Volatility ETF.
(2)Distributions received includes distributions from net investment income and from capital gains, if any.
(3)Non-income producing.
| | | | | | | | | | | | | | | | | | | | | | | | | | |
Fund/Underlying Fund(1) | Beginning
Value | Purchase
Cost | Sales
Cost | Change in Net Unrealized Appreciation (Depreciation) | Ending
Value | Ending
Shares | Net Realized
Gain (Loss) | Distributions Received(2) |
| One Choice Blend+ 2040 Portfolio (Amounts in thousands) |
| Avantis U.S. Equity Fund | $ | 3,726 | | $ | 1,642 | | $ | 891 | | $ | 616 | | $ | 5,093 | | 338 | | $ | (105) | | $ | 66 | |
| Avantis U.S. Small Cap Value Fund | 340 | | 186 | | 109 | | 45 | | 462 | | 30 | | (9) | | 26 | |
Focused Dynamic Growth Fund(3) | 2,509 | | 950 | | 1,392 | | 653 | | 2,720 | | 54 | | (287) | | — | |
| Focused Large Cap Value Fund | 2,415 | | 1,301 | | 488 | | 106 | | 3,334 | | 331 | | (65) | | 199 | |
| Growth Fund | — | | 553 | | 16 | | 127 | | 664 | | 14 | | — | | 12 | |
Heritage Fund(3) | 611 | | 231 | | 162 | | 122 | | 802 | | 32 | | (27) | | — | |
| Mid Cap Value Fund | 579 | | 312 | | 111 | | 14 | | 794 | | 49 | | (17) | | 53 | |
| Small Cap Growth Fund | 333 | | 134 | | 63 | | 54 | | 458 | | 22 | | (12) | | 3 | |
| Avantis Core Fixed Income Fund | 3,262 | | 2,879 | | 966 | | (104) | | 5,071 | | 609 | | (131) | | 150 | |
| High Income Fund | 818 | | 625 | | 176 | | 20 | | 1,287 | | 154 | | (28) | | 72 | |
| Inflation-Adjusted Bond Fund | 298 | | 248 | | 45 | | (37) | | 464 | | 44 | | (6) | | 23 | |
| Avantis Emerging Markets Equity Fund | 440 | | 388 | | 69 | | 86 | | 845 | | 75 | | (14) | | 23 | |
| Avantis International Equity Fund | 1,360 | | 565 | | 303 | | 250 | | 1,872 | | 161 | | (52) | | 34 | |
| Emerging Markets Fund | 656 | | 290 | | 311 | | 121 | | 756 | | 70 | | (92) | | 17 | |
| Focused International Growth Fund | 766 | | 352 | | 180 | | 105 | | 1,043 | | 62 | | (46) | | 11 | |
| Global Real Estate Fund | 461 | | 227 | | 62 | | (7) | | 619 | | 52 | | (19) | | 4 | |
| International Small-Mid Cap Fund | 319 | | 127 | | 46 | | 20 | | 420 | | 43 | | (14) | | 2 | |
| International Value Fund | — | | 244 | | 10 | | 31 | | 265 | | 31 | | — | | 6 | |
| Non-U.S. Intrinsic Value Fund | 744 | | 282 | | 447 | | 206 | | 785 | | 74 | | (51) | | 35 | |
| Emerging Markets Debt Fund | 432 | | 313 | | 87 | | 34 | | 692 | | 77 | | (15) | | 30 | |
| Global Bond Fund | 1,198 | | 1,040 | | 297 | | (69) | | 1,872 | | 218 | | (41) | | 81 | |
| $ | 21,267 | | $ | 12,889 | | $ | 6,231 | | $ | 2,393 | | $ | 30,318 | | 2,540 | | $ | (1,031) | | $ | 847 | |
(1)Underlying fund investments represent G Class.
(2)Distributions received includes distributions from net investment income and from capital gains, if any.
(3)Non-income producing.
| | | | | | | | | | | | | | | | | | | | | | | | | | |
Fund/Underlying Fund(1) | Beginning
Value | Purchase
Cost | Sales
Cost | Change in Net Unrealized Appreciation (Depreciation) | Ending
Value | Ending
Shares | Net Realized
Gain (Loss) | Distributions Received(2) |
| One Choice Blend+ 2045 Portfolio (Amounts in thousands) |
| Avantis U.S. Equity Fund | $ | 4,656 | | $ | 2,345 | | $ | 1,451 | | $ | 801 | | $ | 6,351 | | 421 | | $ | (196) | | $ | 77 | |
| Avantis U.S. Small Cap Value Fund | 419 | | 273 | | 141 | | 63 | | 614 | | 40 | | (16) | | 30 | |
Focused Dynamic Growth Fund(3) | 3,128 | | 1,736 | | 1,601 | | 930 | | 4,193 | | 84 | | (304) | | — | |
| Focused Large Cap Value Fund | 3,043 | | 1,705 | | 773 | | 150 | | 4,125 | | 410 | | (116) | | 238 | |
Heritage Fund(3) | 753 | | 348 | | 254 | | 152 | | 999 | | 40 | | (39) | | — | |
| Mid Cap Value Fund | 729 | | 414 | | 165 | | 22 | | 1,000 | | 62 | | (30) | | 64 | |
| Small Cap Growth Fund | 416 | | 211 | | 126 | | 75 | | 576 | | 28 | | (22) | | 3 | |
| Avantis Emerging Markets Equity Fund | 557 | | 266 | | 129 | | 95 | | 789 | | 70 | | (31) | | 21 | |
| Avantis International Equity Fund | 1,702 | | 828 | | 543 | | 325 | | 2,312 | | 199 | | (100) | | 40 | |
| Emerging Markets Fund | 833 | | 477 | | 261 | | 130 | | 1,179 | | 108 | | (84) | | 25 | |
| Focused International Growth Fund | 957 | | 497 | | 307 | | 141 | | 1,288 | | 77 | | (79) | | 13 | |
| Global Real Estate Fund | 575 | | 328 | | 155 | | 15 | | 763 | | 64 | | (49) | | 5 | |
| International Small-Mid Cap Fund | 393 | | 181 | | 91 | | 33 | | 516 | | 53 | | (27) | | 3 | |
| Non-U.S. Intrinsic Value Fund | 941 | | 425 | | 337 | | 285 | | 1,314 | | 123 | | (57) | | 53 | |
| Avantis Core Fixed Income Fund | 2,744 | | 2,530 | | 1,049 | | (52) | | 4,173 | | 501 | | (144) | | 121 | |
| High Income Fund | 693 | | 501 | | 165 | | 19 | | 1,048 | | 126 | | (28) | | 58 | |
| Inflation-Adjusted Bond Fund | 251 | | 203 | | 50 | | (28) | | 376 | | 36 | | (6) | | 19 | |
| Emerging Markets Debt Fund | 368 | | 245 | | 83 | | 29 | | 559 | | 62 | | (15) | | 24 | |
| Global Bond Fund | 1,011 | | 827 | | 253 | | (54) | | 1,531 | | 178 | | (35) | | 65 | |
| $ | 24,169 | | $ | 14,340 | | $ | 7,934 | | $ | 3,131 | | $ | 33,706 | | 2,682 | | $ | (1,378) | | $ | 859 | |
(1)Underlying fund investments represent G Class.
(2)Distributions received includes distributions from net investment income and from capital gains, if any.
(3)Non-income producing.
| | | | | | | | | | | | | | | | | | | | | | | | | | |
Fund/Underlying Fund(1) | Beginning
Value | Purchase
Cost | Sales
Cost | Change in Net Unrealized Appreciation (Depreciation) | Ending
Value | Ending
Shares | Net Realized
Gain (Loss) | Distributions Received(2) |
| One Choice Blend+ 2050 Portfolio (Amounts in thousands) |
| Avantis U.S. Equity Fund | $ | 3,445 | | $ | 2,007 | | $ | 903 | | $ | 616 | | $ | 5,165 | | 343 | | $ | (116) | | $ | 62 | |
| Avantis U.S. Small Cap Value Fund | 312 | | 212 | | 87 | | 46 | | 483 | | 31 | | (8) | | 24 | |
Focused Dynamic Growth Fund(3) | 2,315 | | 1,582 | | 1,219 | | 726 | | 3,404 | | 68 | | (223) | | — | |
| Focused Large Cap Value Fund | 2,254 | | 1,557 | | 541 | | 115 | | 3,385 | | 336 | | (78) | | 189 | |
Heritage Fund(3) | 561 | | 308 | | 189 | | 126 | | 806 | | 32 | | (33) | | — | |
| Mid Cap Value Fund | 539 | | 339 | | 89 | | 12 | | 801 | | 50 | | (16) | | 50 | |
| Small Cap Growth Fund | 307 | | 179 | | 82 | | 60 | | 464 | | 23 | | (18) | | 2 | |
| Avantis Emerging Markets Equity Fund | 412 | | 231 | | 72 | | 72 | | 643 | | 57 | | (17) | | 17 | |
| Avantis International Equity Fund | 1,260 | | 701 | | 325 | | 252 | | 1,888 | | 163 | | (63) | | 32 | |
| Emerging Markets Fund | 619 | | 407 | | 156 | | 93 | | 963 | | 89 | | (52) | | 20 | |
| Focused International Growth Fund | 709 | | 423 | | 198 | | 108 | | 1,042 | | 62 | | (54) | | 10 | |
| Global Real Estate Fund | 425 | | 289 | | 92 | | 6 | | 628 | | 53 | | (28) | | 4 | |
| International Small-Mid Cap Fund | 293 | | 161 | | 58 | | 25 | | 421 | | 43 | | (19) | | 2 | |
| Non-U.S. Intrinsic Value Fund | 698 | | 390 | | 238 | | 228 | | 1,078 | | 101 | | (41) | | 43 | |
| Avantis Core Fixed Income Fund | 1,395 | | 1,298 | | 417 | | (42) | | 2,234 | | 268 | | (58) | | 63 | |
| High Income Fund | 350 | | 272 | | 76 | | 8 | | 554 | | 67 | | (13) | | 30 | |
| Inflation-Adjusted Bond Fund | 125 | | 107 | | 21 | | (16) | | 195 | | 18 | | (3) | | 10 | |
| Emerging Markets Debt Fund | 186 | | 132 | | 37 | | 14 | | 295 | | 33 | | (7) | | 13 | |
| Global Bond Fund | 512 | | 456 | | 118 | | (32) | | 818 | | 95 | | (16) | | 35 | |
| $ | 16,717 | | $ | 11,051 | | $ | 4,918 | | $ | 2,417 | | $ | 25,267 | | 1,932 | | $ | (863) | | $ | 606 | |
(1)Underlying fund investments represent G Class.
(2)Distributions received includes distributions from net investment income and from capital gains, if any.
(3)Non-income producing.
| | | | | | | | | | | | | | | | | | | | | | | | | | |
Fund/Underlying Fund(1) | Beginning
Value | Purchase
Cost | Sales
Cost | Change in Net Unrealized Appreciation (Depreciation) | Ending
Value | Ending
Shares | Net Realized
Gain (Loss) | Distributions Received(2) |
| One Choice Blend+ 2055 Portfolio (Amounts in thousands) |
| Avantis U.S. Equity Fund | $ | 2,254 | | $ | 1,337 | | $ | 926 | | $ | 405 | | $ | 3,070 | | 204 | | $ | (137) | | $ | 37 | |
| Avantis U.S. Small Cap Value Fund | 202 | | 138 | | 87 | | 30 | | 283 | | 18 | | (11) | | 14 | |
Focused Dynamic Growth Fund(3) | 1,498 | | 1,005 | | 941 | | 473 | | 2,035 | | 41 | | (195) | | — | |
| Focused Large Cap Value Fund | 1,476 | | 1,025 | | 584 | | 91 | | 2,008 | | 199 | | (87) | | 114 | |
Heritage Fund(3) | 361 | | 202 | | 162 | | 79 | | 480 | | 19 | | (27) | | — | |
| Mid Cap Value Fund | 354 | | 224 | | 114 | | 14 | | 478 | | 30 | | (22) | | 30 | |
| Small Cap Growth Fund | 200 | | 120 | | 86 | | 39 | | 273 | | 13 | | (15) | | 1 | |
| Avantis Emerging Markets Equity Fund | 271 | | 171 | | 118 | | 57 | | 381 | | 34 | | (28) | | 10 | |
| Avantis International Equity Fund | 827 | | 484 | | 367 | | 177 | | 1,121 | | 97 | | (79) | | 19 | |
| Emerging Markets Fund | 407 | | 287 | | 206 | | 87 | | 575 | | 53 | | (69) | | 13 | |
| Focused International Growth Fund | 461 | | 296 | | 214 | | 84 | | 627 | | 37 | | (60) | | 6 | |
| Global Real Estate Fund | 280 | | 194 | | 119 | | 20 | | 375 | | 31 | | (39) | | 2 | |
| International Small-Mid Cap Fund | 191 | | 112 | | 74 | | 24 | | 253 | | 26 | | (23) | | 1 | |
| Non-U.S. Intrinsic Value Fund | 458 | | 249 | | 218 | | 149 | | 638 | | 60 | | (47) | | 25 | |
| Avantis Core Fixed Income Fund | 665 | | 662 | | 348 | | (3) | | 976 | | 117 | | (46) | | 28 | |
| High Income Fund | 168 | | 140 | | 72 | | 8 | | 244 | | 29 | | (12) | | 13 | |
| Inflation-Adjusted Bond Fund | 60 | | 53 | | 20 | | (6) | | 87 | | 8 | | (3) | | 4 | |
| Emerging Markets Debt Fund | 90 | | 66 | | 35 | | 9 | | 130 | | 14 | | (6) | | 6 | |
| Global Bond Fund | 245 | | 227 | | 105 | | (8) | | 359 | | 42 | | (14) | | 15 | |
| $ | 10,468 | | $ | 6,992 | | $ | 4,796 | | $ | 1,729 | | $ | 14,393 | | 1,072 | | $ | (920) | | $ | 338 | |
(1)Underlying fund investments represent G Class.
(2)Distributions received includes distributions from net investment income and from capital gains, if any.
(3)Non-income producing.
| | | | | | | | | | | | | | | | | | | | | | | | | | |
Fund/Underlying Fund(1) | Beginning
Value | Purchase
Cost | Sales
Cost | Change in Net Unrealized Appreciation (Depreciation) | Ending
Value | Ending
Shares | Net Realized
Gain (Loss) | Distributions Received(2) |
| One Choice Blend+ 2060 Portfolio (Amounts in thousands) |
| Avantis U.S. Equity Fund | $ | 1,028 | | $ | 1,300 | | $ | 403 | | $ | 269 | | $ | 2,194 | | 146 | | $ | (55) | | $ | 23 | |
| Avantis U.S. Small Cap Value Fund | 92 | | 125 | | 35 | | 21 | | 203 | | 13 | | (5) | | 9 | |
Focused Dynamic Growth Fund(3) | 680 | | 911 | | 436 | | 298 | | 1,453 | | 29 | | (79) | | — | |
| Focused Large Cap Value Fund | 673 | | 971 | | 259 | | 56 | | 1,441 | | 143 | | (36) | | 71 | |
Heritage Fund(3) | 165 | | 199 | | 68 | | 50 | | 346 | | 14 | | (12) | | — | |
| Mid Cap Value Fund | 162 | | 220 | | 45 | | 8 | | 345 | | 21 | | (8) | | 19 | |
| Small Cap Growth Fund | 91 | | 111 | | 29 | | 24 | | 197 | | 10 | | (6) | | 1 | |
| Avantis Emerging Markets Equity Fund | 124 | | 163 | | 52 | | 36 | | 271 | | 24 | | (12) | | 6 | |
| Avantis International Equity Fund | 377 | | 462 | | 140 | | 106 | | 805 | | 69 | | (27) | | 12 | |
| Emerging Markets Fund | 185 | | 259 | | 87 | | 50 | | 407 | | 38 | | (29) | | 7 | |
| Focused International Growth Fund | 210 | | 279 | | 86 | | 46 | | 449 | | 27 | | (22) | | 4 | |
| Global Real Estate Fund | 127 | | 183 | | 52 | | 12 | | 270 | | 23 | | (17) | | 1 | |
| International Small-Mid Cap Fund | 87 | | 108 | | 25 | | 12 | | 182 | | 19 | | (8) | | 1 | |
| Non-U.S. Intrinsic Value Fund | 209 | | 239 | | 91 | | 93 | | 450 | | 42 | | (16) | | 16 | |
| Avantis Core Fixed Income Fund | 249 | | 420 | | 129 | | (3) | | 537 | | 65 | | (17) | | 14 | |
| High Income Fund | 64 | | 93 | | 25 | | 4 | | 136 | | 16 | | (3) | | 7 | |
| Inflation-Adjusted Bond Fund | 23 | | 36 | | 7 | | (3) | | 49 | | 5 | | (1) | | 2 | |
| Emerging Markets Debt Fund | 34 | | 46 | | 11 | | 4 | | 73 | | 8 | | (2) | | 3 | |
| Global Bond Fund | 92 | | 151 | | 40 | | (4) | | 199 | | 23 | | (6) | | 8 | |
| $ | 4,672 | | $ | 6,276 | | $ | 2,020 | | $ | 1,079 | | $ | 10,007 | | 735 | | $ | (361) | | $ | 204 | |
(1)Underlying fund investments represent G Class.
(2)Distributions received includes distributions from net investment income and from capital gains, if any.
(3)Non-income producing.
| | | | | | | | | | | | | | | | | | | | | | | | | | |
Fund/Underlying Fund(1) | Beginning
Value | Purchase
Cost | Sales
Cost | Change in Net Unrealized Appreciation (Depreciation) | Ending
Value | Ending
Shares | Net Realized
Gain (Loss) | Distributions Received(2) |
| One Choice Blend+ 2065 Portfolio (Amounts in thousands) |
| Avantis U.S. Equity Fund | $ | 502 | | $ | 601 | | $ | 406 | | $ | 110 | | $ | 807 | | 54 | | $ | (36) | | $ | 7 | |
| Avantis U.S. Small Cap Value Fund | 45 | | 57 | | 37 | | 9 | | 74 | | 5 | | (4) | | 3 | |
Focused Dynamic Growth Fund(3) | 333 | | 379 | | 322 | | 146 | | 536 | | 11 | | (64) | | — | |
| Focused Large Cap Value Fund | 329 | | 432 | | 269 | | 38 | | 530 | | 53 | | (30) | | 23 | |
Heritage Fund(3) | 81 | | 91 | | 70 | | 25 | | 127 | | 5 | | (11) | | — | |
| Mid Cap Value Fund | 79 | | 104 | | 65 | | 9 | | 127 | | 8 | | (10) | | 6 | |
| Small Cap Growth Fund | 44 | | 53 | | 37 | | 12 | | 72 | | 4 | | (6) | | — | |
| Avantis Emerging Markets Equity Fund | 60 | | 80 | | 58 | | 18 | | 100 | | 9 | | (9) | | 2 | |
| Avantis International Equity Fund | 184 | | 220 | | 153 | | 45 | | 296 | | 26 | | (18) | | 4 | |
| Emerging Markets Fund | 90 | | 126 | | 95 | | 31 | | 152 | | 14 | | (25) | | 2 | |
| Focused International Growth Fund | 103 | | 133 | | 92 | | 22 | | 166 | | 10 | | (16) | | 1 | |
| Global Real Estate Fund | 61 | | 87 | | 63 | | 14 | | 99 | | 8 | | (16) | | 1 | |
| International Small-Mid Cap Fund | 43 | | 54 | | 39 | | 9 | | 67 | | 7 | | (9) | | — | |
| Non-U.S. Intrinsic Value Fund | 102 | | 120 | | 89 | | 34 | | 167 | | 16 | | (9) | | 5 | |
| Avantis Core Fixed Income Fund | 122 | | 189 | | 116 | | 2 | | 197 | | 24 | | (11) | | 5 | |
| High Income Fund | 31 | | 43 | | 27 | | 3 | | 50 | | 6 | | (2) | | 3 | |
| Inflation-Adjusted Bond Fund | 11 | | 16 | | 9 | | — | | 18 | | 2 | | (1) | | 1 | |
| Emerging Markets Debt Fund | 17 | | 21 | | 14 | | 2 | | 26 | | 3 | | (2) | | 1 | |
| Global Bond Fund | 45 | | 68 | | 41 | | 1 | | 73 | | 8 | | (5) | | 2 | |
| $ | 2,282 | | $ | 2,874 | | $ | 2,002 | | $ | 530 | | $ | 3,684 | | 273 | | $ | (284) | | $ | 66 | |
(1)Underlying fund investments represent G Class.
(2)Distributions received includes distributions from net investment income and from capital gains, if any.
(3)Non-income producing.
| | | | | | | | | | | | | | | | | | | | | | | | | | | | | | | | | | | | | | | | | | | | | | | |
| For a Share Outstanding Throughout the Years Ended July 31 (except as noted) |
| Per-Share Data | | | | | | Ratios and Supplemental Data | | |
| | Income From Investment Operations*: | Distributions From: | | | Ratio to Average Net Assets of: | | |
| Net Asset Value, Beginning of Period | Net
Investment
Income
(Loss) | Net Realized and Unrealized Gain (Loss) | Total From Investment Operations | Net
Investment
Income | Net
Realized
Gains | Total
Distributions | Net Asset Value, End of Period | Total Return(1) | Operating
Expenses | Operating
Expenses
(before
expense
waiver) | Net
Investment
Income
(Loss) | Net
Investment
Income
(Loss)
(before
expense
waiver) | Portfolio
Turnover
Rate | Net Assets, End of Period (in thousands) |
| One Choice Blend+ 2015 Portfolio | | | | | | | | | | | |
| Investor Class | | | | | | | | | | | | | |
| 2023 | $9.41 | 0.26 | (0.01) | 0.25 | (0.25) | (0.01) | (0.26) | $9.40 | 2.78% | 0.57% | 0.58% | 2.88% | 2.87% | 36% | $512 | |
| 2022 | $10.51 | 0.29 | (1.17) | (0.88) | (0.22) | — | (0.22) | $9.41 | (8.57)% | 0.57% | 0.58% | 1.58% | 1.57% | 29% | $383 | |
2021(2) | $10.00 | 0.01(3) | 0.50 | 0.51 | — | — | — | $10.51 | 5.10% | 0.56%(4) | 0.58%(4) | 0.52%(4) | 0.50%(4) | — | $153 | |
| I Class | | | | | | | | | | | | | | | |
| 2023 | $9.42 | 0.21 | 0.04 | 0.25 | (0.26) | (0.01) | (0.27) | $9.40 | 2.87% | 0.37% | 0.38% | 3.08% | 3.07% | 36% | $341 | |
| 2022 | $10.51 | 0.32 | (1.17) | (0.85) | (0.24) | — | (0.24) | $9.42 | (8.32)% | 0.37% | 0.38% | 1.78% | 1.77% | 29% | $5 | |
2021(2) | $10.00 | 0.04(3) | 0.47 | 0.51 | — | — | — | $10.51 | 5.10% | 0.36%(4) | 0.38%(4) | 0.72%(4) | 0.70%(4) | — | $5 | |
| A Class | | | | | | | | | | | | | | | |
| 2023 | $9.40 | 0.25 | (0.04) | 0.21 | (0.22) | (0.01) | (0.23) | $9.38 | 2.41% | 0.82% | 0.83% | 2.63% | 2.62% | 36% | $5 | |
| 2022 | $10.49 | 0.26 | (1.15) | (0.89) | (0.20) | — | (0.20) | $9.40 | (8.68)% | 0.82% | 0.83% | 1.33% | 1.32% | 29% | $5 | |
2021(2) | $10.00 | 0.02(3) | 0.47 | 0.49 | — | — | — | $10.49 | 4.90% | 0.81%(4) | 0.83%(4) | 0.27%(4) | 0.25%(4) | — | $5 | |
| R Class | | | | | | | | | | | | | | | |
| 2023 | $9.38 | 0.26 | (0.07) | 0.19 | (0.20) | (0.01) | (0.21) | $9.36 | 2.15% | 1.07% | 1.08% | 2.38% | 2.37% | 36% | $5 | |
| 2022 | $10.48 | 0.23 | (1.15) | (0.92) | (0.18) | — | (0.18) | $9.38 | (8.97)% | 1.07% | 1.08% | 1.08% | 1.07% | 29% | $7 | |
2021(2) | $10.00 | 0.01(3) | 0.47 | 0.48 | — | — | — | $10.48 | 4.80% | 1.06%(4) | 1.08%(4) | 0.02%(4) | 0.00%(4)(5) | — | $5 | |
| | | | | | | | | | | | | | | | | | | | | | | | | | | | | | | | | | | | | | | | | | | | | | | |
| For a Share Outstanding Throughout the Years Ended July 31 (except as noted) |
| Per-Share Data | | | | | | Ratios and Supplemental Data | | |
| | Income From Investment Operations*: | Distributions From: | | | Ratio to Average Net Assets of: | | |
| Net Asset Value, Beginning of Period | Net
Investment
Income
(Loss) | Net Realized and Unrealized Gain (Loss) | Total From Investment Operations | Net
Investment
Income | Net
Realized
Gains | Total
Distributions | Net Asset Value, End of Period | Total Return(1) | Operating
Expenses | Operating
Expenses
(before
expense
waiver) | Net
Investment
Income
(Loss) | Net
Investment
Income
(Loss)
(before
expense
waiver) | Portfolio
Turnover
Rate | Net Assets, End of Period (in thousands) |
| R6 Class | | | | | | | | | | | | | | | |
| 2023 | $9.43 | 0.32 | (0.05) | 0.27 | (0.28) | (0.01) | (0.29) | $9.41 | 3.03% | 0.22% | 0.23% | 3.23% | 3.22% | 36% | $3,683 | |
| 2022 | $10.52 | 0.26 | (1.10) | (0.84) | (0.25) | — | (0.25) | $9.43 | (8.20)% | 0.22% | 0.23% | 1.93% | 1.92% | 29% | $3,789 | |
2021(2) | $10.00 | 0.04(3) | 0.48 | 0.52 | — | — | — | $10.52 | 5.20% | 0.21%(4) | 0.23%(4) | 0.87%(4) | 0.85%(4) | — | $5 | |
| | |
| Notes to Financial Highlights |
(1)Total returns are calculated based on the net asset value of the last business day and do not reflect applicable sales charges, if any. Total returns for periods less than one year are not annualized.
(2)March 10, 2021 (fund inception) through July 31, 2021.
(3)Computed using average shares outstanding throughout the period.
(4)Annualized.
(5)Ratio was less than 0.005%.
*The amount shown for a share outstanding throughout the period may not correlate with the Statement(s) of Operations or precisely reflect the class expense differentials due to the timing of transactions in shares of a fund in relation to income earned and/or fluctuations in the fair value of a fund's investments.
See Notes to Financial Statements.
| | | | | | | | | | | | | | | | | | | | | | | | | | | | | | | | | | | | | | | | | | | | | | | |
| For a Share Outstanding Throughout the Years Ended July 31 (except as noted) |
| Per-Share Data | | | | | | Ratios and Supplemental Data | | |
| | Income From Investment Operations*: | Distributions From: | | | Ratio to Average Net Assets of: | | |
| Net Asset
Value,
Beginning
of Period | Net Investment Income (Loss) | Net
Realized
and
Unrealized
Gain (Loss) | Total From
Investment
Operations | Net Investment Income | Net Realized Gains | Total Distributions | Net
Asset
Value,
End
of Period | Total Return(1) | Operating Expenses | Operating
Expenses
(before
expense
waiver) | Net
Investment
Income
(Loss) | Net
Investment
Income
(Loss)
(before
expense
waiver) | Portfolio
Turnover
Rate | Net
Assets,
End of
Period
(in
thousands) |
| One Choice Blend+ 2020 Portfolio | | | | | | | | | | | |
| Investor Class | | | | | | | | | | | | | |
| 2023 | $9.43 | 0.25 | —(2) | 0.25 | (0.25) | — | (0.25) | $9.43 | 2.87% | 0.57% | 0.58% | 2.75% | 2.74% | 30% | $1,310 | |
| 2022 | $10.57 | 0.27 | (1.17) | (0.90) | (0.23) | (0.01) | (0.24) | $9.43 | (8.32)% | 0.57% | 0.58% | 2.01% | 2.00% | 36% | $1,099 | |
2021(3) | $10.00 | 0.02(4) | 0.55 | 0.57 | — | — | — | $10.57 | 5.20% | 0.57%(5) | 0.58%(5) | 0.66%(5) | 0.65%(5) | 137% | $15 | |
| I Class | | | | | | | | | | | | | | | |
| 2023 | $9.43 | 0.29 | (0.02) | 0.27 | (0.27) | — | (0.27) | $9.43 | 3.08% | 0.37% | 0.38% | 2.95% | 2.94% | 30% | $11 | |
| 2022 | $10.58 | 0.32 | (1.21) | (0.89) | (0.25) | (0.01) | (0.26) | $9.43 | (8.25)% | 0.37% | 0.38% | 2.21% | 2.20% | 36% | $11 | |
2021(3) | $10.00 | 0.04(4) | 0.54 | 0.58 | — | — | — | $10.58 | 5.30% | 0.37%(5) | 0.38%(5) | 0.86%(5) | 0.85%(5) | 137% | $11 | |
| A Class | | | | | | | | | | | | | | | |
| 2023 | $9.41 | 0.24 | (0.01) | 0.23 | (0.23) | — | (0.23) | $9.41 | 2.61% | 0.82% | 0.83% | 2.50% | 2.49% | 30% | $10 | |
| 2022 | $10.56 | 0.28 | (1.21) | (0.93) | (0.21) | (0.01) | (0.22) | $9.41 | (8.61)% | 0.82% | 0.83% | 1.76% | 1.75% | 36% | $10 | |
2021(3) | $10.00 | 0.02(4) | 0.54 | 0.56 | — | — | — | $10.56 | 5.10% | 0.82%(5) | 0.83%(5) | 0.41%(5) | 0.40%(5) | 137% | $11 | |
| R Class | | | | | | | | | | | | | | | |
| 2023 | $9.39 | 0.22 | (0.01) | 0.21 | (0.21) | — | (0.21) | $9.39 | 2.35% | 1.07% | 1.08% | 2.25% | 2.24% | 30% | $13 | |
| 2022 | $10.55 | 0.24 | (1.20) | (0.96) | (0.19) | (0.01) | (0.20) | $9.39 | (8.90)% | 1.07% | 1.08% | 1.51% | 1.50% | 36% | $12 | |
2021(3) | $10.00 | 0.01(4) | 0.54 | 0.55 | — | — | — | $10.55 | 5.00% | 1.07%(5) | 1.08%(5) | 0.16%(5) | 0.15%(5) | 137% | $11 | |
| | | | | | | | | | | | | | | | | | | | | | | | | | | | | | | | | | | | | | | | | | | | | | | |
| For a Share Outstanding Throughout the Years Ended July 31 (except as noted) |
| Per-Share Data | | | | | | Ratios and Supplemental Data | | |
| | Income From Investment Operations*: | Distributions From: | | | Ratio to Average Net Assets of: | | |
| Net Asset
Value,
Beginning
of Period | Net Investment Income (Loss) | Net
Realized
and
Unrealized
Gain (Loss) | Total From
Investment
Operations | Net Investment Income | Net Realized Gains | Total Distributions | Net
Asset
Value,
End
of Period | Total Return(1) | Operating Expenses | Operating
Expenses
(before
expense
waiver) | Net
Investment
Income
(Loss) | Net
Investment
Income
(Loss)
(before
expense
waiver) | Portfolio
Turnover
Rate | Net
Assets,
End of
Period
(in
thousands) |
| R6 Class | | | | | | | | | | | | | | | |
| 2023 | $9.44 | 0.29 | (0.01) | 0.28 | (0.28) | — | (0.28) | $9.44 | 3.23% | 0.22% | 0.23% | 3.10% | 3.09% | 30% | $11,418 | |
| 2022 | $10.59 | 0.30 | (1.18) | (0.88) | (0.26) | (0.01) | (0.27) | $9.44 | (8.13)% | 0.22% | 0.23% | 2.36% | 2.35% | 36% | $6,335 | |
2021(3) | $10.00 | 0.04(4) | 0.55 | 0.59 | — | — | — | $10.59 | 5.40% | 0.22%(5) | 0.23%(5) | 1.01%(5) | 1.00%(5) | 137% | $11 | |
| | |
| Notes to Financial Highlights |
(1)Total returns are calculated based on the net asset value of the last business day and do not reflect applicable sales charges, if any. Total returns for periods less than one year are not annualized.
(2)Per-share amount was less than $0.005.
(3)March 10, 2021 (fund inception) through July 31, 2021.
(4)Computed using average shares outstanding throughout the period.
(5)Annualized.
*The amount shown for a share outstanding throughout the period may not correlate with the Statement(s) of Operations or precisely reflect the class expense differentials due to the timing of transactions in shares of a fund in relation to income earned and/or fluctuations in the fair value of a fund's investments.
See Notes to Financial Statements.
| | | | | | | | | | | | | | | | | | | | | | | | | | | | | | | | | | | | | | | | | | | | | | | |
| For a Share Outstanding Throughout the Years Ended July 31 (except as noted) |
| Per-Share Data | | | | | | Ratios and Supplemental Data | | |
| | Income From Investment Operations*: | Distributions From: | | | Ratio to Average Net Assets of: | | |
| Net Asset
Value,
Beginning
of Period | Net Investment Income (Loss) | Net
Realized
and
Unrealized
Gain (Loss) | Total From
Investment
Operations | Net Investment Income | Net Realized Gains | Total Distributions | Net
Asset
Value,
End
of Period | Total Return(1) | Operating Expenses | Operating
Expenses
(before
expense
waiver) | Net
Investment
Income
(Loss) | Net
Investment
Income
(Loss)
(before
expense
waiver) | Portfolio
Turnover
Rate | Net
Assets,
End of
Period
(in
thousands) |
| One Choice Blend+ 2025 Portfolio | | | | | | | | | | | |
| Investor Class | | | | | | | | | | | | | |
| 2023 | $9.30 | 0.25 | 0.08 | 0.33 | (0.24) | (0.03) | (0.27) | $9.36 | 3.72% | 0.57% | 0.58% | 2.75% | 2.74% | 41% | $4,323 | |
| 2022 | $10.55 | 0.30 | (1.27) | (0.97) | (0.26) | (0.02) | (0.28) | $9.30 | (9.41)% | 0.57% | 0.58% | 1.93% | 1.92% | 32% | $3,081 | |
2021(2) | $10.00 | 0.03(3) | 0.52 | 0.55 | — | — | — | $10.55 | 5.50% | 0.57%(4) | 0.58%(4) | 0.85%(4) | 0.84%(4) | 24% | $1,629 | |
| I Class | | | | | | | | | | | | | | | |
| 2023 | $9.31 | 0.28 | 0.07 | 0.35 | (0.26) | (0.03) | (0.29) | $9.37 | 3.93% | 0.37% | 0.38% | 2.95% | 2.94% | 41% | $5 | |
| 2022 | $10.56 | 0.33 | (1.28) | (0.95) | (0.28) | (0.02) | (0.30) | $9.31 | (9.25)% | 0.37% | 0.38% | 2.13% | 2.12% | 32% | $5 | |
2021(2) | $10.00 | 0.04(3) | 0.52 | 0.56 | — | — | — | $10.56 | 5.60% | 0.37%(4) | 0.38%(4) | 1.05%(4) | 1.04%(4) | 24% | $5 | |
| A Class | | | | | | | | | | | | | | | |
| 2023 | $9.28 | 0.25 | 0.07 | 0.32 | (0.22) | (0.03) | (0.25) | $9.35 | 3.58% | 0.82% | 0.83% | 2.50% | 2.49% | 41% | $5 | |
| 2022 | $10.54 | 0.28 | (1.28) | (1.00) | (0.24) | (0.02) | (0.26) | $9.28 | (9.70)% | 0.82% | 0.83% | 1.68% | 1.67% | 32% | $5 | |
2021(2) | $10.00 | 0.02(3) | 0.52 | 0.54 | — | — | — | $10.54 | 5.40% | 0.82%(4) | 0.83%(4) | 0.60%(4) | 0.59%(4) | 24% | $5 | |
| R Class | | | | | | | | | | | | | | | |
| 2023 | $9.27 | 0.22 | 0.06 | 0.28 | (0.19) | (0.03) | (0.22) | $9.33 | 3.20% | 1.07% | 1.08% | 2.25% | 2.24% | 41% | $28 | |
| 2022 | $10.53 | 0.20 | (1.22) | (1.02) | (0.22) | (0.02) | (0.24) | $9.27 | (9.90)% | 1.07% | 1.08% | 1.43% | 1.42% | 32% | $16 | |
2021(2) | $10.00 | 0.01(3) | 0.52 | 0.53 | — | — | — | $10.53 | 5.30% | 1.07%(4) | 1.08%(4) | 0.35%(4) | 0.34%(4) | 24% | $13 | |
| | | | | | | | | | | | | | | | | | | | | | | | | | | | | | | | | | | | | | | | | | | | | | | |
| For a Share Outstanding Throughout the Years Ended July 31 (except as noted) |
| Per-Share Data | | | | | | Ratios and Supplemental Data | | |
| | Income From Investment Operations*: | Distributions From: | | | Ratio to Average Net Assets of: | | |
| Net Asset
Value,
Beginning
of Period | Net Investment Income (Loss) | Net
Realized
and
Unrealized
Gain (Loss) | Total From
Investment
Operations | Net Investment Income | Net Realized Gains | Total Distributions | Net
Asset
Value,
End
of Period | Total Return(1) | Operating Expenses | Operating
Expenses
(before
expense
waiver) | Net
Investment
Income
(Loss) | Net
Investment
Income
(Loss)
(before
expense
waiver) | Portfolio
Turnover
Rate | Net
Assets,
End of
Period
(in
thousands) |
| R6 Class | | | | | | | | | | | | | | | |
| 2023 | $9.32 | 0.30 | 0.06 | 0.36 | (0.27) | (0.03) | (0.30) | $9.38 | 4.09% | 0.22% | 0.23% | 3.10% | 3.09% | 41% | $23,207 | |
| 2022 | $10.57 | 0.32 | (1.25) | (0.93) | (0.30) | (0.02) | (0.32) | $9.32 | (9.13)% | 0.22% | 0.23% | 2.28% | 2.27% | 32% | $19,569 | |
2021(2) | $10.00 | 0.04(3) | 0.53 | 0.57 | — | — | — | $10.57 | 5.70% | 0.22%(4) | 0.23%(4) | 1.20%(4) | 1.19%(4) | 24% | $5 | |
| | |
| Notes to Financial Highlights |
(1)Total returns are calculated based on the net asset value of the last business day and do not reflect applicable sales charges, if any. Total returns for periods less than one year are not annualized.
(2)March 10, 2021 (fund inception) through July 31, 2021.
(3)Computed using average shares outstanding throughout the period.
(4)Annualized.
*The amount shown for a share outstanding throughout the period may not correlate with the Statement(s) of Operations or precisely reflect the class expense differentials due to the timing of transactions in shares of a fund in relation to income earned and/or fluctuations in the fair value of a fund's investments.
See Notes to Financial Statements.
| | | | | | | | | | | | | | | | | | | | | | | | | | | | | | | | | | | | | | | | | | | | | | | |
| For a Share Outstanding Throughout the Years Ended July 31 (except as noted) |
| Per-Share Data | | | | | | Ratios and Supplemental Data | | |
| | Income From Investment Operations*: | Distributions From: | | | Ratio to Average Net Assets of: | | |
| Net Asset
Value,
Beginning
of Period | Net Investment Income (Loss) | Net
Realized
and
Unrealized
Gain (Loss) | Total From
Investment
Operations | Net Investment Income | Net Realized Gains | Total Distributions | Net
Asset
Value,
End
of Period | Total Return(1) | Operating Expenses | Operating
Expenses
(before
expense
waiver) | Net
Investment
Income
(Loss) | Net
Investment
Income
(Loss)
(before
expense
waiver) | Portfolio
Turnover
Rate | Net
Assets,
End of
Period
(in
thousands) |
| One Choice Blend+ 2030 Portfolio | | | | | | | | | | | |
| Investor Class | | | | | | | | | | | | | |
| 2023 | $9.25 | 0.23 | 0.21 | 0.44 | (0.22) | (0.07) | (0.29) | $9.40 | 5.04% | 0.58% | 0.59% | 2.61% | 2.60% | 36% | $4,126 | |
| 2022 | $10.58 | 0.31 | (1.37) | (1.06) | (0.27) | — | (0.27) | $9.25 | (10.28)% | 0.57% | 0.58% | 1.75% | 1.74% | 26% | $3,498 | |
2021(2) | $10.00 | 0.03(3) | 0.55 | 0.58 | — | — | — | $10.58 | 5.80% | 0.57%(4) | 0.58%(4) | 0.68%(4) | 0.67%(4) | 3% | $2,002 | |
| I Class | | | | | | | | | | | | | | | |
| 2023 | $9.27 | 0.26 | 0.19 | 0.45 | (0.24) | (0.07) | (0.31) | $9.41 | 5.14% | 0.38% | 0.39% | 2.81% | 2.80% | 36% | $5 | |
| 2022 | $10.59 | 0.34 | (1.37) | (1.03) | (0.29) | — | (0.29) | $9.27 | (10.03)% | 0.37% | 0.38% | 1.95% | 1.94% | 26% | $5 | |
2021(2) | $10.00 | 0.04(3) | 0.55 | 0.59 | — | — | — | $10.59 | 5.90% | 0.37%(4) | 0.38%(4) | 0.88%(4) | 0.87%(4) | 3% | $5 | |
| A Class | | | | | | | | | | | | | | | |
| 2023 | $9.24 | 0.21 | 0.21 | 0.42 | (0.20) | (0.07) | (0.27) | $9.39 | 4.78% | 0.83% | 0.84% | 2.36% | 2.35% | 36% | $6 | |
| 2022 | $10.57 | 0.30 | (1.38) | (1.08) | (0.25) | — | (0.25) | $9.24 | (10.48)% | 0.82% | 0.83% | 1.50% | 1.49% | 26% | $5 | |
2021(2) | $10.00 | 0.02(3) | 0.55 | 0.57 | — | — | — | $10.57 | 5.70% | 0.82%(4) | 0.83%(4) | 0.43%(4) | 0.42%(4) | 3% | $5 | |
| R Class | | | | | | | | | | | | | | | |
| 2023 | $9.23 | 0.19 | 0.20 | 0.39 | (0.18) | (0.07) | (0.25) | $9.37 | 4.41% | 1.08% | 1.09% | 2.11% | 2.10% | 36% | $160 | |
| 2022 | $10.56 | 0.26 | (1.36) | (1.10) | (0.23) | — | (0.23) | $9.23 | (10.67)% | 1.07% | 1.08% | 1.25% | 1.24% | 26% | $74 | |
2021(2) | $10.00 | —(3)(5) | 0.56 | 0.56 | — | — | — | $10.56 | 5.60% | 1.07%(4) | 1.08%(4) | 0.18%(4) | 0.17%(4) | 3% | $10 | |
| | | | | | | | | | | | | | | | | | | | | | | | | | | | | | | | | | | | | | | | | | | | | | | |
| For a Share Outstanding Throughout the Years Ended July 31 (except as noted) |
| Per-Share Data | | | | | | Ratios and Supplemental Data | | |
| | Income From Investment Operations*: | Distributions From: | | | Ratio to Average Net Assets of: | | |
| Net Asset
Value,
Beginning
of Period | Net Investment Income (Loss) | Net
Realized
and
Unrealized
Gain (Loss) | Total From
Investment
Operations | Net Investment Income | Net Realized Gains | Total Distributions | Net
Asset
Value,
End
of Period | Total Return(1) | Operating Expenses | Operating
Expenses
(before
expense
waiver) | Net
Investment
Income
(Loss) | Net
Investment
Income
(Loss)
(before
expense
waiver) | Portfolio
Turnover
Rate | Net
Assets,
End of
Period
(in
thousands) |
| R6 Class | | | | | | | | | | | | | | | |
| 2023 | $9.27 | 0.27 | 0.20 | 0.47 | (0.25) | (0.07) | (0.32) | $9.42 | 5.41% | 0.23% | 0.24% | 2.96% | 2.95% | 36% | $28,060 | |
| 2022 | $10.59 | 0.32 | (1.34) | (1.02) | (0.30) | — | (0.30) | $9.27 | (9.92)% | 0.22% | 0.23% | 2.10% | 2.09% | 26% | $20,448 | |
2021(2) | $10.00 | 0.04(3) | 0.55 | 0.59 | — | — | — | $10.59 | 5.90% | 0.22%(4) | 0.23%(4) | 1.03%(4) | 1.02%(4) | 3% | $5 | |
| | |
| Notes to Financial Highlights |
(1)Total returns are calculated based on the net asset value of the last business day and do not reflect applicable sales charges, if any. Total returns for periods less than one year are not annualized.
(2)March 10, 2021 (fund inception) through July 31, 2021.
(3)Computed using average shares outstanding throughout the period.
(4)Annualized.
(5)Per-share amount was less than $0.005.
*The amount shown for a share outstanding throughout the period may not correlate with the Statement(s) of Operations or precisely reflect the class expense differentials due to the timing of transactions in shares of a fund in relation to income earned and/or fluctuations in the fair value of a fund's investments.
See Notes to Financial Statements.
| | | | | | | | | | | | | | | | | | | | | | | | | | | | | | | | | | | | | | | | | | | | | | | |
| For a Share Outstanding Throughout the Years Ended July 31 (except as noted) |
| Per-Share Data | | | | | | Ratios and Supplemental Data | | |
| | Income From Investment Operations*: | Distributions From: | | | Ratio to Average Net Assets of: | | |
| Net Asset
Value,
Beginning
of Period | Net Investment Income (Loss) | Net
Realized
and
Unrealized
Gain (Loss) | Total From
Investment
Operations | Net Investment Income | Net Realized Gains | Total Distributions | Net
Asset
Value,
End
of Period | Total Return(1) | Operating Expenses | Operating
Expenses
(before
expense
waiver) | Net
Investment
Income
(Loss) | Net
Investment
Income
(Loss)
(before
expense
waiver) | Portfolio
Turnover
Rate | Net
Assets,
End of
Period
(in
thousands) |
| One Choice Blend+ 2035 Portfolio | | | | | | | | | | | |
| Investor Class | | | | | | | | | | | | | |
| 2023 | $9.17 | 0.20 | 0.33 | 0.53 | (0.21) | (0.08) | (0.29) | $9.41 | 6.18% | 0.58% | 0.58% | 2.37% | 2.37% | 35% | $4,817 | |
| 2022 | $10.61 | 0.32 | (1.48) | (1.16) | (0.28) | — | (0.28) | $9.17 | (11.24)% | 0.58% | 0.58% | 1.54% | 1.54% | 20% | $3,056 | |
2021(2) | $10.00 | 0.02(3) | 0.59 | 0.61 | — | — | — | $10.61 | 6.10% | 0.58%(4) | 0.58%(4) | 0.54%(4) | 0.54%(4) | 2% | $1,620 | |
| I Class | | | | | | | | | | | | | | | |
| 2023 | $9.18 | 0.24 | 0.31 | 0.55 | (0.23) | (0.08) | (0.31) | $9.42 | 6.39% | 0.38% | 0.38% | 2.57% | 2.57% | 35% | $29 | |
| 2022 | $10.62 | 0.35 | (1.49) | (1.14) | (0.30) | — | (0.30) | $9.18 | (11.08)% | 0.38% | 0.38% | 1.74% | 1.74% | 20% | $27 | |
2021(2) | $10.00 | 0.03(3) | 0.59 | 0.62 | — | — | — | $10.62 | 6.20% | 0.38%(4) | 0.38%(4) | 0.74%(4) | 0.74%(4) | 2% | $31 | |
| A Class | | | | | | | | | | | | | | | |
| 2023 | $9.15 | 0.20 | 0.32 | 0.52 | (0.19) | (0.08) | (0.27) | $9.40 | 6.03% | 0.83% | 0.83% | 2.12% | 2.12% | 35% | $6 | |
| 2022 | $10.60 | 0.30 | (1.49) | (1.19) | (0.26) | — | (0.26) | $9.15 | (11.53)% | 0.83% | 0.83% | 1.29% | 1.29% | 20% | $5 | |
2021(2) | $10.00 | 0.01(3) | 0.59 | 0.60 | — | — | — | $10.60 | 6.00% | 0.83%(4) | 0.83%(4) | 0.29%(4) | 0.29%(4) | 2% | $5 | |
| R Class | | | | | | | | | | | | | | | |
| 2023 | $9.14 | 0.17 | 0.32 | 0.49 | (0.17) | (0.08) | (0.25) | $9.38 | 5.66% | 1.08% | 1.08% | 1.87% | 1.87% | 35% | $223 | |
| 2022 | $10.59 | 0.26 | (1.47) | (1.21) | (0.24) | — | (0.24) | $9.14 | (11.72)% | 1.08% | 1.08% | 1.04% | 1.04% | 20% | $93 | |
2021(2) | $10.00 | —(3)(5) | 0.59 | 0.59 | — | — | — | $10.59 | 5.90% | 1.08%(4) | 1.08%(4) | 0.04%(4) | 0.04%(4) | 2% | $18 | |
| | | | | | | | | | | | | | | | | | | | | | | | | | | | | | | | | | | | | | | | | | | | | | | |
| For a Share Outstanding Throughout the Years Ended July 31 (except as noted) |
| Per-Share Data | | | | | | Ratios and Supplemental Data | | |
| | Income From Investment Operations*: | Distributions From: | | | Ratio to Average Net Assets of: | | |
| Net Asset
Value,
Beginning
of Period | Net Investment Income (Loss) | Net
Realized
and
Unrealized
Gain (Loss) | Total From
Investment
Operations | Net Investment Income | Net Realized Gains | Total Distributions | Net
Asset
Value,
End
of Period | Total Return(1) | Operating Expenses | Operating
Expenses
(before
expense
waiver) | Net
Investment
Income
(Loss) | Net
Investment
Income
(Loss)
(before
expense
waiver) | Portfolio
Turnover
Rate | Net
Assets,
End of
Period
(in
thousands) |
| R6 Class | | | | | | | | | | | | | | | |
| 2023 | $9.19 | 0.26 | 0.31 | 0.57 | (0.25) | (0.08) | (0.33) | $9.43 | 6.55% | 0.23% | 0.23% | 2.72% | 2.72% | 35% | $27,474 | |
| 2022 | $10.62 | 0.33 | (1.45) | (1.12) | (0.31) | — | (0.31) | $9.19 | (10.88)% | 0.23% | 0.23% | 1.89% | 1.89% | 20% | $20,684 | |
2021(2) | $10.00 | 0.04(3) | 0.58 | 0.62 | — | — | — | $10.62 | 6.20% | 0.23%(4) | 0.23%(4) | 0.89%(4) | 0.89%(4) | 2% | $5 | |
| | |
| Notes to Financial Highlights |
(1)Total returns are calculated based on the net asset value of the last business day and do not reflect applicable sales charges, if any. Total returns for periods less than one year are not annualized.
(2)March 10, 2021 (fund inception) through July 31, 2021.
(3)Computed using average shares outstanding throughout the period.
(4)Annualized.
(5)Per-share amount was less than $0.005.
*The amount shown for a share outstanding throughout the period may not correlate with the Statement(s) of Operations or precisely reflect the class expense differentials due to the timing of transactions in shares of a fund in relation to income earned and/or fluctuations in the fair value of a fund's investments.
See Notes to Financial Statements.
| | | | | | | | | | | | | | | | | | | | | | | | | | | | | | | | | | | | | | | | | |
| For a Share Outstanding Throughout the Years Ended July 31 (except as noted) |
| Per-Share Data | | | | | | Ratios and Supplemental Data | |
| | Income From Investment Operations*: | Distributions From: | | | Ratio to Average Net Assets of: | | |
| Net Asset
Value,
Beginning
of Period | Net Investment Income (Loss) | Net
Realized
and
Unrealized
Gain (Loss) | Total From
Investment
Operations | Net Investment Income | Net Realized Gains | Total Distributions | Net Asset
Value,
End
of Period | Total Return(1) | Operating Expenses | Net
Investment
Income
(Loss) | Portfolio
Turnover
Rate | Net Assets,
End of Period
(in thousands) |
| One Choice Blend+ 2040 Portfolio | | | | | | | | | |
| Investor Class | | | | | | | | | | | | | |
| 2023 | $9.14 | 0.19 | 0.45 | 0.64 | (0.19) | (0.08) | (0.27) | $9.51 | 7.33% | 0.58% | 2.16% | 21% | $2,876 | |
| 2022 | $10.65 | 0.31 | (1.52) | (1.21) | (0.28) | (0.02) | (0.30) | $9.14 | (11.73)% | 0.58% | 1.29% | 13% | $1,467 | |
2021(2) | $10.00 | 0.01(3) | 0.64 | 0.65 | — | — | — | $10.65 | 6.50% | 0.58%(4) | 0.37%(4) | 2% | $790 | |
| I Class | | | | | | | | | | | | | |
| 2023 | $9.15 | 0.22 | 0.43 | 0.65 | (0.20) | (0.08) | (0.28) | $9.52 | 7.54% | 0.38% | 2.36% | 21% | $5 | |
| 2022 | $10.66 | 0.36 | (1.55) | (1.19) | (0.30) | (0.02) | (0.32) | $9.15 | (11.58)% | 0.38% | 1.49% | 13% | $5 | |
2021(2) | $10.00 | 0.02(3) | 0.64 | 0.66 | — | — | — | $10.66 | 6.60% | 0.38%(4) | 0.57%(4) | 2% | $5 | |
| A Class | | | | | | | | | | | | | |
| 2023 | $9.12 | 0.18 | 0.43 | 0.61 | (0.16) | (0.08) | (0.24) | $9.49 | 7.07% | 0.83% | 1.91% | 21% | $33 | |
| 2022 | $10.64 | 0.30 | (1.54) | (1.24) | (0.26) | (0.02) | (0.28) | $9.12 | (12.02)% | 0.83% | 1.04% | 13% | $30 | |
2021(2) | $10.00 | 0.01(3) | 0.63 | 0.64 | — | — | — | $10.64 | 6.40% | 0.83%(4) | 0.12%(4) | 2% | $5 | |
| R Class | | | | | | | | | | | | | |
| 2023 | $9.11 | 0.14 | 0.45 | 0.59 | (0.14) | (0.08) | (0.22) | $9.48 | 6.80% | 1.08% | 1.66% | 21% | $251 | |
| 2022 | $10.63 | 0.27 | (1.53) | (1.26) | (0.24) | (0.02) | (0.26) | $9.11 | (12.22)% | 1.08% | 0.79% | 13% | $111 | |
2021(2) | $10.00 | —(3)(5) | 0.63 | 0.63 | — | — | — | $10.63 | 6.30% | 1.08%(4) | (0.13)%(4) | 2% | $33 | |
| R6 Class | | | | | | | | | | | | | |
| 2023 | $9.16 | 0.23 | 0.44 | 0.67 | (0.22) | (0.08) | (0.30) | $9.53 | 7.70% | 0.23% | 2.51% | 21% | $27,154 | |
| 2022 | $10.66 | 0.33 | (1.50) | (1.17) | (0.31) | (0.02) | (0.33) | $9.16 | (11.37)% | 0.23% | 1.64% | 13% | $19,654 | |
2021(2) | $10.00 | 0.03(3) | 0.63 | 0.66 | — | — | — | $10.66 | 6.60% | 0.23%(4) | 0.72%(4) | 2% | $5 | |
| | |
| Notes to Financial Highlights |
(1)Total returns are calculated based on the net asset value of the last business day and do not reflect applicable sales charges, if any. Total returns for periods less than one year are not annualized.
(2)March 10, 2021 (fund inception) through July 31, 2021.
(3)Computed using average shares outstanding throughout the period.
(4)Annualized.
(5)Per-share amount was less than $0.005.
*The amount shown for a share outstanding throughout the period may not correlate with the Statement(s) of Operations or precisely reflect the class expense differentials due to the timing of transactions in shares of a fund in relation to income earned and/or fluctuations in the fair value of a fund's investments.
See Notes to Financial Statements.
| | | | | | | | | | | | | | | | | | | | | | | | | | | | | | | | | | | | | | | | | |
| For a Share Outstanding Throughout the Years Ended July 31 (except as noted) |
| Per-Share Data | | | | | | Ratios and Supplemental Data | |
| | Income From Investment Operations*: | Distributions From: | | | Ratio to Average Net Assets of: | | |
| Net Asset
Value,
Beginning
of Period | Net Investment Income (Loss) | Net
Realized
and
Unrealized
Gain (Loss) | Total From
Investment
Operations | Net Investment Income | Net Realized Gains | Total Distributions | Net Asset
Value,
End
of Period | Total Return(1) | Operating Expenses | Net
Investment
Income
(Loss) | Portfolio
Turnover
Rate | Net Assets,
End of Period
(in thousands) |
| One Choice Blend+ 2045 Portfolio | | | | | | | | | |
| Investor Class | | | | | | | | | | | | | |
| 2023 | $9.15 | 0.17 | 0.57 | 0.74 | (0.18) | (0.09) | (0.27) | $9.62 | 8.47% | 0.58% | 1.89% | 24% | $2,792 | |
| 2022 | $10.68 | 0.32 | (1.56) | (1.24) | (0.29) | — | (0.29) | $9.15 | (11.94)% | 0.58% | 1.08% | 12% | $1,719 | |
2021(2) | $10.00 | 0.01(3) | 0.67 | 0.68 | — | — | — | $10.68 | 6.80% | 0.58%(4) | 0.24%(4) | 10% | $431 | |
| I Class | | | | | | | | | | | | | |
| 2023 | $9.16 | 0.20 | 0.55 | 0.75 | (0.19) | (0.09) | (0.28) | $9.63 | 8.69% | 0.38% | 2.09% | 24% | $15 | |
| 2022 | $10.69 | 0.34 | (1.56) | (1.22) | (0.31) | — | (0.31) | $9.16 | (11.79)% | 0.38% | 1.28% | 12% | $14 | |
2021(2) | $10.00 | 0.02(3) | 0.67 | 0.69 | — | — | — | $10.69 | 6.90% | 0.38%(4) | 0.44%(4) | 10% | $5 | |
| A Class | | | | | | | | | | | | | |
| 2023 | $9.14 | 0.17 | 0.54 | 0.71 | (0.16) | (0.09) | (0.25) | $9.60 | 8.10% | 0.83% | 1.64% | 24% | $5 | |
| 2022 | $10.67 | 0.31 | (1.57) | (1.26) | (0.27) | — | (0.27) | $9.14 | (12.14)% | 0.83% | 0.83% | 12% | $5 | |
2021(2) | $10.00 | —(3)(5) | 0.67 | 0.67 | — | — | — | $10.67 | 6.70% | 0.83%(4) | (0.01)%(4) | 10% | $5 | |
| R Class | | | | | | | | | | | | | |
| 2023 | $9.13 | 0.13 | 0.55 | 0.68 | (0.13) | (0.09) | (0.22) | $9.59 | 7.83% | 1.08% | 1.39% | 24% | $269 | |
| 2022 | $10.66 | 0.26 | (1.54) | (1.28) | (0.25) | — | (0.25) | $9.13 | (12.33)% | 1.08% | 0.58% | 12% | $60 | |
2021(2) | $10.00 | (0.01)(3) | 0.67 | 0.66 | — | — | — | $10.66 | 6.60% | 1.08%(4) | (0.26)%(4) | 10% | $15 | |
| R6 Class | | | | | | | | | | | | | |
| 2023 | $9.17 | 0.22 | 0.54 | 0.76 | (0.21) | (0.09) | (0.30) | $9.63 | 8.74% | 0.23% | 2.24% | 24% | $30,626 | |
| 2022 | $10.70 | 0.34 | (1.54) | (1.20) | (0.33) | — | (0.33) | $9.17 | (11.67)% | 0.23% | 1.43% | 12% | $22,372 | |
2021(2) | $10.00 | 0.03(3) | 0.67 | 0.70 | — | — | — | $10.70 | 7.00% | 0.23%(4) | 0.59%(4) | 10% | $5 | |
| | |
| Notes to Financial Highlights |
(1)Total returns are calculated based on the net asset value of the last business day and do not reflect applicable sales charges, if any. Total returns for periods less than one year are not annualized.
(2)March 10, 2021 (fund inception) through July 31, 2021.
(3)Computed using average shares outstanding throughout the period.
(4)Annualized.
(5)Per-share amount was less than $0.005.
*The amount shown for a share outstanding throughout the period may not correlate with the Statement(s) of Operations or precisely reflect the class expense differentials due to the timing of transactions in shares of a fund in relation to income earned and/or fluctuations in the fair value of a fund's investments.
See Notes to Financial Statements.
| | | | | | | | | | | | | | | | | | | | | | | | | | | | | | | | | | | | | | | | | |
| For a Share Outstanding Throughout the Years Ended July 31 (except as noted) |
| Per-Share Data | | | | | | Ratios and Supplemental Data | |
| | Income From Investment Operations*: | Distributions From: | | | Ratio to Average Net Assets of: | | |
| Net Asset
Value,
Beginning
of Period | Net Investment Income (Loss) | Net
Realized
and
Unrealized
Gain (Loss) | Total From
Investment
Operations | Net Investment Income | Net Realized Gains | Total Distributions | Net Asset
Value,
End
of Period | Total Return(1) | Operating Expenses | Net
Investment
Income
(Loss) | Portfolio
Turnover
Rate | Net Assets,
End of Period
(in thousands) |
| One Choice Blend+ 2050 Portfolio | | | | | | | | | |
| Investor Class | | | | | | | | | | | | | |
| 2023 | $9.14 | 0.16 | 0.64 | 0.80 | (0.16) | (0.09) | (0.25) | $9.69 | 9.20% | 0.58% | 1.73% | 20% | $1,859 | |
| 2022 | $10.70 | 0.35 | (1.59) | (1.24) | (0.32) | — | (0.32) | $9.14 | (12.05)% | 0.58% | 1.15% | 10% | $1,482 | |
2021(2) | $10.00 | 0.01(3) | 0.69 | 0.70 | — | — | — | $10.70 | 7.10% | 0.58%(4) | 0.14%(4) | 12% | $822 | |
| I Class | | | | | | | | | | | | | |
| 2023 | $9.15 | 0.18 | 0.64 | 0.82 | (0.18) | (0.09) | (0.27) | $9.70 | 9.42% | 0.38% | 1.93% | 20% | $5 | |
| 2022 | $10.72 | 0.37 | (1.60) | (1.23) | (0.34) | — | (0.34) | $9.15 | (11.89)% | 0.38% | 1.35% | 10% | $5 | |
2021(2) | $10.00 | 0.02(3) | 0.70 | 0.72 | — | — | — | $10.72 | 7.20% | 0.38%(4) | 0.34%(4) | 12% | $5 | |
| A Class | | | | | | | | | | | | | |
| 2023 | $9.13 | 0.14 | 0.64 | 0.78 | (0.14) | (0.09) | (0.23) | $9.68 | 8.93% | 0.83% | 1.48% | 20% | $5 | |
| 2022 | $10.70 | 0.33 | (1.60) | (1.27) | (0.30) | — | (0.30) | $9.13 | (12.24)% | 0.83% | 0.90% | 10% | $5 | |
2021(2) | $10.00 | —(3)(5) | 0.70 | 0.70 | — | — | — | $10.70 | 7.00% | 0.83%(4) | (0.11)%(4) | 12% | $5 | |
| R Class | | | | | | | | | | | | | |
| 2023 | $9.11 | 0.11 | 0.65 | 0.76 | (0.12) | (0.09) | (0.21) | $9.66 | 8.67% | 1.08% | 1.23% | 20% | $231 | |
| 2022 | $10.68 | 0.29 | (1.58) | (1.29) | (0.28) | — | (0.28) | $9.11 | (12.45)% | 1.08% | 0.65% | 10% | $195 | |
2021(2) | $10.00 | (0.01)(3) | 0.69 | 0.68 | — | — | — | $10.68 | 6.80% | 1.08%(4) | (0.36)%(4) | 12% | $105 | |
| R6 Class | | | | | | | | | | | | | |
| 2023 | $9.16 | 0.19 | 0.64 | 0.83 | (0.19) | (0.09) | (0.28) | $9.71 | 9.58% | 0.23% | 2.08% | 20% | $23,167 | |
| 2022 | $10.72 | 0.37 | (1.57) | (1.20) | (0.36) | — | (0.36) | $9.16 | (11.69)% | 0.23% | 1.50% | 10% | $15,032 | |
2021(2) | $10.00 | 0.03(3) | 0.69 | 0.72 | — | — | — | $10.72 | 7.20% | 0.23%(4) | 0.49%(4) | 12% | $5 | |
| | |
| Notes to Financial Highlights |
(1)Total returns are calculated based on the net asset value of the last business day and do not reflect applicable sales charges, if any. Total returns for periods less than one year are not annualized.
(2)March 10, 2021 (fund inception) through July 31, 2021.
(3)Computed using average shares outstanding throughout the period.
(4)Annualized.
(5)Per-share amount was less than $0.005.
*The amount shown for a share outstanding throughout the period may not correlate with the Statement(s) of Operations or precisely reflect the class expense differentials due to the timing of transactions in shares of a fund in relation to income earned and/or fluctuations in the fair value of a fund's investments.
See Notes to Financial Statements.
| | | | | | | | | | | | | | | | | | | | | | | | | | | | | | | | | | | | | | | | | |
| For a Share Outstanding Throughout the Years Ended July 31 (except as noted) |
| Per-Share Data | | | | | | Ratios and Supplemental Data | |
| | Income From Investment Operations*: | Distributions From: | | | Ratio to Average Net Assets of: | | |
| Net Asset
Value,
Beginning
of Period | Net Investment Income (Loss) | Net
Realized
and
Unrealized
Gain (Loss) | Total From
Investment
Operations | Net Investment Income | Net Realized Gains | Total Distributions | Net Asset
Value,
End
of Period | Total Return(1) | Operating Expenses | Net
Investment
Income
(Loss) | Portfolio
Turnover
Rate | Net Assets,
End of Period
(in thousands) |
| One Choice Blend+ 2055 Portfolio | | | | | | | | | |
| Investor Class | | | | | | | | | | | | | |
| 2023 | $9.14 | 0.14 | 0.70 | 0.84 | (0.16) | (0.11) | (0.27) | $9.71 | 9.69% | 0.58% | 1.60% | 34% | $1,296 | |
| 2022 | $10.73 | 0.36 | (1.62) | (1.26) | (0.33) | — | (0.33) | $9.14 | (12.17)% | 0.58% | 1.09% | 20% | $696 | |
2021(2) | $10.00 | —(3)(4) | 0.73 | 0.73 | — | — | — | $10.73 | 7.30% | 0.58%(5) | 0.12%(5) | 10% | $413 | |
| I Class | | | | | | | | | | | | | |
| 2023 | $9.15 | 0.17 | 0.69 | 0.86 | (0.18) | (0.11) | (0.29) | $9.72 | 9.90% | 0.38% | 1.80% | 34% | $5 | |
| 2022 | $10.73 | 0.38 | (1.61) | (1.23) | (0.35) | — | (0.35) | $9.15 | (11.93)% | 0.38% | 1.29% | 20% | $5 | |
2021(2) | $10.00 | 0.02(3) | 0.71 | 0.73 | — | — | — | $10.73 | 7.30% | 0.38%(5) | 0.32%(5) | 10% | $5 | |
| A Class | | | | | | | | | | | | | |
| 2023 | $9.12 | 0.13 | 0.70 | 0.83 | (0.14) | (0.11) | (0.25) | $9.70 | 9.54% | 0.83% | 1.35% | 34% | $5 | |
| 2022 | $10.71 | 0.33 | (1.61) | (1.28) | (0.31) | — | (0.31) | $9.12 | (12.38)% | 0.83% | 0.84% | 20% | $5 | |
2021(2) | $10.00 | —(3)(4) | 0.71 | 0.71 | — | — | — | $10.71 | 7.10% | 0.83%(5) | (0.13)%(5) | 10% | $5 | |
| R Class | | | | | | | | | | | | | |
| 2023 | $9.11 | 0.11 | 0.69 | 0.80 | (0.12) | (0.11) | (0.23) | $9.68 | 9.16% | 1.08% | 1.10% | 34% | $212 | |
| 2022 | $10.70 | 0.31 | (1.61) | (1.30) | (0.29) | — | (0.29) | $9.11 | (12.57)% | 1.08% | 0.59% | 20% | $185 | |
2021(2) | $10.00 | (0.01)(3) | 0.71 | 0.70 | — | — | — | $10.70 | 7.00% | 1.08%(5) | (0.38)%(5) | 10% | $19 | |
| R6 Class | | | | | | | | | | | | | |
| 2023 | $9.16 | 0.18 | 0.70 | 0.88 | (0.19) | (0.11) | (0.30) | $9.74 | 10.17% | 0.23% | 1.95% | 34% | $12,875 | |
| 2022 | $10.74 | 0.38 | (1.60) | (1.22) | (0.36) | — | (0.36) | $9.16 | (11.81)% | 0.23% | 1.44% | 20% | $9,578 | |
2021(2) | $10.00 | 0.02(3) | 0.72 | 0.74 | — | — | — | $10.74 | 7.40% | 0.23%(5) | 0.47%(5) | 10% | $5 | |
| | |
| Notes to Financial Highlights |
(1)Total returns are calculated based on the net asset value of the last business day and do not reflect applicable sales charges, if any. Total returns for periods less than one year are not annualized.
(2)March 10, 2021 (fund inception) through July 31, 2021.
(3)Computed using average shares outstanding throughout the period.
(4)Per-share amount was less than $0.005.
(5)Annualized.
*The amount shown for a share outstanding throughout the period may not correlate with the Statement(s) of Operations or precisely reflect the class expense differentials due to the timing of transactions in shares of a fund in relation to income earned and/or fluctuations in the fair value of a fund's investments.
See Notes to Financial Statements.
| | | | | | | | | | | | | | | | | | | | | | | | | | | | | | | | | | | | | | | | | |
| For a Share Outstanding Throughout the Years Ended July 31 (except as noted) |
| Per-Share Data | | | | | | Ratios and Supplemental Data | |
| | Income From Investment Operations*: | Distributions From: | | | Ratio to Average Net Assets of: | | |
| Net Asset
Value,
Beginning
of Period | Net
Investment
Income
(Loss) | Net
Realized
and
Unrealized
Gain (Loss) | Total From
Investment
Operations | Net
Investment
Income | Net
Realized
Gains | Total
Distributions | Net Asset
Value,
End
of Period | Total Return(1) | Operating
Expenses | Net
Investment
Income
(Loss) | Portfolio
Turnover
Rate | Net Assets,
End of Period
(in thousands) |
| One Choice Blend+ 2060 Portfolio | | | | | | | | | |
| Investor Class | | | | | | | | | | | | | |
| 2023 | $9.15 | 0.14 | 0.75 | 0.89 | (0.14) | (0.08) | (0.22) | $9.82 | 10.08% | 0.59% | 1.51% | 23% | $1,535 | |
| 2022 | $10.73 | 0.33 | (1.59) | (1.26) | (0.31) | (0.01) | (0.32) | $9.15 | (12.16)% | 0.58% | 1.17% | 19% | $687 | |
2021(2) | $10.00 | 0.01(3) | 0.72 | 0.73 | — | — | — | $10.73 | 7.30% | 0.58%(4) | 0.19%(4) | 13% | $304 | |
| I Class | | | | | | | | | | | | | |
| 2023 | $9.16 | 0.17 | 0.73 | 0.90 | (0.16) | (0.08) | (0.24) | $9.82 | 10.18% | 0.39% | 1.71% | 23% | $12 | |
| 2022 | $10.73 | 0.27 | (1.50) | (1.23) | (0.33) | (0.01) | (0.34) | $9.16 | (11.92)% | 0.38% | 1.37% | 19% | $11 | |
2021(2) | $10.00 | 0.01(3) | 0.72 | 0.73 | — | — | — | $10.73 | 7.30% | 0.38%(4) | 0.39%(4) | 13% | $5 | |
| A Class | | | | | | | | | | | | | |
| 2023 | $9.13 | 0.12 | 0.74 | 0.86 | (0.12) | (0.08) | (0.20) | $9.79 | 9.71% | 0.84% | 1.26% | 23% | $6 | |
| 2022 | $10.71 | 0.33 | (1.61) | (1.28) | (0.29) | (0.01) | (0.30) | $9.13 | (12.37)% | 0.83% | 0.92% | 19% | $5 | |
2021(2) | $10.00 | —(3)(5) | 0.71 | 0.71 | — | — | — | $10.71 | 7.10% | 0.83%(4) | (0.06)%(4) | 13% | $5 | |
| R Class | | | | | | | | | | | | | |
| 2023 | $9.12 | 0.20 | 0.64 | 0.84 | (0.10) | (0.08) | (0.18) | $9.78 | 9.43% | 1.09% | 1.01% | 23% | $87 | |
| 2022 | $10.70 | 0.27 | (1.57) | (1.30) | (0.27) | (0.01) | (0.28) | $9.12 | (12.56)% | 1.08% | 0.67% | 19% | $98 | |
2021(2) | $10.00 | (0.01)(3) | 0.71 | 0.70 | — | — | — | $10.70 | 7.00% | 1.08%(4) | (0.31)%(4) | 13% | $21 | |
| R6 Class | | | | | | | | | | | | | |
| 2023 | $9.16 | 0.16 | 0.76 | 0.92 | (0.17) | (0.08) | (0.25) | $9.83 | 10.46% | 0.24% | 1.86% | 23% | $8,366 | |
| 2022 | $10.74 | 0.36 | (1.58) | (1.22) | (0.35) | (0.01) | (0.36) | $9.16 | (11.90)% | 0.23% | 1.52% | 19% | $3,871 | |
2021(2) | $10.00 | 0.02(3) | 0.72 | 0.74 | — | — | — | $10.74 | 7.40% | 0.23%(4) | 0.54%(4) | 13% | $5 | |
| | |
| Notes to Financial Highlights |
(1)Total returns are calculated based on the net asset value of the last business day and do not reflect applicable sales charges, if any. Total returns for periods less than one year are not annualized.
(2)March 10, 2021 (fund inception) through July 31, 2021.
(3)Computed using average shares outstanding throughout the period.
(4)Annualized.
(5)Per-share amount was less than $0.005.
*The amount shown for a share outstanding throughout the period may not correlate with the Statement(s) of Operations or precisely reflect the class expense differentials due to the timing of transactions in shares of a fund in relation to income earned and/or fluctuations in the fair value of a fund's investments.
See Notes to Financial Statements.
| | | | | | | | | | | | | | | | | | | | | | | | | | | | | | | | | | | | | | | | | |
| For a Share Outstanding Throughout the Years Ended July 31 (except as noted) |
| Per-Share Data | | | | | | Ratios and Supplemental Data | |
| | Income From Investment Operations*: | Distributions From: | | | Ratio to Average Net Assets of: | | |
| Net Asset
Value,
Beginning
of Period | Net Investment Income (Loss) | Net
Realized
and
Unrealized
Gain (Loss) | Total From
Investment
Operations | Net Investment Income | Net Realized Gains | Total Distributions | Net Asset
Value,
End
of Period | Total Return(1) | Operating Expenses | Net
Investment
Income
(Loss) | Portfolio
Turnover
Rate | Net Assets,
End of Period
(in thousands) |
| One Choice Blend+ 2065 Portfolio | | | | | | | | | |
| Investor Class | | | | | | | | | | | | | |
| 2023 | $9.19 | 0.14 | 0.73 | 0.87 | (0.17) | (0.18) | (0.35) | $9.71 | 10.06% | 0.59% | 1.26% | 64% | $2,032 | |
| 2022 | $10.79 | 0.36 | (1.63) | (1.27) | (0.33) | — | (0.33) | $9.19 | (12.20)% | 0.58% | 2.57% | 45% | $1,145 | |
2021(2) | $10.00 | —(3)(4) | 0.79 | 0.79 | — | — | — | $10.79 | 7.90% | 0.58%(5) | 0.13%(5) | 19% | $541 | |
| I Class | | | | | | | | | | | | | |
| 2023 | $9.20 | 0.17 | 0.71 | 0.88 | (0.19) | (0.18) | (0.37) | $9.71 | 10.17% | 0.39% | 1.46% | 64% | $5 | |
| 2022 | $10.80 | 0.38 | (1.63) | (1.25) | (0.35) | — | (0.35) | $9.20 | (12.05)% | 0.38% | 2.77% | 45% | $5 | |
2021(2) | $10.00 | 0.02(3) | 0.78 | 0.80 | — | — | — | $10.80 | 8.00% | 0.38%(5) | 0.33%(5) | 19% | $5 | |
| A Class | | | | | | | | | | | | | |
| 2023 | $9.17 | 0.13 | 0.72 | 0.85 | (0.15) | (0.18) | (0.33) | $9.69 | 9.80% | 0.84% | 1.01% | 64% | $5 | |
| 2022 | $10.78 | 0.33 | (1.63) | (1.30) | (0.31) | — | (0.31) | $9.17 | (12.49)% | 0.83% | 2.32% | 45% | $5 | |
2021(2) | $10.00 | —(3)(4) | 0.78 | 0.78 | — | — | — | $10.78 | 7.80% | 0.83%(5) | (0.12)%(5) | 19% | $5 | |
| R Class | | | | | | | | | | | | | |
| 2023 | $9.16 | 0.11 | 0.71 | 0.82 | (0.12) | (0.18) | (0.30) | $9.68 | 9.53% | 1.09% | 0.76% | 64% | $297 | |
| 2022 | $10.77 | 0.26 | (1.59) | (1.33) | (0.28) | — | (0.28) | $9.16 | (12.68)% | 1.08% | 2.07% | 45% | $206 | |
2021(2) | $10.00 | (0.01)(3) | 0.78 | 0.77 | — | — | — | $10.77 | 7.70% | 1.08%(5) | (0.37)%(5) | 19% | $49 | |
| R6 Class | | | | | | | | | | | | | |
| 2023 | $9.21 | 0.21 | 0.68 | 0.89 | (0.20) | (0.18) | (0.38) | $9.72 | 10.33% | 0.24% | 1.61% | 64% | $1,345 | |
| 2022 | $10.80 | 0.37 | (1.60) | (1.23) | (0.36) | — | (0.36) | $9.21 | (11.84)% | 0.23% | 2.92% | 45% | $921 | |
2021(2) | $10.00 | 0.02(3) | 0.78 | 0.80 | — | — | — | $10.80 | 8.00% | 0.23%(5) | 0.48%(5) | 19% | $5 | |
| | |
| Notes to Financial Highlights |
(1)Total returns are calculated based on the net asset value of the last business day and do not reflect applicable sales charges, if any. Total returns for periods less than one year are not annualized.
(2)March 10, 2021 (fund inception) through July 31, 2021.
(3)Computed using average shares outstanding throughout the period.
(4)Per-share amount was less than $0.005.
(5)Annualized.
*The amount shown for a share outstanding throughout the period may not correlate with the Statement(s) of Operations or precisely reflect the class expense differentials due to the timing of transactions in shares of a fund in relation to income earned and/or fluctuations in the fair value of a fund's investments.
See Notes to Financial Statements.
| | |
| Report of Independent Registered Public Accounting Firm |
To the Shareholders and the Board of Directors of American Century Asset Allocation Portfolios, Inc.:
Opinion on the Financial Statements and Financial Highlights
We have audited the accompanying statements of assets and liabilities, including the schedules of investments, of One Choice® Blend+ 2015 Portfolio, One Choice® Blend+ 2020 Portfolio, One Choice® Blend+ 2025 Portfolio, One Choice® Blend+ 2030 Portfolio, One Choice® Blend+ 2035 Portfolio, One Choice® Blend+ 2040 Portfolio, One Choice® Blend+ 2045 Portfolio, One Choice® Blend+ 2050 Portfolio, One Choice® Blend+ 2055 Portfolio, One Choice® Blend+ 2060 Portfolio, and One Choice® Blend+ 2065 Portfolio, eleven of the portfolios constituting American Century Asset Allocation Portfolios, Inc. (the “Funds”), as of July 31, 2023, the related statements of operations for the year then ended, the statements of changes in net assets for each of the two years in the period then ended, the financial highlights for the two years then ended and the period from March 10, 2021 (commencement of operations) through July 31, 2021, and the related notes. In our opinion, the financial statements and financial highlights present fairly, in all material respects, the financial position of each of the Funds of the American Century Asset Allocation Portfolios, Inc. as of July 31, 2023, and the results of their operations for the year then ended, the changes in their net assets for each of the two years in the period then ended, and the financial highlights for the two years then ended and the period from March 10, 2021 (commencement of operations) through July 31, 2021, in conformity with accounting principles generally accepted in the United States of America.
Basis for Opinion
These financial statements and financial highlights are the responsibility of the Funds’ management. Our responsibility is to express an opinion on the Funds’ financial statements and financial highlights based on our audits. We are a public accounting firm registered with the Public Company Accounting Oversight Board (United States) (PCAOB) and are required to be independent with respect to the Funds in accordance with the U.S. federal securities laws and the applicable rules and regulations of the Securities and Exchange Commission and the PCAOB.
We conducted our audits in accordance with the standards of the PCAOB. Those standards require that we plan and perform the audit to obtain reasonable assurance about whether the financial statements and financial highlights are free of material misstatement, whether due to error or fraud. The Funds are not required to have, nor were we engaged to perform, an audit of their internal control over financial reporting. As part of our audits, we are required to obtain an understanding of internal control over financial reporting but not for the purpose of expressing an opinion on the effectiveness of the Funds’ internal control over financial reporting. Accordingly, we express no such opinion.
Our audits included performing procedures to assess the risks of material misstatement of the financial statements and financial highlights, whether due to error or fraud, and performing procedures that respond to those risks. Such procedures included examining, on a test basis, evidence regarding the amounts and disclosures in the financial statements and financial highlights. Our audits also included evaluating the accounting principles used and significant estimates made by management, as well as evaluating the overall presentation of the financial statements and financial highlights. Our procedures included confirmation of securities owned as of July 31, 2023, by correspondence with the custodian, the transfer agent, and brokers; when replies were not received from brokers, we performed other auditing procedures. We believe that our audits provide a reasonable basis for our opinion.
/s/ Deloitte & Touche LLP
Kansas City, Missouri
September 18, 2023
We have served as the auditor of one or more American Century investment companies since 1997.
The Board of Directors
The individuals listed below serve as directors of the funds. Each director will continue to serve in this capacity until death, retirement, resignation or removal from office. The board has adopted a mandatory retirement age for directors who are not “interested persons,” as that term is defined in the Investment Company Act (independent directors). Independent directors shall retire on December 31 of the year in which they reach their 75th birthday.
Jonathan S. Thomas is an “interested person” because he currently serves as President and Chief Executive Officer of American Century Companies, Inc. (ACC), the parent company of American Century Investment Management, Inc. (ACIM or the advisor). The other directors (more than three-fourths of the total number) are independent. They are not employees, directors or officers of, and have no financial interest in, ACC or any of its wholly owned, direct or indirect, subsidiaries, including ACIM, American Century Investment Services, Inc. (ACIS) and American Century Services, LLC (ACS), and they do not have any other affiliations, positions or relationships that would cause them to be considered “interested persons” under the Investment Company Act. The directors serve in this capacity for seven (in the case of Jonathan S. Thomas, 16; and Stephen E. Yates, 8) registered investment companies in the American Century Investments family of funds.
The following table presents additional information about the directors. The mailing address for each director is 4500 Main Street, Kansas City, Missouri 64111.
| | | | | | | | | | | | | | | | | |
Name
(Year of Birth) | Position(s) Held with Funds | Length of Time Served | Principal Occupation(s) During Past 5 Years | Number of American Century Portfolios Overseen by Director | Other Directorships Held During Past 5 Years |
| Independent Directors | | |
| Brian Bulatao (1964) | Director | Since 2022 | Chief Administrative Officer, Activision Blizzard, Inc. (2021 to present); Under Secretary of State for Management, U.S. Department of State (2018 to 2021); Chief Operating Officer, Central Intelligence Agency (2017 to 2018) | 65 | None |
| Thomas W. Bunn (1953) | Director | Since 2017 | Retired | 65 | None |
Chris H. Cheesman
(1962)
| Director | Since 2019
| Retired. Senior Vice President & Chief Audit Executive, AllianceBernstein (1999 to 2018) | 65 | Alleghany Corporation (2021 to 2022) |
Barry Fink
(1955) | Director | Since 2012 (independent since 2016) | Retired | 65 | None |
Rajesh K. Gupta
(1960)
| Director | Since 2019
| Partner Emeritus, SeaCrest Investment Management and SeaCrest Wealth Management (2019 to present); Chief Executive Officer and Chief Investment Officer, SeaCrest Investment Management (2006 to 2019); Chief Executive Officer and Chief Investment Officer, SeaCrest Wealth Management (2008 to 2019) | 65 | None |
| | | | | | | | | | | | | | | | | |
Name
(Year of Birth) | Position(s) Held with Funds | Length of Time Served | Principal Occupation(s) During Past 5 Years | Number of American Century Portfolios Overseen by Director | Other Directorships Held During Past 5 Years |
| Independent Directors | | |
Lynn Jenkins
(1963)
| Director | Since 2019
| Consultant, LJ Strategies (2019 to present); United States Representative, U.S. House of Representatives (2009 to 2018) | 65 | MGP Ingredients, Inc. (2019 to 2021) |
Jan M. Lewis
(1957) | Director and Board Chair | Since 2011
(Board Chair since 2022) | Retired | 65 | None |
Gary C. Meltzer
(1963) | Director | Since 2022 | Advisor, Pontoro (2021 to present); Executive Advisor, Consultant and Investor, Harris Ariel Advisory LLC (2020 to present); Managing Partner, PricewaterhouseCoopers LLP (1985 to 2020) | 65 | ExcelFin Acquisition Corp., Apollo Realty Income Solutions, Inc. |
Stephen E. Yates
(1948) | Director | Since 2012 | Retired | 116 | None |
| Interested Director | | |
Jonathan S. Thomas
(1963) | Director | Since 2007 | President and Chief Executive Officer, ACC (2007 to present). Also serves as Chief Executive Officer, ACS; Director, ACC and other ACC subsidiaries | 148 | None |
The Statement of Additional Information has additional information about the funds' directors and is available without charge, upon request, by calling 1-800-345-2021.
Officers
The following table presents certain information about the executive officers of the funds. Each officer serves as an officer for each of the 16 investment companies in the American Century family of funds. No officer is compensated for his or her service as an officer of the funds. The listed officers are interested persons of the funds and are appointed or re-appointed on an annual basis. The mailing address for each officer listed below is 4500 Main Street, Kansas City, Missouri 64111.
| | | | | | | | |
Name
(Year of Birth) | Offices with the Funds | Principal Occupation(s) During the Past Five Years |
Patrick Bannigan
(1965) | President since 2019 | Executive Vice President and Director, ACC (2012 to present); Chief Financial Officer, Chief Accounting Officer and Treasurer, ACC (2015 to present). Also serves as President, ACS; Vice President, ACIM; Chief Financial Officer, Chief Accounting Officer and/or Director, ACIM, ACS and other ACC subsidiaries |
R. Wes Campbell
(1974) | Chief Financial Officer and Treasurer since 2018
| Vice President, ACS, (2020 to present); Investment Operations and Investment Accounting, ACS (2000 to present)
|
Amy D. Shelton
(1964) | Chief Compliance Officer and Vice President since 2014 | Chief Compliance Officer, American Century funds, (2014 to present); Chief Compliance Officer, ACIM (2014 to present); Chief Compliance Officer, ACIS (2009 to present). Also serves as Vice President, ACIS |
John Pak
(1968) | General Counsel and
Senior Vice
President since 2021 | General Counsel and Senior Vice President, ACC (2021 to present); Also serves as General Counsel and Senior Vice President, ACIM, ACS and ACIS. Chief Legal Officer of Investment and Wealth Management, The Bank of New York Mellon (2014 to 2021) |
David H. Reinmiller
(1963) | Vice President since 2000 | Attorney, ACC (1994 to present). Also serves as Vice President, ACIM and ACS |
Ward D. Stauffer
(1960) | Secretary since 2005 | Attorney, ACC (2003 to present) |
| | |
| Liquidity Risk Management Program |
The Funds have adopted a liquidity risk management program (the “program”). The Funds' Board of Directors (the "Board") has designated American Century Investment Management, Inc. (“ACIM”) as the administrator of the program. Personnel of ACIM or its affiliates, including members of ACIM’s Investment Oversight Committee who are members of ACIM’s Investment Management and Global Analytics departments, conduct the day-to-day operation of the program pursuant to the program.
Under the program, ACIM manages the Funds' liquidity risk, which is the risk that the Funds could not meet shareholder redemption requests without significant dilution of remaining shareholders’ interests in the Funds. This risk is managed by monitoring the degree of liquidity of the Funds' investments, limiting the amount of the Funds' illiquid investments, and utilizing various risk management tools and facilities available to the Funds for meeting shareholder redemptions, among other means. ACIM’s process of determining the degree of liquidity of certain investments held by the Funds are supported by a third-party liquidity assessment vendor.
The Board reviewed a report prepared by ACIM regarding the operation and effectiveness of the program for the period January 1, 2022 through December 31, 2022. No significant liquidity events impacting the Funds were noted in the report. In addition, ACIM provided its assessment that the program had been effective in managing the Funds' liquidity risk.
A special meeting of shareholders was held on October 13, 2022, to vote on the following proposal. The proposal received the required votes and was adopted. A summary of voting results is listed below.
To elect five directors to the Board of Directors of American Century Asset Allocation
Portfolios, Inc.:
| | | | | | | | | | | |
| Affirmative | | Withhold |
| Brian Bulatao | $ | 8,582,345,051 | | | $ | 563,235,224 | |
| Chris H. Cheesman | $ | 8,707,646,938 | | | $ | 437,933,337 | |
| Rajesh K. Gupta | $ | 8,679,529,882 | | | $ | 466,050,393 | |
| Lynn M. Jenkins | $ | 8,621,650,078 | | | $ | 523,930,197 | |
| Gary C. Meltzer | $ | 8,661,710,317 | | | $ | 483,869,958 | |
The other directors whose term of office continued after the meeting include Jonathan S. Thomas, Thomas W. Bunn, Barry Fink, Jan M. Lewis, and Stephen E. Yates.
Retirement Account Information
As required by law, distributions you receive from certain retirement accounts are subject to federal income tax withholding at the IRS default rate of 10%.* Tax will be withheld on the total amount withdrawn even though you may be receiving amounts that are not subject to withholding, such as nondeductible contributions. In such case, excess amounts of withholding could occur. You may adjust your withholding election so that a greater or lesser amount will be withheld.
You may elect a different withholding rate, or request zero withholding, by submitting an acceptable IRS Form W-4R election with your distribution request. You may notify us of your W-4R election by telephone, on our distribution forms, on IRS Form W-4R, or through other acceptable electronic means. If your withholding election is for an automatic withdrawal plan, you have the right to revoke your election at any time and any election you make will remain in effect until revoked by filing a new election.
Remember, even if you elect not to have income tax withheld, you are liable for paying income tax on the taxable portion of your withdrawal. If you elect not to have income tax withheld or you don’t have enough income tax withheld, you may be responsible for payment of estimated tax. You may incur penalties under the estimated tax rules if your withholding and estimated tax payments are not sufficient. You can reduce or defer the income tax on a distribution by directly or indirectly rolling such distribution over to another IRA or eligible plan. You should consult your tax advisor for additional information.
State tax will be withheld according to state regulations if, at the time of your distribution, your tax residency is within one of the mandatory withholding states.
*Some 403(b), 457 and qualified retirement plan distributions may be subject to 20% mandatory withholding, as they are subject to special tax and withholding rules. Your plan administrator or plan sponsor is required to provide you with a special tax notice explaining those rules at the time you request a distribution. If applicable, federal and/or state taxes may be withheld from your distribution amount.
Proxy Voting Policies
A description of the policies that the funds’ investment advisor uses in exercising the voting rights associated with the securities purchased and/or held by the funds is available without charge, upon request, by calling 1-800-345-2021. It is also available on American Century Investments’ website at americancentury.com/proxy and on the Securities and Exchange Commission’s website at sec.gov. Information regarding how the investment advisor voted proxies relating to portfolio securities during the most recent 12-month period ended June 30 is available on americancentury.com/proxy. It is also available at sec.gov.
Quarterly Portfolio Disclosure
The funds file their complete schedule of portfolio holdings with the Securities and Exchange
Commission (SEC) for the first and third quarters of each fiscal year as an exhibit to their reports on Form N-PORT. These portfolio holdings are available on the funds' website at
americancentury.com and, upon request, by calling 1-800-345-2021. The funds' Form N-PORT
reports are available on the SEC’s website at sec.gov.
Other Tax Information
The following information is provided pursuant to provisions of the Internal Revenue Code.
The funds hereby designate up to the maximum amount allowable as qualified dividend income for the fiscal year ended July 31, 2023.
For corporate taxpayers, the funds hereby designate the following, or up to the maximum amount allowable, of ordinary income distributions paid during the fiscal year ended July 31, 2023 as qualified for the corporate dividends received deduction.
| | | | | | | | | | | | | | | | | |
One Choice Blend+ 2015 Portfolio | One Choice Blend+ 2020 Portfolio | One Choice Blend+ 2025 Portfolio | One Choice Blend+ 2030 Portfolio | One Choice Blend+ 2035 Portfolio | One Choice Blend+ 2040 Portfolio |
| $16,875 | $42,271 | $110,121 | $142,304 | $142,414 | $145,187 |
| | | | | | | | | | | | | | |
One Choice Blend+ 2045 Portfolio | One Choice Blend+ 2050 Portfolio | One Choice Blend+ 2055 Portfolio | One Choice Blend+ 2060 Portfolio | One Choice Blend+ 2065 Portfolio |
| $169,672 | $135,017 | $80,866 | $50,983 | $16,589 |
The funds hereby designate the following, or up to the maximum amount allowable, as long-term capital gain distributions (20% rate gain distributions) for the fiscal year ended July 31, 2023.
| | | | | | | | | | | | | | | | | |
One Choice Blend+ 2015 Portfolio | One Choice Blend+ 2020 Portfolio | One Choice Blend+ 2025 Portfolio | One Choice Blend+ 2030 Portfolio | One Choice Blend+ 2035 Portfolio | One Choice Blend+ 2040 Portfolio |
| $3,071 | — | $63,521 | $191,301 | $208,128 | $208,049 |
| | | | | | | | | | | | | | |
One Choice Blend+ 2045 Portfolio | One Choice Blend+ 2050 Portfolio | One Choice Blend+ 2055 Portfolio | One Choice Blend+ 2060 Portfolio | One Choice Blend+ 2065 Portfolio |
| $247,887 | $182,923 | $125,438 | $53,732 | $39,015 |
For the fiscal year ended July 31, 2023, the funds intend to pass through to shareholders the following foreign source income and foreign taxes paid, or up to the maximum amount allowable, as a foreign tax credit.
| | | | | | | | | | | | | | |
| Foreign Tax Credit | Foreign Source Income |
| Amount | Per Outstanding Share | Amount | Per Outstanding Share |
| One Choice Blend+ 2015 Portfolio | $419 | $0.0009 | $7,161 | $0.0148 |
| One Choice Blend+ 2020 Portfolio | $1,116 | $0.0008 | $18,368 | $0.0136 |
| One Choice Blend+ 2025 Portfolio | $3,637 | $0.0012 | $55,076 | $0.0187 |
| One Choice Blend+ 2030 Portfolio | $5,888 | $0.0017 | $82,656 | $0.0241 |
| One Choice Blend+ 2035 Portfolio | $7,534 | $0.0022 | $98,954 | $0.0287 |
| One Choice Blend+ 2040 Portfolio | $9,161 | $0.0029 | $116,401 | $0.0366 |
| One Choice Blend+ 2045 Portfolio | $11,170 | $0.0032 | $140,871 | $0.0403 |
| One Choice Blend+ 2050 Portfolio | $8,923 | $0.0034 | $112,487 | $0.0432 |
| One Choice Blend+ 2055 Portfolio | $5,297 | $0.0036 | $66,758 | $0.0451 |
| One Choice Blend+ 2060 Portfolio | $3,306 | $0.0032 | $41,665 | $0.0409 |
| One Choice Blend+ 2065 Portfolio | $1,021 | $0.0027 | $12,740 | $0.0336 |
| | | | | | | | |
| |
| | |
| Contact Us | americancentury.com | |
| Automated Information Line | 1-800-345-8765 | |
| Investor Services Representative | 1-800-345-2021
or 816-531-5575 | |
| Investors Using Advisors | 1-800-378-9878 | |
| Business, Not-For-Profit, Employer-Sponsored Retirement Plans | 1-800-345-3533 | |
| Banks and Trust Companies, Broker-Dealers, Financial Professionals, Insurance Companies | 1-800-345-6488 | |
| Telecommunications Relay Services for the Deaf | 711 | |
| | |
| American Century Asset Allocation Portfolios, Inc. | |
| | |
Investment Advisor: American Century Investment Management, Inc. Kansas City, Missouri | |
| | |
| This report and the statements it contains are submitted for the general information of our shareholders. The report is not authorized for distribution to prospective investors unless preceded or accompanied by an effective prospectus. | |
| | |
©2023 American Century Proprietary Holdings, Inc. All rights reserved.
CL-ANN-97414 2309 | |
| | | | | |
| |
| Annual Report |
| |
| July 31, 2023 |
| |
| One Choice® Portfolio: Very Conservative |
| Investor Class (AONIX) |
| R Class (AORHX) |
| |
| One Choice® Portfolio: Conservative |
| Investor Class (AOCIX) |
| R Class (AORSX) |
| |
| One Choice® Portfolio: Moderate |
| Investor Class (AOMIX) |
| R Class (AORMX) |
| |
| One Choice® Portfolio: Aggressive |
| Investor Class (AOGIX) |
| R Class (AORYX) |
| |
| One Choice® Portfolio: Very Aggressive |
| Investor Class (AOVIX) |
| R Class (AORVX) |
| | | | | |
| President’s Letter | |
| Performance | |
| Portfolio Commentary | |
| Portfolio Characteristics | |
| Shareholder Fee Examples | |
| Schedules of Investments | |
| Statements of Assets and Liabilities | |
| Statements of Operations | |
| Statements of Changes in Net Assets | |
| Notes to Financial Statements | |
| Financial Highlights | |
| Report of Independent Registered Public Accounting Firm | |
| Management | |
| Approval of Management Agreement | |
| Liquidity Risk Management Program | |
| Proxy Voting Results | |
| Additional Information | |
| |
Any opinions expressed in this report reflect those of the author as of the date of the report, and do not necessarily represent the opinions of American Century Investments® or any other person in the American Century Investments organization. Any such opinions are subject to change at any time based upon market or other conditions and American Century Investments disclaims any responsibility to update such opinions. These opinions may not be relied upon as investment advice and, because investment decisions made by American Century Investments funds are based on numerous factors, may not be relied upon as an indication of trading intent on behalf of any American Century Investments fund. Security examples are used for representational purposes only and are not intended as recommendations to purchase or sell securities. Performance information for comparative indices and securities is provided to American Century Investments by third party vendors. To the best of American Century Investments’ knowledge, such information is accurate at the time of printing.
Jonathan Thomas
Dear Investor:
Thank you for reviewing this annual report for the period ended July 31, 2023. Annual reports help convey important information about fund returns, including market factors that affected performance. For additional investment insights, please visit americancentury.com.
Stocks Rallied Despite Ongoing Challenges
After delivering modest gains early in the fiscal year, global stocks—most notably U.S. stocks—rallied through the first seven months of 2023. This bounce back, which occurred despite ongoing volatility and rising interest rates, led to strong 12-month performance for most broad stock indices. Investor expectations for the Federal Reserve (Fed) to conclude its rate-hike campaign largely fueled the optimism.
Inflation’s steady slowdown, mounting recession worries and a series of U.S. regional bank failures prompted investors to regularly recalibrate their monetary policy outlooks. However, with inflation still higher than central bank targets, the Fed and its developed markets peers continued to raise rates through period-end.
In June, the Fed bucked the trend of developed markets central banks and paused after 10 consecutive rate hikes. But the break was short-lived. The central bank resumed its tightening campaign in July, raising rates another quarter point to a range of 5.25% to 5.5%, a 22-year high. Citing still-higher-than-target inflation and still-strong economic data, policymakers left their tightening options open. Inflation remained even higher in the eurozone and the U.K., prompting central bankers there to steadily raise interest rates.
Despite the inflation and rate backdrops, better-than-expected corporate earnings helped the S&P 500 Index return 21% for the seven months ended July 31, 2023. For the 12-month period, the S&P 500 Index returned 13%. Global and style-focused stock index returns were even stronger. Meanwhile, amid high inflation and central bank tightening, government bond yields surged, and global and U.S. bond returns declined for the period.
Remaining Diligent in Uncertain Times
We expect market volatility to linger as investors navigate a complex environment of persistent inflation, tighter financial conditions, banking industry turbulence and recession risk. In addition, increasingly tense geopolitical considerations complicate the market backdrop.
We appreciate your confidence in us during these extraordinary times. American Century Investments has a long history of helping clients weather unpredictable and volatile markets, and we’re confident we will continue to meet today’s challenges.
Sincerely,
Jonathan Thomas
President and Chief Executive Officer
American Century Investments
| | | | | | | | | | | | | | | | | | | | |
| Total Returns as of July 31, 2023 |
| | | Average Annual Returns | |
| Ticker
Symbol | 1 year | 5 years | 10 years | Since
Inception | Inception Date |
| One Choice Portfolio: Very Conservative | | | |
| Investor Class | AONIX | 0.21% | 3.19% | 3.51% | — | 9/30/04 |
| R Class | AORHX | -0.29% | 2.68% | — | 2.61% | 3/20/15 |
| One Choice Portfolio: Conservative | | | | | |
| Investor Class | AOCIX | 3.33% | 4.31% | 4.91% | — | 9/30/04 |
| R Class | AORSX | 2.74% | 3.79% | — | 3.74% | 3/20/15 |
| One Choice Portfolio: Moderate | | | | |
| Investor Class | AOMIX | 5.95% | 5.57% | 6.34% | — | 9/30/04 |
| R Class | AORMX | 5.42% | 5.05% | — | 5.03% | 3/20/15 |
| One Choice Portfolio: Aggressive | | | | | |
| Investor Class | AOGIX | 8.42% | 6.72% | 7.63% | — | 9/30/04 |
| R Class | AORYX | 7.92% | 6.19% | — | 6.15% | 3/20/15 |
| One Choice Portfolio: Very Aggressive | | | |
| Investor Class | AOVIX | 10.86% | 7.46% | 8.73% | — | 9/30/04 |
| R Class | AORVX | 10.33% | 6.92% | — | 7.09% | 3/20/15 |
| Russell 3000 Index | — | 12.65% | 11.44% | 12.13% | — | — |
| Bloomberg U.S. Aggregate Bond Index | — | -3.37% | 0.75% | 1.49% | — | — |
Average annual returns since inception are presented when ten years of performance history is not available.
The Russell 3000 Index represents approximately 98% of the investable U.S. equity market and provides a broad measure of equity performance. The Bloomberg U.S. Aggregate Bond Index represents the U.S. investment-grade fixed-rate bond market and provides a broad measure of bond market performance. Performance for these indices is provided for reference only. Neither index is intended to represent the composition of the portfolio, which invests in a mix of equity and fixed-income securities. (See the Schedule of Investments for each portfolio’s asset allocations as of the date of this report.)
Data presented reflect past performance. Past performance is no guarantee of future results. Current performance may be higher or lower than the performance shown. Total returns for periods less than one year are not annualized. Investment return and principal value will fluctuate, and redemption value may be more or less than original cost. Data assumes reinvestment of dividends and capital gains, and none of the charts reflect the deduction of taxes that a shareholder would pay on fund distributions or the redemption of fund shares. To obtain performance data current to the most recent month end, please call 1-800-345-2021 or visit americancentury.com. For additional information about the funds, please consult the prospectus.
| | |
| Growth of $10,000 Over 10 Years of One Choice Portfolio: Very Conservative |
| $10,000 investment made July 31, 2013 |
| Performance for other share classes will vary due to differences in fee structure. |
| | | | | |
| Value on July 31, 2023 |
| Investor Class — $14,125 |
|
| Russell 3000 Index — $31,435 |
|
| Bloomberg U.S. Aggregate Bond Index — $11,601 |
|
| | |
| Growth of $10,000 Over 10 Years of One Choice Portfolio: Conservative |
| $10,000 investment made July 31, 2013 |
| Performance for other share classes will vary due to differences in fee structure. |
| | | | | |
| Value on July 31, 2023 |
| Investor Class — $16,148 |
|
| Russell 3000 Index — $31,435 |
|
| Bloomberg U.S. Aggregate Bond Index — $11,601 |
|
Data presented reflect past performance. Past performance is no guarantee of future results. Current performance may be higher or lower than the performance shown. Total returns for periods less than one year are not annualized. Investment return and principal value will fluctuate, and redemption value may be more or less than original cost. Data assumes reinvestment of dividends and capital gains, and none of the charts reflect the deduction of taxes that a shareholder would pay on fund distributions or the redemption of fund shares. To obtain performance data current to the most recent month end, please call 1-800-345-2021 or visit americancentury.com. For additional information about the funds, please consult the prospectus.
| | |
| Growth of $10,000 Over 10 Years of One Choice Portfolio: Moderate |
| $10,000 investment made July 31, 2013 |
| Performance for other share classes will vary due to differences in fee structure. |
| | | | | |
| Value on July 31, 2023 |
| Investor Class — $18,488 |
|
| Russell 3000 Index — $31,435 |
|
| Bloomberg U.S. Aggregate Bond Index — $11,601 |
|
| | |
| Growth of $10,000 Over 10 Years of One Choice Portfolio: Aggressive |
| $10,000 investment made July 31, 2013 |
| Performance for other share classes will vary due to differences in fee structure. |
| | | | | |
| Value on July 31, 2023 |
| Investor Class — $20,868 |
|
| Russell 3000 Index — $31,435 |
|
| Bloomberg U.S. Aggregate Bond Index — $11,601 |
|
Data presented reflect past performance. Past performance is no guarantee of future results. Current performance may be higher or lower than the performance shown. Total returns for periods less than one year are not annualized. Investment return and principal value will fluctuate, and redemption value may be more or less than original cost. Data assumes reinvestment of dividends and capital gains, and none of the charts reflect the deduction of taxes that a shareholder would pay on fund distributions or the redemption of fund shares. To obtain performance data current to the most recent month end, please call 1-800-345-2021 or visit americancentury.com. For additional information about the funds, please consult the prospectus.
| | |
| Growth of $10,000 Over 10 Years of One Choice Portfolio: Very Aggressive |
| $10,000 investment made July 31, 2013 |
| Performance for other share classes will vary due to differences in fee structure. |
| | | | | |
| Value on July 31, 2023 |
| Investor Class — $23,098 |
|
| Russell 3000 Index — $31,435 |
|
| Bloomberg U.S. Aggregate Bond Index — $11,601 |
|
| | | | | | | | |
| Total Annual Fund Operating Expenses |
| Investor Class | R Class |
| One Choice Portfolio: Very Conservative | 0.69% | 1.19% |
| One Choice Portfolio: Conservative | 0.79% | 1.29% |
| One Choice Portfolio: Moderate | 0.87% | 1.37% |
| One Choice Portfolio: Aggressive | 0.93% | 1.43% |
| One Choice Portfolio: Very Aggressive | 1.04% | 1.54% |
The total annual fund operating expenses shown is as stated in the fund’s prospectus current as of the date of this report. The prospectus may vary from the expense ratio shown elsewhere in this report because it is based on a different time period, includes acquired fund fees and expenses, and, if applicable, does not include fee waivers or expense reimbursements.
Data presented reflect past performance. Past performance is no guarantee of future results. Current performance may be higher or lower than the performance shown. Total returns for periods less than one year are not annualized. Investment return and principal value will fluctuate, and redemption value may be more or less than original cost. Data assumes reinvestment of dividends and capital gains, and none of the charts reflect the deduction of taxes that a shareholder would pay on fund distributions or the redemption of fund shares. To obtain performance data current to the most recent month end, please call 1-800-345-2021 or visit americancentury.com. For additional information about the funds, please consult the prospectus.
Portfolio Managers: Richard Weiss, Scott Wilson, Radu Gabudean, Vidya Rajappa and Brian Garbe
Performance Summary
For the fiscal year ended July 31, 2023, returns of the One Choice® Target Risk Portfolios (the Portfolios) ranged from 0.21%* for One Choice Portfolio: Very Conservative to 10.86% for One Choice Portfolio: Very Aggressive. See pages 3-6 for more detailed performance information. The period was characterized by a hawkish approach in U.S. Federal Reserve (Fed) policy that impacted rates, the economy and markets. As interest rates rose and economic growth slowed, global bonds lost value and global equity markets sold off initially before both reversed course later in the period.
In a mixed market environment, our strategic diversification helped manage volatility. Nearly all stock holdings delivered positive absolute returns, while the opposite was true for bond holdings. Growth-oriented U.S. equities and value-oriented non-U.S. equities were the best performers, while emerging markets bonds also delivered positive returns. Security selection and tactical allocation decisions had mixed effects on performance.
Market Overview
Global stocks rose over the past 12 months. After falling sharply in the second half of 2022 due to rising inflation, the Fed’s interest rate increases and the ongoing war in Ukraine, stocks staged a strong rebound from October 2022 through period-end. They benefited as inflation eased, concerns about a possible recession faded and corporate earnings mostly beat consensus expectations. Bonds finished down, having declined substantially early in the 12-month period before rebounding early in 2023. Nevertheless, stronger-than-expected economic data and the debt ceiling crisis weighed on U.S. government bonds in particular.
Portfolio Performance
Each One Choice Target Risk Portfolio is a fund of funds that invests in other American Century Investments mutual funds to achieve its investment objective and target asset allocation. The Schedules of Investments within this report provide underlying fund allocations for each Portfolio.
The Portfolios gained in value against a shifting backdrop for financial markets. Virtually all equity holdings across the Portfolios delivered positive absolute returns, led by Non-U.S. Intrinsic Value Fund, International Value Fund, Growth Fund and Disciplined Growth Fund. Real Estate Fund and Global Real Estate Fund were the only equity holdings with negative returns. On the bond side, several funds detracted on an absolute basis, including Inflation-Adjusted Bond Fund and Diversified Bond Fund. Conversely, Emerging Markets Debt Fund and High Income Fund posted positive returns. International Small-Mid Cap Fund and International Growth Fund underperformed their benchmarks by the widest margin, while Non-U.S. Intrinsic Value Fund and Small Cap Value Fund performed best on a relative basis.
Portfolio Strategy
Our tactical allocation decisions had a mixed effect. On the one hand, it was detrimental to underweight stocks in favor of short-term bonds in 2023. And within U.S. equities, it hurt to favor value over growth stocks. However, it was beneficial to underweight real estate investments and to favor non-U.S. over U.S. stocks. In an environment of strong performance for equities, security selection contributed in Very Aggressive Portfolio and Aggressive Portfolio, but detracted in Moderate Portfolio, Conservative Portfolio and Very Conservative Portfolio.
*All fund returns referenced in this commentary are for Investor Class shares. Performance for other share classes will vary due to differences in fee structure; when Investor Class performance exceeds that of the fund’s benchmark, other share classes may not. See page 3 for returns for all share classes.
| | |
| Portfolio Characteristics |
| | | | | | | | | | | | | | | | | |
| Portfolio Composition as a % of net assets as of July 31, 2023 |
| One
Choice
Portfolio:
Very
Conservative | One
Choice
Portfolio:
Conservative | One
Choice
Portfolio:
Moderate | One Choice Portfolio: Aggressive | One Choice Portfolio: Very Aggressive |
| Domestic Fixed Income Funds | 57.5% | 38.5% | 25.3% | 15.0% | — |
| Domestic Equity Funds | 23.9% | 33.6% | 45.1% | 56.3% | 65.7% |
| International Fixed Income Funds | 18.6% | 15.8% | 9.0% | 4.5% | — |
| International Equity Funds | — | 12.1% | 20.6% | 24.2% | 34.3% |
| Other Assets and Liabilities | —(1) | —(1) | —(1) | —(1) | — |
(1)Category is less than 0.05% of total net assets.
Fund shareholders may incur two types of costs: (1) transaction costs, including sales charges (loads) on purchase payments and redemption/exchange fees; and (2) ongoing costs, including management fees; distribution and service (12b-1) fees; and other fund expenses. This example is intended to help you understand your ongoing costs (in dollars) of investing in your fund and to compare these costs with the ongoing cost of investing in other mutual funds.
The example is based on an investment of $1,000 made at the beginning of the period and held for the entire period from February 1, 2023 to July 31, 2023.
Actual Expenses
The table provides information about actual account values and actual expenses for each class. You may use the information, together with the amount you invested, to estimate the expenses that you paid over the period. First, identify the share class you own. Then simply divide your account value by $1,000 (for example, an $8,600 account value divided by $1,000 = 8.6), then multiply the result by the number under the heading “Expenses Paid During Period” to estimate the expenses you paid on your account during this period.
If you hold Investor Class shares of any American Century Investments mutual fund, or I Class shares of the American Century Diversified Bond Fund, in an American Century Investments account (i.e., not through a financial intermediary or employer-sponsored retirement plan account), American Century Investments may charge you a $25 annual account maintenance fee if the value of those shares is less than $10,000. We will redeem shares automatically in one of your accounts to pay the $25 fee. In determining your total eligible investment amount, we will include your investments in all personal accounts (including American Century Investments brokerage accounts) registered under your Social Security number. Personal accounts include individual accounts, joint accounts, UGMA/UTMA accounts, personal trusts, Coverdell Education Savings Accounts and IRAs (including traditional, Roth, Rollover, SEP-, SARSEP- and SIMPLE-IRAs), and certain other retirement accounts. If you have only business, business retirement, employer-sponsored or American Century Investments brokerage accounts, you are currently not subject to this fee. If you are subject to the account maintenance fee, your account value could be reduced by the fee amount.
Hypothetical Example for Comparison Purposes
The table also provides information about hypothetical account values and hypothetical expenses based on the actual expense ratio of each class of your fund and an assumed rate of return of 5% per year before expenses, which is not the actual return of a fund’s share class. The hypothetical account values and expenses may not be used to estimate the actual ending account balance or expenses you paid for the period. You may use this information to compare the ongoing costs of investing in your fund and other funds. To do so, compare this 5% hypothetical example with the 5% hypothetical examples that appear in the shareholder reports of the other funds.
Please note that the expenses shown in the table are meant to highlight your ongoing costs only and do not reflect any transactional costs, such as sales charges (loads) or redemption/exchange fees. Therefore, the table is useful in comparing ongoing costs only, and will not help you determine the relative total costs of owning different funds. In addition, if these transactional costs were included, your costs would have been higher.
| | | | | | | | | | | | | | |
| Beginning Account Value 2/1/23 | Ending Account Value 7/31/23 | Expenses Paid During Period(1) 2/1/23 - 7/31/23 | Annualized Expense Ratio(1) |
| One Choice Portfolio: Very Conservative | | |
| Actual | | | | |
| Investor Class | $1,000 | $1,012.60 | $0.00 | 0.00%(2) |
| R Class | $1,000 | $1,010.10 | $2.49 | 0.50% |
| Hypothetical | | | | |
| Investor Class | $1,000 | $1,024.80 | $0.00 | 0.00%(2) |
| R Class | $1,000 | $1,022.32 | $2.51 | 0.50% |
| One Choice Portfolio: Conservative | | |
| Actual | | | | |
| Investor Class | $1,000 | $1,028.60 | $0.00 | 0.00%(2) |
| R Class | $1,000 | $1,025.20 | $2.51 | 0.50% |
| Hypothetical | | | | |
| Investor Class | $1,000 | $1,024.80 | $0.00 | 0.00%(2) |
| R Class | $1,000 | $1,022.32 | $2.51 | 0.50% |
| One Choice Portfolio: Moderate | | |
| Actual | | | | |
| Investor Class | $1,000 | $1,042.70 | $0.00 | 0.00%(2) |
| R Class | $1,000 | $1,040.20 | $2.53 | 0.50% |
| Hypothetical | | | | |
| Investor Class | $1,000 | $1,024.80 | $0.00 | 0.00%(2) |
| R Class | $1,000 | $1,022.32 | $2.51 | 0.50% |
| One Choice Portfolio: Aggressive | | |
| Actual | | | | |
| Investor Class | $1,000 | $1,056.60 | $0.00 | 0.00%(2) |
| R Class | $1,000 | $1,054.40 | $2.55 | 0.50% |
| Hypothetical | | | | |
| Investor Class | $1,000 | $1,024.80 | $0.00 | 0.00%(2) |
| R Class | $1,000 | $1,022.32 | $2.51 | 0.50% |
| One Choice Portfolio: Very Aggressive | | |
| Actual | | | | |
| Investor Class | $1,000 | $1,068.90 | $0.00 | 0.00%(2) |
| R Class | $1,000 | $1,065.60 | $2.56 | 0.50% |
| Hypothetical | | | | |
| Investor Class | $1,000 | $1,024.80 | $0.00 | 0.00%(2) |
| R Class | $1,000 | $1,022.32 | $2.51 | 0.50% |
(1)Expenses are equal to the class's annualized expense ratio listed in the table above, multiplied by the average account value over the period, multiplied by 181, the number of days in the most recent fiscal half-year, divided by 365, to reflect the one-half year period. Annualized expense ratio reflects actual expenses, including any applicable fee waivers or expense reimbursements and excluding any acquired fund fees and expenses.
(2)Other expenses, which include directors' fees and expenses, did not exceed 0.005%.
JULY 31, 2023
One Choice Portfolio: Very Conservative
| | | | | | | | |
| Shares | Value |
UNDERLYING FUNDS(1) — 100.0% | | |
| Domestic Fixed Income Funds — 57.5% | | |
| Diversified Bond Fund Investor Class | 8,136,805 | | $ | 74,695,867 | |
| High Income Fund Investor Class | 595,923 | | 4,964,037 | |
| Inflation-Adjusted Bond Fund Investor Class | 4,624,580 | | 48,881,808 | |
| Short Duration Fund Investor Class | 6,725,082 | | 64,964,292 | |
| Short Duration Inflation Protection Bond Fund Investor Class | 5,755,930 | | 57,616,855 | |
| | 251,122,859 | |
| Domestic Equity Funds — 23.9% | | |
Disciplined Growth Fund Investor Class(2) | 254,058 | | 5,688,354 | |
| Focused Large Cap Value Fund Investor Class | 2,800,453 | | 28,116,549 | |
| Growth Fund Investor Class | 169,318 | | 8,015,510 | |
Heritage Fund Investor Class(2) | 496,255 | | 10,699,261 | |
| Mid Cap Value Fund Investor Class | 934,763 | | 15,040,344 | |
| Real Estate Fund Investor Class | 201,279 | | 4,774,350 | |
Small Cap Growth Fund Investor Class(2) | 138,368 | | 2,558,429 | |
| Small Cap Value Fund Investor Class | 244,358 | | 2,492,455 | |
| Sustainable Equity Fund Investor Class | 588,812 | | 27,067,686 | |
| | 104,452,938 | |
| International Fixed Income Funds — 18.6% | | |
| Emerging Markets Debt Fund Investor Class | 1,067,860 | | 9,589,381 | |
| Global Bond Fund Investor Class | 4,713,482 | | 40,158,870 | |
International Bond Fund Investor Class(2) | 2,967,601 | | 31,278,519 | |
| | 81,026,770 | |
TOTAL INVESTMENT SECURITIES — 100.0% (Cost $432,759,333) | | 436,602,567 | |
OTHER ASSETS AND LIABILITIES† | | (62) | |
| TOTAL NET ASSETS — 100.0% | | $ | 436,602,505 | |
| | | | | | | | |
| NOTES TO SCHEDULE OF INVESTMENTS |
†Category is less than 0.05% of total net assets.
(1)Investments are funds within the American Century Investments family of funds and are considered affiliated funds.
(2)Non-income producing.
See Notes to Financial Statements.
JULY 31, 2023
One Choice Portfolio: Conservative
| | | | | | | | |
| Shares | Value |
UNDERLYING FUNDS(1) — 100.0% | | |
| Domestic Fixed Income Funds — 38.5% | | |
| Diversified Bond Fund Investor Class | 21,585,319 | | $ | 198,153,224 | |
| High Income Fund Investor Class | 1,503,589 | | 12,524,897 | |
| Inflation-Adjusted Bond Fund Investor Class | 9,382,791 | | 99,176,097 | |
| Short Duration Fund Investor Class | 8,109,483 | | 78,337,601 | |
| Short Duration Inflation Protection Bond Fund Investor Class | 5,936,032 | | 59,419,679 | |
| | 447,611,498 | |
| Domestic Equity Funds — 33.6% | | |
Disciplined Growth Fund Investor Class(2) | 1,135,735 | | 25,429,104 | |
| Focused Large Cap Value Fund Investor Class | 8,954,064 | | 89,898,798 | |
| Growth Fund Investor Class | 890,711 | | 42,166,235 | |
Heritage Fund Investor Class(2) | 2,289,476 | | 49,361,110 | |
| Mid Cap Value Fund Investor Class | 3,377,882 | | 54,350,117 | |
Small Cap Growth Fund Investor Class(2) | 521,688 | | 9,646,014 | |
| Small Cap Value Fund Investor Class | 920,662 | | 9,390,756 | |
| Sustainable Equity Fund Investor Class | 2,401,412 | | 110,392,923 | |
| | 390,635,057 | |
| International Fixed Income Funds — 15.8% | | |
| Emerging Markets Debt Fund Investor Class | 2,808,028 | | 25,216,088 | |
| Global Bond Fund Investor Class | 11,049,738 | | 94,143,769 | |
International Bond Fund Investor Class(2) | 6,135,278 | | 64,665,830 | |
| | 184,025,687 | |
| International Equity Funds — 12.1% | | |
Global Real Estate Fund Investor Class(2) | 1,029,865 | | 12,245,091 | |
International Growth Fund Investor Class(2) | 4,692,966 | | 57,911,203 | |
International Small-Mid Cap Fund Investor Class(2) | 1,286,936 | | 12,161,546 | |
| International Value Fund Investor Class | 6,858,977 | | 57,958,356 | |
| | 140,276,196 | |
TOTAL INVESTMENT SECURITIES — 100.0% (Cost $1,104,870,315) | | 1,162,548,438 | |
OTHER ASSETS AND LIABILITIES† | | (3,606) | |
| TOTAL NET ASSETS — 100.0% | | $ | 1,162,544,832 | |
| | | | | | | | |
| NOTES TO SCHEDULE OF INVESTMENTS |
†Category is less than 0.05% of total net assets.
(1)Investments are funds within the American Century Investments family of funds and are considered affiliated funds.
(2)Non-income producing.
See Notes to Financial Statements.
JULY 31, 2023
One Choice Portfolio: Moderate
| | | | | | | | |
| Shares | Value |
UNDERLYING FUNDS(1) — 100.0% | | |
| Domestic Equity Funds — 45.1% | | |
Disciplined Growth Fund Investor Class(2) | 1,466,085 | | $ | 32,825,646 | |
Focused Dynamic Growth Fund Investor Class(2) | 692,545 | | 32,618,867 | |
| Focused Large Cap Value Fund Investor Class | 17,102,602 | | 171,710,127 | |
| Growth Fund Investor Class | 1,822,150 | | 86,260,585 | |
Heritage Fund Investor Class(2) | 5,093,109 | | 109,807,439 | |
| Mid Cap Value Fund Investor Class | 6,254,743 | | 100,638,812 | |
Small Cap Growth Fund Investor Class(2) | 1,327,647 | | 24,548,186 | |
| Small Cap Value Fund Investor Class | 2,335,093 | | 23,817,946 | |
| Sustainable Equity Fund Investor Class | 5,204,822 | | 239,265,658 | |
| | 821,493,266 | |
| Domestic Fixed Income Funds — 25.3% | | |
| Core Plus Fund Investor Class | 25,366,126 | | 232,607,378 | |
| High Income Fund Investor Class | 2,263,211 | | 18,852,544 | |
| Inflation-Adjusted Bond Fund Investor Class | 10,026,271 | | 105,977,687 | |
| Short Duration Fund Investor Class | 8,887,442 | | 85,852,692 | |
| Short Duration Inflation Protection Bond Fund Investor Class | 1,793,187 | | 17,949,800 | |
| | 461,240,101 | |
| International Equity Funds — 20.6% | | |
| Emerging Markets Fund Investor Class | 5,768,717 | | 60,167,722 | |
Global Real Estate Fund Investor Class(2) | 1,548,674 | | 18,413,737 | |
International Growth Fund Investor Class(2) | 10,027,845 | | 123,743,602 | |
International Small-Mid Cap Fund Investor Class(2) | 3,875,996 | | 36,628,160 | |
| International Value Fund Investor Class | 10,347,413 | | 87,435,641 | |
| Non-U.S. Intrinsic Value Fund Investor Class | 4,686,477 | | 49,395,465 | |
| | 375,784,327 | |
| International Fixed Income Funds — 9.0% | | |
| Emerging Markets Debt Fund Investor Class | 4,237,375 | | 38,051,631 | |
| Global Bond Fund Investor Class | 10,481,361 | | 89,301,193 | |
International Bond Fund Investor Class(2) | 3,371,124 | | 35,531,652 | |
| | 162,884,476 | |
TOTAL INVESTMENT SECURITIES — 100.0% (Cost $1,638,654,759) | | 1,821,402,170 | |
OTHER ASSETS AND LIABILITIES† | | (1,122) | |
| TOTAL NET ASSETS — 100.0% | | $ | 1,821,401,048 | |
| | | | | | | | |
| NOTES TO SCHEDULE OF INVESTMENTS |
†Category is less than 0.05% of total net assets.
(1)Investments are funds within the American Century Investments family of funds and are considered affiliated funds.
(2)Non-income producing.
See Notes to Financial Statements.
JULY 31, 2023
One Choice Portfolio: Aggressive
| | | | | | | | |
| Shares | Value |
UNDERLYING FUNDS(1) — 100.0% | | |
| Domestic Equity Funds — 56.3% | | |
Focused Dynamic Growth Fund Investor Class(2) | 915,429 | | $ | 43,116,698 | |
| Focused Large Cap Value Fund Investor Class | 11,375,706 | | 114,212,092 | |
| Growth Fund Investor Class | 1,383,276 | | 65,484,308 | |
Heritage Fund Investor Class(2) | 3,233,263 | | 69,709,150 | |
| Mid Cap Value Fund Investor Class | 3,956,475 | | 63,659,684 | |
Small Cap Growth Fund Investor Class(2) | 802,624 | | 14,840,516 | |
| Small Cap Value Fund Investor Class | 1,402,040 | | 14,300,803 | |
| Sustainable Equity Fund Investor Class | 2,791,999 | | 128,348,188 | |
| | 513,671,439 | |
| International Equity Funds — 24.2% | | |
| Emerging Markets Fund Investor Class | 4,129,273 | | 43,068,314 | |
Global Real Estate Fund Investor Class(2) | 767,855 | | 9,129,797 | |
International Growth Fund Investor Class(2) | 5,610,341 | | 69,231,605 | |
International Small-Mid Cap Fund Investor Class(2) | 2,406,908 | | 22,745,285 | |
| International Value Fund Investor Class | 4,817,894 | | 40,711,208 | |
| Non-U.S. Intrinsic Value Fund Investor Class | 3,437,952 | | 36,236,015 | |
| | 221,122,224 | |
| Domestic Fixed Income Funds — 15.0% | | |
| Core Plus Fund Investor Class | 6,303,850 | | 57,806,309 | |
| High Income Fund Investor Class | 3,282,089 | | 27,339,804 | |
| Inflation-Adjusted Bond Fund Investor Class | 2,481,793 | | 26,232,555 | |
| Short Duration Fund Investor Class | 1,705,494 | | 16,475,070 | |
| Short Duration Inflation Protection Bond Fund Investor Class | 890,798 | | 8,916,887 | |
| | 136,770,625 | |
| International Fixed Income Funds — 4.5% | | |
| Emerging Markets Debt Fund Investor Class | 1,570,175 | | 14,100,171 | |
| Global Bond Fund Investor Class | 3,111,805 | | 26,512,578 | |
| | 40,612,749 | |
TOTAL INVESTMENT SECURITIES — 100.0% (Cost $751,188,126) | | 912,177,037 | |
OTHER ASSETS AND LIABILITIES† | | (5,021) | |
| TOTAL NET ASSETS — 100.0% | | $ | 912,172,016 | |
| | | | | | | | |
| NOTES TO SCHEDULE OF INVESTMENTS |
†Category is less than 0.05% of total net assets.
(1)Investments are funds within the American Century Investments family of funds and are considered affiliated funds.
(2)Non-income producing.
See Notes to Financial Statements.
JULY 31, 2023
One Choice Portfolio: Very Aggressive
| | | | | | | | |
| Shares | Value |
UNDERLYING FUNDS(1) — 100.0% | | |
| Domestic Equity Funds — 65.7% | | |
Focused Dynamic Growth Fund Investor Class(2) | 453,676 | | $ | 21,368,155 | |
| Focused Large Cap Value Fund Investor Class | 4,485,417 | | 45,033,588 | |
| Growth Fund Investor Class | 699,125 | | 33,096,558 | |
Heritage Fund Investor Class(2) | 1,394,993 | | 30,076,049 | |
| Mid Cap Value Fund Investor Class | 1,634,602 | | 26,300,753 | |
Small Cap Growth Fund Investor Class(2) | 481,794 | | 8,908,376 | |
| Small Cap Value Fund Investor Class | 850,119 | | 8,671,210 | |
| Sustainable Equity Fund Investor Class | 1,130,325 | | 51,961,041 | |
| | 225,415,730 | |
| International Equity Funds — 34.3% | | |
| Emerging Markets Fund Investor Class | 2,529,139 | | 26,378,922 | |
Global Real Estate Fund Investor Class(2) | 548,089 | | 6,516,781 | |
International Growth Fund Investor Class(2) | 2,805,312 | | 34,617,553 | |
International Small-Mid Cap Fund Investor Class(2) | 1,729,118 | | 16,340,167 | |
| International Value Fund Investor Class | 1,814,920 | | 15,336,077 | |
| Non-U.S. Intrinsic Value Fund Investor Class | 1,740,381 | | 18,343,620 | |
| | 117,533,120 | |
TOTAL INVESTMENT SECURITIES — 100.0% (Cost $263,770,247) | | 342,948,850 | |
| OTHER ASSETS AND LIABILITIES | | — | |
| TOTAL NET ASSETS — 100.0% | | $ | 342,948,850 | |
| | | | | | | | |
| NOTES TO SCHEDULE OF INVESTMENTS |
(1)Investments are funds within the American Century Investments family of funds and are considered affiliated funds.
(2)Non-income producing.
See Notes to Financial Statements.
| | |
| Statements of Assets and Liabilities |
| | | | | | | | | | | |
| JULY 31, 2023 | | | |
| One Choice Portfolio: Very Conservative | One Choice Portfolio: Conservative | One Choice Portfolio: Moderate |
| Assets | | | |
| Investment securities in affiliates, at value (cost of $432,759,333, $1,104,870,315 and $1,638,654,759, respectively) | $ | 436,602,567 | | $ | 1,162,548,438 | | $ | 1,821,402,170 | |
| Receivable for investments sold | 961,718 | | 1,299,766 | | 1,297,157 | |
| Receivable for capital shares sold | 77,493 | | 92,527 | | 908,047 | |
| Distributions receivable from affiliates | 454,434 | | 904,567 | | 1,116,381 | |
| 438,096,212 | | 1,164,845,298 | | 1,824,723,755 | |
| | | |
| Liabilities | | | |
| Payable for investments purchased | 454,434 | | 904,567 | | 1,116,381 | |
| Payable for capital shares redeemed | 1,038,232 | | 1,395,022 | | 2,204,308 | |
| Distribution and service fees payable | 1,041 | | 877 | | 2,018 | |
| 1,493,707 | | 2,300,466 | | 3,322,707 | |
| | | |
| Net Assets | $ | 436,602,505 | | $ | 1,162,544,832 | | $ | 1,821,401,048 | |
| | | |
| Net Assets Consist of: | | | |
| Capital (par value and paid-in surplus) | $ | 446,616,283 | | $ | 1,134,653,735 | | $ | 1,684,926,799 | |
| Distributable earnings (loss) | (10,013,778) | | 27,891,097 | | 136,474,249 | |
| $ | 436,602,505 | | $ | 1,162,544,832 | | $ | 1,821,401,048 | |
| | | | | | | | | | | |
| Fund/Class | Net Assets | Shares Outstanding | Net Asset Value Per Share |
| One Choice Portfolio: Very Conservative |
| Investor Class, $0.01 Par Value | $434,209,938 | 39,315,841 | $11.04 |
| R Class, $0.01 Par Value | $2,392,567 | 216,473 | $11.05 |
| One Choice Portfolio: Conservative |
| Investor Class, $0.01 Par Value | $1,160,447,920 | 93,685,984 | $12.39 |
| R Class, $0.01 Par Value | $2,096,912 | 169,318 | $12.38 |
| One Choice Portfolio: Moderate |
| Investor Class, $0.01 Par Value | $1,816,522,820 | 128,998,987 | $14.08 |
| R Class, $0.01 Par Value | $4,878,228 | 346,527 | $14.08 |
See Notes to Financial Statements.
| | | | | | | | |
| JULY 31, 2023 | | |
| One Choice Portfolio: Aggressive | One Choice Portfolio: Very Aggressive |
| Assets | | |
| Investment securities in affiliates, at value (cost of $751,188,126 and $263,770,247, respectively) | $ | 912,177,037 | | $ | 342,948,850 | |
| Receivable for investments sold | 714,645 | | — | |
| Receivable for capital shares sold | 3,889,660 | | 887,644 | |
| Distributions receivable from affiliates | 374,209 | | — | |
| 917,155,551 | | 343,836,494 | |
| | |
| Liabilities | | |
| Payable for investments purchased | 374,209 | | 793,652 | |
| Payable for capital shares redeemed | 4,607,035 | | 91,329 | |
| Distribution and service fees payable | 2,291 | | 2,663 | |
| 4,983,535 | | 887,644 | |
| | |
| Net Assets | $ | 912,172,016 | | $ | 342,948,850 | |
| | |
| Net Assets Consist of: | | |
| Capital (par value and paid-in surplus) | $ | 775,188,903 | | $ | 280,208,689 | |
| Distributable earnings (loss) | 136,983,113 | | 62,740,161 | |
| $ | 912,172,016 | | $ | 342,948,850 | |
| | | | | | | | | | | |
| Fund/Class | Net Assets | Shares Outstanding | Net Asset Value Per Share |
| One Choice Portfolio: Aggressive |
| Investor Class, $0.01 Par Value | $906,625,221 | 61,522,479 | $14.74 |
| R Class, $0.01 Par Value | $5,546,795 | 376,652 | $14.73 |
| One Choice Portfolio: Very Aggressive |
| Investor Class, $0.01 Par Value | $336,502,393 | 19,534,717 | $17.23 |
| R Class, $0.01 Par Value | $6,446,457 | 374,445 | $17.22 |
See Notes to Financial Statements.
| | | | | | | | | | | |
| YEAR ENDED JULY 31, 2023 |
| One Choice
Portfolio: Very Conservative | One Choice
Portfolio:
Conservative | One Choice
Portfolio:
Moderate |
| Investment Income (Loss) | | | |
| Income from Affiliates: | | | |
| Income distributions from underlying funds | $ | 15,503,634 | | $ | 31,796,332 | | $ | 40,787,428 | |
| | | |
| Expenses: | | | |
| Distribution and service fees - R Class | 11,388 | | 10,199 | | 24,788 | |
| Directors' fees and expenses | 14,873 | | 37,761 | | 56,873 | |
| Proxy solicitation expenses | 9,880 | | 18,905 | | 27,472 | |
| Other expenses | 31 | | 130 | | 276 | |
| 36,172 | | 66,995 | | 109,409 | |
| | | |
| Net investment income (loss) | 15,467,462 | | 31,729,337 | | 40,678,019 | |
| | | |
| Realized and Unrealized Gain (Loss) on Affiliates | | |
| Net realized gain (loss) on: | | | |
| Sales of investments in underlying funds | (8,460,759) | | (19,986,538) | | (24,480,564) | |
| Capital gain distributions received from underlying funds | 3,777,907 | | 10,387,432 | | 19,356,482 | |
| (4,682,852) | | (9,599,106) | | (5,124,082) | |
| | | |
| Change in net unrealized appreciation (depreciation) on investments in underlying funds | (11,456,927) | | 11,182,392 | | 64,915,387 | |
| | | |
| Net realized and unrealized gain (loss) on affiliates | (16,139,779) | | 1,583,286 | | 59,791,305 | |
| | | |
| Net Increase (Decrease) in Net Assets Resulting from Operations | $ | (672,317) | | $ | 33,312,623 | | $ | 100,469,324 | |
See Notes to Financial Statements.
| | | | | | | | |
| YEAR ENDED JULY 31, 2023 |
| One Choice
Portfolio:
Aggressive | One Choice
Portfolio:
Very Aggressive |
| Investment Income (Loss) | | |
| Income from Affiliates: | | |
| Income distributions from underlying funds | $ | 17,162,365 | | $ | 3,801,932 | |
| | |
| Expenses: | | |
| Distribution and service fees - R Class | 24,271 | | 26,815 | |
| Directors' fees and expenses | 28,078 | | 10,390 | |
| Proxy solicitation expenses | 20,504 | | 9,320 | |
| Other expenses | 156 | | 63 | |
| 73,009 | | 46,588 | |
| | |
| Net investment income (loss) | 17,089,356 | | 3,755,344 | |
| | |
| Realized and Unrealized Gain (Loss) on Affiliates | | |
| Net realized gain (loss) on: | | |
| Sales of investments in underlying funds | (16,670,760) | | (10,001,020) | |
| Capital gain distributions received from underlying funds | 12,293,197 | | 5,107,453 | |
| (4,377,563) | | (4,893,567) | |
| | |
| Change in net unrealized appreciation (depreciation) on investments in underlying funds | 57,312,491 | | 34,844,520 | |
| | |
| Net realized and unrealized gain (loss) on affiliates | 52,934,928 | | 29,950,953 | |
| | |
| Net Increase (Decrease) in Net Assets Resulting from Operations | $ | 70,024,284 | | $ | 33,706,297 | |
See Notes to Financial Statements.
| | |
| Statements of Changes in Net Assets |
| | | | | | | | | | | | | | |
| YEARS ENDED JULY 31, 2023 AND JULY 31, 2022 |
| One Choice Portfolio:
Very Conservative | One Choice Portfolio:
Conservative |
| Increase (Decrease) in Net Assets | July 31, 2023 | July 31, 2022 | July 31, 2023 | July 31, 2022 |
| Operations | | | | |
| Net investment income (loss) | $ | 15,467,462 | | $ | 18,325,385 | | $ | 31,729,337 | | $ | 54,351,423 | |
| Net realized gain (loss) | (4,682,852) | | 16,599,138 | | (9,599,106) | | 73,079,318 | |
| Change in net unrealized appreciation (depreciation) | (11,456,927) | | (70,214,396) | | 11,182,392 | | (257,262,446) | |
| Net increase (decrease) in net assets resulting from operations | (672,317) | | (35,289,873) | | 33,312,623 | | (129,831,705) | |
| | | | |
| Distributions to Shareholders | | | | |
| From earnings: | | | | |
| Investor Class | (31,122,338) | | (33,825,632) | | (101,507,450) | | (115,551,570) | |
| R Class | (138,804) | | (103,325) | | (170,559) | | (136,670) | |
| Decrease in net assets from distributions | (31,261,142) | | (33,928,957) | | (101,678,009) | | (115,688,240) | |
| | | | |
| Capital Share Transactions | | | | |
| Net increase (decrease) in net assets from capital share transactions (Note 5) | (30,103,365) | | 41,327,920 | | (23,986,357) | | 46,423,731 | |
| | | | |
| Net increase (decrease) in net assets | (62,036,824) | | (27,890,910) | | (92,351,743) | | (199,096,214) | |
| | | | |
| Net Assets | | | | |
| Beginning of period | 498,639,329 | | 526,530,239 | | 1,254,896,575 | | 1,453,992,789 | |
| End of period | $ | 436,602,505 | | $ | 498,639,329 | | $ | 1,162,544,832 | | $ | 1,254,896,575 | |
See Notes to Financial Statements.
| | | | | | | | | | | | | | |
| YEARS ENDED JULY 31, 2023 AND JULY 31, 2022 |
| One Choice Portfolio:
Moderate | One Choice Portfolio:
Aggressive |
| Increase (Decrease) in Net Assets | July 31, 2023 | July 31, 2022 | July 31, 2023 | July 31, 2022 |
| Operations | | | | |
| Net investment income (loss) | $ | 40,678,019 | | $ | 86,479,167 | | $ | 17,089,356 | | $ | 45,523,292 | |
| Net realized gain (loss) | (5,124,082) | | 139,051,972 | | (4,377,563) | | 81,141,763 | |
| Change in net unrealized appreciation (depreciation) | 64,915,387 | | (462,386,161) | | 57,312,491 | | (254,398,292) | |
| Net increase (decrease) in net assets resulting from operations | 100,469,324 | | (236,855,022) | | 70,024,284 | | (127,733,237) | |
| | | | |
| Distributions to Shareholders | | | | |
| From earnings: | | | | |
| Investor Class | (163,873,048) | | (197,569,118) | | (89,027,672) | | (102,997,622) | |
| R Class | (450,933) | | (471,737) | | (470,701) | | (471,804) | |
| Decrease in net assets from distributions | (164,323,981) | | (198,040,855) | | (89,498,373) | | (103,469,426) | |
| | | | |
| Capital Share Transactions | | | | |
| Net increase (decrease) in net assets from capital share transactions (Note 5) | 40,512,101 | | 94,545,565 | | 20,707,548 | | 58,711,106 | |
| | | | |
| Net increase (decrease) in net assets | (23,342,556) | | (340,350,312) | | 1,233,459 | | (172,491,557) | |
| | | | |
| Net Assets | | | | |
| Beginning of period | 1,844,743,604 | | 2,185,093,916 | | 910,938,557 | | 1,083,430,114 | |
| End of period | $ | 1,821,401,048 | | $ | 1,844,743,604 | | $ | 912,172,016 | | $ | 910,938,557 | |
See Notes to Financial Statements.
| | | | | | | | |
| YEARS ENDED JULY 31, 2023 AND JULY 31, 2022 |
| One Choice Portfolio:
Very Aggressive |
| Increase (Decrease) in Net Assets | July 31, 2023 | July 31, 2022 |
| Operations | | |
| Net investment income (loss) | $ | 3,755,344 | | $ | 17,070,266 | |
| Net realized gain (loss) | (4,893,567) | | 35,147,596 | |
| Change in net unrealized appreciation (depreciation) | 34,844,520 | | (110,188,438) | |
| Net increase (decrease) in net assets resulting from operations | 33,706,297 | | (57,970,576) | |
| | |
| Distributions to Shareholders | | |
| From earnings: | | |
| Investor Class | (34,957,792) | | (37,268,908) | |
| R Class | (546,234) | | (487,089) | |
| Decrease in net assets from distributions | (35,504,026) | | (37,755,997) | |
| | |
| Capital Share Transactions | | |
| Net increase (decrease) in net assets from capital share transactions (Note 5) | 8,152,404 | | 30,385,890 | |
| | |
| Net increase (decrease) in net assets | 6,354,675 | | (65,340,683) | |
| | |
| Net Assets | | |
| Beginning of period | 336,594,175 | | 401,934,858 | |
| End of period | $ | 342,948,850 | | $ | 336,594,175 | |
See Notes to Financial Statements.
| | |
| Notes to Financial Statements |
JULY 31, 2023
1. Organization
American Century Asset Allocation Portfolios, Inc. (the corporation) is registered under the Investment Company Act of 1940, as amended (the 1940 Act), as an open-end management investment company and is organized as a Maryland corporation. One Choice Portfolio: Very Conservative, One Choice Portfolio: Conservative, One Choice Portfolio: Moderate, One Choice Portfolio: Aggressive and One Choice Portfolio: Very Aggressive (collectively, the funds) are five funds in a series issued by the corporation. The funds operate as “funds of funds,” meaning substantially all of the funds’ assets will be invested in other American Century Investments mutual funds (the underlying funds). Each fund’s assets are allocated among underlying funds that represent major asset classes, including equity securities, fixed-income securities and short-term investments. The funds will assume the risks associated with their underlying funds. Additional information and attributes of each underlying fund are available at americancentury.com. Each fund's investment objective is to seek the highest total return consistent with its asset mix. The funds offer the Investor Class and R Class.
2. Significant Accounting Policies
The following is a summary of significant accounting policies consistently followed by the funds in preparation of their financial statements. Each fund is an investment company and follows accounting and reporting guidance in accordance with accounting principles generally accepted in the United States of America. This may require management to make certain estimates and assumptions at the date of the financial statements. Actual results could differ from these estimates. Management evaluated the impact of events or transactions occurring through the date the financial statements were issued that would merit recognition or disclosure.
Investment Valuations — The funds determine the fair value of their investments and compute their net asset value (NAV) per share at the close of regular trading (usually 4 p.m. Eastern time) on the New York Stock Exchange (NYSE) on each day the NYSE is open. The value of investments of the funds are determined by American Century Investment Management, Inc. (ACIM) (the investment advisor), as the valuation designee, pursuant to its valuation policies and procedures. The Board of Directors oversees the valuation designee and reviews its valuation policies and procedures at least annually. Investments in the underlying funds are valued at their reported NAV.
Security Transactions — Security transactions are accounted for as of the trade date. Net realized gains and losses are determined on the identified cost basis, which is also used for federal income tax purposes.
Investment Income — Income and capital gain distributions, if any, from the underlying funds are recorded as of the ex-dividend date. Long-term capital gain distributions, if any, from the underlying funds are a component of net realized gain (loss).
Expenses — The expenses included in the accompanying financial statements reflect the expenses of each fund and do not include any expenses associated with the underlying funds.
Income Tax Status — It is each fund's policy to distribute substantially all net investment income and net realized gains to shareholders and to otherwise qualify as a regulated investment company under provisions of the Internal Revenue Code. Accordingly, no provision has been made for income taxes. The funds file U.S. federal, state, local and non-U.S. tax returns as applicable. The funds' tax returns are subject to examination by the relevant taxing authority until expiration of the applicable statute of limitations, which is generally three years from the date of filing but can be longer in certain jurisdictions. At this time, management believes there are no uncertain tax positions which, based on their technical merit, would not be sustained upon examination and for which it is reasonably possible that the total amounts of unrecognized tax benefits will significantly change in the next twelve months.
Multiple Class — All shares of each fund represent an equal pro rata interest in the net assets of the class to which such shares belong, and have identical voting, dividend, liquidation and other rights and the same terms and conditions, except for class specific expenses and exclusive rights to vote on matters affecting only individual classes. Income, non-class specific expenses, and realized and unrealized capital gains and losses of the funds are allocated to each class of shares based on their relative net assets.
Distributions to Shareholders — Distributions from net investment income, if any, are generally declared and paid quarterly for One Choice Portfolio: Very Conservative, One Choice Portfolio: Conservative and One Choice Portfolio: Moderate. Distributions from net investment income, if any, are generally declared and paid annually for One Choice Portfolio: Aggressive and One Choice Portfolio: Very Aggressive. Distributions from net realized gains, if any, are generally declared and paid annually for all funds.
Indemnifications — Under the corporation’s organizational documents, its officers and directors are indemnified against certain liabilities arising out of the performance of their duties to the funds. In addition, in the normal course of business, the funds enter into contracts that provide general indemnifications. The maximum exposure under these arrangements is unknown as this would involve future claims that may be made against a fund. The risk of material loss from such claims is considered by management to be remote.
3. Fees and Transactions with Related Parties
Certain officers and directors of the corporation are also officers and/or directors of American Century Companies, Inc. (ACC). The corporation's investment advisor, ACIM, the corporation's distributor, American Century Investment Services, Inc. (ACIS), and the corporation's transfer agent, American Century Services, LLC, are wholly owned, directly or indirectly, by ACC. ACIM serves as the investment advisor for the underlying funds.
Administrative Fees — The corporation's investment advisor, ACIM, does not receive an administrative fee for services provided to the funds.
Distribution and Service Fees — The Board of Directors has adopted a separate Master Distribution and Individual Shareholder Services Plan for the R Class (the plan), pursuant to Rule 12b-1 of the 1940 Act. The plan provides that the R Class will pay ACIS an annual distribution and service fee of 0.50%. The fee is computed and accrued daily based on the R Class's daily net assets and paid monthly in arrears. The fee is used to pay financial intermediaries for distribution and individual shareholder services. Fees incurred under the plan during the period ended July 31, 2023 are detailed in the Statements of Operations.
Directors' Fees and Expenses — The Board of Directors is responsible for overseeing the investment advisor’s management and operations of the funds. The directors receive detailed information about the funds and their investment advisor regularly throughout the year, and meet at least quarterly with management of the investment advisor to review reports about fund operations. The funds' officers do not receive compensation from the funds.
Acquired Fund Fees and Expenses — Each fund will indirectly realize its pro rata share of the fees and expenses of the underlying funds in which it invests. These fees and expenses are already reflected in the valuation of the underlying funds.
4. Investment Transactions
Investment transactions for the period ended July 31, 2023 were as follows:
| | | | | | | | | | | | | | | | | |
| One Choice
Portfolio:
Very Conservative | One Choice
Portfolio:
Conservative | One Choice
Portfolio:
Moderate | One Choice
Portfolio:
Aggressive | One Choice
Portfolio:
Very Aggressive |
| Purchases | $ | 58,917,935 | | $ | 144,335,149 | | $ | 221,020,396 | | $ | 121,128,713 | | $ | 46,699,410 | |
| Sales | $ | 101,036,233 | | $ | 227,879,628 | | $ | 284,796,454 | | $ | 160,537,127 | | $ | 65,188,235 | |
5. Capital Share Transactions
The corporation is authorized to issue 6,000,000,000 shares. Transactions in shares of the funds were as follows:
| | | | | | | | | | | | | | |
| Year ended July 31, 2023 | Year ended July 31, 2022 |
| Shares | Amount | Shares | Amount |
| One Choice Portfolio: Very Conservative | | | |
| Investor Class | | | | |
| Sold | 4,295,034 | | $ | 47,908,584 | | 9,195,049 | | $ | 116,475,915 | |
| Issued in reinvestment of distributions | 2,862,749 | | 30,596,022 | | 2,610,214 | | 33,338,231 | |
| Redeemed | (9,832,725) | | (108,998,735) | | (8,705,748) | | (109,185,414) | |
| (2,674,942) | | (30,494,129) | | 3,099,515 | | 40,628,732 | |
| R Class | | | | |
| Sold | 83,263 | | 917,115 | | 97,854 | | 1,219,846 | |
| Issued in reinvestment of distributions | 12,956 | | 138,504 | | 8,080 | | 103,273 | |
| Redeemed | (60,438) | | (664,855) | | (48,405) | | (623,931) | |
| 35,781 | | 390,764 | | 57,529 | | 699,188 | |
| Net increase (decrease) | (2,639,161) | | $ | (30,103,365) | | 3,157,044 | | $ | 41,327,920 | |
| One Choice Portfolio: Conservative | | | | |
| Investor Class | | | | |
| Sold | 6,084,501 | | $ | 74,953,183 | | 9,930,542 | | $ | 144,300,959 | |
| Issued in reinvestment of distributions | 8,544,788 | | 99,250,594 | | 7,711,112 | | 113,181,297 | |
| Redeemed | (16,195,479) | | (198,440,150) | | (14,810,876) | | (211,560,900) | |
| (1,566,190) | | (24,236,373) | | 2,830,778 | | 45,921,356 | |
| R Class | | | | |
| Sold | 72,167 | | 881,614 | | 45,443 | | 631,654 | |
| Issued in reinvestment of distributions | 14,704 | | 170,559 | | 9,310 | | 136,670 | |
| Redeemed | (64,731) | | (802,157) | | (18,548) | | (265,949) | |
| 22,140 | | 250,016 | | 36,205 | | 502,375 | |
| Net increase (decrease) | (1,544,050) | | $ | (23,986,357) | | 2,866,983 | | $ | 46,423,731 | |
| One Choice Portfolio: Moderate | | | | |
| Investor Class | | | | |
| Sold | 8,848,896 | | $ | 121,843,760 | | 10,046,556 | | $ | 167,344,960 | |
| Issued in reinvestment of distributions | 12,497,701 | | 160,498,699 | | 11,522,336 | | 193,977,295 | |
| Redeemed | (17,647,327) | | (241,814,741) | | (16,482,090) | | (267,919,049) | |
| 3,699,270 | | 40,527,718 | | 5,086,802 | | 93,403,206 | |
| R Class | | | | |
| Sold | 85,660 | | 1,183,183 | | 103,457 | | 1,674,330 | |
| Issued in reinvestment of distributions | 35,171 | | 450,915 | | 27,986 | | 471,737 | |
| Redeemed | (120,840) | | (1,649,715) | | (63,653) | | (1,003,708) | |
| (9) | | (15,617) | | 67,790 | | 1,142,359 | |
| Net increase (decrease) | 3,699,261 | | $ | 40,512,101 | | 5,154,592 | | $ | 94,545,565 | |
| | | | | | | | | | | | | | |
| Year ended July 31, 2023 | Year ended July 31, 2022 |
| Shares | Amount | Shares | Amount |
| One Choice Portfolio: Aggressive | | | |
| Investor Class | | | | |
| Sold | 4,930,076 | | $ | 70,110,928 | | 5,096,871 | | $ | 88,581,600 | |
| Issued in reinvestment of distributions | 6,727,180 | | 87,303,413 | | 5,714,023 | | 101,138,208 | |
| Redeemed | (9,770,100) | | (137,772,897) | | (7,793,154) | | (131,881,555) | |
| 1,887,156 | | 19,641,444 | | 3,017,740 | | 57,838,253 | |
| R Class | | | | |
| Sold | 97,195 | | 1,374,672 | | 87,841 | | 1,509,889 | |
| Issued in reinvestment of distributions | 36,180 | | 470,701 | | 26,610 | | 471,804 | |
| Redeemed | (55,490) | | (779,269) | | (66,621) | | (1,108,840) | |
| 77,885 | | 1,066,104 | | 47,830 | | 872,853 | |
| Net increase (decrease) | 1,965,041 | | $ | 20,707,548 | | 3,065,570 | | $ | 58,711,106 | |
| One Choice Portfolio: Very Aggressive | | | |
| Investor Class | | | | |
| Sold | 1,772,910 | | $ | 28,894,797 | | 2,491,609 | | $ | 52,236,426 | |
| Issued in reinvestment of distributions | 2,310,745 | | 34,152,802 | | 1,725,501 | | 36,218,274 | |
| Redeemed | (3,479,229) | | (56,444,627) | | (2,968,382) | | (59,161,740) | |
| 604,426 | | 6,602,972 | | 1,248,728 | | 29,292,960 | |
| R Class | | | | |
| Sold | 115,505 | | 1,886,697 | | 109,944 | | 2,209,794 | |
| Issued in reinvestment of distributions | 36,803 | | 545,426 | | 23,128 | | 486,618 | |
| Redeemed | (53,870) | | (882,691) | | (81,467) | | (1,603,482) | |
| 98,438 | | 1,549,432 | | 51,605 | | 1,092,930 | |
| Net increase (decrease) | 702,864 | | $ | 8,152,404 | | 1,300,333 | | $ | 30,385,890 | |
6. Fair Value Measurements
The funds' investment valuation process is based on several considerations and may use multiple inputs to determine the fair value of the investments held by the funds. In conformity with accounting principles generally accepted in the United States of America, the inputs used to determine a valuation are classified into three broad levels.
•Level 1 valuation inputs consist of unadjusted quoted prices in an active market for identical investments.
•Level 2 valuation inputs consist of direct or indirect observable market data (including quoted prices for comparable investments, evaluations of subsequent market events, interest rates, prepayment speeds, credit risk, etc.). These inputs also consist of quoted prices for identical investments initially expressed in local currencies that are adjusted through translation into U.S. dollars.
•Level 3 valuation inputs consist of unobservable data (including a fund’s own assumptions).
The level classification is based on the lowest level input that is significant to the fair valuation measurement. The valuation inputs are not necessarily an indication of the risks associated with investing in these securities or other financial instruments.
As of period end, the funds' investment securities were classified as Level 1. The Schedules of Investments provide additional information on the funds' portfolio holdings.
7. Federal Tax Information
The tax character of distributions paid during the years ended July 31, 2023 and July 31, 2022 were as follows:
| | | | | | | | | | | | | | |
| 2023 | 2022 |
| Distributions Paid From: | Distributions Paid From: |
| Ordinary Income | Long-term Capital Gains | Ordinary Income | Long-term Capital Gains |
| One Choice Portfolio: Very Conservative | $ | 15,287,377 | $ | 15,973,765 | $ | 20,290,641 | $ | 13,638,316 |
| One Choice Portfolio: Conservative | $ | 32,144,299 | $ | 69,533,710 | $ | 56,583,759 | $ | 59,104,481 |
| One Choice Portfolio: Moderate | $ | 42,283,665 | $ | 122,040,316 | $ | 93,331,423 | $ | 104,709,432 |
| One Choice Portfolio: Aggressive | $ | 17,673,181 | $ | 71,825,192 | $ | 45,361,778 | $ | 58,107,648 |
| One Choice Portfolio: Very Aggressive | $ | 3,764,336 | $ | 31,739,690 | $ | 16,702,738 | $ | 21,053,259 |
The book-basis character of distributions made during the year from net investment income or net realized gains may differ from their ultimate characterization for federal income tax purposes. These differences reflect the differing character of certain income items and net realized gains and losses for financial statement and tax purposes, and may result in reclassification among certain capital accounts on the financial statements.
As of period end, the federal tax cost of investments and the components of distributable earnings on a tax-basis were as follows:
| | | | | | | | | | | |
| One Choice Portfolio:
Very Conservative | One Choice Portfolio:
Conservative | One Choice Portfolio:
Moderate |
| Federal tax cost of investments | $ | 442,133,994 | | $ | 1,123,483,464 | | $ | 1,669,885,585 | |
| Gross tax appreciation of investments | $ | 29,622,187 | | $ | 118,106,728 | | $ | 253,448,494 | |
| Gross tax depreciation of investments | (35,153,614) | | (79,041,754) | | (101,931,909) | |
| Net tax appreciation (depreciation) of investments | $ | (5,531,427) | | $ | 39,064,974 | | $ | 151,516,585 | |
| Undistributed ordinary income | $ | 338,823 | | $ | 672,583 | | $ | 804,436 | |
| Accumulated short-term capital losses | $ | (2,356,667) | | $ | (5,275,105) | | $ | (9,922,516) | |
| Accumulated long-term capital losses | $ | (2,464,507) | | $ | (6,571,355) | | $ | (5,924,256) | |
| | | | | | | | |
| One Choice Portfolio:
Aggressive | One Choice Portfolio:
Very Aggressive |
| Federal tax cost of investments | $ | 774,345,331 | | $ | 275,859,939 | |
| Gross tax appreciation of investments | $ | 161,705,153 | | $ | 68,849,799 | |
| Gross tax depreciation of investments | (23,873,447) | | (1,760,888) | |
| Net tax appreciation (depreciation) of investments | $ | 137,831,706 | | $ | 67,088,911 | |
| Undistributed ordinary income | $ | 6,092,090 | | $ | 1,189,728 | |
| Accumulated short-term capital losses | $ | (5,375,802) | | $ | (2,077,261) | |
| Accumulated long-term capital losses | $ | (1,564,881) | | $ | (3,461,217) | |
The difference between book-basis and tax-basis unrealized appreciation (depreciation) is attributable primarily to the tax deferral of losses on wash sales.
Accumulated capital losses represent net capital loss carryovers that may be used to offset future realized capital gains for federal income tax purposes. The capital loss carryovers may be carried forward for an unlimited period. Future capital loss carryover utilization in any given year may be subject to Internal Revenue Code limitations.
8. Investments in Underlying Funds
The funds do not invest in the underlying funds for the purpose of exercising management or control; however, investments by the funds within their investment strategies may represent a significant portion of the underlying funds’ net assets. As of period end, One Choice Portfolio: Moderate owned 60% of the shares of Core Plus Fund.
9. Risk Factors
The value of the funds’ shares will go up and down based on the performance of the underlying funds in which they invest. The value of the underlying funds’ shares will, in turn, fluctuate based on the performance of the securities they own and other factors generally affecting the securities market. Market risks, including political, regulatory, economic and social developments, can affect the value of the funds’ investments. Natural disasters, public health emergencies, war, terrorism and other unforeseeable events may lead to increased market volatility and may have adverse long-term effects on world economies and markets generally.
10. Affiliated Fund Transactions
A summary of transactions for each underlying fund for the period ended July 31, 2023 follows:
| | | | | | | | | | | | | | | | | | | | | | | | | | |
Fund/Underlying Fund(1) | Beginning
Value | Purchase
Cost | Sales
Cost | Change in Net Unrealized
Appreciation (Depreciation) | Ending
Value | Ending
Shares | Net Realized
Gain (Loss) | Distributions Received(2) |
| One Choice Portfolio: Very Conservative (Amounts in thousands) |
| Diversified Bond Fund | $ | 111,059 | | $ | 7,015 | | $ | 42,071 | | $ | (1,307) | | $ | 74,696 | | 8,137 | | $ | (6,057) | | $ | 2,990 | |
| High Income Fund | 5,409 | | 305 | | 776 | | 26 | | 4,964 | | 596 | | (122) | | 305 | |
| Inflation-Adjusted Bond Fund | 49,948 | | 7,465 | | 2,875 | | (5,656) | | 48,882 | | 4,625 | | (387) | | 3,052 | |
| Short Duration Fund | 63,153 | | 7,367 | | 4,115 | | (1,441) | | 64,964 | | 6,725 | | (305) | | 2,062 | |
| Short Duration Inflation Protection Bond Fund | 63,900 | | 4,801 | | 6,399 | | (4,685) | | 57,617 | | 5,756 | | (196) | | 3,173 | |
Disciplined Growth Fund(3) | 5,421 | | — | | 474 | | 741 | | 5,688 | | 254 | | (10) | | — | |
| Focused Large Cap Value Fund | 39,353 | | 2,573 | | 14,640 | | 831 | | 28,117 | | 2,800 | | (572) | | 2,327 | |
| Growth Fund | 8,061 | | 129 | | 1,534 | | 1,360 | | 8,016 | | 169 | | (366) | | 130 | |
Heritage Fund(3) | 5,927 | | 4,567 | | 1,251 | | 1,456 | | 10,699 | | 496 | | (202) | | — | |
| Mid Cap Value Fund | 21,001 | | 1,284 | | 6,328 | | (917) | | 15,040 | | 935 | | 702 | | 1,149 | |
| Real Estate Fund | 2,917 | | 2,705 | | 63 | | (785) | | 4,774 | | 201 | | 82 | | 466 | |
Small Cap Growth Fund(3) | 4,689 | | — | | 3,363 | | 1,232 | | 2,558 | | 138 | | (1,039) | | — | |
| Small Cap Value Fund | 4,870 | | 78 | | 2,688 | | 233 | | 2,493 | | 244 | | (240) | | 77 | |
| Sustainable Equity Fund | 21,446 | | 8,546 | | 6,101 | | 3,177 | | 27,068 | | 589 | | 180 | | 167 | |
| Emerging Markets Debt Fund | 6,977 | | 2,749 | | 507 | | 370 | | 9,589 | | 1,068 | | (81) | | 404 | |
| Global Bond Fund | 39,696 | | 7,114 | | 3,685 | | (2,966) | | 40,159 | | 4,713 | | (646) | | 2,342 | |
International Bond Fund(3) | 34,122 | | 1,582 | | 3,923 | | (502) | | 31,279 | | 2,968 | | (866) | | — | |
| Equity Growth Fund | 10,690 | | 638 | | 8,704 | | (2,624) | | — | | — | | 1,664 | | 638 | |
| $ | 498,639 | | $ | 58,918 | | $ | 109,497 | | $ | (11,457) | | $ | 436,603 | | 40,414 | | $ | (8,461) | | $ | 19,282 | |
(1)Underlying fund investments represent Investor Class.
(2)Distributions received includes distributions from net investment income and from capital gains, if any.
(3)Non-income producing.
| | | | | | | | | | | | | | | | | | | | | | | | | | |
Fund/Underlying Fund(1) | Beginning
Value | Purchase
Cost | Sales
Cost | Change in Net Unrealized
Appreciation (Depreciation) | Ending
Value | Ending
Shares | Net Realized
Gain (Loss) | Distributions Received(2) |
| One Choice Portfolio: Conservative (Amounts in thousands) |
| Diversified Bond Fund | $ | 269,992 | | $ | 15,878 | | $ | 82,502 | | $ | (5,215) | | $ | 198,153 | | 21,585 | | $ | (12,764) | | $ | 7,632 | |
| High Income Fund | 16,283 | | 825 | | 5,040 | | 457 | | 12,525 | | 1,504 | | (817) | | 825 | |
| Inflation-Adjusted Bond Fund | 91,358 | | 22,562 | | 3,571 | | (11,173) | | 99,176 | | 9,383 | | (452) | | 5,991 | |
| Short Duration Fund | 77,248 | | 9,771 | | 7,012 | | (1,669) | | 78,338 | | 8,109 | | (448) | | 2,448 | |
| Short Duration Inflation Protection Bond Fund | 65,709 | | 3,085 | | 4,479 | | (4,895) | | 59,420 | | 5,936 | | (14) | | 3,086 | |
Disciplined Growth Fund(3) | 23,392 | | — | | 1,511 | | 3,548 | | 25,429 | | 1,136 | | (263) | | — | |
| Focused Large Cap Value Fund | 94,648 | | 6,226 | | 12,549 | | 1,574 | | 89,899 | | 8,954 | | (604) | | 6,227 | |
| Growth Fund | 38,666 | | 686 | | 3,419 | | 6,233 | | 42,166 | | 891 | | (1,019) | | 655 | |
Heritage Fund(3) | 30,143 | | 13,912 | | — | | 5,306 | | 49,361 | | 2,289 | | — | | — | |
| Mid Cap Value Fund | 71,490 | | 4,069 | | 18,167 | | (3,042) | | 54,350 | | 3,378 | | 2,039 | | 4,003 | |
Small Cap Growth Fund(3) | 18,824 | | — | | 14,387 | | 5,209 | | 9,646 | | 522 | | (4,550) | | — | |
| Small Cap Value Fund | 18,806 | | 299 | | 9,933 | | 219 | | 9,391 | | 921 | | (381) | | 299 | |
| Sustainable Equity Fund | 78,627 | | 31,860 | | 11,017 | | 10,923 | | 110,393 | | 2,401 | | 1,551 | | 599 | |
| Emerging Markets Debt Fund | 25,113 | | 1,043 | | 2,098 | | 1,158 | | 25,216 | | 2,808 | | (355) | | 1,043 | |
| Global Bond Fund | 90,396 | | 16,309 | | 5,185 | | (7,376) | | 94,144 | | 11,050 | | (819) | | 5,240 | |
International Bond Fund(3) | 66,638 | | 1,095 | | 275 | | (2,792) | | 64,666 | | 6,135 | | (53) | | — | |
Global Real Estate Fund(3) | 9,884 | | 3,798 | | 1,063 | | (374) | | 12,245 | | 1,030 | | (221) | | — | |
International Growth Fund(3) | 54,269 | | 7,767 | | 14,165 | | 10,040 | | 57,911 | | 4,693 | | (3,588) | | — | |
International Small-Mid Cap Fund(3) | 11,047 | | 1,014 | | — | | 100 | | 12,161 | | 1,287 | | — | | — | |
| International Value Fund | 62,348 | | 1,550 | | 17,905 | | 11,965 | | 57,958 | | 6,859 | | (2,192) | | 1,550 | |
| Equity Growth Fund | 40,016 | | 2,586 | | 33,588 | | (9,014) | | — | | — | | 4,963 | | 2,586 | |
| $ | 1,254,897 | | $ | 144,335 | | $ | 247,866 | | $ | 11,182 | | $ | 1,162,548 | | 100,871 | | $ | (19,987) | | $ | 42,184 | |
(1)Underlying fund investments represent Investor Class.
(2)Distributions received includes distributions from net investment income and from capital gains, if any.
(3)Non-income producing.
| | | | | | | | | | | | | | | | | | | | | | | | | | |
Fund/Underlying Fund(1) | Beginning
Value | Purchase
Cost | Sales
Cost | Change in Net Unrealized
Appreciation (Depreciation) | Ending
Value | Ending
Shares | Net Realized
Gain (Loss) | Distributions Received(2) |
| One Choice Portfolio: Moderate (Amounts in thousands) |
Disciplined Growth Fund(3) | $ | 30,195 | | $ | 3 | | $ | 2,146 | | $ | 4,774 | | $ | 32,826 | | 1,466 | | $ | (534) | | — | |
Focused Dynamic Growth Fund(3) | 27,123 | | 1,533 | | — | | 3,963 | | 32,619 | | 693 | | — | | — | |
| Focused Large Cap Value Fund | 166,856 | | 11,269 | | 8,516 | | 2,101 | | 171,710 | | 17,103 | | (244) | | $ | 11,149 | |
| Growth Fund | 72,407 | | 5,489 | | 3,801 | | 12,166 | | 86,261 | | 1,822 | | (973) | | 1,327 | |
Heritage Fund(3) | 84,259 | | 13,855 | | — | | 11,693 | | 109,807 | | 5,093 | | — | | — | |
| Mid Cap Value Fund | 116,872 | | 7,804 | | 21,653 | | (2,384) | | 100,639 | | 6,255 | | 393 | | 7,335 | |
Small Cap Growth Fund(3) | 39,196 | | 319 | | 24,594 | | 9,627 | | 24,548 | | 1,328 | | (8,155) | | — | |
| Small Cap Value Fund | 44,994 | | 1,009 | | 22,877 | | 692 | | 23,818 | | 2,335 | | (1,069) | | 759 | |
| Sustainable Equity Fund | 161,500 | | 64,333 | | 11,660 | | 25,093 | | 239,266 | | 5,205 | | 1,946 | | 1,279 | |
| Core Plus Fund | 289,477 | | 27,096 | | 74,659 | | (9,307) | | 232,607 | | 25,366 | | (12,406) | | 9,808 | |
| High Income Fund | 23,945 | | 1,251 | | 7,010 | | 666 | | 18,852 | | 2,263 | | (1,089) | | 1,252 | |
| Inflation-Adjusted Bond Fund | 96,072 | | 22,130 | | — | | (12,224) | | 105,978 | | 10,026 | | — | | 6,377 | |
| Short Duration Fund | 76,205 | | 15,760 | | 4,196 | | (1,917) | | 85,852 | | 8,887 | | (282) | | 2,560 | |
| Short Duration Inflation Protection Bond Fund | 21,717 | | 932 | | 3,212 | | (1,487) | | 17,950 | | 1,793 | | (50) | | 932 | |
| Emerging Markets Fund | 66,244 | | 7,769 | | 22,769 | | 8,924 | | 60,168 | | 5,769 | | (7,229) | | 1,536 | |
Global Real Estate Fund(3) | 15,188 | | 4,170 | | — | | (945) | | 18,413 | | 1,549 | | — | | — | |
International Growth Fund(3) | 104,827 | | 15,895 | | 12,736 | | 15,758 | | 123,744 | | 10,028 | | (3,260) | | — | |
International Small-Mid Cap Fund(3) | 33,152 | | 3,171 | | — | | 305 | | 36,628 | | 3,876 | | — | | — | |
| International Value Fund | 77,057 | | 2,678 | | 6,450 | | 14,151 | | 87,436 | | 10,347 | | (781) | | 2,002 | |
| Non-U.S. Intrinsic Value Fund | 49,987 | | 1,810 | | 13,083 | | 10,681 | | 49,395 | | 4,686 | | (1,434) | | 1,810 | |
| Emerging Markets Debt Fund | 37,681 | | 1,574 | | 2,905 | | 1,702 | | 38,052 | | 4,237 | | (493) | | 1,574 | |
| Global Bond Fund | 94,908 | | 4,997 | | 2,928 | | (7,676) | | 89,301 | | 10,481 | | (395) | | 4,997 | |
International Bond Fund(3) | 36,359 | | 725 | | — | | (1,552) | | 35,532 | | 3,371 | | — | | — | |
| Equity Growth Fund | 78,522 | | 5,448 | | 64,081 | | (19,889) | | — | | — | | 11,574 | | 5,447 | |
| $ | 1,844,743 | | $ | 221,020 | | $ | 309,276 | | $ | 64,915 | | $ | 1,821,402 | | 143,979 | | $ | (24,481) | | $ | 60,144 | |
(1)Underlying fund investments represent Investor Class.
(2)Distributions received includes distributions from net investment income and from capital gains, if any.
(3)Non-income producing.
| | | | | | | | | | | | | | | | | | | | | | | | | | |
Fund/Underlying Fund(1) | Beginning
Value | Purchase
Cost | Sales
Cost | Change in Net Unrealized
Appreciation (Depreciation) | Ending
Value | Ending
Shares | Net Realized
Gain (Loss) | Distributions Received(2) |
| One Choice Portfolio: Aggressive (Amounts in thousands) |
Focused Dynamic Growth Fund(3) | $ | 35,033 | | $ | 3,302 | | $ | 784 | | $ | 5,566 | | $ | 43,117 | | 915 | | $ | (225) | | — | |
| Focused Large Cap Value Fund | 113,629 | | 7,602 | | 8,548 | | 1,529 | | 114,212 | | 11,376 | | (359) | | $ | 7,447 | |
| Growth Fund | 55,954 | | 4,730 | | 4,886 | | 9,686 | | 65,484 | | 1,383 | | (1,194) | | 1,034 | |
Heritage Fund(3) | 58,088 | | 4,461 | | 304 | | 7,464 | | 69,709 | | 3,233 | | (58) | | — | |
| Mid Cap Value Fund | 67,925 | | 5,154 | | 8,439 | | (980) | | 63,660 | | 3,956 | | (439) | | 4,611 | |
Small Cap Growth Fund(3) | 21,443 | | 390 | | 12,033 | | 5,041 | | 14,841 | | 803 | | (4,013) | | — | |
| Small Cap Value Fund | 24,552 | | 711 | | 11,477 | | 515 | | 14,301 | | 1,402 | | (544) | | 452 | |
| Sustainable Equity Fund | 85,241 | | 35,979 | | 6,563 | | 13,691 | | 128,348 | | 2,792 | | 951 | | 689 | |
| Emerging Markets Fund | 45,322 | | 5,277 | | 12,954 | | 5,422 | | 43,067 | | 4,129 | | (4,225) | | 1,046 | |
Global Real Estate Fund(3) | 8,737 | | 993 | | — | | (600) | | 9,130 | | 768 | | — | | — | |
International Growth Fund(3) | 61,592 | | 7,101 | | 8,660 | | 9,199 | | 69,232 | | 5,610 | | (2,233) | | — | |
International Small-Mid Cap Fund(3) | 20,532 | | 2,021 | | — | | 192 | | 22,745 | | 2,407 | | — | | — | |
| International Value Fund | 36,269 | | 1,135 | | 3,398 | | 6,705 | | 40,711 | | 4,818 | | (502) | | 939 | |
| Non-U.S. Intrinsic Value Fund | 37,149 | | 1,400 | | 10,236 | | 7,923 | | 36,236 | | 3,438 | | (935) | | 1,400 | |
| Core Plus Fund | 69,971 | | 24,115 | | 37,346 | | 1,066 | | 57,806 | | 6,304 | | (6,351) | | 2,512 | |
| High Income Fund | 30,857 | | 1,741 | | 5,627 | | 369 | | 27,340 | | 3,282 | | (901) | | 1,742 | |
| Inflation-Adjusted Bond Fund | 30,496 | | 1,578 | | 2,731 | | (3,110) | | 26,233 | | 2,482 | | (286) | | 1,579 | |
| Short Duration Fund | 10,372 | | 7,839 | | 1,471 | | (265) | | 16,475 | | 1,705 | | (101) | | 406 | |
| Short Duration Inflation Protection Bond Fund | 10,760 | | 463 | | 1,580 | | (726) | | 8,917 | | 891 | | (36) | | 463 | |
| Emerging Markets Debt Fund | 14,002 | | 584 | | 1,126 | | 640 | | 14,100 | | 1,570 | | (193) | | 583 | |
| Global Bond Fund | 29,536 | | 1,489 | | 2,404 | | (2,108) | | 26,513 | | 3,112 | | (344) | | 1,489 | |
| Equity Growth Fund | 43,484 | | 3,064 | | 36,641 | | (9,907) | | — | | — | | 5,317 | | 3,064 | |
| $ | 910,944 | | $ | 121,129 | | $ | 177,208 | | $ | 57,312 | | $ | 912,177 | | 66,376 | | $ | (16,671) | | $ | 29,456 | |
(1)Underlying fund investments represent Investor Class.
(2)Distributions received includes distributions from net investment income and from capital gains, if any.
(3)Non-income producing.
| | | | | | | | | | | | | | | | | | | | | | | | | | |
Fund/Underlying Fund(1) | Beginning
Value | Purchase
Cost | Sales
Cost | Change in Net Unrealized
Appreciation (Depreciation) | Ending
Value | Ending
Shares | Net Realized
Gain (Loss) | Distributions Received(2) |
| One Choice Portfolio: Very Aggressive (Amounts in thousands) |
Focused Dynamic Growth Fund(3) | $ | 17,797 | | $ | 2,552 | | $ | 2,202 | | $ | 3,221 | | $ | 21,368 | | 454 | | $ | (484) | | — | |
| Focused Large Cap Value Fund | 44,429 | | 4,422 | | 4,516 | | 699 | | 45,034 | | 4,485 | | (274) | | $ | 2,948 | |
| Growth Fund | 28,364 | | 4,609 | | 5,182 | | 5,306 | | 33,097 | | 699 | | (1,317) | | 521 | |
Heritage Fund(3) | 28,395 | | 251 | | 2,348 | | 3,778 | | 30,076 | | 1,395 | | (568) | | — | |
| Mid Cap Value Fund | 28,005 | | 2,270 | | 3,741 | | (233) | | 26,301 | | 1,635 | | (338) | | 1,948 | |
Small Cap Growth Fund(3) | 11,475 | | 43 | | 4,876 | | 2,266 | | 8,908 | | 482 | | (1,619) | | — | |
| Small Cap Value Fund | 12,328 | | 280 | | 4,228 | | 291 | | 8,671 | | 850 | | (269) | | 275 | |
| Sustainable Equity Fund | 33,191 | | 17,793 | | 4,825 | | 5,802 | | 51,961 | | 1,130 | | 97 | | 285 | |
| Emerging Markets Fund | 28,400 | | 5,329 | | 11,570 | | 4,220 | | 26,379 | | 2,529 | | (3,519) | | 595 | |
Global Real Estate Fund(3) | 4,403 | | 2,699 | | 450 | | (135) | | 6,517 | | 548 | | (83) | | — | |
International Growth Fund(3) | 33,293 | | 2,356 | | 6,449 | | 5,418 | | 34,618 | | 2,805 | | (1,784) | | — | |
International Small-Mid Cap Fund(3) | 15,642 | | 1,298 | | 1,100 | | 500 | | 16,340 | | 1,729 | | (380) | | — | |
| International Value Fund | 14,051 | | 827 | | 2,332 | | 2,789 | | 15,335 | | 1,815 | | (448) | | 367 | |
| Non-U.S. Intrinsic Value Fund | 20,500 | | 772 | | 7,211 | | 4,283 | | 18,344 | | 1,740 | | (624) | | 772 | |
| Equity Growth Fund | 16,321 | | 1,198 | | 14,159 | | (3,360) | | — | | — | | 1,609 | | 1,198 | |
| $ | 336,594 | | $ | 46,699 | | $ | 75,189 | | $ | 34,845 | | $ | 342,949 | | 22,296 | | $ | (10,001) | | $ | 8,909 | |
(1)Underlying fund investments represent Investor Class.
(2)Distributions received includes distributions from net investment income and from capital gains, if any.
(3)Non-income producing.
| | | | | | | | | | | | | | | | | | | | | | | | | | | | | | | | | | | | | | | | | |
| For a Share Outstanding Throughout the Years Ended July 31 (except as noted) | | | | | | |
| Per-Share Data | | | | | Ratios and Supplemental Data | |
| | Income From Investment Operations*: | Distributions From: | | | Ratio to Average Net Assets of: | | |
| Net Asset Value, Beginning
of Period | Net Investment Income (Loss)(1) | Net
Realized and Unrealized
Gain (Loss) | Total From Investment Operations | Net
Investment
Income | Net
Realized
Gains | Total
Distributions | Net Asset
Value,
End
of Period | Total Return(2) | Operating Expenses(3) | Net
Investment Income
(Loss) | Portfolio
Turnover
Rate | Net Assets,
End of
Period
(in thousands) |
| One Choice Portfolio: Very Conservative | | | | | | | | | |
| Investor Class | | | | | | | | | |
| 2023 | $11.82 | 0.38 | (0.39) | (0.01) | (0.38) | (0.39) | (0.77) | $11.04 | 0.21% | 0.01% | 3.37% | 13% | $434,210 | |
| 2022 | $13.50 | 0.45 | (1.28) | (0.83) | (0.46) | (0.39) | (0.85) | $11.82 | (6.57)% | 0.00%(4) | 3.52% | 9% | $496,501 | |
| 2021 | $12.54 | 0.20 | 1.20 | 1.40 | (0.19) | (0.25) | (0.44) | $13.50 | 11.39% | 0.00%(4) | 1.55% | 18% | $524,867 | |
| 2020 | $12.19 | 0.21 | 0.57 | 0.78 | (0.21) | (0.22) | (0.43) | $12.54 | 6.56% | 0.00%(4) | 1.73% | 22% | $459,434 | |
| 2019 | $12.05 | 0.29 | 0.32 | 0.61 | (0.29) | (0.18) | (0.47) | $12.19 | 5.31% | 0.00%(4) | 2.48% | 11% | $425,814 | |
| R Class | | | | | | | | | |
| 2023 | $11.83 | 0.31 | (0.38) | (0.07) | (0.32) | (0.39) | (0.71) | $11.05 | (0.29)% | 0.51% | 2.87% | 13% | $2,393 | |
| 2022 | $13.50 | 0.37 | (1.26) | (0.89) | (0.39) | (0.39) | (0.78) | $11.83 | (6.96)% | 0.50% | 3.02% | 9% | $2,138 | |
| 2021 | $12.55 | 0.14 | 1.19 | 1.33 | (0.13) | (0.25) | (0.38) | $13.50 | 10.73% | 0.50% | 1.05% | 18% | $1,663 | |
| 2020 | $12.19 | 0.14 | 0.59 | 0.73 | (0.15) | (0.22) | (0.37) | $12.55 | 6.11% | 0.50% | 1.23% | 22% | $1,265 | |
| 2019 | $12.06 | 0.21 | 0.33 | 0.54 | (0.23) | (0.18) | (0.41) | $12.19 | 4.69% | 0.50% | 1.98% | 11% | $721 | |
| | | | | | | | | | | | | | | | | | | | | | | | | | | | | | | | | | | | | | | | | |
| For a Share Outstanding Throughout the Years Ended July 31 (except as noted) | | | | | | |
| Per-Share Data | | | | | Ratios and Supplemental Data | |
| | Income From Investment Operations*: | Distributions From: | | | Ratio to Average Net Assets of: | | |
| Net Asset Value, Beginning
of Period | Net Investment Income (Loss)(1) | Net
Realized and Unrealized
Gain (Loss) | Total From Investment Operations | Net
Investment
Income | Net
Realized
Gains | Total
Distributions | Net Asset
Value,
End
of Period | Total Return(2) | Operating Expenses(3) | Net
Investment Income
(Loss) | Portfolio
Turnover
Rate | Net Assets,
End of
Period
(in thousands) |
| One Choice Portfolio: Conservative | | | | | | | | | |
| Investor Class | | | | | | | | | |
| 2023 | $13.15 | 0.33 | 0.02 | 0.35 | (0.35) | (0.76) | (1.11) | $12.39 | 3.33% | 0.00%(4) | 2.72% | 12% | $1,160,448 | |
| 2022 | $15.71 | 0.57 | (1.87) | (1.30) | (0.59) | (0.67) | (1.26) | $13.15 | (9.08)% | 0.00%(4) | 3.94% | 10% | $1,252,961 | |
| 2021 | $14.16 | 0.22 | 2.11 | 2.33 | (0.22) | (0.56) | (0.78) | $15.71 | 16.82% | 0.00%(4) | 1.46% | 18% | $1,452,250 | |
| 2020 | $13.75 | 0.22 | 0.84 | 1.06 | (0.22) | (0.43) | (0.65) | $14.16 | 7.95% | 0.00%(4) | 1.64% | 24% | $1,245,493 | |
| 2019 | $13.90 | 0.33 | 0.19 | 0.52 | (0.33) | (0.34) | (0.67) | $13.75 | 4.25% | 0.00%(4) | 2.45% | 11% | $1,240,425 | |
| R Class | | | | | | | | | |
| 2023 | $13.15 | 0.27 | 0.01 | 0.28 | (0.29) | (0.76) | (1.05) | $12.38 | 2.74% | 0.50% | 2.22% | 12% | $2,097 | |
| 2022 | $15.71 | 0.49 | (1.87) | (1.38) | (0.51) | (0.67) | (1.18) | $13.15 | (9.54)% | 0.50% | 3.44% | 10% | $1,936 | |
| 2021 | $14.15 | 0.14 | 2.12 | 2.26 | (0.14) | (0.56) | (0.70) | $15.71 | 16.30% | 0.50% | 0.96% | 18% | $1,743 | |
| 2020 | $13.74 | 0.15 | 0.85 | 1.00 | (0.16) | (0.43) | (0.59) | $14.15 | 7.42% | 0.50% | 1.14% | 24% | $1,403 | |
| 2019 | $13.89 | 0.25 | 0.21 | 0.46 | (0.27) | (0.34) | (0.61) | $13.74 | 3.73% | 0.50% | 1.95% | 11% | $847 | |
| | | | | | | | | | | | | | | | | | | | | | | | | | | | | | | | | | | | | | | | | |
| For a Share Outstanding Throughout the Years Ended July 31 (except as noted) | | | | | | |
| Per-Share Data | | | | | Ratios and Supplemental Data | |
| | Income From Investment Operations*: | Distributions From: | | | Ratio to Average Net Assets of: | | |
| Net Asset Value, Beginning
of Period | Net Investment Income (Loss)(1) | Net
Realized and Unrealized
Gain (Loss) | Total From Investment Operations | Net
Investment
Income | Net
Realized
Gains | Total
Distributions | Net Asset
Value,
End
of Period | Total Return(2) | Operating Expenses(3) | Net
Investment Income
(Loss) | Portfolio
Turnover
Rate | Net Assets,
End of
Period
(in thousands) |
| One Choice Portfolio: Moderate | | | | | | | | |
| Investor Class | | | | | | | | | |
| 2023 | $14.68 | 0.32 | 0.41 | 0.73 | (0.33) | (1.00) | (1.33) | $14.08 | 5.95% | 0.00%(4) | 2.31% | 13% | $1,816,523 | |
| 2022 | $18.13 | 0.69 | (2.49) | (1.80) | (0.72) | (0.93) | (1.65) | $14.68 | (11.03)% | 0.00%(4) | 4.21% | 11% | $1,839,658 | |
| 2021 | $16.01 | 0.20 | 3.36 | 3.56 | (0.20) | (1.24) | (1.44) | $18.13 | 23.09% | 0.00%(4) | 1.18% | 30% | $2,180,041 | |
| 2020 | $15.67 | 0.24 | 1.10 | 1.34 | (0.24) | (0.76) | (1.00) | $16.01 | 8.86% | 0.00%(4) | 1.59% | 28% | $1,833,678 | |
| 2019 | $16.11 | 0.35 | 0.14 | 0.49 | (0.35) | (0.58) | (0.93) | $15.67 | 3.81% | 0.00%(4) | 2.28% | 14% | $1,881,575 | |
| R Class | | | | | | | | | |
| 2023 | $14.68 | 0.25 | 0.41 | 0.66 | (0.26) | (1.00) | (1.26) | $14.08 | 5.42% | 0.50% | 1.81% | 13% | $4,878 | |
| 2022 | $18.13 | 0.60 | (2.48) | (1.88) | (0.64) | (0.93) | (1.57) | $14.68 | (11.48)% | 0.50% | 3.71% | 11% | $5,086 | |
| 2021 | $16.00 | 0.11 | 3.37 | 3.48 | (0.11) | (1.24) | (1.35) | $18.13 | 22.54% | 0.50% | 0.68% | 30% | $5,053 | |
| 2020 | $15.66 | 0.16 | 1.11 | 1.27 | (0.17) | (0.76) | (0.93) | $16.00 | 8.32% | 0.50% | 1.09% | 28% | $4,226 | |
| 2019 | $16.10 | 0.26 | 0.16 | 0.42 | (0.28) | (0.58) | (0.86) | $15.66 | 3.29% | 0.50% | 1.78% | 14% | $3,770 | |
| | | | | | | | | | | | | | | | | | | | | | | | | | | | | | | | | | | | | | | | | |
| For a Share Outstanding Throughout the Years Ended July 31 (except as noted) | | | | | | |
| Per-Share Data | | | | | Ratios and Supplemental Data | |
| | Income From Investment Operations*: | Distributions From: | | | Ratio to Average Net Assets of: | | |
| Net Asset Value, Beginning
of Period | Net Investment Income (Loss)(1) | Net
Realized and Unrealized
Gain (Loss) | Total From Investment Operations | Net
Investment
Income | Net
Realized
Gains | Total
Distributions | Net Asset
Value,
End
of Period | Total Return(2) | Operating Expenses(3) | Net
Investment Income
(Loss) | Portfolio
Turnover
Rate | Net Assets,
End of
Period
(in thousands) |
| One Choice Portfolio: Aggressive | | | | | | | | |
| Investor Class | | | | | | | | | |
| 2023 | $15.20 | 0.28 | 0.80 | 1.08 | (0.30) | (1.24) | (1.54) | $14.74 | 8.42% | 0.01% | 1.96% | 14% | $906,625 | |
| 2022 | $19.05 | 0.77 | (2.79) | (2.02) | (0.76) | (1.07) | (1.83) | $15.20 | (11.96)% | 0.00%(4) | 4.47% | 11% | $906,402 | |
| 2021 | $16.24 | 0.19 | 4.23 | 4.42 | (0.17) | (1.44) | (1.61) | $19.05 | 28.36% | 0.00%(4) | 1.07% | 21% | $1,078,655 | |
| 2020 | $16.82 | 0.25 | 1.23 | 1.48 | (0.26) | (1.80) | (2.06) | $16.24 | 9.12% | 0.00%(4) | 1.56% | 27% | $882,822 | |
| 2019 | $17.44 | 0.36 | 0.07 | 0.43 | (0.36) | (0.69) | (1.05) | $16.82 | 3.53% | 0.00%(4) | 2.17% | 23% | $1,333,116 | |
| R Class | | | | | | | | | |
| 2023 | $15.18 | 0.21 | 0.80 | 1.01 | (0.22) | (1.24) | (1.46) | $14.73 | 7.92% | 0.51% | 1.46% | 14% | $5,547 | |
| 2022 | $19.03 | 0.68 | (2.80) | (2.12) | (0.66) | (1.07) | (1.73) | $15.18 | (12.44)% | 0.50% | 3.97% | 11% | $4,537 | |
| 2021 | $16.21 | 0.10 | 4.23 | 4.33 | (0.07) | (1.44) | (1.51) | $19.03 | 27.80% | 0.50% | 0.57% | 21% | $4,775 | |
| 2020 | $16.78 | 0.17 | 1.23 | 1.40 | (0.17) | (1.80) | (1.97) | $16.21 | 8.60% | 0.50% | 1.06% | 27% | $3,552 | |
| 2019 | $17.41 | 0.26 | 0.08 | 0.34 | (0.28) | (0.69) | (0.97) | $16.78 | 2.94% | 0.50% | 1.67% | 23% | $2,898 | |
| | | | | | | | | | | | | | | | | | | | | | | | | | | | | | | | | | | | | | | | | |
| For a Share Outstanding Throughout the Years Ended July 31 (except as noted) | | | | | | |
| Per-Share Data | | | | | Ratios and Supplemental Data | |
| | Income From Investment Operations*: | Distributions From: | | | Ratio to Average Net Assets of: | | |
| Net Asset Value, Beginning
of Period | Net Investment Income (Loss)(1) | Net
Realized and Unrealized
Gain (Loss) | Total From Investment Operations | Net
Investment
Income | Net
Realized
Gains | Total
Distributions | Net Asset
Value,
End
of Period | Total Return(2) | Operating Expenses(3) | Net
Investment Income
(Loss) | Portfolio
Turnover
Rate | Net Assets,
End of
Period
(in thousands) |
| One Choice Portfolio: Very Aggressive | | | | | | | | |
| Investor Class | | | | | | | | | |
| 2023 | $17.53 | 0.19 | 1.40 | 1.59 | (0.20) | (1.69) | (1.89) | $17.23 | 10.86% | 0.01% | 1.17% | 14% | $336,502 | |
| 2022 | $22.45 | 0.90 | (3.75) | (2.85) | (0.88) | (1.19) | (2.07) | $17.53 | (14.22)% | 0.00%(4) | 4.48% | 11% | $331,761 | |
| 2021 | $18.07 | 0.14 | 5.90 | 6.04 | (0.13) | (1.53) | (1.66) | $22.45 | 34.63% | 0.00%(4) | 0.67% | 15% | $396,903 | |
| 2020 | $17.99 | 0.21 | 1.49 | 1.70 | (0.22) | (1.40) | (1.62) | $18.07 | 9.61% | 0.00%(4) | 1.21% | 33% | $304,714 | |
| 2019 | $19.07 | 0.30 | (0.14) | 0.16 | (0.31) | (0.93) | (1.24) | $17.99 | 2.10% | 0.00%(4) | 1.70% | 19% | $305,967 | |
| R Class | | | | | | | | | |
| 2023 | $17.51 | 0.10 | 1.42 | 1.52 | (0.12) | (1.69) | (1.81) | $17.22 | 10.33% | 0.51% | 0.67% | 14% | $6,446 | |
| 2022 | $22.42 | 0.80 | (3.76) | (2.96) | (0.76) | (1.19) | (1.95) | $17.51 | (14.65)% | 0.50% | 3.98% | 11% | $4,833 | |
| 2021 | $18.05 | 0.03 | 5.89 | 5.92 | (0.02) | (1.53) | (1.55) | $22.42 | 33.90% | 0.50% | 0.17% | 15% | $5,032 | |
| 2020 | $17.96 | 0.12 | 1.49 | 1.61 | (0.12) | (1.40) | (1.52) | $18.05 | 9.11% | 0.50% | 0.71% | 33% | $2,952 | |
| 2019 | $19.04 | 0.20 | (0.12) | 0.08 | (0.23) | (0.93) | (1.16) | $17.96 | 1.58% | 0.50% | 1.20% | 19% | $2,184 | |
| | |
| Notes to Financial Highlights |
(1)Computed using average shares outstanding throughout the period.
(2)Total returns are calculated based on the net asset value of the last business day. Total returns for periods less than one year are not annualized.
(3)Ratio of operating expenses to average net assets does not include any fees and expenses of the underlying funds.
(4)Ratio was less than 0.005%.
*The amount shown for a share outstanding throughout the period may not correlate with the Statement(s) of Operations or precisely reflect the class expense differentials due to the timing of transactions in shares of a fund in relation to income earned and/or fluctuations in the fair value of a fund's investments.
See Notes to Financial Statements.
| | |
| Report of Independent Registered Public Accounting Firm |
To the Shareholders and the Board of Directors of American Century Asset Allocation Portfolios, Inc.:
Opinion on the Financial Statements and Financial Highlights
We have audited the accompanying statements of assets and liabilities, including the schedules of investments, of One Choice® Portfolio: Very Conservative, One Choice® Portfolio: Conservative, One Choice® Portfolio: Moderate, One Choice® Portfolio: Aggressive, and One Choice® Portfolio: Very Aggressive, five of the portfolios constituting American Century Asset Allocation Portfolios, Inc. (the “Funds”), as of July 31, 2023, the related statements of operations for the year then ended, the statements of changes in net assets for each of the two years in the period then ended, the financial highlights for each of the five years in the period then ended, and the related notes. In our opinion, the financial statements and financial highlights present fairly, in all material respects, the financial position of each of the Funds of the American Century Asset Allocation Portfolios, Inc. as of July 31, 2023, and the results of their operations for the year then ended, the changes in their net assets for each of the two years in the period then ended, and the financial highlights for each of the five years in the period then ended, in conformity with accounting principles generally accepted in the United States of America.
Basis for Opinion
These financial statements and financial highlights are the responsibility of the Funds’ management. Our responsibility is to express an opinion on the Funds’ financial statements and financial highlights based on our audits. We are a public accounting firm registered with the Public Company Accounting Oversight Board (United States) (PCAOB) and are required to be independent with respect to the Funds in accordance with the U.S. federal securities laws and the applicable rules and regulations of the Securities and Exchange Commission and the PCAOB.
We conducted our audits in accordance with the standards of the PCAOB. Those standards require that we plan and perform the audit to obtain reasonable assurance about whether the financial statements and financial highlights are free of material misstatement, whether due to error or fraud. The Funds are not required to have, nor were we engaged to perform, an audit of their internal control over financial reporting. As part of our audits, we are required to obtain an understanding of internal control over financial reporting but not for the purpose of expressing an opinion on the effectiveness of the Funds’ internal control over financial reporting. Accordingly, we express no such opinion.
Our audits included performing procedures to assess the risks of material misstatement of the financial statements and financial highlights, whether due to error or fraud, and performing procedures that respond to those risks. Such procedures included examining, on a test basis, evidence regarding the amounts and disclosures in the financial statements and financial highlights. Our audits also included evaluating the accounting principles used and significant estimates made by management, as well as evaluating the overall presentation of the financial statements and financial highlights. Our procedures included confirmation of securities owned as of July 31, 2023, by correspondence with the custodian, the transfer agent, and brokers; when replies were not received from brokers, we performed other auditing procedures. We believe that our audits provide a reasonable basis for our opinion.
/s/ Deloitte & Touche LLP
Kansas City, Missouri
September 18, 2023
We have served as the auditor of one or more American Century investment companies since 1997.
The Board of Directors
The individuals listed below serve as directors of the funds. Each director will continue to serve in this capacity until death, retirement, resignation or removal from office. The board has adopted a mandatory retirement age for directors who are not “interested persons,” as that term is defined in the Investment Company Act (independent directors). Independent directors shall retire on December 31 of the year in which they reach their 75th birthday.
Jonathan S. Thomas is an “interested person” because he currently serves as President and Chief Executive Officer of American Century Companies, Inc. (ACC), the parent company of American Century Investment Management, Inc. (ACIM or the advisor). The other directors (more than three-fourths of the total number) are independent. They are not employees, directors or officers of, and have no financial interest in, ACC or any of its wholly owned, direct or indirect, subsidiaries, including ACIM, American Century Investment Services, Inc. (ACIS) and American Century Services, LLC (ACS), and they do not have any other affiliations, positions or relationships that would cause them to be considered “interested persons” under the Investment Company Act. The directors serve in this capacity for seven (in the case of Jonathan S. Thomas, 16; and Stephen E. Yates, 8) registered investment companies in the American Century Investments family of funds.
The following table presents additional information about the directors. The mailing address for each director is 4500 Main Street, Kansas City, Missouri 64111.
| | | | | | | | | | | | | | | | | |
Name
(Year of Birth) | Position(s) Held with Funds | Length of Time Served | Principal Occupation(s) During Past 5 Years | Number of American Century Portfolios Overseen by Director | Other Directorships Held During Past 5 Years |
| Independent Directors | | |
| Brian Bulatao (1964) | Director | Since 2022 | Chief Administrative Officer, Activision Blizzard, Inc. (2021 to present); Under Secretary of State for Management, U.S. Department of State (2018 to 2021); Chief Operating Officer, Central Intelligence Agency (2017 to 2018) | 65 | None |
| Thomas W. Bunn (1953) | Director | Since 2017 | Retired | 65 | None |
Chris H. Cheesman
(1962)
| Director | Since 2019
| Retired. Senior Vice President & Chief Audit Executive, AllianceBernstein (1999 to 2018) | 65 | Alleghany Corporation (2021 to 2022) |
Barry Fink
(1955) | Director | Since 2012 (independent since 2016) | Retired | 65 | None |
Rajesh K. Gupta
(1960)
| Director | Since 2019
| Partner Emeritus, SeaCrest Investment Management and SeaCrest Wealth Management (2019 to present); Chief Executive Officer and Chief Investment Officer, SeaCrest Investment Management (2006 to 2019); Chief Executive Officer and Chief Investment Officer, SeaCrest Wealth Management (2008 to 2019) | 65 | None |
| | | | | | | | | | | | | | | | | |
Name
(Year of Birth) | Position(s) Held with Funds | Length of Time Served | Principal Occupation(s) During Past 5 Years | Number of American Century Portfolios Overseen by Director | Other Directorships Held During Past 5 Years |
| Independent Directors | | |
Lynn Jenkins
(1963)
| Director | Since 2019
| Consultant, LJ Strategies (2019 to present); United States Representative, U.S. House of Representatives (2009 to 2018) | 65 | MGP Ingredients, Inc. (2019 to 2021) |
Jan M. Lewis
(1957) | Director and Board Chair | Since 2011
(Board Chair since 2022) | Retired | 65 | None |
Gary C. Meltzer
(1963) | Director | Since 2022 | Advisor, Pontoro (2021 to present); Executive Advisor, Consultant and Investor, Harris Ariel Advisory LLC (2020 to present); Managing Partner, PricewaterhouseCoopers LLP (1985 to 2020) | 65 | ExcelFin Acquisition Corp., Apollo Realty Income Solutions, Inc. |
Stephen E. Yates
(1948) | Director | Since 2012 | Retired | 116 | None |
| Interested Director | | |
Jonathan S. Thomas
(1963) | Director | Since 2007 | President and Chief Executive Officer, ACC (2007 to present). Also serves as Chief Executive Officer, ACS; Director, ACC and other ACC subsidiaries | 148 | None |
The Statement of Additional Information has additional information about the funds' directors and is available without charge, upon request, by calling 1-800-345-2021.
Officers
The following table presents certain information about the executive officers of the funds. Each officer serves as an officer for each of the 16 investment companies in the American Century family of funds. No officer is compensated for his or her service as an officer of the funds. The listed officers are interested persons of the funds and are appointed or re-appointed on an annual basis. The mailing address for each officer listed below is 4500 Main Street, Kansas City, Missouri 64111.
| | | | | | | | |
Name
(Year of Birth) | Offices with the Funds | Principal Occupation(s) During the Past Five Years |
Patrick Bannigan
(1965) | President since 2019 | Executive Vice President and Director, ACC (2012 to present); Chief Financial Officer, Chief Accounting Officer and Treasurer, ACC (2015 to present). Also serves as President, ACS; Vice President, ACIM; Chief Financial Officer, Chief Accounting Officer and/or Director, ACIM, ACS and other ACC subsidiaries |
R. Wes Campbell
(1974) | Chief Financial Officer and Treasurer since 2018
| Vice President, ACS, (2020 to present); Investment Operations and Investment Accounting, ACS (2000 to present)
|
Amy D. Shelton
(1964) | Chief Compliance Officer and Vice President since 2014 | Chief Compliance Officer, American Century funds, (2014 to present); Chief Compliance Officer, ACIM (2014 to present); Chief Compliance Officer, ACIS (2009 to present). Also serves as Vice President, ACIS |
John Pak
(1968) | General Counsel and
Senior Vice
President since 2021 | General Counsel and Senior Vice President, ACC (2021 to present); Also serves as General Counsel and Senior Vice President, ACIM, ACS and ACIS. Chief Legal Officer of Investment and Wealth Management, The Bank of New York Mellon (2014 to 2021) |
David H. Reinmiller
(1963) | Vice President since 2000 | Attorney, ACC (1994 to present). Also serves as Vice President, ACIM and ACS |
Ward D. Stauffer
(1960) | Secretary since 2005 | Attorney, ACC (2003 to present) |
| | |
| Approval of Management Agreement |
At a meeting held on June 28, 2023, the Funds' Board of Directors (the "Board") unanimously approved the renewal of the management agreement pursuant to which American Century Investment Management, Inc. (the “Advisor”) acts as the investment advisor for each of the Funds. Under the Investment Company Act of 1940 (the “Investment Company Act”), contracts for investment advisory services are required to be reviewed, evaluated, and approved by a majority of a fund’s Directors, including a majority of the independent Directors.
Prior to its consideration of the renewal of the Funds’ management agreement, the Directors requested and reviewed data and information compiled by the Advisor and certain independent data providers concerning the Funds. This review was in addition to the oversight and evaluation undertaken by the Board and its committees on a continual basis and the information received was supplemental to the information that the Board and its committees receive and consider over time.
In connection with its consideration of the renewal of the Funds’ management agreement, the Board’s review and evaluation of the services provided by the Advisor and its affiliates included, but was not limited to
•the nature, extent, and quality of investment management, shareholder services, distribution services, and other services provided to the Funds;
•the wide range of programs and services the Advisor and other service providers provide to the Funds and their shareholders on a routine and non-routine basis;
•the Funds’ investment performance compared to appropriate benchmarks and/or peer groups of other mutual funds with similar investment objectives and strategies;
•the cost of owning each Fund compared to the cost of owning similarly-managed funds;
•the Advisor’s compliance policies, procedures, and regulatory experience and those of certain other service providers;
•the Advisor’s strategic plans, generally, and with respect to areas of heightened regulatory interest in the mutual fund industry and certain recent geopolitical and other issues;
•the Advisor’s business continuity plans, vendor management practices, and information security practices;
•the cost of services provided to the Funds, the profitability of the Funds to the Advisor, and the Advisor’s financial results of operation;
•possible economies of scale associated with the Advisor’s management of the Funds;
•any collateral benefits derived by the Advisor from the management of the Funds;
•fees and expenses associated with any investment by the Fund in other funds;
•payments to intermediaries by the Fund and the Advisor and services provided by intermediaries in connection therewith; and
•services provided and charges to the Advisor’s other investment management clients.
The Board held two meetings to consider the renewal. The independent Directors also met in private session multiple times to review and discuss the information provided in response to their request. The independent Directors held active discussions with the Advisor regarding the renewal of the management agreement, requesting supplemental information, and reviewing information provided by the Advisor in response thereto. The independent Directors had the benefit of the advice of their independent counsel throughout the process.
Factors Considered
The Directors considered all of the information provided by the Advisor, the independent data providers, and independent counsel in connection with the approval. They determined that the information was sufficient for them to evaluate the management agreement for each Fund. In connection with their review, the Directors did not identify any single factor as being all-important or
controlling, and each Director may have attributed different levels of importance to different factors. In deciding to renew the management agreement, the Board based its decision on a number of factors, including without limitation the following:
Nature, Extent and Quality of Services — Generally. Under the management agreement, the Advisor is responsible for providing or arranging for all services necessary for the operation of each Fund. The Board noted that the Advisor provides or arranges at its own expense a wide variety of services which include, without limitation, the following:
•constructing and designing each Fund
•portfolio research and security selection
•initial capitalization/funding
•securities trading
•Fund administration
•custody of Fund assets
•daily valuation of each Fund’s portfolio
•liquidity monitoring and management
•risk management, including information security
•shareholder servicing and transfer agency, including shareholder confirmations, recordkeeping, and communications
•legal services (except the independent Directors’ counsel)
•regulatory and portfolio compliance
•financial reporting
•marketing and distribution (except amounts paid by each Fund under Rule 12b-1 plans)
The Board noted that many of these services have expanded over time in terms of both quantity and complexity in response to shareholder demands, competition in the industry, changing distribution channels, and the changing regulatory environment.
Investment Management Services. The nature of the investment management services provided to the Funds is quite complex and allows Fund shareholders access to professional money management, instant diversification of their investments, the opportunity to easily diversify among asset classes by investing in or exchanging among various American Century Investments funds, and liquidity. In evaluating investment performance, the Board expects the Advisor to manage each Fund in accordance with its investment objectives and principal investment strategies. Further, the Directors recognize that the Advisor has an obligation to monitor trading activities, and in particular to seek the best execution of fund trades, and to evaluate the use of and payment for research. In providing these services, the Advisor utilizes teams of investment professionals who require extensive information technology, research, training, compliance, and other systems to conduct their business. The Board, directly and through its Fund Performance Review Committee, provides oversight of the investment performance process. It regularly reviews investment performance information for each Fund, together with comparative information for appropriate benchmarks and/or peer groups of similarly-managed funds, over different time horizons. The Directors also review investment performance information during the management agreement renewal process. If performance concerns are identified, the Board discusses with the Advisor the reasons for such results and any actions being taken to improve performance and may conduct special reviews until performance improves. The performance for One Choice Portfolio: Very Conservative and One Choice Portfolio: Conservative was above each Fund's respective benchmark for the one-, three-, five-, and ten-year periods reviewed by the Board. The performance for One Choice Portfolio: Moderate, One Choice Portfolio: Aggressive, and One Choice Portfolio: Very Aggressive was above each Fund's respective benchmark for the three-, five-, and ten-year periods and below each Fund's respective benchmark for the one-year period reviewed by the Board. In relation to industry peers, the One Choice Portfolio: Very Conservative, One Choice Portfolio: Aggressive, and One Choice Portfolio: Very Aggressive were above the median of their peer performance universe as identified by a third-party service provider for the one-, three-, five-, and ten-year periods. The One Choice Portfolio: Conservative and One Choice Portfolio: Moderate were above the median of their peer performance universe for the one-year period and below the median of
their peer performance universe for the three-, five-, and ten-year periods. The Board found the investment management services provided by the Advisor to each Fund to be satisfactory and consistent with the management agreement.
Shareholder and Other Services. Under the management agreement, the Advisor provides the Funds with a comprehensive package of transfer agency, shareholder, and other services. The Board, directly and through its various committees, regularly reviews reports and evaluations of such services at its regular meetings. These reports include, but are not limited to, information regarding the operational efficiency and accuracy of the shareholder and transfer agency services provided, staffing levels, shareholder satisfaction, technology support (including information security), new products and services offered to Fund shareholders, securities trading activities, portfolio valuation services, auditing services, and legal and operational compliance activities. The Board found the services provided by the Advisor to each Fund under the management agreement to be competitive and of high quality.
Costs of Services and Profitability. The Advisor provides detailed information concerning its cost of providing various services to the Funds, its profitability in managing each Fund (pre- and post-distribution), and its financial results of operation. The Directors have reviewed with the Advisor the methodology used to prepare this financial information. This information is considered in evaluating the Advisor’s financial condition, its ability to continue to provide services under the management agreement, and the reasonableness of the terms of the current management agreement. The Board concluded that the Advisor’s profits were reasonable in light of the services provided to the Funds.
Ethics. The Board generally considers the Advisor’s commitment to providing quality services to shareholders and to conducting its business ethically. They noted that the Advisor’s practices generally meet or exceed industry best practices.
Economies of Scale. The Board also reviewed information provided by the Advisor regarding the possible existence of economies of scale in connection with the management of each Fund. The Board concluded that economies of scale are difficult to measure and predict with precision, especially on a fund-by-fund basis. The Board concluded that the Advisor is sharing economies of scale, to the extent they exist, through its fee structure, and through reinvestment in its business, infrastructure, investment capabilities and initiatives to provide shareholders enhanced and expanded content and services.
Comparison to Other Funds’ Fees. The Funds invest their non-cash assets entirely in other American Century Investments funds. The Funds do not pay an investment advisory fee to the Advisor. Rather, each Fund bears its pro rata share of the expenses incurred by the underlying funds. Each underlying fund pays the Advisor a single, all-inclusive (or unified) management fee for providing services necessary for the management and operation of the fund, other than brokerage and other transaction fees and expenses relating to acquisition and disposition of portfolio securities, acquired fund fees and expenses, taxes, interest, extraordinary expenses, fund litigation expenses, fees and expenses of the Funds' independent Directors (including their independent legal counsel), as well as expenses incurred in connection with the provision of shareholder services and distribution services under a plan adopted pursuant to Rule 12b-1 under the Investment Company Act. The Board concluded that the underlying fund expenses incurred by each Fund were reasonable in light of the services provided to each Fund.
Comparison to Fees and Services Provided to Other Clients of the Advisor. The Board also requested and received information from the Advisor concerning the nature of the services, fees, costs, and profitability of its advisory services to advisory clients other than the Funds. They observed that these varying types of client accounts require different services and involve different regulatory and entrepreneurial risks than the management of each Fund. The Board analyzed this information and concluded that the fees charged and services provided to the Funds were reasonable by comparison.
Payments to Intermediaries. The Directors also requested and received a description of payments made to intermediaries by each Fund and the Advisor and services provided in response thereto. These payments include various payments made by each Fund or the Advisor to different types of intermediaries and recordkeepers for distribution and service activities provided for each Fund. The Board reviewed such information and received representations from the Advisor that all such payments by the Funds were made pursuant to each Fund's Rule 12b-1 Plan and that all such payments by the Advisor were made from the Advisor’s resources and reasonable profits.
Collateral or “Fall-Out” Benefits Derived by the Advisor. The Board considered the possible existence of collateral benefits the Advisor may receive as a result of its relationship with the Funds. They concluded that the Advisor’s primary business is managing funds and it generally does not use fund or shareholder information to generate profits in other lines of business, and therefore does not derive any significant collateral benefits from them. To the extent there are potential collateral benefits, the Board has been advised and has taken this into consideration in its review of the management contract with the Funds. The Board noted that additional assets from other clients may offer the Advisor some benefit from increased leverage with prospective clients, service providers, and counterparties. Additionally, the Advisor may receive proprietary research from broker-dealers that execute fund portfolio transactions, which the Board concluded is likely to benefit other clients of the Advisor, as well as Fund shareholders. The Board also determined that the Advisor is able to provide investment management services to certain clients other than the Funds, at least in part, due to its existing infrastructure built to serve the fund complex. The Board concluded that appropriate allocation methodologies had been employed to assign resources and the cost of those resources to these other clients.
Existing Relationship. The Board also considered whether there was any reason for not continuing the existing arrangement with the Advisor. In this regard, the Board was mindful of the potential disruptions of the Funds' operations and various risks, uncertainties, and other effects that could occur as a result of a decision not to continue such relationship. In particular, the Board recognized that most shareholders have invested in the Funds on the strength of the Advisor’s industry standing and reputation and in the expectation that the Advisor will have a continuing role in providing advisory services to each Fund.
Conclusion of the Directors. As a result of this process, the Board, including all of the independent Directors, taking into account all of the factors discussed above and the information provided by the Advisor and others in connection with its review and received over time, determined that the terms of the management agreement are fair and reasonable in light of the services provided and that the management agreement between the Funds and the Advisor should be renewed for an additional one-year period.
| | |
| Liquidity Risk Management Program |
The Funds have adopted a liquidity risk management program (the “program”). The Funds' Board of Directors (the "Board") has designated American Century Investment Management, Inc. (“ACIM”) as the administrator of the program. Personnel of ACIM or its affiliates, including members of ACIM’s Investment Oversight Committee who are members of ACIM’s Investment Management and Global Analytics departments, conduct the day-to-day operation of the program pursuant to the program.
Under the program, ACIM manages the Funds' liquidity risk, which is the risk that the Funds could not meet shareholder redemption requests without significant dilution of remaining shareholders’ interests in the Funds. This risk is managed by monitoring the degree of liquidity of the Funds' investments, limiting the amount of the Funds' illiquid investments, and utilizing various risk management tools and facilities available to the Funds for meeting shareholder redemptions, among other means. ACIM’s process of determining the degree of liquidity of certain investments held by the Funds are supported by a third-party liquidity assessment vendor.
The Board reviewed a report prepared by ACIM regarding the operation and effectiveness of the program for the period January 1, 2022 through December 31, 2022. No significant liquidity events impacting the Funds were noted in the report. In addition, ACIM provided its assessment that the program had been effective in managing the Funds' liquidity risk.
A special meeting of shareholders was held on October 13, 2022, to vote on the following proposal. The proposal received the required votes and was adopted. A summary of voting results is listed below.
To elect five directors to the Board of Directors of American Century Asset Allocation
Portfolios, Inc.:
| | | | | | | | | | | |
| Affirmative | | Withhold |
| Brian Bulatao | $ | 8,582,345,051 | | | $ | 563,235,224 | |
| Chris H. Cheesman | $ | 8,707,646,938 | | | $ | 437,933,337 | |
| Rajesh K. Gupta | $ | 8,679,529,882 | | | $ | 466,050,393 | |
| Lynn M. Jenkins | $ | 8,621,650,078 | | | $ | 523,930,197 | |
| Gary C. Meltzer | $ | 8,661,710,317 | | | $ | 483,869,958 | |
The other directors whose term of office continued after the meeting include Jonathan S. Thomas, Thomas W. Bunn, Barry Fink, Jan M. Lewis, and Stephen E. Yates.
Retirement Account Information
As required by law, distributions you receive from certain retirement accounts are subject to federal income tax withholding at the IRS default rate of 10%.* Tax will be withheld on the total amount withdrawn even though you may be receiving amounts that are not subject to withholding, such as nondeductible contributions. In such case, excess amounts of withholding could occur. You may adjust your withholding election so that a greater or lesser amount will be withheld.
You may elect a different withholding rate, or request zero withholding, by submitting an acceptable IRS Form W-4R election with your distribution request. You may notify us of your W-4R election by telephone, on our distribution forms, on IRS Form W-4R, or through other acceptable electronic means. If your withholding election is for an automatic withdrawal plan, you have the right to revoke your election at any time and any election you make will remain in effect until revoked by filing a new election.
Remember, even if you elect not to have income tax withheld, you are liable for paying income tax on the taxable portion of your withdrawal. If you elect not to have income tax withheld or you don’t have enough income tax withheld, you may be responsible for payment of estimated tax. You may incur penalties under the estimated tax rules if your withholding and estimated tax payments are not sufficient. You can reduce or defer the income tax on a distribution by directly or indirectly rolling such distribution over to another IRA or eligible plan. You should consult your tax advisor for additional information.
State tax will be withheld according to state regulations if, at the time of your distribution, your tax residency is within one of the mandatory withholding states.
*Some 403(b), 457 and qualified retirement plan distributions may be subject to 20% mandatory withholding, as they are subject to special tax and withholding rules. Your plan administrator or plan sponsor is required to provide you with a special tax notice explaining those rules at the time you request a distribution. If applicable, federal and/or state taxes may be withheld from your distribution amount.
Proxy Voting Policies
A description of the policies that the funds’ investment advisor uses in exercising the voting rights associated with the securities purchased and/or held by the funds is available without charge, upon request, by calling 1-800-345-2021. It is also available on American Century Investments’ website at americancentury.com/proxy and on the Securities and Exchange Commission’s website at sec.gov. Information regarding how the investment advisor voted proxies relating to portfolio securities during the most recent 12-month period ended June 30 is available on americancentury.com/proxy. It is also available at sec.gov.
Quarterly Portfolio Disclosure
The funds file their complete schedule of portfolio holdings with the Securities and Exchange
Commission (SEC) for the first and third quarters of each fiscal year as an exhibit to their reports on Form N-PORT. These portfolio holdings are available on the funds' website at
americancentury.com and, upon request, by calling 1-800-345-2021. The funds' Form N-PORT
reports are available on the SEC’s website at sec.gov.
Other Tax Information
The following information is provided pursuant to provisions of the Internal Revenue Code.
The funds hereby designate up to the maximum amount allowable as qualified dividend income for the fiscal year ended July 31, 2023.
For corporate taxpayers, the funds hereby designate the following, or up to the maximum amount allowable, of ordinary income distributions paid during the fiscal year ended July 31, 2023 as qualified for the corporate dividends received deduction.
| | | | | | | | | | | | | | |
One Choice Portfolio: Very Conservative | One Choice Portfolio: Conservative | One Choice Portfolio: Moderate | One Choice Portfolio: Aggressive | One Choice Portfolio: Very Aggressive |
| $916,382 | $2,837,026 | $5,279,958 | $3,298,190 | $1,346,507 |
The funds hereby designate the following as qualified short-term capital gain distributions for purposes of Internal Revenue Code Section 871 for the fiscal year ended July 31, 2023.
| | | | | | | | | | | | | | |
One Choice Portfolio: Very Conservative | One Choice Portfolio: Conservative | One Choice Portfolio: Moderate | One Choice Portfolio: Aggressive | One Choice Portfolio: Very Aggressive |
| — | — | $636,636 | $413,480 | — |
The funds hereby designate the following, or up to the maximum amount allowable, as long-term capital gain distributions (20% rate gain distributions) for the fiscal year ended July 31, 2023.
| | | | | | | | | | | | | | |
One Choice Portfolio: Very Conservative | One Choice Portfolio: Conservative | One Choice Portfolio: Moderate | One Choice Portfolio: Aggressive | One Choice Portfolio: Very Aggressive |
| $15,973,765 | $69,533,710 | $122,040,316 | $71,825,192 | $31,739,690 |
For the fiscal year ended July 31, 2023, the funds intend to pass through to shareholders the following foreign source income and foreign taxes paid, or up to the maximum amount allowable, as a foreign tax credit.
| | | | | | | | | | | | | | |
| Foreign Tax Credit | Foreign Source Income |
| Amount | Per Outstanding Share | Amount | Per Outstanding Share |
| One Choice Portfolio: Very Conservative | — | — | — | — |
| One Choice Portfolio: Conservative | $70,753 | $0.0008 | $1,323,074 | $0.0141 |
| One Choice Portfolio: Moderate | $409,154 | $0.0032 | $4,967,284 | $0.0384 |
| One Choice Portfolio: Aggressive | $276,661 | $0.0045 | $3,180,310 | $0.0514 |
| One Choice Portfolio: Very Aggressive | $151,991 | $0.0076 | $1,644,096 | $0.0826 |
| | | | | | | | |
| |
| | |
| Contact Us | americancentury.com | |
| Automated Information Line | 1-800-345-8765 | |
| Investor Services Representative | 1-800-345-2021
or 816-531-5575 | |
| Investors Using Advisors | 1-800-378-9878 | |
| Business, Not-For-Profit, Employer-Sponsored Retirement Plans | 1-800-345-3533 | |
| Banks and Trust Companies, Broker-Dealers, Financial Professionals, Insurance Companies | 1-800-345-6488 | |
| Telecommunications Relay Services for the Deaf | 711 | |
| | |
| American Century Asset Allocation Portfolios, Inc. | |
| | |
Investment Advisor: American Century Investment Management, Inc. Kansas City, Missouri | |
| | |
| This report and the statements it contains are submitted for the general information of our shareholders. The report is not authorized for distribution to prospective investors unless preceded or accompanied by an effective prospectus. | |
| | |
©2023 American Century Proprietary Holdings, Inc. All rights reserved.
CL-ANN-93180 2309 | |
| | | | | | | | |
| | |
| Annual Report | |
| | |
| July 31, 2023 | |
| | |
| One Choice® In Retirement Portfolio | One Choice® 2045 Portfolio |
| Investor Class (ARTOX) | Investor Class (AROIX) |
| I Class (ATTIX) | I Class (AOOIX) |
| A Class (ARTAX) | A Class (AROAX) |
| C Class (ATTCX) | C Class (AROCX) |
| R Class (ARSRX) | R Class (ARORX) |
| R6 Class (ARDTX) | R6 Class (ARDOX) |
| One Choice® 2025 Portfolio | One Choice® 2050 Portfolio |
| Investor Class (ARWIX) | Investor Class (ARFVX) |
| I Class (ARWFX) | I Class (ARFSX) |
| A Class (ARWAX) | A Class (ARFMX) |
| C Class (ARWCX) | C Class (ARFDX) |
| R Class (ARWRX) | R Class (ARFWX) |
| R6 Class (ARWDX) | R6 Class (ARFEX) |
| One Choice® 2030 Portfolio | One Choice® 2055 Portfolio |
| Investor Class (ARCVX) | Investor Class (AREVX) |
| I Class (ARCSX) | I Class (ARENX) |
| A Class (ARCMX) | A Class (AREMX) |
| C Class (ARWOX) | C Class (AREFX) |
| R Class (ARCRX) | R Class (AREOX) |
| R6 Class (ARCUX) | R6 Class (AREUX) |
| One Choice® 2035 Portfolio | One Choice® 2060 Portfolio |
| Investor Class (ARYIX) | Investor Class (ARGVX) |
| I Class (ARLIX) | I Class (ARGNX) |
| A Class (ARYAX) | A Class (ARGMX) |
| C Class (ARLCX) | C Class (ARGHX) |
| R Class (ARYRX) | R Class (ARGRX) |
| R6 Class (ARLDX) | R6 Class (ARGDX) |
| One Choice® 2040 Portfolio | One Choice® 2065 Portfolio |
| Investor Class (ARDVX) | Investor Class (ARHVX) |
| I Class (ARDSX) | I Class (ARHUX) |
| A Class (ARDMX) | A Class (ARHMX) |
| C Class (ARNOX) | C Class (ARHEX) |
| R Class (ARDRX) | R Class (ARHFX) |
| R6 Class (ARDUX) | R6 Class (ARHSX) |
| | | | | |
| President’s Letter | |
| Performance | |
| Portfolio Commentary | |
| Portfolio Characteristics | |
| Shareholder Fee Examples | |
| Schedules of Investments | |
| Statements of Assets and Liabilities | |
| Statements of Operations | |
| Statements of Changes in Net Assets | |
| Notes to Financial Statements | |
| Financial Highlights | |
| Report of Independent Registered Public Accounting Firm | |
| Management | |
| |
| Liquidity Risk Management Program | |
| Proxy Voting Results | |
| Additional Information | |
| |
Any opinions expressed in this report reflect those of the author as of the date of the report, and do not necessarily represent the opinions of American Century Investments® or any other person in the American Century Investments organization. Any such opinions are subject to change at any time based upon market or other conditions and American Century Investments disclaims any responsibility to update such opinions. These opinions may not be relied upon as investment advice and, because investment decisions made by American Century Investments funds are based on numerous factors, may not be relied upon as an indication of trading intent on behalf of any American Century Investments fund. Security examples are used for representational purposes only and are not intended as recommendations to purchase or sell securities. Performance information for comparative indices and securities is provided to American Century Investments by third party vendors. To the best of American Century Investments’ knowledge, such information is accurate at the time of printing.
Jonathan Thomas
Dear Investor:
Thank you for reviewing this annual report for the period ended July 31, 2023. Annual reports help convey important information about fund returns, including market factors that affected performance. For additional investment insights, please visit americancentury.com.
Stocks Rallied Despite Ongoing Challenges
After delivering modest gains early in the fiscal year, global stocks—most notably U.S. stocks—rallied through the first seven months of 2023. This bounce back, which occurred despite ongoing volatility and rising interest rates, led to strong 12-month performance for most broad stock indices. Investor expectations for the Federal Reserve (Fed) to conclude its rate-hike campaign largely fueled the optimism.
Inflation’s steady slowdown, mounting recession worries and a series of U.S. regional bank failures prompted investors to regularly recalibrate their monetary policy outlooks. However, with inflation still higher than central bank targets, the Fed and its developed markets peers continued to raise rates through period-end.
In June, the Fed bucked the trend of developed markets central banks and paused after 10 consecutive rate hikes. But the break was short-lived. The central bank resumed its tightening campaign in July, raising rates another quarter point to a range of 5.25% to 5.5%, a 22-year high. Citing still-higher-than-target inflation and still-strong economic data, policymakers left their tightening options open. Inflation remained even higher in the eurozone and the U.K., prompting central bankers there to steadily raise interest rates.
Despite the inflation and rate backdrops, better-than-expected corporate earnings helped the S&P 500 Index return 21% for the seven months ended July 31, 2023. For the 12-month period, the S&P 500 Index returned 13%. Global and style-focused stock index returns were even stronger. Meanwhile, amid high inflation and central bank tightening, government bond yields surged, and global and U.S. bond returns declined for the period.
Remaining Diligent in Uncertain Times
We expect market volatility to linger as investors navigate a complex environment of persistent inflation, tighter financial conditions, banking industry turbulence and recession risk. In addition, increasingly tense geopolitical considerations complicate the market backdrop.
We appreciate your confidence in us during these extraordinary times. American Century Investments has a long history of helping clients weather unpredictable and volatile markets, and we’re confident we will continue to meet today’s challenges.
Sincerely,
Jonathan Thomas
President and Chief Executive Officer
American Century Investments
| | | | | | | | | | | | | | | | | | |
| Total Returns as of July 31, 2023 |
| | | | Average Annual Returns | |
| Ticker
Symbol | | 1 year | 5 years | 10 years | Inception
Date |
| One Choice In Retirement Portfolio |
| Investor Class | ARTOX | | 3.44% | 4.16% | 4.74% | 8/31/04 |
| S&P Target Date Retirement Income Index | — | | 3.55% | 3.51% | 3.95% | — |
| I Class | ATTIX | | 3.64% | 4.36% | 4.94% | 8/31/04 |
| A Class | ARTAX | | | | | 8/31/04 |
| No sales charge | | | 3.18% | 3.90% | 4.48% | |
| With sales charge | | | -2.75% | 2.67% | 3.86% | |
| C Class | ATTCX | | 2.44% | 3.12% | 3.70% | 3/1/10 |
| R Class | ARSRX | | 2.93% | 3.64% | 4.21% | 8/31/04 |
| R6 Class | ARDTX | | 3.81% | 4.54% | 5.09% | 10/23/17 |
Fund returns would have been lower if a portion of the fees had not been waived.
C Class shares will automatically convert to A Class shares after being held for approximately eight years. C Class average annual returns do not reflect this conversion.
Historical performance for the R6 Class prior to its inception reflects the performance of the R6 Class of the One Choice In Retirement Portfolio R6. Such historical performance began on July 31, 2013. The R6 Class of the fund acquired all of the assets of the One Choice In Retirement Portfolio R6 on October 20, 2017 pursuant to a reorganization.
Sales charges include initial sales charges and contingent deferred sales charges (CDSCs), as applicable. A Class shares have a 5.75% maximum initial sales charge and may be subject to a maximum CDSC of 1.00%. C Class shares redeemed within 12 months of purchase are subject to a maximum CDSC of 1.00%. The SEC requires that mutual funds provide performance information net of maximum sales charges in all cases where charges could be applied.
A One Choice Target Date Portfolio's target date is the approximate year when investors plan to retire or start withdrawing their money. The principal value of the investment is not guaranteed at any time, including at the target date.
Data presented reflect past performance. Past performance is no guarantee of future results. Current performance may be higher or lower than the performance shown. Total returns for periods less than one year are not annualized. Investment return and principal value will fluctuate, and redemption value may be more or less than original cost. Data assumes reinvestment of dividends and capital gains, and none of the charts reflect the deduction of taxes that a shareholder would pay on fund distributions or the redemption of fund shares. To obtain performance data current to the most recent month end, please call 1-800-345-2021 or visit americancentury.com. For additional information about the funds, please consult the prospectus.
| | | | | | | | | | | | | | | | | | |
| Total Returns as of July 31, 2023 |
| | | | Average Annual Returns | |
| Ticker
Symbol | | 1 year | 5 years | 10 years | Inception
Date |
| One Choice 2025 Portfolio |
| Investor Class | ARWIX | | 3.60% | 4.36% | 5.27% | 8/31/04 |
| S&P Target Date To 2025 Index | — | | 5.16% | 4.79% | 5.58% | — |
| I Class | ARWFX | | 3.81% | 4.57% | 5.48% | 8/31/04 |
| A Class | ARWAX | | | | | 8/31/04 |
| No sales charge | | | 3.34% | 4.09% | 5.00% | |
| With sales charge | | | -2.60% | 2.86% | 4.38% | |
| C Class | ARWCX | | 2.55% | 3.32% | 4.22% | 3/1/10 |
| R Class | ARWRX | | 3.08% | 3.83% | 4.74% | 8/31/04 |
| R6 Class | ARWDX | | 3.98% | 4.72% | 5.63% | 10/23/17 |
Fund returns would have been lower if a portion of the fees had not been waived.
C Class shares will automatically convert to A Class shares after being held for approximately eight years. C Class average annual returns do not reflect this conversion.
Historical performance for the R6 Class prior to its inception reflects the performance of the R6 Class of the One Choice 2025 Portfolio R6. Such historical performance began on July 31, 2013. The R6 Class of the fund acquired all of the assets of the One Choice 2025 Portfolio R6 on October 20, 2017 pursuant to a reorganization.
Sales charges include initial sales charges and contingent deferred sales charges (CDSCs), as applicable. A Class shares have a 5.75% maximum initial sales charge and may be subject to a maximum CDSC of 1.00%. C Class shares redeemed within 12 months of purchase are subject to a maximum CDSC of 1.00%. The SEC requires that mutual funds provide performance information net of maximum sales charges in all cases where charges could be applied.
A One Choice Target Date Portfolio's target date is the approximate year when investors plan to retire or start withdrawing their money. The principal value of the investment is not guaranteed at any time, including at the target date.
Data presented reflect past performance. Past performance is no guarantee of future results. Current performance may be higher or lower than the performance shown. Total returns for periods less than one year are not annualized. Investment return and principal value will fluctuate, and redemption value may be more or less than original cost. Data assumes reinvestment of dividends and capital gains, and none of the charts reflect the deduction of taxes that a shareholder would pay on fund distributions or the redemption of fund shares. To obtain performance data current to the most recent month end, please call 1-800-345-2021 or visit americancentury.com. For additional information about the funds, please consult the prospectus.
| | | | | | | | | | | | | | | | | | |
| Total Returns as of July 31, 2023 |
| | | | Average Annual Returns | |
| Ticker
Symbol | | 1 year | 5 years | 10 years | Inception
Date |
| One Choice 2030 Portfolio |
| Investor Class | ARCVX | | 4.31% | 4.70% | 5.70% | 5/30/08 |
| S&P Target Date To 2030 Index | — | | 6.68% | 5.57% | 6.31% | — |
| I Class | ARCSX | | 4.53% | 4.92% | 5.92% | 5/30/08 |
| A Class | ARCMX | | | | | 5/30/08 |
| No sales charge | | | 3.97% | 4.44% | 5.44% | |
| With sales charge | | | -2.01% | 3.21% | 4.81% | |
| C Class | ARWOX | | 3.25% | 3.65% | 4.65% | 3/1/10 |
| R Class | ARCRX | | 3.70% | 4.17% | 5.17% | 5/30/08 |
| R6 Class | ARCUX | | 4.67% | 5.07% | 6.05% | 10/23/17 |
Fund returns would have been lower if a portion of the fees had not been waived.
C Class shares will automatically convert to A Class shares after being held for approximately eight years. C Class average annual returns do not reflect this conversion.
Historical performance for the R6 Class prior to its inception reflects the performance of the R6 Class of the One Choice 2030 Portfolio R6. Such historical performance began on July 31, 2013. The R6 Class of the fund acquired all of the assets of the One Choice 2030 Portfolio R6 on October 20, 2017 pursuant to a reorganization.
Sales charges include initial sales charges and contingent deferred sales charges (CDSCs), as applicable. A Class shares have a 5.75% maximum initial sales charge and may be subject to a maximum CDSC of 1.00%. C Class shares redeemed within 12 months of purchase are subject to a maximum CDSC of 1.00%. The SEC requires that mutual funds provide performance information net of maximum sales charges in all cases where charges could be applied.
A One Choice Target Date Portfolio's target date is the approximate year when investors plan to retire or start withdrawing their money. The principal value of the investment is not guaranteed at any time, including at the target date.
Data presented reflect past performance. Past performance is no guarantee of future results. Current performance may be higher or lower than the performance shown. Total returns for periods less than one year are not annualized. Investment return and principal value will fluctuate, and redemption value may be more or less than original cost. Data assumes reinvestment of dividends and capital gains, and none of the charts reflect the deduction of taxes that a shareholder would pay on fund distributions or the redemption of fund shares. To obtain performance data current to the most recent month end, please call 1-800-345-2021 or visit americancentury.com. For additional information about the funds, please consult the prospectus.
| | | | | | | | | | | | | | | | | | |
| Total Returns as of July 31, 2023 |
| | | | Average Annual Returns | |
| Ticker
Symbol | | 1 year | 5 years | 10 years | Inception
Date |
| One Choice 2035 Portfolio |
| Investor Class | ARYIX | | 5.05% | 5.05% | 6.17% | 8/31/04 |
| S&P Target Date To 2035 Index | — | | 8.22% | 6.28% | 6.94% | — |
| I Class | ARLIX | | 5.33% | 5.29% | 6.38% | 8/31/04 |
| A Class | ARYAX | | | | | 8/31/04 |
| No sales charge | | | 4.85% | 4.81% | 5.90% | |
| With sales charge | | | -1.18% | 3.57% | 5.28% | |
| C Class | ARLCX | | 4.06% | 4.03% | 5.12% | 3/1/10 |
| R Class | ARYRX | | 4.52% | 4.53% | 5.64% | 8/31/04 |
| R6 Class | ARLDX | | 5.49% | 5.42% | 6.52% | 10/23/17 |
Fund returns would have been lower if a portion of the fees had not been waived.
C Class shares will automatically convert to A Class shares after being held for approximately eight years. C Class average annual returns do not reflect this conversion.
Historical performance for the R6 Class prior to its inception reflects the performance of the R6 Class of the One Choice 2035 Portfolio R6. Such historical performance began on July 31, 2013. The R6 Class of the fund acquired all of the assets of the One Choice 2035 Portfolio R6 on October 20, 2017 pursuant to a reorganization.
Sales charges include initial sales charges and contingent deferred sales charges (CDSCs), as applicable. A Class shares have a 5.75% maximum initial sales charge and may be subject to a maximum CDSC of 1.00%. C Class shares redeemed within 12 months of purchase are subject to a maximum CDSC of 1.00%. The SEC requires that mutual funds provide performance information net of maximum sales charges in all cases where charges could be applied.
A One Choice Target Date Portfolio's target date is the approximate year when investors plan to retire or start withdrawing their money. The principal value of the investment is not guaranteed at any time, including at the target date.
Data presented reflect past performance. Past performance is no guarantee of future results. Current performance may be higher or lower than the performance shown. Total returns for periods less than one year are not annualized. Investment return and principal value will fluctuate, and redemption value may be more or less than original cost. Data assumes reinvestment of dividends and capital gains, and none of the charts reflect the deduction of taxes that a shareholder would pay on fund distributions or the redemption of fund shares. To obtain performance data current to the most recent month end, please call 1-800-345-2021 or visit americancentury.com. For additional information about the funds, please consult the prospectus.
| | | | | | | | | | | | | | | | | | |
| Total Returns as of July 31, 2023 |
| | | | Average Annual Returns | |
| Ticker
Symbol | | 1 year | 5 years | 10 years | Inception
Date |
| One Choice 2040 Portfolio |
| Investor Class | ARDVX | | 6.00% | 5.45% | 6.66% | 5/30/08 |
| S&P Target Date To 2040 Index | — | | 9.69% | 6.80% | 7.48% | — |
| I Class | ARDSX | | 6.14% | 5.66% | 6.87% | 5/30/08 |
| A Class | ARDMX | | | | | 5/30/08 |
| No sales charge | | | 5.74% | 5.20% | 6.39% | |
| With sales charge | | | -0.34% | 3.96% | 5.76% | |
| C Class | ARNOX | | 4.94% | 4.40% | 5.59% | 3/1/10 |
| R Class | ARDRX | | 5.47% | 4.93% | 6.13% | 5/30/08 |
| R6 Class | ARDUX | | 6.41% | 5.83% | 7.03% | 10/23/17 |
Fund returns would have been lower if a portion of the fees had not been waived.
C Class shares will automatically convert to A Class shares after being held for approximately eight years. C Class average annual returns do not reflect this conversion.
Historical performance for the R6 Class prior to its inception reflects the performance of the R6 Class of the One Choice 2040 Portfolio R6. Such historical performance began on July 31, 2013. The R6 Class of the fund acquired all of the assets of the One Choice 2040 Portfolio R6 on October 20, 2017 pursuant to a reorganization.
Sales charges include initial sales charges and contingent deferred sales charges (CDSCs), as applicable. A Class shares have a 5.75% maximum initial sales charge and may be subject to a maximum CDSC of 1.00%. C Class shares redeemed within 12 months of purchase are subject to a maximum CDSC of 1.00%. The SEC requires that mutual funds provide performance information net of maximum sales charges in all cases where charges could be applied.
A One Choice Target Date Portfolio's target date is the approximate year when investors plan to retire or start withdrawing their money. The principal value of the investment is not guaranteed at any time, including at the target date.
Data presented reflect past performance. Past performance is no guarantee of future results. Current performance may be higher or lower than the performance shown. Total returns for periods less than one year are not annualized. Investment return and principal value will fluctuate, and redemption value may be more or less than original cost. Data assumes reinvestment of dividends and capital gains, and none of the charts reflect the deduction of taxes that a shareholder would pay on fund distributions or the redemption of fund shares. To obtain performance data current to the most recent month end, please call 1-800-345-2021 or visit americancentury.com. For additional information about the funds, please consult the prospectus.
| | | | | | | | | | | | | | | | | | |
| Total Returns as of July 31, 2023 |
| | | | Average Annual Returns | |
| Ticker
Symbol | | 1 year | 5 years | 10 years | Inception
Date |
| One Choice 2045 Portfolio |
| Investor Class | AROIX | | 6.79% | 5.88% | 7.15% | 8/31/04 |
| S&P Target Date To 2045 Index | — | | 11.07% | 7.25% | 7.87% | — |
| I Class | AOOIX | | 7.00% | 6.10% | 7.37% | 8/31/04 |
| A Class | AROAX | | | | | 8/31/04 |
| No sales charge | | | 6.46% | 5.61% | 6.88% | |
| With sales charge | | | 0.34% | 4.37% | 6.25% | |
| C Class | AROCX | | 5.67% | 4.83% | 6.08% | 3/1/10 |
| R Class | ARORX | | 6.25% | 5.37% | 6.62% | 8/31/04 |
| R6 Class | ARDOX | | 7.07% | 6.25% | 7.51% | 10/23/17 |
Fund returns would have been lower if a portion of the fees had not been waived.
C Class shares will automatically convert to A Class shares after being held for approximately eight years. C Class average annual returns do not reflect this conversion.
Historical performance for the R6 Class prior to its inception reflects the performance of the R6 Class of the One Choice 2045 Portfolio R6. Such historical performance began on July 31, 2013. The R6 Class of the fund acquired all of the assets of the One Choice 2045 Portfolio R6 on October 20, 2017 pursuant to a reorganization.
Sales charges include initial sales charges and contingent deferred sales charges (CDSCs), as applicable. A Class shares have a 5.75% maximum initial sales charge and may be subject to a maximum CDSC of 1.00%. C Class shares redeemed within 12 months of purchase are subject to a maximum CDSC of 1.00%. The SEC requires that mutual funds provide performance information net of maximum sales charges in all cases where charges could be applied.
A One Choice Target Date Portfolio's target date is the approximate year when investors plan to retire or start withdrawing their money. The principal value of the investment is not guaranteed at any time, including at the target date.
Data presented reflect past performance. Past performance is no guarantee of future results. Current performance may be higher or lower than the performance shown. Total returns for periods less than one year are not annualized. Investment return and principal value will fluctuate, and redemption value may be more or less than original cost. Data assumes reinvestment of dividends and capital gains, and none of the charts reflect the deduction of taxes that a shareholder would pay on fund distributions or the redemption of fund shares. To obtain performance data current to the most recent month end, please call 1-800-345-2021 or visit americancentury.com. For additional information about the funds, please consult the prospectus.
| | | | | | | | | | | | | | | | | | |
| Total Returns as of July 31, 2023 |
| | | | Average Annual Returns | |
| Ticker
Symbol | | 1 year | 5 years | 10 years | Inception
Date |
| One Choice 2050 Portfolio |
| Investor Class | ARFVX | | 7.71% | 6.42% | 7.57% | 5/30/08 |
| S&P Target Date To 2050 Index | — | | 11.71% | 7.54% | 8.14% | — |
| I Class | ARFSX | | 7.99% | 6.65% | 7.80% | 5/30/08 |
| A Class | ARFMX | | | | | 5/30/08 |
| No sales charge | | | 7.44% | 6.18% | 7.31% | |
| With sales charge | | | 1.26% | 4.93% | 6.68% | |
| C Class | ARFDX | | 6.64% | 5.37% | 6.51% | 3/1/10 |
| R Class | ARFWX | | 7.16% | 5.90% | 7.04% | 5/30/08 |
| R6 Class | ARFEX | | 8.06% | 6.80% | 7.93% | 10/23/17 |
Fund returns would have been lower if a portion of the fees had not been waived.
C Class shares will automatically convert to A Class shares after being held for approximately eight years. C Class average annual returns do not reflect this conversion.
Historical performance for the R6 Class prior to its inception reflects the performance of the R6 Class of the One Choice 2050 Portfolio R6. Such historical performance began on July 31, 2013. The R6 Class of the fund acquired all of the assets of the One Choice 2050 Portfolio R6 on October 20, 2017 pursuant to a reorganization.
Sales charges include initial sales charges and contingent deferred sales charges (CDSCs), as applicable. A Class shares have a 5.75% maximum initial sales charge and may be subject to a maximum CDSC of 1.00%. C Class shares redeemed within 12 months of purchase are subject to a maximum CDSC of 1.00%. The SEC requires that mutual funds provide performance information net of maximum sales charges in all cases where charges could be applied.
A One Choice Target Date Portfolio's target date is the approximate year when investors plan to retire or start withdrawing their money. The principal value of the investment is not guaranteed at any time, including at the target date.
Data presented reflect past performance. Past performance is no guarantee of future results. Current performance may be higher or lower than the performance shown. Total returns for periods less than one year are not annualized. Investment return and principal value will fluctuate, and redemption value may be more or less than original cost. Data assumes reinvestment of dividends and capital gains, and none of the charts reflect the deduction of taxes that a shareholder would pay on fund distributions or the redemption of fund shares. To obtain performance data current to the most recent month end, please call 1-800-345-2021 or visit americancentury.com. For additional information about the funds, please consult the prospectus.
| | | | | | | | | | | | | | | | | | |
| Total Returns as of July 31, 2023 |
| | | | Average Annual Returns | |
| Ticker
Symbol | | 1 year | 5 years | 10 years | Inception
Date |
| One Choice 2055 Portfolio |
| Investor Class | AREVX | | 8.45% | 6.69% | 7.81% | 3/31/11 |
| S&P Target Date To 2055 Index | — | | 11.80% | 7.52% | 8.25% | — |
| I Class | ARENX | | 8.60% | 6.89% | 8.02% | 3/31/11 |
| A Class | AREMX | | | | | 3/31/11 |
| No sales charge | | | 8.18% | 6.41% | 7.54% | |
| With sales charge | | | 1.96% | 5.16% | 6.90% | |
| C Class | AREFX | | 7.35% | 5.62% | 6.74% | 3/31/11 |
| R Class | AREOX | | 7.90% | 6.15% | 7.27% | 3/31/11 |
| R6 Class | AREUX | | 8.79% | 7.05% | 8.17% | 10/23/17 |
Fund returns would have been lower if a portion of the fees had not been waived.
C Class shares will automatically convert to A Class shares after being held for approximately eight years. C Class average annual returns do not reflect this conversion.
Historical performance for the R6 Class prior to its inception reflects the performance of the R6 Class of the One Choice 2055 Portfolio R6. Such historical performance began on July 31, 2013. The R6 Class of the fund acquired all of the assets of the One Choice 2055 Portfolio R6 on October 20, 2017 pursuant to a reorganization.
Sales charges include initial sales charges and contingent deferred sales charges (CDSCs), as applicable. A Class shares have a 5.75% maximum initial sales charge and may be subject to a maximum CDSC of 1.00%. C Class shares redeemed within 12 months of purchase are subject to a maximum CDSC of 1.00%. The SEC requires that mutual funds provide performance information net of maximum sales charges in all cases where charges could be applied.
A One Choice Target Date Portfolio's target date is the approximate year when investors plan to retire or start withdrawing their money. The principal value of the investment is not guaranteed at any time, including at the target date.
Data presented reflect past performance. Past performance is no guarantee of future results. Current performance may be higher or lower than the performance shown. Total returns for periods less than one year are not annualized. Investment return and principal value will fluctuate, and redemption value may be more or less than original cost. Data assumes reinvestment of dividends and capital gains, and none of the charts reflect the deduction of taxes that a shareholder would pay on fund distributions or the redemption of fund shares. To obtain performance data current to the most recent month end, please call 1-800-345-2021 or visit americancentury.com. For additional information about the funds, please consult the prospectus.
| | | | | | | | | | | | | | | | | | |
| Total Returns as of July 31, 2023 |
| | | | Average Annual Returns | |
| Ticker
Symbol | | 1 year | 5 years | Since
Inception | Inception
Date |
| One Choice 2060 Portfolio |
| Investor Class | ARGVX | | 8.80% | 6.86% | 8.73% | 9/30/15 |
| S&P Target Date To 2060 Index | — | | 12.01% | 7.76% | 9.67% | — |
| I Class | ARGNX | | 9.01% | 7.07% | 8.95% | 9/30/15 |
| A Class | ARGMX | | | | | 9/30/15 |
| No sales charge | | | 8.45% | 6.58% | 8.45% | |
| With sales charge | | | 2.22% | 5.32% | 7.63% | |
| C Class | ARGHX | | 7.69% | 5.79% | 7.65% | 9/30/15 |
| R Class | ARGRX | | 8.26% | 6.31% | 8.18% | 9/30/15 |
| R6 Class | ARGDX | | 9.15% | 7.22% | 9.09% | 10/23/17 |
Fund returns would have been lower if a portion of the fees had not been waived.
Historical performance for the R6 Class prior to its inception reflects the performance of the R6 Class of the One Choice 2060 Portfolio R6. Such historical performance began on September 30, 2015. The R6 Class of the fund acquired all of the assets of the One Choice 2060 Portfolio R6 on October 20, 2017 pursuant to a reorganization.
Sales charges include initial sales charges and contingent deferred sales charges (CDSCs), as applicable. A Class shares have a 5.75% maximum initial sales charge and may be subject to a maximum CDSC of 1.00%. C Class shares redeemed within 12 months of purchase are subject to a maximum CDSC of 1.00%. The SEC requires that mutual funds provide performance information net of maximum sales charges in all cases where charges could be applied.
A One Choice Target Date Portfolio's target date is the approximate year when investors plan to retire or start withdrawing their money. The principal value of the investment is not guaranteed at any time, including at the target date.
Data presented reflect past performance. Past performance is no guarantee of future results. Current performance may be higher or lower than the performance shown. Total returns for periods less than one year are not annualized. Investment return and principal value will fluctuate, and redemption value may be more or less than original cost. Data assumes reinvestment of dividends and capital gains, and none of the charts reflect the deduction of taxes that a shareholder would pay on fund distributions or the redemption of fund shares. To obtain performance data current to the most recent month end, please call 1-800-345-2021 or visit americancentury.com. For additional information about the funds, please consult the prospectus.
| | | | | | | | | | | | | | |
| Total Returns as of July 31, 2023 |
| | | Average Annual Returns | |
| Ticker
Symbol | 1 year | Since
Inception | Inception
Date |
| One Choice 2065 Portfolio |
| Investor Class | ARHVX | 9.00% | 7.98% | 9/23/20 |
| S&P Target Date To 2065+ Index | — | 12.03% | 11.36% | — |
| I Class | ARHUX | 9.22% | 8.19% | 9/23/20 |
| A Class | ARHMX | | | 9/23/20 |
| No sales charge | | 8.73% | 7.70% | |
| With sales charge | | 2.48% | 5.49% | |
| C Class | ARHEX | 7.92% | 6.92% | 9/23/20 |
| R Class | ARHFX | 8.46% | 7.45% | 9/23/20 |
| R6 Class | ARHSX | 9.37% | 8.38% | 9/23/20 |
Fund returns would have been lower if a portion of the fees had not been waived.
Sales charges include initial sales charges and contingent deferred sales charges (CDSCs), as applicable. A Class shares have a 5.75% maximum initial sales charge and may be subject to a maximum CDSC of 1.00%. C Class shares redeemed within 12 months of purchase are subject to a maximum CDSC of 1.00%. The SEC requires that mutual funds provide performance information net of maximum sales charges in all cases where charges could be applied.
A One Choice Target Date Portfolio's target date is the approximate year when investors plan to retire or start withdrawing their money. The principal value of the investment is not guaranteed at any time, including at the target date.
Data presented reflect past performance. Past performance is no guarantee of future results. Current performance may be higher or lower than the performance shown. Total returns for periods less than one year are not annualized. Investment return and principal value will fluctuate, and redemption value may be more or less than original cost. Data assumes reinvestment of dividends and capital gains, and none of the charts reflect the deduction of taxes that a shareholder would pay on fund distributions or the redemption of fund shares. To obtain performance data current to the most recent month end, please call 1-800-345-2021 or visit americancentury.com. For additional information about the funds, please consult the prospectus.
| | |
| Growth of $10,000 Over 10 Years of One Choice In Retirement Portfolio — Investor Class |
| $10,000 investment made July 31, 2013 |
| Performance for other share classes will vary due to differences in fee structure. |
| | | | | |
| Value on July 31, 2023 |
| Investor Class — $15,892 |
|
| S&P Target Date Retirement Income Index — $14,730 |
|
Ending value of Investor Class would have been lower if a portion of the fees had not been waived.
| | |
| Growth of $10,000 Over 10 Years of One Choice 2025 Portfolio — Investor Class |
| $10,000 investment made July 31, 2013 |
| Performance for other share classes will vary due to differences in fee structure. |
| | | | | |
| Value on July 31, 2023 |
| Investor Class — $16,711 |
|
| S&P Target Date To 2025 Index — $17,214 |
|
Ending value of Investor Class would have been lower if a portion of the fees had not been waived.
A One Choice Target Date Portfolio's target date is the approximate year when investors plan to retire or start withdrawing their money. The principal value of the investment is not guaranteed at any time, including at the target date.
Data presented reflect past performance. Past performance is no guarantee of future results. Current performance may be higher or lower than the performance shown. Total returns for periods less than one year are not annualized. Investment return and principal value will fluctuate, and redemption value may be more or less than original cost. Data assumes reinvestment of dividends and capital gains, and none of the charts reflect the deduction of taxes that a shareholder would pay on fund distributions or the redemption of fund shares. To obtain performance data current to the most recent month end, please call 1-800-345-2021 or visit americancentury.com. For additional information about the funds, please consult the prospectus.
| | |
| Growth of $10,000 Over 10 Years of One Choice 2030 Portfolio — Investor Class |
| $10,000 investment made July 31, 2013 |
| Performance for other share classes will vary due to differences in fee structure. |
| | | | | |
| Value on July 31, 2023 |
| Investor Class — $17,412 |
|
| S&P Target Date To 2030 Index — $18,440 |
|
Ending value of Investor Class would have been lower if a portion of the fees had not been waived.
| | |
| Growth of $10,000 Over 10 Years of One Choice 2035 Portfolio — Investor Class |
| $10,000 investment made July 31, 2013 |
| Performance for other share classes will vary due to differences in fee structure. |
| | | | | |
| Value on July 31, 2023 |
| Investor Class — $18,196 |
|
| S&P Target Date To 2035 Index — $19,578 |
|
Ending value of Investor Class would have been lower if a portion of the fees had not been waived.
A One Choice Target Date Portfolio's target date is the approximate year when investors plan to retire or start withdrawing their money. The principal value of the investment is not guaranteed at any time, including at the target date.
Data presented reflect past performance. Past performance is no guarantee of future results. Current performance may be higher or lower than the performance shown. Total returns for periods less than one year are not annualized. Investment return and principal value will fluctuate, and redemption value may be more or less than original cost. Data assumes reinvestment of dividends and capital gains, and none of the charts reflect the deduction of taxes that a shareholder would pay on fund distributions or the redemption of fund shares. To obtain performance data current to the most recent month end, please call 1-800-345-2021 or visit americancentury.com. For additional information about the funds, please consult the prospectus.
| | |
| Growth of $10,000 Over 10 Years of One Choice 2040 Portfolio — Investor Class |
| $10,000 investment made July 31, 2013 |
| Performance for other share classes will vary due to differences in fee structure. |
| | | | | |
| Value on July 31, 2023 |
| Investor Class — $19,051 |
|
| S&P Target Date To 2040 Index — $20,577 |
|
Ending value of Investor Class would have been lower if a portion of the fees had not been waived.
| | |
| Growth of $10,000 Over 10 Years of One Choice 2045 Portfolio — Investor Class |
| $10,000 investment made July 31, 2013 |
| Performance for other share classes will vary due to differences in fee structure. |
| | | | | |
| Value on July 31, 2023 |
| Investor Class — $19,942 |
|
| S&P Target Date To 2045 Index — $21,338 |
|
Ending value of Investor Class would have been lower if a portion of the fees had not been waived.
A One Choice Target Date Portfolio's target date is the approximate year when investors plan to retire or start withdrawing their money. The principal value of the investment is not guaranteed at any time, including at the target date.
Data presented reflect past performance. Past performance is no guarantee of future results. Current performance may be higher or lower than the performance shown. Total returns for periods less than one year are not annualized. Investment return and principal value will fluctuate, and redemption value may be more or less than original cost. Data assumes reinvestment of dividends and capital gains, and none of the charts reflect the deduction of taxes that a shareholder would pay on fund distributions or the redemption of fund shares. To obtain performance data current to the most recent month end, please call 1-800-345-2021 or visit americancentury.com. For additional information about the funds, please consult the prospectus.
| | |
| Growth of $10,000 Over 10 Years of One Choice 2050 Portfolio — Investor Class |
| $10,000 investment made July 31, 2013 |
| Performance for other share classes will vary due to differences in fee structure. |
| | | | | |
| Value on July 31, 2023 |
| Investor Class — $20,750 |
|
| S&P Target Date To 2050 Index — $21,885 |
|
Ending value of Investor Class would have been lower if a portion of the fees had not been waived.
| | |
| Growth of $10,000 Over 10 Years of One Choice 2055 Portfolio — Investor Class |
| $10,000 investment made July 31, 2013 |
| Performance for other share classes will vary due to differences in fee structure. |
| | | | | |
| Value on July 31, 2023 |
| Investor Class — $21,222 |
|
| S&P Target Date To 2055 Index — $22,105 |
|
Ending value of Investor Class would have been lower if a portion of the fees had not been waived.
A One Choice Target Date Portfolio's target date is the approximate year when investors plan to retire or start withdrawing their money. The principal value of the investment is not guaranteed at any time, including at the target date.
Data presented reflect past performance. Past performance is no guarantee of future results. Current performance may be higher or lower than the performance shown. Total returns for periods less than one year are not annualized. Investment return and principal value will fluctuate, and redemption value may be more or less than original cost. Data assumes reinvestment of dividends and capital gains, and none of the charts reflect the deduction of taxes that a shareholder would pay on fund distributions or the redemption of fund shares. To obtain performance data current to the most recent month end, please call 1-800-345-2021 or visit americancentury.com. For additional information about the funds, please consult the prospectus.
| | |
| Growth of $10,000 Over Life of One Choice 2060 Portfolio — Investor Class |
| $10,000 investment made September 30, 2015 |
| Performance for other share classes will vary due to differences in fee structure. |
| | | | | |
| Value on July 31, 2023 |
| Investor Class — $19,260 |
|
| S&P Target Date To 2060 Index — $20,613 |
|
Ending value of Investor Class would have been lower if a portion of the fees had not been waived.
| | |
| Growth of $10,000 Over Life of One Choice 2065 Portfolio — Investor Class |
| $10,000 investment made September 23, 2020 |
| Performance for other share classes will vary due to differences in fee structure. |
| | | | | |
| Value on July 31, 2023 |
| Investor Class — $12,449 |
|
| S&P Target Date To 2065+ Index — $13,592 |
|
| |
|
Ending value of Investor Class would have been lower if a portion of the fees had not been waived.
A One Choice Target Date Portfolio's target date is the approximate year when investors plan to retire or start withdrawing their money. The principal value of the investment is not guaranteed at any time, including at the target date.
Data presented reflect past performance. Past performance is no guarantee of future results. Current performance may be higher or lower than the performance shown. Total returns for periods less than one year are not annualized. Investment return and principal value will fluctuate, and redemption value may be more or less than original cost. Data assumes reinvestment of dividends and capital gains, and none of the charts reflect the deduction of taxes that a shareholder would pay on fund distributions or the redemption of fund shares. To obtain performance data current to the most recent month end, please call 1-800-345-2021 or visit americancentury.com. For additional information about the funds, please consult the prospectus.
| | | | | | | | | | | | | | | | | | | | |
| Total Annual Fund Operating Expenses | |
| Investor Class | I
Class | A
Class | C
Class | R
Class | R6 Class |
| One Choice In Retirement Portfolio | 0.79% | 0.61% | 1.04% | 1.79% | 1.29% | 0.51% |
| One Choice 2025 Portfolio | 0.80% | 0.61% | 1.05% | 1.80% | 1.30% | 0.52% |
| One Choice 2030 Portfolio | 0.82% | 0.63% | 1.07% | 1.82% | 1.32% | 0.53% |
| One Choice 2035 Portfolio | 0.85% | 0.66% | 1.10% | 1.85% | 1.35% | 0.55% |
| One Choice 2040 Portfolio | 0.88% | 0.68% | 1.13% | 1.88% | 1.38% | 0.57% |
| One Choice 2045 Portfolio | 0.90% | 0.71% | 1.15% | 1.90% | 1.40% | 0.59% |
| One Choice 2050 Portfolio | 0.92% | 0.72% | 1.17% | 1.92% | 1.42% | 0.60% |
| One Choice 2055 Portfolio | 0.93% | 0.74% | 1.18% | 1.93% | 1.43% | 0.61% |
| One Choice 2060 Portfolio | 0.94% | 0.74% | 1.19% | 1.94% | 1.44% | 0.62% |
| One Choice 2065 Portfolio | 0.95% | 0.75% | 1.20% | 1.95% | 1.45% | 0.62% |
The total annual fund operating expenses shown is as stated in the fund’s prospectus current as of the date of this report. The prospectus may vary from the expense ratio shown elsewhere in this report because it is based on a different time period, includes acquired fund fees and expenses, and, if applicable, does not include fee waivers or expense reimbursements.
A One Choice Target Date Portfolio's target date is the approximate year when investors plan to retire or start withdrawing their money. The principal value of the investment is not guaranteed at any time, including at the target date.
Data presented reflect past performance. Past performance is no guarantee of future results. Current performance may be higher or lower than the performance shown. Total returns for periods less than one year are not annualized. Investment return and principal value will fluctuate, and redemption value may be more or less than original cost. Data assumes reinvestment of dividends and capital gains, and none of the charts reflect the deduction of taxes that a shareholder would pay on fund distributions or the redemption of fund shares. To obtain performance data current to the most recent month end, please call 1-800-345-2021 or visit americancentury.com. For additional information about the funds, please consult the prospectus.
Portfolio Managers: Richard Weiss, Scott Wilson, Radu Gabudean, Vidya Rajappa and Brian Garbe
John Donner left the management team and Brian Garbe joined during the reporting period.
Performance Summary
Each of the 10 One Choice® Target Date Portfolios (the Portfolios) gained in value during the fiscal year ended July 31, 2023, with returns ranging from 3.44%* for the One Choice In Retirement Portfolio to 9.00% for the One Choice 2065 Portfolio. See pages 3-17 for more detailed performance information. The period was characterized by a hawkish approach in U.S. Federal Reserve (Fed) policy that impacted rates, the economy and markets. As interest rates rose and economic growth slowed, global bonds lost value and global equity markets sold off initially before both reversed course later in the period.
Because of the Portfolios’ strategic exposure to a variety of asset classes, a review of the financial markets helps explain much of their performance.
Market Overview
Global stocks rose over the past 12 months. After falling sharply in the second half of 2022 due to rising inflation, the Fed’s interest rate increases and the ongoing war in Ukraine, stocks staged a strong rebound from October 2022 through period-end. They benefited as inflation eased, concerns about a possible recession faded and corporate earnings mostly beat consensus expectations. Bonds finished down, having declined substantially early in the 12-month period before rebounding early in 2023. Nevertheless, stronger-than-expected economic data and the debt ceiling crisis weighed on U.S. government bonds in particular.
Portfolio Information
Each One Choice Target Date Portfolio is a fund of funds that invests in other American Century Investments mutual funds to achieve its investment objective and target asset allocation. The Schedules of Investments within this report provide underlying fund allocations for each Portfolio. A Portfolio’s target date is the approximate year when investors plan to retire and likely would stop making new investments in the fund. One Choice In Retirement Portfolio is generally intended for investors near, at or in retirement. There is no guarantee that an investment in any of the funds will provide adequate income at or through an investor’s retirement.
Each target-date Portfolio seeks the highest total return consistent with its asset mix. Over time, the asset mix and weightings are adjusted to be more conservative. In general, as the target year approaches, each Portfolio’s allocation becomes more conservative by decreasing the allocation to stock funds and increasing the allocation to bond funds and short-term investments.
Portfolio Performance
The Portfolios gained in value against a shifting backdrop for financial markets. Virtually all equity holdings across the Portfolios delivered positive absolute returns, led by Non-U.S. Intrinsic Value Fund, International Value Fund, Growth Fund and Disciplined Growth Fund. Global Real Estate Fund was the only equity holding with a negative return. On the bond side, several funds detracted on an absolute basis, most notably Inflation-Adjusted Bond Fund, International Bond Fund and Diversified Bond Fund. Conversely, Emerging Markets Debt Fund and High Income Fund posted positive returns. International Small-Mid Cap Fund and International Growth Fund underperformed their benchmarks by the widest margin, while Non-U.S. Intrinsic Value Fund and Small Cap Value Fund performed best on a relative basis.
Dynamic Risk Management Process
As of July 31, the long-term strategic glide path weightings in the near-retirement vintages of the One Choice Target Date Portfolios remained conservatively positioned. Specifically, equity allocations for In Retirement through 2050 vintages were moderately underweight equities reflecting concerns over looming recession risks.
*All fund returns referenced in this commentary are for Investor Class shares. Fund returns would have been lower if a portion of the fees had not been waived. Performance for other share classes will vary due to differences in fee structure; when Investor Class performance exceeds that of the fund’s benchmark, other share classes may not. See pages 3-12 for returns for all share classes.
| | |
| Portfolio Characteristics |
| | | | | | | | | | | | | | | | | |
| Portfolio Composition as a % of net assets as of July 31, 2023 |
| One
Choice In
Retirement
Portfolio | One
Choice
2025
Portfolio | One
Choice
2030
Portfolio | One
Choice
2035
Portfolio | One
Choice
2040
Portfolio |
| Domestic Fixed Income Funds | 44.8% | 43.1% | 37.7% | 32.4% | 27.6% |
| Domestic Equity Funds | 30.1% | 31.2% | 34.8% | 38.7% | 43.0% |
| International Fixed Income Funds | 14.2% | 14.1% | 13.7% | 12.6% | 10.6% |
| International Equity Funds | 10.9% | 11.6% | 13.8% | 16.3% | 18.8% |
| Other Assets and Liabilities | —(1) | —(1) | —(1) | —(1) | —(1) |
| | | | | | | | | | | | | | | | | |
| One
Choice
2045
Portfolio | One
Choice
2050
Portfolio | One
Choice
2055
Portfolio | One
Choice
2060
Portfolio | One
Choice
2065
Portfolio |
| Domestic Fixed Income Funds | 22.8% | 17.7% | 13.7% | 12.1% | 10.8% |
| Domestic Equity Funds | 47.3% | 52.2% | 55.9% | 57.4% | 58.5% |
| International Fixed Income Funds | 8.6% | 6.7% | 5.2% | 4.5% | 4.1% |
| International Equity Funds | 21.3% | 23.4% | 25.2% | 26.0% | 26.6% |
| Other Assets and Liabilities | —(1) | — | —(1) | —(1) | — |
(1)Category is less than 0.05% of total net assets.
Fund shareholders may incur two types of costs: (1) transaction costs, including sales charges (loads) on purchase payments and redemption/exchange fees; and (2) ongoing costs, including management fees; distribution and service (12b-1) fees; and other fund expenses. This example is intended to help you understand your ongoing costs (in dollars) of investing in your fund and to compare these costs with the ongoing cost of investing in other mutual funds.
The example is based on an investment of $1,000 made at the beginning of the period and held for the entire period from February 1, 2023 to July 31, 2023.
Actual Expenses
The table provides information about actual account values and actual expenses for each class. You may use the information, together with the amount you invested, to estimate the expenses that you paid over the period. First, identify the share class you own. Then simply divide your account value by $1,000 (for example, an $8,600 account value divided by $1,000 = 8.6), then multiply the result by the number under the heading “Expenses Paid During Period” to estimate the expenses you paid on your account during this period.
If you hold Investor Class shares of any American Century Investments mutual fund, or I Class shares of the American Century Diversified Bond Fund, in an American Century Investments account (i.e., not through a financial intermediary or employer-sponsored retirement plan account), American Century Investments may charge you a $25 annual account maintenance fee if the value of those shares is less than $10,000. We will redeem shares automatically in one of your accounts to pay the $25 fee. In determining your total eligible investment amount, we will include your investments in all personal accounts (including American Century Investments brokerage accounts) registered under your Social Security number. Personal accounts include individual accounts, joint accounts, UGMA/UTMA accounts, personal trusts, Coverdell Education Savings Accounts and IRAs (including traditional, Roth, Rollover, SEP-, SARSEP- and SIMPLE-IRAs), and certain other retirement accounts. If you have only business, business retirement, employer-sponsored or American Century Investments brokerage accounts, you are currently not subject to this fee. If you are subject to the account maintenance fee, your account value could be reduced by the fee amount.
Hypothetical Example for Comparison Purposes
The table also provides information about hypothetical account values and hypothetical expenses based on the actual expense ratio of each class of your fund and an assumed rate of return of 5% per year before expenses, which is not the actual return of a fund’s share class. The hypothetical account values and expenses may not be used to estimate the actual ending account balance or expenses you paid for the period. You may use this information to compare the ongoing costs of investing in your fund and other funds. To do so, compare this 5% hypothetical example with the 5% hypothetical examples that appear in the shareholder reports of the other funds.
Please note that the expenses shown in the table are meant to highlight your ongoing costs only and do not reflect any transactional costs, such as sales charges (loads) or redemption/exchange fees. Therefore, the table is useful in comparing ongoing costs only, and will not help you determine the relative total costs of owning different funds. In addition, if these transactional costs were included, your costs would have been higher.
| | | | | | | | | | | | | | |
| Beginning Account Value 2/1/23 | Ending Account Value 7/31/23 | Expenses Paid During Period(1) 2/1/23 - 7/31/23 | Annualized Expense Ratio(1) |
| One Choice In Retirement Portfolio |
| Actual | | | | |
| Investor Class | $1,000 | $1,029.50 | $3.72 | 0.74% |
| I Class | $1,000 | $1,030.50 | $2.72 | 0.54% |
| A Class | $1,000 | $1,028.20 | $4.98 | 0.99% |
| C Class | $1,000 | $1,024.80 | $8.74 | 1.74% |
| R Class | $1,000 | $1,027.10 | $6.23 | 1.24% |
| R6 Class | $1,000 | $1,031.70 | $1.96 | 0.39% |
| Hypothetical | | | | |
| Investor Class | $1,000 | $1,021.13 | $3.71 | 0.74% |
| I Class | $1,000 | $1,022.12 | $2.71 | 0.54% |
| A Class | $1,000 | $1,019.89 | $4.96 | 0.99% |
| C Class | $1,000 | $1,016.17 | $8.70 | 1.74% |
| R Class | $1,000 | $1,018.65 | $6.21 | 1.24% |
| R6 Class | $1,000 | $1,022.86 | $1.96 | 0.39% |
| One Choice 2025 Portfolio |
| Actual | | | | |
| Investor Class | $1,000 | $1,030.40 | $3.83 | 0.76% |
| I Class | $1,000 | $1,031.10 | $2.82 | 0.56% |
| A Class | $1,000 | $1,028.90 | $5.08 | 1.01% |
| C Class | $1,000 | $1,025.80 | $8.84 | 1.76% |
| R Class | $1,000 | $1,027.30 | $6.33 | 1.26% |
| R6 Class | $1,000 | $1,032.10 | $2.07 | 0.41% |
| Hypothetical | | | | |
| Investor Class | $1,000 | $1,021.03 | $3.81 | 0.76% |
| I Class | $1,000 | $1,022.02 | $2.81 | 0.56% |
| A Class | $1,000 | $1,019.79 | $5.06 | 1.01% |
| C Class | $1,000 | $1,016.07 | $8.80 | 1.76% |
| R Class | $1,000 | $1,018.55 | $6.31 | 1.26% |
| R6 Class | $1,000 | $1,022.76 | $2.06 | 0.41% |
(1)Expenses are equal to the class's annualized expense ratio listed in the table above, multiplied by the average account value over the period, multiplied by 181, the number of days in the most recent fiscal half-year, divided by 365, to reflect the one-half year period. Annualized expense ratio reflects actual expenses, including any applicable fee waivers or expense reimbursements and excluding any acquired fund fees and expenses.
| | | | | | | | | | | | | | |
| Beginning Account Value 2/1/23 | Ending Account Value 7/31/23 | Expenses Paid During Period(1) 2/1/23 - 7/31/23 | Annualized Expense Ratio(1) |
| One Choice 2030 Portfolio |
| Actual | | | | |
| Investor Class | $1,000 | $1,034.60 | $3.93 | 0.78% |
| I Class | $1,000 | $1,035.50 | $2.93 | 0.58% |
| A Class | $1,000 | $1,032.90 | $5.19 | 1.03% |
| C Class | $1,000 | $1,029.40 | $8.96 | 1.78% |
| R Class | $1,000 | $1,032.10 | $6.45 | 1.28% |
| R6 Class | $1,000 | $1,036.90 | $2.17 | 0.43% |
| Hypothetical | | | | |
| Investor Class | $1,000 | $1,020.93 | $3.91 | 0.78% |
| I Class | $1,000 | $1,021.92 | $2.91 | 0.58% |
| A Class | $1,000 | $1,019.69 | $5.16 | 1.03% |
| C Class | $1,000 | $1,015.97 | $8.90 | 1.78% |
| R Class | $1,000 | $1,018.45 | $6.41 | 1.28% |
| R6 Class | $1,000 | $1,022.66 | $2.16 | 0.43% |
| One Choice 2035 Portfolio |
| Actual | | | | |
| Investor Class | $1,000 | $1,039.50 | $4.10 | 0.81% |
| I Class | $1,000 | $1,040.80 | $3.09 | 0.61% |
| A Class | $1,000 | $1,038.10 | $5.36 | 1.06% |
| C Class | $1,000 | $1,034.80 | $9.13 | 1.81% |
| R Class | $1,000 | $1,036.80 | $6.62 | 1.31% |
| R6 Class | $1,000 | $1,041.00 | $2.33 | 0.46% |
| Hypothetical | | | | |
| Investor Class | $1,000 | $1,020.78 | $4.06 | 0.81% |
| I Class | $1,000 | $1,021.77 | $3.06 | 0.61% |
| A Class | $1,000 | $1,019.54 | $5.31 | 1.06% |
| C Class | $1,000 | $1,015.82 | $9.05 | 1.81% |
| R Class | $1,000 | $1,018.30 | $6.56 | 1.31% |
| R6 Class | $1,000 | $1,022.51 | $2.31 | 0.46% |
(1)Expenses are equal to the class's annualized expense ratio listed in the table above, multiplied by the average account value over the period, multiplied by 181, the number of days in the most recent fiscal half-year, divided by 365, to reflect the one-half year period. Annualized expense ratio reflects actual expenses, including any applicable fee waivers or expense reimbursements and excluding any acquired fund fees and expenses.
| | | | | | | | | | | | | | |
| Beginning Account Value 2/1/23 | Ending Account Value 7/31/23 | Expenses Paid During Period(1) 2/1/23 - 7/31/23 | Annualized Expense Ratio(1) |
| One Choice 2040 Portfolio |
| Actual | | | | |
| Investor Class | $1,000 | $1,044.20 | $4.21 | 0.83% |
| I Class | $1,000 | $1,045.00 | $3.19 | 0.63% |
| A Class | $1,000 | $1,043.40 | $5.47 | 1.08% |
| C Class | $1,000 | $1,039.40 | $9.25 | 1.83% |
| R Class | $1,000 | $1,041.80 | $6.73 | 1.33% |
| R6 Class | $1,000 | $1,046.30 | $2.44 | 0.48% |
| Hypothetical | | | | |
| Investor Class | $1,000 | $1,020.68 | $4.16 | 0.83% |
| I Class | $1,000 | $1,021.67 | $3.16 | 0.63% |
| A Class | $1,000 | $1,019.44 | $5.41 | 1.08% |
| C Class | $1,000 | $1,015.72 | $9.15 | 1.83% |
| R Class | $1,000 | $1,018.20 | $6.66 | 1.33% |
| R6 Class | $1,000 | $1,022.41 | $2.41 | 0.48% |
| One Choice 2045 Portfolio |
| Actual | | | | |
| Investor Class | $1,000 | $1,048.40 | $4.37 | 0.86% |
| I Class | $1,000 | $1,050.30 | $3.36 | 0.66% |
| A Class | $1,000 | $1,047.20 | $5.63 | 1.11% |
| C Class | $1,000 | $1,043.50 | $9.42 | 1.86% |
| R Class | $1,000 | $1,046.50 | $6.90 | 1.36% |
| R6 Class | $1,000 | $1,050.20 | $2.59 | 0.51% |
| Hypothetical | | | | |
| Investor Class | $1,000 | $1,020.53 | $4.31 | 0.86% |
| I Class | $1,000 | $1,021.52 | $3.31 | 0.66% |
| A Class | $1,000 | $1,019.29 | $5.56 | 1.11% |
| C Class | $1,000 | $1,015.57 | $9.30 | 1.86% |
| R Class | $1,000 | $1,018.05 | $6.81 | 1.36% |
| R6 Class | $1,000 | $1,022.27 | $2.56 | 0.51% |
(1)Expenses are equal to the class's annualized expense ratio listed in the table above, multiplied by the average account value over the period, multiplied by 181, the number of days in the most recent fiscal half-year, divided by 365, to reflect the one-half year period. Annualized expense ratio reflects actual expenses, including any applicable fee waivers or expense reimbursements and excluding any acquired fund fees and expenses.
| | | | | | | | | | | | | | |
| Beginning Account Value 2/1/23 | Ending Account Value 7/31/23 | Expenses Paid During Period(1) 2/1/23 - 7/31/23 | Annualized Expense Ratio(1) |
| One Choice 2050 Portfolio |
| Actual | | | | |
| Investor Class | $1,000 | $1,053.70 | $4.48 | 0.88% |
| I Class | $1,000 | $1,056.00 | $3.47 | 0.68% |
| A Class | $1,000 | $1,053.00 | $5.75 | 1.13% |
| C Class | $1,000 | $1,049.20 | $9.55 | 1.88% |
| R Class | $1,000 | $1,051.40 | $7.02 | 1.38% |
| R6 Class | $1,000 | $1,055.80 | $2.70 | 0.53% |
| Hypothetical | | | | |
| Investor Class | $1,000 | $1,020.43 | $4.41 | 0.88% |
| I Class | $1,000 | $1,021.42 | $3.41 | 0.68% |
| A Class | $1,000 | $1,019.19 | $5.66 | 1.13% |
| C Class | $1,000 | $1,015.47 | $9.39 | 1.88% |
| R Class | $1,000 | $1,017.95 | $6.90 | 1.38% |
| R6 Class | $1,000 | $1,022.17 | $2.66 | 0.53% |
| One Choice 2055 Portfolio |
| Actual | | | | |
| Investor Class | $1,000 | $1,058.70 | $4.49 | 0.88% |
| I Class | $1,000 | $1,059.40 | $3.47 | 0.68% |
| A Class | $1,000 | $1,057.40 | $5.76 | 1.13% |
| C Class | $1,000 | $1,053.00 | $9.57 | 1.88% |
| R Class | $1,000 | $1,056.00 | $7.03 | 1.38% |
| R6 Class | $1,000 | $1,060.50 | $2.71 | 0.53% |
| Hypothetical | | | | |
| Investor Class | $1,000 | $1,020.43 | $4.41 | 0.88% |
| I Class | $1,000 | $1,021.42 | $3.41 | 0.68% |
| A Class | $1,000 | $1,019.19 | $5.66 | 1.13% |
| C Class | $1,000 | $1,015.47 | $9.39 | 1.88% |
| R Class | $1,000 | $1,017.95 | $6.90 | 1.38% |
| R6 Class | $1,000 | $1,022.17 | $2.66 | 0.53% |
(1)Expenses are equal to the class's annualized expense ratio listed in the table above, multiplied by the average account value over the period, multiplied by 181, the number of days in the most recent fiscal half-year, divided by 365, to reflect the one-half year period. Annualized expense ratio reflects actual expenses, including any applicable fee waivers or expense reimbursements and excluding any acquired fund fees and expenses.
| | | | | | | | | | | | | | |
| Beginning Account Value 2/1/23 | Ending Account Value 7/31/23 | Expenses Paid During Period(1) 2/1/23 - 7/31/23 | Annualized Expense Ratio(1) |
| One Choice 2060 Portfolio |
| Actual | | | | |
| Investor Class | $1,000 | $1,061.10 | $4.50 | 0.88% |
| I Class | $1,000 | $1,061.80 | $3.48 | 0.68% |
| A Class | $1,000 | $1,058.90 | $5.77 | 1.13% |
| C Class | $1,000 | $1,054.80 | $9.58 | 1.88% |
| R Class | $1,000 | $1,058.20 | $7.04 | 1.38% |
| R6 Class | $1,000 | $1,062.40 | $2.71 | 0.53% |
| Hypothetical | | | | |
| Investor Class | $1,000 | $1,020.43 | $4.41 | 0.88% |
| I Class | $1,000 | $1,021.42 | $3.41 | 0.68% |
| A Class | $1,000 | $1,019.19 | $5.66 | 1.13% |
| C Class | $1,000 | $1,015.47 | $9.39 | 1.88% |
| R Class | $1,000 | $1,017.95 | $6.90 | 1.38% |
| R6 Class | $1,000 | $1,022.17 | $2.66 | 0.53% |
| One Choice 2065 Portfolio |
| Actual | | | | |
| Investor Class | $1,000 | $1,061.70 | $4.50 | 0.88% |
| I Class | $1,000 | $1,062.70 | $3.48 | 0.68% |
| A Class | $1,000 | $1,060.90 | $5.77 | 1.13% |
| C Class | $1,000 | $1,057.10 | $9.59 | 1.88% |
| R Class | $1,000 | $1,058.90 | $7.04 | 1.38% |
| R6 Class | $1,000 | $1,063.60 | $2.71 | 0.53% |
| Hypothetical | | | | |
| Investor Class | $1,000 | $1,020.43 | $4.41 | 0.88% |
| I Class | $1,000 | $1,021.42 | $3.41 | 0.68% |
| A Class | $1,000 | $1,019.19 | $5.66 | 1.13% |
| C Class | $1,000 | $1,015.47 | $9.39 | 1.88% |
| R Class | $1,000 | $1,017.95 | $6.90 | 1.38% |
| R6 Class | $1,000 | $1,022.17 | $2.66 | 0.53% |
(1)Expenses are equal to the class's annualized expense ratio listed in the table above, multiplied by the average account value over the period, multiplied by 181, the number of days in the most recent fiscal half-year, divided by 365, to reflect the one-half year period. Annualized expense ratio reflects actual expenses, including any applicable fee waivers or expense reimbursements and excluding any acquired fund fees and expenses.
JULY 31, 2023
One Choice In Retirement Portfolio
| | | | | | | | |
| Shares | Value |
UNDERLYING FUNDS(1) — 100.0% | | |
| Domestic Fixed Income Funds — 44.8% | | |
| Diversified Bond Fund G Class | 42,735,671 | | $ | 392,740,817 | |
| High Income Fund G Class | 8,514,763 | | 70,927,973 | |
| Inflation-Adjusted Bond Fund G Class | 6,172,462 | | 65,181,198 | |
| Short Duration Fund G Class | 15,863,937 | | 153,086,990 | |
| Short Duration Inflation Protection Bond Fund G Class | 14,163,842 | | 143,196,439 | |
| | 825,133,417 | |
| Domestic Equity Funds — 30.1% | | |
| Disciplined Growth Fund G Class | 2,001,769 | | 45,500,207 | |
| Focused Large Cap Value Fund G Class | 14,630,084 | | 147,324,950 | |
| Growth Fund G Class | 1,381,717 | | 67,787,030 | |
Heritage Fund G Class(2) | 1,273,668 | | 32,007,265 | |
| Mid Cap Value Fund G Class | 3,296,225 | | 53,168,109 | |
| Small Cap Growth Fund G Class | 808,445 | | 16,637,795 | |
| Small Cap Value Fund G Class | 1,661,693 | | 17,231,752 | |
| Sustainable Equity Fund G Class | 3,777,590 | | 175,129,088 | |
| | 554,786,196 | |
| International Fixed Income Funds — 14.2% | | |
| Emerging Markets Debt Fund G Class | 2,510,498 | | 22,569,373 | |
| Global Bond Fund G Class | 22,822,648 | | 196,274,775 | |
International Bond Fund G Class(2) | 3,989,816 | | 43,289,500 | |
| | 262,133,648 | |
| International Equity Funds — 10.9% | | |
| Global Real Estate Fund G Class | 1,427,911 | | 17,063,539 | |
International Growth Fund G Class(2) | 6,487,840 | | 80,514,089 | |
| International Small-Mid Cap Fund G Class | 1,003,238 | | 9,741,442 | |
| International Value Fund G Class | 11,031,818 | | 93,549,818 | |
| | 200,868,888 | |
TOTAL INVESTMENT SECURITIES — 100.0% (Cost $1,681,314,913) | | 1,842,922,149 | |
OTHER ASSETS AND LIABILITIES† | | (1,660) | |
| TOTAL NET ASSETS — 100.0% | | $ | 1,842,920,489 | |
| | | | | | | | |
| NOTES TO SCHEDULE OF INVESTMENTS |
†Category is less than 0.05% of total net assets.
(1)Investments are funds within the American Century Investments family of funds and are considered affiliated funds.
(2)Non-income producing.
See Notes to Financial Statements.
JULY 31, 2023
One Choice 2025 Portfolio
| | | | | | | | |
| Shares | Value |
UNDERLYING FUNDS(1) — 100.0% | | |
| Domestic Fixed Income Funds — 43.1% | | |
| Diversified Bond Fund G Class | 41,046,126 | | $ | 377,213,899 | |
| High Income Fund G Class | 8,626,421 | | 71,858,086 | |
| Inflation-Adjusted Bond Fund G Class | 6,558,132 | | 69,253,872 | |
| Short Duration Fund G Class | 13,459,490 | | 129,884,079 | |
| Short Duration Inflation Protection Bond Fund G Class | 11,844,657 | | 119,749,479 | |
| | 767,959,415 | |
| Domestic Equity Funds — 31.2% | | |
| Disciplined Growth Fund G Class | 2,055,526 | | 46,722,116 | |
| Focused Large Cap Value Fund G Class | 14,310,822 | | 144,109,983 | |
| Growth Fund G Class | 1,411,243 | | 69,235,588 | |
Heritage Fund G Class(2) | 1,334,167 | | 33,527,625 | |
| Mid Cap Value Fund G Class | 3,419,850 | | 55,162,179 | |
| Small Cap Growth Fund G Class | 811,810 | | 16,707,054 | |
| Small Cap Value Fund G Class | 1,662,407 | | 17,239,161 | |
| Sustainable Equity Fund G Class | 3,731,860 | | 173,009,044 | |
| | 555,712,750 | |
| International Fixed Income Funds — 14.1% | | |
| Emerging Markets Debt Fund G Class | 2,896,806 | | 26,042,289 | |
| Global Bond Fund G Class | 21,496,913 | | 184,873,454 | |
International Bond Fund G Class(2) | 3,701,664 | | 40,163,055 | |
| | 251,078,798 | |
| International Equity Funds — 11.6% | | |
| Emerging Markets Fund G Class | 376,854 | | 4,073,794 | |
| Global Real Estate Fund G Class | 1,498,088 | | 17,902,153 | |
International Growth Fund G Class(2) | 6,404,837 | | 79,484,028 | |
| International Small-Mid Cap Fund G Class | 1,204,583 | | 11,696,496 | |
| International Value Fund G Class | 10,545,610 | | 89,426,771 | |
| Non-U.S. Intrinsic Value Fund G Class | 331,566 | | 3,527,865 | |
| | 206,111,107 | |
TOTAL INVESTMENT SECURITIES — 100.0% (Cost $1,617,416,029) | | 1,780,862,070 | |
OTHER ASSETS AND LIABILITIES† | | (17,687) | |
| TOTAL NET ASSETS — 100.0% | | $ | 1,780,844,383 | |
| | | | | | | | |
| NOTES TO SCHEDULE OF INVESTMENTS |
†Category is less than 0.05% of total net assets.
(1)Investments are funds within the American Century Investments family of funds and are considered affiliated funds.
(2)Non-income producing.
See Notes to Financial Statements.
JULY 31, 2023
One Choice 2030 Portfolio
| | | | | | | | |
| Shares | Value |
UNDERLYING FUNDS(1) — 100.0% | | |
| Domestic Fixed Income Funds — 37.7% | | |
| Diversified Bond Fund G Class | 38,893,227 | | $ | 357,428,753 | |
| High Income Fund G Class | 9,210,377 | | 76,722,443 | |
| Inflation-Adjusted Bond Fund G Class | 7,437,761 | | 78,542,759 | |
| Short Duration Fund G Class | 7,809,254 | | 75,359,302 | |
| Short Duration Inflation Protection Bond Fund G Class | 6,444,233 | | 65,151,194 | |
| | 653,204,451 | |
| Domestic Equity Funds — 34.8% | | |
| Disciplined Growth Fund G Class | 2,186,728 | | 49,704,329 | |
Focused Dynamic Growth Fund G Class(2) | 87,117 | | 4,358,454 | |
| Focused Large Cap Value Fund G Class | 14,727,952 | | 148,310,480 | |
| Growth Fund G Class | 1,605,810 | | 78,781,060 | |
Heritage Fund G Class(2) | 1,690,193 | | 42,474,552 | |
| Mid Cap Value Fund G Class | 3,950,905 | | 63,728,101 | |
| Small Cap Growth Fund G Class | 885,315 | | 18,219,777 | |
| Small Cap Value Fund G Class | 1,818,309 | | 18,855,863 | |
| Sustainable Equity Fund G Class | 3,869,793 | | 179,403,581 | |
| | 603,836,197 | |
| International Equity Funds — 13.8% | | |
| Emerging Markets Fund G Class | 1,659,814 | | 17,942,587 | |
| Global Real Estate Fund G Class | 1,776,827 | | 21,233,083 | |
International Growth Fund G Class(2) | 6,858,613 | | 85,115,392 | |
| International Small-Mid Cap Fund G Class | 1,853,705 | | 17,999,474 | |
| International Value Fund G Class | 9,871,200 | | 83,707,773 | |
| Non-U.S. Intrinsic Value Fund G Class | 1,301,511 | | 13,848,076 | |
| | 239,846,385 | |
| International Fixed Income Funds — 13.7% | | |
| Emerging Markets Debt Fund G Class | 3,910,958 | | 35,159,510 | |
| Global Bond Fund G Class | 19,594,656 | | 168,514,042 | |
International Bond Fund G Class(2) | 3,154,023 | | 34,221,145 | |
| | 237,894,697 | |
TOTAL INVESTMENT SECURITIES — 100.0% (Cost $1,594,989,088) | | 1,734,781,730 | |
OTHER ASSETS AND LIABILITIES† | | (71) | |
| TOTAL NET ASSETS — 100.0% | | $ | 1,734,781,659 | |
| | | | | | | | |
| NOTES TO SCHEDULE OF INVESTMENTS |
†Category is less than 0.05% of total net assets.
(1)Investments are funds within the American Century Investments family of funds and are considered affiliated funds.
(2)Non-income producing.
See Notes to Financial Statements.
JULY 31, 2023
One Choice 2035 Portfolio
| | | | | | | | |
| Shares | Value |
UNDERLYING FUNDS(1) — 100.0% | | |
| Domestic Equity Funds — 38.7% | | |
| Disciplined Growth Fund G Class | 2,267,559 | | $ | 51,541,616 | |
Focused Dynamic Growth Fund G Class(2) | 369,684 | | 18,495,273 | |
| Focused Large Cap Value Fund G Class | 17,693,790 | | 178,176,464 | |
| Growth Fund G Class | 2,077,640 | | 101,929,037 | |
Heritage Fund G Class(2) | 2,567,540 | | 64,522,276 | |
| Mid Cap Value Fund G Class | 5,446,679 | | 87,854,928 | |
| Small Cap Growth Fund G Class | 1,109,956 | | 22,842,902 | |
| Small Cap Value Fund G Class | 2,281,642 | | 23,660,626 | |
| Sustainable Equity Fund G Class | 4,677,629 | | 216,854,892 | |
| | 765,878,014 | |
| Domestic Fixed Income Funds — 32.4% | | |
| Diversified Bond Fund G Class | 41,751,211 | | 383,693,630 | |
| High Income Fund G Class | 10,801,937 | | 89,980,131 | |
| Inflation-Adjusted Bond Fund G Class | 8,389,240 | | 88,590,376 | |
| Short Duration Fund G Class | 4,560,255 | | 44,006,458 | |
| Short Duration Inflation Protection Bond Fund G Class | 3,554,396 | | 35,934,942 | |
| | 642,205,537 | |
| International Equity Funds — 16.3% | | |
| Emerging Markets Fund G Class | 3,906,347 | | 42,227,616 | |
| Global Real Estate Fund G Class | 2,503,149 | | 29,912,628 | |
International Growth Fund G Class(2) | 8,388,189 | | 104,097,423 | |
| International Small-Mid Cap Fund G Class | 3,021,392 | | 29,337,717 | |
| International Value Fund G Class | 10,572,101 | | 89,651,420 | |
| Non-U.S. Intrinsic Value Fund G Class | 2,703,982 | | 28,770,368 | |
| | 323,997,172 | |
| International Fixed Income Funds — 12.6% | | |
| Emerging Markets Debt Fund G Class | 5,301,122 | | 47,657,089 | |
| Global Bond Fund G Class | 20,149,581 | | 173,286,396 | |
International Bond Fund G Class(2) | 2,619,280 | | 28,419,184 | |
| | 249,362,669 | |
TOTAL INVESTMENT SECURITIES — 100.0% (Cost $1,774,520,104) | | 1,981,443,392 | |
OTHER ASSETS AND LIABILITIES† | | (13,627) | |
| TOTAL NET ASSETS — 100.0% | | $ | 1,981,429,765 | |
| | | | | | | | |
| NOTES TO SCHEDULE OF INVESTMENTS |
†Category is less than 0.05% of total net assets.
(1)Investments are funds within the American Century Investments family of funds and are considered affiliated funds.
(2)Non-income producing.
See Notes to Financial Statements.
JULY 31, 2023
One Choice 2040 Portfolio
| | | | | | | | |
| Shares | Value |
UNDERLYING FUNDS(1) — 100.0% | | |
| Domestic Equity Funds — 43.0% | | |
| Disciplined Growth Fund G Class | 1,373,367 | | $ | 31,216,643 | |
Focused Dynamic Growth Fund G Class(2) | 507,481 | | 25,389,299 | |
| Focused Large Cap Value Fund G Class | 13,707,658 | | 138,036,112 | |
| Growth Fund G Class | 1,681,414 | | 82,490,173 | |
Heritage Fund G Class(2) | 2,469,561 | | 62,060,067 | |
| Mid Cap Value Fund G Class | 4,701,338 | | 75,832,575 | |
| Small Cap Growth Fund G Class | 879,807 | | 18,106,430 | |
| Small Cap Value Fund G Class | 1,808,489 | | 18,754,031 | |
| Sustainable Equity Fund G Class | 3,580,648 | | 165,998,854 | |
| | 617,884,184 | |
| Domestic Fixed Income Funds — 27.6% | | |
| Diversified Bond Fund G Class | 28,259,923 | | 259,708,695 | |
| High Income Fund G Class | 7,658,003 | | 63,791,168 | |
| Inflation-Adjusted Bond Fund G Class | 5,179,097 | | 54,691,260 | |
| Short Duration Fund G Class | 1,099,816 | | 10,613,224 | |
| Short Duration Inflation Protection Bond Fund G Class | 846,446 | | 8,557,568 | |
| | 397,361,915 | |
| International Equity Funds — 18.8% | | |
| Emerging Markets Fund G Class | 4,791,239 | | 51,793,290 | |
| Global Real Estate Fund G Class | 2,113,808 | | 25,260,010 | |
International Growth Fund G Class(2) | 6,437,777 | | 79,892,818 | |
| International Small-Mid Cap Fund G Class | 2,708,293 | | 26,297,525 | |
| International Value Fund G Class | 6,670,423 | | 56,565,191 | |
| Non-U.S. Intrinsic Value Fund G Class | 2,933,834 | | 31,215,989 | |
| | 271,024,823 | |
| International Fixed Income Funds — 10.6% | | |
| Emerging Markets Debt Fund G Class | 4,066,547 | | 36,558,258 | |
| Global Bond Fund G Class | 12,685,978 | | 109,099,407 | |
International Bond Fund G Class(2) | 621,852 | | 6,747,094 | |
| | 152,404,759 | |
TOTAL INVESTMENT SECURITIES — 100.0% (Cost $1,292,226,408) | | 1,438,675,681 | |
OTHER ASSETS AND LIABILITIES† | | (3,185) | |
| TOTAL NET ASSETS — 100.0% | | $ | 1,438,672,496 | |
| | | | | | | | |
| NOTES TO SCHEDULE OF INVESTMENTS |
†Category is less than 0.05% of total net assets.
(1)Investments are funds within the American Century Investments family of funds and are considered affiliated funds.
(2)Non-income producing.
See Notes to Financial Statements.
JULY 31, 2023
One Choice 2045 Portfolio
| | | | | | | | |
| Shares | Value |
UNDERLYING FUNDS(1) — 100.0% | | |
| Domestic Equity Funds — 47.3% | | |
| Disciplined Growth Fund G Class | 1,028,419 | | $ | 23,375,958 | |
Focused Dynamic Growth Fund G Class(2) | 807,872 | | 40,417,832 | |
| Focused Large Cap Value Fund G Class | 15,507,834 | | 156,163,893 | |
| Growth Fund G Class | 1,928,283 | | 94,601,584 | |
Heritage Fund G Class(2) | 3,224,613 | | 81,034,526 | |
| Mid Cap Value Fund G Class | 5,693,835 | | 91,841,556 | |
| Small Cap Growth Fund G Class | 991,308 | | 20,401,109 | |
| Small Cap Value Fund G Class | 2,008,192 | | 20,824,951 | |
| Sustainable Equity Fund G Class | 3,988,480 | | 184,905,928 | |
| | 713,567,337 | |
| Domestic Fixed Income Funds — 22.8% | | |
| Diversified Bond Fund G Class | 25,839,140 | | 237,461,698 | |
| High Income Fund G Class | 7,151,548 | | 59,572,392 | |
| Inflation-Adjusted Bond Fund G Class | 4,431,412 | | 46,795,708 | |
| | 343,829,798 | |
| International Equity Funds — 21.3% | | |
| Emerging Markets Fund G Class | 6,968,278 | | 75,327,087 | |
| Global Real Estate Fund G Class | 2,547,210 | | 30,439,158 | |
International Growth Fund G Class(2) | 7,066,214 | | 87,691,712 | |
| International Small-Mid Cap Fund G Class | 3,350,948 | | 32,537,710 | |
| International Value Fund G Class | 6,519,297 | | 55,283,636 | |
| Non-U.S. Intrinsic Value Fund G Class | 3,733,404 | | 39,723,421 | |
| | 321,002,724 | |
| International Fixed Income Funds — 8.6% | | |
| Emerging Markets Debt Fund G Class | 3,964,315 | | 35,639,190 | |
| Global Bond Fund G Class | 11,042,801 | | 94,968,088 | |
| | 130,607,278 | |
TOTAL INVESTMENT SECURITIES — 100.0% (Cost $1,311,832,679) | | 1,509,007,137 | |
OTHER ASSETS AND LIABILITIES† | | (1) | |
| TOTAL NET ASSETS — 100.0% | | $ | 1,509,007,136 | |
| | | | | | | | |
| NOTES TO SCHEDULE OF INVESTMENTS |
†Category is less than 0.05% of total net assets.
(1)Investments are funds within the American Century Investments family of funds and are considered affiliated funds.
(2)Non-income producing.
See Notes to Financial Statements.
JULY 31, 2023
One Choice 2050 Portfolio
| | | | | | | | |
| Shares | Value |
UNDERLYING FUNDS(1) — 100.0% | | |
| Domestic Equity Funds — 52.2% | | |
| Disciplined Growth Fund G Class | 414,924 | | $ | 9,431,219 | |
Focused Dynamic Growth Fund G Class(2) | 888,186 | | 44,435,946 | |
| Focused Large Cap Value Fund G Class | 13,047,240 | | 131,385,708 | |
| Growth Fund G Class | 1,625,635 | | 79,753,637 | |
Heritage Fund G Class(2) | 2,720,193 | | 68,358,462 | |
| Mid Cap Value Fund G Class | 4,832,355 | | 77,945,879 | |
| Small Cap Growth Fund G Class | 830,676 | | 17,095,307 | |
| Small Cap Value Fund G Class | 1,718,068 | | 17,816,366 | |
| Sustainable Equity Fund G Class | 3,351,156 | | 155,359,584 | |
| | 601,582,108 | |
| International Equity Funds — 23.4% | | |
| Emerging Markets Fund G Class | 5,877,561 | | 63,536,431 | |
| Global Real Estate Fund G Class | 2,143,493 | | 25,614,737 | |
International Growth Fund G Class(2) | 5,905,008 | | 73,281,146 | |
| International Small-Mid Cap Fund G Class | 2,785,094 | | 27,043,266 | |
| International Value Fund G Class | 5,001,733 | | 42,414,695 | |
| Non-U.S. Intrinsic Value Fund G Class | 3,514,284 | | 37,391,979 | |
| | 269,282,254 | |
| Domestic Fixed Income Funds — 17.7% | | |
| Diversified Bond Fund G Class | 15,405,816 | | 141,579,452 | |
| High Income Fund G Class | 4,196,926 | | 34,960,395 | |
| Inflation-Adjusted Bond Fund G Class | 2,616,807 | | 27,633,487 | |
| | 204,173,334 | |
| International Fixed Income Funds — 6.7% | | |
| Emerging Markets Debt Fund G Class | 2,307,152 | | 20,741,294 | |
| Global Bond Fund G Class | 6,507,340 | | 55,963,128 | |
| | 76,704,422 | |
TOTAL INVESTMENT SECURITIES — 100.0% (Cost $1,014,882,942) | | 1,151,742,118 | |
| OTHER ASSETS AND LIABILITIES | | — | |
| TOTAL NET ASSETS — 100.0% | | $ | 1,151,742,118 | |
| | | | | | | | |
| NOTES TO SCHEDULE OF INVESTMENTS |
(1)Investments are funds within the American Century Investments family of funds and are considered affiliated funds.
(2)Non-income producing.
See Notes to Financial Statements.
JULY 31, 2023
One Choice 2055 Portfolio
| | | | | | | | |
| Shares | Value |
UNDERLYING FUNDS(1) — 100.0% | | |
| Domestic Equity Funds — 55.9% | | |
Focused Dynamic Growth Fund G Class(2) | 804,272 | | $ | 40,237,717 | |
| Focused Large Cap Value Fund G Class | 9,793,369 | | 98,619,227 | |
| Growth Fund G Class | 1,222,720 | | 59,986,628 | |
Heritage Fund G Class(2) | 2,038,480 | | 51,227,008 | |
| Mid Cap Value Fund G Class | 3,608,768 | | 58,209,425 | |
| Small Cap Growth Fund G Class | 615,328 | | 12,663,455 | |
| Small Cap Value Fund G Class | 1,302,416 | | 13,506,051 | |
| Sustainable Equity Fund G Class | 2,522,648 | | 116,949,983 | |
| | 451,399,494 | |
| International Equity Funds — 25.2% | | |
| Emerging Markets Fund G Class | 4,429,812 | | 47,886,267 | |
| Global Real Estate Fund G Class | 1,614,438 | | 19,292,536 | |
International Growth Fund G Class(2) | 4,450,263 | | 55,227,766 | |
| International Small-Mid Cap Fund G Class | 2,118,215 | | 20,567,871 | |
| International Value Fund G Class | 3,568,753 | | 30,263,025 | |
| Non-U.S. Intrinsic Value Fund G Class | 2,830,661 | | 30,118,230 | |
| | 203,355,695 | |
| Domestic Fixed Income Funds — 13.7% | | |
| Diversified Bond Fund G Class | 8,388,853 | | 77,093,556 | |
| High Income Fund G Class | 2,273,915 | | 18,941,712 | |
| Inflation-Adjusted Bond Fund G Class | 1,422,351 | | 15,020,026 | |
| | 111,055,294 | |
| International Fixed Income Funds — 5.2% | | |
| Emerging Markets Debt Fund G Class | 1,253,667 | | 11,270,466 | |
| Global Bond Fund G Class | 3,533,350 | | 30,386,813 | |
| | 41,657,279 | |
TOTAL INVESTMENT SECURITIES — 100.0% (Cost $717,597,288) | | 807,467,762 | |
OTHER ASSETS AND LIABILITIES† | | (931) | |
| TOTAL NET ASSETS — 100.0% | | $ | 807,466,831 | |
| | | | | | | | |
| NOTES TO SCHEDULE OF INVESTMENTS |
†Category is less than 0.05% of total net assets.
(1)Investments are funds within the American Century Investments family of funds and are considered affiliated funds.
(2)Non-income producing.
See Notes to Financial Statements.
JULY 31, 2023
One Choice 2060 Portfolio
| | | | | | | | |
| Shares | Value |
UNDERLYING FUNDS(1) — 100.0% | | |
| Domestic Equity Funds — 57.4% | | |
Focused Dynamic Growth Fund G Class(2) | 410,447 | | $ | 20,534,673 | |
| Focused Large Cap Value Fund G Class | 5,045,258 | | 50,805,750 | |
| Growth Fund G Class | 624,803 | | 30,652,820 | |
Heritage Fund G Class(2) | 1,039,591 | | 26,124,933 | |
| Mid Cap Value Fund G Class | 1,850,220 | | 29,844,051 | |
| Small Cap Growth Fund G Class | 317,915 | | 6,542,695 | |
| Small Cap Value Fund G Class | 663,008 | | 6,875,392 | |
| Sustainable Equity Fund G Class | 1,289,302 | | 59,772,054 | |
| | 231,152,368 | |
| International Equity Funds — 26.0% | | |
| Emerging Markets Fund G Class | 2,275,295 | | 24,595,936 | |
| Global Real Estate Fund G Class | 831,278 | | 9,933,771 | |
International Growth Fund G Class(2) | 2,305,356 | | 28,609,469 | |
| International Small-Mid Cap Fund G Class | 1,094,655 | | 10,629,101 | |
| International Value Fund G Class | 1,774,724 | | 15,049,657 | |
| Non-U.S. Intrinsic Value Fund G Class | 1,493,751 | | 15,893,507 | |
| | 104,711,441 | |
| Domestic Fixed Income Funds — 12.1% | | |
| Diversified Bond Fund G Class | 3,650,043 | | 33,543,897 | |
| High Income Fund G Class | 1,005,727 | | 8,377,709 | |
| Inflation-Adjusted Bond Fund G Class | 628,820 | | 6,640,334 | |
| | 48,561,940 | |
| International Fixed Income Funds — 4.5% | | |
| Emerging Markets Debt Fund G Class | 555,001 | | 4,989,460 | |
| Global Bond Fund G Class | 1,551,433 | | 13,342,326 | |
| | 18,331,786 | |
TOTAL INVESTMENT SECURITIES — 100.0% (Cost $371,934,203) | | 402,757,535 | |
OTHER ASSETS AND LIABILITIES† | | (129) | |
| TOTAL NET ASSETS — 100.0% | | $ | 402,757,406 | |
| | | | | | | | |
| NOTES TO SCHEDULE OF INVESTMENTS |
†Category is less than 0.05% of total net assets.
(1)Investments are funds within the American Century Investments family of funds and are considered affiliated funds.
(2)Non-income producing.
See Notes to Financial Statements.
JULY 31, 2023
One Choice 2065 Portfolio
| | | | | | | | |
| Shares | Value |
UNDERLYING FUNDS(1) — 100.0% | | |
| Domestic Equity Funds — 58.5% | | |
Focused Dynamic Growth Fund G Class(2) | 53,997 | | $ | 2,701,457 | |
| Focused Large Cap Value Fund G Class | 663,385 | | 6,680,290 | |
| Growth Fund G Class | 82,915 | | 4,067,790 | |
Heritage Fund G Class(2) | 137,035 | | 3,443,686 | |
| Mid Cap Value Fund G Class | 243,781 | | 3,932,189 | |
| Small Cap Growth Fund G Class | 41,947 | | 863,268 | |
| Small Cap Value Fund G Class | 84,225 | | 873,417 | |
| Sustainable Equity Fund G Class | 170,049 | | 7,883,464 | |
| | 30,445,561 | |
| International Equity Funds — 26.6% | | |
| Emerging Markets Fund G Class | 303,514 | | 3,280,986 | |
| Global Real Estate Fund G Class | 109,124 | | 1,304,028 | |
International Growth Fund G Class(2) | 304,395 | | 3,777,540 | |
| International Small-Mid Cap Fund G Class | 144,373 | | 1,401,860 | |
| International Value Fund G Class | 227,487 | | 1,929,085 | |
| Non-U.S. Intrinsic Value Fund G Class | 199,420 | | 2,121,833 | |
| | 13,815,332 | |
| Domestic Fixed Income Funds — 10.8% | | |
| Diversified Bond Fund G Class | 421,660 | | 3,875,058 | |
| High Income Fund G Class | 117,326 | | 977,326 | |
| Inflation-Adjusted Bond Fund G Class | 72,898 | | 769,808 | |
| | 5,622,192 | |
| International Fixed Income Funds — 4.1% | | |
| Emerging Markets Debt Fund G Class | 64,751 | | 582,109 | |
| Global Bond Fund G Class | 179,877 | | 1,546,942 | |
| | 2,129,051 | |
TOTAL INVESTMENT SECURITIES — 100.0% (Cost $50,013,975) | | 52,012,136 | |
| OTHER ASSETS AND LIABILITIES | | — | |
| TOTAL NET ASSETS — 100.0% | | $ | 52,012,136 | |
| | | | | | | | |
| NOTES TO SCHEDULE OF INVESTMENTS |
(1)Investments are funds within the American Century Investments family of funds and are considered affiliated funds.
(2)Non-income producing.
See Notes to Financial Statements.
| | |
| Statements of Assets and Liabilities |
| | | | | | | | |
| JULY 31, 2023 | | |
| One Choice In
Retirement
Portfolio | One Choice
2025 Portfolio |
| Assets | | |
| Investment securities in affiliates, at value (cost of $1,681,314,913 and $1,617,416,029, respectively) | $ | 1,842,922,149 | | $ | 1,780,862,070 | |
| Receivable for investments sold | 2,807,930 | | 3,468,537 | |
| Receivable for capital shares sold | 873,795 | | 755,673 | |
| Distributions receivable from affiliates | 2,331,738 | | 2,203,244 | |
| 1,848,935,612 | | 1,787,289,524 | |
| | |
| Liabilities | | |
| Payable for investments purchased | 2,331,738 | | 2,203,244 | |
| Payable for capital shares redeemed | 2,560,324 | | 3,144,533 | |
| Accrued management fees | 983,977 | | 958,578 | |
| Distribution and service fees payable | 139,084 | | 138,786 | |
| 6,015,123 | | 6,445,141 | |
| | |
| Net Assets | $ | 1,842,920,489 | | $ | 1,780,844,383 | |
| | |
| Net Assets Consist of: | | |
| Capital (par value and paid-in surplus) | $ | 1,675,033,140 | | $ | 1,588,609,187 | |
| Distributable earnings (loss) | 167,887,349 | | 192,235,196 | |
| $ | 1,842,920,489 | | $ | 1,780,844,383 | |
| | | | | | | | | | | |
| Fund/Class | Net Assets | Shares Outstanding | Net Asset Value Per Share* |
| One Choice In Retirement Portfolio |
| Investor Class, $0.01 Par Value | $748,717,140 | 62,304,712 | $12.02 |
| I Class, $0.01 Par Value | $237,898,126 | 19,791,885 | $12.02 |
| A Class, $0.01 Par Value | $190,934,251 | 15,885,650 | $12.02 |
| C Class, $0.01 Par Value | $1,961,794 | 165,127 | $11.88 |
| R Class, $0.01 Par Value | $230,484,509 | 19,235,884 | $11.98 |
| R6 Class, $0.01 Par Value | $432,924,669 | 46,755,892 | $9.26 |
| One Choice 2025 Portfolio |
| Investor Class, $0.01 Par Value | $636,548,908 | 46,917,977 | $13.57 |
| I Class, $0.01 Par Value | $245,803,393 | 18,098,916 | $13.58 |
| A Class, $0.01 Par Value | $158,130,113 | 11,667,980 | $13.55 |
| C Class, $0.01 Par Value | $1,873,844 | 138,514 | $13.53 |
| R Class, $0.01 Par Value | $245,508,641 | 18,143,576 | $13.53 |
| R6 Class, $0.01 Par Value | $492,979,484 | 51,087,125 | $9.65 |
*Maximum offering price per share was equal to the net asset value per share for all share classes, except A Class, for which the maximum offering price per share was $12.75 and $14.38 (net asset value divided by 0.9425) for One Choice In Retirement Portfolio and One Choice 2025 Portfolio, respectively. A contingent deferred sales charge may be imposed on redemptions of A Class and C Class.
See Notes to Financial Statements.
| | | | | | | | |
| JULY 31, 2023 | | |
| One Choice
2030 Portfolio | One Choice
2035 Portfolio |
| Assets | | |
| Investment securities in affiliates, at value (cost of $1,594,989,088 and $1,774,520,104, respectively) | $ | 1,734,781,730 | | $ | 1,981,443,392 | |
| Receivable for investments sold | 2,051,182 | | 3,353,257 | |
| Receivable for capital shares sold | 1,817,811 | | 1,449,811 | |
| Distributions receivable from affiliates | 1,953,732 | | 2,015,232 | |
| 1,740,604,455 | | 1,988,261,692 | |
| | |
| Liabilities | | |
| Payable for investments purchased | 1,953,732 | | 2,015,232 | |
| Payable for capital shares redeemed | 2,780,895 | | 3,501,461 | |
| Accrued management fees | 916,467 | | 1,128,079 | |
| Distribution and service fees payable | 171,702 | | 187,155 | |
| 5,822,796 | | 6,831,927 | |
| | |
| Net Assets | $ | 1,734,781,659 | | $ | 1,981,429,765 | |
| | |
| Net Assets Consist of: | | |
| Capital (par value and paid-in surplus) | $ | 1,590,544,780 | | $ | 1,764,646,439 | |
| Distributable earnings (loss) | 144,236,879 | | 216,783,326 | |
| $ | 1,734,781,659 | | $ | 1,981,429,765 | |
| | | | | | | | | | | |
| Fund/Class | Net Assets | Shares Outstanding | Net Asset Value Per Share* |
| One Choice 2030 Portfolio | | | |
| Investor Class, $0.01 Par Value | $381,503,389 | 31,907,294 | $11.96 |
| I Class, $0.01 Par Value | $284,715,441 | 23,808,369 | $11.96 |
| A Class, $0.01 Par Value | $151,848,578 | 12,736,810 | $11.92 |
| C Class, $0.01 Par Value | $2,085,295 | 175,048 | $11.91 |
| R Class, $0.01 Par Value | $327,843,312 | 27,516,258 | $11.91 |
| R6 Class, $0.01 Par Value | $586,785,644 | 55,007,489 | $10.67 |
| One Choice 2035 Portfolio | | | |
| Investor Class, $0.01 Par Value | $572,770,484 | 37,522,620 | $15.26 |
| I Class, $0.01 Par Value | $277,987,523 | 18,174,691 | $15.30 |
| A Class, $0.01 Par Value | $185,742,417 | 12,181,142 | $15.25 |
| C Class, $0.01 Par Value | $1,070,942 | 70,563 | $15.18 |
| R Class, $0.01 Par Value | $349,839,880 | 22,967,068 | $15.23 |
| R6 Class, $0.01 Par Value | $594,018,519 | 59,936,861 | $9.91 |
*Maximum offering price per share was equal to the net asset value per share for all share classes, except A Class, for which the maximum offering price per share was $12.65 and $16.18 (net asset value divided by 0.9425) for One Choice 2030 Portfolio and One Choice 2035 Portfolio, respectively. A contingent deferred sales charge may be imposed on redemptions of A Class and C Class.
See Notes to Financial Statements.
| | | | | | | | |
| JULY 31, 2023 | | |
| One Choice
2040 Portfolio | One Choice
2045 Portfolio |
| Assets | | |
| Investment securities in affiliates, at value (cost of $1,292,226,408 and $1,311,832,679, respectively) | $ | 1,438,675,681 | | $ | 1,509,007,137 | |
| Receivable for investments sold | 2,178,772 | | 3,330,658 | |
| Receivable for capital shares sold | 598,582 | | 1,267,781 | |
| Distributions receivable from affiliates | 1,300,659 | | 1,156,751 | |
| 1,442,753,694 | | 1,514,762,327 | |
| | |
| Liabilities | | |
| Payable for investments purchased | 1,300,659 | | 1,156,751 | |
| Payable for capital shares redeemed | 1,792,244 | | 3,518,526 | |
| Accrued management fees | 825,678 | | 920,913 | |
| Distribution and service fees payable | 162,617 | | 159,001 | |
| 4,081,198 | | 5,755,191 | |
| | |
| Net Assets | $ | 1,438,672,496 | | $ | 1,509,007,136 | |
| | |
| Net Assets Consist of: | | |
| Capital (par value and paid-in surplus) | $ | 1,294,425,497 | | $ | 1,309,920,858 | |
| Distributable earnings (loss) | 144,246,999 | | 199,086,278 | |
| $ | 1,438,672,496 | | $ | 1,509,007,136 | |
| | | | | | | | | | | |
| Fund/Class | Net Assets | Shares Outstanding | Net Asset Value Per Share* |
| One Choice 2040 Portfolio | | | |
| Investor Class, $0.01 Par Value | $288,416,700 | 22,605,459 | $12.76 |
| I Class, $0.01 Par Value | $246,246,734 | 19,281,629 | $12.77 |
| A Class, $0.01 Par Value | $130,075,723 | 10,209,805 | $12.74 |
| C Class, $0.01 Par Value | $1,094,529 | 86,382 | $12.67 |
| R Class, $0.01 Par Value | $321,002,579 | 25,236,407 | $12.72 |
| R6 Class, $0.01 Par Value | $451,836,231 | 40,831,373 | $11.07 |
| One Choice 2045 Portfolio | | | |
| Investor Class, $0.01 Par Value | $407,550,935 | 24,769,201 | $16.45 |
| I Class, $0.01 Par Value | $221,518,012 | 13,436,766 | $16.49 |
| A Class, $0.01 Par Value | $124,182,050 | 7,560,637 | $16.42 |
| C Class, $0.01 Par Value | $1,288,864 | 79,004 | $16.31 |
| R Class, $0.01 Par Value | $315,313,588 | 19,202,124 | $16.42 |
| R6 Class, $0.01 Par Value | $439,153,687 | 43,722,021 | $10.04 |
*Maximum offering price per share was equal to the net asset value per share for all share classes, except A Class, for which the maximum offering price per share was $13.52 and $17.42 (net asset value divided by 0.9425) for One Choice 2040 Portfolio and One Choice 2045 Portfolio, respectively. A contingent deferred sales charge may be imposed on redemptions of A Class and C Class.
See Notes to Financial Statements.
| | | | | | | | |
| JULY 31, 2023 | | |
| One Choice
2050 Portfolio | One Choice
2055 Portfolio |
| Assets | | |
| Investment securities in affiliates, at value (cost of $1,014,882,942 and $717,597,288, respectively) | $ | 1,151,742,118 | | $ | 807,467,762 | |
| Receivable for investments sold | 1,866,352 | | 1,059,708 | |
| Receivable for capital shares sold | 776,283 | | 2,147,798 | |
| Distributions receivable from affiliates | 680,895 | | 367,810 | |
| 1,155,065,648 | | 811,043,078 | |
| | |
| Liabilities | | |
| Payable for investments purchased | 680,895 | | 367,895 | |
| Payable for capital shares redeemed | 1,809,154 | | 2,623,916 | |
| Accrued management fees | 703,646 | | 488,585 | |
| Distribution and service fees payable | 129,835 | | 95,851 | |
| 3,323,530 | | 3,576,247 | |
| | |
| Net Assets | $ | 1,151,742,118 | | $ | 807,466,831 | |
| | |
| Net Assets Consist of: | | |
| Capital (par value and paid-in surplus) | $ | 1,021,243,202 | | $ | 730,304,734 | |
| Distributable earnings (loss) | 130,498,916 | | 77,162,097 | |
| $ | 1,151,742,118 | | $ | 807,466,831 | |
| | | | | | | | | | | |
| Fund/Class | Net Assets | Shares Outstanding | Net Asset Value Per Share* |
| One Choice 2050 Portfolio | | | |
| Investor Class, $0.01 Par Value | $214,541,957 | 15,620,358 | $13.73 |
| I Class, $0.01 Par Value | $209,960,721 | 15,253,187 | $13.77 |
| A Class, $0.01 Par Value | $98,747,948 | 7,198,316 | $13.72 |
| C Class, $0.01 Par Value | $1,161,040 | 85,128 | $13.64 |
| R Class, $0.01 Par Value | $259,212,525 | 18,907,253 | $13.71 |
| R6 Class, $0.01 Par Value | $368,117,927 | 30,846,017 | $11.93 |
| One Choice 2055 Portfolio | | | |
| Investor Class, $0.01 Par Value | $122,095,032 | 7,874,195 | $15.51 |
| I Class, $0.01 Par Value | $157,600,486 | 10,158,824 | $15.51 |
| A Class, $0.01 Par Value | $69,325,825 | 4,482,015 | $15.47 |
| C Class, $0.01 Par Value | $822,289 | 53,729 | $15.30 |
| R Class, $0.01 Par Value | $192,693,252 | 12,455,493 | $15.47 |
| R6 Class, $0.01 Par Value | $264,929,947 | 20,970,243 | $12.63 |
*Maximum offering price per share was equal to the net asset value per share for all share classes, except A Class, for which the maximum offering price per share was $14.56 and $16.41 (net asset value divided by 0.9425) for One Choice 2050 Portfolio and One Choice 2055 Portfolio, respectively. A contingent deferred sales charge may be imposed on redemptions of A Class and C Class.
See Notes to Financial Statements.
| | | | | | | | |
| JULY 31, 2023 | | |
| One Choice
2060 Portfolio | One Choice
2065 Portfolio |
| Assets | | |
| Investment securities in affiliates, at value (cost of $371,934,203 and $50,013,975, respectively) | $ | 402,757,535 | | $ | 52,012,136 | |
| Receivable for investments sold | 266,533 | | — | |
| Receivable for capital shares sold | 508,375 | | 117,075 | |
| Distributions receivable from affiliates | 159,008 | | 18,280 | |
| 403,691,451 | | 52,147,491 | |
| | |
| Liabilities | | |
| Payable for investments purchased | 158,923 | | 33,999 | |
| Payable for capital shares redeemed | 478,521 | | 62,320 | |
| Accrued management fees | 242,559 | | 30,985 | |
| Distribution and service fees payable | 54,042 | | 8,051 | |
| 934,045 | | 135,355 | |
| | |
| Net Assets | $ | 402,757,406 | | $ | 52,012,136 | |
| | |
| Net Assets Consist of: | | |
| Capital (par value and paid-in surplus) | $ | 383,774,755 | | $ | 51,726,633 | |
| Distributable earnings (loss) | 18,982,651 | | 285,503 | |
| $ | 402,757,406 | | $ | 52,012,136 | |
| | | | | | | | | | | |
| Fund/Class | Net Assets | Shares Outstanding | Net Asset Value Per Share* |
| One Choice 2060 Portfolio | | | |
| Investor Class, $0.01 Par Value | $55,975,227 | 3,981,636 | $14.06 |
| I Class, $0.01 Par Value | $66,910,211 | 4,752,070 | $14.08 |
| A Class, $0.01 Par Value | $28,252,633 | 2,013,033 | $14.03 |
| C Class, $0.01 Par Value | $290,081 | 20,908 | $13.87 |
| R Class, $0.01 Par Value | $115,828,007 | 8,266,558 | $14.01 |
| R6 Class, $0.01 Par Value | $135,501,247 | 9,588,633 | $14.13 |
| One Choice 2065 Portfolio | | | |
| Investor Class, $0.01 Par Value | $5,228,985 | 460,546 | $11.35 |
| I Class, $0.01 Par Value | $8,114,000 | 714,179 | $11.36 |
| A Class, $0.01 Par Value | $2,533,619 | 223,544 | $11.33 |
| C Class, $0.01 Par Value | $117,149 | 10,378 | $11.29 |
| R Class, $0.01 Par Value | $18,381,952 | 1,623,342 | $11.32 |
| R6 Class, $0.01 Par Value | $17,636,431 | 1,549,521 | $11.38 |
*Maximum offering price per share was equal to the net asset value per share for all share classes, except A Class, for which the maximum offering price per share was $14.89 and $12.02 (net asset value divided by 0.9425) for One Choice 2060 Portfolio and One Choice 2065 Portfolio, respectively. A contingent deferred sales charge may be imposed on redemptions of A Class and C Class.
See Notes to Financial Statements.
| | | | | | | | |
| YEAR ENDED JULY 31, 2023 |
| One Choice In
Retirement
Portfolio | One Choice
2025 Portfolio |
| Investment Income (Loss) | | |
| Income from Affiliates: | | |
| Income distributions from underlying funds | $ | 65,629,269 | | $ | 62,826,596 | |
| | |
| Expenses: | | |
| Management fees | 12,832,331 | | 12,338,723 | |
| Distribution and service fees: | | |
| A Class | 476,795 | | 410,053 | |
| C Class | 22,013 | | 18,752 | |
| R Class | 1,122,628 | | 1,167,451 | |
| Directors' fees and expenses | 60,734 | | 58,677 | |
| Other expenses | 28,033 | | 27,017 | |
| 14,542,534 | | 14,020,673 | |
| Fees waived | (1,017,202) | | (834,093) | |
| 13,525,332 | | 13,186,580 | |
| | |
| Net investment income (loss) | 52,103,937 | | 49,640,016 | |
| | |
| Realized and Unrealized Gain (Loss) on Affiliates | | |
| Net realized gain (loss) on: | | |
| Sales of investments in underlying funds | 20,199,009 | | 16,153,486 | |
| Capital gain distributions received from underlying funds | 17,863,034 | | 17,624,284 | |
| 38,062,043 | | 33,777,770 | |
| | |
| Change in net unrealized appreciation (depreciation) on investments in underlying funds | (32,044,617) | | (23,714,941) | |
| | |
| Net realized and unrealized gain (loss) on affiliates | 6,017,426 | | 10,062,829 | |
| | |
| Net Increase (Decrease) in Net Assets Resulting from Operations | $ | 58,121,363 | | $ | 59,702,845 | |
See Notes to Financial Statements.
| | | | | | | | |
| YEAR ENDED JULY 31, 2023 | | |
| One Choice
2030 Portfolio | One Choice
2035 Portfolio |
| Investment Income (Loss) | | |
| Income from Affiliates: | | |
| Income distributions from underlying funds | $ | 56,765,172 | | $ | 62,568,636 | |
| | |
| Expenses: | | |
| Management fees | 11,525,475 | | 14,046,480 | |
| Distribution and service fees: | | |
| A Class | 378,270 | | 453,239 | |
| C Class | 20,669 | | 11,071 | |
| R Class | 1,496,533 | | 1,570,493 | |
| Directors' fees and expenses | 54,637 | | 62,745 | |
| Other expenses | 27,452 | | 35,540 | |
| 13,503,036 | | 16,179,568 | |
| Fees waived | (848,327) | | (882,181) | |
| 12,654,709 | | 15,297,387 | |
| | |
| Net investment income (loss) | 44,110,463 | | 47,271,249 | |
| | |
| Realized and Unrealized Gain (Loss) on Affiliates | | |
| Net realized gain (loss) on: | | |
| Sales of investments in underlying funds | (14,877,737) | | (15,334,256) | |
| Capital gain distributions received from underlying funds | 17,165,108 | | 20,904,052 | |
| 2,287,371 | | 5,569,796 | |
| | |
| Change in net unrealized appreciation (depreciation) on investments in underlying funds | 23,903,344 | | 42,273,634 | |
| | |
| Net realized and unrealized gain (loss) on affiliates | 26,190,715 | | 47,843,430 | |
| | |
| Net Increase (Decrease) in Net Assets Resulting from Operations | $ | 70,301,178 | | $ | 95,114,679 | |
See Notes to Financial Statements.
| | | | | | | | |
| YEAR ENDED JULY 31, 2023 | | |
| One Choice
2040 Portfolio | One Choice
2045 Portfolio |
| Investment Income (Loss) | | |
| Income from Affiliates: | | |
| Income distributions from underlying funds | $ | 42,308,204 | | $ | 41,583,141 | |
| | |
| Expenses: | | |
| Management fees | 10,192,238 | | 11,173,225 | |
| Distribution and service fees: | | |
| A Class | 313,921 | | 306,831 | |
| C Class | 10,917 | | 13,514 | |
| R Class | 1,433,047 | | 1,377,349 | |
| Directors' fees and expenses | 44,497 | | 46,712 | |
| Other expenses | 30,978 | | 39,296 | |
| 12,025,598 | | 12,956,927 | |
| Fees waived | (694,216) | | (612,846) | |
| 11,331,382 | | 12,344,081 | |
| | |
| Net investment income (loss) | 30,976,822 | | 29,239,060 | |
| | |
| Realized and Unrealized Gain (Loss) on Affiliates | | |
| Net realized gain (loss) on: | | |
| Sales of investments in underlying funds | (20,057,219) | | (17,767,592) | |
| Capital gain distributions received from underlying funds | 15,920,920 | | 18,010,690 | |
| (4,136,299) | | 243,098 | |
| | |
| Change in net unrealized appreciation (depreciation) on investments in underlying funds | 53,796,905 | | 65,581,508 | |
| | |
| Net realized and unrealized gain (loss) on affiliates | 49,660,606 | | 65,824,606 | |
| | |
| Net Increase (Decrease) in Net Assets Resulting from Operations | $ | 80,637,428 | | $ | 95,063,666 | |
See Notes to Financial Statements.
| | | | | | | | |
| YEAR ENDED JULY 31, 2023 |
| One Choice
2050 Portfolio | One Choice
2055 Portfolio |
| Investment Income (Loss) | | |
| Income from Affiliates: | | |
| Income distributions from underlying funds | $ | 27,992,601 | | $ | 18,042,895 | |
| | |
| Expenses: | | |
| Management fees | 8,189,567 | | 5,669,068 | |
| Distribution and service fees: | | |
| A Class | 225,283 | | 158,850 | |
| C Class | 10,774 | | 7,859 | |
| R Class | 1,125,858 | | 811,820 | |
| Directors' fees and expenses | 34,026 | | 23,396 | |
| Other expenses | 34,970 | | 33,537 | |
| 9,620,478 | | 6,704,530 | |
| Fees waived | (404,230) | | (363,926) | |
| 9,216,248 | | 6,340,604 | |
| | |
| Net investment income (loss) | 18,776,353 | | 11,702,291 | |
| | |
| Realized and Unrealized Gain (Loss) on Affiliates | | |
| Net realized gain (loss) on: | | |
| Sales of investments in underlying funds | (20,362,681) | | (20,043,615) | |
| Capital gain distributions received from underlying funds | 14,206,420 | | 10,371,874 | |
| (6,156,261) | | (9,671,741) | |
| | |
| Change in net unrealized appreciation (depreciation) on investments in underlying funds | 70,230,994 | | 60,841,502 | |
| | |
| Net realized and unrealized gain (loss) on affiliates | 64,074,733 | | 51,169,761 | |
| | |
| Net Increase (Decrease) in Net Assets Resulting from Operations | $ | 82,851,086 | | $ | 62,872,052 | |
See Notes to Financial Statements.
| | | | | | | | |
| YEAR ENDED JULY 31, 2023 |
| One Choice
2060 Portfolio | One Choice
2065 Portfolio |
| Investment Income (Loss) | | |
| Income from Affiliates: | | |
| Income distributions from underlying funds | $ | 7,893,482 | | $ | 853,772 | |
| | |
| Expenses: | | |
| Management fees | 2,659,104 | | 294,098 | |
| Distribution and service fees: | | |
| A Class | 60,768 | | 3,968 | |
| C Class | 2,561 | | 473 | |
| R Class | 463,520 | | 58,544 | |
| Directors' fees and expenses | 10,664 | | 1,167 | |
| Other expenses | 24,443 | | 8,950 | |
| 3,221,060 | | 367,200 | |
| Fees waived | (196,721) | | (24,476) | |
| 3,024,339 | | 342,724 | |
| | |
| Net investment income (loss) | 4,869,143 | | 511,048 | |
| | |
| Realized and Unrealized Gain (Loss) on Affiliates | | |
| Net realized gain (loss) on: | | |
| Sales of investments in underlying funds | (9,790,602) | | (1,940,616) | |
| Capital gain distributions received from underlying funds | 4,733,426 | | 524,695 | |
| (5,057,176) | | (1,415,921) | |
| | |
| Change in net unrealized appreciation (depreciation) on investments in underlying funds | 32,759,742 | | 5,487,226 | |
| | |
| Net realized and unrealized gain (loss) on affiliates | 27,702,566 | | 4,071,305 | |
| | |
| Net Increase (Decrease) in Net Assets Resulting from Operations | $ | 32,571,709 | | $ | 4,582,353 | |
See Notes to Financial Statements.
| | |
| Statements of Changes in Net Assets |
| | | | | | | | | | | | | | |
| YEARS ENDED JULY 31, 2023 AND JULY 31, 2022 |
| One Choice
In Retirement Portfolio | One Choice
2025 Portfolio |
| Increase (Decrease) in Net Assets | July 31, 2023 | July 31, 2022 | July 31, 2023 | July 31, 2022 |
| Operations | | | | |
| Net investment income (loss) | $ | 52,103,937 | | $ | 101,892,413 | | $ | 49,640,016 | | $ | 101,678,037 | |
| Net realized gain (loss) | 38,062,043 | | 86,793,657 | | 33,777,770 | | 96,493,756 | |
| Change in net unrealized appreciation (depreciation) | (32,044,617) | | (374,658,155) | | (23,714,941) | | (393,012,926) | |
| Net increase (decrease) in net assets resulting from operations | 58,121,363 | | (185,972,085) | | 59,702,845 | | (194,841,133) | |
| | | | |
| Distributions to Shareholders | | | | |
| From earnings: | | | | |
| Investor Class | (36,472,356) | | (75,268,652) | | (28,548,007) | | (64,627,237) | |
| I Class | (12,940,975) | | (29,384,549) | | (12,295,260) | | (29,947,885) | |
| A Class | (8,697,673) | | (17,895,445) | | (6,790,321) | | (15,704,904) | |
| C Class | (84,454) | | (281,897) | | (62,011) | | (196,368) | |
| R Class | (9,624,346) | | (19,032,312) | | (8,848,845) | | (17,832,838) | |
| R6 Class | (28,397,300) | | (59,897,904) | | (31,237,545) | | (69,708,018) | |
| Decrease in net assets from distributions | (96,217,104) | | (201,760,759) | | (87,781,989) | | (198,017,250) | |
| | | | |
| Capital Share Transactions | | | | |
| Net increase (decrease) in net assets from capital share transactions (Note 5) | (152,560,527) | | (257,932,454) | | (158,505,620) | | (206,231,189) | |
| | | | |
| Net increase (decrease) in net assets | (190,656,268) | | (645,665,298) | | (186,584,764) | | (599,089,572) | |
| | | | |
| Net Assets | | | | |
| Beginning of period | 2,033,576,757 | | 2,679,242,055 | | 1,967,429,147 | | 2,566,518,719 | |
| End of period | $ | 1,842,920,489 | | $ | 2,033,576,757 | | $ | 1,780,844,383 | | $ | 1,967,429,147 | |
See Notes to Financial Statements.
| | | | | | | | | | | | | | |
| YEARS ENDED JULY 31, 2023 AND JULY 31, 2022 |
| One Choice 2030 Portfolio | One Choice 2035 Portfolio |
| Increase (Decrease) in Net Assets | July 31, 2023 | July 31, 2022 | July 31, 2023 | July 31, 2022 |
| Operations | | | | |
| Net investment income (loss) | $ | 44,110,463 | | $ | 92,086,452 | | $ | 47,271,249 | | $ | 106,741,100 | |
| Net realized gain (loss) | 2,287,371 | | 89,447,244 | | 5,569,796 | | 116,421,542 | |
| Change in net unrealized appreciation (depreciation) | 23,903,344 | | (371,678,686) | | 42,273,634 | | (461,836,590) | |
| Net increase (decrease) in net assets resulting from operations | 70,301,178 | | (190,144,990) | | 95,114,679 | | (238,673,948) | |
| | | | |
| Distributions to Shareholders | | | | |
| From earnings: | | | | |
| Investor Class | (21,138,435) | | (37,930,472) | | (29,112,933) | | (51,528,323) | |
| I Class | (16,495,579) | | (31,137,808) | | (16,646,206) | | (30,293,457) | |
| A Class | (7,667,026) | | (14,421,414) | | (8,617,225) | | (14,980,120) | |
| C Class | (86,646) | | (213,331) | | (44,753) | | (110,066) | |
| R Class | (13,976,485) | | (22,222,744) | | (13,741,392) | | (20,697,138) | |
| R6 Class | (33,248,073) | | (62,185,446) | | (43,393,558) | | (76,638,766) | |
| Decrease in net assets from distributions | (92,612,244) | | (168,111,215) | | (111,556,067) | | (194,247,870) | |
| | | | |
| Capital Share Transactions | | | | |
| Net increase (decrease) in net assets from capital share transactions (Note 5) | (33,297,951) | | (75,988,669) | | (50,530,416) | | (44,962,079) | |
| | | | |
| Net increase (decrease) in net assets | (55,609,017) | | (434,244,874) | | (66,971,804) | | (477,883,897) | |
| | | | |
| Net Assets | | | | |
| Beginning of period | 1,790,390,676 | | 2,224,635,550 | | 2,048,401,569 | | 2,526,285,466 | |
| End of period | $ | 1,734,781,659 | | $ | 1,790,390,676 | | $ | 1,981,429,765 | | $ | 2,048,401,569 | |
See Notes to Financial Statements.
| | | | | | | | | | | | | | |
| YEARS ENDED JULY 31, 2023 AND JULY 31, 2022 |
| One Choice 2040 Portfolio | One Choice 2045 Portfolio |
| Increase (Decrease) in Net Assets | July 31, 2023 | July 31, 2022 | July 31, 2023 | July 31, 2022 |
| Operations | | | | |
| Net investment income (loss) | $ | 30,976,822 | | $ | 77,283,729 | | $ | 29,239,060 | | $ | 82,103,763 | |
| Net realized gain (loss) | (4,136,299) | | 87,032,892 | | 243,098 | | 106,102,880 | |
| Change in net unrealized appreciation (depreciation) | 53,796,905 | | (347,238,092) | | 65,581,508 | | (392,020,651) | |
| Net increase (decrease) in net assets resulting from operations | 80,637,428 | | (182,921,471) | | 95,063,666 | | (203,814,008) | |
| | | | |
| Distributions to Shareholders | | | | |
| From earnings: | | | | |
| Investor Class | (18,460,784) | | (30,078,810) | | (22,157,540) | | (37,296,784) | |
| I Class | (15,362,725) | | (26,312,273) | | (13,900,939) | | (23,437,359) | |
| A Class | (7,090,840) | | (11,766,510) | | (6,426,727) | | (10,768,562) | |
| C Class | (52,271) | | (92,512) | | (61,618) | | (116,970) | |
| R Class | (14,990,930) | | (20,928,000) | | (13,198,910) | | (18,546,575) | |
| R6 Class | (28,404,492) | | (52,115,518) | | (36,216,085) | | (63,298,641) | |
| Decrease in net assets from distributions | (84,362,042) | | (141,293,623) | | (91,961,819) | | (153,464,891) | |
| | | | |
| Capital Share Transactions | | | | |
| Net increase (decrease) in net assets from capital share transactions (Note 5) | (3,116,579) | | (21,007,985) | | (5,463,598) | | (23,338,616) | |
| | | | |
| Net increase (decrease) in net assets | (6,841,193) | | (345,223,079) | | (2,361,751) | | (380,617,515) | |
| | | | |
| Net Assets | | | | |
| Beginning of period | 1,445,513,689 | | 1,790,736,768 | | 1,511,368,887 | | 1,891,986,402 | |
| End of period | $ | 1,438,672,496 | | $ | 1,445,513,689 | | $ | 1,509,007,136 | | $ | 1,511,368,887 | |
See Notes to Financial Statements.
| | | | | | | | | | | | | | |
| YEARS ENDED JULY 31, 2023 AND JULY 31, 2022 |
| One Choice 2050 Portfolio | One Choice 2055 Portfolio |
| Increase (Decrease) in Net Assets | July 31, 2023 | July 31, 2022 | July 31, 2023 | July 31, 2022 |
| Operations | | | | |
| Net investment income (loss) | $ | 18,776,353 | | $ | 59,213,403 | | $ | 11,702,291 | | $ | 40,139,800 | |
| Net realized gain (loss) | (6,156,261) | | 73,548,421 | | (9,671,741) | | 47,032,034 | |
| Change in net unrealized appreciation (depreciation) | 70,230,994 | | (278,835,356) | | 60,841,502 | | (188,168,821) | |
| Net increase (decrease) in net assets resulting from operations | 82,851,086 | | (146,073,532) | | 62,872,052 | | (100,996,987) | |
| | | | |
| Distributions to Shareholders | | | | |
| From earnings: | | | | |
| Investor Class | (13,810,584) | | (19,584,498) | | (6,889,472) | | (10,516,664) | |
| I Class | (13,082,127) | | (18,807,255) | | (9,402,434) | | (14,045,981) | |
| A Class | (5,270,428) | | (7,479,172) | | (3,437,227) | | (4,965,583) | |
| C Class | (56,479) | | (91,643) | | (36,512) | | (59,803) | |
| R Class | (12,587,806) | | (14,630,696) | | (8,162,296) | | (9,808,258) | |
| R6 Class | (22,936,476) | | (37,644,256) | | (16,163,562) | | (27,609,685) | |
| Decrease in net assets from distributions | (67,743,900) | | (98,237,520) | | (44,091,503) | | (67,005,974) | |
| | | | |
| Capital Share Transactions | | | | |
| Net increase (decrease) in net assets from capital share transactions (Note 5) | 66,377,416 | | 616,751 | | 61,591,392 | | 27,918,203 | |
| | | | |
| Net increase (decrease) in net assets | 81,484,602 | | (243,694,301) | | 80,371,941 | | (140,084,758) | |
| | | | |
| Net Assets | | | | |
| Beginning of period | 1,070,257,516 | | 1,313,951,817 | | 727,094,890 | | 867,179,648 | |
| End of period | $ | 1,151,742,118 | | $ | 1,070,257,516 | | $ | 807,466,831 | | $ | 727,094,890 | |
See Notes to Financial Statements.
| | | | | | | | | | | | | | |
| YEARS ENDED JULY 31, 2023 AND JULY 31, 2022 |
| One Choice 2060 Portfolio | One Choice 2065 Portfolio |
| Increase (Decrease) in Net Assets | July 31, 2023 | July 31, 2022 | July 31, 2023 | July 31, 2022 |
| Operations | | | | |
| Net investment income (loss) | $ | 4,869,143 | | $ | 15,691,515 | | $ | 511,048 | | $ | 866,732 | |
| Net realized gain (loss) | (5,057,176) | | 15,500,419 | | (1,415,921) | | 555,898 | |
| Change in net unrealized appreciation (depreciation) | 32,759,742 | | (71,627,849) | | 5,487,226 | | (4,042,530) | |
| Net increase (decrease) in net assets resulting from operations | 32,571,709 | | (40,435,915) | | 4,582,353 | | (2,619,900) | |
| | | | |
| Distributions to Shareholders | | | | |
| From earnings: | | | | |
| Investor Class | (3,749,305) | | (3,814,767) | | (171,838) | | (125,764) | |
| I Class | (3,829,500) | | (3,552,447) | | (249,270) | | (103,965) | |
| A Class | (1,555,452) | | (1,504,548) | | (53,366) | | (22,097) | |
| C Class | (14,871) | | (14,810) | | (1,231) | | (1,069) | |
| R Class | (5,638,209) | | (4,091,371) | | (368,424) | | (129,272) | |
| R6 Class | (7,174,242) | | (7,968,447) | | (580,166) | | (407,453) | |
| Decrease in net assets from distributions | (21,961,579) | | (20,946,390) | | (1,424,295) | | (789,620) | |
| | | | |
| Capital Share Transactions | | | | |
| Net increase (decrease) in net assets from capital share transactions (Note 5) | 81,993,624 | | 45,369,632 | | 23,404,959 | | 19,639,970 | |
| | | | |
| Net increase (decrease) in net assets | 92,603,754 | | (16,012,673) | | 26,563,017 | | 16,230,450 | |
| | | | |
| Net Assets | | | | |
| Beginning of period | 310,153,652 | | 326,166,325 | | 25,449,119 | | 9,218,669 | |
| End of period | $ | 402,757,406 | | $ | 310,153,652 | | $ | 52,012,136 | | $ | 25,449,119 | |
See Notes to Financial Statements.
| | |
| Notes to Financial Statements |
JULY 31, 2023
1. Organization
American Century Asset Allocation Portfolios, Inc. (the corporation) is registered under the Investment Company Act of 1940, as amended (the 1940 Act), as an open-end management investment company and is organized as a Maryland corporation. One Choice In Retirement Portfolio, One Choice 2025 Portfolio, One Choice 2030 Portfolio, One Choice 2035 Portfolio, One Choice 2040 Portfolio, One Choice 2045 Portfolio, One Choice 2050 Portfolio, One Choice 2055 Portfolio, One Choice 2060 Portfolio and One Choice 2065 Portfolio (collectively, the funds) are ten funds in a series issued by the corporation. The funds operate as “funds of funds,” meaning substantially all of the funds’ assets will be invested in other American Century Investments mutual funds (the underlying funds). Each fund’s assets are allocated among underlying funds that represent major asset classes, including equity securities, fixed-income securities and short-term investments. The funds will assume the risks associated with their underlying funds. Additional information and attributes of each underlying fund are available at americancentury.com. The investment objective of One Choice In Retirement Portfolio is to seek current income. Capital appreciation is a secondary objective. The investment objective of each of the nine target date One Choice Portfolios is to seek the highest total return consistent with its asset mix. When a fund reaches its most conservative planned target asset allocation, which is expected to occur on approximately November 30 of the year before the target date, its target allocation will become fixed and will match that of One Choice In Retirement Portfolio.
The funds offer the Investor Class, I Class, A Class, C Class, R Class and R6 Class. The A Class may incur an initial sales charge. The A Class and C Class may be subject to a contingent deferred sales charge.
2. Significant Accounting Policies
The following is a summary of significant accounting policies consistently followed by the funds in preparation of their financial statements. Each fund is an investment company and follows accounting and reporting guidance in accordance with accounting principles generally accepted in the United States of America. This may require management to make certain estimates and assumptions at the date of the financial statements. Actual results could differ from these estimates. Management evaluated the impact of events or transactions occurring through the date the financial statements were issued that would merit recognition or disclosure.
Investment Valuations — The funds determine the fair value of their investments and compute their net asset value (NAV) per share at the close of regular trading (usually 4 p.m. Eastern time) on the New York Stock Exchange (NYSE) on each day the NYSE is open. The value of investments of the funds are determined by American Century Investment Management, Inc. (ACIM) (the investment advisor), as the valuation designee, pursuant to its valuation policies and procedures. The Board of Directors oversees the valuation designee and reviews its valuation policies and procedures at least annually. Investments in the underlying funds are valued at their reported NAV.
Security Transactions — Security transactions are accounted for as of the trade date. Net realized gains and losses are determined on the identified cost basis, which is also used for federal income tax purposes.
Investment Income — Income and capital gain distributions, if any, from the underlying funds are recorded as of the ex-dividend date. Long-term capital gain distributions, if any, from the underlying funds are a component of net realized gain (loss).
Income Tax Status — It is each fund's policy to distribute substantially all net investment income and net realized gains to shareholders and to otherwise qualify as a regulated investment company under provisions of the Internal Revenue Code. Accordingly, no provision has been made for income taxes. The funds file U.S. federal, state, local and non-U.S. tax returns as applicable. The funds' tax returns are subject to examination by the relevant taxing authority until expiration of the applicable statute of limitations, which is generally three years from the date of filing but can be longer in certain jurisdictions. At this time, management believes there are no uncertain tax positions which, based on their technical merit, would not be sustained upon examination and for which it is reasonably possible that the total amounts of unrecognized tax benefits will significantly change in the next twelve months.
Multiple Class — All shares of each fund represent an equal pro rata interest in the net assets of the class to which such shares belong, and have identical voting, dividend, liquidation and other rights and the same terms and conditions, except for class specific expenses and exclusive rights to vote on matters affecting only individual classes. Income, non-class specific expenses, and realized and unrealized capital gains and losses of the funds are allocated to each class of shares based on their relative net assets.
Distributions to Shareholders — Distributions from net investment income, if any, are generally declared and paid quarterly for One Choice In Retirement Portfolio. Distributions from net investment income, if any, are generally declared and paid annually for the nine target date One Choice Portfolios. Distributions from net realized gains, if any, are generally declared and paid annually for all funds. Each fund may elect to treat a portion of its payment to a redeeming shareholder, which represents the pro rata share of undistributed net investment income and net realized gains, as a distribution for federal income tax purposes (tax equalization).
Indemnifications — Under the corporation’s organizational documents, its officers and directors are indemnified against certain liabilities arising out of the performance of their duties to the funds. In addition, in the normal course of business, the funds enter into contracts that provide general indemnifications. The maximum exposure under these arrangements is unknown as this would involve future claims that may be made against a fund. The risk of material loss from such claims is considered by management to be remote.
3. Fees and Transactions with Related Parties
Certain officers and directors of the corporation are also officers and/or directors of American Century Companies, Inc. (ACC). The corporation's investment advisor, ACIM, the corporation's distributor, American Century Investment Services, Inc. (ACIS), and the corporation's transfer agent, American Century Services, LLC, are wholly owned, directly or indirectly, by ACC. ACIM serves as the investment advisor for the underlying funds.
Management Fees — The corporation has entered into a management agreement with ACIM, under which ACIM provides the funds with investment advisory and management services in exchange for a single, unified management fee (the fee) per class. The agreement provides that ACIM will pay all expenses of managing and operating the funds, except brokerage expenses, taxes, interest, fees and expenses of the independent directors (including legal counsel fees), extraordinary expenses, and expenses incurred in connection with the provision of shareholder services and distribution services under a plan adopted pursuant to Rule 12b-1 under the 1940 Act. The fee is computed and accrued daily based on the daily net assets of each class of each fund and paid monthly in arrears. The difference in the fee among the classes of each fund is a result of their separate arrangements for non-Rule 12b-1 shareholder services. It is not the result of any difference in advisory or custodial fees or other expenses related to the management of each fund’s assets, which do not vary by class. Each year, the Board of Directors will approve a new management fee rate to be applied December 1st. The fee rate will be based on the most conservative neutral mix of the underlying funds as estimated by the portfolio managers for the upcoming year, and adjusted for each class to reflect such class’s separate arrangements for shareholder services. During the period ended July 31, 2023, the investment advisor agreed to waive a portion of each class of each fund’s management fee. The investment advisor expects these waivers to continue until November 30, 2023 and cannot terminate them prior to such date without the approval of the Board of Directors.
From August 1, 2022 until November 30, 2022, the annual management fee and the fee waiver for each class of each fund was as follows:
| | | | | | | | | | | | | | | | | | | | |
| Annual Management Fee | Fee Waiver |
| Investor, A, C and R Classes | I Class | R6 Class | Investor, A, C and R Classes | I Class | R6 Class |
| One Choice In Retirement Portfolio | 0.77% | 0.58% | 0.48% | 0.03% | 0.04% | 0.09% |
| One Choice 2025 Portfolio | 0.78% | 0.59% | 0.49% | 0.02% | 0.03% | 0.08% |
| One Choice 2030 Portfolio | 0.81% | 0.62% | 0.51% | 0.03% | 0.04% | 0.08% |
| One Choice 2035 Portfolio | 0.84% | 0.64% | 0.54% | 0.03% | 0.03% | 0.08% |
| One Choice 2040 Portfolio | 0.86% | 0.67% | 0.56% | 0.03% | 0.04% | 0.08% |
| One Choice 2045 Portfolio | 0.89% | 0.69% | 0.58% | 0.03% | 0.03% | 0.07% |
| One Choice 2050 Portfolio | 0.91% | 0.71% | 0.58% | 0.03% | 0.03% | 0.05% |
| One Choice 2055 Portfolio | 0.92% | 0.72% | 0.59% | 0.04% | 0.04% | 0.06% |
| One Choice 2060 Portfolio | 0.93% | 0.73% | 0.60% | 0.05% | 0.05% | 0.07% |
| One Choice 2065 Portfolio | 0.93% | 0.74% | 0.60% | 0.05% | 0.06% | 0.07% |
Effective December 1, 2022, the annual management fee and the fee waiver for each class of each fund are as follows:
| | | | | | | | | | | | | | | | | | | | |
| Annual Management Fee | Fee Waiver |
| Investor, A, C and R Classes | I Class | R6 Class | Investor, A, C and R Classes | I Class | R6 Class |
| One Choice In Retirement Portfolio | 0.78% | 0.60% | 0.50% | 0.04% | 0.06% | 0.11% |
| One Choice 2025 Portfolio | 0.79% | 0.60% | 0.51% | 0.03% | 0.04% | 0.10% |
| One Choice 2030 Portfolio | 0.81% | 0.62% | 0.52% | 0.03% | 0.04% | 0.09% |
| One Choice 2035 Portfolio | 0.84% | 0.65% | 0.54% | 0.03% | 0.04% | 0.08% |
| One Choice 2040 Portfolio | 0.87% | 0.67% | 0.56% | 0.04% | 0.04% | 0.08% |
| One Choice 2045 Portfolio | 0.89% | 0.70% | 0.58% | 0.03% | 0.04% | 0.07% |
| One Choice 2050 Portfolio | 0.91% | 0.71% | 0.59% | 0.03% | 0.03% | 0.06% |
| One Choice 2055 Portfolio | 0.92% | 0.73% | 0.60% | 0.04% | 0.05% | 0.07% |
| One Choice 2060 Portfolio | 0.93% | 0.73% | 0.61% | 0.05% | 0.05% | 0.08% |
| One Choice 2065 Portfolio | 0.94% | 0.74% | 0.61% | 0.06% | 0.06% | 0.08% |
For the period ended July 31, 2023, the effective annual management fee, the fee waiver and the effective annual management fee after waiver for each class of each fund are as follows:
| | | | | | | | | | | | | | | | | | | | |
| Effective Annual Management Fee | Fee Waiver |
| Investor, A, C and R Classes | I Class | R6 Class | Investor, A, C and R Classes | I Class | R6 Class |
| One Choice In Retirement Portfolio | 0.78% | 0.59% | 0.49% | 0.04% | 0.05% | 0.10% |
| One Choice 2025 Portfolio | 0.79% | 0.60% | 0.50% | 0.03% | 0.04% | 0.09% |
| One Choice 2030 Portfolio | 0.81% | 0.62% | 0.52% | 0.03% | 0.04% | 0.09% |
| One Choice 2035 Portfolio | 0.84% | 0.65% | 0.54% | 0.03% | 0.04% | 0.08% |
| One Choice 2040 Portfolio | 0.87% | 0.67% | 0.56% | 0.04% | 0.04% | 0.08% |
| One Choice 2045 Portfolio | 0.89% | 0.70% | 0.58% | 0.03% | 0.04% | 0.07% |
| One Choice 2050 Portfolio | 0.91% | 0.71% | 0.59% | 0.03% | 0.03% | 0.06% |
| One Choice 2055 Portfolio | 0.92% | 0.73% | 0.60% | 0.04% | 0.05% | 0.07% |
| One Choice 2060 Portfolio | 0.93% | 0.73% | 0.61% | 0.05% | 0.05% | 0.08% |
| One Choice 2065 Portfolio | 0.94% | 0.74% | 0.61% | 0.06% | 0.06% | 0.08% |
| | | | | | | | | | | |
| Effective Annual Management Fee After Waiver |
| Investor, A, C and R Classes | I Class | R6 Class |
| One Choice In Retirement Portfolio | 0.74% | 0.54% | 0.39% |
| One Choice 2025 Portfolio | 0.76% | 0.56% | 0.41% |
| One Choice 2030 Portfolio | 0.78% | 0.58% | 0.43% |
| One Choice 2035 Portfolio | 0.81% | 0.61% | 0.46% |
| One Choice 2040 Portfolio | 0.83% | 0.63% | 0.48% |
| One Choice 2045 Portfolio | 0.86% | 0.66% | 0.51% |
| One Choice 2050 Portfolio | 0.88% | 0.68% | 0.53% |
| One Choice 2055 Portfolio | 0.88% | 0.68% | 0.53% |
| One Choice 2060 Portfolio | 0.88% | 0.68% | 0.53% |
| One Choice 2065 Portfolio | 0.88% | 0.68% | 0.53% |
The total amount of the waiver for each class of each fund for the period ended July 31, 2023 is as follows:
| | | | | | | | | | | | | | | | | | | | |
| Investor Class | I Class | A Class | C Class | R Class | R6 Class |
| One Choice In Retirement Portfolio | $ | 278,880 | | $ | 136,382 | | $ | 69,874 | | $ | 800 | | $ | 82,472 | | $ | 448,794 | |
| One Choice 2025 Portfolio | $ | 174,005 | | $ | 97,075 | | $ | 43,595 | | $ | 500 | | $ | 62,538 | | $ | 456,380 | |
| One Choice 2030 Portfolio | $ | 118,047 | | $ | 118,607 | | $ | 45,392 | | $ | 620 | | $ | 89,792 | | $ | 475,869 | |
| One Choice 2035 Portfolio | $ | 173,870 | | $ | 112,251 | | $ | 54,389 | | $ | 332 | | $ | 94,229 | | $ | 447,110 | |
| One Choice 2040 Portfolio | $ | 109,913 | | $ | 100,344 | | $ | 46,113 | | $ | 400 | | $ | 105,755 | | $ | 331,691 | |
| One Choice 2045 Portfolio | $ | 121,371 | | $ | 86,778 | | $ | 36,820 | | $ | 405 | | $ | 82,641 | | $ | 284,831 | |
| One Choice 2050 Portfolio | $ | 64,856 | | $ | 61,580 | | $ | 27,034 | | $ | 323 | | $ | 67,551 | | $ | 182,886 | |
| One Choice 2055 Portfolio | $ | 47,121 | | $ | 72,369 | | $ | 25,416 | | $ | 314 | | $ | 64,946 | | $ | 153,760 | |
| One Choice 2060 Portfolio | $ | 26,924 | | $ | 28,583 | | $ | 12,154 | | $ | 128 | | $ | 46,352 | | $ | 82,580 | |
| One Choice 2065 Portfolio | $ | 2,482 | | $ | 3,577 | | $ | 920 | | $ | 28 | | $ | 6,758 | | $ | 10,711 | |
Distribution and Service Fees — The Board of Directors has adopted a separate Master Distribution and Individual Shareholder Services Plan for each of the A Class, C Class and R Class (collectively the plans), pursuant to Rule 12b-1 of the 1940 Act. The plans provide that the A Class will pay ACIS an annual distribution and service fee of 0.25%. The plans provide that the C Class will pay ACIS an annual distribution and service fee of 1.00%, of which 0.25% is paid for individual shareholder services and 0.75% is paid for distribution services. The plans provide that the R Class will pay ACIS an annual distribution and service fee of 0.50%. The fees are computed and accrued daily based on each class’s daily net assets and paid monthly in arrears. These fees are used to pay financial intermediaries for distribution and individual shareholder services. Fees incurred under the plans during the period ended July 31, 2023 are detailed in the Statements of Operations.
Directors' Fees and Expenses — The Board of Directors is responsible for overseeing the investment advisor’s management and operations of the funds. The directors receive detailed information about the funds and their investment advisor regularly throughout the year, and meet at least quarterly with management of the investment advisor to review reports about fund operations. The funds' officers do not receive compensation from the funds.
Other Expenses — A fund’s other expenses may include interest charges, clearing exchange fees, proxy solicitation expenses, fees associated with the recovery of foreign tax reclaims and other miscellaneous expenses.
4. Investment Transactions
Investment transactions for the period ended July 31, 2023 were as follows:
| | | | | | | | | | | | | | | | | |
| One Choice In Retirement Portfolio | One Choice 2025 Portfolio | One Choice 2030 Portfolio | One Choice 2035 Portfolio | One Choice 2040 Portfolio |
| Purchases | $ | 290,267,960 | | $ | 268,372,853 | | $ | 286,060,108 | | $ | 300,455,621 | | $ | 236,192,427 | |
| Sales | $ | 469,075,354 | | $ | 447,392,618 | | $ | 350,693,866 | | $ | 394,352,392 | | $ | 276,773,008 | |
| | | | | | | | | | | | | | | | | |
| One Choice
2045 Portfolio | One Choice 2050 Portfolio | One Choice 2055 Portfolio | One Choice 2060 Portfolio | One Choice 2065 Portfolio |
| Purchases | $ | 235,176,707 | | $ | 215,687,909 | | $ | 172,430,221 | | $ | 117,232,904 | | $ | 30,023,391 | |
| Sales | $ | 285,352,178 | | $ | 184,071,501 | | $ | 132,856,020 | | $ | 47,598,349 | | $ | 7,006,983 | |
5. Capital Share Transactions
The corporation is authorized to issue 6,000,000,000 shares. Transactions in shares of the funds were as follows:
| | | | | | | | | | | | | | |
| Year ended
July 31, 2023 | Year ended
July 31, 2022 |
| Shares | Amount | Shares | Amount |
| One Choice In Retirement Portfolio | | | | |
| Investor Class | | | | |
| Sold | 5,444,170 | | $ | 63,761,920 | | 27,164,199 | | $ | 336,713,681 | |
| Issued in reinvestment of distributions | 3,200,247 | | 36,002,633 | | 5,495,026 | | 74,308,384 | |
| Redeemed | (14,014,159) | | (163,392,008) | | (33,936,152) | | (427,529,361) | |
| (5,369,742) | | (63,627,455) | | (1,276,927) | | (16,507,296) | |
| I Class | | | | |
| Sold | 5,808,349 | | 67,557,376 | | 4,423,335 | | 60,874,797 | |
| Issued in reinvestment of distributions | 1,147,848 | | 12,914,096 | | 2,167,747 | | 29,314,654 | |
| Redeemed | (12,305,495) | | (143,508,063) | | (18,827,197) | | (266,537,968) | |
| (5,349,298) | | (63,036,591) | | (12,236,115) | | (176,348,517) | |
| A Class | | | | |
| Sold | 2,091,391 | | 24,466,911 | | 2,497,791 | | 33,030,391 | |
| Issued in reinvestment of distributions | 742,189 | | 8,343,605 | | 1,272,451 | | 17,235,371 | |
| Redeemed | (3,508,385) | | (40,919,709) | | (5,778,594) | | (78,208,285) | |
| (674,805) | | (8,109,193) | | (2,008,352) | | (27,942,523) | |
| C Class | | | | |
| Sold | 5,878 | | 67,842 | | 5,355 | | 73,473 | |
| Issued in reinvestment of distributions | 7,616 | | 84,454 | | 20,939 | | 281,897 | |
| Redeemed | (69,052) | | (797,607) | | (130,935) | | (1,712,684) | |
| (55,558) | | (645,311) | | (104,641) | | (1,357,314) | |
| R Class | | | | |
| Sold | 3,076,798 | | 35,874,244 | | 2,800,303 | | 36,930,338 | |
| Issued in reinvestment of distributions | 858,245 | | 9,616,052 | | 1,406,942 | | 19,015,368 | |
| Redeemed | (3,534,897) | | (41,292,396) | | (4,118,553) | | (54,636,161) | |
| 400,146 | | 4,197,900 | | 88,692 | | 1,309,545 | |
| R6 Class | | | | |
| Sold | 10,752,182 | | 96,876,207 | | 21,378,773 | | 234,435,190 | |
| Issued in reinvestment of distributions | 3,151,476 | | 27,417,076 | | 5,476,942 | | 58,078,042 | |
| Redeemed | (15,976,890) | | (145,633,160) | | (30,951,438) | | (329,599,581) | |
| (2,073,232) | | (21,339,877) | | (4,095,723) | | (37,086,349) | |
| Net increase (decrease) | (13,122,489) | | $ | (152,560,527) | | (19,633,066) | | $ | (257,932,454) | |
| | | | | | | | | | | | | | |
| Year ended
July 31, 2023 | Year ended
July 31, 2022 |
| Shares | Amount | Shares | Amount |
| One Choice 2025 Portfolio | | | | |
| Investor Class | | | | |
| Sold | 3,835,046 | | $ | 50,185,999 | | 13,232,430 | | $ | 188,998,802 | |
| Issued in reinvestment of distributions | 2,268,239 | | 28,398,350 | | 4,217,765 | | 64,489,627 | |
| Redeemed | (11,161,171) | | (146,066,997) | | (19,849,568) | | (286,170,677) | |
| (5,057,886) | | (67,482,648) | | (2,399,373) | | (32,682,248) | |
| I Class | | | | |
| Sold | 5,695,619 | | 74,065,454 | | 5,639,779 | | 88,205,976 | |
| Issued in reinvestment of distributions | 973,558 | | 12,188,942 | | 1,947,049 | | 29,750,915 | |
| Redeemed | (11,932,406) | | (156,332,894) | | (17,662,993) | | (279,989,130) | |
| (5,263,229) | | (70,078,498) | | (10,076,165) | | (162,032,239) | |
| A Class | | | | |
| Sold | 1,668,925 | | 21,934,103 | | 1,956,052 | | 29,008,539 | |
| Issued in reinvestment of distributions | 508,874 | | 6,371,109 | | 972,411 | | 14,868,167 | |
| Redeemed | (3,641,183) | | (47,786,593) | | (4,881,863) | | (74,426,806) | |
| (1,463,384) | | (19,481,381) | | (1,953,400) | | (30,550,100) | |
| C Class | | | | |
| Sold | 16,074 | | 210,990 | | 8,356 | | 123,092 | |
| Issued in reinvestment of distributions | 4,937 | | 62,011 | | 12,809 | | 196,368 | |
| Redeemed | (29,478) | | (386,220) | | (76,218) | | (1,126,229) | |
| (8,467) | | (113,219) | | (55,053) | | (806,769) | |
| R Class | | | | |
| Sold | 3,340,930 | | 43,700,508 | | 3,510,215 | | 52,081,313 | |
| Issued in reinvestment of distributions | 706,660 | | 8,847,385 | | 1,163,075 | | 17,783,415 | |
| Redeemed | (3,005,751) | | (39,423,272) | | (3,421,912) | | (50,758,421) | |
| 1,041,839 | | 13,124,621 | | 1,251,378 | | 19,106,307 | |
| R6 Class | | | | |
| Sold | 11,252,756 | | 105,427,085 | | 21,885,155 | | 250,954,930 | |
| Issued in reinvestment of distributions | 3,338,050 | | 29,675,260 | | 6,017,310 | | 66,551,447 | |
| Redeemed | (15,831,954) | | (149,576,840) | | (28,872,558) | | (316,772,517) | |
| (1,241,148) | | (14,474,495) | | (970,093) | | 733,860 | |
| Net increase (decrease) | (11,992,275) | | $ | (158,505,620) | | (14,202,706) | | $ | (206,231,189) | |
| | | | | | | | | | | | | | |
| Year ended
July 31, 2023 | Year ended
July 31, 2022 |
| Shares | Amount | Shares | Amount |
| One Choice 2030 Portfolio | | | | |
| Investor Class | | | | |
| Sold | 4,411,295 | | $ | 50,962,731 | | 9,924,803 | | $ | 130,395,835 | |
| Issued in reinvestment of distributions | 1,919,082 | | 20,995,260 | | 2,767,974 | | 37,782,853 | |
| Redeemed | (9,785,695) | | (112,016,664) | | (11,368,928) | | (147,402,743) | |
| (3,455,318) | | (40,058,673) | | 1,323,849 | | 20,775,945 | |
| I Class | | | | |
| Sold | 6,653,365 | | 76,094,906 | | 6,659,489 | | 92,482,881 | |
| Issued in reinvestment of distributions | 1,506,442 | | 16,465,414 | | 2,280,644 | | 31,085,177 | |
| Redeemed | (13,105,576) | | (151,057,024) | | (20,493,561) | | (295,016,684) | |
| (4,945,769) | | (58,496,704) | | (11,553,428) | | (171,448,626) | |
| A Class | | | | |
| Sold | 2,246,045 | | 25,878,055 | | 2,429,910 | | 32,077,156 | |
| Issued in reinvestment of distributions | 634,045 | | 6,923,750 | | 966,445 | | 13,172,647 | |
| Redeemed | (3,365,410) | | (38,484,849) | | (5,720,245) | | (77,368,834) | |
| (485,320) | | (5,683,044) | | (2,323,890) | | (32,119,031) | |
| C Class | | | | |
| Sold | 28,926 | | 333,850 | | 12,048 | | 160,377 | |
| Issued in reinvestment of distributions | 7,906 | | 86,646 | | 15,606 | | 213,331 | |
| Redeemed | (47,862) | | (548,035) | | (88,205) | | (1,121,977) | |
| (11,030) | | (127,539) | | (60,551) | | (748,269) | |
| R Class | | | | |
| Sold | 5,878,139 | | 67,640,613 | | 5,242,790 | | 69,118,887 | |
| Issued in reinvestment of distributions | 1,277,589 | | 13,964,049 | | 1,627,462 | | 22,198,588 | |
| Redeemed | (3,592,254) | | (41,374,307) | | (3,799,644) | | (49,746,628) | |
| 3,563,474 | | 40,230,355 | | 3,070,608 | | 41,570,847 | |
| R6 Class | | | | |
| Sold | 13,230,437 | | 136,024,000 | | 23,294,890 | | 294,161,645 | |
| Issued in reinvestment of distributions | 3,294,420 | | 32,087,649 | | 4,917,441 | | 60,140,299 | |
| Redeemed | (13,240,804) | | (137,273,995) | | (24,029,377) | | (288,321,479) | |
| 3,284,053 | | 30,837,654 | | 4,182,954 | | 65,980,465 | |
| Net increase (decrease) | (2,049,910) | | $ | (33,297,951) | | (5,360,458) | | $ | (75,988,669) | |
| | | | | | | | | | | | | | |
| Year ended
July 31, 2023 | Year ended
July 31, 2022 |
| Shares | Amount | Shares | Amount |
| One Choice 2035 Portfolio | | | | |
| Investor Class | | | | |
| Sold | 4,008,295 | | $ | 58,737,720 | | 7,218,726 | | $ | 122,173,063 | |
| Issued in reinvestment of distributions | 2,095,522 | | 29,002,021 | | 2,946,248 | | 51,294,080 | |
| Redeemed | (9,516,926) | | (138,152,581) | | (9,890,153) | | (165,281,021) | |
| (3,413,109) | | (50,412,840) | | 274,821 | | 8,186,122 | |
| I Class | | | | |
| Sold | 6,277,052 | | 90,868,040 | | 5,821,052 | | 103,478,164 | |
| Issued in reinvestment of distributions | 1,198,458 | | 16,598,641 | | 1,735,410 | | 30,230,842 | |
| Redeemed | (12,869,574) | | (187,547,333) | | (15,389,952) | | (279,904,291) | |
| (5,394,064) | | (80,080,652) | | (7,833,490) | | (146,195,285) | |
| A Class | | | | |
| Sold | 1,943,295 | | 28,379,690 | | 2,093,463 | | 35,138,236 | |
| Issued in reinvestment of distributions | 589,176 | | 8,154,199 | | 819,515 | | 14,275,948 | |
| Redeemed | (2,719,037) | | (39,568,965) | | (4,456,457) | | (77,551,342) | |
| (186,566) | | (3,035,076) | | (1,543,479) | | (28,137,158) | |
| C Class | | | | |
| Sold | 8,947 | | 130,168 | | 11,723 | | 198,399 | |
| Issued in reinvestment of distributions | 3,234 | | 44,753 | | 6,322 | | 110,066 | |
| Redeemed | (19,483) | | (284,228) | | (52,809) | | (893,361) | |
| (7,302) | | (109,307) | | (34,764) | | (584,896) | |
| R Class | | | | |
| Sold | 5,291,526 | | 77,236,125 | | 4,322,882 | | 72,135,912 | |
| Issued in reinvestment of distributions | 989,160 | | 13,699,852 | | 1,184,359 | | 20,631,535 | |
| Redeemed | (2,823,664) | | (41,364,908) | | (2,848,728) | | (47,663,523) | |
| 3,457,022 | | 49,571,069 | | 2,658,513 | | 45,103,924 | |
| R6 Class | | | | |
| Sold | 13,858,323 | | 132,145,203 | | 23,050,787 | | 279,251,098 | |
| Issued in reinvestment of distributions | 4,641,820 | | 41,637,129 | | 6,370,127 | | 73,957,179 | |
| Redeemed | (14,580,174) | | (140,245,942) | | (24,230,509) | | (276,543,063) | |
| 3,919,969 | | 33,536,390 | | 5,190,405 | | 76,665,214 | |
| Net increase (decrease) | (1,624,050) | | $ | (50,530,416) | | (1,287,994) | | $ | (44,962,079) | |
| | | | | | | | | | | | | | |
| Year ended
July 31, 2023 | Year ended
July 31, 2022 |
| Shares | Amount | Shares | Amount |
| One Choice 2040 Portfolio | | | | |
| Investor Class | | | | |
| Sold | 3,935,400 | | $ | 48,077,303 | | 6,494,868 | | $ | 92,943,653 | |
| Issued in reinvestment of distributions | 1,606,963 | | 18,415,789 | | 2,041,048 | | 30,003,399 | |
| Redeemed | (8,666,921) | | (104,454,915) | | (7,482,453) | | (105,124,942) | |
| (3,124,558) | | (37,961,823) | | 1,053,463 | | 17,822,110 | |
| I Class | | | | |
| Sold | 5,748,702 | | 69,392,642 | | 5,277,135 | | 78,789,349 | |
| Issued in reinvestment of distributions | 1,333,920 | | 15,286,723 | | 1,781,655 | | 26,190,334 | |
| Redeemed | (10,358,610) | | (126,034,242) | | (12,213,037) | | (188,963,827) | |
| (3,275,988) | | (41,354,877) | | (5,154,247) | | (83,984,144) | |
| A Class | | | | |
| Sold | 1,871,885 | | 22,738,942 | | 1,691,850 | | 24,021,551 | |
| Issued in reinvestment of distributions | 575,813 | | 6,598,818 | | 751,760 | | 11,050,866 | |
| Redeemed | (2,352,582) | | (28,479,375) | | (3,995,825) | | (58,767,441) | |
| 95,116 | | 858,385 | | (1,552,215) | | (23,695,024) | |
| C Class | | | | |
| Sold | 13,764 | | 165,987 | | 14,632 | | 208,112 | |
| Issued in reinvestment of distributions | 4,565 | | 52,271 | | 6,298 | | 92,512 | |
| Redeemed | (24,798) | | (301,244) | | (23,706) | | (347,537) | |
| (6,469) | | (82,986) | | (2,776) | | (46,913) | |
| R Class | | | | |
| Sold | 5,832,785 | | 70,887,191 | | 4,934,023 | | 69,771,771 | |
| Issued in reinvestment of distributions | 1,306,735 | | 14,975,179 | | 1,422,368 | | 20,908,819 | |
| Redeemed | (3,212,849) | | (39,104,758) | | (2,704,186) | | (38,081,790) | |
| 3,926,671 | | 46,757,612 | | 3,652,205 | | 52,598,800 | |
| R6 Class | | | | |
| Sold | 10,682,875 | | 112,837,873 | | 16,734,864 | | 221,043,411 | |
| Issued in reinvestment of distributions | 2,761,849 | | 27,397,541 | | 3,938,191 | | 50,605,761 | |
| Redeemed | (10,469,022) | | (111,568,304) | | (20,461,843) | | (255,351,986) | |
| 2,975,702 | | 28,667,110 | | 211,212 | | 16,297,186 | |
| Net increase (decrease) | 590,474 | | $ | (3,116,579) | | (1,792,358) | | $ | (21,007,985) | |
| | | | | | | | | | | | | | |
| Year ended
July 31, 2023 | Year ended
July 31, 2022 |
| Shares | Amount | Shares | Amount |
| One Choice 2045 Portfolio | | | | |
| Investor Class | | | | |
| Sold | 3,025,862 | | $ | 47,252,373 | | 4,407,329 | | $ | 81,551,161 | |
| Issued in reinvestment of distributions | 1,507,338 | | 22,097,579 | | 1,971,523 | | 37,222,347 | |
| Redeemed | (6,616,429) | | (102,276,967) | | (5,805,206) | | (105,035,583) | |
| (2,083,229) | | (32,927,015) | | 573,646 | | 13,737,925 | |
| I Class | | | | |
| Sold | 5,116,462 | | 78,813,732 | | 4,874,268 | | 92,671,501 | |
| Issued in reinvestment of distributions | 934,676 | | 13,711,693 | | 1,225,772 | | 23,167,092 | |
| Redeemed | (9,264,770) | | (143,826,662) | | (9,919,112) | | (193,752,329) | |
| (3,213,632) | | (51,301,237) | | (3,819,072) | | (77,913,736) | |
| A Class | | | | |
| Sold | 1,465,259 | | 22,821,644 | | 1,384,915 | | 24,906,403 | |
| Issued in reinvestment of distributions | 411,980 | | 6,035,526 | | 539,782 | | 10,191,077 | |
| Redeemed | (2,237,885) | | (34,866,909) | | (2,774,963) | | (51,460,363) | |
| (360,646) | | (6,009,739) | | (850,266) | | (16,362,883) | |
| C Class | | | | |
| Sold | 7,058 | | 109,588 | | 6,696 | | 121,434 | |
| Issued in reinvestment of distributions | 4,215 | | 61,618 | | 6,212 | | 116,970 | |
| Redeemed | (20,899) | | (324,274) | | (24,596) | | (426,311) | |
| (9,626) | | (153,068) | | (11,688) | | (187,907) | |
| R Class | | | | |
| Sold | 4,851,110 | | 75,577,315 | | 3,845,831 | | 68,941,384 | |
| Issued in reinvestment of distributions | 899,004 | | 13,188,393 | | 980,425 | | 18,530,033 | |
| Redeemed | (2,507,808) | | (39,110,139) | | (2,366,774) | | (42,549,410) | |
| 3,242,306 | | 49,655,569 | | 2,459,482 | | 44,922,007 | |
| R6 Class | | | | |
| Sold | 11,429,861 | | 109,975,671 | | 16,209,612 | | 200,326,465 | |
| Issued in reinvestment of distributions | 3,904,403 | | 34,866,318 | | 5,136,621 | | 61,331,261 | |
| Redeemed | (11,362,276) | | (109,570,097) | | (21,306,729) | | (249,191,748) | |
| 3,971,988 | | 35,271,892 | | 39,504 | | 12,465,978 | |
| Net increase (decrease) | 1,547,161 | | $ | (5,463,598) | | (1,608,394) | | $ | (23,338,616) | |
| | | | | | | | | | | | | | |
| Year ended
July 31, 2023 | Year ended
July 31, 2022 |
| Shares | Amount | Shares | Amount |
| One Choice 2050 Portfolio | | | | |
| Investor Class | | | | |
| Sold | 3,038,200 | | $ | 39,345,515 | | 4,090,776 | | $ | 62,912,597 | |
| Issued in reinvestment of distributions | 1,136,965 | | 13,791,391 | | 1,236,036 | | 19,566,441 | |
| Redeemed | (5,855,555) | | (75,092,100) | | (4,248,798) | | (64,711,145) | |
| (1,680,390) | | (21,955,194) | | 1,078,014 | | 17,767,893 | |
| I Class | | | | |
| Sold | 4,409,949 | | 56,713,252 | | 4,099,582 | | 64,552,242 | |
| Issued in reinvestment of distributions | 1,067,065 | | 12,954,169 | | 1,177,432 | | 18,662,303 | |
| Redeemed | (6,605,236) | | (85,548,258) | | (7,821,616) | | (129,159,527) | |
| (1,128,222) | | (15,880,837) | | (2,544,602) | | (45,944,982) | |
| A Class | | | | |
| Sold | 1,804,184 | | 23,403,069 | | 1,457,088 | | 22,133,715 | |
| Issued in reinvestment of distributions | 383,897 | | 4,656,670 | | 426,229 | | 6,747,209 | |
| Redeemed | (1,707,879) | | (22,098,942) | | (2,115,341) | | (32,900,856) | |
| 480,202 | | 5,960,797 | | (232,024) | | (4,019,932) | |
| C Class | | | | |
| Sold | 16,554 | | 215,761 | | 14,706 | | 224,972 | |
| Issued in reinvestment of distributions | 4,664 | | 56,479 | | 5,796 | | 91,643 | |
| Redeemed | (14,730) | | (190,718) | | (28,760) | | (428,170) | |
| 6,488 | | 81,522 | | (8,258) | | (111,555) | |
| R Class | | | | |
| Sold | 5,328,307 | | 68,990,132 | | 4,158,879 | | 62,428,975 | |
| Issued in reinvestment of distributions | 1,035,145 | | 12,566,659 | | 921,479 | | 14,605,444 | |
| Redeemed | (2,614,415) | | (33,944,664) | | (2,408,655) | | (36,045,905) | |
| 3,749,037 | | 47,612,127 | | 2,671,703 | | 40,988,514 | |
| R6 Class | | | | |
| Sold | 9,679,267 | | 109,241,275 | | 12,008,171 | | 169,189,795 | |
| Issued in reinvestment of distributions | 2,114,476 | | 22,223,140 | | 2,650,958 | | 36,768,783 | |
| Redeemed | (7,124,795) | | (80,905,414) | | (16,011,430) | | (214,021,765) | |
| 4,668,948 | | 50,559,001 | | (1,352,301) | | (8,063,187) | |
| Net increase (decrease) | 6,096,063 | | $ | 66,377,416 | | (387,468) | | $ | 616,751 | |
| | | | | | | | | | | | | | |
| Year ended
July 31, 2023 | Year ended
July 31, 2022 |
| Shares | Amount | Shares | Amount |
| One Choice 2055 Portfolio | | | | |
| Investor Class | | | | |
| Sold | 2,286,683 | | $ | 33,323,809 | | 2,511,013 | | $ | 42,871,698 | |
| Issued in reinvestment of distributions | 506,049 | | 6,877,220 | | 592,880 | | 10,505,826 | |
| Redeemed | (3,260,165) | | (46,789,620) | | (2,599,386) | | (43,572,623) | |
| (467,433) | | (6,588,591) | | 504,507 | | 9,804,901 | |
| I Class | | | | |
| Sold | 4,199,858 | | 60,274,724 | | 3,796,881 | | 67,025,465 | |
| Issued in reinvestment of distributions | 685,903 | | 9,321,418 | | 788,250 | | 13,959,905 | |
| Redeemed | (5,796,349) | | (83,529,293) | | (5,971,140) | | (109,233,140) | |
| (910,588) | | (13,933,151) | | (1,386,009) | | (28,247,770) | |
| A Class | | | | |
| Sold | 1,115,876 | | 16,213,623 | | 1,067,414 | | 17,936,036 | |
| Issued in reinvestment of distributions | 248,430 | | 3,373,676 | | 274,436 | | 4,857,524 | |
| Redeemed | (1,027,402) | | (14,901,207) | | (1,400,844) | | (24,444,616) | |
| 336,904 | | 4,686,092 | | (58,994) | | (1,651,056) | |
| C Class | | | | |
| Sold | 8,276 | | 118,943 | | 9,737 | | 158,413 | |
| Issued in reinvestment of distributions | 2,705 | | 36,512 | | 3,398 | | 59,803 | |
| Redeemed | (13,594) | | (192,139) | | (15,093) | | (260,260) | |
| (2,613) | | (36,684) | | (1,958) | | (42,044) | |
| R Class | | | | |
| Sold | 4,047,394 | | 58,743,670 | | 2,994,294 | | 50,124,086 | |
| Issued in reinvestment of distributions | 599,495 | | 8,153,121 | | 552,581 | | 9,797,257 | |
| Redeemed | (1,699,040) | | (24,843,840) | | (1,495,227) | | (25,153,401) | |
| 2,947,849 | | 42,052,951 | | 2,051,648 | | 34,767,942 | |
| R6 Class | | | | |
| Sold | 6,741,860 | | 80,333,230 | | 9,118,052 | | 135,751,422 | |
| Issued in reinvestment of distributions | 1,421,925 | | 15,712,275 | | 1,848,638 | | 27,008,601 | |
| Redeemed | (5,081,492) | | (60,634,730) | | (10,613,938) | | (149,473,793) | |
| 3,082,293 | | 35,410,775 | | 352,752 | | 13,286,230 | |
| Net increase (decrease) | 4,986,412 | | $ | 61,591,392 | | 1,461,946 | | $ | 27,918,203 | |
| | | | | | | | | | | | | | |
| Year ended
July 31, 2023 | Year ended
July 31, 2022 |
| Shares | Amount | Shares | Amount |
| One Choice 2060 Portfolio | | | | |
| Investor Class | | | | |
| Sold | 1,519,402 | | $ | 20,090,452 | | 1,679,007 | | $ | 26,205,384 | |
| Issued in reinvestment of distributions | 305,038 | | 3,745,876 | | 234,388 | | 3,808,805 | |
| Redeemed | (1,790,811) | | (23,412,836) | | (1,276,655) | | (19,250,514) | |
| 33,629 | | 423,492 | | 636,740 | | 10,763,675 | |
| I Class | | | | |
| Sold | 1,740,693 | | 22,839,416 | | 1,405,808 | | 21,738,332 | |
| Issued in reinvestment of distributions | 311,595 | | 3,829,500 | | 218,612 | | 3,552,447 | |
| Redeemed | (1,261,891) | | (16,811,043) | | (2,322,844) | | (39,366,552) | |
| 790,397 | | 9,857,873 | | (698,424) | | (14,075,773) | |
| A Class | | | | |
| Sold | 616,536 | | 8,164,645 | | 567,954 | | 8,746,443 | |
| Issued in reinvestment of distributions | 124,292 | | 1,526,300 | | 89,283 | | 1,450,847 | |
| Redeemed | (422,579) | | (5,592,774) | | (552,126) | | (8,820,422) | |
| 318,249 | | 4,098,171 | | 105,111 | | 1,376,868 | |
| C Class | | | | |
| Sold | 1,966 | | 25,762 | | 1,364 | | 20,803 | |
| Issued in reinvestment of distributions | 1,220 | | 14,871 | | 918 | | 14,810 | |
| Redeemed | (326) | | (4,138) | | (1,655) | | (25,879) | |
| 2,860 | | 36,495 | | 627 | | 9,734 | |
| R Class | | | | |
| Sold | 3,178,954 | | 41,892,036 | | 2,348,676 | | 35,742,228 | |
| Issued in reinvestment of distributions | 458,981 | | 5,636,289 | | 251,869 | | 4,090,353 | |
| Redeemed | (1,004,470) | | (13,270,466) | | (689,257) | | (10,458,165) | |
| 2,633,465 | | 34,257,859 | | 1,911,288 | | 29,374,416 | |
| R6 Class | | | | |
| Sold | 4,416,669 | | 58,743,657 | | 4,707,360 | | 75,830,343 | |
| Issued in reinvestment of distributions | 571,210 | | 7,037,302 | | 482,305 | | 7,861,578 | |
| Redeemed | (2,435,252) | | (32,461,225) | | (4,205,608) | | (65,771,209) | |
| 2,552,627 | | 33,319,734 | | 984,057 | | 17,920,712 | |
| Net increase (decrease) | 6,331,227 | | $ | 81,993,624 | | 2,939,399 | | $ | 45,369,632 | |
| | | | | | | | | | | | | | |
| Year ended
July 31, 2023 | Year ended
July 31, 2022 |
| Shares | Amount | Shares | Amount |
| One Choice 2065 Portfolio | | | | |
| Investor Class | | | | |
| Sold | 322,066 | | $ | 3,394,681 | | 270,010 | | $ | 3,282,853 | |
| Issued in reinvestment of distributions | 17,357 | | 171,838 | | 9,903 | | 125,764 | |
| Redeemed | (199,557) | | (2,070,653) | | (122,428) | | (1,457,294) | |
| 139,866 | | 1,495,866 | | 157,485 | | 1,951,323 | |
| I Class | | | | |
| Sold | 625,465 | | 6,425,515 | | 239,832 | | 2,901,150 | |
| Issued in reinvestment of distributions | 25,204 | | 249,270 | | 8,186 | | 103,965 | |
| Redeemed | (242,211) | | (2,515,082) | | (89,604) | | (1,167,367) | |
| 408,458 | | 4,159,703 | | 158,414 | | 1,837,748 | |
| A Class | | | | |
| Sold | 157,531 | | 1,652,014 | | 82,714 | | 990,270 | |
| Issued in reinvestment of distributions | 5,391 | | 53,366 | | 1,740 | | 22,097 | |
| Redeemed | (12,892) | | (136,945) | | (32,006) | | (376,061) | |
| 150,030 | | 1,568,435 | | 52,448 | | 636,306 | |
| C Class | | | | |
| Sold | 7,403 | | 80,937 | | 604 | | 6,769 | |
| Issued in reinvestment of distributions | 124 | | 1,231 | | 84 | | 1,069 | |
| Redeemed | (355) | | (3,889) | | (6) | | (61) | |
| 7,172 | | 78,279 | | 682 | | 7,777 | |
| R Class | | | | |
| Sold | 1,072,441 | | 11,295,024 | | 549,930 | | 6,435,359 | |
| Issued in reinvestment of distributions | 37,194 | | 368,219 | | 10,170 | | 129,272 | |
| Redeemed | (125,768) | | (1,328,987) | | (51,932) | | (615,977) | |
| 983,867 | | 10,334,256 | | 508,168 | | 5,948,654 | |
| R6 Class | | | | |
| Sold | 1,035,405 | | 10,939,694 | | 1,043,512 | | 12,777,114 | |
| Issued in reinvestment of distributions | 58,394 | | 578,097 | | 32,058 | | 407,453 | |
| Redeemed | (543,707) | | (5,749,371) | | (325,597) | | (3,926,405) | |
| 550,092 | | 5,768,420 | | 749,973 | | 9,258,162 | |
| Net increase (decrease) | 2,239,485 | | $ | 23,404,959 | | 1,627,170 | | $ | 19,639,970 | |
6. Fair Value Measurements
The funds' investment valuation process is based on several considerations and may use multiple inputs to determine the fair value of the investments held by the funds. In conformity with accounting principles generally accepted in the United States of America, the inputs used to determine a valuation are classified into three broad levels.
•Level 1 valuation inputs consist of unadjusted quoted prices in an active market for identical investments.
•Level 2 valuation inputs consist of direct or indirect observable market data (including quoted prices for comparable investments, evaluations of subsequent market events, interest rates, prepayment speeds, credit risk, etc.). These inputs also consist of quoted prices for identical investments initially expressed in local currencies that are adjusted through translation into U.S. dollars.
•Level 3 valuation inputs consist of unobservable data (including a fund’s own assumptions).
The level classification is based on the lowest level input that is significant to the fair valuation measurement. The valuation inputs are not necessarily an indication of the risks associated with investing in these securities or other financial instruments.
As of period end, the funds' investment securities were classified as Level 1. The Schedules of Investments provide additional information on the funds' portfolio holdings.
7. Federal Tax Information
The tax character of distributions paid during the years ended July 31, 2023 and July 31, 2022 were as follows:
| | | | | | | | | | | | | | |
| 2023 | 2022 |
| Distributions Paid From: | Distributions Paid From: |
| Ordinary Income | Long-term
Capital Gains | Ordinary Income | Long-term
Capital Gains |
| One Choice In Retirement Portfolio | $ | 51,327,879 | $ | 44,889,225 | $ | 108,359,575 | $ | 93,401,184 |
| One Choice 2025 Portfolio | $ | 49,471,109 | $ | 38,310,880 | $ | 94,900,771 | $ | 103,116,479 |
| One Choice 2030 Portfolio | $ | 43,187,180 | $ | 49,425,064 | $ | 85,856,361 | $ | 82,254,854 |
| One Choice 2035 Portfolio | $ | 46,708,031 | $ | 64,848,036 | $ | 99,913,863 | $ | 94,334,007 |
| One Choice 2040 Portfolio | $ | 30,365,611 | $ | 53,996,431 | $ | 72,149,829 | $ | 69,143,794 |
| One Choice 2045 Portfolio | $ | 28,156,539 | $ | 63,805,280 | $ | 77,619,627 | $ | 75,845,264 |
| One Choice 2050 Portfolio | $ | 17,382,372 | $ | 50,361,528 | $ | 56,690,831 | $ | 41,546,689 |
| One Choice 2055 Portfolio | $ | 11,530,347 | $ | 32,561,156 | $ | 38,773,925 | $ | 28,232,049 |
| One Choice 2060 Portfolio | $ | 4,993,974 | $ | 16,967,605 | $ | 14,854,738 | $ | 6,091,652 |
| One Choice 2065 Portfolio | $ | 558,369 | $ | 865,926 | $ | 768,078 | $ | 21,542 |
The book-basis character of distributions made during the year from net investment income or net realized gains may differ from their ultimate characterization for federal income tax purposes. These differences reflect the differing character of certain income items and net realized gains and losses for financial statement and tax purposes, and may result in reclassification among certain capital accounts on the financial statements.
As of period end, the federal tax cost of investments and the components of distributable earnings on a tax-basis were as follows:
| | | | | | | | | | | | | | | | | |
| One Choice In Retirement Portfolio | One Choice 2025 Portfolio | One Choice 2030 Portfolio | One Choice 2035 Portfolio | One Choice 2040 Portfolio |
| Federal tax cost of investments | $ | 1,711,440,471 | | $ | 1,633,287,773 | | $ | 1,610,500,242 | | $ | 1,791,475,839 | | $ | 1,304,860,051 | |
| Gross tax appreciation of investments | $ | 228,031,056 | | $ | 240,991,414 | | $ | 216,758,451 | | $ | 291,360,060 | | $ | 199,401,697 | |
| Gross tax depreciation of investments | (96,549,378) | | (93,417,117) | | (92,476,963) | | (101,392,507) | | (65,586,067) | |
| Net tax appreciation (depreciation) of investments | $ | 131,481,678 | | $ | 147,574,297 | | $ | 124,281,488 | | $ | 189,967,553 | | $ | 133,815,630 | |
| Undistributed ordinary income | — | | $ | 11,112,701 | | $ | 11,265,421 | | $ | 11,439,225 | | $ | 7,105,069 | |
| Accumulated long-term gains | $ | 36,405,671 | | $ | 33,548,198 | | $ | 8,689,970 | | $ | 15,376,548 | | $ | 3,326,300 | |
| | | | | | | | | | | | | | | | | |
| One Choice 2045 Portfolio | One Choice 2050 Portfolio | One Choice 2055 Portfolio | One Choice 2060 Portfolio | One Choice 2065 Portfolio |
| Federal tax cost of investments | $ | 1,323,495,422 | | $ | 1,024,322,544 | | $ | 727,458,015 | | $ | 383,041,601 | | $ | 51,812,751 | |
| Gross tax appreciation of investments | $ | 243,989,182 | | $ | 160,259,661 | | $ | 97,439,767 | | $ | 30,857,442 | | $ | 1,488,478 | |
| Gross tax depreciation of investments | (58,477,467) | | (32,840,087) | | (17,430,020) | | (11,141,508) | | (1,289,093) | |
| Net tax appreciation (depreciation) of investments | $ | 185,511,715 | | $ | 127,419,574 | | $ | 80,009,747 | | $ | 19,715,934 | | $ | 199,385 | |
| Undistributed ordinary income | $ | 5,689,351 | | $ | 2,838,081 | | $ | 1,249,922 | | $ | 408,444 | | $ | 40,368 | |
| Accumulated long-term gains | $ | 7,885,212 | | $ | 241,261 | | — | | — | | $ | 45,750 | |
| Accumulated short-term capital losses | — | | — | | $ | (3,281,780) | | $ | (1,141,727) | | — | |
| Accumulated long-term capital losses | — | | — | | $ | (815,792) | | — | | — | |
The difference between book-basis and tax-basis unrealized appreciation (depreciation) is attributable primarily to the tax deferral of losses on wash sales.
Accumulated capital losses represent net capital loss carryovers that may be used to offset future realized capital gains for federal income tax purposes. The capital loss carryovers may be carried forward for an unlimited period. Future capital loss carryover utilization in any given year may be subject to Internal Revenue Code limitations.
8. Investments in Underlying Funds
The funds do not invest in the underlying funds for the purpose of exercising management or control; however, investments by the funds within their investment strategies may represent a significant portion of the underlying funds’ net assets.
9. Risk Factors
The value of the funds’ shares will go up and down based on the performance of the underlying funds in which they invest. The value of the underlying funds’ shares will, in turn, fluctuate based on the performance of the securities they own and other factors generally affecting the securities market. Market risks, including political, regulatory, economic and social developments, can affect the value of the funds’ investments. Natural disasters, public health emergencies, war, terrorism and other unforeseeable events may lead to increased market volatility and may have adverse long-term effects on world economies and markets generally.
10. Affiliated Fund Transactions
A summary of transactions for each underlying fund for the period ended July 31, 2023 follows:
| | | | | | | | | | | | | | | | | | | | | | | | | | |
Fund/Underlying Fund(1) | Beginning
Value | Purchase
Cost | Sales
Cost | Change in Net Unrealized Appreciation (Depreciation) | Ending
Value | Ending
Shares | Net Realized
Gain (Loss) | Distributions Received(2) |
| One Choice In Retirement Portfolio (Amounts in thousands) |
| Diversified Bond Fund | $ | 401,445 | | $ | 59,860 | | $ | 45,299 | | $ | (23,265) | | $ | 392,741 | | 42,736 | | $ | (4,535) | | $ | 15,539 | |
| High Income Fund | 71,058 | | 5,675 | | 5,705 | | (100) | | 70,928 | | 8,515 | | (891) | | 4,825 | |
| Inflation-Adjusted Bond Fund | 60,757 | | 12,444 | | 542 | | (7,478) | | 65,181 | | 6,172 | | 10 | | 4,062 | |
| Short Duration Fund | 199,330 | | 9,859 | | 54,443 | | (1,659) | | 153,087 | | 15,864 | | (3,443) | | 6,225 | |
| Short Duration Inflation Protection Bond Fund | 144,602 | | 16,311 | | 6,597 | | (11,120) | | 143,196 | | 14,164 | | 168 | | 7,895 | |
| Disciplined Growth Fund | 58,099 | | 621 | | 18,116 | | 4,896 | | 45,500 | | 2,002 | | 1,019 | | 517 | |
| Focused Large Cap Value Fund | 185,334 | | 14,792 | | 46,888 | | (5,913) | | 147,325 | | 14,630 | | 7,131 | | 12,315 | |
| Growth Fund | 86,675 | | 3,554 | | 22,563 | | 121 | | 67,787 | | 1,382 | | 7,938 | | 1,995 | |
Heritage Fund(3) | 40,049 | | 11 | | 11,486 | | 3,433 | | 32,007 | | 1,274 | | 532 | | — | |
| Mid Cap Value Fund | 83,757 | | 5,287 | | 28,413 | | (7,463) | | 53,168 | | 3,296 | | 6,512 | | 5,110 | |
| Small Cap Growth Fund | 20,130 | | 133 | | 5,817 | | 2,192 | | 16,638 | | 808 | | (648) | | 133 | |
| Small Cap Value Fund | 19,930 | | 774 | | 3,211 | | (261) | | 17,232 | | 1,662 | | 594 | | 774 | |
| Sustainable Equity Fund | 143,471 | | 68,086 | | 54,247 | | 17,819 | | 175,129 | | 3,778 | | 3,032 | | 2,622 | |
| Emerging Markets Debt Fund | 22,164 | | 1,319 | | 1,962 | | 1,048 | | 22,569 | | 2,510 | | (305) | | 1,136 | |
| Global Bond Fund | 159,760 | | 56,046 | | 5,608 | | (13,923) | | 196,275 | | 22,823 | | (639) | | 11,059 | |
International Bond Fund(3) | 44,536 | | 1,210 | | 996 | | (1,461) | | 43,289 | | 3,990 | | (126) | | — | |
| Global Real Estate Fund | 20,873 | | 678 | | 3,277 | | (1,210) | | 17,064 | | 1,428 | | (418) | | 164 | |
International Growth Fund(3) | 86,624 | | 9,998 | | 26,151 | | 10,044 | | 80,515 | | 6,488 | | (701) | | — | |
| International Small-Mid Cap Fund | 10,068 | | 951 | | 1,824 | | 546 | | 9,741 | | 1,003 | | (414) | | 74 | |
| International Value Fund | 97,782 | | 16,838 | | 37,767 | | 16,697 | | 93,550 | | 11,032 | | (1,298) | | 3,427 | |
| Equity Growth Fund | 77,131 | | 5,821 | | 67,964 | | (14,988) | | — | | — | | 6,681 | | 5,620 | |
| $ | 2,033,575 | | $ | 290,268 | | $ | 448,876 | | $ | (32,045) | | $ | 1,842,922 | | 165,557 | | $ | 20,199 | | $ | 83,492 | |
(1)Underlying fund investments represent G Class.
(2)Distributions received includes distributions from net investment income and from capital gains, if any.
(3)Non-income producing.
| | | | | | | | | | | | | | | | | | | | | | | | | | |
Fund/Underlying Fund(1) | Beginning
Value | Purchase
Cost | Sales
Cost | Change in Net Unrealized Appreciation (Depreciation) | Ending
Value | Ending
Shares | Net Realized
Gain (Loss) | Distributions Received(2) |
| One Choice 2025 Portfolio (Amounts in thousands) |
| Diversified Bond Fund | $ | 385,811 | | $ | 52,425 | | $ | 37,786 | | $ | (23,236) | | $ | 377,214 | | 41,046 | | $ | (3,761) | | $ | 14,940 | |
| High Income Fund | 73,528 | | 5,998 | | 7,846 | | 178 | | 71,858 | | 8,626 | | (1,139) | | 4,954 | |
| Inflation-Adjusted Bond Fund | 70,409 | | 9,245 | | 2,095 | | (8,305) | | 69,254 | | 6,558 | | 33 | | 4,406 | |
| Short Duration Fund | 155,782 | | 13,051 | | 37,263 | | (1,686) | | 129,884 | | 13,459 | | (2,440) | | 5,109 | |
| Short Duration Inflation Protection Bond Fund | 110,277 | | 20,456 | | 2,286 | | (8,697) | | 119,750 | | 11,845 | | 17 | | 6,369 | |
| Disciplined Growth Fund | 59,737 | | 1,161 | | 19,529 | | 5,353 | | 46,722 | | 2,056 | | 681 | | 533 | |
| Focused Large Cap Value Fund | 181,210 | | 12,465 | | 45,516 | | (4,049) | | 144,110 | | 14,311 | | 5,244 | | 12,066 | |
| Growth Fund | 88,980 | | 4,444 | | 23,861 | | (327) | | 69,236 | | 1,411 | | 8,752 | | 2,055 | |
Heritage Fund(3) | 43,055 | | — | | 12,711 | | 3,184 | | 33,528 | | 1,334 | | 983 | | — | |
| Mid Cap Value Fund | 88,431 | | 5,404 | | 30,933 | | (7,740) | | 55,162 | | 3,420 | | 6,702 | | 5,303 | |
| Small Cap Growth Fund | 20,278 | | 133 | | 6,281 | | 2,577 | | 16,707 | | 812 | | (1,064) | | 133 | |
| Small Cap Value Fund | 20,089 | | 774 | | 3,333 | | (291) | | 17,239 | | 1,662 | | 584 | | 774 | |
| Sustainable Equity Fund | 141,107 | | 58,615 | | 44,627 | | 17,914 | | 173,009 | | 3,732 | | 2,819 | | 2,510 | |
| Emerging Markets Debt Fund | 27,515 | | 1,352 | | 4,378 | | 1,553 | | 26,042 | | 2,897 | | (678) | | 1,348 | |
| Global Bond Fund | 155,497 | | 50,000 | | 7,387 | | (13,237) | | 184,873 | | 21,497 | | (874) | | 10,547 | |
International Bond Fund(3) | 41,164 | | 845 | | 439 | | (1,407) | | 40,163 | | 3,702 | | (75) | | — | |
| Emerging Markets Fund | 6,815 | | 145 | | 1,848 | | (1,038) | | 4,074 | | 377 | | 1,094 | | 145 | |
| Global Real Estate Fund | 22,212 | | 682 | | 3,939 | | (1,053) | | 17,902 | | 1,498 | | (698) | | 172 | |
International Growth Fund(3) | 87,514 | | 8,844 | | 28,283 | | 11,409 | | 79,484 | | 6,405 | | (2,148) | | — | |
| International Small-Mid Cap Fund | 13,596 | | 852 | | 3,745 | | 993 | | 11,696 | | 1,205 | | (889) | | 92 | |
| International Value Fund | 92,863 | | 15,688 | | 35,394 | | 16,270 | | 89,427 | | 10,546 | | (1,676) | | 3,285 | |
| Non-U.S. Intrinsic Value Fund | 5,530 | | 227 | | 3,281 | | 1,052 | | 3,528 | | 332 | | (268) | | 227 | |
| Equity Growth Fund | 76,043 | | 5,567 | | 68,478 | | (13,132) | | — | | — | | 4,954 | | 5,483 | |
| $ | 1,967,443 | | $ | 268,373 | | $ | 431,239 | | $ | (23,715) | | $ | 1,780,862 | | 158,731 | | $ | 16,153 | | $ | 80,451 | |
(1)Underlying fund investments represent G Class.
(2)Distributions received includes distributions from net investment income and from capital gains, if any.
(3)Non-income producing.
| | | | | | | | | | | | | | | | | | | | | | | | | | |
Fund/Underlying Fund(1) | Beginning
Value | Purchase
Cost | Sales
Cost | Change in Net Unrealized Appreciation (Depreciation) | Ending
Value | Ending
Shares | Net Realized
Gain (Loss) | Distributions Received(2) |
| One Choice 2030 Portfolio (Amounts in thousands) |
| Diversified Bond Fund | $ | 337,615 | | $ | 65,857 | | $ | 26,212 | | $ | (19,831) | | $ | 357,429 | | 38,893 | | $ | (4,018) | | $ | 13,593 | |
| High Income Fund | 73,922 | | 6,611 | | 3,347 | | (464) | | 76,722 | | 9,210 | | (463) | | 5,085 | |
| Inflation-Adjusted Bond Fund | 77,481 | | 11,640 | | 1,428 | | (9,150) | | 78,543 | | 7,438 | | 8 | | 4,847 | |
| Short Duration Fund | 85,362 | | 8,939 | | 17,811 | | (1,131) | | 75,359 | | 7,809 | | (1,188) | | 2,900 | |
| Short Duration Inflation Protection Bond Fund | 57,099 | | 12,614 | | — | | (4,562) | | 65,151 | | 6,444 | | — | | 3,393 | |
| Disciplined Growth Fund | 54,187 | | 2,656 | | 15,141 | | 8,002 | | 49,704 | | 2,187 | | (1,311) | | 522 | |
Focused Dynamic Growth Fund(3) | 5,927 | | — | | 1,549 | | (20) | | 4,358 | | 87 | | 530 | | — | |
| Focused Large Cap Value Fund | 167,939 | | 16,253 | | 36,542 | | 660 | | 148,310 | | 14,728 | | 761 | | 11,540 | |
| Growth Fund | 91,188 | | 7,143 | | 27,498 | | 7,948 | | 78,781 | | 1,606 | | 1,845 | | 2,171 | |
Heritage Fund(3) | 50,631 | | 29 | | 14,880 | | 6,695 | | 42,475 | | 1,690 | | (1,476) | | — | |
| Mid Cap Value Fund | 92,180 | | 6,011 | | 30,101 | | (4,362) | | 63,728 | | 3,951 | | 3,372 | | 5,792 | |
| Small Cap Growth Fund | 18,937 | | 133 | | 3,336 | | 2,486 | | 18,220 | | 885 | | (877) | | 133 | |
| Small Cap Value Fund | 20,165 | | 782 | | 2,183 | | 92 | | 18,856 | | 1,818 | | 355 | | 782 | |
| Sustainable Equity Fund | 132,977 | | 68,799 | | 41,452 | | 19,080 | | 179,404 | | 3,870 | | 1,774 | | 2,511 | |
| Emerging Markets Fund | 20,833 | | 556 | | 5,107 | | 1,661 | | 17,943 | | 1,660 | | (1,231) | | 556 | |
| Global Real Estate Fund | 23,790 | | 1,290 | | 2,704 | | (1,143) | | 21,233 | | 1,777 | | (656) | | 192 | |
International Growth Fund(3) | 87,122 | | 9,820 | | 25,417 | | 13,590 | | 85,115 | | 6,859 | | (3,985) | | — | |
| International Small-Mid Cap Fund | 18,629 | | 1,448 | | 3,327 | | 1,250 | | 18,000 | | 1,854 | | (1,049) | | 130 | |
| International Value Fund | 79,028 | | 13,377 | | 23,522 | | 14,825 | | 83,708 | | 9,871 | | (1,621) | | 2,853 | |
| Non-U.S. Intrinsic Value Fund | 16,383 | | 789 | | 6,671 | | 3,347 | | 13,848 | | 1,302 | | (554) | | 789 | |
| Emerging Markets Debt Fund | 34,649 | | 2,046 | | 3,195 | | 1,660 | | 35,160 | | 3,911 | | (507) | | 1,750 | |
| Global Bond Fund | 140,908 | | 41,452 | | 1,654 | | (12,192) | | 168,514 | | 19,595 | | (239) | | 9,187 | |
International Bond Fund(3) | 32,885 | | 2,508 | | — | | (1,172) | | 34,221 | | 3,154 | | — | | — | |
| Equity Growth Fund | 70,553 | | 5,307 | | 72,494 | | (3,366) | | — | | — | | (4,348) | | 5,204 | |
| $ | 1,790,390 | | $ | 286,060 | | $ | 365,571 | | $ | 23,903 | | $ | 1,734,782 | | 150,599 | | $ | (14,878) | | $ | 73,930 | |
(1)Underlying fund investments represent G Class.
(2)Distributions received includes distributions from net investment income and from capital gains, if any.
(3)Non-income producing.
| | | | | | | | | | | | | | | | | | | | | | | | | | |
Fund/Underlying Fund(1) | Beginning
Value | Purchase
Cost | Sales
Cost | Change in Net Unrealized Appreciation (Depreciation) | Ending
Value | Ending
Shares | Net Realized
Gain (Loss) | Distributions Received(2) |
| One Choice 2035 Portfolio (Amounts in thousands) |
| Disciplined Growth Fund | $ | 53,172 | | $ | 2,999 | | $ | 13,022 | | $ | 8,393 | | $ | 51,542 | | 2,268 | | $ | (1,385) | | $ | 529 | |
Focused Dynamic Growth Fund(3) | 20,989 | | 253 | | 4,478 | | 1,731 | | 18,495 | | 370 | | 563 | | — | |
| Focused Large Cap Value Fund | 198,151 | | 17,133 | | 37,576 | | 469 | | 178,177 | | 17,694 | | 1,197 | | 13,777 | |
| Growth Fund | 114,511 | | 8,642 | | 31,334 | | 10,110 | | 101,929 | | 2,078 | | 2,838 | | 2,756 | |
Heritage Fund(3) | 74,643 | | 575 | | 20,336 | | 9,640 | | 64,522 | | 2,568 | | (1,636) | | — | |
| Mid Cap Value Fund | 117,618 | | 8,685 | | 33,218 | | (5,230) | | 87,855 | | 5,447 | | 3,837 | | 7,793 | |
| Small Cap Growth Fund | 23,488 | | 166 | | 3,756 | | 2,945 | | 22,843 | | 1,110 | | (829) | | 166 | |
| Small Cap Value Fund | 25,457 | | 971 | | 2,867 | | 100 | | 23,661 | | 2,282 | | 572 | | 970 | |
| Sustainable Equity Fund | 156,251 | | 80,928 | | 43,543 | | 23,219 | | 216,855 | | 4,678 | | 2,371 | | 3,005 | |
| Diversified Bond Fund | 367,365 | | 74,741 | | 38,705 | | (19,707) | | 383,694 | | 41,751 | | (6,354) | | 14,755 | |
| High Income Fund | 88,216 | | 7,739 | | 5,667 | | (308) | | 89,980 | | 10,802 | | (806) | | 6,083 | |
| Inflation-Adjusted Bond Fund | 86,385 | | 13,109 | | 676 | | (10,228) | | 88,590 | | 8,389 | | (16) | | 5,442 | |
| Short Duration Fund | 50,633 | | 3,912 | | 9,866 | | (673) | | 44,006 | | 4,560 | | (692) | | 1,720 | |
| Short Duration Inflation Protection Bond Fund | 32,878 | | 5,669 | | — | | (2,612) | | 35,935 | | 3,554 | | — | | 1,936 | |
| Emerging Markets Fund | 46,833 | | 1,300 | | 9,941 | | 4,036 | | 42,228 | | 3,906 | | (2,850) | | 1,300 | |
| Global Real Estate Fund | 33,405 | | 1,415 | | 3,354 | | (1,553) | | 29,913 | | 2,503 | | (731) | | 261 | |
International Growth Fund(3) | 106,567 | | 8,172 | | 27,027 | | 16,385 | | 104,097 | | 8,388 | | (4,632) | | — | |
| International Small-Mid Cap Fund | 29,765 | | 1,798 | | 3,750 | | 1,525 | | 29,338 | | 3,021 | | (1,129) | | 200 | |
| International Value Fund | 81,953 | | 12,675 | | 21,244 | | 16,267 | | 89,651 | | 10,572 | | (2,217) | | 2,962 | |
| Non-U.S. Intrinsic Value Fund | 31,910 | | 1,648 | | 11,440 | | 6,652 | | 28,770 | | 2,704 | | (716) | | 1,648 | |
| Emerging Markets Debt Fund | 46,437 | | 2,397 | | 3,278 | | 2,101 | | 47,657 | | 5,301 | | (540) | | 2,397 | |
| Global Bond Fund | 154,113 | | 34,185 | | 2,141 | | (12,871) | | 173,286 | | 20,150 | | (373) | | 9,641 | |
International Bond Fund(3) | 24,021 | | 5,211 | | — | | (813) | | 28,419 | | 2,619 | | — | | — | |
| Equity Growth Fund | 83,640 | | 6,133 | | 82,469 | | (7,304) | | — | | — | | (1,806) | | 6,132 | |
| $ | 2,048,401 | | $ | 300,456 | | $ | 409,688 | | $ | 42,274 | | $ | 1,981,443 | | 166,715 | | $ | (15,334) | | $ | 83,473 | |
(1)Underlying fund investments represent G Class.
(2)Distributions received includes distributions from net investment income and from capital gains, if any.
(3)Non-income producing.
| | | | | | | | | | | | | | | | | | | | | | | | | | |
Fund/Underlying Fund(1) | Beginning
Value | Purchase
Cost | Sales
Cost | Change in Net Unrealized Appreciation (Depreciation) | Ending
Value | Ending
Shares | Net Realized
Gain (Loss) | Distributions Received(2) |
| One Choice 2040 Portfolio (Amounts in thousands) |
| Disciplined Growth Fund | $ | 29,698 | | $ | 2,150 | | $ | 5,887 | | $ | 5,256 | | $ | 31,217 | | 1,373 | | $ | (930) | | $ | 305 | |
Focused Dynamic Growth Fund(3) | 28,186 | | 1,383 | | 7,390 | | 3,210 | | 25,389 | | 507 | | 69 | | — | |
| Focused Large Cap Value Fund | 144,907 | | 15,493 | | 23,510 | | 1,146 | | 138,036 | | 13,708 | | 296 | | 10,250 | |
| Growth Fund | 88,263 | | 9,289 | | 25,013 | | 9,951 | | 82,490 | | 1,681 | | 828 | | 2,150 | |
Heritage Fund(3) | 68,671 | | 2,520 | | 17,732 | | 8,601 | | 62,060 | | 2,470 | | (794) | | — | |
| Mid Cap Value Fund | 91,080 | | 8,926 | | 21,313 | | (2,860) | | 75,833 | | 4,701 | | 1,701 | | 6,483 | |
| Small Cap Growth Fund | 18,047 | | 194 | | 2,298 | | 2,164 | | 18,107 | | 880 | | (488) | | 128 | |
| Small Cap Value Fund | 19,056 | | 1,658 | | 2,159 | | 199 | | 18,754 | | 1,808 | | 446 | | 751 | |
| Sustainable Equity Fund | 113,878 | | 62,564 | | 28,338 | | 17,895 | | 165,999 | | 3,581 | | 1,691 | | 2,223 | |
| Diversified Bond Fund | 241,777 | | 62,426 | | 32,695 | | (11,799) | | 259,709 | | 28,260 | | (5,330) | | 9,786 | |
| High Income Fund | 60,586 | | 5,808 | | 2,146 | | (457) | | 63,791 | | 7,658 | | (305) | | 4,226 | |
| Inflation-Adjusted Bond Fund | 51,569 | | 9,299 | | — | | (6,177) | | 54,691 | | 5,179 | | — | | 3,301 | |
| Short Duration Fund | 9,253 | | 2,193 | | 599 | | (234) | | 10,613 | | 1,100 | | (43) | | 379 | |
| Short Duration Inflation Protection Bond Fund | 6,110 | | 2,998 | | — | | (550) | | 8,558 | | 846 | | — | | 439 | |
| Emerging Markets Fund | 55,924 | | 3,736 | | 13,189 | | 5,322 | | 51,793 | | 4,791 | | (3,558) | | 1,548 | |
| Global Real Estate Fund | 27,264 | | 1,409 | | 2,000 | | (1,413) | | 25,260 | | 2,114 | | (401) | | 220 | |
International Growth Fund(3) | 80,382 | | 5,732 | | 18,225 | | 12,004 | | 79,893 | | 6,438 | | (3,230) | | — | |
| International Small-Mid Cap Fund | 28,014 | | 720 | | 3,906 | | 1,470 | | 26,298 | | 2,708 | | (1,142) | | 180 | |
| International Value Fund | 51,560 | | 5,595 | | 10,131 | | 9,541 | | 56,565 | | 6,670 | | (768) | | 1,804 | |
| Non-U.S. Intrinsic Value Fund | 33,210 | | 1,751 | | 10,749 | | 7,004 | | 31,216 | | 2,934 | | (712) | | 1,751 | |
| Emerging Markets Debt Fund | 35,034 | | 1,826 | | 1,784 | | 1,482 | | 36,558 | | 4,067 | | (297) | | 1,826 | |
| Global Bond Fund | 98,256 | | 21,242 | | 2,597 | | (7,802) | | 109,099 | | 12,686 | | (450) | | 5,981 | |
International Bond Fund(3) | 4,453 | | 2,428 | | — | | (134) | | 6,747 | | 622 | | — | | — | |
| Equity Growth Fund | 60,339 | | 4,852 | | 65,169 | | (22) | | — | | — | | (6,640) | | 4,498 | |
| $ | 1,445,517 | | $ | 236,192 | | $ | 296,830 | | $ | 53,797 | | $ | 1,438,676 | | 116,782 | | $ | (20,057) | | $ | 58,229 | |
(1)Underlying fund investments represent G Class.
(2)Distributions received includes distributions from net investment income and from capital gains, if any.
(3)Non-income producing.
| | | | | | | | | | | | | | | | | | | | | | | | | | |
Fund/Underlying Fund(1) | Beginning
Value | Purchase
Cost | Sales
Cost | Change in Net Unrealized Appreciation (Depreciation) | Ending
Value | Ending
Shares | Net Realized
Gain (Loss) | Distributions Received(2) |
| One Choice 2045 Portfolio (Amounts in thousands) |
| Disciplined Growth Fund | $ | 20,103 | | $ | 2,918 | | $ | 3,580 | | $ | 3,935 | | $ | 23,376 | | 1,028 | | $ | (507) | | $ | 224 | |
Focused Dynamic Growth Fund(3) | 44,235 | | 2,602 | | 11,824 | | 5,405 | | 40,418 | | 808 | | (13) | | — | |
| Focused Large Cap Value Fund | 162,276 | | 17,966 | | 24,890 | | 812 | | 156,164 | | 15,508 | | 730 | | 11,481 | |
| Growth Fund | 99,063 | | 8,318 | | 23,722 | | 10,943 | | 94,602 | | 1,928 | | 1,475 | | 2,438 | |
Heritage Fund(3) | 85,085 | | 3,657 | | 19,249 | | 11,542 | | 81,035 | | 3,225 | | (1,541) | | — | |
| Mid Cap Value Fund | 102,583 | | 11,581 | | 19,357 | | (2,966) | | 91,841 | | 5,694 | | 1,518 | | 7,685 | |
| Small Cap Growth Fund | 20,724 | | 145 | | 3,022 | | 2,554 | | 20,401 | | 991 | | (680) | | 144 | |
| Small Cap Value Fund | 22,061 | | 2,142 | | 3,453 | | 75 | | 20,825 | | 2,008 | | 650 | | 847 | |
| Sustainable Equity Fund | 125,641 | | 67,295 | | 28,051 | | 20,021 | | 184,906 | | 3,988 | | 1,840 | | 2,445 | |
| Diversified Bond Fund | 218,751 | | 60,759 | | 31,480 | | (10,568) | | 237,462 | | 25,839 | | (5,299) | | 8,904 | |
| High Income Fund | 56,695 | | 6,080 | | 2,874 | | (329) | | 59,572 | | 7,152 | | (435) | | 3,941 | |
| Inflation-Adjusted Bond Fund | 45,554 | | 6,909 | | 341 | | (5,326) | | 46,796 | | 4,431 | | (28) | | 2,846 | |
| Emerging Markets Fund | 74,473 | | 7,139 | | 13,830 | | 7,545 | | 75,327 | | 6,968 | | (4,743) | | 2,171 | |
| Global Real Estate Fund | 31,508 | | 2,719 | | 2,174 | | (1,614) | | 30,439 | | 2,547 | | (432) | | 262 | |
International Growth Fund(3) | 89,158 | | 3,340 | | 17,687 | | 12,881 | | 87,692 | | 7,066 | | (3,273) | | — | |
| International Small-Mid Cap Fund | 32,835 | | 1,024 | | 2,692 | | 1,370 | | 32,537 | | 3,351 | | (938) | | 218 | |
| International Value Fund | 51,562 | | 4,457 | | 10,217 | | 9,482 | | 55,284 | | 6,519 | | (718) | | 1,753 | |
| Non-U.S. Intrinsic Value Fund | 41,173 | | 2,378 | | 12,617 | | 8,789 | | 39,723 | | 3,733 | | (709) | | 2,212 | |
| Emerging Markets Debt Fund | 32,770 | | 1,841 | | 143 | | 1,171 | | 35,639 | | 3,964 | | (20) | | 1,777 | |
| Global Bond Fund | 88,424 | | 16,913 | | 3,665 | | (6,704) | | 94,968 | | 11,043 | | (654) | | 5,255 | |
| Equity Growth Fund | 66,695 | | 4,994 | | 68,253 | | (3,436) | | — | | — | | (3,991) | | 4,991 | |
| $ | 1,511,369 | | $ | 235,177 | | $ | 303,121 | | $ | 65,582 | | $ | 1,509,007 | | 117,791 | | $ | (17,768) | | $ | 59,594 | |
(1)Underlying fund investments represent G Class.
(2)Distributions received includes distributions from net investment income and from capital gains, if any.
(3)Non-income producing.
| | | | | | | | | | | | | | | | | | | | | | | | | | |
Fund/Underlying Fund(1) | Beginning
Value | Purchase
Cost | Sales
Cost | Change in Net Unrealized Appreciation (Depreciation) | Ending
Value | Ending
Shares | Net Realized
Gain (Loss) | Distributions Received(2) |
| One Choice 2050 Portfolio (Amounts in thousands) |
| Disciplined Growth Fund | $ | 5,977 | | $ | 2,069 | | — | | $ | 1,386 | | $ | 9,432 | | 415 | | — | | $ | 79 | |
Focused Dynamic Growth Fund(3) | 44,293 | | 5,268 | | $ | 11,554 | | 6,429 | | 44,436 | | 888 | | $ | (147) | | — | |
| Focused Large Cap Value Fund | 124,662 | | 19,636 | | 14,959 | | 2,047 | | 131,386 | | 13,047 | | (535) | | 9,126 | |
| Growth Fund | 76,399 | | 9,711 | | 17,171 | | 10,815 | | 79,754 | | 1,626 | | 128 | | 1,925 | |
Heritage Fund(3) | 65,288 | | 5,950 | | 12,079 | | 9,199 | | 68,358 | | 2,720 | | (790) | | — | |
| Mid Cap Value Fund | 79,683 | | 11,303 | | 12,024 | | (1,016) | | 77,946 | | 4,832 | | 89 | | 6,096 | |
| Small Cap Growth Fund | 15,798 | | 708 | | 1,303 | | 1,892 | | 17,095 | | 831 | | (343) | | 114 | |
| Small Cap Value Fund | 16,672 | | 2,665 | | 1,938 | | 417 | | 17,816 | | 1,718 | | 305 | | 674 | |
| Sustainable Equity Fund | 96,575 | | 55,822 | | 14,526 | | 17,489 | | 155,360 | | 3,351 | | 975 | | 1,936 | |
| Emerging Markets Fund | 57,706 | | 10,133 | | 10,534 | | 6,231 | | 63,536 | | 5,878 | | (3,636) | | 1,712 | |
| Global Real Estate Fund | 25,104 | | 2,991 | | 1,228 | | (1,252) | | 25,615 | | 2,143 | | (244) | | 207 | |
International Growth Fund(3) | 68,780 | | 5,640 | | 11,078 | | 9,939 | | 73,281 | | 5,905 | | (2,009) | | — | |
| International Small-Mid Cap Fund | 25,492 | | 2,151 | | 1,572 | | 972 | | 27,043 | | 2,785 | | (594) | | 175 | |
| International Value Fund | 36,627 | | 4,199 | | 5,350 | | 6,939 | | 42,415 | | 5,002 | | (441) | | 1,279 | |
| Non-U.S. Intrinsic Value Fund | 35,771 | | 2,205 | | 8,380 | | 7,796 | | 37,392 | | 3,514 | | (628) | | 1,935 | |
| Diversified Bond Fund | 121,816 | | 45,833 | | 20,507 | | (5,563) | | 141,579 | | 15,406 | | (3,288) | | 5,107 | |
| High Income Fund | 30,981 | | 4,622 | | 312 | | (330) | | 34,961 | | 4,197 | | (38) | | 2,251 | |
| Inflation-Adjusted Bond Fund | 25,237 | | 5,423 | | — | | (3,027) | | 27,633 | | 2,617 | | — | | 1,640 | |
| Emerging Markets Debt Fund | 17,637 | | 2,675 | | 268 | | 697 | | 20,741 | | 2,307 | | (41) | | 1,014 | |
| Global Bond Fund | 49,168 | | 12,080 | | 1,373 | | (3,912) | | 55,963 | | 6,507 | | (245) | | 3,015 | |
| Equity Growth Fund | 50,591 | | 4,604 | | 58,278 | | 3,083 | | — | | — | | (8,881) | | 3,914 | |
| $ | 1,070,257 | | $ | 215,688 | | $ | 204,434 | | $ | 70,231 | | $ | 1,151,742 | | 85,689 | | $ | (20,363) | | $ | 42,199 | |
(1)Underlying fund investments represent G Class.
(2)Distributions received includes distributions from net investment income and from capital gains, if any.
(3)Non-income producing.
| | | | | | | | | | | | | | | | | | | | | | | | | | |
Fund/Underlying Fund(1) | Beginning
Value | Purchase
Cost | Sales
Cost | Change in Net Unrealized Appreciation (Depreciation) | Ending
Value | Ending
Shares | Net Realized
Gain (Loss) | Distributions Received(2) |
| One Choice 2055 Portfolio (Amounts in thousands) |
Focused Dynamic Growth Fund(3) | $ | 37,093 | | $ | 5,637 | | $ | 8,764 | | $ | 6,272 | | $ | 40,238 | | 804 | | $ | (589) | | — | |
| Focused Large Cap Value Fund | 88,546 | | 19,877 | | 11,686 | | 1,882 | | 98,619 | | 9,793 | | (801) | | $ | 6,693 | |
| Growth Fund | 55,106 | | 8,156 | | 11,757 | | 8,482 | | 59,987 | | 1,223 | | (276) | | 1,410 | |
Heritage Fund(3) | 47,522 | | 5,721 | | 9,129 | | 7,113 | | 51,227 | | 2,038 | | (838) | | — | |
| Mid Cap Value Fund | 56,690 | | 10,563 | | 8,716 | | (328) | | 58,209 | | 3,609 | | (309) | | 4,461 | |
| Small Cap Growth Fund | 11,372 | | 933 | | 1,098 | | 1,456 | | 12,663 | | 615 | | (295) | | 83 | |
| Small Cap Value Fund | 12,097 | | 2,295 | | 1,317 | | 431 | | 13,506 | | 1,302 | | 159 | | 494 | |
| Sustainable Equity Fund | 69,615 | | 44,411 | | 10,447 | | 13,371 | | 116,950 | | 2,523 | | 431 | | 1,417 | |
| Emerging Markets Fund | 41,323 | | 10,282 | | 8,542 | | 4,823 | | 47,886 | | 4,430 | | (2,874) | | 1,249 | |
| Global Real Estate Fund | 17,746 | | 3,241 | | 862 | | (832) | | 19,293 | | 1,614 | | (167) | | 151 | |
International Growth Fund(3) | 49,655 | | 5,453 | | 7,321 | | 7,441 | | 55,228 | | 4,450 | | (1,547) | | — | |
| International Small-Mid Cap Fund | 18,661 | | 2,238 | | 1,090 | | 759 | | 20,568 | | 2,118 | | (428) | | 128 | |
| International Value Fund | 25,004 | | 4,060 | | 3,686 | | 4,885 | | 30,263 | | 3,569 | | (290) | | 883 | |
| Non-U.S. Intrinsic Value Fund | 26,404 | | 4,008 | | 6,532 | | 6,238 | | 30,118 | | 2,831 | | (466) | | 1,506 | |
| Diversified Bond Fund | 66,678 | | 26,274 | | 12,969 | | (2,889) | | 77,094 | | 8,389 | | (1,995) | | 2,766 | |
| High Income Fund | 17,131 | | 2,974 | | 1,111 | | (52) | | 18,942 | | 2,274 | | (167) | | 1,223 | |
| Inflation-Adjusted Bond Fund | 13,615 | | 3,275 | | 265 | | (1,605) | | 15,020 | | 1,422 | | (41) | | 897 | |
| Emerging Markets Debt Fund | 9,956 | | 1,348 | | 479 | | 445 | | 11,270 | | 1,254 | | (87) | | 549 | |
| Global Bond Fund | 26,436 | | 7,982 | | 2,015 | | (2,016) | | 30,387 | | 3,533 | | (303) | | 1,662 | |
| Equity Growth Fund | 36,446 | | 3,702 | | 45,114 | | 4,966 | | — | | — | | (9,161) | | 2,843 | |
| $ | 727,096 | | $ | 172,430 | | $ | 152,900 | | $ | 60,842 | | $ | 807,468 | | 57,791 | | $ | (20,044) | | $ | 28,415 | |
(1)Underlying fund investments represent G Class.
(2)Distributions received includes distributions from net investment income and from capital gains, if any.
(3)Non-income producing.
| | | | | | | | | | | | | | | | | | | | | | | | | | |
Fund/Underlying Fund(1) | Beginning
Value | Purchase
Cost | Sales
Cost | Change in Net Unrealized Appreciation (Depreciation) | Ending
Value | Ending
Shares | Net Realized
Gain (Loss) | Distributions Received(2) |
| One Choice 2060 Portfolio (Amounts in thousands) |
Focused Dynamic Growth Fund(3) | $ | 16,147 | | $ | 4,327 | | $ | 3,586 | | $ | 3,647 | | $ | 20,535 | | 410 | | $ | (580) | | — | |
| Focused Large Cap Value Fund | 39,241 | | 13,571 | | 2,912 | | 906 | | 50,806 | | 5,045 | | (245) | | $ | 3,094 | |
| Growth Fund | 24,047 | | 6,336 | | 4,622 | | 4,892 | | 30,653 | | 625 | | (476) | | 649 | |
Heritage Fund(3) | 20,567 | | 5,271 | | 3,560 | | 3,847 | | 26,125 | | 1,040 | | (640) | | — | |
| Mid Cap Value Fund | 24,830 | | 7,924 | | 2,921 | | 11 | | 29,844 | | 1,850 | | (200) | | 2,060 | |
| Small Cap Growth Fund | 5,039 | | 1,063 | | 217 | | 658 | | 6,543 | | 318 | | (64) | | 38 | |
| Small Cap Value Fund | 5,191 | | 1,626 | | 285 | | 343 | | 6,875 | | 663 | | (20) | | 232 | |
| Sustainable Equity Fund | 30,424 | | 25,775 | | 3,566 | | 7,139 | | 59,772 | | 1,289 | | (24) | | 649 | |
| Emerging Markets Fund | 18,341 | | 7,401 | | 3,502 | | 2,356 | | 24,596 | | 2,275 | | (1,223) | | 576 | |
| Global Real Estate Fund | 7,901 | | 2,683 | | 317 | | (333) | | 9,934 | | 831 | | (64) | | 69 | |
International Growth Fund(3) | 21,774 | | 5,815 | | 2,496 | | 3,516 | | 28,609 | | 2,305 | | (586) | | — | |
| International Small-Mid Cap Fund | 8,256 | | 2,316 | | 220 | | 277 | | 10,629 | | 1,095 | | (87) | | 64 | |
| International Value Fund | 10,756 | | 2,782 | | 827 | | 2,339 | | 15,050 | | 1,775 | | (157) | | 391 | |
| Non-U.S. Intrinsic Value Fund | 11,904 | | 3,044 | | 2,116 | | 3,062 | | 15,894 | | 1,494 | | (151) | | 705 | |
| Diversified Bond Fund | 24,844 | | 14,145 | | 4,236 | | (1,209) | | 33,544 | | 3,650 | | (665) | | 1,112 | |
| High Income Fund | 6,208 | | 2,409 | | 200 | | (39) | | 8,378 | | 1,006 | | (28) | | 487 | |
| Inflation-Adjusted Bond Fund | 5,001 | | 2,303 | | 35 | | (629) | | 6,640 | | 629 | | (5) | | 352 | |
| Emerging Markets Debt Fund | 3,672 | | 1,175 | | 9 | | 151 | | 4,989 | | 555 | | (2) | | 222 | |
| Global Bond Fund | 9,875 | | 4,954 | | 735 | | (752) | | 13,342 | | 1,551 | | (106) | | 634 | |
| Equity Growth Fund | 16,136 | | 2,313 | | 21,027 | | 2,578 | | — | | — | | (4,468) | | 1,293 | |
| $ | 310,154 | | $ | 117,233 | | $ | 57,389 | | $ | 32,760 | | $ | 402,758 | | 28,406 | | $ | (9,791) | | $ | 12,627 | |
(1)Underlying fund investments represent G Class.
(2)Distributions received includes distributions from net investment income and from capital gains, if any.
(3)Non-income producing.
| | | | | | | | | | | | | | | | | | | | | | | | | | |
Fund/Underlying Fund(1) | Beginning
Value | Purchase
Cost | Sales
Cost | Change in Net Unrealized Appreciation (Depreciation) | Ending
Value | Ending
Shares | Net Realized
Gain (Loss) | Distributions Received(2) |
| One Choice 2065 Portfolio (Amounts in thousands) |
Focused Dynamic Growth Fund(3) | $ | 1,345 | | $ | 1,335 | | $ | 588 | | $ | 609 | | $ | 2,701 | | 54 | | $ | (174) | | — | |
| Focused Large Cap Value Fund | 3,275 | | 3,792 | | 644 | | 257 | | 6,680 | | 663 | | (137) | | $ | 348 | |
| Growth Fund | 2,010 | | 2,003 | | 760 | | 815 | | 4,068 | | 83 | | (175) | | 73 | |
Heritage Fund(3) | 1,727 | | 1,681 | | 536 | | 572 | | 3,444 | | 137 | | (146) | | — | |
| Mid Cap Value Fund | 2,070 | | 2,308 | | 576 | | 130 | | 3,932 | | 244 | | (112) | | 231 | |
| Small Cap Growth Fund | 418 | | 410 | | 75 | | 110 | | 863 | | 42 | | (25) | | 4 | |
| Small Cap Value Fund | 417 | | 481 | | 97 | | 72 | | 873 | | 84 | | (17) | | 26 | |
| Sustainable Equity Fund | 2,515 | | 5,217 | | 914 | | 1,066 | | 7,884 | | 170 | | (111) | | 72 | |
| Emerging Markets Fund | 1,534 | | 1,856 | | 474 | | 365 | | 3,281 | | 304 | | (182) | | 64 | |
| Global Real Estate Fund | 654 | | 748 | | 128 | | 30 | | 1,304 | | 109 | | (43) | | 8 | |
International Growth Fund(3) | 1,790 | | 2,007 | | 572 | | 553 | | 3,778 | | 304 | | (155) | | — | |
| International Small-Mid Cap Fund | 676 | | 763 | | 135 | | 98 | | 1,402 | | 144 | | (53) | | 8 | |
| International Value Fund | 889 | | 896 | | 161 | | 305 | | 1,929 | | 227 | | (31) | | 42 | |
| Non-U.S. Intrinsic Value Fund | 1,016 | | 899 | | 191 | | 398 | | 2,122 | | 199 | | (19) | | 78 | |
| Diversified Bond Fund | 1,882 | | 2,648 | | 583 | | (72) | | 3,875 | | 422 | | (89) | | 114 | |
| High Income Fund | 474 | | 560 | | 68 | | 11 | | 977 | | 117 | | (12) | | 50 | |
| Inflation-Adjusted Bond Fund | 376 | | 501 | | 61 | | (46) | | 770 | | 73 | | (11) | | 36 | |
| Emerging Markets Debt Fund | 282 | | 310 | | 34 | | 24 | | 582 | | 65 | | (6) | | 23 | |
| Global Bond Fund | 751 | | 991 | | 151 | | (44) | | 1,547 | | 180 | | (29) | | 61 | |
| Equity Growth Fund | 1,348 | | 617 | | 2,199 | | 234 | | — | | — | | (414) | | 140 | |
| $ | 25,449 | | $ | 30,023 | | $ | 8,947 | | $ | 5,487 | | $ | 52,012 | | 3,621 | | $ | (1,941) | | $ | 1,378 | |
(1)Underlying fund investments represent G Class.
(2)Distributions received includes distributions from net investment income and from capital gains, if any.
(3)Non-income producing.
| | | | | | | | | | | | | | | | | | | | | | | | | | | | | | | | | | | | | | | | | | | | | | | |
| For a Share Outstanding Throughout the Years Ended July 31 (except as noted) | | | | | | | |
| Per-Share Data | | | Ratios and Supplemental Data |
| | Income From Investment Operations*: | Distributions From: | | | Ratio to Average Net Assets of: | | |
| Net Asset
Value,
Beginning
of Period | Net Investment Income (Loss)(1) | Net
Realized
and
Unrealized
Gain (Loss) | Total From
Investment
Operations | Net
Investment
Income | Net
Realized
Gains | Total
Distributions | Net Asset
Value,
End of Period | Total Return(2) | Operating
Expenses | Operating
Expenses
(before
expense
waiver) | Net
Investment
Income
(Loss) | Net
Investment
Income (Loss) (before expense waiver) | Portfolio
Turnover
Rate | Net
Assets,
End of
Period (in thousands) |
| One Choice In Retirement Portfolio | | | | | | | | | | | |
| Investor Class | | | | | | | | | | | | | |
| 2023 | $12.21 | 0.32 | 0.06 | 0.38 | (0.30) | (0.27) | (0.57) | $12.02 | 3.44% | 0.74% | 0.78% | 2.77% | 2.73% | 16% | $748,717 | |
| 2022 | $14.39 | 0.58 | (1.65) | (1.07) | (0.56) | (0.55) | (1.11) | $12.21 | (8.11)% | 0.74% | 0.77% | 4.31% | 4.28% | 18% | $826,119 | |
| 2021 | $13.15 | 0.18 | 1.78 | 1.96 | (0.16) | (0.56) | (0.72) | $14.39 | 15.64% | 0.74% | 0.77% | 1.34% | 1.31% | 29% | $991,945 | |
| 2020 | $13.23 | 0.23 | 0.64 | 0.87 | (0.23) | (0.72) | (0.95) | $13.15 | 6.67% | 0.74% | 0.77% | 1.80% | 1.77% | 24% | $607,393 | |
| 2019 | $13.47 | 0.33 | 0.20 | 0.53 | (0.33) | (0.44) | (0.77) | $13.23 | 4.55% | 0.74% | 0.77% | 2.58% | 2.55% | 19% | $735,213 | |
| I Class | | | | | | | | | | | |
| 2023 | $12.21 | 0.35 | 0.05 | 0.40 | (0.32) | (0.27) | (0.59) | $12.02 | 3.64% | 0.54% | 0.59% | 2.97% | 2.92% | 16% | $237,898 | |
| 2022 | $14.39 | 0.62 | (1.66) | (1.04) | (0.59) | (0.55) | (1.14) | $12.21 | (7.92)% | 0.54% | 0.58% | 4.51% | 4.47% | 18% | $306,979 | |
| 2021 | $13.15 | 0.21 | 1.78 | 1.99 | (0.19) | (0.56) | (0.75) | $14.39 | 15.78% | 0.54% | 0.59% | 1.54% | 1.49% | 29% | $537,817 | |
| 2020 | $13.24 | 0.26 | 0.62 | 0.88 | (0.25) | (0.72) | (0.97) | $13.15 | 6.88% | 0.54% | 0.60% | 2.00% | 1.94% | 24% | $191,356 | |
| 2019 | $13.47 | 0.37 | 0.20 | 0.57 | (0.36) | (0.44) | (0.80) | $13.24 | 4.84% | 0.54% | 0.59% | 2.78% | 2.73% | 19% | $254,459 | |
| | | | | | | | | | | | | | | | | | | | | | | | | | | | | | | | | | | | | | | | | | | | | | | |
| For a Share Outstanding Throughout the Years Ended July 31 (except as noted) | | | | | | | |
| Per-Share Data | | | Ratios and Supplemental Data |
| | Income From Investment Operations*: | Distributions From: | | | Ratio to Average Net Assets of: | | |
| Net Asset
Value,
Beginning
of Period | Net Investment Income (Loss)(1) | Net
Realized
and
Unrealized
Gain (Loss) | Total From
Investment
Operations | Net
Investment
Income | Net
Realized
Gains | Total
Distributions | Net Asset
Value,
End of Period | Total Return(2) | Operating
Expenses | Operating
Expenses
(before
expense
waiver) | Net
Investment
Income
(Loss) | Net
Investment
Income (Loss) (before expense waiver) | Portfolio
Turnover
Rate | Net
Assets,
End of
Period (in thousands) |
| A Class | | | | | | | | | | | | | | |
| 2023 | $12.21 | 0.29 | 0.06 | 0.35 | (0.27) | (0.27) | (0.54) | $12.02 | 3.18% | 0.99% | 1.03% | 2.52% | 2.48% | 16% | $190,934 | |
| 2022 | $14.39 | 0.54 | (1.65) | (1.11) | (0.52) | (0.55) | (1.07) | $12.21 | (8.34)% | 0.99% | 1.02% | 4.06% | 4.03% | 18% | $202,196 | |
| 2021 | $13.15 | 0.15 | 1.78 | 1.93 | (0.13) | (0.56) | (0.69) | $14.39 | 15.28% | 0.99% | 1.02% | 1.09% | 1.06% | 29% | $267,135 | |
| 2020 | $13.24 | 0.19 | 0.63 | 0.82 | (0.19) | (0.72) | (0.91) | $13.15 | 6.40% | 0.99% | 1.02% | 1.55% | 1.52% | 24% | $114,462 | |
| 2019 | $13.47 | 0.31 | 0.20 | 0.51 | (0.30) | (0.44) | (0.74) | $13.24 | 4.36% | 0.99% | 1.02% | 2.33% | 2.30% | 19% | $153,056 | |
| C Class | | | | | | | | | | | | | | |
| 2023 | $12.07 | 0.20 | 0.06 | 0.26 | (0.18) | (0.27) | (0.45) | $11.88 | 2.44% | 1.74% | 1.78% | 1.77% | 1.73% | 16% | $1,962 | |
| 2022 | $14.25 | 0.46 | (1.65) | (1.19) | (0.44) | (0.55) | (0.99) | $12.07 | (9.03)% | 1.74% | 1.77% | 3.31% | 3.28% | 18% | $2,664 | |
| 2021 | $13.08 | 0.06 | 1.75 | 1.81 | (0.08) | (0.56) | (0.64) | $14.25 | 14.40% | 1.74% | 1.77% | 0.34% | 0.31% | 29% | $4,636 | |
| 2020 | $13.18 | 0.10 | 0.63 | 0.73 | (0.11) | (0.72) | (0.83) | $13.08 | 5.65% | 1.74% | 1.77% | 0.80% | 0.77% | 24% | $3,020 | |
| 2019 | $13.43 | 0.22 | 0.18 | 0.40 | (0.21) | (0.44) | (0.65) | $13.18 | 3.50% | 1.74% | 1.77% | 1.58% | 1.55% | 19% | $4,077 | |
| R Class | | | | | | | | | | | | | | |
| 2023 | $12.17 | 0.26 | 0.06 | 0.32 | (0.24) | (0.27) | (0.51) | $11.98 | 2.93% | 1.24% | 1.28% | 2.27% | 2.23% | 16% | $230,485 | |
| 2022 | $14.35 | 0.51 | (1.65) | (1.14) | (0.49) | (0.55) | (1.04) | $12.17 | (8.60)% | 1.24% | 1.27% | 3.81% | 3.78% | 18% | $229,286 | |
| 2021 | $13.13 | 0.12 | 1.77 | 1.89 | (0.11) | (0.56) | (0.67) | $14.35 | 15.00% | 1.24% | 1.27% | 0.84% | 0.81% | 29% | $268,946 | |
| 2020 | $13.22 | 0.16 | 0.63 | 0.79 | (0.16) | (0.72) | (0.88) | $13.13 | 6.15% | 1.24% | 1.27% | 1.30% | 1.27% | 24% | $129,338 | |
| 2019 | $13.45 | 0.27 | 0.21 | 0.48 | (0.27) | (0.44) | (0.71) | $13.22 | 4.11% | 1.24% | 1.27% | 2.08% | 2.05% | 19% | $139,359 | |
| | | | | | | | | | | | | | | | | | | | | | | | | | | | | | | | | | | | | | | | | | | | | | | |
| For a Share Outstanding Throughout the Years Ended July 31 (except as noted) | | | | | | | |
| Per-Share Data | | | Ratios and Supplemental Data |
| | Income From Investment Operations*: | Distributions From: | | | Ratio to Average Net Assets of: | | |
| Net Asset
Value,
Beginning
of Period | Net Investment Income (Loss)(1) | Net
Realized
and
Unrealized
Gain (Loss) | Total From
Investment
Operations | Net
Investment
Income | Net
Realized
Gains | Total
Distributions | Net Asset
Value,
End of Period | Total Return(2) | Operating
Expenses | Operating
Expenses
(before
expense
waiver) | Net
Investment
Income
(Loss) | Net
Investment
Income (Loss) (before expense waiver) | Portfolio
Turnover
Rate | Net
Assets,
End of
Period (in thousands) |
| R6 Class | | | | | | | | | | | | | | |
| 2023 | $9.55 | 0.28 | 0.04 | 0.32 | (0.34) | (0.27) | (0.61) | $9.26 | 3.81% | 0.39% | 0.49% | 3.12% | 3.02% | 16% | $432,925 | |
| 2022 | $11.50 | 0.51 | (1.30) | (0.79) | (0.61) | (0.55) | (1.16) | $9.55 | (7.75)% | 0.39% | 0.48% | 4.66% | 4.57% | 18% | $466,333�� | |
| 2021 | $10.66 | 0.18 | 1.43 | 1.61 | (0.21) | (0.56) | (0.77) | $11.50 | 15.94% | 0.39% | 0.50% | 1.69% | 1.58% | 29% | $608,763 | |
| 2020 | $10.91 | 0.22 | 0.52 | 0.74 | (0.27) | (0.72) | (0.99) | $10.66 | 7.08% | 0.39% | 0.51% | 2.15% | 2.03% | 24% | $221,796 | |
| 2019 | $11.25 | 0.32 | 0.16 | 0.48 | (0.38) | (0.44) | (0.82) | $10.91 | 5.00% | 0.39% | 0.52% | 2.93% | 2.80% | 19% | $225,207 | |
| | |
| Notes to Financial Highlights |
(1)Computed using average shares outstanding throughout the period.
(2)Total returns are calculated based on the net asset value of the last business day and do not reflect applicable sales charges, if any. Total returns for periods less than one year are not annualized.
*The amount shown for a share outstanding throughout the period may not correlate with the Statement(s) of Operations or precisely reflect the class expense differentials due to the timing of transactions in shares of a fund in relation to income earned and/or fluctuations in the fair value of a fund's investments.
See Notes to Financial Statements.
| | | | | | | | | | | | | | | | | | | | | | | | | | | | | | | | | | | | | | | | | | | | | | | |
| For a Share Outstanding Throughout the Years Ended July 31 (except as noted) | | | | | | | |
| Per-Share Data | | | Ratios and Supplemental Data |
| | Income From Investment Operations*: | Distributions From: | | | Ratio to Average Net Assets of: | | |
| Net Asset
Value,
Beginning
of Period | Net Investment Income (Loss)(1) | Net
Realized
and
Unrealized
Gain (Loss) | Total From
Investment
Operations | Net
Investment
Income | Net
Realized
Gains | Total
Distributions | Net Asset
Value,
End of Period | Total Return(2) | Operating
Expenses | Operating
Expenses
(before
expense
waiver) | Net
Investment
Income
(Loss) | Net
Investment
Income (Loss) (before expense waiver) | Portfolio
Turnover
Rate | Net
Assets,
End of
Period (in thousands) |
| One Choice 2025 Portfolio | | | | | | | | | | | |
| Investor Class | | | | | | | | | | | | | |
| 2023 | $13.70 | 0.36 | 0.08 | 0.44 | (0.32) | (0.25) | (0.57) | $13.57 | 3.60% | 0.76% | 0.79% | 2.71% | 2.68% | 15% | $636,549 | |
| 2022 | $16.17 | 0.67 | (1.92) | (1.25) | (0.55) | (0.67) | (1.22) | $13.70 | (8.54)% | 0.76% | 0.78% | 4.42% | 4.40% | 15% | $712,029 | |
| 2021 | $14.70 | 0.20 | 2.21 | 2.41 | (0.17) | (0.77) | (0.94) | $16.17 | 16.85% | 0.76% | 0.79% | 1.27% | 1.24% | 19% | $879,425 | |
| 2020 | $14.78 | 0.26 | 0.75 | 1.01 | (0.22) | (0.87) | (1.09) | $14.70 | 6.99% | 0.76% | 0.80% | 1.82% | 1.78% | 26% | $867,457 | |
| 2019 | $15.15 | 0.38 | 0.18 | 0.56 | (0.37) | (0.56) | (0.93) | $14.78 | 4.47% | 0.76% | 0.80% | 2.61% | 2.57% | 18% | $1,003,059 | |
| I Class | | | | | | | | | | | |
| 2023 | $13.71 | 0.39 | 0.08 | 0.47 | (0.35) | (0.25) | (0.60) | $13.58 | 3.81% | 0.56% | 0.60% | 2.91% | 2.87% | 15% | $245,803 | |
| 2022 | $16.19 | 0.71 | (1.94) | (1.23) | (0.58) | (0.67) | (1.25) | $13.71 | (8.40)% | 0.56% | 0.59% | 4.62% | 4.59% | 15% | $320,347 | |
| 2021 | $14.72 | 0.22 | 2.22 | 2.44 | (0.20) | (0.77) | (0.97) | $16.19 | 17.15% | 0.56% | 0.61% | 1.47% | 1.42% | 19% | $541,299 | |
| 2020 | $14.80 | 0.30 | 0.74 | 1.04 | (0.25) | (0.87) | (1.12) | $14.72 | 7.13% | 0.56% | 0.62% | 2.02% | 1.96% | 26% | $512,042 | |
| 2019 | $15.16 | 0.41 | 0.19 | 0.60 | (0.40) | (0.56) | (0.96) | $14.80 | 4.75% | 0.56% | 0.62% | 2.81% | 2.75% | 18% | $624,560 | |
| | | | | | | | | | | | | | | | | | | | | | | | | | | | | | | | | | | | | | | | | | | | | | | |
| For a Share Outstanding Throughout the Years Ended July 31 (except as noted) | | | | | | | |
| Per-Share Data | | | Ratios and Supplemental Data |
| | Income From Investment Operations*: | Distributions From: | | | Ratio to Average Net Assets of: | | |
| Net Asset
Value,
Beginning
of Period | Net Investment Income (Loss)(1) | Net
Realized
and
Unrealized
Gain (Loss) | Total From
Investment
Operations | Net
Investment
Income | Net
Realized
Gains | Total
Distributions | Net Asset
Value,
End of Period | Total Return(2) | Operating
Expenses | Operating
Expenses
(before
expense
waiver) | Net
Investment
Income
(Loss) | Net
Investment
Income (Loss) (before expense waiver) | Portfolio
Turnover
Rate | Net
Assets,
End of
Period (in thousands) |
| A Class | | | | | | | | | | | | | | |
| 2023 | $13.68 | 0.32 | 0.09 | 0.41 | (0.29) | (0.25) | (0.54) | $13.55 | 3.34% | 1.01% | 1.04% | 2.46% | 2.43% | 15% | $158,130 | |
| 2022 | $16.15 | 0.63 | (1.92) | (1.29) | (0.51) | (0.67) | (1.18) | $13.68 | (8.79)% | 1.01% | 1.03% | 4.17% | 4.15% | 15% | $179,681 | |
| 2021 | $14.68 | 0.16 | 2.21 | 2.37 | (0.13) | (0.77) | (0.90) | $16.15 | 16.57% | 1.01% | 1.04% | 1.02% | 0.99% | 19% | $243,677 | |
| 2020 | $14.76 | 0.22 | 0.75 | 0.97 | (0.18) | (0.87) | (1.05) | $14.68 | 6.72% | 1.01% | 1.05% | 1.57% | 1.53% | 26% | $231,738 | |
| 2019 | $15.13 | 0.34 | 0.19 | 0.53 | (0.34) | (0.56) | (0.90) | $14.76 | 4.21% | 1.01% | 1.05% | 2.36% | 2.32% | 18% | $297,582 | |
| C Class | | | | | | | | | | | | | | |
| 2023 | $13.66 | 0.22 | 0.09 | 0.31 | (0.19) | (0.25) | (0.44) | $13.53 | 2.55% | 1.76% | 1.79% | 1.71% | 1.68% | 15% | $1,874 | |
| 2022 | $16.12 | 0.55 | (1.95) | (1.40) | (0.39) | (0.67) | (1.06) | $13.66 | (9.45)% | 1.76% | 1.78% | 3.42% | 3.40% | 15% | $2,007 | |
| 2021 | $14.65 | 0.05 | 2.20 | 2.25 | (0.01) | (0.77) | (0.78) | $16.12 | 15.70% | 1.76% | 1.79% | 0.27% | 0.24% | 19% | $3,256 | |
| 2020 | $14.73 | 0.11 | 0.75 | 0.86 | (0.07) | (0.87) | (0.94) | $14.65 | 5.90% | 1.76% | 1.80% | 0.82% | 0.78% | 26% | $4,332 | |
| 2019 | $15.09 | 0.23 | 0.20 | 0.43 | (0.23) | (0.56) | (0.79) | $14.73 | 3.48% | 1.76% | 1.80% | 1.61% | 1.57% | 18% | $4,562 | |
| R Class | | | | | | | | | | | | | | |
| 2023 | $13.66 | 0.29 | 0.09 | 0.38 | (0.26) | (0.25) | (0.51) | $13.53 | 3.08% | 1.26% | 1.29% | 2.21% | 2.18% | 15% | $245,509 | |
| 2022 | $16.13 | 0.58 | (1.91) | (1.33) | (0.47) | (0.67) | (1.14) | $13.66 | (9.04)% | 1.26% | 1.28% | 3.92% | 3.90% | 15% | $233,649 | |
| 2021 | $14.66 | 0.12 | 2.21 | 2.33 | (0.09) | (0.77) | (0.86) | $16.13 | 16.29% | 1.26% | 1.29% | 0.77% | 0.74% | 19% | $255,643 | |
| 2020 | $14.74 | 0.18 | 0.75 | 0.93 | (0.14) | (0.87) | (1.01) | $14.66 | 6.45% | 1.26% | 1.30% | 1.32% | 1.28% | 26% | $211,271 | |
| 2019 | $15.11 | 0.30 | 0.19 | 0.49 | (0.30) | (0.56) | (0.86) | $14.74 | 3.94% | 1.26% | 1.30% | 2.11% | 2.07% | 18% | $210,971 | |
| | | | | | | | | | | | | | | | | | | | | | | | | | | | | | | | | | | | | | | | | | | | | | | |
| For a Share Outstanding Throughout the Years Ended July 31 (except as noted) | | | | | | | |
| Per-Share Data | | | Ratios and Supplemental Data |
| | Income From Investment Operations*: | Distributions From: | | | Ratio to Average Net Assets of: | | |
| Net Asset
Value,
Beginning
of Period | Net Investment Income (Loss)(1) | Net
Realized
and
Unrealized
Gain (Loss) | Total From
Investment
Operations | Net
Investment
Income | Net
Realized
Gains | Total
Distributions | Net Asset
Value,
End of Period | Total Return(2) | Operating
Expenses | Operating
Expenses
(before
expense
waiver) | Net
Investment
Income
(Loss) | Net
Investment
Income (Loss) (before expense waiver) | Portfolio
Turnover
Rate | Net
Assets,
End of
Period (in thousands) |
| R6 Class | | | | | | | | | | | | | | |
| 2023 | $9.93 | 0.29 | 0.05 | 0.34 | (0.37) | (0.25) | (0.62) | $9.65 | 3.98% | 0.41% | 0.50% | 3.06% | 2.97% | 15% | $492,979 | |
| 2022 | $12.07 | 0.54 | (1.40) | (0.86) | (0.61) | (0.67) | (1.28) | $9.93 | (8.26)% | 0.41% | 0.49% | 4.77% | 4.69% | 15% | $519,716 | |
| 2021 | $11.20 | 0.18 | 1.68 | 1.86 | (0.22) | (0.77) | (0.99) | $12.07 | 17.32% | 0.41% | 0.51% | 1.62% | 1.52% | 19% | $643,218 | |
| 2020 | $11.53 | 0.24 | 0.58 | 0.82 | (0.28) | (0.87) | (1.15) | $11.20 | 7.29% | 0.41% | 0.53% | 2.17% | 2.05% | 26% | $526,937 | |
| 2019 | $12.05 | 0.33 | 0.13 | 0.46 | (0.42) | (0.56) | (0.98) | $11.53 | 4.86% | 0.41% | 0.54% | 2.96% | 2.83% | 18% | $489,170 | |
| | |
| Notes to Financial Highlights |
(1)Computed using average shares outstanding throughout the period.
(2)Total returns are calculated based on the net asset value of the last business day and do not reflect applicable sales charges, if any. Total returns for periods less than one year are not annualized.
*The amount shown for a share outstanding throughout the period may not correlate with the Statement(s) of Operations or precisely reflect the class expense differentials due to the timing of transactions in shares of a fund in relation to income earned and/or fluctuations in the fair value of a fund's investments.
See Notes to Financial Statements.
| | | | | | | | | | | | | | | | | | | | | | | | | | | | | | | | | | | | | | | | | | | | | | | |
| For a Share Outstanding Throughout the Years Ended July 31 (except as noted) | | | | | | | |
| Per-Share Data | | | Ratios and Supplemental Data |
| | Income From Investment Operations*: | Distributions From: | | | Ratio to Average Net Assets of: | | |
| Net Asset
Value,
Beginning
of Period | Net Investment Income (Loss)(1) | Net
Realized
and
Unrealized
Gain (Loss) | Total From
Investment
Operations | Net
Investment
Income | Net
Realized
Gains | Total
Distributions | Net Asset
Value,
End of Period | Total Return(2) | Operating
Expenses | Operating
Expenses
(before
expense
waiver) | Net
Investment
Income
(Loss) | Net
Investment
Income (Loss) (before expense waiver) | Portfolio
Turnover
Rate | Net
Assets,
End of
Period (in thousands) |
| One Choice 2030 Portfolio | | | | | | | | | | | |
| Investor Class | | | | | | | | | | | | | |
| 2023 | $12.11 | 0.30 | 0.17 | 0.47 | (0.29) | (0.33) | (0.62) | $11.96 | 4.31% | 0.78% | 0.81% | 2.58% | 2.55% | 17% | $381,503 | |
| 2022 | $14.44 | 0.60 | (1.83) | (1.23) | (0.53) | (0.57) | (1.10) | $12.11 | (9.35)% | 0.78% | 0.81% | 4.53% | 4.50% | 17% | $428,278 | |
| 2021 | $12.89 | 0.18 | 2.15 | 2.33 | (0.15) | (0.63) | (0.78) | $14.44 | 18.62% | 0.78% | 0.82% | 1.25% | 1.21% | 19% | $491,652 | |
| 2020 | $12.90 | 0.24 | 0.70 | 0.94 | (0.20) | (0.75) | (0.95) | $12.89 | 7.47% | 0.78% | 0.83% | 1.86% | 1.81% | 27% | $503,229 | |
| 2019 | $13.28 | 0.31 | 0.16 | 0.47 | (0.33) | (0.52) | (0.85) | $12.90 | 4.38% | 0.78% | 0.83% | 2.56% | 2.51% | 20% | $664,953 | |
| I Class | | | | | | | | | | | |
| 2023 | $12.11 | 0.33 | 0.16 | 0.49 | (0.31) | (0.33) | (0.64) | $11.96 | 4.53% | 0.58% | 0.62% | 2.78% | 2.74% | 17% | $284,715 | |
| 2022 | $14.45 | 0.65 | (1.86) | (1.21) | (0.56) | (0.57) | (1.13) | $12.11 | (9.23)% | 0.58% | 0.62% | 4.73% | 4.69% | 17% | $348,341 | |
| 2021 | $12.89 | 0.20 | 2.17 | 2.37 | (0.18) | (0.63) | (0.81) | $14.45 | 18.94% | 0.58% | 0.63% | 1.45% | 1.40% | 19% | $582,440 | |
| 2020 | $12.90 | 0.26 | 0.71 | 0.97 | (0.23) | (0.75) | (0.98) | $12.89 | 7.69% | 0.58% | 0.64% | 2.06% | 2.00% | 27% | $524,709 | |
| 2019 | $13.28 | 0.36 | 0.13 | 0.49 | (0.35) | (0.52) | (0.87) | $12.90 | 4.59% | 0.58% | 0.64% | 2.76% | 2.70% | 20% | $625,840 | |
| A Class | | | | | | | | | | | | | | |
| 2023 | $12.08 | 0.27 | 0.16 | 0.43 | (0.26) | (0.33) | (0.59) | $11.92 | 3.97% | 1.03% | 1.06% | 2.33% | 2.30% | 17% | $151,849 | |
| 2022 | $14.40 | 0.57 | (1.82) | (1.25) | (0.50) | (0.57) | (1.07) | $12.08 | (9.54)% | 1.03% | 1.06% | 4.28% | 4.25% | 17% | $159,676 | |
| 2021 | $12.85 | 0.14 | 2.16 | 2.30 | (0.12) | (0.63) | (0.75) | $14.40 | 18.37% | 1.03% | 1.07% | 1.00% | 0.96% | 19% | $223,936 | |
| 2020 | $12.86 | 0.19 | 0.72 | 0.91 | (0.17) | (0.75) | (0.92) | $12.85 | 7.21% | 1.03% | 1.08% | 1.61% | 1.56% | 27% | $218,597 | |
| 2019 | $13.24 | 0.29 | 0.15 | 0.44 | (0.30) | (0.52) | (0.82) | $12.86 | 4.12% | 1.03% | 1.08% | 2.31% | 2.26% | 20% | $271,679 | |
| | | | | | | | | | | | | | | | | | | | | | | | | | | | | | | | | | | | | | | | | | | | | | | |
| For a Share Outstanding Throughout the Years Ended July 31 (except as noted) | | | | | | | |
| Per-Share Data | | | Ratios and Supplemental Data |
| | Income From Investment Operations*: | Distributions From: | | | Ratio to Average Net Assets of: | | |
| Net Asset
Value,
Beginning
of Period | Net Investment Income (Loss)(1) | Net
Realized
and
Unrealized
Gain (Loss) | Total From
Investment
Operations | Net
Investment
Income | Net
Realized
Gains | Total
Distributions | Net Asset
Value,
End of Period | Total Return(2) | Operating
Expenses | Operating
Expenses
(before
expense
waiver) | Net
Investment
Income
(Loss) | Net
Investment
Income (Loss) (before expense waiver) | Portfolio
Turnover
Rate | Net
Assets,
End of
Period (in thousands) |
| C Class | | | | | | | | | | | | | | |
| 2023 | $12.06 | 0.18 | 0.17 | 0.35 | (0.17) | (0.33) | (0.50) | $11.91 | 3.25% | 1.78% | 1.81% | 1.58% | 1.55% | 17% | $2,085 | |
| 2022 | $14.38 | 0.50 | (1.87) | (1.37) | (0.38) | (0.57) | (0.95) | $12.06 | (10.27)% | 1.78% | 1.81% | 3.53% | 3.50% | 17% | $2,244 | |
| 2021 | $12.83 | 0.04 | 2.15 | 2.19 | (0.01) | (0.63) | (0.64) | $14.38 | 17.48% | 1.78% | 1.82% | 0.25% | 0.21% | 19% | $3,547 | |
| 2020 | $12.84 | 0.10 | 0.71 | 0.81 | (0.07) | (0.75) | (0.82) | $12.83 | 6.38% | 1.78% | 1.83% | 0.86% | 0.81% | 27% | $3,540 | |
| 2019 | $13.22 | 0.20 | 0.15 | 0.35 | (0.21) | (0.52) | (0.73) | $12.84 | 3.31% | 1.78% | 1.83% | 1.56% | 1.51% | 20% | $4,387 | |
| R Class | | | | | | | | | | | | | | |
| 2023 | $12.07 | 0.24 | 0.16 | 0.40 | (0.23) | (0.33) | (0.56) | $11.91 | 3.70% | 1.28% | 1.31% | 2.08% | 2.05% | 17% | $327,843 | |
| 2022 | $14.39 | 0.53 | (1.82) | (1.29) | (0.46) | (0.57) | (1.03) | $12.07 | (9.79)% | 1.28% | 1.31% | 4.03% | 4.00% | 17% | $289,067 | |
| 2021 | $12.84 | 0.10 | 2.16 | 2.26 | (0.08) | (0.63) | (0.71) | $14.39 | 18.08% | 1.28% | 1.32% | 0.75% | 0.71% | 19% | $300,569 | |
| 2020 | $12.85 | 0.16 | 0.72 | 0.88 | (0.14) | (0.75) | (0.89) | $12.84 | 6.93% | 1.28% | 1.33% | 1.36% | 1.31% | 27% | $245,796 | |
| 2019 | $13.23 | 0.26 | 0.15 | 0.41 | (0.27) | (0.52) | (0.79) | $12.85 | 3.85% | 1.28% | 1.33% | 2.06% | 2.01% | 20% | $233,886 | |
| R6 Class | | | | | | | | | | | | | | |
| 2023 | $10.88 | 0.30 | 0.15 | 0.45 | (0.33) | (0.33) | (0.66) | $10.67 | 4.67% | 0.43% | 0.52% | 2.93% | 2.84% | 17% | $586,786 | |
| 2022 | $13.09 | 0.62 | (1.68) | (1.06) | (0.58) | (0.57) | (1.15) | $10.88 | (9.03)% | 0.43% | 0.51% | 4.88% | 4.80% | 17% | $562,783 | |
| 2021 | $11.75 | 0.20 | 1.97 | 2.17 | (0.20) | (0.63) | (0.83) | $13.09 | 19.11% | 0.43% | 0.53% | 1.60% | 1.50% | 19% | $622,491 | |
| 2020 | $11.85 | 0.25 | 0.65 | 0.90 | (0.25) | (0.75) | (1.00) | $11.75 | 7.79% | 0.43% | 0.55% | 2.21% | 2.09% | 27% | $503,360 | |
| 2019 | $12.28 | 0.34 | 0.12 | 0.46 | (0.37) | (0.52) | (0.89) | $11.85 | 4.74% | 0.43% | 0.56% | 2.91% | 2.78% | 20% | $465,684 | |
| | |
| Notes to Financial Highlights |
(1)Computed using average shares outstanding throughout the period.
(2)Total returns are calculated based on the net asset value of the last business day and do not reflect applicable sales charges, if any. Total returns for periods less than one year are not annualized.
*The amount shown for a share outstanding throughout the period may not correlate with the Statement(s) of Operations or precisely reflect the class expense differentials due to the timing of transactions in shares of a fund in relation to income earned and/or fluctuations in the fair value of a fund's investments.
See Notes to Financial Statements.
| | | | | | | | | | | | | | | | | | | | | | | | | | | | | | | | | | | | | | | | | | | | | | | |
| For a Share Outstanding Throughout the Years Ended July 31 (except as noted) | | | | | | | |
| Per-Share Data | | | Ratios and Supplemental Data |
| | Income From Investment Operations*: | Distributions From: | | | Ratio to Average Net Assets of: | | |
| Net Asset
Value,
Beginning
of Period | Net Investment Income (Loss)(1) | Net
Realized
and
Unrealized
Gain (Loss) | Total From
Investment
Operations | Net
Investment
Income | Net
Realized
Gains | Total
Distributions | Net Asset
Value,
End of Period | Total Return(2) | Operating
Expenses | Operating
Expenses
(before
expense
waiver) | Net
Investment
Income
(Loss) | Net
Investment
Income (Loss) (before expense waiver) | Portfolio
Turnover
Rate | Net
Assets,
End of
Period (in thousands) |
| One Choice 2035 Portfolio | | | | | | | | | | | |
| Investor Class | | | | | | | | | | | | | |
| 2023 | $15.30 | 0.35 | 0.34 | 0.69 | (0.30) | (0.43) | (0.73) | $15.26 | 5.05% | 0.82% | 0.85% | 2.40% | 2.37% | 15% | $572,770 | |
| 2022 | $18.29 | 0.77 | (2.47) | (1.70) | (0.62) | (0.67) | (1.29) | $15.30 | (10.19)% | 0.81% | 0.84% | 4.58% | 4.55% | 17% | $626,308 | |
| 2021 | $16.09 | 0.21 | 3.04 | 3.25 | (0.17) | (0.88) | (1.05) | $18.29 | 20.75% | 0.81% | 0.85% | 1.19% | 1.15% | 17% | $743,664 | |
| 2020 | $16.12 | 0.28 | 0.97 | 1.25 | (0.24) | (1.04) | (1.28) | $16.09 | 7.91% | 0.81% | 0.85% | 1.81% | 1.77% | 27% | $719,718 | |
| 2019 | $16.64 | 0.40 | 0.12 | 0.52 | (0.38) | (0.66) | (1.04) | $16.12 | 4.06% | 0.81% | 0.86% | 2.51% | 2.46% | 17% | $819,274 | |
| I Class | | | | | | | | | | | |
| 2023 | $15.33 | 0.39 | 0.34 | 0.73 | (0.33) | (0.43) | (0.76) | $15.30 | 5.33% | 0.62% | 0.66% | 2.60% | 2.56% | 15% | $277,988 | |
| 2022 | $18.32 | 0.83 | (2.50) | (1.67) | (0.65) | (0.67) | (1.32) | $15.33 | (9.98)% | 0.61% | 0.65% | 4.78% | 4.74% | 17% | $361,327 | |
| 2021 | $16.12 | 0.24 | 3.04 | 3.28 | (0.20) | (0.88) | (1.08) | $18.32 | 20.96% | 0.61% | 0.66% | 1.39% | 1.34% | 17% | $575,410 | |
| 2020 | $16.15 | 0.32 | 0.96 | 1.28 | (0.27) | (1.04) | (1.31) | $16.12 | 8.12% | 0.61% | 0.67% | 2.01% | 1.95% | 27% | $520,022 | |
| 2019 | $16.66 | 0.43 | 0.13 | 0.56 | (0.41) | (0.66) | (1.07) | $16.15 | 4.33% | 0.61% | 0.67% | 2.71% | 2.65% | 17% | $598,639 | |
| A Class | | | | | | | | | | | | | | |
| 2023 | $15.28 | 0.32 | 0.35 | 0.67 | (0.27) | (0.43) | (0.70) | $15.25 | 4.85% | 1.07% | 1.10% | 2.15% | 2.12% | 15% | $185,742 | |
| 2022 | $18.27 | 0.73 | (2.48) | (1.75) | (0.57) | (0.67) | (1.24) | $15.28 | (10.43)% | 1.06% | 1.09% | 4.33% | 4.30% | 17% | $189,012 | |
| 2021 | $16.07 | 0.16 | 3.04 | 3.20 | (0.12) | (0.88) | (1.00) | $18.27 | 20.47% | 1.06% | 1.10% | 0.94% | 0.90% | 17% | $254,130 | |
| 2020 | $16.11 | 0.24 | 0.96 | 1.20 | (0.20) | (1.04) | (1.24) | $16.07 | 7.57% | 1.06% | 1.10% | 1.56% | 1.52% | 27% | $234,875 | |
| 2019 | $16.61 | 0.36 | 0.14 | 0.50 | (0.34) | (0.66) | (1.00) | $16.11 | 3.92% | 1.06% | 1.11% | 2.26% | 2.21% | 17% | $290,779 | |
| | | | | | | | | | | | | | | | | | | | | | | | | | | | | | | | | | | | | | | | | | | | | | | |
| For a Share Outstanding Throughout the Years Ended July 31 (except as noted) | | | | | | | |
| Per-Share Data | | | Ratios and Supplemental Data |
| | Income From Investment Operations*: | Distributions From: | | | Ratio to Average Net Assets of: | | |
| Net Asset
Value,
Beginning
of Period | Net Investment Income (Loss)(1) | Net
Realized
and
Unrealized
Gain (Loss) | Total From
Investment
Operations | Net
Investment
Income | Net
Realized
Gains | Total
Distributions | Net Asset
Value,
End of Period | Total Return(2) | Operating
Expenses | Operating
Expenses
(before
expense
waiver) | Net
Investment
Income
(Loss) | Net
Investment
Income (Loss) (before expense waiver) | Portfolio
Turnover
Rate | Net
Assets,
End of
Period (in thousands) |
| C Class | | | | | | | | | | | | | | |
| 2023 | $15.21 | 0.21 | 0.35 | 0.56 | (0.16) | (0.43) | (0.59) | $15.18 | 4.06% | 1.82% | 1.85% | 1.40% | 1.37% | 15% | $1,071 | |
| 2022 | $18.18 | 0.66 | (2.53) | (1.87) | (0.43) | (0.67) | (1.10) | $15.21 | (11.07)% | 1.81% | 1.84% | 3.58% | 3.55% | 17% | $1,184 | |
| 2021 | $16.00 | 0.05 | 3.01 | 3.06 | — | (0.88) | (0.88) | $18.18 | 19.56% | 1.81% | 1.85% | 0.19% | 0.15% | 17% | $2,048 | |
| 2020 | $16.04 | 0.12 | 0.95 | 1.07 | (0.07) | (1.04) | (1.11) | $16.00 | 6.76% | 1.81% | 1.85% | 0.81% | 0.77% | 27% | $3,226 | |
| 2019 | $16.54 | 0.24 | 0.15 | 0.39 | (0.23) | (0.66) | (0.89) | $16.04 | 3.13% | 1.81% | 1.86% | 1.51% | 1.46% | 17% | $3,676 | |
| R Class | | | | | | | | | | | | | | |
| 2023 | $15.27 | 0.27 | 0.35 | 0.62 | (0.23) | (0.43) | (0.66) | $15.23 | 4.52% | 1.32% | 1.35% | 1.90% | 1.87% | 15% | $349,840 | |
| 2022 | $18.25 | 0.68 | (2.47) | (1.79) | (0.52) | (0.67) | (1.19) | $15.27 | (10.62)% | 1.31% | 1.34% | 4.08% | 4.05% | 17% | $297,839 | |
| 2021 | $16.05 | 0.12 | 3.04 | 3.16 | (0.08) | (0.88) | (0.96) | $18.25 | 20.18% | 1.31% | 1.35% | 0.69% | 0.65% | 17% | $307,513 | |
| 2020 | $16.09 | 0.20 | 0.95 | 1.15 | (0.15) | (1.04) | (1.19) | $16.05 | 7.29% | 1.31% | 1.35% | 1.31% | 1.27% | 27% | $241,416 | |
| 2019 | $16.60 | 0.31 | 0.14 | 0.45 | (0.30) | (0.66) | (0.96) | $16.09 | 3.60% | 1.31% | 1.36% | 2.01% | 1.96% | 17% | $227,954 | |
| R6 Class | | | | | | | | | | | | | | |
| 2023 | $10.22 | 0.26 | 0.21 | 0.47 | (0.35) | (0.43) | (0.78) | $9.91 | 5.49% | 0.47% | 0.55% | 2.75% | 2.67% | 15% | $594,019 | |
| 2022 | $12.66 | 0.59 | (1.68) | (1.09) | (0.68) | (0.67) | (1.35) | $10.22 | (9.90)% | 0.46% | 0.54% | 4.93% | 4.85% | 17% | $572,731 | |
| 2021 | $11.44 | 0.18 | 2.15 | 2.33 | (0.23) | (0.88) | (1.11) | $12.66 | 21.24% | 0.46% | 0.56% | 1.54% | 1.44% | 17% | $643,520 | |
| 2020 | $11.84 | 0.24 | 0.70 | 0.94 | (0.30) | (1.04) | (1.34) | $11.44 | 8.18% | 0.46% | 0.57% | 2.16% | 2.05% | 27% | $480,172 | |
| 2019 | $12.54 | 0.33 | 0.06 | 0.39 | (0.43) | (0.66) | (1.09) | $11.84 | 4.46% | 0.46% | 0.58% | 2.86% | 2.74% | 17% | $420,380 | |
| | |
| Notes to Financial Highlights |
(1)Computed using average shares outstanding throughout the period.
(2)Total returns are calculated based on the net asset value of the last business day and do not reflect applicable sales charges, if any. Total returns for periods less than one year are not annualized.
*The amount shown for a share outstanding throughout the period may not correlate with the Statement(s) of Operations or precisely reflect the class expense differentials due to the timing of transactions in shares of a fund in relation to income earned and/or fluctuations in the fair value of a fund's investments.
See Notes to Financial Statements.
| | | | | | | | | | | | | | | | | | | | | | | | | | | | | | | | | | | | | | | | | | | | | | | |
| For a Share Outstanding Throughout the Years Ended July 31 (except as noted) | | | | | | | |
| Per-Share Data | | | Ratios and Supplemental Data |
| | Income From Investment Operations*: | Distributions From: | | | Ratio to Average Net Assets of: | | |
| Net Asset
Value,
Beginning
of Period | Net Investment Income (Loss)(1) | Net
Realized
and
Unrealized
Gain (Loss) | Total From
Investment
Operations | Net
Investment
Income | Net
Realized
Gains | Total
Distributions | Net Asset
Value,
End of Period | Total Return(2) | Operating
Expenses | Operating
Expenses
(before
expense
waiver) | Net
Investment
Income
(Loss) | Net
Investment
Income (Loss) (before expense waiver) | Portfolio
Turnover
Rate | Net
Assets,
End of
Period (in thousands) |
| One Choice 2040 Portfolio | | | | | | | | | | | |
| Investor Class | | | | | | | | | | | | | |
| 2023 | $12.80 | 0.28 | 0.41 | 0.69 | (0.26) | (0.47) | (0.73) | $12.76 | 6.00% | 0.84% | 0.88% | 2.23% | 2.19% | 17% | $288,417 | |
| 2022 | $15.56 | 0.66 | (2.22) | (1.56) | (0.58) | (0.62) | (1.20) | $12.80 | (11.00)% | 0.83% | 0.87% | 4.68% | 4.64% | 19% | $329,436 | |
| 2021 | $13.47 | 0.17 | 2.83 | 3.00 | (0.14) | (0.77) | (0.91) | $15.56 | 22.90% | 0.83% | 0.88% | 1.12% | 1.07% | 19% | $383,921 | |
| 2020 | $13.50 | 0.24 | 0.84 | 1.08 | (0.21) | (0.90) | (1.11) | $13.47 | 8.19% | 0.83% | 0.88% | 1.78% | 1.73% | 28% | $389,734 | |
| 2019 | $14.10 | 0.31 | 0.09 | 0.40 | (0.33) | (0.67) | (1.00) | $13.50 | 3.92% | 0.83% | 0.89% | 2.41% | 2.35% | 23% | $505,459 | |
| I Class | | | | | | | | | | | |
| 2023 | $12.82 | 0.30 | 0.41 | 0.71 | (0.29) | (0.47) | (0.76) | $12.77 | 6.14% | 0.64% | 0.68% | 2.43% | 2.39% | 17% | $246,247 | |
| 2022 | $15.57 | 0.71 | (2.23) | (1.52) | (0.61) | (0.62) | (1.23) | $12.82 | (10.74)% | 0.63% | 0.67% | 4.88% | 4.84% | 19% | $289,091 | |
| 2021 | $13.49 | 0.19 | 2.83 | 3.02 | (0.17) | (0.77) | (0.94) | $15.57 | 23.14% | 0.63% | 0.69% | 1.32% | 1.26% | 19% | $431,522 | |
| 2020 | $13.51 | 0.26 | 0.85 | 1.11 | (0.23) | (0.90) | (1.13) | $13.49 | 8.42% | 0.63% | 0.70% | 1.98% | 1.91% | 28% | $382,370 | |
| 2019 | $14.11 | 0.35 | 0.08 | 0.43 | (0.36) | (0.67) | (1.03) | $13.51 | 4.13% | 0.63% | 0.70% | 2.61% | 2.54% | 23% | $460,260 | |
| A Class | | | | | | | | | | | | | | |
| 2023 | $12.78 | 0.24 | 0.42 | 0.66 | (0.23) | (0.47) | (0.70) | $12.74 | 5.74% | 1.09% | 1.13% | 1.98% | 1.94% | 17% | $130,076 | |
| 2022 | $15.53 | 0.63 | (2.22) | (1.59) | (0.54) | (0.62) | (1.16) | $12.78 | (11.19)% | 1.08% | 1.12% | 4.43% | 4.39% | 19% | $129,310 | |
| 2021 | $13.45 | 0.13 | 2.82 | 2.95 | (0.10) | (0.77) | (0.87) | $15.53 | 22.54% | 1.08% | 1.13% | 0.87% | 0.82% | 19% | $181,238 | |
| 2020 | $13.48 | 0.19 | 0.85 | 1.04 | (0.17) | (0.90) | (1.07) | $13.45 | 7.92% | 1.08% | 1.13% | 1.53% | 1.48% | 28% | $165,350 | |
| 2019 | $14.07 | 0.29 | 0.09 | 0.38 | (0.30) | (0.67) | (0.97) | $13.48 | 3.73% | 1.08% | 1.14% | 2.16% | 2.10% | 23% | $203,271 | |
| | | | | | | | | | | | | | | | | | | | | | | | | | | | | | | | | | | | | | | | | | | | | | | |
| For a Share Outstanding Throughout the Years Ended July 31 (except as noted) | | | | | | | |
| Per-Share Data | | | Ratios and Supplemental Data |
| | Income From Investment Operations*: | Distributions From: | | | Ratio to Average Net Assets of: | | |
| Net Asset
Value,
Beginning
of Period | Net Investment Income (Loss)(1) | Net
Realized
and
Unrealized
Gain (Loss) | Total From
Investment
Operations | Net
Investment
Income | Net
Realized
Gains | Total
Distributions | Net Asset
Value,
End of Period | Total Return(2) | Operating
Expenses | Operating
Expenses
(before
expense
waiver) | Net
Investment
Income
(Loss) | Net
Investment
Income (Loss) (before expense waiver) | Portfolio
Turnover
Rate | Net
Assets,
End of
Period (in thousands) |
| C Class | | | | | | | | | | | | | | |
| 2023 | $12.71 | 0.14 | 0.43 | 0.57 | (0.14) | (0.47) | (0.61) | $12.67 | 4.94% | 1.84% | 1.88% | 1.23% | 1.19% | 17% | $1,095 | |
| 2022 | $15.45 | 0.51 | (2.21) | (1.70) | (0.42) | (0.62) | (1.04) | $12.71 | (11.88)% | 1.83% | 1.87% | 3.68% | 3.64% | 19% | $1,181 | |
| 2021 | $13.39 | 0.02 | 2.81 | 2.83 | — | (0.77) | (0.77) | $15.45 | 21.64% | 1.83% | 1.88% | 0.12% | 0.07% | 19% | $1,478 | |
| 2020 | $13.42 | 0.10 | 0.83 | 0.93 | (0.06) | (0.90) | (0.96) | $13.39 | 7.11% | 1.83% | 1.88% | 0.78% | 0.73% | 28% | $1,605 | |
| 2019 | $14.01 | 0.19 | 0.09 | 0.28 | (0.20) | (0.67) | (0.87) | $13.42 | 2.94% | 1.83% | 1.89% | 1.41% | 1.35% | 23% | $2,015 | |
| R Class | | | | | | | | | | | | | | |
| 2023 | $12.76 | 0.21 | 0.42 | 0.63 | (0.20) | (0.47) | (0.67) | $12.72 | 5.47% | 1.34% | 1.38% | 1.73% | 1.69% | 17% | $321,003 | |
| 2022 | $15.51 | 0.58 | (2.21) | (1.63) | (0.50) | (0.62) | (1.12) | $12.76 | (11.44)% | 1.33% | 1.37% | 4.18% | 4.14% | 19% | $271,996 | |
| 2021 | $13.43 | 0.09 | 2.82 | 2.91 | (0.06) | (0.77) | (0.83) | $15.51 | 22.26% | 1.33% | 1.38% | 0.62% | 0.57% | 19% | $273,869 | |
| 2020 | $13.46 | 0.16 | 0.84 | 1.00 | (0.13) | (0.90) | (1.03) | $13.43 | 7.65% | 1.33% | 1.38% | 1.28% | 1.23% | 28% | $207,548 | |
| 2019 | $14.05 | 0.25 | 0.10 | 0.35 | (0.27) | (0.67) | (0.94) | $13.46 | 3.47% | 1.33% | 1.39% | 1.91% | 1.85% | 23% | $188,023 | |
| R6 Class | | | | | | | | | | | | | | |
| 2023 | $11.21 | 0.27 | 0.36 | 0.63 | (0.30) | (0.47) | (0.77) | $11.07 | 6.41% | 0.49% | 0.57% | 2.58% | 2.50% | 17% | $451,836 | |
| 2022 | $13.78 | 0.67 | (1.98) | (1.31) | (0.64) | (0.62) | (1.26) | $11.21 | (10.67)% | 0.48% | 0.56% | 5.03% | 4.95% | 19% | $424,500 | |
| 2021 | $12.03 | 0.19 | 2.52 | 2.71 | (0.19) | (0.77) | (0.96) | $13.78 | 23.31% | 0.48% | 0.58% | 1.47% | 1.37% | 19% | $518,709 | |
| 2020 | $12.18 | 0.24 | 0.77 | 1.01 | (0.26) | (0.90) | (1.16) | $12.03 | 8.54% | 0.48% | 0.60% | 2.13% | 2.01% | 28% | $395,998 | |
| 2019 | $12.83 | 0.33 | 0.06 | 0.39 | (0.37) | (0.67) | (1.04) | $12.18 | 4.35% | 0.48% | 0.61% | 2.76% | 2.63% | 23% | $381,349 | |
| | |
| Notes to Financial Highlights |
(1)Computed using average shares outstanding throughout the period.
(2)Total returns are calculated based on the net asset value of the last business day and do not reflect applicable sales charges, if any. Total returns for periods less than one year are not annualized.
*The amount shown for a share outstanding throughout the period may not correlate with the Statement(s) of Operations or precisely reflect the class expense differentials due to the timing of transactions in shares of a fund in relation to income earned and/or fluctuations in the fair value of a fund's investments.
See Notes to Financial Statements.
| | | | | | | | | | | | | | | | | | | | | | | | | | | | | | | | | | | | | | | | | | | | | | | |
| For a Share Outstanding Throughout the Years Ended July 31 (except as noted) | | | | | | | |
| Per-Share Data | | | Ratios and Supplemental Data |
| | Income From Investment Operations*: | Distributions From: | | | Ratio to Average Net Assets of: | | |
| Net Asset
Value,
Beginning
of Period | Net Investment Income (Loss)(1) | Net
Realized
and
Unrealized
Gain (Loss) | Total From
Investment
Operations | Net
Investment
Income | Net
Realized
Gains | Total
Distributions | Net Asset
Value,
End of Period | Total Return(2) | Operating
Expenses | Operating
Expenses
(before
expense
waiver) | Net
Investment
Income
(Loss) | Net
Investment
Income (Loss) (before expense waiver) | Portfolio
Turnover
Rate | Net
Assets,
End of
Period (in thousands) |
| One Choice 2045 Portfolio | | | | | | | | | | | |
| Investor Class | | | | | | | | | | | | | |
| 2023 | $16.31 | 0.32 | 0.68 | 1.00 | (0.26) | (0.60) | (0.86) | $16.45 | 6.79% | 0.87% | 0.90% | 2.00% | 1.97% | 16% | $407,551 | |
| 2022 | $19.84 | 0.86 | (2.96) | (2.10) | (0.67) | (0.76) | (1.43) | $16.31 | (11.59)% | 0.86% | 0.89% | 4.73% | 4.70% | 18% | $438,091 | |
| 2021 | $16.86 | 0.19 | 3.92 | 4.11 | (0.14) | (0.99) | (1.13) | $19.84 | 25.08% | 0.86% | 0.90% | 1.01% | 0.97% | 15% | $521,474 | |
| 2020 | $16.93 | 0.28 | 1.14 | 1.42 | (0.23) | (1.26) | (1.49) | $16.86 | 8.59% | 0.86% | 0.91% | 1.69% | 1.64% | 30% | $505,365 | |
| 2019 | $17.75 | 0.39 | 0.07 | 0.46 | (0.38) | (0.90) | (1.28) | $16.93 | 3.78% | 0.86% | 0.91% | 2.36% | 2.31% | 21% | $565,928 | |
| I Class | | | | | | | | | | | |
| 2023 | $16.35 | 0.35 | 0.68 | 1.03 | (0.29) | (0.60) | (0.89) | $16.49 | 7.00% | 0.67% | 0.71% | 2.20% | 2.16% | 16% | $221,518 | |
| 2022 | $19.88 | 0.92 | (2.98) | (2.06) | (0.71) | (0.76) | (1.47) | $16.35 | (11.38)% | 0.66% | 0.69% | 4.93% | 4.90% | 18% | $272,169 | |
| 2021 | $16.90 | 0.22 | 3.93 | 4.15 | (0.18) | (0.99) | (1.17) | $19.88 | 25.35% | 0.66% | 0.71% | 1.21% | 1.16% | 15% | $406,955 | |
| 2020 | $16.96 | 0.31 | 1.16 | 1.47 | (0.27) | (1.26) | (1.53) | $16.90 | 8.80% | 0.66% | 0.72% | 1.89% | 1.83% | 30% | $350,086 | |
| 2019 | $17.78 | 0.43 | 0.06 | 0.49 | (0.41) | (0.90) | (1.31) | $16.96 | 3.99% | 0.66% | 0.72% | 2.56% | 2.50% | 21% | $400,165 | |
| A Class | | | | | | | | | | | | | | |
| 2023 | $16.29 | 0.28 | 0.67 | 0.95 | (0.22) | (0.60) | (0.82) | $16.42 | 6.46% | 1.12% | 1.15% | 1.75% | 1.72% | 16% | $124,182 | |
| 2022 | $19.81 | 0.81 | (2.96) | (2.15) | (0.61) | (0.76) | (1.37) | $16.29 | (11.79)% | 1.11% | 1.14% | 4.48% | 4.45% | 18% | $129,008 | |
| 2021 | $16.83 | 0.14 | 3.93 | 4.07 | (0.10) | (0.99) | (1.09) | $19.81 | 24.80% | 1.11% | 1.15% | 0.76% | 0.72% | 15% | $173,756 | |
| 2020 | $16.90 | 0.23 | 1.14 | 1.37 | (0.18) | (1.26) | (1.44) | $16.83 | 8.31% | 1.11% | 1.16% | 1.44% | 1.39% | 30% | $159,638 | |
| 2019 | $17.72 | 0.35 | 0.07 | 0.42 | (0.34) | (0.90) | (1.24) | $16.90 | 3.51% | 1.11% | 1.16% | 2.11% | 2.06% | 21% | $199,985 | |
| | | | | | | | | | | | | | | | | | | | | | | | | | | | | | | | | | | | | | | | | | | | | | | |
| For a Share Outstanding Throughout the Years Ended July 31 (except as noted) | | | | | | | |
| Per-Share Data | | | Ratios and Supplemental Data |
| | Income From Investment Operations*: | Distributions From: | | | Ratio to Average Net Assets of: | | |
| Net Asset
Value,
Beginning
of Period | Net Investment Income (Loss)(1) | Net
Realized
and
Unrealized
Gain (Loss) | Total From
Investment
Operations | Net
Investment
Income | Net
Realized
Gains | Total
Distributions | Net Asset
Value,
End of Period | Total Return(2) | Operating
Expenses | Operating
Expenses
(before
expense
waiver) | Net
Investment
Income
(Loss) | Net
Investment
Income (Loss) (before expense waiver) | Portfolio
Turnover
Rate | Net
Assets,
End of
Period (in thousands) |
| C Class | | | | | | | | | | | | | | |
| 2023 | $16.18 | 0.16 | 0.67 | 0.83 | (0.10) | (0.60) | (0.70) | $16.31 | 5.67% | 1.87% | 1.90% | 1.00% | 0.97% | 16% | $1,289 | |
| 2022 | $19.68 | 0.67 | (2.95) | (2.28) | (0.46) | (0.76) | (1.22) | $16.18 | (12.46)% | 1.86% | 1.89% | 3.73% | 3.70% | 18% | $1,434 | |
| 2021 | $16.76 | 0.01 | 3.90 | 3.91 | — | (0.99) | (0.99) | $19.68 | 23.89% | 1.86% | 1.90% | 0.01% | (0.03)% | 15% | $1,974 | |
| 2020 | $16.83 | 0.12 | 1.12 | 1.24 | (0.05) | (1.26) | (1.31) | $16.76 | 7.49% | 1.86% | 1.91% | 0.69% | 0.64% | 30% | $2,100 | |
| 2019 | $17.64 | 0.23 | 0.08 | 0.31 | (0.22) | (0.90) | (1.12) | $16.83 | 2.77% | 1.86% | 1.91% | 1.36% | 1.31% | 21% | $2,531 | |
| R Class | | | | | | | | | | | | | | |
| 2023 | $16.28 | 0.23 | 0.69 | 0.92 | (0.18) | (0.60) | (0.78) | $16.42 | 6.25% | 1.37% | 1.40% | 1.50% | 1.47% | 16% | $315,314 | |
| 2022 | $19.80 | 0.75 | (2.95) | (2.20) | (0.56) | (0.76) | (1.32) | $16.28 | (12.03)% | 1.36% | 1.39% | 4.23% | 4.20% | 18% | $259,822 | |
| 2021 | $16.83 | 0.09 | 3.92 | 4.01 | (0.05) | (0.99) | (1.04) | $19.80 | 24.49% | 1.36% | 1.40% | 0.51% | 0.47% | 15% | $267,304 | |
| 2020 | $16.89 | 0.19 | 1.15 | 1.34 | (0.14) | (1.26) | (1.40) | $16.83 | 8.03% | 1.36% | 1.41% | 1.19% | 1.14% | 30% | $197,275 | |
| 2019 | $17.70 | 0.30 | 0.09 | 0.39 | (0.30) | (0.90) | (1.20) | $16.89 | 3.30% | 1.36% | 1.41% | 1.86% | 1.81% | 21% | $176,355 | |
| R6 Class | | | | | | | | | | | | | | |
| 2023 | $10.34 | 0.23 | 0.38 | 0.61 | (0.31) | (0.60) | (0.91) | $10.04 | 7.07% | 0.52% | 0.59% | 2.35% | 2.28% | 16% | $439,154 | |
| 2022 | $13.11 | 0.63 | (1.90) | (1.27) | (0.74) | (0.76) | (1.50) | $10.34 | (11.25)% | 0.51% | 0.58% | 5.08% | 5.01% | 18% | $410,845 | |
| 2021 | $11.50 | 0.16 | 2.65 | 2.81 | (0.21) | (0.99) | (1.20) | $13.11 | 25.53% | 0.51% | 0.59% | 1.36% | 1.28% | 15% | $520,523 | |
| 2020 | $12.01 | 0.22 | 0.82 | 1.04 | (0.29) | (1.26) | (1.55) | $11.50 | 9.01% | 0.51% | 0.61% | 2.04% | 1.94% | 30% | $374,167 | |
| 2019 | $13.03 | 0.31 | 0.01 | 0.32 | (0.44) | (0.90) | (1.34) | $12.01 | 4.13% | 0.51% | 0.62% | 2.71% | 2.60% | 21% | $327,799 | |
| | |
| Notes to Financial Highlights |
(1)Computed using average shares outstanding throughout the period.
(2)Total returns are calculated based on the net asset value of the last business day and do not reflect applicable sales charges, if any. Total returns for periods less than one year are not annualized.
*The amount shown for a share outstanding throughout the period may not correlate with the Statement(s) of Operations or precisely reflect the class expense differentials due to the timing of transactions in shares of a fund in relation to income earned and/or fluctuations in the fair value of a fund's investments.
See Notes to Financial Statements.
| | | | | | | | | | | | | | | | | | | | | | | | | | | | | | | | | | | | | | | | | | | | | | | |
| For a Share Outstanding Throughout the Years Ended July 31 (except as noted) | | | | | | | |
| Per-Share Data | | | Ratios and Supplemental Data |
| | Income From Investment Operations*: | Distributions From: | | | Ratio to Average Net Assets of: | | |
| Net Asset
Value,
Beginning
of Period | Net Investment Income (Loss)(1) | Net
Realized
and
Unrealized
Gain (Loss) | Total From
Investment
Operations | Net
Investment
Income | Net
Realized
Gains | Total
Distributions | Net Asset
Value,
End of Period | Total Return(2) | Operating
Expenses | Operating
Expenses
(before
expense
waiver) | Net
Investment
Income
(Loss) | Net
Investment
Income (Loss) (before expense waiver) | Portfolio
Turnover
Rate | Net
Assets,
End of
Period (in thousands) |
| One Choice 2050 Portfolio | | | | | | | | | | | |
| Investor Class | | | | | | | | | | | | | |
| 2023 | $13.61 | 0.23 | 0.71 | 0.94 | (0.21) | (0.61) | (0.82) | $13.73 | 7.71% | 0.89% | 0.92% | 1.75% | 1.72% | 17% | $214,542 | |
| 2022 | $16.61 | 0.73 | (2.53) | (1.80) | (0.64) | (0.56) | (1.20) | $13.61 | (11.87)% | 0.88% | 0.91% | 4.87% | 4.84% | 19% | $235,537 | |
| 2021 | $13.90 | 0.15 | 3.54 | 3.69 | (0.13) | (0.85) | (0.98) | $16.61 | 27.33% | 0.88% | 0.92% | 0.90% | 0.86% | 16% | $269,509 | |
| 2020 | $13.87 | 0.23 | 0.98 | 1.21 | (0.20) | (0.98) | (1.18) | $13.90 | 8.91% | 0.88% | 0.93% | 1.66% | 1.61% | 34% | $259,196 | |
| 2019 | $14.51 | 0.30 | 0.06 | 0.36 | (0.31) | (0.69) | (1.00) | $13.87 | 3.66% | 0.88% | 0.94% | 2.26% | 2.20% | 27% | $312,038 | |
| I Class | | | | | | | | | | | |
| 2023 | $13.64 | 0.26 | 0.71 | 0.97 | (0.23) | (0.61) | (0.84) | $13.77 | 7.99% | 0.69% | 0.72% | 1.95% | 1.92% | 17% | $209,961 | |
| 2022 | $16.65 | 0.79 | (2.57) | (1.78) | (0.67) | (0.56) | (1.23) | $13.64 | (11.72)% | 0.68% | 0.71% | 5.07% | 5.04% | 19% | $223,504 | |
| 2021 | $13.93 | 0.17 | 3.56 | 3.73 | (0.16) | (0.85) | (1.01) | $16.65 | 27.61% | 0.68% | 0.73% | 1.10% | 1.05% | 16% | $315,079 | |
| 2020 | $13.90 | 0.26 | 0.98 | 1.24 | (0.23) | (0.98) | (1.21) | $13.93 | 9.13% | 0.68% | 0.74% | 1.86% | 1.80% | 34% | $257,140 | |
| 2019 | $14.53 | 0.34 | 0.05 | 0.39 | (0.33) | (0.69) | (1.02) | $13.90 | 3.94% | 0.68% | 0.74% | 2.46% | 2.40% | 27% | $287,434 | |
| A Class | | | | | | | | | | | | | | |
| 2023 | $13.60 | 0.19 | 0.72 | 0.91 | (0.18) | (0.61) | (0.79) | $13.72 | 7.44% | 1.14% | 1.17% | 1.50% | 1.47% | 17% | $98,748 | |
| 2022 | $16.59 | 0.70 | (2.53) | (1.83) | (0.60) | (0.56) | (1.16) | $13.60 | (12.04)% | 1.13% | 1.16% | 4.62% | 4.59% | 19% | $91,347 | |
| 2021 | $13.88 | 0.11 | 3.54 | 3.65 | (0.09) | (0.85) | (0.94) | $16.59 | 27.04% | 1.13% | 1.17% | 0.65% | 0.61% | 16% | $115,318 | |
| 2020 | $13.85 | 0.18 | 0.99 | 1.17 | (0.16) | (0.98) | (1.14) | $13.88 | 8.64% | 1.13% | 1.18% | 1.41% | 1.36% | 34% | $103,188 | |
| 2019 | $14.48 | 0.28 | 0.06 | 0.34 | (0.28) | (0.69) | (0.97) | $13.85 | 3.47% | 1.13% | 1.19% | 2.01% | 1.95% | 27% | $129,680 | |
| | | | | | | | | | | | | | | | | | | | | | | | | | | | | | | | | | | | | | | | | | | | | | | |
| For a Share Outstanding Throughout the Years Ended July 31 (except as noted) | | | | | | | |
| Per-Share Data | | | Ratios and Supplemental Data |
| | Income From Investment Operations*: | Distributions From: | | | Ratio to Average Net Assets of: | | |
| Net Asset
Value,
Beginning
of Period | Net Investment Income (Loss)(1) | Net
Realized
and
Unrealized
Gain (Loss) | Total From
Investment
Operations | Net
Investment
Income | Net
Realized
Gains | Total
Distributions | Net Asset
Value,
End of Period | Total Return(2) | Operating
Expenses | Operating
Expenses
(before
expense
waiver) | Net
Investment
Income
(Loss) | Net
Investment
Income (Loss) (before expense waiver) | Portfolio
Turnover
Rate | Net
Assets,
End of
Period (in thousands) |
| C Class | | | | | | | | | | | | | | |
| 2023 | $13.52 | 0.10 | 0.71 | 0.81 | (0.08) | (0.61) | (0.69) | $13.64 | 6.64% | 1.89% | 1.92% | 0.75% | 0.72% | 17% | $1,161 | |
| 2022 | $16.50 | 0.61 | (2.56) | (1.95) | (0.47) | (0.56) | (1.03) | $13.52 | (12.74)% | 1.88% | 1.91% | 3.87% | 3.84% | 19% | $1,063 | |
| 2021 | $13.83 | —(3) | 3.52 | 3.52 | — | (0.85) | (0.85) | $16.50 | 26.11% | 1.88% | 1.92% | (0.10)% | (0.14)% | 16% | $1,434 | |
| 2020 | $13.80 | 0.08 | 0.98 | 1.06 | (0.05) | (0.98) | (1.03) | $13.83 | 7.82% | 1.88% | 1.93% | 0.66% | 0.61% | 34% | $1,400 | |
| 2019 | $14.43 | 0.17 | 0.07 | 0.24 | (0.18) | (0.69) | (0.87) | $13.80 | 2.67% | 1.88% | 1.94% | 1.26% | 1.20% | 27% | $1,503 | |
| R Class | | | | | | | | | | | | | | |
| 2023 | $13.59 | 0.16 | 0.71 | 0.87 | (0.14) | (0.61) | (0.75) | $13.71 | 7.16% | 1.39% | 1.42% | 1.25% | 1.22% | 17% | $259,213 | |
| 2022 | $16.58 | 0.64 | (2.52) | (1.88) | (0.55) | (0.56) | (1.11) | $13.59 | (12.28)% | 1.38% | 1.41% | 4.37% | 4.34% | 19% | $205,966 | |
| 2021 | $13.87 | 0.06 | 3.55 | 3.61 | (0.05) | (0.85) | (0.90) | $16.58 | 26.73% | 1.38% | 1.42% | 0.40% | 0.36% | 16% | $207,018 | |
| 2020 | $13.84 | 0.14 | 0.99 | 1.13 | (0.12) | (0.98) | (1.10) | $13.87 | 8.36% | 1.38% | 1.43% | 1.16% | 1.11% | 34% | $145,300 | |
| 2019 | $14.47 | 0.23 | 0.07 | 0.30 | (0.24) | (0.69) | (0.93) | $13.84 | 3.20% | 1.38% | 1.44% | 1.76% | 1.70% | 27% | $123,006 | |
| R6 Class | | | | | | | | | | | | | | |
| 2023 | $11.95 | 0.23 | 0.61 | 0.84 | (0.25) | (0.61) | (0.86) | $11.93 | 8.06% | 0.54% | 0.60% | 2.10% | 2.04% | 17% | $368,118 | |
| 2022 | $14.73 | 0.75 | (2.27) | (1.52) | (0.70) | (0.56) | (1.26) | $11.95 | (11.52)% | 0.53% | 0.59% | 5.22% | 5.16% | 19% | $312,841 | |
| 2021 | $12.43 | 0.17 | 3.16 | 3.33 | (0.18) | (0.85) | (1.03) | $14.73 | 27.78% | 0.53% | 0.61% | 1.25% | 1.17% | 16% | $405,593 | |
| 2020 | $12.53 | 0.23 | 0.90 | 1.13 | (0.25) | (0.98) | (1.23) | $12.43 | 9.27% | 0.53% | 0.63% | 2.01% | 1.91% | 34% | $302,601 | |
| 2019 | $13.22 | 0.32 | 0.03 | 0.35 | (0.35) | (0.69) | (1.04) | $12.53 | 4.06% | 0.53% | 0.64% | 2.61% | 2.50% | 27% | $272,649 | |
| | |
| Notes to Financial Highlights |
(1)Computed using average shares outstanding throughout the period.
(2)Total returns are calculated based on the net asset value of the last business day and do not reflect applicable sales charges, if any. Total returns for periods less than one year are not annualized.
(3)Per-share amount was less than $0.005.
*The amount shown for a share outstanding throughout the period may not correlate with the Statement(s) of Operations or precisely reflect the class expense differentials due to the timing of transactions in shares of a fund in relation to income earned and/or fluctuations in the fair value of a fund's investments.
See Notes to Financial Statements.
| | | | | | | | | | | | | | | | | | | | | | | | | | | | | | | | | | | | | | | | | | | | | | | |
| For a Share Outstanding Throughout the Years Ended July 31 (except as noted) | | | | | | | |
| Per-Share Data | | | Ratios and Supplemental Data |
| | Income From Investment Operations*: | Distributions From: | | | Ratio to Average Net Assets of: | | |
| Net Asset
Value,
Beginning
of Period | Net Investment Income (Loss)(1) | Net
Realized
and
Unrealized
Gain (Loss) | Total From
Investment
Operations | Net
Investment
Income | Net
Realized
Gains | Total
Distributions | Net Asset
Value,
End of Period | Total Return(2) | Operating
Expenses | Operating
Expenses
(before
expense
waiver) | Net
Investment
Income
(Loss) | Net
Investment
Income (Loss) (before expense waiver) | Portfolio
Turnover
Rate | Net
Assets,
End of
Period (in thousands) |
| One Choice 2055 Portfolio | | | | | | | | | | | |
| Investor Class | | | | | | | | | | | | | |
| 2023 | $15.19 | 0.24 | 0.93 | 1.17 | (0.22) | (0.63) | (0.85) | $15.51 | 8.45% | 0.89% | 0.93% | 1.58% | 1.54% | 18% | $122,095 | |
| 2022 | $18.57 | 0.82 | (2.87) | (2.05) | (0.71) | (0.62) | (1.33) | $15.19 | (12.07)% | 0.88% | 0.92% | 4.89% | 4.85% | 19% | $126,682 | |
| 2021 | $15.21 | 0.16 | 4.07 | 4.23 | (0.14) | (0.73) | (0.87) | $18.57 | 28.45% | 0.88% | 0.93% | 0.86% | 0.81% | 17% | $145,510 | |
| 2020 | $15.02 | 0.25 | 1.08 | 1.33 | (0.21) | (0.93) | (1.14) | $15.21 | 9.03% | 0.88% | 0.94% | 1.61% | 1.55% | 40% | $148,797 | |
| 2019 | $15.55 | 0.33 | 0.06 | 0.39 | (0.32) | (0.60) | (0.92) | $15.02 | 3.51% | 0.88% | 0.95% | 2.24% | 2.17% | 27% | $161,378 | |
| I Class | | | | | | | | | | | |
| 2023 | $15.20 | 0.27 | 0.92 | 1.19 | (0.25) | (0.63) | (0.88) | $15.51 | 8.60% | 0.69% | 0.74% | 1.78% | 1.73% | 18% | $157,600 | |
| 2022 | $18.58 | 0.89 | (2.90) | (2.01) | (0.75) | (0.62) | (1.37) | $15.20 | (11.88)% | 0.68% | 0.72% | 5.09% | 5.05% | 19% | $168,209 | |
| 2021 | $15.22 | 0.18 | 4.08 | 4.26 | (0.17) | (0.73) | (0.90) | $18.58 | 28.69% | 0.68% | 0.74% | 1.06% | 1.00% | 17% | $231,400 | |
| 2020 | $15.03 | 0.26 | 1.10 | 1.36 | (0.24) | (0.93) | (1.17) | $15.22 | 9.25% | 0.68% | 0.75% | 1.81% | 1.74% | 40% | $200,296 | |
| 2019 | $15.56 | 0.37 | 0.05 | 0.42 | (0.35) | (0.60) | (0.95) | $15.03 | 3.73% | 0.68% | 0.75% | 2.44% | 2.37% | 27% | $201,236 | |
| A Class | | | | | | | | | | | | | | |
| 2023 | $15.15 | 0.19 | 0.94 | 1.13 | (0.18) | (0.63) | (0.81) | $15.47 | 8.18% | 1.14% | 1.18% | 1.33% | 1.29% | 18% | $69,326 | |
| 2022 | $18.52 | 0.78 | (2.87) | (2.09) | (0.66) | (0.62) | (1.28) | $15.15 | (12.27)% | 1.13% | 1.17% | 4.64% | 4.60% | 19% | $62,800 | |
| 2021 | $15.17 | 0.11 | 4.06 | 4.17 | (0.09) | (0.73) | (0.82) | $18.52 | 28.12% | 1.13% | 1.18% | 0.61% | 0.56% | 17% | $77,870 | |
| 2020 | $14.99 | 0.19 | 1.09 | 1.28 | (0.17) | (0.93) | (1.10) | $15.17 | 8.69% | 1.13% | 1.19% | 1.36% | 1.30% | 40% | $69,721 | |
| 2019 | $15.52 | 0.28 | 0.07 | 0.35 | (0.28) | (0.60) | (0.88) | $14.99 | 3.25% | 1.13% | 1.20% | 1.99% | 1.92% | 27% | $79,664 | |
| | | | | | | | | | | | | | | | | | | | | | | | | | | | | | | | | | | | | | | | | | | | | | | |
| For a Share Outstanding Throughout the Years Ended July 31 (except as noted) | | | | | | | |
| Per-Share Data | | | Ratios and Supplemental Data |
| | Income From Investment Operations*: | Distributions From: | | | Ratio to Average Net Assets of: | | |
| Net Asset
Value,
Beginning
of Period | Net Investment Income (Loss)(1) | Net
Realized
and
Unrealized
Gain (Loss) | Total From
Investment
Operations | Net
Investment
Income | Net
Realized
Gains | Total
Distributions | Net Asset
Value,
End of Period | Total Return(2) | Operating
Expenses | Operating
Expenses
(before
expense
waiver) | Net
Investment
Income
(Loss) | Net
Investment
Income (Loss) (before expense waiver) | Portfolio
Turnover
Rate | Net
Assets,
End of
Period (in thousands) |
| C Class | | | | | | | | | | | | | | |
| 2023 | $14.99 | 0.08 | 0.93 | 1.01 | (0.07) | (0.63) | (0.70) | $15.30 | 7.35% | 1.89% | 1.93% | 0.58% | 0.54% | 18% | $822 | |
| 2022 | $18.34 | 0.63 | (2.84) | (2.21) | (0.52) | (0.62) | (1.14) | $14.99 | (12.98)% | 1.88% | 1.92% | 3.89% | 3.85% | 19% | $845 | |
| 2021 | $15.06 | (0.01) | 4.02 | 4.01 | — | (0.73) | (0.73) | $18.34 | 27.24% | 1.88% | 1.93% | (0.14)% | (0.19)% | 17% | $1,069 | |
| 2020 | $14.87 | 0.09 | 1.08 | 1.17 | (0.05) | (0.93) | (0.98) | $15.06 | 7.90% | 1.88% | 1.94% | 0.61% | 0.55% | 40% | $961 | |
| 2019 | $15.40 | 0.19 | 0.06 | 0.25 | (0.18) | (0.60) | (0.78) | $14.87 | 2.47% | 1.88% | 1.95% | 1.24% | 1.17% | 27% | $881 | |
| R Class | | | | | | | | | | | | | | |
| 2023 | $15.15 | 0.15 | 0.94 | 1.09 | (0.14) | (0.63) | (0.77) | $15.47 | 7.90% | 1.39% | 1.43% | 1.08% | 1.04% | 18% | $192,693 | |
| 2022 | $18.52 | 0.72 | (2.86) | (2.14) | (0.61) | (0.62) | (1.23) | $15.15 | (12.50)% | 1.38% | 1.42% | 4.39% | 4.35% | 19% | $144,055 | |
| 2021 | $15.17 | 0.06 | 4.07 | 4.13 | (0.05) | (0.73) | (0.78) | $18.52 | 27.79% | 1.38% | 1.43% | 0.36% | 0.31% | 17% | $138,104 | |
| 2020 | $14.98 | 0.15 | 1.10 | 1.25 | (0.13) | (0.93) | (1.06) | $15.17 | 8.48% | 1.38% | 1.44% | 1.11% | 1.05% | 40% | $93,577 | |
| 2019 | $15.51 | 0.25 | 0.07 | 0.32 | (0.25) | (0.60) | (0.85) | $14.98 | 2.99% | 1.38% | 1.45% | 1.74% | 1.67% | 27% | $76,052 | |
| R6 Class | | | | | | | | | | | | | | |
| 2023 | $12.55 | 0.23 | 0.75 | 0.98 | (0.27) | (0.63) | (0.90) | $12.63 | 8.79% | 0.54% | 0.61% | 1.93% | 1.86% | 18% | $264,930 | |
| 2022 | $15.58 | 0.80 | (2.44) | (1.64) | (0.77) | (0.62) | (1.39) | $12.55 | (11.75)% | 0.53% | 0.59% | 5.24% | 5.18% | 19% | $224,504 | |
| 2021 | $12.89 | 0.17 | 3.45 | 3.62 | (0.20) | (0.73) | (0.93) | $15.58 | 28.91% | 0.53% | 0.61% | 1.21% | 1.13% | 17% | $273,227 | |
| 2020 | $12.91 | 0.23 | 0.94 | 1.17 | (0.26) | (0.93) | (1.19) | $12.89 | 9.34% | 0.53% | 0.64% | 1.96% | 1.85% | 40% | $193,435 | |
| 2019 | $13.52 | 0.32 | 0.04 | 0.36 | (0.37) | (0.60) | (0.97) | $12.91 | 3.88% | 0.53% | 0.65% | 2.59% | 2.47% | 27% | $160,881 | |
| | |
| Notes to Financial Highlights |
(1)Computed using average shares outstanding throughout the period.
(2)Total returns are calculated based on the net asset value of the last business day and do not reflect applicable sales charges, if any. Total returns for periods less than one year are not annualized.
*The amount shown for a share outstanding throughout the period may not correlate with the Statement(s) of Operations or precisely reflect the class expense differentials due to the timing of transactions in shares of a fund in relation to income earned and/or fluctuations in the fair value of a fund's investments.
See Notes to Financial Statements.
| | | | | | | | | | | | | | | | | | | | | | | | | | | | | | | | | | | | | | | | | | | | | | | |
| For a Share Outstanding Throughout the Years Ended July 31 (except as noted) | | | | | | | |
| Per-Share Data | | | Ratios and Supplemental Data |
| | Income From Investment Operations*: | Distributions From: | | | Ratio to Average Net Assets of: | | |
| Net Asset
Value,
Beginning
of Period | Net Investment Income (Loss)(1) | Net
Realized
and
Unrealized
Gain (Loss) | Total From
Investment
Operations | Net
Investment
Income | Net
Realized
Gains | Total
Distributions | Net Asset
Value,
End of Period | Total Return(2) | Operating
Expenses | Operating
Expenses
(before
expense
waiver) | Net
Investment
Income
(Loss) | Net
Investment
Income (Loss) (before expense waiver) | Portfolio
Turnover
Rate | Net
Assets,
End of
Period (in thousands) |
| One Choice 2060 Portfolio | | | | | | | | | | | |
| Investor Class | | | | | | | | | | | | | |
| 2023 | $13.90 | 0.20 | 0.89 | 1.09 | (0.21) | (0.72) | (0.93) | $14.06 | 8.80% | 0.89% | 0.94% | 1.46% | 1.41% | 14% | $55,975 | |
| 2022 | $16.84 | 0.75 | (2.65) | (1.90) | (0.70) | (0.34) | (1.04) | $13.90 | (12.16)% | 0.88% | 0.93% | 4.87% | 4.82% | 16% | $54,887 | |
| 2021 | $13.46 | 0.13 | 3.75 | 3.88 | (0.13) | (0.37) | (0.50) | $16.84 | 29.28% | 0.88% | 0.94% | 0.80% | 0.74% | 9% | $55,757 | |
| 2020 | $13.06 | 0.21 | 0.95 | 1.16 | (0.19) | (0.57) | (0.76) | $13.46 | 8.94% | 0.88% | 0.95% | 1.53% | 1.46% | 34% | $38,347 | |
| 2019 | $13.25 | 0.25 | 0.11 | 0.36 | (0.27) | (0.28) | (0.55) | $13.06 | 3.50% | 0.88% | 0.95% | 2.07% | 2.00% | 21% | $37,219 | |
| I Class | | | | | | | | | | | |
| 2023 | $13.92 | 0.22 | 0.89 | 1.11 | (0.23) | (0.72) | (0.95) | $14.08 | 9.01% | 0.69% | 0.74% | 1.66% | 1.61% | 14% | $66,910 | |
| 2022 | $16.86 | 0.81 | (2.67) | (1.86) | (0.74) | (0.34) | (1.08) | $13.92 | (11.96)% | 0.68% | 0.73% | 5.07% | 5.02% | 16% | $55,157 | |
| 2021 | $13.47 | 0.15 | 3.77 | 3.92 | (0.16) | (0.37) | (0.53) | $16.86 | 29.59% | 0.68% | 0.74% | 1.00% | 0.94% | 9% | $78,572 | |
| 2020 | $13.08 | 0.22 | 0.95 | 1.17 | (0.21) | (0.57) | (0.78) | $13.47 | 9.07% | 0.68% | 0.75% | 1.73% | 1.66% | 34% | $55,590 | |
| 2019 | $13.27 | 0.29 | 0.10 | 0.39 | (0.30) | (0.28) | (0.58) | $13.08 | 3.70% | 0.68% | 0.75% | 2.27% | 2.20% | 21% | $40,025 | |
| A Class | | | | | | | | | | | | | | |
| 2023 | $13.88 | 0.16 | 0.88 | 1.04 | (0.17) | (0.72) | (0.89) | $14.03 | 8.45% | 1.14% | 1.19% | 1.21% | 1.16% | 14% | $28,253 | |
| 2022 | $16.81 | 0.71 | (2.64) | (1.93) | (0.66) | (0.34) | (1.00) | $13.88 | (12.35)% | 1.13% | 1.18% | 4.62% | 4.57% | 16% | $23,520 | |
| 2021 | $13.43 | 0.09 | 3.75 | 3.84 | (0.09) | (0.37) | (0.46) | $16.81 | 29.01% | 1.13% | 1.19% | 0.55% | 0.49% | 9% | $26,722 | |
| 2020 | $13.04 | 0.16 | 0.95 | 1.11 | (0.15) | (0.57) | (0.72) | $13.43 | 8.59% | 1.13% | 1.20% | 1.28% | 1.21% | 34% | $10,488 | |
| 2019 | $13.23 | 0.23 | 0.10 | 0.33 | (0.24) | (0.28) | (0.52) | $13.04 | 3.24% | 1.13% | 1.20% | 1.82% | 1.75% | 21% | $8,425 | |
| | | | | | | | | | | | | | | | | | | | | | | | | | | | | | | | | | | | | | | | | | | | | | | |
| For a Share Outstanding Throughout the Years Ended July 31 (except as noted) | | | | | | | |
| Per-Share Data | | | Ratios and Supplemental Data |
| | Income From Investment Operations*: | Distributions From: | | | Ratio to Average Net Assets of: | | |
| Net Asset
Value,
Beginning
of Period | Net Investment Income (Loss)(1) | Net
Realized
and
Unrealized
Gain (Loss) | Total From
Investment
Operations | Net
Investment
Income | Net
Realized
Gains | Total
Distributions | Net Asset
Value,
End of Period | Total Return(2) | Operating
Expenses | Operating
Expenses
(before
expense
waiver) | Net
Investment
Income
(Loss) | Net
Investment
Income (Loss) (before expense waiver) | Portfolio
Turnover
Rate | Net
Assets,
End of
Period (in thousands) |
| C Class | | | | | | | | | | | | | | |
| 2023 | $13.72 | 0.06 | 0.88 | 0.94 | (0.07) | (0.72) | (0.79) | $13.87 | 7.69% | 1.89% | 1.94% | 0.46% | 0.41% | 14% | $290 | |
| 2022 | $16.62 | 0.59 | (2.62) | (2.03) | (0.53) | (0.34) | (0.87) | $13.72 | (13.00)% | 1.88% | 1.93% | 3.87% | 3.82% | 16% | $248 | |
| 2021 | $13.31 | (0.03) | 3.71 | 3.68 | — | (0.37) | (0.37) | $16.62 | 27.97% | 1.88% | 1.94% | (0.20)% | (0.26)% | 9% | $290 | |
| 2020 | $12.92 | 0.07 | 0.93 | 1.00 | (0.04) | (0.57) | (0.61) | $13.31 | 7.83% | 1.88% | 1.95% | 0.53% | 0.46% | 34% | $213 | |
| 2019 | $13.11 | 0.15 | 0.10 | 0.25 | (0.16) | (0.28) | (0.44) | $12.92 | 2.47% | 1.88% | 1.95% | 1.07% | 1.00% | 21% | $185 | |
| R Class | | | | | | | | | | | | | | |
| 2023 | $13.85 | 0.13 | 0.89 | 1.02 | (0.14) | (0.72) | (0.86) | $14.01 | 8.26% | 1.39% | 1.44% | 0.96% | 0.91% | 14% | $115,828 | |
| 2022 | $16.78 | 0.70 | (2.67) | (1.97) | (0.62) | (0.34) | (0.96) | $13.85 | (12.60)% | 1.38% | 1.43% | 4.37% | 4.32% | 16% | $78,044 | |
| 2021 | $13.41 | 0.05 | 3.74 | 3.79 | (0.05) | (0.37) | (0.42) | $16.78 | 28.65% | 1.38% | 1.44% | 0.30% | 0.24% | 9% | $62,456 | |
| 2020 | $13.02 | 0.12 | 0.96 | 1.08 | (0.12) | (0.57) | (0.69) | $13.41 | 8.32% | 1.38% | 1.45% | 1.03% | 0.96% | 34% | $34,558 | |
| 2019 | $13.21 | 0.19 | 0.11 | 0.30 | (0.21) | (0.28) | (0.49) | $13.02 | 2.98% | 1.38% | 1.45% | 1.57% | 1.50% | 21% | $20,542 | |
| R6 Class | | | | | | | | | | | | | | |
| 2023 | $13.97 | 0.24 | 0.89 | 1.13 | (0.25) | (0.72) | (0.97) | $14.13 | 9.15% | 0.54% | 0.62% | 1.81% | 1.73% | 14% | $135,501 | |
| 2022 | $16.92 | 0.88 | (2.73) | (1.85) | (0.76) | (0.34) | (1.10) | $13.97 | (11.84)% | 0.53% | 0.60% | 5.22% | 5.15% | 16% | $98,298 | |
| 2021 | $13.52 | 0.17 | 3.78 | 3.95 | (0.18) | (0.37) | (0.55) | $16.92 | 29.76% | 0.53% | 0.62% | 1.15% | 1.06% | 9% | $102,371 | |
| 2020 | $13.12 | 0.23 | 0.97 | 1.20 | (0.23) | (0.57) | (0.80) | $13.52 | 9.29% | 0.53% | 0.64% | 1.88% | 1.77% | 34% | $60,786 | |
| 2019 | $13.31 | 0.31 | 0.09 | 0.40 | (0.31) | (0.28) | (0.59) | $13.12 | 3.85% | 0.53% | 0.65% | 2.42% | 2.30% | 21% | $37,601 | |
| | |
| Notes to Financial Highlights |
(1)Computed using average shares outstanding throughout the period.
(2)Total returns are calculated based on the net asset value of the last business day and do not reflect applicable sales charges, if any. Total returns for periods less than one year are not annualized.
*The amount shown for a share outstanding throughout the period may not correlate with the Statement(s) of Operations or precisely reflect the class expense differentials due to the timing of transactions in shares of a fund in relation to income earned and/or fluctuations in the fair value of a fund's investments.
See Notes to Financial Statements.
| | | | | | | | | | | | | | | | | | | | | | | | | | | | | | | | | | | | | | | | | | | | | | | |
| For a Share Outstanding Throughout the Years Ended July 31 (except as noted) | | |
| Per-Share Data | | | Ratios and Supplemental Data |
| | Income From Investment Operations*: | Distributions From: | | | Ratio to Average Net Assets of: | | |
| Net Asset
Value,
Beginning
of Period | Net Investment Income (Loss)(1) | Net
Realized
and
Unrealized
Gain (Loss) | Total From
Investment
Operations | Net
Investment
Income | Net
Realized
Gains | Total
Distributions | Net Asset
Value,
End of Period | Total Return(2) | Operating
Expenses | Operating
Expenses
(before
expense
waiver) | Net
Investment
Income
(Loss) | Net
Investment
Income (Loss) (before expense waiver) | Portfolio
Turnover
Rate | Net
Assets,
End of
Period (in thousands) |
| One Choice 2065 Portfolio | | |
| Investor Class | | | | | | | | | | | | | | |
| 2023 | $10.86 | 0.15 | 0.77 | 0.92 | (0.17) | (0.26) | (0.43) | $11.35 | 9.00% | 0.91% | 0.97% | 1.37% | 1.31% | 19% | $5,229 | |
| 2022 | $12.89 | 0.60 | (2.09) | (1.49) | (0.52) | (0.02) | (0.54) | $10.86 | (12.16)% | 0.88% | 0.93% | 4.77% | 4.72% | 18% | $3,483 | |
2021(3) | $10.00 | 0.06 | 2.93 | 2.99 | (0.10) | — | (0.10) | $12.89 | 30.02% | 0.88%(4) | 0.94%(4) | 0.33%(4) | 0.27%(4) | 17% | $2,103 | |
| I Class | | | | | | | | | | | | | | | |
| 2023 | $10.87 | 0.17 | 0.77 | 0.94 | (0.19) | (0.26) | (0.45) | $11.36 | 9.22% | 0.71% | 0.77% | 1.57% | 1.51% | 19% | $8,114 | |
| 2022 | $12.90 | 0.63 | (2.09) | (1.46) | (0.55) | (0.02) | (0.57) | $10.87 | (11.97)% | 0.68% | 0.74% | 4.97% | 4.91% | 18% | $3,324 | |
2021(3) | $10.00 | 0.03 | 2.98 | 3.01 | (0.11) | — | (0.11) | $12.90 | 30.19% | 0.68%(4) | 0.75%(4) | 0.53%(4) | 0.46%(4) | 17% | $1,901 | |
| A Class | | | | | | | | | | | | | | | |
| 2023 | $10.84 | 0.11 | 0.78 | 0.89 | (0.14) | (0.26) | (0.40) | $11.33 | 8.73% | 1.16% | 1.22% | 1.12% | 1.06% | 19% | $2,534 | |
| 2022 | $12.86 | 0.57 | (2.08) | (1.51) | (0.49) | (0.02) | (0.51) | $10.84 | (12.33)% | 1.13% | 1.18% | 4.52% | 4.47% | 18% | $797 | |
2021(3) | $10.00 | 0.03 | 2.92 | 2.95 | (0.09) | — | (0.09) | $12.86 | 29.63% | 1.13%(4) | 1.19%(4) | 0.08%(4) | 0.02%(4) | 17% | $271 | |
| C Class | | | | | | | | | | | | | | | |
| 2023 | $10.80 | 0.04 | 0.77 | 0.81 | (0.06) | (0.26) | (0.32) | $11.29 | 7.92% | 1.91% | 1.97% | 0.37% | 0.31% | 19% | $117 | |
| 2022 | $12.81 | 0.45 | (2.05) | (1.60) | (0.39) | (0.02) | (0.41) | $10.80 | (12.98)% | 1.88% | 1.93% | 3.77% | 3.72% | 18% | $35 | |
2021(3) | $10.00 | (0.01) | 2.89 | 2.88 | (0.07) | — | (0.07) | $12.81 | 28.86% | 1.88%(4) | 1.94%(4) | (0.67)%(4) | (0.73)%(4) | 17% | $32 | |
| | | | | | | | | | | | | | | | | | | | | | | | | | | | | | | | | | | | | | | | | | | | | | | |
| For a Share Outstanding Throughout the Years Ended July 31 (except as noted) | | |
| Per-Share Data | | | Ratios and Supplemental Data |
| | Income From Investment Operations*: | Distributions From: | | | Ratio to Average Net Assets of: | | |
| Net Asset
Value,
Beginning
of Period | Net Investment Income (Loss)(1) | Net
Realized
and
Unrealized
Gain (Loss) | Total From
Investment
Operations | Net
Investment
Income | Net
Realized
Gains | Total
Distributions | Net Asset
Value,
End of Period | Total Return(2) | Operating
Expenses | Operating
Expenses
(before
expense
waiver) | Net
Investment
Income
(Loss) | Net
Investment
Income (Loss) (before expense waiver) | Portfolio
Turnover
Rate | Net
Assets,
End of
Period (in thousands) |
| R Class | | | | | | | | | | | | | | | |
| 2023 | $10.83 | 0.09 | 0.77 | 0.86 | (0.11) | (0.26) | (0.37) | $11.32 | 8.46% | 1.41% | 1.47% | 0.87% | 0.81% | 19% | $18,382 | |
| 2022 | $12.85 | 0.54 | (2.08) | (1.54) | (0.46) | (0.02) | (0.48) | $10.83 | (12.57)% | 1.38% | 1.43% | 4.27% | 4.22% | 18% | $6,927 | |
2021(3) | $10.00 | (0.02) | 2.95 | 2.93 | (0.08) | — | (0.08) | $12.85 | 29.44% | 1.38%(4) | 1.44%(4) | (0.17)%(4) | (0.23)%(4) | 17% | $1,688 | |
| R6 Class | | | | | | | | | | | | | | |
| 2023 | $10.89 | 0.18 | 0.77 | 0.95 | (0.20) | (0.26) | (0.46) | $11.38 | 9.37% | 0.56% | 0.64% | 1.72% | 1.64% | 19% | $17,636 | |
| 2022 | $12.92 | 0.66 | (2.10) | (1.44) | (0.57) | (0.02) | (0.59) | $10.89 | (11.81)% | 0.53% | 0.60% | 5.12% | 5.05% | 18% | $10,883 | |
2021(3) | $10.00 | 0.06 | 2.97 | 3.03 | (0.11) | — | (0.11) | $12.92 | 30.44% | 0.53%(4) | 0.61%(4) | 0.68%(4) | 0.60%(4) | 17% | $3,224 | |
| | |
| Notes to Financial Highlights |
(1)Computed using average shares outstanding throughout the period.
(2)Total returns are calculated based on the net asset value of the last business day and do not reflect applicable sales charges, if any. Total returns for periods less than one year are not annualized.
(3)September 23, 2020 (fund inception) through July 31, 2021.
(4)Annualized.
*The amount shown for a share outstanding throughout the period may not correlate with the Statement(s) of Operations or precisely reflect the class expense differentials due to the timing of transactions in shares of a fund in relation to income earned and/or fluctuations in the fair value of a fund's investments.
See Notes to Financial Statements.
| | |
| Report of Independent Registered Public Accounting Firm |
To the Shareholders and the Board of Directors of American Century Asset Allocation Portfolios, Inc.:
Opinion on the Financial Statements and Financial Highlights
We have audited the accompanying statements of assets and liabilities, including the schedules of investments, of One Choice® In Retirement Portfolio, One Choice® 2025 Portfolio, One Choice® 2030 Portfolio, One Choice® 2035 Portfolio, One Choice® 2040 Portfolio, One Choice® 2045 Portfolio, One Choice® 2050 Portfolio, One Choice® 2055 Portfolio, One Choice® 2060 Portfolio, and One Choice® 2065 Portfolio, ten of the portfolios constituting American Century Asset Allocation Portfolios, Inc. (the “Funds”), as of July 31, 2023, the related statements of operations for the year then ended, the statements of changes in net assets for each of the two years in the period then ended, the financial highlights for each of the five years in the period then ended (as to One Choice® 2065 Portfolio, for the two years in the period ended July 31, 2023 and the period from September 23, 2020 (commencement of operations) through July 31, 2021), and the related notes. In our opinion, the financial statements and financial highlights present fairly, in all material respects, the financial position of each of the Funds of the American Century Asset Allocation Portfolios, Inc. as of July 31, 2023, and the results of their operations for the year then ended, the changes in their net assets for each of the two years in the period then ended, and the financial highlights for each of the five years in the period then ended (as to One Choice® 2065 Portfolio, for the two years in the period ended July 31, 2023 and the period from September 23, 2020 (commencement of operations) through July 31, 2021), in conformity with accounting principles generally accepted in the United States of America.
Basis for Opinion
These financial statements and financial highlights are the responsibility of the Funds’ management. Our responsibility is to express an opinion on the Funds’ financial statements and financial highlights based on our audits. We are a public accounting firm registered with the Public Company Accounting Oversight Board (United States) (PCAOB) and are required to be independent with respect to the Funds in accordance with the U.S. federal securities laws and the applicable rules and regulations of the Securities and Exchange Commission and the PCAOB.
We conducted our audits in accordance with the standards of the PCAOB. Those standards require that we plan and perform the audit to obtain reasonable assurance about whether the financial statements and financial highlights are free of material misstatement, whether due to error or fraud. The Funds are not required to have, nor were we engaged to perform, an audit of their internal control over financial reporting. As part of our audits, we are required to obtain an understanding of internal control over financial reporting but not for the purpose of expressing an opinion on the effectiveness of the Funds’ internal control over financial reporting. Accordingly, we express no such opinion.
Our audits included performing procedures to assess the risks of material misstatement of the financial statements and financial highlights, whether due to error or fraud, and performing procedures that respond to those risks. Such procedures included examining, on a test basis, evidence regarding the amounts and disclosures in the financial statements and financial highlights. Our audits also included evaluating the accounting principles used and significant estimates made by management, as well as evaluating the overall presentation of the financial statements and financial highlights. Our procedures included confirmation of securities owned as of July 31, 2023, by correspondence with the custodian, the transfer agent, and brokers; when replies were not received from brokers, we performed other auditing procedures. We believe that our audits provide a reasonable basis for our opinion.
/s/ Deloitte & Touche LLP
Kansas City, Missouri
September 18, 2023
We have served as the auditor of one or more American Century investment companies since 1997.
The Board of Directors
The individuals listed below serve as directors of the funds. Each director will continue to serve in this capacity until death, retirement, resignation or removal from office. The board has adopted a mandatory retirement age for directors who are not “interested persons,” as that term is defined in the Investment Company Act (independent directors). Independent directors shall retire on December 31 of the year in which they reach their 75th birthday.
Jonathan S. Thomas is an “interested person” because he currently serves as President and Chief Executive Officer of American Century Companies, Inc. (ACC), the parent company of American Century Investment Management, Inc. (ACIM or the advisor). The other directors (more than three-fourths of the total number) are independent. They are not employees, directors or officers of, and have no financial interest in, ACC or any of its wholly owned, direct or indirect, subsidiaries, including ACIM, American Century Investment Services, Inc. (ACIS) and American Century Services, LLC (ACS), and they do not have any other affiliations, positions or relationships that would cause them to be considered “interested persons” under the Investment Company Act. The directors serve in this capacity for seven (in the case of Jonathan S. Thomas, 16; and Stephen E. Yates, 8) registered investment companies in the American Century Investments family of funds.
The following table presents additional information about the directors. The mailing address for each director is 4500 Main Street, Kansas City, Missouri 64111.
| | | | | | | | | | | | | | | | | |
Name
(Year of Birth) | Position(s) Held with Funds | Length of Time Served | Principal Occupation(s) During Past 5 Years | Number of American Century Portfolios Overseen by Director | Other Directorships Held During Past 5 Years |
| Independent Directors | | |
| Brian Bulatao (1964) | Director | Since 2022 | Chief Administrative Officer, Activision Blizzard, Inc. (2021 to present); Under Secretary of State for Management, U.S. Department of State (2018 to 2021); Chief Operating Officer, Central Intelligence Agency (2017 to 2018) | 65 | None |
| Thomas W. Bunn (1953) | Director | Since 2017 | Retired | 65 | None |
Chris H. Cheesman
(1962)
| Director | Since 2019
| Retired. Senior Vice President & Chief Audit Executive, AllianceBernstein (1999 to 2018) | 65 | Alleghany Corporation (2021 to 2022) |
Barry Fink
(1955) | Director | Since 2012 (independent since 2016) | Retired | 65 | None |
Rajesh K. Gupta
(1960)
| Director | Since 2019
| Partner Emeritus, SeaCrest Investment Management and SeaCrest Wealth Management (2019 to present); Chief Executive Officer and Chief Investment Officer, SeaCrest Investment Management (2006 to 2019); Chief Executive Officer and Chief Investment Officer, SeaCrest Wealth Management (2008 to 2019) | 65 | None |
| | | | | | | | | | | | | | | | | |
Name
(Year of Birth) | Position(s) Held with Funds | Length of Time Served | Principal Occupation(s) During Past 5 Years | Number of American Century Portfolios Overseen by Director | Other Directorships Held During Past 5 Years |
| Independent Directors | | |
Lynn Jenkins
(1963)
| Director | Since 2019
| Consultant, LJ Strategies (2019 to present); United States Representative, U.S. House of Representatives (2009 to 2018) | 65 | MGP Ingredients, Inc. (2019 to 2021) |
Jan M. Lewis
(1957) | Director and Board Chair | Since 2011
(Board Chair since 2022) | Retired | 65 | None |
Gary C. Meltzer
(1963) | Director | Since 2022 | Advisor, Pontoro (2021 to present); Executive Advisor, Consultant and Investor, Harris Ariel Advisory LLC (2020 to present); Managing Partner, PricewaterhouseCoopers LLP (1985 to 2020) | 65 | ExcelFin Acquisition Corp., Apollo Realty Income Solutions, Inc. |
Stephen E. Yates
(1948) | Director | Since 2012 | Retired | 116 | None |
| Interested Director | | |
Jonathan S. Thomas
(1963) | Director | Since 2007 | President and Chief Executive Officer, ACC (2007 to present). Also serves as Chief Executive Officer, ACS; Director, ACC and other ACC subsidiaries | 148 | None |
The Statement of Additional Information has additional information about the funds' directors and is available without charge, upon request, by calling 1-800-345-2021.
Officers
The following table presents certain information about the executive officers of the funds. Each officer serves as an officer for each of the 16 investment companies in the American Century family of funds. No officer is compensated for his or her service as an officer of the funds. The listed officers are interested persons of the funds and are appointed or re-appointed on an annual basis. The mailing address for each officer listed below is 4500 Main Street, Kansas City, Missouri 64111.
| | | | | | | | |
Name
(Year of Birth) | Offices with the Funds | Principal Occupation(s) During the Past Five Years |
Patrick Bannigan
(1965) | President since 2019 | Executive Vice President and Director, ACC (2012 to present); Chief Financial Officer, Chief Accounting Officer and Treasurer, ACC (2015 to present). Also serves as President, ACS; Vice President, ACIM; Chief Financial Officer, Chief Accounting Officer and/or Director, ACIM, ACS and other ACC subsidiaries |
R. Wes Campbell
(1974) | Chief Financial Officer and Treasurer since 2018
| Vice President, ACS, (2020 to present); Investment Operations and Investment Accounting, ACS (2000 to present)
|
Amy D. Shelton
(1964) | Chief Compliance Officer and Vice President since 2014 | Chief Compliance Officer, American Century funds, (2014 to present); Chief Compliance Officer, ACIM (2014 to present); Chief Compliance Officer, ACIS (2009 to present). Also serves as Vice President, ACIS |
John Pak
(1968) | General Counsel and
Senior Vice
President since 2021 | General Counsel and Senior Vice President, ACC (2021 to present); Also serves as General Counsel and Senior Vice President, ACIM, ACS and ACIS. Chief Legal Officer of Investment and Wealth Management, The Bank of New York Mellon (2014 to 2021) |
David H. Reinmiller
(1963) | Vice President since 2000 | Attorney, ACC (1994 to present). Also serves as Vice President, ACIM and ACS |
Ward D. Stauffer
(1960) | Secretary since 2005 | Attorney, ACC (2003 to present) |
| | |
| Liquidity Risk Management Program |
The Funds have adopted a liquidity risk management program (the “program”). The Funds' Board of Directors (the "Board") has designated American Century Investment Management, Inc. (“ACIM”) as the administrator of the program. Personnel of ACIM or its affiliates, including members of ACIM’s Investment Oversight Committee who are members of ACIM’s Investment Management and Global Analytics departments, conduct the day-to-day operation of the program pursuant to the program.
Under the program, ACIM manages the Funds' liquidity risk, which is the risk that the Funds could not meet shareholder redemption requests without significant dilution of remaining shareholders’ interests in the Funds. This risk is managed by monitoring the degree of liquidity of the Funds' investments, limiting the amount of the Funds' illiquid investments, and utilizing various risk management tools and facilities available to the Funds for meeting shareholder redemptions, among other means. ACIM’s process of determining the degree of liquidity of certain investments held by the Funds are supported by a third-party liquidity assessment vendor.
The Board reviewed a report prepared by ACIM regarding the operation and effectiveness of the program for the period January 1, 2022 through December 31, 2022. No significant liquidity events impacting the Funds were noted in the report. In addition, ACIM provided its assessment that the program had been effective in managing the Funds' liquidity risk.
A special meeting of shareholders was held on October 13, 2022, to vote on the following proposal. The proposal received the required votes and was adopted. A summary of voting results is listed below.
To elect five directors to the Board of Directors of American Century Asset Allocation
Portfolios, Inc.:
| | | | | | | | | | | |
| Affirmative | | Withhold |
| Brian Bulatao | $ | 8,582,345,051 | | | $ | 563,235,224 | |
| Chris H. Cheesman | $ | 8,707,646,938 | | | $ | 437,933,337 | |
| Rajesh K. Gupta | $ | 8,679,529,882 | | | $ | 466,050,393 | |
| Lynn M. Jenkins | $ | 8,621,650,078 | | | $ | 523,930,197 | |
| Gary C. Meltzer | $ | 8,661,710,317 | | | $ | 483,869,958 | |
The other directors whose term of office continued after the meeting include Jonathan S. Thomas, Thomas W. Bunn, Barry Fink, Jan M. Lewis, and Stephen E. Yates.
Retirement Account Information
As required by law, distributions you receive from certain retirement accounts are subject to federal income tax withholding at the IRS default rate of 10%.* Tax will be withheld on the total amount withdrawn even though you may be receiving amounts that are not subject to withholding, such as nondeductible contributions. In such case, excess amounts of withholding could occur. You may adjust your withholding election so that a greater or lesser amount will be withheld.
You may elect a different withholding rate, or request zero withholding, by submitting an acceptable IRS Form W-4R election with your distribution request. You may notify us of your W-4R election by telephone, on our distribution forms, on IRS Form W-4R, or through other acceptable electronic means. If your withholding election is for an automatic withdrawal plan, you have the right to revoke your election at any time and any election you make will remain in effect until revoked by filing a new election.
Remember, even if you elect not to have income tax withheld, you are liable for paying income tax on the taxable portion of your withdrawal. If you elect not to have income tax withheld or you don’t have enough income tax withheld, you may be responsible for payment of estimated tax. You may incur penalties under the estimated tax rules if your withholding and estimated tax payments are not sufficient. You can reduce or defer the income tax on a distribution by directly or indirectly rolling such distribution over to another IRA or eligible plan. You should consult your tax advisor for additional information.
State tax will be withheld according to state regulations if, at the time of your distribution, your tax residency is within one of the mandatory withholding states.
*Some 403(b), 457 and qualified retirement plan distributions may be subject to 20% mandatory withholding, as they are subject to special tax and withholding rules. Your plan administrator or plan sponsor is required to provide you with a special tax notice explaining those rules at the time you request a distribution. If applicable, federal and/or state taxes may be withheld from your distribution amount.
Proxy Voting Policies
A description of the policies that the funds’ investment advisor uses in exercising the voting rights associated with the securities purchased and/or held by the funds is available without charge, upon request, by calling 1-800-345-2021. It is also available on American Century Investments’ website at americancentury.com/proxy and on the Securities and Exchange Commission’s website at sec.gov. Information regarding how the investment advisor voted proxies relating to portfolio securities during the most recent 12-month period ended June 30 is available on americancentury.com/proxy. It is also available at sec.gov.
Quarterly Portfolio Disclosure
The funds file their complete schedule of portfolio holdings with the Securities and Exchange
Commission (SEC) for the first and third quarters of each fiscal year as an exhibit to their reports on Form N-PORT. These portfolio holdings are available on the funds' website at
americancentury.com and, upon request, by calling 1-800-345-2021. The funds' Form N-PORT
reports are available on the SEC’s website at sec.gov.
Other Tax Information
The following information is provided pursuant to provisions of the Internal Revenue Code.
The funds hereby designate up to the maximum amount allowable as qualified dividend income for the fiscal year ended July 31, 2023.
For corporate taxpayers, the funds hereby designate the following, or up to the maximum amount allowable, of ordinary income distributions paid during the fiscal year ended July 31, 2023 as qualified for the corporate dividends received deduction.
| | | | | | | | | | | | | | |
One Choice In
Retirement
Portfolio | One Choice
2025 Portfolio | One Choice
2030 Portfolio | One Choice
2035 Portfolio | One Choice
2040 Portfolio |
| $ | 8,055,173 | | $ | 8,017,202 | | $ | 7,972,736 | | $ | 9,720,139 | | $ | 7,328,285 | |
| | | | | | | | | | | | | | |
One Choice 2045 Portfolio | One Choice 2050 Portfolio | One Choice 2055 Portfolio | One Choice 2060 Portfolio | One Choice 2065 Portfolio |
| $ | 8,200,601 | | $ | 6,426,524 | | $ | 4,649,549 | | $ | 2,167,128 | | $ | 242,615 | |
The funds hereby designate the following as qualified short-term capital gain distributions for purposes of Internal Revenue Code Section 871 for the fiscal year ended July 31, 2023.
| | | | | | | | | | | | | | |
One Choice In Retirement Portfolio | One Choice 2025 Portfolio | One Choice 2030 Portfolio | One Choice 2035 Portfolio | One Choice 2040 Portfolio |
| $ | 462,023 | | — | | — | | — | | — | |
| | | | | | | | | | | | | | |
One Choice 2045 Portfolio | One Choice 2050 Portfolio | One Choice 2055 Portfolio | One Choice 2060 Portfolio | One Choice 2065 Portfolio |
| — | | — | | — | | $ | 142,775 | | — | |
The funds hereby designate the following, or up to the maximum amount allowable, as long-term capital gain distributions (20% rate gain distributions) for the fiscal year ended July 31, 2023.
| | | | | | | | | | | | | | |
One Choice In
Retirement
Portfolio | One Choice
2025 Portfolio | One Choice
2030 Portfolio | One Choice
2035 Portfolio | One Choice
2040 Portfolio |
| $ | 46,811,953 | | $ | 39,675,337 | | $ | 49,464,615 | | $ | 65,011,448 | | $ | 54,000,719 | |
| | | | | | | | | | | | | | |
One Choice
2045 Portfolio | One Choice
2050 Portfolio | One Choice
2055 Portfolio | One Choice
2060 Portfolio | One Choice
2065 Portfolio |
| $ | 63,843,033 | | $ | 50,361,839 | | $ | 32,561,156 | | $ | 16,967,605 | | $ | 865,926 | |
For the fiscal year ended July 31, 2023, the funds intend to pass through to shareholders the following foreign source income and foreign taxes paid, or up to the maximum amount allowable, as a foreign tax credit.
| | | | | | | | | | | | | | |
| Foreign Tax Credit | Foreign Source Income |
| Amount | Per Outstanding Share | Amount | Per Outstanding Share |
| One Choice In Retirement Portfolio | $ | 110,976 | $0.0007 | $ | 2,892,704 | $0.0176 |
| One Choice 2025 Portfolio | $ | 136,260 | $0.0009 | $ | 3,127,024 | $0.0214 |
| One Choice 2030 Portfolio | $ | 195,147 | $0.0013 | $ | 3,687,941 | $0.0244 |
| One Choice 2035 Portfolio | $ | 317,874 | $0.0021 | $ | 5,306,942 | $0.0352 |
| One Choice 2040 Portfolio | $ | 303,079 | $0.0026 | $ | 4,666,896 | $0.0395 |
| One Choice 2045 Portfolio | $ | 378,212 | $0.0035 | $ | 5,659,857 | $0.0520 |
| One Choice 2050 Portfolio | $ | 309,530 | $0.0035 | $ | 4,556,187 | $0.0518 |
| One Choice 2055 Portfolio | $ | 231,239 | $0.0041 | $ | 3,369,476 | $0.0602 |
| One Choice 2060 Portfolio | $ | 105,981 | $0.0037 | $ | 1,549,288 | $0.0541 |
| One Choice 2065 Portfolio | $ | 11,427 | $0.0025 | $ | 171,332 | $0.0374 |
The funds utilized the following earnings and profits distributed to shareholders on redemptions of shares as part of the dividends paid deduction (tax equalization).
| | | | | | | | | | | | | | |
One Choice In
Retirement
Portfolio | One Choice
2025 Portfolio | One Choice
2030 Portfolio | One Choice
2035 Portfolio | One Choice
2040 Portfolio |
| $ | 2,861,326 | | $ | 3,298,461 | | $ | 239,148 | | $ | 651,871 | | $ | 44,300 | |
| | | | | | | | | | | | | | |
One Choice
2045 Portfolio | One Choice
2050 Portfolio | One Choice
2055 Portfolio | One Choice
2060 Portfolio | One Choice
2065 Portfolio |
| $ | 177,851 | | $ | 24,718 | | — | | — | | — | |
| | | | | | | | |
| |
| | |
| Contact Us | americancentury.com | |
| Automated Information Line | 1-800-345-8765 | |
| Investor Services Representative | 1-800-345-2021
or 816-531-5575 | |
| Investors Using Advisors | 1-800-378-9878 | |
| Business, Not-For-Profit, Employer-Sponsored Retirement Plans | 1-800-345-3533 | |
| Banks and Trust Companies, Broker-Dealers, Financial Professionals, Insurance Companies | 1-800-345-6488 | |
| Telecommunications Relay Services for the Deaf | 711 | |
| | |
| American Century Asset Allocation Portfolios, Inc. | |
| | |
Investment Advisor: American Century Investment Management, Inc. Kansas City, Missouri | |
| | |
| This report and the statements it contains are submitted for the general information of our shareholders. The report is not authorized for distribution to prospective investors unless preceded or accompanied by an effective prospectus. | |
| | |
©2023 American Century Proprietary Holdings, Inc. All rights reserved.
CL-ANN-93179 2309 | |
(b) None.
ITEM 2. CODE OF ETHICS.
(a) The registrant has adopted a Code of Ethics for Senior Financial Officers that applies to the registrant’s principal executive officer, principal financial officer, principal accounting officer, and persons performing similar functions.
(b) No response required.
(c) None.
(d) None.
(e) Not applicable.
(f) The registrant’s Code of Ethics for Senior Financial Officers was filed as Exhibit 12 (a)(1) to American Century Asset Allocation Portfolios, Inc.’s Annual Certified Shareholder Report on Form N-CSR, File No. 811-21591, on September 29, 2005, and is incorporated herein by reference.
ITEM 3. AUDIT COMMITTEE FINANCIAL EXPERT.
(a)(1) The registrant’s board has determined that the registrant has at least one audit committee financial expert serving on its audit committee.
(a)(2) Chris H. Cheesman, Lynn M. Jenkins, Barry Fink and Gary Meltzer are the registrant’s designated audit committee financial experts. They are “independent” as defined in Item 3 of Form N-CSR.
(a)(3) Not applicable.
(b) No response required.
(c) No response required.
(d) No response required.
ITEM 4. PRINCIPAL ACCOUNTANT FEES AND SERVICES.
(a) Audit Fees.
The aggregate fees billed for each of the last two fiscal years for professional services rendered by the principal accountant for the audit of the registrant’s annual financial statements or services that are normally provided by the accountant in connection with statutory and regulatory filings or engagements for those fiscal years were as follows:
FY 2022: $206,780
FY 2023: $203,860
(b) Audit-Related Fees.
The aggregate fees billed in each of the last two fiscal years for assurance and related services by the principal accountant that are reasonably related to the performance of the audit of the registrant’s financial statements and are not reported under paragraph (a) of this Item were as follows:
For services rendered to the registrant:
FY 2022: $0
FY 2023: $0
Fees required to be approved pursuant to paragraph (c)(7)(ii) of Rule 2-01 of Regulation S-X (relating to certain engagements for non-audit services with the registrant’s investment adviser and its affiliates):
FY 2022: $0
FY 2023: $0
(c) Tax Fees.
The aggregate fees billed in each of the last two fiscal years for professional services rendered by the principal accountant for tax compliance, tax advice, and tax planning were as follows:
For services rendered to the registrant:
FY 2022: $0
FY 2023: $0
Fees required to be approved pursuant to paragraph (c)(7)(ii) of Rule 2-01 of Regulation S-X (relating to certain engagements for non-audit services with the registrant’s investment adviser and its affiliates):
FY 2022: $0
FY 2023: $0
(d) All Other Fees.
The aggregate fees billed in each of the last two fiscal years for products and services provided by the principal accountant, other than the services reported in paragraphs (a) through (c) of this Item were as follows:
For services rendered to the registrant:
FY 2022: $0
FY 2023: $0
Fees required to be approved pursuant to paragraph (c)(7)(ii) of Rule 2-01 of Regulation S-X (relating to certain engagements for non-audit services with the registrant’s investment adviser and its affiliates):
FY 2022: $0
FY 2023: $0
(e)(1) In accordance with paragraph (c)(7)(i)(A) of Rule 2-01 of Regulation S-X, before the accountant is engaged by the registrant to render audit or non-audit services, the engagement is approved by the registrant’s audit committee. Pursuant to paragraph (c)(7)(ii) of Rule 2-01 of Regulation S-X, the registrant’s audit committee also pre-approves its accountant’s engagements for non-audit services with the registrant’s investment adviser, its parent company, and any entity controlled by, or under common control with the investment adviser that provides ongoing services to the registrant, if the engagement relates directly to the operations and financial reporting of the registrant.
(e)(2) All services described in each of paragraphs (b) through (d) of this Item were pre-approved before the engagement by the registrant’s audit committee pursuant to paragraph (c)(7)(i)(A) of Rule 2-01 of Regulation S-X. Consequently, none of such services were required to be approved by the audit committee pursuant to paragraph (c)(7)(i)(C).
(f) The percentage of hours expended on the principal accountant’s engagement to audit the registrant’s financial statements for the most recent fiscal year that were attributed to work performed by persons other than the principal accountant’s full-time, permanent employees was less than 50%.
(g) The aggregate non-audit fees billed by the registrant’s accountant for services rendered to the registrant, and rendered to the registrant’s investment adviser (not including any sub-adviser whose role is primarily portfolio management and is subcontracted with or overseen by another investment adviser), and any entity controlling, controlled by, or under common control with the adviser that provides ongoing services to the registrant for each of the last two fiscal years of the registrant were as follows:
FY 2022: $2,285,611
FY 2023: $243,325
(h) The registrant’s investment adviser and accountant have notified the registrant’s audit committee of all non-audit services that were rendered by the registrant’s accountant to the registrant’s investment adviser, its parent company, and any entity controlled by, or under common control with the investment adviser that provides services to the registrant, which services were not required to be pre-approved pursuant to paragraph (c)(7)(ii) of Rule 2-01 of Regulation S-X. The notification provided to the registrant’s audit committee included sufficient details regarding such services to allow the registrant’s audit committee to consider the continuing independence of its principal accountant.
(i) Not applicable.
(j) Not applicable.
ITEM 5. AUDIT COMMITTEE OF LISTED REGISTRANTS.
Not applicable.
ITEM 6. INVESTMENTS.
(a) The schedule of investments is included as part of the report to stockholders filed under Item 1 of this Form.
(b) Not applicable.
ITEM 7. DISCLOSURE OF PROXY VOTING POLICIES AND PROCEDURES FOR CLOSED-END MANAGEMENT INVESTMENT COMPANIES.
Not applicable.
ITEM 8. PORTFOLIO MANAGERS OF CLOSED-END MANAGEMENT INVESTMENT COMPANIES.
Not applicable.
ITEM 9. PURCHASES OF EQUITY SECURITIES BY CLOSED-END MANAGEMENT INVESTMENT COMPANY AND AFFILIATED PURCHASERS.
Not applicable.
ITEM 10. SUBMISSION OF MATTERS TO A VOTE OF SECURITY HOLDERS.
During the reporting period, there were no material changes to the procedures by which shareholders may recommend nominees to the registrant’s board.
ITEM 11. CONTROLS AND PROCEDURES.
(a) The registrant's principal executive officer and principal financial officer have concluded that the registrant's disclosure controls and procedures (as defined in Rule 30a-3(c) under the Investment Company Act of 1940) are effective based on their evaluation of these controls and procedures as of a date within 90 days of the filing date of this report.
(b) There were no changes in the registrant's internal control over financial reporting (as defined in Rule 30a-3(d) under the Investment Company Act of 1940) that occurred during the period covered by this report that have materially affected, or are reasonably likely to materially affect, the registrant's internal control over financial reporting.
ITEM 12. DISCLOSURE OF SECURITIES LENDING ACTIVITIES FOR CLOSED-END MANAGEMENT INVESTMENT COMPANIES.
Not applicable.
ITEM 13. EXHIBITS.
(a)(1) Registrant’s Code of Ethics for Senior Financial Officers, which is the subject of the disclosure required by Item 2 of Form N-CSR, was filed as Exhibit 12(a)(1) to American Century Asset Allocation Portfolios, Inc.’s Certified Shareholder Report on Form N-CSR, File No. 811-21591, on September 29, 2005.
(a)(3) Not applicable.
(a)(4) Not applicable.
SIGNATURES
Pursuant to the requirements of the Securities Exchange Act of 1934 and the Investment Company Act of 1940, the registrant has duly caused this report to be signed on its behalf by the undersigned, thereunto duly authorized.
| | | | | | | | | | | | | | |
| Registrant: | American Century Asset Allocation Portfolios, Inc. | |
| | | | |
| | | | |
| By: | /s/ Patrick Bannigan | |
| | Name: | Patrick Bannigan | |
| | Title: | President | |
| | | | |
| Date: | September 28, 2023 | |
| | | |
Pursuant to the requirements of the Securities Exchange Act of 1934 and the Investment Company Act of 1940, this report has been signed below by the following persons on behalf of the registrant and in the capacities and on the dates indicated.
| | | | | | | | | | | |
| By: | /s/ Patrick Bannigan | |
| | Name: | Patrick Bannigan | |
| | Title: | President | |
| | | (principal executive officer) | |
| | | | |
| | | | |
| Date: | September 28, 2023 | |
| | | | | | | | | | | |
| By: | /s/ R. Wes Campbell | |
| | Name: | R. Wes Campbell | |
| | Title: | Treasurer and | |
| | | Chief Financial Officer | |
| | | (principal financial officer) | |
| | | | |
| Date: | September 28, 2023 | |