Table of Contents
As filed with the Securities and Exchange Commission on December 22, 2011
UNITED STATES
SECURITIES AND EXCHANGE COMMISSION
Washington, D.C. 20549
FORM N-CSR
CERTIFIED SHAREHOLDER REPORT OF REGISTERED
MANAGEMENT INVESTMENT COMPANIES
Investment Company Act file number 811-21597
PRIMECAP Odyssey Funds
(Exact name of registrant as specified in charter)
225 South Lake Avenue, Suite 400
Pasadena, CA 91101
(Address of principal executive offices) (Zip code)
Michael J. Ricks
PRIMECAP Management Company
225 South Lake Avenue, Suite 400
Pasadena, CA 91101
(Name and address of agent for service)
(626) 304-9222
Registrant’s telephone number, including area code
Date of fiscal year end: October 31
Date of reporting period: October 31, 2011
Table of Contents
Item 1. Reports to Stockholders.
ANNUAL REPORT
October 31, 2011

PRIMECAP ODYSSEY STOCK (POSKX)
PRIMECAP ODYSSEY GROWTH (POGRX)
PRIMECAP ODYSSEY AGGRESSIVE GROWTH (POAGX)
Table of Contents
 | PRIMECAP Odyssey Funds |
| 2 | ||||
| 9 | ||||
| 9 | ||||
| 10 | ||||
| 11 | ||||
| 12 | ||||
| 14 | ||||
| 14 | ||||
| 18 | ||||
| 22 | ||||
| 26 | ||||
| 27 | ||||
| 28 | ||||
| 28 | ||||
| 29 | ||||
| 30 | ||||
| 31 | ||||
| 31 | ||||
| 32 | ||||
| 33 | ||||
| 34 | ||||
| 43 | ||||
| 44 | ||||
| 46 | ||||
| 50 | ||||
1
Table of Contents
| PRIMECAP Odyssey Funds |
Dear Fellow Shareholders,
For the fiscal year ended October 31, 2011, the PRIMECAP Odyssey Stock Fund, PRIMECAP Odyssey Growth Fund, and PRIMECAP Odyssey Aggressive Growth Fund produced total returns of +7.05%, +5.13%, and +8.50%, respectively. By comparison, the unmanaged Standard & Poor’s 500 Index (S&P 500) produced a total return of +8.09% for the period.
The PRIMECAP Odyssey Growth Fund and the PRIMECAP Odyssey Aggressive Growth Fund will each distribute capital gains in December 2011, primarily related to several stocks held in the funds which were purchased at substantial premiums by acquiring companies during the fiscal year. As long-term investors, we hold most of our positions for years, not months. However, acquisitions and other corporate actions will, from time to time, generate realized capital gains that result in distributions. Despite these distributions, we want to assure the Funds’ shareholders that we are always mindful of the tax consequences of our investment decisions.
Led by energy, materials, and industrial stocks, the S&P 500 gained more than 15% in the first half of the fiscal year. However, by mid-year, confidence in the economic recovery began to falter, and concerns regarding the European sovereign debt crisis and its potential ramifications for the global financial system weighed on financial markets. In response, the S&P 500 declined each month from May through September, more than reversing the gains achieved in the first half of the fiscal year, but finished with positive gains due to a strong rally in October.
The U.S. economy’s recovery from the recession has slowed, as evidenced by moderating growth in GDP and declining consumer confidence. Unemployment remains stubbornly high, and the housing market has failed to show any meaningful improvement. The ongoing debt crisis in Europe has increased volatility in equity markets as investors fear potential contagion to the global financial system. Despite these unsettling developments, industrial production continues to grow and corporations are generating profit margins and returns on capital well above historical averages.
The PRIMECAP Odyssey Funds remain focused on investing in companies that, in our judgment, offer better growth prospects than are currently anticipated by the market. This process often leads us to invest more heavily in some sectors of the market than others. We continue to be overweight in the health care and information technology sectors and underweight in the financials, consumer staples, and energy sectors in each of the three PRIMECAP Odyssey Funds.
During the past fiscal year, a large commitment to the health care sector helped relative returns in the PRIMECAP Odyssey Stock Fund and the PRIMECAP Odyssey Aggressive Growth Fund. In the PRIMECAP Odyssey Growth Fund, stock selection in the health care sector led to more mixed results. We built considerable positions in pharmaceutical, biotechnology, and medical device companies based on our view that these companies are in the process of developing innovative new drugs and other products that represent real advances in the treatments for diseases such as diabetes, cancer, and neurological disorders. As data regarding the efficacy and safety of these new products emerged, several stocks in the portfolios experienced dramatic price changes which significantly impacted the funds’ results, both favorably and unfavorably.
2
Table of Contents
Letter to Shareholders
PRIMECAP Odyssey Funds
continued
Each of the PRIMECAP Odyssey Funds benefited from its minimal position in the financials sector, which was the only sector in the S&P 500 with negative returns for the fiscal year. An underweight position in the energy sector and poor stock selection in the industrials sector hurt the funds’ results.
A more detailed discussion of the results for each of the PRIMECAP Odyssey Funds follows.
PRIMECAP Odyssey Stock Fund
From November 1, 2010 to October 31, 2011, the Stock Fund returned +7.05%, which trailed the S&P 500’s total return of +8.09%. On a relative basis, our underweight position and poor stock selection in the energy sector and poor stock selection in the industrials sector hurt the fund’s returns. This was partially offset by our underweight position in the financials sector and our overweight position and positive stock selection in the health care sector.
Research in Motion (-64.5%), Southwest Airlines (-37.8%), and Whirlpool (-31.3%) were among the biggest decliners. Research in Motion suffered from concerns over its loss of market share in U.S. smartphones and delays in the development of its next generation operating system. However, we believe there is significant value in the stock at current levels, given the recurring nature of its service revenues and its strong position in rapidly growing markets in Latin America and Asia. Southwest Airlines, along with other airlines, faced higher fuel costs. Yet Southwest has continued to expand its market share while maintaining its position as the leading low cost airline. Whirlpool experienced lower demand for its appliances due to the continued weakness in the housing market, resulting in a decline in earnings.
On the positive side, several of the fund’s largest holdings in the health care sector helped the fund’s relative returns including Biogen Idec (+85.6%), GlaxoSmithKline (+19.4%), and Roche Holding AG (+18.7%). Biogen Idec reported favorable results from studies of its new oral drug to treat multiple sclerosis, while Roche received regulatory approval for drugs to treat melanoma and lung cancer.
Other top contributors included Range Resources (+84.7%), Electronic Arts (+47.5%), KLA-Tencor (+35.4%), and Marsh & McLennan (+26.3%).
3
Table of Contents
Letter to Shareholders
PRIMECAP Odyssey Funds
continued
The fund’s top 10 holdings, which collectively represented 33.7% of the portfolio at October 31, 2011, are listed below:
| PRIMECAP Odyssey Stock Fund Top 10 Holdings as of 10/31/11 | Ending % of Total Portfolio* | |||
Roche Holding AG | 4.5 | |||
Johnson & Johnson | 4.3 | |||
Amgen, Inc. | 4.1 | |||
Texas Instruments, Inc. | 3.6 | |||
Microsoft Corp. | 3.4 | |||
Medtronic, Inc. | 2.9 | |||
Marsh & McLennan Cos., Inc. | 2.8 | |||
Eli Lilly & Co. | 2.8 | |||
Schweitzer-Mauduit Intl., Inc. | 2.7 | |||
GlaxoSmithKline PLC | 2.6 | |||
Total % of Portfolio | 33.7 | % | ||
| * | The percentage is calculated by using the ending market value of the security divided by that of the total investments of the fund. |
PRIMECAP Odyssey Growth Fund
From November 1, 2010 to October 31, 2011, the Growth Fund’s total return was +5.13%, which trailed the S&P 500’s total return of +8.09% and the Russell 1000 Growth Index’s total return of +9.92%. The fund’s disappointing relative returns were driven mainly by poor stock selection in the industrials sector, including two airlines, AMR (-66.7%) and Southwest Airlines (-37.8%).
The fund’s considerable holdings in the health care sector had mixed results. Several health care stocks were among the largest detractors from the fund’s returns, including Dendreon (-70.0%), Nektar Therapeutics (-62.8%), and Accuray (-39.2%). Dendreon declined after the company lowered sales expectations for Provenge, its treatment for prostate cancer. Despite positive clinical results for Provenge, sales have been disappointing due to the complexity of the treatment regimen.
These negative results were mostly offset by strong gains in four health care stocks, which were among were the fund’s top 10 holdings: Biogen Idec (+85.6%), Cepheid (+70.5%), ImmunoGen (+65.2%), and Seattle Genetics (+34.1%). Cepheid, a leading manufacturer of molecular diagnostic tools, has experienced strong growth in the sales of its GeneXpert™ system, which helps hospitals detect bacteria responsible for serious infections with greater accuracy, ease of use, and
4
Table of Contents
Letter to Shareholders
PRIMECAP Odyssey Funds
continued
speed. ImmunoGen and Seattle Genetics are two leading developers of antibody drug conjugates. ImmunoGen released positive data regarding its candidate drug to treat breast cancer while Seattle Genetics received regulatory approval for its drug to treat Hodgkin’s lymphoma. We are excited about the potential of using antibody drug conjugates because they deliver chemotherapy directly to the cancerous cells, providing greater efficacy than conventional treatments with fewer side effects. Other top contributors included Nuance Communications (+68.6%) and Electronic Arts (+47.5%). The fund’s minimal holding in the financials sector contributed positively to relative returns.
The fund’s top 10 holdings, which collectively represented 33.0% of the portfolio at October 31, 2011, are listed below:
| PRIMECAP Odyssey Growth Fund Top 10 Holdings as of 10/31/11 | Ending % of Total Portfolio* | |||
Seattle Genetics, Inc. | 5.5 | |||
Roche Holding AG | 4.4 | |||
ImmunoGen, Inc. | 4.3 | |||
Amgen, Inc. | 4.3 | |||
Biogen Idec, Inc. | 2.8 | |||
Cepheid, Inc. | 2.5 | |||
Google, Inc. (Cl A) | 2.4 | |||
Nuance Communications, Inc. | 2.4 | |||
Altera Corp. | 2.2 | |||
Charles Schwab Corp. | 2.2 | |||
Total % of Portfolio | 33.0 | % | ||
| * | The percentage is calculated by using the ending market value of the security divided by that of the total investments of the fund. |
PRIMECAP Odyssey Aggressive Growth Fund
From November 1, 2010 to October 31, 2011, the Aggressive Growth Fund’s total return was +8.50%, ahead of the S&P 500’s total return of +8.09% but behind the Russell Midcap Growth Index’s total return of +10.08%. Positive stock selection in the health care sector and the fund’s underweight position in the financials sector helped results. This was offset by poor stock selection in the industrials and consumer discretionary sectors.
Several of the fund’s holdings in the health care sector were major contributors to the fund’s results: OraSure Technologies (+128.3%), Pharmacyclics (+115.2%), Biogen Idec (+85.6%), Cepheid (+70.5%), ImmunoGen (+65.2%), and Seattle Genetics (+34.1%). OraSure
5
Table of Contents
Letter to Shareholders
PRIMECAP Odyssey Funds
continued
Technologies, a manufacturer of oral fluid diagnostic products, made important progress in the clinical development of its rapid blood test for hepatitis C and for its over-the-counter HIV test. Pharmacyclics reported favorable results from novel oral drug candidates for the treatment of cancer and immune-mediated diseases.
Other top contributors included Cabot Oil & Gas (+168.9%), Smart Balance (+84.0%), and Electronic Arts (+47.5%).
Although our selections in the health care sector made a net positive contribution to returns for the fiscal year, certain health care stocks were among the largest detractors from the fund’s results, including Dendreon (-70.0%), Nektar Therapeutics (-62.8%), and Accuray (-39.2%). AMR (-66.7%), Research in Motion (-64.5%), and DreamWorks Animation (-47.5%) were among the other large detractors.
The fund’s top 10 holdings, which collectively represented 33.5% of the portfolio at October 31, 2011, are listed below:
| PRIMECAP Odyssey Aggressive Growth Fund Top 10 Holdings as of 10/31/11 | Ending % of Total Portfolio* | |||
Seattle Genetics, Inc. | 5.7 | |||
Roche Holding AG | 4.9 | |||
ImmunoGen, Inc. | 4.3 | |||
Cepheid, Inc. | 3.5 | |||
Google, Inc. (Cl A) | 2.9 | |||
Abiomed, Inc. | 2.7 | |||
Pharmacyclics, Inc. | 2.6 | |||
Stratasys, Inc. | 2.4 | |||
Adobe Systems, Inc. | 2.3 | |||
DreamWorks Animation SKG, Inc. (Cl A) | 2.2 | |||
Total % of Portfolio | 33.5 | % | ||
| * | The percentage is calculated by using the ending market value of the security divided by that of the total investments of the fund. |
6
Table of Contents
Letter to Shareholders
PRIMECAP Odyssey Funds
continued
Outlook
As we enter fiscal 2012, U.S. equities look attractive in our judgment. In the sectors that the PRIMECAP Odyssey Funds have the greatest weightings, notably health care and information technology, we find valuations particularly compelling.
Over the last decade, the greatest returns among U.S. stocks were concentrated in the energy and materials sectors. Driven by rapidly growing demand from China, India, Brazil, and other emerging economies, prices for commodities such as oil, copper, and corn have soared. This led to expanded profit margins and rapid earnings growth at companies in these sectors and resulted in high valuation multiples for their stocks. In our opinion, and contrary to conventional wisdom, this trend is unsustainable. Conversely, the information technology and health care sectors have endured a decade of valuation compression as investors questioned the long-term growth prospects and earnings potential of companies in these sectors. As we have previously discussed, in our view, the fundamental outlook for many holdings in the information technology and health care sectors is promising. Also, we feel the investment case for many of these stocks is further supported by compelling valuations and very strong balance sheets.
Over the history of the PRIMECAP Odyssey Funds, we have tended to find the greatest opportunities in downtrodden stocks and sectors in which others have often perceived the greatest risks. Similarly, we have frequently found the risks to be greatest in stocks and sectors that have been viewed most favorably by the consensus. We believe this approach has been instrumental to the results of the PRIMECAP Odyssey Funds since their inception.
Sincerely,
PRIMECAP Management Company
November 15, 2011
Note: On November 29, 2011, AMR Corporation filed for Chapter 11 bankruptcy after failing to negotiate new labor contracts with its employees’ unions.
Past performance is not a guarantee of future results.
The funds invest in smaller companies, which involve additional risks such as limited liquidity and greater volatility. All funds may invest in foreign securities, which involves greater volatility and political, economic and currency risks and differences in accounting methods. Mutual fund investing involves risk, and loss of principal is possible. Growth stocks typically are more volatile than value stocks; however, value stocks have a lower expected growth rate in earnings and sales.
Please refer to the Schedule of Investments for details of fund holdings. Fund holdings and sector allocations are subject to change at any time and are not recommendations to buy or sell any security.
7
Table of Contents
Letter to Shareholders
PRIMECAP Odyssey Funds
continued
The S&P 500 Index is a broad based index of 500 stocks, which is widely recognized as representative of the market in general. The Russell 1000 Growth Index is an index that measures the performance of those Russell 1000 companies with higher price-to-book ratios and higher forecasted growth values. The Russell Midcap Growth Index measures the performance of those Russell Midcap companies with higher price-to-book ratios and higher forecasted growth values. You cannot invest directly in an index.
Any tax information provided is merely a summary of our understanding and interpretation of some of the current income tax regulations and is not exhaustive. Investors must consult their tax advisor for advice and information concerning their particular situation. Neither the funds nor their representatives may give tax advice.
Earnings growth is an indicator for measuring a company’s success and can be the driving force behind stock price appreciation.
The information provided herein represents the opinions of PRIMECAP Management Company and is not intended to be a forecast of future events, a guarantee of future results, or investment advice.
8
Table of Contents
|
The following chart compares the value of a hypothetical $10,000 investment in the PRIMECAP Odyssey Stock Fund from November 1, 2004 (inception) to October 31, 2011, compared to the S&P 500 Index. This chart illustrates the performance of a hypothetical $10,000 investment made on the fund’s inception date and is not intended to imply any future performance. The returns shown do not reflect the deduction of taxes that a shareholder would pay on fund distributions or the redemption of fund shares. The chart assumes reinvestment of capital gains and dividends.
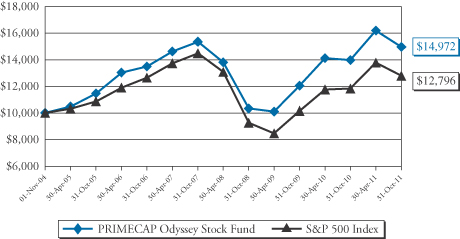
| Total Return Period Ended October 31, 2011 | ||||||||||||
| 1 Year | Annualized 5 Year | Annualized Since Inception^ | ||||||||||
PRIMECAP Odyssey Stock Fund | 7.05% | 2.11% | 5.94% | |||||||||
S&P 500 Index* | 8.09% | 0.25% | 3.59% | |||||||||
Performance data quoted represents past performance and does not guarantee future results. The investment return and principal value of an investment will fluctuate so that an investor’s shares, when redeemed, may be worth more or less than their original cost. Current performance of the fund may be lower or higher than the performance quoted. Performance data current to the most recent month end may be obtained by calling 1-800-729-2307. The fund imposes a 2% redemption fee on shares held less than 60 days.
| * | The S&P 500 is a market capitalization weighted index of 500 large-capitalization stocks commonly used to represent the U.S. equity market. |
| ^ | November 1, 2004 |
9
Table of Contents
| Performance Graphs |
The following chart compares the value of a hypothetical $10,000 investment in the PRIMECAP Odyssey Growth Fund from November 1, 2004 (inception) to October 31 2011, compared to the S&P 500 Index. This chart illustrates the performance of a hypothetical $10,000 investment made on the fund’s inception date and is not intended to imply any future performance. The returns shown do not reflect the deduction of taxes that a shareholder would pay on fund distributions or the redemption of fund shares. The chart assumes reinvestment of capital gains and dividends.
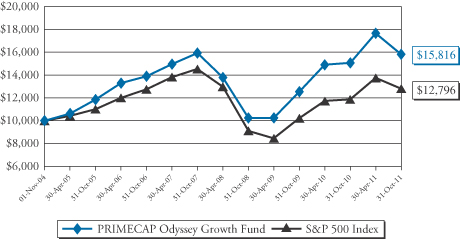
| Total Return Period Ended October 31, 2011 | ||||||||||||
| 1 Year | Annualized 5 Year | Annualized Since Inception^ | ||||||||||
PRIMECAP Odyssey Growth Fund | 5.13% | 2.81% | 6.77% | |||||||||
S&P 500 Index* | 8.09% | 0.25% | 3.59% | |||||||||
Performance data quoted represents past performance and does not guarantee future results. The investment return and principal value of an investment will fluctuate so that an investor’s shares, when redeemed, may be worth more or less than their original cost. Current performance of the fund may be lower or higher than the performance quoted. Performance data current to the most recent month end may be obtained by calling 1-800-729-2307. The fund imposes a 2% redemption fee on shares held less than 60 days.
| * | The S&P 500 is a market capitalization weighted index of 500 large-capitalization stocks commonly used to represent the U.S. equity market. |
| ^ | November 1, 2004 |
10
Table of Contents
| Performance Graphs |
The following chart compares the value of a hypothetical $10,000 investment in the PRIMECAP Odyssey Aggressive Growth Fund from November 1, 2004 (inception) to October 31, 2011, compared to the S&P 500 Index. This chart illustrates the performance of a hypothetical $10,000 investment made on the fund’s inception date and is not intended to imply any future performance. The returns shown do not reflect the deduction of taxes that a shareholder would pay on fund distributions or the redemption of fund shares. The chart assumes reinvestment of capital gains and dividends.
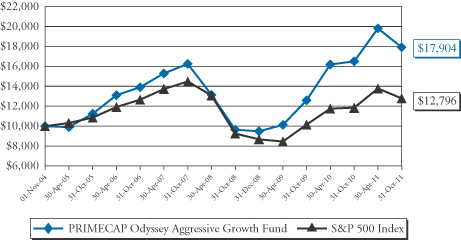
| Total Return Period Ended October 31, 2011 | ||||||||||||
| 1 Year | Annualized 5 Year | Annualized Since Inception^ | ||||||||||
PRIMECAP Odyssey Aggressive Growth Fund | 8.50% | 5.16% | 8.68% | |||||||||
S&P 500 Index* | 8.09% | 0.25% | 3.59% | |||||||||
Performance data quoted represents past performance and does not guarantee future results. The investment return and principal value of an investment will fluctuate so that an investor’s shares, when redeemed, may be worth more or less than their original cost. Current performance of the fund may be lower or higher than the performance quoted. Performance data current to the most recent month end may be obtained by calling 1-800-729-2307. The fund imposes a 2% redemption fee on shares held less than 60 days.
| * | The S&P 500 is a market capitalization weighted index of 500 large-capitalization stocks commonly used to represent the U.S. equity market. |
| ^ | November 1, 2004 |
11
Table of Contents
| PRIMECAP Odyssey Funds |
PRIMECAP Odyssey Stock Fund
Consumer Discretionary | 9.5% | |||
Consumer Staples | 3.3% | |||
Energy | 8.1% | |||
Financials | 6.3% | |||
Health Care | 26.6% | |||
Industrials | 11.7% | |||
Information Technology | 21.0% | |||
Materials | 5.8% | |||
Utilities | 1.7% | |||
Short Term Investments and Other Assets | 6.0% | |||
Total | 100.0% |
PRIMECAP Odyssey Growth Fund
Consumer Discretionary | 9.0% | |||
Consumer Staples | 0.4% | |||
Energy | 6.7% | |||
Financials | 5.1% | |||
Health Care | 38.3% | |||
Industrials | 8.5% | |||
Information Technology | 28.7% | |||
Materials | 2.2% | |||
Short Term Investments, net of Other Liabilities | 1.1% | |||
Total | 100.0% |
The tables above list sector allocations as a percentage of each fund’s total net assets as of October 31, 2011. The management report makes reference to average allocations during the period. As a result, the sector allocations above may differ from those discussed in the management report.
12
Table of Contents
Sector Breakdown
PRIMECAP Odyssey Funds
continued
PRIMECAP Odyssey Aggressive Growth Fund
Consumer Discretionary | 5.6% | |||
Consumer Staples | 1.9% | |||
Energy | 5.9% | |||
Financials | 1.6% | |||
Health Care | 39.2% | |||
Industrials | 7.3% | |||
Information Technology | 32.6% | |||
Materials | 2.3% | |||
Short Term Investments and Other Assets | 3.6% | |||
Total | 100.0% |
The table above lists sector allocations as a percentage of the fund’s total net assets as of October 31, 2011. The management report makes reference to average allocations during the period. As a result, the sector allocations above may differ from those discussed in the management report.
13
Table of Contents
| October 31, 2011 |
| Shares | Value | |||||||
| COMMON STOCKS – 94.0% | ||||||||
| Consumer Discretionary – 9.5% | ||||||||
| 21,000 | Amazon.com, Inc. (a) | $ | 4,483,710 | |||||
| 188,700 | Ascena Retail Group, Inc. (a) | 5,453,430 | ||||||
| 102,600 | Bed Bath & Beyond, Inc. (a) | 6,344,784 | ||||||
| 226,600 | CarMax, Inc. (a) | 6,811,596 | ||||||
| 333,100 | Carnival Corp. | 11,728,451 | ||||||
| 64,500 | DIRECTV – Class A (a) | 2,932,170 | ||||||
| 410,000 | Limited Brands, Inc. | 17,511,100 | ||||||
| 260,000 | Mattel, Inc. | 7,342,400 | ||||||
| 8,100 | Men’s Wearhouse, Inc. (The) | 250,128 | ||||||
| 59,900 | Sony Corp. – ADR | 1,256,103 | ||||||
| 96,700 | TJX Cos., Inc. | 5,698,531 | ||||||
| 115,000 | Walt Disney Co. (The) | 4,011,200 | ||||||
| 240,000 | Whirlpool Corp. | 12,194,400 | ||||||
|
| |||||||
| 86,018,003 | ||||||||
|
| |||||||
| Consumer Staples – 3.3% | ||||||||
| 210,000 | Kellogg Co. | 11,384,100 | ||||||
| 185,000 | PepsiCo, Inc. | 11,645,750 | ||||||
| 100,000 | Procter & Gamble Co. (The) | 6,399,000 | ||||||
|
| |||||||
| 29,428,850 | ||||||||
|
| |||||||
| Energy – 8.1% | ||||||||
| 100,000 | Cameco Corp. | 2,143,000 | ||||||
| 150,000 | Cameron International Corp. (a) | 7,371,000 | ||||||
| 75,000 | Cenovus Energy, Inc. | 2,565,000 | ||||||
| 80,000 | Encana Corp. | 1,736,000 | ||||||
| 102,900 | EOG Resources, Inc. | 9,202,347 | ||||||
| 56,800 | Hess Corp. | 3,553,408 | ||||||
| 360,000 | McDermott International, Inc. (a) | 3,952,800 | ||||||
| 94,700 | National Oilwell Varco, Inc. | 6,754,951 | ||||||
| 50,000 | Noble Energy, Inc. | 4,467,000 | ||||||
| 250,000 | Petroleo Brasileiro SA – ADR | 6,322,500 | ||||||
| 208,300 | Range Resources Corp. | 14,339,372 | ||||||
| 112,434 | Schlumberger Ltd. | 8,260,526 | ||||||
| 53,000 | Transocean Ltd. | 3,028,950 | ||||||
|
| |||||||
| 73,696,854 | ||||||||
|
| |||||||
The accompanying notes are an integral part of these financial statements.
14
Table of Contents
Schedule of Investments
PRIMECAP Odyssey Stock Fund
October 31, 2011 – continued
| Shares | Value | |||||||
| Financials – 6.3% | ||||||||
| 1,540,200 | Charles Schwab Corp. (The) | $ | 18,913,656 | |||||
| 100,000 | Chubb Corp. (The) | 6,705,000 | ||||||
| 834,950 | Marsh & McLennan Cos., Inc. | 25,566,169 | ||||||
| 135,600 | Mercury General Corp. | 5,871,480 | ||||||
|
| |||||||
| 57,056,305 | ||||||||
|
| |||||||
| Health Care – 26.6% | ||||||||
| 75,000 | Abbott Laboratories | 4,040,250 | ||||||
| 75,000 | Affymetrix, Inc. (a) | 419,250 | ||||||
| 644,000 | Amgen, Inc. | 36,881,880 | ||||||
| 158,500 | Biogen Idec, Inc. (a) | 18,443,060 | ||||||
| 227,900 | Boston Scientific Corp. (a) | 1,342,331 | ||||||
| 677,100 | Eli Lilly & Co. | 25,161,036 | ||||||
| 526,735 | GlaxoSmithKline PLC – ADR | 23,592,461 | ||||||
| 596,900 | Johnson & Johnson | 38,434,391 | ||||||
| 760,800 | Medtronic, Inc. | 26,430,192 | ||||||
| 406,450 | Novartis AG – ADR | 22,952,231 | ||||||
| 100,000 | PerkinElmer, Inc. | 2,067,000 | ||||||
| 247,716 | Roche Holding AG – CHF | 40,834,478 | ||||||
|
| |||||||
| 240,598,560 | ||||||||
|
| |||||||
| Industrials – 11.7% | ||||||||
| 23,800 | Alaska Air Group, Inc. (a) | 1,583,414 | ||||||
| 50,000 | Alexander & Baldwin, Inc. | 2,075,500 | ||||||
| 160,100 | AMR Corp. (a) | 421,063 | ||||||
| 244,900 | Arkansas Best Corp. | 5,044,940 | ||||||
| 480,000 | Babcock & Wilcox Co. (The) (a) | 10,555,200 | ||||||
| 241,400 | Boeing Co. (The) | 15,881,706 | ||||||
| 50,000 | Canadian Pacific Railway Ltd. | 3,094,000 | ||||||
| 8,300 | Caterpillar, Inc. | 784,018 | ||||||
| 116,000 | European Aeronautic Defence and Space Co. N.V. – EUR | 3,430,082 | ||||||
| 26,200 | FedEx Corp. | 2,143,946 | ||||||
| 241,900 | Honeywell International, Inc. | 12,675,560 | ||||||
| 23,500 | JetBlue Airways Corp. (a) | 105,280 | ||||||
| 140,000 | Norfolk Southern Corp. | 10,358,600 | ||||||
| 64,300 | Pall Corp. | 3,290,231 | ||||||
| 179,400 | Ritchie Bros. Auctioneers, Inc. | 3,577,236 | ||||||
| 100,700 | Rockwell Automation, Inc. | 6,812,355 | ||||||
| 1,039,200 | Southwest Airlines Co. | 8,885,160 | ||||||
| 1,900 | Thomas & Betts Corp. (a) | 94,411 | ||||||
The accompanying notes are an integral part of these financial statements.
15
Table of Contents
Schedule of Investments
PRIMECAP Odyssey Stock Fund
October 31, 2011 – continued
| Shares | Value | |||||||
| Industrials (continued) | ||||||||
| 36,000 | Union Pacific Corp. | $ | 3,584,520 | |||||
| 160,000 | United Parcel Service, Inc. – Class B | 11,238,400 | ||||||
|
| |||||||
| 105,635,622 | ||||||||
|
| |||||||
| Information Technology – 21.0% | ||||||||
| 45,650 | Accenture PLC – Class A | 2,750,869 | ||||||
| 227,200 | Altera Corp. | 8,615,424 | ||||||
| 268,700 | Applied Materials, Inc. | 3,310,384 | ||||||
| 24,577 | ASML Holding N.V. | 1,030,514 | ||||||
| 350,000 | Corning, Inc. | 5,001,500 | ||||||
| 200,000 | Diebold, Inc. | 6,456,000 | ||||||
| 416,400 | Electronic Arts, Inc. (a) | 9,722,940 | ||||||
| 81,500 | EMC Corp. (a) | 1,997,565 | ||||||
| 11,500 | Google, Inc. – Class A (a) | 6,815,360 | ||||||
| 46,000 | Hewlett-Packard Co. | 1,224,060 | ||||||
| 263,000 | Intel Corp. | 6,454,020 | ||||||
| 94,700 | Intuit, Inc. | 5,082,549 | ||||||
| 330,100 | KLA-Tencor Corp. | 15,544,409 | ||||||
| 964,700 | L.M. Ericsson Telephone Co. – ADR | 10,042,527 | ||||||
| 1,153,100 | Microsoft Corp. | 30,707,053 | ||||||
| 14,112 | Motorola Mobility Holdings, Inc. (a) | 548,675 | ||||||
| 16,128 | Motorola Solutions, Inc. | 756,564 | ||||||
| 81,400 | NeuStar, Inc. – Class A (a) | 2,587,706 | ||||||
| 320,000 | NVIDIA Corp. (a) | 4,736,000 | ||||||
| 50,700 | Oracle Corp. | 1,661,439 | ||||||
| 45,900 | QUALCOMM, Inc. | 2,368,440 | ||||||
| 234,100 | Research In Motion Ltd. (a) | 4,728,820 | ||||||
| 244,800 | Symantec Corp. (a) | 4,164,048 | ||||||
| 1,042,100 | Texas Instruments, Inc. | 32,023,733 | ||||||
| 190,000 | Visa, Inc. – Class A | 17,719,400 | ||||||
| 100,000 | Xilinx, Inc. | 3,346,000 | ||||||
| 24,800 | Yahoo!, Inc. (a) | 387,872 | ||||||
|
| |||||||
| 189,783,871 | ||||||||
|
| |||||||
| Materials – 5.8% | ||||||||
| 113,600 | Freeport-McMoRan Copper & Gold, Inc. | 4,573,536 | ||||||
| 71,900 | Monsanto Co. | 5,230,725 | ||||||
| 159,500 | Potash Corp. of Saskatchewan, Inc. | 7,549,135 | ||||||
| 346,000 | Schweitzer-Mauduit International, Inc. | 24,330,720 | ||||||
| 350,000 | Vulcan Materials Co. | 10,951,500 | ||||||
|
| |||||||
| 52,635,616 | ||||||||
|
| |||||||
The accompanying notes are an integral part of these financial statements.
16
Table of Contents
Schedule of Investments
PRIMECAP Odyssey Stock Fund
October 31, 2011 – continued
| Shares | Value | |||||||
| Utilities – 1.7% | ||||||||
| 80,000 | Edison International | $ | 3,248,000 | |||||
| 50,000 | NextEra Energy, Inc. | 2,820,000 | ||||||
| 274,300 | Public Service Enterprise Group, Inc. | 9,243,910 | ||||||
|
| |||||||
| 15,311,910 | ||||||||
|
| |||||||
| TOTAL COMMON STOCKS | $ | 850,165,591 | |||||
|
| |||||||
| SHORT TERM INVESTMENTS – 5.8% | ||||||||
| 52,184,842 | Dreyfus Treasury Prime Cash Management Fund | 52,184,842 | ||||||
|
| |||||||
| TOTAL SHORT TERM INVESTMENTS | 52,184,842 | ||||||
|
| |||||||
| TOTAL INVESTMENTS – 99.8% | 902,350,433 | ||||||
| Other Assets in Excess of Liabilities: 0.2% | 1,900,889 | ||||||
|
| |||||||
| TOTAL NET ASSETS: 100% | $ | 904,251,322 | |||||
|
| |||||||
ADR – American Depository Receipt
CHF – Swiss Francs
EUR – Euros
| (a) | Non-income producing |
The Global Industry Classification Standard (GICS®) was developed by and is the exclusive property of MSCI Inc. and Standard & Poor’s Financial Services LLC (“S&P’’). GICS is a service mark of MSCI and S&P and has been licensed for use by PRIMECAP Management Company.
The accompanying notes are an integral part of these financial statements.
17
Table of Contents
| Schedule of Investments October 31, 2011 |
| Shares | Value | |||||||
| COMMON STOCKS – 98.9% | ||||||||
| Consumer Discretionary – 9.0% | ||||||||
| 250,000 | 99 Cents Only Stores (a) | $ | 5,450,000 | |||||
| 63,300 | Amazon.com, Inc. (a) | 13,515,183 | ||||||
| 357,900 | Ascena Retail Group, Inc. (a) | 10,343,310 | ||||||
| 255,600 | Bed Bath & Beyond, Inc. (a) | 15,806,304 | ||||||
| 804,500 | CarMax, Inc. (a) | 24,183,270 | ||||||
| 174,400 | Carnival Corp. | 6,140,624 | ||||||
| 161,800 | DIRECTV – Class A (a) | 7,355,428 | ||||||
| 1,083,000 | DreamWorks Animation SKG, Inc. – Class A (a) | 20,089,650 | ||||||
| 160,000 | Gentex Corp. | 4,819,200 | ||||||
| 795,000 | Limited Brands, Inc. | 33,954,450 | ||||||
| 460,000 | Mattel, Inc. | 12,990,400 | ||||||
| 239,400 | Sony Corp. – ADR | 5,020,218 | ||||||
| 63,000 | TJX Cos., Inc. | 3,712,590 | ||||||
|
| |||||||
| 163,380,627 | ||||||||
|
| |||||||
| Consumer Staples – 0.4% | ||||||||
| 100,000 | Procter & Gamble Co. (The) | 6,399,000 | ||||||
|
| |||||||
| Energy – 6.7% | ||||||||
| 140,000 | Cenovus Energy, Inc. | 4,788,000 | ||||||
| 130,000 | Encana Corp. | 2,821,000 | ||||||
| 170,000 | EOG Resources, Inc. | 15,203,100 | ||||||
| 120,000 | Hess Corp. | 7,507,200 | ||||||
| 300,000 | McDermott International, Inc. (a) | 3,294,000 | ||||||
| 180,000 | National Oilwell Varco, Inc. | 12,839,400 | ||||||
| 80,000 | Noble Energy, Inc. | 7,147,200 | ||||||
| 340,000 | Oceaneering International, Inc. | 14,222,200 | ||||||
| 187,900 | Petroleo Brasileiro SA – ADR | 4,751,991 | ||||||
| 340,000 | Range Resources Corp. | 23,405,600 | ||||||
| 169,800 | Schlumberger Ltd. | 12,475,206 | ||||||
| 320,000 | Southwestern Energy Co. (a) | 13,452,800 | ||||||
|
| |||||||
| 121,907,697 | ||||||||
|
| |||||||
| Financials – 5.1% | ||||||||
| 100,000 | Berkshire Hathaway, Inc. – Class B (a) | 7,786,000 | ||||||
| 3,202,100 | Charles Schwab Corp. (The) | 39,321,788 | ||||||
| 200,000 | Chubb Corp. (The) | 13,410,000 | ||||||
| 1,000,700 | Marsh & McLennan Cos., Inc. | 30,641,434 | ||||||
| 140,000 | Progressive Corp. (The) | 2,661,400 | ||||||
|
| |||||||
| 93,820,622 | ||||||||
|
| |||||||
The accompanying notes are an integral part of these financial statements.
18
Table of Contents
Schedule of Investments
PRIMECAP Odyssey Growth Fund
October 31, 2011 – continued
| Shares | Value | |||||||
| Health Care – 38.3% | ||||||||
| 910,000 | Abiomed, Inc. (a) | $ | 13,704,600 | |||||
| 3,120,000 | Accuray, Inc. (a) | 12,480,000 | ||||||
| 199,400 | Affymetrix, Inc. (a) | 1,114,646 | ||||||
| 1,365,800 | Amgen, Inc. | 78,219,366 | ||||||
| 442,500 | Biogen Idec, Inc. (a) | 51,489,300 | ||||||
| 298,200 | BioMarin Pharmaceutical, Inc. (a) | 10,171,602 | ||||||
| 672,500 | Boston Scientific Corp. (a) | 3,961,025 | ||||||
| 1,280,100 | Cepheid, Inc. (a) | 45,929,988 | ||||||
| 2,253,728 | Conceptus, Inc. (a) (b) | 25,962,947 | ||||||
| 1,271,500 | Dendreon Corp. (a) | 13,910,210 | ||||||
| 787,200 | Eli Lilly & Co. | 29,252,352 | ||||||
| 81,000 | GlaxoSmithKline PLC – ADR | 3,627,990 | ||||||
| 270,000 | Illumina, Inc. (a) | 8,267,400 | ||||||
| 5,840,000 | ImmunoGen, Inc. (a) (b) | 79,307,200 | ||||||
| 445,800 | Johnson & Johnson | 28,705,062 | ||||||
| 200,000 | Kinetic Concepts, Inc. (a) | 13,678,000 | ||||||
| 308,000 | Life Technologies Corp. (a) | 12,526,360 | ||||||
| 901,800 | Medtronic, Inc. | 31,328,532 | ||||||
| 300,000 | Momenta Pharmaceuticals, Inc. (a) | 4,440,000 | ||||||
| 3,904,456 | Nektar Therapeutics (a) | 21,162,152 | ||||||
| 341,650 | Novartis AG – ADR | 19,292,975 | ||||||
| 145,000 | NuVasive, Inc. (a) | 2,148,900 | ||||||
| 260,000 | OraSure Technologies, Inc. (a) | 2,415,400 | ||||||
| 484,032 | Roche Holding AG – CHF | 79,789,736 | ||||||
| 4,556,400 | Seattle Genetics, Inc. (a) | 100,240,800 | ||||||
| 68,500 | Waters Corp. (a) | 5,488,220 | ||||||
|
| |||||||
| 698,614,763 | ||||||||
|
| |||||||
| Industrials – 8.5% | ||||||||
| 1,037,000 | AECOM Technology Corp. (a) | 21,694,040 | ||||||
| 2,050,000 | AMR Corp. (a) | 5,391,500 | ||||||
| 680,000 | Babcock & Wilcox Co. (The) (a) | 14,953,200 | ||||||
| 300,000 | C. H. Robinson Worldwide, Inc. | 20,829,000 | ||||||
| 133,600 | Caterpillar, Inc. | 12,619,856 | ||||||
| 10,000 | CIRCOR International, Inc. | 348,200 | ||||||
| 227,100 | European Aeronautic Defence and Space Co. N.V. – EUR | 6,715,272 | ||||||
| 320,000 | Expeditors International of Washington, Inc. | 14,592,000 | ||||||
| 40,900 | FedEx Corp. | 3,346,847 | ||||||
| 850,150 | JetBlue Airways Corp. (a) | 3,808,672 | ||||||
The accompanying notes are an integral part of these financial statements.
19
Table of Contents
Schedule of Investments
PRIMECAP Odyssey Growth Fund
October 31, 2011 – continued
| Shares | Value | |||||||
| Industrials (continued) | ||||||||
| 107,800 | Pall Corp. | $ | 5,516,126 | |||||
| 389,000 | Ritchie Bros. Auctioneers, Inc. | 7,756,660 | ||||||
| 50,000 | Rockwell Automation, Inc. | 3,382,500 | ||||||
| 2,501,400 | Southwest Airlines Co. | 21,386,970 | ||||||
| 182,100 | United Parcel Service, Inc. – Class B | 12,790,704 | ||||||
|
| |||||||
| 155,131,547 | ||||||||
|
| |||||||
| Information Technology – 28.7% | ||||||||
| 57,850 | Accenture PLC – Class A | 3,486,041 | ||||||
| 938,500 | Adobe Systems, Inc. (a) | 27,601,285 | ||||||
| 200,000 | Akamai Technologies, Inc. (a) | 5,388,000 | ||||||
| 1,040,000 | Altera Corp. | 39,436,800 | ||||||
| 389,300 | Applied Materials, Inc. | 4,796,176 | ||||||
| 116,000 | ASML Holding N.V. | 4,863,880 | ||||||
| 350,000 | Corning, Inc. | 5,001,500 | ||||||
| 375,300 | Cree, Inc. (a) | 9,997,992 | ||||||
| 120,000 | Cymer, Inc. (a) | 5,214,000 | ||||||
| 1,657,000 | Electronic Arts, Inc. (a) | 38,690,950 | ||||||
| 542,600 | EMC Corp. (a) | 13,299,126 | ||||||
| 2,600,000 | Flextronics International Ltd. (a) | 17,069,000 | ||||||
| 742,018 | FormFactor, Inc. (a) | 4,437,268 | ||||||
| 74,280 | Google, Inc. – Class A (a) | 44,021,299 | ||||||
| 90,000 | Hewlett-Packard Co. | 2,394,900 | ||||||
| 250,700 | Intel Corp. | 6,152,178 | ||||||
| 285,000 | Intuit, Inc. | 15,295,950 | ||||||
| 300,000 | KLA-Tencor Corp. | 14,127,000 | ||||||
| 1,347,800 | L.M. Ericsson Telephone Co. – ADR | 14,030,598 | ||||||
| 5,500 | MasterCard, Inc. – Class A | 1,909,820 | ||||||
| 725,000 | Micron Technology, Inc. (a) | 4,052,750 | ||||||
| 887,500 | Microsoft Corp. | 23,634,125 | ||||||
| 30,737 | Motorola Mobility Holdings, Inc. (a) | 1,195,055 | ||||||
| 35,128 | Motorola Solutions, Inc. | 1,647,854 | ||||||
| 195,900 | NeuStar, Inc. – Class A (a) | 6,227,661 | ||||||
| 1,630,000 | Nuance Communications, Inc. (a) | 43,162,400 | ||||||
| 540,000 | NVIDIA Corp. (a) | 7,992,000 | ||||||
| 122,000 | QUALCOMM, Inc. | 6,295,200 | ||||||
| 290,000 | Rambus, Inc. (a) | 5,141,700 | ||||||
| 912,450 | Research In Motion Ltd. (a) | 18,431,490 | ||||||
| 201,800 | SanDisk Corp. (a) | 10,225,206 | ||||||
| 1,060,000 | Stratasys, Inc. (a) (b) | 29,722,400 | ||||||
The accompanying notes are an integral part of these financial statements.
20
Table of Contents
Schedule of Investments
PRIMECAP Odyssey Growth Fund
October 31, 2011 – continued
| Shares | Value | |||||||
| Information Technology (continued) | ||||||||
| 536,400 | Symantec Corp. (a) | $ | 9,124,164 | |||||
| 959,000 | Texas Instruments, Inc. | 29,470,070 | ||||||
| 335,000 | Trimble Navigation Ltd. (a) | 13,537,350 | ||||||
| 335,000 | Visa, Inc. – Class A | 31,242,100 | ||||||
| 120,000 | Xilinx, Inc. | 4,015,200 | ||||||
|
| |||||||
| 522,330,488 | ||||||||
|
| |||||||
| Materials – 2.2% | ||||||||
| 332,400 | Monsanto Co. | 24,182,100 | ||||||
| 102,600 | Potash Corp. of Saskatchewan, Inc. | 4,856,058 | ||||||
| 17,250 | Praxair, Inc. | 1,753,807 | ||||||
| 321,800 | Vulcan Materials Co. | 10,069,122 | ||||||
|
| |||||||
| 40,861,087 | ||||||||
|
| |||||||
| TOTAL COMMON STOCKS | $ | 1,802,445,831 | |||||
|
| |||||||
| SHORT TERM INVESTMENTS – 1.2% | ||||||||
| 20,924,532 | Dreyfus Treasury Prime Cash Management Fund | 20,924,532 | ||||||
|
| |||||||
| TOTAL SHORT TERM INVESTMENTS | 20,924,532 | ||||||
|
| |||||||
| TOTAL INVESTMENTS – 100.1% | 1,823,370,363 | ||||||
| Other Liabilities in excess of Assets: (0.1)% | (1,497,116 | ) | |||||
|
| |||||||
| TOTAL NET ASSETS: 100.0% | $ | 1,821,873,247 | |||||
|
| |||||||
|
| |||||||
ADR – American Depository Receipt
CHF – Swiss Francs
EUR – Euros
| (a) | Non-income producing |
| (b) | Considered an affiliated company of the Fund as the Fund owns more than 5% of the outstanding voting securities of such company. |
The Global Industry Classification Standard (GICS®) was developed by and is the exclusive property of MSCI Inc. and Standard & Poor’s Financial Services LLC (“S&P”). GICS is a service mark of MSCI and S&P and has been licensed for use by PRIMECAP Management Company.
The accompanying notes are an integral part of these financial statements.
21
Table of Contents
| Schedule of Investments PRIMECAP Odyssey Aggressive Growth Fund October 31, 2011 |
| Shares | Value | |||||||
| COMMON STOCKS – 96.4% | ||||||||
| Consumer Discretionary – 5.6% | ||||||||
| 63,000 | Amazon.com, Inc. (a) | $ | 13,451,130 | |||||
| 345,602 | Callaway Golf Co. | 2,007,948 | ||||||
| 420,800 | CarMax, Inc. (a) | 12,649,248 | ||||||
| 74,700 | DIRECTV – Class A (a) | 3,395,862 | ||||||
| 1,367,100 | DreamWorks Animation SKG, Inc. – Class A (a) | 25,359,705 | ||||||
| 140,000 | Gentex Corp. | 4,216,800 | ||||||
| 4,800 | Quiksilver, Inc. (a) | 16,080 | ||||||
| 87,090 | Tesla Motors, Inc. (a) | 2,557,833 | ||||||
|
| |||||||
| 63,654,606 | ||||||||
|
| |||||||
| Consumer Staples – 1.9% | ||||||||
| 5,600 | Chefs' Warehouse Holdings, Inc. (The) (a) | 80,024 | ||||||
| 3,313,405 | Smart Balance, Inc. (a) (b) | 21,702,803 | ||||||
|
| |||||||
| 21,782,827 | ||||||||
|
| |||||||
| Energy – 5.9% | ||||||||
| 200,000 | Cabot Oil & Gas Corp. | 15,544,000 | ||||||
| 110,000 | EOG Resources, Inc. | 9,837,300 | ||||||
| 120,000 | National Oilwell Varco, Inc. | 8,559,600 | ||||||
| 168,000 | Oceaneering International, Inc. | 7,027,440 | ||||||
| 200,000 | Range Resources Corp. | 13,768,000 | ||||||
| 780,000 | Rex Energy Corp. (a) | 12,074,400 | ||||||
|
| |||||||
| 66,810,740 | ||||||||
|
| |||||||
| Financials – 1.6% | ||||||||
| 605,820 | MarketAxess Holdings, Inc. | 17,708,119 | ||||||
|
| |||||||
| Health Care – 39.2% | ||||||||
| 2,048,173 | Abiomed, Inc. (a) (b) | 30,845,485 | ||||||
| 2,865,000 | Accuray, Inc. (a) | 11,460,000 | ||||||
| 172,000 | Affymetrix, Inc. (a) | 961,480 | ||||||
| 205,000 | Biogen Idec, Inc. (a) | 23,853,800 | ||||||
| 590,300 | BioMarin Pharmaceutical, Inc. (a) | 20,135,133 | ||||||
| 791,700 | Boston Scientific Corp. (a) | 4,663,113 | ||||||
| 591,600 | Cardica, Inc. (a) | 1,254,192 | ||||||
| 1,088,700 | Cepheid, Inc. (a) | 39,062,556 | ||||||
| 1,669,750 | Conceptus, Inc. (a) (b) | 19,235,520 | ||||||
| 1,341,800 | Dendreon Corp. (a) | 14,679,292 | ||||||
| 5,825,000 | Dyax Corp. (a) (b) | 7,863,750 | ||||||
| 3,620,250 | ImmunoGen, Inc. (a) | 49,162,995 | ||||||
The accompanying notes are an integral part of these financial statements.
22
Table of Contents
Schedule of Investments
PRIMECAP Odyssey Aggressive Growth Fund
October 31, 2011 – continued
| Shares | Value | |||||||
| Health Care (continued) | ||||||||
| 10,000 | Insulet Corp. (a) | $ | 163,200 | |||||
| 607,900 | InterMune, Inc. (a) | 15,501,450 | ||||||
| 100,000 | Kinetic Concepts, Inc. (a) | 6,839,000 | ||||||
| 706,200 | Luminex Corp. (a) | 15,508,152 | ||||||
| 80,000 | Momenta Pharmaceuticals, Inc. (a) | 1,184,000 | ||||||
| 2,689,100 | Nektar Therapeutics (a) | 14,574,922 | ||||||
| 155,000 | NuVasive, Inc. (a) | 2,297,100 | ||||||
| 1,742,600 | OraSure Technologies, Inc. (a) | 16,188,754 | ||||||
| 2,208,139 | Pharmacyclics, Inc. (a) | 29,081,191 | ||||||
| 333,900 | Roche Holding AG – CHF | 55,041,387 | ||||||
| 2,908,800 | Seattle Genetics, Inc. (a) | 63,993,600 | ||||||
| 116,000 | SurModics, Inc. (a) | 1,222,640 | ||||||
|
| |||||||
| 444,772,712 | ||||||||
|
| |||||||
| Industrials – 7.3% | ||||||||
| 201,900 | AECOM Technology Corp. (a) | 4,223,748 | ||||||
| 195,000 | Alaska Air Group, Inc. (a) | 12,973,350 | ||||||
| 2,130,000 | AMR Corp. (a) | 5,601,900 | ||||||
| 433,700 | Arkansas Best Corp. | 8,934,220 | ||||||
| 140,000 | C. H. Robinson Worldwide, Inc. | 9,720,200 | ||||||
| 220,000 | CIRCOR International, Inc. | 7,660,400 | ||||||
| 2,424,525 | JetBlue Airways Corp. (a) | 10,861,872 | ||||||
| 82,600 | Pall Corp. | 4,226,642 | ||||||
| 293,100 | Ritchie Bros. Auctioneers, Inc. | 5,844,414 | ||||||
| 948,000 | Southwest Airlines Co. | 8,105,400 | ||||||
| 234,000 | US Airways Group, Inc. (a) | 1,350,180 | ||||||
| 45,000 | USA Truck, Inc. (a) | 396,000 | ||||||
| 470,000 | Vitran Corp, Inc. (a) | 2,279,500 | ||||||
| 61,221 | Zipcar, Inc. (a) | 1,251,969 | ||||||
|
| |||||||
| 83,429,795 | ||||||||
|
| |||||||
| Information Technology – 32.6% | ||||||||
| 894,600 | Adobe Systems, Inc. (a) | 26,310,186 | ||||||
| 180,000 | Akamai Technologies, Inc. (a) | 4,849,200 | ||||||
| 570,000 | Altera Corp. | 21,614,400 | ||||||
| 247,777 | ASML Holding N.V. | 10,389,290 | ||||||
| 869,000 | comScore, Inc. (a) | 18,344,590 | ||||||
| 297,800 | Cree, Inc. (a) | 7,933,392 | ||||||
| 150,000 | Cymer, Inc. (a) | 6,517,500 | ||||||
| 1,083,400 | Electronic Arts, Inc. (a) | 25,297,390 | ||||||
The accompanying notes are an integral part of these financial statements.
23
Table of Contents
Schedule of Investments
PRIMECAP Odyssey Aggressive Growth Fund
October 31, 2011 – continued
| Shares | Value | |||||||
| Information Technology (continued) | ||||||||
| 200,000 | EMC Corp. (a) | $ | 4,902,000 | |||||
| 270,000 | FARO Technologies, Inc. (a) | 11,280,600 | ||||||
| 280,000 | FEI Co. (a) | 11,132,800 | ||||||
| 716,300 | FormFactor, Inc. (a) | 4,283,474 | ||||||
| 56,100 | Google, Inc., – Class A (a) | 33,247,104 | ||||||
| 1,302,100 | Guidance Software, Inc. (a) (b) | 7,825,621 | ||||||
| 275,000 | Intuit, Inc. | 14,759,250 | ||||||
| 365,300 | KLA – Tencor Corp. | 17,201,977 | ||||||
| 800,000 | Micron Technology, Inc. (a) | 4,472,000 | ||||||
| 420,000 | Monster Worldwide, Inc. (a) | 3,876,600 | ||||||
| 235,100 | NeuStar, Inc. – Class A (a) | 7,473,829 | ||||||
| 670,000 | Nuance Communications, Inc. (a) | 17,741,600 | ||||||
| 326,550 | NVIDIA Corp. (a) | 4,832,940 | ||||||
| 245,000 | Rambus, Inc. (a) | 4,343,850 | ||||||
| 772,900 | Research In Motion Ltd. (a) | 15,612,580 | ||||||
| 5,400 | Responsys, Inc. (a) | 58,968 | ||||||
| 300,000 | RightNow Technologies, Inc. (a) | 12,903,000 | ||||||
| 142,100 | SanDisk Corp. (a) | 7,200,207 | ||||||
| 733,500 | SMART Technologies, Inc. – Class A (a) | 2,508,570 | ||||||
| 984,100 | Stratasys, Inc. (a) | 27,594,164 | ||||||
| 329,900 | Symantec Corp. (a) | 5,611,599 | ||||||
| 281,300 | Trimble Navigation Ltd. (a) | 11,367,333 | ||||||
| 984,600 | Websense, Inc. (a) | 17,565,264 | ||||||
| 60,000 | Yahoo!, Inc. (a) | 938,400 | ||||||
|
| |||||||
| 369,989,678 | ||||||||
|
| |||||||
| Materials – 2.3% | ||||||||
| 291,800 | Monsanto Co. | 21,228,450 | ||||||
| 94,100 | Potash Corp. of Saskatchewan, Inc. | 4,453,753 | ||||||
|
| |||||||
| 25,682,203 | ||||||||
|
| |||||||
| TOTAL COMMON STOCKS | $ | 1,093,830,680 | |||||
|
| |||||||
The accompanying notes are an integral part of these financial statements.
24
Table of Contents
Schedule of Investments
PRIMECAP Odyssey Aggressive Growth Fund
October 31, 2011 – continued
| Shares | Value | |||||||
| SHORT TERM INVESTMENTS – 3.4% | ||||||||
| 38,760,445 | Dreyfus Treasury Prime Cash Management Fund | $ | 38,760,445 | |||||
|
| |||||||
| TOTAL SHORT TERM INVESTMENTS | 38,760,445 | ||||||
|
| |||||||
| TOTAL INVESTMENTS – 99.8% | 1,132,591,125 | ||||||
| Other Assets in Excess of Liabilities: 0.2% | 1,944,180 | ||||||
|
| |||||||
| TOTAL NET ASSETS: 100.0% | $ | 1,134,535,305 | |||||
|
| |||||||
CHF – Swiss Francs
| (a) | Non-income producing |
| (b) | Considered an affiliated company of the Fund as the Fund owns more than 5% of the outstanding voting securities of such company. |
The Global Industry Classification Standard (GICS®) was developed by and is the exclusive property of MSCI Inc. and Standard & Poor's Financial Services LLC (“S&P”). GICS is a service mark of MSCI and S&P and has been licensed for use by PRIMECAP Management Company.
The accompanying notes are an integral part of these financial statements.
25
Table of Contents
| Statements of Assets and Liabilities PRIMECAP Odyssey Funds October 31, 2011 |
| PRIMECAP Odyssey Stock Fund | PRIMECAP Odyssey Growth Fund | PRIMECAP Odyssey Aggressive Growth Fund | ||||||||||
ASSETS | ||||||||||||
Investments, at cost | $ | 811,221,369 | $ | 1,629,898,344 | $ | 1,001,285,278 | ||||||
|
|
|
|
|
| |||||||
Investments, at value (unaffiliated) | $ | 902,350,433 | $ | 1,688,377,816 | $ | 1,045,117,946 | ||||||
Investments, at value (affiliated) | — | 134,992,547 | 87,473,179 | |||||||||
Receivables: | ||||||||||||
Securities sold | — | — | 4,830 | |||||||||
Dividends and interest | 1,034,737 | 1,520,811 | 596,483 | |||||||||
Fund shares sold | 5,824,942 | 2,565,997 | 3,475,808 | |||||||||
Prepaid expenses and other assets | 17,325 | 40,214 | 34,460 | |||||||||
|
|
|
|
|
| |||||||
Total assets | 909,227,437 | 1,827,497,385 | 1,136,702,706 | |||||||||
|
|
|
|
|
| |||||||
| LIABILITIES | ||||||||||||
Payable for securities purchased | 3,599,632 | 734,169 | — | |||||||||
Payable for fund shares repurchased | 118,700 | 2,071,503 | 456,448 | |||||||||
Payable to the advisor (Note 6) | 1,086,578 | 2,447,224 | 1,459,267 | |||||||||
Other accrued expenses & liabilities | 171,205 | 371,242 | 251,686 | |||||||||
|
|
|
|
|
| |||||||
Total liabilities | 4,976,115 | 5,624,138 | 2,167,401 | |||||||||
|
|
|
|
|
| |||||||
NET ASSETS | $ | 904,251,322 | $ | 1,821,873,247 | $ | 1,134,535,305 | ||||||
|
|
|
|
|
| |||||||
Number of shares issued and outstanding (unlimited shares authorized, $0.01 par value) | 63,147,115 | 117,989,471 | 66,762,268 | |||||||||
|
|
|
|
|
| |||||||
NET ASSET VALUE, OFFERING AND REDEMPTION PRICE PER SHARE | $ | 14.32 | $ | 15.44 | $ | 16.99 | ||||||
|
|
|
|
|
| |||||||
| COMPONENTS OF NET ASSETS | ||||||||||||
Paid-in capital | 828,170,214 | 1,621,757,583 | 981,984,208 | |||||||||
Undistributed net investment income | 8,872,391 | 4,319,310 | — | |||||||||
Accumulated net realized gain (loss) | (23,964,502 | ) | 2,231,930 | 21,197,798 | ||||||||
Net unrealized appreciation | 91,173,219 | 193,564,424 | 131,353,299 | |||||||||
|
|
|
|
|
| |||||||
Net assets | $ | 904,251,322 | $ | 1,821,873,247 | $ | 1,134,535,305 | ||||||
|
|
|
|
|
| |||||||
The accompanying notes are an integral part of these financial statements.
26
Table of Contents
| PRIMECAP Odyssey Funds For the Year Ended October 31, 2011 |
| PRIMECAP Odyssey Stock Fund | PRIMECAP Odyssey Growth Fund | PRIMECAP Odyssey Aggressive Growth Fund | ||||||||||
INVESTMENT INCOME | ||||||||||||
Income | ||||||||||||
Dividends (net of foreign taxes withheld of $581,143, $804,354, $355,998, respectively) | $ | 14,996,553 | $ | 16,506,026 | $ | 3,667,960 | ||||||
Interest income | 238 | 345 | 231 | |||||||||
|
|
|
|
|
| |||||||
Total income | 14,996,791 | 16,506,371 | 3,668,191 | |||||||||
|
|
|
|
|
| |||||||
Expenses | ||||||||||||
Advisory fees | 4,366,379 | 9,831,335 | 5,754,978 | |||||||||
Fund administration and accounting fees | 330,932 | 755,987 | 432,327 | |||||||||
Professional fees | 57,978 | 58,551 | 58,289 | |||||||||
Shareholder servicing fees | 191,933 | 686,252 | 451,325 | |||||||||
Registration fees | 32,207 | 69,941 | 63,275 | |||||||||
Custody fees | 81,329 | 161,791 | 107,952 | |||||||||
Trustee fees | 28,521 | 28,619 | 28,874 | |||||||||
Printing and mailing | 26,385 | 105,344 | 76,016 | |||||||||
Other | 52,905 | 128,536 | 77,767 | |||||||||
|
|
|
|
|
| |||||||
Total expenses | 5,168,569 | 11,826,356 | 7,050,803 | |||||||||
|
|
|
|
|
| |||||||
Net investment income (loss) | 9,828,222 | 4,680,015 | (3,382,612 | ) | ||||||||
|
|
|
|
|
| |||||||
| REALIZED AND UNREALIZED GAIN (LOSS) ON INVESTMENTS AND FOREIGN CURRENCY | ||||||||||||
Net realized gain (loss) on: | ||||||||||||
Investments (includes net realized gains on sales of affiliated companies of $0, $0, and $38,795) | 8,833,830 | 20,610,429 | 26,971,334 | |||||||||
Foreign currency transactions | (5,762 | ) | (10,487 | ) | 12,755 | |||||||
Change in net unrealized appreciation on: | ||||||||||||
Investments | 37,786,162 | 35,839,872 | 42,923,262 | |||||||||
Foreign currency translations | 29,831 | 59,350 | 20,135 | |||||||||
|
|
|
|
|
| |||||||
Net realized and unrealized gain on investments and foreign currency | 46,644,061 | 56,499,164 | 69,927,486 | |||||||||
|
|
|
|
|
| |||||||
| NET INCREASE IN NET ASSETS RESULTING FROM OPERATIONS | $ | 56,472,283 | $ | 61,179,179 | $ | 66,544,874 | ||||||
|
|
|
|
|
| |||||||
The accompanying notes are an integral part of these financial statements.
27
Table of Contents
|
| Year Ended October 31, 2011 | Year Ended October 31, 2010 | |||||||
INCREASE (DECREASE) IN NET ASSETS FROM: | ||||||||
OPERATIONS | ||||||||
Net investment income | $ | 9,828,222 | $ | 4,596,688 | ||||
Net realized gain (loss) on: | ||||||||
Investments | 8,833,830 | 1,277,157 | ||||||
Foreign currency transactions | (5,762 | ) | (719 | ) | ||||
Change in net unrealized appreciation on: | ||||||||
Investments | 37,786,162 | 52,902,519 | ||||||
Foreign currency translations | 29,831 | 5,628 | ||||||
|
|
|
| |||||
Net increase in net assets resulting from operations | 56,472,283 | 58,781,273 | ||||||
|
|
|
| |||||
| DISTRIBUTIONS TO SHAREHOLDERS FROM NET INVESTMENT INCOME | (5,099,941 | ) | (1,831,079 | ) | ||||
|
|
|
| |||||
| CAPITAL SHARE TRANSACTIONS | ||||||||
Proceeds from shares sold | 492,192,375 | 403,570,379 | ||||||
Proceeds from reinvestment of distributions | 4,774,772 | 1,822,043 | ||||||
Cost of shares redeemed | (251,163,250 | ) | (34,962,948 | ) | ||||
Redemption fee proceeds | 15,527 | 7,738 | ||||||
|
|
|
| |||||
Net increase from capital share transactions | 245,819,424 | 370,437,212 | ||||||
|
|
|
| |||||
Total increase in net assets | 297,191,766 | 427,387,406 | ||||||
|
|
|
| |||||
| NET ASSETS | ||||||||
Beginning of year | 607,059,556 | 179,672,150 | ||||||
|
|
|
| |||||
End of year (includes undistributed net investment income of $8,872,391 and $4,150,713 respectively) | $ | 904,251,322 | $ | 607,059,556 | ||||
|
|
|
| |||||
| CHANGE IN CAPITAL SHARES | ||||||||
Shares outstanding, beginning of year | 45,027,268 | 15,370,380 | ||||||
|
|
|
| |||||
Shares sold | 34,887,757 | 32,259,418 | ||||||
Shares issued on reinvestment of distributions | 341,543 | 144,721 | ||||||
Shares repurchased | (17,109,453 | ) | (2,747,251 | ) | ||||
|
|
|
| |||||
Net increase in capital shares | 18,119,847 | 29,656,888 | ||||||
|
|
|
| |||||
Shares outstanding, end of year | 63,147,115 | 45,027,268 | ||||||
|
|
|
| |||||
The accompanying notes are an integral part of these financial statements.
28
Table of Contents
| Statement of Changes in Net Assets |
| Year Ended October 31, 2011 | Year Ended October 31, 2010 | |||||||
INCREASE (DECREASE) IN NET ASSETS FROM: | ||||||||
OPERATIONS | ||||||||
Net investment income | $ | 4,680,015 | $ | 1,633,753 | ||||
Net realized gain (loss) on: | ||||||||
Investments | 20,610,429 | 996,951 | ||||||
Foreign currency transactions | (10,487 | ) | 2,203 | |||||
Change in net unrealized appreciation on: | ||||||||
Investments | 35,839,872 | 189,764,571 | ||||||
Foreign currency translations | 59,350 | 14,525 | ||||||
|
|
|
| |||||
Net increase in net assets resulting from operations | 61,179,179 | 192,412,003 | ||||||
|
|
|
| |||||
| DISTRIBUTIONS TO SHAREHOLDERS FROM NET INVESTMENT INCOME | (1,416,348 | ) | (1,825,837 | ) | ||||
|
|
|
| |||||
| CAPITAL SHARE TRANSACTIONS | ||||||||
Proceeds from shares sold | 711,410,844 | 745,167,382 | ||||||
Proceeds from reinvestment of distributions | 1,337,875 | 1,740,542 | ||||||
Cost of shares redeemed | (401,953,384 | ) | (192,905,219 | ) | ||||
Redemption fee proceeds | 149,175 | 87,258 | ||||||
|
|
|
| |||||
Net increase from capital share transactions | 310,944,510 | 554,089,963 | ||||||
|
|
|
| |||||
Total increase in net assets | 370,707,341 | 744,676,129 | ||||||
|
|
|
| |||||
| NET ASSETS | ||||||||
Beginning of year | 1,451,165,906 | 706,489,777 | ||||||
|
|
|
| |||||
End of year (includes undistributed net investment income of $4,319,310 and $1,066,130 respectively) | $ | 1,821,873,247 | $ | 1,451,165,906 | ||||
|
|
|
| |||||
| CHANGE IN CAPITAL SHARES | ||||||||
Shares outstanding, beginning of year | 98,706,971 | 57,986,448 | ||||||
|
|
|
| |||||
Shares sold | 45,548,287 | 54,837,387 | ||||||
Shares issued on reinvestment of distributions | 87,787 | 132,764 | ||||||
Shares repurchased | (26,353,574 | ) | (14,249,628 | ) | ||||
|
|
|
| |||||
Net increase in capital shares | 19,282,500 | 40,720,523 | ||||||
|
|
|
| |||||
Shares outstanding, end of year | 117,989,471 | 98,706,971 | ||||||
|
|
|
| |||||
The accompanying notes are an integral part of these financial statements.
29
Table of Contents
| Statement of Changes in Net Assets |
| Year Ended October 31, 2011 | Year Ended October 31, 2010 | |||||||
INCREASE (DECREASE) IN NET ASSETS FROM: | ||||||||
OPERATIONS | ||||||||
Net investment loss | $ | (3,382,612 | ) | $ | (2,543,607 | ) | ||
Net realized gain on: | ||||||||
Investments | 26,971,334 | 41,681,114 | ||||||
Foreign currency transactions | 12,755 | 3,184 | ||||||
Change in net unrealized appreciation on: | ||||||||
Investments | 42,923,262 | 102,732,709 | ||||||
Foreign currency translations | 20,135 | 11,194 | ||||||
|
|
|
| |||||
Net increase in net assets resulting from operations | 66,544,874 | 141,884,594 | ||||||
|
|
|
| |||||
| DISTRIBUTIONS TO SHAREHOLDERS FROM REALIZED GAIN ON INVESTMENTS | (27,881,437 | ) | — | |||||
|
|
|
| |||||
| CAPITAL SHARE TRANSACTIONS | ||||||||
Proceeds from shares sold | 492,535,674 | 402,604,235 | ||||||
Proceeds from reinvestment of distributions | 27,335,474 | — | ||||||
Cost of shares redeemed | (234,079,639 | ) | (98,500,526 | ) | ||||
Redemption fee proceeds | 131,984 | 129,280 | ||||||
|
|
|
| |||||
Net increase from capital share transactions | 285,923,493 | 304,232,989 | ||||||
|
|
|
| |||||
Total increase in net assets | 324,586,930 | 446,117,583 | ||||||
|
|
|
| |||||
| NET ASSETS | ||||||||
Beginning of year | 809,948,375 | 363,830,792 | ||||||
|
|
|
| |||||
End of year | $ | 1,134,535,305 | $ | 809,948,375 | ||||
|
|
|
| |||||
| CHANGE IN CAPITAL SHARES | ||||||||
Shares outstanding, beginning of year | 50,097,938 | 29,505,941 | ||||||
|
|
|
| |||||
Shares sold | 29,150,342 | 27,379,055 | ||||||
Shares issued on reinvestment of distributions | 1,689,461 | | — | | ||||
Shares repurchased | (14,175,473 | ) | (6,787,058 | ) | ||||
|
|
|
| |||||
Net increase in capital shares | 16,664,330 | 20,591,997 | ||||||
|
|
|
| |||||
Shares outstanding, end of year | 66,762,268 | 50,097,938 | ||||||
|
|
|
| |||||
The accompanying notes are an integral part of these financial statements.
30
Table of Contents
| For a capital share outstanding throughout each period. |
| Year Ended Oct. 31, 2011 | Year Ended Oct. 31, 2010 | Year Ended Oct. 31, 2009 | Year Ended Oct. 31, 2008 | Year Ended Oct. 31, 2007 | ||||||||||||||||
Net asset value, beginning of the year | $ | 13.48 | $ | 11.69 | $ | 10.10 | $ | 15.22 | $ | 13.48 | ||||||||||
|
|
|
|
|
|
|
|
|
| |||||||||||
Income from investment operations: | ||||||||||||||||||||
Net investment income | 0.16 | 0.09 | 2 | 0.10 | 0.06 | 0.07 | ||||||||||||||
Net realized and unrealized gain (loss) on investments and foreign currency | 0.79 | 1.79 | 1.55 | (4.99 | ) | 1.79 | ||||||||||||||
|
|
|
|
|
|
|
|
|
| |||||||||||
Total from investment operations | 0.95 | 1.88 | 1.65 | (4.93 | ) | 1.86 | ||||||||||||||
|
|
|
|
|
|
|
|
|
| |||||||||||
Less: | ||||||||||||||||||||
Dividends from net investment income | (0.11 | ) | (0.09 | ) | (0.06 | ) | (0.07 | ) | (0.04 | ) | ||||||||||
Distributions from net realized gain | — | — | — | (0.12 | ) | (0.08 | ) | |||||||||||||
|
|
|
|
|
|
|
|
|
| |||||||||||
Total distributions | (0.11 | ) | (0.09 | ) | (0.06 | ) | (0.19 | ) | (0.12 | ) | ||||||||||
|
|
|
|
|
|
|
|
|
| |||||||||||
Redemption fee proceeds | 0.00 | 1 | 0.00 | 1 | 0.00 | 1 | 0.00 | 1 | 0.00 | 1 | ||||||||||
|
|
|
|
|
|
|
|
|
| |||||||||||
Net asset value, end of year | $ | 14.32 | $ | 13.48 | $ | 11.69 | $ | 10.10 | $ | 15.22 | ||||||||||
|
|
|
|
|
|
|
|
|
| |||||||||||
Total return | 7.05 | % | 16.14 | % | 16.55 | % | (32.73 | %) | 13.88 | % | ||||||||||
Ratios/supplemental data: | ||||||||||||||||||||
Net assets, end of year (millions) | $ | 904.3 | $ | 607.1 | $ | 179.7 | $ | 187.0 | $ | 216.4 | ||||||||||
Ratio of expenses to average net assets | 0.66 | % | 0.71 | % | 0.80 | % | 0.79 | % | 0.81 | % | ||||||||||
Ratio of net investment income | 1.25 | % | 1.37 | %2 | 0.96 | % | 0.51 | % | 0.59 | % | ||||||||||
Portfolio turnover rate | 24.27 | % | 3.35 | % | 33.55 | % | 9.66 | % | 5.87 | % | ||||||||||
| 1 | Amount represents less than $0.01 per share. |
| 2 | Investment income per share reflects a special dividend of $0.05. Excluding the special dividend, the ratio of net investment income to average net assets would have been 0.74%. |
The accompanying notes are an integral part of these financial statements.
31
Table of Contents
| Financial Highlights For a capital share outstanding throughout each period. |
| Year Ended Oct. 31, 2011 | Year Ended Oct. 31, 2010 | Year Ended Oct. 31, 2009 | Year Ended Oct. 31, 2008 | Year Ended Oct. 31, 2007 | ||||||||||||||||
Net asset value, beginning of the year | $ | 14.70 | $ | 12.18 | $ | 10.07 | $ | 15.71 | $ | 13.76 | ||||||||||
|
|
|
|
|
|
|
|
|
| |||||||||||
Income from investment operations: | ||||||||||||||||||||
Net investment income | 0.04 | 0.02 | 0.03 | 0.03 | 0.04 | |||||||||||||||
Net realized and unrealized gain (loss) | 0.71 | 2.53 | 2.11 | (5.59 | ) | 2.07 | ||||||||||||||
|
|
|
|
|
|
|
|
|
| |||||||||||
Total from investment operations | 0.75 | 2.55 | 2.14 | (5.56 | ) | 2.11 | ||||||||||||||
|
|
|
|
|
|
|
|
|
| |||||||||||
Less: | ||||||||||||||||||||
Dividends from net investment income | (0.01 | ) | (0.03 | ) | (0.03 | ) | (0.04 | ) | (0.02 | ) | ||||||||||
Distributions from net realized gain | — | — | — | (0.04 | ) | (0.14 | ) | |||||||||||||
|
|
|
|
|
|
|
|
|
| |||||||||||
Total distributions | (0.01 | ) | (0.03 | ) | (0.03 | ) | (0.08 | ) | (0.16 | ) | ||||||||||
|
|
|
|
|
|
|
|
|
| |||||||||||
Redemption fee proceeds | 0.00 | 1 | 0.00 | 1 | 0.00 | 1 | 0.00 | 1 | 0.00 | 1 | ||||||||||
|
|
|
|
|
|
|
|
|
| |||||||||||
Net asset value, end of year | $ | 15.44 | $ | 14.70 | $ | 12.18 | $ | 10.07 | $ | 15.71 | ||||||||||
|
|
|
|
|
|
|
|
|
| |||||||||||
Total return | 5.13 | % | 20.96 | % | 21.39 | % | (35.55 | %) | 15.46 | % | ||||||||||
Ratios/supplemental data: | ||||||||||||||||||||
Net assets, end of year (millions) | $ | 1,821.9 | $ | 1,451.2 | $ | 706.5 | $ | 412.4 | $ | 512.0 | ||||||||||
Ratio of expenses to average net assets | 0.66 | % | 0.68 | % | 0.71 | % | 0.71 | % | 0.75 | % | ||||||||||
Ratio of net investment income | 0.26 | % | 0.15 | % | 0.35 | % | 0.26 | % | 0.30 | % | ||||||||||
Portfolio turnover rate | 12.57 | % | 4.93 | % | 12.49 | % | 12.72 | % | 4.83 | % | ||||||||||
| 1 | Amount represents less than $0.01 per share. |
The accompanying notes are an integral part of these financial statements.
32
Table of Contents
| Financial Highlights PRIMECAP Odyssey Aggressive Growth Fund For a capital share outstanding throughout each period. |
| Year Ended Oct. 31, 2011 | Year Ended Oct. 31, 2010 | Year Ended Oct. 31, 2009 | Year Ended Oct. 31, 2008 | Year Ended Oct. 31, 2007 | ||||||||||||||||
Net asset value, beginning of the year | $ | 16.17 | $ | 12.33 | $ | 9.46 | $ | 16.03 | $ | 13.92 | ||||||||||
|
|
|
|
|
|
|
|
|
| |||||||||||
Income from investment operations: | ||||||||||||||||||||
Net investment loss | (0.05 | ) | (0.05 | ) | (0.05 | ) | (0.06 | ) | (0.03 | ) | ||||||||||
Net realized and unrealized gain (loss) | 1.40 | 3.89 | 2.92 | (6.42 | ) | 2.34 | ||||||||||||||
|
|
|
|
|
|
|
|
|
| |||||||||||
Total from investment operations | 1.35 | 3.84 | 2.87 | (6.48 | ) | 2.31 | ||||||||||||||
|
|
|
|
|
|
|
|
|
| |||||||||||
Less: | ||||||||||||||||||||
Distributions from net realized gain | (0.53 | ) | — | — | (0.09 | ) | (0.20 | ) | ||||||||||||
|
|
|
|
|
|
|
|
|
| |||||||||||
Redemption fees proceeds | 0.00 | 1 | 0.00 | 1 | 0.00 | 1 | 0.00 | 1 | 0.00 | 1 | ||||||||||
|
|
|
|
|
|
|
|
|
| |||||||||||
Net asset value, end of year | $ | 16.99 | $ | 16.17 | $ | 12.33 | $ | 9.46 | $ | 16.03 | ||||||||||
|
|
|
|
|
|
|
|
|
| |||||||||||
Total return | 8.50 | % | 31.14 | % | 30.34 | % | (40.60 | %) | 16.76 | % | ||||||||||
Ratios/supplemental data: | ||||||||||||||||||||
Net assets, end of year (millions) | $ | 1,134.5 | $ | 809.9 | $ | 368.8 | $ | 225.4 | $ | 375.2 | ||||||||||
Ratio of expenses to average net assets | 0.68 | % | 0.71 | % | 0.77 | % | 0.78 | % | 0.78 | % | ||||||||||
Ratio of net investment loss | (0.33 | %) | (0.45 | %) | (0.54 | %) | (0.46 | %) | (0.25 | %) | ||||||||||
Portfolio turnover rate | 11.32 | % | 15.34 | % | 19.70 | % | 24.32 | % | 6.02 | % | ||||||||||
| 1 | Amount represents less than $0.01 per share. |
The accompanying notes are an integral part of these financial statements.
33
Table of Contents
| PRIMECAP Odyssey Funds For the Year Ended October 31, 2011 |
(1) Organization
PRIMECAP Odyssey Funds (the “Trust”) was organized on June 8, 2004 as a Delaware statutory trust and is registered as an open-end management investment company under the Investment Company Act of 1940, as amended (the “1940 Act”). The Trust is comprised of three series: PRIMECAP Odyssey Stock Fund, PRIMECAP Odyssey Growth Fund, and PRIMECAP Odyssey Aggressive Growth Fund (the “Funds”), each of which is diversified within the meaning of the 1940 Act. PRIMECAP Management Company (the “Investment Advisor”) serves as investment advisor to the Funds. Each Fund commenced operations on November 1, 2004.
Each Fund’s investment objective is to provide long-term capital appreciation. Each Fund is authorized to issue unlimited shares of beneficial interest. All shares within each Fund have equal rights with respect to voting. Each Fund may charge a redemption fee of 2% of the redemption amount on shares redeemed or exchanged within 60 days of purchase.
(2) Significant Accounting Policies
The Funds consistently follow the accounting policies set forth below which are in conformity with accounting principles generally accepted in the United States of America.
| A. | Security Valuation |
Securities traded on a national securities exchange are valued at the last reported sales price at the close of regular trading on each day the exchanges are open for trading. Securities listed on the NASDAQ Global Market, the NASDAQ Global Select Market, and the NASDAQ Capital Market are valued using the NASDAQ Official Closing Price, which may not necessarily represent the last sale price. Quotations of foreign securities in a foreign currency are valued daily in U.S. dollars on the basis of the foreign currency exchange rates prevailing at the time such valuation is determined. Foreign currency exchange rates generally are determined prior to the close of the New York Stock Exchange (the “NYSE”). Securities traded on an exchange for which there have been no sales are valued at the mean between the bid and asked price. Securities for which quotations are not readily available are stated at their respective fair values as determined in good faith by a valuation committee of the Investment Advisor in accordance with procedures approved by the Trust’s Board of Trustees. In determining fair value, the Funds take into account all relevant factors and available information. Consequently, the price of a security used by a Fund to calculate its net asset value per share (“NAV”) may differ from quoted or published prices for the same security. Fair value pricing involves subjective judgments, and there is no single standard for determining a security’s fair value. As a result, different mutual funds could reasonably arrive at a different fair value for the same security. It is possible that the fair value determined for a security is materially different from the value that could be realized upon the sale of that security or from the values that other mutual funds may determine.
Investments in other funds are valued at their respective net asset values as determined by those funds, in accordance with the 1940 Act.
34
Table of Contents
Notes to Financial Statements
PRIMECAP Odyssey Funds
For the Year Ended October 31, 2011 – continued
Foreign securities are recorded in the financial statements after their prices are converted to U.S. dollars based on the applicable exchange rate at the end of the period. The Funds do not isolate that portion of the results of operations arising as a result of changes in the currency exchange rate from the fluctuations arising as a result of changes in the market prices of investments during the period.
| B. | Share Valuation |
The NAV of a Fund is calculated by dividing the sum of the value of the securities held by the Fund, plus cash or other assets, minus all liabilities (including estimated accrued expenses), by the total number of shares outstanding of the Fund. The result is rounded to the nearest cent. The Funds’ shares will not be priced on the days on which the NYSE is closed for trading.
| C. | Foreign Currency |
Values of investments denominated in foreign currencies are converted into U.S. dollars using the spot market rate of exchange at the time of valuation. Purchases and sales of investments and dividend and interest income are converted into U.S. dollars using the spot market rate of exchange prevailing on the respective dates of such translations. Realized foreign exchange gains or losses arise from sales of foreign currencies, currency gains or losses realized between the trade and settlement dates on securities transactions and the difference between the recorded amounts of dividends, interest, and foreign withholding taxes and the U.S. dollar equivalent of the amounts actually received or paid. Net unrealized foreign exchange gains and losses arise from changes in foreign exchange rates on foreign denominated assets and liabilities other than investments in securities held at the end of the reporting period. Foreign securities and currency transactions may involve risks not associated with U.S. securities and currency.
| D. | Federal Income Taxes |
Each Fund has elected to be treated as a “regulated investment company” under Subchapter M of the Internal Revenue Code (the “IRC”). The Funds intend to distribute substantially all of their taxable income and any accumulated net realized capital gains. Accordingly, no provision for Federal income taxes has been made in the accompanying financial statements.
The Funds may be subject to foreign taxes on income, gains on investments, or currency repatriation, a portion of which may be recoverable. The Funds will accrue such taxes and recoveries as applicable based upon their current interpretations of the tax rules and regulations that exist in the markets in which they invest.
Each Fund has adopted accounting standards regarding recognition and measurement of tax positions taken on a tax return. No material uncertain tax positions existed in any Fund as of October 31, 2011. As of October 31, 2011, open tax years include the tax years ended October 31, 2008 through 2011. The Funds are also not aware of any tax positions for which it is reasonably possible that the total amounts of unrecognized tax benefits will significantly change in the next 12 months. The Funds recognize interest and penalties, if any, related to unrecognized tax benefits as income tax
35
Table of Contents
Notes to Financial Statements
PRIMECAP Odyssey Funds
For the Year Ended October 31, 2011 – continued
expense in the Statement of Operations. During the fiscal year ended October 31, 2011, the Funds did not incur any interest or penalties.
| E. | Allocation of Expenses |
Each Fund is charged for those expenses directly attributable to it. Expenses that are not directly attributable to a Fund are allocated among the Funds by an appropriate method based on the nature of the expense.
| F. | Security Transactions, Investment Income, and Distributions |
Security transactions are accounted for on the trade date. Dividend income and distributions to shareholders are recorded on the ex-dividend date, and interest income is recognized on the accrual basis. Realized gains and losses are evaluated on the basis of identified costs. Premiums and discounts on the purchase of securities are amortized/accreted using the effective interest method. Accounting principles generally accepted in the United States of America require that permanent financial reporting and tax differences be reclassified in the capital accounts.
| G. | Use of Estimates |
The preparation of financial statements in conformity with accounting principles generally accepted in the United States of America requires management to make estimates and assumptions that affect the reported amounts of assets and liabilities and disclosure of contingent assets and liabilities at the date of the financial statements, and the reported amounts of revenues and expenses during the reporting period. Actual results could differ from these estimates.
| H. | Indemnification Obligations |
Under the Trust’s organizational documents, its current and former officers and trustees are indemnified against certain liabilities arising out of the performance of their duties to the Funds. In addition, in the normal course of business, the Funds enter into contracts that contain a variety of representations and warranties that provide general indemnifications. The Funds’ maximum exposure under these arrangements is unknown as this would involve future claims that may be made against the Funds that have not yet occurred. Based on experience, the Funds would expect the risk of loss to be remote.
| I. | Reclassifications |
Certain prior year amounts have been reclassified to conform to the current year’s presentation.
(3) Investment Transactions
The cost of purchases and the proceeds from sales of securities, excluding short-term investments, for the year ended October 31, 2011 were as follows:
Fund | Purchases | Sales | ||||||
PRIMECAP Odyssey Stock Fund | $ | 426,971,316 | $ | 177,608,522 | ||||
PRIMECAP Odyssey Growth Fund | $ | 572,956,289 | $ | 212,724,200 | ||||
PRIMECAP Odyssey Aggressive Growth Fund | $ | 371,544,802 | $ | 110,978,257 | ||||
36
Table of Contents
Notes to Financial Statements
PRIMECAP Odyssey Funds
For the Year Ended October 31, 2011 – continued
(4) Fair Value of the Financial Instruments
The Funds have adopted fair valuation accounting standards which establish an authoritative definition of fair value and set forth a hierarchy for measuring fair value. These standards require additional disclosure about the various inputs and valuation techniques used to develop the measurements of fair value and a discussion of changes in valuation techniques and related inputs during the period. These standards define fair value as the price that would be received in the sale of an asset or paid to transfer a liability in an orderly transaction between market participants on the measurement date. The fair value hierarchy is organized into three levels based upon the assumptions (referred to as “inputs”) used to value the asset or liability. These standards state that “observable inputs” reflect the assumptions that market participants would use in valuing an asset or liability based on market data obtained from independent sources. “Unobservable inputs” reflect the Funds’ own assumptions about the inputs market participants would use to value the asset or liability.
Various inputs are used in determining the value of each Fund’s investments. These inputs are summarized in the three broad levels below:
| Level 1 – | Unadjusted quoted prices in active markets for identical securities to which the trust has access at the date of measurement. |
| Level 2 – | Other significant observable inputs (including quoted prices for similar or related securities in both active and inactive markets, interest rates, foreign exchange rates, and fair value estimates for foreign securities indices). |
| Level 3 – | Significant unobservable inputs to the extent observable inputs are unavailable (including the Funds’ own assumptions in determining fair value of investments based on the best available information). |
37
Table of Contents
Notes to Financial Statements
PRIMECAP Odyssey Funds
For the Year Ended October 31, 2011 – continued
The following table provides the fair value measurements of applicable Fund assets by level within the fair value hierarchy for each Fund as of October 31, 2011. There were no significant transfers into or out of Level 1 and Level 2 during the reporting period. These assets are measured on a recurring basis.
Fund | Description | Quoted prices in active markets for identical assets (Level 1) | Significant other observable inputs (Level 2) | Significant unobservable inputs (Level 3) | Total | |||||||||||||
PRIMECAP Odyssey Stock Fund | Equity | $ | 850,165,591 | $ | — | $ | — | $ | 850,165,591 | |||||||||
|
|
|
|
|
|
|
| |||||||||||
Total Equity | $ | 850,165,591 | $ | — | $ | — | $ | 850,165,591 | ||||||||||
|
|
|
|
|
|
|
| |||||||||||
Short-Term Investments | $ | 52,184,842 | $ | — | $ | — | $ | 52,184,842 | ||||||||||
|
|
|
|
|
|
|
| |||||||||||
Total Investments in Securities | $ | 902,350,433 | $ | — | $ | — | $ | 902,350,433 | ||||||||||
|
|
|
|
|
|
|
| |||||||||||
PRIMECAP Odyssey Growth Fund | Equity | $ | 1,802,445,831 | $ | — | $ | — | $ | 1,802,445,831 | |||||||||
|
|
|
|
|
|
|
| |||||||||||
Total Equity | $ | 1,802,445,831 | $ | — | $ | — | $ | 1,802,445,831 | ||||||||||
|
|
|
|
|
|
|
| |||||||||||
Short-Term Investments | $ | 20,924,532 | $ | — | $ | — | $ | 20,924,532 | ||||||||||
|
|
|
|
|
|
|
| |||||||||||
Total Investments in Securities | $ | 1,823,370,363 | $ | — | $ | — | $ | 1,823,370,363 | ||||||||||
|
|
|
|
|
|
|
| |||||||||||
PRIMECAP Odyssey Aggressive Growth Fund | Equity | $ | 1,093,830,680 | $ | — | $ | — | $ | 1,093,830,680 | |||||||||
|
|
|
|
|
|
|
| |||||||||||
Total Equity | $ | 1,093,830,680 | $ | — | $ | — | $ | 1,093,830,680 | ||||||||||
|
|
|
|
|
|
|
| |||||||||||
Short-Term Investments | $ | 38,760,445 | $ | — | $ | — | $ | 38,760,445 | ||||||||||
|
|
|
|
|
|
|
| |||||||||||
Total Investments in Securities | $ | 1,132,591,125 | $ | — | $ | — | $ | 1,132,591,125 | ||||||||||
|
|
|
|
|
|
|
| |||||||||||
Refer to each Fund’s respective Schedule of Investments for the breakdown of major categories.
In May 2011, the FASB issued ASU No. 2011-04 “Amendments to Achieve Common Fair Value Measurement and Disclosure Requirements” in GAAP and the International Financial Reporting Standards (“IFRS”). ASU No. 2011-04 amends FASB ASC Topic 820, Fair Value Measurements and Disclosures, to establish common requirements for measuring fair value and for disclosing information about fair value measurements in accordance with GAAP and IFRS. ASU No. 2011-04 is effective for interim and fiscal years beginning after December 15, 2011. Management is currently evaluating the impact of these amendments and does not believe they will have a material impact on the Funds’ financial statements.
38
Table of Contents
Notes to Financial Statements
PRIMECAP Odyssey Funds
For the Year Ended October 31, 2011 – continued
(5) Distribution to Shareholders
Net investment income and net realized gains differ for financial statement and tax purposes due to differing treatments of deferred wash sale losses.
As of October 31, 2011, the components of capital on a tax basis were as follows:
| PRIMECAP Odyssey Stock Fund | PRIMECAP Odyssey Growth Fund | PRIMECAP Odyssey Aggressive Growth Fund | ||||||||||
Cost of investments for tax purposes(1) | $ | 815,152,845 | $ | 1,634,621,179 | $ | 1,001,330,101 | ||||||
|
|
|
|
|
| |||||||
Gross tax unrealized appreciation | 133,373,705 | 402,987,313 | 310,304,846 | |||||||||
Gross tax unrealized depreciation | (46,131,962 | ) | (214,145,724 | ) | (178,996,370 | ) | ||||||
|
|
|
|
|
| |||||||
Net tax unrealized appreciation . | $ | 87,241,743 | $ | 188,841,589 | $ | 131,308,476 | ||||||
|
|
|
|
|
| |||||||
Undistributed ordinary income . | $ | 8,872,391 | $ | 11,274,075 | $ | 13,465,599 | ||||||
Undistributed long-term capital gain | — | — | 7,777,022 | |||||||||
|
|
|
|
|
| |||||||
Total distributable earnings | $ | 8,872,391 | $ | 11,274,075 | $ | 21,242,621 | ||||||
|
|
|
|
|
| |||||||
Other accumulated gain (loss) | $ | (20,033,026 | ) | $ | — | $ | — | |||||
|
|
|
|
|
| |||||||
Total accumulated gain | $ | 76,081,108 | $ | 200,115,664 | $ | 152,551,097 | ||||||
|
|
|
|
|
| |||||||
| (1) | At October 31, 2011 the differences in the basis for federal income tax purposes and financial reporting purchases are due to the tax deferral of losses on wash sales. |
U.S. Generally Accepted Accounting Principles (GAAP) require that permanent book-to-tax differences be reclassified among the components of net assets. These reclassifications have no effect on net assets or net asset value per share. For the fiscal year ended October 31, 2011, the following reclassifications were made:
| Undistributed Net Investment Income | Accumulated Net Realized Loss | Paid In Capital | ||||||||||
PRIMECAP Odyssey | (6,603) | 6,603 | — | |||||||||
PRIMECAP Odyssey | (10,487) | (3,899,269) | 3,909,756 | |||||||||
PRIMECAP Odyssey | 3,382,612 | (5,709,284) | 2,326,672 | |||||||||
The Funds used a tax accounting practice to treat a portion of the price of capital shares redeemed during the year as distributions from realized capital gains. The PRIMECAP Odyssey Growth
39
Table of Contents
Notes to Financial Statements
PRIMECAP Odyssey Funds
For the Year Ended October 31, 2011 – continued
Fund reclassified $3,909,756 from Accumulated Net Realized Gain to Paid In Capital. The PRIMECAP Odyssey Aggressive Growth Fund reclassified $2,326,672 from Accumulated Net Realized Gain to Paid In Capital. Other permanent book-to-tax differences that required reclassification among the Funds’ capital accounts related to foreign currency adjustments and net operating losses.
At October 31, 2011, the PRIMECAP Odyssey Stock Fund had capital loss carryover of $20,033,026 which expires on October 31, 2017.
Tax components of dividends paid during the year ended October 31, 2011 and the year ended October 31, 2010 were as follows:
| October 31, 2011 | ||||||||
| Ordinary Income Distributions | Long-Term Capital Gain Distributions | |||||||
PRIMECAP Odyssey Stock Fund | $ | 5,099,941 | $ | — | ||||
PRIMECAP Odyssey Growth Fund | $ | 1,416,348 | $ | — | ||||
PRIMECAP Odyssey Aggressive Growth Fund | $ | — | $ | 27,881,437 | ||||
| October 31, 2010 | ||||||||
| Ordinary Income Distributions | Long-Term Capital Gain Distributions | |||||||
PRIMECAP Odyssey Stock Fund | $ | 1,831,079 | $ | — | ||||
PRIMECAP Odyssey Growth Fund | $ | 1,825,837 | $ | — | ||||
PRIMECAP Odyssey Aggressive Growth Fund | $ | — | $ | — | ||||
The Funds designated as long-term capital gain dividends, pursuant to Internal Revenue Code Section 852(b)(3), the amounts necessary to reduce the earnings and profits of the Funds related to net capital gains to zero for the tax year ended October 31, 2011.
In December 2010, the Regulated Investment Company Modernization Act (the “RIC Act”) was enacted by Congress and signed into law. Under the RIC Act, new capital losses may be carried forward indefinitely and retain the character of the original loss. Any post-enactment capital losses generated will be required to be utilized prior to the losses incurred in pre-enactment years. The RIC Act, among other things, also contains provisions aimed at preventing disqualification under the IRC for inadvertent failures to comply with the asset diversification and qualifying income tests, exempts RICs from the preferential dividend rule, and repeals the 60-day designation requirement for certain pay-through income and gains. Most of the provisions of the RIC Act will apply to the Funds beginning in the 2012 fiscal year.
40
Table of Contents
Notes to Financial Statements
PRIMECAP Odyssey Funds
For the Year Ended October 31, 2011 – continued
(6) Investment Advisory and Other Agreements
The Trust has entered into an investment management agreement with the Investment Advisor on behalf of each Fund. Under the terms of the agreement, each of the Funds will pay a fee equal to the following annual percentages of average net assets:
| For the First $100,000,000 Per Fund | Assets in Excess of $100,000,000 Per Fund | |||||||
PRIMECAP Odyssey Stock Fund | 0.60% | 0.55% | ||||||
PRIMECAP Odyssey Growth Fund | 0.60% | 0.55% | ||||||
PRIMECAP Odyssey Aggressive Growth Fund | 0.60% | 0.55% | ||||||
The Bank of New York Mellon serves as the Funds’ custodian. U.S. Bancorp Fund Services, LLC (“USBFS”) serves as the administrator, fund accountant, and transfer agent to the Funds. Quasar Distributors, LLC, an affiliate of USBFS, serves as the Funds’ distributor.
(7) Other Affiliates
Certain of the Funds’ investments are in companies that are considered to be affiliated companies of a Fund because the Fund owns more than 5% of the outstanding voting securities of the company. Transactions during the period in securities of these companies were as follows:
PRIMECAP Odyssey Growth Fund |
| |||||||||||||||||||||||
| Current Period Transactions | ||||||||||||||||||||||||
Common Stock | Market Value as of October 31, 2010 | Purchases at Cost | Proceeds from Securities Sold | Dividend Income | Realized Gain (Loss) | Market Value at October 31, 2011 | ||||||||||||||||||
Conceptus, Inc. | 31,457,075 | 591,600 | — | — | — | 25,962,947 | ||||||||||||||||||
ImmunoGen, Inc. | 46,196,400 | 2,593,517 | — | — | — | 79,307,200 | ||||||||||||||||||
Stratasys, Inc.^ | 21,297,600 | 9,690,129 | — | — | — | 29,722,400 | ||||||||||||||||||
|
|
|
|
|
|
|
|
|
|
|
| |||||||||||||
Total | $ | 98,951,075 | $ | 12,875,246 | — | — | — | $ | 134,992,547 | |||||||||||||||
|
|
|
|
|
|
|
|
|
|
|
| |||||||||||||
| ^ | Not an affiliate as of October 31, 2010 |
41
Table of Contents
Notes to Financial Statements
PRIMECAP Odyssey Funds
For the Year Ended October 31, 2011 – continued
PRIMECAP Odyssey Aggressive Growth Fund |
| |||||||||||||||||||||||
| Current Period Transactions | ||||||||||||||||||||||||
Common Stock | Market Value as of October 31, 2010 | Purchases at Cost | Proceeds from Securities Sold | Dividend Income | Realized Gain (Loss) | Market Value at October 31, 2011 | ||||||||||||||||||
Abiomed, Inc.^ | 12,998,570 | 10,685,104 | — | — | — | 30,845,485 | ||||||||||||||||||
Conceptus, Inc.^ | 21,382,497 | 2,269,604 | — | — | — | 19,235,520 | ||||||||||||||||||
Dyax Corp.^ | 11,223,647 | 2,268,318 | — | — | — | 7,863,750 | ||||||||||||||||||
Guidance Software, Inc.^ | 4,858,566 | 3,853,867 | — | — | — | 7,825,621 | ||||||||||||||||||
Smart Balance, Inc. | 11,433,670 | 729,968 | 639,138 | — | 38,795 | 21,702,803 | ||||||||||||||||||
|
|
|
|
|
|
|
|
|
|
|
| |||||||||||||
Total | $ | 61,896,950 | 19,806,861 | 639,138 | — | 38,795 | $ | 87,473,179 | ||||||||||||||||
|
|
|
|
|
|
|
|
|
|
|
| |||||||||||||
| ^ | Not an affiliate as of October 31, 2010 |
(8) Subsequent Events
The Funds have evaluated subsequent events through the issuance of the financial statements and determined that no events have occurred that require disclosure.
42
Table of Contents
| Report of Independent Registered Public Accounting Firm |
To the Board of Trustees and Shareholders
of PRIMECAP Odyssey Funds:
In our opinion, the accompanying statements of assets and liabilities, including the schedules of investments, and the related statements of operations and of changes in net assets and the financial highlights present fairly, in all material respects, the financial position of PRIMECAP Odyssey Stock Fund, PRIMECAP Odyssey Growth Fund and PRIMECAP Odyssey Aggressive Growth Fund (the “Funds”) at October 31, 2011, the results of each of their operations for the year then ended, the changes in each of their net assets for each of the two years in the period then ended and the financial highlights for each of the five years in the period then ended, in conformity with accounting principles generally accepted in the United States of America. These financial statements and financial highlights (hereafter referred to as “financial statements”) are the responsibility of the Funds’ management; our responsibility is to express an opinion on these financial statements based on our audits. We conducted our audits of these financial statements in accordance with the standards of the Public Company Accounting Oversight Board (United States). Those standards require that we plan and perform the audit to obtain reasonable assurance about whether the financial statements are free of material misstatement. An audit includes examining, on a test basis, evidence supporting the amounts and disclosures in the financial statements, assessing the accounting principles used and significant estimates made by management, and evaluating the overall financial statement presentation. We believe that our audits, which included confirmation of securities at October 31, 2011 by correspondence with the custodian and brokers, provide a reasonable basis for our opinion.
PricewaterhouseCoopers LLP
San Francisco, California
December 13, 2011
43
Table of Contents
| PRIMECAP Odyssey Funds (Unaudited) |
As a shareholder of one or more of the Funds, you incur ongoing costs, including management fees and other Fund expenses. This expense example is intended to help you understand your ongoing costs (in dollars) of investing in the Funds and to compare these costs with the ongoing costs of investing in other mutual funds.
The expense example is based on an investment of $1,000 invested for a six-month period beginning May 1, 2011 and held through October 31, 2011.
Actual Expenses
The information in the table adjacent to the heading “Actual Performance” provides actual account values and actual expenses. You may use the information in these columns, together with the amount you invested, to estimate the expenses that you paid over the period. Simply divide your account value by $1,000 (for example, an $8,600 account value divided by $1,000 = 8.6), then multiply the result by the number in the column entitled “Expenses Paid during Period” to estimate the expenses you paid on your account during this period.
Hypothetical Example for Comparison Purposes
The information in the table adjacent to the heading “Hypothetical Performance (5% return before expenses)” provides hypothetical account values and hypothetical expenses based on the Funds’ actual expense ratios and an assumed rate of return of 5% per year before expenses, which are not the Funds’ actual returns. The hypothetical account values and expenses may not be used to estimate the actual ending account balance or expenses you paid for the period. You may use this information to compare the ongoing costs of investing in the Funds and other mutual funds. To do so, compare these 5% hypothetical examples with the 5% hypothetical examples that appear in the shareholder reports of the other mutual funds.
Please note that the expenses shown in the table are meant to highlight your ongoing costs only. Therefore, the information adjacent to the heading “Hypothetical Performance (5% return before expenses)” is useful in comparing ongoing costs only and will not help you determine the relative total costs of owning different mutual funds. In addition, if transactional costs were included, your costs would have been higher.
44
Table of Contents
Expense Example
PRIMECAP Odyssey Funds
(Unaudited) – continued
| Beginning Account Value (5/1/11) | Ending Account Value (10/31/11) | Expenses Paid During Period* (5/1/11 to 10/31/11) | Expense Ratio During Period* (5/1/11 to 10/31/11) | |||||||||||||
PRIMECAP Odyssey Stock Fund |
| |||||||||||||||
Actual Performance | $ | 1,000.00 | $ | 925.10 | $ | 3.22 | 0.66% | |||||||||
Hypothetical Performance | $ | 1,000.00 | $ | 1,021.86 | $ | 3.38 | 0.66% | |||||||||
PRIMECAP Odyssey Growth Fund |
| |||||||||||||||
Actual Performance | $ | 1,000.00 | $ | 895.60 | $ | 3.22 | 0.67% | |||||||||
Hypothetical Performance | $ | 1,000.00 | $ | 1,021.81 | $ | 3.43 | 0.67% | |||||||||
PRIMECAP Odyssey Aggressive Growth Fund |
| |||||||||||||||
Actual Performance | $ | 1,000.00 | $ | 904.20 | $ | 3.28 | 0.68% | |||||||||
Hypothetical Performance | $ | 1,000.00 | $ | 1,021.76 | $ | 3.48 | 0.68% | |||||||||
| * | Expenses are equal to a Fund’s annualized expense ratio as indicated, multiplied by the average account value over the period, multiplied by the number of days in the most recent fiscal half-year period (184), then divided by the number of days in the fiscal year (365) to reflect the one-half year period. |
45
Table of Contents
| PRIMECAP Odyssey Funds (Unaudited) |
Additional Tax Information
The PRIMECAP Odyssey Stock Fund and PRIMECAP Odyssey Growth Fund designate 100% and 100%, respectively, of ordinary income distributions paid during the fiscal year ended October 31, 2011 as qualified dividend income.
The PRIMECAP Odyssey Stock Fund and PRIMECAP Odyssey Growth Fund designate 100% and 100%, respectively, of ordinary income distributions paid during the fiscal year ended October 31, 2011 as dividends qualifying for the dividends received deduction available for corporate shareholders.
Proxy Voting Procedures
The Investment Advisor votes proxies relating to portfolio securities in accordance with procedures that have been approved by the Trust’s Board of Trustees. You may obtain a description of these procedures, free of charge, by calling toll-free 1-800-729-2307. This information is also available through the Securities and Exchange Commission’s (“SEC”) website at www.sec.gov.
Proxy Voting Record
Information regarding how the Funds voted proxies relating to the portfolio securities during the most recent 12-month period ended June 30 is available, without charge, by calling toll-free 1-800-729-2307. This information is also available through the SEC’s website at www.sec.gov.
Form N-Q Disclosure
The Trust files its complete schedules of portfolio holdings with the SEC for the first and third quarters of each fiscal year on Form N-Q. The Trust’s Form N-Q is available on the SEC’s website at www.sec.gov. The Trust’s Form N-Q may be reviewed and copied at the Commission’s Public Reference Room in Washington, DC, and information on the operation of the Public Reference Room may be obtained by calling 1-800-SEC-0330. This information is also available, without charge, by calling toll-free 1-800-729-2307.
Board Approval of the Renewal of the Investment Advisory Agreement
The Board of Trustees (the “Board”) of PRIMECAP Odyssey Funds (the “Trust”) is comprised of five Trustees, four of whom are not “interested persons” of the Trust within the meaning of the Investment Company Act of 1940, as amended (the “Independent Trustees”). In September 2011, the Board of Trustees, including the Independent Trustees, approved a one-year renewal of the Trust’s investment advisory agreement with PRIMECAP Management Company (the “Advisor”).
General Information
As part of the annual contract review process, the Independent Trustees, through Trust counsel, requested and received extensive materials, including information related to: the nature, extent, and quality of the services provided to the Funds by the Advisor; information regarding the short- and long-term performance of each Fund relative to market indices and other funds in its Morningstar category; the advisory fees paid to the Advisor and the total expense ratio of each Fund compared to the advisory fees and the total expense ratios of other funds in the Fund’s Morning-
46
Table of Contents
Additional Information
PRIMECAP Odyssey Funds
(Unaudited) – continued
star category; financial information for the Advisor and information related to the profitability to the Advisor of the investment advisory agreement with the Trust; the extent to which the Advisor expects to achieve economies of scale in connection with the services it provides to each Fund; any ancillary or “fall out” benefits that the Advisor may derive from its relationship with the Funds; and information about the personnel of the Advisor providing services to the Funds. The Independent Trustees also requested and received information regarding the Advisor’s risk controls, risk evaluation processes, and compliance program (including brokerage and trading processes and business continuity plans).
With respect to investment performance, the Board noted that the Advisor had made presentations on a quarterly basis regarding the Funds’ portfolio construction, investment environment, and results. The Board noted that in addition to meeting with the Funds’ portfolio managers on a quarterly basis, they also received presentations from different analysts throughout the year on specific investment sectors and each Fund’s investments in those sectors. In considering the renewal of the agreement, the Board also took into account other information it had received at past Board and committee meetings with respect to various matters.
The Independent Trustees reviewed information from Trust counsel regarding their responsibilities in considering whether to renew the investment advisory agreement for an additional one-year period. In connection with their deliberations, the Board considered such information and factors that they believed, in light of the legal advice furnished to them and their own business judgment, to be relevant. The Board considered renewal of the investment advisory agreement separately for each Fund, although the Board took into account the common interests of all the Funds in its review. In considering these matters, the Board discussed the renewal of the investment advisory agreement with management, and the Independent Trustees met in private sessions with Trust counsel at which no employees of the Advisor were present.
In deciding to approve the renewal of the investment advisory agreement, the Board and the Independent Trustees did not identify a single factor that was controlling. The Board and the Independent Trustees concluded that each of the various factors referred to below favored such approval. The following summary describes the key factors considered by the Independent Trustees and the conclusions thereto that formed the basis for approving the renewal of the investment advisory agreement in light of the legal advice furnished by counsel and their own business judgment. This summary in not inclusive of all of the factors considered.
Nature, Extent, and Quality of Services
The Board considered the services provided by the Advisor to the Funds under the investment advisory agreement, including the background, education, and experience of its key portfolio management, compliance, and operational personnel; its overall financial strength and stability; its resources and efforts to retain, attract, and motivate capable personnel to serve the Funds; and the overall general quality and depth of its organization. The Board also took into account the experience, capability, and integrity of the Advisor’s senior management, the time that the senior management commits to the Funds, and the Advisor’s demonstrated commitment to the Funds; its investment philosophy and processes, including its brokerage and trading practices; its disaster
47
Table of Contents
Additional Information
PRIMECAP Odyssey Funds
(Unaudited) – continued
recovery and contingency planning; and its oversight of the Funds’ internal control environment with regard to compliance with applicable laws and regulations. The Board and the Independent Trustees concluded that the nature, extent, and quality of services provided (and expected to be provided) under the investment advisory agreement were of a high level and very satisfactory.
Investment Performance
The Board assessed the performance of each Fund compared with its benchmark and other funds in the same category as determined by Morningstar, Inc. (“Morningstar”) for the one-year, three-year, five-year, and since-inception periods ended July 31, 2011. The Board made the following observations in reviewing the Funds’ performance:
| • | The PRIMECAP Odyssey Stock Fund outperformed its benchmark, the S&P 500 Index, during the three-year, five-year, and since inception periods, though it underperformed during the 12-month period. The Fund’s performance relative to other mutual funds in the Morningstar Large-Cap Growth Fund universe was above median for longer time periods and was determined to be acceptable. |
| • | The PRIMECAP Odyssey Growth Fund outperformed the S&P 500 Index, its primary benchmark, for the one-year, three-year, five-year, and since inception periods. The Fund outperformed its secondary benchmark, the Russell 1000 Growth Index, for the three-year and since inception periods but underperformed the index for the one-year and five-year periods. The Fund’s performance was above median for longer time periods and was satisfactory in relation to other mutual funds in Morningstar’s Large-Cap Growth Fund universe. |
| • | The PRIMECAP Odyssey Aggressive Growth Fund outperformed both its primary and secondary benchmarks, the S&P 500 Index and the Russell Midcap Growth Index, for the three-year, five-year, and since inception periods. Over the 12 months ended July 31, 2011, the Fund outperformed the S&P 500 Index but underperformed the Russell Midcap Growth Index. The Fund’s performance generally compared favorably to other mutual funds in the Morningstar Mid-Cap Growth Fund universe and was above median for longer time periods. |
Based on the information provided to them and in consideration of the specific investment objectives and risk profiles of each Fund, the Board and the Independent Trustees concluded that the performance of each Fund was satisfactory.
Advisory Fees and Fund Expenses
The Board reviewed the fees and expenses paid by each Fund to the Advisor as well as an analysis of Morningstar data with respect to the fees and expenses paid by comparable funds. They compared the advisory fees and total expense ratios for each Fund to those of: 1) all other funds in the same Morningstar category (for the Stock and Growth Funds – Large-Cap Growth Funds, and for the Aggressive Growth Fund – Mid-Cap Growth Funds); 2) funds in the same Morningstar category with fee structures and characteristics similar to the Funds (e.g., no distribution or shareholder servicing fees, and excluding load funds, enhanced index funds, funds of funds and multi-manager funds); and 3) a peer group of 15 funds with characteristics and asset sizes similar
48
Table of Contents
Additional Information
PRIMECAP Odyssey Funds
(Unaudited) – continued
to the Funds. The Independent Trustees noted that, for each Fund, the advisory fee and the total expense ratio was in the lowest quartile (and therefore most favorable to shareholders) in each group reviewed, except for the advisory fee of the Aggressive Growth Fund, which had the fourth lowest advisory fee of the 15 funds in its peer group (and therefore was in the lowest 27% of funds in the peer group).
The Board also reviewed the fees charged by the Advisor to other clients, including other mutual funds for which it provides sub-advisory services. The Board noted that although those fees were lower than those charged by the Advisor to the Funds, the Advisor provided additional services to the Funds that it did not provide to other clients, including the services of the Trust’s Chief Compliance Officer and other personnel involved in the oversight of the Trust’s service providers. The Board and the Independent Trustees determined that the advisory fees and expenses charged to the Funds were reasonable in consideration of the services provided.
Costs and Profits of the Advisor
The Board reviewed information relating to the Advisor’s profitability with respect to the investment advisory agreement and concluded that the profit levels were reasonable in light of the nature, extent, and quality of the services provided by the Advisor to the Funds. The Board also reviewed information regarding the Advisor’s financial position and concluded that the Advisor would be able to continue to provide advisory services to the Fund. As part of this discussion, the Independent Trustees recognized the importance of the profitability of the Advisor, not only in maintaining its own financial condition, but also in maintaining an environment in which it is able to attract and retain talented investment professionals.
Economies of Scale and Other Benefits to the Investment Advisor
The Board recognized the Advisor’s efforts in monitoring and minimizing the expenses of the Funds. The Independent Trustees noted that, as the assets of the Funds had grown since their launch, their expense ratios had decreased. The Board considered information regarding the level of advisory fees charged to each Fund and noted that the advisory fees were and, since the inception of the Funds, had been low relative to other mutual funds with similar investment objectives. The Board and the Independent Trustees concluded that the assets of the Funds were unlikely to grow to levels that would generate significant economies of scale for the Advisor that would justify additional fee breakpoints in the near future. The Board also considered the benefits received by the Advisor as a result of its relationship with the Funds, including investment advisory fees and the intangible benefits of any favorable publicity arising in connection with the Funds’ performance.
Conclusions
Based on their review, including their consideration of each of the factors referred to above, the Board and the Independent Trustees concluded that the compensation payable to the Advisor pursuant to the investment advisory agreement is fair and reasonable in light of the services being provided by the Advisor to each Fund and its shareholders, and that renewal of the investment advisory agreement was in the best interest of each Fund and its shareholders.
49
Table of Contents
| PRIMECAP Odyssey Funds (Unaudited) |
Portfolio Managers
PRIMECAP Management Company has five portfolio managers who together have more than 180 years of investment experience. Each of these five individuals manages a portion of the PRIMECAP Odyssey Stock Fund and the PRIMECAP Odyssey Growth Fund. The PRIMECAP Odyssey Aggressive Growth Fund is primarily managed by Messrs. Schow, Kolokotrones, Fried, and Mordecai. A small portion of each Fund’s assets may be managed by individuals in the Investment Advisor’s research department. The portfolio managers primarily responsible for overseeing the Funds’ investments are:
| Name | Years of Experience | |||
Howard B. Schow | 56 | |||
Mitchell J. Milias | 47 | |||
Theo A. Kolokotrones | 41 | |||
Joel P. Fried | 26 | |||
Alfred W. Mordecai | 14 | |||
Officers and Trustees
The Trust’s officers, who oversee the Funds’ daily operations, are appointed by the Board of Trustees. The trustees are responsible for the overall management of the Trust, including establishing the Funds’ policies and general supervision and review of their investment activities. The Statement of Additional Information includes additional information about the trustees and is available, without charge, by calling 1-800-729-2307 or at the Funds’ website at www.odysseyfunds.com.
Executive Officers. The table below sets forth certain information about each of the Trust’s executive officers.
| Name, Address (Year of Birth) | Position(s) Held with Trust | Term of Office; Length of Time Served | Principal Occupation(s) During Past 5 Years | |||
Howard B. Schow 225 South Lake Ave. Pasadena, CA 91101-3005 (1927) | Co-Chief Executive Officer | Indefinite; Since 09/04 | Chairman Emeritus, Director, Portfolio Manager, and Principal PRIMECAP Management Company | |||
Theo A. Kolokotrones 225 South Lake Ave. Pasadena, CA 91101-3005 | Co-Chief Executive Officer | Indefinite; Since 09/04 | Vice-Chairman, Director, Portfolio Manager, and Principal PRIMECAP Management Company |
50
Table of Contents
Management
PRIMECAP Odyssey Funds
(Unaudited) – continued
Name, Address (Year of Birth) | Position(s) Held with Trust | Term of Office; Length of Time Served | Principal Occupation(s) During Past 5 Years | |||
Joel P. Fried 225 South Lake Ave. Pasadena, CA 91101-3005 (1962) | Co-Chief Executive Officer and Trustee | Indefinite; Since 09/04 | President, Director, Portfolio Manager, and Principal PRIMECAP Management Company | |||
Michael J. Ricks 225 South Lake Ave. Pasadena, CA 91101-3005 (1977) | Chief Financial Officer, Chief Administrative Officer, and Secretary | Indefinite; Since 03/11 | Director of Fund Administration, PRIMECAP Management Company (since 2011); Vice President, Fund Administration and Compliance, U.S. Bancorp Fund Services, LLC (2001-2011) | |||
Karen Chen 225 South Lake Ave. Pasadena, CA 91101-3005 (1973) | Vice President of Compliance, Chief Compliance Officer, and AML Officer | Indefinite; Since 10/04 | Chief Compliance Officer, Director of Compliance and Reporting PRIMECAP Management Company |
“Independent” Trustees. The table below sets forth certain information about each of the trustees of the Trust who is not an “interested person” of the Trust as defined in the 1940 Act (“Independent Trustees”).
| Name, Address (Year of Birth) | Position(s) Held with Trust | Term of Office; Length of Time Served | Principal Occupation(s) During Past 5 Years | Number of Portfolios in Fund Complex by Trustee1 | Other Director- ships Held by Trustee | |||||
Benjamin F. Hammon 225 South Lake Ave. Pasadena, CA 91101-3005 (1935) | Chairman of the Board and Trustee | Indefinite; Since 09/04 | Retired; Director, Institutional Equity Sales, Salomon Smith Barney Inc. (1963-1998) | 3 | None | |||||
Wayne H. Smith 225 South Lake Ave. Pasadena, CA 91101-3005 (1941) | Chairman of the Audit Committee and Trustee | Indefinite; Since 09/04 | Retired; President, Wayne H. Smith Consulting, Inc. (2002- 2007); Vice President, Financial Services, Avery Dennison Corporation (2001-2002); Vice President, Financial Services, and Treasurer, Avery Dennison Corporation (1999-2001) | 3 | None |
51
Table of Contents
Management
PRIMECAP Odyssey Funds
(Unaudited) – continued
| Name, Address (Year of Birth) | Position(s) Held with Trust | Term of Office; Length of Time Served | Principal Occupation(s) During Past 5 Years | Number of Portfolios in Fund Complex by Trustee1 | Other Director- ships Held by Trustee | |||||
| Joseph G. Uzelac 225 South Lake Ave. Pasadena, CA 91101-3005 (1944) | Trustee | Indefinite; Since 10/07 | Retired; Managing Director, Lehman Brothers Global Investment Bank (1988-2007) | 3 | None | |||||
| Elizabeth D. Obershaw 225 South Lake Ave. Pasadena, CA 91101-3005 (1960) | Trustee | Indefinite; Since 06/08 | Managing Director, Horsley Bridge Partners, an investment advisor (2007-present); Vice President and Chief Investment Officer, Hewlett-Packard Company (1991-2007); Hewlett-Packard Company (1983-1991) | 3 | None |
| 1 | Fund Complex includes any funds, series of funds, or trusts that share the same advisor or that hold themselves out to investors as related companies. |
“Interested” Trustees. The table below sets forth certain information about each of the trustees of the Trust who is an “interested person” of the Trust as defined by the 1940 Act.
| Name, Address (Year of Birth) | Position(s) Held with Trust | Term of Office; Length of Time Served | Principal Occupation(s) During Past 5 Years | Number of Portfolios in Fund Complex by Trustee1 | Other Director- ships Held by Trustee | |||||
| Joel P. Fried2 225 South Lake Ave. Pasadena, CA 91101-3005 (1962) | Co-Chief Executive Officer and Trustee | Indefinite; Since 09/04 | President, Director, Portfolio Manager, and Principal PRIMECAP Management Company | 3 | None |
| 1 | Fund Complex includes any funds, series of funds, or trusts that share the same advisor or that hold themselves out to investors as related companies. |
| 2 | Mr. Fried is an “interested person” of the Trust, as defined by the 1940 Act, because of his employ- ment with PRIMECAP Management Company, the investment advisor to the Trust. |
52
Table of Contents
Investment Advisor
PRIMECAP MANAGEMENT COMPANY
225 South Lake Avenue, Suite 400
Pasadena, California 91101
•
Distributor
QUASAR DISTRIBUTORS, LLC
615 East Michigan Street, 4th Floor
Milwaukee, Wisconsin 53202
•
Custodian
THE BANK OF NEW YORK MELLON
One Wall Street
New York, New York 10286
•
Transfer Agent
U.S. BANCORP FUND SERVICES, LLC
615 East Michigan Street, 3rd Floor
Milwaukee, Wisconsin 53202
•
Administrator
U.S. BANCORP FUND SERVICES, LLC
2020 East Financial Way, Suite 100
Glendora, California 91741
•
Legal Counsel
BINGHAM McCUTCHEN LLP
355 South Grand Avenue, Suite 4400
Los Angeles, California 90071
•
Independent Registered Public Accounting Firm
PRICEWATERHOUSECOOPERS LLP
Three Embarcadero Center
San Francisco, California 94111
This report is intended for the shareholders of the PRIMECAP Odyssey Funds and may not be used as sales literature unless preceded or accompanied by a current prospectus.
Past performance results shown in this report should not be considered a representation of future performance. Share price and returns will fluctuate so that shares, when redeemed, may be worth more or less than their original cost. Statements and other information herein are dated and are subject to change.
PRIMECAP, PRIMECAP Odyssey, and the PRIMECAP Odyssey logo are trademarks of PRIMECAP Management Company.
Table of Contents
Item 2. Code of Ethics.
The registrant has adopted a code of ethics that applies to the registrant’s principal executive officer and principal financial officer. The registrant has not made any amendments to its code of ethics during the period covered by this report. The registrant has not granted any waivers from any provisions of the code of ethics during the period covered by this report.
The registrant undertakes to provide to any person without charge, upon request, a copy of its code of ethics by mail when they call the registrant at 1-800-729-2307.
Item 3. Audit Committee Financial Expert.
The registrant’s Board of Trustees has determined that there is at least one audit committee financial expert serving on its audit committee. Wayne Smith is the “audit committee financial expert” and is considered to be “independent” as each term is defined in Item 3 of Form N-CSR.
Item 4. Principal Accountant Fees and Services.
The registrant has engaged its principal accountant to perform audit services, audit-related services, tax services and other services during the past two fiscal years. “Audit services” refer to performing an audit of the registrant’s annual financial statements or services that are normally provided by the accountant in connection with statutory and regulatory filings or engagements for those fiscal years. “Audit-related services” refer to the assurance and related services by the principal accountant that are reasonably related to the performance of the audit. “Tax services” refer to professional services rendered by the principal accountant for tax compliance, tax advice, and tax planning and specifically relate to the accountant’s review of the Registrant’s federal and state tax returns. There were no “Other services” provided by the principal accountant. The following table details the aggregate fees billed or expected to be billed for each of the last two fiscal years for audit fees, audit-related fees, tax fees and other fees by the principal accountant.
| FYE 10/31/2011 | FYE 10/31/2010 | |||
Audit Fees | $80,350 | $77,250 | ||
Audit-Related Fees | $0 | $0 | ||
Tax Fees | $12,450 | $17,250 | ||
All Other Fees | $0 | $0 |
The audit committee has adopted pre-approval policies and procedures that require the audit committee to pre-approve all audit and non-audit services of the registrant, including services provided to any entity affiliated with the registrant.
Table of Contents
The percentage of fees billed by PricewaterhouseCoopers LLP applicable to non-audit services pursuant to waiver of pre-approval requirement were as follows:
| FYE 10/31/2011 | FYE 10/31/2010 | |||
Audit-Related Fees | 0% | 0% | ||
Tax Fees | 0% | 0% | ||
All Other Fees | 0% | 0% |
All of the principal accountant’s hours spent on auditing the registrant’s financial statements were attributed to work performed by full-time permanent employees of the principal accountant.
The following table indicates the non-audit fees billed or expected to be billed by the registrant’s accountant for services to the registrant and to the registrant’s investment adviser (and any other entity, controlling, controlled by, or under common control with the adviser that provides ongoing services to the registrant for the last two fiscal years.
Non-Audit Related Fees | FYE 10/31/2011 | FYE 10/31/2010 | ||
Registrant | $12,450 | $17,250 | ||
Registrant’s Investment Adviser | $0 | $0 |
Item 5. Audit Committee of Listed Registrants.
Not applicable to registrants who are not listed issuers (as defined in Rule 10A-3 under the Securities Exchange Act of 1934).
Item 6. Investments.
Schedule of Investments is included as part of the report to shareholders filed under Item 1 of this Form.
Item 7. Disclosure of Proxy Voting Policies and Procedures for Closed-End Management Investment Companies.
Not applicable to open-end investment companies.
Item 8. Portfolio Managers of Closed-End Management Investment Companies.
Not applicable to open-end investment companies.
Item 9. Purchases of Equity Securities by Closed-End Management Investment Company and Affiliated Purchasers.
Not applicable to open-end investment companies.
Item 10. Submission of Matters to a Vote of Security Holders.
There have been no material changes to the procedures by which shareholders may recommend nominees to the registrant’s board of directors/trustees.
2
Table of Contents
Item 11. Controls and Procedures.
| (a) | The Registrant’s Co-Chief Executive Officers and Chief Financial Officer have reviewed the Registrant’s disclosure controls and procedures (as defined in Rule 30a-3(c) under the Investment Company Act of 1940 (the “Act”)) as of a date within 90 days of the filing of this report, as required by Rule 30a-3(b) under the Act and Rules 13a-15(b) or 15d-15(b) under the Securities Exchange Act of 1934. Based on their review, such officers have concluded that the disclosure controls and procedures are effective in ensuring that information required to be disclosed in this report is appropriately recorded, processed, summarized and reported and made known to them by others within the Registrant and by the Registrant’s service provider. |
| (b) | There were no changes in the Registrant’s internal control over financial reporting (as defined in Rule 30a-3(d) under the Act) that occurred during the second fiscal quarter of the period covered by this report that has materially affected, or is reasonably likely to materially affect, the Registrant’s internal control over financial reporting. |
Item 12. Exhibits.
| (a) | (1) Any code of ethics or amendment thereto, that is the subject of the disclosure required by Item 2, to the extent that the registrant intends to satisfy Item 2 requirements through filing an exhibit. Incorporated by reference to the Registrant’s Form N-CSR filed January 6, 2006. |
| (2) | A separate certification for each principal executive and principal financial officer pursuant to Section 302 of the Sarbanes-Oxley Act of 2002. Filed herewith. |
| (3) | Any written solicitation to purchase securities under Rule 23c-1 under the Act sent or given during the period covered by the report by or on behalf of the registrant to 10 or more persons. Not applicable to open-end investment companies. |
| (b) | Certifications pursuant to Section 906 of the Sarbanes-Oxley Act of 2002. Furnished herewith. |
3
Table of Contents
SIGNATURES
Pursuant to the requirements of the Securities Exchange Act of 1934 and the Investment Company Act of 1940, the registrant has duly caused this report to be signed on its behalf by the undersigned, thereunto duly authorized.
PRIMECAP Odyssey Funds | ||
| By | /s/ Joel P. Fried | |
| Joel P. Fried, Co-Chief Executive Officer | ||
Date | December 21, 2011 | |
| By | /s/ Howard B. Schow | |
| Howard B. Schow, Co-Chief Executive Officer | ||
| Date | December 21, 2011 | |
| By | /s/ Theo A. Kolokotrones | |
| Theo A. Kolokotrones, Co-Chief Executive Officer | ||
| Date | December 21, 2011 | |
Pursuant to the requirements of the Securities Exchange Act of 1934 and the Investment Company Act of 1940, this report has been signed below by the following persons on behalf of the registrant and in the capacities and on the dates indicated.
| By | /s/ Joel P. Fried | |
| Joel P. Fried, Co-Chief Executive Officer | ||
| Date | December 21, 2011 | |
| By | /s/ Howard B. Schow | |
| Howard B. Schow, Co-Chief Executive Officer | ||
| Date | December 21, 2011 | |
| By | /s/ Theo A. Kolokotrones | |
| Theo A. Kolokotrones, Co-Chief Executive Officer | ||
| Date | December 21, 2011 | |
| By | /s/ Michael J. Ricks | |
| Michael J. Ricks, Chief Financial Officer | ||
| Date | December 21, 2011 | |
4