As filed with the Securities and Exchange Commission on December 27, 2012
UNITED STATES
SECURITIES AND EXCHANGE COMMISSION
Washington, D.C. 20549
FORM N-CSR
CERTIFIED SHAREHOLDER REPORT OF REGISTERED
MANAGEMENT INVESTMENT COMPANIES
Investment Company Act file number 811-21597
PRIMECAP Odyssey Funds
(Exact name of registrant as specified in charter)
225 South Lake Avenue, Suite 400
Pasadena, CA 91101
(Address of principal executive offices) (Zip code)
Michael J. Ricks
PRIMECAP Management Company
225 South Lake Avenue, Suite 400
Pasadena, CA 91101
(Name and address of agent for service)
(626) 304-9222
Registrant’s telephone number, including area code
Date of fiscal year end: October 31
Date of reporting period: October 31, 2012
Item 1. Reports to Stockholders.
ANNUAL REPORT
October 31, 2012

PRIMECAP ODYSSEY STOCK (POSKX)
PRIMECAP ODYSSEY GROWTH (POGRX)
PRIMECAP ODYSSEY AGGRESSIVE GROWTH (POAGX)
 | PRIMECAP Odyssey Funds |
| 2 | ||||
| 8 | ||||
| 8 | ||||
| 9 | ||||
| 10 | ||||
| 11 | ||||
| 13 | ||||
| 13 | ||||
| 17 | ||||
| 21 | ||||
| 25 | ||||
| 26 | ||||
| 27 | ||||
| 27 | ||||
| 28 | ||||
| 29 | ||||
| 30 | ||||
| 30 | ||||
| 31 | ||||
| 32 | ||||
| 33 | ||||
| 41 | ||||
| 42 | ||||
| 44 | ||||
| 49 | ||||
1
| PRIMECAP Odyssey Funds |
Dear Fellow Shareholders,
For the fiscal year ended October 31, 2012, the PRIMECAP Odyssey Stock Fund, PRIMECAP Odyssey Growth Fund, and PRIMECAP Odyssey Aggressive Growth Fund produced total returns of +11.39%, +9.86%, and +13.25%, respectively. By comparison, the unmanaged S&P 500 produced a total return of +15.21% for the period.
The stock market posted strong gains over the past 12 months despite a deteriorating global economic outlook. The corporate sector, which has been a notable area of strength during this economic recovery, is increasingly challenged. Cost cutting and share repurchases have effectively leveraged modest revenue growth into robust earnings growth over the last several years. However, it appears likely that corporations will face increasing revenue and cost pressures in 2013.
In the near term, major capital outlays and investment decisions are likely to be put on hold pending resolution of the imminent “fiscal cliff”. China, an important engine of global economic growth, is confronting decelerating rates of growth in GDP. Much of Europe remains mired in recession as the continent struggles to deal with its sovereign debt crisis. Meanwhile, recent military engagements in the Middle East raise the threat of geopolitical instability, which could further disrupt economic growth. As a result, many economists and market strategists are forecasting a decline in aggregate corporate profits next year.
Led by financials, health care, and consumer discretionary stocks, the S&P 500 gained more than 15% for the fiscal year. As epitomized by Apple Inc. (+47.7%), which recently became the largest market capitalization stock in history, market strength was highly concentrated in the very largest capitalization stocks. All three PRIMECAP Odyssey Funds were substantially underweight this segment of stocks, a significant factor in why the funds’ relative returns trailed that of the S&P 500.
Two consistent themes were prevalent in all three PRIMECAP Odyssey Funds. First, the funds benefitted significantly from their health care holdings. Second, the funds’ technology stocks hurt the year’s relative returns. As the fiscal year began, the valuations of many biopharmaceutical companies reflected concerns that had developed over many years regarding price controls, patent expirations, and diminished productivity. Portfolio companies such as Amgen, Eli Lilly, and Roche began to overcome these concerns as investors increasingly looked beyond 2011 and 2012, the industry’s worst two years for patent expirations, and toward the future. Several large scale clinical trials showed promising results for diseases like cancer, diabetes, and Alzheimer’s, all of which have tremendous unmet medical need. We believe pharmaceutical development is being enhanced in terms of speed, efficacy, and safety as the dramatic reduction in the cost of sequencing genes is leading to a more fundamental understanding of disease. Strong performance in several smaller drug and device companies benefitted the PRIMECAP Odyssey Aggressive Growth Fund in particular.
Each of the PRIMECAP Odyssey Funds continues to be overweight in the health care and information technology sectors and underweight in the financials, consumer staples, and energy sectors.
2
Letter to Shareholders
PRIMECAP Odyssey Funds
continued
A more detailed discussion of the results of each PRIMECAP Odyssey Fund follows.
PRIMECAP Odyssey Stock Fund
From November 1, 2011 to October 31, 2012, the Stock Fund’s total return of +11.39% trailed the S&P 500’s total return of +15.21%.
Health care companies among the largest contributors to the fund’s results included Amgen (+54.0%), Eli Lilly (+37.4%), and Roche (+20.7%). Other top contributors included Whirlpool (+98.3%), Visa (+50.0%), and Limited Brands (+22.7%).
On the negative side, technology stocks among the largest detractors from the fund’s results included Research in Motion (-60.8%), Electronic Arts (-47.1%), Corning (-15.9%), Ericsson (-12.4%), and Texas Instruments (-6.4%).
The top 10 holdings, which collectively represent 33.5% of the portfolio at the period end, are listed below:
PRIMECAP Odyssey Stock Fund Top 10 Holdings as of 10/31/12 | Ending % of Total Portfolio* | |||
Roche Holding AG | 4.6 | |||
Amgen Inc. | 4.3 | |||
Johnson & Johnson | 4.1 | |||
Eli Lilly & Co. | 3.4 | |||
Microsoft Corp. | 3.4 | |||
Charles Schwab Corp. | 3.3 | |||
Texas Instruments Inc. | 3.1 | |||
Medtronic Inc. | 2.5 | |||
Novartis AG ADS | 2.4 | |||
Visa Inc. | 2.4 | |||
Total % of Portfolio | 33.5 | % | ||
| * | The percentage is calculated by using the ending market value of the security divided by that of the total investments of the fund. |
PRIMECAP Odyssey Growth Fund
From November 1, 2011 to October 31, 2012, the Growth Fund’s total return was +9.86%, which trailed both the S&P 500’s total return of +15.21% and the Russell 1000 Growth Index’s total return of +13.02%.
3
Letter to Shareholders
PRIMECAP Odyssey Funds
continued
Health care stocks among the largest contributors to relative results included Nektar Therapeutics (+66.1%), Conceptus (+63.7%), Amgen (+54.0%), Eli Lilly (+37.4%), and Roche (+20.7%). Other large contributors included Stratasys (+137.8%) and Visa (+50.0%).
On the negative side, technology stocks among the largest detractors from the fund’s results included Rambus (-72.7%), Research in Motion (-60.8%), Electronic Arts (-47.1%), Altera (-18.9%), and Nuance Communications (-15.9%).
The top 10 holdings, which collectively represent 33.9% of the portfolio at the period end, are listed below:
PRIMECAP Odyssey Growth Fund Top 10 Holdings as of 10/31/12 | Ending % of Total Portfolio* | |||
Amgen Inc. | 5.7 | |||
Seattle Genetics Inc. | 5.2 | |||
Roche Holding AG | 5.1 | |||
Immunogen Inc. | 3.0 | |||
Biogen Idec Inc. | 2.8 | |||
Google Inc. Cl A | 2.5 | |||
Charles Schwab Corp. | 2.5 | |||
Stratasys Inc. | 2.4 | |||
Adobe Systems Inc. | 2.4 | |||
Eli Lilly & Co. | 2.3 | |||
Total % of Portfolio | 33.9 | % | ||
| * | The percentage is calculated by using the ending market value of the security divided by that of the total investments of the fund. |
PRIMECAP Odyssey Aggressive Growth Fund
From November 1, 2011 to October 31, 2012, the Aggressive Growth Fund’s total return was +13.25%, which trailed the S&P 500’s total return of +15.21% but exceeded the Russell Midcap Growth Index’s total return of +9.09%.
Some of the largest contributors to the fund’s results were health care stocks, led by Pharmacyclics (+363.7%), a biotechnology firm whose lead compound continues to show impressive efficacy and safety in treating multiple cancer types in clinical trials. Other health care stocks that helped returns included Dyax Corp. (+123.0%), Accuray (+74.0%), Conceptus (+63.7%), and Nektar Therapeutics (+66.1%). Stratasys (+137.8%), a manufacturer of 3D printers, and Smart Balance (+81.7%), a consumer food products company, were also top contributors to the fund’s results.
4
Letter to Shareholders
PRIMECAP Odyssey Funds
continued
On the negative side, technology stocks among the largest detractors from results included KIT digital (-73.5%), Zipcar (-69.2%), Research in Motion (-60.8%), Electronic Arts (-47.1%), and comScore (-33.0%).
The top 10 holdings, which collectively represent 33.2% of the portfolio at the period end, are listed below:
PRIMECAP Odyssey Aggressive Growth Fund Top 10 Holdings as of 10/31/12 | Ending % of Total Portfolio* | |||
Pharmacyclics Inc. | 6.1 | |||
Seattle Genetics Inc. | 4.8 | |||
Roche Holding AG | 4.7 | |||
Google Inc. Cl A | 2.8 | |||
Abiomed Inc. | 2.8 | |||
Stratasys Inc. | 2.6 | |||
Immunogen | 2.6 | |||
Smart Balance Inc. | 2.6 | |||
Adobe Systems Inc. | 2.2 | |||
Conceptus Inc. | 2.0 | |||
Total % of Portfolio | 33.2 | |||
| * | The percentage is calculated by using the ending market value of the security divided by that of the total investments of the fund. |
Outlook
As we enter fiscal 2013, we are more tempered in our optimism for U.S. equities than a year ago. In the near term, despite the recent election, issues regarding fiscal spending, tax policy, and the regulatory environment remain unresolved. The federal “fiscal cliff” and fiscal challenges facing state and local governments as well as those in Europe continue to weigh on the minds of investors.
Despite an increasingly challenged environment for corporate America, we have reasons to be positive on the prospects for U.S. equities. Valuations generally seem reasonable relative to historical standards, especially given the low interest rate environment. Although the S&P 500 is considerably higher than it was a year ago, in our opinion, equities remain preferable to most other asset classes. The dividend yield of the S&P 500 is above 2%, which is still higher than the current yield on the 10-year Treasury bond.
5
Letter to Shareholders
PRIMECAP Odyssey Funds
continued
In the sectors in which the funds have the greatest weightings, we find current valuations compelling. While we expect U.S. economic growth to be modest at best in the near future, many U.S. companies can grow revenues and earnings more rapidly than the growth in domestic GDP through globalization and innovation. Last year, 46% of the revenues for companies in the S&P 500 came from outside the United States. We believe that the long-term growth opportunities in international markets for companies in the information technology, health care, and industrial sectors remain attractive, even if some economies face cyclical growth challenges in the near term.
We also believe that innovation by U.S. companies, particularly by those in the information technology and health care sectors, should result in revenue and earnings growth opportunities not reflected in current expectations. These two sectors represent areas where we believe the United States has a strong competitive advantage relative to the rest of the world. The substantial investment in research and development will, in our opinion, lead to new products and services that improve productivity for businesses and quality of life for consumers.
Furthermore, technology stocks have more cash on their balance sheets as a percentage of market value than any other sector. In our opinion, this cash is a strategic asset that the stock market is dramatically undervaluing. Given the low valuations of many technology stocks and the current inability to earn a return on cash reserves, prudent stewards of capital, when appropriate, are increasingly utilizing excess cash to leverage earnings growth through share repurchases.
In closing, we are certainly disappointed that the funds’ returns have lagged those of the S&P 500 during the past year, but we accept that our long-term orientation and low turnover will not produce returns that exceed the index every year. Our disciplined investment process generally leads us to continue to add to high conviction, out-of-favor positions as they decline. Consequently, if our view of the fundamentals ultimately proves correct, the funds will hold larger positions in these stocks on the way up than on the way down. In our view, this approach is instrumental in seeking to deliver superior long-term relative returns.
Sincerely,
PRIMECAP Management Company
November 19, 2012
Past performance is not a guarantee of future results.
The funds invest in smaller companies, which involve additional risks such as limited liquidity and greater volatility. All funds may invest in foreign securities, which involves greater volatility and political, economic and currency risks and differences in accounting methods. Mutual fund investing involves risk, and loss of principal is possible. Growth stocks typically are more volatile than value stocks; however, value stocks have a lower expected growth rate in earnings and sales.
6
Letter to Shareholders
PRIMECAP Odyssey Funds
continued
Please refer to the Schedule of Investments for details of fund holdings. Fund holdings and sector allocations are subject to change at any time and are not recommendations to buy or sell any security.
The S&P 500 Index is a broad-based index of 500 stocks, which is widely recognized as representative of the market in general. The Russell 1000 Growth Index is an index that measures the performance of those Russell 1000 companies with higher price-to-book ratios and higher forecasted growth values. The Russell Midcap Growth Index measures the performance of those Russell Midcap companies with higher price-to-book ratios and higher forecasted growth values. You cannot invest directly in an index.
The information provided herein represents the opinions of PRIMECAP Management Company and is not intended to be a forecast of future events, a guarantee of future results, or investment advice.
7
|
The following chart compares the value of a hypothetical $10,000 investment in the PRIMECAP Odyssey Stock Fund from November 1, 2004 (inception) to October 31, 2012, compared to the S&P 500 Index. This chart illustrates the performance of a hypothetical $10,000 investment made on the fund’s inception date and is not intended to imply any future performance. The returns shown do not reflect the deduction of taxes that a shareholder would pay on fund distributions or the redemption of fund shares. The chart assumes reinvestment of capital gains and dividends.
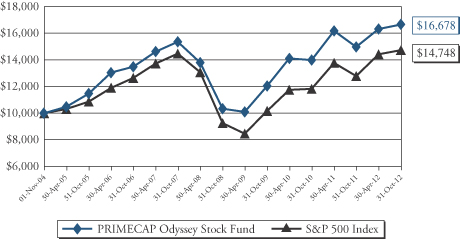
| Total Return Period Ended October 31, 2012 | ||||||||||||
| 1 Year | Annualized 5 Year | Annualized Since Inception^ | ||||||||||
PRIMECAP Odyssey Stock Fund | 11.39% | 1.66% | 6.60% | |||||||||
S&P 500 Index* | 15.21% | 0.36% | 4.98% | |||||||||
Performance data quoted represents past performance and does not guarantee future results. The investment return and principal value of an investment will fluctuate so that an investor’s shares, when redeemed, may be worth more or less than their original cost. Current performance of the fund may be lower or higher than the performance quoted. Performance data current to the most recent month end may be obtained by calling 1-800-729-2307.
| * | The S&P 500 is a market capitalization-weighted index of 500 large-capitalization stocks commonly used to represent the U.S. equity market. |
| ^ | November 1, 2004 |
8
| Performance Graphs |
The following chart compares the value of a hypothetical $10,000 investment in the PRIMECAP Odyssey Growth Fund from November 1, 2004 (inception) to October 31, 2012, compared to the S&P 500 Index. This chart illustrates the performance of a hypothetical $10,000 investment made on the fund’s inception date and is not intended to imply any future performance. The returns shown do not reflect the deduction of taxes that a shareholder would pay on fund distributions or the redemption of fund shares. The chart assumes reinvestment of capital gains and dividends.
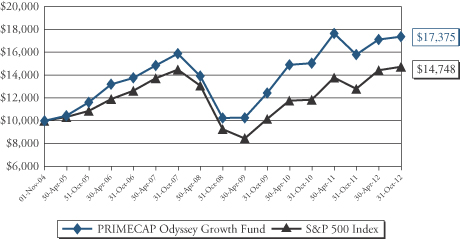
| Total Return Period Ended October 31, 2012 | ||||||||||||
| 1 Year | Annualized 5 Year | Annualized Since Inception^ | ||||||||||
PRIMECAP Odyssey Growth Fund | 9.86% | 1.79% | 7.15% | |||||||||
S&P 500 Index* | 15.21% | 0.36% | 4.98% | |||||||||
Performance data quoted represents past performance and does not guarantee future results. The investment return and principal value of an investment will fluctuate so that an investor’s shares, when redeemed, may be worth more or less than their original cost. Current performance of the fund may be lower or higher than the performance quoted. Performance data current to the most recent month end may be obtained by calling 1-800-729-2307.
| * | The S&P 500 is a market capitalization-weighted index of 500 large-capitalization stocks commonly used to represent the U.S. equity market. |
| ^ | November 1, 2004 |
9
| Performance Graphs |
The following chart compares the value of a hypothetical $10,000 investment in the PRIMECAP Odyssey Aggressive Growth Fund from November 1, 2004 (inception) to October 31, 2012, compared to the S&P 500 Index. This chart illustrates the performance of a hypothetical $10,000 investment made on the fund’s inception date and is not intended to imply any future performance. The returns shown do not reflect the deduction of taxes that a shareholder would pay on fund distributions or the redemption of fund shares. The chart assumes reinvestment of capital gains and dividends.
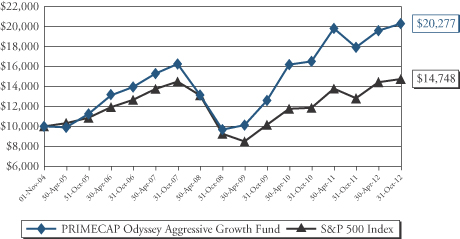
| Total Return Period Ended October 31, 2012 | ||||||||||||
| 1 Year | Annualized 5 Year | Annualized Since Inception^ | ||||||||||
PRIMECAP Odyssey Aggressive Growth Fund | 13.25% | 4.52% | 9.24% | |||||||||
S&P 500 Index* | 15.21% | 0.36% | 4.98% | |||||||||
Performance data quoted represents past performance and does not guarantee future results. The investment return and principal value of an investment will fluctuate so that an investor’s shares, when redeemed, may be worth more or less than their original cost. Current performance of the fund may be lower or higher than the performance quoted. Performance data current to the most recent month end may be obtained by calling 1-800-729-2307.
| * | The S&P 500 is a market capitalization-weighted index of 500 large-capitalization stocks commonly used to represent the U.S. equity market. |
| ^ | November 1, 2004 |
10
| PRIMECAP Odyssey Funds |
PRIMECAP Odyssey Stock Fund
Consumer Discretionary | 9.6% | |||
Consumer Staples | 2.3% | |||
Energy | 5.9% | |||
Financials | 8.5% | |||
Health Care | 27.9% | |||
Industrials | 11.6% | |||
Information Technology | 19.9% | |||
Materials | 4.9% | |||
Utilities | 0.8% | |||
Short-Term Investments and Other Assets | 8.6% | |||
Total | 100.0% |
PRIMECAP Odyssey Growth Fund
Consumer Discretionary | 8.3% | |||
Energy | 3.3% | |||
Financials | 5.5% | |||
Health Care | 41.9% | |||
Industrials | 7.1% | |||
Information Technology | 29.0% | |||
Materials | 1.5% | |||
Short-Term Investments and Other Assets | 3.4% | |||
Total | 100.0% |
The tables above list sector allocations as a percentage of each fund’s total net assets as of October 31, 2012. The management report makes reference to average allocations during the period. As a result, the sector allocations above may differ from those discussed in the management report.
11
Sector Breakdown
PRIMECAP Odyssey Funds
continued
PRIMECAP Odyssey Aggressive Growth Fund
Consumer Discretionary | 7.9% | |||
Consumer Staples | 2.6% | |||
Energy | 3.0% | |||
Financials | 1.5% | |||
Health Care | 38.1% | |||
Industrials | 8.2% | |||
Information Technology | 29.1% | |||
Materials | 1.8% | |||
Short-Term Investments and Other Assets | 7.8% | |||
Total | 100.0% |
The table above lists sector allocations as a percentage of the fund’s total net assets as of October 31, 2012. The management report makes reference to average allocations during the period. As a result, the sector allocations above may differ from those discussed in the management report.
12
| October 31, 2012 |
| Shares | Value | |||||||
| COMMON STOCKS – 91.4% | ||||||||
| Consumer Discretionary – 9.6% | ||||||||
| 188,800 | Ascena Retail Group, Inc. (a) | $ | 3,738,240 | |||||
| 102,600 | Bed Bath & Beyond, Inc. (a) | 5,917,968 | ||||||
| 246,600 | CarMax, Inc. (a) | 8,322,750 | ||||||
| 915,100 | Carnival Corp. | 34,663,988 | ||||||
| 64,500 | DIRECTV (a) | 3,296,595 | ||||||
| 716,300 | Limited Brands, Inc. | 34,303,607 | ||||||
| 115,000 | Macy’s, Inc. | 4,378,050 | ||||||
| 260,200 | Mattel, Inc. | 9,570,156 | ||||||
| 8,100 | Men’s Wearhouse, Inc. (The) | 265,599 | ||||||
| 75,000 | Ross Stores, Inc. | 4,571,250 | ||||||
| 59,900 | Sony Corp. – ADR | 703,226 | ||||||
| 193,400 | TJX Cos., Inc. | 8,051,242 | ||||||
| 275,000 | Walt Disney Co. (The) | 13,494,250 | ||||||
| 147,500 | Whirlpool Corp. | 14,407,800 | ||||||
|
| |||||||
| 145,684,721 | ||||||||
|
| |||||||
| Consumer Staples – 2.3% | ||||||||
| 290,000 | Kellogg Co. | 15,172,800 | ||||||
| 290,000 | PepsiCo, Inc. | 20,079,600 | ||||||
|
| |||||||
| 35,252,400 | ||||||||
|
| |||||||
| Energy – 5.9% | ||||||||
| 333,200 | Cameron International Corp. (a) | 16,873,248 | ||||||
| 95,500 | Cenovus Energy, Inc. | 3,372,105 | ||||||
| 625,200 | Encana Corp. | 14,098,260 | ||||||
| 78,300 | EOG Resources, Inc. | 9,121,167 | ||||||
| 65,000 | Exxon Mobil Corp. | 5,926,050 | ||||||
| 80,000 | Hess Corp. | 4,180,800 | ||||||
| 39,100 | National Oilwell Varco, Inc. | 2,881,670 | ||||||
| 50,000 | Noble Energy, Inc. | 4,750,500 | ||||||
| 458,800 | Petroleo Brasileiro SA – ADR | 9,419,164 | ||||||
| 85,000 | Range Resources Corp. | 5,555,600 | ||||||
| 132,634 | Schlumberger Ltd. | 9,222,042 | ||||||
| 57,600 | Southwestern Energy Co. (a) | 1,998,720 | ||||||
| 45,100 | Transocean Ltd. | 2,060,619 | ||||||
|
| |||||||
| 89,459,945 | ||||||||
|
| |||||||
| Financials – 8.5% | ||||||||
| 105,000 | American Express Co. | 5,876,850 | ||||||
| 3,700,000 | Charles Schwab Corp. (The) | 50,246,000 | ||||||
| 140,000 | Chubb Corp. (The) | 10,777,200 | ||||||
The accompanying notes are an integral part of these financial statements.
13
Schedule of Investments
PRIMECAP Odyssey Stock Fund
October 31, 2012 – continued
| Shares | Value | |||||||
| Financials (continued) | ||||||||
| 100,000 | Comerica, Inc. | $ | 2,981,000 | |||||
| 944,950 | Marsh & McLennan Cos., Inc. | 32,156,648 | ||||||
| 281,600 | Mercury General Corp. | 11,413,248 | ||||||
| 502,200 | Willis Group Holdings PLC | 16,909,074 | ||||||
|
| |||||||
| 130,360,020 | ||||||||
|
| |||||||
| Health Care – 27.9% | ||||||||
| 481,200 | Abbott Laboratories | 31,528,224 | ||||||
| 75,000 | Affymetrix, Inc. (a) | 237,750 | ||||||
| 762,600 | Amgen, Inc. | 65,999,217 | ||||||
| 158,500 | Biogen Idec, Inc. (a) | 21,907,870 | ||||||
| 227,900 | Boston Scientific Corp. (a) | 1,171,406 | ||||||
| 1,070,900 | Eli Lilly & Co. | 52,077,867 | ||||||
| 632,035 | GlaxoSmithKline PLC – ADR | 28,378,372 | ||||||
| 879,100 | Johnson & Johnson | 62,257,862 | ||||||
| 918,800 | Medtronic, Inc. | 38,203,704 | ||||||
| 612,850 | Novartis AG – ADR | 37,052,911 | ||||||
| 342,206 | PerkinElmer, Inc. | 10,584,432 | ||||||
| 367,400 | Roche Holding AG – CHF | 70,655,363 | ||||||
| 100,000 | Sanofi – ADR | 4,385,000 | ||||||
|
| |||||||
| 424,439,978 | ||||||||
|
| |||||||
| Industrials – 11.6% | ||||||||
| 47,600 | Alaska Air Group, Inc. (a) | 1,820,224 | ||||||
| 536,000 | Arkansas Best Corp. | 4,314,800 | ||||||
| 210,900 | Babcock & Wilcox Co. (The) (a) | 5,434,893 | ||||||
| 440,400 | Boeing Co. (The) | 31,021,776 | ||||||
| 120,000 | C.H. Robinson Worldwide, Inc. | 7,239,600 | ||||||
| 25,000 | Caterpillar, Inc. | 2,120,250 | ||||||
| 30,000 | CIRCOR International, Inc. | 1,034,700 | ||||||
| 100,000 | CSX Corp. | 2,047,000 | ||||||
| 158,300 | European Aeronautic Defence and Space Co. N.V. – EUR | 5,623,967 | ||||||
| 201,900 | FedEx Corp. | 18,572,781 | ||||||
| 320,900 | Honeywell International, Inc. | 19,651,916 | ||||||
| 23,500 | JetBlue Airways Corp. (a) | 124,315 | ||||||
| 70,000 | Matson, Inc. | 1,487,500 | ||||||
| 135,000 | Norfolk Southern Corp. | 8,282,250 | ||||||
| 220,000 | PACCAR Inc. | 9,534,800 | ||||||
| 64,300 | Pall Corp. | 4,048,328 | ||||||
| 349,100 | Ritchie Bros. Auctioneers, Inc. | 7,851,259 | ||||||
The accompanying notes are an integral part of these financial statements.
14
Schedule of Investments
PRIMECAP Odyssey Stock Fund
October 31, 2012 – continued
| Shares | Value | |||||||
| Industrials (continued) | ||||||||
| 145,500 | Rockwell Automation, Inc. | $ | 10,339,230 | |||||
| 2,239,200 | Southwest Airlines Co. | 19,749,744 | ||||||
| 20,000 | Union Pacific Corp. | 2,460,600 | ||||||
| 199,200 | United Parcel Service, Inc. – Class B | 14,591,400 | ||||||
|
| |||||||
| 177,351,333 | ||||||||
|
| |||||||
| Information Technology – 19.9% | ||||||||
| 45,650 | Accenture PLC – Class A | 3,077,266 | ||||||
| 160,000 | Activision Blizzard, Inc. | 1,742,400 | ||||||
| 545,500 | Adobe Systems, Inc. (a) | 18,547,000 | ||||||
| 198,100 | Altera Corp. | 6,038,088 | ||||||
| 30,000 | Analog Devices, Inc. | 1,173,300 | ||||||
| 1,328,900 | Applied Materials, Inc. | 14,086,340 | ||||||
| 12,300 | ASML Holding N.V. | 676,131 | ||||||
| 600,000 | Corning, Inc. | 7,050,000 | ||||||
| 300,000 | Diebold, Inc. | 8,925,000 | ||||||
| 416,400 | Electronic Arts, Inc. (a) | 5,142,540 | ||||||
| 81,500 | EMC Corp. (a) | 1,990,230 | ||||||
| 13,000 | Google, Inc. – Class A (a) | 8,837,010 | ||||||
| 80,000 | Hewlett-Packard Co. | 1,108,000 | ||||||
| 350,000 | Intel Corp. | 7,568,750 | ||||||
| 94,700 | Intuit, Inc. | 5,627,074 | ||||||
| 352,000 | KLA-Tencor Corp. | 16,375,040 | ||||||
| 914,700 | L.M. Ericsson Telephone Co. – ADR | 8,131,683 | ||||||
| 5,500 | MasterCard Inc. – Class A | 2,535,115 | ||||||
| 1,802,700 | Microsoft Corp. | 51,440,045 | ||||||
| 16,128 | Motorola Solutions, Inc. | 833,495 | ||||||
| 81,400 | NeuStar, Inc. – Class A (a) | 2,978,426 | ||||||
| 230,000 | NVIDIA Corp. (a) | 2,753,100 | ||||||
| 50,700 | Oracle Corp. | 1,574,235 | ||||||
| 320,000 | QUALCOMM, Inc. | 18,744,000 | ||||||
| 154,100 | Research In Motion Ltd. (a) | 1,222,013 | ||||||
| 616,200 | Symantec Corp. (a) | 11,208,678 | ||||||
| 1,674,800 | Texas Instruments, Inc. | 47,045,132 | ||||||
| 200,000 | Thomson Reuters Corp. | 5,652,000 | ||||||
| 264,700 | Visa, Inc. – Class A | 36,729,772 | ||||||
| 100,000 | Xilinx, Inc. | 3,276,000 | ||||||
| 24,800 | Yahoo!, Inc. (a) | 416,888 | ||||||
|
| |||||||
| 302,504,751 | ||||||||
|
| |||||||
The accompanying notes are an integral part of these financial statements.
15
Schedule of Investments
PRIMECAP Odyssey Stock Fund
October 31, 2012 – continued
| Shares | Value | |||||||
| Materials – 4.9% | ||||||||
| 260,000 | Cabot Corp. | $ | 9,297,600 | |||||
| 40,000 | Dow Chemical Co. (The) | 1,172,000 | ||||||
| 66,000 | E. I. du Pont de Nemours and Co. | 2,938,320 | ||||||
| 25,700 | Freeport-McMoRan Copper & Gold, Inc. | 999,216 | ||||||
| 200,300 | Greif, Inc. – Class A | 8,404,588 | ||||||
| 78,249 | Greif, Inc. – Class B | 3,544,680 | ||||||
| 71,900 | Monsanto Co. | 6,188,433 | ||||||
| 87,300 | Newmont Mining Corp. | 4,762,215 | ||||||
| 157,300 | Potash Corp. of Saskatchewan, Inc. | 6,350,201 | ||||||
| 886,800 | Schweitzer-Mauduit International, Inc. | 31,064,604 | ||||||
|
| |||||||
| 74,721,857 | ||||||||
|
| |||||||
| Utilities – 0.8% | ||||||||
| 372,379 | Public Service Enterprise Group, Inc. | 11,931,023 | ||||||
|
| |||||||
| TOTAL COMMON STOCKS | $ | 1,391,706,028 | |||||
|
| |||||||
| SHORT-TERM INVESTMENTS – 8.5% | ||||||||
| 129,603,233 | Dreyfus Treasury Prime Cash Management Fund | 129,603,233 | ||||||
|
| |||||||
| TOTAL SHORT-TERM INVESTMENTS | 129,603,233 | ||||||
|
| |||||||
| TOTAL INVESTMENTS – 99.9% | 1,521,309,261 | ||||||
| Other Assets in Excess of Liabilities – 0.1% | 892,085 | ||||||
|
| |||||||
| TOTAL NET ASSETS – 100.0% | $ | 1,522,201,346 | |||||
|
| |||||||
ADR – American Depository Receipt
CHF – Swiss Francs
EUR – Euros
| (a) | Non-Income Producing |
The Global Industry Classification Standard (GICS®) was developed by and is the exclusive property of MSCI Inc. and Standard & Poor’s Financial Services LLC (“S&P”). GICS is a service mark of MSCI and S&P and has been licensed for use by PRIMECAP Management Company.
The accompanying notes are an integral part of these financial statements.
16
| Schedule of Investments October 31, 2012 |
| Shares | Value | |||||||
| COMMON STOCKS – 96.6% | ||||||||
| Consumer Discretionary – 8.3% | ||||||||
| 60,100 | Ascena Retail Group, Inc. (a) | $ | 1,189,980 | |||||
| 222,800 | Bed Bath & Beyond, Inc. (a) | 12,851,104 | ||||||
| 847,200 | CarMax, Inc. (a) | 28,593,000 | ||||||
| 737,846 | Carnival Corp. | 27,949,606 | ||||||
| 10,000 | Deckers Outdoor Corp. (a) | 286,300 | ||||||
| 161,800 | DIRECTV (a) | 8,269,598 | ||||||
| 1,233,000 | DreamWorks Animation SKG, Inc. – Class A (a) | 25,116,210 | ||||||
| 915,000 | Limited Brands, Inc. | 43,819,350 | ||||||
| 416,000 | Mattel, Inc. | 15,300,480 | ||||||
| 100,000 | Royal Caribbean Cruises Ltd. | 3,367,000 | ||||||
| 240,000 | Shutterfly, Inc. (a) | 7,262,400 | ||||||
| 239,400 | Sony Corp. – ADR | 2,810,556 | ||||||
| 126,000 | TJX Cos., Inc. | 5,245,380 | ||||||
|
| |||||||
| 182,060,964 | ||||||||
|
| |||||||
| Energy – 3.3% | ||||||||
| 140,000 | Cenovus Energy, Inc. | 4,943,400 | ||||||
| 130,000 | Encana Corp. | 2,931,500 | ||||||
| 117,000 | EOG Resources, Inc. | 13,629,330 | ||||||
| 100,000 | Hess Corp. | 5,226,000 | ||||||
| 74,200 | National Oilwell Varco, Inc. | 5,468,540 | ||||||
| 80,000 | Noble Energy, Inc. | 7,600,800 | ||||||
| 70,000 | Oceaneering International, Inc. | 3,663,100 | ||||||
| 187,900 | Petroleo Brasileiro SA – ADR | 3,857,587 | ||||||
| 130,000 | Range Resources Corp. | 8,496,800 | ||||||
| 169,800 | Schlumberger Ltd. | 11,806,194 | ||||||
| 156,800 | Southwestern Energy Co. (a) | 5,440,960 | ||||||
|
| |||||||
| 73,064,211 | ||||||||
|
| |||||||
| Financials – 5.5% | ||||||||
| 200,000 | Berkshire Hathaway, Inc. – Class B (a) | 17,270,000 | ||||||
| 4,000,000 | Charles Schwab Corp. (The) | 54,320,000 | ||||||
| 200,000 | Chubb Corp. (The) | 15,396,000 | ||||||
| 1,000,700 | Marsh & McLennan Cos., Inc. | 34,053,821 | ||||||
|
| |||||||
| 121,039,821 | ||||||||
|
| |||||||
| Health Care – 41.9% | ||||||||
| 1,735,500 | Abiomed, Inc. (a) | 34,397,610 | ||||||
| 3,139,300 | Accuray, Inc. (a) | 21,849,528 | ||||||
| 564,200 | Affymetrix, Inc. (a) | 1,788,514 | ||||||
| 1,442,200 | Amgen, Inc. | 124,815,199 | ||||||
The accompanying notes are an integral part of these financial statements.
17
Schedule of Investments
PRIMECAP Odyssey Growth Fund
October 31, 2012 – continued
| Shares | Value | |||||||
| Health Care (continued) | ||||||||
| 442,500 | Biogen Idec, Inc. (a) | $ | 61,162,350 | |||||
| 298,200 | BioMarin Pharmaceutical, Inc. (a) | 11,045,328 | ||||||
| 611,500 | Boston Scientific Corp. (a) | 3,143,110 | ||||||
| 885,100 | Cepheid, Inc. (a) | 26,827,381 | ||||||
| 118,700 | Charles River Laboratories International, Inc. (a) | 4,429,884 | ||||||
| 2,293,728 | Conceptus, Inc. (a) (b) | 43,213,835 | ||||||
| 450,000 | Dendreon Corp. (a) | 1,710,000 | ||||||
| 1,051,400 | Eli Lilly & Co. | 51,129,582 | ||||||
| 81,000 | GlaxoSmithKline PLC – ADR | 3,636,900 | ||||||
| 463,400 | Illumina, Inc. (a) | 22,016,134 | ||||||
| 5,855,100 | ImmunoGen, Inc. (a) (b) | 64,874,508 | ||||||
| 289,300 | Insulet Corp. (a) | 6,136,053 | ||||||
| 250,000 | InterMune, Inc. (a) | 1,987,500 | ||||||
| 576,200 | Johnson & Johnson | 40,806,484 | ||||||
| 548,100 | Life Technologies Corp. (a) | 26,807,571 | ||||||
| 890,300 | Medtronic, Inc. | 37,018,674 | ||||||
| 300,000 | Momenta Pharmaceuticals, Inc. (a) | 3,804,000 | ||||||
| 4,405,056 | Nektar Therapeutics (a) | 39,645,504 | ||||||
| 538,750 | Novartis AG – ADR | 32,572,825 | ||||||
| 145,000 | NuVasive, Inc. (a) | 2,090,900 | ||||||
| 433,000 | OraSure Technologies, Inc. (a) | 3,922,980 | ||||||
| 48,400 | PerkinElmer, Inc. | 1,497,012 | ||||||
| 911,314 | QIAGEN N.V. (a) | 15,902,430 | ||||||
| 586,500 | Roche Holding AG – CHF | 112,790,884 | ||||||
| 4,581,400 | Seattle Genetics, Inc. (a) | 115,268,024 | ||||||
| 68,500 | Waters Corp. (a) | 5,603,985 | ||||||
|
| |||||||
| 921,894,689 | ||||||||
|
| |||||||
| Industrials – 7.1% | ||||||||
| 498,400 | AECOM Technology Corp. (a) | 10,700,648 | ||||||
| 290,000 | Babcock & Wilcox Co. (The) (a) | 7,473,300 | ||||||
| 415,800 | C.H. Robinson Worldwide, Inc. | 25,085,214 | ||||||
| 133,600 | Caterpillar, Inc. | 11,330,616 | ||||||
| 10,000 | CIRCOR International, Inc. | 344,900 | ||||||
| 296,000 | European Aeronautic Defence and Space Co. N.V. – EUR | 10,516,072 | ||||||
| 399,400 | Expeditors International Washington, Inc. | 14,622,034 | ||||||
| 40,900 | FedEx Corp. | 3,762,391 | ||||||
| 90,000 | IDEX Corp. | 3,827,700 | ||||||
| 42,000 | Jacobs Engineering Group, Inc. (a) | 1,620,780 | ||||||
The accompanying notes are an integral part of these financial statements.
18
Schedule of Investments
PRIMECAP Odyssey Growth Fund
October 31, 2012 – continued
| Shares | Value | |||||||
| Industrials (continued) | ||||||||
| 1,227,550 | JetBlue Airways Corp. (a) | $ | 6,493,740 | |||||
| 107,800 | Pall Corp. | 6,787,088 | ||||||
| 489,000 | Ritchie Bros. Auctioneers, Inc. | 10,997,610 | ||||||
| 33,100 | Rockwell Automation, Inc. | 2,352,086 | ||||||
| 2,673,200 | Southwest Airlines Co. | 23,577,624 | ||||||
| 150,000 | United Continental Holdings, Inc. (a) | 2,881,500 | ||||||
| 196,000 | United Parcel Service, Inc – Class B | 14,357,000 | ||||||
|
| |||||||
| 156,730,303 | ||||||||
|
| |||||||
| Information Technology – 29.0% | ||||||||
| 57,850 | Accenture Ltd. – Class A | 3,899,668 | ||||||
| 1,530,900 | Adobe Systems, Inc. (a) | 52,050,600 | ||||||
| 1,001,700 | Altera Corp. | 30,531,816 | ||||||
| 469,700 | Applied Materials, Inc. | 4,978,820 | ||||||
| 83,600 | ASML Holding N.V. | 4,595,492 | ||||||
| 350,000 | Corning, Inc. | 4,112,500 | ||||||
| 671,000 | Cree, Inc. (a) | 20,351,430 | ||||||
| 197,500 | Cymer, Inc. (a) | 15,738,775 | ||||||
| 1,867,200 | Electronic Arts, Inc. (a) | 23,059,920 | ||||||
| 805,700 | EMC Corp. (a) | 19,675,194 | ||||||
| 3,118,000 | Flextronics International Ltd. (a) | 17,990,860 | ||||||
| 738,618 | FormFactor, Inc. (a) | 3,368,098 | ||||||
| 82,080 | Google, Inc. – Class A (a) | 55,795,522 | ||||||
| 90,000 | Hewlett-Packard Co. | 1,246,500 | ||||||
| 250,700 | Intel Corp. | 5,421,388 | ||||||
| 105,000 | Intuit, Inc. | 6,239,100 | ||||||
| 230,000 | Jabil Circuit, Inc. | 3,988,200 | ||||||
| 300,000 | KLA-Tencor Corp. | 13,956,000 | ||||||
| 1,247,800 | L.M. Ericsson Telephone Co. – ADR | 11,092,942 | ||||||
| 5,500 | MasterCard, Inc. – Class A | 2,535,115 | ||||||
| 725,000 | Micron Technology, Inc. (a) | 3,933,125 | ||||||
| 1,740,600 | Microsoft Corp. | 49,668,021 | ||||||
| 35,128 | Motorola Solutions, Inc. | 1,815,415 | ||||||
| 359,811 | NetApp, Inc. (a) | 9,678,916 | ||||||
| 195,900 | NeuStar, Inc. – Class A (a) | 7,167,981 | ||||||
| 1,928,900 | Nuance Communications, Inc. (a) | 42,937,314 | ||||||
| 399,200 | NVIDIA Corp. (a) | 4,778,424 | ||||||
| 460,000 | QUALCOMM, Inc. | 26,944,500 | ||||||
| 160,000 | Rambus, Inc. (a) | 774,400 | ||||||
| 722,450 | Research In Motion Ltd. (a) | 5,729,028 | ||||||
The accompanying notes are an integral part of these financial statements.
19
Schedule of Investments
PRIMECAP Odyssey Growth Fund
October 31, 2012 – continued
| Shares | Value | |||||||
| Information Technology (continued) | ||||||||
| 431,400 | SanDisk Corp. (a) | $ | 18,015,264 | |||||
| 797,900 | Stratasys, Inc. (a) | 53,195,993 | ||||||
| 736,400 | Symantec Corp. (a) | 13,395,116 | ||||||
| 1,187,500 | Texas Instruments, Inc. | 33,356,875 | ||||||
| 335,000 | Trimble Navigation Ltd. (a) | 15,805,300 | ||||||
| 330,000 | Visa, Inc. – Class A | 45,790,800 | ||||||
| 30 | Workday, Inc. – Class A (a) | 1,455 | ||||||
| 120,000 | Xilinx, Inc. | 3,931,200 | ||||||
|
| |||||||
| 637,547,067 | ||||||||
|
| |||||||
| Materials – 1.5% | ||||||||
| 317,500 | Monsanto Co. | 27,327,225 | ||||||
| 102,600 | Potash Corp. of Saskatchewan, Inc. | 4,141,962 | ||||||
| 18,000 | Praxair, Inc. | 1,911,780 | ||||||
|
| |||||||
| 33,380,967 | ||||||||
|
| |||||||
| TOTAL COMMON STOCKS | $ | 2,125,718,022 | |||||
|
| |||||||
| SHORT-TERM INVESTMENTS – 3.3% | ||||||||
| 73,151,815 | Dreyfus Treasury Prime Cash Management Fund | 73,151,815 | ||||||
|
| |||||||
| TOTAL SHORT-TERM INVESTMENTS | 73,151,815 | ||||||
|
| |||||||
| TOTAL INVESTMENTS – 99.9% | 2,198,869,837 | ||||||
| Other Assets in Excess of Liabilities – 0.1% | 3,027,025 | ||||||
|
| |||||||
| TOTAL NET ASSETS – 100.0% | $ | 2,201,896,862 | |||||
|
| |||||||
ADR – American Depository Receipt
CHF – Swiss Francs
EUR – Euros
| (a) | Non-Income Producing |
| (b) | Considered an affiliated company of the fund as the fund owns 5% or more of the outstanding voting securities of such company. |
The Global Industry Classification Standard (GICS®) was developed by and is the exclusive property of MSCI Inc. and Standard & Poor’s Financial Services LLC (“S&P”). GICS is a service mark of MSCI and S&P and has been licensed for use by PRIMECAP Management Company.
The accompanying notes are an integral part of these financial statements.
20
| Schedule of Investments PRIMECAP Odyssey Aggressive Growth Fund October 31, 2012 |
| Shares | Value | |||||||
| COMMON STOCKS – 92.2% | ||||||||
| Consumer Discretionary – 7.9% | ||||||||
| 15,000 | Amazon.com, Inc. (a) | $ | 3,492,300 | |||||
| 198,000 | Ascena Retail Group, Inc. (a) | 3,920,400 | ||||||
| 392,102 | Callaway Golf Co. | 2,140,877 | ||||||
| 518,400 | CarMax, Inc. (a) | 17,496,000 | ||||||
| 74,700 | DIRECTV (a) | 3,817,917 | ||||||
| 1,537,100 | DreamWorks Animation SKG, Inc. – Class A (a) | 31,310,727 | ||||||
| 2,200 | Five Below, Inc. (a) | 72,908 | ||||||
| 752,000 | Royal Caribbean Cruises Ltd. | 25,319,840 | ||||||
| 896,300 | Shutterfly, Inc. (a) | 27,122,038 | ||||||
| 277,590 | Tesla Motors, Inc. (a) | 7,808,607 | ||||||
|
| |||||||
| 122,501,614 | ||||||||
|
| |||||||
| Consumer Staples – 2.6% | ||||||||
| 2,700 | Chefs’ Warehouse Holdings, Inc. (The) (a) | 41,688 | ||||||
| 3,313,405 | Smart Balance, Inc. (a) (b) | 39,429,519 | ||||||
|
| |||||||
| 39,471,207 | ||||||||
|
| |||||||
| Energy – 3.0% | ||||||||
| 270,200 | Cabot Oil & Gas Corp. | 12,693,996 | ||||||
| 60,000 | EOG Resources, Inc. | 6,989,400 | ||||||
| 80,500 | National Oilwell Varco, Inc. | 5,932,850 | ||||||
| 117,800 | Range Resources Corp. | 7,699,408 | ||||||
| 958,400 | Rex Energy Corp. (a) | 12,689,216 | ||||||
|
| |||||||
| 46,004,870 | ||||||||
|
| |||||||
| Financials – 1.5% | ||||||||
| 605,820 | MarketAxess Holdings, Inc. | 18,925,817 | ||||||
| 139,400 | MSCI, Inc. (a) | 3,755,436 | ||||||
|
| |||||||
| 22,681,253 | ||||||||
|
| |||||||
| Health Care – 38.1% | ||||||||
| 2,151,673 | Abiomed, Inc. (a) (b) | 42,646,159 | ||||||
| 2,993,300 | Accuray, Inc. (a) | 20,833,368 | ||||||
| 688,200 | Affymetrix, Inc. (a) | 2,181,594 | ||||||
| 205,200 | Biogen Idec, Inc. (a) | 28,362,744 | ||||||
| 592,800 | BioMarin Pharmaceutical, Inc. (a) | 21,957,312 | ||||||
| 672,100 | Boston Scientific Corp. (a) | 3,454,594 | ||||||
| 847,600 | Cardica, Inc. (a) | 1,135,784 | ||||||
| 957,600 | Cepheid, Inc. (a) | 29,024,856 | ||||||
| 14,000 | Charles River Laboratories International, Inc. (a) | 522,480 | ||||||
| 1,669,750 | Conceptus, Inc. (a) (b) | 31,458,090 | ||||||
| 692,000 | Dendreon Corp. (a) | 2,629,600 | ||||||
The accompanying notes are an integral part of these financial statements.
21
Schedule of Investments
PRIMECAP Odyssey Aggressive Growth Fund
October 31, 2012 – continued
| Shares | Value | |||||||
| Health Care (continued) | ||||||||
| 5,866,100 | Dyax Corp. (a) (b) | $ | 17,598,300 | |||||
| 645,200 | Fluidigm Corp. (a) | 9,736,068 | ||||||
| 112,000 | Illumina, Inc. (a) | 5,321,120 | ||||||
| 3,627,417 | ImmunoGen, Inc. (a) | 40,191,780 | ||||||
| 732,300 | Insulet Corp. (a) | 15,532,083 | ||||||
| 1,457,200 | InterMune, Inc. (a) | 11,584,740 | ||||||
| 827,838 | Luminex Corp. (a) | 13,311,634 | ||||||
| 437,500 | Momenta Pharmaceuticals, Inc. (a) | 5,547,500 | ||||||
| 2,767,000 | Nektar Therapeutics (a) | 24,903,000 | ||||||
| 255,000 | NuVasive, Inc. (a) | 3,677,100 | ||||||
| 1,582,600 | OraSure Technologies, Inc. (a) | 14,338,356 | ||||||
| 1,529,939 | Pharmacyclics, Inc. (a) | 93,433,375 | ||||||
| 113,000 | QIAGEN N.V. (a) | 1,971,850 | ||||||
| 377,400 | Roche Holding AG – CHF | 72,578,482 | ||||||
| 2,917,500 | Seattle Genetics, Inc. (a) | 73,404,300 | ||||||
| 5,600 | SurModics, Inc. (a) | 100,688 | ||||||
| 74,000 | XenoPort, Inc. (a) | 609,020 | ||||||
|
| |||||||
| 588,045,977 | ||||||||
|
| |||||||
| Industrials – 8.2% | ||||||||
| 390,000 | Alaska Air Group, Inc. (a) | 14,913,600 | ||||||
| 528,800 | Arkansas Best Corp. | 4,256,840 | ||||||
| 107,900 | C.H. Robinson Worldwide, Inc. | 6,509,607 | ||||||
| 252,000 | CIRCOR International, Inc. | 8,691,480 | ||||||
| 43,800 | Colfax Corp. (a) | 1,506,282 | ||||||
| 607,200 | Delta Air Lines, Inc. (a) | 5,847,336 | ||||||
| 16,000 | Expeditors International of Washington, Inc. | 585,760 | ||||||
| 3,259,525 | JetBlue Airways Corp. (a) | 17,242,887 | ||||||
| 82,600 | Pall Corp. | 5,200,496 | ||||||
| 584,200 | Polypore International, Inc. (a) | 20,610,576 | ||||||
| 293,100 | Ritchie Bros. Auctioneers, Inc. | 6,591,819 | ||||||
| 56,000 | RPX Corp. (a) | 589,680 | ||||||
| 907,000 | Southwest Airlines Co. | 7,999,740 | ||||||
| 47,000 | Spirit Airlines, Inc. (a) | 824,850 | ||||||
| 755,000 | United Continental Holdings, Inc. (a) | 14,503,550 | ||||||
| 234,000 | US Airways Group, Inc. (a) | 2,850,120 | ||||||
| 325,000 | Vitran Corp, Inc. (a) | 1,699,750 | ||||||
| 830,738 | Zipcar, Inc. (a) | 5,208,728 | ||||||
|
| |||||||
| 125,633,101 | ||||||||
|
| |||||||
The accompanying notes are an integral part of these financial statements.
22
Schedule of Investments
PRIMECAP Odyssey Aggressive Growth Fund
October 31, 2012 – continued
| Shares | Value | |||||||
| Information Technology – 29.1% | ||||||||
| 25,000 | 3D Systems Corp. (a) | $ | 1,087,500 | |||||
| 1,711,500 | Active Network, Inc. (a) | 15,163,890 | ||||||
| 992,000 | Adobe Systems, Inc. (a) | 33,728,000 | ||||||
| 80,000 | Akamai Technologies, Inc. (a) | 3,039,200 | ||||||
| 505,100 | Altera Corp. | 15,395,448 | ||||||
| 20,000 | Applied Materials, Inc. | 212,000 | ||||||
| 192,600 | ASML Holding N.V. | 10,587,222 | ||||||
| 46,100 | Audience, Inc. (a) | 346,902 | ||||||
| 1,723,200 | comScore, Inc. (a) | 24,417,744 | ||||||
| 507,200 | Cree, Inc. (a) | 15,383,376 | ||||||
| 225,000 | Cymer, Inc. (a) | 17,930,250 | ||||||
| 1,214,000 | Electronic Arts, Inc. (a) | 14,992,900 | ||||||
| 475,000 | EMC Corp. (a) | 11,599,500 | ||||||
| 93,231 | ExactTarget, Inc. (a) | 2,174,147 | ||||||
| 354,200 | FARO Technologies, Inc. (a) | 14,238,840 | ||||||
| 302,700 | FEI Co. | 16,663,635 | ||||||
| 716,300 | FormFactor, Inc. (a) | 3,266,328 | ||||||
| 64,090 | Google, Inc. – Class A (a) | 43,566,459 | ||||||
| 1,402,100 | Guidance Software, Inc. (a) (b) | 17,077,578 | ||||||
| 39,500 | hiSoft Technology International Ltd. – ADR (a) | 410,405 | ||||||
| 275,000 | Intuit, Inc. | 16,340,500 | ||||||
| 184,000 | iSoftStone Holdings Ltd. – ADR (a) | 881,360 | ||||||
| 250,000 | Jabil Circuit, Inc. | 4,335,000 | ||||||
| 894,500 | KIT digital, Inc. (a) | 2,486,710 | ||||||
| 373,300 | KLA-Tencor Corp. | 17,365,916 | ||||||
| 800,000 | Micron Technology, Inc. (a) | 4,340,000 | ||||||
| 420,000 | Monster Worldwide, Inc. (a) | 2,612,400 | ||||||
| 331,900 | NetApp, Inc. (a) | 8,928,110 | ||||||
| 150,798 | NeuStar, Inc. – Class A (a) | 5,517,699 | ||||||
| 855,900 | Nuance Communications, Inc. (a) | 19,052,334 | ||||||
| 169,400 | NVIDIA Corp. (a) | 2,027,718 | ||||||
| 13,700 | Peregrine Semiconductor Corp. (a) | 242,627 | ||||||
| 76,500 | QUALCOMM, Inc. | 4,480,988 | ||||||
| 140,000 | Rambus, Inc. (a) | 677,600 | ||||||
| 602,900 | Research In Motion Ltd. (a) | 4,780,997 | ||||||
| 1,732 | Responsys, Inc. (a) | 15,484 | ||||||
| 409,800 | SanDisk Corp. (a) | 17,113,248 | ||||||
| 344,091 | SMART Technologies, Inc. – Class A (a) | 467,964 | ||||||
| 603,700 | Stratasys, Inc. (a) | 40,248,679 | ||||||
The accompanying notes are an integral part of these financial statements.
23
Schedule of Investments
PRIMECAP Odyssey Aggressive Growth Fund
October 31, 2012 – continued
| Shares | Value | |||||||
| Information Technology (continued) | ||||||||
| 329,900 | Symantec Corp. (a) | $ | 6,000,881 | |||||
| 336,600 | Trimble Navigation Ltd. (a) | 15,880,788 | ||||||
| 40,000 | VanceInfo Technologies, Inc. – ADR (a) | 304,800 | ||||||
| 1,000 | VMware, Inc. – Class A (a) | 84,770 | ||||||
| 969,600 | Websense, Inc. (a) | 12,818,112 | ||||||
| 60,000 | Yahoo!, Inc. (a) | 1,008,600 | ||||||
|
| |||||||
| 449,294,609 | ||||||||
|
| |||||||
| Materials – 1.8% | ||||||||
| 272,300 | Monsanto Co. | 23,436,861 | ||||||
| 94,100 | Potash Corp. of Saskatchewan, Inc. | 3,798,817 | ||||||
|
| |||||||
| 27,235,678 | ||||||||
|
| |||||||
| TOTAL COMMON STOCKS | $ | 1,420,868,309 | |||||
|
| |||||||
| SHORT-TERM INVESTMENTS – 7.6% | ||||||||
| 117,365,151 | Dreyfus Treasury Prime Cash Management Fund | 117,365,151 | ||||||
|
| |||||||
| TOTAL SHORT-TERM INVESTMENTS | 117,365,151 | ||||||
|
| |||||||
| TOTAL INVESTMENTS – 99.8% | 1,538,233,460 | ||||||
| Assets in Excess of Other Liabilities – 0.2% | 3,218,008 | ||||||
|
| |||||||
| TOTAL NET ASSETS – 100.0% | $ | 1,541,451,468 | |||||
|
| |||||||
ADR – American Depository Receipt
CHF – Swiss Francs
| (a) | Non-Income Producing |
| (b) | Considered an affiliated company of the fund as the fund owns 5% or more of the outstanding voting securities of such company. |
The Global Industry Classification Standard (GICS®) was developed by and is the exclusive property of MSCI Inc. and Standard & Poor’s Financial Services LLC (“S&P”). GICS is a service mark of MSCI and S&P and has been licensed for use by PRIMECAP Management Company.
The accompanying notes are an integral part of these financial statements.
24
| Statements of Assets and Liabilities PRIMECAP Odyssey Funds October 31, 2012 |
| PRIMECAP Odyssey Stock Fund | PRIMECAP Odyssey Growth Fund | PRIMECAP Odyssey Aggressive Growth Fund | ||||||||||
ASSETS | ||||||||||||
Investments, at cost | $ | 1,323,123,974 | $ | 1,822,925,256 | $ | 1,253,931,151 | ||||||
|
|
|
|
|
| |||||||
Investments, at value (unaffiliated) | $ | 1,521,309,261 | $ | 2,090,781,494 | $ | 1,390,023,814 | ||||||
Investments, at value (affiliated) | — | 108,088,343 | 148,209,646 | |||||||||
Receivable for securities sold | — | 4,226,058 | 482,742 | |||||||||
Receivable for dividends and interest | 1,934,031 | 2,372,107 | 1,074,208 | |||||||||
Receivable for fund shares sold | 4,620,314 | 4,388,875 | 5,426,233 | |||||||||
Prepaid expenses and other assets | 20,427 | 31,171 | 24,059 | |||||||||
|
|
|
|
|
| |||||||
Total assets | 1,527,884,033 | 2,209,888,048 | 1,545,240,702 | |||||||||
|
|
|
|
|
| |||||||
| LIABILITIES | ||||||||||||
Payable for securities purchased | 2,561,320 | 586,781 | 186,853 | |||||||||
Payable for fund shares repurchased | 652,699 | 3,637,433 | 1,068,217 | |||||||||
Payable to the advisor (Note 6) | 2,061,173 | 3,098,102 | 2,119,420 | |||||||||
Other accrued expenses & liabilities | 407,495 | 668,870 | 414,744 | |||||||||
|
|
|
|
|
| |||||||
Total liabilities | 5,682,687 | 7,991,186 | 3,789,234 | |||||||||
|
|
|
|
|
| |||||||
NET ASSETS | $ | 1,522,201,346 | $ | 2,201,896,862 | $ | 1,541,451,468 | ||||||
|
|
|
|
|
| |||||||
Number of shares issued and outstanding (unlimited shares authorized, $0.01 par value) | 96,638,419 | 130,856,379 | 81,752,723 | |||||||||
|
|
|
|
|
| |||||||
NET ASSET VALUE, OFFERING AND REDEMPTION PRICE PER SHARE | $ | 15.75 | $ | 16.83 | $ | 18.86 | ||||||
|
|
|
|
|
| |||||||
| COMPONENTS OF NET ASSETS | ||||||||||||
Paid-in capital | $ | 1,325,478,423 | $ | 1,824,349,544 | $ | 1,258,171,114 | ||||||
Undistributed net investment income/(Accumulated net losses) | 16,330,713 | 8,607,982 | (807,083 | ) | ||||||||
Accumulated net realized loss | (17,801,356 | ) | (7,030,158 | ) | (221,297 | ) | ||||||
Net unrealized appreciation | 198,193,566 | 375,969,494 | 284,308,734 | |||||||||
|
|
|
|
|
| |||||||
Net assets | $ | 1,522,201,346 | $ | 2,201,896,862 | $ | 1,541,451,468 | ||||||
|
|
|
|
|
| |||||||
The accompanying notes are an integral part of these financial statements.
25
| PRIMECAP Odyssey Funds For the Year Ended October 31, 2012 |
| PRIMECAP Odyssey Stock Fund | PRIMECAP Odyssey Growth Fund | PRIMECAP Odyssey Aggressive Growth Fund | ||||||||||
INVESTMENT INCOME | ||||||||||||
Income | ||||||||||||
Dividends1 | $ | 28,066,819 | $ | 25,159,389 | $ | 4,690,051 | ||||||
Interest income | 35 | 29 | 27 | |||||||||
|
|
|
|
|
| |||||||
Total income | 28,066,854 | 25,159,418 | 4,690,078 | |||||||||
|
|
|
|
|
| |||||||
Expenses | ||||||||||||
Advisory fees | 6,987,965 | 11,438,016 | 7,240,088 | |||||||||
Shareholder servicing | 424,974 | 1,053,778 | 651,024 | |||||||||
Fund administration and accounting | 494,083 | 802,319 | 509,780 | |||||||||
Custody | 124,678 | 178,634 | 125,971 | |||||||||
Professional fees | 55,461 | 55,523 | 55,513 | |||||||||
Registration fees | 29,955 | 63,680 | 60,725 | |||||||||
Trustee fees | 28,314 | 28,397 | 28,314 | |||||||||
Printing and mailing | 80,136 | 151,305 | 101,693 | |||||||||
Other | 93,636 | 54,314 | 56,563 | |||||||||
|
|
|
|
|
| |||||||
Total expenses | 8,319,202 | 13,825,966 | 8,829,671 | |||||||||
|
|
|
|
|
| |||||||
Net investment income (loss) | 19,747,652 | 11,333,452 | (4,139,593 | ) | ||||||||
|
|
|
|
|
| |||||||
| REALIZED AND UNREALIZED GAIN (LOSS) ON INVESTMENTS AND FOREIGN CURRENCY | ||||||||||||
Net realized gain (loss) on: | ||||||||||||
Investments2 | 6,127,327 | (2,307,323 | ) | 3,170,833 | ||||||||
Foreign currency transactions | (11,753 | ) | (23,518 | ) | (14,797 | ) | ||||||
Change in net unrealized appreciation/depreciation on: | ||||||||||||
Investments | 107,056,223 | 182,472,562 | 152,996,462 | |||||||||
Foreign currency translations | (35,876 | ) | (67,492 | ) | (41,027 | ) | ||||||
|
|
|
|
|
| |||||||
Net realized and unrealized gain on investments and foreign currency | 113,135,921 | 180,074,229 | 156,111,471 | |||||||||
|
|
|
|
|
| |||||||
| NET INCREASE IN NET ASSETS RESULTING FROM OPERATIONS | $ | 132,883,573 | $ | 191,407,681 | $ | 151,971,878 | ||||||
|
|
|
|
|
| |||||||
| 1 | Net of foreign taxes withheld of $794,578, $1,066,064, and $421,752, respectively. |
| 2 | Includes net realized gain on sales of affiliated companies of $0, $7,018,751, and $60,462, respectively. |
The accompanying notes are an integral part of these financial statements.
26
|
| Year Ended October 31, 2012 | Year Ended October 31, 2011 | |||||||
INCREASE (DECREASE) IN NET ASSETS FROM: | ||||||||
OPERATIONS | ||||||||
Net investment income | $ | 19,747,652 | $ | 9,828,222 | ||||
Net realized gain (loss) on: | ||||||||
Investments | 6,127,327 | 8,833,830 | ||||||
Foreign currency transactions | (11,753 | ) | (5,762 | ) | ||||
Change in net unrealized appreciation/depreciation on: | ||||||||
Investments | 107,056,223 | 37,786,162 | ||||||
Foreign currency translations | (35,876 | ) | 29,831 | |||||
|
|
|
| |||||
Net increase in net assets resulting from operations | 132,883,573 | 56,472,283 | ||||||
|
|
|
| |||||
| DISTRIBUTIONS TO SHAREHOLDERS FROM NET INVESTMENT INCOME | (12,241,758 | ) | (5,099,941 | ) | ||||
|
|
|
| |||||
| CAPITAL SHARE TRANSACTIONS | ||||||||
Proceeds from shares sold | 673,497,259 | 492,192,375 | ||||||
Proceeds from reinvestment of distributions | 9,899,513 | 4,774,772 | ||||||
Cost of shares repurchased | (186,121,894 | ) | (251,163,250 | ) | ||||
Redemption fee proceeds | 33,331 | 15,527 | ||||||
|
|
|
| |||||
Net increase from capital share transactions | 497,308,209 | 245,819,424 | ||||||
|
|
|
| |||||
Total increase in net assets | 617,950,024 | 297,191,766 | ||||||
|
|
|
| |||||
| NET ASSETS | ||||||||
Beginning of year | 904,251,322 | 607,059,556 | ||||||
|
|
|
| |||||
End of year (includes undistributed net investment income of $16,330,713 and $8,872,391, respectively) | $ | 1,522,201,346 | $ | 904,251,322 | ||||
|
|
|
| |||||
| CHANGE IN CAPITAL SHARES | ||||||||
Shares outstanding, beginning of year | 63,147,115 | 45,027,268 | ||||||
|
|
|
| |||||
Shares sold | 45,089,741 | 34,887,757 | ||||||
Shares issued on reinvestment of distributions | 711,172 | 341,543 | ||||||
Shares repurchased | (12,309,609 | ) | (17,109,453 | ) | ||||
|
|
|
| |||||
Net increase in capital shares | 33,491,304 | 18,119,847 | ||||||
|
|
|
| |||||
Shares outstanding, end of year | 96,638,419 | 63,147,115 | ||||||
|
|
|
| |||||
The accompanying notes are an integral part of these financial statements.
27
| Statement of Changes in Net Assets |
| Year Ended October 31, 2012 | Year Ended October 31, 2011 | |||||||
INCREASE (DECREASE) IN NET ASSETS FROM: | ||||||||
OPERATIONS | ||||||||
Net investment income | $ | 11,333,452 | $ | 4,680,015 | ||||
Net realized gain (loss) on: | ||||||||
Investments | (2,307,323 | ) | 20,610,429 | |||||
Foreign currency transactions | (23,518 | ) | (10,487 | ) | ||||
Change in net unrealized appreciation/depreciation on: | ||||||||
Investments | 182,472,562 | 35,839,872 | ||||||
Foreign currency translations | (67,492 | ) | 59,350 | |||||
|
|
|
| |||||
Net increase in net assets resulting from operations | 191,407,681 | 61,179,179 | ||||||
|
|
|
| |||||
| DISTRIBUTION TO SHAREHOLDERS FROM: | ||||||||
Net investment income | (6,864,980 | ) | (1,416,348 | ) | ||||
Net realized gain on investments | (7,111,047 | ) | — | |||||
|
|
|
| |||||
Net decrease in net assets resulting from distributions paid | (13,976,027 | ) | (1,416,348 | ) | ||||
|
|
|
| |||||
| CAPITAL SHARE TRANSACTIONS | ||||||||
Proceeds from shares sold | 711,441,078 | 711,410,844 | ||||||
Proceeds from reinvestment of distributions | 13,378,508 | 1,337,875 | ||||||
Cost of shares repurchased | (522,292,867 | ) | (401,953,384 | ) | ||||
Redemption fee proceeds | 65,242 | 149,175 | ||||||
|
|
|
| |||||
Net increase from capital share transactions | 202,591,961 | 310,944,510 | ||||||
|
|
|
| |||||
Total increase in net assets | 380,023,615 | 370,707,341 | ||||||
|
|
|
| |||||
| NET ASSETS | ||||||||
Beginning of year | 1,821,873,247 | 1,451,165,906 | ||||||
|
|
|
| |||||
End of year (includes undistributed net investment income of $8,607,982 and $4,319,310, respectively) | $ | 2,201,896,862 | $ | 1,821,873,247 | ||||
|
|
|
| |||||
| CHANGE IN CAPITAL SHARES | ||||||||
Shares outstanding, beginning of year | 117,989,471 | 98,706,971 | ||||||
|
|
|
| |||||
Shares sold | 44,162,964 | 45,548,287 | ||||||
Shares issued on reinvestment of distributions | 905,731 | 87,787 | ||||||
Shares repurchased | (32,201,787 | ) | (26,353,574 | ) | ||||
|
|
|
| |||||
Net increase in capital shares | 12,866,908 | 19,282,500 | ||||||
|
|
|
| |||||
Shares outstanding, end of year | 130,856,379 | 117,989,471 | ||||||
|
|
|
| |||||
The accompanying notes are an integral part of these financial statements.
28
| Statement of Changes in Net Assets |
| Year Ended October 30, 2012 | Year Ended October 30, 2011 | |||||||
INCREASE (DECREASE) IN NET ASSETS FROM: | ||||||||
OPERATIONS | ||||||||
Net investment loss | $ | (4,139,593 | ) | $ | (3,382,612 | ) | ||
Net realized gain (loss) on: | ||||||||
Investments | 3,170,833 | 26,971,334 | ||||||
Foreign currency transactions | (14,797 | ) | 12,755 | |||||
Change in net unrealized appreciation/depreciation on: | ||||||||
Investments | 152,996,462 | 42,923,262 | ||||||
Foreign currency translations | (41,027 | ) | 20,135 | |||||
|
|
|
| |||||
Net increase in net assets resulting from operations | 151,971,878 | 66,544,874 | ||||||
|
|
|
| |||||
| DISTRIBUTIONS TO SHAREHOLDERS FROM REALIZED GAIN ON INVESTMENTS | (21,243,259 | ) | (27,881,437 | ) | ||||
|
|
|
| |||||
| CAPITAL SHARE TRANSACTIONS | ||||||||
Proceeds from shares sold | 535,108,903 | 492,535,674 | ||||||
Proceeds from reinvestment of distributions | 20,208,334 | 27,335,474 | ||||||
Cost of shares repurchased | (279,205,992 | ) | (234,079,639 | ) | ||||
Redemption fee proceeds | 76,299 | 131,984 | ||||||
|
|
|
| |||||
Net increase from capital share transactions | 276,187,544 | 285,923,493 | ||||||
|
|
|
| |||||
Total increase in net assets | 406,916,163 | 324,586,930 | ||||||
|
|
|
| |||||
| NET ASSETS | ||||||||
Beginning of year | 1,134,535,305 | 809,948,375 | ||||||
|
|
|
| |||||
End of year (includes accumulated net losses of $807,083 and $0, respectively) | $ | 1,541,451,468 | $ | 1,134,535,305 | ||||
|
|
|
| |||||
| CHANGE IN CAPITAL SHARES | ||||||||
Shares outstanding, beginning of year | 66,762,268 | 50,097,938 | ||||||
|
|
|
| |||||
Shares sold | 29,438,901 | 29,150,342 | ||||||
Shares issued on reinvestment of distributions | 1,276,585 | 1,689,461 | ||||||
Shares repurchased | (15,725,031 | ) | (14,175,473 | ) | ||||
|
|
|
| |||||
Net increase in capital shares | 14,990,455 | 16,664,330 | ||||||
|
|
|
| |||||
Shares outstanding, end of year | 81,752,723 | 66,762,268 | ||||||
|
|
|
| |||||
The accompanying notes are an integral part of these financial statements.
29
| For a capital share outstanding throughout each period. |
| Year Ended Oct. 31, 2012 | Year Ended Oct. 31, 2011 | Year Ended Oct. 31, 2010 | Year Ended Oct. 31, 2009 | Year Ended Oct. 31, 2008 | ||||||||||||||||
Net asset value, beginning of the year | $ | 14.32 | $ | 13.48 | $ | 11.69 | $ | 10.10 | $ | 15.22 | ||||||||||
|
|
|
|
|
|
|
|
|
| |||||||||||
Income from investment operations: | ||||||||||||||||||||
Net investment income | 0.21 | 0.16 | 0.09 | 1 | 0.10 | 0.06 | ||||||||||||||
Net realized and unrealized gain (loss) on investments and foreign currency | 1.40 | 0.79 | 1.79 | 1.55 | (4.99 | ) | ||||||||||||||
|
|
|
|
|
|
|
|
|
| |||||||||||
Total from investment operations | 1.61 | 0.95 | 1.88 | 1.65 | (4.93 | ) | ||||||||||||||
|
|
|
|
|
|
|
|
|
| |||||||||||
Less: | ||||||||||||||||||||
Dividends from net investment income | (0.18 | ) | (0.11 | ) | (0.09 | ) | (0.06 | ) | (0.07 | ) | ||||||||||
Distributions from net realized gain | — | — | — | — | (0.12 | ) | ||||||||||||||
|
|
|
|
|
|
|
|
|
| |||||||||||
Total distributions | (0.18 | ) | (0.11 | ) | (0.09 | ) | (0.06 | ) | (0.19 | ) | ||||||||||
|
|
|
|
|
|
|
|
|
| |||||||||||
Net asset value, end of year | $ | 15.75 | $ | 14.32 | $ | 13.48 | $ | 11.69 | $ | 10.10 | ||||||||||
|
|
|
|
|
|
|
|
|
| |||||||||||
Total return | 11.39 | % | 7.05 | % | 16.14 | % | 16.55 | % | (32.73 | %) | ||||||||||
Ratios/supplemental data: | ||||||||||||||||||||
Net assets, end of year (millions) | $ | 1,522.2 | $ | 904.3 | $ | 607.1 | $ | 179.7 | $ | 187.0 | ||||||||||
Ratio of expenses to average net assets | 0.66 | % | 0.66 | % | 0.71 | % | 0.80 | % | 0.79 | % | ||||||||||
Ratio of net investment income to | 1.57 | % | 1.25 | % | 1.37 | %1 | 0.96 | % | 0.51 | % | ||||||||||
Portfolio turnover rate | 11 | % | 24 | % | 3 | % | 34 | % | 10 | % | ||||||||||
| 1 | Investment income per share reflects a special dividend of $0.05. Excluding the special dividend, the ratio of net investment income to average net assets would have been 0.74%. |
The accompanying notes are an integral part of these financial statements.
30
| Financial Highlights For a capital share outstanding throughout each period. |
| Year Ended Oct. 31, 2012 | Year Ended Oct. 31, 2011 | Year Ended Oct. 31, 2010 | Year Ended Oct. 31, 2009 | Year Ended Oct. 31, 2008 | ||||||||||||||||
Net asset value, beginning of the year | $ | 15.44 | $ | 14.70 | $ | 12.18 | $ | 10.07 | $ | 15.71 | ||||||||||
|
|
|
|
|
|
|
|
|
| |||||||||||
Income from investment operations: | ||||||||||||||||||||
Net investment income | 0.09 | 0.04 | 0.02 | 0.03 | 0.03 | |||||||||||||||
Net realized and unrealized gain (loss) on investments and foreign currency | 1.42 | 0.71 | 2.53 | 2.11 | (5.59 | ) | ||||||||||||||
|
|
|
|
|
|
|
|
|
| |||||||||||
Total from investment operations | 1.51 | 0.75 | 2.55 | 2.14 | (5.56 | ) | ||||||||||||||
|
|
|
|
|
|
|
|
|
| |||||||||||
Less: | ||||||||||||||||||||
Dividends from net investment income | (0.06 | ) | (0.01 | ) | (0.03 | ) | (0.03 | ) | (0.04 | ) | ||||||||||
Distributions from net realized gain | (0.06 | ) | — | — | — | (0.04 | ) | |||||||||||||
|
|
|
|
|
|
|
|
|
| |||||||||||
Total distributions | (0.12 | ) | (0.01 | ) | (0.03 | ) | (0.03 | ) | (0.08 | ) | ||||||||||
|
|
|
|
|
|
|
|
|
| |||||||||||
Net asset value, end of year | $ | 16.83 | $ | 15.44 | $ | 14.70 | $ | 12.18 | $ | 10.07 | ||||||||||
|
|
|
|
|
|
|
|
|
| |||||||||||
Total return | 9.86 | % | 5.13 | % | 20.96 | % | 21.39 | % | (35.55 | %) | ||||||||||
Ratios/supplemental data: | ||||||||||||||||||||
Net assets, end of year (millions) | $ | 2,201.9 | $ | 1,821.9 | $ | 1,451.2 | $ | 706.5 | $ | 412.4 | ||||||||||
Ratio of expenses to average net assets | 0.67 | % | 0.66 | % | 0.68 | % | 0.71 | % | 0.71 | % | ||||||||||
Ratio of net investment income to average net assets | 0.55 | % | 0.26 | % | 0.15 | % | 0.35 | % | 0.26 | % | ||||||||||
Portfolio turnover rate | 12 | % | 13 | % | 5 | % | 12 | % | 13 | % | ||||||||||
The accompanying notes are an integral part of these financial statements.
31
| Financial Highlights PRIMECAP Odyssey Aggressive Growth Fund For a capital share outstanding throughout each period. |
| Year Ended Oct. 31, 2012 | Year Ended Oct. 31, 2011 | Year Ended Oct. 31, 2010 | Year Ended Oct. 31, 2009 | Year Ended Oct. 31, 2008 | ||||||||||||||||
Net asset value, beginning of the year | $ | 16.99 | $ | 16.17 | $ | 12.33 | $ | 9.46 | $ | 16.03 | ||||||||||
|
|
|
|
|
|
|
|
|
| |||||||||||
Income from investment operations: | ||||||||||||||||||||
Net investment loss | (0.05 | ) | (0.05 | ) | (0.05 | ) | (0.05 | ) | (0.06 | ) | ||||||||||
Net realized and unrealized gain (loss) on investments and foreign currency | 2.24 | 1.40 | 3.89 | 2.92 | (6.42 | ) | ||||||||||||||
|
|
|
|
|
|
|
|
|
| |||||||||||
Total from investment operations | 2.19 | 1.35 | 3.84 | 2.87 | (6.48 | ) | ||||||||||||||
|
|
|
|
|
|
|
|
|
| |||||||||||
Less: | ||||||||||||||||||||
Distributions from net realized gain | (0.32 | ) | (0.53 | ) | — | — | (0.09 | ) | ||||||||||||
|
|
|
|
|
|
|
|
|
| |||||||||||
Net asset value, end of year | $ | 18.86 | $ | 16.99 | $ | 16.17 | $ | 12.33 | $ | 9.46 | ||||||||||
|
|
|
|
|
|
|
|
|
| |||||||||||
Total return | 13.25 | % | 8.50 | % | 31.14 | % | 30.34 | % | (40.60 | %) | ||||||||||
Ratios/supplemental data: | ||||||||||||||||||||
Net assets, end of year (millions) | $ | 1,541.5 | $ | 1,134.5 | $ | 809.9 | $ | 368.8 | $ | 225.4 | ||||||||||
Ratio of expenses to average net assets | 0.68 | % | 0.68 | % | 0.71 | % | 0.77 | % | 0.78 | % | ||||||||||
Ratio of net investment loss to | (0.32 | %) | (0.33 | %) | (0.45 | %) | (0.54 | %) | (0.46 | %) | ||||||||||
Portfolio turnover rate | 14 | % | 11 | % | 15 | % | 20 | % | 24 | % | ||||||||||
The accompanying notes are an integral part of these financial statements.
32
| PRIMECAP Odyssey Funds For the Year Ended October 31, 2012 |
(1) Organization
PRIMECAP Odyssey Funds (the “Trust”) was organized on June 8, 2004 as a Delaware statutory trust and is registered as an open-end management investment company under the Investment Company Act of 1940, as amended (the “1940 Act”). The Trust is comprised of three series: PRIMECAP Odyssey Stock Fund, PRIMECAP Odyssey Growth Fund, and PRIMECAP Odyssey Aggressive Growth Fund (the “Funds”), each of which is diversified within the meaning of the 1940 Act. PRIMECAP Management Company (the “Investment Advisor”) serves as investment advisor to the Funds. Each Fund commenced operations on November 1, 2004.
Each Fund’s investment objective is to achieve long-term capital appreciation. Each Fund is authorized to issue unlimited shares of beneficial interest. All shares within each Fund have equal rights with respect to voting. Prior to July 1, 2012, each Fund charged a redemption fee of 2% of the redemption amount on shares redeemed or exchanged within 60 days of purchase.
(2) Significant Accounting Policies
The Funds consistently follow the accounting policies set forth below which are in conformity with accounting principles generally accepted in the United States of America.
| A. | Security Valuation |
Securities traded on a national securities exchange are valued at the last reported sales price at the close of regular trading on each day the exchanges are open for trading. Securities traded on the National Association of Securities Dealers Authorized Quotations (“NASDAQ”) are valued at the NASDAQ Official Closing Price, which may not necessarily represent the last sale price. Non-U.S. traded stocks are valued at the last sale price or official closing price in the primary local market where the stock is traded. Securities traded on an exchange for which there have been no sales are valued at the mean between the bid and ask price.
Securities for which quotations are not readily available are stated at their respective fair values as determined in good faith by a valuation committee of the Investment Advisor in accordance with procedures approved by the Trust’s Board of Trustees. In determining fair value, the Funds take into account all relevant factors and available information. Consequently, the price of a security used by a Fund to calculate its net asset value per share (“NAV”) may differ from quoted or published prices for the same security. Fair value pricing involves subjective judgments, and there is no single standard for determining a security’s fair value. As a result, different mutual funds could reasonably arrive at a different fair value for the same security. It is possible that the fair value determined for a security is materially different from the value that could be realized upon the sale of that security or from the values that other mutual funds may determine.
Investments in other funds are valued at their respective net asset values as determined by those funds, in accordance with the 1940 Act.
33
Notes to Financial Statements
PRIMECAP Odyssey Funds
For the Year Ended October 31, 2012 – continued
| B. | Share Valuation |
The NAV of a Fund is calculated by dividing the sum of the value of the securities held by the Fund, plus cash or other assets, minus all liabilities (including estimated accrued expenses), by the total number of shares outstanding of the Fund. The result is rounded to the nearest cent. The Funds’ shares will not be priced on the days on which the NYSE is closed for trading.
| C. | Foreign Currency |
Securities and other assets and liabilities denominated in foreign currencies are translated into U.S. dollars using exchange rates as of 4 p.m. Eastern time on the valuation date. Purchases and sales of investments and dividend and interest income are converted into U.S. dollars using the spot market rate of exchange prevailing on the respective dates of such translations. Realized foreign exchange gains or losses arise from sales of foreign currencies, currency gains or losses realized between the trade and settlement dates on securities transactions and the difference between the recorded amounts of dividends, interest, and foreign withholding taxes and the U.S. dollar equivalent of the amounts actually received or paid. Net unrealized foreign exchange gains and losses arise from changes in foreign exchange rates on foreign denominated assets and liabilities other than investments in securities held at the end of the reporting period. Foreign securities and currency transactions may involve risks not associated with U.S. securities and currency.
| D. | Federal Income Taxes |
Each Fund has elected to be treated as a “regulated investment company” under Subchapter M of the Internal Revenue Code (the “IRC”). Each Fund intends to distribute substantially all of its taxable income and any accumulated net realized capital gains. Accordingly, no provision for Federal income taxes has been made in the financial statements.
The Funds may be subject to foreign taxes on income, gains on investments, or currency repatriation, a portion of which may be reclaimed. The Funds will accrue such taxes and reclaims as applicable based upon their current interpretations of the tax rules and regulations that exist in the markets in which they invest.
Each Fund has adopted accounting standards regarding recognition and measurement of tax positions taken on a tax return. No material uncertain tax positions existed in any Fund as of October 31, 2012. As of October 31, 2012, open tax years include the tax years ended October 31, 2009 through 2012. The Funds are also not aware of any tax positions for which it is reasonably possible that the total amounts of unrecognized tax benefits will significantly change in the next 12 months. The Funds recognize interest and penalties, if any, related to unrecognized tax benefits as income tax expense in the Statement of Operations. During the fiscal year ended October 31, 2012, the Funds did not incur any interest or penalties.
34
Notes to Financial Statements
PRIMECAP Odyssey Funds
For the Year Ended October 31, 2012 – continued
| E. | Allocation of Expenses |
Each Fund is charged for those expenses directly attributable to it. Expenses that are not directly attributable to a Fund are allocated among the Funds by an appropriate method based on the nature of the expense.
| F. | Security Transactions, Investment Income, and Distributions |
Security transactions are accounted for on the trade date. Dividend income and distributions to shareholders are recorded on the ex-dividend date, and interest income is recognized on the accrual basis. Realized gains and losses are evaluated on the basis of identified costs. Premiums and discounts on the purchase of securities are amortized/accreted using the effective interest method. United States Generally Accepted Accounting Principles (“GAAP”) require that permanent financial reporting and tax differences be reclassified in the capital accounts.
| G. | Use of Estimates |
The preparation of financial statements in conformity with accounting principles generally accepted in the United States of America requires management to make estimates and assumptions that affect the reported amounts of assets and liabilities and disclosure of contingent assets and liabilities at the date of the financial statements, and the reported amounts of revenues and expenses during the reporting period. Actual results could differ from these estimates.
| H. | Indemnification Obligations |
Under the Trust’s organizational documents, its current and former officers and trustees are indemnified against certain liabilities arising out of the performance of their duties to the Funds. In addition, in the normal course of business, the Funds enter into contracts that contain a variety of representations and warranties that provide general indemnifications. The Funds’ maximum exposure under these arrangements is unknown as this would involve future claims that may be made against the Funds that have not yet occurred. Based on experience, the Funds would expect the risk of loss to be minimal.
(3) Investment Transactions
The cost of purchases and the proceeds from sales of securities, excluding short-term investments, for the year ended October 31, 2012 were as follows:
Fund | Purchases | Sales | ||||||
PRIMECAP Odyssey Stock Fund | $ | 558,542,813 | $ | 130,180,365 | ||||
PRIMECAP Odyssey Growth Fund | $ | 383,771,758 | $ | 240,598,963 | ||||
PRIMECAP Odyssey Aggressive Growth Fund | $ | 340,137,304 | $ | 169,242,481 | ||||
35
Notes to Financial Statements
PRIMECAP Odyssey Funds
For the Year Ended October 31, 2012 – continued
(4) Valuation Measurements
The Funds have adopted fair valuation accounting standards which establish an authoritative definition of fair value and set forth a hierarchy for measuring fair value. These standards require additional disclosure about the various inputs and valuation techniques used to develop the measurements of fair value and a discussion of changes in valuation techniques and related inputs during the period. These standards define fair value as the price that would be received in the sale of an asset or paid to transfer a liability in an orderly transaction between market participants on the measurement date. The fair value hierarchy is organized into three levels based upon the assumptions (referred to as “inputs”) used to value the asset or liability. These standards state that “observable inputs” reflect the assumptions that market participants would use in valuing an asset or liability based on market data obtained from independent sources. “Unobservable inputs” reflect the Funds’ own assumptions about the inputs market participants would use to value the asset or liability.
Various inputs are used in determining the value of each Fund’s investments. These inputs are summarized in the three broad levels below:
| Level 1 – | Unadjusted quoted prices in active markets for identical securities to which the Trust has access at the date of measurement. |
| Level 2 – | Other significant observable inputs (including quoted prices for similar or related securities in both active and inactive markets, interest rates, foreign exchange rates, and fair value estimates for foreign securities indices). |
| Level 3 – | Significant unobservable inputs to the extent observable inputs are unavailable (including the Funds’ own assumptions in determining fair value of investments based on the best available information). |
36
Notes to Financial Statements
PRIMECAP Odyssey Funds
For the Year Ended October 31, 2012 – continued
The following table provides the fair value measurements of applicable Fund assets by level within the fair value hierarchy for each Fund as of October 31, 2012. There were no transfers into or out of Level 1 and Level 2 during the reporting period. These assets are measured on a recurring basis.
Fund | Description | Quoted prices in active markets for identical assets (Level 1) | Significant other observable inputs (Level 2) | Significant unobservable inputs (Level 3) | Total | |||||||||||||
PRIMECAP Odyssey Stock Fund | Equity | $ | 1,391,706,028 | $ | — | $ | — | $ | 1,391,706,028 | |||||||||
|
|
|
|
|
|
|
| |||||||||||
Total Equity | $ | 1,391,706,028 | $ | — | $ | — | $ | 1,391,706,028 | ||||||||||
|
|
|
|
|
|
|
| |||||||||||
Short-Term Investments | $ | 129,603,233 | $ | — | $ | — | $ | 129,603,233 | ||||||||||
|
|
|
|
|
|
|
| |||||||||||
Total Investments in Securities | $ | 1,521,309,261 | $ | — | $ | — | $ | 1,521,309,261 | ||||||||||
|
|
|
|
|
|
|
| |||||||||||
PRIMECAP Odyssey Growth Fund | Equity | $ | 2,125,718,022 | $ | — | $ | — | $ | 2,125,718,022 | |||||||||
|
|
|
|
|
|
|
| |||||||||||
Total Equity | $ | 2,125,718,022 | $ | — | $ | — | $ | 2,125,718,022 | ||||||||||
|
|
|
|
|
|
|
| |||||||||||
Short-Term Investments | $ | 73,151,815 | $ | — | $ | — | $ | 73,151,815 | ||||||||||
|
|
|
|
|
|
|
| |||||||||||
Total Investments | $ | 2,198,869,837 | $ | — | $ | — | $ | 2,198,869,837 | ||||||||||
|
|
|
|
|
|
|
| |||||||||||
PRIMECAP Odyssey Aggressive Growth Fund | Equity | $ | 1,420,868,309 | $ | — | $ | — | $ | 1,420,868,309 | |||||||||
|
|
|
|
|
|
|
| |||||||||||
Total Equity | $ | 1,420,868,309 | $ | — | $ | — | $ | 1,420,868,309 | ||||||||||
|
|
|
|
|
|
|
| |||||||||||
Short-Term Investments | $ | 117,365,151 | $ | — | $ | — | $ | 117,365,151 | ||||||||||
|
|
|
|
|
|
|
| |||||||||||
Total Investments | $ | 1,538,233,460 | $ | — | $ | — | $ | 1,538,233,460 | ||||||||||
|
|
|
|
|
|
|
| |||||||||||
1 Refer to each Fund’s respective Schedule of Investments for the breakdown of major categories.
In May 2011, the FASB issued ASU No. 2011-04 “Amendments to Achieve Common Fair Value Measurement and Disclosure Requirements” in GAAP and International Financial Reporting Standards (“IFRS”). ASU No. 2011-04 amends FASB ASC Topic 820, Fair Value Measurements and Disclosures, to establish common requirements for measuring fair value and for disclosing information about fair value measurements in accordance with GAAP and IFRS. ASU No. 2011-04 is effective for interim and fiscal years beginning after December 15, 2011. Management does not believe these amendments will have a material impact on the Funds’ financial statements.
37
Notes to Financial Statements
PRIMECAP Odyssey Funds
For the Year Ended October 31, 2012 – continued
(5) Distribution to Shareholders
Net investment income and net realized gains differ for financial statement and tax purposes due to differing treatments of deferred wash sale losses.
As of October 31, 2012, the components of capital on a tax basis were as follows:
| PRIMECAP Odyssey Stock Fund | PRIMECAP Odyssey Growth Fund | PRIMECAP Odyssey Aggressive Growth Fund | ||||||||||
Cost of investments for tax purposes1 | $ | 1,326,954,285 | $ | 1,826,775,111 | $ | 1,254,152,448 | ||||||
|
|
|
|
|
| |||||||
Gross tax unrealized appreciation | 241,643,043 | 523,149,720 | 458,365,589 | |||||||||
Gross tax unrealized depreciation | (47,279,788 | ) | (151,030,082 | ) | (174,278,152 | ) | ||||||
|
|
|
|
|
| |||||||
Net tax unrealized appreciation . | 194,363,255 | 372,119,638 | 284,087,437 | |||||||||
|
|
|
|
|
| |||||||
Undistributed ordinary income . | 16,330,713 | 8,607,982 | — | |||||||||
Undistributed long-term capital gain | — | — | — | |||||||||
|
|
|
|
|
| |||||||
Total distributable earnings | 16,330,713 | 8,607,982 | — | |||||||||
|
|
|
|
|
| |||||||
Other accumulated gain (loss) | (13,971,045 | ) | (3,180,302 | ) | (807,083 | ) | ||||||
|
|
|
|
|
| |||||||
Total accumulated gain | $ | 196,722,923 | $ | 377,547,318 | $ | 283,280,354 | ||||||
|
|
|
|
|
| |||||||
| 1 | At October 31, 2012 the differences in the basis for federal income tax purposes and financial reporting purposes are due to the tax deferral of losses on wash sales. |
GAAP requires that permanent book-to-tax differences be reclassified among the components of net assets. These reclassifications have no effect on net assets or net asset value per share. For the fiscal year ended October 31, 2012, the following reclassifications were made:
| Undistributed Net Investment Income | Accumulated Net Realized Loss | Paid In Capital | ||||||||||
PRIMECAP Odyssey | $ | (47,572) | $ | 47,572 | $ | — | ||||||
PRIMECAP Odyssey | (179,800) | 179,800 | — | |||||||||
PRIMECAP Odyssey | 3,332,510 | (3,331,872) | (638) | |||||||||
Permanent book-to-tax differences that required reclassification among the Funds’ capital accounts related to foreign currency adjustments and net operating losses.
38
Notes to Financial Statements
PRIMECAP Odyssey Funds
For the Year Ended October 31, 2012 – continued
During the fiscal year ended October 31, 2012, the PRIMECAP Odyssey Stock Fund used $6,026,817 in capital loss carryover accumulated in prior fiscal years. At October 31, 2012, the PRIMECAP Odyssey Stock Fund had capital loss carryover of $13,971,045 which expires on October 31, 2017. The PRIMECAP Odyssey Growth Fund had a long-term capital loss carryover of $3,180,302 which does not expire. The PRIMECAP Odyssey Aggressive Growth Fund deferred, on a tax basis, late-year ordinary losses of $807,083.
Tax components of dividends paid during the fiscal years ended October 31, 2012 and October 31, 2011 were as follows:
| October 31, 2012 | ||||||||
| Ordinary Income Distributions | Long-Term Capital Gain Distributions | |||||||
PRIMECAP Odyssey Stock Fund | $ | 12,241,758 | $ | — | ||||
PRIMECAP Odyssey Growth Fund | $ | 13,976,027 | $ | — | ||||
PRIMECAP Odyssey Aggressive Growth Fund | $ | 13,466,237 | $ | 7,777,022 | ||||
| October 31, 2011 | ||||||||
| Ordinary Income Distributions | Long-Term Capital Gain Distributions | |||||||
PRIMECAP Odyssey Stock Fund | $ | 5,099,941 | $ | — | ||||
PRIMECAP Odyssey Growth Fund | $ | 1,416,348 | $ | — | ||||
PRIMECAP Odyssey Aggressive Growth Fund | $ | — | $ | 27,881,437 | ||||
The Funds designated as long-term capital gain dividends, pursuant to Internal Revenue Code Section 852(b)(3), the amounts necessary to reduce the earnings and profits of the Funds related to net capital gains to zero for the tax year ended October 31, 2012.
In December 2010, the Regulated Investment Company Modernization Act (the “RIC Act”) was enacted by Congress and signed into law. Under the RIC Act, new capital loss carryover may be carried forward indefinitely and retain the character of the original loss. Any post-enactment capital loss carryover generated will be required to be utilized prior to the losses incurred in pre-enactment years. This ordering rule increases the likelihood that the pre-enactment capital loss carryovers will expire unused. The RIC Act, among other things, also contains provisions aimed at preventing disqualification under the IRC for inadvertent failures to comply with the asset diversification and qualifying income tests, exempts RICs from the preferential dividend rule, and repeals the 60-day designation requirement for certain pay-through income and gains.
(6) Investment Advisory and Other Agreements
The Trust has entered into an investment management agreement with the Investment Advisor on behalf of each Fund. For its services to the Funds, the Investment Advisor receives a fee paid quarterly at the annual rate of 0.60% of the first $100 million of each Fund’s average daily net
39
Notes to Financial Statements
PRIMECAP Odyssey Funds
For the Year Ended October 31, 2012 – continued
assets and 0.55% of each Fund’s average daily net assets in excess of $100 million. For the year ended October 31, 2012, each Fund paid the Investment Advisor at an effective annual rate of 0.55% of its respective average net assets.
The Bank of New York Mellon serves as the Funds’ custodian. U.S. Bancorp Fund Services, LLC (“USBFS”) serves as the administrator, fund accountant, and transfer agent to the Funds. Quasar Distributors, LLC, an affiliate of USBFS, serves as the Funds’ distributor.
(7) Other Affiliates
Certain of the Funds’ investments are in companies that are considered to be affiliated companies of a Fund because the Fund owns 5% or more of the outstanding voting securities of the company. Transactions during the period in securities of these companies were as follows:
PRIMECAP Odyssey Growth Fund |
| |||||||||||||||||||||||
| Current Period Transactions | ||||||||||||||||||||||||
Common Stock | Market Value at October 31, 2011 | Purchases at Cost | Proceeds from Securities Sold | Dividend Income | Realized Gain (Loss) | Market Value at October 31, 2012 | ||||||||||||||||||
Conceptus, Inc. | $ | 25,962,947 | $ | 523,756 | $ | — | $ | — | $ | — | $ | 43,213,835 | ||||||||||||
ImmunoGen, Inc. | 79,307,200 | 302,486 | 95,493 | — | 6,443 | 64,874,508 | ||||||||||||||||||
Stratasys, Inc.(1) | 29,722,400 | — | 13,976,512 | — | 7,012,308 | N/A | ||||||||||||||||||
|
|
|
|
|
|
|
|
|
|
|
| |||||||||||||
| $ | 134,992,547 | $ | 826,242 | $ | 14,072,005 | $ | — | $ | 7,018,751 | $ | 108,088,343 | |||||||||||||
|
|
|
|
|
|
|
|
|
|
|
| |||||||||||||
| (1) | No longer an affiliate as of October 31, 2012. |
PRIMECAP Odyssey Aggressive Growth Fund |
| |||||||||||||||||||||||
| Current Period Transactions | ||||||||||||||||||||||||
Common Stock | Market Value at October 31, 2011 | Purchases at Cost | Proceeds from Securities Sold | Dividend Income | Realized Gain (Loss) | Market Value at October 31, 2012 | ||||||||||||||||||
Abiomed, Inc. | $ | 30,845,485 | $ | 2,373,723 | $ | 346,355 | $ | — | $ | 60,462 | $ | 42,646,159 | ||||||||||||
Conceptus, Inc. | 19,235,520 | — | — | — | — | 31,458,090 | ||||||||||||||||||
Dyax, Corp. | 7,863,750 | 77,587 | — | — | — | 17,598,300 | ||||||||||||||||||
Guidance Software, Inc. | 7,825,621 | 1,101,838 | — | — | — | 17,077,578 | ||||||||||||||||||
Smart Balance, Inc. | 21,702,803 | — | — | — | — | 39,429,519 | ||||||||||||||||||
|
|
|
|
|
|
|
|
|
|
|
| |||||||||||||
| $ | 87,473,179 | $ | 3,553,148 | $ | 346,355 | $ | — | $ | 60,462 | $ | 148,209,646 | |||||||||||||
|
|
|
|
|
|
|
|
|
|
|
| |||||||||||||
(8) Subsequent Events
The Funds have evaluated subsequent events through the issuance of the financial statements and determined that no events have occurred that require disclosure.
40
| Report of Independent Registered Public Accounting Firm |
To the Board of Trustees and Shareholders
of PRIMECAP Odyssey Funds:
In our opinion, the accompanying statements of assets and liabilities, including the schedules of investments, and the related statements of operations and of changes in net assets and the financial highlights present fairly, in all material respects, the financial position of PRIMECAP Odyssey Stock Fund, PRIMECAP Odyssey Growth Fund and PRIMECAP Odyssey Aggressive Growth Fund (the “Funds”) at October 31, 2012, the results of each of their operations for the year then ended, the changes in each of their net assets for each of the two years in the period then ended and the financial highlights for each of the five years in the period then ended, in conformity with accounting principles generally accepted in the United States of America. These financial statements and financial highlights (hereafter referred to as “financial statements”) are the responsibility of the Funds’ management; our responsibility is to express an opinion on these financial statements based on our audits. We conducted our audits of these financial statements in accordance with the standards of the Public Company Accounting Oversight Board (United States). Those standards require that we plan and perform the audit to obtain reasonable assurance about whether the financial statements are free of material misstatement. An audit includes examining, on a test basis, evidence supporting the amounts and disclosures in the financial statements, assessing the accounting principles used and significant estimates made by management, and evaluating the overall financial statement presentation. We believe that our audits, which included confirmation of securities at October 31, 2012 by correspondence with the custodian and brokers, provide a reasonable basis for our opinion.
PricewaterhouseCoopers LLP
San Francisco, California
December 13, 2012
41
| PRIMECAP Odyssey Funds (Unaudited) |
As a shareholder of one or more of the Funds, you incur ongoing costs, including management fees and other Fund expenses. This expense example is intended to help you understand your ongoing costs (in dollars) of investing in the Funds and to compare these costs with the ongoing costs of investing in other mutual funds.
The expense example is based on an investment of $1,000 invested for a six-month period beginning May 1, 2012 and held through October 31, 2012.
Actual Expenses
The information in the table adjacent to the heading “Actual Performance” provides actual account values and actual expenses. You may use the information in these columns, together with the amount you invested, to estimate the expenses that you paid over the period. Simply divide your account value by $1,000 (for example, an $8,600 account value divided by $1,000 = 8.6), then multiply the result by the number in the column entitled “Expenses Paid during Period” to estimate the expenses you paid on your account during this period.
Hypothetical Example for Comparison Purposes
The information in the table adjacent to the heading “Hypothetical Performance (5% return before expenses)” provides hypothetical account values and hypothetical expenses based on the Funds’ actual expense ratios and an assumed rate of return of 5% per year before expenses, which are not the Funds’ actual returns. The hypothetical account values and expenses may not be used to estimate the actual ending account balance or expenses you paid for the period. You may use this information to compare the ongoing costs of investing in the Funds and other mutual funds. To do so, compare these 5% hypothetical examples with the 5% hypothetical examples that appear in the shareholder reports of the other mutual funds.
Please note that the expenses shown in the table are meant to highlight your ongoing costs only. Therefore, the information adjacent to the heading “Hypothetical Performance (5% return before expenses)” is useful in comparing ongoing costs only and will not help you determine the relative total costs of owning different mutual funds. In addition, if transactional costs were included, your costs would have been higher.
42
Expense Example
PRIMECAP Odyssey Funds
(Unaudited) – continued
| Beginning Account Value (05/1/12) | Ending | Expenses Paid During Period1 (05/1/12 to 10/31/12) | Expense Ratio During Period1 (05/1/12 to 10/31/12) | |||||||||||||
PRIMECAP Odyssey Stock Fund |
| |||||||||||||||
Actual Performance | $ | 1,000.00 | $ | 1,020.70 | $ | 3.39 | 0.67% | |||||||||
Hypothetical Performance | $ | 1,000.00 | $ | 1,021.79 | $ | 3.39 | 0.67% | |||||||||
PRIMECAP Odyssey Growth Fund |
| |||||||||||||||
Actual Performance | $ | 1,000.00 | $ | 1,014.50 | $ | 3.37 | 0.67% | |||||||||
Hypothetical Performance | $ | 1,000.00 | $ | 1,021.79 | $ | 3.39 | 0.67% | |||||||||
PRIMECAP Odyssey Aggressive Growth Fund |
| |||||||||||||||
Actual Performance | $ | 1,000.00 | $ | 1,035.70 | $ | 3.45 | 0.67% | |||||||||
Hypothetical Performance | $ | 1,000.00 | $ | 1,021.75 | $ | 3.43 | 0.67% | |||||||||
| 1 | Expenses are equal to a Fund’s annualized expense ratio as indicated, multiplied by the average account value over the period, multiplied by the number of days in the most recent fiscal half-year period (184), then divided by the number of days in the fiscal year (366) to reflect the one-half year period. |
43
| PRIMECAP Odyssey Funds (Unaudited) |
Additional Tax Information
PRIMECAP Odyssey Stock Fund, PRIMECAP Odyssey Growth Fund, and PRIMECAP Odyssey Aggressive Growth Fund designate 100%, 100% and 27%, respectively, of ordinary income distributions paid during the fiscal year ended October 31, 2012 as qualified dividend income.
PRIMECAP Odyssey Stock Fund, PRIMECAP Odyssey Growth Fund, and PRIMECAP Odyssey Aggressive Growth Fund designate 100%, 100%, and 11%, respectively, of ordinary income distributions paid during the fiscal year ended October 31, 2012 as dividends qualifying for the dividends received deduction available for corporate shareholders.
PRIMECAP Odyssey Growth Fund and PRIMECAP Odyssey Aggressive Growth Fund designate 50% and 100%, respectively, of ordinary income distributions paid during the fiscal year ended October 31, 2012 as short-term capital gain under Internal Revenue Code 871(k)(2)(C).
Proxy Voting Procedures
The Investment Advisor votes proxies relating to portfolio securities in accordance with procedures that have been approved by the Trust’s Board of Trustees. You may obtain a description of these procedures, free of charge, by calling toll-free 1-800-729-2307. This information is also available through the Securities and Exchange Commission’s (“SEC”) website at www.sec.gov.
Proxy Voting Record
Information regarding how the Funds voted proxies relating to the portfolio securities during the most recent 12-month period ended June 30 is available, without charge, by calling toll-free 1-800-729-2307. This information is also available through the SEC’s website at www.sec.gov.
Form N-Q Disclosure
The Funds file a complete schedule of portfolio holdings with the SEC for the first and third quarters of each fiscal year on Form N-Q. The Funds’ Forms N-Q are available on the SEC’s website at www.sec.gov. The Funds’ Forms N-Q may be reviewed and copied at the Commission’s Public Reference Room in Washington, DC, and information on the operation of the Public Reference Room may be obtained by calling 1-800-SEC-0330. This information is also available, without charge, by calling toll-free 1-800-729-2307.
Board Approval of the Renewal of the Investment Advisory Agreement
The Board of Trustees (the “Board”) of PRIMECAP Odyssey Funds (the “Trust”) is comprised of five Trustees, four of whom are not “interested persons” of the Trust within the meaning of the Investment Company Act of 1940, as amended (the “Independent Trustees”). In October 2012, the Board of Trustees, including the Independent Trustees, approved a one-year renewal of the Trust’s investment advisory agreement with PRIMECAP Management Company (the “Advisor”).
General Information
As part of the annual contract review process, the Independent Trustees, through Trust counsel, requested and received extensive materials, including information related to: the nature, extent,
44
Additional Information
PRIMECAP Odyssey Funds
(Unaudited) – continued
and quality of the services provided to the Funds by the Advisor; information regarding the short- and long-term performance of each Fund relative to market indices and other funds in its Morningstar, Inc. (“Morningstar”) category; the advisory fees paid to the Advisor and the total expense ratio of each Fund compared to the advisory fees and the total expense ratios of other funds in the Fund’s Morningstar category; financial information for the Advisor and information related to the profitability to the Advisor of the investment advisory agreement with the Trust; the extent to which the Advisor expects to achieve economies of scale in connection with the services it provides to each Fund; any ancillary or “fall out” benefits that the Advisor may derive from its relationship with the Funds; and information about the personnel of the Advisor providing services to the Funds. The Independent Trustees also requested and received information regarding the Advisor’s risk controls, risk evaluation processes and compliance program, including brokerage and trading processes, and business continuity plans.
With respect to investment performance, the Board noted that the Advisor had made presentations on a quarterly basis regarding the Funds’ portfolio construction, investment environment, and results. The Board noted that in addition to meeting with the Funds’ portfolio managers on a quarterly basis, they also received presentations from different analysts throughout the year on specific investment sectors and each Fund’s investments in those sectors. In considering the renewal of the agreement, the Board also took into account other information it had received at past Board and committee meetings with respect to various matters.
The Independent Trustees reviewed information from Trust counsel regarding their responsibilities in considering whether to renew the investment advisory agreement for an additional one-year period. In connection with their deliberations, the Board considered such information and factors that they believed, in light of the legal advice furnished to them and their own business judgment, to be relevant. The Board considered renewal of the investment advisory agreement separately for each Fund, although the Board took into account the common interests of all the Funds in its review. In considering these matters, the Board discussed the renewal of the investment advisory agreement with management, and the Independent Trustees met in private sessions with Trust counsel at which no employees of the Advisor were present.
In deciding to approve the renewal of the investment advisory agreement, the Board and the Independent Trustees did not identify a single factor that was controlling. The Board and the Independent Trustees concluded that each of the various factors referred to below favored such approval. The following summary describes the key factors considered by the Independent Trustees and the conclusions thereto that formed the basis for approving the renewal of the investment advisory agreement in light of the legal advice furnished by counsel and their own business judgment. This summary in not inclusive of all of the factors considered.
Nature, Extent, and Quality of Services
The Board considered the services provided by the Advisor to the Funds under the investment advisory agreement, including the background, education, and experience of its key portfolio management, compliance, and operational personnel; its overall financial strength and stability; its resources and efforts to retain, attract, and motivate capable personnel to serve the Funds; and
45
Additional Information
PRIMECAP Odyssey Funds
(Unaudited) – continued
the overall general quality and depth of its organization. The Board also took into account the experience, capability, and integrity of the Advisor’s senior management, the time that the senior management commits to the Funds, and the Advisor’s demonstrated commitment to the Funds; its investment philosophy and processes, including its brokerage and trading practices; its disaster recovery and contingency planning; its oversight of the Funds’ internal control environment with regard to compliance with applicable laws and regulations; each Fund’s Morningstar Stewardship rating of “A”; and the significant investment by each portfolio manager in the Funds that he manages, aligning his interests with those of Fund shareholders. The Board and the Independent Trustees concluded that the nature, extent, and quality of services provided (and expected to be provided) under the investment advisory agreement were of a high level and very satisfactory.
Investment Performance
The Board assessed the performance of each Fund compared with its benchmark and other funds in the same category as determined by Morningstar for the one-year, three-year, five-year, and since-inception periods ended July 31, 2012. The Board made the following observations in reviewing the Funds’ performance:
| • | The PRIMECAP Odyssey Stock Fund outperformed its benchmark, the S&P 500, during the five-year and since inception periods, though it underperformed during the one-year and three-year periods. The Fund’s performance relative to other mutual funds in the Morningstar Large Growth Fund universe was at or above median for all time periods reviewed and was determined to be acceptable. |
| • | The PRIMECAP Odyssey Growth Fund outperformed the S&P 500, its primary benchmark, for the five-year and since inception periods. The Fund underperformed the S&P 500 during the one and three-year periods. It outperformed its secondary benchmark, the Russell 1000 Growth Index, for the period from the Fund’s inception through July 31, 2012 but underperformed the index for the shorter periods. The Fund’s performance was above median for each time period considered and was satisfactory in relation to other mutual funds in Morningstar’s Large Growth Fund universe over the various time periods. |
| • | The PRIMECAP Odyssey Aggressive Growth Fund outperformed both its primary and secondary benchmarks, the S&P 500 and the Russell Midcap Growth Index, for the three-year, five-year, and since inception periods. Over the 12 months ended July 31, 2012, the Fund outperformed the Russell Midcap Growth Index but underperformed the S&P 500. The Fund’s performance generally compared favorably to other mutual funds in the Morningstar Mid-Cap Growth Fund universe and was above median for all time periods considered. |
Based on the information provided to them and in consideration of the specific investment objectives and risk profiles of each Fund, the Board and the Independent Trustees concluded that the performance of each Fund was satisfactory.
46
Additional Information
PRIMECAP Odyssey Funds
(Unaudited) – continued
Advisory Fees and Fund Expenses
The Board reviewed the fees and expenses paid by each Fund to the Advisor as well as an analysis of Morningstar data with respect to the fees and expenses paid by comparable funds. They compared the advisory fees and total expense ratios for each Fund to those of: 1) all other funds in the same Morningstar category (for the Stock and Growth Funds – Large Growth Funds, and for the Aggressive Growth Fund – Mid-Cap Growth Funds); 2) funds in the same Morningstar category with fee structures and characteristics similar to the Funds (e.g., no distribution or shareholder servicing plans, and excluding load funds, index and enhanced index funds, funds of funds, and multi-manager funds); and 3) a peer group of 15 funds with characteristics and asset sizes similar to the Funds. The Independent Trustees noted that, for each Fund, the advisory fee and the total expense ratio was in the lowest quartile (and therefore most favorable to shareholders) in each group reviewed, except for the advisory fee of the Stock Fund, which had the fourth lowest advisory fee of the 15 funds in its peer group (and therefore was in the lowest 27% of funds in the peer group).
The Board also reviewed the fees charged by the Advisor to other clients, including other mutual funds for which it provides sub-advisory services. The Board noted that although those fees were lower than those charged by the Advisor to the Funds, the Advisor provided additional services to the Funds that it did not provide to other clients, including the services of the Trust’s Chief Compliance Officer and other Fund officers, and other personnel involved in the oversight of the Trust’s service providers. The Board and the Independent Trustees determined that the advisory fees and expenses charged to the Funds were reasonable in consideration of the services provided.
Costs and Profits of the Advisor
The Board reviewed information relating to the Advisor’s profitability with respect to the investment advisory agreement and concluded that the profit levels were reasonable in light of the nature, extent, and quality of the services provided by the Advisor to the Funds. The Board also reviewed information regarding the Advisor’s financial position and concluded that the Advisor would be able to continue to provide advisory services to the Fund. As part of this discussion, the Independent Trustees recognized the importance of the profitability of the Advisor, not only in maintaining its own financial condition, but also in maintaining an environment in which it is able to attract and retain talented investment professionals.
Economies of Scale and Other Benefits to the Investment Advisor
The Board recognized the Advisor’s efforts in overseeing the expenses incurred by the Funds. The Independent Trustees considered information regarding the level of advisory fees charged to each Fund and noted that the advisory fees were low relative to other mutual funds with similar investment objectives. The Board and the Independent Trustees concluded that the assets of the Funds were unlikely to grow to levels that would generate economies of scale for the Advisor that would justify additional fee breakpoints in the near future. The Board also considered the benefits received by the Advisor as a result of its relationship with the Funds, including investment advisory fees and the intangible benefits of any favorable publicity arising in connection with the Funds’ performance.
47
Additional Information
PRIMECAP Odyssey Funds
(Unaudited) – continued
Conclusions
Based on their review, including their consideration of each of the factors referred to above, the Board and the Independent Trustees concluded that the compensation payable to the Advisor pursuant to the investment advisory agreement is fair and reasonable in light of the services being provided by the Advisor to each Fund and its shareholders, and that renewal of the investment advisory agreement was in the best interest of each Fund and its shareholders.
48
| PRIMECAP Odyssey Funds (Unaudited) |
Portfolio Managers
PRIMECAP Management Company has five portfolio managers who together have more than 140 years of investment experience. The portfolio managers primarily responsible for overseeing the Funds’ investments are:
| Name | Years of Experience | |||
Mitchell J. Milias | 48 | |||
Theo A. Kolokotrones | 42 | |||
Joel P. Fried | 27 | |||
Alfred W. Mordecai | 15 | |||
M. Mohsin Ansari | 12 | |||
Each of these five individuals manages a portion of the PRIMECAP Odyssey Stock Fund and the PRIMECAP Odyssey Growth Fund. The PRIMECAP Odyssey Aggressive Growth Fund is primarily managed by Messrs. Kolokotrones, Fried, Mordecai, and Ansari. A small portion of each Fund’s assets may be managed by individuals in the Investment Advisor’s research department.
Officers and Trustees
The Trust’s officers, who oversee the Funds’ daily operations, are appointed by the Board of Trustees. The trustees are responsible for the overall management of the Trust, including establishing the Funds’ policies and general supervision and review of their investment activities. The Statement of Additional Information includes additional information about the trustees and is available, without charge, by calling 1-800-729-2307 or at the Funds’ website at www.odysseyfunds.com.
Executive Officers. The table below sets forth certain information about each of the Trust’s executive officers.
| Name, Address (Year of Birth) | Position(s) Held with Trust | Term of Office; Length of Time Served | Principal Occupation(s) During Past 5 Years | |||
Theo A. Kolokotrones 225 South Lake Ave. Pasadena, CA 91101-3005 | Co-Chief Executive Officer | Indefinite; Since 09/04 | Vice-Chairman, Director, Portfolio Manager, and Principal PRIMECAP Management Company | |||
Joel P. Fried 225 South Lake Ave. Pasadena, CA 91101-3005 (1962) | Co-Chief Executive Officer and Trustee | Indefinite; Since 09/04 | President, Director, Portfolio Manager, and Principal PRIMECAP Management Company |
49
Management
PRIMECAP Odyssey Funds
(Unaudited) – continued
| Name, Address (Year of Birth) | Position(s) Held with Trust | Term of Office; Length of Time Served | Principal Occupation(s) During Past 5 Years | |||
Alfred W. Mordecai 225 South Lake Ave. Pasadena, CA 91101-3005 (1967) | Co-Chief Executive Officer | Indefinite; Since 10/12 | Executive Vice President, Director, Portfolio Manager, and Principal PRIMECAP Management Company | |||
Michael J. Ricks 225 South Lake Ave. Pasadena, CA 91101-3005 (1977) | Chief Financial Officer, Chief Administrative Officer, and Secretary | Indefinite; Since 03/11 | Director of Fund Administration, PRIMECAP Management Company (since 2011); Vice President, Fund Administration and Compliance, U.S. Bancorp Fund Services, LLC (2001-2011) | |||
Karen Chen 225 South Lake Ave. Pasadena, CA 91101-3005 (1973) | Vice President of Compliance, Chief Compliance Officer, and AML Officer | Indefinite; Since 10/04 | Chief Compliance Officer, Director of Compliance and Reporting PRIMECAP Management Company |
“Independent” Trustees. The table below sets forth certain information about each of the trustees of the Trust who is not an “interested person” of the Trust as defined in the 1940 Act (“Independent Trustees”).
| Name, Address (Year of Birth) | Position(s) Held with Trust | Term of Office; Length of Time Served | Principal Occupation(s) During Past 5 Years | Number of Portfolios in Fund Complex by Trustee1 | Other Director- ships Held by Trustee | |||||
Benjamin F. Hammon 225 South Lake Ave. Pasadena, CA 91101-3005 (1935) | Chairman of the Board and Trustee | Indefinite; Since 09/04 | Retired; Director, Institutional Equity Sales, Salomon Smith Barney Inc. (1963-1998) | 3 | None | |||||
Wayne H. Smith 225 South Lake Ave. Pasadena, CA 91101-3005 (1941) | Chairman of the Audit Committee and Trustee | Indefinite; Since 09/04 | Retired; President, Wayne H. Smith Consulting, Inc. (2002- 2007); Vice President, Financial Services, Avery Dennison Corporation (2001-2002); Vice President, Financial Services, and Treasurer, Avery Dennison Corporation (1999-2001) | 3 | None |
50
Management
PRIMECAP Odyssey Funds
(Unaudited) – continued
| Name, Address (Year of Birth) | Position(s) Held with Trust | Term of Office; Length of Time Served | Principal Occupation(s) During Past 5 Years | Number of Portfolios in Fund Complex by Trustee1 | Other Director- ships Held by Trustee | |||||
| Joseph G. Uzelac 225 South Lake Ave. Pasadena, CA 91101-3005 (1944) | Trustee | Indefinite; Since 10/07 | Retired; Managing Director, Lehman Brothers Global Investment Bank (1988-2007) | 3 | None | |||||
| Elizabeth D. Obershaw 225 South Lake Ave. Pasadena, CA 91101-3005 (1960) | Trustee | Indefinite; Since 06/08 | Managing Director, Horsley Bridge Partners, an investment advisor (2007-present); Vice President and Chief Investment Officer, Hewlett-Packard Company (1991-2007); Hewlett-Packard Company (1983-1991) | 3 | None |
“Interested” Trustees. The table below sets forth certain information about each of the trustees of the Trust who is an “interested person” of the Trust as defined by the 1940 Act.
| Name, Address (Year of Birth) | Position(s) Held with Trust | Term of Office; Length of Time Served | Principal Occupation(s) During Past 5 Years | Number of Portfolios in Fund Complex by Trustee1 | Other Director- ships Held by Trustee | |||||
| Joel P. Fried2 225 South Lake Ave. Pasadena, CA 91101-3005 (1962) | Co-Chief Executive Officer and Trustee | Indefinite; Since 09/04 | President, Director, Portfolio Manager, and Principal PRIMECAP Management Company | 3 | None |
| 1 | Fund Complex includes any funds, series of funds, or trusts that share the same advisor or that hold themselves out to investors as related companies. |
| 2 | Mr. Fried is an “interested person” of the Trust, as defined by the 1940 Act, because of his employ- ment with PRIMECAP Management Company, the investment advisor to the Trust. |
51
Investment Advisor
PRIMECAP MANAGEMENT COMPANY
225 South Lake Avenue, Suite 400
Pasadena, California 91101
•
Distributor
QUASAR DISTRIBUTORS, LLC
615 East Michigan Street, 4th Floor
Milwaukee, Wisconsin 53202
•
Custodian
THE BANK OF NEW YORK MELLON
One Wall Street
New York, New York 10286
•
Transfer Agent
U.S. BANCORP FUND SERVICES, LLC
615 East Michigan Street, 3rd Floor
Milwaukee, Wisconsin 53202
•
Administrator
U.S. BANCORP FUND SERVICES, LLC
2020 East Financial Way, Suite 100
Glendora, California 91741
•
Legal Counsel
BINGHAM McCUTCHEN LLP
355 South Grand Avenue, Suite 4400
Los Angeles, California 90071
•
Independent Registered Public Accounting Firm
PRICEWATERHOUSECOOPERS LLP
Three Embarcadero Center
San Francisco, California 94111
This report is intended for the shareholders of the PRIMECAP Odyssey Funds and may not be used as sales literature unless preceded or accompanied by a current prospectus.
Past performance results shown in this report should not be considered a representation of future performance. Share price and returns will fluctuate so that shares, when redeemed, may be worth more or less than their original cost. Statements and other information herein are dated and are subject to change.
PRIMECAP, PRIMECAP Odyssey, and the PRIMECAP Odyssey logo are trademarks of PRIMECAP Management Company.
Item 2. Code of Ethics.
The registrant has adopted a code of ethics that applies to the registrant’s principal executive officer and principal financial officer. The registrant has not made any amendments to its code of ethics during the period covered by this report. The registrant has not granted any waivers from any provisions of the code of ethics during the period covered by this report.
The registrant undertakes to provide to any person without charge, upon request, a copy of its code of ethics by mail when they call the registrant at 1-800-729-2307.
Item 3. Audit Committee Financial Expert.
The registrant’s Board of Trustees has determined that there is at least one audit committee financial expert serving on its audit committee. Wayne Smith is the “audit committee financial expert” and is considered to be “independent” as each term is defined in Item 3 of Form N-CSR.
Item 4. Principal Accountant Fees and Services.
The registrant has engaged its principal accountant to perform audit services, audit-related services, and tax services during the past two fiscal years. “Audit services” refer to performing an audit of the registrant’s annual financial statements or services that are normally provided by the accountant in connection with statutory and regulatory filings or engagements for those fiscal years. “Audit-related services” refer to the assurance and related services by the principal accountant that are reasonably related to the performance of the audit. “Tax services” refer to professional services rendered by the principal accountant for tax compliance, tax advice, and tax planning and specifically relate to the accountant’s review of the registrant’s federal and state tax returns. There were no other services provided by the principal accountant to the registrant during the past two fiscal years. The following table details the aggregate fees billed or expected to be billed for each of the last two fiscal years for audit fees, audit-related fees, tax fees and other fees by the principal accountant.
| FYE 10/31/2012 | FYE 10/31/2011 | |||||||
Audit Fees | $ | 85,000 | $ | 80,350 | ||||
Audit-Related Fees | $ | 0 | $ | 0 | ||||
Tax Fees | $ | 13,200 | $ | 12,450 | ||||
All Other Fees | $ | 0 | $ | 0 | ||||
The audit committee has adopted pre-approval policies and procedures that require the audit committee to pre-approve all audit and non-audit services of the registrant, including services provided to any entity affiliated with the registrant.
The percentages of fees billed by PricewaterhouseCoopers LLP applicable to non-audit services that were pre-approved by the audit committee were as follows:
| FYE 10/31/2012 | FYE 10/31/2011 | |||||||
Audit-Related Fees | 100 | % | 100 | % | ||||
Tax Fees | 100 | % | 100 | % | ||||
All Other Fees | 100 | % | 100 | % | ||||
All of the principal accountant’s hours spent on auditing the registrant’s financial statements were attributed to work performed by full-time permanent employees of the principal accountant.
The following table indicates the aggregate non-audit fees billed or expected to be billed by the registrant’s accountant for services to the registrant and to the registrant’s investment adviser (and any other entity, controlling, controlled by, or under common control with the adviser that provides ongoing services to the registrant, for the last two fiscal years.
Non-Audit Related Fees | FYE 10/31/2012 | FYE 10/31/2011 | ||||||
Registrant | $ | 13,200 | $ | 12,450 | ||||
Registrant’s Investment Adviser | $ | 0 | $ | 0 | ||||
Item 5. Audit Committee of Listed Registrants.
Not applicable to registrants who are not listed issuers (as defined in Rule 10A-3 under the Securities Exchange Act of 1934).
Item 6. Investments.
Schedule of Investments is included as part of the report to shareholders filed under Item 1 of this Form.
Item 7. Disclosure of Proxy Voting Policies and Procedures for Closed-End Management Investment Companies.
Not applicable to open-end investment companies.
Item 8. Portfolio Managers of Closed-End Management Investment Companies.
Not applicable to open-end investment companies.
Item 9. Purchases of Equity Securities by Closed-End Management Investment Company and Affiliated Purchasers.
Not applicable to open-end investment companies.
Item 10. Submission of Matters to a Vote of Security Holders.
There have been no material changes to the procedures by which shareholders may recommend nominees to the registrant’s board of trustees.
Item 11. Controls and Procedures.
| (a) | The Registrant’s Co-Chief Executive Officers and Chief Financial Officer have reviewed the Registrant’s disclosure controls and procedures (as defined in Rule 30a-3(c) under the Investment Company Act of 1940 (the “Act”)) as of a date within 90 days of the filing of this report, as required by Rule 30a-3(b) under the Act and Rules 13a-15(b) or 15d-15(b) under the Securities Exchange Act of 1934. Based on their review, such officers have concluded that the disclosure controls and procedures are effective in ensuring that information required to be disclosed in this report is appropriately recorded, processed, summarized and reported and made known to them by others within the Registrant and by the Registrant’s service provider. |
| (b) | There were no changes in the Registrant’s internal control over financial reporting (as defined in Rule 30a-3(d) under the Act) that occurred during the second fiscal quarter of the period covered by this report that has materially affected, or is reasonably likely to materially affect, the Registrant’s internal control over financial reporting. |
Item 12. Exhibits.
| (a) | (1) Any code of ethics or amendment thereto, that is the subject of the disclosure required by Item 2, to the extent that the registrant intends to satisfy Item 2 requirements through filing an exhibit. Not applicable. |
(2) A separate certification for each principal executive and principal financial officer pursuant to Section 302 of the Sarbanes-Oxley Act of 2002. Filed herewith.
(3) Any written solicitation to purchase securities under Rule 23c-1 under the Act sent or given during the period covered by the report by or on behalf of the registrant to 10 or more persons. Not applicable to open-end investment companies.
| (b) | Certifications pursuant to Section 906 of the Sarbanes-Oxley Act of 2002. Furnished herewith. |
SIGNATURES
Pursuant to the requirements of the Securities Exchange Act of 1934 and the Investment Company Act of 1940, the registrant has duly caused this report to be signed on its behalf by the undersigned, thereunto duly authorized.
| PRIMECAP Odyssey Funds | ||||
| By | /s/ Joel P. Fried | |||
| Joel P. Fried, Co-Chief Executive Officer | ||||
| Date | December 21, 2012 | |||
| By | /s/ Theo A. Kolokotrones | |||
| Theo A. Kolokotrones, Co-Chief Executive Officer | ||||
| Date | December 21, 2012 | |||
| By | /s/ Alfred W. Mordecai | |||
| Alfred W. Mordecai, Co-Chief Executive Officer | ||||
| Date | December 21, 2012 | |||
Pursuant to the requirements of the Securities Exchange Act of 1934 and the Investment Company Act of 1940, this report has been signed below by the following persons on behalf of the registrant and in the capacities and on the dates indicated.
| By | /s/ Joel P. Fried | |||
| Joel P. Fried, Co-Chief Executive Officer | ||||
| Date | December 21, 2012 | |||
| By | /s/ Theo A. Kolokotrones | |||
| Theo A. Kolokotrones, Co-Chief Executive Officer | ||||
| Date | December 21, 2012 | |||
| By | /s/ Alfred W. Mordecai | |||
| Alfred W. Mordecai, Co-Chief Executive Officer | ||||
| Date | December 21, 2012 | |||
| By | /s/ Michael J. Ricks | |||
| Michael J. Ricks, Chief Financial Officer | ||||
| Date | December 21, 2012 | |||