As filed with the Securities and Exchange Commission on June 21, 2012
UNITED STATES
SECURITIES AND EXCHANGE COMMISSION
Washington, D.C. 20549
FORM N-CSR
CERTIFIED SHAREHOLDER REPORT OF REGISTERED
MANAGEMENT INVESTMENT COMPANIES
Investment Company Act file number: 811-21597
PRIMECAP Odyssey Funds
(Exact name of registrant as specified in charter)
225 South Lake Avenue, Suite 400
Pasadena, CA 91101
(Address of principal executive offices) (Zip code)
Michael J. Ricks
PRIMECAP Management Company
225 South Lake Avenue, Suite 400
Pasadena, CA 91101
(Name and address of agent for service)
Registrant’s telephone number, including area code: (626) 304-9222
Date of fiscal year end: October 31
Date of reporting period: April 30, 2012
Item 1. Reports to Stockholders.
Item 1. Reports to Stockholders.
SEMIANNUAL REPORT
For the Six Months Ended April 30, 2012

PRIMECAP ODYSSEY STOCK (POSKX)
PRIMECAP ODYSSEY GROWTH (POGRX)
PRIMECAP ODYSSEY AGGRESSIVE GROWTH (POAGX)
 | PRIMECAP Odyssey Funds |
| 2 | ||||
| 9 | ||||
| 9 | ||||
| 10 | ||||
| 11 | ||||
| 12 | ||||
| 14 | ||||
| 14 | ||||
| 18 | ||||
| 22 | ||||
| 26 | ||||
| 27 | ||||
| 28 | ||||
| 28 | ||||
| 29 | ||||
| 30 | ||||
| 31 | ||||
| 31 | ||||
| 32 | ||||
| 33 | ||||
| 34 | ||||
| 42 | ||||
| 44 | ||||
| 45 | ||||
1
| PRIMECAP Odyssey Funds |
Dear Fellow Shareholders,
For the six months ended April 30, 2012, the PRIMECAP Odyssey Stock Fund, PRIMECAP Odyssey Growth Fund, and PRIMECAP Odyssey Aggressive Growth Fund produced total returns of +9.13%, +8.29%, and +9.35%, respectively. By comparison, the unmanaged S&P 500 Index (S&P 500) produced a total return of +12.77% for the period.
Led by the consumer discretionary, information technology, and financials sectors, the S&P 500 returned almost 13% in the first six months of the fiscal year. Recent data suggests that the U.S. economy has resumed its recovery from the recession after a period of slower growth. The estimated +2.2% growth in real GDP in the first quarter of 2012 followed a 3.0% increase in real GDP in the fourth quarter of 2011, the highest rate of growth since the second quarter of 2010. Consumer spending has also reaccelerated. Corporate profits continue to grow with increased industrial production and higher capacity utilization. However, there are reasons for caution regarding the sustainability of this recovery. Unemployment has declined from 9.0% a year ago, but it remains high at 8.1% and likely understates the challenges of the current job market by excluding those no longer looking for jobs (an additional 342,000 in April alone) and by not reflecting a growing community of underemployed workers. Housing markets remain weak, and governments at the federal, state, and local levels face significant fiscal challenges. Furthermore, concerns about the sovereign debt crisis in Europe, slowing growth in China, and political unrest in the Middle East add uncertainty to the global economic outlook.
The PRIMECAP Odyssey Funds remain focused on investing in high quality companies that, in our judgment, offer better growth prospects than are anticipated by the market. Each of the three PRIMECAP Odyssey Funds continues to be overweight in the health care and information technology sectors and underweight in the financials, consumer staples, and energy sectors.
During the first six months of this fiscal year, information technology was the sector with the second highest returns in the S&P 500, trailing only the consumer discretionary sector. However, the information technology stocks in all three PRIMECAP Odyssey Funds hurt relative results due to poor stock selection. None of the funds owned Apple Inc. (+44.3%), which is the largest constituent of the S&P 500 based on market capitalization. Poor stock selection in the industrials sector also contributed to the disappointing relative results in all three funds. Relative returns in both the PRIMECAP Odyssey Growth Fund and PRIMECAP Odyssey Aggressive Growth Fund were further hurt by poor stock selection in the consumer discretionary sector.
A more detailed discussion of the results of each PRIMECAP Odyssey Fund follows.
PRIMECAP Odyssey Stock Fund
From November 1, 2011 to April 30, 2012, the Stock Fund’s total return of +9.13% trailed the S&P 500’s total return of +12.77%. In addition to the negative stock selection in the information technology and industrials sectors, relative results were further hurt by poor stock selection in the materials and consumer staples sectors as well as an underweight position in the financials sector.
2
Letter to Shareholders
PRIMECAP Odyssey Funds
continued
Two information technology stocks, Electronic Arts (-34.1%) and Research in Motion (-29.2%), were among the largest detractors from the fund’s results. Electronic Arts, a leading manufacturer of video games, experienced a decline in the number of active subscribers to its “Star Wars: Knights of the Old Republic” game, fueling doubts about the company’s ability to transition from traditional video games to online gaming. Research in Motion’s loss of market share in U.S. smartphones and its delays in the development of its next-generation operating system contributed to the stock’s decline. However, we believe there is significant value in the stock at current levels, given the recurring nature of the company’s service revenues and its strong position in international markets, which now represent approximately 80% of revenues.
Other major detractors included Arkansas Best (-25.3%), Carnival (-6.2%), Kellogg (-5.1%), and Range Resources (-3.2%). On the positive side were Visa (+31.9%), Amgen (+25.4%), and Microsoft (+21.9%).
The top 10 holdings, which collectively represent 33.2% of the portfolio at the period end, are listed below:
PRIMECAP Odyssey Stock Fund Top 10 Holdings as of 4/30/12 | Ending % of Total Portfolio* | |||
Roche Holding AG | 4.6 | |||
Johnson & Johnson | 4.1 | |||
Amgen Inc. | 4.1 | |||
Texas Instruments Inc. | 3.6 | |||
Microsoft Corp. | 3.5 | |||
Charles Schwab Corp. | 3.2 | |||
Eli Lilly & Co. | 2.7 | |||
Medtronic, Inc. | 2.6 | |||
Novartis AG (ADS) | 2.5 | |||
Marsh & McLennan Cos. | 2.3 | |||
Total % of Portfolio | 33.2 | % | ||
| * | The percentage is calculated by using the market value of the security divided by the market value of the total investments of the fund. |
PRIMECAP Odyssey Growth Fund
From November 1, 2011 to April 30, 2012, the Growth Fund’s total return was +8.29%, which trailed both the S&P 500’s total return of +12.77% and the Russell 1000 Growth Index’s total return of +14.13%. The fund’s poor relative returns were due primarily to negative stock selection in the information technology sector. Negative stock selection in the industrials and consumer
3
Letter to Shareholders
PRIMECAP Odyssey Funds
continued
discretionary sectors as well as an underweight position in the financials sector further hurt the fund’s relative results. This was partially offset by the fund’s underweight positions in the utilities and energy sectors.
Similar to the Stock Fund, Electronic Arts (-34.1%) and Research in Motion (-29.2%) were among the biggest detractors from relative results. Two of the largest holdings in the fund, Seattle Genetics (-10.1%) and ImmunoGen (-6.1%), also hurt returns. Seattle Genetics has been under pressure as the launch of its newly approved drug ADCETRIS has progressed more slowly than some investors had anticipated. Both Seattle Genetics and ImmunoGen are biotechnology companies which focus on developing targeted anti-cancer therapies using their expertise in monoclonal antibodies. AMR Corp. (-90.1%) and Southwestern Energy (-24.9%) were also among the largest detractors. AMR Corp. filed for bankruptcy in November after failing to reach new agreements with its labor unions.
Stratasys (+82.6%), a manufacturer of 3-D printer systems, was the largest contributor to the fund’s results, followed by several health care stocks including Accuray (+92.4%), Conceptus (+63.1%), Abiomed (+61.6%), Nektar Therapeutics (+40.7%), and Amgen (+25.4%). Visa (+32.4%) and Limited Brands (+23.3%) also helped the fund’s relative returns.
The top 10 holdings, which collectively represent 31.4% of the portfolio at the period end, are listed below:
PRIMECAP Odyssey Growth Fund Top 10 Holdings as of 4/30/12 | Ending % of Total Portfolio* | |||
Amgen Inc. | 4.7 | |||
Roche Holding AG | 4.6 | |||
Seattle Genetics Inc. | 4.2 | |||
ImmunoGen Inc. | 3.5 | |||
Biogen Idec Inc. | 2.7 | |||
Charles Schwab Corp. | 2.6 | |||
Adobe Systems Inc. | 2.4 | |||
Google Inc. – Class A | 2.3 | |||
Nuance Communications, Inc. | 2.2 | |||
Stratasys Inc. | 2.2 | |||
Total % of Portfolio | 31.4 | % | ||
| * | The percentage is calculated by using the market value of the security divided by the market value of the total investments of the fund. |
4
Letter to Shareholders
PRIMECAP Odyssey Funds
continued
PRIMECAP Odyssey Aggressive Growth Fund
From November 1, 2011 to April 30, 2012, the Aggressive Growth Fund’s total return was +9.35%, which trailed both the S&P 500’s total return of +12.77% and the Russell Midcap Growth Index’s total return of +12.26%. Similar to the other two PRIMECAP Odyssey Funds, poor stock selection in the information technology and industrials sectors was the primary reason for the Aggressive Growth Fund’s poor relative return. Poor stock selection in the consumer discretionary and consumer staples sectors, along with underweight positions in the financials and consumer discretionary sectors, further hurt results. This was partially offset by positive stock selection in the health care sector.
InterMune (-59.1%), Electronic Arts (-34.1%), and Research in Motion (-29.2%) were among the largest detractors from the fund’s relative results. InterMune was down due to concerns regarding a slower than expected launch of its recently approved drug, Esbriet, as well as new hurdles for reimbursement in Europe. Despite these recent difficulties, we believe the company’s current valuation does not adequately reflect the drug’s potential sales. Seattle Genetics (-10.1%) and ImmunoGen (-6.1%), two of the top 10 holdings in the fund, further hurt returns, as did the bankruptcy of AMR Corp. (-90.1%).
Several of the largest contributors to the fund’s returns were health care stocks, including Pharmacyclics (+109.3%), Accuray (+92.4%), Conceptus (+63.1%), Abiomed (+61.6%), and Nektar Therapeutics (+40.7%). Pharmacyclics’ lead compound continues to show impressive efficacy and safety in treating multiple cancer types in clinical trials. The company signed a collaboration agreement with Johnson & Johnson to accelerate the development of this drug. Other top contributors included Stratasys (+82.6%), Guidance Software (+57.9%), and Shutterfly (+36.9%).
5
Letter to Shareholders
PRIMECAP Odyssey Funds
continued
The top 10 holdings, which collectively represent 34.5% of the portfolio at the period end, are listed below:
PRIMECAP Odyssey Aggressive Growth Fund Top 10 Holdings as of 4/30/12 | Ending % of Total Portfolio* | |||
Roche Holding AG | 4.7 | |||
Pharmacyclics Inc. | 4.4 | |||
Seattle Genetics Inc. | 4.4 | |||
Abiomed Inc. | 4.0 | |||
ImmunoGen Inc. | 3.5 | |||
Stratasys Inc. | 3.1 | |||
Cepheid | 2.9 | |||
Google Inc. - Class A | 2.8 | |||
Conceptus, Inc. | 2.4 | |||
Adobe Systems Inc. | 2.3 | |||
Total % of Portfolio | 34.5 | % | ||
| * | The percentage is calculated by using the market value of the security divided by the market value of the total investments of the fund. |
Outlook
Looking ahead to the rest of fiscal year 2012 and beyond, we continue to view U.S. equities as attractive investment opportunities relative to most other asset classes. Interest rates remain low, inflation appears to be under control, and corporate profit margins remain at high levels. We are further encouraged by what we consider to be low valuations in sectors like information technology and health care where the funds have overweight positions. Additionally, many of the funds’ holdings in these sectors have very strong balance sheets and generate significant free cash flows.
The funds’ significant holdings in the information technology sector were a major reason for the poor relative results of all three PRIMECAP Odyssey Funds during the first half of the fiscal year. Despite this, we remain enthusiastic about the potential investment returns for many companies in that sector. A groundswell of innovation continues to drive the evolution of the Internet. Cloud computing, social networking, search, mobility, and e-commerce are changing the ways in which individuals and enterprises interact with each other. Cheaper and faster mobile devices are enabling users to connect to the Internet at any time, from any location, and on any device. As users engage more with the Internet, they generate and share an increasing amount of data, photos, videos, and other content, which in turn should drive higher demand for semiconductors, computer hardware, software, and storage.
6
Letter to Shareholders
PRIMECAP Odyssey Funds
continued
We also remain positive on the outlook for many stocks in the health care sector. Following a period of numerous political and regulatory challenges, we are encouraged by the uptick in new drug approvals by the U.S. Food and Drug Administration in the past year. The aging global population, combined with rising standards of living in developing markets such as China, India, and Brazil, should lead to greater demand for health care products and services. We continue to believe that the pharmaceutical, biotechnology, and medical device products currently in development represent more efficient ways to treat diseases.
We are particularly excited about the prospects for targeted, personalized medicines. Advances in genetic research, diagnostic tools, and targeted therapies may enable more effective treatments for individuals in the near future. The dramatic decline in the cost of sequencing human genomes, and the corresponding increase in available genetic information, is one element that is enabling advances in this area. Another enabling factor is the increase in computing power available to analyze this information. Combined, these two factors are helping researchers develop a more fundamental understanding of the causes of diseases, which in turn supports the development of therapies to treat these diseases. At the same time, new diagnostic tools are helping identify patients or groups of patients for whom specific treatments are more effective.
The correlation among stocks in the S&P 500 has been exceptionally high during the past year. Going forward, we believe stock selection will be more critical. During periods of heightened fear and uncertainty, such as the recent recession, investors are less likely to differentiate among stocks. However, as the economy and financial markets return to greater stability, correlation among stocks has tended to decrease, and stock selection is rewarded. While we do not expect particularly strong growth in U.S. GDP in the near term, we think there are opportunities to increase the funds’ holdings in existing positions as well as to establish new positions at attractive valuations.
In Loving Memory
We are saddened to announce the passing of Howard B. Schow on April 8, 2012 at the age of 84. Mr. Schow co-founded PRIMECAP Management Company in 1983 and had co-managed the PRIMECAP Odyssey Funds since their inception in 2004. His unwavering focus, persistent optimism, and competitive spirit inspired all of us. Although he will be greatly missed, Mr. Schow’s indelible imprint on PRIMECAP lives on. The other co-managers of the funds and an additional portfolio manager, M. Mohsin Ansari, have assumed responsibility for the portion of the PRIMECAP Odyssey Funds that was previously managed by Mr. Schow. As we honor his life and celebrate his extraordinary career, we will continue to pursue the same long-term investment approach that he was so instrumental in creating at PRIMECAP.
Sincerely,
PRIMECAP Management Company
May 12, 2012
7
Letter to Shareholders
PRIMECAP Odyssey Funds
continued
Past performance is not a guarantee of future results.
The funds invest in smaller companies, which involve additional risks such as limited liquidity and greater volatility. All funds may invest in foreign securities, which involves greater volatility and political, economic and currency risks and differences in accounting methods. Mutual fund investing involves risk, and loss of principal is possible. Growth stocks typically are more volatile than value stocks; however, value stocks have a lower expected growth rate in earnings and sales.
Please refer to the Schedule of Investments for details of fund holdings. Fund holdings and sector allocations are subject to change at any time and are not recommendations to buy or sell any security.
The S&P 500 Index is a broad based index of 500 stocks, which is widely recognized as representative of the market in general. The Russell 1000 Growth Index is an index that measures the performance of those Russell 1000 companies with higher price-to-book ratios and higher forecasted growth values. The Russell Midcap Growth Index measures the performance of those Russell Midcap companies with higher price-to-book ratios and higher forecasted growth values. You cannot invest directly in an index. Correlation is a statistical measure of how two securities move in relation to each other. Free cash flow is the amount of cash a company has after expenses, debt service, capital expenditures, and dividends.
The information provided herein represents the opinions of PRIMECAP Management Company and is not intended to be a forecast of future events, a guarantee of future results, or investment advice.
8
|
The following chart compares the value of a hypothetical $10,000 investment in the PRIMECAP Odyssey Stock Fund from November 1, 2004 (inception) to April 30, 2012, compared to the S&P 500 Index. This chart illustrates the performance of a hypothetical $10,000 investment made on the fund’s inception date and is not intended to imply any future performance. The returns shown do not reflect the deduction of taxes that a shareholder would pay on fund distributions or the redemption of fund shares. The chart assumes reinvestment of capital gains and dividends.
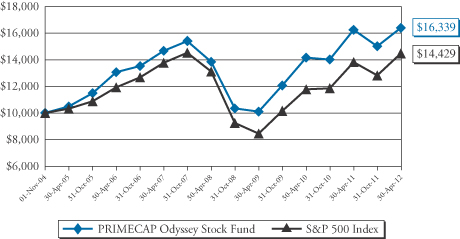
| Total Return Period Ended April 30, 2012 | ||||||||||||
| 1 Year | Annualized 5 Year | Annualized Since Inception^ | ||||||||||
PRIMECAP Odyssey Stock Fund | 0.95% | 2.23% | 6.77% | |||||||||
S&P 500 Index* | 4.76% | 1.01% | 5.02% | |||||||||
Performance data quoted represents past performance and does not guarantee future results. The investment return and principal value of an investment will fluctuate so that an investor’s shares, when redeemed, may be worth more or less than their original cost. Current performance of the fund may be lower or higher than the performance quoted. Performance data current to the most recent month end may be obtained by calling 1-800-729-2307. The funds impose a 2% redemption fee on shares held less than 60 days.
| * | The S&P 500 is a market capitalization weighted index of 500 large-capitalization stocks commonly used to represent the U.S. equity market. |
| ^ | November 1, 2004 |
9
| Performance Graphs |
The following chart compares the value of a hypothetical $10,000 investment in the PRIMECAP Odyssey Growth Fund from November 1, 2004 (inception) to April 30, 2012, compared to the S&P 500 Index. This chart illustrates the performance of a hypothetical $10,000 investment made on the fund’s inception date and is not intended to imply any future performance. The returns shown do not reflect the deduction of taxes that a shareholder would pay on fund distributions or the redemption of fund shares. The chart assumes reinvestment of capital gains and dividends.
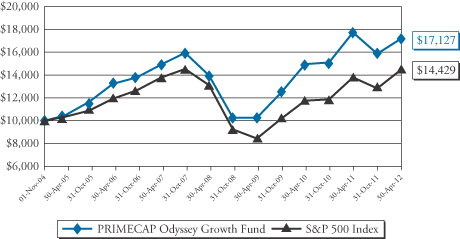
| Total Return Period Ended April 30, 2012 | ||||||||||||
| 1 Year | Annualized 5 Year | Annualized Since Inception^ | ||||||||||
PRIMECAP Odyssey Growth Fund | -3.01% | 2.90% | 7.45% | |||||||||
S&P 500 Index* | 4.76% | 1.01% | 5.02% | |||||||||
Performance data quoted represents past performance and does not guarantee future results. The investment return and principal value of an investment will fluctuate so that an investor’s shares, when redeemed, may be worth more or less than their original cost. Current performance of the fund may be lower or higher than the performance quoted. Performance data current to the most recent month end may be obtained by calling 1-800-729-2307. The funds impose a 2% redemption fee on shares held less than 60 days.
| * | The S&P 500 is a market capitalization weighted index of 500 large-capitalization stocks commonly used to represent the U.S. equity market. |
| ^ | November 1, 2004 |
10
| Performance Graphs |
The following chart compares the value of a hypothetical $10,000 investment in the PRIMECAP Odyssey Aggressive Growth Fund from November 1, 2004 (inception) to April 30, 2012, compared to the S&P 500 Index. This chart illustrates the performance of a hypothetical $10,000 investment made on the fund’s inception date and is not intended to imply any future performance. The returns shown do not reflect the deduction of taxes that a shareholder would pay on fund distributions or the redemption of fund shares. The chart assumes reinvestment of capital gains and dividends.
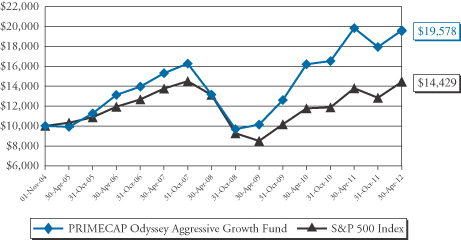
| Total Return Period Ended April 30, 2012 | ||||||||||||
| 1 Year | Annualized 5 Year | Annualized Since Inception^ | ||||||||||
PRIMECAP Odyssey Aggressive Growth Fund | -1.13% | 5.08% | 9.38% | |||||||||
S&P 500 Index* | 4.76% | 1.01% | 5.02% | |||||||||
Performance data quoted represents past performance and does not guarantee future results. The investment return and principal value of an investment will fluctuate so that an investor’s shares, when redeemed, may be worth more or less than their original cost. Current performance of the fund may be lower or higher than the performance quoted. Performance data current to the most recent month end may be obtained by calling 1-800-729-2307. The funds impose a 2% redemption fee on shares held less than 60 days.
| * | The S&P 500 is a market capitalization weighted index of 500 large-capitalization stocks commonly used to represent the U.S. equity market. |
| ^ | November 1, 2004 |
11
| PRIMECAP Odyssey Funds |
PRIMECAP Odyssey Stock Fund
Consumer Discretionary | 9.9% | |||
Consumer Staples | 3.0% | |||
Energy | 5.8% | |||
Financials | 7.5% | |||
Health Care | 26.9% | |||
Industrials | 11.6% | |||
Information Technology | 20.3% | |||
Materials | 2.9% | |||
Utilities | 1.9% | |||
Short Term Investments and Other Assets | 10.2% | |||
Total | 100.0% |
PRIMECAP Odyssey Growth Fund
Consumer Discretionary | 8.3% | |||
Consumer Staples | 0.3% | |||
Energy | 4.6% | |||
Financials | 5.7% | |||
Health Care | 39.2% | |||
Industrials | 7.7% | |||
Information Technology | 28.1% | |||
Materials | 1.4% | |||
Short Term Investments and Other Assets | 4.7% | |||
Total | 100.0% |
The tables above list sector allocations as a percentage of each fund’s total net assets as of April 30, 2012. The management report makes reference to average allocations during the period. As a result, the sector allocations above may differ from those discussed in the management report.
12
Sector Breakdown
PRIMECAP Odyssey Funds
continued
PRIMECAP Odyssey Aggressive Growth Fund
Consumer Discretionary | 5.6% | |||
Consumer Staples | 1.5% | |||
Energy | 3.2% | |||
Financials | 1.9% | |||
Health Care | 41.2% | |||
Industrials | 6.3% | |||
Information Technology | 31.6% | |||
Materials | 1.9% | |||
Short Term Investments, net of Other Liabilities | 6.8% | |||
Total | 100.0% |
The table above lists sector allocations as a percentage of the fund’s total net assets as of April 30, 2012. The management report makes reference to average allocations during the period. As a result, the sector allocations above may differ from those discussed in the management report.
13
| April 30, 2012 (Unaudited) |
| Shares | Value | |||||||
| COMMON STOCKS – 89.8% | ||||||||
| Consumer Discretionary – 9.9% | ||||||||
| 183,600 | Ascena Retail Group, Inc. (a) | $ | 3,760,128 | |||||
| 102,600 | Bed Bath & Beyond, Inc. (a) | 7,222,014 | ||||||
| 246,600 | CarMax, Inc. (a) | 7,612,542 | ||||||
| 755,800 | Carnival Corp. | 24,555,942 | ||||||
| 64,500 | DIRECTV – Class A (a) | 3,177,915 | ||||||
| 585,100 | Limited Brands, Inc. | 29,079,470 | ||||||
| 5,000 | Macy’s, Inc. | 205,100 | ||||||
| 300,000 | Mattel, Inc. | 10,080,000 | ||||||
| 8,100 | Men’s Wearhouse, Inc. (The) | 300,024 | ||||||
| 169,200 | P. F. Chang’s China Bistro, Inc. | 6,715,548 | ||||||
| 50,000 | Ross Stores, Inc. | 3,079,500 | ||||||
| 59,900 | Sony Corp. – ADR | 970,979 | ||||||
| 193,400 | TJX Cos., Inc. | 8,066,714 | ||||||
| 255,000 | Walt Disney Co. (The) | 10,993,050 | ||||||
| 222,600 | Whirlpool Corp. | 14,250,852 | ||||||
|
| |||||||
| 130,069,778 | ||||||||
|
| |||||||
| Consumer Staples – 3.0% | ||||||||
| 270,000 | Kellogg Co. | 13,653,900 | ||||||
| 270,000 | PepsiCo, Inc. | 17,820,000 | ||||||
| 120,000 | Procter & Gamble Co. (The) | 7,636,800 | ||||||
|
| |||||||
| 39,110,700 | ||||||||
|
| |||||||
| Energy – 5.8% | ||||||||
| 100,000 | Cameco Corp. | 2,210,000 | ||||||
| 280,000 | Cameron International Corp. (a) | 14,350,000 | ||||||
| 100,000 | Cenovus Energy, Inc. | 3,625,000 | ||||||
| 100,000 | Encana Corp. | 2,094,000 | ||||||
| 89,200 | EOG Resources, Inc. | 9,795,052 | ||||||
| 10,000 | Exxon Mobil Corp. | 863,400 | ||||||
| 100,000 | Hess Corp. | 5,214,000 | ||||||
| 158,100 | McDermott International, Inc. (a) | 1,786,530 | ||||||
| 89,300 | National Oilwell Varco, Inc. | 6,765,368 | ||||||
| 50,000 | Noble Energy, Inc. | 4,966,000 | ||||||
| 200,000 | Petroleo Brasileiro SA – ADR | 4,432,000 | ||||||
| 94,800 | Range Resources Corp. | 6,319,368 | ||||||
| 112,434 | Schlumberger Ltd. | 8,335,857 | ||||||
| 64,200 | Southwestern Energy Co. (a) | 2,027,436 | ||||||
| 57,100 | Transocean Ltd. | 2,877,269 | ||||||
|
| |||||||
| 75,661,280 | ||||||||
|
| |||||||
The accompanying notes are an integral part of these financial statements.
14
Schedule of Investments
PRIMECAP Odyssey Stock Fund
April 30, 2012 (Unaudited) – continued
| Shares | Value | |||||||
| Financials – 7.5% | ||||||||
| 2,891,700 | Charles Schwab Corp. (The) | $ | 41,351,310 | |||||
| 140,000 | Chubb Corp. (The) | 10,229,800 | ||||||
| 894,950 | Marsh & McLennan Cos., Inc. | 29,936,077 | ||||||
| 164,900 | Mercury General Corp. | 7,451,831 | ||||||
| 229,100 | Willis Group Holdings PLC | 8,352,986 | ||||||
|
| |||||||
| 97,322,004 | ||||||||
|
| |||||||
| Health Care – 26.9% | ||||||||
| 421,200 | Abbott Laboratories | 26,139,672 | ||||||
| 75,000 | Affymetrix, Inc. (a) | 331,500 | ||||||
| 742,000 | Amgen, Inc. | 52,763,620 | ||||||
| 158,500 | Biogen Idec, Inc. (a) | 21,240,585 | ||||||
| 227,900 | Boston Scientific Corp. (a) | 1,426,654 | ||||||
| 842,800 | Eli Lilly & Co. | 34,883,492 | ||||||
| 616,735 | GlaxoSmithKline PLC – ADR | 28,511,659 | ||||||
| 822,200 | Johnson & Johnson | 53,516,998 | ||||||
| 895,300 | Medtronic, Inc. | 34,200,460 | ||||||
| 602,850 | Novartis AG – ADR | 33,259,235 | ||||||
| 242,206 | PerkinElmer, Inc. | 6,684,885 | ||||||
| 327,716 | Roche Holding AG – CHF | 59,863,728 | ||||||
|
| |||||||
| 352,822,488 | ||||||||
|
| |||||||
| Industrials – 11.6% | ||||||||
| 47,600 | Alaska Air Group, Inc. (a) | 1,608,880 | ||||||
| 70,000 | Alexander & Baldwin, Inc. | 3,581,200 | ||||||
| 543,900 | Arkansas Best Corp. | 8,343,426 | ||||||
| 447,700 | Babcock & Wilcox Co. (The) (a) | 11,013,420 | ||||||
| 276,700 | Boeing Co. (The) | 21,250,560 | ||||||
| 100,000 | C. H. Robinson Worldwide, Inc. | 5,974,000 | ||||||
| 70,000 | Canadian Pacific Railway Ltd. | 5,423,600 | ||||||
| 8,300 | Caterpillar, Inc. | 852,991 | ||||||
| 35,000 | CSX Corp. | 780,850 | ||||||
| 116,000 | European Aeronautic Defence and Space Co. N.V. – EUR | 4,579,594 | ||||||
| 181,900 | FedEx Corp. | 16,050,856 | ||||||
| 251,900 | Honeywell International, Inc. | 15,280,254 | ||||||
| 23,500 | JetBlue Airways Corp. (a) | 111,625 | ||||||
| 110,000 | Norfolk Southern Corp. | 8,022,300 | ||||||
| 64,300 | Pall Corp. | 3,832,923 | ||||||
| 179,400 | Ritchie Bros. Auctioneers, Inc. | 3,790,722 | ||||||
The accompanying notes are an integral part of these financial statements.
15
Schedule of Investments
PRIMECAP Odyssey Stock Fund
April 30, 2012 (Unaudited) – continued
| Shares | Value | |||||||
| Industrials (continued) | ||||||||
| 145,500 | Rockwell Automation, Inc. | $ | 11,252,970 | |||||
| 1,289,200 | Southwest Airlines Co. | 10,674,576 | ||||||
| 1,900 | Thomas & Betts Corp. (a) | 136,629 | ||||||
| 36,000 | Union Pacific Corp. | 4,047,840 | ||||||
| 199,200 | United Parcel Service, Inc. – Class B | 15,565,488 | ||||||
|
| |||||||
| 152,174,704 | ||||||||
|
| |||||||
| Information Technology – 20.3% | ||||||||
| 45,650 | Accenture PLC – Class A | 2,964,968 | ||||||
| 540,000 | Adobe Systems, Inc. (a) | 18,122,400 | ||||||
| 198,100 | Altera Corp. | 7,046,417 | ||||||
| 268,700 | Applied Materials, Inc. | 3,221,713 | ||||||
| 11,277 | ASML Holding N.V. | 575,014 | ||||||
| 600,000 | Corning, Inc. | 8,610,000 | ||||||
| 260,000 | Diebold, Inc. | 10,257,000 | ||||||
| 416,400 | Electronic Arts, Inc. (a) | 6,404,232 | ||||||
| 81,500 | EMC Corp. (a) | 2,299,115 | ||||||
| 13,000 | Google, Inc. – Class A (a) | 7,867,990 | ||||||
| 46,000 | Hewlett-Packard Co. | 1,138,960 | ||||||
| 280,000 | Intel Corp. | 7,952,000 | ||||||
| 94,700 | Intuit, Inc. | 5,489,759 | ||||||
| 350,100 | KLA-Tencor Corp. | 18,257,715 | ||||||
| 914,700 | L.M. Ericsson Telephone Co. – ADR | 9,142,426 | ||||||
| 1,408,900 | Microsoft Corp. | 45,112,978 | ||||||
| 14,112 | Motorola Mobility Holdings, Inc. (a) | 547,828 | ||||||
| 16,128 | Motorola Solutions, Inc. | 823,012 | ||||||
| 81,400 | NeuStar, Inc. – Class A (a) | 2,958,890 | ||||||
| 360,000 | NVIDIA Corp. (a) | 4,680,000 | ||||||
| 50,700 | Oracle Corp. | 1,490,073 | ||||||
| 250,000 | QUALCOMM, Inc. | 15,960,000 | ||||||
| 154,100 | Research In Motion Ltd. (a) | 2,203,630 | ||||||
| 244,800 | Symantec Corp. (a) | 4,044,096 | ||||||
| 1,478,200 | Texas Instruments, Inc. | 47,213,708 | ||||||
| 225,000 | Visa, Inc. – Class A | 27,670,500 | ||||||
| 100,000 | Xilinx, Inc. | 3,638,000 | ||||||
| 24,800 | Yahoo!, Inc. (a) | 385,392 | ||||||
|
| |||||||
| 266,077,816 | ||||||||
|
| |||||||
| Materials – 2.9% | ||||||||
| 25,700 | Freeport-McMoRan Copper & Gold, Inc. | 984,310 | ||||||
| 10,000 | Greif, Inc. – Class A | 536,400 | ||||||
The accompanying notes are an integral part of these financial statements.
16
Schedule of Investments
PRIMECAP Odyssey Stock Fund
April 30, 2012 (Unaudited) – continued
| Shares | Value | |||||||
| Materials (continued) | ||||||||
| 71,900 | Monsanto Co. | $ | 5,477,342 | |||||
| 162,600 | Potash Corp. of Saskatchewan, Inc. | 6,907,248 | ||||||
| 358,400 | Schweitzer-Mauduit International, Inc. | 24,306,688 | ||||||
|
| |||||||
| 38,211,988 | ||||||||
|
| |||||||
| Utilities – 1.9% | ||||||||
| 80,000 | Edison International | 3,520,800 | ||||||
| 50,000 | NextEra Energy, Inc. | 3,217,500 | ||||||
| 591,358 | Public Service Enterprise Group, Inc. | 18,420,802 | ||||||
|
| |||||||
| 25,159,102 | ||||||||
|
| |||||||
| TOTAL COMMON STOCKS | $ | 1,176,609,860 | |||||
|
| |||||||
| SHORT TERM INVESTMENTS – 9.4% | ||||||||
| 123,697,153 | Dreyfus Treasury Prime Cash Management Fund | 123,697,153 | ||||||
|
| |||||||
| TOTAL SHORT TERM INVESTMENTS | 123,697,153 | ||||||
|
| |||||||
| TOTAL INVESTMENTS – 99.2% | 1,300,307,013 | ||||||
| Other Assets in Excess of Liabilities – 0.8% | 10,485,274 | ||||||
|
| |||||||
| TOTAL NET ASSETS – 100.0% | $ | 1,310,792,287 | |||||
|
| |||||||
ADR – American Depository Receipt
CHF – Swiss Francs
EUR – Euros
| (a) | Non-Income Producing |
The Global Industry Classification Standard (GICS®) was developed by and is the exclusive property of MSCI Inc. and Standard & Poor’s Financial Services LLC (“S&P”). GICS is a service mark of MSCI and S&P and has been licensed for use by PRIMECAP Management Company.
The accompanying notes are an integral part of these financial statements.
17
| Schedule of Investments April 30, 2012 (Unaudited) |
| Shares | Value | |||||||
| COMMON STOCKS – 95.3% | ||||||||
| Consumer Discretionary – 8.3% | ||||||||
| 645,600 | Ascena Retail Group, Inc. (a) | $ | 13,221,888 | |||||
| 222,800 | Bed Bath & Beyond, Inc. (a) | 15,682,892 | ||||||
| 804,500 | CarMax, Inc. (a) | 24,834,915 | ||||||
| 710,800 | Carnival Corp. | 23,093,892 | ||||||
| 10,000 | Deckers Outdoor Corp. (a) | 510,100 | ||||||
| 161,800 | DIRECTV – Class A (a) | 7,971,886 | ||||||
| 1,083,000 | DreamWorks Animation SKG, Inc. – Class A (a) | 19,504,830 | ||||||
| 915,000 | Limited Brands, Inc. | 45,475,500 | ||||||
| 460,000 | Mattel, Inc. | 15,456,000 | ||||||
| 5,600 | Michael Kors Holdings, Ltd. (a) | 255,752 | ||||||
| 100,000 | Royal Caribbean Cruises Ltd. | 2,737,000 | ||||||
| 100,000 | Shutterfly, Inc. (a) | 3,112,000 | ||||||
| 239,400 | Sony Corp. – ADR | 3,880,674 | ||||||
| 126,000 | TJX Cos., Inc. | 5,255,460 | ||||||
|
| |||||||
| 180,992,789 | ||||||||
|
| |||||||
| Consumer Staples – 0.3% | ||||||||
| 100,000 | Procter & Gamble Co. (The) | 6,364,000 | ||||||
|
| |||||||
| Energy – 4.6% | ||||||||
| 140,000 | Cenovus Energy, Inc. | 5,075,000 | ||||||
| 130,000 | Encana Corp. | 2,722,200 | ||||||
| 146,600 | EOG Resources, Inc. | 16,098,146 | ||||||
| 180,000 | Hess Corp. | 9,385,200 | ||||||
| 138,400 | McDermott International, Inc. (a) | 1,563,920 | ||||||
| 171,600 | National Oilwell Varco, Inc. | 13,000,416 | ||||||
| 80,000 | Noble Energy, Inc. | 7,945,600 | ||||||
| 254,100 | Oceaneering International, Inc. | 13,119,183 | ||||||
| 187,900 | Petroleo Brasileiro SA – ADR | 4,163,864 | ||||||
| 146,700 | Range Resources Corp. | 9,779,022 | ||||||
| 169,800 | Schlumberger Ltd. | 12,588,972 | ||||||
| 175,400 | Southwestern Energy Co. (a) | 5,539,132 | ||||||
|
| |||||||
| 100,980,655 | ||||||||
|
| |||||||
| Financials – 5.7% | ||||||||
| 200,000 | Berkshire Hathaway, Inc. – Class B (a) | 16,090,000 | ||||||
| 3,902,100 | Charles Schwab Corp. (The) | 55,800,030 | ||||||
| 200,000 | Chubb Corp. (The) | 14,614,000 | ||||||
| 1,000,700 | Marsh & McLennan Cos, Inc. | 33,473,415 | ||||||
| 140,000 | Progressive Corp. (The) | 2,982,000 | ||||||
|
| |||||||
| 122,959,445 | ||||||||
|
| |||||||
The accompanying notes are an integral part of these financial statements.
18
Schedule of Investments
PRIMECAP Odyssey Growth Fund
April 30, 2012 (Unaudited) – continued
| Shares | Value | |||||||
| Health Care – 39.2% | ||||||||
| 1,743,800 | Abiomed, Inc. (a) | $ | 42,426,654 | |||||
| 3,120,000 | Accuray, Inc. (a) | 24,024,000 | ||||||
| 199,400 | Affymetrix, Inc. (a) | 881,348 | ||||||
| 1,427,800 | Amgen, Inc. | 101,530,858 | ||||||
| 442,500 | Biogen Idec, Inc. (a) | 59,299,425 | ||||||
| 298,200 | BioMarin Pharmaceutical, Inc. (a) | 10,347,540 | ||||||
| 672,500 | Boston Scientific Corp. (a) | 4,209,850 | ||||||
| 965,100 | Cepheid, Inc. (a) | 37,069,491 | ||||||
| 118,700 | Charles River Laboratories International, Inc. (a) | 4,217,411 | ||||||
| 2,293,728 | Conceptus, Inc. (a) (b) | 43,053,275 | ||||||
| 1,476,200 | Dendreon Corp. (a) | 17,197,730 | ||||||
| 867,200 | Eli Lilly & Co. | 35,893,408 | ||||||
| 81,000 | GlaxoSmithKline PLC – ADR | 3,744,630 | ||||||
| 270,000 | Illumina, Inc. (a) | 12,023,100 | ||||||
| 5,840,000 | ImmunoGen, Inc. (a) (b) | 74,460,000 | ||||||
| 222,300 | Insulet Corp. (a) | 3,970,278 | ||||||
| 470,000 | InterMune, Inc. (a) | 4,906,800 | ||||||
| 497,000 | Johnson & Johnson | 32,349,730 | ||||||
| 540,000 | Life Technologies Corp. (a) | 25,034,400 | ||||||
| 976,800 | Medtronic, Inc. | 37,313,760 | ||||||
| 300,000 | Momenta Pharmaceuticals, Inc. (a) | 4,764,000 | ||||||
| 4,404,456 | Nektar Therapeutics (a) | 33,561,955 | ||||||
| 538,750 | Novartis AG – ADR | 29,722,837 | ||||||
| 145,000 | NuVasive, Inc. (a) | 2,402,650 | ||||||
| 167,700 | OraSure Technologies, Inc. (a) | 1,923,519 | ||||||
| 461,600 | QIAGEN N.V. (a) | 7,722,568 | ||||||
| 543,132 | Roche Holding AG – CHF | 99,213,668 | ||||||
| 4,606,400 | Seattle Genetics, Inc. (a) | 91,068,528 | ||||||
| 68,500 | Waters Corp. (a) | 5,761,535 | ||||||
|
| |||||||
| 850,094,948 | ||||||||
|
| |||||||
| Industrials – 7.7% | ||||||||
| 871,252 | AECOM Technology Corp. (a) | 19,228,532 | ||||||
| 574,400 | Babcock & Wilcox Co. (The) (a) | 14,130,240 | ||||||
| 430,000 | C. H. Robinson Worldwide, Inc. | 25,688,200 | ||||||
| 133,600 | Caterpillar, Inc. | 13,730,072 | ||||||
| 10,000 | CIRCOR International, Inc. | 311,200 | ||||||
| 227,100 | European Aeronautic Defence and Space Co. N.V. – EUR | 8,965,739 | ||||||
| 420,000 | Expeditors International Washington, Inc. | 16,800,000 | ||||||
| 40,900 | FedEx Corp. | 3,609,016 | ||||||
The accompanying notes are an integral part of these financial statements.
19
Schedule of Investments
PRIMECAP Odyssey Growth Fund
April 30, 2012 (Unaudited) – continued
| Shares | Value | |||||||
| Industrials (continued) | ||||||||
| 50,000 | IDEX Corp. | $ | 2,165,500 | |||||
| 1,087,550 | JetBlue Airways Corp. (a) | 5,165,862 | ||||||
| 107,800 | Pall Corp. | 6,425,958 | ||||||
| 389,000 | Ritchie Bros. Auctioneers, Inc. | 8,219,570 | ||||||
| 50,000 | Rockwell Automation, Inc. | 3,867,000 | ||||||
| 2,423,200 | Southwest Airlines Co. | 20,064,096 | ||||||
| 150,000 | United Continental Holdings, Inc. (a) | 3,288,000 | ||||||
| 196,000 | United Parcel Service, Inc. – Class B | 15,315,440 | ||||||
|
| |||||||
| 166,974,425 | ||||||||
|
| |||||||
| Information Technology – 28.1% | ||||||||
| 57,850 | Accenture PLC – Class A | 3,757,358 | ||||||
| 1,523,500 | Adobe Systems, Inc. (a) | 51,128,660 | ||||||
| 1,001,700 | Altera Corp. | 35,630,469 | ||||||
| 389,300 | Applied Materials, Inc. | 4,667,707 | ||||||
| 83,600 | ASML Holding N.V. | 4,262,764 | ||||||
| 350,000 | Corning, Inc. | 5,022,500 | ||||||
| 562,200 | Cree, Inc. (a) | 17,371,980 | ||||||
| 150,000 | Cymer, Inc. (a) | 7,776,000 | ||||||
| 1,657,000 | Electronic Arts, Inc. (a) | 25,484,660 | ||||||
| 633,900 | EMC Corp. (a) | 17,882,319 | ||||||
| 2,800,000 | Flextronics International Ltd. (a) | 18,648,000 | ||||||
| 742,018 | FormFactor, Inc. (a) | 4,155,301 | ||||||
| 82,080 | Google, Inc. – Class A (a) | 49,677,278 | ||||||
| 90,000 | Hewlett-Packard Co. | 2,228,400 | ||||||
| 250,700 | Intel Corp. | 7,119,880 | ||||||
| 105,000 | Intuit, Inc. | 6,086,850 | ||||||
| 32,000 | Jabil Circuit, Inc. | 750,400 | ||||||
| 300,000 | KLA-Tencor Corp. | 15,645,000 | ||||||
| 1,247,800 | L.M. Ericsson Telephone Co. – ADR | 12,471,761 | ||||||
| 5,500 | MasterCard, Inc. – Class A | 2,487,485 | ||||||
| 725,000 | Micron Technology, Inc. (a) | 4,777,750 | ||||||
| 1,155,500 | Microsoft Corp. | 36,999,110 | ||||||
| 30,737 | Motorola Mobility Holdings, Inc. (a) | 1,193,210 | ||||||
| 35,128 | Motorola Solutions, Inc. | 1,792,582 | ||||||
| 264,811 | NetApp, Inc. (a) | 10,282,611 | ||||||
| 195,900 | NeuStar, Inc. – Class A (a) | 7,120,965 | ||||||
| 1,927,400 | Nuance Communications, Inc. (a) | 47,105,656 | ||||||
| 540,000 | NVIDIA Corp. (a) | 7,020,000 | ||||||
| 450,000 | QUALCOMM, Inc. | 28,728,000 | ||||||
The accompanying notes are an integral part of these financial statements.
20
Schedule of Investments
PRIMECAP Odyssey Growth Fund
April 30, 2012 (Unaudited) – continued
| Shares | Value | |||||||
| Information Technology (continued) | ||||||||
| 160,000 | Rambus, Inc. (a) | $ | 814,400 | |||||
| 722,450 | Research In Motion Ltd. (a) | 10,331,035 | ||||||
| 242,100 | SanDisk Corp. (a) | 8,960,121 | ||||||
| 915,900 | Stratasys, Inc. (a) | 46,903,239 | ||||||
| 536,400 | Symantec Corp. (a) | 8,861,328 | ||||||
| 1,015,300 | Texas Instruments, Inc. | 32,428,682 | ||||||
| 335,000 | Trimble Navigation Ltd. (a) | 18,136,900 | ||||||
| 335,000 | Visa, Inc. – Class A | 41,198,300 | ||||||
| 120,000 | Xilinx, Inc. | 4,365,600 | ||||||
| 8,000 | Zynga, Inc. – Class A (a) | 66,720 | ||||||
|
| |||||||
| 609,340,981 | ||||||||
|
| |||||||
| Materials – 1.4% | ||||||||
| 317,500 | Monsanto Co. | 24,187,150 | ||||||
| 102,600 | Potash Corp. Saskatchewan, Inc. | 4,358,448 | ||||||
| 17,250 | Praxair, Inc. | 1,995,825 | ||||||
|
| |||||||
| 30,541,423 | ||||||||
|
| |||||||
| TOTAL COMMON STOCKS | $ | 2,068,248,666 | |||||
|
| |||||||
| SHORT TERM INVESTMENTS – 4.1% | ||||||||
| 88,594,497 | Dreyfus Treasury Prime Cash Management Fund | 88,594,497 | ||||||
|
| |||||||
| TOTAL SHORT TERM INVESTMENTS | 88,594,497 | ||||||
|
| |||||||
| TOTAL INVESTMENTS – 99.4% | 2,156,843,163 | ||||||
| Other Assets in Excess of Liabilities – 0.6% | 14,020,772 | ||||||
|
| |||||||
| TOTAL NET ASSETS – 100.0% | $ | 2,170,863,935 | |||||
|
| |||||||
ADR – American Depository Receipt
CHF – Swiss Francs
EUR – Euros
| (a) | Non-Income Producing |
| (b) | Considered an affiliated company of the fund as the fund owns 5% or more of the outstanding voting securities of such company. |
The Global Industry Classification Standard (GICS®) was developed by and is the exclusive property of MSCI Inc. and Standard & Poor’s Financial Services LLC (“S&P”). GICS is a service mark of MSCI and S&P and has been licensed for use by PRIMECAP Management Company.
The accompanying notes are an integral part of these financial statements.
21
| Schedule of Investments PRIMECAP Odyssey Aggressive Growth Fund April 30, 2012 (Unaudited) |
| Shares | Value | |||||||
| COMMON STOCKS – 93.2% | ||||||||
| Consumer Discretionary – 5.6% | ||||||||
| 15,000 | Amazon.com, Inc. (a) | $ | 3,478,500 | |||||
| 392,102 | Callaway Golf Co. | 2,403,585 | ||||||
| 420,800 | CarMax, Inc. (a) | 12,990,096 | ||||||
| 15,000 | Deckers Outdoor Corp. (a) | 765,150 | ||||||
| 74,700 | DIRECTV – Class A (a) | 3,680,469 | ||||||
| 1,367,100 | DreamWorks Animation SKG, Inc. – Class A (a) | 24,621,471 | ||||||
| 27,000 | Royal Caribbean Cruises Ltd. | 738,990 | ||||||
| 653,400 | Shutterfly, Inc. (a) | 20,333,808 | ||||||
| 89,090 | Tesla Motors, Inc. (a) | 2,951,552 | ||||||
| 36,000 | Warnaco Group, Inc. (The) (a) | 1,906,560 | ||||||
|
| |||||||
| 73,870,181 | ||||||||
|
| |||||||
| Consumer Staples – 1.5% | ||||||||
| 2,700 | Chefs’ Warehouse Holdings, Inc. (The) (a) | 65,286 | ||||||
| 3,313,405 | Smart Balance, Inc. (a) (b) | 19,549,089 | ||||||
|
| |||||||
| 19,614,375 | ||||||||
|
| |||||||
| Energy – 3.2% | ||||||||
| 270,200 | Cabot Oil & Gas Corp. | 9,494,828 | ||||||
| 60,000 | EOG Resources, Inc. | 6,588,600 | ||||||
| 113,800 | National Oilwell Varco, Inc. | 8,621,488 | ||||||
| 117,800 | Range Resources Corp. | 7,852,548 | ||||||
| 908,800 | Rex Energy Corp. (a) | 9,551,488 | ||||||
|
| |||||||
| 42,108,952 | ||||||||
|
| |||||||
| Financials – 1.9% | ||||||||
| 605,820 | MarketAxess Holdings, Inc. | 20,785,684 | ||||||
| 114,400 | MSCI, Inc. (a) | 4,185,896 | ||||||
|
| |||||||
| 24,971,580 | ||||||||
|
| |||||||
| Health Care – 41.2% | ||||||||
| 2,151,673 | Abiomed, Inc. (a) (b) | 52,350,204 | ||||||
| 2,966,900 | Accuray, Inc. (a) | 22,845,130 | ||||||
| 172,000 | Affymetrix, Inc. (a) | 760,240 | ||||||
| 205,200 | Biogen Idec, Inc. (a) | 27,498,852 | ||||||
| 592,800 | BioMarin Pharmaceutical, Inc. (a) | 20,570,160 | ||||||
| 700,500 | Boston Scientific Corp. (a) | 4,385,130 | ||||||
| 786,650 | Cardica, Inc. (a) | 1,651,965 | ||||||
| 1,007,600 | Cepheid, Inc. (a) | 38,701,916 | ||||||
| 11,500 | Charles River Laboratories International, Inc. (a) | 408,595 | ||||||
| 1,669,750 | Conceptus, Inc. (a) (b) | 31,341,208 | ||||||
The accompanying notes are an integral part of these financial statements.
22
Schedule of Investments
PRIMECAP Odyssey Aggressive Growth Fund
April 30, 2012 (Unaudited) – continued
| Shares | Value | |||||||
| Health Care (continued) | ||||||||
| 1,478,500 | Dendreon Corp. (a) | $ | 17,224,525 | |||||
| 5,849,900 | Dyax Corp. (a) (b) | 9,535,337 | ||||||
| 9,000 | Illumina, Inc. (a) | 400,770 | ||||||
| 3,620,250 | ImmunoGen, Inc. (a) | 46,158,187 | ||||||
| 589,300 | Insulet Corp. (a) | 10,524,898 | ||||||
| 1,439,300 | InterMune, Inc. (a) | 15,026,292 | ||||||
| 708,200 | Luminex Corp. (a) | 17,733,328 | ||||||
| 306,600 | Momenta Pharmaceuticals, Inc. (a) | 4,868,808 | ||||||
| 2,760,300 | Nektar Therapeutics (a) | 21,033,486 | ||||||
| 186,000 | NuVasive, Inc. (a) | 3,082,020 | ||||||
| 1,473,600 | OraSure Technologies, Inc. (a) | 16,902,192 | ||||||
| 2,138,139 | Pharmacyclics, Inc. (a) | 58,927,111 | ||||||
| 74,000 | QIAGEN N.V. (a) | 1,238,020 | ||||||
| 338,800 | Roche Holding AG – CHF | 61,888,437 | ||||||
| 2,917,500 | Seattle Genetics, Inc. (a) | 57,678,975 | ||||||
| 19,200 | SurModics, Inc. (a) | 283,968 | ||||||
|
| |||||||
| 543,019,754 | ||||||||
|
| |||||||
| Industrials – 6.3% | ||||||||
| 390,000 | Alaska Air Group, Inc. (a) | 13,182,000 | ||||||
| 536,600 | Arkansas Best Corp. | 8,231,444 | ||||||
| 101,800 | C. H. Robinson Worldwide, Inc. | 6,081,532 | ||||||
| 222,000 | CIRCOR International, Inc. | 6,908,640 | ||||||
| 111,000 | Delta Air Lines, Inc. (a) | 1,216,560 | ||||||
| 10,000 | Expeditors International of Washington, Inc. | 400,000 | ||||||
| 2,424,525 | JetBlue Airways Corp. (a) | 11,516,494 | ||||||
| 82,600 | Pall Corp. | 4,923,786 | ||||||
| 5,390 | Polypore International, Inc. (a) | 201,317 | ||||||
| 293,100 | Ritchie Bros. Auctioneers, Inc. | 6,193,203 | ||||||
| 895,000 | Southwest Airlines Co. | 7,410,600 | ||||||
| 42,000 | Spirit Airlines, Inc. (a) | 1,008,840 | ||||||
| 36,000 | United Continental Holdings, Inc. (a) | 789,120 | ||||||
| 234,000 | US Airways Group, Inc. (a) | 2,400,840 | ||||||
| 48,200 | USA Truck, Inc. (a) | 331,616 | ||||||
| 525,000 | Vitran Corp, Inc. (a) | 4,509,750 | ||||||
| 607,638 | Zipcar, Inc. (a) | 7,322,038 | ||||||
|
| |||||||
| 82,627,780 | ||||||||
|
| |||||||
The accompanying notes are an integral part of these financial statements.
23
Schedule of Investments
PRIMECAP Odyssey Aggressive Growth Fund
April 30, 2012 (Unaudited) – continued
| Shares | Value | |||||||
| Information Technology – 31.6% | ||||||||
| 894,600 | Adobe Systems, Inc. (a) | $ | 30,022,776 | |||||
| 80,000 | Akamai Technologies, Inc. (a) | 2,608,000 | ||||||
| 507,900 | Altera Corp. | 18,066,003 | ||||||
| 192,600 | ASML Holding N.V. | 9,820,674 | ||||||
| 1,419,500 | comScore, Inc. (a) | 28,276,440 | ||||||
| 348,300 | Cree, Inc. (a) | 10,762,470 | ||||||
| 200,000 | Cymer, Inc. (a) | 10,368,000 | ||||||
| 1,083,400 | Electronic Arts, Inc. (a) | 16,662,692 | ||||||
| 281,400 | EMC Corp. (a) | 7,938,294 | ||||||
| 272,100 | FARO Technologies, Inc. (a) | 15,232,158 | ||||||
| 302,700 | FEI Co. (a) | 15,186,459 | ||||||
| 716,300 | FormFactor, Inc. (a) | 4,011,280 | ||||||
| 61,090 | Google, Inc. – Class A (a) | 36,973,501 | ||||||
| 1,402,100 | Guidance Software, Inc. (a) (b) | 13,305,929 | ||||||
| 334,854 | Higher One Holdings, Inc. (a) | 5,280,648 | ||||||
| 38,500 | hiSoft Technology International Ltd. – ADR (a) | 547,470 | ||||||
| 900 | Imperva, Inc. (a) | 31,293 | ||||||
| 275,000 | Intuit, Inc. | 15,941,750 | ||||||
| 150,000 | iSoftStone Holdings Ltd. – ADR (a) | 1,197,000 | ||||||
| 30,000 | Jabil Circuit, Inc. | 703,500 | ||||||
| 1,104,800 | KIT Digital, Inc. (a) | 7,490,544 | ||||||
| 378,300 | KLA-Tencor Corp. | 19,728,345 | ||||||
| 800,000 | Micron Technology, Inc. (a) | 5,272,000 | ||||||
| 420,000 | Monster Worldwide, Inc. (a) | 3,624,600 | ||||||
| 110,500 | NetApp, Inc. (a) | 4,290,715 | ||||||
| 150,798 | NeuStar, Inc. – Class A (a) | 5,481,507 | ||||||
| 851,100 | Nuance Communications, Inc. (a) | 20,800,884 | ||||||
| 162,300 | NVIDIA Corp. (a) | 2,109,900 | ||||||
| 140,000 | Rambus, Inc. (a) | 712,600 | ||||||
| 602,900 | Research In Motion Ltd. (a) | 8,621,470 | ||||||
| 3,567 | Responsys, Inc. (a) | 45,586 | ||||||
| 237,500 | SanDisk Corp. (a) | 8,789,875 | ||||||
| 733,500 | SMART Technologies, Inc. – Class A (a) | 1,855,755 | ||||||
| 799,101 | Stratasys, Inc. (a) | 40,921,962 | ||||||
| 329,900 | Symantec Corp. (a) | 5,449,948 | ||||||
| 322,900 | Trimble Navigation Ltd. (a) | 17,481,806 | ||||||
| 24,000 | VanceInfo Technologies, Inc. – ADR (a) | 310,800 | ||||||
| 984,600 | Websense, Inc. (a) | 20,420,604 | ||||||
| 60,000 | Yahoo!, Inc. (a) | 932,400 | ||||||
|
| |||||||
| 417,277,638 | ||||||||
|
| |||||||
The accompanying notes are an integral part of these financial statements.
24
Schedule of Investments
PRIMECAP Odyssey Aggressive Growth Fund
April 30, 2012 (Unaudited) – continued
| Shares | Value | |||||||
| Materials – 1.9% | ||||||||
| 272,300 | Monsanto Co. | $ | 20,743,814 | |||||
| 94,100 | Potash Corp. of Saskatchewan, Inc. | 3,997,368 | ||||||
|
| |||||||
| 24,741,182 | ||||||||
|
| |||||||
| TOTAL COMMON STOCKS | $ | 1,228,231,442 | |||||
|
| |||||||
| SHORT TERM INVESTMENTS – 6.9% | ||||||||
| 91,761,980 | Dreyfus Treasury Prime Cash Management Fund | 91,761,980 | ||||||
|
| |||||||
| TOTAL SHORT TERM INVESTMENTS | 91,761,980 | ||||||
|
| |||||||
| TOTAL INVESTMENTS – 100.1% | 1,319,993,422 | ||||||
| Liabilities in Excess of Other Assets – (0.1)% | (1,630,798 | ) | |||||
|
| |||||||
| TOTAL NET ASSETS – 100.0% | $ | 1,318,362,624 | |||||
|
| |||||||
ADR – American Depository Receipt
CHF – Swiss Francs
| (a) | Non-Income Producing |
| (b) | Considered an affiliated company of the fund as the fund owns 5% or more of the outstanding voting securities of such company. |
The Global Industry Classification Standard (GICS®) was developed by and is the exclusive property of MSCI Inc. and Standard & Poor’s Financial Services LLC (“S&P”). GICS is a service mark of MSCI and S&P and has been licensed for use by PRIMECAP Management Company.
The accompanying notes are an integral part of these financial statements.
25
| Statements of Assets and Liabilities April 30, 2012 (Unaudited) |
| PRIMECAP Odyssey Stock Fund | PRIMECAP Odyssey Growth Fund | PRIMECAP Odyssey Aggressive Growth Fund | ||||||||||
ASSETS | ||||||||||||
Investments, at cost | $ | 1,119,070,580 | $ | 1,824,307,084 | $ | 1,086,936,034 | ||||||
|
|
|
|
|
| |||||||
Investments, at value (unaffiliated) | $ | 1,300,307,013 | $ | 2,039,329,889 | $ | 1,193,911,655 | ||||||
Investments, at value (affiliated) | — | 117,513,274 | 126,081,767 | |||||||||
Cash | — | — | 2,512,478 | |||||||||
Receivables: | ||||||||||||
Securities sold | 12,060,015 | 22,764,809 | 6,454,431 | |||||||||
Dividends and interest | 1,705,644 | 2,366,939 | 1,172,004 | |||||||||
Fund shares sold | 3,841,557 | 2,268,277 | 4,835,691 | |||||||||
Prepaid expenses and other assets | 19,166 | 43,847 | 39,213 | |||||||||
|
|
|
|
|
| |||||||
Total assets | 1,317,933,395 | 2,184,287,035 | 1,335,007,239 | |||||||||
|
|
|
|
|
| |||||||
| LIABILITIES | ||||||||||||
Payable for securities purchased | 4,895,187 | 8,289,359 | 13,343,741 | |||||||||
Payable for fund shares repurchased | 308,333 | 1,653,804 | 1,253,053 | |||||||||
Payable to the advisor (Note 6) | 1,691,091 | 2,935,543 | 1,727,592 | |||||||||
Other accrued expenses & liabilities | 246,497 | 544,394 | 320,229 | |||||||||
|
|
|
|
|
| |||||||
Total liabilities | 7,141,108 | 13,423,100 | 16,644,615 | |||||||||
|
|
|
|
|
| |||||||
NET ASSETS | $ | 1,310,792,287 | $ | 2,170,863,935 | $ | 1,318,362,624 | ||||||
|
|
|
|
|
| |||||||
Number of shares issued and outstanding | 84,964,010 | 130,841,472 | 72,394,451 | |||||||||
|
|
|
|
|
| |||||||
NET ASSET VALUE, OFFERING AND REDEMPTION PRICE PER SHARE | $ | 15.43 | $ | 16.59 | $ | 18.21 | ||||||
|
|
|
|
|
| |||||||
| COMPONENTS OF NET ASSETS | ||||||||||||
Paid-in capital | $ | 1,147,430,980 | $ | 1,822,502,612 | $ | 1,080,365,005 | ||||||
Undistributed net investment income | 6,982,632 | 5,272,975 | — | |||||||||
Accumulated net realized gain (loss) | (24,889,486 | ) | 10,483,273 | 4,906,793 | ||||||||
Net unrealized appreciation | 181,268,161 | 332,605,075 | 233,090,826 | |||||||||
|
|
|
|
|
| |||||||
Net assets | $ | 1,310,792,287 | $ | 2,170,863,935 | $ | 1,318,362,624 | ||||||
|
|
|
|
|
| |||||||
The accompanying notes are an integral part of these financial statements.
26
| Statements of Operations For the Six Months Ended April 30, 2012 (Unaudited) |
| PRIMECAP Odyssey Stock Fund | PRIMECAP Odyssey Growth Fund | PRIMECAP Odyssey Aggressive Growth Fund | ||||||||||
INVESTMENT INCOME | ||||||||||||
Income | ||||||||||||
Dividends1 | $ | 13,978,703 | $ | 14,440,494 | $ | 3,367,899 | ||||||
Interest income | 15 | 15 | 9 | |||||||||
|
|
|
|
|
| |||||||
Total income | 13,978,718 | 14,440,509 | 3,367,908 | |||||||||
|
|
|
|
|
| |||||||
Expenses | ||||||||||||
Advisory fees | 3,090,299 | 5,464,892 | 3,267,167 | |||||||||
Shareholder servicing | 160,023 | 541,718 | 306,073 | |||||||||
Fund administration and accounting | 221,485 | 387,899 | 234,029 | |||||||||
Custody | 54,933 | 80,793 | 55,653 | |||||||||
Professional fees | 25,556 | 25,706 | 25,695 | |||||||||
Registration fees | 14,196 | 31,913 | 29,962 | |||||||||
Trustee fees | 13,923 | 14,005 | 13,923 | |||||||||
Printing and mailing | 19,436 | 49,070 | 32,908 | |||||||||
Other | 26,868 | 25,868 | 24,337 | |||||||||
|
|
|
|
|
| |||||||
Total expenses | 3,626,719 | 6,621,864 | 3,989,747 | |||||||||
|
|
|
|
|
| |||||||
Net investment income (loss) | 10,351,999 | 7,818,645 | (621,839 | ) | ||||||||
|
|
|
|
|
| |||||||
| REALIZED AND UNREALIZED GAIN (LOSS) ON INVESTMENTS AND FOREIGN CURRENCY | ||||||||||||
Net realized gain (loss) on: | ||||||||||||
Investments2 | (912,553 | ) | 15,386,356 | 5,588,890 | ||||||||
Foreign currency transactions | (12,431 | ) | (23,966 | ) | (14,797 | ) | ||||||
Change in net unrealized appreciation/(depreciation) on: | ||||||||||||
Investments | 90,107,369 | 139,064,060 | 101,751,541 | |||||||||
Foreign currency translations | (12,427 | ) | (23,409 | ) | (14,014 | ) | ||||||
|
|
|
|
|
| |||||||
Net realized and unrealized gain on investments and foreign currency | 89,169,958 | 154,403,041 | 107,311,620 | |||||||||
|
|
|
|
|
| |||||||
| NET INCREASE IN NET ASSETS RESULTING FROM OPERATIONS | $ | 99,521,957 | $ | 162,221,686 | $ | 106,689,781 | ||||||
|
|
|
|
|
| |||||||
| 1 | Net of foreign taxes withheld of $605,299, $862,159, $405,998, respectively. |
| 2 | Includes net realized gains on sales of affiliated companies of $0, $3,344,165, $60,462, respectively. |
The accompanying notes are an integral part of these financial statements.
27
|
| Six Months Ended April 30, 20121 | Year Ended October 30, 2011 | |||||||
INCREASE (DECREASE) IN NET ASSETS FROM: | ||||||||
OPERATIONS | ||||||||
Net investment income | $ | 10,351,999 | $ | 9,828,222 | ||||
Net realized gain (loss) on: | ||||||||
Investments | (912,553 | ) | 8,833,830 | |||||
Foreign currency transactions | (12,431 | ) | (5,762 | ) | ||||
Change in net unrealized appreciation/(depreciation) on: | ||||||||
Investments | 90,107,369 | 37,786,162 | ||||||
Foreign currency translations | (12,427 | ) | 29,831 | |||||
|
|
|
| |||||
Net increase in net assets resulting from operations | 99,521,957 | 56,472,283 | ||||||
|
|
|
| |||||
| DISTRIBUTIONS TO SHAREHOLDERS FROM NET INVESTMENT INCOME | (12,241,758 | ) | (5,099,941 | ) | ||||
|
|
|
| |||||
| CAPITAL SHARE TRANSACTIONS | ||||||||
Proceeds from shares sold | 395,439,741 | 492,192,375 | ||||||
Proceeds from reinvestment of distributions | 9,899,514 | 4,774,772 | ||||||
Cost of shares redeemed | (86,101,591 | ) | (251,163,250 | ) | ||||
Redemption fee proceeds | 23,102 | 15,527 | ||||||
|
|
|
| |||||
Net increase from capital share transactions | 319,260,766 | 245,819,424 | ||||||
|
|
|
| |||||
Total increase in net assets | 406,540,965 | 297,191,766 | ||||||
|
|
|
| |||||
| NET ASSETS | ||||||||
Beginning of period | 904,251,322 | 607,059,556 | ||||||
|
|
|
| |||||
End of period (includes undistributed net investment income of $6,982,632 and $8,872,391 respectively) | $ | 1,310,792,287 | $ | 904,251,322 | ||||
|
|
|
| |||||
| CHANGE IN CAPITAL SHARES | ||||||||
Shares outstanding, beginning of period | 63,147,115 | 45,027,268 | ||||||
|
|
|
| |||||
Shares sold | 26,913,153 | 34,887,757 | ||||||
Shares issued on reinvestment of distributions | 711,172 | 341,543 | ||||||
Shares repurchased | (5,807,430 | ) | (17,109,453 | ) | ||||
|
|
|
| |||||
Net increase in capital shares | 21,816,895 | 18,119,847 | ||||||
|
|
|
| |||||
Shares outstanding, end of period | 84,964,010 | 63,147,115 | ||||||
|
|
|
| |||||
| 1 | Unaudited |
The accompanying notes are an integral part of these financial statements.
28
| Statement of Changes in Net Assets |
| Six Months Ended April 30, 20121 | Year Ended October 30, 2011 | |||||||
INCREASE (DECREASE) IN NET ASSETS FROM: | ||||||||
OPERATIONS | ||||||||
Net investment income | $ | 7,818,645 | $ | 4,680,015 | ||||
Net realized gain (loss) on: | ||||||||
Investments | 15,386,356 | 20,610,429 | ||||||
Foreign currency transactions | (23,966 | ) | (10,487 | ) | ||||
Change in net unrealized appreciation/(depreciation) on: | ||||||||
Investments | 139,064,060 | 35,839,872 | ||||||
Foreign currency translations | (23,409 | ) | 59,350 | |||||
|
|
|
| |||||
Net increase in net assets resulting from operations | 162,221,686 | 61,179,179 | ||||||
|
|
|
| |||||
| DISTRIBUTIONS TO SHAREHOLDERS FROM | ||||||||
Net investment income | (6,864,980 | ) | (1,416,348 | ) | ||||
Net realized gain on investments | (7,111,047 | ) | — | |||||
|
|
|
| |||||
Net decrease in net assets resulting from distributions paid | (13,976,027 | ) | (1,416,348 | ) | ||||
|
|
|
| |||||
| CAPITAL SHARE TRANSACTIONS | ||||||||
Proceeds from shares sold | 434,405,822 | 711,410,844 | ||||||
Proceeds from reinvestment of distributions | 13,378,508 | 1,337,875 | ||||||
Cost of shares redeemed | (247,086,396 | ) | (401,953,384 | ) | ||||
Redemption fee proceeds | 47,095 | 149,175 | ||||||
|
|
|
| |||||
Net increase from capital share transactions | 200,745,029 | 310,944,510 | ||||||
|
|
|
| |||||
Total increase in net assets | 348,990,688 | 370,707,341 | ||||||
|
|
|
| |||||
| NET ASSETS | ||||||||
Beginning of period | 1,821,873,247 | 1,451,165,906 | ||||||
|
|
|
| |||||
End of period (includes undistributed net investment income of $5,272,975 and $4,319,310 respectively) | $ | 2,170,863,935 | $ | 1,821,873,247 | ||||
|
|
|
| |||||
| CHANGE IN CAPITAL SHARES | ||||||||
Shares outstanding, beginning of period | 117,989,471 | 98,706,971 | ||||||
|
|
|
| |||||
Shares sold | 27,620,879 | 45,548,287 | ||||||
Shares issued on reinvestment of distributions | 905,731 | 87,787 | ||||||
Shares repurchased | (15,674,609 | ) | (26,353,574 | ) | ||||
|
|
|
| |||||
Net increase in capital shares | 12,852,001 | 19,282,500 | ||||||
|
|
|
| |||||
Shares outstanding, end of period | 130,841,472 | 117,989,471 | ||||||
|
|
|
| |||||
| 1 | Unaudited |
The accompanying notes are an integral part of these financial statements.
29
| Statement of Changes in Net Assets |
| Six Months Ended April 30, 20121 | Year Ended October 30, 2011 | |||||||
INCREASE (DECREASE) IN NET ASSETS FROM: | ||||||||
OPERATIONS | ||||||||
Net investment loss | $ | (621,839 | ) | $ | (3,382,612 | ) | ||
Net realized gain (loss) on: | ||||||||
Investments | 5,588,890 | 26,971,334 | ||||||
Foreign currency transactions | (14,797 | ) | 12,755 | |||||
Change in net unrealized appreciation/(depreciation) on: | ||||||||
Investments | 101,751,541 | 42,923,262 | ||||||
Foreign currency translations | (14,014 | ) | 20,135 | |||||
|
|
|
| |||||
Net increase in net assets resulting from operations | 106,689,781 | 66,544,874 | ||||||
|
|
|
| |||||
| DISTRIBUTIONS TO SHAREHOLDERS FROM REALIZED GAIN ON INVESTMENTS | (21,243,259 | ) | (27,881,437 | ) | ||||
|
|
|
| |||||
| CAPITAL SHARE TRANSACTIONS | ||||||||
Proceeds from shares sold | 228,670,227 | 492,535,674 | ||||||
Proceeds from reinvestment of distributions | 20,208,334 | 27,335,474 | ||||||
Cost of shares redeemed | (150,551,297 | ) | (234,079,639 | ) | ||||
Redemption fee proceeds | 53,533 | 131,984 | ||||||
|
|
|
| |||||
Net increase from capital share transactions | 98,380,797 | 285,923,493 | ||||||
|
|
|
| |||||
Total increase in net assets | 183,827,319 | 324,586,930 | ||||||
|
|
|
| |||||
| NET ASSETS | ||||||||
Beginning of period | 1,134,535,305 | 809,948,375 | ||||||
|
|
|
| |||||
End of period | $ | 1,318,362,624 | $ | 1,134,535,305 | ||||
|
|
|
| |||||
| CHANGE IN CAPITAL SHARES | ||||||||
Shares outstanding, beginning of period | 66,762,268 | 50,097,938 | ||||||
|
|
|
| |||||
Shares sold | 13,209,118 | 29,150,342 | ||||||
Shares issued on reinvestment of distributions | 1,276,585 | 1,689,461 | ||||||
Shares repurchased | (8,853,520 | ) | (14,175,473 | ) | ||||
|
|
|
| |||||
Net increase in capital shares | 5,632,183 | 16,664,330 | ||||||
|
|
|
| |||||
Shares outstanding, end of period | 72,394,451 | 66,762,268 | ||||||
|
|
|
| |||||
| 1 | Unaudited |
The accompanying notes are an integral part of these financial statements.
30
| For a capital share outstanding throughout each period. |
The following information should be read in conjunction with the financial statements and notes thereto appearing elsewhere in this Semiannual Report.
| Six Months Ended Apr. 30, 20121 | Year Ended Oct. 31, 2011 | Year Ended Oct. 31, 2010 | Year Ended Oct. 31, 2009 | Year Ended Oct. 31, 2008 | Year Ended Oct. 31, 2007 | |||||||||||||||||||
Net asset value, beginning of the period | $ | 14.32 | $ | 13.48 | $ | 11.69 | $ | 10.10 | $ | 15.22 | $ | 13.48 | ||||||||||||
|
|
|
|
|
|
|
|
|
|
|
| |||||||||||||
Income from investment operations: | ||||||||||||||||||||||||
Net investment income | 0.12 | 0.16 | 0.09 | 5 | 0.10 | 0.06 | 0.07 | |||||||||||||||||
Net realized and unrealized gain (loss) on | 1.17 | 0.79 | 1.79 | 1.55 | (4.99 | ) | 1.79 | |||||||||||||||||
|
|
|
|
|
|
|
|
|
|
|
| |||||||||||||
Total from investment operations | 1.29 | 0.95 | 1.88 | 1.65 | (4.93 | ) | 1.86 | |||||||||||||||||
|
|
|
|
|
|
|
|
|
|
|
| |||||||||||||
Less: | ||||||||||||||||||||||||
Dividends from net investment income | (0.18 | ) | (0.11 | ) | (0.09 | ) | (0.06 | ) | (0.07 | ) | (0.04 | ) | ||||||||||||
Distributions from net realized gain | — | — | — | — | (0.12 | ) | (0.08 | ) | ||||||||||||||||
|
|
|
|
|
|
|
|
|
|
|
| |||||||||||||
Total distributions | (0.18 | ) | (0.11 | ) | (0.09 | ) | (0.06 | ) | (0.19 | ) | (0.12 | ) | ||||||||||||
|
|
|
|
|
|
|
|
|
|
|
| |||||||||||||
Redemption fees proceeds | 0.00 | 4 | 0.00 | 4 | 0.00 | 4 | 0.00 | 4 | 0.00 | 4 | 0.00 | 4 | ||||||||||||
|
|
|
|
|
|
|
|
|
|
|
| |||||||||||||
Net asset value, end of period | $ | 15.43 | $ | 14.32 | $ | 13.48 | $ | 11.69 | $ | 10.10 | $ | 15.22 | ||||||||||||
|
|
|
|
|
|
|
|
|
|
|
| |||||||||||||
Total return | 9.13 | %3 | 7.05 | % | 16.14 | % | 16.55 | % | (32.73 | %) | 13.88 | % | ||||||||||||
Ratios/supplemental data: | ||||||||||||||||||||||||
Net assets, end of period (millions) | $ | 1,310.8 | $ | 904.3 | $ | 607.1 | $ | 179.7 | $ | 187.0 | $ | 216.4 | ||||||||||||
Ratio of expenses to average net assets | 0.65 | %2 | 0.66 | % | 0.71 | % | 0.80 | % | 0.79 | % | 0.81 | % | ||||||||||||
Ratio of net investment income to average | 1.86 | %2 | 1.25 | % | 1.37 | %5 | 0.96 | % | 0.51 | % | 0.59 | % | ||||||||||||
Portfolio turnover rate | 5.82 | %3 | 24.27 | % | 3.35 | % | 33.55 | % | 9.66 | % | 5.87 | % | ||||||||||||
| 1 | Unaudited |
| 2 | Annualized |
| 3 | Not annualized |
| 4 | Amount represents less than $0.01 per share. |
| 5 | Investment income per share reflects a special dividend of $0.05. Excluding the special dividend, the ratio of net investment income to average net assets would have been 0.74%. |
The accompanying notes are an integral part of these financial statements.
31
| Financial Highlights For a capital share outstanding throughout each period. |
The following information should be read in conjunction with the financial statements and notes thereto appearing elsewhere in this Semiannual Report.
| Six Months Ended Apr. 30, 20121 | Year Ended Oct. 31, 2011 | Year Ended Oct. 31, 2010 | Year Ended Oct. 31, 2009 | Year Ended Oct. 31, 2008 | Year Ended Oct. 31, 2007 | |||||||||||||||||||
Net asset value, beginning of the period | $ | 15.44 | $ | 14.70 | $ | 12.18 | $ | 10.07 | $ | 15.71 | $ | 13.76 | ||||||||||||
|
|
|
|
|
|
|
|
|
|
|
| |||||||||||||
Income from investment operations: | ||||||||||||||||||||||||
Net investment income | 0.06 | 0.04 | 0.02 | 0.03 | 0.03 | 0.04 | ||||||||||||||||||
Net realized and unrealized gain (loss) on investments and foreign currency | 1.21 | 0.71 | 2.53 | 2.11 | (5.59 | ) | 2.07 | |||||||||||||||||
|
|
|
|
|
|
|
|
|
|
|
| |||||||||||||
Total from investment operations | 1.27 | 0.75 | 2.55 | 2.14 | (5.56 | ) | 2.11 | |||||||||||||||||
|
|
|
|
|
|
|
|
|
|
|
| |||||||||||||
Less: | ||||||||||||||||||||||||
Dividend from investment income | (0.06 | ) | (0.01 | ) | (0.03 | ) | (0.03 | ) | (0.04 | ) | (0.02 | ) | ||||||||||||
Distributions from net realized gain | (0.06 | ) | — | — | — | (0.04 | ) | (0.14 | ) | |||||||||||||||
|
|
|
|
|
|
|
|
|
|
|
| |||||||||||||
Total distributions | (0.12 | ) | (0.01 | ) | (0.03 | ) | (0.03 | ) | (0.08 | ) | (0.16 | ) | ||||||||||||
|
|
|
|
|
|
|
|
|
|
|
| |||||||||||||
Redemption fees proceeds | 0.00 | 4 | 0.00 | 4 | 0.00 | 4 | 0.00 | 4 | 0.00 | 4 | 0.00 | 4 | ||||||||||||
|
|
|
|
|
|
|
|
|
|
|
| |||||||||||||
Net asset value, end of period | $ | 16.59 | $ | 15.44 | $ | 14.70 | $ | 12.18 | $ | 10.07 | $ | 15.71 | ||||||||||||
|
|
|
|
|
|
|
|
|
|
|
| |||||||||||||
Total return | 8.29 | %3 | 5.13 | % | 20.96 | % | 21.39 | % | (35.55 | %) | 15.46 | % | ||||||||||||
Ratios/supplemental data: | ||||||||||||||||||||||||
Net assets, end of period (millions) | $ | 2,170.9 | $ | 1,821.9 | $ | 1,451.2 | $ | 706.5 | $ | 412.4 | $ | 512.0 | ||||||||||||
Ratio of expenses to average net assets | 0.67 | %2 | 0.66 | % | 0.68 | % | 0.71 | % | 0.71 | % | 0.75 | % | ||||||||||||
Ratio of net investment loss to average net assets | 0.79 | %2 | 0.26 | % | 0.15 | % | 0.35 | % | 0.26 | % | 0.30 | % | ||||||||||||
Portfolio turnover rate | 7.30 | %3 | 12.57 | % | 4.93 | % | 12.49 | % | 12.72 | % | 4.83 | % | ||||||||||||
| 1 | Unaudited |
| 2 | Annualized |
| 3 | Not annualized |
| 4 | Amount represents less than $0.01 per share. |
The accompanying notes are an integral part of these financial statements.
32
| Financial Highlights PRIMECAP Odyssey Aggressive Growth Fund For a capital share outstanding throughout each period. |
The following information should be read in conjunction with the financial statements and notes thereto appearing elsewhere in this Semiannual Report.
| Six Months Ended Apr. 30, 20121 | Year Ended Oct. 31, 2011 | Year Ended Oct. 31, 2010 | Year Ended Oct. 31, 2009 | Year Ended Oct. 31, 2008 | Year Ended Oct. 31, 2007 | |||||||||||||||||||
Net asset value, beginning of the period | $ | 16.99 | $ | 16.17 | $ | 12.33 | $ | 9.46 | $ | 16.03 | $ | 13.92 | ||||||||||||
|
|
|
|
|
|
|
|
|
|
|
| |||||||||||||
Income from investment operations: | ||||||||||||||||||||||||
Net investment loss | (0.01 | ) | (0.05 | ) | (0.05 | ) | (0.05 | ) | (0.06 | ) | (0.03 | ) | ||||||||||||
Net realized and unrealized gain (loss) on investments and foreign currency | 1.55 | 1.40 | 3.89 | 2.92 | (6.42 | ) | 2.34 | |||||||||||||||||
|
|
|
|
|
|
|
|
|
|
|
| |||||||||||||
Total from investment operations | 1.54 | 1.35 | 3.84 | 2.87 | (6.48 | ) | 2.31 | |||||||||||||||||
|
|
|
|
|
|
|
|
|
|
|
| |||||||||||||
Less: | ||||||||||||||||||||||||
Distributions from net realized gain | (0.32 | ) | (0.53 | ) | — | — | (0.09 | ) | (0.20 | ) | ||||||||||||||
|
|
|
|
|
|
|
|
|
|
|
| |||||||||||||
Redemption fees proceeds | 0.00 | 4 | 0.00 | 4 | 0.00 | 4 | 0.00 | 4 | 0.00 | 4 | 0.00 | 4 | ||||||||||||
|
|
|
|
|
|
|
|
|
|
|
| |||||||||||||
Net asset value, end of period | $ | 18.21 | $ | 16.99 | $ | 16.17 | $ | 12.33 | $ | 9.46 | $ | 16.03 | ||||||||||||
|
|
|
|
|
|
|
|
|
|
|
| |||||||||||||
Total return | 9.35 | %3 | 8.50 | % | 31.14 | % | 30.34 | % | (40.60 | %) | 16.76 | % | ||||||||||||
Ratios/supplemental data: | ||||||||||||||||||||||||
Net assets, end of period (millions) | $ | 1,318.4 | $ | 1,134.5 | $ | 809.9 | $ | 368.8 | $ | 225.4 | $ | 375.2 | ||||||||||||
Ratio of expenses to average net assets | 0.68 | %2 | 0.68 | % | 0.71 | % | 0.77 | % | 0.78 | % | 0.78 | % | ||||||||||||
Ratio of net investment loss to average net assets | (0.11 | %)2 | (0.33 | %) | (0.45 | %) | (0.54 | %) | (0.46 | %) | (0.25 | %) | ||||||||||||
Portfolio turnover rate | 10.90 | %3 | 11.32 | % | 15.34 | % | 19.70 | % | 24.32 | % | 6.02 | % | ||||||||||||
| 1 | Unaudited |
| 2 | Annualized |
| 3 | Not annualized |
| 4 | Amount represents less than $0.01 per share. |
The accompanying notes are an integral part of these financial statements.
33
| PRIMECAP Odyssey Funds For the Six Months Ended April 30, 2012 (Unaudited) |
(1) Organization
PRIMECAP Odyssey Funds (the “Trust”) was organized on June 8, 2004 as a Delaware statutory trust and is registered as an open-end management investment company under the Investment Company Act of 1940, as amended (the “1940 Act”). The Trust is comprised of three series: PRIMECAP Odyssey Stock Fund, PRIMECAP Odyssey Growth Fund, and PRIMECAP Odyssey Aggressive Growth Fund (the “Funds”), each of which is diversified within the meaning of the 1940 Act. PRIMECAP Management Company (the “Investment Advisor”) serves as investment advisor to the Funds. Each Fund commenced operations on November 1, 2004.
Each Fund’s investment objective is to provide long-term capital appreciation. Each Fund is authorized to issue unlimited shares of beneficial interest. All shares within each Fund have equal rights with respect to voting. Each Fund may charge a redemption fee of 2% of the redemption amount on shares redeemed or exchanged within 60 days of purchase.
(2) Significant Accounting Policies
The Funds consistently follow the accounting policies set forth below which are in conformity with accounting principles generally accepted in the United States of America.
| A. | Security Valuation |
Securities traded on a national securities exchange are valued at the last reported sales price at the close of regular trading on each day the exchanges are open for trading. Securities listed on the NASDAQ Global Market, the NASDAQ Global Select Market, and the NASDAQ Capital Market are valued using the NASDAQ Official Closing Price, which may not necessarily represent the last sale price. Quotations of foreign securities in a foreign currency are valued daily in U.S. dollars on the basis of the foreign currency exchange rates prevailing at the time such valuation is determined. Foreign currency exchange rates generally are determined prior to the close of the New York Stock Exchange (the “NYSE”). Securities traded on an exchange for which there have been no sales are valued at the mean between the bid and asked price. Securities for which quotations are not readily available are stated at their respective fair values as determined in good faith by a valuation committee of the Investment Advisor in accordance with procedures approved by the Trust’s Board of Trustees. In determining fair value, the Funds take into account all relevant factors and available information. Consequently, the price of a security used by a Fund to calculate its net asset value per share (“NAV”) may differ from quoted or published prices for the same security. Fair value pricing involves subjective judgments, and there is no single standard for determining a security’s fair value. As a result, different mutual funds could reasonably arrive at a different fair value for the same security. It is possible that the fair value determined for a security is materially different from the value that could be realized upon the sale of that security or from the values that other mutual funds may determine.
Investments in other funds are valued at their respective net asset values as determined by those funds, in accordance with the 1940 Act.
34
Notes to Financial Statements
PRIMECAP Odyssey Funds
For the Six Months Ended April 30, 2012 (Unaudited) – continued
Foreign securities are recorded in the financial statements after their prices are converted to U.S. dollars based on the applicable exchange rate at the end of the period. The Funds do not isolate that portion of the results of operations arising as a result of changes in the currency exchange rate from the fluctuations arising as a result of changes in the market prices of investments during the period.
| B. | Share Valuation |
The NAV of a Fund is calculated by dividing the sum of the value of the securities held by the Fund, plus cash or other assets, minus all liabilities (including estimated accrued expenses), by the total number of shares outstanding of the Fund. The result is rounded to the nearest cent. The Funds’ shares will not be priced on the days on which the NYSE is closed for trading.
| C. | Foreign Currency |
Values of investments denominated in foreign currencies are converted into U.S. dollars using the spot market rate of exchange at the time of valuation. Purchases and sales of investments and dividend and interest income are converted into U.S. dollars using the spot market rate of exchange prevailing on the respective dates of such translations. Realized foreign exchange gains or losses arise from sales of foreign currencies, currency gains or losses realized between the trade and settlement dates on securities transactions and the difference between the recorded amounts of dividends, interest, and foreign withholding taxes and the U.S. dollar equivalent of the amounts actually received or paid. Net unrealized foreign exchange gains and losses arise from changes in foreign exchange rates on foreign denominated assets and liabilities other than investments in securities held at the end of the reporting period. Foreign securities and currency transactions may involve risks not associated with U.S. securities and currency.
| D. | Federal Income Taxes |
Each Fund has elected to be treated as a “regulated investment company” under Subchapter M of the Internal Revenue Code (the “IRC”). The Funds intend to distribute substantially all of their taxable income and any accumulated net realized capital gains. Accordingly, no provision for Federal income taxes has been made in the accompanying financial statements.
The Funds may be subject to foreign taxes on income, gains on investments, or currency repatriation, a portion of which may be recoverable. The Funds will accrue such taxes and recoveries as applicable based upon their current interpretations of the tax rules and regulations that exist in the markets in which they invest.
Each Fund has adopted accounting standards regarding recognition and measurement of tax positions taken on a tax return. No material uncertain tax positions existed in any Fund as of April 30, 2012. As of April 30, 2012, open tax years include the tax years ended October 31, 2008 through 2011. The Funds are also not aware of any tax positions for which it is reasonably possible that the total amounts of unrecognized tax benefits will significantly change in the next 12 months. The Funds recognize interest
35
Notes to Financial Statements
PRIMECAP Odyssey Funds
For the Six Months Ended April 30, 2012 (Unaudited) – continued
and penalties, if any, related to unrecognized tax benefits as income tax expense in the Statement of Operations. During the six months ended April 30, 2012, the Funds did not incur any interest or penalties.
| E. | Allocation of Expenses |
Each Fund is charged for those expenses directly attributable to it. Expenses that are not directly attributable to a Fund are allocated among the Funds by an appropriate method based on the nature of the expense.
| F. | Security Transactions, Investment Income, and Distributions |
Security transactions are accounted for on the trade date. Dividend income and distributions to shareholders are recorded on the ex-dividend date, and interest income is recognized on the accrual basis. Realized gains and losses are evaluated on the basis of identified costs. Premiums and discounts on the purchase of securities are amortized/accreted using the effective interest method. Accounting principles generally accepted in the United States of America require that permanent financial reporting and tax differences be reclassified in the capital accounts.
| G. | Use of Estimates |
The preparation of financial statements in conformity with accounting principles generally accepted in the United States of America requires management to make estimates and assumptions that affect the reported amounts of assets and liabilities and disclosure of contingent assets and liabilities at the date of the financial statements, and the reported amounts of revenues and expenses during the reporting period. Actual results could differ from these estimates.
| H. | Indemnification Obligations |
Under the Trust’s organizational documents, its current and former officers and trustees are indemnified against certain liabilities arising out of the performance of their duties to the Funds. In addition, in the normal course of business, the Funds enter into contracts that contain a variety of representations and warranties that provide general indemnifications. The Funds’ maximum exposure under these arrangements is unknown as this would involve future claims that may be made against the Funds that have not yet occurred. Based on experience, the Funds would expect the risk of loss to be remote.
(3) Investment Transactions
The cost of purchases and the proceeds from sales of securities, excluding short-term investments, for the six months ended April 30, 2012 were as follows:
Fund | Purchases | Sales | ||||||
PRIMECAP Odyssey Stock Fund | $ | 301,219,363 | $ | 60,364,063 | ||||
PRIMECAP Odyssey Growth Fund | $ | 252,462,907 | $ | 140,333,409 | ||||
PRIMECAP Odyssey Aggressive Growth Fund | $ | 136,691,713 | $ | 115,584,943 | ||||
36
Notes to Financial Statements
PRIMECAP Odyssey Funds
For the Six Months Ended April 30, 2012 (Unaudited) – continued
(4) Fair Value of the Financial Instruments
The Funds have adopted fair valuation accounting standards which establish an authoritative definition of fair value and set forth a hierarchy for measuring fair value. These standards require additional disclosure about the various inputs and valuation techniques used to develop the measurements of fair value and a discussion of changes in valuation techniques and related inputs during the period. These standards define fair value as the price that would be received in the sale of an asset or paid to transfer a liability in an orderly transaction between market participants on the measurement date. The fair value hierarchy is organized into three levels based upon the assumptions (referred to as “inputs”) used to value the asset or liability. These standards state that “observable inputs” reflect the assumptions that market participants would use in valuing an asset or liability based on market data obtained from independent sources. “Unobservable inputs” reflect the Funds’ own assumptions about the inputs market participants would use to value the asset or liability.
Various inputs are used in determining the value of each Fund’s investments. These inputs are summarized in the three broad levels below:
| Level 1 – | Unadjusted quoted prices in active markets for identical securities to which the Trust has access at the date of measurement. |
| Level 2 – | Other significant observable inputs (including quoted prices for similar or related securities in both active and inactive markets, interest rates, foreign exchange rates, and fair value estimates for foreign securities indices). |
| Level 3 – | Significant unobservable inputs to the extent observable inputs are unavailable (including the Funds’ own assumptions in determining fair value of investments based on the best available information). |
37
Notes to Financial Statements
PRIMECAP Odyssey Funds
For the Six Months Ended April 30, 2012 (Unaudited) – continued
The following table provides the fair value measurements of applicable Fund assets by level within the fair value hierarchy for each Fund as of April 30, 2012. There were no significant transfers into or out of Level 1 and Level 2 during the reporting period. These assets are measured on a recurring basis.
Fund | Description | Quoted prices in active markets for identical assets (Level 1) | Significant other observable inputs (Level 2) | Significant unobservable inputs (Level 3) | Total | |||||||||||||
PRIMECAP Odyssey Stock Fund | Equity | $ | 1,176,609,860 | $ | — | $ | — | $ | 1,176,609,860 | |||||||||
|
|
|
|
|
|
|
| |||||||||||
Total Equity | 1,176,609,860 | — | — | 1,176,609,860 | ||||||||||||||
|
|
|
|
|
|
|
| |||||||||||
Short-Term Investments | 123,697,153 | — | — | 123,697,153 | ||||||||||||||
|
|
|
|
|
|
|
| |||||||||||
Total Investments | $ | 1,300,307,013 | $ | — | $ | — | $ | 1,300,307,013 | ||||||||||
|
|
|
|
|
|
|
| |||||||||||
PRIMECAP Odyssey Growth Fund | Equity | $ | 2,068,248,666 | $ | — | $ | — | $ | 2,068,248,666 | |||||||||
|
|
|
|
|
|
|
| |||||||||||
Total Equity | 2,068,248,666 | — | — | 2,068,248,666 | ||||||||||||||
|
|
|
|
|
|
|
| |||||||||||
Short-Term Investments | 88,594,497 | — | — | 88,594,497 | ||||||||||||||
|
|
|
|
|
|
|
| |||||||||||
Total Investments | $ | 2,156,843,163 | $ | — | $ | — | $ | 2,156,843,163 | ||||||||||
|
|
|
|
|
|
|
| |||||||||||
PRIMECAP Odyssey Aggressive Growth Fund | Equity | $ | 1,228,231,442 | $ | — | $ | — | $ | 1,228,231,442 | |||||||||
|
|
|
|
|
|
|
| |||||||||||
Total Equity | 1,228,231,442 | — | — | 1,228,231,442 | ||||||||||||||
|
|
|
|
|
|
|
| |||||||||||
Short-Term Investments | 91,761,980 | — | — | 91,761,980 | ||||||||||||||
|
|
|
|
|
|
|
| |||||||||||
Total Investments | $ | 1,319,993,422 | $ | — | $ | — | $ | 1,319,993,422 | ||||||||||
|
|
|
|
|
|
|
| |||||||||||
1 Refer to each Fund’s respective Schedule of Investments for the breakdown of major categories.
In May 2011, the FASB issued ASU No. 2011-04 “Amendments to Achieve Common Fair Value Measurement and Disclosure Requirements” in GAAP and the International Financial Reporting Standards (“IFRS”). ASU No. 2011-04 amends FASB ASC Topic 820, Fair Value Measurements and Disclosures, to establish common requirements for measuring fair value and for disclosing information about fair value measurements in accordance with GAAP and IFRS. ASU No. 2011-04 is effective for interim and fiscal years beginning after December 15, 2011. Management is currently evaluating the impact of these amendments and does not believe they will have a material impact on the Funds’ financial statements.
38
Notes to Financial Statements
PRIMECAP Odyssey Funds
For the Six Months Ended April 30, 2012 (Unaudited) – continued
(5) Distribution to Shareholders
Net investment income and net realized gains differ for financial statement and tax purposes due to differing treatments of deferred wash sale losses.
As of October 31, 2011, the components of capital on a tax basis were as follows:
| PRIMECAP Odyssey Stock Fund | PRIMECAP Odyssey Growth Fund | PRIMECAP Odyssey Aggressive Growth Fund | ||||||||||
Cost of investments for tax purposes1 | $ | 815,152,845 | $ | 1,634,621,179 | $ | 1,001,330,101 | ||||||
|
|
|
|
|
| |||||||
Gross tax unrealized appreciation | 133,373,705 | 402,987,313 | 310,304,846 | |||||||||
Gross tax unrealized depreciation | (46,131,962 | ) | (214,145,724 | ) | (178,996,370 | ) | ||||||
|
|
|
|
|
| |||||||
Net tax unrealized appreciation . | 87,241,743 | 188,841,589 | 131,308,476 | |||||||||
|
|
|
|
|
| |||||||
Undistributed ordinary income . | 8,872,391 | 11,274,075 | 13,465,599 | |||||||||
Undistributed long-term capital gain | — | — | 7,777,022 | |||||||||
|
|
|
|
|
| |||||||
Total distributable earnings | 8,872,391 | 11,274,075 | 21,242,621 | |||||||||
|
|
|
|
|
| |||||||
Other accumulated gain (loss) | (20,033,026 | ) | — | — | ||||||||
|
|
|
|
|
| |||||||
Total accumulated gain | $ | 76,081,108 | $ | 200,115,664 | $ | 152,551,097 | ||||||
|
|
|
|
|
| |||||||
| 1 | At October 31, 2011 the differences in the basis for federal income tax purposes and financial reporting purchases are due to the tax deferral of losses on wash sales. |
At October 31, 2011, the PRIMECAP Odyssey Stock Fund had capital loss carryover of $20,033,026 which expires on October 31, 2017.
Tax components of dividends paid during the six months ended April 30, 2012 and the year ended October 31, 2011 were as follows:
| April 30, 2012 | ||||||||
| Ordinary Income Distributions | Long-Term Capital Gain Distributions | |||||||
PRIMECAP Odyssey Stock Fund | $ | 12,241,758 | $ | — | ||||
PRIMECAP Odyssey Growth Fund | $ | 13,976,027 | $ | — | ||||
PRIMECAP Odyssey Aggressive Growth Fund | $ | 7,776,563 | $ | 13,466,696 | ||||
39
Notes to Financial Statements
PRIMECAP Odyssey Funds
For the Six Months Ended April 30, 2012 (Unaudited) – continued
| October 31, 2011 | ||||||||
| Ordinary Income Distributions | Long-Term Capital Gain Distributions | |||||||
PRIMECAP Odyssey Stock Fund | $ | 5,099,941 | $ | — | ||||
PRIMECAP Odyssey Growth Fund | $ | 1,416,348 | $ | — | ||||
PRIMECAP Odyssey Aggressive Growth Fund | $ | — | $ | 27,881,437 | ||||
The Funds designated as long-term capital gain dividends, pursuant to Internal Revenue Code Section 852(b)(3), the amounts necessary to reduce the earnings and profits of the Funds related to net capital gains to zero for the tax year ended October 31, 2011.
In December 2010, the Regulated Investment Company Modernization Act (the “RIC Act”) was enacted by Congress and signed into law. Under the RIC Act, new capital losses may be carried forward indefinitely and retain the character of the original loss. Any post-enactment capital losses generated will be required to be utilized prior to the losses incurred in pre-enactment years. The RIC Act, among other things, also contains provisions aimed at preventing disqualification under the IRC for inadvertent failures to comply with the asset diversification and qualifying income tests, exempts RICs from the preferential dividend rule, and repeals the 60-day designation requirement for certain pay-through income and gains. Most of the provisions of the RIC Act will apply to the Funds beginning in the 2012 fiscal year.
(6) Investment Advisory and Other Agreements
The Trust has entered into an investment management agreement with the Investment Advisor on behalf of each Fund. For its services to the Funds, the Investment Advisor receives a fee paid quarterly at the annual rate of 0.60% of the first $100 million of each Fund’s average daily net assets and 0.55% of each Fund’s average daily net assets in excess of $100 million. For the six months ended April 30, 2012, each Fund paid the Investment Advisor at an effective annual rate of 0.55% of its respective average net assets.
The Bank of New York Mellon serves as the Funds’ custodian. U.S. Bancorp Fund Services, LLC (“USBFS”) serves as the administrator, fund accountant, and transfer agent to the Funds. Quasar Distributors, LLC, an affiliate of USBFS, serves as the Funds’ distributor.
(7) Other Affiliates
Certain of the Funds’ investments are in companies that are considered to be affiliated companies of a Fund because the Fund owns 5% or more of the outstanding voting securities of the company. Transactions during the period in securities of these companies were as follows:
40
Notes to Financial Statements
PRIMECAP Odyssey Funds
For the Six Months Ended April 30, 2012 (Unaudited) – continued
PRIMECAP Odyssey Growth Fund |
| |||||||||||||||||||||||
| Current Period Transactions | ||||||||||||||||||||||||
Common Stock | Market Value at October 31, 2011 | Purchases at Cost | Proceeds from Securities Sold | Dividend Income | Realized Gain (Loss) | Market Value at April 30, 2012 | ||||||||||||||||||
Conceptus, Inc. | $ | 25,962,947 | $ | 523,756 | $ | — | $ | — | $ | — | $ | 43,053,275 | ||||||||||||
ImmunoGen, Inc. | 79,307,200 | — | — | — | — | 74,460,000 | ||||||||||||||||||
Stratasys, Inc.1 | 29,722,400 | — | 7,306,546 | — | 3,344,165 | N/A | ||||||||||||||||||
|
|
|
|
|
|
|
|
|
|
|
| |||||||||||||
Total | $ | 134,992,547 | $ | 523,756 | $ | 7,306,546 | $ | — | $ | 3,344,165 | $ | 117,513,275 | ||||||||||||
|
|
|
|
|
|
|
|
|
|
|
| |||||||||||||
| 1 | No longer an affiliate as of April 30, 2012. |
PRIMECAP Odyssey Aggressive Growth Fund |
| |||||||||||||||||||||||
| Current Period Transactions | ||||||||||||||||||||||||
Common Stock | Market Value at October 31, 2011 | Purchases at Cost | Proceeds from Securities Sold | Dividend Income | Realized Gain (Loss) | Market Value at April 30, 2012 | ||||||||||||||||||
Abiomed, Inc. | $ | 30,845,485 | $ | 2,373,723 | $ | 346,355 | $ | — | $ | 60,462 | $ | 52,350,204 | ||||||||||||
Conceptus, Inc. | 19,235,520 | — | — | — | — | 31,341,208 | ||||||||||||||||||
Dyax, Corp. | 7,863,750 | 40,338 | — | — | — | 9,535,337 | ||||||||||||||||||
Guidance Software, Inc. | 7,825,621 | 1,101,838 | — | — | — | 13,305,929 | ||||||||||||||||||
Smart Balance, Inc. | 21,702,803 | — | — | — | — | 19,549,089 | ||||||||||||||||||
|
|
|
|
|
|
|
|
|
|
|
| |||||||||||||
Total | $ | 87,473,179 | $ | 3,515,899 | $ | 346,355 | $ | — | $ | 60,462 | $ | 126,081,767 | ||||||||||||
|
|
|
|
|
|
|
|
|
|
|
| |||||||||||||
(8) Subsequent Events
The Funds have evaluated subsequent events through the issuance of the financial statements and determined that no events have occurred that require disclosure.
41
| PRIMECAP Odyssey Funds (Unaudited) |
As a shareholder of one or more of the Funds, you incur ongoing costs, including management fees and other Fund expenses. This expense example is intended to help you understand your ongoing costs (in dollars) of investing in the Funds and to compare these costs with the ongoing costs of investing in other mutual funds.
The expense example is based on an investment of $1,000 invested for a six-month period beginning November 1, 2011 and held through April 30, 2012.
Actual Expenses
The information in the table adjacent to the heading “Actual Performance” provides actual account values and actual expenses. You may use the information in these columns, together with the amount you invested, to estimate the expenses that you paid over the period. Simply divide your account value by $1,000 (for example, an $8,600 account value divided by $1,000 = 8.6), then multiply the result by the number in the column entitled “Expenses Paid during Period” to estimate the expenses you paid on your account during this period.
Hypothetical Example for Comparison Purposes
The information in the table adjacent to the heading “Hypothetical Performance (5% return before expenses)” provides hypothetical account values and hypothetical expenses based on the Funds’ actual expense ratios and an assumed rate of return of 5% per year before expenses, which are not the Funds’ actual returns. The hypothetical account values and expenses may not be used to estimate the actual ending account balance or expenses you paid for the period. You may use this information to compare the ongoing costs of investing in the Funds and other mutual funds. To do so, compare these 5% hypothetical examples with the 5% hypothetical examples that appear in the shareholder reports of the other mutual funds.
Please note that the expenses shown in the table are meant to highlight your ongoing costs only. Therefore, the information adjacent to the heading “Hypothetical Performance (5% return before expenses)” is useful in comparing ongoing costs only and will not help you determine the relative total costs of owning different mutual funds. In addition, if transactional costs were included, your costs would have been higher.
42
Expense Example
PRIMECAP Odyssey Funds
(Unaudited) – continued
| Beginning Account Value (11/1/11) | Ending (04/30/12) | Expenses Paid During Period1 (11/1/11 to 04/30/12) | Expense Ratio During Period1 (11/1/11 to 04/30/12) | |||||||||||||
PRIMECAP Odyssey Stock Fund |
| |||||||||||||||
Actual Performance | $ | 1,000.00 | $ | 1,091.30 | $ | 3.38 | 0.65% | |||||||||
Hypothetical Performance | $ | 1,000.00 | $ | 1,021.63 | $ | 3.27 | 0.65% | |||||||||
PRIMECAP Odyssey Growth Fund |
| |||||||||||||||
Actual Performance | $ | 1,000.00 | $ | 1,082.90 | $ | 3.47 | 0.67% | |||||||||
Hypothetical Performance | $ | 1,000.00 | $ | 1,021.53 | $ | 3.36 | 0.67% | |||||||||
PRIMECAP Odyssey Aggressive Growth Fund |
| |||||||||||||||
Actual Performance | $ | 1,000.00 | $ | 1,093.50 | $ | 3.52 | 0.68% | |||||||||
Hypothetical Performance | $ | 1,000.00 | $ | 1,021.50 | $ | 3.40 | 0.68% | |||||||||
| 1 | Expenses are equal to a Fund’s annualized expense ratio as indicated, multiplied by the average account value over the period, multiplied by the number of days in the most recent fiscal half-year period (182), then divided by the number of days in the fiscal year (366) to reflect the one-half year period. |
43
| PRIMECAP Odyssey Funds (Unaudited) |
Proxy Voting Procedures
The Investment Advisor votes proxies relating to portfolio securities in accordance with procedures that have been approved by the Trust’s Board of Trustees. You may obtain a description of these procedures, free of charge, by calling toll-free 1-800-729-2307. This information is also available through the Securities and Exchange Commission’s (“SEC”) website at www.sec.gov.
Proxy Voting Record
Information regarding how the Funds voted proxies relating to the portfolio securities during the most recent 12-month period ended June 30 is available, without charge, by calling toll-free 1-800-729-2307. This information is also available through the SEC’s website at www.sec.gov.
Form N-Q Disclosure
The Trust files its complete schedules of portfolio holdings with the SEC for the first and third quarters of each fiscal year on Form N-Q. The Trust’s Form N-Q is available on the SEC’s website at www.sec.gov. The Trust’s Form N-Q may be reviewed and copied at the Commission’s Public Reference Room in Washington, DC, and information on the operation of the Public Reference Room may be obtained by calling 1-800-SEC-0330. This information is also available, without charge, by calling toll-free 1-800-729-2307.
44
| PRIMECAP Odyssey Funds (Unaudited) |
Portfolio Managers
PRIMECAP Management Company has five portfolio managers who together have more than 140 years of investment experience. Each of these five individuals manages a portion of the PRIMECAP Odyssey Stock Fund and the PRIMECAP Odyssey Growth Fund. The PRIMECAP Odyssey Aggressive Growth Fund is primarily managed by Messrs. Kolokotrones, Fried, Mordecai, and Ansari. A small portion of each Fund’s assets may be managed by individuals in the Investment Advisor’s research department. The portfolio managers primarily responsible for overseeing the Funds’ investments are:
| Name | Years of Experience | |||
Mitchell J. Milias | 48 | |||
Theo A. Kolokotrones | 42 | |||
Joel P. Fried | 27 | |||
Alfred W. Mordecai | 15 | |||
M. Mohsin Ansari | 12 | |||
Officers and Trustees
The Trust’s officers, who oversee the Funds’ daily operations, are appointed by the Board of Trustees. The trustees are responsible for the overall management of the Trust, including establishing the Funds’ policies and general supervision and review of their investment activities. The Statement of Additional Information includes additional information about the trustees and is available, without charge, by calling 1-800-729-2307 or at the Funds’ website at www.odysseyfunds.com.
Executive Officers. The table below sets forth certain information about each of the Trust’s executive officers.
| Name, Address (Year of Birth) | Position(s) Held with Trust | Term of Office; Length of Time Served | Principal Occupation(s) During Past 5 Years | |||
Theo A. Kolokotrones 225 South Lake Ave. Pasadena, CA 91101-3005 | Co-Chief Executive Officer | Indefinite; Since 09/04 | Vice-Chairman, Director, Portfolio Manager, and Principal PRIMECAP Management Company | |||
Joel P. Fried 225 South Lake Ave. Pasadena, CA 91101-3005 (1962) | Co-Chief Executive Officer and Trustee | Indefinite; Since 09/04 | President, Director, Portfolio Manager, and Principal PRIMECAP Management Company |
45
Management
PRIMECAP Odyssey Funds
(Unaudited) – continued
| Name, Address (Year of Birth) | Position(s) Held with Trust | Term of Office; Length of Time Served | Principal Occupation(s) During Past 5 Years | |||
Michael J. Ricks 225 South Lake Ave. Pasadena, CA 91101-3005 (1977) | Chief Financial Officer, Chief Administrative Officer, and Secretary | Indefinite; Since 03/11 | Director of Fund Administration, PRIMECAP Management Company (since 2011); Vice President, Fund Administration and Compliance, U.S. Bancorp Fund Services, LLC (2001-2011) | |||
Karen Chen 225 South Lake Ave. Pasadena, CA 91101-3005 (1973) | Vice President of Compliance, Chief Compliance Officer, and AML Officer | Indefinite; Since 10/04 | Chief Compliance Officer, Director of Compliance and Reporting PRIMECAP Management Company |
“Independent” Trustees. The table below sets forth certain information about each of the trustees of the Trust who is not an “interested person” of the Trust as defined in the 1940 Act (“Independent Trustees”).
| Name, Address (Year of Birth) | Position(s) Held with Trust | Term of Office; Length of Time Served | Principal Occupation(s) During Past 5 Years | Number of Portfolios in Fund Complex by Trustee1 | Other Director- ships Held by Trustee | |||||
Benjamin F. Hammon 225 South Lake Ave. Pasadena, CA 91101-3005 (1935) | Chairman of the Board and Trustee | Indefinite; Since 09/04 | Retired; Director, Institutional Equity Sales, Salomon Smith Barney Inc. (1963-1998) | 3 | None | |||||
Wayne H. Smith 225 South Lake Ave. Pasadena, CA 91101-3005 (1941) | Chairman of the Audit Committee and Trustee | Indefinite; Since 09/04 | Retired; President, Wayne H. Smith Consulting, Inc. (2002- 2007); Vice President, Financial Services, Avery Dennison Corporation (2001-2002); Vice President, Financial Services, and Treasurer, Avery Dennison Corporation (1999-2001) | 3 | None | |||||
| Joseph G. Uzelac 225 South Lake Ave. Pasadena, CA 91101-3005 (1944) | Trustee | Indefinite; Since 10/07 | Retired; Managing Director, Lehman Brothers Global Investment Bank (1988-2007) | 3 | None |
46
Management
PRIMECAP Odyssey Funds
(Unaudited) – continued
| Name, Address (Year of Birth) | Position(s) Held with Trust | Term of Office; Length of Time Served | Principal Occupation(s) During Past 5 Years | Number of Portfolios in Fund Complex by Trustee1 | Other Director- ships Held by Trustee | |||||
| Elizabeth D. Obershaw 225 South Lake Ave. Pasadena, CA 91101-3005 (1960) | Trustee | Indefinite; Since 06/08 | Managing Director, Horsley Bridge Partners, an investment advisor (2007-present); Vice President and Chief Investment Officer, Hewlett-Packard Company (1991-2007); Hewlett-Packard Company (1983-1991) | 3 | None |
| 1 | Fund Complex includes any funds, series of funds, or trusts that share the same advisor or that hold themselves out to investors as related companies. |
“Interested” Trustees. The table below sets forth certain information about each of the trustees of the Trust who is an “interested person” of the Trust as defined by the 1940 Act.
| Name, Address (Year of Birth) | Position(s) Held with Trust | Term of Office; Length of Time Served | Principal Occupation(s) During Past 5 Years | Number of Portfolios in Fund Complex by Trustee1 | Other Director- ships Held by Trustee | |||||
| Joel P. Fried2 225 South Lake Ave. Pasadena, CA 91101-3005 (1962) | Co-Chief Executive Officer and Trustee | Indefinite; Since 09/04 | President, Director, Portfolio Manager, and Principal PRIMECAP Management Company | 3 | None |
| 1 | Fund Complex includes any funds, series of funds, or trusts that share the same advisor or that hold themselves out to investors as related companies. |
| 2 | Mr. Fried is an “interested person” of the Trust, as defined by the 1940 Act, because of his employ- ment with PRIMECAP Management Company, the investment advisor to the Trust. |
47
Investment Advisor
PRIMECAP MANAGEMENT COMPANY
225 South Lake Avenue, Suite 400
Pasadena, California 91101
•
Distributor
QUASAR DISTRIBUTORS, LLC
615 East Michigan Street, 4th Floor
Milwaukee, Wisconsin 53202
•
Custodian
THE BANK OF NEW YORK MELLON
One Wall Street
New York, New York 10286
•
Transfer Agent
U.S. BANCORP FUND SERVICES, LLC
615 East Michigan Street, 3rd Floor
Milwaukee, Wisconsin 53202
•
Administrator
U.S. BANCORP FUND SERVICES, LLC
2020 East Financial Way, Suite 100
Glendora, California 91741
•
Legal Counsel
BINGHAM McCUTCHEN LLP
355 South Grand Avenue, Suite 4400
Los Angeles, California 90071
•
Independent Registered Public Accounting Firm
PRICEWATERHOUSECOOPERS LLP
Three Embarcadero Center
San Francisco, California 94111
This report is intended for the shareholders of the PRIMECAP Odyssey Funds and may not be used as sales literature unless preceded or accompanied by a current prospectus.
Past performance results shown in this report should not be considered a representation of future performance. Share price and returns will fluctuate so that shares, when redeemed, may be worth more or less than their original cost. Statements and other information herein are dated and are subject to change.
PRIMECAP, PRIMECAP Odyssey, and the PRIMECAP Odyssey logo are trademarks of PRIMECAP Management Company.
Item 2. Code of Ethics.
Not applicable for semi-annual reports.
Item 3. Audit Committee Financial Expert.
Not applicable for semi-annual reports.
Item 4. Principal Accountant Fees and Services.
Not applicable for semi-annual reports.
Item 5. Audit Committee of Listed Registrants.
Not applicable to registrants who are not listed issuers (as defined in Rule 10A-3 under the Securities Exchange Act of 1934).
Item 6. Investments.
| (a) | Schedule of Investments is included as part of the report to shareholders filed under Item 1 of this Form. |
| (b) | Not applicable. |
Item 7. Disclosure of Proxy Voting Policies and Procedures for Closed-End Management Investment Companies.
Not applicable to open-end investment companies.
Item 8. Portfolio Managers of Closed-End Management Investment Companies.
Not applicable to open-end investment companies.
Item 9. Purchases of Equity Securities by Closed-End Management Investment Company and Affiliated Purchasers.
Not applicable to open-end investment companies.
Item 10. Submission of Matters to a Vote of Security Holders.
Not applicable.
Item 11. Controls and Procedures.
| (a) | The Registrant’s Co-Chief Executive Officers and Chief Financial Officer have reviewed the Registrant’s disclosure controls and procedures (as defined in Rule 30a-3(c) under the |
Investment Company Act of 1940 (the “Act”)) as of a date within 90 days of the filing of this report, as required by Rule 30a-3(b) under the Act and Rules 13a-15(b) or 15d-15(b) under the Securities Exchange Act of 1934. Based on their review, such officers have concluded that the disclosure controls and procedures are effective in ensuring that information required to be disclosed in this report is appropriately recorded, processed, summarized and reported and made known to them by others within the Registrant and by the Registrant’s service provider.
| (b) | There were no changes in the Registrant’s internal control over financial reporting (as defined in Rule 30a-3(d) under the Act) that occurred during the second fiscal quarter of the period covered by this report that has materially affected, or is reasonably likely to materially affect, the Registrant’s internal control over financial reporting. |
Item 12. Exhibits.
| (a) | (1) Any code of ethics or amendment thereto, that is the subject of the disclosure required by Item 2, to the extent that the registrant intends to satisfy Item 2 requirements through filing an exhibit. Not applicable. |
(2) A separate certification for each principal executive and principal financial officer pursuant to Section 302 of the Sarbanes-Oxley Act of 2002. Filed herewith.
(3) Any written solicitation to purchase securities under Rule 23c-1 under the Act sent or given during the period covered by the report by or on behalf of the registrant to 10 or more persons. Not applicable to open-end investment companies.
| (b) | Certifications pursuant to Section 906 of the Sarbanes-Oxley Act of 2002. Furnished herewith. |
SIGNATURES
Pursuant to the requirements of the Securities Exchange Act of 1934 and the Investment Company Act of 1940, the registrant has duly caused this report to be signed on its behalf by the undersigned, thereunto duly authorized.
| PRIMECAP Odyssey Funds | ||
| By: | /s/ Joel P. Fried | |
| Joel P. Fried, Co-Chief Executive Officer | ||
| Date: | 06/18/12 | |
| By: | /s/ Theo A. Kolokotrones | |
| Theo A. Kolokotrones, Co-Chief Executive Officer | ||
| Date: | 06/18/12 | |
Pursuant to the requirements of the Securities Exchange Act of 1934 and the Investment Company Act of 1940, this report has been signed below by the following persons on behalf of the registrant and in the capacities and on the dates indicated.
| By: | /s/ Joel P. Fried | |
| Joel P. Fried, Co-Chief Executive Officer | ||
| Date: | 06/18/12 | |
| By: | /s/ Theo A. Kolokotrones | |
| Theo A. Kolokotrones, Co-Chief Executive Officer | ||
| Date: | 06/18/12 | |
| By: | /s/ Michael J. Ricks | |
| Michael J. Ricks, Chief Financial Officer | ||
| Date: | 06/18/12 | |