As filed with the Securities and Exchange Commission on June 21, 2013
UNITED STATES
SECURITIES AND EXCHANGE COMMISSION
Washington, D.C. 20549
FORM N-CSR
CERTIFIED SHAREHOLDER REPORT OF REGISTERED
MANAGEMENT INVESTMENT COMPANIES
Investment Company Act file number 811-21597
PRIMECAP Odyssey Funds
(Exact name of registrant as specified in charter)
225 South Lake Avenue, Suite 400
Pasadena, CA 91101
(Address of principal executive offices) (Zip code)
Michael J. Ricks
PRIMECAP Management Company
225 South Lake Avenue, Suite 400
Pasadena, CA 91101
(Name and address of agent for service)
(626) 304-9222
Registrant’s telephone number, including area code:
Date of fiscal year end: October 31
Date of reporting period: April 30, 2013
Item 1. Reports to Stockholders.
SEMIANNUAL REPORT
For the Six Months Ended April 30, 2013

PRIMECAP ODYSSEY STOCK (POSKX)
PRIMECAP ODYSSEY GROWTH (POGRX)
PRIMECAP ODYSSEY AGGRESSIVE GROWTH (POAGX)
 | PRIMECAP Odyssey Funds |
| 2 | ||||
| 8 | ||||
| 8 | ||||
| 9 | ||||
| 10 | ||||
| 11 | ||||
| 13 | ||||
| 13 | ||||
| 17 | ||||
| 21 | ||||
| 25 | ||||
| 26 | ||||
| 27 | ||||
| 27 | ||||
| 28 | ||||
| 29 | ||||
| 30 | ||||
| 30 | ||||
| 31 | ||||
| 32 | ||||
| 33 | ||||
| 41 | ||||
| 42 | ||||
| 44 | ||||
1
| PRIMECAP Odyssey Funds |
Dear Fellow Shareholders,
For the six months ended April 30, 2013, all three PRIMECAP Odyssey Funds outperformed the unmanaged S&P 500 Index. The PRIMECAP Odyssey Stock Fund, PRIMECAP Odyssey Growth Fund, and PRIMECAP Odyssey Aggressive Growth Fund produced total returns of +18.43%, +23.20%, and +21.42%, respectively, versus the S&P 500’s total return of +14.42% for the period.
The economic environment for the past six months has been clouded by uncertainty over the fiscal challenges faced by the Federal Government. While the passage of the American Taxpayer Relief Act of 2012 in early January temporarily averted the tax issues related to the “fiscal cliff”, it only delayed budget sequestration until March, when automatic spending reductions began to take effect. We expect that federal spending cuts, along with higher payroll and other taxes, will negatively impact U.S. economic growth this year. Meanwhile, Europe continues to face economic difficulties due to sovereign debt crises, as evidenced by the unconventional bailout of Cyprus in March.
The stock market shrugged off these challenges, with the S&P 500 returning over 14% for the period. Continued monetary stimulus by central banks in the U.S., Europe, and Japan likely contributed to the strong gains. The recovery in the U.S. housing market appears to be accelerating, aided by the current low interest rate environment. The corporate sector remains an area of strength, with profit margins near all-time highs. Consumer spending growth has resumed, despite the expiration of the payroll tax holiday at the beginning of 2013.
We are encouraged by the PRIMECAP Odyssey Funds’ results for the past six months, but we remain focused on our goal of generating superior returns over the long-term. We continue to be overweight in the health care and information technology sectors and underweight in the financials, consumer staples, and energy sectors in each of the three PRIMECAP Odyssey Funds.
During the first six months of this fiscal year, sizeable positions in the health care and information technology sectors helped results in each of the three PRIMECAP Odyssey Funds. Health care was the sector with the second highest return in the S&P 500 for the period, trailing only the consumer discretionary sector. Large overweight positions, along with favorable stock selection in health care, contributed to each fund’s results. While information technology was the worst-performing sector in the S&P 500 for the period, relative returns in each of the three PRIMECAP Odyssey Funds benefitted from information technology investments as favorable stock selection more than offset sector underperformance. Notably, each fund benefitted from not owning Apple Inc. (-24.8%), the largest constituent of the S&P 500 Index based on market capitalization. Positive stock selection in the industrials sector also contributed to results in each of the three funds.
A more detailed discussion of the results of each PRIMECAP Odyssey Fund follows.
2
Letter to Shareholders
PRIMECAP Odyssey Funds
continued
PRIMECAP Odyssey Stock Fund
From November 1, 2012 to April 30, 2013, the Stock Fund returned +18.43%, which surpassed the S&P 500’s total return of +14.42%. In addition to positive stock selection in the health care, information technology, and industrials sectors, relative results further benefitted from an underweight position in the energy sector. This was partially offset by poor stock selection in the consumer discretionary sector.
The four largest health care positions in the portfolio contributed significantly to the fund’s relative returns. Roche Holding AG (+34.5%), Novartis AG (+25.8%), Johnson & Johnson (+22.4%), and Amgen Inc. (+21.7%) each outperformed both the S&P 500 Health Care sector and the S&P 500 Index. Pharmaceutical companies have outpaced the broader market recently as investors have increasingly looked beyond current patent expirations and have focused on the industry’s promising pipelines for new drugs. As an example, Roche received FDA approval in February for Kadcyla, its new breast cancer drug. Kadcyla is an antibody-drug conjugate, a type of targeted medicine that can attach to certain cancer cells and deliver chemotherapy directly to them without harming the body’s healthy cells.
The top 10 holdings, which collectively represented 36.7% of the portfolio at the period end, are listed below:
PRIMECAP Odyssey Stock Fund Top 10 Holdings as of 4/30/13 | Ending % of Total Portfolio* | |||
Roche Holding AG | 5.7 | |||
Johnson & Johnson | 4.6 | |||
Amgen Inc. | 4.5 | |||
Charles Schwab Corp. | 3.8 | |||
Eli Lilly & Co. | 3.6 | |||
Texas Instruments Inc. | 3.6 | |||
Microsoft Corp. | 3.2 | |||
L Brands Inc. | 2.7 | |||
Novartis AG | 2.7 | |||
Medtronic Inc. | 2.3 | |||
Total % of Portfolio | 36.7 | % | ||
| * | The percentage is calculated by using the ending market value of the security divided by the total investments of the Fund. |
3
Letter to Shareholders
PRIMECAP Odyssey Funds
continued
PRIMECAP Odyssey Growth Fund
From November 1, 2012 to April 30, 2013, the Growth Fund’s total return was +23.20%, which surpassed both the S&P 500’s total return of +14.42% and the Russell 1000 Growth Index’s total return of +13.71%. In addition to positive stock selection in the health care, information technology, and industrials sectors, relative results were further helped by an underweight position in the energy sector. This was partially offset by the fund’s underweight position in the financials sector.
Several biotechnology-driven firms including Biogen Idec Inc. (+58.4%), Seattle Genetics, Inc. (+46.9%), ImmunoGen, Inc. (+44.6%), Roche Holding AG (+34.5%), and Amgen Inc. (+21.7%) were among the largest contributors to the fund’s relative returns. Biogen Idec received FDA approval in March for Tecfidera, a new oral drug to treat multiple sclerosis. ImmunoGen is a partner in Roche’s newly approved breast cancer drug, Kadcyla, which uses ImmunoGen’s targeted antibody payload technology to target cancer cells.
Among the fund’s information technology holdings, Research in Motion Limited (+105.6%), Cree, Inc. (+86.7%), Electronic Arts Inc. (+42.6%), Adobe Systems Inc. (+32.5%), and Texas Instruments Inc. (+30.8%) were among the biggest contributors. Texas Instruments raised its quarterly dividend 25% in February and is increasing its share buyback authorization program to $8.4B as part of its capital allocation strategy. We continue to believe that many technology companies in the portfolio are undervalued, especially when their strong free cash flows and sizeable and growing cash balances are taken into consideration.
The top 10 holdings, which collectively represented 34.8% of the portfolio at the period end, are listed below:
PRIMECAP Odyssey Growth Fund Top 10 Holdings as of 4/30/13 | Ending % of Total Portfolio* | |||
Seattle Genetics, Inc. | 6.0 | |||
Roche Holding AG | 5.3 | |||
Amgen Inc. | 4.9 | |||
ImmunoGen, Inc. | 3.4 | |||
Biogen Idec Inc. | 3.2 | |||
Conceptus, Inc. | 2.5 | |||
Google Inc. Cl A | 2.5 | |||
Adobe Systems Inc. | 2.5 | |||
Charles Schwab Corp. | 2.4 | |||
Eli Lilly & Co. | 2.1 | |||
Total % of Portfolio | 34.8 | % | ||
| * | The percentage is calculated by using the ending market value of the security divided by the total investments of the Fund. |
4
Letter to Shareholders
PRIMECAP Odyssey Funds
continued
PRIMECAP Odyssey Aggressive Growth Fund
From November 1, 2012 to April 30, 2013, the Aggressive Growth Fund’s total return was +21.42%, which surpassed both the S&P 500’s total return of +14.42% and the Russell Midcap Growth Index’s total return of +17.75%. Similar to the other two PRIMECAP Odyssey Funds, favorable stock selection in the health care, information technology, and industrials sectors were the primary reasons for the Aggressive Growth Fund’s strong relative results. Positive stock selection in the consumer discretionary, energy, and materials sectors, along with an underweight position in the energy sector, further helped results. This was partially offset by an underweight position in the financials sector and poor stock selection in the consumer staples sector.
The fund’s holdings in the health care sector, including BioMarin Pharmaceutical Inc. (+77.2%), Conceptus, Inc. (+64.6%), Seattle Genetics, Inc. (+46.9%), ImmunoGen, Inc. (+44.6%), Roche Holdings AG (+34.5%), and Pharmacyclics, Inc. (+33.5%) were the largest contributors to the fund’s results. Conceptus’ shares rose in late April, when the company announced it had reached an agreement to be acquired by German chemicals and pharmaceuticals company Bayer.
Among the fund’s information technology holdings, Research in Motion Limited (+105.6%), Cree, Inc. (+86.7%), Electronic Arts, Inc. (+42.6%), Adobe Systems Inc. (+32.5%), and Stratasys Ltd. (+24.6%) were among the biggest contributors. Research in Motion’s shares rallied in the wake of a strong response to the launch of its new BlackBerry Z10 phone. In the industrials sector, airline stocks helped the fund’s results as several airlines, including Delta Air Lines, Inc. (+78.0%), United Continental Holdings, Inc. (+68.1%), and Alaska Air Group, Inc. (+61.2%) benefitted from the results of restructuring, better pricing and capacity discipline, and a greater focus on profitability.
5
Letter to Shareholders
PRIMECAP Odyssey Funds
continued
The top 10 holdings, which collectively represented 27.3% of the portfolio at the period end, are listed below:
PRIMECAP Odyssey Aggressive Growth Fund Top 10 Holdings as of 4/30/13 | Ending % of Total Portfolio* | |||
Pharmacyclics, Inc. | 4.2 | |||
Seattle Genetics, Inc. | 4.1 | |||
Roche Holding AG | 4.0 | |||
DreamWorks Animation SKG Inc. Cl A | 3.0 | |||
Google Inc. Cl A | 2.2 | |||
ImmunoGen, Inc. | 2.2 | |||
Conceptus, Inc. | 1.9 | |||
CME Group Inc. Cl A | 1.9 | |||
Abiomed Inc. | 1.9 | |||
Adobe Systems Inc. | 1.9 | |||
Total % of Portfolio | 27.3 | % | ||
| * | The percentage is calculated by using the ending market value of the security divided by the total investments of the Fund. |
Outlook
As we look to the remainder of the fiscal year, we are more cautious in our outlook for U.S. equities than we were a year ago. The S&P 500 has appreciated significantly and is trading at an all-time high, and we believe valuations are stretched in some segments of the market. We have lingering concerns regarding the outlook for economic growth, which could pressure revenue and earnings expansion. Much of the earnings per share growth for S&P 500 companies in recent quarters has been driven by profit margin expansion and reduced shares outstanding as companies have cut costs, refinanced debt at lower interest rates, and accelerated the rate of share repurchase activity. Meanwhile, revenue growth has been minimal or even negative. Furthermore, the ongoing uncertainties surrounding fiscal and tax policies are likely to discourage consumers and companies from making investment decisions. However, equities remain attractively valued relative to bonds and most other asset classes, increasing the likelihood that net investment flows from bonds and money market funds to equities could support equity prices. Mutual fund flow statistics from the Investment Company Institute (ICI) indicate that domestic equity funds experienced over $600B in net outflows from mid-2007 to year-end 2012, while bond funds experienced over $1.1T in net inflows during the same period. If investors develop a higher tolerance for risk as they seek higher returns, this trend could reverse, leading to higher equity prices. There was some evidence of this in first quarter of 2013, when domestic equity funds gained nearly $20B in net inflows, the largest quarterly net inflow since the second quarter of 2009.
6
Letter to Shareholders
PRIMECAP Odyssey Funds
continued
Although we are more cautious in our overall outlook for U.S. equities, we are optimistic about investment opportunities in certain segments of the market, specifically information technology and health care. We maintain the view that many companies in these two sectors may have better growth opportunities than are currently reflected in their stock prices. Computers permeate almost every consumer device, internet traffic growth remains strong, and technology companies continue to develop new products and services that benefit consumers and businesses in ways that were unimaginable only a few years ago. For companies in the health care sector, global demographic trends and ongoing innovation should sustain growth for the foreseeable future. As the proportion of elderly people in the population increases, health care spending should grow since older age groups typically consume three times as much in health care resources as the general population. At the same time, the health care industry’s considerable investments in research and development over the years are driving the development of new and more effective therapies for many diseases, such as cancer, diabetes, and Alzheimer’s. While we are particularly enthusiastic about the funds’ investments in the health care and information technology sectors, we continue to seek investment opportunities in all sectors of the market, focusing on companies that have better growth prospects over a three-to-five year horizon than their current market valuations would suggest.
Sincerely,
PRIMECAP Management Company
May 17, 2013
Past performance is not a guarantee of future results.
Each fund may invest in smaller companies, which involve additional risks such as limited liquidity and greater volatility. Each fund may invest in foreign securities, which involves greater volatilityand political, economic and currency risks and differences in accounting methods. Mutual fund investing involves risk, and loss of principal is possible. Growth stocks typically are more volatile than value stocks; however, value stocks typically have a lower expected growth rate in earnings and sales.
Please refer to the Schedule of Investments for details of fund holdings. Fund holdings and sector allocations are subject to change at any time and are not recommendations to buy or sell any security.
The S&P 500 is a market capitalization-weighted index of 500 large-capitalization stocks commonly used to represent the U.S. equity market. The Russell 1000 Growth Index is an index that measures the performance of those Russell 1000 companies with higher price-to-book ratios and higher forecasted growth values. The Russell Midcap Growth Index measures the performance of those Russell Midcap companies with higher price-to-book ratios and higher forecasted growth values. You cannot invest directly in an index. Free cash flow is the amount of cash a company has after expenses, debt service, capital expenditures, and dividends.
The information provided herein represents the opinions of PRIMECAP Management Company and is not intended to be a forecast of future events, a guarantee of future results, or investment advice.
7
|
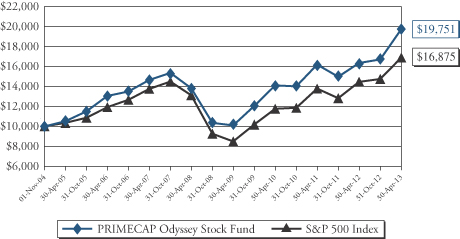
The following chart compares the value of a hypothetical $10,000 investment in the PRIMECAP Odyssey Stock Fund from November 1, 2004 (inception) to April 30, 2013, compared to the S&P 500 Index. This chart illustrates the performance of a hypothetical $10,000 investment made on the fund’s inception date and is not intended to imply any future performance. The returns shown do not reflect the deduction of taxes that a shareholder would pay on fund distributions or the redemption of fund shares. The chart assumes reinvestment of capital gains and dividends.
| Total Return Period Ended April 30, 2013 | ||||||||||||
| 1 Year | Annualized 5 Year | Annualized Since Inception^ | ||||||||||
PRIMECAP Odyssey Stock Fund | 20.88% | 7.43% | 8.34% | |||||||||
S&P 500 Index* | 16.89% | 5.21% | 6.35% | |||||||||
Performance data quoted represents past performance and does not guarantee future results. The investment return and principal value of an investment will fluctuate so that an investor’s shares, when redeemed, may be worth more or less than their original cost. Current performance of the fund may be lower or higher than the performance quoted. Performance data current to the most recent month end may be obtained by calling 1-800-729-2307.
| * | The S&P 500 is a market capitalization-weighted index of 500 large-capitalization stocks commonly used to represent the U.S. equity market. |
| ^ | November 1, 2004 |
8
| Performance Graphs |
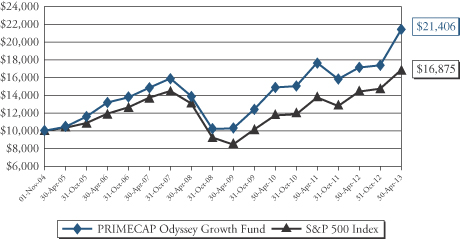
The following chart compares the value of a hypothetical $10,000 investment in the PRIMECAP Odyssey Growth Fund from November 1, 2004 (inception) to April 30, 2013, compared to the S&P 500 Index. This chart illustrates the performance of a hypothetical $10,000 investment made on the fund’s inception date and is not intended to imply any future performance. The returns shown do not reflect the deduction of taxes that a shareholder would pay on fund distributions or the redemption of fund shares. The chart assumes reinvestment of capital gains and dividends.
| Total Return Period Ended April 30, 2013 | ||||||||||||
| 1 Year | Annualized 5 Year | Annualized Since Inception^ | ||||||||||
PRIMECAP Odyssey Growth Fund | 24.98% | 8.99% | 9.37% | |||||||||
S&P 500 Index* | 16.89% | 5.21% | 6.35% | |||||||||
Performance data quoted represents past performance and does not guarantee future results. The investment return and principal value of an investment will fluctuate so that an investor’s shares, when redeemed, may be worth more or less than their original cost. Current performance of the fund may be lower or higher than the performance quoted. Performance data current to the most recent month end may be obtained by calling 1-800-729-2307.
| * | The S&P 500 is a market capitalization-weighted index of 500 large-capitalization stocks commonly used to represent the U.S. equity market. |
| ^ | November 1, 2004 |
9
| Performance Graphs |
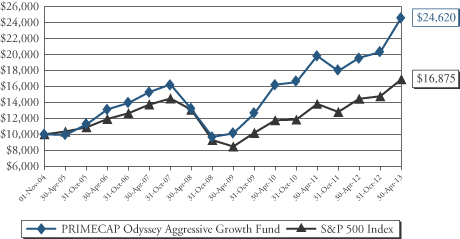
The following chart compares the value of a hypothetical $10,000 investment in the PRIMECAP Odyssey Aggressive Growth Fund from November 1, 2004 (inception) to April 30, 2013, compared to the S&P 500 Index. This chart illustrates the performance of a hypothetical $10,000 investment made on the fund’s inception date and is not intended to imply any future performance. The returns shown do not reflect the deduction of taxes that a shareholder would pay on fund distributions or the redemption of fund shares. The chart assumes reinvestment of capital gains and dividends.
| Total Return Period Ended April 30, 2013 | ||||||||||||
| 1 Year | Annualized 5 Year | Annualized Since Inception^ | ||||||||||
PRIMECAP Odyssey Aggressive Growth Fund | 25.76% | 13.39% | 11.19% | |||||||||
S&P 500 Index* | 16.89% | 5.21% | 6.35% | |||||||||
Performance data quoted represents past performance and does not guarantee future results. The investment return and principal value of an investment will fluctuate so that an investor’s shares, when redeemed, may be worth more or less than their original cost. Current performance of the fund may be lower or higher than the performance quoted. Performance data current to the most recent month end may be obtained by calling 1-800-729-2307.
| * | The S&P 500 is a market capitalization-weighted index of 500 large-capitalization stocks commonly used to represent the U.S. equity market. |
| ^ | November 1, 2004 |
10
| PRIMECAP Odyssey Funds |
PRIMECAP Odyssey Stock Fund
Consumer Discretionary | 9.0% | |||
Consumer Staples | 1.9% | |||
Energy | 5.2% | |||
Financials | 10.2% | |||
Health Care | 30.4% | |||
Industrials | 11.1% | |||
Information Technology | 21.2% | |||
Materials | 4.7% | |||
Utilities | 1.3% | |||
Short-Term Investments, net of Other Liabilities | 5.0% | |||
Total | 100.0% |
PRIMECAP Odyssey Growth Fund
Consumer Discretionary | 7.5% | |||
Energy | 2.5% | |||
Financials | 5.1% | |||
Health Care | 42.1% | |||
Industrials | 6.6% | |||
Information Technology | 26.7% | |||
Materials | 1.3% | |||
Short-Term Investments and Other Assets | 8.2% | |||
Total | 100.0% |
The tables above list sector allocations as a percentage of each fund’s total net assets as of April 30, 2013. The management report may make reference to average allocations during the period. As a result, the sector allocations above may differ from those discussed in the management report.
11
Sector Breakdown
PRIMECAP Odyssey Funds
continued
PRIMECAP Odyssey Aggressive Growth Fund
Consumer Discretionary | 10.0% | |||
Consumer Staples | 1.1% | |||
Energy | 3.2% | |||
Financials | 2.9% | |||
Health Care | 33.1% | |||
Industrials | 10.6% | |||
Information Technology | 29.0% | |||
Materials | 1.2% | |||
Short-Term Investments, net of Other Liabilities | 8.9% | |||
Total | 100.0% |
The table above lists sector allocations as a percentage of the fund’s total net assets as of April 30, 2013. The management report may make reference to average allocations during the period. As a result, the sector allocations above may differ from those discussed in the management report.
12
| April 30, 2013 (Unaudited) |
| Shares | Value | |||||||
| COMMON STOCKS – 95.0% | ||||||||
| Consumer Discretionary – 9.0% | ||||||||
| 170,000 | Ascena Retail Group, Inc. (a) | $ | 3,145,000 | |||||
| 73,200 | Bed Bath & Beyond, Inc. (a) | 5,036,160 | ||||||
| 246,600 | CarMax, Inc. (a) | 11,353,464 | ||||||
| 770,100 | Carnival Corp. | 26,576,151 | ||||||
| 54,900 | DIRECTV (a) | 3,105,144 | ||||||
| 883,864 | L Brands, Inc. | 44,555,584 | ||||||
| 50,000 | Macy’s, Inc. | 2,230,000 | ||||||
| 250,000 | Mattel, Inc. | 11,415,000 | ||||||
| 150,000 | Ross Stores, Inc. | 9,910,500 | ||||||
| 59,900 | Sony Corp. – ADR | 984,157 | ||||||
| 193,400 | TJX Cos., Inc. | 9,432,118 | ||||||
| 225,000 | Walt Disney Co. (The) | 14,139,000 | ||||||
| 29,600 | Whirlpool Corp. | 3,382,688 | ||||||
|
| |||||||
| 145,264,966 | ||||||||
|
| |||||||
| Consumer Staples – 1.9% | ||||||||
| 270,000 | Kellogg Co. | 17,560,800 | ||||||
| 150,000 | PepsiCo, Inc. | 12,370,500 | ||||||
|
| |||||||
| 29,931,300 | ||||||||
|
| |||||||
| Energy – 5.2% | ||||||||
| 333,200 | Cameron International Corp. (a) | 20,508,460 | ||||||
| 515,200 | Encana Corp. | 9,505,440 | ||||||
| 30,000 | EOG Resources, Inc. | 3,634,800 | ||||||
| 65,000 | Exxon Mobil Corp. | 5,784,350 | ||||||
| 30,000 | National Oilwell Varco, Inc. | 1,956,600 | ||||||
| 50,000 | Noble Energy, Inc. | 5,664,500 | ||||||
| 65,000 | Range Resources Corp. | 4,778,800 | ||||||
| 132,634 | Schlumberger Ltd. | 9,871,949 | ||||||
| 55,000 | Southwestern Energy Co. (a) | 2,058,100 | ||||||
| 386,500 | Transocean Ltd. | 19,893,155 | ||||||
|
| |||||||
| 83,656,154 | ||||||||
|
| |||||||
| Financials – 10.2% | ||||||||
| 117,000 | American Express Co. | 8,003,970 | ||||||
| 3,601,400 | Charles Schwab Corp. (The) | 61,079,744 | ||||||
| 140,000 | Chubb Corp. (The) | 12,329,800 | ||||||
| 11,000 | CME Group, Inc. | 669,460 | ||||||
| 190,000 | Comerica, Inc. | 6,887,500 | ||||||
| 884,950 | Marsh & McLennan Cos., Inc. | 33,636,950 | ||||||
| 281,600 | Mercury General Corp. | 12,871,936 | ||||||
The accompanying notes are an integral part of these financial statements.
13
Schedule of Investments
PRIMECAP Odyssey Stock Fund
April 30, 2013 (Unaudited) – continued
| Shares | Value | |||||||
| Financials (continued) | ||||||||
| 165,000 | Wells Fargo & Co. | $ | 6,266,700 | |||||
| 595,600 | Willis Group Holdings PLC | 23,633,408 | ||||||
|
| |||||||
| 165,379,468 | ||||||||
|
| |||||||
| Health Care – 30.4% | ||||||||
| 612,800 | Abbott Laboratories | 22,624,576 | ||||||
| 476,200 | AbbVie, Inc. | 21,929,010 | ||||||
| 75,000 | Affymetrix, Inc. (a) | 273,000 | ||||||
| 697,200 | Amgen, Inc. | 72,655,212 | ||||||
| 121,600 | Biogen Idec, Inc. (a) | 26,621,888 | ||||||
| 117,900 | Boston Scientific Corp. (a) | 883,071 | ||||||
| 1,050,300 | Eli Lilly & Co. | 58,165,614 | ||||||
| 521,735 | GlaxoSmithKline PLC – ADR | 26,942,395 | ||||||
| 884,100 | Johnson & Johnson | 75,351,843 | ||||||
| 810,000 | Medtronic, Inc. | 37,810,800 | ||||||
| 587,250 | Novartis AG – ADR | 43,315,560 | ||||||
| 315,000 | PerkinElmer, Inc. | 9,654,750 | ||||||
| 367,400 | Roche Holding AG – CHF | 91,830,243 | ||||||
| 75,000 | Sanofi – ADR | 4,001,250 | ||||||
|
| |||||||
| 492,059,212 | ||||||||
|
| |||||||
| Industrials – 11.1% | ||||||||
| 47,600 | Alaska Air Group, Inc. (a) | 2,934,064 | ||||||
| 418,900 | Arkansas Best Corp. | 4,402,639 | ||||||
| 63,100 | Babcock & Wilcox Co. (The) | 1,716,320 | ||||||
| 260,000 | Boeing Co. (The) | 23,766,600 | ||||||
| 140,000 | C.H. Robinson Worldwide, Inc. | 8,314,600 | ||||||
| 25,000 | Caterpillar, Inc. | 2,116,750 | ||||||
| 33,000 | CIRCOR International, Inc. | 1,561,890 | ||||||
| 100,000 | CSX Corp. | 2,459,000 | ||||||
| 158,300 | European Aeronautic Defence and Space Co. N.V. – EUR | 8,360,820 | ||||||
| 201,900 | FedEx Corp. | 18,980,619 | ||||||
| 321,900 | Honeywell International, Inc. | 23,672,526 | ||||||
| 141,000 | Norfolk Southern Corp. | 10,916,220 | ||||||
| 239,000 | PACCAR, Inc. | 11,897,420 | ||||||
| 349,100 | Ritchie Bros. Auctioneers, Inc. | 7,041,347 | ||||||
| 45,000 | Rockwell Automation, Inc. | 3,815,100 | ||||||
| 2,089,200 | Southwest Airlines Co. | 28,622,040 | ||||||
| 20,000 | Union Pacific Corp. | 2,959,200 | ||||||
| 181,700 | United Parcel Service, Inc. – Class B | 15,597,128 | ||||||
|
| |||||||
| 179,134,283 | ||||||||
|
| |||||||
The accompanying notes are an integral part of these financial statements.
14
Schedule of Investments
PRIMECAP Odyssey Stock Fund
April 30, 2013 (Unaudited) – continued
| Shares | Value | |||||||
| Information Technology – 21.2% | ||||||||
| 45,650 | Accenture PLC – Class A | $ | 3,717,736 | |||||
| 180,000 | Activision Blizzard, Inc. | 2,691,000 | ||||||
| 447,600 | Adobe Systems, Inc. (a) | 20,177,808 | ||||||
| 93,200 | Altera Corp. | 2,983,332 | ||||||
| 53,000 | Analog Devices, Inc. | 2,331,470 | ||||||
| 1,015,000 | Applied Materials, Inc. | 14,727,650 | ||||||
| 525,000 | Cisco Systems, Inc. | 10,983,000 | ||||||
| 750,000 | Corning, Inc. | 10,875,000 | ||||||
| 300,000 | Diebold, Inc. | 8,787,000 | ||||||
| 416,400 | Electronic Arts, Inc. (a) | 7,332,804 | ||||||
| 81,500 | EMC Corp. (a) | 1,828,045 | ||||||
| 12,000 | Google, Inc. – Class A (a) | 9,894,840 | ||||||
| 135,000 | Hewlett-Packard Co. | 2,781,000 | ||||||
| 350,000 | Intel Corp. | 8,382,500 | ||||||
| 90,300 | Intuit, Inc. | 5,385,492 | ||||||
| 431,000 | KLA-Tencor Corp. | 23,381,750 | ||||||
| 438,000 | L.M. Ericsson Telephone Co. – ADR | 5,391,780 | ||||||
| 4,900 | MasterCard, Inc. – Class A | 2,709,357 | ||||||
| 1,561,700 | Microsoft Corp. | 51,692,270 | ||||||
| 81,400 | NeuStar, Inc. – Class A (a) | 3,571,018 | ||||||
| 125,000 | NVIDIA Corp. | 1,721,250 | ||||||
| 50,700 | Oracle Corp. | 1,661,946 | ||||||
| 305,900 | QUALCOMM, Inc. | 18,849,558 | ||||||
| 743,200 | Symantec Corp. (a) | 18,059,760 | ||||||
| 1,605,300 | Texas Instruments, Inc. | 58,127,913 | ||||||
| 200,000 | Thomson Reuters Corp. | 6,698,000 | ||||||
| 199,000 | Visa, Inc. – Class A | 33,523,540 | ||||||
| 100,000 | Xilinx, Inc. | 3,791,000 | ||||||
| 24,800 | Yahoo!, Inc. (a) | 613,304 | ||||||
|
| |||||||
| 342,671,123 | ||||||||
|
| |||||||
| Materials – 4.7% | ||||||||
| 260,000 | Cabot Corp. | 9,765,600 | ||||||
| 240,000 | Dow Chemical Co. (The) | 8,138,400 | ||||||
| 215,000 | E.I. du Pont de Nemours and Co. | 11,719,650 | ||||||
| 65,000 | Greif, Inc. – Class A | 3,131,050 | ||||||
| 78,381 | Greif, Inc. – Class B | 4,059,352 | ||||||
| 71,900 | Monsanto Co. | 7,680,358 | ||||||
| 210,000 | Newmont Mining Corp. | 6,804,000 | ||||||
| 136,900 | Potash Corp. of Saskatchewan, Inc. | 5,763,490 | ||||||
The accompanying notes are an integral part of these financial statements.
15
Schedule of Investments
PRIMECAP Odyssey Stock Fund
April 30, 2013 (Unaudited) – continued
| Shares | Value | |||||||
| Materials (continued) | ||||||||
| 481,200 | Schweitzer-Mauduit International, Inc. | $ | 19,387,548 | |||||
|
| |||||||
| 76,449,448 | ||||||||
|
| |||||||
| Utilities – 1.3% | ||||||||
| 212,000 | Exelon Corp. | 7,952,120 | ||||||
| 372,379 | Public Service Enterprise Group, Inc. | 13,632,795 | ||||||
|
| |||||||
| 21,584,915 | ||||||||
|
| |||||||
| TOTAL COMMON STOCKS | $ | 1,536,130,869 | |||||
|
| |||||||
| SHORT-TERM INVESTMENTS – 5.3% | ||||||||
| 84,967,775 | Dreyfus Treasury Prime Cash Management Fund | 84,967,775 | ||||||
|
| |||||||
| TOTAL SHORT-TERM INVESTMENTS | 84,967,775 | ||||||
|
| |||||||
| TOTAL INVESTMENTS | 1,621,098,644 | ||||||
| Liabilities in Excess of Other Assets – (0.3)% | (4,563,876 | ) | |||||
|
| |||||||
| TOTAL NET ASSETS – 100.0% | $ | 1,616,534,768 | |||||
|
| |||||||
ADR – American Depository Receipt
CHF – Swiss Francs
EUR – Euros
| (a) | Non-Income Producing |
The Global Industry Classification Standard (GICS®) was developed by and is the exclusive property of MSCI Inc. and Standard & Poor’s Financial Services LLC (“S&P”). GICS is a service mark of MSCI and S&P and has been licensed for use by PRIMECAP Management Company.
The accompanying notes are an integral part of these financial statements.
16
| Schedule of Investments April 30, 2013 (Unaudited) |
| Shares | Value | |||||||
| COMMON STOCKS – 91.8% | ||||||||
| Consumer Discretionary – 7.5% | ||||||||
| 60,100 | Ascena Retail Group, Inc. (a) | $ | 1,111,850 | |||||
| 154,200 | Bed Bath & Beyond, Inc. (a) | 10,608,960 | ||||||
| 847,200 | CarMax, Inc. (a) | 39,005,088 | ||||||
| 737,846 | Carnival Corp. | 25,463,065 | ||||||
| 161,800 | DIRECTV (a) | 9,151,408 | ||||||
| 1,400,000 | DreamWorks Animation SKG, Inc. – Class A (a) | 26,992,000 | ||||||
| 1,071,798 | L Brands, Inc. | 54,029,337 | ||||||
| 416,000 | Mattel, Inc. | 18,994,560 | ||||||
| 100,000 | Royal Caribbean Cruises Ltd. | 3,653,000 | ||||||
| 250,000 | Shutterfly, Inc. (a) | 11,132,500 | ||||||
| 239,400 | Sony Corp. – ADR | 3,933,342 | ||||||
| 126,000 | TJX Cos., Inc. | 6,145,020 | ||||||
|
| |||||||
| 210,220,130 | ||||||||
|
| |||||||
| Energy – 2.5% | ||||||||
| 140,000 | Cenovus Energy, Inc. | 4,191,600 | ||||||
| 130,000 | Encana Corp. | 2,398,500 | ||||||
| 117,000 | EOG Resources, Inc. | 14,175,720 | ||||||
| 64,300 | National Oilwell Varco, Inc. | 4,193,646 | ||||||
| 80,000 | Noble Energy, Inc. | 9,063,200 | ||||||
| 28,100 | Oceaneering International, Inc. | 1,971,777 | ||||||
| 125,000 | Range Resources Corp. | 9,190,000 | ||||||
| 169,800 | Schlumberger Ltd. | 12,638,214 | ||||||
| 156,800 | Southwestern Energy Co. (a) | 5,867,456 | ||||||
| 119,600 | Transocean Ltd. | 6,155,812 | ||||||
|
| |||||||
| 69,845,925 | ||||||||
|
| |||||||
| Financials – 5.1% | ||||||||
| 200,000 | Berkshire Hathaway, Inc. – Class B (a) | 21,264,000 | ||||||
| 4,000,000 | Charles Schwab Corp. (The) | 67,840,000 | ||||||
| 200,000 | Chubb Corp. (The) | 17,614,000 | ||||||
| 25,000 | CME Group, Inc. | 1,521,500 | ||||||
| 947,250 | Marsh & McLennan Cos., Inc. | 36,004,972 | ||||||
|
| |||||||
| 144,244,472 | ||||||||
|
| |||||||
| Health Care – 42.1% | ||||||||
| 524,600 | Abbott Laboratories | 19,368,232 | ||||||
| 1,914,800 | Abiomed, Inc. (a) | 35,366,356 | ||||||
| 3,139,700 | Accuray, Inc. (a) | 13,814,680 | ||||||
| 564,200 | Affymetrix, Inc. (a) | 2,053,688 | ||||||
| 1,316,700 | Amgen, Inc. | 137,213,307 | ||||||
The accompanying notes are an integral part of these financial statements.
17
Schedule of Investments
PRIMECAP Odyssey Growth Fund
April 30, 2013 (Unaudited) – continued
| Shares | Value | |||||||
| Health Care (continued) | ||||||||
| 407,200 | Biogen Idec, Inc. (a) | $ | 89,148,296 | |||||
| 298,200 | BioMarin Pharmaceutical, Inc. (a) | 19,561,920 | ||||||
| 611,500 | Boston Scientific Corp. (a) | 4,580,135 | ||||||
| 870,100 | Cepheid, Inc. (a) | 33,176,913 | ||||||
| 120,427 | Charles River Laboratories International, Inc. (a) | 5,237,370 | ||||||
| 2,293,728 | Conceptus, Inc. (a) (b) | 71,128,505 | ||||||
| 450,000 | Dendreon Corp. (a) | 2,119,500 | ||||||
| 1,059,600 | Eli Lilly & Co. | 58,680,648 | ||||||
| 81,000 | GlaxoSmithKline PLC – ADR | 4,182,840 | ||||||
| 463,400 | Illumina, Inc. (a) | 29,977,346 | ||||||
| 5,855,100 | ImmunoGen, Inc. (a) (b) | 93,798,702 | ||||||
| 519,400 | Insulet Corp. (a) | 13,109,656 | ||||||
| 281,500 | InterMune, Inc. (a) | 2,626,395 | ||||||
| 576,200 | Johnson & Johnson | 49,109,526 | ||||||
| 463,100 | Life Technologies Corp. (a) | 34,125,839 | ||||||
| 890,300 | Medtronic, Inc. | 41,559,204 | ||||||
| 300,000 | Momenta Pharmaceuticals, Inc. (a) | 3,696,000 | ||||||
| 2,676,356 | Nektar Therapeutics (a) | 29,011,699 | ||||||
| 538,750 | Novartis AG – ADR | 39,738,200 | ||||||
| 145,000 | NuVasive, Inc. (a) | 3,040,650 | ||||||
| 433,000 | OraSure Technologies, Inc. (a) | 1,931,180 | ||||||
| 55,000 | PerkinElmer, Inc. | 1,685,750 | ||||||
| 911,314 | QIAGEN N.V. (a) | 18,116,923 | ||||||
| 586,500 | Roche Holding AG – CHF | 146,593,461 | ||||||
| 4,556,400 | Seattle Genetics, Inc. (a) | 168,358,980 | ||||||
| 68,500 | Waters Corp. (a) | 6,329,400 | ||||||
|
| |||||||
| 1,178,441,301 | ||||||||
|
| |||||||
| Industrials – 6.6% | ||||||||
| 498,400 | AECOM Technology Corp. (a) | 14,488,488 | ||||||
| 101,500 | Babcock & Wilcox Co. (The) | 2,760,800 | ||||||
| 421,200 | C.H. Robinson Worldwide, Inc. | 25,015,068 | ||||||
| 133,600 | Caterpillar, Inc. | 11,311,912 | ||||||
| 10,000 | CIRCOR International, Inc. | 473,300 | ||||||
| 145,000 | Delta Air Lines, Inc. (a) | 2,485,300 | ||||||
| 296,000 | European Aeronautic Defence and Space Co. N.V. – EUR | 15,633,624 | ||||||
| 393,700 | Expeditors International Washington, Inc. | 14,145,641 | ||||||
| 40,900 | FedEx Corp. | 3,845,009 | ||||||
| 90,000 | IDEX Corp. | 4,682,700 | ||||||
The accompanying notes are an integral part of these financial statements.
18
Schedule of Investments
PRIMECAP Odyssey Growth Fund
April 30, 2013 (Unaudited) – continued
| Shares | Value | |||||||
| Industrials (continued) | ||||||||
| 100,000 | Jacobs Engineering Group, Inc. (a) | $ | 5,048,000 | |||||
| 1,227,550 | JetBlue Airways Corp. (a) | 8,457,820 | ||||||
| 40,000 | Pall Corp. | 2,668,400 | ||||||
| 489,000 | Ritchie Bros. Auctioneers, Inc. | 9,863,130 | ||||||
| 33,100 | Rockwell Automation, Inc. | 2,806,218 | ||||||
| 2,673,200 | Southwest Airlines Co. | 36,622,840 | ||||||
| 245,000 | United Continental Holdings, Inc. (a) | 7,913,500 | ||||||
| 196,000 | United Parcel Service, Inc. – Class B | 16,824,640 | ||||||
|
| |||||||
| 185,046,390 | ||||||||
|
| |||||||
| Information Technology – 26.7% | ||||||||
| 57,850 | Accenture PLC – Class A | 4,711,304 | ||||||
| 1,530,900 | Adobe Systems, Inc. (a) | 69,012,972 | ||||||
| 774,600 | Altera Corp. | 24,794,946 | ||||||
| 276,700 | Applied Materials, Inc. | 4,014,917 | ||||||
| 64,372 | ASML Holding N.V. | 4,787,346 | ||||||
| 350,000 | Corning, Inc. | 5,075,000 | ||||||
| 671,000 | Cree, Inc. (a) | 37,958,470 | ||||||
| 197,500 | Cymer, Inc. (a) | 20,690,100 | ||||||
| 1,816,200 | Electronic Arts, Inc. (a) | 31,983,282 | ||||||
| 940,100 | EMC Corp. (a) | 21,086,443 | ||||||
| 35,000 | F5 Networks, Inc. (a) | 2,675,050 | ||||||
| 3,025,200 | Flextronics International Ltd. (a) | 21,630,180 | ||||||
| 658,418 | FormFactor, Inc. (a) | 3,259,169 | ||||||
| 84,080 | Google, Inc. – Class A (a) | 69,329,846 | ||||||
| 90,000 | Hewlett-Packard Co. | 1,854,000 | ||||||
| 250,700 | Intel Corp. | 6,004,265 | ||||||
| 105,000 | Intuit, Inc. | 6,262,200 | ||||||
| 345,000 | Jabil Circuit, Inc. | 6,141,000 | ||||||
| 300,000 | KLA-Tencor Corp. | 16,275,000 | ||||||
| 1,247,800 | L.M. Ericsson Telephone Co. – ADR | 15,360,418 | ||||||
| 5,500 | MasterCard, Inc. – Class A | 3,041,115 | ||||||
| 725,000 | Micron Technology, Inc. (a) | 6,829,500 | ||||||
| 1,635,600 | Microsoft Corp. | 54,138,360 | ||||||
| 35,128 | Motorola Solutions, Inc. | 2,009,322 | ||||||
| 364,811 | NetApp, Inc. (a) | 12,728,256 | ||||||
| 195,900 | NeuStar, Inc. – Class A (a) | 8,594,133 | ||||||
| 1,463,700 | Nuance Communications, Inc. (a) | 27,868,848 | ||||||
| 360,000 | NVIDIA Corp. | 4,957,200 | ||||||
| 512,000 | QUALCOMM, Inc. | 31,549,440 | ||||||
The accompanying notes are an integral part of these financial statements.
19
Schedule of Investments
PRIMECAP Odyssey Growth Fund
April 30, 2013 (Unaudited) – continued
| Shares | Value | |||||||
| Information Technology (continued) | ||||||||
| 160,000 | Rambus, Inc. (a) | $ | 1,113,600 | |||||
| 722,450 | Research In Motion Ltd. (a) | 11,768,710 | ||||||
| 431,400 | SanDisk Corp. (a) | 22,622,616 | ||||||
| 571,300 | Stratasys, Ltd. (a) | 47,446,465 | ||||||
| 736,400 | Symantec Corp. (a) | 17,894,520 | ||||||
| 1,187,500 | Texas Instruments, Inc. | 42,999,375 | ||||||
| 670,000 | Trimble Navigation Ltd. (a) | 19,255,800 | ||||||
| 330,000 | Visa, Inc. – Class A | 55,591,800 | ||||||
| 120,000 | Xilinx, Inc. | 4,549,200 | ||||||
|
| |||||||
| 747,864,168 | ||||||||
|
| |||||||
| Materials – 1.3% | ||||||||
| 317,500 | Monsanto Co. | 33,915,350 | ||||||
| 18,000 | Praxair, Inc. | 2,057,400 | ||||||
|
| |||||||
| 35,972,750 | ||||||||
|
| |||||||
| TOTAL COMMON STOCKS | $ | 2,571,635,136 | |||||
|
| |||||||
| SHORT-TERM INVESTMENTS – 7.9% | ||||||||
| 222,161,299 | Dreyfus Treasury Prime Cash Management Fund | 222,161,299 | ||||||
|
| |||||||
| TOTAL SHORT-TERM INVESTMENTS | 222,161,299 | ||||||
|
| |||||||
| TOTAL INVESTMENTS | 2,793,796,435 | ||||||
| Other Assets in Excess of Liabilities – 0.3% | 8,651,833 | ||||||
|
| |||||||
| TOTAL NET ASSETS – 100.0% | $ | 2,802,448,268 | |||||
|
| |||||||
ADR – American Depository Receipt
CHF – Swiss Francs
EUR – Euros
| (a) | Non-Income Producing |
| (b) | Considered an affiliated company of the fund as the fund owns 5% or more of the outstanding voting securities of such company. |
The Global Industry Classification Standard (GICS®) was developed by and is the exclusive property of MSCI Inc. and Standard & Poor’s Financial Services LLC (“S&P”). GICS is a service mark of MSCI and S&P and has been licensed for use by PRIMECAP Management Company.
The accompanying notes are an integral part of these financial statements.
20
| Schedule of Investments PRIMECAP Odyssey Aggressive Growth Fund April 30, 2013 (Unaudited) |
| Shares | Value | |||||||
| COMMON STOCKS – 91.1% | ||||||||
| Consumer Discretionary – 10.0% | ||||||||
| 198,000 | Ascena Retail Group, Inc. (a) | $ | 3,663,000 | |||||
| 303,102 | Callaway Golf Co. | 2,030,783 | ||||||
| 518,400 | CarMax, Inc. (a) | 23,867,136 | ||||||
| 74,700 | DIRECTV (a) | 4,225,032 | ||||||
| 4,096,700 | DreamWorks Animation SKG, Inc. – Class A (a) (b) | 78,984,376 | ||||||
| 3,090,000 | Quiksilver, Inc. (a) | 20,795,700 | ||||||
| 34,300 | Panera Bread Co. – Class A (a) | 6,078,989 | ||||||
| 902,001 | Royal Caribbean Cruises Ltd. | 32,950,097 | ||||||
| 1,097,300 | Shutterfly, Inc. (a) | 48,862,769 | ||||||
| 1,505,000 | Sony Corp. – ADR | 24,727,150 | ||||||
| 327,590 | Tesla Motors, Inc. (a) | 17,686,584 | ||||||
|
| |||||||
| 263,871,616 | ||||||||
|
| |||||||
| Consumer Staples – 1.1% | ||||||||
| 3,313,405 | Boulder Brands, Inc. (a) (b) | 29,853,779 | ||||||
|
| |||||||
| Energy – 3.2% | ||||||||
| 250,200 | Cabot Oil & Gas Corp. | 17,026,110 | ||||||
| 2,000 | Cameron International Corp. (a) | 123,100 | ||||||
| 60,000 | EOG Resources, Inc. | 7,269,600 | ||||||
| 80,500 | National Oilwell Varco, Inc. | 5,250,210 | ||||||
| 117,800 | Range Resources Corp. | 8,660,656 | ||||||
| 1,008,400 | Rex Energy Corp. (a) | 16,204,988 | ||||||
| 374,428 | Solazyme, Inc. (a) | 3,407,295 | ||||||
| 499,000 | Transocean Ltd. | 25,683,530 | ||||||
|
| |||||||
| 83,625,489 | ||||||||
|
| |||||||
| Financials – 2.9% | ||||||||
| 817,300 | CME Group, Inc. | 49,740,878 | ||||||
| 605,820 | MarketAxess Holdings, Inc. | 25,638,302 | ||||||
|
| |||||||
| 75,379,180 | ||||||||
|
| |||||||
| Health Care – 33.1% | ||||||||
| 2,671,073 | Abiomed, Inc. (a) (b) | 49,334,718 | ||||||
| 3,246,600 | Accuray, Inc. (a) | 14,285,040 | ||||||
| 688,200 | Affymetrix, Inc. (a) | 2,505,048 | ||||||
| 205,200 | Biogen Idec, Inc. (a) | 44,924,436 | ||||||
| 592,800 | BioMarin Pharmaceutical, Inc. (a) | 38,887,680 | ||||||
| 672,100 | Boston Scientific Corp. (a) | 5,034,029 | ||||||
| 1,976,600 | Cardica, Inc. (a) | 2,569,580 | ||||||
| 957,600 | Cepheid, Inc. (a) | 36,513,288 | ||||||
| 435,100 | Charles River Laboratories International, Inc. (a) | 18,922,499 | ||||||
The accompanying notes are an integral part of these financial statements.
21
Schedule of Investments
PRIMECAP Odyssey Aggressive Growth Fund
April 30, 2013 (Unaudited) – continued
| Shares | Value | |||||||
| Health Care (continued) | ||||||||
| 1,669,750 | Conceptus, Inc. (a) (b) | $ | 51,778,948 | |||||
| 692,000 | Dendreon Corp. (a) | 3,259,320 | ||||||
| 5,866,100 | Dyax Corp. (a) (b) | 16,131,775 | ||||||
| 2,390,000 | Fluidigm Corp. (a) (b) | 40,247,600 | ||||||
| 112,000 | Illumina, Inc. (a) | 7,245,280 | ||||||
| 3,627,417 | ImmunoGen, Inc. (a) | 58,111,220 | ||||||
| 1,014,356 | Insulet Corp. (a) | 25,602,345 | ||||||
| 3,709,700 | InterMune, Inc. (a) | 34,611,501 | ||||||
| 327,200 | KaloBios Pharmaceuticals, Inc. (a) | 1,963,200 | ||||||
| 929,838 | Luminex Corp. (a) | 15,463,206 | ||||||
| 707,500 | Momenta Pharmaceuticals, Inc. (a) | 8,716,400 | ||||||
| 3,484,800 | Nektar Therapeutics (a) | 37,775,232 | ||||||
| 405,000 | NuVasive, Inc. (a) | 8,492,850 | ||||||
| 1,607,600 | OraSure Technologies, Inc. (a) | 7,169,896 | ||||||
| 1,374,739 | Pharmacyclics, Inc. (a) | 112,041,229 | ||||||
| 737,114 | QIAGEN N.V. (a) | 14,653,826 | ||||||
| 426,300 | Roche Holding AG – CHF | 106,552,076 | ||||||
| 2,926,099 | Seattle Genetics, Inc. (a) | 108,119,358 | ||||||
| 74,000 | XenoPort, Inc. (a) | 459,540 | ||||||
|
| |||||||
| 871,371,120 | ||||||||
|
| |||||||
| Industrials – 10.6% | ||||||||
| 390,000 | Alaska Air Group, Inc. (a) | 24,039,600 | ||||||
| 497,400 | Arkansas Best Corp. | 5,227,674 | ||||||
| 155,500 | C.H. Robinson Worldwide, Inc. | 9,235,145 | ||||||
| 294,500 | CIRCOR International, Inc. | 13,938,685 | ||||||
| 43,800 | Colfax Corp. (a) | 2,044,146 | ||||||
| 2,432,200 | Delta Air Lines, Inc. (a) | 41,687,908 | ||||||
| 16,000 | Expeditors International of Washington, Inc. | 574,880 | ||||||
| 278,900 | Hertz Global Holdings, Inc. (a) | 6,715,912 | ||||||
| 417,500 | Jacobs Engineering Group, Inc. (a) | 21,075,400 | ||||||
| 5,395,725 | JetBlue Airways Corp. (a) | 37,176,545 | ||||||
| 82,600 | Pall Corp. | 5,510,246 | ||||||
| 768,100 | Polypore International, Inc. (a) | 32,206,433 | ||||||
| 326,600 | Ritchie Bros. Auctioneers, Inc. | 6,587,522 | ||||||
| 56,000 | RPX Corp. (a) | 750,960 | ||||||
| 907,000 | Southwest Airlines Co. | 12,425,900 | ||||||
| 212,000 | Spirit Airlines, Inc. (a) | 5,660,400 | ||||||
| 1,346,000 | United Continental Holdings, Inc. (a) | 43,475,800 | ||||||
| 635,000 | US Airways Group, Inc. (a) | 10,731,500 | ||||||
The accompanying notes are an integral part of these financial statements.
22
Schedule of Investments
PRIMECAP Odyssey Aggressive Growth Fund
April 30, 2013 (Unaudited) – continued
| Shares | Value | |||||||
| Industrials (continued) | ||||||||
| 325,000 | Vitran Corp, Inc. (a) | $ | 1,566,500 | |||||
|
| |||||||
| 280,631,156 | ||||||||
|
| |||||||
| Information Technology – 29.0% | ||||||||
| 37,500 | 3D Systems Corp. (a) | 1,434,000 | ||||||
| 5,055,587 | Active Network, Inc. (a) (b) | 25,429,603 | ||||||
| 1,092,000 | Adobe Systems, Inc. (a) | 49,227,360 | ||||||
| 80,000 | Akamai Technologies, Inc. (a) | 3,512,800 | ||||||
| 462,600 | Altera Corp. | 14,807,826 | ||||||
| 20,000 | Applied Materials, Inc. | 290,200 | ||||||
| 147,374 | ASML Holding N.V. | 10,960,205 | ||||||
| 181,877 | Audience, Inc. (a) | 2,689,961 | ||||||
| 2,753,260 | comScore, Inc. (a) (b) | 44,520,214 | ||||||
| 507,200 | Cree, Inc. (a) | 28,692,304 | ||||||
| 225,000 | Cymer, Inc. (a) | 23,571,000 | ||||||
| 1,214,000 | Electronic Arts, Inc. (a) | 21,378,540 | ||||||
| 2,000 | Ellie Mae, Inc. (a) | 52,040 | ||||||
| 1,150,000 | EMC Corp. (a) | 25,794,500 | ||||||
| 980,400 | ExactTarget, Inc. (a) | 19,196,232 | ||||||
| 673,783 | FARO Technologies, Inc. (a) | 26,136,043 | ||||||
| 348,000 | FEI Co. | 22,230,240 | ||||||
| 4,542,800 | Flextronics International Ltd. (a) | 32,481,020 | ||||||
| 716,300 | FormFactor, Inc. (a) | 3,545,685 | ||||||
| 72,090 | Google, Inc. – Class A (a) | 59,443,251 | ||||||
| 1,552,100 | Guidance Software, Inc. (a) (b) | 16,328,092 | ||||||
| 275,000 | Intuit, Inc. | 16,401,000 | ||||||
| 84,000 | iSoftStone Holdings Ltd. – ADR (a) | 363,720 | ||||||
| 500,000 | Jabil Circuit, Inc. | 8,900,000 | ||||||
| 682,400 | KLA-Tencor Corp. | 37,020,200 | ||||||
| 3,500,000 | Micron Technology, Inc. (a) | 32,970,000 | ||||||
| 420,000 | Monster Worldwide, Inc. (a) | 1,839,600 | ||||||
| 880,300 | NetApp, Inc. (a) | 30,713,667 | ||||||
| 150,798 | NeuStar, Inc. – Class A (a) | 6,615,508 | ||||||
| 964,600 | Nuance Communications, Inc. (a) | 18,365,984 | ||||||
| 225,000 | NVIDIA Corp. | 3,098,250 | ||||||
| 80,866 | Pactera Technology International Ltd. – ADR (a) | 411,608 | ||||||
| 1,430,000 | Peregrine Semiconductor Corp. (a) | 13,813,800 | ||||||
| 76,500 | QUALCOMM, Inc. | 4,713,930 | ||||||
| 140,000 | Rambus, Inc. (a) | 974,400 | ||||||
| 1,362,000 | Research In Motion Ltd. (a) | 22,186,980 | ||||||
The accompanying notes are an integral part of these financial statements.
23
Schedule of Investments
PRIMECAP Odyssey Aggressive Growth Fund
April 30, 2013 (Unaudited) – continued
| Shares | Value | |||||||
| Information Technology (continued) | ||||||||
| 703,800 | SanDisk Corp. (a) | $ | 36,907,272 | |||||
| 200,000 | SMART Technologies, Inc. – Class A (a) | 288,000 | ||||||
| 543,700 | Stratasys Ltd. (a) | 45,154,285 | ||||||
| 329,900 | Symantec Corp. (a) | 8,016,570 | ||||||
| 674,200 | Trimble Navigation Ltd. (a) | 19,376,508 | ||||||
| 1,000 | VMware, Inc. – Class A (a) | 70,500 | ||||||
| 1,198,874 | Websense, Inc. (a) | 21,387,912 | ||||||
| 60,000 | Yahoo!, Inc. (a) | 1,483,800 | ||||||
|
| |||||||
| 762,794,610 | ||||||||
|
| |||||||
| Materials – 1.2% | ||||||||
| 4,400 | Boise Cascade Co. (a) | 140,932 | ||||||
| 272,300 | Monsanto Co. | 29,087,086 | ||||||
| 94,100 | Potash Corp. of Saskatchewan, Inc. | 3,961,610 | ||||||
|
| |||||||
| 33,189,628 | ||||||||
|
| |||||||
| TOTAL COMMON STOCKS | $ | 2,400,716,578 | |||||
|
| |||||||
| SHORT-TERM INVESTMENTS – 9.4% | ||||||||
| 246,329,233 | Dreyfus Treasury Prime Cash Management Fund | 246,329,233 | ||||||
|
| |||||||
| TOTAL SHORT-TERM INVESTMENTS | 246,329,233 | ||||||
|
| |||||||
| TOTAL INVESTMENTS | 2,647,045,811 | ||||||
| Liabilities in Excess of Other Assets – (0.5)% | (13,232,774 | ) | |||||
|
| |||||||
| TOTAL NET ASSETS – 100.0% | $ | 2,633,813,037 | |||||
|
| |||||||
ADR – American Depository Receipt
CHF – Swiss Francs
| (a) | Non-Income Producing |
| (b) | Considered an affiliated company of the fund as the fund owns 5% or more of the outstanding voting securities of such company. |
The Global Industry Classification Standard (GICS®) was developed by and is the exclusive property of MSCI Inc. and Standard & Poor’s Financial Services LLC (“S&P”). GICS is a service mark of MSCI and S&P and has been licensed for use by PRIMECAP Management Company.
The accompanying notes are an integral part of these financial statements.
24
| Statements of Assets and Liabilities PRIMECAP Odyssey Funds April 30, 2013 (Unaudited) |
| PRIMECAP Odyssey Stock Fund | PRIMECAP Odyssey Growth Fund | PRIMECAP Odyssey Aggressive Growth Fund | ||||||||||
ASSETS | ||||||||||||
Investments, at cost | $ | 1,195,496,275 | $ | 1,962,864,634 | $ | 2,003,168,266 | ||||||
|
|
|
|
|
| |||||||
Investments, at value (unaffiliated) | $ | 1,621,098,644 | $ | 2,628,869,228 | $ | 2,294,436,706 | ||||||
Investments, at value (affiliated) | — | 164,927,207 | 352,609,105 | |||||||||
Cash | — | — | 324,988 | |||||||||
Receivable for investments sold | 199,503 | 189,577 | — | |||||||||
Receivable for dividends and interest | 2,177,981 | 2,507,589 | 1,264,795 | |||||||||
Receivable for fund shares sold | 4,805,489 | 14,322,748 | 12,993,728 | |||||||||
Prepaid expenses and other assets | 25,158 | 34,582 | 49,311 | |||||||||
|
|
|
|
|
| |||||||
Total assets | 1,628,306,775 | 2,810,850,931 | 2,661,678,633 | |||||||||
|
|
|
|
|
| |||||||
| LIABILITIES | ||||||||||||
Payable for investments purchased | 6,781,182 | 3,289,331 | 22,201,198 | |||||||||
Payable for fund shares repurchased | 2,649,756 | 1,160,819 | 2,072,667 | |||||||||
Payable to the advisor (Note 6) | 2,080,182 | 3,468,434 | 3,157,936 | |||||||||
Other accrued expenses & liabilities | 260,887 | 484,079 | 433,795 | |||||||||
|
|
|
|
|
| |||||||
Total liabilities | 11,772,007 | 8,402,663 | 27,865,596 | |||||||||
|
|
|
|
|
| |||||||
| NET ASSETS | $ | 1,616,534,768 | $ | 2,802,448,268 | $ | 2,633,813,037 | ||||||
|
|
|
|
|
| |||||||
Number of shares issued and outstanding (unlimited shares authorized, $0.01 par value) | 88,020,895 | 135,988,400 | 115,009,185 | |||||||||
|
|
|
|
|
| |||||||
NET ASSET VALUE, OFFERING AND REDEMPTION PRICE PER SHARE | $ | 18.37 | $ | 20.61 | $ | 22.90 | ||||||
|
|
|
|
|
| |||||||
| COMPONENTS OF NET ASSETS | ||||||||||||
Paid-in capital | $ | 1,181,675,688 | $ | 1,930,125,696 | $ | 1,955,848,349 | ||||||
Undistributed net investment income/(Accumulated net losses) | 8,956,153 | 6,129,125 | (1,986,374 | ) | ||||||||
Accumulated net realized gain | 285,222 | 35,255,333 | 36,068,003 | |||||||||
Net unrealized appreciation | 425,617,705 | 830,938,114 | 643,883,059 | |||||||||
|
|
|
|
|
| |||||||
Net assets | $ | 1,616,534,768 | $ | 2,802,448,268 | $ | 2,633,813,037 | ||||||
|
|
|
|
|
| |||||||
The accompanying notes are an integral part of these financial statements.
25
| PRIMECAP Odyssey Funds For the Six Months Ended April 30, 2013 (Unaudited) |
| PRIMECAP Odyssey Stock Fund | PRIMECAP Odyssey Growth Fund | PRIMECAP Odyssey Aggressive Growth Fund | ||||||||||
INVESTMENT INCOME | ||||||||||||
Income | ||||||||||||
Dividends1 | $ | 21,986,087 | $ | 18,959,435 | $ | 5,372,686 | ||||||
Interest income | 18 | 22 | 37 | |||||||||
|
|
|
|
|
| |||||||
Total income | 21,986,105 | 18,959,457 | 5,372,723 | |||||||||
|
|
|
|
|
| |||||||
Expenses | ||||||||||||
Advisory fees | 4,243,222 | 6,606,253 | 5,520,030 | |||||||||
Shareholder servicing | 289,567 | 676,899 | 471,582 | |||||||||
Custody | 55,234 | 79,420 | 69,889 | |||||||||
Trustee fees | 23,310 | 23,309 | 23,309 | |||||||||
Other | 311,259 | 470,839 | 467,204 | |||||||||
|
|
|
|
|
| |||||||
Total expenses | 4,922,592 | 7,856,720 | 6,552,014 | |||||||||
|
|
|
|
|
| |||||||
Net investment income (loss) | 17,063,513 | 11,102,737 | (1,179,291 | ) | ||||||||
|
|
|
|
|
| |||||||
| REALIZED AND UNREALIZED GAIN (LOSS) ON INVESTMENTS AND FOREIGN CURRENCY | ||||||||||||
Net realized gain (loss) on: | ||||||||||||
Investments | 18,095,422 | 42,274,636 | 36,294,332 | |||||||||
Foreign currency transactions | (8,844 | ) | 10,855 | (5,032 | ) | |||||||
Change in net unrealized appreciation/ depreciation on: | ||||||||||||
Investments | 227,417,082 | 454,987,220 | 359,575,235 | |||||||||
Foreign currency translations | 7,057 | (18,600 | ) | (910 | ) | |||||||
|
|
|
|
|
| |||||||
Net realized and unrealized gain on investments and foreign currency | 245,510,717 | 497,254,111 | 395,863,625 | |||||||||
|
|
|
|
|
| |||||||
| NET INCREASE IN NET ASSETS RESULTING FROM OPERATIONS | $ | 262,574,230 | $ | 508,356,848 | $ | 394,684,334 | ||||||
|
|
|
|
|
| |||||||
| 1 | Net of foreign taxes withheld of $737,213, $1,019,046, and $519,240, respectively. |
The accompanying notes are an integral part of these financial statements.
26
|
| Six Months Ended April 30, 20131 | Year Ended October 31, 2012 | |||||||
INCREASE (DECREASE) IN NET ASSETS FROM: | ||||||||
| OPERATIONS | ||||||||
Net investment income | $ | 17,063,513 | $ | 19,747,652 | ||||
Net realized gain (loss) on: | ||||||||
Investments | 18,095,422 | 6,127,327 | ||||||
Foreign currency transactions | (8,844 | ) | (11,753 | ) | ||||
Change in net unrealized appreciation/depreciation on: | ||||||||
Investments | 227,417,082 | 107,056,223 | ||||||
Foreign currency translations | 7,057 | (35,876 | ) | |||||
|
|
|
| |||||
Net increase in net assets resulting from operations | 262,574,230 | 132,883,573 | ||||||
|
|
|
| |||||
| DISTRIBUTIONS TO SHAREHOLDERS FROM NET INVESTMENT INCOME | (24,438,073 | ) | (12,241,758 | ) | ||||
|
|
|
| |||||
| CAPITAL SHARE TRANSACTIONS | ||||||||
Proceeds from shares sold | 311,542,187 | 673,497,259 | ||||||
Proceeds from reinvestment of distributions | 15,171,281 | 9,899,513 | ||||||
Cost of shares repurchased | (470,516,203 | ) | (186,121,894 | ) | ||||
Redemption fee proceeds | — | 33,331 | ||||||
|
|
|
| |||||
Net increase (decrease) from capital share transactions | (143,802,735 | ) | 497,308,209 | |||||
|
|
|
| |||||
Total increase in net assets | 94,333,422 | 617,950,024 | ||||||
|
|
|
| |||||
| NET ASSETS | ||||||||
Beginning of period | 1,522,201,346 | 904,251,322 | ||||||
|
|
|
| |||||
End of period (includes undistributed net investment income of $8,956,153 and $16,330,713, respectively) | $ | 1,616,534,768 | $ | 1,522,201,346 | ||||
|
|
|
| |||||
| CHANGE IN CAPITAL SHARES | ||||||||
Shares outstanding, beginning of period | 96,638,419 | 63,147,115 | ||||||
|
|
|
| |||||
Shares sold | 18,613,747 | 45,089,741 | ||||||
Shares issued on reinvestment of distributions | 946,431 | 711,172 | ||||||
Shares repurchased | (28,177,702 | ) | (12,309,609 | ) | ||||
|
|
|
| |||||
Net increase (decrease) in capital shares | (8,617,524 | ) | 33,491,304 | |||||
|
|
|
| |||||
Shares outstanding, end of period | 88,020,895 | 96,638,419 | ||||||
|
|
|
| |||||
| 1 | Unaudited |
The accompanying notes are an integral part of these financial statements.
27
| Statement of Changes in Net Assets |
| Six Months Ended April 30, 20131 | Year Ended October 31, 2012 | |||||||
INCREASE (DECREASE) IN NET ASSETS FROM: | ||||||||
| OPERATIONS | ||||||||
Net investment income | $ | 11,102,737 | $ | 11,333,452 | ||||
Net realized gain (loss) on: | ||||||||
Investments | 42,274,636 | (2,307,323 | ) | |||||
Foreign currency transactions | 10,855 | (23,518 | ) | |||||
Change in net unrealized appreciation/depreciation on: | ||||||||
Investments | 454,987,220 | 182,472,562 | ||||||
Foreign currency translations | (18,600 | ) | (67,492 | ) | ||||
|
|
|
| |||||
Net increase in net assets resulting from operations | 508,356,848 | 191,407,681 | ||||||
|
|
|
| |||||
| DISTRIBUTIONS TO SHAREHOLDERS FROM: | ||||||||
Net investment income | (13,581,594 | ) | (6,864,980 | ) | ||||
Net realized gain on investments | — | (7,111,047 | ) | |||||
|
|
|
| |||||
Net decrease in net assets resulting from distributions paid | (13,581,594 | ) | (13,976,027 | ) | ||||
|
|
|
| |||||
| CAPITAL SHARE TRANSACTIONS | ||||||||
Proceeds from shares sold | 400,699,001 | 711,441,078 | ||||||
Proceeds from reinvestment of distributions | 13,044,088 | 13,378,508 | ||||||
Cost of shares repurchase | (307,966,937 | ) | (522,292,867 | ) | ||||
Redemption fee proceeds | — | 65,242 | ||||||
|
|
|
| |||||
Net increase from capital share transactions | 105,776,152 | 202,591,961 | ||||||
|
|
|
| |||||
Total increase in net assets | 600,551,406 | 380,023,615 | ||||||
|
|
|
| |||||
| NET ASSETS | ||||||||
Beginning of period | 2,201,896,862 | 1,821,873,247 | ||||||
|
|
|
| |||||
End of period (includes undistributed net investment income of $6,129,125 and $8,607,982, respectively) | $ | 2,802,448,268 | $ | 2,201,896,862 | ||||
|
|
|
| |||||
| CHANGE IN CAPITAL SHARES | ||||||||
Shares outstanding, beginning of period | 130,856,379 | 117,989,471 | ||||||
|
|
|
| |||||
Shares sold | 21,360,327 | 44,162,964 | ||||||
Shares issued on reinvestment of distributions | 750,092 | 905,731 | ||||||
Shares repurchased | (16,978,398 | ) | (32,201,787 | ) | ||||
|
|
|
| |||||
Net increase in capital shares | 5,132,021 | 12,866,908 | ||||||
|
|
|
| |||||
Shares outstanding, end of period | 135,988,400 | 130,856,379 | ||||||
|
|
|
| |||||
| 1 | Unaudited |
The accompanying notes are an integral part of these financial statements.
28
| Statement of Changes in Net Assets |
| Six Months Ended April 30, 20131 | Year Ended October 31, 2012 | |||||||
INCREASE (DECREASE) IN NET ASSETS FROM: | ||||||||
| OPERATIONS | ||||||||
Net investment loss | $ | (1,179,291 | ) | $ | (4,139,593 | ) | ||
Net realized gain (loss) on: | ||||||||
Investments | 36,294,332 | 3,170,833 | ||||||
Foreign currency transactions | (5,032 | ) | (14,797 | ) | ||||
Change in net unrealized appreciation/depreciation on: | ||||||||
Investments | 359,575,235 | 152,996,462 | ||||||
Foreign currency translations | (910 | ) | (41,027 | ) | ||||
|
|
|
| |||||
Net increase in net assets resulting from operations | 394,684,334 | 151,971,878 | ||||||
|
|
|
| |||||
| DISTRIBUTIONS TO SHAREHOLDERS FROM REALIZED GAIN ON INVESTMENTS | — | (21,243,259 | ) | |||||
|
|
|
| |||||
| CAPITAL SHARE TRANSACTIONS | ||||||||
Proceeds from shares sold | 908,987,637 | 535,108,903 | ||||||
Proceeds from reinvestment of distributions | — | 20,208,334 | ||||||
Cost of shares repurchased | (211,310,402 | ) | (279,205,992 | ) | ||||
Redemption fee proceeds | — | 76,299 | ||||||
|
|
|
| |||||
Net increase from capital share transactions | 697,677,235 | 276,187,544 | ||||||
|
|
|
| |||||
Total increase in net assets | 1,092,361,569 | 406,916,163 | ||||||
|
|
|
| |||||
| NET ASSETS | ||||||||
Beginning of period | 1,541,451,468 | 1,134,535,305 | ||||||
|
|
|
| |||||
End of period (includes accumulated net losses of $1,986,375 and $807,083, respectively) | $ | 2,633,813,037 | $ | 1,541,451,468 | ||||
|
|
|
| |||||
| CHANGE IN CAPITAL SHARES | ||||||||
Shares outstanding, beginning of period | 81,752,723 | 66,762,268 | ||||||
|
|
|
| |||||
Shares sold | 43,521,063 | 29,438,901 | ||||||
Shares issued on reinvestment of distributions | — | 1,276,585 | ||||||
Shares repurchased | (10,264,601 | ) | (15,725,031 | ) | ||||
|
|
|
| |||||
Net increase in capital shares | 33,256,462 | 14,990,455 | ||||||
|
|
|
| |||||
Shares outstanding, end of period | 115,009,185 | 81,752,723 | ||||||
|
|
|
| |||||
| 1 | Unaudited |
The accompanying notes are an integral part of these financial statements.
29
| For a capital share outstanding throughout each period. |
| Six Months Ended Apr. 30, 20131 | Year Ended Oct. 31, 2012 | Year Ended Oct. 31, 2011 | Year Ended Oct. 31, 2010 | Year Ended Oct. 31, 2009 | Year Ended Oct. 31, 2008 | |||||||||||||||||||
Net asset value, beginning of the period | $ | 15.75 | $ | 14.32 | $ | 13.48 | $ | 11.69 | $ | 10.10 | $ | 15.22 | ||||||||||||
|
|
|
|
|
|
|
|
|
|
|
| |||||||||||||
Income from investment operations: | ||||||||||||||||||||||||
Net investment income | 0.18 | 0.21 | 0.16 | 0.09 | 4 | 0.10 | 0.06 | |||||||||||||||||
Net realized and unrealized gain (loss) on investments and foreign currency | 2.69 | 1.40 | 0.79 | 1.79 | 1.55 | (4.99 | ) | |||||||||||||||||
|
|
|
|
|
|
|
|
|
|
|
| |||||||||||||
Total from investment operations | 2.87 | 1.61 | 0.95 | 1.88 | 1.65 | (4.93 | ) | |||||||||||||||||
|
|
|
|
|
|
|
|
|
|
|
| |||||||||||||
Less: | ||||||||||||||||||||||||
Dividends from net investment income | (0.25 | ) | (0.18 | ) | (0.11 | ) | (0.09 | ) | (0.06 | ) | (0.07 | ) | ||||||||||||
Distributions from net realized gain | — | — | — | — | — | (0.12 | ) | |||||||||||||||||
|
|
|
|
|
|
|
|
|
|
|
| |||||||||||||
Total distributions | (0.25 | ) | (0.18 | ) | (0.11 | ) | (0.09 | ) | (0.06 | ) | (0.19 | ) | ||||||||||||
|
|
|
|
|
|
|
|
|
|
|
| |||||||||||||
Net asset value, end of period | $ | 18.37 | $ | 15.75 | $ | 14.32 | $ | 13.48 | $ | 11.69 | $ | 10.10 | ||||||||||||
|
|
|
|
|
|
|
|
|
|
|
| |||||||||||||
Total return | 18.43 | %3 | 11.39 | % | 7.05 | % | 16.14 | % | 16.55 | % | (32.73 | %) | ||||||||||||
Ratios/supplemental data: | ||||||||||||||||||||||||
Net assets, end of period (millions) | $ | 1,616.5 | $ | 1,522.2 | $ | 904.3 | $ | 607.1 | $ | 179.7 | $ | 187.0 | ||||||||||||
Ratio of expenses to average net assets | 0.64 | %2 | 0.66 | % | 0.66 | % | 0.71 | % | 0.80 | % | 0.79 | % | ||||||||||||
Ratio of net investment income to | 2.22 | %2 | 1.57 | % | 1.25 | % | 1.37 | %4 | 0.96 | % | 0.51 | % | ||||||||||||
Portfolio turnover rate | 7 | %3 | 11 | % | 24 | % | 3 | % | 34 | % | 10 | % | ||||||||||||
| 1 | Unaudited |
| 2 | Annualized |
| 3 | Not annualized |
| 4 | Investment income per share reflects a special dividend of $0.05. Excluding the special dividend, the ratio of net investment income to average net assets would have been 0.74%. |
The accompanying notes are an integral part of these financial statements.
30
| Financial Highlights For a capital share outstanding throughout each period. |
| Six Months Ended Apr. 30 20131 | Year Ended Oct. 31, 2012 | Year Ended Oct. 31, 2011 | Year Ended Oct. 31, 2010 | Year Ended Oct. 31, 2009 | Year Ended Oct. 31, 2008 | |||||||||||||||||||
Net asset value, beginning of the period | $ | 16.83 | $ | 15.44 | $ | 14.70 | $ | 12.18 | $ | 10.07 | $ | 15.71 | ||||||||||||
|
|
|
|
|
|
|
|
|
|
|
| |||||||||||||
Income from investment operations: | ||||||||||||||||||||||||
Net investment income | 0.08 | 0.09 | 0.04 | 0.02 | 0.03 | 0.03 | ||||||||||||||||||
Net realized and unrealized gain (loss) | 3.80 | 1.42 | 0.71 | 2.53 | 2.11 | (5.59 | ) | |||||||||||||||||
|
|
|
|
|
|
|
|
|
|
|
| |||||||||||||
Total from investment operations | 3.88 | 1.51 | 0.75 | 2.55 | 2.14 | (5.56 | ) | |||||||||||||||||
|
|
|
|
|
|
|
|
|
|
|
| |||||||||||||
Less: | ||||||||||||||||||||||||
Dividend from investment income | (0.10 | ) | (0.06 | ) | (0.01 | ) | (0.03 | ) | (0.03 | ) | (0.04 | ) | ||||||||||||
Distributions from net realized gain | — | (0.06 | ) | — | — | — | (0.04 | ) | ||||||||||||||||
|
|
|
|
|
|
|
|
|
|
|
| |||||||||||||
Total distributions | (0.10 | ) | (0.12 | ) | (0.01 | ) | (0.03 | ) | (0.03 | ) | (0.08 | ) | ||||||||||||
|
|
|
|
|
|
|
|
|
|
|
| |||||||||||||
Net asset value, end of period | $ | 20.61 | $ | 16.83 | $ | 15.44 | $ | 14.70 | $ | 12.18 | $ | 10.07 | ||||||||||||
|
|
|
|
|
|
|
|
|
|
|
| |||||||||||||
Total return | 23.20 | %3 | 9.86 | % | 5.13 | % | 20.96 | % | 21.39 | % | (35.55 | %) | ||||||||||||
Ratios/supplemental data: | ||||||||||||||||||||||||
Net assets, end of period (millions) | $ | 2,802.4 | $ | 2,201.9 | $ | 1,821.9 | $ | 1,451.2 | $ | 706.5 | $ | 412.4 | ||||||||||||
Ratio of expenses to average net assets | 0.66 | %2 | 0.67 | % | 0.66 | % | 0.68 | % | 0.71 | % | 0.71 | % | ||||||||||||
Ratio of net investment income to | 0.93 | %2 | 0.55 | % | 0.26 | % | 0.15 | % | 0.35 | % | 0.26 | % | ||||||||||||
Portfolio turnover rate | 5 | %3 | 12 | % | 13 | % | 5 | % | 12 | % | 13 | % | ||||||||||||
| 1 | Unaudited |
| 2 | Annualized |
| 3 | Not annualized |
The accompanying notes are an integral part of these financial statements.
31
| Financial Highlights PRIMECAP Odyssey Aggressive Growth Fund For a capital share outstanding throughout each period. |
| Six Months Ended Apr. 30 20131 | Year Ended Oct. 31, 2012 | Year Ended Oct. 31, 2011 | Year Ended Oct. 31, 2010 | Year Ended Oct. 31, 2009 | Year Ended Oct. 31, 2008 | |||||||||||||||||||
Net asset value, beginning of the period | $ | 18.86 | $ | 16.99 | $ | 16.17 | $ | 12.33 | $ | 9.46 | $ | 16.03 | ||||||||||||
|
|
|
|
|
|
|
|
|
|
|
| |||||||||||||
Income from investment operations: | ||||||||||||||||||||||||
Net investment loss | (0.01 | ) | (0.05 | ) | (0.05 | ) | (0.05 | ) | (0.05 | ) | (0.06 | ) | ||||||||||||
Net realized and unrealized gain (loss) | 4.05 | 2.24 | 1.40 | 3.89 | 2.92 | (6.42 | ) | |||||||||||||||||
|
|
|
|
|
|
|
|
|
|
|
| |||||||||||||
Total from investment operations | 4.04 | 2.19 | 1.35 | 3.84 | 2.87 | (6.48 | ) | |||||||||||||||||
|
|
|
|
|
|
|
|
|
|
|
| |||||||||||||
Less: | ||||||||||||||||||||||||
Distributions from net realized gain | — | (0.32 | ) | (0.53 | ) | — | — | (0.09 | ) | |||||||||||||||
|
|
|
|
|
|
|
|
|
|
|
| |||||||||||||
Net asset value, end of period | $ | 22.90 | $ | 18.86 | $ | 16.99 | $ | 16.17 | $ | 12.33 | $ | 9.46 | ||||||||||||
| �� |
|
|
|
|
|
|
|
|
|
|
|
| ||||||||||||
Total return | 21.42 | %3 | 13.25 | % | 8.50 | % | 31.14 | % | 30.34 | % | (40.60 | %) | ||||||||||||
Ratios/supplemental data: | ||||||||||||||||||||||||
Net assets, end of period (millions) | $ | 2,633.8 | $ | 1,541.5 | $ | 1,134.5 | $ | 809.9 | $ | 363.8 | $ | 225.4 | ||||||||||||
Ratio of expenses to average net | 0.66 | %2 | 0.68 | % | 0.68 | % | 0.71 | % | 0.77 | % | 0.78 | % | ||||||||||||
Ratio of net investment loss to | (0.12 | %)2 | (0.32 | %) | (0.33 | %) | (0.45 | %) | (0.54 | %) | (0.46 | %) | ||||||||||||
Portfolio turnover rate | 5 | %3 | 14 | % | 11 | % | 15 | % | 20 | % | 24 | % | ||||||||||||
| 1 | Unaudited |
| 2 | Annualized |
| 3 | Not annualized |
The accompanying notes are an integral part of these financial statements.
32
| PRIMECAP Odyssey Funds For the Six Months Ended April 30, 2013 (Unaudited) |
(1) Organization
PRIMECAP Odyssey Funds (the “Trust”) was organized on June 8, 2004 as a Delaware statutory trust and is registered as an open-end management investment company under the Investment Company Act of 1940, as amended (the “1940 Act”). The Trust is comprised of three series: PRIMECAP Odyssey Stock Fund, PRIMECAP Odyssey Growth Fund, and PRIMECAP Odyssey Aggressive Growth Fund (the “Funds”), each of which is diversified within the meaning of the 1940 Act. PRIMECAP Management Company (the “Investment Advisor”) serves as investment advisor to the Funds. Each Fund commenced operations on November 1, 2004.
Each Fund’s investment objective is to achieve long-term capital appreciation. Each Fund is authorized to issue unlimited shares of beneficial interest. All shares within each Fund have equal rights with respect to voting. Prior to July 1, 2012, each Fund charged a redemption fee of 2% of the redemption amount on shares redeemed or exchanged within 60 days of purchase.
(2) Significant Accounting Policies
The Funds consistently follow the accounting policies set forth below which are in conformity with accounting principles generally accepted in the United States of America.
| A. | Security Valuation |
Securities traded on a national securities exchange are valued at the last reported sales price at the close of regular trading on each day the exchanges are open for trading. Securities traded on the National Association of Securities Dealers Authorized Quotations (“NASDAQ”) are valued at the NASDAQ Official Closing Price, which may not necessarily represent the last sale price. Non-U.S. traded stocks are valued at the last sale price or official closing price in the primary local market where the stock is traded. Securities traded on an exchange for which there have been no sales are valued at the mean between the bid and ask price. Because trading on most non-U.S. exchanges is normally completed before the close of the New York Stock Exchange, the value of securities traded on foreign exchanges can change by the time the Fund calculates its net asset value per share (“NAV”). To address these changes, the Funds may utilize adjustment factors provided by an independent pricing services to systematically value foreign securities at fair value. These adjustment factors are based on statistical analyses of subsequent movement in securities indices, specific security prices, and exchange rates in foreign markets.
Securities for which quotations are not readily available are stated at their respective fair values as determined in good faith by a valuation committee of the Investment Advisor in accordance with procedures approved by the Trust’s Board of Trustees. In determining fair value, the Funds take into account all relevant factors and available information. Consequently, the price of a security used by a Fund to calculate its share NAV may differ from quoted or published prices for the same security. Fair value pricing involves subjective judgments, and there is no single standard for determining a security’s fair value. As a result, different mutual funds could reasonably arrive at a different fair value for the same security. It is possible that the fair value determined for a security is
33
Notes to Financial Statements
PRIMECAP Odyssey Funds
For the Six Months Ended April 30, 2013 (Unaudited) – continued
materially different from the value that could be realized upon the sale of that security or from the values that other mutual funds may determine.
Investments in other funds are valued at their respective net asset values as determined by those funds, in accordance with the 1940 Act.
| B. | Share Valuation |
The NAV of a Fund is calculated by dividing the sum of the value of the securities held by the Fund, plus cash or other assets, minus all liabilities (including estimated accrued expenses), by the total number of shares outstanding of the Fund. The result is rounded to the nearest cent. The Funds’ shares will not be priced on the days on which the NYSE is closed for trading.
| C. | Foreign Currency |
Securities and other assets and liabilities denominated in foreign currencies are translated into U.S. dollars using exchange rates as of 4 p.m. Eastern time on the valuation date. Purchases and sales of investments and dividend and interest income are converted into U.S. dollars using the spot market rate of exchange prevailing on the respective dates of such translations. Realized foreign exchange gains or losses arise from sales of foreign currencies, currency gains or losses realized between the trade and settlement dates on securities transactions and the difference between the recorded amounts of dividends, interest, and foreign withholding taxes and the U.S. dollar equivalent of the amounts actually received or paid. Net unrealized foreign exchange gains and losses arise from changes in foreign exchange rates on foreign denominated assets and liabilities other than investments in securities held at the end of the reporting period. Foreign securities and currency transactions may involve risks not associated with U.S. securities and currency.
| D. | Federal Income Taxes |
Each Fund has elected to be treated as a “regulated investment company” under Subchapter M of the Internal Revenue Code (the “IRC”). Each Fund intends to distribute substantially all of its taxable income and any accumulated net realized capital gains. Accordingly, no provision for Federal income taxes has been made in the financial statements.
The Funds may be subject to foreign taxes on income, gains on investments, or currency repatriation, a portion of which may be reclaimed. The Funds will accrue such taxes and reclaims as applicable based upon their current interpretations of the tax rules and regulations that exist in the markets in which they invest.
Each Fund has adopted accounting standards regarding recognition and measurement of tax positions taken or expected to be taken on a tax return. The Funds recognize interest and penalties, if any, related to unrecognized tax benefits as income tax expense in the Statement of Operations. During the six months ended April 30, 2013, the Funds did not incur any interest or penalties. As of April 30, 2013, open tax years include the tax years ended October 31, 2009 through 2012. The Funds are also not
34
Notes to Financial Statements
PRIMECAP Odyssey Funds
For the Six Months Ended April 30, 2013 (Unaudited) – continued
aware of any tax positions for which it is reasonably possible that the total amounts of unrecognized tax benefits will significantly change in the next 12 months.
| E. | Allocation of Expenses |
Each Fund is charged for those expenses directly attributable to it. Expenses that are not directly attributable to a Fund are allocated among the Funds by an appropriate method based on the nature of the expense.
| F. | Security Transactions, Investment Income, and Distributions |
Security transactions are accounted for on the trade date. Dividend income and distributions to shareholders are recorded on the ex-dividend date, and interest income is recognized on the accrual basis. Realized gains and losses are evaluated on the basis of identified costs. Premiums and discounts on the purchase of securities are amortized/accreted using the effective interest method. United States Generally Accepted Accounting Principles (“GAAP”) require that permanent financial reporting and tax differences be reclassified in the capital accounts.
| G. | Use of Estimates |
The preparation of financial statements in conformity with U.S. GAAP requires management to make estimates and assumptions that affect the reported amounts of assets and liabilities and disclosure of contingent assets and liabilities at the date of the financial statements, and the reported amounts of revenues and expenses during the reporting period. Actual results could differ from these estimates.
| H. | Indemnification Obligations |
Under the Trust’s organizational documents, its current and former officers and trustees are indemnified against certain liabilities arising out of the performance of their duties to the Funds. In addition, in the normal course of business, the Funds enter into contracts that contain a variety of representations and warranties that provide general indemnifications. The Funds’ maximum exposure under these arrangements is unknown as this would involve future claims that may be made against the Funds that have not yet occurred. Based on experience, the Funds would expect the risk of loss to be minimal.
(3) Investment Transactions
The cost of purchases and the proceeds from sales of securities, excluding short-term investments, for the six months ended April 30, 2013 were as follows:
Fund | Purchases | Sales | ||||||
PRIMECAP Odyssey Stock Fund | $ | 101,394,923 | $ | 202,336,588 | ||||
PRIMECAP Odyssey Growth Fund | $ | 118,950,574 | $ | 169,303,005 | ||||
PRIMECAP Odyssey Aggressive Growth Fund | $ | 672,253,639 | $ | 85,988,826 | ||||
35
Notes to Financial Statements
PRIMECAP Odyssey Funds
For the Six Months Ended April 30, 2013 (Unaudited) – continued
(4) Valuation Measurements
The Funds have adopted fair valuation accounting standards which establish an authoritative definition of fair value and set forth a hierarchy for measuring fair value. These standards require additional disclosure about the various inputs and valuation techniques used to develop the measurements of fair value and a discussion of changes in valuation techniques and related inputs during the period. These standards define fair value as the price that would be received in the sale of an asset or paid to transfer a liability in an orderly transaction between market participants on the measurement date. The fair value hierarchy is organized into three levels based upon the assumptions (referred to as “inputs”) used to value the asset or liability. These standards state that “observable inputs” reflect the assumptions that market participants would use in valuing an asset or liability based on market data obtained from independent sources. “Unobservable inputs” reflect the Funds’ own assumptions about the inputs market participants would use to value the asset or liability.
Various inputs are used in determining the value of each Fund’s investments. These inputs are summarized in the three broad levels below:
| Level 1 – | Unadjusted quoted prices in active markets for identical securities to which the Trust has access at the date of measurement. |
| Level 2 – | Other significant observable inputs (including quoted prices for similar or related securities in both active and inactive markets, interest rates, foreign exchange rates, and fair value estimates for foreign securities indices). |
| Level 3 – | Significant unobservable inputs to the extent observable inputs are unavailable (including the Funds’ own assumptions in determining fair value of investments based on the best available information). |
36
Notes to Financial Statements
PRIMECAP Odyssey Funds
For the Six Months Ended April 30, 2013 (Unaudited) – continued
The following table provides the fair value measurements of applicable Fund assets by level within the fair value hierarchy for each Fund as of April 30, 2013. There were no transfers into or out of Level 1 and Level 2 during the reporting period. These assets are measured on a recurring basis.
Fund | Description | Quoted prices in active markets for identical assets (Level 1) | Significant other observable inputs (Level 2) | Significant unobservable inputs (Level 3) | Total | |||||||||||||
PRIMECAP Odyssey Stock Fund | Equity | $ | 1,536,130,869 | $ | — | $ | — | $ | 1,536,130,869 | |||||||||
|
|
|
|
|
|
|
| |||||||||||
Total Equity | $ | 1,536,130,869 | $ | — | $ | — | $ | 1,536,130,869 | ||||||||||
|
|
|
|
|
|
|
| |||||||||||
Short-Term Investments | $ | 84,967,775 | $ | — | $ | — | $ | 84,967,775 | ||||||||||
|
|
|
|
|
|
|
| |||||||||||
Total Investments in Securities | $ | 1,621,098,644 | $ | — | $ | — | $ | 1,621,098,644 | ||||||||||
|
|
|
|
|
|
|
| |||||||||||
PRIMECAP Odyssey Growth Fund | Equity | $ | 2,571,635,136 | $ | — | $ | — | $ | 2,571,635,136 | |||||||||
|
|
|
|
|
|
|
| |||||||||||
Total Equity | $ | 2,571,635,136 | $ | — | $ | — | $ | 2,571,635,136 | ||||||||||
|
|
|
|
|
|
|
| |||||||||||
Short-Term Investments | $ | 222,161,299 | $ | — | $ | — | $ | 222,161,299 | ||||||||||
|
|
|
|
|
|
|
| |||||||||||
Total Investments in Securities | $ | 2,793,796,435 | $ | — | $ | — | $ | 2,793,796,435 | ||||||||||
|
|
|
|
|
|
|
| |||||||||||
PRIMECAP Odyssey Aggressive Growth Fund | Equity | $ | 2,400,716,578 | $ | — | $ | — | $ | 2,400,716,578 | |||||||||
|
|
|
|
|
|
|
| |||||||||||
Total Equity | $ | 2,400,716,578 | $ | — | $ | — | $ | 2,400,716,578 | ||||||||||
|
|
|
|
|
|
|
| |||||||||||
Short-Term Investments | $ | 246,329,233 | $ | — | $ | — | $ | 246,329,233 | ||||||||||
|
|
|
|
|
|
|
| |||||||||||
Total Investments in Securities | $ | 2,647,045,811 | $ | — | $ | — | $ | 2,647,045,811 | ||||||||||
|
|
|
|
|
|
|
| |||||||||||
1 Refer to each Fund’s respective Schedule of Investments for the breakdown of major categories.
(5) Distribution to Shareholders
Net investment income and net realized gains differ for financial statement and tax purposes due to differing treatments of deferred wash sale losses.
37
Notes to Financial Statements
PRIMECAP Odyssey Funds
For the Six Months Ended April 30, 2013 (Unaudited) – continued
As of October 31, 2012, the components of capital on a tax basis were as follows:
| PRIMECAP Odyssey Stock Fund | PRIMECAP Odyssey Growth Fund | PRIMECAP Odyssey Aggressive Growth Fund | ||||||||||
Cost of investments for tax purposes1 | $ | 1,326,954,285 | $ | 1,826,775,111 | $ | 1,254,152,448 | ||||||
|
|
|
|
|
| |||||||
Gross tax unrealized appreciation | 241,643,043 | 523,149,720 | 458,365,589 | |||||||||
Gross tax unrealized depreciation | (47,279,788 | ) | (151,030,082 | ) | (174,278,152 | ) | ||||||
|
|
|
|
|
| |||||||
Net tax unrealized appreciation | 194,363,255 | 372,119,638 | 284,087,437 | |||||||||
|
|
|
|
|
| |||||||
Undistributed ordinary income | 16,330,713 | 8,607,982 | — | |||||||||
Undistributed long-term capital gain | — | — | — | |||||||||
|
|
|
|
|
| |||||||
Total distributable earnings | 16,330,713 | 8,607,982 | — | |||||||||
|
|
|
|
|
| |||||||
Other accumulated gain (loss) | (13,971,045 | ) | (3,180,302 | ) | (807,083 | ) | ||||||
|
|
|
|
|
| |||||||
Total accumulated gain | $ | 196,722,923 | $ | 377,547,318 | $ | 283,280,354 | ||||||
|
|
|
|
|
| |||||||
| 1 | At October 31, 2012 the differences in the basis for federal income tax purposes and financial reporting purposes are due to the tax deferral of losses on wash sales. |
At October 31, 2012, the PRIMECAP Odyssey Stock Fund had capital loss carryover of $13,971,045 which expires on October 31, 2017. The PRIMECAP Odyssey Growth Fund had a long-term capital loss carryover of $3,180,302 which does not expire. The PRIMECAP Odyssey Aggressive Growth Fund deferred, on a tax basis, late-year ordinary losses of $807,083.
Tax components of dividends paid during the six months ended April 30, 2013 and the year ended October 31, 2012 were as follows:
| April 30, 2013 | October 31, 2012 | |||||||||||||||
| Ordinary Income Distributions | Long-Term Capital Gain Distributions | Ordinary Income Distributions | Long-Term Capital Gain Distributions | |||||||||||||
Stock Fund | $ | 24,438,073 | — | $ | 12,241,758 | — | ||||||||||
Growth Fund | $ | 13,581,594 | — | $ | 13,976,027 | — | ||||||||||
Aggressive Growth Fund | — | — | $ | 13,466,237 | $ | 7,777,022 | ||||||||||
The Funds designated as long-term capital gain dividends, pursuant to Internal Revenue Code Section 852 (b) (3), the amounts necessary to reduce the earnings and profits of the Funds related to net capital gains to zero for the tax year ended October 31, 2012.
38
Notes to Financial Statements
PRIMECAP Odyssey Funds
For the Six Months Ended April 30, 2013 (Unaudited) – continued
(6) Investment Advisory and Other Agreements
The Trust has entered into an investment management agreement with the Investment Advisor on behalf of each Fund. For its services to the Funds, the Investment Advisor receives a fee paid quarterly at the annual rate of 0.60% of the first $100 million of each Fund’s average daily net assets and 0.55% of each Fund’s average daily net assets in excess of $100 million. For the six months ended April 30, 2013, each Fund paid the Investment Advisor at an effective annual rate of 0.55% of its respective average net assets.
The Bank of New York Mellon serves as the Funds’ custodian. U.S. Bancorp Fund Services, LLC (“USBFS”) serves as the administrator, fund accountant, and transfer agent to the Funds. Quasar Distributors, LLC, an affiliate of USBFS, serves as the Funds’ distributor.
(7) Other Affiliates
Certain of the Funds’ investments are in companies that are considered to be affiliated companies of a Fund because the Fund owns 5% or more of the outstanding voting securities of the company. Transactions during the period in securities of these companies were as follows:
PRIMECAP Odyssey Growth Fund |
| |||||||||||||||||||||||
| Current Period Transactions | ||||||||||||||||||||||||
Common Stock | Market Value at October 31, 2012 | Purchases at Cost | Proceeds from Securities Sold | Dividend Income | Realized Gain (Loss) | Market Value at April 30, 2013 | ||||||||||||||||||
Conceptus, Inc. | $ | 43,213,835 | $ | — | $ | — | $ | — | $ | — | $ | 71,128,505 | ||||||||||||
ImmunoGen, Inc. | 64,874,508 | — | — | — | — | 93,798,702 | ||||||||||||||||||
|
|
|
|
|
|
|
|
|
|
|
| |||||||||||||
| $ | 108,088,343 | $ | — | $ | — | $ | — | $ | — | $ | 164,927,207 | |||||||||||||
|
|
|
|
|
|
|
|
|
|
|
| |||||||||||||
39
Notes to Financial Statements
PRIMECAP Odyssey Funds
For the Six Months Ended April 30, 2013 (Unaudited) – continued
PRIMECAP Odyssey Aggressive Growth Fund |
| |||||||||||||||||||||||
| Current Period Transactions | ||||||||||||||||||||||||
Common Stock | Market Value at October 31, 2012 | Purchases at Cost | Proceeds from Securities Sold | Dividend Income | Realized Gain (Loss) | Market Value at April 30, 2013 | ||||||||||||||||||
Abiomed, Inc. | $ | 42,646,159 | $ | 6,612,737 | $ | — | $ | — | $ | — | $ | 49,334,718 | ||||||||||||
Active Network, Inc.(1) | — | 17,339,331 | — | — | — | 25,429,603 | ||||||||||||||||||
Boulder Brands, Inc.* | 39,429,519 | — | — | — | — | 29,853,779 | ||||||||||||||||||
comScore, Inc.(1) | — | 15,034,230 | — | — | — | 44,520,214 | ||||||||||||||||||
Conceptus, Inc. | 31,458,090 | — | — | — | — | 51,778,948 | ||||||||||||||||||
DreamWorks Animation SKG, Inc.(1) | — | 43,690,371 | — | — | — | 78,984,376 | ||||||||||||||||||
Dyax, Corp. | 17,598,300 | — | — | — | — | 16,131,775 | ||||||||||||||||||
Fluidigm Corp.(1) | — | 27,342,882 | — | — | — | 40,247,600 | ||||||||||||||||||
Guidance Software, Inc. | 17,077,578 | 1,451,095 | — | — | — | 16,328,092 | ||||||||||||||||||
|
|
|
|
|
|
|
|
|
|
|
| |||||||||||||
| $ | 148,209,646 | $ | 111,470,646 | $ | — | $ | — | $ | — | $ | 352,609,105 | |||||||||||||
|
|
|
|
|
|
|
|
|
|
|
| |||||||||||||
| * | Prior to January 2, 2013, Boulder Brands, Inc. was known as Smart Balance, Inc. |
| (1) | As of October 31, 2012, the company was not an affiliate. |
(8) Subsequent Events
The Funds have evaluated subsequent events through the issuance of the financial statements and determined that no events have occurred that require disclosure.
40
| PRIMECAP Odyssey Funds (Unaudited) |
Proxy Voting Procedures
The Investment Advisor votes proxies relating to portfolio securities in accordance with procedures that have been approved by the Trust’s Board of Trustees. You may obtain a description of these procedures, free of charge, by calling toll-free 1-800-729-2307. This information is also available through the Securities and Exchange Commission’s (“SEC”) website at www.sec.gov.
Proxy Voting Record
Information regarding how the Funds voted proxies relating to the portfolio securities during the most recent 12-month period ended June 30 is available, without charge, by calling toll-free 1-800-729-2307. This information is also available through the SEC’s website at www.sec.gov.
Form N-Q Disclosure
The Funds file a complete schedule of portfolio holdings with the SEC for the first and third quarters of each fiscal year on Form N-Q. The Funds’ Forms N-Q are available on the SEC’s website at www.sec.gov. The Funds’ Forms N-Q may be reviewed and copied at the Commission’s Public Reference Room in Washington, DC, and information on the operation of the Public Reference Room may be obtained by calling 1-800-SEC-0330. This information is also available, without charge, by calling toll-free 1-800-729-2307.
41
| PRIMECAP Odyssey Funds (Unaudited) |
As a shareholder of one or more of the Funds, you incur ongoing costs, including management fees and other Fund expenses. This expense example is intended to help you understand your ongoing costs (in dollars) of investing in the Funds and to compare these costs with the ongoing costs of investing in other mutual funds.
The expense example is based on an investment of $1,000 invested for a six-month period beginning November 1, 2012 and held through April 30, 2013.
Actual Expenses
The information in the table adjacent to the heading “Actual Performance” provides actual account values and actual expenses. You may use the information in these columns, together with the amount you invested, to estimate the expenses that you paid over the period. Simply divide your account value by $1,000 (for example, an $8,600 account value divided by $1,000 = 8.6), then multiply the result by the number in the column entitled “Expenses Paid during Period” to estimate the expenses you paid on your account during this period.
Hypothetical Example for Comparison Purposes
The information in the table adjacent to the heading “Hypothetical Performance (5% return before expenses)” provides hypothetical account values and hypothetical expenses based on the Funds’ actual expense ratios and an assumed rate of return of 5% per year before expenses, which are not the Funds’ actual returns. The hypothetical account values and expenses may not be used to estimate the actual ending account balance or expenses you paid for the period. You may use this information to compare the ongoing costs of investing in the Funds and other mutual funds. To do so, compare these 5% hypothetical examples with the 5% hypothetical examples that appear in the shareholder reports of the other mutual funds.
Please note that the expenses shown in the table are meant to highlight your ongoing costs only. Therefore, the information adjacent to the heading “Hypothetical Performance (5% return before expenses)” is useful in comparing ongoing costs only and will not help you determine the relative total costs of owning different mutual funds. In addition, if transactional costs were included, your costs would have been higher.
42
Expense Example
PRIMECAP Odyssey Funds
(Unaudited) – continued
| Beginning Account Value (11/1/12) | Ending | Expenses Paid During Period1 (11/1/12 to 4/30/13) | Expense Ratio During Period1 (11/1/12 to 4/30/13) | |||||||||||||
PRIMECAP Odyssey Stock Fund |
| |||||||||||||||
Actual Performance | $ | 1,000.00 | $ | 1,184.30 | $ | 3.48 | 0.64% | |||||||||
Hypothetical Performance | $ | 1,000.00 | $ | 1,021.60 | $ | 3.22 | 0.64% | |||||||||
PRIMECAP Odyssey Growth Fund |
| |||||||||||||||
Actual Performance | $ | 1,000.00 | $ | 1,232.00 | $ | 3.63 | 0.66% | |||||||||
Hypothetical Performance | $ | 1,000.00 | $ | 1,021.54 | $ | 3.29 | 0.66% | |||||||||
PRIMECAP Odyssey Aggressive Growth Fund |
| |||||||||||||||
Actual Performance | $ | 1,000.00 | $ | 1,214.20 | $ | 3.60 | 0.66% | |||||||||
Hypothetical Performance | $ | 1,000.00 | $ | 1,021.54 | $ | 3.29 | 0.66% | |||||||||
| 1 | Expenses are equal to a Fund’s annualized expense ratio as indicated, multiplied by the average account value over the period, multiplied by the number of days in the most recent fiscal half-year period (181), then divided by the number of days in the fiscal year (365) to reflect the one-half year period. |
43
| PRIMECAP Odyssey Funds (Unaudited) |
Portfolio Managers
PRIMECAP Management Company has five portfolio managers who together have more than 145 years of investment experience. The portfolio managers primarily responsible for overseeing the Funds’ investments are:
| Name | Years of Experience | |||
Mitchell J. Milias | 49 | |||
Theo A. Kolokotrones | 43 | |||
Joel P. Fried | 28 | |||
Alfred W. Mordecai | 16 | |||
M. Mohsin Ansari | 13 | |||
Each of these five individuals manages a portion of the PRIMECAP Odyssey Stock Fund and the PRIMECAP Odyssey Growth Fund. The PRIMECAP Odyssey Aggressive Growth Fund is primarily managed by Messrs. Kolokotrones, Fried, Mordecai, and Ansari. A small portion of each Fund’s assets may be managed by individuals in the Investment Advisor’s research department.
Officers and Trustees
The Trust’s officers, who oversee the Funds’ daily operations, are appointed by the Board of Trustees. The trustees are responsible for the overall management of the Trust, including establishing the Funds’ policies and general supervision and review of their investment activities. The Statement of Additional Information includes additional information about the trustees and is available, without charge, by calling 1-800-729-2307 or at the Funds’ website at www.odysseyfunds.com.
Executive Officers. The table below sets forth certain information about each of the Trust’s executive officers.
| Name, Address (Year of Birth) | Position(s) Held with Trust | Term of Office; Length of Time Served | Principal Occupation(s) During Past 5 Years | |||
Theo A. Kolokotrones 225 South Lake Ave. Pasadena, CA 91101-3005 | Co-Chief Executive Officer | Indefinite; Since 09/04 | Vice-Chairman, Director, Portfolio Manager, and Principal PRIMECAP Management Company | |||
Joel P. Fried 225 South Lake Ave. Pasadena, CA 91101-3005 (1962) | Co-Chief Executive Officer and Trustee | Indefinite; Since 09/04 | President, Director, Portfolio Manager, and Principal PRIMECAP Management Company |
44
Management
PRIMECAP Odyssey Funds
(Unaudited) – continued
| Name, Address (Year of Birth) | Position(s) Held with Trust | Term of Office; Length of Time Served | Principal Occupation(s) During Past 5 Years | |||
Alfred W. Mordecai 225 South Lake Ave. Pasadena, CA 91101-3005 (1967) | Co-Chief Executive Officer | Indefinite; Since 10/12 | Executive Vice President, Director, Portfolio Manager, and Principal PRIMECAP Management Company | |||
Michael J. Ricks 225 South Lake Ave. Pasadena, CA 91101-3005 (1977) | Chief Financial Officer, Chief Administrative Officer, and Secretary | Indefinite; Since 03/11 | Director of Fund Administration, PRIMECAP Management Company (since 2011); Vice President, Fund Administration and Compliance, U.S. Bancorp Fund Services, LLC (2001-2011) | |||
Karen Chen 225 South Lake Ave. Pasadena, CA 91101-3005 (1973) | Vice President of Compliance, Chief Compliance Officer, and AML Officer | Indefinite; Since 10/04 | Chief Compliance Officer, Director of Compliance and Reporting PRIMECAP Management Company |
“Independent” Trustees. The table below sets forth certain information about each of the trustees of the Trust who is not an “interested person” of the Trust as defined in the 1940 Act (“Independent Trustees”).
| Name, Address (Year of Birth) | Position(s) Held with Trust | Term of Office; Length of Time Served | Principal Occupation(s) During Past 5 Years | Number of Portfolios in Fund Complex by Trustee1 | Other Director- ships Held by Trustee | |||||
Benjamin F. Hammon 225 South Lake Ave. Pasadena, CA 91101-3005 (1935) | Chairman of the Board and Trustee | Indefinite; Since 09/04 | Retired; Private investor | 3 | None | |||||
Wayne H. Smith 225 South Lake Ave. Pasadena, CA 91101-3005 (1941) | Chairman of the Audit Committee and Trustee | Indefinite; Since 09/04 | Retired; Private investor | 3 | None | |||||
| Joseph G. Uzelac 225 South Lake Ave. Pasadena, CA 91101-3005 (1944) | Trustee | Indefinite; Since 10/07 | Retired; Private investor | 3 | None | |||||
| Elizabeth D. Obershaw 225 South Lake Ave. Pasadena, CA 91101-3005 (1960) | Trustee | Indefinite; Since 06/08 | Managing Director, Horsley Bridge Partners, an investment advisor (2007-present) | 3 | None |
45
Management
PRIMECAP Odyssey Funds
(Unaudited) – continued
“Interested” Trustees. The table below sets forth certain information about each of the trustees of the Trust who is an “interested person” of the Trust as defined by the 1940 Act.
| Name, Address (Year of Birth) | Position(s) Held with Trust | Term of Office; Length of Time Served | Principal Occupation(s) During Past 5 Years | Number of Portfolios in Fund Complex by Trustee1 | Other Director- ships Held by Trustee | |||||
| Joel P. Fried2 225 South Lake Ave. Pasadena, CA 91101-3005 (1962) | Co-Chief Executive Officer and Trustee | Indefinite; Since 09/04 | President, Director, Portfolio Manager, and Principal PRIMECAP Management Company | 3 | None |
| 1 | Fund Complex includes any funds, series of funds, or trusts that share the same advisor or that hold themselves out to investors as related companies. |
| 2 | Mr. Fried is an “interested person” of the Trust, as defined by the 1940 Act, because of his employ- ment with PRIMECAP Management Company, the investment advisor to the Trust. |
46
Investment Advisor
PRIMECAP MANAGEMENT COMPANY
225 South Lake Avenue, Suite 400
Pasadena, California 91101
•
Distributor
QUASAR DISTRIBUTORS, LLC
615 East Michigan Street, 4th Floor
Milwaukee, Wisconsin 53202
•
Custodian
THE BANK OF NEW YORK MELLON
One Wall Street
New York, New York 10286
•
Transfer Agent
U.S. BANCORP FUND SERVICES, LLC
615 East Michigan Street, 3rd Floor
Milwaukee, Wisconsin 53202
•
Administrator
U.S. BANCORP FUND SERVICES, LLC
2020 East Financial Way, Suite 100
Glendora, California 91741
•
Legal Counsel
BINGHAM McCUTCHEN LLP
355 South Grand Avenue, Suite 4400
Los Angeles, California 90071
•
Independent Registered Public Accounting Firm
PRICEWATERHOUSECOOPERS LLP
Three Embarcadero Center
San Francisco, California 94111
This report is intended for the shareholders of the PRIMECAP Odyssey Funds and may not be used as sales literature unless preceded or accompanied by a current prospectus.
Past performance results shown in this report should not be considered a representation of future performance. Share price and returns will fluctuate so that shares, when redeemed, may be worth more or less than their original cost. Statements and other information herein are dated and are subject to change.
PRIMECAP, PRIMECAP Odyssey, and the PRIMECAP Odyssey logo are trademarks of PRIMECAP Management Company.
Item 2. Code of Ethics.
Not applicable for semi-annual reports.
Item 3. Audit Committee Financial Expert.
Not applicable for semi-annual reports.
Item 4. Principal Accountant Fees and Services.
Not applicable for semi-annual reports.
Item 5. Audit Committee of Listed Registrants.
Not applicable to registrants who are not listed issuers (as defined in Rule 10A-3 under the Securities Exchange Act of 1934).
Item 6. Investments.
| (a) | Schedule of Investments is included as part of the report to shareholders filed under Item 1 of this Form. |
| (b) | Not applicable. |
Item 7. Disclosure of Proxy Voting Policies and Procedures for Closed-End Management Investment Companies.
Not applicable to open-end investment companies.
Item 8. Portfolio Managers of Closed-End Management Investment Companies.
Not applicable to open-end investment companies.
Item 9. Purchases of Equity Securities by Closed-End Management Investment Company and Affiliated Purchasers.
Not applicable to open-end investment companies.
Item 10. Submission of Matters to a Vote of Security Holders.
Not applicable.
Item 11. Controls and Procedures.
| (a) | The Registrant’s Co-Chief Executive Officers and Chief Financial Officer have reviewed the Registrant’s disclosure controls and procedures (as defined in Rule 30a-3(c) under the Investment Company Act of 1940 (the “Act”)) as of a date within 90 days of the filing of this report, as required by Rule 30a-3(b) under the Act and Rules 13a-15(b) or 15d-15(b) under the Securities Exchange Act of 1934. Based on their review, such officers have concluded that the disclosure controls and procedures are effective in ensuring that information required to be disclosed in this report is appropriately recorded, processed, summarized and reported and made known to them by others within the Registrant and by the Registrant’s service providers. |
| (b) | There were no changes in the Registrant’s internal control over financial reporting (as defined in Rule 30a-3(d) under the Act) that occurred during the second fiscal quarter of the period covered by this report that has materially affected, or is reasonably likely to materially affect, the Registrant’s internal control over financial reporting. |
Item 12. Exhibits.
| (a) | (1) Any code of ethics or amendment thereto, that is the subject of the disclosure required by Item 2, to the extent that the registrant intends to satisfy Item 2 requirements through filing an exhibit. Not applicable. |
(2) A separate certification for each principal executive and principal financial officer pursuant to Section 302 of the Sarbanes-Oxley Act of 2002. Filed herewith.
(3) Any written solicitation to purchase securities under Rule 23c-1 under the Act sent or given during the period covered by the report by or on behalf of the registrant to 10 or more persons. Not applicable to open-end investment companies.
| (b) | Certifications pursuant to Section 906 of the Sarbanes-Oxley Act of 2002. Furnished herewith. |
2
SIGNATURES
Pursuant to the requirements of the Securities Exchange Act of 1934 and the Investment Company Act of 1940, the registrant has duly caused this report to be signed on its behalf by the undersigned, thereunto duly authorized.
PRIMECAP Odyssey Funds | ||||
By | /s/ Joel P. Fried | |||
| Joel P. Fried, Co-Chief Executive Officer | ||||
Date | June 20, 2013 | |||
By | /s/ Theo A. Kolokotrones | |||
| Theo A. Kolokotrones, Co-Chief Executive Officer | ||||
Date | June 20, 2013 | |||
By | /s/ Alfred W. Mordecai | |||
| Alfred W. Mordecai, Co-Chief Executive Officer | ||||
Date | June 20, 2013 | |||
Pursuant to the requirements of the Securities Exchange Act of 1934 and the Investment Company Act of 1940, this report has been signed below by the following persons on behalf of the registrant and in the capacities and on the dates indicated.
| By | /s/ Joel P. Fried | |||
| Joel P. Fried, Co-Chief Executive Officer | ||||
| Date | June 20, 2013 | |||
| By | /s/ Theo A. Kolokotrones | |||
| Theo A. Kolokotrones, Co-Chief Executive Officer | ||||
| Date | June 20, 2013 | |||
| By | /s/ Alfred W. Mordecai | |||
| Alfred W. Mordecai, Co-Chief Executive Officer | ||||
| Date | June 20, 2013 | |||
| By | /s/ Michael J. Ricks | |||
| Michael J. Ricks, Chief Financial Officer | ||||
Date | June 20, 2013 | |||
3