As filed with the Securities and Exchange Commission on December 27, 2019
UNITED STATES
SECURITIES AND EXCHANGE COMMISSION
Washington, D.C. 20549
FORMN-CSR
CERTIFIED SHAREHOLDER REPORT OF REGISTERED
MANAGEMENT INVESTMENT COMPANIES
Investment Company Act file number 811-21597
PRIMECAP Odyssey Funds
(Exact name of registrant as specified in charter)
177 East Colorado Boulevard, 11th Floor
Pasadena, CA 91105
(Address of principal executive offices) (Zip code)
Michael J. Ricks
PRIMECAP Management Company
177 East Colorado Boulevard, 11th Floor
Pasadena, CA 91105
(Name and address of agent for service)
(626)304-9222
Registrant’s telephone number, including area code
Date of fiscal year end: October 31
Date of reporting period: October 31, 2019
Item 1. Reports to Stockholders.
Item 1. Reports to Stockholders.
ANNUAL REPORT
For the Year Ended October 31, 2019

PRIMECAP ODYSSEY STOCK (POSKX)
PRIMECAP ODYSSEY GROWTH (POGRX)
PRIMECAP ODYSSEY AGGRESSIVE GROWTH (POAGX)
Beginning in January 2021, as permitted by regulations adopted by the U.S. Securities and Exchange Commission, paper copies of the Funds’ annual and semiannual shareholder reports will no longer be sent by mail, unless you specifically request paper copies of the reports. Instead, the reports will be made available on the Funds’ website (http://www.primecap.com/document-viewer/), and you will be notified by mail each time a report is posted and provided with a website link to access the report.
If you already elected to receive shareholder reports electronically, you will not be affected by this change and you need not take any action. You may elect to receive shareholder reports and other communications from the Funds electronically anytime by contacting your financial intermediary (such as a broker-dealer or a bank) or, if you are a direct investor, by calling 1-800-729-2307 or by accessing your online shareholder account at http://www.primecap.com.
You may elect to receive all future reports in paper free of charge. If you invest through a financial intermediary, you can contact your financial intermediary to request that you continue to receive paper copies of your shareholder reports. If you invest directly with the Funds, you can call 1-800-729-2307 to let the Funds know you wish to continue receiving paper copies of your shareholder reports. Your election to receive reports in paper will apply to all Funds held in your account with that intermediary if you invest through your financial intermediary or all Funds held with the fund complex if you invest directly with the Funds.
 | PRIMECAP Odyssey Funds |
| 2 | ||||
| 9 | ||||
| 9 | ||||
| 10 | ||||
| 11 | ||||
| 12 | ||||
| 14 | ||||
| 14 | ||||
| 18 | ||||
| 23 | ||||
| 30 | ||||
| 31 | ||||
| 32 | ||||
| 32 | ||||
| 33 | ||||
| 34 | ||||
| 35 | ||||
| 35 | ||||
| 36 | ||||
| 37 | ||||
| 38 | ||||
| 47 | ||||
| 48 | ||||
| 50 | ||||
| 56 | ||||
Privacy Notice | ||||
1
| PRIMECAP Odyssey Funds |
Dear Fellow Shareholders,
For the fiscal year ended October 31, 2019, the PRIMECAP Odyssey Stock Fund, PRIMECAP Odyssey Growth Fund, and PRIMECAP Odyssey Aggressive Growth Fund produced total returns of +11.22%, +5.75%, and +4.71%, respectively. The unmanaged S&P 500 index produced a total return of +14.33% during the period. Unfavorable stock selection detracted from results relative to the S&P 500, while sector allocation had a more mixed impact across the funds.
During the fiscal year, the American economy’s decade-long expansion moderated somewhat, demonstrating signs of late-cycle fatigue amid a broader global slowdown. Consumer spending generally remained healthy, bolstered by continued labor market strength, even as consumer confidence dipped in the summer months. But business investment weakened of late, a notable reversal fromyear-ago conditions, and trade-driven uncertainty has hindered business confidence. Elsewhere, major foreign economies slowed, particularly in Europe and China, and geopolitical tension intensified, including an apparent Iranian attack on Saudi Arabia oil infrastructure and a further deterioration in U.S.-China relations. The Federal Reserve responded to the unease with three interest rate cuts, an about-face from last year’s tightening campaign.
The equity market proved resilient in the face of this widespread uncertainty, finishing the period at record-high levels. The S&P 500’s +14% return defied a sharp deceleration in corporate earnings throughout the year, as analysts now project just +1% earnings growth for the S&P 500 index in 2019, well below original expectations for double-digit growth. Indeed, the index’s current expected earnings for 2020 nearly matchyear-ago expectations for 2019 earnings, implying forward valuation climbed in tandem with the market’s ascent.
Defensive sectors real estate (+27%) and utilities (+24%) led the market as beneficiaries of the Federal Reserve’s dovish pivot to lower interest rates, but many cyclical sectors also outperformed, including information technology (+23%) and consumer discretionary (+16%). Weakness, meanwhile, was concentrated in energy(-12%) and health care (+9%), which were beset by declining crude prices and domestic political scrutiny, respectively. The market’s performance overall featured something of a flight to quality, with bond-proxy defensive stocks and high-quality cyclical stocks both benefitting. In a sense, and somewhat counterintuitively, persistent anxiety and wilting bond yields together fueled the market rise, with investors crowding into ostensible safe harbors across disparate sectors.
We tend to fish in less tranquil seas, willfully eschewing perceived safety in return for what we assess as greater risk-adjusted opportunities. This results in relatively concentrated and often contrarian exposures toout-of-favor and higher-risk industries. Our consequent ownership of unloved (e.g., airlines and cruise lines) and more speculative (e.g., biotechnology) stocks bears limited resemblance to the S&P 500, creating the possibility for substantial deviation in performance. Unfortunately, many of our portfolios’ idiosyncratic features directly contributed to poor relative results this fiscal year, particularly in the Growth and Aggressive Growth Funds.
2
Letter to Shareholders
PRIMECAP Odyssey Funds
continued
Each of the PRIMECAP Odyssey Funds continues to be overweight in the health care, information technology, industrials, and consumer discretionary sectors, and underweight in the communication services, energy, consumer staples, materials, utilities, and real estate sectors. Within the financials sector, the PRIMECAP Odyssey Stock Fund has developed a modest overweight position, while the Growth and Aggressive Growth Funds remain slightly underweight the sector.
A more detailed discussion of the results of each PRIMECAP Odyssey Fund follows.
PRIMECAP Odyssey Stock Fund
For the fiscal year ended October 31, 2019, the Stock Fund’s total return of +11.22% trailed the S&P 500’s total return of +14.33%. Relative to the S&P 500, modestly favorable sector allocation was more than offset by unfavorable stock selection.
The Stock Fund’s steep underweight position in the lagging energy sector (1% of average assets versus 5% for the index) benefited relative results, as did overweight positions in information technology and industrials. Providing a substantial offset were a sizable health care overweight position, modest cash holdings, and negligible exposure to the two best performing sectors, real estate (+27%) and utilities (+24%).
Sector allocation is reasonably similar across each of the Odyssey Funds with a few notable exceptions. Relative to its Odyssey Fund peers, the Stock Fund has larger industrials (20% of average assets) and financials (14% of average assets) ownership, while its health care overweight position (20% of average assets) is less pronounced than in the Growth and Aggressive Growth Funds. These distinctive features explain the Stock Fund’s modest sector allocation tailwind.
Stock selection was unfavorable in aggregate. Information technology and industrials were the areas of greatest relative weakness. Within information technology, strong performances from several key semiconductor holdings, led by KLA Corporation (+90%), failed to offset substantial weakness in our technology hardware ownership, most notably NetApp(-27%) and HP Inc.(-26%). Within industrials, FedEx(-30%) was the primary laggard, as both trade concerns and company-specific challenges weighed on the shares. Airlines generally detracted from results as well, with American Airlines(-13%) the worst performer in the group.
Favorable selection within health care provided a partial offset. The Stock Fund features fewer biotechnology holdings, and the portfolio’s differentiated pharmaceutical ownership outperformed overall. The fund’s largest holding atperiod-end, Astrazeneca PLC (+31%), was the standout performer, followed by Roche (+27%), while avoidinglarge-cap peers Pfizer(-8%) and Johnson & Johnson(-3%) also boosted relative results.
3
Letter to Shareholders
PRIMECAP Odyssey Funds
continued
The top 10 holdings, which collectively represented 28.8% of the portfolio at the period end, are listed below:
| PRIMECAP Odyssey Stock Fund Top 10 Holdings as of 10/31/19 | Ending % of Total Portfolio* | |||
AstraZeneca Plc | 4.2 | |||
JPMorgan Chase & Co. | 4.1 | |||
Eli Lilly & Co. | 3.3 | |||
United Airlines Holdings, Inc. | 2.6 | |||
Discover Financial Services | 2.6 | |||
Southwest Airlines Co. | 2.6 | |||
Wells Fargo & Company | 2.4 | |||
Siemens AG | 2.4 | |||
Whirlpool Corporation | 2.3 | |||
Sony Corporation | 2.3 | |||
Total % of Portfolio | 28.8 | |||
| * | The percentage is calculated by using the ending market value of the security divided by the ending market value of the total investments of the fund. |
PRIMECAP Odyssey Growth Fund
For the fiscal year ended October 31, 2019, the Growth Fund returned +5.75%, behind both the S&P 500’s +14.33% total return and the Russell 1000 Growth Index’s total return of +17.10%. Both sector allocation and stock selection detracted from performance relative to the S&P 500.
The Growth Fund’s poor stock selection this period was widespread. Consumer discretionary holdings iRobot(-45%), L Brands(-44%), and Carnival(-21%) severely underperformed, even as the sector benchmark (+16%) managed to outpace the market. And while individual stock performance was somewhat more varied in other key sectors, selection was overall unfavorable in each of health care, information technology, industrials, and financials.
Within health care, Seattle Genetics (+91%) and Insulet (+65%) outperformed but were unable to offset the broadersell-off in biotechnology stocks, punctuated by a significant decline in Nektar Therapeutics(-56%) and Alkermes(-52%). ABIOMED(-39%) also underperformed, a sharp reversal following a remarkable multi-year ascent. The story was similar in the information technology sector, as strength in KLA Corporation (+90%) and Universal Display (+63%) failed to compensate for underperformance in other holdings, most notably BlackBerry(-43%) and NetApp(-27%). Elsewhere in the fund, airlines led the industrials’ underperformance, with American(-13%) and United (+6%) the main culprits, while E*TRADE Financial(-15%) dragged down the financials portfolio.
4
Letter to Shareholders
PRIMECAP Odyssey Funds
continued
Sector allocation largely mirrored that of the Stock Fund, but with a larger health care overweight position (30% of average assets) and a slightly less pronounced energy underweight (2% of average assets), the overall allocation effect tipped modestly negative. Underweight positions in real estate and utilities were once again headwinds to relative performance.
The top 10 holdings, which collectively represented 26.4% of the portfolio at the period end, are listed below:
| PRIMECAP Odyssey Growth Fund Top 10 Holdings as of 10/31/19 | Ending % of Total Portfolio* | |||
Seattle Genetics, Inc. | 4.3 | |||
United Airlines Holdings, Inc. | 3.5 | |||
Eli Lilly & Co. | 2.7 | |||
ABIOMED, Inc. | 2.7 | |||
Alphabet Inc. | 2.4 | |||
Insulet Corporation | 2.3 | |||
Micron Technology | 2.3 | |||
Alibaba Group Holding ADR | 2.2 | |||
Southwest Airlines Co. | 2.1 | |||
Siemens AG | 1.9 | |||
Total % of Portfolio | 26.4 | |||
| * | The percentage is calculated by using the ending market value of the security divided by the ending market value of the total investments of the fund. |
PRIMECAP Odyssey Aggressive Growth Fund
For the fiscal year ended October 31, 2019, the Aggressive Growth Fund’s total return of +4.71% lagged both the S&P 500’s total return of +14.33% and the Russell Midcap Growth Index’s total return of +18.93%. As with the Growth Fund, both sector allocation and stock selection detracted from performance relative to the S&P 500.
Unfavorable stock selection was again broad-based, with the Aggressive Growth Fund’s greater biotechnology ownership contributing to the portfolio’s inferior results relative to the Growth Fund. The fund’s health care holdings significantly lagged(-6%) its sector benchmark (+9%), explaining roughly half of the fund-level underperformance during the period. Seattle Genetics (+91%) and Insulet (+65%) again provided a lift but were overwhelmed by declines in several key positions. In addition to Nektar Therapeutics(-56%), Alkermes(-52%), and ABIOMED(-39%), the portfolio also suffered from its exposure to Spectrum Pharmaceuticals(-35%), BioMarin(-21%), and QIAGEN(-18%). While the portfolio featured many smaller outperformers, significant weakness in our larger holdings proved insurmountable.
5
Letter to Shareholders
PRIMECAP Odyssey Funds
continued
In the rest of the portfolio, favorable stock selection in financials, led by MarketAxess Holdings (+77%), was unable to offset weakness in communication services, industrials, information technology, and consumer discretionary. In a continuation of last year’s results in communication services, shares of both comScore(-86%), a media measurement firm, and Lions Gate Entertainment(-58%), a media content platform, led the portfolio’s underperformance. Within consumer discretionary, iRobot(-45%) was the principal detractor, while results in information technology and industrials closely mimicked the Stock and Growth Funds, as technology companies and airlines drove the underperformance.
The top 10 holdings, which collectively represented 29.8% of the portfolio at the period end, are listed below:
| PRIMECAP Odyssey Aggressive Growth Fund Top 10 Holdings as of 10/31/19 | Ending % of Total Portfolio* | |||
Sony Corporation | 4.3 | |||
Seattle Genetics, Inc. | 3.9 | |||
United Airlines Holdings, Inc. | 3.3 | |||
Micron Technology, Inc. | 3.3 | |||
Splunk Inc. | 2.7 | |||
Universal Display Corporation | 2.6 | |||
ABIOMED, Inc. | 2.5 | |||
American Airlines Group, Inc. | 2.5 | |||
MarketAxess Holdings, Inc. | 2.4 | |||
Delta Air Lines, Inc. | 2.3 | |||
Total % of Portfolio | 29.8 | |||
| * | The percentage is calculated by using the ending market value of the security divided by the ending market value of the total investments of the fund. |
Outlook
Our longstanding cautious optimism currently tilts slightly towards caution, a reflection of increased concerns in both the international and domestic arenas. The S&P 500 finished the year at record highs despite a moderation in economic activity. Absolute valuation (17.2x forward P/E valuation) is perhaps reasonable relative to anemic bond yields (1.7%10-year Treasury yield), but the divergence between equity market performance and underlying economic activity feels unsustainable. Indeed, even with equity market indices prevailing at elevated levels, the bond markets recently indicated apparent distress. In late August, the10-year Treasury yield briefly dipped below the2-year Treasury yield, an inversion notorious as a harbinger of recession.
6
Letter to Shareholders
PRIMECAP Odyssey Funds
continued
Meanwhile, confidence in some form of a U.S.-China trade deal remains steadfast, with “phase one” enthusiasm reaching a crescendo of late, even as national political crises unfold in both countries (an impeachment inquiry and the Hong Kong protests, respectively). We have admittedly been hopeful that trade-inspired geopolitical risks would subside, but instead we have observed mostly false starts and provocation thus far. American domestic political rancor has likewise escalated, with hyper-partisanship effectively paralyzing the federal government’s legislative and executive branches for the indefinite future as another major election looms.
Despite the relentless uncertainty, we nonetheless remain believers in America’s economic engine, the free enterprise system. This fundamental faith undergirds and informs our desire to own U.S. equities over the long-term, and we remain cognizant of how quickly conditions can improve. Our largest sector positions continue to be in information technology and health care, where the development of innovative technologies and therapies is not tied to near-term economic prospects. We also, however, invest in companies and industries, such as semiconductors and airlines, with more cyclical orientations. These companies rely heavily on global growth and, in some cases, a constructive China relationship.
Following a year of substantial underperformance, our conviction in our portfolios has only increased. With regards to our outsized health care ownership, despite the political noise, our assessment of company-level prospects is largely unaltered. And so rather than pursue perceived security in slow-growth businesses tied to food and other staples, we continue to prefer pharmaceutical and biotech companies, particularly research-intensive enterprises with substantial upside potential. Atperiod-end, the health care sector traded at a far more attractive absolute and relative valuation (15.2x forward P/E versus its 16.3x20-year average) than its defensive sector peers, including consumer staples (19.8x versus 16.8x) and utilities (19.9x versus 14.4x).
Similarly, our airlines ownership again detracted from relative results, extending its multi-year run of underperformance. We remain optimistic, and our disproportionate exposure to the group is a distinctive portfolio differentiator. We observe a consolidated industry with above-average growth prospects, improved balance sheets, and sustainable free cash flow generation, characteristics that make the airlines increasingly indistinguishable from highly-regarded industrial sector peers. And yet the airlines industry now trades at a forward P/E multiple (8.2x) that is less than half that of the market (17.2x) and the sector (18.6x), a discount we view as more rooted in legacy investor animosity than present day economic reality.
In short, we believe our portfolios possess an attractive combination of secular growth and reasonable valuations, a view borne out through the lens of theprice/earnings-to-growth ratio, or PEG ratio. For instance, the S&P 500 atperiod-end comprised a 2020 P/E of 17.0x and an estimated3-5 year earnings growth outlook of 10.9%, equivalent to a PEG of 1.6. In contrast, each of the PRIMECAP Odyssey Funds screens more favorably. Relative to the market, the Growth Fund features both a slight valuation discount and fastermid-term earnings growth, generating a PEG of roughly 1.0. The Stock Fund is considerably less expensive with marginally slower earnings growth, resulting in a PEG of roughly 1.4. And the Aggressive Growth Fund is modestly more expensive than the market, but its earnings are expected to grow notably faster, resulting in a PEG of roughly 1.0.
7
Letter to Shareholders
PRIMECAP Odyssey Funds
continued
No single metric, of course, perfectly represents a portfolio’s inherent attractiveness, nor will any metric singularly govern relative performance. Our investment process is a fundamental,bottom-up search for stocks with long-term prospects we find to be materially better than market prices imply; a superior PEG ratio is an output of this process, not an input. Our approach to stock selection generates fund returns that will, at times, meaningfully deviate from their benchmarks, and not always in our favor. We nonetheless believe that this approach can generate superior results for shareholders over the long term.
Sincerely,
PRIMECAP Management Company
November 8, 2019
Past performance is not a guarantee of future results.
The funds invest in smaller companies, which involve additional risks such as limited liquidity and greater volatility. All funds may invest in foreign securities, which involves greater volatility and political, economic and currency risks and differences in accounting methods. Mutual fund investing involves risk, and loss of principal is possible. Growth stocks typically are more volatile than value stocks; however, value stocks have a lower expected growth rate in earnings and sales.
Please refer to the Schedule of Investments for details of fund holdings. Fund holdings and sector allocations are subject to change at any time and are not recommendations to buy or sell any security.
TheS&P 500 is a market capitalization-weighted index of 500 large-capitalization stocks commonly used to represent the U.S. equity market. TheRussell 1000 Growth Index is an index that measures the performance of those Russell 1000 companies with higherprice-to-book ratios and higher forecasted growth values (the Russell 1000 Index measures the performance of thelarge-cap segment of the U.S. equity universe). TheRussell Midcap Growth Index measures the performance of those Russell Midcap companies with higherprice-to-book ratios and higher forecasted growth values. You cannot invest directly in an index.
Earnings per share (EPS) is calculated by taking the total earnings divided by the number of shares outstanding.
Price-to-earnings ratio is calculated by dividing the current share price of a stock by its earnings per share.
Free cash flow represents the cash a company generates after cash outflows to support operations and maintain its capital assets.
The price/earnings to growth ratio (PEG ratio) is astock’s price-to-earnings (P/E) ratio divided by the growth rate of its earnings for a specified time period.
Earnings growth is not a prediction of a fund’s future performance.
The information provided herein represents the opinions of PRIMECAP Management Company and is not intended to be a forecast of future events, a guarantee of future results, or investment advice.
8
|
The following chart compares the value of a hypothetical $10,000 investment in the PRIMECAP Odyssey Stock Fund from October 31, 2009 to October 31, 2019, compared to the S&P 500. This chart illustrates the performance of a hypothetical $10,000 investment made October 31, 2009 and is not intended to imply any future performance. The returns shown do not reflect the deduction of taxes that a shareholder would pay on fund distributions or the redemption of fund shares. The chart assumes reinvestment of capital gains and dividends.
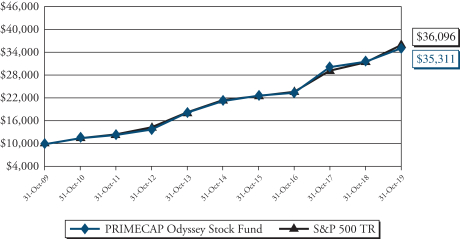
| Total Return Period Ended October 31, 2019 | ||||||||||||||||
| 1 Year | Annualized 5 Year | Annualized 10 Year | Annualized Since Inception^ | |||||||||||||
Stock Fund | 11.22% | 10.56% | 13.45% | 10.13% | ||||||||||||
S&P 500* | 14.33% | 10.78% | 13.70% | 9.05% | ||||||||||||
Performance data quoted represents past performance and does not guarantee future results. The investment return and principal value of an investment will fluctuate so that an investor’s shares, when redeemed, may be worth more or less than their original cost. Current performance of the fund may be lower or higher than the performance quoted. Performance data current to the most recent month end may be obtained by calling1-800-729-2307.
| * | The S&P 500 is a market capitalization-weighted index of 500 large-capitalization stocks commonly used to represent the U.S. equity market. |
| ^ | November 1, 2004 |
9
| Performance Graphs |
The following chart compares the value of a hypothetical $10,000 investment in the PRIMECAP Odyssey Growth Fund from October 31, 2009 to October 31, 2019, compared to the S&P 500. This chart illustrates the performance of a hypothetical $10,000 investment made October 31, 2009 and is not intended to imply any future performance. The returns shown do not reflect the deduction of taxes that a shareholder would pay on fund distributions or the redemption of fund shares. The chart assumes reinvestment of capital gains and dividends.
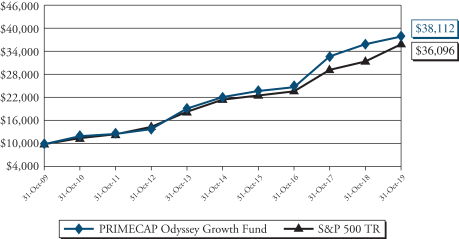
| Total Return Period Ended October 31, 2019 | ||||||||||||||||
| 1 Year | Annualized 5 Year | Annualized 10 Year | Annualized Since Inception^ | |||||||||||||
Growth Fund | 5.75% | 11.28% | 14.32% | 10.93% | ||||||||||||
S&P 500* | 14.33% | 10.78% | 13.70% | 9.05% | ||||||||||||
Performance data quoted represents past performance and does not guarantee future results. The investment return and principal value of an investment will fluctuate so that an investor’s shares, when redeemed, may be worth more or less than their original cost. Current performance of the fund may be lower or higher than the performance quoted. Performance data current to the most recent month end may be obtained by calling1-800-729-2307.
| * | The S&P 500 is a market capitalization-weighted index of 500 large-capitalization stocks commonly used to represent the U.S. equity market. |
| ^ | November 1, 2004 |
10
| Performance Graphs |
The following chart compares the value of a hypothetical $10,000 investment in the PRIMECAP Odyssey Aggressive Growth Fund from October 31, 2009 to October 31, 2019, compared to the S&P 500. This chart illustrates the performance of a hypothetical $10,000 investment made October 31, 2009 and is not intended to imply any future performance. The returns shown do not reflect the deduction of taxes that a shareholder would pay on fund distributions or the redemption of fund shares. The chart assumes reinvestment of capital gains and dividends.
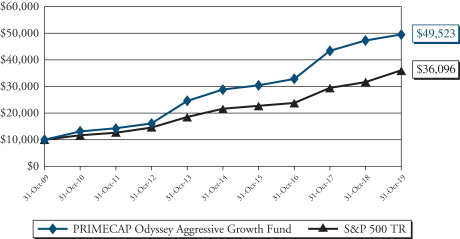
| Total Return Period Ended October 31, 2019 | ||||||||||||||||
| 1 Year | Annualized 5 Year | Annualized 10 Year | Annualized Since Inception^ | |||||||||||||
Aggressive Growth Fund | 4.71% | 11.39% | 17.35% | 12.97% | ||||||||||||
S&P 500* | 14.33% | 10.78% | 13.70% | 9.05% | ||||||||||||
Performance data quoted represents past performance and does not guarantee future results. The investment return and principal value of an investment will fluctuate so that an investor’s shares, when redeemed, may be worth more or less than their original cost. Current performance of the fund may be lower or higher than the performance quoted. Performance data current to the most recent month end may be obtained by calling1-800-729-2307.
| * | The S&P 500 is a market capitalization-weighted index of 500 large-capitalization stocks commonly used to represent the U.S. equity market. |
| ^ | November 1, 2004 |
11
| PRIMECAP Odyssey Funds |
PRIMECAP Odyssey Stock Fund
Communication Services | 1.8% | |||
Consumer Discretionary | 11.2% | |||
Consumer Staples | 0.6% | |||
Energy | 0.9% | |||
Financials | 15.3% | |||
Health Care | 20.5% | |||
Industrials | 19.6% | |||
Information Technology | 22.5% | |||
Materials | 0.9% | |||
Utilities | 0.2% | |||
Short-Term Investments and Other Assets | 6.5% | |||
Total | 100.0% |
PRIMECAP Odyssey Growth Fund
Communication Services | 3.1% | |||
Consumer Discretionary | 11.8% | |||
Consumer Staples | 0.1% | |||
Energy | 1.9% | |||
Financials | 9.0% | |||
Health Care | 29.8% | |||
Industrials | 16.5% | |||
Information Technology | 25.5% | |||
Materials | 0.3% | |||
Short-Term Investments and Other Assets | 2.0% | |||
Total | 100.0% |
The tables above list sector allocations as a percentage of each fund’s total net assets as of October 31, 2019. The management report may make reference to average allocations during the period. As a result, the sector allocations above may differ from those discussed in the management report.
12
Sector Breakdown
PRIMECAP Odyssey Funds
continued
PRIMECAP Odyssey Aggressive Growth Fund
Communication Services | 4.7% | |||
Consumer Discretionary | 14.1% | |||
Consumer Staples | 0.1% | |||
Energy | 0.6% | |||
Financials | 5.7% | |||
Health Care | 26.6% | |||
Industrials | 14.7% | |||
Information Technology | 27.3% | |||
Materials | 0.1% | |||
Preferred Stocks (Financials) | 0.5% | |||
Rights (Communication Services) | 0.0% | |||
Rights (Health Care) | 0.0% | |||
Short-Term Investments, net of Other Liabilities | 5.6% | |||
Total | 100.0% |
The table above lists sector allocations as a percentage of the fund’s total net assets as of October 31, 2019. The management report may make reference to average allocations during the period. As a result, the sector allocations above may differ from those discussed in the management report.
13
| October 31, 2019 |
| Shares | Value | |||||||
| COMMON STOCKS – 93.5% | ||||||||
| Communication Services – 1.8% | ||||||||
| 990,000 | Activision Blizzard, Inc. | $ | 55,469,700 | |||||
| 32,725 | Alphabet, Inc. – Class A (a) | 41,194,230 | ||||||
| 32,725 | Alphabet, Inc. – Class C (a) | 41,237,100 | ||||||
| 300,000 | Comcast Corp. – Class A | 13,446,000 | ||||||
| 500,000 | Entercom Communications Corp. – Class A | 1,740,000 | ||||||
| 1,295,600 | Tribune Publishing Co. | 11,608,576 | ||||||
| 168,100 | Walt Disney Co. (The) | 21,839,552 | ||||||
|
| |||||||
| 186,535,158 | ||||||||
|
| |||||||
| Consumer Discretionary – 11.2% | ||||||||
| 1,600,000 | Ascena Retail Group, Inc. (a) | 563,520 | ||||||
| 1,073,600 | CarMax, Inc. (a) | 100,027,312 | ||||||
| 2,971,650 | Carnival Corp. | 127,454,068 | ||||||
| 1,411,200 | eBay, Inc. | 49,744,800 | ||||||
| 1,174,100 | L Brands, Inc. | 20,006,664 | ||||||
| 8,295,200 | Mattel, Inc. (a) | 99,044,688 | ||||||
| 10,000 | McDonald’s Corp. | 1,967,000 | ||||||
| 1,191,800 | MGM Resorts International | 33,966,300 | ||||||
| 1,575,000 | Newell Brands, Inc. | 29,877,750 | ||||||
| 300,000 | Restaurant Brands International, Inc. | 19,632,000 | ||||||
| 1,143,900 | Ross Stores, Inc. | 125,451,513 | ||||||
| 353,100 | Royal Caribbean Cruises Ltd. | 38,427,873 | ||||||
| 3,767,000 | Sony Corp. – ADR | 229,146,610 | ||||||
| 300,000 | TJX Cos., Inc. (The) | 17,295,000 | ||||||
| 285,000 | V.F. Corp. | 23,452,650 | ||||||
| 1,543,539 | Whirlpool Corp. | 234,803,153 | ||||||
|
| |||||||
| 1,150,860,901 | ||||||||
|
| |||||||
| Consumer Staples – 0.6% | ||||||||
| 300,000 | Altria Group, Inc. | 13,437,000 | ||||||
| 200,000 | Kroger Co. (The) | 4,928,000 | ||||||
| 150,000 | Philip Morris International, Inc. | 12,216,000 | ||||||
| 370,000 | Tyson Foods, Inc. – Class A | 30,632,300 | ||||||
|
| |||||||
| 61,213,300 | ||||||||
|
| |||||||
| Energy – 0.9% | ||||||||
| 20,000 | EOG Resources, Inc. | 1,386,200 | ||||||
| 388,500 | Hess Corp. | 25,543,875 | ||||||
| 325,000 | Noble Energy, Inc. | 6,259,500 | ||||||
| 350,051 | Pioneer Natural Resources Co. | 43,063,274 | ||||||
| 100,000 | Schlumberger Ltd. | 3,269,000 | ||||||
The accompanying notes are an integral part of these financial statements.
14
Schedule of Investments
PRIMECAP Odyssey Stock Fund
October 31, 2019 –continued
| Shares | Value | |||||||
| Energy (continued) | ||||||||
| 2,200,000 | Southwestern Energy Co. (a) | $ | 4,510,000 | |||||
| 1,315,100 | Transocean Ltd. (a) | 6,246,725 | ||||||
|
| |||||||
| 90,278,574 | ||||||||
|
| |||||||
| Financials – 15.3% | ||||||||
| 4,041,400 | Bank of America Corp. | 126,374,578 | ||||||
| 2,285,600 | Charles Schwab Corp. (The) | 93,046,776 | ||||||
| 2,100,000 | Citigroup, Inc. | 150,906,000 | ||||||
| 386,163 | CME Group, Inc. | 79,453,037 | ||||||
| 3,278,800 | Discover Financial Services | 263,156,488 | ||||||
| 3,325,500 | JPMorgan Chase & Co. | 415,421,460 | ||||||
| 380,950 | Marsh & McLennan Cos., Inc. | 39,474,039 | ||||||
| 276,200 | Mercury General Corp. | 13,274,172 | ||||||
| 942,200 | Northern Trust Corp. | 93,918,496 | ||||||
| 234,400 | Progressive Corp. (The) | 16,337,680 | ||||||
| 412,000 | Raymond James Financial, Inc. | 34,397,880 | ||||||
| 4,802,408 | Wells Fargo & Co. | 247,948,325 | ||||||
|
| |||||||
| 1,573,708,931 | ||||||||
|
| |||||||
| Health Care – 20.5% | ||||||||
| 691,100 | Abbott Laboratories | 57,782,871 | ||||||
| 1,345,004 | Agilent Technologies, Inc. | 101,884,053 | ||||||
| 282,870 | Alcon, Inc. (a) | 16,765,705 | ||||||
| 778,800 | Amgen, Inc. | 166,079,100 | ||||||
| 8,642,200 | AstraZeneca PLC – ADR | 423,727,066 | ||||||
| 260,500 | Biogen, Inc. (a) | 77,813,955 | ||||||
| 667,900 | Boston Scientific Corp. (a) | 27,851,430 | ||||||
| 2,901,870 | Bristol-Myers Squibb Co. | 166,480,282 | ||||||
| 825,000 | CVS Health Corp. | 54,771,750 | ||||||
| 1,828,096 | Elanco Animal Health, Inc. (a) | 49,395,154 | ||||||
| 2,909,441 | Eli Lilly & Co. | 331,530,802 | ||||||
| 252,000 | Medtronic PLC | 27,442,800 | ||||||
| 1,100,000 | Merck & Co., Inc. | 95,326,000 | ||||||
| 1,565,650 | Novartis AG – ADR | 136,900,436 | ||||||
| 759,200 | PerkinElmer, Inc. | 65,260,832 | ||||||
| 217,956 | Roche Holding AG – CHF | 65,574,598 | ||||||
| 340,000 | Sanofi – ADR | 15,667,200 | ||||||
| 1,557,489 | Siemens Healthineers AG – EUR | 66,173,566 | ||||||
| 400,000 | Thermo Fisher Scientific, Inc. | 120,792,000 | ||||||
| 253,900 | Zimmer Biomet Holdings, Inc. | 35,096,597 | ||||||
|
| |||||||
| 2,102,316,197 | ||||||||
|
| |||||||
The accompanying notes are an integral part of these financial statements.
15
Schedule of Investments
PRIMECAP Odyssey Stock Fund
October 31, 2019 –continued
| Shares | Value | |||||||
| Industrials – 19.6% | ||||||||
| 3,894,000 | AECOM (a) | $ | 155,798,940 | |||||
| 1,513,000 | Airbus SE – EUR | 216,702,126 | ||||||
| 86,400 | Alaska Air Group, Inc. | 5,998,752 | ||||||
| 5,807,200 | American Airlines Group, Inc. | 174,564,432 | ||||||
| 45,000 | Boeing Co. (The) | 15,295,950 | ||||||
| 1,121,700 | Caterpillar, Inc. | 154,570,260 | ||||||
| 269,200 | Curtiss-Wright Corp. | 36,409,300 | ||||||
| 315,000 | Deere & Co. | 54,854,100 | ||||||
| 1,627,700 | Delta Air Lines, Inc. | 89,653,716 | ||||||
| 820,200 | FedEx Corp. | 125,211,732 | ||||||
| 65,000 | General Dynamics Corp. | 11,492,000 | ||||||
| 759,500 | Jacobs Engineering Group, Inc. | 71,074,010 | ||||||
| 175,900 | Matson, Inc. | 6,715,862 | ||||||
| 180,000 | Maxar Technologies, Inc. | 1,528,200 | ||||||
| 225,000 | Norfolk Southern Corp. | 40,950,000 | ||||||
| 127,600 | Pentair PLC | 5,291,572 | ||||||
| 30,000 | Rockwell Automation, Inc. | 5,159,700 | ||||||
| 2,106,889 | Siemens AG – EUR | 242,923,629 | ||||||
| 4,670,100 | Southwest Airlines Co. | 262,132,713 | ||||||
| 2,920,900 | United Airlines Holdings, Inc. (a) | 265,334,556 | ||||||
| 355,400 | United Parcel Service, Inc. – Class B | 40,931,418 | ||||||
| 190,762 | United Technologies Corp. | 27,389,608 | ||||||
|
| |||||||
| 2,009,982,576 | ||||||||
|
| |||||||
| Information Technology – 22.5% | ||||||||
| 356,000 | Adobe, Inc. (a) | 98,943,080 | ||||||
| 383,000 | Analog Devices, Inc. | 40,839,290 | ||||||
| 1,668,250 | Applied Materials, Inc. | 90,519,245 | ||||||
| 1,847,600 | Cisco Systems, Inc. | 87,779,476 | ||||||
| 635,898 | Corning, Inc. | 18,841,658 | ||||||
| 295,000 | Diebold Nixdorf, Inc. (a) | 2,065,000 | ||||||
| 216,398 | DXC Technology Co. | 5,987,733 | ||||||
| 11,468,486 | Flex Ltd. (a) | 134,754,711 | ||||||
| 13,747,500 | Hewlett Packard Enterprise Co. | 225,596,475 | ||||||
| 5,967,800 | HP, Inc. | 103,660,686 | ||||||
| 2,915,000 | Intel Corp. | 164,784,950 | ||||||
| 809,550 | Keysight Technologies, Inc. (a) | 81,691,690 | ||||||
| 778,700 | KLA Corp. | 131,631,448 | ||||||
| 18,457,780 | L.M. Ericsson Telephone Co. – ADR | 160,951,842 | ||||||
| 1,898,400 | Micro Focus International PLC – ADR | 26,046,048 | ||||||
| 1,505,050 | Microsoft Corp. | 215,779,018 | ||||||
The accompanying notes are an integral part of these financial statements.
16
Schedule of Investments
PRIMECAP Odyssey Stock Fund
October 31, 2019 –continued
| Shares | Value | |||||||
| Information Technology (continued) | ||||||||
| 3,100,800 | NetApp, Inc. | $ | 173,272,704 | |||||
| 8,726,000 | Nokia Corp. – ADR | 31,849,900 | ||||||
| 128,600 | NVIDIA Corp. | 25,851,172 | ||||||
| 675,000 | Oracle Corp. | 36,780,750 | ||||||
| 558,750 | PayPal Holdings, Inc. (a) | 58,165,875 | ||||||
| 90,199 | Perspecta, Inc. | 2,393,881 | ||||||
| 1,975,355 | QUALCOMM, Inc. | 158,897,556 | ||||||
| 685,000 | Teradyne, Inc. | 41,935,700 | ||||||
| 1,428,600 | Texas Instruments, Inc. | 168,560,514 | ||||||
| 131,000 | Visa, Inc. – Class A | 23,430,660 | ||||||
|
| |||||||
| 2,311,011,062 | ||||||||
|
| |||||||
| Materials – 0.9% | ||||||||
| 777,500 | Albemarle Corp. | 47,225,350 | ||||||
| 375,333 | Corteva, Inc. | 9,901,285 | ||||||
| 368,333 | Dow, Inc. | 18,597,133 | ||||||
| 341,334 | DuPont de Nemours, Inc. | 22,497,324 | ||||||
|
| |||||||
| 98,221,092 | ||||||||
|
| |||||||
| Utilities – 0.2% | ||||||||
| 365,279 | Public Service Enterprise Group, Inc. | 23,125,814 | ||||||
|
| |||||||
| | TOTAL COMMON STOCKS | $ | 9,607,253,605 | |||||
|
| |||||||
| SHORT-TERM INVESTMENTS – 5.1% | ||||||||
| 520,711,052 | Dreyfus Treasury Securities Cash Management Fund – Institutional Shares – 1.64% (b) | $ | 520,711,052 | |||||
|
| |||||||
| | TOTAL SHORT-TERM INVESTMENTS | 520,711,052 | ||||||
|
| |||||||
| | TOTAL INVESTMENTS IN SECURITIES | 10,127,964,657 | ||||||
Other Assets in Excess of Liabilities – 1.4% | 146,382,789 | |||||||
|
| |||||||
TOTAL NET ASSETS – 100.0% | $ | 10,274,347,446 | ||||||
|
| |||||||
| ADR | American Depository Receipt |
| CHF | Swiss Francs |
| EUR | Euros |
| (a) | Non-Income Producing |
| (b) | Rate quoted isseven-day yield at period end. |
The Global Industry Classification Standard (GICS®) was developed by and is the exclusive property of MSCI Inc. and Standard & Poor’s Financial Services LLC (“S&P”). GICS is a service mark of MSCI and S&P and has been licensed for use by the fund’s administrator.
The accompanying notes are an integral part of these financial statements.
17
| Schedule of Investments October 31, 2019 |
| Shares | Value | |||||||
| COMMON STOCKS – 98.0% | ||||||||
| Communication Services – 3.1% | ||||||||
| 160,000 | Activision Blizzard, Inc. | $ | 8,964,800 | |||||
| 136,767 | Alphabet, Inc. – Class A (a) | 172,162,299 | ||||||
| 100,815 | Alphabet, Inc. – Class C (a) | 127,037,990 | ||||||
| 105,000 | Comcast Corp. – Class A | 4,706,100 | ||||||
| 1,618,400 | comScore, Inc. (a) | 3,738,504 | ||||||
| 220,000 | Electronic Arts, Inc. (a) | 21,208,000 | ||||||
| 2,164,800 | IMAX Corp. (a) | 46,218,480 | ||||||
| 20,900 | Walt Disney Co. (The) | 2,715,328 | ||||||
|
| |||||||
| 386,751,501 | ||||||||
|
| |||||||
| Consumer Discretionary – 11.8% | ||||||||
| 1,557,200 | Alibaba Group Holding Ltd. – ADR (a) | 275,110,524 | ||||||
| 2,145,000 | Ascena Retail Group, Inc. (a) | 755,469 | ||||||
| 1,000,000 | Capri Holdings Ltd. (a) | 31,070,000 | ||||||
| 1,896,200 | CarMax, Inc. (a) | 176,668,954 | ||||||
| 2,689,746 | Carnival Corp. | 115,363,206 | ||||||
| 260,000 | eBay, Inc. | 9,165,000 | ||||||
| 331,500 | Gildan Activewear, Inc. | 8,463,195 | ||||||
| 105,000 | Hilton Worldwide Holdings, Inc. | 10,180,800 | ||||||
| 2,582,100 | iRobot Corp. (a) (b) | 124,095,726 | ||||||
| 1,838,498 | L Brands, Inc. | 31,328,006 | ||||||
| 100,000 | Las Vegas Sands Corp. | 6,184,000 | ||||||
| 100,000 | Marriott International, Inc. – Class A | 12,655,000 | ||||||
| 5,658,100 | Mattel, Inc. (a) | 67,557,714 | ||||||
| 1,758,000 | MGM Resorts International | 50,103,000 | ||||||
| 1,744,700 | Norwegian Cruise Line Holdings Ltd. (a) | 88,560,972 | ||||||
| 85,000 | Ross Stores, Inc. | 9,321,950 | ||||||
| 1,680,471 | Royal Caribbean Cruises Ltd. | 182,885,659 | ||||||
| 3,287,800 | Sony Corp. – ADR | 199,996,874 | ||||||
| 110,900 | Tesla, Inc. (a) | 34,924,628 | ||||||
| 252,000 | TJX Cos., Inc. (The) | 14,527,800 | ||||||
| 44,000 | Ulta Beauty, Inc. (a) | 10,258,600 | ||||||
|
| |||||||
| 1,459,177,077 | ||||||||
|
| |||||||
| Consumer Staples – 0.1% | ||||||||
| 200,000 | Altria Group, Inc. | 8,958,000 | ||||||
| 20,000 | BJ’s Wholesale Club Holdings, Inc. (a) | 534,000 | ||||||
|
| |||||||
| 9,492,000 | ||||||||
|
| |||||||
The accompanying notes are an integral part of these financial statements.
18
Schedule of Investments
PRIMECAP Odyssey Growth Fund
October 31, 2019 –continued
| Shares | Value | |||||||
| Energy – 1.9% | ||||||||
| 825,000 | Cabot Oil & Gas Corp. | $ | 15,378,000 | |||||
| 14,700 | EOG Resources, Inc. | 1,018,857 | ||||||
| 905,521 | Hess Corp. | 59,538,006 | ||||||
| 250,000 | Noble Energy, Inc. | 4,815,000 | ||||||
| 808,600 | Pioneer Natural Resources Co. | 99,473,972 | ||||||
| 3,000,000 | Southwestern Energy Co. (a) | 6,150,000 | ||||||
| 9,465,404 | Transocean Ltd. (a) | 44,960,669 | ||||||
|
| |||||||
| 231,334,504 | ||||||||
|
| |||||||
| Financials – 9.0% | ||||||||
| 725,000 | Bank of America Corp. | 22,670,750 | ||||||
| 380,000 | Cboe Global Markets, Inc. | 43,757,000 | ||||||
| 1,976,423 | Charles Schwab Corp. (The) | 80,460,180 | ||||||
| 589,300 | Citigroup, Inc. | 42,347,098 | ||||||
| 120,000 | CME Group, Inc. | 24,690,000 | ||||||
| 1,360,000 | Discover Financial Services | 109,153,600 | ||||||
| 5,165,400 | E*TRADE Financial Corp. | 215,862,066 | ||||||
| 1,520,500 | JPMorgan Chase & Co. | 189,940,860 | ||||||
| 381,850 | Marsh & McLennan Cos., Inc. | 39,567,297 | ||||||
| 632,300 | Northern Trust Corp. | 63,027,664 | ||||||
| 160,000 | Progressive Corp. (The) | 11,152,000 | ||||||
| 671,000 | Raymond James Financial, Inc. | 56,021,790 | ||||||
| 4,103,400 | Wells Fargo & Co. | 211,858,542 | ||||||
|
| |||||||
| 1,110,508,847 | ||||||||
|
| |||||||
| Health Care – 29.8% | ||||||||
| 760,718 | Abbott Laboratories | 63,603,632 | ||||||
| 1,581,850 | ABIOMED, Inc. (a) | 328,360,423 | ||||||
| 2,250,895 | Accuray, Inc. (a) | 5,852,327 | ||||||
| 411,300 | Agilent Technologies, Inc. | 31,155,975 | ||||||
| 235,787 | Alcon, Inc. (a) | 13,975,095 | ||||||
| 6,509,055 | Alkermes PLC (a) | 127,121,844 | ||||||
| 1,084,400 | Amgen, Inc. | 231,248,300 | ||||||
| 613,300 | Arena Pharmaceuticals, Inc. (a) | 29,876,910 | ||||||
| 4,203,700 | AstraZeneca PLC – ADR | 206,107,411 | ||||||
| 465,000 | BeiGene Ltd. – ADR (a) | 64,328,100 | ||||||
| 2,409,800 | BeiGene Ltd. – HKD (a) | 25,648,112 | ||||||
| 416,150 | Biogen, Inc. (a) | 124,308,167 | ||||||
| 1,846,896 | BioMarin Pharmaceutical, Inc. (a) | 135,211,256 | ||||||
| 1,444,600 | Boston Scientific Corp. (a) | 60,239,820 | ||||||
| 2,774,000 | Bristol-Myers Squibb Co. | 159,144,380 | ||||||
The accompanying notes are an integral part of these financial statements.
19
Schedule of Investments
PRIMECAP Odyssey Growth Fund
October 31, 2019 –continued
| Shares | Value | |||||||
| Health Care (continued) | ||||||||
| 373,000 | CVS Health Corp. | $ | 24,763,470 | |||||
| 2,890,944 | Elanco Animal Health, Inc. (a) | 78,113,307 | ||||||
| 2,920,026 | Eli Lilly & Co. | 332,736,963 | ||||||
| 4,136,543 | Epizyme, Inc. (a) | 47,611,610 | ||||||
| 284,900 | Illumina, Inc. (a) | 84,193,648 | ||||||
| 2,400,000 | ImmunoGen, Inc. (a) | 5,712,000 | ||||||
| 1,984,441 | Insulet Corp. (a) | 288,378,966 | ||||||
| 133,700 | LivaNova PLC (a) | 9,456,601 | ||||||
| 127,700 | Medtronic PLC | 13,906,530 | ||||||
| 392,900 | Merck & Co., Inc. | 34,048,714 | ||||||
| 573,500 | Momenta Pharmaceuticals, Inc. (a) | 8,877,780 | ||||||
| 6,818,158 | Nektar Therapeutics (a) | 116,760,956 | ||||||
| 1,782,936 | Novartis AG – ADR | 155,899,924 | ||||||
| 196,400 | NuVasive, Inc. (a) | 13,854,056 | ||||||
| 589,300 | OraSure Technologies, Inc. (a) | 5,032,622 | ||||||
| 375,000 | PerkinElmer, Inc. | 32,235,000 | ||||||
| 2,691,443 | QIAGEN N.V. (a) | 80,231,916 | ||||||
| 174,923 | Roche Holding AG – CHF | 52,627,619 | ||||||
| 4,943,300 | Seattle Genetics, Inc. (a) | 530,910,420 | ||||||
| 202,200 | Siemens Healthineers AG – EUR | 8,590,940 | ||||||
| 273,400 | Thermo Fisher Scientific, Inc. | 82,561,332 | ||||||
| 21,970 | Waters Corp. (a) | 4,649,291 | ||||||
| 864,400 | Xencor, Inc. (a) | 29,571,124 | ||||||
| 268,100 | Zimmer Biomet Holdings, Inc. | 37,059,463 | ||||||
|
| |||||||
| 3,683,966,004 | ||||||||
|
| |||||||
| Industrials – 16.5% | ||||||||
| 5,280,022 | AECOM (a) | 211,253,680 | ||||||
| 721,600 | Airbus SE – EUR | 103,352,448 | ||||||
| 7,326,801 | American Airlines Group, Inc. | 220,243,638 | ||||||
| 420,600 | Caterpillar, Inc. | 57,958,680 | ||||||
| 140,000 | CIRCOR International, Inc. (a) | 5,360,600 | ||||||
| 346,000 | Colfax Corp. (a) | 11,625,600 | ||||||
| 334,600 | Curtiss-Wright Corp. | 45,254,650 | ||||||
| 1,982,300 | Delta Air Lines, Inc. | 109,185,084 | ||||||
| 191,400 | FedEx Corp. | 29,219,124 | ||||||
| 255,000 | General Dynamics Corp. | 45,084,000 | ||||||
| 122,000 | IDEX Corp. | 18,974,660 | ||||||
| 1,412,694 | Jacobs Engineering Group, Inc. | 132,199,905 | ||||||
| 3,852,650 | JetBlue Airways Corp. (a) | 74,356,145 | ||||||
The accompanying notes are an integral part of these financial statements.
20
Schedule of Investments
PRIMECAP Odyssey Growth Fund
October 31, 2019 –continued
| Shares | Value | |||||||
| Industrials (continued) | ||||||||
| 135,100 | Lyft, Inc. – Class A (a) | $ | 5,598,544 | |||||
| 2,062,270 | Siemens AG – EUR | 237,779,073 | ||||||
| 4,697,700 | Southwest Airlines Co. | 263,681,901 | ||||||
| 755,000 | Textron, Inc. | 34,797,950 | ||||||
| 4,762,000 | United Airlines Holdings, Inc. (a) | 432,580,080 | ||||||
|
| |||||||
| 2,038,505,762 | ||||||||
|
| |||||||
| Information Technology – 25.5% | ||||||||
| 742,400 | Adobe, Inc. (a) | 206,335,232 | ||||||
| 826,300 | Altair Engineering, Inc. – Class A (a) | 30,465,681 | ||||||
| 439,800 | Analog Devices, Inc. | 46,895,874 | ||||||
| 546,700 | Applied Materials, Inc. | 29,663,942 | ||||||
| 195,707 | ASML Holding N.V. – ADR | 51,269,363 | ||||||
| 16,982,043 | BlackBerry Ltd. (a) | 89,325,546 | ||||||
| 164,875 | Cerence, Inc. (a) | 2,555,562 | ||||||
| 1,474,800 | Cisco Systems, Inc. | 70,067,748 | ||||||
| 1,702,400 | Cree, Inc. (a) | 81,255,552 | ||||||
| 60,000 | Dell Technologies, Inc. – Class C (a) | 3,173,400 | ||||||
| 1,382,500 | Descartes Systems Group, Inc. (The) (a) | 53,793,075 | ||||||
| 13,468,229 | Flex Ltd. (a) | 158,251,691 | ||||||
| 524,718 | FormFactor, Inc. (a) | 11,454,594 | ||||||
| 7,186,900 | Hewlett Packard Enterprise Co. | 117,937,029 | ||||||
| 1,656,836 | HP, Inc. | 28,779,241 | ||||||
| 1,585,800 | Intel Corp. | 89,645,274 | ||||||
| 925,000 | Jabil, Inc. | 34,058,500 | ||||||
| 386,250 | Keysight Technologies, Inc. (a) | 38,976,488 | ||||||
| 667,424 | KLA Corp. | 112,821,353 | ||||||
| 8,044,200 | L.M. Ericsson Telephone Co. – ADR | 70,145,424 | ||||||
| 700,000 | MaxLinear, Inc. (a) | 13,272,000 | ||||||
| 900,000 | Micro Focus International PLC – ADR | 12,348,000 | ||||||
| 5,840,000 | Micron Technology, Inc. (a) | 277,692,000 | ||||||
| 1,457,000 | Microsoft Corp. | 208,890,090 | ||||||
| 3,203,111 | NetApp, Inc. | 178,989,843 | ||||||
| 800,000 | Nokia Corp. – ADR | 2,920,000 | ||||||
| 1,319,000 | Nuance Communications, Inc. (a) | 21,526,080 | ||||||
| 284,400 | NVIDIA Corp. | 57,170,088 | ||||||
| 370,000 | Oracle Corp. | 20,161,300 | ||||||
| 44,001 | Palo Alto Networks, Inc. (a) | 10,005,387 | ||||||
| 1,974,730 | QUALCOMM, Inc. | 158,847,281 | ||||||
| 1,955,000 | Splunk, Inc. (a) | 234,521,800 | ||||||
The accompanying notes are an integral part of these financial statements.
21
Schedule of Investments
PRIMECAP Odyssey Growth Fund
October 31, 2019 –continued
| Shares | Value | |||||||
| Information Technology (continued) | ||||||||
| 4,696,900 | Stratasys Ltd. (a) (b) | $ | 97,131,892 | |||||
| 80,000 | Teradyne, Inc. | 4,897,600 | ||||||
| 1,503,795 | Texas Instruments, Inc. | 177,432,772 | ||||||
| 1,068,200 | Trimble, Inc. (a) | 42,557,088 | ||||||
| 1,000,000 | Universal Display Corp. | 200,180,000 | ||||||
| 341,500 | Visa, Inc. – Class A | 61,080,690 | ||||||
| 250,000 | VMware, Inc. – Class A | 39,567,500 | ||||||
| 274,900 | Western Digital Corp. | 14,198,585 | ||||||
|
| |||||||
| 3,160,260,565 | ||||||||
|
| |||||||
| Materials – 0.3% | ||||||||
| 591,600 | Albemarle Corp. | 35,933,784 | ||||||
|
| |||||||
| | TOTAL COMMON STOCKS | $ | 12,115,930,044 | |||||
|
| |||||||
| SHORT-TERM INVESTMENTS – 2.0% | ||||||||
| 246,502,463 | Dreyfus Treasury Securities Cash Management Fund – Institutional Shares – 1.64% (c) | $ | 246,502,463 | |||||
|
| |||||||
| | TOTAL SHORT-TERM INVESTMENTS | 246,502,463 | ||||||
|
| |||||||
| | TOTAL INVESTMENTS IN SECURITIES | 12,362,432,507 | ||||||
Other Assets in Excess of Liabilities – 0.0% | 3,167,724 | |||||||
|
| |||||||
TOTAL NET ASSETS – 100.0% | $ | 12,365,600,231 | ||||||
|
| |||||||
| ADR | American Depository Receipt |
| CHF | Swiss Francs |
| EUR | Euros |
| HKD | Hong Kong Dollars |
| (a) | Non-Income Producing |
| (b) | Considered an affiliated company of the fund as the fund owns 5% or more of the outstanding voting securities of such company. (Note 7) |
| (c) | Rate quoted isseven-day yield at period end. |
The Global Industry Classification Standard (GICS®) was developed by and is the exclusive property of MSCI Inc. and Standard & Poor’s Financial Services LLC (“S&P”). GICS is a service mark of MSCI and S&P and has been licensed for use by the fund’s administrator.
The accompanying notes are an integral part of these financial statements.
22
| Schedule of Investments PRIMECAP Odyssey Aggressive Growth Fund October 31, 2019 |
| Shares | Value | |||||||
| COMMON STOCKS – 93.9% | ||||||||
| Communication Services – 4.7% | ||||||||
| 84,120 | Alphabet, Inc. – Class A (a) | $ | 105,890,256 | |||||
| 84,469 | Alphabet, Inc. – Class C (a) | 106,440,231 | ||||||
| 630,962 | ANGI Homeservices, Inc. – Class A (a) | 4,322,090 | ||||||
| 5,572,060 | comScore, Inc. (a) (b) | 12,871,459 | ||||||
| 6,450,000 | DHX Media Ltd. – CAD (a) | 9,304,533 | ||||||
| 125,000 | Electronic Arts, Inc. (a) | 12,050,000 | ||||||
| 3,055,700 | IMAX Corp. (a) | 65,239,195 | ||||||
| 1,792,886 | Lions Gate Entertainment Corp. – Class A (a) | 14,325,159 | ||||||
| 2,746,300 | Lions Gate Entertainment Corp. – Class B (a) | 20,569,787 | ||||||
| 5,500 | Netflix, Inc. (a) | 1,580,755 | ||||||
| 150,300 | Pinterest, Inc. – Class A (a) | 3,778,542 | ||||||
| 16,430,000 | Sprint Corp. (a) | 102,030,300 | ||||||
| 17,200 | T-Mobile US, Inc. (a) | 1,421,752 | ||||||
| 871,501 | Tribune Publishing Co. | 7,808,649 | ||||||
|
| |||||||
| 467,632,708 | ||||||||
|
| |||||||
| Consumer Discretionary – 14.1% | ||||||||
| 1,003,700 | Alibaba Group Holding Ltd. – ADR (a) | 177,323,679 | ||||||
| 5,300 | Amazon.com, Inc. (a) | 9,416,298 | ||||||
| 2,248,000 | Ascena Retail Group, Inc. (a) | 791,745 | ||||||
| 31,000 | At Home Group, Inc. (a) | 264,120 | ||||||
| 540,000 | Boot Barn Holdings, Inc. (a) | 18,927,000 | ||||||
| 17,600 | Burlington Stores, Inc. (a) | 3,382,192 | ||||||
| 85,800 | Camping World Holdings, Inc. – Class A | 810,810 | ||||||
| 1,341,100 | CarMax, Inc. (a) | 124,950,287 | ||||||
| 5,862,300 | Chegg, Inc. (a) | 179,738,118 | ||||||
| 442,800 | eBay, Inc. | 15,608,700 | ||||||
| 6,300 | Five Below, Inc. (a) | 788,193 | ||||||
| 265,000 | Gildan Activewear, Inc. | 6,765,450 | ||||||
| 96,000 | Habit Restaurants, Inc. (The) – Class A (a) | 1,008,960 | ||||||
| 1,342,700 | iRobot Corp. (a) | 64,530,162 | ||||||
| 1,387,200 | Norwegian Cruise Line Holdings Ltd. (a) | 70,414,272 | ||||||
| 1,045,000 | OneSpaWorld Holdings Ltd. (a) | 16,249,750 | ||||||
| 23,200 | Restaurant Brands International, Inc. | 1,518,208 | ||||||
| 1,642,000 | Royal Caribbean Cruises Ltd. | 178,698,860 | ||||||
| 333,600 | Rubicon Project, Inc. (The) (a) | 2,835,600 | ||||||
| 6,887,600 | Sony Corp. – ADR | 418,972,708 | ||||||
| 254,190 | Tesla, Inc. (a) | 80,049,515 | ||||||
| 1,509,000 | Tuesday Morning Corp. (a) | 2,052,240 | ||||||
The accompanying notes are an integral part of these financial statements.
23
Schedule of Investments
PRIMECAP Odyssey Aggressive Growth Fund
October 31, 2019 –continued
| Shares | Value | |||||||
| Consumer Discretionary (continued) | ||||||||
| 74,200 | Ulta Beauty, Inc. (a) | $ | 17,299,730 | |||||
|
| |||||||
| 1,392,396,597 | ||||||||
|
| |||||||
| Consumer Staples – 0.1% | ||||||||
| 97,300 | Calavo Growers, Inc. | 8,438,829 | ||||||
|
| |||||||
| Energy – 0.6% | ||||||||
| 587,850 | Cabot Oil & Gas Corp. | 10,957,524 | ||||||
| 40,000 | EOG Resources, Inc. | 2,772,400 | ||||||
| 8,873,882 | Transocean Ltd. (a) | 42,150,940 | ||||||
|
| |||||||
| 55,880,864 | ||||||||
|
| |||||||
| Financials – 5.7% | ||||||||
| 150,500 | Cboe Global Markets, Inc. | 17,330,075 | ||||||
| 246,271 | CME Group, Inc. | 50,670,258 | ||||||
| 717,203 | Discover Financial Services | 57,562,713 | ||||||
| 2,562,166 | E*TRADE Financial Corp. | 107,072,917 | ||||||
| 654,520 | MarketAxess Holdings, Inc. | 241,249,527 | ||||||
| 2,279,449 | NMI Holdings, Inc. – Class A (a) | 66,673,883 | ||||||
| 151,000 | Progressive Corp. (The) | 10,524,700 | ||||||
| 140,600 | Tradeweb Markets, Inc. – Class A | 5,870,050 | ||||||
|
| |||||||
| 556,954,123 | ||||||||
|
| |||||||
| Health Care – 26.6% | ||||||||
| 648,700 | Abbott Laboratories | 54,237,807 | ||||||
| 1,208,873 | ABIOMED, Inc. (a) | 250,937,857 | ||||||
| 1,653,000 | Accuray, Inc. (a) | 4,297,800 | ||||||
| 5,480,222 | Alkermes PLC (a) | 107,028,736 | ||||||
| 2,292,000 | Amicus Therapeutics, Inc. (a) | 19,321,560 | ||||||
| 600,000 | Arbutus Biopharma Corp. (a) | 852,000 | ||||||
| 567,375 | Arena Pharmaceuticals, Inc. (a) | 27,639,673 | ||||||
| 103,000 | Axovant Gene Therapies Ltd. (a) | 636,540 | ||||||
| 341,647 | BeiGene Ltd. – ADR (a) | 47,263,446 | ||||||
| 1,476,800 | BeiGene Ltd. – HKD (a) | 15,717,956 | ||||||
| 275,550 | Biogen, Inc. (a) | 82,309,541 | ||||||
| 1,545,900 | BioMarin Pharmaceutical, Inc. (a) | 113,175,339 | ||||||
| 896,376 | BioNTech SE – ADR (a) | 15,077,044 | ||||||
| 346,500 | Boston Scientific Corp. (a) | 14,449,050 | ||||||
| 11,300,000 | Cerus Corp. (a) (b) | 49,155,000 | ||||||
| 17,000 | Charles River Laboratories International, Inc. (a) | 2,209,660 | ||||||
| 507,040 | Dextera Surgical, Inc. (a) (c) (d) | 0 | ||||||
| 761,692 | Elanco Animal Health, Inc. (a) | 20,580,918 | ||||||
The accompanying notes are an integral part of these financial statements.
24
Schedule of Investments
PRIMECAP Odyssey Aggressive Growth Fund
October 31, 2019 –continued
| Shares | Value | |||||||
| Health Care (continued) | ||||||||
| 1,383,089 | Eli Lilly & Co. | $ | 157,602,992 | |||||
| 7,252,214 | Epizyme, Inc. (a) (b) | 83,472,983 | ||||||
| 1,329,900 | Exact Sciences Corp. (a) | 115,701,300 | ||||||
| 4,651,532 | Fluidigm Corp. (a) (b) | 22,885,537 | ||||||
| 215,700 | Glaukos Corp. (a) | 13,768,131 | ||||||
| 13,000 | Illumina, Inc. (a) | 3,841,760 | ||||||
| 325,000 | ImmunoGen, Inc. (a) | 773,500 | ||||||
| 1,533,556 | Insulet Corp. (a) | 222,856,358 | ||||||
| 367,028 | LivaNova PLC (a) | 25,959,890 | ||||||
| 483,487 | Mereo Biopharma Group PLC – ADR (a) | 1,402,112 | ||||||
| 1,804,583 | Momenta Pharmaceuticals, Inc. (a) | 27,934,945 | ||||||
| 296,726 | MyoKardia, Inc. (a) | 17,011,302 | ||||||
| 11,037,376 | Nektar Therapeutics (a) (b) | 189,015,064 | ||||||
| 490,000 | NuVasive, Inc. (a) | 34,564,600 | ||||||
| 990,000 | OraSure Technologies, Inc. (a) | 8,454,600 | ||||||
| 19,500 | Penumbra, Inc. (a) | 3,041,415 | ||||||
| 3,098,800 | Pfenex, Inc. (a) (b) | 28,570,936 | ||||||
| 3,503,221 | QIAGEN N.V. (a) | 104,431,018 | ||||||
| 1,462,312 | Rhythm Pharmaceuticals, Inc. (a) | 31,176,492 | ||||||
| 182,600 | Roche Holding AG – CHF | 54,937,334 | ||||||
| 3,570,500 | Seattle Genetics, Inc. (a) | 383,471,700 | ||||||
| 9,656,300 | Spectrum Pharmaceuticals, Inc. (a) (b) | 74,932,888 | ||||||
| 973,726 | Wave Life Sciences Ltd. (a) | 24,625,531 | ||||||
| 4,894,182 | Xencor, Inc. (a) (b) | 167,429,966 | ||||||
|
| |||||||
| 2,622,752,281 | ||||||||
|
| |||||||
| Industrials – 14.7% | ||||||||
| 2,268,500 | AECOM (a) | 90,762,685 | ||||||
| 774,000 | Alaska Air Group, Inc. | 53,738,820 | ||||||
| 9,100 | Allegiant Travel Co. | 1,522,703 | ||||||
| 8,237,400 | American Airlines Group, Inc. | 247,616,244 | ||||||
| 392,000 | Axon Enterprise, Inc. (a) | 20,042,960 | ||||||
| 70,600 | Bloom Energy Corp. – Class A (a) | 216,036 | ||||||
| 40,000 | CIRCOR International, Inc. (a) | 1,531,600 | ||||||
| 41,000 | Controladora Vuela Compania de Aviacion, S.A.B. de C.V. – ADR (a) | 444,440 | ||||||
| 340,000 | Cornerstone Building Brands, Inc. (a) | 2,125,000 | ||||||
| 224,200 | Curtiss-Wright Corp. | 30,323,050 | ||||||
| 4,081,700 | Delta Air Lines, Inc. | 224,820,036 | ||||||
| 9,900 | FedEx Corp. | 1,511,334 | ||||||
The accompanying notes are an integral part of these financial statements.
25
Schedule of Investments
PRIMECAP Odyssey Aggressive Growth Fund
October 31, 2019 –continued
| Shares | Value | |||||||
| Industrials (continued) | ||||||||
| 205,300 | Gibraltar Industries, Inc. (a) | $ | 10,928,119 | |||||
| 781,200 | Hawaiian Holdings, Inc. | 22,350,132 | ||||||
| 1,153,600 | Jacobs Engineering Group, Inc. | 107,953,888 | ||||||
| 8,184,225 | JetBlue Airways Corp. (a) | 157,955,542 | ||||||
| 41,000 | Lyft, Inc. – Class A (a) | 1,699,040 | ||||||
| 4,170,000 | NN, Inc. (b) | 30,107,400 | ||||||
| 25,000 | Old Dominion Freight Line, Inc. | 4,552,000 | ||||||
| 15,800 | Ryanair Holdings PLC – ADR (a) | 1,179,312 | ||||||
| 1,466,900 | Southwest Airlines Co. | 82,337,097 | ||||||
| 441,400 | Spirit Airlines, Inc. (a) | 16,578,984 | ||||||
| 8,500 | TransDigm Group, Inc. | 4,473,380 | ||||||
| 3,626,450 | United Airlines Holdings, Inc. (a) | 329,426,718 | ||||||
| 189,600 | WillScot Corp. (a) | 2,988,096 | ||||||
|
| |||||||
| 1,447,184,616 | ||||||||
|
| |||||||
| Information Technology – 27.3% | ||||||||
| 1,222,700 | 2U, Inc. (a) | 21,916,897 | ||||||
| 597,200 | Adobe, Inc. (a) | 165,979,796 | ||||||
| 1,500 | Arista Networks, Inc. (a) | 366,855 | ||||||
| 2,038,700 | Arlo Technologies, Inc. (a) | 6,951,967 | ||||||
| 95,300 | ASML Holding N.V. – ADR | 24,965,741 | ||||||
| 2,511,500 | Axcelis Technologies, Inc. (a) (b) | 48,145,455 | ||||||
| 23,472,518 | BlackBerry Ltd. (a) | 123,465,445 | ||||||
| 253,625 | Cerence, Inc. (a) | 3,931,187 | ||||||
| 250,000 | Corning, Inc. | 7,407,500 | ||||||
| 1,780,100 | Cree, Inc. (a) | 84,964,173 | ||||||
| 15,399 | CrowdStrike Holdings, Inc. – Class A (a) | 768,564 | ||||||
| 26,400 | CyberArk Software Ltd. (a) | 2,681,712 | ||||||
| 100,000 | Dell Technologies, Inc. – Class C (a) | 5,289,000 | ||||||
| 1,400,000 | Descartes Systems Group, Inc. (The) (a) | 54,474,000 | ||||||
| 355,000 | Digimarc Corp. (a) | 12,638,000 | ||||||
| 43,000 | DXC Technology Co. | 1,189,810 | ||||||
| 924,539 | FARO Technologies, Inc. (a) (b) | 44,082,019 | ||||||
| 10,571,200 | Flex Ltd. (a) | 124,211,600 | ||||||
| 770,250 | ForeScout Technologies, Inc. (a) | 23,692,890 | ||||||
| 1,109,300 | FormFactor, Inc. (a) | 24,216,019 | ||||||
| 1,290,000 | Hewlett Packard Enterprise Co. | 21,168,900 | ||||||
| 540,000 | HP, Inc. | 9,379,800 | ||||||
| 441,750 | HubSpot, Inc. (a) | 68,515,425 | ||||||
| 145,000 | Intuit, Inc. | 37,337,500 | ||||||
The accompanying notes are an integral part of these financial statements.
26
Schedule of Investments
PRIMECAP Odyssey Aggressive Growth Fund
October 31, 2019 –continued
| Shares | Value | |||||||
| Information Technology (continued) | ||||||||
| 750,000 | Jabil, Inc. | $ | 27,615,000 | |||||
| 185,900 | Keysight Technologies, Inc. (a) | 18,759,169 | ||||||
| 77,639 | Keywords Studios PLC – GBP | 1,116,326 | ||||||
| 764,400 | KLA Corp. | 129,214,176 | ||||||
| 145,000 | MACOM Technology Solutions Holdings, Inc. (a) | 3,297,300 | ||||||
| 668,500 | Materialise NV – ADR (a) | 12,761,665 | ||||||
| 2,663,861 | MaxLinear, Inc. (a) | 50,506,805 | ||||||
| 267,336 | Micro Focus International PLC – ADR | 3,667,850 | ||||||
| 6,740,200 | Micron Technology, Inc. (a) | 320,496,510 | ||||||
| 2,132,467 | NetApp, Inc. | 119,162,256 | ||||||
| 598,250 | nLIGHT, Inc. (a) | 7,992,620 | ||||||
| 2,029,000 | Nuance Communications, Inc. (a) | 33,113,280 | ||||||
| 163,000 | Nutanix, Inc. – Class A (a) | 4,762,860 | ||||||
| 229,100 | NVIDIA Corp. | 46,053,682 | ||||||
| 213,000 | OSI Systems, Inc. (a) | 21,138,120 | ||||||
| 73,000 | Palo Alto Networks, Inc. (a) | 16,599,470 | ||||||
| 20,616 | Perspecta, Inc. | 547,149 | ||||||
| 336,900 | Pivotal Software, Inc. – Class A (a) | 5,043,393 | ||||||
| 270,300 | Pluralsight, Inc. – Class A (a) | 4,887,024 | ||||||
| 3,092,100 | PROS Holdings, Inc. (a) (b) | 158,439,204 | ||||||
| 1,548,340 | QUALCOMM, Inc. | 124,548,470 | ||||||
| 53,000 | Rapid7, Inc. (a) | 2,654,770 | ||||||
| 8,813,000 | ServiceSource International, Inc. (a) (b) | 11,016,250 | ||||||
| 2,222,000 | Splunk, Inc. (a) | 266,551,120 | ||||||
| 2,398,800 | Stratasys Ltd. (a) | 49,607,184 | ||||||
| 830,000 | Trimble, Inc. (a) | 33,067,200 | ||||||
| 1,281,431 | Universal Display Corp. | 256,516,858 | ||||||
| 260,000 | VMware, Inc. – Class A | 41,150,200 | ||||||
| 16,500 | Western Digital Corp. | 852,225 | ||||||
| 1,400 | Zoom Video Communications, Inc. – Class A (a) | 97,846 | ||||||
|
| |||||||
| 2,688,976,237 | ||||||||
|
| |||||||
| Materials – 0.1% | ||||||||
| 116,300 | Albemarle Corp. | 7,064,062 | ||||||
| 9,800 | Ingevity Corp. (a) | 825,258 | ||||||
| 2,071,654 | Marrone Bio Innovations, Inc. (a) | 2,734,583 | ||||||
|
| |||||||
| 10,623,903 | ||||||||
|
| |||||||
| | TOTAL COMMON STOCKS | $ | 9,250,840,158 | |||||
|
| |||||||
The accompanying notes are an integral part of these financial statements.
27
Schedule of Investments
PRIMECAP Odyssey Aggressive Growth Fund
October 31, 2019 –continued
| Shares | Value | |||||||
| PREFERRED STOCKS – 0.5% | ||||||||
| Financials – 0.5% | ||||||||
| 1,756,376 | Fannie MaeFixed-to-Floating RateNon-Cumulative Preferred Stock Series S, Perpetual Maturity 7.750% (a) | $ | 20,584,727 | |||||
| 2,503,400 | Freddie MacFixed-to-Floating RateNon-Cumulative Preferred Stock Series Z, Perpetual Maturity 7.875% (a) | 29,039,440 | ||||||
|
| |||||||
| 49,624,167 | ||||||||
|
| |||||||
| | TOTAL PREFERRED STOCKS | 49,624,167 | ||||||
|
| |||||||
| RIGHTS – 0.0% | ||||||||
| Communication Services – 0.0% | ||||||||
| 6,350,000 | DHX Media Ltd. – CAD (a) | 409,802 | ||||||
|
| |||||||
| Health Care – 0.0% | ||||||||
| 3,786,300 | Mereo BioPharma Group PLC – CVR | 0 | ||||||
| 3,786,300 | Mereo BioPharma Group PLC – CVR | 0 | ||||||
|
| |||||||
| 0 | ||||||||
|
| |||||||
| | TOTAL RIGHTS | 409,802 | ||||||
|
| |||||||
| SHORT-TERM INVESTMENTS – 5.7% | ||||||||
| 564,921,413 | Dreyfus Treasury Securities Cash Management Fund – Institutional Shares – 1.64% (e) | $ | 564,921,413 | |||||
|
| |||||||
| | TOTAL SHORT-TERM INVESTMENTS | 564,921,413 | ||||||
|
| |||||||
| | TOTAL INVESTMENTS IN SECURITIES | 9,865,795,540 | ||||||
Liabilities in Excess of Other Assets – (0.1)% | (14,429,789 | ) | ||||||
|
| |||||||
TOTAL NET ASSETS – 100.0% | $ | 9,851,365,751 | ||||||
|
| |||||||
| ADR | American Depository Receipt |
| CAD | Canadian Dollars |
| CHF | Swiss Francs |
| CVR | Contingent Value Rights |
| GBP | British Pound Sterling |
| HKD | Hong Kong Dollars |
| (a) | Non-Income Producing |
The accompanying notes are an integral part of these financial statements.
28
Schedule of Investments
PRIMECAP Odyssey Aggressive Growth Fund
October 31, 2019 –continued
| (b) | Considered an affiliated company of the fund as the fund owns 5% or more of the outstanding voting securities of such company. (Note 7) |
| (c) | Fair-valued security (Note 4) |
| (d) | Illiquid security |
| (e) | Rate quoted isseven-day yield at period end. |
The Global Industry Classification Standard (GICS®) was developed by and is the exclusive property of MSCI Inc. and Standard & Poor’s Financial Services LLC (“S&P”). GICS is a service mark of MSCI and S&P and has been licensed for use by the fund’s administrator.
The accompanying notes are an integral part of these financial statements.
29
| Statements of Assets and Liabilities PRIMECAP Odyssey Funds October 31, 2019 |
| PRIMECAP Odyssey Stock Fund | PRIMECAP Odyssey Growth Fund | PRIMECAP Odyssey Aggressive Growth Fund | ||||||||||
ASSETS | ||||||||||||
Investments, at cost (unaffiliated) | $ | 6,991,467,642 | $ | 7,671,934,434 | $ | 5,209,600,808 | ||||||
|
|
|
|
|
| |||||||
Investments, at cost (affiliated) | — | 280,359,453 | 1,015,325,919 | |||||||||
|
|
|
|
|
| |||||||
Investments, at value (unaffiliated) | 10,127,964,657 | 12,141,204,889 | 8,945,671,379 | |||||||||
Investments, at value (affiliated) | — | 221,227,618 | 920,124,161 | |||||||||
Receivable for investments sold | 33,413 | 21,035,444 | 4,470,852 | |||||||||
Receivable for dividends and interest | 13,184,684 | 11,294,391 | 5,283,195 | |||||||||
Receivable for fund shares sold | 160,853,021 | 9,310,460 | 3,462,222 | |||||||||
Prepaid expenses and other assets | 81,056 | 118,685 | 73,465 | |||||||||
|
|
|
|
|
| |||||||
Total assets | 10,302,116,831 | 12,404,191,487 | 9,879,085,274 | |||||||||
|
|
|
|
|
| |||||||
| LIABILITIES | ||||||||||||
Payable for investments purchased | 895,684 | 7,104,488 | 6,327,007 | |||||||||
Payable for fund shares repurchased | 12,165,988 | 13,229,415 | 6,707,814 | |||||||||
Payable to the advisor (Note 6) | 13,548,740 | �� | 16,978,123 | 13,758,808 | ||||||||
Payable to custodian | 30,162 | 33,010 | 23,017 | |||||||||
Other accrued expenses and liabilities | 1,128,811 | 1,246,220 | 902,877 | |||||||||
|
|
|
|
|
| |||||||
Total liabilities | 27,769,385 | 38,591,256 | 27,719,523 | |||||||||
|
|
|
|
|
| |||||||
NET ASSETS | $ | 10,274,347,446 | $ | 12,365,600,231 | $ | 9,851,365,751 | ||||||
|
|
|
|
|
| |||||||
Number of shares issued and outstanding (unlimited shares authorized, $0.01 par value) | 299,274,034 | 311,638,641 | 226,657,092 | |||||||||
|
|
|
|
|
| |||||||
NET ASSET VALUE, OFFERING AND REDEMPTION PRICE PER SHARE | $ | 34.33 | $ | 39.68 | $ | 43.46 | ||||||
|
|
|
|
|
| |||||||
| COMPONENTS OF NET ASSETS | ||||||||||||
Paid-in capital | $ | 6,546,720,948 | $ | 7,353,458,417 | $ | 5,687,917,175 | ||||||
Total distributable earnings | 3,727,626,498 | 5,012,141,814 | 4,163,448,576 | |||||||||
|
|
|
|
|
| |||||||
Net assets | $ | 10,274,347,446 | $ | 12,365,600,231 | $ | 9,851,365,751 | ||||||
|
|
|
|
|
| |||||||
The accompanying notes are an integral part of these financial statements.
30
| PRIMECAP Odyssey Funds For the Year Ended October 31, 2019 |
| PRIMECAP Odyssey Stock Fund | PRIMECAP Odyssey Growth Fund | PRIMECAP Odyssey Aggressive Growth Fund | ||||||||||
INVESTMENT INCOME | ||||||||||||
Dividends (unaffiliated)(1) | $ | 195,958,428 | $ | 142,873,887 | $ | 52,797,157 | ||||||
Dividends (affiliated) | — | — | 1,164,100 | |||||||||
Interest income | 8,588,495 | 7,946,674 | 12,093,555 | |||||||||
|
|
|
|
|
| |||||||
Total investment income | 204,546,923 | 150,820,561 | 66,054,812 | |||||||||
|
|
|
|
|
| |||||||
Expenses | ||||||||||||
Advisory fees | 55,423,350 | 70,849,570 | 56,598,065 | |||||||||
Shareholder servicing | 7,436,412 | 9,406,187 | 6,801,988 | |||||||||
Custody | 175,436 | 195,273 | 128,679 | |||||||||
Trustee fees | 157,422 | 157,623 | 157,623 | |||||||||
Other | 2,041,842 | 2,110,252 | 1,448,628 | |||||||||
|
|
|
|
|
| |||||||
Total expenses | 65,234,462 | 82,718,905 | 65,134,983 | |||||||||
|
|
|
|
|
| |||||||
Net investment income | 139,312,461 | 68,101,656 | 919,829 | |||||||||
|
|
|
|
|
| |||||||
| REALIZED AND UNREALIZED GAIN (LOSS) ON INVESTMENTS AND FOREIGN CURRENCY | ||||||||||||
Net realized gain (loss) on: | ||||||||||||
Investments (unaffiliated) | 550,161,628 | 645,186,820 | 424,426,145 | |||||||||
Investments (affiliated) | — | (9,675,862 | ) | 169,519,247 | ||||||||
Foreign currency transactions | (141,292 | ) | (194,335 | ) | (128,102 | ) | ||||||
Change in unrealized appreciation/depreciation on: | ||||||||||||
Investments (unaffiliated) | 387,588,658 | 81,927,799 | 245,728,866 | |||||||||
Investments (affiliated) | — | (85,591,842 | ) | (386,400,930 | ) | |||||||
Foreign currency translations | 121,344 | 199,299 | 168,102 | |||||||||
|
|
|
|
|
| |||||||
Net realized and unrealized gain on investments and foreign currency | 937,730,338 | 631,851,879 | 453,313,328 | |||||||||
|
|
|
|
|
| |||||||
NET INCREASE IN NET ASSETS RESULTING FROM OPERATIONS | $ | 1,077,042,799 | $ | 699,953,535 | $ | 454,233,157 | ||||||
|
|
|
|
|
| |||||||
| (1) | Net of foreign taxes withheld of $3,764,063, $3,994,966, and $1,176,676, respectively. |
The accompanying notes are an integral part of these financial statements.
31
|
| Year Ended October 31, 2019 | Year Ended October 31, 2018 | |||||||
INCREASE (DECREASE) IN NET ASSETS FROM: | ||||||||
| OPERATIONS | ||||||||
Net investment income | $ | 139,312,461 | $ | 104,496,815 | ||||
Net realized gain (loss) on: | ||||||||
Investments | 550,161,628 | 204,413,813 | ||||||
Foreign currency transactions | (141,292 | ) | (18,144 | ) | ||||
Change in unrealized appreciation/depreciation on: | ||||||||
Investments | 387,588,658 | 75,501,205 | ||||||
Foreign currency translations | 121,344 | (108,069 | ) | |||||
|
|
|
| |||||
Net increase in net assets resulting from operations | 1,077,042,799 | 384,285,620 | ||||||
|
|
|
| |||||
| NET DISTRIBUTIONS TO SHAREHOLDERS | (279,726,568 | ) | (196,909,495 | ) | ||||
|
|
|
| |||||
| CAPITAL SHARE TRANSACTIONS | ||||||||
Proceeds from shares sold | 2,288,869,865 | 3,456,847,979 | ||||||
Proceeds from reinvestment of distributions | 228,973,462 | 152,175,213 | ||||||
Cost of shares repurchased | (3,197,882,950 | ) | (2,337,913,774 | ) | ||||
|
|
|
| |||||
Net increase/(decrease) from capital share transactions | (680,039,623 | ) | 1,271,109,418 | |||||
|
|
|
| |||||
Total increase in net assets | 117,276,608 | 1,458,485,543 | ||||||
|
|
|
| |||||
| NET ASSETS | ||||||||
Beginning of year | 10,157,070,838 | 8,698,585,295 | ||||||
|
|
|
| |||||
End of year | $ | 10,274,347,446 | $ | 10,157,070,838 | ||||
|
|
|
| |||||
| CHANGE IN CAPITAL SHARES | ||||||||
Shares outstanding, beginning of year | 319,462,317 | 280,436,108 | ||||||
|
|
|
| |||||
Shares sold | 71,470,237 | 105,750,521 | ||||||
Shares issued on reinvestment of distributions | 7,846,932 | 4,748,056 | ||||||
Shares repurchased | (99,505,452 | ) | (71,472,368 | ) | ||||
|
|
|
| |||||
Increase/(decrease) in capital shares | (20,188,283 | ) | 39,026,209 | |||||
|
|
|
| |||||
Shares outstanding, end of year | 299,274,034 | 319,462,317 | ||||||
|
|
|
| |||||
The accompanying notes are an integral part of these financial statements.
32
| Statements of Changes in Net Assets |
| Year Ended October 31, 2019 | Year Ended October 31, 2018 | |||||||
INCREASE (DECREASE) IN NET ASSETS FROM: | ||||||||
| OPERATIONS | ||||||||
Net investment income | $ | 68,101,656 | $ | 32,488,370 | ||||
Net realized gain (loss) on: | ||||||||
Investments | 635,510,958 | 267,857,974 | ||||||
Foreign currency transactions | (194,335 | ) | (17,022 | ) | ||||
Change in unrealized appreciation/depreciation on: | ||||||||
Investments | (3,664,043 | ) | 485,804,162 | |||||
Foreign currency translations | 199,299 | (84,778 | ) | |||||
|
|
|
| |||||
Net increase in net assets resulting from operations | 699,953,535 | 786,048,706 | ||||||
|
|
|
| |||||
| NET DISTRIBUTIONS TO SHAREHOLDERS | (286,506,874 | ) | (160,292,332 | ) | ||||
|
|
|
| |||||
| CAPITAL SHARE TRANSACTIONS | ||||||||
Proceeds from shares sold | 2,455,955,463 | 4,654,487,440 | ||||||
Proceeds from reinvestment of distributions | 274,658,653 | 154,711,162 | ||||||
Cost of shares repurchased | (3,923,397,524 | ) | (1,991,511,906 | ) | ||||
|
|
|
| |||||
Net increase/(decrease) from capital share transactions | (1,192,783,408 | ) | 2,817,686,696 | |||||
|
|
|
| |||||
Total increase/(decrease) in net assets | (779,336,747 | ) | 3,443,443,070 | |||||
|
|
|
| |||||
| NET ASSETS | ||||||||
Beginning of year | 13,144,936,978 | 9,701,493,908 | ||||||
|
|
|
| |||||
End of year | $ | 12,365,600,231 | $ | 13,144,936,978 | ||||
|
|
|
| |||||
| CHANGE IN CAPITAL SHARES | ||||||||
Shares outstanding, beginning of year | 342,085,105 | 272,228,484 | ||||||
|
|
|
| |||||
Shares sold | 64,552,659 | 115,258,917 | ||||||
Shares issued on reinvestment of distributions | 7,816,125 | 4,125,631 | ||||||
Shares repurchased | (102,815,248 | ) | (49,527,927 | ) | ||||
|
|
|
| |||||
Increase/(decrease) in capital shares | (30,446,464 | ) | 69,856,621 | |||||
|
|
|
| |||||
Shares outstanding, end of year | 311,638,641 | 342,085,105 | ||||||
|
|
|
| |||||
The accompanying notes are an integral part of these financial statements.
33
| Statements of Changes in Net Assets |
| Year Ended October 31, 2019 | Year Ended October 31, 2018 | |||||||
INCREASE (DECREASE) IN NET ASSETS FROM: | ||||||||
| OPERATIONS | ||||||||
Net investment income (loss) | $ | 919,829 | $ | (20,849,154 | ) | |||
Net realized gain (loss) on: | ||||||||
Investments | 593,945,392 | 738,147,688 | ||||||
Foreign currency transactions | (128,102 | ) | (25,260 | ) | ||||
Change in unrealized appreciation/depreciation on: | ||||||||
Investments | (140,672,064 | ) | 12,355,810 | |||||
Foreign currency translations | 168,102 | (59,386 | ) | |||||
|
|
|
| |||||
Net increase in net assets resulting from operations | 454,233,157 | 729,569,698 | ||||||
|
|
|
| |||||
| NET DISTRIBUTIONS TO SHAREHOLDERS | (683,057,590 | ) | (81,924,081 | ) | ||||
|
|
|
| |||||
| CAPITAL SHARE TRANSACTIONS | ||||||||
Proceeds from shares sold | 1,331,245,698 | 2,035,610,194 | ||||||
Proceeds from reinvestment of distributions | 647,702,692 | 77,951,618 | ||||||
Cost of shares repurchased | (2,144,086,023 | ) | (1,395,356,499 | ) | ||||
|
|
|
| |||||
Net increase/(decrease) from capital share transactions | (165,137,633 | ) | 718,205,313 | |||||
|
|
|
| |||||
Total increase/(decrease) in net assets | (393,962,066 | ) | 1,365,850,930 | |||||
|
|
|
| |||||
| NET ASSETS | ||||||||
Beginning of year | 10,245,327,817 | 8,879,476,887 | ||||||
|
|
|
| |||||
End of year | $ | 9,851,365,751 | $ | 10,245,327,817 | ||||
|
|
|
| |||||
| CHANGE IN CAPITAL SHARES | ||||||||
Shares outstanding, beginning of year | 229,145,250 | 214,433,583 | ||||||
|
|
|
| |||||
Shares sold | 31,073,538 | 42,031,699 | ||||||
Shares issued on reinvestment of distributions | 16,689,067 | 1,750,935 | ||||||
Shares repurchased | (50,250,763 | ) | (29,070,967 | ) | ||||
|
|
|
| |||||
Increase/(decrease) in capital shares | (2,488,158 | ) | 14,711,667 | |||||
|
|
|
| |||||
Shares outstanding, end of year | 226,657,092 | 229,145,250 | ||||||
|
|
|
| |||||
The accompanying notes are an integral part of these financial statements.
34
| For a capital share outstanding throughout each year. |
| Year Ended Oct. 31, 2019 | Year Ended Oct. 31, 2018 | Year Ended Oct. 31, 2017 | Year Ended Oct. 31, 2016 | Year Ended Oct. 31, 2015 | ||||||||||||||||
Net asset value, beginning of the year | $ | 31.79 | $ | 31.02 | $ | 24.84 | $ | 24.45 | $ | 23.59 | ||||||||||
|
|
|
|
|
|
|
|
|
| |||||||||||
Income from investment operations: | ||||||||||||||||||||
Net investment income | 0.46 | 0.33 | 0.33 | 0.29 | 0.31 | |||||||||||||||
Net realized and unrealized gain on investments and foreign currency | 2.95 | 1.13 | 6.61 | 0.55 | 1.21 | |||||||||||||||
|
|
|
|
|
|
|
|
|
| |||||||||||
Total from investment operations | 3.41 | 1.46 | 6.94 | 0.84 | 1.52 | |||||||||||||||
|
|
|
|
|
|
|
|
|
| |||||||||||
Less: | ||||||||||||||||||||
Dividends from net investment income | (0.34 | ) | (0.30 | ) | (0.31 | ) | (0.24 | ) | (0.31 | ) | ||||||||||
Distributions from net realized gain | (0.53 | ) | (0.39 | ) | (0.45 | ) | (0.21 | ) | (0.35 | ) | ||||||||||
|
|
|
|
|
|
|
|
|
| |||||||||||
Total distributions | (0.87 | ) | (0.69 | ) | (0.76 | ) | (0.45 | ) | (0.66 | ) | ||||||||||
|
|
|
|
|
|
|
|
|
| |||||||||||
Net asset value, end of year | $ | 34.33 | $ | 31.79 | $ | 31.02 | $ | 24.84 | $ | 24.45 | ||||||||||
|
|
|
|
|
|
|
|
|
| |||||||||||
Total return | 11.22 | % | 4.70 | % | 28.51 | % | 3.52 | % | 6.64 | % | ||||||||||
Ratios/supplemental data: | ||||||||||||||||||||
Net assets, end of year (millions) | $ | 10,274.3 | $ | 10,157.1 | $ | 8,698.6 | $ | 5,654.3 | $ | 5,126.0 | ||||||||||
Ratio of expenses to average net assets | 0.65 | % | 0.64 | % | 0.65 | % | 0.67 | % | 0.65 | % | ||||||||||
Ratio of net investment income to average net assets | 1.38 | % | 1.04 | % | 1.18 | % | 1.22 | % | 1.38 | % | ||||||||||
Portfolio turnover rate | 6 | % | 5 | % | 6 | % | 8 | % | 7 | % | ||||||||||
The accompanying notes are an integral part of these financial statements.
35
| Financial Highlights For a capital share outstanding throughout each year. |
| Year Ended Oct. 31, 2019 | Year Ended Oct. 31, 2018 | Year Ended Oct. 31, 2017 | Year Ended Oct. 31, 2016 | Year Ended Oct. 31, 2015 | ||||||||||||||||
Net asset value, beginning of the year | $ | 38.43 | $ | 35.64 | $ | 27.90 | $ | 27.09 | $ | 26.14 | ||||||||||
|
|
|
|
|
|
|
|
|
| |||||||||||
Income from investment operations: | ||||||||||||||||||||
Net investment income | 0.22 | 0.10 | 0.12 | 0.12 | 0.14 | |||||||||||||||
Net realized and unrealized gain on investments and foreign currency | 1.88 | 3.26 | 8.62 | 1.04 | 1.62 | |||||||||||||||
|
|
|
|
|
|
|
|
|
| |||||||||||
Total from investment operations | 2.10 | 3.36 | 8.74 | 1.16 | 1.76 | |||||||||||||||
|
|
|
|
|
|
|
|
|
| |||||||||||
Less: | ||||||||||||||||||||
Dividends from investment income | (0.12 | ) | (0.11 | ) | (0.14 | ) | (0.10 | ) | (0.16 | ) | ||||||||||
Distributions from net realized gain | (0.73 | ) | (0.46 | ) | (0.86 | ) | (0.25 | ) | (0.65 | ) | ||||||||||
|
|
|
|
|
|
|
|
|
| |||||||||||
Total distributions | (0.85 | ) | (0.57 | ) | (1.00 | ) | (0.35 | ) | (0.81 | ) | ||||||||||
|
|
|
|
|
|
|
|
|
| |||||||||||
Net asset value, end of year | $ | 39.68 | $ | 38.43 | $ | 35.64 | $ | 27.90 | $ | 27.09 | ||||||||||
|
|
|
|
|
|
|
|
|
| |||||||||||
Total return | 5.75 | % | 9.48 | % | 32.12 | % | 4.31 | % | 6.96 | % | ||||||||||
Ratios/supplemental data: | ||||||||||||||||||||
Net assets, end of year (millions) | $ | 12,365.6 | $ | 13,144.9 | $ | 9,701.5 | $ | 6,604.5 | $ | 6,254.6 | ||||||||||
Ratio of expenses to average net assets | 0.64 | % | 0.64 | % | 0.66 | % | 0.65 | % | 0.64 | % | ||||||||||
Ratio of net investment income to average net assets | 0.53 | % | 0.26 | % | 0.39 | % | 0.47 | % | 0.53 | % | ||||||||||
Portfolio turnover rate | 6 | % | 4 | % | 5 | % | 9 | % | 5 | % | ||||||||||
The accompanying notes are an integral part of these financial statements.
36
| Financial Highlights PRIMECAP Odyssey Aggressive Growth Fund For a capital share outstanding throughout each year. |
| Year Ended Oct. 31, 2019 | Year Ended Oct. 31, 2018 | Year Ended Oct. 31, 2017 | Year Ended Oct. 31, 2016 | Year Ended Oct. 31, 2015 | ||||||||||||||||
Net asset value, beginning of the year | $ | 44.71 | $ | 41.41 | $ | 33.78 | $ | 33.27 | $ | 33.21 | ||||||||||
|
|
|
|
|
|
|
|
|
| |||||||||||
Income from investment operations: | ||||||||||||||||||||
Net investment income (loss) | 0.03 | 0.00 | (1) | (0.03 | ) | (0.05 | ) | 0.06 | ||||||||||||
Net realized and unrealized gain on investments and foreign currency | 1.72 | 3.68 | 10.44 | 2.59 | 1.54 | |||||||||||||||
|
|
|
|
|
|
|
|
|
| |||||||||||
Total from investment operations | 1.75 | 3.68 | 10.41 | 2.54 | 1.60 | |||||||||||||||
|
|
|
|
|
|
|
|
|
| |||||||||||
Less: | ||||||||||||||||||||
Dividends from investment income | (0.03 | ) | — | — | (0.00 | )(1) | (0.06 | ) | ||||||||||||
Distributions from net realized gain | (2.97 | ) | (0.38 | ) | (2.78 | ) | (2.03 | ) | (1.48 | ) | ||||||||||
|
|
|
|
|
|
|
|
|
| |||||||||||
Total distributions | (3.00 | ) | (0.38 | ) | (2.78 | ) | (2.03 | ) | (1.54 | ) | ||||||||||
|
|
|
|
|
|
|
|
|
| |||||||||||
Net asset value, end of year | $ | 43.46 | $ | 44.71 | $ | 41.41 | $ | 33.78 | $ | 33.27 | ||||||||||
|
|
|
|
|
|
|
|
|
| |||||||||||
Total return | 4.71 | % | 8.90 | % | 32.59 | % | 7.90 | % | 5.13 | % | ||||||||||
Ratios/supplemental data: | ||||||||||||||||||||
Net assets, end of year (millions) | $ | 9,851.4 | $ | 10,245.3 | $ | 8,879.5 | $ | 6,721.4 | $ | 6,502.8 | ||||||||||
Ratio of expenses to average net assets | 0.63 | % | 0.63 | % | 0.64 | % | 0.63 | % | 0.62 | % | ||||||||||
Ratio of net investment income (loss) to average net assets | 0.01 | % | (0.19 | %) | (0.07 | %) | (0.16 | %) | 0.17 | % | ||||||||||
Portfolio turnover rate | 7 | % | 12 | % | 9 | % | 15 | % | 15 | % | ||||||||||
| (1) | Less than one cent per share |
The accompanying notes are an integral part of these financial statements.
37
| PRIMECAP Odyssey Funds For the Year Ended October 31, 2019 |
(1) Organization
PRIMECAP Odyssey Funds (the “Trust”) was organized on June 8, 2004 as a Delaware statutory trust and is registered as anopen-end management investment company under the Investment Company Act of 1940, as amended (the “1940 Act”). The Trust is comprised of three series: PRIMECAP Odyssey Stock Fund, PRIMECAP Odyssey Growth Fund, and PRIMECAP Odyssey Aggressive Growth Fund (the “Funds”), each of which is diversified within the meaning of the 1940 Act. PRIMECAP Management Company (the “Investment Advisor”) serves as investment advisor to the Funds. Each Fund commenced operations on November 1, 2004.
Each Fund’s investment objective is to achieve long-term capital appreciation. Each Fund is authorized to issue unlimited shares of beneficial interest. All shares of each Fund have equal rights with respect to voting. The PRIMECAP Odyssey Aggressive Growth Fund is closed to most new investors.
(2) Significant Accounting Policies
The Funds consistently follow the accounting policies set forth below which are in conformity with accounting principles generally accepted in the United States of America (“U.S. GAAP”). The Funds are considered investment companies under U.S. GAAP and follow the accounting and reporting guidance applicable to investment companies in the Financial Accounting Standards BoardAuditing Standards Codification Topic 946.
| A. | Security Valuation |
Securities traded on a national securities exchange are valued at the last reported sales price at the close of regular trading on each day the exchanges are open for trading. Securities traded on the National Association of Securities Dealers Automated Quotations (“NASDAQ”) are valued at the NASDAQ Official Closing Price, which may not necessarily represent the last sale price. Non-U.S. traded stocks are valued at the last sale price or official closing price in the primary local market where the stock is traded. Securities traded on an exchange for which there have been no sales are valued at the mean between the bid and ask price. Because trading on most non-U.S. exchanges is normally completed before the close of the New York Stock Exchange, the value of securities traded on foreign exchanges can change by the time a Fund calculates its net asset value per share (“NAV”). To address these changes, the Funds may utilize adjustment factors provided by an independent pricing service to systematically value foreign securities at fair value. These adjustment factors are based on statistical analyses of subsequent movement in securities indices, specific security prices, and exchange rates in foreign markets.
Securities for which quotations are not readily available are valued at their respective fair values as determined in good faith by a valuation committee of the Investment Advisor in accordance with procedures approved by the Trust’s Board of Trustees. In determining fair value, the Funds take into account all relevant factors and available information. Consequently, the price of a security used by a Fund to calculate its NAV may differ from quoted or published prices for the same security. Fair value pricing involves
38
Notes to Financial Statements
PRIMECAP Odyssey Funds
For the Year Ended October 31, 2019 –continued
subjective judgments, and there is no single standard for determining a security’s fair value. As a result, different mutual funds could reasonably arrive at a different fair value for the same security. It is possible that the fair value determined for a security is materially different from the value that could be realized upon the sale of that security or from the values that other mutual funds may determine.
Investments in other funds are valued at their respective net asset values as determined by those funds, in accordance with the 1940 Act.
| B. | Share Valuation |
The NAV of a Fund is calculated by dividing the sum of the value of the securities held by the Fund, plus cash or other assets, minus all liabilities (including estimated accrued expenses), by the total number of outstanding shares of the Fund. The result is rounded to the nearest cent. The Funds’ shares will not be priced on the days on which the NYSE is closed for trading.
| C. | Foreign Currency |
Securities and other assets and liabilities denominated in foreign currencies are translated into U.S. dollars using exchange rates as of 4 p.m. Eastern time on the valuation date. Purchases and sales of investments and dividend and interest income are converted into U.S. dollars using the spot market rate of exchange prevailing on the respective dates of such translations. Realized foreign exchange gains or losses may arise from 1) sales of foreign currencies; 2) currency gains or losses realized between the trade and settlement dates on securities transactions; and 3) the difference between the recorded amounts of dividends, interest, and foreign withholding taxes and the U.S. dollar equivalent of the amounts actually received or paid. Net unrealized foreign exchange gains and losses arise from changes in foreign exchange rates on foreign denominated assets and liabilities other than investments in securities held at the end of the reporting period. Foreign securities and currency transactions may involve risks not associated with U.S. securities and currency.
| D. | Federal Income Taxes |
Each Fund has elected to be treated as a “regulated investment company” under Subchapter M of the Internal Revenue Code of 1986 (the “IRC”). Each Fund intends to distribute substantially all of its taxable income and any accumulated net realized capital gains. Accordingly, no provision for federal income taxes has been made in the financial statements.
The Funds may be subject to foreign taxes on income, gains on investments, or currency repatriation, a portion of which may be reclaimed. The Funds will accrue such taxes and reclaims as applicable based upon their current interpretations of the tax rules and regulations that exist in the markets in which they invest.
Each Fund has adopted accounting standards regarding recognition and measurement of tax positions taken or expected to be taken on a tax return. The Funds recognize interest and penalties, if any, related to unrecognized tax benefits as income tax
39
Notes to Financial Statements
PRIMECAP Odyssey Funds
For the Year Ended October 31, 2019 –continued
expense in the Statement of Operations. During the year ended October 31, 2019, the Funds did not incur any interest or penalties. As of October 31, 2019, open tax years include the tax years ended October 31, 2016 through October 31, 2019. No Fund is aware of any tax positions for which it is more likely than not that the total amounts of unrecognized tax benefits or loss will significantly change in the next 12 months.
| E. | Allocation of Expenses |
Each Fund is charged for those expenses directly attributable to it. Expenses that are not directly attributable to a Fund are allocated among the Funds by an appropriate method based on the nature of the expense.
| F. | Security Transactions, Investment Income, and Distributions |
Security transactions are accounted for on the trade date. Dividend income and distributions to shareholders are recorded on theex-dividend date, and interest income is recognized on the accrual basis. Realized gains and losses are evaluated on the basis of identified costs. Premiums and discounts on the purchase of securities are amortized/accreted using the effective interest method. U.S. GAAP requires that permanent financial reporting and tax differences be reclassified in the capital accounts.
| G. | Use of Estimates |
The preparation of financial statements in conformity with U.S. GAAP requires management to make estimates and assumptions that affect the reported amounts of assets and liabilities and disclosure of contingent assets and liabilities at the date of the financial statements, and the reported amounts of revenues and expenses during the reporting period. Actual results could differ from these estimates, and such differences could be material.
| H. | Indemnification Obligations |
Under the Trust’s organizational documents, its current and former officers and trustees are indemnified against certain liabilities arising out of the performance of their duties to the Funds. In addition, in the normal course of business, the Funds enter into contracts that contain a variety of representations and warranties that provide general indemnifications. The Funds’ maximum exposure under these arrangements is unknown as this would involve future claims that may be made against the Funds that have not yet occurred. Based on experience, the Funds would expect the risk of loss to be minimal.
(3) Investment Transactions
The cost of purchases and the proceeds from sales of securities, excluding short-term investments, for the year ended October 31, 2019 were as follows:
Fund | Purchases | Sales | ||||||
Stock Fund | $ | 538,091,539 | $ | 1,709,338,617 | ||||
Growth Fund | $ | 798,896,522 | $ | 1,834,454,019 | ||||
Aggressive Growth Fund | $ | 647,562,215 | $ | 1,532,887,891 | ||||
40
Notes to Financial Statements
PRIMECAP Odyssey Funds
For the Year Ended October 31, 2019 –continued
(4) Valuation Measurements
The Funds have adopted fair valuation accounting standards which establish an authoritative definition of fair value and set forth a hierarchy for measuring fair value. These standards require additional disclosure about the various inputs and valuation techniques used to develop the measurements of fair value and a discussion of changes in valuation techniques and related inputs during the period. These standards define fair value as the price that would be received in the sale of an asset or paid to transfer a liability in an orderly transaction between market participants on the measurement date. The fair value hierarchy is organized into three levels based upon the assumptions (referred to as “inputs”) used to value the asset or liability. These standards state that “observable inputs” reflect the significant assumptions that market participants would use in valuing an asset or liability based on market data obtained from independent sources. “Unobservable inputs” reflect the Funds’ own assumptions about the inputs market participants would use to value the asset or liability.
Various inputs are used in determining the value of each Fund’s investments, and the lowest level for any significant input determines leveling. These inputs are summarized in the three broad levels below:
| Level 1 – | Unadjusted quoted prices in active markets for identical securities to which the Trust has access at the date of measurement. |
| Level 2 – | Other significant observable inputs (including quoted prices for similar or related securities in both active and inactive markets, interest rates, foreign exchange rates, and fair value estimates for foreign securities indices). |
| Level 3 – | Significant unobservable inputs to the extent observable inputs are unavailable (including the Funds’ own assumptions in determining fair value of investments based on the best available information). |
41
Notes to Financial Statements
PRIMECAP Odyssey Funds
For the Year Ended October 31, 2019 –continued
The following table provides the fair value measurements of applicable Fund assets by level within the fair value hierarchy for each Fund as of October 31, 2019. These assets are measured on a recurring basis.
Fund | Description | Quoted prices in active markets for identical assets (Level 1) | Significant other observable inputs (Level 2) | Significant unobservable inputs (Level 3) | Total | |||||||||||||
| Stock Fund | Common Stock(1) | $ | 9,607,253,605 | $ | — | $ | — | $ | 9,607,253,605 | |||||||||
Short-Term Investments | 520,711,052 | — | — | 520,711,052 | ||||||||||||||
|
|
|
|
|
|
|
| |||||||||||
Total Investments in Securities | $ | 10,127,964,657 | $ | — | $ | — | $ | 10,127,964,657 | ||||||||||
|
|
|
|
|
|
|
| |||||||||||
| Growth Fund | Common Stock(1) | $ | 12,115,930,044 | $ | — | $ | — | $ | 12,115,930,044 | |||||||||
Short-Term Investments | 246,502,463 | — | — | 246,502,463 | ||||||||||||||
|
|
|
|
|
|
|
| |||||||||||
Total Investments in Securities | $ | 12,362,432,507 | $ | — | $ | — | $ | 12,362,432,507 | ||||||||||
|
|
|
|
|
|
|
| |||||||||||
Aggressive Growth Fund | Common Stock(1) | $ | 9,250,840,158 | $ | — | $ | 0 | $ | 9,250,840,158 | |||||||||
Preferred Stock(2) | 49,624,167 | — | — | 49,624,167 | ||||||||||||||
Rights(3) | 409,802 | — | 0 | 409,802 | ||||||||||||||
Short-Term Investments | 564,921,413 | — | — | 564,921,413 | ||||||||||||||
|
|
|
|
|
|
|
| |||||||||||
Total Investments in Securities | $ | 9,865,795,540 | $ | — | $ | 0 | $ | 9,865,795,540 | ||||||||||
|
|
|
|
|
|
|
| |||||||||||
| (1) | Refer to each Fund’s respective Schedule of Investments for the breakdown of major categories. |
| (2) | Financials |
| (3) | Communication Services and Health Care |
42
Notes to Financial Statements
PRIMECAP Odyssey Funds
For the Year Ended October 31, 2019 –continued
(5) Distribution to Shareholders
Net investment income and net realized gains differ for financial statement and tax purposes due to differing treatments of deferred wash sale losses.
As of October 31, 2019, the components of capital on a tax basis were as follows:
| PRIMECAP Odyssey Stock Fund | PRIMECAP Odyssey Growth Fund | PRIMECAP Odyssey Aggressive Growth Fund | ||||||||||
Cost of investments for tax purposes(1) | $ | 6,996,617,342 | $ | 7,976,580,023 | $ | 6,237,475,230 | ||||||
|
|
|
|
|
| |||||||
Gross tax unrealized appreciation | 3,598,275,048 | 5,316,870,138 | 4,718,810,220 | |||||||||
Gross tax unrealized depreciation | (467,003,488 | ) | (931,049,501 | ) | (1,090,487,579 | ) | ||||||
|
|
|
|
|
| |||||||
Net tax unrealized appreciation | 3,131,271,560 | 4,385,820,637 | 3,628,322,641 | |||||||||
|
|
|
|
|
| |||||||
Undistributed ordinary income | 118,197,783 | 71,970,840 | 25,463,714 | |||||||||
Undistributed long-term capital gain | 478,157,155 | 554,350,337 | 509,662,221 | |||||||||
|
|
|
|
|
| |||||||
Total distributable earnings | 596,354,938 | 626,321,177 | 535,125,935 | |||||||||
|
|
|
|
|
| |||||||
Other accumulated gain (loss) | — | — | — | |||||||||
|
|
|
|
|
| |||||||
Total accumulated gain | $ | 3,727,626,498 | $ | 5,012,141,814 | $ | 4,163,448,576 | ||||||
|
|
|
|
|
| |||||||
| (1) | At October 31, 2019 the differences in the basis for federal income tax purposes and financial reporting purposes are due to the tax deferral of losses on wash sales. |
U.S. GAAP requires that permanentbook-to-tax differences be reclassified among the components of net assets. These reclassifications have no effect on net assets or NAV. For the fiscal year ended October 31, 2019, the following reclassifications were made:
| Undistributed Net Investment Gain (Loss) | Accumulated Net Realized Loss | Paid In Capital | ||||||||||
Stock Fund | $ | (144,275) | $ | (68,302,702) | $ | 68,446,977 | ||||||
Growth Fund | $ | (194,335) | $ | (80,064,277) | $ | 80,258,612 | ||||||
Aggressive Growth Fund | $ | 4,968,272 | $ | (61,066,741) | $ | 56,098,469 | ||||||
The Funds used a tax accounting practice to treat a portion of the price of capital shares redeemed during the year as distributions from net realized capital gains. The PRIMECAP Odyssey Stock Fund, PRIMECAP Odyssey Growth Fund, and PRIMECAP Odyssey Aggressive Growth Fund reclassified $68,446,977, $80,258,612, and $56,098,469, respectively, from Accumulated Net Realized Gain to Paid In Capital. Other permanentbook-to-tax differences that required reclassification among the Funds’ capital accounts related to foreign currency adjustments and net operating losses.
43
Notes to Financial Statements
PRIMECAP Odyssey Funds
For the Year Ended October 31, 2019 –continued
Tax components of dividends paid during the fiscal years ended October 31, 2019 and October 31, 2018 were as follows:
| October 31, 2019 | October 31, 2018 | |||||||||||||||
| Ordinary Income Distributions | Long-Term Capital Gain Distributions | Ordinary Income Distributions | Long-Term Capital Gain Distributions | |||||||||||||
Stock Fund | $ | 122,583,434 | $ | 157,143,134 | $ | 95,637,597 | $ | 101,271,898 | ||||||||
Growth Fund | $ | 53,586,031 | $ | 232,920,843 | $ | 33,749,309 | $ | 126,543,023 | ||||||||
Aggressive Growth Fund | $ | 10,794,465 | $ | 672,263,125 | $ | 3,605,900 | $ | 78,318,181 | ||||||||
The Funds designated as long-term capital gain dividends, pursuant to IRC Section 852 (b) (3), the amounts necessary to reduce the earnings and profits of the Funds related to net capital gains to zero for the tax year ended October 31, 2019.
(6) Investment Advisory and Other Agreements
The Trust has entered into an investment management agreement with the Investment Advisor on behalf of each Fund. For its services to the Funds, the Investment Advisor receives a fee paid quarterly at the annual rate of 0.60% of the first $100 million of each Fund’s average daily net assets and 0.55% of each Fund’s average daily net assets in excess of $100 million. For the year ended October 31, 2019, each Fund paid the Investment Advisor at an effective annual rate of 0.55% of its respective average net assets.
U.S. Bancorp Fund Services, LLC (“USBFS”) serves as the administrator, fund accountant, and transfer agent to the Funds. Quasar Distributors, LLC, an affiliate of USBFS, serves as the Funds’ distributor. U.S. Bank, N.A., an affiliate of USBFS, serves as the Funds’ custodian.
(7) Other Affiliates
Certain of the Funds’ investments are in companies that are considered to be affiliated companies of a Fund because the Fund owns 5% or more of the outstanding voting securities of the company. With respect to each such investment, refer to each Fund’s respective Schedule of Investments for the information on the sector, the number of shares held, and the percentages of net assets held in each sector. Transactions during the period in securities of these companies were as follows:
PRIMECAP Odyssey Growth Fund
| Current Period Transactions | ||||||||||||||||||||||||||||
Common Stock | Market Value at October 31, 2018 | Purchases at Cost | Proceeds from Securities Sold | Dividend Income | Realized Gain (Loss) | Change in Unrealized Gain (Loss) | Market Value at October 31, 2019 | |||||||||||||||||||||
iRobot Corp. | $ | 244,707,018 | $ | 3,326,002 | $ | 20,072,149 | $ | — | $ | 1,064,405 | $ | (104,929,550 | ) | $ | 124,095,726 | |||||||||||||
Stratasys Ltd. | 93,666,558 | — | 5,132,107 | — | (10,740,267 | ) | 19,337,708 | 97,131,892 | ||||||||||||||||||||
|
|
|
|
|
|
|
|
|
|
|
|
|
| |||||||||||||||
Total | $ | 338,373,576 | $ | 3,326,002 | $ | 25,204,256 | $ | — | $ | (9,675,862 | ) | $ | (85,591,842 | ) | $ | 221,227,618 | ||||||||||||
|
|
|
|
|
|
|
|
|
|
|
|
|
| |||||||||||||||
44
Notes to Financial Statements
PRIMECAP Odyssey Funds
For the Year Ended October 31, 2019 –continued
PRIMECAP Odyssey Aggressive Growth Fund
| Current Period Transactions | ||||||||||||||||||||||||||||
Common Stock | Market Value at October 31, 2018 | Purchases at Cost | Proceeds from Securities Sold | Dividend Income | Realized Gain (Loss) | Change in Unrealized Gain (Loss) | Market Value at October 31, 2019 | |||||||||||||||||||||
Arbutus Biopharma Corp.(1) | $ | 17,258,496 | $ | — | $ | 3,383,415 | $ | — | $ | (39,559,685 | ) | $ | 26,536,604 | $ | N/A | |||||||||||||
Axcelis Technologies, Inc. | 43,581,500 | 74,981 | 326,238 | — | (4,650 | ) | 4,819,862 | 48,145,455 | ||||||||||||||||||||
Cerus Corp | 69,010,000 | 5,200,037 | — | — | — | (25,055,037 | ) | 49,155,000 | ||||||||||||||||||||
Chegg, Inc.(1) | 212,778,544 | — | 67,657,165 | — | 51,717,485 | (17,100,746 | ) | N/A | ||||||||||||||||||||
comScore, Inc. | 91,858,602 | 188,101 | 2,367,548 | — | (4,256,226 | ) | (72,551,470 | ) | 12,871,459 | |||||||||||||||||||
Ellie Mae, Inc.(1)(2) | 136,052,956 | — | 200,086,075 | — | 148,031,677 | (83,998,558 | ) | N/A | ||||||||||||||||||||
Epizyme, Inc. | 46,443,541 | 18,510,280 | 758,823 | — | (3,187,002 | ) | 22,464,987 | 83,472,983 | ||||||||||||||||||||
FARO Technologies, Inc. | 71,460,224 | — | 25,751,099 | — | 7,555,954 | (9,183,060 | ) | 44,082,019 | ||||||||||||||||||||
Fluidigm Corp. | 28,072,310 | 5,183,325 | 71,864 | — | (433,834 | ) | (9,864,400 | ) | 22,885,537 | |||||||||||||||||||
IMAX Corp.(1) | 64,540,432 | — | 5,483,612 | — | (3,440,157 | ) | 9,622,532 | N/A | ||||||||||||||||||||
Nektar Therapeutics | 444,498,028 | 2,500,033 | 21,584,332 | — | 13,448,364 | (249,847,029 | ) | 189,015,064 | ||||||||||||||||||||
NN, Inc. | 46,980,000 | 1,070,992 | — | 1,164,100 | — | (17,943,592 | ) | 30,107,400 | ||||||||||||||||||||
OncoMed Pharmaceuticals, Inc.(1)(3) | 6,303,668 | — | 3,252,594 | — | (24,274,350 | ) | 21,223,276 | N/A | ||||||||||||||||||||
Pfenex, Inc. | 12,471,358 | 74,556 | 182,061 | — | (602,239 | ) | 16,809,322 | 28,570,936 | ||||||||||||||||||||
PROS Holdings, Inc. | 90,727,520 | 19,115,341 | 6,670,252 | — | 2,392 | 55,264,203 | 158,439,204 | |||||||||||||||||||||
ServiceSource International, Inc. | 12,045,810 | — | 234,024 | — | (1,904,196 | ) | 1,108,660 | 11,016,250 | ||||||||||||||||||||
Shutterfly, Inc.(1)(4) | 136,985,000 | 5,635,291 | 145,298,068 | — | 39,737,956 | (37,060,179 | ) | N/A | ||||||||||||||||||||
Spectrum Pharmaceuticals, Inc. | 126,021,000 | 1,106,418 | 9,231,052 | — | (14,265,235 | ) | (28,698,243 | ) | 74,932,888 | |||||||||||||||||||
Xencor, Inc. | 166,727,443 | — | 7,302,408 | — | 952,993 | 7,051,938 | 167,429,966 | |||||||||||||||||||||
|
|
|
|
|
|
|
|
|
|
|
|
|
| |||||||||||||||
Total | $ | 1,823,816,432 | $ | 58,659,355 | $ | 499,640,630 | $ | 1,164,100 | $ | 169,519,247 | $ | (386,400,930 | ) | $ | 920,124,161 | |||||||||||||
|
|
|
|
|
|
|
|
|
|
|
|
|
| |||||||||||||||
| (1) | No longer an affiliate as of October 31, 2019. |
| (2) | Included in “Proceeds from Securities Sold” are proceeds received when Ellie Mae, Inc. was acquired. |
| (3) | Included in “Proceeds from Securities Sold” are proceeds received when OncoMed Pharmaceuticals, Inc. was acquired. |
| (4) | Included in “Proceeds from Securities Sold” are proceeds received when Shutterfly, Inc. was acquired. |
(8) Subsequent Events
In preparing these financial statements, the Funds have evaluated events and transactions for potential recognition or disclosure through the date the financial statements were issued.
45
Notes to Financial Statements
PRIMECAP Odyssey Funds
For the Year Ended October 31, 2019 –continued
On November 25, 2019, U.S. Bancorp, the parent company of Quasar Distributors, LLC, the Fund’s distributor, announced that it had signed a purchase agreement to sell Quasar to Foreside Financial Group, LLC (“Foreside”) such that Quasar will become a wholly-owned broker-dealer subsidiary of Foreside. The transaction is expected to close by the end of March 2020. Management is evaluating firms, including Foreside, to serve as the Funds’ distributor.
46
| Report of Independent Registered Public Accounting Firm |
To the Board of Trustees of PRIMECAP Odyssey Funds and shareholders of
PRIMECAP Odyssey Stock Fund
PRIMECAP Odyssey Growth Fund and
PRIMECAP Odyssey Aggressive Growth Fund
Opinions on the Financial Statements
We have audited the accompanying statements of assets and liabilities, including the schedules of investments, of PRIMECAP Odyssey Stock Fund, PRIMECAP Odyssey Growth Fund, and PRIMECAP Odyssey Aggressive Growth Fund (constituting PRIMECAP Odyssey Funds, hereafter collectively referred to as the “Funds”) as of October 31, 2019, the related statements of operations for the year ended October 31, 2019, the statements of changes in net assets for each of the two years in the period ended October 31, 2019, including the related notes, and the financial highlights for each of the five years in the period ended October 31, 2019 (collectively referred to as the “financial statements”). In our opinion, the financial statements present fairly, in all material respects, the financial position of each of the Funds as of October 31, 2019, the results of each of their operations for the year then ended, the changes in each of their net assets for each of the two years in the period ended October 31, 2019 and each of the financial highlights for each of the five years in the period ended October 31, 2019 in conformity with accounting principles generally accepted in the United States of America.
Basis for Opinions
These financial statements are the responsibility of the Funds’ management. Our responsibility is to express an opinion on the Funds’ financial statements based on our audits. We are a public accounting firm registered with the Public Company Accounting Oversight Board (United States) (PCAOB) and are required to be independent with respect to the Funds in accordance with the U.S. federal securities laws and the applicable rules and regulations of the Securities and Exchange Commission and the PCAOB.
We conducted our audits of these financial statements in accordance with the standards of the PCAOB. Those standards require that we plan and perform the audit to obtain reasonable assurance about whether the financial statements are free of material misstatement, whether due to error or fraud.
Our audits included performing procedures to assess the risks of material misstatement of the financial statements, whether due to error or fraud, and performing procedures that respond to those risks. Such procedures included examining, on a test basis, evidence regarding the amounts and disclosures in the financial statements. Our audits also included evaluating the accounting principles used and significant estimates made by management, as well as evaluating the overall presentation of the financial statements. Our procedures included confirmation of securities owned as of October 31, 2019by correspondence with the custodian and brokers; when replies were not received from brokers, we performed other auditing procedures. We believe that our audits provide a reasonable basis for our opinions.
/s/ PricewaterhouseCoopers LLP
Los Angeles, California
December 11, 2019
We have served as the auditor of one or more investment companies in PRIMECAP Odyssey Funds Investment Company Complex since 2004.
47
| PRIMECAP Odyssey Funds (Unaudited) |
As a shareholder of one or more of the Funds, you incur ongoing costs including management fees and other Fund expenses. This expense example is intended to help you understand your ongoing costs (in dollars) of investing in the Funds and to compare these costs with the ongoing costs of investing in other mutual funds.
The expense example is based on an investment of $1,000 invested for a six-month period beginning May 1, 2019 through October 31, 2019.
Actual Expenses
The information in the table adjacent to the heading “Actual Performance” provides actual account values and actual expenses. You may use the information in these columns, together with the amount you invested, to estimate the expenses that you paid over the period. Simply divide your account value by $1,000 (for example, an $8,600 account value divided by $1,000 = 8.6), then multiply the result by the number in the column entitled “Expenses Paid during Period” to estimate the expenses you paid on your account during this period.
Hypothetical Example for Comparison Purposes
The information in the table adjacent to the heading “Hypothetical Performance (5% return before expenses)” provides hypothetical account values and hypothetical expenses based on the Funds’ actual expense ratios and an assumed rate of return of 5% per year before expenses, which are not the Funds’ actual returns. The hypothetical account values and expenses may not be used to estimate the actual ending account balance or expenses you paid for the period. You may use this information to compare the ongoing costs of investing in the Funds and other mutual funds. To do so, compare these 5% hypothetical examples with the 5% hypothetical examples that appear in the shareholder reports of the other mutual funds.
Please note that the expenses shown in the table are meant to highlight your ongoing costs only. Therefore, the information adjacent to the heading “Hypothetical Performance (5% return before expenses)” is useful in comparing ongoing costs only and will not help you determine the relative total costs of owning different mutual funds. In addition, if transactional costs were included, your costs would have been higher.
48
Expense Example
PRIMECAP Odyssey Funds
(Unaudited) –continued
Beginning Account Value (5/1/19) | Ending Account Value (10/31/19) | Expenses Paid During Period(1) (5/1/19 to 10/31/19) | Expense Ratio During Period(1) (5/1/19 to 10/31/19) | |||||||||||||
PRIMECAP Odyssey Stock Fund |
| |||||||||||||||
Actual Performance | $ | 1,000.00 | $ | 1,026.60 | $ | 3.32 | 0.65% | |||||||||
Hypothetical Performance | $ | 1,000.00 | $ | 1,021.93 | $ | 3.31 | 0.65% | |||||||||
PRIMECAP Odyssey Growth Fund |
| |||||||||||||||
Actual Performance | $ | 1,000.00 | $ | 993.00 | $ | 3.22 | 0.64% | |||||||||
Hypothetical Performance | $ | 1,000.00 | $ | 1,021.98 | $ | 3.26 | 0.64% | |||||||||
PRIMECAP Odyssey Aggressive Growth Fund |
| |||||||||||||||
Actual Performance | $ | 1,000.00 | $ | 969.00 | $ | 3.13 | 0.63% | |||||||||
Hypothetical Performance | $ | 1,000.00 | $ | 1,022.03 | $ | 3.21 | 0.63% | |||||||||
| (1) | Expenses are equal to a Fund’s annualized expense ratio as indicated, multiplied by the average account value over the period, multiplied by the number of days in the most recent fiscal half-year period (184), then divided by the number of days in the fiscal year (365) to reflect theone-half year period. |
49
| PRIMECAP Odyssey Funds (Unaudited) |
Additional Tax Information
PRIMECAP Odyssey Stock Fund, PRIMECAP Odyssey Growth Fund, and PRIMECAP Odyssey Aggressive Growth Fund designate 100%, 100%, and 100%, respectively, of ordinary income distributions paid during the fiscal year ended October 31, 2019 as qualified dividend income.
PRIMECAP Odyssey Stock Fund, PRIMECAP Odyssey Growth Fund, and PRIMECAP Odyssey Aggressive Growth Fund designate 100%, 100%, and 100%, respectively, of ordinary income distributions paid during the fiscal year ended October 31, 2019 as dividends qualifying for the dividends received deduction available for corporate shareholders.
PRIMECAP Odyssey Stock Fund, PRIMECAP Odyssey Growth Fund, and PRIMECAP Odyssey Aggressive Growth Fund designate 10.44%, 22.47%, and 92.67%, respectively, of ordinary income distributions paid during the fiscal year ended October 31, 2019 as short-term capital gain under Internal Revenue Code 871(k)(2)(C).
Proxy Voting Procedures
The Investment Advisor votes proxies relating to portfolio securities in accordance with procedures that have been approved by the Trust’s Board of Trustees. You may obtain a description of these procedures, free of charge, by calling toll-free 1-800-729-2307. This information is also available through the Securities and Exchange Commission’s (“SEC”) website at www.sec.gov.
Proxy Voting Record
Information regarding how the Funds voted proxies relating to the portfolio securities during the most recent 12-month period ended June 30 is available, without charge, by calling toll-free1-800-729-2307. This information is also available through the SEC’s website at www.sec.gov.
Portfolio Holdings Disclosure
The Funds file a complete schedule of portfolio holdings with the SEC for the first and third quarters of each fiscal year onForm N-Q or Part F of Form N-PORT (beginning with filings after March 31, 2019). This information is available, without charge, by calling toll-free1-800-729-2307. The Funds’ Forms N-Q or Part F of Form N-PORT are also available on the SEC’s website at www.sec.gov. The Funds’ Forms N-Q or Part F of Form N-PORT may be reviewed and copied at the Commission’s Public Reference Room in Washington, DC, and information on the operation of the Public Reference Room may be obtained by calling1-800-SEC-0330.
Board Approval of the Renewal of the Investment Advisory Agreement
The Board of Trustees (the “Board”) of PRIMECAP Odyssey Funds (the “Trust”) is comprised of seven Trustees, five of whom are not “interested persons” of the Trust as defined by the Investment Company Act of 1940, as amended (the “Independent Trustees”). In October 2019, the Board of Trustees, including the Independent Trustees, approved aone-year renewal of the Trust’s investment advisory agreement with PRIMECAP Management Company (the “Advisor”) with respect to the series of the Trust (the “Funds”).
50
Additional Information
PRIMECAP Odyssey Funds
(Unaudited) –continued
General Information
As part of the annual contract review process, the Independent Trustees, through counsel to the Trust and the Independent Trustees, requested and received extensive materials, including information related to the nature, extent, and quality of the services provided to the Funds by the Advisor; the short- and long-term performance of each Fund relative to the performance of market indices and other funds in its Morningstar category as selected by Broadridge Financial Solutions (“Broadridge”); the advisory fees paid to the Advisor and the total expense ratio of each Fund compared to the advisory fees and the total expense ratios of other funds in the Fund’s Morningstar category; financial information for the Advisor and information related to the profitability to the Advisor of the investment advisory agreement with the Trust; the extent to which the Advisor expects to achieve economies of scale in connection with the services it provides to each Fund; any ancillary or “fall out” benefits that the Advisor may derive from its relationship with the Funds; and the personnel of the Advisor providing services to the Funds. The Independent Trustees also requested and received information regarding the Advisor’s risk controls, risk evaluation processes, compliance program (including brokerage and trading processes), information technology infrastructure (including cyber security), business continuity plans, and other matters.
The Trust engaged Broadridge to prepare an independent expense and performance analysis for each Fund. Broadridge used Morningstar data to compare the expenses and performance of each Fund to similar funds managed by other advisors identified by Broadridge. The Board reviewed the Broadridge materials, which included comparisons of the performance and risk profile of each Fund to those of relevant market indices and of other funds in the relevant Morningstar institutional and retail categories and in a smaller group of funds selected by Broadridge (each a “peer group”). The Broadridge materials also included for each Fund comparisons of advisory fees and total expenses to those of other funds in the relevant Morningstar category and peer group.
With respect to investment performance, the Trustees noted that the Advisor had made quarterly presentations to the Board regarding the Funds’ portfolio construction, investment strategies, and results. The Trustees also noted that in addition to meeting with the Funds’ portfolio managers on a quarterly basis, they also received presentations from different investment analysts throughout the year on specific investment sectors and each Fund’s investments in those sectors. In considering the renewal of the agreement, the Board also took into account other information it had received at past Board and committee meetings with respect to various matters.
The Independent Trustees reviewed information from counsel to the Trust and the Independent Trustees regarding their responsibilities in considering whether to renew the investment advisory agreement for an additionalone-year period. In connection with their deliberations, the Board considered such information and factors that they believed to be relevant. The Board considered renewal of the investment advisory agreement separately for each Fund, although the Board took into account the common interests of all the Funds in its review. In considering these matters, the Board discussed the renewal of the investment advisory agreement with management, and the Trustees who are not employees of the Advisor met in a private session with counsel to the Trust and the Independent Trustees at which no employees of the Advisor were present.
51
Additional Information
PRIMECAP Odyssey Funds
(Unaudited) –continued
In deciding to approve the renewal of the investment advisory agreement, the Board and the Independent Trustees did not identify a single factor that was controlling. The Board and the Independent Trustees concluded that each of the various factors referred to below favored such approval. The following summary describes the key factors considered by the Independent Trustees and their conclusions that formed the basis for approving the renewal of the investment advisory agreement in light of the legal advice furnished by counsel and their own business judgment. This summary is not inclusive of all of the factors considered, and each Board member did not necessarily attribute the same weight to each factor.
Nature, Extent, and Quality of Services
The Board considered the services provided by the Advisor to the Funds under the investment advisory agreement, including the background, education, and experience of the Advisor’s key portfolio management, compliance, and operational personnel; its overall financial strength and stability; its resources and efforts to retain, attract, and motivate capable personnel to serve the Funds; and the overall general quality and depth of its organization. The Board also took into account the experience, capability, and integrity of the Advisor’s senior management, the time that senior management commits to the Funds, and the Advisor’s demonstrated commitment to the Funds; its investment philosophy and processes, including its brokerage and trading practices; its disaster recovery and contingency planning; its oversight of the Funds’ internal control environment with regard to compliance with applicable laws and regulations; and the significant investment by each portfolio manager in the Funds that he manages, which helps align his interests with those of Fund shareholders. The Board and the Independent Trustees concluded that the nature, extent, and quality of services provided under the investment advisory agreement were of a high level and satisfactory.
Investment Performance
The Board assessed the performance of each Fund compared with the performance of its benchmark(s) and other funds in the Fund’s Morningstar retail category and peer group for theone-year, three-year, five-year andten-year periods ended July 31, 2019. The Board made the following observations in reviewing the Funds’ performance:
| • | The annualized total return of thePRIMECAP Odyssey Stock Fund outperformed the S&P 500 index for the period from the Fund’s inception through July 31, 2019, although it underperformed the S&P 500 index during theone-, three-, five-, andten-year periods ended July 31, 2019, by 4.69%, 0.09%, 0.21% and 0.32%, respectively. The Fund’s annualized total return was above the median of funds in the Morningstar Large Cap Blend category for all periods with the exception of theone-year period. For theone-year period, the Fund’s total return ranked in the 73rd percentile, with a return 3.05% under the median of the category. |
| • | The annualized total returns of thePRIMECAP Odyssey Growth Fund were above the returns of the S&P 500 index for the three-, five-,ten-year and since inception periods ended July 31, 2019, but trailed the S&P 500 for theone-year period by 9.11%. The |
52
Additional Information
PRIMECAP Odyssey Funds
(Unaudited) –continued
Fund outperformed its secondary benchmark, the Russell 1000 Growth Index, for the period from the Fund’s inception through July 31, 2019, although the Fund’s annualized total returns underperformed the Index for the three-, five-, andten-year periods by 1.85%, 1.49% and 0.98%, respectively. The Fund’s performance was above the median of funds in the Morningstar Large Cap Growth category for the five- andten-year periods ended July 31, 2019 but ranked in the 99th and 53rd percentile, respectively, for theone- and three-year periods then ended. For theone- and three-year periods, the Fund’s annualized total return was below the Morningstar Category’s median return by 10.24% and 0.20%, respectively. |
| • | The annualized total returns of thePRIMECAP Odyssey Aggressive Growth Fund were above the returns of the Fund’s primary benchmark, the S&P 500 index, and its secondary benchmark, the Russell Mid Cap Growth Index, for the three-, five-,ten-year and since inception periods ended July 31, 2019. For theone-year period, the Fund’s total return was below the returns of the S&P 500 index and the Russell Mid Cap Growth Index by 8.45% and 14.61%, respectively. The Fund’s performance was above the median of funds in the Morningstar Mid Cap Growth category for all periods with the exception of theone-year period. For theone-year period, the Fund ranked in the 96th percentile and returned 12.45% less than the category median. |
Based on the information provided to them and in consideration of the specific investment objectives and risk profiles of each Fund, the Board and the Independent Trustees concluded that the performance of each Fund was satisfactory.
Advisory Fees and Fund Expenses
The Board reviewed the advisory fees and expenses paid by each Fund compared to those of other funds in the same Morningstar retail category (for the Stock Fund – Large Blend funds; for the Growth Fund – Large Growth funds; and for the Aggressive Growth Fund –Mid-Cap Growth funds), and of other funds in the Fund’s expense peer group, which was selected by Broadridge and was comprised of funds comparable to the Fund with fee structures and characteristics similar to those of the Funds (e.g., no distribution or shareholder servicing fees, and excluding load funds, index and enhanced index funds, funds of funds, and multi-manager funds).
The Independent Trustees observed that the advisory fee of the Stock Fund was below median with respect to other funds in the Morningstar Large Cap Blend retail category and ranked 10th lowest out of 16 funds in the Broadridge selected peer group. The advisory fee of each of the Growth Fund and Aggressive Growth Fund was below the median fees of the funds in the relevant Morningstar retail category and the Fund’s peer group. With respect to the Funds’ total expense ratios, in each case the total expense ratio of the Fund was in the lowest quartile of funds in its selected peer group. The total expense ratios for the Growth and Aggressive Growth Funds were in the lowest quartile relative to their respective Morningstar retail categories, while the Stock Fund’s total expense ratio was in the second lowest quartile of its Morningstar retail category.
53
Additional Information
PRIMECAP Odyssey Funds
(Unaudited) –continued
The Board also reviewed the fees charged by the Advisor to other clients, including other mutual funds for which it providessub-advisory services. The Board considered that although those fees were lower than those charged by the Advisor to the Funds, the differences appropriately reflected the investment, operational, and regulatory differences between advising other clients and the Funds, noting that mutual funds are subject to certain requirements under the 1940 Act that do not apply to the Advisor’s separate account clients. The Board and the Independent Trustees determined that the advisory fees and expenses charged to the Funds were reasonable in consideration of the services provided.
Costs and Profits of the Advisor
The Board reviewed information regarding the Advisor’s financial position and concluded that the Advisor would be able to continue to provide advisory services to the Funds. The Board also reviewed information relating to the Advisor’s profitability. Recognizing the difficulty in evaluating an investment advisor’s profitability with respect to the funds it manages in the context of an advisor with multiple lines of business, and noting that other profitability methodologies might also be reasonable, the Board and the Independent Trustees concluded that the profit of the Advisor from its relationship with each Fund was reasonable. The Board noted that the Advisor had closed the Aggressive Growth Fund in January 2014 to most new investors, limiting the growth of the Fund and consequently future profits to the Advisor as it relates to the Aggressive Growth Fund. In considering the Advisor’s profitability, the Independent Trustees recognized the importance of the profitability of the Advisor, not only in maintaining its own financial condition, but also in maintaining an environment in which it is able to attract and retain talented investment professionals.
Economies of Scale and Other Benefits to the Investment Advisor
The Board and the Independent Trustees noted that the Investment Advisory Agreement provides for a fee breakpoint at $100 million in assets for each Fund. The Board considered that the Advisor had significant assets under management at the time the Funds commenced operations and that the Funds were offered advisory fee rates at inception that reflected scale within the Advisor’s business. The Board also acknowledged various diseconomies of scale experienced by the Advisor as the Funds have grown, including the hiring of additional personnel and the provision of additional services to the Funds including improved technology. The Board and the Independent Trustees concluded that the Advisor had shared any economies of scale it had realized from the Funds with the Funds and their shareholders, through advisory fee breakpoints, the hiring of additional personnel, and the provision of additional services to the Funds.
The Board also considered the benefits received by the Advisor as a result of its relationship with the Funds other than investment advisory fees, including any research received by broker-dealers providing execution services to the Funds, the intangible benefits of the Advisor’s association with the Funds generally, and any favorable publicity arising in connection with the Funds’ performance.
54
Additional Information
PRIMECAP Odyssey Funds
(Unaudited) –continued
Conclusions
Based on their review, including their consideration of each of the factors referred to above, the Board and the Independent Trustees concluded that the compensation payable to the Advisor pursuant to the investment advisory agreement with respect to each Fund is fair and reasonable in light of the services being provided by the Advisor to the Fund and its shareholders and that renewal of the investment advisory agreement with respect to each Fund was in the best interest of the Fund and its shareholders.
55
| PRIMECAP Odyssey Funds (Unaudited) |
Portfolio Managers
PRIMECAP Management Company has five portfolio managers who together have more than 135 years of investment experience. The portfolio managers primarily responsible for overseeing the Funds’ investments are:
| Name | Years of Experience | |||
Theo A. Kolokotrones | 49 | |||
Joel P. Fried | 34 | |||
Alfred W. Mordecai | 22 | |||
M. Mohsin Ansari | 19 | |||
James Marchetti | 14 | |||
Each of these five individuals manages a portion of the PRIMECAP Odyssey Stock Fund, the PRIMECAP Odyssey Growth Fund, and the PRIMECAP Odyssey Aggressive Growth Fund. A portion of each Fund’s assets may be managed by individuals in the Investment Advisor’s research department.
Officers and Trustees
The Trust’s officers, who oversee the Funds’ daily operations, are appointed by the Board of Trustees. The trustees are responsible for the overall management of the Trust, including establishing the Funds’ policies and general supervision and review of their investment activities. The Statement of Additional Information includes additional information about the trustees and is available, without charge, by calling1-800-729-2307 or at the Funds’ website at www.primecap.com.
Executive Officers. The table below sets forth certain information about each of the Trust’s executive officers. The address for each officer is 177 East Colorado Boulevard, 11th Floor, Pasadena, CA 91105.
Name Age | Position(s) Held with Trust | Term of Office; Length of Time Served | Principal Occupation(s) During Past 5 Years | |||
Theo A. Kolokotrones Age: 73 | Co-Chief Executive Officer | Indefinite; Since 09/04 | Chairman, Director, and Portfolio Manager PRIMECAP Management Company | |||
Joel P. Fried Age: 58 | Co-Chief Executive Officer and Trustee | Indefinite; Since 09/04 | President, Director, and Portfolio Manager PRIMECAP Management Company |
56
Management
PRIMECAP Odyssey Funds
(Unaudited) –continued
| Name Age | Position(s) Held with Trust | Term of Office; Length of Time Served | Principal Occupation(s) During Past 5 Years | |||
Alfred W. Mordecai Age: 52 | Co-Chief Executive Officer | Indefinite; Since 10/12 | Vice Chairman, Director, and Portfolio Manager PRIMECAP Management Company | |||
Michael J. Ricks Age: 41 | Chief Financial Officer, Chief Administrative Officer, Secretary, | Indefinite; Since 03/11 | Director of Fund Administration PRIMECAP Management Company | |||
| Chief Compliance Officer, and AML Compliance Officer | Indefinite; Since 02/19 | |||||
“Independent” Trustees. The table below sets forth certain information about each of the trustees of the Trust who is not an “interested person” of the Trust as defined in the 1940 Act (“Independent Trustees”). The address for each Independent Trustee is 177 East Colorado Boulevard, 11th Floor, Pasadena, CA 91105.
| Name Age | Position(s) Held with Trust | Term of Office; Length of Time Served | Principal Occupation(s) During Past 5 Years | Number of Portfolios in Fund Complex Overseen by Trustee(1) | Other Director- ships Held by Trustee | |||||
Benjamin F. Hammon Age: 84 | Chairman of the Board and Trustee | Indefinite; Since 09/04 | Retired; Private investor | 3 | None | |||||
Wayne H. Smith Age: 78 | Chairman of the Audit Committee and Trustee | Indefinite; Since 09/04 | Retired; Private investor | 3 | None | |||||
Joseph G. Uzelac Age: 75 | Trustee | Indefinite; Since 10/07 | Retired; Private investor | 3 | None | |||||
Elizabeth D. Obershaw Age: 59 | Trustee | Indefinite; Since 06/08 | Managing Director, Horsley Bridge Partners, an investment advisor (2007-present) | 3 | None | |||||
J. Blane Grinstead Age: 64 | Trustee | Indefinite; Since 03/19 | Retired; Private investor | 3 | None |
| (1) | Fund Complex includes any funds, series of funds, or trusts that share the same advisor or that hold themselves out to investors as related companies. |
57
Management
PRIMECAP Odyssey Funds
(Unaudited) –continued
“Interested” Trustees. The table below sets forth certain information about each of the trustees of the Trust who is an “interested person” of the Trust as defined by the 1940 Act. The address for each interested trustee is 177 East Colorado Boulevard, 11th Floor, Pasadena, CA 91105.
| Name Age | Position(s) Held with Trust | Term of Office; Length of Time Served | Principal Occupation(s) During Past 5 Years | Number of Portfolios in Fund Complex Overseen by Trustee(1) | Other Director- ships Held by Trustee | |||||
Joel P. Fried(2) Age: 58 | Co-Chief Executive Officer and Trustee | Indefinite; Since 09/04 | President, Director, and Portfolio Manager PRIMECAP Management Company | 3 | None | |||||
Michael Glazer(3) Age: 79 | Trustee | Indefinite; Since 10/19 | Formerly, Partner and Senior Counsel, Morgan, Lewis & Bockius LLP | 3 | None |
| (1) | Fund Complex includes any funds, series of funds, or trusts that share the same advisor or that hold themselves out to investors as related companies. |
| (2) | Mr. Fried is an “interested person” of the Trust, as defined by the 1940 Act, because of hisemploy- ment with PRIMECAP Management Company, the investment advisor to the Trust. |
| (3) | Mr. Glazer is an “interested person” of the Trust, as defined by the 1940 Act, due to his former employment with the Trust’s counsel, Morgan, Lewis & Bockius LLP. |
58
| Privacy Notice PRIMECAP Odyssey Funds |
PRIMECAP Management Company
Maintaining the confidentiality of client personal financial information is very important to PRIMECAP Odyssey Funds (the “Trust”) and PRIMECAP Management Company (the “Advisor”). The Advisor and the Trust may collect several types of nonpublic personal information about investors, including:
| • | Information from forms that investors may fill out and send to the Advisor or the Trust in connection with an account (such as name, address, and social security number). |
| • | Information an investor may give the Advisor or the Trust orally. |
| • | Information about the amount investors have invested in an account. |
| • | Information about any bank account investors may use for transfers between a bank account and a shareholder account. |
The Advisor and the Trust will not sell or disclose client personal information to anyone except as permitted or required by law. For example, information collected may be shared with the independent auditors in the course of the annual audit of the Advisor or the Trust. The Advisor or the Trust may also share this information with the Advisor’s or the Trust’s legal counsel, as deemed appropriate, and with regulators. Finally, the Advisor or the Trust may disclose information about clients or investors at the client’s or investor’s request (for example, by sending duplicate account statements to someone designated by the client or investor), or as otherwise permitted or required by law.
Within the Advisor and the Trust, access to information about clients and investors is restricted to those employees or service providers who need to know the information to service client accounts. The Advisor’s employees are trained to follow its procedures to protect client privacy and are instructed to access information about clients only when they have a business reason to obtain it.
The Advisor and the Trust reserve the right to change this privacy policy in the future, but we will not disclose investor nonpublic personal information except as required or permitted by law without giving the investor an opportunity to instruct us not to do so.
Investment Advisor
PRIMECAP MANAGEMENT COMPANY
177 East Colorado Boulevard, 11th Floor
Pasadena, California 91105
•
Distributor
QUASAR DISTRIBUTORS, LLC
777 East Wisconsin Avenue
Milwaukee, Wisconsin 53202
•
Custodian
U.S. BANK, N.A.
1555 North RiverCenter Drive, Suite 302
Milwaukee, Wisconsin 53212
•
Transfer Agent
U.S. BANCORP FUND SERVICES, LLC
615 East Michigan Street, 3rd Floor
Milwaukee, Wisconsin 53202
•
Administrator
U.S. BANCORP FUND SERVICES, LLC
2020 East Financial Way, Suite 100
Glendora, California 91741
•
Legal Counsel
MORGAN, LEWIS & BOCKIUS LLP
300 South Grand Avenue, Twenty-Second Floor
Los Angeles, California 90071
•
Independent Registered Public Accounting Firm
PRICEWATERHOUSECOOPERS LLP
601 South Figueroa Street, Suite 900
Los Angeles, California 90017
This report is intended for the shareholders of the PRIMECAP Odyssey Funds and may not be used as sales literature unless preceded or accompanied by a current prospectus.
Past performance results shown in this report should not be considered a representation of future performance. Share price and returns will fluctuate so that shares, when redeemed, may be worth more or less than their original cost. Statements and other information herein are dated and are subject to change.
PRIMECAP, PRIMECAP Odyssey, and the PRIMECAP Odyssey logo are trademarks of PRIMECAP Management Company.
Item 2. Code of Ethics.
The registrant has adopted a code of ethics that applies to the registrant’s principal executive officers and principal financial officer. The registrant has not made any amendments to its code of ethics during the period covered by this report. The registrant has not granted any waivers from any provisions of the code of ethics during the period covered by this report.
The registrant undertakes to provide to any person without charge, upon request, a copy of its code of ethics by mail when such person calls the registrant at1-800-729-2307.
Item 3. Audit Committee Financial Expert.
The registrant’s Board of Trustees has determined that there is at least one audit committee financial expert serving on its audit committee. Wayne Smith is the registrant’s “audit committee financial expert” and is considered to be “independent” as each term is defined in Item 3 ofForm N-CSR.
Item 4. Principal Accountant Fees and Services.
The registrant has engaged its principal accountant, PricewaterhouseCoopers LLP,to perform audit services, audit-related services, and tax services during the past two fiscal years. “Audit services” refer to performing an audit of the registrant’s annual financial statements or services that are normally provided by the accountant in connection with statutory and regulatory filings or engagements for those fiscal years. “Audit-related services” refer to the assurance and related services by the principal accountant that are reasonably related to the performance of the audit. “Tax services” refer to professional services rendered by the principal accountant for tax compliance, tax advice, and tax planning and specifically relate to the accountant’s review of the registrant’s federal and state tax returns. There were no other services provided by the principal accountant to the registrant during the past two fiscal years. The following table details the aggregate fees billed or expected to be billed to the registrant for each of the last two fiscal years for audit fees, audit-related fees, tax fees and other fees by the principal accountant.
| FYE 10/31/2019 | FYE 10/31/2018 | |||||||
Audit Fees | $ | 128,340 | $ | 124,600 | ||||
Audit-Related Fees | $ | 0 | $ | 0 | ||||
Tax Fees | $ | 16,392 | $ | 15,915 | ||||
All Other Fees | $ | 0 | $ | 0 | ||||
The audit committee has adoptedpre-approval policies and procedures that require the audit committee topre-approve all audit andnon-audit services of the registrant, including services provided to any entity affiliated with the registrant. All services werepre-approved and no waivers to thepre-approval requirement were made.
The percentage of fees billed by PricewaterhouseCoopers applicable tonon-audit services pursuant to waiver ofpre-approval requirement were as follows:
| FYE 10/31/2019 | FYE 10/31/2018 | |||||||
Audit-Related Fees | 0 | % | 0 | % | ||||
Tax Fees | 0 | % | 0 | % | ||||
All Other Fees | 0 | % | 0 | % | ||||
All of the principal accountant’s hours spent on auditing the registrant’s financial statements were attributed to work performed byfull-time permanent employees of the principal accountant.
The following table indicates thenon-audit fees billedor expected to be billed by the registrant’s accountant for services to the registrant and to the registrant’s investment adviser (and any entity controlling, controlled by, or under common control with the investment adviser) for the last two years. The audit committee of the board of trustees/directors has considered whether the provision ofnon-audit services that were rendered to the registrant’s investment adviser is compatible with maintaining the principal accountant’s independence and has concluded that the provision of suchnon-audit services by the accountant has not compromised the accountant’s independence.
Non-Audit Related Fees | FYE 10/31/2019 | FYE 10/31/2018 | ||||||
Registrant | $ | 16,392 | $ | 15,915 | ||||
Registrant’s Investment Adviser | $ | 0 | $ | 0 | ||||
Item 5. Audit Committee of Listed Registrants.
Not applicable to registrants who are not listed issuers (as defined in Rule10A-3 under the Securities Exchange Act of 1934).
Item 6. Investments.
The registrant’s Schedule of Investments is included as part of the report to shareholders filed under Item 1 of this Form.
Item 7. Disclosure of Proxy Voting Policies and Procedures forClosed-End Management Investment Companies.
Not applicable toopen-end investment companies.
Item 8. Portfolio Managers ofClosed-End Management Investment Companies.
Not applicable toopen-end investment companies.
Item 9. Purchases of Equity Securities by Closed-End Management Investment Company and Affiliated Purchasers.
Not applicable toopen-end investment companies.
Item 10. Submission of Matters to a Vote of Security Holders.
There have been no material changes to the procedures by which shareholders may recommend nominees to the registrant’s board of trustees.
Item 11. Controls and Procedures.
| (a) | The Registrant’sCo-Chief Executive Officers and Chief Financial Officer have reviewed the Registrant’s disclosure controls and procedures (as defined in Rule30a-3(c) under the Investment Company Act of 1940 (the “Act”)) as of a date within 90 days of the filing of this report, as required by Rule30a-3(b) under the Act and Rules13a-15(b) or15d-15(b) under the Securities Exchange Act of 1934. Based on their review, such officers have concluded that the disclosure controls and procedures are effective in ensuring that information required to be disclosed in this report is appropriately recorded, processed, summarized and reported and made known to them by others within the Registrant and by the Registrant’s service provider. |
| (b) | There were no changes in the Registrant’s internal control over financial reporting (as defined in Rule30a-3(d) under the Act) that occurred during the second fiscal quarter of the period covered by this report that have materially affected, or are reasonably likely to materially affect, the Registrant’s internal control over financial reporting. |
Item 12. Disclosure of Securities Lending Activities forClosed-End Management Investment Companies.
Not applicable toopen-end investment companies.
Item 13. Exhibits.
| (a) | (1)Any code of ethics or amendment thereto, that is the subject of the disclosure required by Item 2, to the extent that the registrant intends to satisfy Item 2 requirements through filing an exhibit.Incorporated by reference to the Registrant’sForm N-CSR filed January 5, 2006. |
(2)A separate certification for each principal executive and principal financial officer pursuant to Rule30a-2(a) under the Act (17 CFR270.30a-2(a)).Filed herewith.
(3)Any written solicitation to purchase securities under Rule 23c-1 under the Act sent or given during the period covered by the report by or on behalf of the registrant to 10 or more persons.Not applicable toopen-end investment companies.
(4)Change in the registrant’s independent public accountant.There was no change in the registrant’s independent public accountant for the period covered by this report.
| (b) | Certifications pursuant to Section 906 of the Sarbanes-Oxley Act of 2002. Furnished herewith. |
SIGNATURES
Pursuant to the requirements of the Securities Exchange Act of 1934 and the Investment Company Act of 1940, the registrant has duly caused this report to be signed on its behalf by the undersigned, thereunto duly authorized.
PRIMECAP Odyssey Funds | ||||||
| By | /s/ Joel P. Fried | |||||
| Joel P. Fried,Co-Chief Executive Officer | ||||||
| Date | December 19, 2019 | |||||
| By | /s/ Theo A. Kolokotrones | |||||
| Theo A. Kolokotrones,Co-Chief Executive Officer | ||||||
| Date | December 19, 2019 | |||||
| By | /s/ Alfred W. Mordecai | |||||
| Alfred W. Mordecai,Co-Chief Executive Officer | ||||||
| Date | December 19, 2019 | |||||
Pursuant to the requirements of the Securities Exchange Act of 1934 and the Investment Company Act of 1940, this report has been signed below by the following persons on behalf of the registrant and in the capacities and on the dates indicated.
| By | /s/ Joel P. Fried | |||||
| Joel P. Fried,Co-Chief Executive Officer | ||||||
| Date | December 19, 2019 | |||||
| By | /s/ Theo A. Kolokotrones | |||||
| Theo A. Kolokotrones,Co-Chief Executive Officer | ||||||
| Date | December 19, 2019 | |||||
| By | /s/ Alfred W. Mordecai | |||||
| Alfred W. Mordecai,Co-Chief Executive Officer | ||||||
| Date | December 19, 2019 | |||||
| By | /s/ Michael J. Ricks | |||||
| Michael J. Ricks, Chief Financial Officer | ||||||
| Date | December 19, 2019 | |||||