As filed with the Securities and Exchange Commission on December 23, 2022
UNITED STATES
SECURITIES AND EXCHANGE COMMISSION
Washington, D.C. 20549
FORM N-CSR
CERTIFIED SHAREHOLDER REPORT OF REGISTERED
MANAGEMENT INVESTMENT COMPANIES
Investment Company Act file number 811-21597
PRIMECAP Odyssey Funds
(Exact name of registrant as specified in charter)
177 East Colorado Boulevard, 11th Floor
Pasadena, CA 91105
(Address of principal executive offices) (Zip code)
Michael J. Ricks
PRIMECAP Management Company
177 East Colorado Boulevard, 11th Floor
Pasadena, CA 91105
(Name and address of agent for service)
(626) 304-9222
Registrant’s telephone number, including area code
Date of fiscal year end: October 31
Date of reporting period: October 31, 2022
Item 1. Reports to Stockholders.
Item 1. Reports to Stockholders.
ANNUAL REPORT
For the Year Ended October 31, 2022

PRIMECAP ODYSSEY STOCK (POSKX)
PRIMECAP ODYSSEY GROWTH (POGRX)
PRIMECAP ODYSSEY AGGRESSIVE GROWTH (POAGX)
 | PRIMECAP Odyssey Funds |
| 2 | ||||
| 10 | ||||
| 10 | ||||
| 11 | ||||
| 12 | ||||
| 13 | ||||
| 15 | ||||
| 15 | ||||
| 20 | ||||
| 26 | ||||
| 34 | ||||
| 35 | ||||
| 36 | ||||
| 36 | ||||
| 37 | ||||
| 38 | ||||
| 39 | ||||
| 39 | ||||
| 40 | ||||
| 41 | ||||
| 42 | ||||
| 51 | ||||
| 52 | ||||
| 54 | ||||
| 60 | ||||
1
| PRIMECAP Odyssey Funds |
Dear Fellow Shareholders,
For the fiscal year ended October 31, 2022, the PRIMECAP Odyssey Stock Fund, PRIMECAP Odyssey Growth Fund, and PRIMECAP Odyssey Aggressive Growth Fund produced total returns of -11.33%, -17.61%, and -28.21%, respectively. The unmanaged S&P 500® Index produced a total return of -14.61% during the period. Sector allocation benefited results relative to the S&P 500®, while the impact from stock selection varied widely by Fund.
The fiscal year marked an abrupt degradation in market conditions. The year began with a disruptive bout of COVID-19, courtesy of the contagious omicron variant that peaked in mid-January. But in this case the prognosis was mostly good news, and thereafter Covid’s inordinate societal influence largely faded.
Geopolitical hostility and widespread inflation, however, supplanted COVID-19 as fresh sources of market anxiety. Russia’s invasion-turned-quagmire in Ukraine devastated the region and posed substantial risks to Europe and the world. Meanwhile, at home, stimulus-driven excess demand continued to overwhelm structurally-impaired supply chains and an inadequate labor pool; in other words, too much money chased too few goods (and services). Inflation thus broadened and worsened during the period, notching 40-year highs, as price spikes in goods and commodities hemorrhaged into stickier categories, like wages and services.
The Federal Reserve (the “Fed,”) chagrined by its earlier complacency in the face of ramping inflation, executed a dramatic hawkish pivot, punctuated by an ongoing series of aggressive rate hikes. The real economy stalled somewhat; despite solid nominal economic growth and a tight labor market, real gross domestic product declined during the first half of 2022. Yet the Fed resolved to further reduce economic activity, raising the prospects of a hard landing.
Equities unsurprisingly faltered amid this tumult, plummeting more than 25 percent from their January peak to their October lows before staging a late rally. Elevated inflation and rising interest rates weighed especially on high-valuation growth stocks; the communication services (-41%), consumer discretionary (-29%), and information technology (-20%) sectors lagged the market. Energy (+65%) fared best, a repeat of last fiscal year’s accolade, boosted by yet higher oil prices. Defensive sectors also generally outperformed, including consumer staples (+5%), utilities (+3%), and health care (+1%).
The Funds again endured a mixed relative report card, with only the Stock Fund eclipsing the benchmark. This divergent performance persisted from April’s half-year results, and it echoed last year’s rank ordering, as well. For two consecutive years, value stocks have outpaced growth stocks, with the gap widening substantially this fiscal year. Indeed, consistent with our semiannual commentary, the Growth and Aggressive Growth Funds outperformed size-specific, growth-centric indices for the full year despite trailing the broader market.
The Funds’ sector positioning continues to evolve, with information technology now a very modest underweight position in the Aggressive Growth Fund, a new development; the Stock and
2
Letter to Shareholders
PRIMECAP Odyssey Funds
continued
Growth Funds had already expressed an underweight view. Otherwise, each of the Funds held an overweight position in the health care and industrials sectors, and an underweight position in the energy, real estate, consumer staples, communication services, materials, and utilities sectors. The Growth Fund was also underweight the financials and consumer discretionary sectors; of these, the Stock Fund was overweight financials while the Aggressive Growth Fund was overweight consumer discretionary.
A more detailed discussion of the results of each PRIMECAP Odyssey Fund follows.
PRIMECAP Odyssey Stock Fund
For the fiscal year ended October 31, 2022, the Stock Fund’s total return of -11.33% exceeded the S&P 500®’s total return of -14.61%. Relative to the S&P 500®, sector allocation and stock selection both provided tailwinds to Fund performance.
All three Odyssey Funds benefited from favorable sector allocation, albeit to different degrees. The Stock Fund was the best-positioned Fund, owing chiefly to its more limited exposure to communication services (3% of average Stock Fund assets versus 9% for the index), the worst-performing sector, and a more substantial industrials overweight position (18% versus 8%). As with the other Funds, the Stock Fund also benefited from a large overweight position in health care (24% versus 14%) and a modest cash position (4%). Partially offsetting these exposures were underweight positions in the three best-performing sectors, energy (2% versus 4%), consumer staples (1% versus 6%), and utilities (0% versus 3%).
The Stock Fund also generated favorable stock selection results, in contrast to the Growth and Aggressive Growth Funds. Health care was a primary differentiator, as the Stock Fund’s greater concentration in large-capitalization biopharmaceuticals fared better than its peer Funds’ outsized ownership of smaller-capitalization biotechnology stocks. Eli Lilly (+44%) delivered another stellar performance on the back of its new diabetes and obesity drug, Mounjaro; the stock finished the period as the largest investment in all three Funds, but the Stock Fund position was most pronounced. Complementing Eli Lilly were four additional Top 10 holdings from the health care sector: two pharmaceutical companies (Bristol-Myers Squibb +37% and Astrazeneca -3%) and two biotechnology giants (Amgen +35% and Biogen +6%).
Stock selection elsewhere was more mixed. All three Funds largely avoided Meta (-71%) and Netflix (-58%) in communication services, while the Stock Fund’s distinctly smaller position in Alphabet (-36%) provided an additional relative boost. Within consumer discretionary, no exposure to Amazon (-39%) and limited ownership of Tesla (-39%) roughly offset disappointing performances from CarMax (-54%) and Sony (-41%). Within information technology, slumping PC demand doomed Intel (-40%) while no ownership in heavyweight Apple (+3%) also hurt; this combined headwind more than offset a strong year from Flex (+16%). Finally, Raymond James (+21%) and AECOM (+11%) logged strong performances within financials and industrials, respectively.
3
Letter to Shareholders
PRIMECAP Odyssey Funds
continued
The top 10 holdings, which collectively represented 32.8% of the portfolio at the period end, are listed below:
| PRIMECAP Odyssey Stock Fund Top 10 Holdings as of 10/31/22 | Ending % of Total Portfolio* | |||
Eli Lilly & Co. | 7.8 | |||
AstraZeneca PLC – ADR | 4.0 | |||
AECOM | 3.9 | |||
Amgen, Inc. | 2.9 | |||
Biogen, Inc. | 2.7 | |||
Wells Fargo & Co. | 2.6 | |||
Microsoft Corp. | 2.4 | |||
Bristol-Myers Squibb Co. | 2.3 | |||
Flex Ltd. | 2.1 | |||
FedEx Corp. | 2.1 | |||
Total % of Portfolio | 32.8 | |||
| * | The percentage is calculated by using the ending market value of the security divided by the ending market value of the total investments of the Fund. |
PRIMECAP Odyssey Growth Fund
For the fiscal year ended October 31, 2022, the Growth Fund returned -17.61%, trailing the S&P 500®’s -14.61% total return but exceeding the Russell 1000 Growth Index’s total return of -24.60%. Unfavorable stock selection more than offset favorable sector allocation relative to the S&P 500®.
Sector allocation was slightly less advantageous than that of the Stock Fund given more exposure to communication services (5%) and less to industrials (13%). These incremental headwinds were partially offset by the Growth Fund’s larger health care overweight (30%) and less pronounced energy underweight (3%).
Stock selection was unfavorable overall. Despite several familiar health care outperformers –Eli Lilly, Amgen, and Biogen, plus BioMarin (+9%) – the Growth Fund’s greater biotechnology exposure detracted from results, especially Nektar (-75%) and BeiGene (-53%). Selection within consumer discretionary and information technology was also notably more unfavorable, with large positions in Alibaba (-61%) and Splunk (-50%), respectively, weighing heavily on sector-level performance.
4
Letter to Shareholders
PRIMECAP Odyssey Funds
continued
The top 10 holdings, which collectively represented 30.1% of the portfolio at the period end, are listed below:
| PRIMECAP Odyssey Growth Fund Top 10 Holdings as of 10/31/22 | Ending % of Total Portfolio* | |||
Eli Lilly & Co. | 6.5 | |||
AECOM | 3.5 | |||
Biogen, Inc. | 3.2 | |||
Raymond James Financial, Inc. | 3.1 | |||
Amgen, Inc. | 2.7 | |||
Alphabet Inc. – Class A & C | 2.6 | |||
ABIOMED, Inc. | 2.3 | |||
BioMarin Pharmaceutical, Inc. | 2.1 | |||
Insulet Corp. | 2.1 | |||
Micron Technology, Inc. | 2.0 | |||
Total % of Portfolio | 30.1 | |||
| * | The percentage is calculated by using the ending market value of the security divided by the ending market value of the total investments of the Fund. |
PRIMECAP Odyssey Aggressive Growth Fund
For the fiscal year ended October 31, 2022, the Aggressive Growth Fund’s total return of -28.21% trailed the S&P 500®’s total return of -14.61% but slightly exceeded the Russell Midcap Growth Index’s total return of -28.94%. Unfavorable stock selection was the primary driver of underperformance relative to the S&P 500®, while sector allocation provided a modest offset.
The Aggressive Growth Fund’s sector allocation benefit was quite limited. The main culprit relative to its Odyssey Fund peers was a reduced position (less than 1% of average assets) in the high-performing energy sector. Likewise, even more so than the Growth Fund, the Fund suffered from greater exposure to communication services (6%) and less exposure to industrials (12%).
Stock selection was more unfavorable than the Growth Fund, albeit for similar reasons. As its name implies, the Fund’s more ‘aggressive’ growth orientation amid an unforgiving landscape for growth stocks proved especially punitive relative to the benchmark. Health care selection was a significant headwind, as the familiar winners (such as Eli Lilly and Biogen) were less consequential while several key holdings struggled. BioNTech (-50%) retrenched after a two-year Covid-fueled explosion; Pulmonx (-66%) plus larger positions in Nektar and BeiGene also detracted from results. Rhythm Pharmaceuticals (+119%) was a notable offset, as its drug for severe obesity, Imcivree, cleared several milestones. Within information technology and consumer discretionary, growth stocks again
5
Letter to Shareholders
PRIMECAP Odyssey Funds
continued
dragged on relative results. The collapses in HubSpot (-63%) and MaxLinear (-51%), for instance, were representative of widespread weakness in high-multiple software and semiconductor stocks, respectively. And positions in Tesla and its Chinese EV competitor, Xpeng (-86%), contributed to underperformance in the consumer discretionary sector.
The top 10 holdings, which collectively represented 30.4% of the portfolio at the period end, are listed below:
| PRIMECAP Odyssey Aggressive Growth Fund Top 10 Holdings as of 10/31/22 | Ending % of Total Portfolio* | |||
Eli Lilly & Co. | 4.4 | |||
Biogen, Inc. | 3.6 | |||
Micron Technology, Inc. | 3.0 | |||
Seagen, Inc. | 3.0 | |||
Tesla, Inc. | 2.9 | |||
BioNTech SE – ADR | 2.8 | |||
Sony Group Corp. – ADR | 2.8 | |||
ABIOMED, Inc. | 2.7 | |||
AECOM | 2.7 | |||
BioMarin Pharmaceutical, Inc. | 2.5 | |||
Total % of Portfolio | 30.4 | |||
| * | The percentage is calculated by using the ending market value of the security divided by the ending market value of the total investments of the Fund. |
Outlook
Following late October’s market rebound, the S&P 500® Index’s valuation returned to modestly elevated levels (16.7x forward P/E versus 15.5x 20-year average). But interest rates soared during the period, undermining a key rationale for above-average equity multiples; the 4.1% 10-year Treasury yield is now comparable to its longer-term historical norm. Meanwhile, recent earnings reports have generally disappointed, and the stronger dollar has a direct negative impact on near-term earnings given companies’ substantial foreign exposures. Forward earnings expectations are thus likely too high. Additionally, we remain wary of above-average macroeconomic risks, most obviously a Fed intent on reducing aggregate demand. These concerns leave us somewhat cautious overall, even after the market’s recalibration.
More broadly, we assess this year’s developments as a potential paradigm shift in the market. Notwithstanding an occasional glitch, the decade-plus since the Great Recession had been remarkably benign: accommodative financial conditions, steady if modest global economic
6
Letter to Shareholders
PRIMECAP Odyssey Funds
continued
growth, and a relentless equity bull market. A pliant Fed, offering investors quasi-insurance in the form of a “Fed put,” underwrote a “buy the dip” mentality that became ubiquitous.
But the COVID-19 era, both the virus and especially the policy response, ultimately sowed enough dislocation to tip the proverbial apple cart. Ironically, it was Covid’s abrupt fade – its welcome shift to endemic status – that applied the final push. The mass normalization of society, coupled with two years of excessive money supply growth, unleashed the worst inflation in forty years.
The hallmarks of the prior paradigm – low interest rates, inflation, and growth – bred a certain type of winner. Big Tech stocks were perhaps the ultimate winners, highlighted by the ascendance of FAANG stocks (Apple, Amazon, Alphabet, Meta, and Netflix) – plus a few select peers. A new paradigm would presumably upend this dynamic, as investors migrate from yesterday’s darlings to fresh leadership. And, as previously mentioned, these stocks indeed struggled this year; Meta, Netflix, Amazon, and Alphabet all badly lagged the market’s decline.
That said, picking the next winners is never straightforward. Despite largely avoiding Big Tech weakness, the Growth and Aggressive Growth Funds still struggled in relative terms due to their own idiosyncratic miscues. The Funds’ unconventional ownership of small-capitalization biotechnology and Chinese technology stocks, for instance, discussed at length in recent letters, has fared poorly of late. The Funds continue to own numerous beaten-down stocks in these industries.
The Funds also own underappreciated successes, however, including Eli Lilly, the Funds’ largest position. Lilly has long been a meaningful Fund position – it was the Stock and Growth Funds’ largest holding at the start of the year, and a Top 10 Aggressive Growth Fund position, as well. Its outsized gains during the period (+44%) catapulted the stock to the top of all three Funds, and it finished the period between 4 and 8 percent of each Fund’s year-end assets, multiples above its benchmark weighting of less than 1 percent.
Like several Fund stock narratives, the Lilly story began nearly two decades ago. The Stock and Growth Funds initiated positions in the 2000s as Lilly was approaching patent cliffs for its so-called “twin towers” of Zyprexa and Cymbalta. The market, foreseeing a collapse in revenue and earnings, assigned Lilly an anemic valuation. But this ignored a key plotline: the company’s earnings were disproportionately depressed by healthy R&D spend, and its promising pipeline had huge potential. Looking through our long-term lens, we identified this latent opportunity, which had been obscured by the market’s obsession with near-term dynamics. It took time, but by the mid-2010s Lilly had returned to robust revenue growth on the back of a stable of new products. Its earnings climbed and its multiple expanded.
But the story was not over. The Funds stayed invested (and the Aggressive Growth Fund joined the bloc) because of our optimism regarding two pipeline drugs that were largely overlooked by Wall Street’s sell-side consensus, each with transformative blockbuster potential: tirzepatide
7
Letter to Shareholders
PRIMECAP Odyssey Funds
continued
(brand name Mounjaro) for obesity and donanemab for Alzheimer’s. Since then, tirzepatide surpassed trial expectations, achieving approval in diabetes with additional approval in obesity expected next year. And donanemab, despite skepticism regarding the beta amyloid hypothesis, continues to make regulatory progress. Following in Biogen’s choppy wake, donanemab faces ample investor doubt – but there persists an enormous unmet need for a desperate Alzheimer’s population, and the commercial opportunity is staggering. The stock’s spectacular run has generated a superficially-high valuation (40.0x forward P/E), but earnings could plausibly quadruple in the mid-term as these drugs are absorbed by Lilly’s income statement. We believe that combined with a best-in-class management team, these two drugs (and the rest of Lilly’s pipeline) can deliver another decade-long chapter in this remarkable success story.
Meanwhile, in stark juxtaposition, the Funds have no exposure to Apple. Unlike its Big Tech peers, Apple has thus far avoided a major stumble. Its market capitalization is north of two trillion dollars, and it now represents roughly 7 percent of the S&P 500® – a record-high weighting for any constituent since 1980. The company’s multiple re-rated higher pre-Covid and valuation has sustained at elevated levels (24.3x forward P/E). Apple is a premier brand that has made a habit of revolutionizing the consumer electronics industry. But it undeniably benefited from COVID-19, and its mid-term earnings outlook is uninspiring – in contrast to Lilly’s imminent inflection.
Each of these two Fund “positions” – a massive Lilly overweight and corresponding Apple underweight – is a material departure from the benchmark. Each position embodies a high-conviction, inherently contrarian belief. Such deviation is emblematic of the Funds’ differentiated investment philosophy and process. And on the eve – or in the midst – of a paradigm change, we prefer the Funds’ distinctive portfolios to the benchmark status quo.
Tomorrow’s longer-term winners are, as always, uncertain. The contours of this potential new paradigm have yet to take shape. Rapidly rising rates tend to break things, and we expect wreckage if the Fed perseveres. But eventually we believe a less Fed-centric market will arise, one where fundamentals and valuations feature more prominently than last decade’s artificial backstop. We are optimistic our holdings’ long-term fundamentals and attractive valuations will benefit from this evolution.
Sincerely,
PRIMECAP Management Company
November 6, 2022
Past performance is not a guarantee of future results.
The funds invest in smaller companies, which involve additional risks such as limited liquidity and greater volatility. All funds may invest in foreign securities, which involves greater volatility and political, economic and currency risks and differences in accounting methods. Mutual fund investing involves risk, and loss of principal is possible. Growth stocks typically are more volatile than value stocks; however, value stocks have a lower expected growth rate in earnings and sales.
8
Letter to Shareholders
PRIMECAP Odyssey Funds
continued
Please refer to the Schedule of Investments for details of fund holdings. Fund holdings and sector allocations are subject to change at any time and are not recommendations to buy or sell any security.
The S&P 500® is a market capitalization-weighted index of 500 large-capitalization stocks commonly used to represent the U.S. equity market. The Russell 1000 Growth Index is an index that measures the performance of those Russell 1000 companies with higher price-to-book ratios and higher forecasted growth values (the Russell 1000 Index measures the performance of the large-cap segment of the U.S. equity universe). The Russell Midcap Growth Index measures the performance of those Russell Midcap companies with higher price-to-book ratios and higher forecasted growth values. You cannot invest directly in an index.
Earnings per share (EPS) is calculated by taking the total earnings divided by the number of shares outstanding.
Price-to-earnings (P/E) ratio is calculated by dividing the current share price of a stock by its earnings per share.
Earnings growth is not a prediction of a fund’s future performance.
The information provided herein represents the opinions of PRIMECAP Management Company and is not intended to be a forecast of future events, a guarantee of future results, or investment advice.
9
|
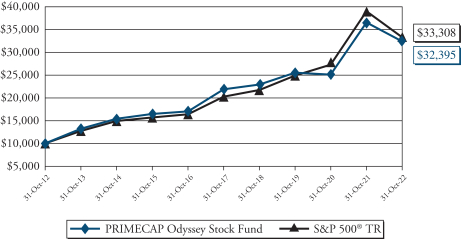
The chart below illustrates the performance of a hypothetical $10,000 investment made on October 31, 2012 and is not intended to imply any future performance. The returns shown do not reflect the deduction of taxes that a shareholder would pay on fund distributions or the redemption of fund shares. The chart assumes reinvestment of dividends and capital gains for the fund and dividends for the index.
| Total Return Period Ended October 31, 2022 | ||||||||||||||||
| 1 Year | Annualized 5 Year | Annualized 10 Year | Annualized Since Inception^ | |||||||||||||
Stock Fund | -11.33% | 8.15% | 12.47% | 9.83% | ||||||||||||
S&P 500®* | -14.61% | 10.44% | 12.79% | 9.25% | ||||||||||||
Performance data quoted represents past performance and does not guarantee future results. The investment return and principal value of an investment will fluctuate so that an investor’s shares, when redeemed, may be worth more or less than their original cost. Current performance of the fund may be lower or higher than the performance quoted. Performance data current to the most recent month end may be obtained by calling 1-800-729-2307.
| * | The S&P 500® is a market capitalization-weighted index of 500 large-capitalization stocks commonly used to represent the U.S. equity market. |
| ^ | November 1, 2004 |
10
| Performance Graphs |
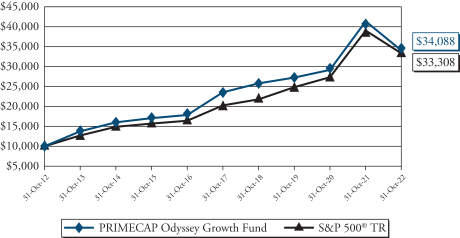
The chart below illustrates the performance of a hypothetical $10,000 investment made on October 31, 2012 and is not intended to imply any future performance. The returns shown do not reflect the deduction of taxes that a shareholder would pay on fund distributions or the redemption of fund shares. The chart assumes reinvestment of dividends and capital gains for the fund and dividends for the index.
| Total Return Period Ended October 31, 2022 | ||||||||||||||||
| 1 Year | Annualized 5 Year | Annualized 10 Year | Annualized Since Inception^ | |||||||||||||
Growth Fund | -17.61% | 7.66% | 13.05% | 10.39% | ||||||||||||
S&P 500®* | -14.61% | 10.44% | 12.79% | 9.25% | ||||||||||||
Performance data quoted represents past performance and does not guarantee future results. The investment return and principal value of an investment will fluctuate so that an investor’s shares, when redeemed, may be worth more or less than their original cost. Current performance of the fund may be lower or higher than the performance quoted. Performance data current to the most recent month end may be obtained by calling 1-800-729-2307.
| * | The S&P 500® is a market capitalization-weighted index of 500 large-capitalization stocks commonly used to represent the U.S. equity market. |
| ^ | November 1, 2004 |
11
| Performance Graphs |
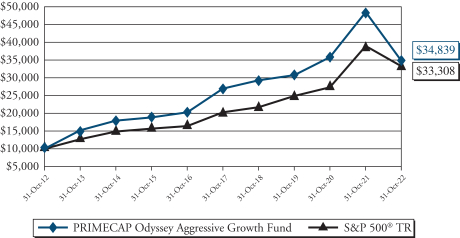
The chart below illustrates the performance of a hypothetical $10,000 investment made on October 31, 2012 and is not intended to imply any future performance. The returns shown do not reflect the deduction of taxes that a shareholder would pay on fund distributions or the redemption of fund shares. The chart assumes reinvestment of dividends and capital gains for the fund and dividends for the index.
| Total Return Period Ended October 31, 2022 | ||||||||||||||||
| 1 Year | Annualized 5 Year | Annualized 10 Year | Annualized Since Inception^ | |||||||||||||
Aggressive Growth Fund | -28.21% | 5.27% | 13.29% | 11.47% | ||||||||||||
S&P 500®* | -14.61% | 10.44% | 12.79% | 9.25% | ||||||||||||
Performance data quoted represents past performance and does not guarantee future results. The investment return and principal value of an investment will fluctuate so that an investor’s shares, when redeemed, may be worth more or less than their original cost. Current performance of the fund may be lower or higher than the performance quoted. Performance data current to the most recent month end may be obtained by calling 1-800-729-2307.
| * | The S&P 500® is a market capitalization-weighted index of 500 large-capitalization stocks commonly used to represent the U.S. equity market. |
| ^ | November 1, 2004 |
12
| PRIMECAP Odyssey Funds |
PRIMECAP Odyssey Stock Fund
Communication Services | 2.8% | |||
Consumer Discretionary | 9.0% | |||
Consumer Staples | 1.2% | |||
Energy | 2.9% | |||
Financials | 12.1% | |||
Health Care | 27.8% | |||
Industrials | 18.3% | |||
Information Technology | 20.0% | |||
Materials | 2.3% | |||
Short-Term Investments, net of Liabilities in Excess of Other Assets | 3.6% | |||
Total | 100.0% |
PRIMECAP Odyssey Growth Fund
Communication Services | 4.5% | |||
Consumer Discretionary | 10.4% | |||
Consumer Staples | 0.2% | |||
Energy | 3.5% | |||
Financials | 8.6% | |||
Health Care | 34.4% | |||
Industrials | 13.5% | |||
Information Technology | 21.7% | |||
Materials | 0.7% | |||
Rights (Health Care) | 0.0% | |||
Short-Term Investments, net of Liabilities in Excess of Other Assets | 2.5% | |||
Total | 100.0% |
The tables above list sector allocations as a percentage of each fund’s total net assets as of October 31, 2022. The management report may make reference to average allocations during the period. As a result, the sector allocations above may differ from those discussed in the management report.
13
Sector Breakdown
PRIMECAP Odyssey Funds
continued
PRIMECAP Odyssey Aggressive Growth Fund
Communication Services | 5.5% | |||
Consumer Discretionary | 11.8% | |||
Consumer Staples | 0.0% | |||
Energy | 1.2% | |||
Financials | 5.0% | |||
Health Care | 35.4% | |||
Industrials | 12.7% | |||
Information Technology | 25.1% | |||
Materials | 0.8% | |||
Real Estate | 0.1% | |||
Preferred Stocks (Financials) | 0.0% | |||
Warrants (Materials) | 0.0% | |||
Rights (Health Care) | 0.0% | |||
Short-Term Investments, net of Liabilities in Excess of Other Assets | 2.4% | |||
Total | 100.0% |
The table above lists sector allocations as a percentage of the fund’s total net assets as of October 31, 2022. The management report may make reference to average allocations during the period. As a result, the sector allocations above may differ from those discussed in the management report.
14
| October 31, 2022 |
| Shares | Value | |||||||
| COMMON STOCKS – 96.4% | ||||||||
| Communication Services – 2.8% | ||||||||
| 354,030 | Activision Blizzard, Inc. | $ | 25,773,384 | |||||
| 372,480 | Alphabet, Inc. – Class A (a) | 35,203,085 | ||||||
| 490,600 | Alphabet, Inc. – Class C (a) | 46,440,196 | ||||||
| 138,600 | Comcast Corp. – Class A | 4,399,164 | ||||||
| 75,200 | Meta Platforms, Inc. – Class A (a) | 7,005,632 | ||||||
| 300,000 | Nintendo Co. Ltd. – JPY | 12,246,545 | ||||||
| 271,600 | Walt Disney Co. (The) (a) | 28,936,264 | ||||||
|
| |||||||
| 160,004,270 | ||||||||
|
| |||||||
| Consumer Discretionary – 9.0% | ||||||||
| 424,100 | Bath & Body Works, Inc. | 14,156,458 | ||||||
| 369,100 | Brinker International, Inc. (a) | 12,324,249 | ||||||
| 25,700 | Burlington Stores, Inc. (a) | 3,674,072 | ||||||
| 212,600 | Capri Holdings Ltd. (a) | 9,711,568 | ||||||
| 521,900 | CarMax, Inc. (a) | 32,884,919 | ||||||
| 1,268,700 | Carnival Corp. (a) | 11,494,422 | ||||||
| 196,300 | Dollar Tree, Inc. (a) | 31,113,550 | ||||||
| 230,650 | eBay, Inc. | 9,189,096 | ||||||
| 217,800 | Leslie’s, Inc. (a) | 3,057,912 | ||||||
| 4,676,700 | Mattel, Inc. (a) | 88,670,232 | ||||||
| 82,310 | MGM Resorts International | 2,927,767 | ||||||
| 740,000 | Newell Brands, Inc. | 10,219,400 | ||||||
| 898,340 | Ross Stores, Inc. | 85,962,154 | ||||||
| 184,550 | Royal Caribbean Cruises Ltd. (a) | 9,851,279 | ||||||
| 1,496,819 | Sony Group Corp. – ADR | 100,990,378 | ||||||
| 230,400 | TJX Cos., Inc. (The) | 16,611,840 | ||||||
| 227,599 | Victoria’s Secret & Co. (a) | 8,557,722 | ||||||
| 526,529 | Whirlpool Corp. | 72,787,369 | ||||||
|
| |||||||
| 524,184,387 | ||||||||
|
| |||||||
| Consumer Staples – 1.2% | ||||||||
| 207,300 | Altria Group, Inc. | 9,591,771 | ||||||
| 283,600 | BJ’s Wholesale Club Holdings, Inc. (a) | 21,950,640 | ||||||
| 105,300 | Philip Morris International, Inc. | 9,671,805 | ||||||
| 229,500 | Sysco Corp. | 19,865,520 | ||||||
| 149,800 | Tyson Foods, Inc. – Class A | 10,238,830 | ||||||
|
| |||||||
| 71,318,566 | ||||||||
|
| |||||||
| Energy – 2.9% | ||||||||
| 172,400 | Cameco Corp. | 4,089,328 | ||||||
| 250,600 | EOG Resources, Inc. | 34,211,912 | ||||||
The accompanying notes are an integral part of these financial statements.
15
Schedule of Investments
PRIMECAP Odyssey Stock Fund
October 31, 2022 – continued
| Shares | Value | |||||||
| Energy (continued) | ||||||||
| 348,400 | Hess Corp. | $ | 49,152,272 | |||||
| 170,600 | Pioneer Natural Resources Co. | 43,743,546 | ||||||
| 1,390,000 | Southwestern Energy Co. (a) | 9,632,700 | ||||||
| 235,000 | TechnipFMC PLC (a) | 2,488,650 | ||||||
| 922,800 | Transocean Ltd. (a) | 3,395,904 | ||||||
| 177,600 | Valero Energy Corp. | 22,297,680 | ||||||
|
| |||||||
| 169,011,992 | ||||||||
|
| |||||||
| Financials – 12.1% | ||||||||
| 2,036,330 | Bank of America Corp. | 73,389,333 | ||||||
| 265,000 | Charles Schwab Corp. (The) | 21,112,550 | ||||||
| 1,193,150 | Citigroup, Inc. | 54,717,859 | ||||||
| 236,000 | CME Group, Inc. – Class A | 40,898,800 | ||||||
| 690,220 | Discover Financial Services | 72,100,381 | ||||||
| 41,590 | Evercore, Inc. – Class A | 4,371,109 | ||||||
| 863,220 | JPMorgan Chase & Co. | 108,662,134 | ||||||
| 580,880 | Northern Trust Corp. | 48,997,228 | ||||||
| 75,130 | Progressive Corp. (The) | 9,646,692 | ||||||
| 974,765 | Raymond James Financial, Inc. | 115,158,737 | ||||||
| 3,305,908 | Wells Fargo & Co. | 152,038,709 | ||||||
|
| |||||||
| 701,093,532 | ||||||||
|
| |||||||
| Health Care – 27.8% | ||||||||
| 255,960 | Abbott Laboratories | 25,324,682 | ||||||
| 459,100 | Agilent Technologies, Inc. | 63,516,485 | ||||||
| 46,500 | Alcon, Inc. | 2,821,620 | ||||||
| 624,200 | Amgen, Inc. | 168,752,470 | ||||||
| 3,978,680 | AstraZeneca PLC – ADR | 233,986,171 | ||||||
| 555,850 | Biogen, Inc. (a) | 157,550,124 | ||||||
| 349,800 | Boston Scientific Corp. (a) | 15,079,878 | ||||||
| 1,699,300 | Bristol-Myers Squibb Co. | 131,644,771 | ||||||
| 267,160 | CVS Health Corp. | 25,300,052 | ||||||
| 1,873,690 | Elanco Animal Health, Inc. (a) | 24,713,971 | ||||||
| 1,252,163 | Eli Lilly & Co. | 453,395,701 | ||||||
| 27,000 | IQVIA Holdings, Inc. (a) | 5,661,090 | ||||||
| 387,000 | LivaNova PLC (a) | 18,227,700 | ||||||
| 38,010 | Medtronic PLC | 3,319,793 | ||||||
| 85,300 | Merck & Co., Inc. | 8,632,360 | ||||||
| 712,020 | Novartis AG – ADR | 57,766,183 | ||||||
| 234,230 | PerkinElmer, Inc. | 31,288,443 | ||||||
| 79,011 | Roche Holding AG – CHF | 26,239,684 | ||||||
The accompanying notes are an integral part of these financial statements.
16
Schedule of Investments
PRIMECAP Odyssey Stock Fund
October 31, 2022 – continued
| Shares | Value | |||||||
| Health Care (continued) | ||||||||
| 113,360 | Sanofi – ADR | $ | 4,900,553 | |||||
| 262,398 | Siemens Healthineers AG – EUR | 12,078,881 | ||||||
| 24,700 | Stryker Corp. | 5,662,228 | ||||||
| 187,140 | Thermo Fisher Scientific, Inc. | 96,184,346 | ||||||
| 6,980 | Waters Corp. (a) | 2,088,207 | ||||||
| 312,790 | Zimmer Biomet Holdings, Inc. | 35,454,746 | ||||||
| 4,200 | ZimVie, Inc. (a) | 36,834 | ||||||
|
| |||||||
| 1,609,626,973 | ||||||||
|
| |||||||
| Industrials – 18.3% | ||||||||
| 3,008,900 | AECOM | 226,509,992 | ||||||
| 448,400 | Airbus SE – EUR | 48,558,314 | ||||||
| 54,050 | Alaska Air Group, Inc. (a) | 2,403,063 | ||||||
| 2,350,490 | American Airlines Group, Inc. (a) | 33,329,948 | ||||||
| 34,900 | AMETEK, Inc. | 4,525,134 | ||||||
| 391,872 | Carrier Global Corp. | 15,580,831 | ||||||
| 142,223 | Caterpillar, Inc. | 30,785,590 | ||||||
| 332,700 | CSX Corp. | 9,668,262 | ||||||
| 274,940 | Curtiss-Wright Corp. | 46,143,180 | ||||||
| 23,100 | Deere & Co. | 9,143,442 | ||||||
| 916,450 | Delta Air Lines, Inc. (a) | 31,095,148 | ||||||
| 747,285 | FedEx Corp. | 119,774,840 | ||||||
| 85,070 | General Dynamics Corp. | 21,250,486 | ||||||
| 111,200 | GXO Logistics, Inc. (a) | 4,063,248 | ||||||
| 466,190 | Jacobs Solutions, Inc. | 53,714,412 | ||||||
| 267,000 | JELD-WEN Holding, Inc. (a) | 2,832,870 | ||||||
| 371,600 | Kirby Corp. (a) | 25,919,100 | ||||||
| 2,500 | Knight-Swift Transportation Holdings, Inc. | 120,075 | ||||||
| 23,300 | L3Harris Technologies, Inc. | 5,742,751 | ||||||
| 226,900 | Matson, Inc. | 16,695,302 | ||||||
| 594,120 | Maxar Technologies, Inc. | 13,272,641 | ||||||
| 92,200 | Norfolk Southern Corp. | 21,028,054 | ||||||
| 33,181 | Otis Worldwide Corp. | 2,343,906 | ||||||
| 13,562 | Raytheon Technologies Corp. | 1,285,949 | ||||||
| 18,310 | Rockwell Automation, Inc. | 4,674,543 | ||||||
| 14,700 | Saia, Inc. (a) | 2,923,242 | ||||||
| 1,055,708 | Siemens AG – EUR | 115,431,058 | ||||||
| 2,544,380 | Southwest Airlines Co. (a) | 92,488,213 | ||||||
| 30,400 | Union Pacific Corp. | 5,993,056 | ||||||
| 1,401,900 | United Airlines Holdings, Inc. (a) | 60,393,852 | ||||||
The accompanying notes are an integral part of these financial statements.
17
Schedule of Investments
PRIMECAP Odyssey Stock Fund
October 31, 2022 – continued
| Shares | Value | |||||||
| Industrials (continued) | ||||||||
| 173,600 | United Parcel Service, Inc. – Class B | $ | 29,124,872 | |||||
| 135,200 | XPO Logistics, Inc. (a) | 6,995,248 | ||||||
|
| |||||||
| 1,063,810,622 | ||||||||
|
| |||||||
| Information Technology – 20.0% | ||||||||
| 126,000 | Adobe, Inc. (a) | 40,131,000 | ||||||
| 257,300 | Analog Devices, Inc. | 36,696,126 | ||||||
| 627,650 | Applied Materials, Inc. | 55,415,218 | ||||||
| 501,600 | Cisco Systems, Inc. | 22,787,688 | ||||||
| 263,698 | Corning, Inc. | 8,483,165 | ||||||
| 137,000 | Fidelity National Information Services, Inc. | 11,369,630 | ||||||
| 6,152,179 | Flex Ltd. (a) | 120,459,665 | ||||||
| 4,726,680 | Hewlett Packard Enterprise Co. | 67,449,724 | ||||||
| 1,286,260 | HP, Inc. | 35,526,501 | ||||||
| 3,598,610 | Intel Corp. | 102,308,482 | ||||||
| 146,320 | Keysight Technologies, Inc. (a) | 25,481,628 | ||||||
| 353,930 | KLA Corp. | 112,001,148 | ||||||
| 5,845,580 | L.M. Ericsson Telephone Co. – ADR | 32,559,880 | ||||||
| 602,450 | Microsoft Corp. | 139,846,718 | ||||||
| 970,900 | NetApp, Inc. | 67,254,243 | ||||||
| 19,310 | NVIDIA Corp. | 2,606,271 | ||||||
| 901,580 | Oracle Corp. | 70,386,351 | ||||||
| 175,510 | PayPal Holdings, Inc. (a) | 14,669,126 | ||||||
| 379,607 | QUALCOMM, Inc. | 44,664,560 | ||||||
| 20,000 | Seagate Technology Holdings PLC | 993,200 | ||||||
| 165,500 | Teradyne, Inc. | 13,463,425 | ||||||
| 514,540 | Texas Instruments, Inc. | 82,650,560 | ||||||
| 131,500 | Visa, Inc. – Class A | 27,241,540 | ||||||
| 145,140 | WEX, Inc. (a) | 23,823,280 | ||||||
|
| |||||||
| 1,158,269,129 | ||||||||
|
| |||||||
| Materials – 2.3% | ||||||||
| 198,200 | Albemarle Corp. | 55,470,234 | ||||||
| 230,083 | Corteva, Inc. | 15,033,623 | ||||||
| 199,383 | Dow, Inc. | 9,319,162 | ||||||
| 215,784 | DuPont de Nemours, Inc. | 12,342,845 | ||||||
| 504,900 | Freeport-McMoRan, Inc. | 16,000,281 | ||||||
| 4,427,278 | Glencore PLC – GBP | 25,360,673 | ||||||
|
| |||||||
| 133,526,818 | ||||||||
|
| |||||||
| | TOTAL COMMON STOCKS | $ | 5,590,846,289 | |||||
|
| |||||||
The accompanying notes are an integral part of these financial statements.
18
Schedule of Investments
PRIMECAP Odyssey Stock Fund
October 31, 2022 – continued
| Shares | Value | |||||||
| SHORT-TERM INVESTMENTS – 3.7% | ||||||||
| 211,502,114 | Dreyfus Treasury Securities Cash Management Fund – Institutional Shares – 3.01% (b) | $ | 211,502,114 | |||||
|
| |||||||
| | TOTAL SHORT-TERM INVESTMENTS | 211,502,114 | ||||||
|
| |||||||
| | TOTAL INVESTMENTS IN SECURITIES | 5,802,348,403 | ||||||
Liabilities in Excess of Other Assets – (0.1)% | (3,245,420 | ) | ||||||
|
| |||||||
TOTAL NET ASSETS – 100.0% | $ | 5,799,102,983 | ||||||
|
| |||||||
| ADR | American Depository Receipt |
| CHF | Swiss Francs |
| EUR | Euros |
| GBP | British Pound Sterling |
| JPY | Japanese Yen |
| (a) | Non-Income Producing |
| (b) | Rate quoted is seven-day yield at period end. |
The Global Industry Classification Standard (GICS ®) was developed by and is the exclusive property of MSCI Inc. and Standard & Poor’s Financial Services LLC (“S&P”). GICS is a service mark of MSCI and S&P and has been licensed for use by the fund’s administrator.
The accompanying notes are an integral part of these financial statements.
19
| Schedule of Investments October 31, 2022 |
| Shares | Value | |||||||
| COMMON STOCKS – 97.5% | ||||||||
| Communication Services – 4.5% | ||||||||
| 1,048,850 | Alphabet, Inc. – Class A (a) | $ | 99,126,814 | |||||
| 872,750 | Alphabet, Inc. – Class C (a) | 82,614,515 | ||||||
| 631,870 | Baidu, Inc. – ADR (a) | 48,382,286 | ||||||
| 957,182 | comScore, Inc. (a) | 1,158,190 | ||||||
| 96,000 | Electronic Arts, Inc. | 12,092,160 | ||||||
| 220,100 | IMAX Corp. (a) | 2,801,873 | ||||||
| 69,180 | Live Nation Entertainment, Inc. (a) | 5,507,420 | ||||||
| 75,100 | Meta Platforms, Inc. – Class A (a) | 6,996,316 | ||||||
| 10,000 | Netflix, Inc. (a) | 2,918,800 | ||||||
| 550,000 | Nintendo Co. Ltd. – JPY | 22,451,999 | ||||||
| 247,700 | Walt Disney Co. (The) (a) | 26,389,958 | ||||||
|
| |||||||
| 310,440,331 | ||||||||
|
| |||||||
| Consumer Discretionary – 10.4% | ||||||||
| 1,189,760 | Alibaba Group Holding Ltd. – ADR (a) | 75,644,941 | ||||||
| 499,498 | Bath & Body Works, Inc. | 16,673,243 | ||||||
| 137,410 | Brinker International, Inc. (a) | 4,588,120 | ||||||
| 75,600 | Burlington Stores, Inc. (a) | 10,807,776 | ||||||
| 510,300 | Capri Holdings Ltd. (a) | 23,310,504 | ||||||
| 728,840 | CarMax, Inc. (a) | 45,924,208 | ||||||
| 1,279,346 | Carnival Corp. (a) | 11,590,875 | ||||||
| 121,200 | Dollar Tree, Inc. (a) | 19,210,200 | ||||||
| 31,550 | DoorDash, Inc. – Class A (a) | 1,373,371 | ||||||
| 145,460 | eBay, Inc. | 5,795,126 | ||||||
| 1,801,124 | Entain PLC – GBP | 26,087,680 | ||||||
| 76,143 | Flutter Entertainment PLC – GBP (a) | 10,111,767 | ||||||
| 1,187,058 | iRobot Corp. (a) | 67,068,777 | ||||||
| 78,400 | Las Vegas Sands Corp. (a) | 2,979,984 | ||||||
| 247,900 | Leslie’s, Inc. (a) | 3,480,516 | ||||||
| 39,300 | Marriott International, Inc. – Class A | 6,292,323 | ||||||
| 3,196,850 | Mattel, Inc. (a) | 60,612,276 | ||||||
| 93,230 | MGM Resorts International | 3,316,191 | ||||||
| 633,800 | Norwegian Cruise Line Holdings Ltd. (a) | 10,704,882 | ||||||
| 75,700 | Ollie’s Bargain Outlet Holdings, Inc. (a) | 4,239,200 | ||||||
| 3,700 | O’Reilly Automotive, Inc. (a) | 3,097,529 | ||||||
| 110,550 | Ross Stores, Inc. | 10,578,530 | ||||||
| 621,571 | Royal Caribbean Cruises Ltd. (a) | 33,179,460 | ||||||
| 1,182,947 | Sony Group Corp. – ADR | 79,813,434 | ||||||
| 526,600 | Tesla, Inc. (a) | 119,822,564 | ||||||
The accompanying notes are an integral part of these financial statements.
20
Schedule of Investments
PRIMECAP Odyssey Growth Fund
October 31, 2022 – continued
| Shares | Value | |||||||
| Consumer Discretionary (continued) | ||||||||
| 202,200 | TJX Cos., Inc. (The) | $ | 14,578,620 | |||||
| 265,099 | Victoria’s Secret & Co. (a) | 9,967,722 | ||||||
| 727,310 | Xometry, Inc. – Class A (a) | 43,682,239 | ||||||
|
| |||||||
| 724,532,058 | ||||||||
|
| |||||||
| Consumer Staples – 0.2% | ||||||||
| 169,200 | Altria Group, Inc. | 7,828,884 | ||||||
| 95,590 | BJ’s Wholesale Club Holdings, Inc. (a) | 7,398,666 | ||||||
| 31,000 | Grocery Outlet Holding Corp. (a) | 1,071,670 | ||||||
|
| |||||||
| 16,299,220 | ||||||||
|
| |||||||
| Energy – 3.5% | ||||||||
| 718,100 | Coterra Energy, Inc. | 22,354,453 | ||||||
| 106,900 | EOG Resources, Inc. | 14,593,988 | ||||||
| 412,021 | Hess Corp. | 58,127,923 | ||||||
| 447,400 | Pioneer Natural Resources Co. | 114,717,834 | ||||||
| 1,900,000 | Southwestern Energy Co. (a) | 13,167,000 | ||||||
| 6,291,104 | Transocean Ltd. (a) | 23,151,263 | ||||||
|
| |||||||
| 246,112,461 | ||||||||
|
| |||||||
| Financials – 8.6% | ||||||||
| 302,800 | Bank of America Corp. | 10,912,912 | ||||||
| 407,000 | Citigroup, Inc. | 18,665,020 | ||||||
| 96,600 | CME Group, Inc. – Class A | 16,740,780 | ||||||
| 486,310 | Discover Financial Services | 50,799,943 | ||||||
| 12,380 | Evercore, Inc. – Class A | 1,301,138 | ||||||
| 174,100 | JPMorgan Chase & Co. | 21,915,708 | ||||||
| 102,600 | MarketAxess Holdings, Inc. | 25,038,504 | ||||||
| 746,140 | Morgan Stanley | 61,310,324 | ||||||
| 560,980 | Northern Trust Corp. | 47,318,663 | ||||||
| 1,826,375 | Raymond James Financial, Inc. | 215,767,942 | ||||||
| 100,000 | Tradeweb Markets, Inc. – Class A | 5,508,000 | ||||||
| 2,628,900 | Wells Fargo & Co. | 120,903,111 | ||||||
|
| |||||||
| 596,182,045 | ||||||||
|
| |||||||
| Health Care – 34.4% | ||||||||
| 229,918 | Abbott Laboratories | 22,748,087 | ||||||
| 647,150 | ABIOMED, Inc. (a) | 163,133,572 | ||||||
| 161,690 | Agilent Technologies, Inc. | 22,369,812 | ||||||
| 62,860 | Alcon, Inc. | 3,814,345 | ||||||
| 408,100 | Alkermes PLC (a) | 9,263,870 | ||||||
| 704,660 | Amgen, Inc. | 190,504,831 | ||||||
| 2,345,230 | AstraZeneca PLC – ADR | 137,922,976 | ||||||
The accompanying notes are an integral part of these financial statements.
21
Schedule of Investments
PRIMECAP Odyssey Growth Fund
October 31, 2022 – continued
| Shares | Value | |||||||
| Health Care (continued) | ||||||||
| 703,427 | BeiGene Ltd. – ADR (a) | $ | 118,801,786 | |||||
| 782,840 | Biogen, Inc. (a) | 221,888,170 | ||||||
| 1,702,716 | BioMarin Pharmaceutical, Inc. (a) | 147,506,287 | ||||||
| 165,100 | BioNTech SE – ADR | 22,724,364 | ||||||
| 831,700 | Boston Scientific Corp. (a) | 35,854,587 | ||||||
| 205,492 | Bridgebio Pharma, Inc. (a) | 2,143,282 | ||||||
| 1,186,500 | Bristol-Myers Squibb Co. | 91,918,155 | ||||||
| 240,900 | CVS Health Corp. | 22,813,230 | ||||||
| 55,000 | Edwards Lifesciences Corp. (a) | 3,983,650 | ||||||
| 1,958,671 | Elanco Animal Health, Inc. (a) | 25,834,870 | ||||||
| 1,258,078 | Eli Lilly & Co. | 455,537,463 | ||||||
| 97,766 | Enovis Corp. (a) | 4,834,529 | ||||||
| 1,868,340 | FibroGen, Inc. (a) | 30,416,575 | ||||||
| 53,800 | Guardant Health, Inc. (a) | 2,663,100 | ||||||
| 94,120 | Illumina, Inc. (a) | 21,536,538 | ||||||
| 551,609 | Insulet Corp. (a) | 142,761,925 | ||||||
| 22,860 | IQVIA Holdings, Inc. (a) | 4,793,056 | ||||||
| 772,100 | LivaNova PLC (a) | 36,365,910 | ||||||
| 28,800 | Merck & Co., Inc. | 2,914,560 | ||||||
| 4,798,916 | Nektar Therapeutics (a) | 18,043,924 | ||||||
| 1,000 | Neurocrine Biosciences, Inc. (a) | 115,120 | ||||||
| 776,156 | Novartis AG – ADR | 62,969,536 | ||||||
| 16,140 | Omnicell, Inc. (a) | 1,247,945 | ||||||
| 149,600 | OraSure Technologies, Inc. (a) | 652,256 | ||||||
| 73,120 | PerkinElmer, Inc. | 9,767,370 | ||||||
| 179,910 | QIAGEN N.V. – EUR (a) | 7,769,685 | ||||||
| 1,747,558 | Rhythm Pharmaceuticals, Inc. (a) | 43,986,035 | ||||||
| 116,494 | Roche Holding AG – CHF | 38,687,851 | ||||||
| 919,900 | Seagen, Inc. (a) | 116,974,484 | ||||||
| 81,080 | Siemens Healthineers AG – EUR | 3,732,329 | ||||||
| 165,000 | Thermo Fisher Scientific, Inc. | 84,805,050 | ||||||
| 863,503 | Xencor, Inc. (a) | 24,178,084 | ||||||
| 314,320 | Zimmer Biomet Holdings, Inc. | 35,628,172 | ||||||
|
| |||||||
| 2,393,607,371 | ||||||||
|
| |||||||
| Industrials – 13.5% | ||||||||
| 3,218,022 | AECOM | 242,252,696 | ||||||
| 318,846 | Airbus SE – EUR | 34,528,600 | ||||||
| 2,576,261 | American Airlines Group, Inc. (a) | 36,531,381 | ||||||
| 60,000 | AMETEK, Inc. | 7,779,600 | ||||||
The accompanying notes are an integral part of these financial statements.
22
Schedule of Investments
PRIMECAP Odyssey Growth Fund
October 31, 2022 – continued
| Shares | Value | |||||||
| Industrials (continued) | ||||||||
| 95,000 | Carrier Global Corp. | $ | 3,777,200 | |||||
| 238,900 | Curtiss-Wright Corp. | 40,094,587 | ||||||
| 1,335,500 | Delta Air Lines, Inc. (a) | 45,313,515 | ||||||
| 97,765 | ESAB Corp. | 3,646,634 | ||||||
| 218,700 | FedEx Corp. | 35,053,236 | ||||||
| 118,360 | General Dynamics Corp. | 29,566,328 | ||||||
| 62,600 | IDEX Corp. | 13,916,606 | ||||||
| 54,700 | J.B. Hunt Transport Services, Inc. | 9,357,529 | ||||||
| 939,794 | Jacobs Solutions, Inc. | 108,283,065 | ||||||
| 670,100 | JetBlue Airways Corp. (a) | 5,387,604 | ||||||
| �� | 360,501 | Lyft, Inc. – Class A (a) | 5,277,735 | |||||
| 22,200 | Old Dominion Freight Line, Inc. | 6,096,120 | ||||||
| 17,200 | Saia, Inc. (a) | 3,420,392 | ||||||
| 886,579 | Siemens AG – EUR | 96,938,502 | ||||||
| 2,554,030 | Southwest Airlines Co. (a) | 92,838,990 | ||||||
| 299,900 | Textron, Inc. | 20,525,156 | ||||||
| 11,400 | TransDigm Group, Inc. | 6,563,664 | ||||||
| 133,500 | Uber Technologies, Inc. (a) | 3,547,095 | ||||||
| 55,500 | Union Pacific Corp. | 10,941,270 | ||||||
| 1,855,750 | United Airlines Holdings, Inc. (a) | 79,945,710 | ||||||
|
| |||||||
| 941,583,215 | ||||||||
|
| |||||||
| Information Technology – 21.7% | ||||||||
| 180,900 | Adobe, Inc. (a) | 57,616,650 | ||||||
| 583,500 | Altair Engineering, Inc. – Class A (a) | 28,620,675 | ||||||
| 281,600 | Analog Devices, Inc. | 40,161,792 | ||||||
| 328,100 | Applied Materials, Inc. | 28,967,949 | ||||||
| 55,300 | ASML Holding N.V. – ADR | 26,124,826 | ||||||
| 5,244,743 | BlackBerry Ltd. (a) | 24,440,502 | ||||||
| 661,100 | Cisco Systems, Inc. | 30,033,773 | ||||||
| 47,900 | Dell Technologies, Inc. – Class C | 1,839,360 | ||||||
| 548,600 | Descartes Systems Group, Inc. (The) (a) | 37,891,802 | ||||||
| 6,910,699 | Flex Ltd. (a) | 135,311,486 | ||||||
| 586,956 | FormFactor, Inc. (a) | 11,862,381 | ||||||
| 2,207,120 | Hewlett Packard Enterprise Co. | 31,495,602 | ||||||
| 602,476 | HP, Inc. | 16,640,387 | ||||||
| 1,420,440 | Intel Corp. | 40,383,109 | ||||||
| 14,400 | Intuit, Inc. | 6,156,000 | ||||||
| 585,000 | Jabil, Inc. | 37,586,250 | ||||||
| 88,070 | Keysight Technologies, Inc. (a) | 15,337,391 | ||||||
The accompanying notes are an integral part of these financial statements.
23
Schedule of Investments
PRIMECAP Odyssey Growth Fund
October 31, 2022 – continued
| Shares | Value | |||||||
| Information Technology (continued) | ||||||||
| 317,124 | KLA Corp. | $ | 100,353,890 | |||||
| 2,533,300 | L.M. Ericsson Telephone Co. – ADR | 14,110,481 | ||||||
| 464,050 | MaxLinear, Inc. (a) | 14,329,864 | ||||||
| 2,568,600 | Micron Technology, Inc. | 138,961,260 | ||||||
| 501,900 | Microsoft Corp. | 116,506,047 | ||||||
| 821,811 | NetApp, Inc. | 56,926,848 | ||||||
| 572,800 | Nutanix, Inc. – Class A (a) | 15,694,720 | ||||||
| 88,580 | NVIDIA Corp. | 11,955,643 | ||||||
| 364,100 | Oracle Corp. | 28,425,287 | ||||||
| 55,000 | OSI Systems, Inc. (a) | 4,519,900 | ||||||
| 39,100 | Palo Alto Networks, Inc. (a) | 6,709,169 | ||||||
| 25,600 | PayPal Holdings, Inc. (a) | 2,139,648 | ||||||
| 324,600 | QUALCOMM, Inc. | 38,192,436 | ||||||
| 39,400 | Salesforce, Inc. (a) | 6,406,046 | ||||||
| 1,544,230 | Splunk, Inc. (a) | 128,340,955 | ||||||
| 1,827,599 | Stratasys Ltd. (a) | 26,445,358 | ||||||
| 142,900 | Teradyne, Inc. | 11,624,915 | ||||||
| 505,115 | Texas Instruments, Inc. | 81,136,622 | ||||||
| 392,050 | Trimble, Inc. (a) | 23,585,728 | ||||||
| 284,066 | Universal Display Corp. | 27,048,765 | ||||||
| 198,850 | Visa, Inc. – Class A | 41,193,766 | ||||||
| 23,000 | VMware, Inc. – Class A | 2,588,190 | ||||||
| 26,000 | Western Digital Corp. (a) | 893,620 | ||||||
| 84,810 | WEX, Inc. (a) | 13,920,713 | ||||||
| 326,700 | Wolfspeed, Inc. (a) | 25,727,625 | ||||||
|
| |||||||
| 1,508,207,431 | ||||||||
|
| |||||||
| Materials – 0.7% | ||||||||
| 160,600 | Albemarle Corp. | 44,947,122 | ||||||
|
| |||||||
| | TOTAL COMMON STOCKS | $ | 6,781,911,254 | |||||
|
| |||||||
| RIGHTS – 0.0% | ||||||||
| Health Care – 0.0% | ||||||||
| 4,207,543 | Epizyme, Inc. – CVR (Issue Date 8/15/22) (a) (b) (c) | 84,151 | ||||||
|
| |||||||
| | TOTAL RIGHTS | 84,151 | ||||||
|
| |||||||
The accompanying notes are an integral part of these financial statements.
24
Schedule of Investments
PRIMECAP Odyssey Growth Fund
October 31, 2022 – continued
| Shares | Value | |||||||
| SHORT-TERM INVESTMENTS – 2.7% | ||||||||
| 191,463,748 | Dreyfus Treasury Securities Cash Management Fund – Institutional Shares – 3.01% (d) | $ | 191,463,748 | |||||
|
| |||||||
| | TOTAL SHORT-TERM INVESTMENTS | 191,463,748 | ||||||
|
| |||||||
| | TOTAL INVESTMENTS IN SECURITIES | 6,973,459,153 | ||||||
Liabilities in Excess of Other Assets – (0.2)% | (15,874,834 | ) | ||||||
|
| |||||||
TOTAL NET ASSETS – 100.0% | $ | 6,957,584,319 | ||||||
|
| |||||||
| ADR | American Depository Receipt |
| CHF | Swiss Francs |
| CVR | Contingent Value Rights |
| EUR | Euros |
| GBP | British Pound Sterling |
| JPY | Japanese Yen |
| (a) | Non-Income Producing |
| (b) | Illiquid security |
| (c) | Fair-valued security (Note 4) |
| (d) | Rate quoted is seven-day yield at period end. |
The Global Industry Classification Standard (GICS ®) was developed by and is the exclusive property of MSCI Inc. and Standard & Poor’s Financial Services LLC (“S&P”). GICS is a service mark of MSCI and S&P and has been licensed for use by the fund’s administrator.
The accompanying notes are an integral part of these financial statements.
25
| Schedule of Investments PRIMECAP Odyssey Aggressive Growth Fund October 31, 2022 |
| Shares | Value | |||||||
| COMMON STOCKS – 97.6% | ||||||||
| Communication Services – 5.5% | ||||||||
| 769,550 | Alphabet, Inc. – Class A (a) | $ | 72,730,170 | |||||
| 712,640 | Alphabet, Inc. – Class C (a) | 67,458,502 | ||||||
| 987,700 | Baidu, Inc. – ADR (a) | 75,628,189 | ||||||
| 3,571,140 | comScore, Inc. (a) | 4,321,079 | ||||||
| 100,800 | Electronic Arts, Inc. | 12,696,768 | ||||||
| 682,300 | IMAX Corp. (a) | 8,685,679 | ||||||
| 142,665 | Live Nation Entertainment, Inc. (a) | 11,357,561 | ||||||
| 586,128 | Madison Square Garden Entertainment Corp. – Class A (a) | 28,737,856 | ||||||
| 2,850 | Madison Square Garden Sports Corp. – Class A | 446,339 | ||||||
| 80,700 | Meta Platforms, Inc. – Class A (a) | 7,518,012 | ||||||
| 10,400 | Netflix, Inc. (a) | 3,035,552 | ||||||
| 1,615,150 | Pinterest, Inc. – Class A (a) | 39,732,690 | ||||||
| 25,900 | Roblox Corp. – Class A (a) | 1,158,766 | ||||||
| 105,300 | Snap, Inc. – Class A (a) | 1,043,523 | ||||||
| 218,120 | T-Mobile US, Inc. (a) | 33,058,267 | ||||||
| 6,709,170 | WildBrain Ltd. – CAD (a) | 10,194,137 | ||||||
| 94,319 | ZoomInfo Technologies, Inc. (a) | 4,200,025 | ||||||
|
| |||||||
| 382,003,115 | ||||||||
|
| |||||||
| Consumer Discretionary – 11.8% | ||||||||
| 1,147,900 | Alibaba Group Holding Ltd. – ADR (a) | 72,983,482 | ||||||
| 146,500 | Amazon.com, Inc. (a) | 15,007,460 | ||||||
| 69,300 | Boot Barn Holdings, Inc. (a) | 3,936,240 | ||||||
| 104,900 | Burlington Stores, Inc. (a) | 14,996,504 | ||||||
| 143,537 | Capri Holdings Ltd. (a) | 6,556,770 | ||||||
| 785,000 | CarMax, Inc. (a) | 49,462,850 | ||||||
| 13,500 | Darden Restaurants, Inc. | 1,932,390 | ||||||
| 350 | Dollar General Corp. | 89,267 | ||||||
| 1,300 | Duolingo, Inc. (a) | 106,392 | ||||||
| 264,850 | eBay, Inc. | 10,551,624 | ||||||
| 3,659,109 | Entain PLC – GBP | 52,998,941 | ||||||
| 8,000 | Five Below, Inc. (a) | 1,170,800 | ||||||
| 22,700 | Flutter Entertainment PLC – GBP (a) | 3,014,553 | ||||||
| 1,712,185 | GAN Ltd. (a) | 3,441,492 | ||||||
| 104,000 | Gildan Activewear, Inc. | 3,281,200 | ||||||
| 846,100 | GrowGeneration Corp. (a) | 3,020,577 | ||||||
| 949,175 | iRobot Corp. (a) | 53,628,388 | ||||||
| 1,059,865 | Norwegian Cruise Line Holdings Ltd. (a) | 17,901,120 | ||||||
The accompanying notes are an integral part of these financial statements.
26
Schedule of Investments
PRIMECAP Odyssey Aggressive Growth Fund
October 31, 2022 – continued
| Shares | Value | |||||||
| Consumer Discretionary (continued) | ||||||||
| 199,610 | Ollie’s Bargain Outlet Holdings, Inc. (a) | $ | 11,178,160 | |||||
| 61,200 | Restaurant Brands International, Inc. | 3,634,056 | ||||||
| 63,860 | Rivian Automotive, Inc. – Class A (a) | 2,233,184 | ||||||
| 969,676 | Royal Caribbean Cruises Ltd. (a) | 51,761,305 | ||||||
| 2,892,440 | Sony Group Corp. – ADR | 195,152,927 | ||||||
| 879,850 | Tesla, Inc. (a) | 200,201,069 | ||||||
| 945,200 | Tuesday Morning Corp. (a) | 125,239 | ||||||
| 27,400 | Ulta Beauty, Inc. (a) | 11,490,738 | ||||||
| 127,400 | Victoria’s Secret & Co. (a) | 4,790,240 | ||||||
| 3,015,250 | XPeng, Inc. – ADR (a) | 19,960,955 | ||||||
|
| |||||||
| 814,607,923 | ||||||||
|
| |||||||
| Consumer Staples – 0.0% | ||||||||
| 18,300 | Calavo Growers, Inc. | 632,997 | ||||||
| 65,000 | Grocery Outlet Holding Corp. (a) | 2,247,050 | ||||||
|
| |||||||
| 2,880,047 | ||||||||
|
| |||||||
| Energy – 1.2% | ||||||||
| 579,750 | Coterra Energy, Inc. | 18,047,617 | ||||||
| 149,700 | EOG Resources, Inc. | 20,437,044 | ||||||
| 167,500 | New Fortress Energy, Inc. | 9,224,225 | ||||||
| 8,883,882 | Transocean Ltd. (a) | 32,692,686 | ||||||
|
| |||||||
| 80,401,572 | ||||||||
|
| |||||||
| Financials – 5.0% | ||||||||
| 192,700 | AssetMark Financial Holdings, Inc. (a) | 3,990,817 | ||||||
| 7,600 | Charles Schwab Corp. (The) | 605,492 | ||||||
| 144,471 | CME Group, Inc. – Class A | 25,036,824 | ||||||
| 340,743 | Discover Financial Services | 35,594,014 | ||||||
| 116,700 | Galaxy Digital Holdings Ltd. – CAD (a) | 567,931 | ||||||
| 76,000 | LPL Financial Holdings, Inc. | 19,429,400 | ||||||
| 530,220 | MarketAxess Holdings, Inc. | 129,394,889 | ||||||
| 915,752 | Morgan Stanley | 75,247,342 | ||||||
| 711,400 | NMI Holdings, Inc. – Class A (a) | 15,601,002 | ||||||
| 121,280 | Progressive Corp. (The) | 15,572,352 | ||||||
| 465,900 | Tradeweb Markets, Inc. – Class A | 25,661,772 | ||||||
|
| |||||||
| 346,701,835 | ||||||||
|
| |||||||
| Health Care – 35.4% | ||||||||
| 284,100 | Abbott Laboratories | 28,108,854 | ||||||
| 749,973 | ABIOMED, Inc. (a) | 189,053,194 | ||||||
| 229,300 | Accuray, Inc. (a) | 467,772 | ||||||
| 108,200 | Adaptive Biotechnologies Corp. (a) | 841,796 | ||||||
The accompanying notes are an integral part of these financial statements.
27
Schedule of Investments
PRIMECAP Odyssey Aggressive Growth Fund
October 31, 2022 – continued
| Shares | Value | |||||||
| Health Care (continued) | ||||||||
| 1,474,410 | Alkermes PLC (a) | $ | 33,469,107 | |||||
| 1,983,820 | Allogene Therapeutics, Inc. (a) | 20,433,346 | ||||||
| 1,298,200 | Amicus Therapeutics, Inc. (a) | 12,982,000 | ||||||
| 413,800 | Arbutus Biopharma Corp. (a) | 968,292 | ||||||
| 748,627 | BeiGene Ltd. – ADR (a) | 126,435,614 | ||||||
| 6,145 | Berkeley Lights, Inc. (a) | 13,642 | ||||||
| 879,739 | Biogen, Inc. (a) | 249,353,222 | ||||||
| 1,976,810 | BioMarin Pharmaceutical, Inc. (a) | 171,251,050 | ||||||
| 1,419,292 | BioNTech SE – ADR | 195,351,351 | ||||||
| 423,000 | Boston Scientific Corp. (a) | 18,235,530 | ||||||
| 478,338 | Bridgebio Pharma, Inc. (a) | 4,989,065 | ||||||
| 279,715 | Calithera Biosciences, Inc. (a) (b) | 702,085 | ||||||
| 9,212,700 | Cerus Corp. (a) (b) | 33,718,482 | ||||||
| 15,250 | Charles River Laboratories International, Inc. (a) | 3,236,812 | ||||||
| 90,300 | Edwards Lifesciences Corp. (a) | 6,540,429 | ||||||
| 673,092 | Elanco Animal Health, Inc. (a) | 8,878,083 | ||||||
| 848,294 | Eli Lilly & Co. | 307,158,774 | ||||||
| 437,600 | Exact Sciences Corp. (a) | 15,219,728 | ||||||
| 4,243,131 | FibroGen, Inc. (a) | 69,078,173 | ||||||
| 465,320 | Glaukos Corp. (a) | 26,090,492 | ||||||
| 108,269 | Guardant Health, Inc. (a) | 5,359,316 | ||||||
| 462,706 | Health Catalyst, Inc. (a) | 4,081,067 | ||||||
| 11,980 | Illumina, Inc. (a) | 2,741,264 | ||||||
| 219,500 | ImmunoGen, Inc. (a) | 1,303,830 | ||||||
| 566,846 | Insulet Corp. (a) | 146,705,413 | ||||||
| 887,000 | LivaNova PLC (a) | 41,777,700 | ||||||
| 218,030 | Mereo Biopharma Group PLC – ADR (a) | 218,008 | ||||||
| 10,301,870 | Nektar Therapeutics (a) (b) | 38,735,031 | ||||||
| 76,400 | NuVasive, Inc. (a) | 3,371,532 | ||||||
| 688,800 | OraSure Technologies, Inc. (a) | 3,003,168 | ||||||
| 19,500 | Penumbra, Inc. (a) | 3,343,665 | ||||||
| 3,685,191 | Pulmonx Corp. (a) (b) | 49,234,152 | ||||||
| 206,220 | QIAGEN N.V. – EUR (a) | 8,905,923 | ||||||
| 20,886 | Repligen Corp. (a) | 3,811,486 | ||||||
| 5,016,580 | Rhythm Pharmaceuticals, Inc. (a) (b) | 126,267,319 | ||||||
| 118,800 | Roche Holding AG – CHF | 39,453,678 | ||||||
| 72,700 | Sage Therapeutics, Inc. (a) | 2,737,882 | ||||||
| 1,621,093 | Seagen, Inc. (a) | 206,138,186 | ||||||
| 253,930 | Shockwave Medical, Inc. (a) | 74,439,580 | ||||||
The accompanying notes are an integral part of these financial statements.
28
Schedule of Investments
PRIMECAP Odyssey Aggressive Growth Fund
October 31, 2022 – continued
| Shares | Value | |||||||
| Health Care (continued) | ||||||||
| 14,400 | Sio Gene Therapies, Inc. (a) | $ | 4,219 | |||||
| 3,943,132 | Standard BioTools, Inc. (a) (b) | 4,652,896 | ||||||
| 3,745,470 | Wave Life Sciences Ltd. (a) | 17,940,801 | ||||||
| 4,398,717 | Xencor, Inc. (a) (b) | 123,164,076 | ||||||
| 849,490 | Zentalis Pharmaceuticals, Inc. (a) | 21,313,704 | ||||||
|
| |||||||
| 2,451,280,789 | ||||||||
|
| |||||||
| Industrials – 12.7% | ||||||||
| 2,486,500 | AECOM | 187,183,720 | ||||||
| 501,600 | Alaska Air Group, Inc. (a) | 22,301,136 | ||||||
| 25,100 | Allegiant Travel Co. (a) | 1,883,755 | ||||||
| 4,705,400 | American Airlines Group, Inc. (a) | 66,722,572 | ||||||
| 2,320,300 | Array Technologies, Inc. (a) | 41,997,430 | ||||||
| 3,503,800 | Aurora Innovation, Inc. – Class A (a) | 7,217,828 | ||||||
| 181,000 | Axon Enterprise, Inc. (a) | 26,324,640 | ||||||
| 49,600 | Bloom Energy Corp. – Class A (a) | 928,016 | ||||||
| 41,000 | Controladora Vuela Compania de Aviacion, S.A.B. de C.V. – ADR (a) | 343,580 | ||||||
| 232,310 | Curtiss-Wright Corp. | 38,988,587 | ||||||
| 2,555,947 | Delta Air Lines, Inc. (a) | 86,723,282 | ||||||
| 19,600 | FedEx Corp. | 3,141,488 | ||||||
| 42,400 | Frontier Group Holdings, Inc. (a) | 555,864 | ||||||
| 245,300 | Gibraltar Industries, Inc. (a) | 12,529,924 | ||||||
| 181,900 | Hawaiian Holdings, Inc. (a) | 2,624,817 | ||||||
| 567,700 | Hertz Global Holdings, Inc. (a) | 10,445,680 | ||||||
| 970,430 | Jacobs Solutions, Inc. | 111,812,945 | ||||||
| 3,076,900 | JetBlue Airways Corp. (a) | 24,738,276 | ||||||
| 2,008,700 | Li-Cycle Holdings Corp. (a) | 11,971,852 | ||||||
| 384,120 | Lyft, Inc. – Class A (a) | 5,623,517 | ||||||
| 179,500 | Masonite International Corp. (a) | 12,839,635 | ||||||
| 1,700,360 | NN, Inc. (a) | 4,233,896 | ||||||
| 13,600 | Old Dominion Freight Line, Inc. | 3,734,560 | ||||||
| 15,800 | Ryanair Holdings PLC – ADR (a) | 1,088,462 | ||||||
| 1,789,140 | Southwest Airlines Co. (a) | 65,035,239 | ||||||
| 242,400 | Spirit Airlines, Inc. | 5,332,800 | ||||||
| 28,815 | Sun Country Airlines Holdings, Inc. (a) | 469,108 | ||||||
| 38,150 | TransDigm Group, Inc. | 21,965,244 | ||||||
| 20,000 | TuSimple Holdings, Inc. – Class A (a) | 68,600 | ||||||
| 353,200 | Uber Technologies, Inc. (a) | 9,384,524 | ||||||
| 2,165,360 | United Airlines Holdings, Inc. (a) | 93,283,709 | ||||||
The accompanying notes are an integral part of these financial statements.
29
Schedule of Investments
PRIMECAP Odyssey Aggressive Growth Fund
October 31, 2022 – continued
| Shares | Value | |||||||
| Industrials (continued) | ||||||||
| 42,400 | WillScot Mobile Mini Holdings Corp. (a) | $ | 1,803,272 | |||||
|
| |||||||
| 883,297,958 | ||||||||
|
| |||||||
| Information Technology – 25.1% | ||||||||
| 175,300 | Adobe, Inc. (a) | 55,833,050 | ||||||
| 108,310 | Ambarella, Inc. (a) | 5,927,806 | ||||||
| 109,200 | Applied Materials, Inc. | 9,641,268 | ||||||
| 2,770,800 | Arlo Technologies, Inc. (a) | 14,269,620 | ||||||
| 46,200 | ASML Holding N.V. – ADR | 21,825,804 | ||||||
| 31,700 | Autodesk, Inc. (a) | 6,793,310 | ||||||
| 1,513,245 | Axcelis Technologies, Inc. (a) | 87,768,210 | ||||||
| 10,749,366 | BlackBerry Ltd. (a) | 50,092,046 | ||||||
| 49,500 | Cerence, Inc. (a) | 851,400 | ||||||
| 70,300 | Credo Technology Group Holding Ltd. (a) | 965,922 | ||||||
| 132,899 | CrowdStrike Holdings, Inc. – Class A (a) | 21,423,319 | ||||||
| 77,050 | CyberArk Software Ltd. (a) | 12,089,916 | ||||||
| 91,300 | Dell Technologies, Inc. – Class C | 3,505,920 | ||||||
| 721,341 | Descartes Systems Group, Inc. (The) (a) | 49,823,023 | ||||||
| 200 | DocuSign, Inc. (a) | 9,660 | ||||||
| 49,500 | FARO Technologies, Inc. (a) | 1,445,895 | ||||||
| 7,558,250 | Flex Ltd. (a) | 147,990,535 | ||||||
| 15,500 | Flywire Corp. (a) | 340,225 | ||||||
| 911,155 | FormFactor, Inc. (a) | 18,414,443 | ||||||
| 108,500 | Freshworks, Inc. – Class A (a) | 1,474,515 | ||||||
| 27,920 | GitLab, Inc. – Class A (a) | 1,353,003 | ||||||
| 997,100 | Hewlett Packard Enterprise Co. | 14,228,617 | ||||||
| 375,670 | HP, Inc. | 10,376,005 | ||||||
| 135,100 | HubSpot, Inc. (a) | 40,065,256 | ||||||
| 2,425,800 | indie Semiconductor, Inc. – Class A (a) | 18,969,756 | ||||||
| 116,250 | Intuit, Inc. | 49,696,875 | ||||||
| 696,500 | Jabil, Inc. | 44,750,125 | ||||||
| 88,800 | Jamf Holding Corp. (a) | 2,101,896 | ||||||
| 55,210 | Keysight Technologies, Inc. (a) | 9,614,821 | ||||||
| 128,904 | Keywords Studios PLC – GBP | 3,562,640 | ||||||
| 351,430 | KLA Corp. | 111,210,023 | ||||||
| 122,500 | Marqeta, Inc. – Class A (a) | 965,300 | ||||||
| 160,730 | Materialise NV – ADR (a) | 1,702,131 | ||||||
| 1,875,130 | MaxLinear, Inc. (a) | 57,904,014 | ||||||
| 3,839,700 | Micron Technology, Inc. | 207,727,770 | ||||||
| 350,400 | Mobileye Global, Inc. – Class A (a) | 9,243,552 | ||||||
The accompanying notes are an integral part of these financial statements.
30
Schedule of Investments
PRIMECAP Odyssey Aggressive Growth Fund
October 31, 2022 – continued
| Shares | Value | |||||||
| Information Technology (continued) | ||||||||
| 24,550 | MongoDB, Inc. (a) | $ | 4,493,387 | |||||
| 1,063,567 | NetApp, Inc. | 73,673,286 | ||||||
| 1,005,033 | nLIGHT, Inc. (a) | 10,824,205 | ||||||
| 1,977,465 | Nutanix, Inc. – Class A (a) | 54,182,541 | ||||||
| 208,300 | NVIDIA Corp. | 28,114,251 | ||||||
| 89,000 | Okta, Inc. – Class A (a) | 4,994,680 | ||||||
| 200,440 | OSI Systems, Inc. (a) | 16,472,159 | ||||||
| 74,410 | Palo Alto Networks, Inc. (a) | 12,768,012 | ||||||
| 320,050 | PROS Holdings, Inc. (a) | 7,985,248 | ||||||
| 344,623 | QUALCOMM, Inc. | 40,548,342 | ||||||
| 176,900 | Rapid7, Inc. (a) | 8,008,263 | ||||||
| 3,250 | RingCentral, Inc. – Class A (a) | 115,440 | ||||||
| 1,735,310 | Splunk, Inc. (a) | 144,221,614 | ||||||
| 1,429,800 | Stratasys Ltd. (a) | 20,689,206 | ||||||
| 45,800 | Tenable Holdings, Inc. (a) | 1,861,312 | ||||||
| 610,070 | Trimble, Inc. (a) | 36,701,811 | ||||||
| 150,540 | Unity Software, Inc. (a) | 4,440,930 | ||||||
| 844,169 | Universal Display Corp. | 80,381,772 | ||||||
| 130,700 | VMware, Inc. – Class A | 14,707,671 | ||||||
| 380,980 | Western Digital Corp. (a) | 13,094,283 | ||||||
| 115,480 | WEX, Inc. (a) | 18,954,887 | ||||||
| 521,500 | Wolfspeed, Inc. (a) | 41,068,125 | ||||||
| 70,300 | Zoom Video Communications, Inc. – Class A (a) | 5,865,832 | ||||||
|
| |||||||
| 1,738,124,928 | ||||||||
|
| |||||||
| Materials – 0.8% | ||||||||
| 91,100 | Albemarle Corp. | 25,496,157 | ||||||
| 67,359 | Bioceres Crop Solutions Corp. (a) | 974,011 | ||||||
| 34,500 | Ingevity Corp. (a) | 2,320,815 | ||||||
| 2,699,400 | Ivanhoe Mines Ltd. – Class A – CAD (a) | 18,724,505 | ||||||
| 1,358,552 | Perimeter Solutions SA (a) | 10,854,831 | ||||||
|
| |||||||
| 58,370,319 | ||||||||
|
| |||||||
| Real Estate – 0.1% | ||||||||
| 168,000 | EPR Properties | 6,484,800 | ||||||
| 53,600 | Safehold, Inc. | 1,567,800 | ||||||
|
| |||||||
| 8,052,600 | ||||||||
|
| |||||||
| | TOTAL COMMON STOCKS | $ | 6,765,721,086 | |||||
|
| |||||||
The accompanying notes are an integral part of these financial statements.
31
Schedule of Investments
PRIMECAP Odyssey Aggressive Growth Fund
October 31, 2022 – continued
| Shares | Value | |||||||
| PREFERRED STOCKS – 0.0% | ||||||||
| Financials – 0.0% | ||||||||
| 595,000 | Freddie Mac Fixed-to-Floating Rate Non-Cumulative Preferred Stock Series Z, Perpetual Maturity 7.875% (a) | $ | 1,814,750 | |||||
|
| |||||||
| | TOTAL PREFERRED STOCKS | 1,814,750 | ||||||
|
| |||||||
| WARRANTS – 0.0% | ||||||||
| Materials – 0.0% | ||||||||
| 364,100 | Perimeter Solutions SA | 709,995 | ||||||
|
| |||||||
| | TOTAL WARRANTS | 709,995 | ||||||
|
| |||||||
| RIGHTS – 0.0% | ||||||||
| Health Care – 0.0% | ||||||||
| 10,344,756 | Epizyme, Inc. – CVR (Issue Date 8/15/22) (a) (c) (d) | 206,895 | ||||||
| 3,786,300 | Mereo BioPharma Group PLC – CVR | 0 | ||||||
|
| |||||||
| 206,895 | ||||||||
|
| |||||||
| | TOTAL RIGHTS | 206,895 | ||||||
|
| |||||||
| SHORT-TERM INVESTMENTS – 2.5% | ||||||||
| 170,943,658 | Dreyfus Treasury Securities Cash Management Fund – Institutional Shares – 3.01% (e) | $ | 170,943,658 | |||||
|
| |||||||
| | TOTAL SHORT-TERM INVESTMENTS | 170,943,658 | ||||||
|
| |||||||
| | TOTAL INVESTMENTS IN SECURITIES | 6,939,396,384 | ||||||
Liabilities in Excess of Other Assets – (0.1)% | (8,325,099 | ) | ||||||
|
| |||||||
TOTAL NET ASSETS – 100.0% | $ | 6,931,071,285 | ||||||
|
| |||||||
| ADR | American Depository Receipt |
| CAD | Canadian Dollars |
| CHF | Swiss Francs |
| CVR | Contingent Value Rights |
| EUR | Euros |
| GBP | British Pound Sterling |
| (a) | Non-Income Producing |
The accompanying notes are an integral part of these financial statements.
32
Schedule of Investments
PRIMECAP Odyssey Aggressive Growth Fund
October 31, 2022 – continued
| (b) | Considered an affiliated company of the fund as the fund owns 5% or more of the outstanding voting securities of such company. (Note 7) |
| (c) | Illiquid security |
| (d) | Fair-valued security (Note 4) |
| (e) | Rate quoted is seven-day yield at period end. |
The Global Industry Classification Standard (GICS ®) was developed by and is the exclusive property of MSCI Inc. and Standard & Poor’s Financial Services LLC (“S&P”). GICS is a service mark of MSCI and S&P and has been licensed for use by the fund’s administrator.
The accompanying notes are an integral part of these financial statements.
33
| Statements of Assets and Liabilities PRIMECAP Odyssey Funds October 31, 2022 |
| PRIMECAP Odyssey Stock Fund | PRIMECAP Odyssey Growth Fund | PRIMECAP Odyssey Aggressive Growth Fund | ||||||||||
ASSETS | ||||||||||||
Investments, at cost (unaffiliated) | $ | 3,301,601,636 | $ | 3,923,477,038 | $ | 4,008,563,537 | ||||||
|
|
|
|
|
| |||||||
Investments, at cost (affiliated) | — | — | 536,129,909 | |||||||||
|
|
|
|
|
| |||||||
Investments, at value (unaffiliated) | 5,802,348,403 | 6,973,459,153 | 6,562,922,343 | |||||||||
Investments, at value (affiliated) | — | — | 376,474,041 | |||||||||
Receivable for investments sold | 1,802,728 | 7,884,200 | 3,583,554 | |||||||||
Receivable for dividends and interest | 7,253,216 | 7,850,496 | 2,735,618 | |||||||||
Receivable for fund shares sold | 2,281,651 | 2,434,490 | 1,733,276 | |||||||||
Prepaid expenses and other assets | 59,715 | 68,696 | 85,892 | |||||||||
|
|
|
|
|
| |||||||
Total assets | 5,813,745,713 | 6,991,697,035 | 6,947,534,724 | |||||||||
|
|
|
|
|
| |||||||
| LIABILITIES | ||||||||||||
Payable for investments purchased | 104,310 | 1,398,430 | 254,474 | |||||||||
Payable for fund shares repurchased | 5,762,106 | 21,907,520 | 5,230,691 | |||||||||
Payable to the advisor (Note 6) | 8,051,620 | 9,962,535 | 10,215,781 | |||||||||
Payable to custodian | 17,973 | 22,958 | 20,009 | |||||||||
Other accrued expenses and liabilities | 706,721 | 821,273 | 742,484 | |||||||||
|
|
|
|
|
| |||||||
Total liabilities | 14,642,730 | 34,112,716 | 16,463,439 | |||||||||
|
|
|
|
|
| |||||||
NET ASSETS | $ | 5,799,102,983 | $ | 6,957,584,319 | $ | 6,931,071,285 | ||||||
|
|
|
|
|
| |||||||
Number of shares issued and outstanding (unlimited shares authorized, $0.01 par value) | 166,752,590 | 189,577,840 | 178,104,760 | |||||||||
|
|
|
|
|
| |||||||
NET ASSET VALUE, OFFERING AND REDEMPTION PRICE PER SHARE | $ | 34.78 | $ | 36.70 | $ | 38.92 | ||||||
|
|
|
|
|
| |||||||
| COMPONENTS OF NET ASSETS | ||||||||||||
Paid-in capital | $ | 2,709,301,766 | $ | 3,205,113,503 | $ | 3,950,614,078 | ||||||
Total distributable earnings | 3,089,801,217 | 3,752,470,816 | 2,980,457,207 | |||||||||
|
|
|
|
|
| |||||||
Net assets | $ | 5,799,102,983 | $ | 6,957,584,319 | $ | 6,931,071,285 | ||||||
|
|
|
|
|
| |||||||
The accompanying notes are an integral part of these financial statements.
34
| PRIMECAP Odyssey Funds For the Year Ended October 31, 2022 |
| PRIMECAP Odyssey Stock Fund | PRIMECAP Odyssey Growth Fund | PRIMECAP Odyssey Aggressive Growth Fund | ||||||||||
INVESTMENT INCOME | ||||||||||||
Dividends (unaffiliated)(1) | $ | 103,027,075 | $ | 84,589,306 | $ | 38,211,044 | ||||||
Interest income | 1,931,756 | 1,647,590 | 1,942,294 | |||||||||
|
|
|
|
|
| |||||||
Total investment income | 104,958,831 | 86,236,896 | 40,153,338 | |||||||||
|
|
|
|
|
| |||||||
Expenses | ||||||||||||
Advisory fees (Note 6) | 36,416,482 | 45,180,706 | 48,029,077 | |||||||||
Shareholder servicing | 5,295,567 | 6,640,019 | 6,739,093 | |||||||||
Trustee fees | 237,285 | 237,285 | 237,285 | |||||||||
Custody | 122,242 | 151,820 | 138,963 | |||||||||
Other | 1,343,036 | 1,460,522 | 1,450,083 | |||||||||
|
|
|
|
|
| |||||||
Total expenses | 43,414,612 | 53,670,352 | 56,594,501 | |||||||||
|
|
|
|
|
| |||||||
Net investment income (loss) | 61,544,219 | 32,566,544 | (16,441,163 | ) | ||||||||
|
|
|
|
|
| |||||||
| REALIZED AND UNREALIZED GAIN (LOSS) ON INVESTMENTS AND FOREIGN CURRENCY | ||||||||||||
Net realized gain (loss) on: | ||||||||||||
Investments (unaffiliated) | 647,224,948 | 832,338,376 | 928,886,023 | |||||||||
Investments (affiliated) | — | — | (172,600,404 | ) | ||||||||
Foreign currency transactions | (27,449 | ) | (84,221 | ) | 4,606 | |||||||
Change in unrealized appreciation/depreciation on: | ||||||||||||
Investments (unaffiliated) | (1,508,520,339 | ) | (2,524,938,381 | ) | (3,739,369,414 | ) | ||||||
Investments (affiliated) | — | — | (96,914,927 | ) | ||||||||
Foreign currency translations | (542,347 | ) | (512,055 | ) | (127,296 | ) | ||||||
|
|
|
|
|
| |||||||
Net realized and unrealized loss on investments and foreign currency | (861,865,187 | ) | (1,693,196,281 | ) | (3,080,121,412 | ) | ||||||
|
|
|
|
|
| |||||||
NET DECREASE IN NET ASSETS RESULTING FROM OPERATIONS | $ | (800,320,968 | ) | $ | (1,660,629,737 | ) | $ | (3,096,562,575 | ) | |||
|
|
|
|
|
| |||||||
| (1) | Net of foreign taxes withheld of $1,941,249, $1,756,660, and $916,745, respectively. |
The accompanying notes are an integral part of these financial statements.
35
|
| Year Ended October 31, 2022 | Year Ended October 31, 2021 | |||||||
INCREASE (DECREASE) IN NET ASSETS FROM: | ||||||||
| OPERATIONS | ||||||||
Net investment income | $ | 61,544,219 | $ | 50,107,278 | ||||
Net realized gain (loss) on: | ||||||||
Investments | 647,224,948 | 693,227,700 | ||||||
Foreign currency transactions | (27,449 | ) | 109,255 | |||||
Change in unrealized appreciation/depreciation on: | ||||||||
Investments | (1,508,520,339 | ) | 1,906,515,848 | |||||
Foreign currency translations | (542,347 | ) | (83,689 | ) | ||||
|
|
|
| |||||
Net increase (decrease) in net assets resulting from operations | (800,320,968 | ) | 2,649,876,392 | |||||
|
|
|
| |||||
NET DISTRIBUTIONS TO SHAREHOLDERS | (663,331,689 | ) | (521,946,602 | ) | ||||
|
|
|
| |||||
| CAPITAL SHARE TRANSACTIONS | ||||||||
Proceeds from shares sold | 667,871,168 | 820,313,951 | ||||||
Proceeds from reinvestment of distributions | 625,946,173 | 469,381,159 | ||||||
Cost of shares repurchased | (1,764,672,183 | ) | (1,928,638,760 | ) | ||||
|
|
|
| |||||
Net decrease from capital share transactions | (470,854,842 | ) | (638,943,650 | ) | ||||
|
|
|
| |||||
Total increase (decrease) in net assets | (1,934,507,499 | ) | 1,488,986,140 | |||||
|
|
|
| |||||
| NET ASSETS | ||||||||
Beginning of year | 7,733,610,482 | 6,244,624,342 | ||||||
|
|
|
| |||||
End of year | $ | 5,799,102,983 | $ | 7,733,610,482 | ||||
|
|
|
| |||||
| CHANGE IN CAPITAL SHARES | ||||||||
Shares outstanding, beginning of year | 179,968,262 | 195,799,339 | ||||||
|
|
|
| |||||
Shares sold | 17,904,467 | 20,815,677 | ||||||
Shares issued on reinvestment of distributions | 15,899,064 | 13,511,260 | ||||||
Shares repurchased | (47,019,203 | ) | (50,158,014 | ) | ||||
|
|
|
| |||||
Decrease in capital shares | (13,215,672 | ) | (15,831,077 | ) | ||||
|
|
|
| |||||
Shares outstanding, end of year | 166,752,590 | 179,968,262 | ||||||
|
|
|
| |||||
The accompanying notes are an integral part of these financial statements.
36
| Statements of Changes in Net Assets |
| Year Ended October 31, 2022 | Year Ended October 31, 2021 | |||||||
INCREASE (DECREASE) IN NET ASSETS FROM: | ||||||||
| OPERATIONS | ||||||||
Net investment income | $ | 32,566,544 | $ | 9,957,571 | ||||
Net realized gain (loss) on: | ||||||||
Investments | 832,338,376 | 1,333,530,262 | ||||||
Foreign currency transactions | (84,221 | ) | 85,833 | |||||
Change in unrealized appreciation/depreciation on: | ||||||||
Investments | (2,524,938,381 | ) | 2,004,621,861 | |||||
Foreign currency translations | (512,055 | ) | (96,195 | ) | ||||
|
|
|
| |||||
Net increase (decrease) in net assets resulting from operations | (1,660,629,737 | ) | 3,348,099,332 | |||||
|
|
|
| |||||
NET DISTRIBUTIONS TO SHAREHOLDERS | (1,188,273,747 | ) | (1,087,744,161 | ) | ||||
|
|
|
| |||||
| CAPITAL SHARE TRANSACTIONS | ||||||||
Proceeds from shares sold | 764,196,219 | 922,066,332 | ||||||
Proceeds from reinvestment of distributions | 1,137,615,421 | 1,047,279,976 | ||||||
Cost of shares repurchased | (2,263,851,289 | ) | (2,667,590,516 | ) | ||||
|
|
|
| |||||
Net decrease from capital share transactions | (362,039,649 | ) | (698,244,208 | ) | ||||
|
|
|
| |||||
Total increase (decrease) in net assets | (3,210,943,133 | ) | 1,562,110,963 | |||||
|
|
|
| |||||
| NET ASSETS | ||||||||
Beginning of year | 10,168,527,452 | 8,606,416,489 | ||||||
|
|
|
| |||||
End of year | $ | 6,957,584,319 | $ | 10,168,527,452 | ||||
|
|
|
| |||||
| CHANGE IN CAPITAL SHARES | ||||||||
Shares outstanding, beginning of year | 200,231,866 | 213,490,110 | ||||||
|
|
|
| |||||
Shares sold | 19,065,925 | 19,494,793 | ||||||
Shares issued on reinvestment of distributions | 26,388,667 | 25,066,538 | ||||||
Shares repurchased | (56,108,618 | ) | (57,819,575 | ) | ||||
|
|
|
| |||||
Decrease in capital shares | (10,654,026 | ) | (13,258,244 | ) | ||||
|
|
|
| |||||
Shares outstanding, end of year | 189,577,840 | 200,231,866 | ||||||
|
|
|
| |||||
The accompanying notes are an integral part of these financial statements.
37
| Statements of Changes in Net Assets |
| Year Ended October 31, 2022 | Year Ended October 31, 2021 | |||||||
INCREASE (DECREASE) IN NET ASSETS FROM: | ||||||||
| OPERATIONS | ||||||||
Net investment loss | $ | (16,441,163 | ) | $ | (44,974,829 | ) | ||
Net realized gain on: | ||||||||
Investments | 756,285,619 | 1,277,061,756 | ||||||
Foreign currency transactions | 4,606 | 165,129 | ||||||
Change in unrealized appreciation/depreciation on: | ||||||||
Investments | (3,836,284,341 | ) | 2,070,409,100 | |||||
Unfunded commitment with a SPAC | — | (2,927,075 | ) | |||||
Foreign currency translations | (127,296 | ) | (117,845 | ) | ||||
|
|
|
| |||||
Net increase (decrease) in net assets resulting from operations | (3,096,562,575 | ) | 3,299,616,236 | |||||
|
|
|
| |||||
NET DISTRIBUTIONS TO SHAREHOLDERS | (1,124,701,183 | ) | (822,100,806 | ) | ||||
|
|
|
| |||||
| CAPITAL SHARE TRANSACTIONS | ||||||||
Proceeds from shares sold | 787,713,914 | 1,003,449,519 | ||||||
Proceeds from reinvestment of distributions | 1,074,932,684 | 780,448,114 | ||||||
Cost of shares repurchased | (2,445,463,848 | ) | (2,097,662,877 | ) | ||||
Other capital contribution | — | 13,817 | ||||||
|
|
|
| |||||
Net decrease from capital share transactions | (582,817,250 | ) | (313,751,427 | ) | ||||
|
|
|
| |||||
Total increase (decrease) in net assets | (4,804,081,008 | ) | 2,163,764,003 | |||||
|
|
|
| |||||
| NET ASSETS | ||||||||
Beginning of year | 11,735,152,293 | 9,571,388,290 | ||||||
|
|
|
| |||||
End of year | $ | 6,931,071,285 | $ | 11,735,152,293 | ||||
|
|
|
| |||||
| CHANGE IN CAPITAL SHARES | ||||||||
Shares outstanding, beginning of year | 194,391,937 | 199,125,574 | ||||||
|
|
|
| |||||
Shares sold | 17,617,406 | 17,501,649 | ||||||
Shares issued on reinvestment of distributions | 20,852,234 | 14,689,406 | ||||||
Shares repurchased | (54,756,817 | ) | (36,924,692 | ) | ||||
|
|
|
| |||||
Decrease in capital shares | (16,287,177 | ) | (4,733,637 | ) | ||||
|
|
|
| |||||
Shares outstanding, end of year | 178,104,760 | 194,391,937 | ||||||
|
|
|
| |||||
The accompanying notes are an integral part of these financial statements.
38
| For a capital share outstanding throughout each year. |
| Year Ended Oct. 31, 2022 | Year Ended Oct. 31, 2021 | Year Ended Oct. 31, 2020 | Year Ended Oct. 31, 2019 | Year Ended Oct. 31, 2018 | ||||||||||||||||
Net asset value, beginning of year | $ | 42.97 | $ | 31.89 | $ | 34.33 | $ | 31.79 | $ | 31.02 | ||||||||||
|
|
|
|
|
|
|
|
|
| |||||||||||
Income (loss) from investment operations: | ||||||||||||||||||||
Net investment income | 0.35 | (1) | 0.27 | (1) | 0.40 | (1) | 0.46 | 0.33 | ||||||||||||
Net realized and unrealized gain (loss) on investments and foreign currency | (4.78 | ) | 13.57 | (0.76 | ) | 2.95 | 1.13 | |||||||||||||
|
|
|
|
|
|
|
|
|
| |||||||||||
Total from investment operations | (4.43 | ) | 13.84 | (0.36 | ) | 3.41 | 1.46 | |||||||||||||
|
|
|
|
|
|
|
|
|
| |||||||||||
Less: | ||||||||||||||||||||
Dividends from net investment income | (0.28 | ) | (0.48 | ) | (0.47 | ) | (0.34 | ) | (0.30 | ) | ||||||||||
Distributions from net realized gain | (3.48 | ) | (2.28 | ) | (1.61 | ) | (0.53 | ) | (0.39 | ) | ||||||||||
|
|
|
|
|
|
|
|
|
| |||||||||||
Total distributions | (3.76 | ) | (2.76 | ) | (2.08 | ) | (0.87 | ) | (0.69 | ) | ||||||||||
|
|
|
|
|
|
|
|
|
| |||||||||||
Net asset value, end of year | $ | 34.78 | $ | 42.97 | $ | 31.89 | $ | 34.33 | $ | 31.79 | ||||||||||
|
|
|
|
|
|
|
|
|
| |||||||||||
Total return | (11.33 | %) | 45.44 | % | (1.48 | %) | 11.22 | % | 4.70 | % | ||||||||||
Ratios/supplemental data: | ||||||||||||||||||||
Net assets, end of year (millions) | $ | 5,799.1 | $ | 7,733.6 | $ | 6,244.6 | $ | 10,274.3 | $ | 10,157.1 | ||||||||||
Ratio of expenses to average net assets | 0.66 | % | 0.65 | % | 0.65 | % | 0.65 | % | 0.64 | % | ||||||||||
Ratio of net investment income to average net assets | 0.93 | % | 0.67 | % | 1.28 | % | 1.38 | % | 1.04 | % | ||||||||||
Portfolio turnover rate | 4 | % | 6 | % | 8 | % | 6 | % | 5 | % | ||||||||||
| (1) | Calculated using the average shares method. |
The accompanying notes are an integral part of these financial statements.
39
| Financial Highlights For a capital share outstanding throughout each year. |
| Year Ended Oct. 31, 2022 | Year Ended Oct. 31, 2021 | Year Ended Oct. 31, 2020 | Year Ended Oct. 31, 2019 | Year Ended Oct. 31, 2018 | ||||||||||||||||
Net asset value, beginning of year | $ | 50.78 | $ | 40.31 | $ | 39.68 | $ | 38.43 | $ | 35.64 | ||||||||||
|
|
|
|
|
|
|
|
|
| |||||||||||
Income from investment operations: | ||||||||||||||||||||
Net investment income | 0.16 | (1) | 0.05 | (1) | 0.16 | (1) | 0.22 | 0.10 | ||||||||||||
Net realized and unrealized gain (loss) on investments and foreign currency | (8.21 | ) | 15.72 | 2.57 | 1.88 | 3.26 | ||||||||||||||
|
|
|
|
|
|
|
|
|
| |||||||||||
Total from investment operations | (8.05 | ) | 15.77 | 2.73 | 2.10 | 3.36 | ||||||||||||||
|
|
|
|
|
|
|
|
|
| |||||||||||
Less: | ||||||||||||||||||||
Dividends from net investment income | (0.05 | ) | (0.17 | ) | (0.20 | ) | (0.12 | ) | (0.11 | ) | ||||||||||
Distributions from net realized gain | (5.98 | ) | (5.13 | ) | (1.90 | ) | (0.73 | ) | (0.46 | ) | ||||||||||
|
|
|
|
|
|
|
|
|
| |||||||||||
Total distributions | (6.03 | ) | (5.30 | ) | (2.10 | ) | (0.85 | ) | (0.57 | ) | ||||||||||
|
|
|
|
|
|
|
|
|
| |||||||||||
Net asset value, end of year | $ | 36.70 | $ | 50.78 | $ | 40.31 | $ | 39.68 | $ | 38.43 | ||||||||||
|
|
|
|
|
|
|
|
|
| |||||||||||
Total return | (17.61 | %) | 41.97 | % | 6.83 | % | 5.75 | % | 9.48 | % | ||||||||||
Ratios/supplemental data: | ||||||||||||||||||||
Net assets, end of year (millions) | $ | 6,957.6 | $ | 10,168.5 | $ | 8,606.4 | $ | 12,365.6 | $ | 13,144.9 | ||||||||||
Ratio of expenses to average net assets | 0.65 | % | 0.65 | % | 0.65 | % | 0.64 | % | 0.64 | % | ||||||||||
Ratio of net investment income to average net assets | 0.40 | % | 0.10 | % | 0.42 | % | 0.53 | % | 0.26 | % | ||||||||||
Portfolio turnover rate | 4 | % | 7 | % | 9 | % | 6 | % | 4 | % | ||||||||||
| (1) | Calculated using the average shares method. |
The accompanying notes are an integral part of these financial statements.
40
| Financial Highlights PRIMECAP Odyssey Aggressive Growth Fund For a capital share outstanding throughout each year. |
| Year Ended Oct. 31, 2022 | Year Ended Oct. 31, 2021 | Year Ended Oct. 31, 2020 | Year Ended Oct. 31, 2019 | Year Ended Oct. 31, 2018 | ||||||||||||||||
Net asset value, beginning of year | $ | 60.37 | $ | 48.07 | $ | 43.46 | $ | 44.71 | $ | 41.41 | ||||||||||
|
|
|
|
|
|
|
|
|
| |||||||||||
Income (loss) from investment operations: | ||||||||||||||||||||
Net investment income (loss) | (0.09 | )(1) | (0.22 | )(1) | (0.10 | )(1) | 0.03 | 0.00 | (2) | |||||||||||
Net realized and unrealized gain (loss) on investments and foreign currency | (15.51 | ) | 16.73 | 7.10 | 1.72 | 3.68 | ||||||||||||||
|
|
|
|
|
|
|
|
|
| |||||||||||
Total from investment operations | (15.60 | ) | 16.51 | 7.00 | 1.75 | 3.68 | ||||||||||||||
|
|
|
|
|
|
|
|
|
| |||||||||||
Less: | ||||||||||||||||||||
Dividends from net investment income | — | — | — | (0.03 | ) | — | ||||||||||||||
Distributions from net realized gain | (5.85 | ) | (4.21 | ) | (2.39 | ) | (2.97 | ) | (0.38 | ) | ||||||||||
|
|
|
|
|
|
|
|
|
| |||||||||||
Total distributions | (5.85 | ) | (4.21 | ) | (2.39 | ) | (3.00 | ) | (0.38 | ) | ||||||||||
|
|
|
|
|
|
|
|
|
| |||||||||||
Net asset value, end of year | $ | 38.92 | $ | 60.37 | $ | 48.07 | $ | 43.46 | $ | 44.71 | ||||||||||
|
|
|
|
|
|
|
|
|
| |||||||||||
Total return | (28.21 | %) | 35.53 | % | 16.52 | % | 4.71 | % | 8.90 | % | ||||||||||
Ratios/supplemental data: | ||||||||||||||||||||
Net assets, end of year (millions) | $ | 6,931.1 | $ | 11,735.2 | $ | 9,571.4 | $ | 9,851.4 | $ | 10,245.3 | ||||||||||
Ratio of expenses to average net assets | 0.65 | % | 0.64 | % | 0.64 | % | 0.63 | % | 0.63 | % | ||||||||||
Ratio of net investment income (loss) to average net assets | (0.19 | %) | (0.39 | %) | (0.23 | %) | 0.01 | % | (0.19 | %) | ||||||||||
Portfolio turnover rate | 4 | % | 9 | % | 17 | % | 7 | % | 12 | % | ||||||||||
| (1) | Calculated using the average shares method. |
| (2) | Less than one cent per share. |
The accompanying notes are an integral part of these financial statements.
41
| PRIMECAP Odyssey Funds For the Year Ended October 31, 2022 |
(1) Organization
PRIMECAP Odyssey Funds (the “Trust”) was organized on June 8, 2004 as a Delaware statutory trust and is registered as an open-end management investment company under the Investment Company Act of 1940, as amended (the “1940 Act”). The Trust is comprised of three series: PRIMECAP Odyssey Stock Fund, PRIMECAP Odyssey Growth Fund, and PRIMECAP Odyssey Aggressive Growth Fund (the “Funds”), each of which is diversified within the meaning of the 1940 Act. PRIMECAP Management Company (the “Investment Advisor”) serves as investment advisor to the Funds. Each Fund commenced operations on November 1, 2004.
Each Fund’s investment objective is to achieve long-term capital appreciation. Each Fund is authorized to issue unlimited shares of beneficial interest. All shares of each Fund have equal rights with respect to voting. The PRIMECAP Odyssey Aggressive Growth Fund is closed to most new investors.
(2) Significant Accounting Policies
The Funds consistently follow the accounting policies set forth below which are in conformity with accounting principles generally accepted in the United States of America (“U.S. GAAP”). The Funds are considered investment companies under U.S. GAAP and follow the accounting and reporting guidance applicable to investment companies in the Financial Accounting Standards Board Auditing Standards Codification Topic 946.
| A. | Security Valuation |
Securities traded on a national securities exchange are valued at the last reported sales price at the close of regular trading on each day the exchanges are open for trading. Securities traded on the National Association of Securities Dealers Automated Quotations (“NASDAQ”) are valued at the NASDAQ Official Closing Price, which may not necessarily represent the last sale price. Non-U.S. traded stocks are valued at the last sale price or official closing price in the primary local market where the stock is traded. Securities traded on an exchange for which there have been no sales are valued at the mean between the bid and ask price. Because trading on most non-U.S. exchanges is normally completed before the close of the New York Stock Exchange, the value of securities traded on foreign exchanges can change by the time a Fund calculates its net asset value per share (“NAV”). To address these changes, the Funds may utilize adjustment factors provided by an independent pricing service to systematically value foreign securities at fair value. These adjustment factors are based on statistical analyses of subsequent movement in securities indices, specific security prices, and exchange rates in foreign markets.
Securities for which quotations are not readily available are valued at their respective fair values as determined in good faith by a valuation committee of the Investment Advisor in accordance with procedures approved by the Trust’s Board of Trustees. Pursuant to those procedures, the Board of Trustees has designated the Investment Advisor as the Funds’ valuation designee responsible for determining whether market quotations are readily available and reliable, and making good faith determinations of fair value when
42
Notes to Financial Statements
PRIMECAP Odyssey Funds
For the Year Ended October 31, 2022 – continued
appropriate. In determining fair value, the Funds take into account all relevant factors and available information. Consequently, the price of a security used by a Fund to calculate its NAV may differ from quoted or published prices for the same security. Fair value pricing involves subjective judgments, and there is no single standard for determining a security’s fair value. As a result, different mutual funds could reasonably arrive at a different fair value for the same security. It is possible that the fair value determined for a security is materially different from the value that could be realized upon the sale of that security or from the values that other mutual funds may determine.
Investments in other funds are valued at their respective net asset values as determined by those funds, in accordance with the 1940 Act.
| B. | Share Valuation |
The NAV of a Fund is calculated by dividing the sum of the value of the securities held by the Fund, plus cash or other assets, minus all liabilities (including estimated accrued expenses), by the total number of outstanding shares of the Fund. The result is rounded to the nearest cent. The Funds’ shares will not be priced on the days on which the New York Stock Exchange is closed for trading.
| C. | Foreign Currency |
Securities and other assets and liabilities denominated in foreign currencies are translated into U.S. dollars using exchange rates as of 4 p.m. Eastern time on the valuation date. Purchases and sales of investments and dividend and interest income are converted into U.S. dollars using the spot market rate of exchange prevailing on the respective dates of such translations. Realized foreign exchange gains or losses may arise from 1) sales of foreign currencies; 2) currency gains or losses realized between the trade and settlement dates on securities transactions; and 3) the difference between the recorded amounts of dividends, interest, and foreign withholding taxes and the U.S. dollar equivalent of the amounts actually received or paid. Net unrealized foreign exchange gains and losses arise from changes in foreign exchange rates on foreign denominated assets and liabilities other than investments in securities held at the end of the reporting period. Foreign securities and currency transactions may involve risks not associated with U.S. securities and currency.
| D. | Federal Income Taxes |
Each Fund has elected to be treated as a “regulated investment company” under Subchapter M of the Internal Revenue Code of 1986 (the “IRC”). Each Fund intends to distribute substantially all of its taxable income and any accumulated net realized capital gains. Accordingly, no provision for federal income taxes has been made in the financial statements.
The Funds may be subject to foreign taxes on income, gains on investments, or currency repatriation, a portion of which may be reclaimed. The Funds will accrue such taxes and reclaims as applicable based upon their current interpretations of the tax rules and regulations that exist in the markets in which they invest.
43
Notes to Financial Statements
PRIMECAP Odyssey Funds
For the Year Ended October 31, 2022 – continued
Each Fund has adopted accounting standards regarding recognition and measurement of tax positions taken or expected to be taken on a tax return. The Funds recognize interest and penalties, if any, related to unrecognized tax benefits as income tax expense in the Statement of Operations. During the year ended October 31, 2022, the Funds did not incur any interest or penalties. As of October 31, 2022, open tax years include the tax years ended October 31, 2019 through October 31, 2022. No Fund is aware of any tax positions for which it is more likely than not that the total amounts of unrecognized tax benefits or loss will significantly change in the next 12 months.
| E. | Allocation of Expenses |
Each Fund is charged for those expenses directly attributable to it. Expenses that are not directly attributable to a Fund are allocated among the Funds by an appropriate method based on the nature of the expense.
| F. | Security Transactions, Investment Income, and Distributions |
Security transactions are accounted for on the trade date. Dividend income and distributions to shareholders are recorded on the ex-dividend date, and interest income is recognized on the accrual basis. Realized gains and losses are evaluated on the basis of identified costs. Premiums and discounts on the purchase of securities are amortized/accreted using the effective interest method. U.S. GAAP requires that permanent financial reporting and tax differences be reclassified in the capital accounts.
| G. | Use of Estimates |
The preparation of financial statements in conformity with U.S. GAAP requires management to make estimates and assumptions that affect the reported amounts of assets and liabilities and disclosure of contingent assets and liabilities at the date of the financial statements, and the reported amounts of revenues and expenses during the reporting period. Actual results could differ from these estimates, and such differences could be material.
| H. | Indemnification Obligations |
Under the Trust’s organizational documents, its current and former officers and trustees are indemnified against certain liabilities arising out of the performance of their duties to the Funds. In addition, in the normal course of business, the Funds enter into contracts that contain a variety of representations and warranties that provide general indemnifications. The Funds’ maximum exposure under these arrangements is unknown as this would involve future claims that may be made against the Funds that have not yet occurred. Based on experience, the Funds would expect the risk of loss to be minimal.
44
Notes to Financial Statements
PRIMECAP Odyssey Funds
For the Year Ended October 31, 2022 – continued
(3) Investment Transactions
The cost of purchases and the proceeds from sales of securities, excluding short-term investments, for the year ended October 31, 2022 were as follows:
Fund | Purchases | Sales | ||||||
Stock Fund | $ | 253,792,778 | $ | 1,300,162,434 | ||||
Growth Fund | $ | 320,021,277 | $ | 1,783,446,713 | ||||
Aggressive Growth Fund | $ | 346,619,243 | $ | 1,957,715,110 | ||||
(4) Valuation Measurements
The Funds have adopted fair valuation accounting standards which establish an authoritative definition of fair value and set forth a hierarchy for measuring fair value. These standards require additional disclosure about the various inputs and valuation techniques used to develop the measurements of fair value and a discussion of changes in valuation techniques and related inputs during the period. These standards define fair value as the price that would be received in the sale of an asset or paid to transfer a liability in an orderly transaction between market participants on the measurement date. The fair value hierarchy is organized into three levels based upon the assumptions (referred to as “inputs”) used to value the asset or liability. These standards state that “observable inputs” reflect the significant assumptions that market participants would use in valuing an asset or liability based on market data obtained from independent sources. “Unobservable inputs” reflect the Funds’ own assumptions about the inputs market participants would use to value the asset or liability.
Various inputs are used in determining the value of each Fund’s investments, and the lowest level for any significant input determines leveling. These inputs are summarized in the three broad levels below:
| Level 1 – | Unadjusted quoted prices in active markets for identical securities to which the Trust has access at the date of measurement. |
| Level 2 – | Other significant observable inputs (including quoted prices for similar or related securities in both active and inactive markets, interest rates, foreign exchange rates, and fair value estimates for foreign securities indices). |
| Level 3 – | Significant unobservable inputs to the extent observable inputs are unavailable (including the Funds’ own assumptions in determining fair value of investments based on the best available information). |
45
Notes to Financial Statements
PRIMECAP Odyssey Funds
For the Year Ended October 31, 2022 – continued
The following table provides the fair value measurements of applicable Fund assets by level within the fair value hierarchy for each Fund as of October 31, 2022. These assets are measured on a recurring basis.
Fund | Description | Quoted prices in active markets for identical assets (Level 1) | Significant other observable inputs (Level 2) | Significant unobservable inputs (Level 3) | Total | |||||||||||||
| Stock | Common Stocks(1) | $ | 5,590,846,289 | $ | — | $ | — | $ | 5,590,846,289 | |||||||||
| Fund | Short-Term Investments | 211,502,114 | — | — | 211,502,114 | |||||||||||||
|
|
|
|
|
|
|
| |||||||||||
Total Investments in Securities | $ | 5,802,348,403 | $ | — | $ | — | $ | 5,802,348,403 | ||||||||||
|
|
|
|
|
|
|
| |||||||||||
| Growth | Common Stocks(1) | $ | 6,781,911,254 | $ | — | $ | — | $ | 6,781,911,254 | |||||||||
| Fund | Rights(2) | — | — | 84,151 | 84,151 | |||||||||||||
Short-Term Investments | 191,463,748 | — | — | 191,463,748 | ||||||||||||||
|
|
|
|
|
|
|
| |||||||||||
Total Investments in Securities | $ | 6,973,375,002 | $ | — | $ | 84,151 | $ | 6,973,459,153 | ||||||||||
|
|
|
|
|
|
|
| |||||||||||
| Aggressive | Common Stocks(1) | $ | 6,765,721,086 | $ | — | $ | — | $ | 6,765,721,086 | |||||||||
| Growth | Preferred Stocks(3) | 1,814,750 | — | — | 1,814,750 | |||||||||||||
| Fund | Warrants(4) | 709,995 | — | — | 709,995 | |||||||||||||
Rights(2) | — | — | 206,895 | 206,895 | ||||||||||||||
Short-Term Investments | 170,943,658 | — | — | 170,943,658 | ||||||||||||||
|
|
|
|
|
|
|
| |||||||||||
Total Investments in Securities | $ | 6,939,189,489 | $ | — | $ | 206,895 | $ | 6,939,396,384 | ||||||||||
|
|
|
|
|
|
|
| |||||||||||
| (1) | Refer to each Fund’s respective Schedule of Investments for the breakdown of major categories. |
| (2) | Health Care |
| (3) | Financials |
| (4) | Materials |
Following is a reconciliation of investments in which significant unobservable inputs (Level 3) were used in determining fair value.
Epizyme, Inc. - CVR (Issue Date 8/15/22) | ||||||||
| Growth Fund | Aggressive Growth Fund | |||||||
Balance at October 31, 2021 | $ | — | $ | — | ||||
Purchases (Received) | 84,151 | 206,895 | ||||||
Sales (Proceeds) | — | — | ||||||
Realized Gain (Loss) | — | — | ||||||
Change in Unrealized Appreciation/Depreciation | — | — | ||||||
|
|
|
| |||||
Balance at October 31, 2022 | $ | 84,151 | $ | 206,895 | ||||
|
|
|
| |||||
During the year ended October 31, 2022, the Funds determined the fair value of Epizyme, Inc. (“Epizyme”) CVR considering available information, including the value of Epizyme stock prior to the issuance of the CVR. The likelihood of receiving payments pursuant to an agreement will depend on achievement of certain milestones.
46
Notes to Financial Statements
PRIMECAP Odyssey Funds
For the Year Ended October 31, 2022 – continued
(5) Distribution to Shareholders
Net investment income and net realized gains differ for financial statement and tax purposes due to differing treatments of deferred wash sale losses.
As of October 31, 2022, the components of capital on a tax basis were as follows:
| PRIMECAP Odyssey Stock Fund | PRIMECAP Odyssey Growth Fund | PRIMECAP Odyssey Aggressive Growth Fund | ||||||||||
Cost of investments for tax purposes(1) | $ | 3,323,509,538 | $ | 3,973,725,721 | $ | 4,586,591,584 | ||||||
|
|
|
|
|
| |||||||
Gross tax unrealized appreciation | 2,790,740,603 | 3,557,621,010 | 3,544,311,611 | |||||||||
Gross tax unrealized depreciation | (312,291,596 | ) | (558,179,002 | ) | (1,191,548,104 | ) | ||||||
|
|
|
|
|
| |||||||
Net tax unrealized appreciation | 2,478,449,007 | 2,999,442,008 | 2,352,763,507 | |||||||||
|
|
|
|
|
| |||||||
Undistributed ordinary income | 58,348,538 | 46,160,486 | — | |||||||||
Undistributed long-term capital gain | 553,003,672 | 706,868,322 | 640,274,263 | |||||||||
|
|
|
|
|
| |||||||
Total distributable earnings | 611,352,210 | 753,028,808 | 640,274,263 | |||||||||
|
|
|
|
|
| |||||||
Other accumulated gain (loss) | — | — | (12,580,563 | ) | ||||||||
|
|
|
|
|
| |||||||
Total accumulated gain | $ | 3,089,801,217 | $ | 3,752,470,816 | $ | 2,980,457,207 | ||||||
|
|
|
|
|
| |||||||
| (1) | At October 31, 2022 the differences in the basis for federal income tax purposes and financial reporting purposes are due to the tax deferral of losses on wash sales. |
U.S. GAAP requires that permanent book-to-tax differences be reclassified among the components of net assets. These reclassifications have no effect on net assets or NAV. For the fiscal year ended October 31, 2022, the following reclassifications were made:
| Undistributed Net Investment Gain (Loss) | Accumulated Net Realized Gain (Loss) | Paid In Capital | ||||||||||
Stock Fund | $ | (27,449) | $ | (89,795,892) | $ | 89,823,341 | ||||||
Growth Fund | $ | (84,221) | $ | (117,059,635) | $ | 117,143,856 | ||||||
Aggressive Growth Fund | $ | 7,091,673 | $ | (125,642,491) | $ | 118,550,818 | ||||||
The Funds used a tax accounting practice to treat a portion of the price of capital shares redeemed during the year as distributions from net realized capital gains. The PRIMECAP Odyssey Stock Fund, PRIMECAP Odyssey Growth Fund, and PRIMECAP Odyssey Aggressive Growth Fund reclassified $89,823,341, $117,143,856, and $118,550,818, respectively, from Accumulated Net Realized Gain to Paid In Capital. Other permanent book-to-tax differences that required reclassification among the Funds’ capital accounts related to foreign currency adjustments and net operating losses. The PRIMECAP Odyssey Aggressive Growth Fund deferred, on a tax basis, late-year ordinary losses of $12,580,563.
47
Notes to Financial Statements
PRIMECAP Odyssey Funds
For the Year Ended October 31, 2022 – continued
Tax components of dividends paid during the fiscal years ended October 31, 2022 and October 31, 2021 were as follows:
| October 31, 2022 | October 31, 2021 | |||||||||||||||
| Ordinary Income Distributions | Long-Term Capital Gain Distributions | Ordinary Income Distributions | Long-Term Capital Gain Distributions | |||||||||||||
Stock Fund | $ | 56,748,200 | $ | 606,583,489 | $ | 91,207,885 | $ | 430,738,717 | ||||||||
Growth Fund | $ | 35,104,520 | $ | 1,153,169,227 | $ | 35,746,054 | $ | 1,051,998,107 | ||||||||
Aggressive Growth Fund | $ | — | $ | 1,124,701,183 | $ | — | $ | 822,100,806 | ||||||||
The Funds designated as long-term capital gain dividends, pursuant to IRC Section 852 (b) (3), the amounts necessary to reduce the earnings and profits of the Funds related to net capital gains to zero for the tax year ended October 31, 2022.
(6) Investment Advisory and Other Agreements
The Trust has entered into an investment management agreement with the Investment Advisor on behalf of each Fund. For its services to the Funds, the Investment Advisor receives an annual fee, payable on a quarterly basis, at the annual rate of 0.60% on the first $100 million of each Fund’s average daily assets, 0.55% on the next $9.9 billion of each Fund’s average daily net assets, and 0.50% on each Fund’s average daily assets in excess of $10 billion. For the year ended October 31, 2022, each Fund paid the Investment Advisor at an effective annual rate of 0.55% of its respective average net assets.
U.S. Bancorp Fund Services, LLC, d/b/a U.S. Bank Global Fund Services, serves as the administrator, fund accountant, and transfer agent to the Funds. U.S. Bank, N.A. serves as the Funds’ custodian. ALPS Distributors, Inc. serves as the Funds’ distributor.
48
Notes to Financial Statements
PRIMECAP Odyssey Funds
For the Year Ended October 31, 2022 – continued
(7) Other Affiliates
Certain of the Funds’ investments are in companies that are considered to be affiliated companies of a Fund because the Fund owns 5% or more of the outstanding voting securities of the company. With respect to each such investment, refer to each Fund’s respective Schedule of Investments for the information on the sector of each such company, the number of shares of each such company held, and the percentages of net assets represented by such companies held in each sector. Transactions during the period in securities of these companies were as follows:
PRIMECAP Odyssey Aggressive Growth Fund
| Current Period Transactions | ||||||||||||||||||||||||||||
Common Stock | Market Value at October 31, 2021 | Purchases at Cost | Proceeds from Securities Sold | Dividend Income | Realized Gain (Loss) | Change in Unrealized Gain (Loss) | Market Value at October 31, 2022 | |||||||||||||||||||||
Axcelis Technologies, Inc.(1) | $ | 112,881,150 | $ | — | $ | 33,090,337 | $ | — | $ | 28,332,607 | $ | (20,355,210 | ) | $ | N/A | |||||||||||||
Calithera Biosciences, Inc. | 14,261,542 | 56,740 | 349,533 | — | (9,018,520 | ) | (4,248,144 | ) | 702,085 | |||||||||||||||||||
Cerus Corp. | 65,404,680 | — | 3,863,780 | — | 29,730 | (27,852,148 | ) | 33,718,482 | ||||||||||||||||||||
Epizyme, Inc.(1)(2) | 41,220,089 | 1,281,038 | 16,531,884 | — | (142,996,515 | ) | 117,027,272 | N/A | ||||||||||||||||||||
Nektar Therapeutics | 168,252,957 | — | 7,891,066 | — | (3,792,013 | ) | (117,834,847 | ) | 38,735,031 | |||||||||||||||||||
NN, Inc.(1) | 13,238,510 | — | 2,970,728 | — | (13,325,146 | ) | 7,291,260 | N/A | ||||||||||||||||||||
Pulmonx Corp. | 98,058,947 | 41,310,610 | 1,158,495 | — | (2,816,596 | ) | (86,160,314 | ) | 49,234,152 | |||||||||||||||||||
Rhythm Pharmaceuticals, Inc. | 55,174,106 | 4,240,169 | 1,091,330 | — | (3,847,741 | ) | 71,792,115 | 126,267,319 | ||||||||||||||||||||
ServiceSource International, Inc.(1)(3) | 8,838,960 | — | 10,150,635 | — | (23,714,097 | ) | 25,025,772 | N/A | ||||||||||||||||||||
Standard BioTools, Inc.(4) | 21,584,845 | — | 667,649 | — | (3,615,686 | ) | (12,648,614 | ) | 4,652,896 | |||||||||||||||||||
Wave Life Sciences Ltd.(1) | 17,762,290 | 62,348 | 297,683 | — | (2,758,380 | ) | 3,172,226 | N/A | ||||||||||||||||||||
Xencor, Inc. | 168,988,492 | 14,431,804 | 13,053,878 | — | 4,921,953 | (52,124,295 | ) | 123,164,076 | ||||||||||||||||||||
|
|
|
|
|
|
|
|
|
|
|
|
|
| |||||||||||||||
Total | $ | 785,666,568 | $ | 61,382,709 | $ | 91,116,998 | $ | — | $ | (172,600,404 | ) | $ | (96,914,927 | ) | $ | 376,474,041 | ||||||||||||
|
|
|
|
|
|
|
|
|
|
|
|
|
| |||||||||||||||
| (1) | No longer an affiliate as of October 31, 2022. |
| (2) | Included in “Proceeds from Securities Sold” are proceeds received when Epizyme, Inc. was acquired. |
| (3) | Included in “Proceeds from Securities Sold” are proceeds received when ServiceSource International, Inc. was acquired. |
| (4) | Formerly Fluidigm Corp. Name change effective April 6, 2022. |
49
Notes to Financial Statements
PRIMECAP Odyssey Funds
For the Year Ended October 31, 2022 – continued
(8) Other Matters
Significant market disruptions, such as those caused by pandemics (e.g., COVID-19 pandemic), natural or environmental disasters, war (e.g., Russia’s invasion of Ukraine), acts of terrorism, or other events, can adversely affect local and global markets and normal market operations. The ultimate economic fallout from these disruptions and the long-term impact on economies, markets, industries, and individual issuers, are not known. The operational and financial performance of the issuers of securities in which each Fund invests depends on future developments and may negatively impact the value of each Fund’s investments and lead to losses.
(9) Subsequent Events
The Funds have evaluated subsequent events through the issuance of the financial statements and determined that no events have occurred that require disclosure.
50
| Report of Independent Registered Public Accounting Firm |
To the Board of Trustees of PRIMECAP Odyssey Funds and Shareholders of
PRIMECAP Odyssey Stock Fund,
PRIMECAP Odyssey Growth Fund, and
PRIMECAP Odyssey Aggressive Growth Fund
Opinions on the Financial Statements
We have audited the accompanying statements of assets and liabilities, including the schedules of investments, of PRIMECAP Odyssey Stock Fund, PRIMECAP Odyssey Growth Fund, and PRIMECAP Odyssey Aggressive Growth Fund (constituting PRIMECAP Odyssey Funds, hereafter collectively referred to as the “Funds”) as of October 31, 2022, the related statements of operations for the year ended October 31, 2022, the statements of changes in net assets for each of the two years in the period ended October 31, 2022, including the related notes, and the financial highlights for each of the five years in the period ended October 31, 2022 (collectively referred to as the “financial statements”). In our opinion, the financial statements present fairly, in all material respects, the financial position of each of the Funds as of October 31, 2022, the results of each of their operations for the year then ended, the changes in each of their net assets for each of the two years in the period ended October 31, 2022 and each of the financial highlights for each of the five years in the period ended October 31, 2022 in conformity with accounting principles generally accepted in the United States of America.
Basis for Opinions
These financial statements are the responsibility of the Funds’ management. Our responsibility is to express an opinion on the Funds’ financial statements based on our audits. We are a public accounting firm registered with the Public Company Accounting Oversight Board (United States) (PCAOB) and are required to be independent with respect to the Funds in accordance with the U.S. federal securities laws and the applicable rules and regulations of the Securities and Exchange Commission and the PCAOB.
We conducted our audits of these financial statements in accordance with the standards of the PCAOB. Those standards require that we plan and perform the audit to obtain reasonable assurance about whether the financial statements are free of material misstatement, whether due to error or fraud.
Our audits included performing procedures to assess the risks of material misstatement of the financial statements, whether due to error or fraud, and performing procedures that respond to those risks. Such procedures included examining, on a test basis, evidence regarding the amounts and disclosures in the financial statements. Our audits also included evaluating the accounting principles used and significant estimates made by management, as well as evaluating the overall presentation of the financial statements. Our procedures included confirmation of securities owned as of October 31, 2022 by correspondence with the custodian and brokers. We believe that our audits provide a reasonable basis for our opinions.
/s/ PricewaterhouseCoopers LLP
Los Angeles, California
December 13, 2022
We have served as the auditor of one or more investment companies in PRIMECAP Odyssey Funds Investment Company Complex since 2004.
51
| PRIMECAP Odyssey Funds (Unaudited) |
As a shareholder of one or more of the Funds, you incur ongoing costs including management fees and other Fund expenses. This expense example is intended to help you understand your ongoing costs (in dollars) of investing in the Funds and to compare these costs with the ongoing costs of investing in other mutual funds.
The expense example is based on an investment of $1,000 invested for a six-month period beginning May 1, 2022 through October 31, 2022.
Actual Expenses
The information in the table adjacent to the heading “Actual Performance” provides actual account values and actual expenses. You may use the information in these columns, together with the amount you invested, to estimate the expenses that you paid over the period. Simply divide your account value by $1,000 (for example, an $8,600 account value divided by $1,000 = 8.6), then multiply the result by the number in the column entitled “Expenses Paid during Period” to estimate the expenses you paid on your account during this period.
Hypothetical Example for Comparison Purposes
The information in the table adjacent to the heading “Hypothetical Performance (5% return before expenses)” provides hypothetical account values and hypothetical expenses based on the Funds’ actual expense ratios and an assumed rate of return of 5% per year before expenses, which are not the Funds’ actual returns. The hypothetical account values and expenses may not be used to estimate the actual ending account balance or expenses you paid for the period. You may use this information to compare the ongoing costs of investing in the Funds and other mutual funds. To do so, compare these 5% hypothetical examples with the 5% hypothetical examples that appear in the shareholder reports of the other mutual funds.
Please note that the expenses shown in the table are meant to highlight your ongoing costs only. Therefore, the information adjacent to the heading “Hypothetical Performance (5% return before expenses)” is useful in comparing ongoing costs only and will not help you determine the relative total costs of owning different mutual funds. In addition, if transactional costs were included, your costs would have been higher.
52
Expense Example
PRIMECAP Odyssey Funds
(Unaudited) – continued
| Beginning Account Value (5/1/22) | Ending Account Value (10/31/22) | Expenses Paid During Period(1) (5/1/22 to 10/31/22) | Expense Ratio During Period(1) (5/1/22 to 10/31/22) | |||||||||||||
PRIMECAP Odyssey Stock Fund |
| |||||||||||||||
Actual Performance | $ | 1,000.00 | $ | 960.00 | $ | 3.26 | 0.66% | |||||||||
Hypothetical Performance (5% return before expenses) | $ | 1,000.00 | $ | 1,021.88 | $ | 3.36 | 0.66% | |||||||||
PRIMECAP Odyssey Growth Fund |
| |||||||||||||||
Actual Performance | $ | 1,000.00 | $ | 957.20 | $ | 3.26 | 0.66% | |||||||||
Hypothetical Performance (5% return before expenses) | $ | 1,000.00 | $ | 1,021.88 | $ | 3.36 | 0.66% | |||||||||
PRIMECAP Odyssey Aggressive Growth Fund |
| |||||||||||||||
Actual Performance | $ | 1,000.00 | $ | 932.20 | $ | 3.17 | 0.65% | |||||||||
Hypothetical Performance (5% return before expenses) | $ | 1,000.00 | $ | 1,021.93 | $ | 3.31 | 0.65% | |||||||||
| (1) | Expenses are equal to a Fund’s annualized expense ratio as indicated, multiplied by the average account value over the period, multiplied by the number of days in the most recent fiscal half-year period (184), then divided by the number of days in the fiscal year (365) to reflect the one-half year period. |
53
| PRIMECAP Odyssey Funds (Unaudited) |
Additional Tax Information
PRIMECAP Odyssey Stock Fund, PRIMECAP Odyssey Growth Fund, and PRIMECAP Odyssey Aggressive Growth Fund designate 100%, 100%, and 0%, respectively, of ordinary income distributions paid during the fiscal year ended October 31, 2022 as qualified dividend income.
PRIMECAP Odyssey Stock Fund, PRIMECAP Odyssey Growth Fund, and PRIMECAP Odyssey Aggressive Growth Fund designate 100%, 100%, and 0%, respectively, of ordinary income distributions paid during the fiscal year ended October 31, 2022 as dividends qualifying for the dividends received deduction available for corporate shareholders.
PRIMECAP Odyssey Stock Fund, PRIMECAP Odyssey Growth Fund, and PRIMECAP Odyssey Aggressive Growth Fund designate 12.63%, 69.22%, and 0%, respectively, of ordinary income distributions paid during the fiscal year ended October 31, 2022 as short-term capital gain under Internal Revenue Code 871(k)(2)(C).
Proxy Voting Procedures
The Investment Advisor votes proxies relating to portfolio securities in accordance with procedures that have been approved by the Trust’s Board of Trustees. You may obtain a description of these procedures, free of charge, by calling toll-free 1-800-729-2307. This information is also available through the Securities and Exchange Commission’s (“SEC”) website at www.sec.gov.
Proxy Voting Record
Information regarding how the Funds voted proxies relating to the portfolio securities during the most recent 12-month period ended June 30 is available, without charge, by calling toll-free 1-800-729-2307. This information is also available through the SEC’s website at www.sec.gov.
Portfolio Holdings Disclosure
The Funds file a complete schedule of portfolio holdings with the SEC for the first and third quarters of each fiscal year on Part F of Form N-PORT. This information is available, without charge, by calling toll-free 1-800-729-2307. The Funds’ Part F of Form N-PORT is also available on the SEC’s website at www.sec.gov. The Funds’ Part F of Form N-PORT may be reviewed and copied at the Commission’s Public Reference Room in Washington, DC, and information on the operation of the Public Reference Room may be obtained by calling 1-800-SEC-0330.
Board Approval of the Renewal of the Investment Advisory Agreement
The Board of Trustees (the “Board”) of PRIMECAP Odyssey Funds (the “Trust”) is comprised of seven Trustees, six of whom are not “interested persons” of the Trust as defined by the Investment Company Act of 1940, as amended (the “Independent Trustees”). In October 2022, the Board of Trustees, including the Independent Trustees, approved a one-year renewal of the Trust’s investment advisory agreement with PRIMECAP Management Company (the “Advisor”) with respect to the series of the Trust (the “Funds”).
General Information
As part of the annual contract review process, the Independent Trustees, through counsel to the Trust and the Independent Trustees, requested and received extensive materials, including
54
Additional Information
PRIMECAP Odyssey Funds
(Unaudited) – continued
information related to the nature, extent, and quality of the services provided to the Funds by the Advisor; information prepared by Broadridge Financial Solutions (“Broadridge”) comparing the performance and risk profile of each Fund to those of relevant market indices and of other funds in the relevant Morningstar, Inc. (“Morningstar”) categories and in a smaller group of funds selected by Broadridge; information prepared by Broadridge comparing the advisory fees and total expenses to those of other funds in the relevant Morningstar category and peer group; financial information for the Advisor and information related to the profitability to the Advisor of the investment advisory agreement with the Trust; the extent to which the Advisor expects to achieve economies of scale in connection with the services it provides to each Fund; any ancillary or “fall out” benefits that the Advisor may derive from its relationship with the Funds; and the personnel of the Advisor providing services to the Funds. The Independent Trustees also requested and received information regarding the Advisor’s risk controls, risk evaluation processes, compliance program (including brokerage and trading processes), information technology infrastructure (including cyber security measures), business continuity plans, and other matters.
The Trust engaged Broadridge to prepare an independent expense and performance analysis for each Fund. In performing its analyses, Broadridge used data compiled by Morningstar to compare the expenses and performance of each Fund to those of similar funds managed by other advisors identified by Broadridge. The Board reviewed the Broadridge materials, which included information regarding the performance of each Fund compared with the performance of its benchmark index and of the entire universe of funds in its Morningstar retail category, as well as the performance of a group of comparable funds selected by Broadridge from the relevant Morningstar category (each a “Peer Group”), for the one-, three-, five- and ten-year periods ended July 31, 2022 (in each case net of fees); as well as information regarding the advisory fees paid to the Advisor and the total expense ratio of each Fund compared to those of a peer group of comparable funds selected by Broadridge (each an “Expense Peer Group”) from the Fund’s Morningstar retail category.
With respect to investment performance, the Trustees noted that the Advisor had made quarterly presentations to the Board regarding the Funds’ portfolio construction, investment strategies, and results. The Trustees also noted that in addition to meeting with the Funds’ portfolio managers on a quarterly basis, they also received presentations from different investment analysts throughout the year on specific investment sectors and each Fund’s investments in those sectors. In considering the renewal of the agreement, the Board also took into account other information it had received at past Board and committee meetings with respect to various matters.
The Trustees reviewed information from counsel to the Trust and the Independent Trustees regarding their responsibilities in considering whether to renew the investment advisory agreement for an additional one-year period. In connection with their deliberations, the Board considered such information and factors that they believed to be relevant. The Board considered renewal of the investment advisory agreement separately for each Fund, although the Board took into account the common interests of all the Funds in its review. In considering these matters, the Board discussed the renewal of the investment advisory agreement with management, and the Independent Trustees met in a private session with counsel to the Trust and the Independent Trustees at which no employees of the Advisor were present.
55
Additional Information
PRIMECAP Odyssey Funds
(Unaudited) – continued
In deciding to approve the renewal of the investment advisory agreement, the Board and the Independent Trustees did not identify a single factor that was controlling. The Board and the Independent Trustees concluded that each of the various factors referred to below favored such approval. The following summary describes the key factors considered by the Trustees and their conclusions that formed the basis for approving the renewal of the investment advisory agreement in light of the legal advice furnished by counsel and their own business judgment. This summary is not inclusive of all of the factors considered, and each Trustee did not necessarily attribute the same weight to each factor.
Nature, Extent, and Quality of Services
The Board considered the services provided by the Advisor to the Funds under the investment advisory agreement, including the background, education, and experience of the Advisor’s key portfolio management, compliance, and operational personnel; its overall financial strength and stability; its resources and efforts to retain, attract, and motivate capable personnel to serve the Funds; and the overall general quality and depth of its organization. The Board also took into account the experience, capability, and integrity of the Advisor’s senior management, the time that senior management commits to the Funds, and the Advisor’s demonstrated commitment to the Funds; its investment philosophy and processes, including its brokerage and trading practices; its disaster recovery and contingency planning; its oversight of the Funds’ internal control environment with regard to compliance with applicable laws and regulations; and the significant investment by each portfolio manager in the Funds that he manages, which helps align his interests with those of Fund shareholders. The Trustees concluded that the nature, extent, and quality of services provided under the investment advisory agreement were of a high level and satisfactory.
Investment Performance
The Board assessed the performance of each Fund compared with the performance of its benchmark(s) and other funds in the Fund’s Morningstar retail category and Peer Group for the one-, three-, five- and ten-year periods ended July 31, 2022. The Board made the following observations in reviewing the Funds’ performance:
| • | The annualized total return of the PRIMECAP Odyssey Stock Fund outperformed the S&P 500® Index for the since inception period ended July 31, 2022, but underperformed compared to the Index for the one-, three-, five-, and ten-year periods by 1.67%, 3.03%, 2.64% and 0.67%, respectively. The Fund’s return exceeded the median of funds in the Morningstar Large Relative Value category for the ten-year period by 0.45% but was below the median returns of the Morningstar category for the one-, three- and five-year periods by 0.64%, 1.47% and 1.04%, respectively. The Fund’s returns were above the median of the Peer Group for the one- and ten-year periods by 0.26% and 0.30%, respectively, but were below the median of the Peer group for the three- and five-year periods by 0.85% and 0.02%, respectively. |
| • | The annualized total returns of the PRIMECAP Odyssey Growth Fund outperformed its primary benchmark, the S&P 500® Index, for the since inception period ended July 31, 2022, but underperformed compared to the Index for the one-, three-, five- and ten-year |
56
Additional Information
PRIMECAP Odyssey Funds
(Unaudited) – continued
periods by 6.45%, 4.38%, 2.53% and 0.12%, respectively. The Fund’s annualized total returns outperformed its secondary benchmark, the Russell 1000 Growth Index, for the one-year period by 0.84%, but underperformed relative to the Index for the three-, five-, ten-year and since inception periods by 7.07%, 6.00%, 2.27% and 0.65%, respectively. The Fund outperformed the medians of funds in the Morningstar Large Core Growth category and Peer Group for the one-year period. For the three-, five- and ten-year periods, the Fund’s annualized total returns were below the Morningstar category’s median return by 3.50%, 3.03% and 0.31%, respectively. The Fund’s annualized total returns were below the median returns of the Peer Group for the three-, five- and ten-year periods by 3.22%, 3.82%, and 0.75%, respectively. |
| • | The annualized total returns of the PRIMECAP Odyssey Aggressive Growth Fund were above the returns of the Fund’s primary benchmark, the S&P 500® Index, and its secondary benchmark, the Russell Mid Cap Growth Index, for the ten-year and since inception periods ended July 31, 2022. The Fund’s annualized total return was below the return of the S&P 500® Index for the one-, three- and five-year periods by 15.98%, 8.21% and 4.57%, respectively. The Fund’s annualized total returns for the one- and ten-year periods were above the returns of the Russell Mid Cap Growth Index by 1.14% and 1.44%, respectively, but below the three- and five-year periods by 2.36% and 2.80%, respectively. For the ten-year period, the Fund’s performance was above the median of funds in the Morningstar All Cap Growth category and Peer Group by 1.89% and 1.41%, respectively. For the one-, three- and five-year periods, the Fund returned 0.11%, 3.41% and 2.84% less than the category median, respectively. The Fund’s annualized total return for the one-year period was equal to the median of the Peer Group but was lower than the Peer Group medians for the three- and five-year periods by 3.46% and 2.89%, respectively. |
In assessing the performance of the Funds, the Trustees considered the Advisor’s explanation that the Funds’ performance struggled to keep pace with that of their respective indices, Peer Groups, and Morningstar categories as the Advisor stayed committed to its investment philosophy and refused to chase momentum driven stocks during the height of the COVID-19 pandemic. The Board considered the Advisor’s explanation that the Funds’ performance was negatively impacted by a confluence of factors that worked against the Funds’ investment objectives and risk profiles during the COVID-19 pandemic, including: the Funds’ underweight positions in the “Big 5” tech stocks (Microsoft, Apple, Amazon, Alphabet, and Meta), since those companies benefited significantly from the pandemic; the Funds’ overweight positions in the airline and cruise line industries when the pandemic first began; and delays and cancellation of medical elective procedures, which negatively impacted the healthcare devices sector. The Board also considered that the Advisor feels the Funds are well positioned for the future as consumers are expected to rotate back to services such as air travel and cruises and the healthcare industry is expected to develop more drugs and treatments to address significant unmet medical needs. The Trustees noted that the Advisor believes that each Fund continues to hold considerable value in its portfolio despite the various periods of underperformance. The Trustees also noted that each Fund had performed well over the long term.
57
Additional Information
PRIMECAP Odyssey Funds
(Unaudited) – continued
Based on the information provided to them and in consideration of the specific investment objectives and risk profiles of each Fund, the Board and the Independent Trustees concluded that the performance of each Fund was satisfactory.
Advisory Fees and Fund Expenses
The Board reviewed the advisory fees and expenses paid by each Fund compared to those of other funds in the same Morningstar retail category (for the Stock Fund – Large Blend funds; for the Growth Fund – Large Growth funds; and for the Aggressive Growth Fund – Mid-Cap Growth funds), and of other funds in the Fund’s Expense Peer Group, which was selected by Broadridge and was comprised of funds comparable to the Fund with fee structures and characteristics similar to those of the Funds (e.g., no distribution or shareholder servicing fees, and excluding load funds, index and enhanced index funds, funds of funds, and multi-manager funds).
The materials for the meeting indicated as follows:
| • | The advisory fee of the Stock Fund was the same as the medians of the Fund’s Expense Peer Group and the funds in the Morningstar Large Blend retail category. |
| • | The advisory fee of the Growth Fund was below the median fees of the funds in the Morningstar Large Growth category and the Fund’s Expense Peer Group. |
| • | The advisory fee of the Aggressive Growth Fund was below the median fees of the funds in the Morningstar Mid-Cap Growth category and the Fund’s Expense Peer Group. |
| • | The total expense ratios of the Stock Fund, the Growth Fund and the Aggressive Growth Fund were below the medians of the respective Expense Peer Groups and Morningstar retail categories. |
The Board also reviewed the fees charged by the Advisor to other clients, including other mutual funds for which it provides sub-advisory services. The Board considered that although those fees were lower than those charged by the Advisor to the Funds, the differences appropriately reflected the investment, operational, and regulatory differences between advising other clients and the Funds, noting that mutual funds are subject to certain requirements under the 1940 Act that do not apply to the Advisor’s separate account clients. The Trustees considered the services provided by the Advisor under the Investment Advisory Agreement, including providing the Chief Compliance Officer, certain other officers of the Trust and other personnel involved in the oversight of the Trust’s service providers. The Board further noted that the advisory fee was the sole source of revenue from the Funds to the Advisor. The Board and the Independent Trustees determined that the advisory fees and expenses charged to the Funds were reasonable in consideration of the services provided.
Costs and Profits of the Advisor
The Board reviewed information regarding the Advisor’s financial position and concluded that the Advisor would be able to continue to provide advisory services to the Funds. The Board also reviewed information relating to the Advisor’s profitability. The Board recognized the competitiveness of the registered fund industry and the importance of an investment advisor’s
58
Additional Information
PRIMECAP Odyssey Funds
(Unaudited) – continued
long-term profitability, including for maintaining management stability and accountability. The Board noted that the Advisor had closed the Aggressive Growth Fund in January 2014 to most new investors, limiting the growth of the Fund and consequently future profits to the Advisor as it relates to the Fund. In considering the Advisor’s profitability, the Trustees recognized the importance of the profitability of the Advisor, not only in maintaining its own financial condition, but also in maintaining an environment in which it is able to attract and retain talented investment professionals. Recognizing the difficulty in evaluating an investment advisor’s profitability with respect to the funds it manages in the context of an advisor with multiple lines of business, and noting that other profitability methodologies might also be reasonable, the Board and the Independent Trustees concluded that the profit of the Advisor from its relationship with each Fund was reasonable.
Economies of Scale and Other Benefits to the Investment Advisor
The Trustees considered that the Investment Advisory Agreement provides fee breakpoints at $100 million and $10 billion in assets for each Fund, that the Advisor had added the $10 billion breakpoint effective May 1, 2021, and that that the fees continued to compare favorably to those of other actively managed funds with similar investment objectives. The Board considered that the Advisor had significant assets under management at the time the Funds commenced operations and that the Funds were offered advisory fee rates at inception that reflected scale within the Advisor’s business. The Board also acknowledged various diseconomies of scale experienced by the Advisor as the Funds have grown, including the hiring of additional personnel and the provision of additional services to the Funds including online access to shareholder accounts and improved technology, systems, and hardware. The Board and the Independent Trustees concluded that the Advisor had shared any economies of scale it had realized from the Funds with the Funds and their shareholders through advisory fee breakpoints, the hiring of additional personnel, and the provision of additional services to the Funds.
The Board also considered the benefits received by the Advisor as a result of its relationship with the Funds other than investment advisory fees, including any research provided to the Advisor by broker-dealers providing execution services to the Funds, the intangible benefits of the Advisor’s association with the Funds generally, and any favorable publicity arising in connection with the Funds’ performance.
Conclusions
Based on their review, including their consideration of each of the factors referred to above, the Board and the Independent Trustees concluded that the compensation payable to the Advisor pursuant to the investment advisory agreement with respect to each Fund was fair and reasonable in light of the services being provided by the Advisor to the Fund and its shareholders and that renewal of the investment advisory agreement with respect to each Fund was in the best interest of the Fund and its shareholders.
59
| PRIMECAP Odyssey Funds (Unaudited) |
Portfolio Managers
PRIMECAP Management Company has five portfolio managers who together have more than 150 years of investment experience. The portfolio managers primarily responsible for overseeing the Funds’ investments are:
| Name | Years of Experience | |||
Theo A. Kolokotrones | 52 | |||
Joel P. Fried | 37 | |||
Alfred W. Mordecai | 25 | |||
M. Mohsin Ansari | 22 | |||
James Marchetti | 17 | |||
Each of these five individuals manages a portion of the PRIMECAP Odyssey Stock Fund, the PRIMECAP Odyssey Growth Fund, and the PRIMECAP Odyssey Aggressive Growth Fund. A portion of each Fund’s assets may be managed by individuals in the Investment Advisor’s research department.
Officers and Trustees
The Trust’s officers, who oversee the Funds’ daily operations, are appointed by the Board of Trustees. The trustees are responsible for the overall management of the Trust, including establishing the Funds’ policies and general supervision and review of their investment activities. The Statement of Additional Information includes additional information about the trustees and is available, without charge, by calling 1-800-729-2307 or at the Funds’ website at www.primecap.com.
Executive Officers. The table below sets forth certain information about each of the Trust’s executive officers. The address for each officer is 177 East Colorado Boulevard, 11th Floor, Pasadena, CA 91105.
Name Age | Position(s) Held with Trust | Term of Office; Length of Time Served | Principal Occupation(s) During Past 5 Years | |||
Theo A. Kolokotrones Age: 76 | Co-Chief Executive Officer | Indefinite; Since 09/04 | Chairman, Director, and Portfolio Manager PRIMECAP Management Company | |||
Joel P. Fried Age: 60 | Co-Chief Executive Officer and Trustee | Indefinite; Since 09/04 | President, Director, and Portfolio Manager PRIMECAP Management Company |
60
Management
PRIMECAP Odyssey Funds
(Unaudited) – continued
| Name Age | Position(s) Held with Trust | Term of Office; Length of Time Served | Principal Occupation(s) During Past 5 Years | |||
Alfred W. Mordecai Age: 55 | Co-Chief Executive Officer | Indefinite; Since 10/12 | Vice Chairman, Director, and Portfolio Manager PRIMECAP Management Company | |||
Michael J. Ricks Age: 44 | Chief Financial Officer, Secretary, Chief Administrative Officer | Indefinite; Since 03/11 | Director of Fund Administration PRIMECAP Management Company; Chief Compliance Officer, PRIMECAP Odyssey Funds; Chief Compliance Officer PRIMECAP Management Company March 2019-March 2020 | |||
Jennifer Ottosen Age: 62 | Chief Compliance Officer, AML Compliance Officer | Indefinite; Since 02/20 | Chief Compliance Officer, PRIMECAP Management Company since March 2020; Senior Compliance Officer, PRIMECAP Management Company May 2019-March 2020; CCO Dividend Assets Capital, LLC; CCO & General Counsel, GW Capital, Inc. |
“Independent” Trustees. The table below sets forth certain information about each of the trustees of the Trust who is not an “interested person” of the Trust as defined in the 1940 Act (“Independent Trustees”). The address for each Independent Trustee is 177 East Colorado Boulevard, 11th Floor, Pasadena, CA 91105.
| Name Age | Position(s) Held with Trust | Term of Office; Length of Time Served | Principal Occupation(s) During Past 5 Years | Number of Portfolios in Fund Complex Overseen by Trustee(1) | Other Director- ships Held by Trustee | |||||
Benjamin F. Hammon Age: 87 | Chairman of the Board and Trustee | Indefinite; Since 09/04 | Retired; Private investor | 3 | None | |||||
Wayne H. Smith Age: 81 | Chairman of the Audit Committee and Trustee | Indefinite; Since 09/04 | Retired; Private investor | 3 | None | |||||
Joseph G. Uzelac Age: 78 | Trustee | Indefinite; Since 10/07 | Retired; Private investor | 3 | None | |||||
Elizabeth D. Obershaw Age: 62 | Trustee | Indefinite; Since 06/08 | Retired; Formerly, Managing Director, Horsley Bridge Partners, an investment advisor (2007-2021) | 3 | None | |||||
J. Blane Grinstead Age: 67 | Trustee | Indefinite; Since 03/19 | Retired; Private investor | 3 | Orenda, Inc., a renewable energy technology company (May 2020 – Present) | |||||
Michael Glazer Age: 82 | Trustee | Indefinite; Since 10/19 | Retired; Formerly, Partner and Senior Counsel, Morgan, Lewis & Bockius LLP | 3 | None |
| (1) | Fund Complex includes any funds, series of funds, or trusts that share the same advisor or that hold themselves out to investors as related companies. |
61
Management
PRIMECAP Odyssey Funds
(Unaudited) – continued
“Interested” Trustee. The table below sets forth certain information about the trustee of the Trust who is an “interested person” of the Trust as defined by the 1940 Act. The address for the interested trustee is 177 East Colorado Boulevard, 11th Floor, Pasadena, CA 91105.
| Name Age | Position(s) Held with Trust | Term of Office; Length of Time Served | Principal Occupation(s) During Past 5 Years | Number of Portfolios in Fund Complex Overseen by Trustee(1) | Other Director- ships Held by Trustee | |||||
Joel P. Fried(2) Age: 60 | Co-Chief Executive Officer and Trustee | Indefinite; Since 09/04 | President, Director, and Portfolio Manager PRIMECAP Management Company | 3 | None |
| (1) | Fund Complex means two or more registered investment companies that hold themselves out to investors as related companies for purposes of investment and investor services or have a common investment advisor or have an investment advisor that is an affiliated person of the investment advisor of any of the other registered investment companies. |
| (2) | Mr. Fried is an “interested person” of the Trust, as defined by the 1940 Act, because of his employment with PRIMECAP Management Company, the investment advisor to the Trust. |
62
| PRIMECAP Odyssey Funds |
PRIMECAP Management Company
Maintaining the confidentiality of client personal financial information is very important to PRIMECAP Odyssey Funds (the “Trust”) and PRIMECAP Management Company (the “Advisor”). The Advisor and the Trust may collect several types of nonpublic personal information about investors, including:
| • | Information from forms that investors may fill out and send to the Advisor or the Trust in connection with an account (such as name, address, and social security number). |
| • | Information an investor may give the Advisor or the Trust orally. |
| • | Information about the amount investors have invested in an account. |
| • | Information about any bank account investors may use for transfers between a bank account and a shareholder account. |
The Advisor and the Trust will not sell or disclose client personal information to anyone except as permitted or required by law. For example, information collected may be shared with the independent auditors in the course of the annual audit of the Advisor or the Trust. The Advisor or the Trust may also share this information with the Advisor’s or the Trust’s legal counsel, as deemed appropriate, and with regulators. Finally, the Advisor or the Trust may disclose information about clients or investors at the client’s or investor’s request (for example, by sending duplicate account statements to someone designated by the client or investor), or as otherwise permitted or required by law.
Within the Advisor and the Trust, access to information about clients and investors is restricted to those employees or service providers who need to know the information to service client accounts. The Advisor’s employees are trained to follow its procedures to protect client privacy and are instructed to access information about clients only when they have a business reason to obtain it.
The Advisor and the Trust reserve the right to change this privacy policy in the future, but we will not disclose investor nonpublic personal information except as required or permitted by law without giving the investor an opportunity to instruct us not to do so.
Investment Advisor
PRIMECAP MANAGEMENT COMPANY
177 East Colorado Boulevard, 11th Floor
Pasadena, California 91105
•
Distributor
ALPS DISTRIBUTORS, INC.
1290 Broadway, Suite 1000
Denver, Colorado 80203
•
Custodian
U.S. BANK, N.A.
1555 North RiverCenter Drive, Suite 302
Milwaukee, Wisconsin 53212
•
Transfer Agent
U.S. BANCORP FUND SERVICES, LLC
615 East Michigan Street, 3rd Floor
Milwaukee, Wisconsin 53202
•
Administrator
U.S. BANCORP FUND SERVICES, LLC
2020 East Financial Way, Suite 100
Glendora, California 91741
•
Legal Counsel
MORGAN, LEWIS & BOCKIUS LLP
600 Anton Boulevard, Suite 1800
Costa Mesa, California 92626
•
Independent Registered Public Accounting Firm
PRICEWATERHOUSECOOPERS LLP
601 South Figueroa Street, Suite 900
Los Angeles, California 90017
This report is intended for the shareholders of the PRIMECAP Odyssey Funds and may not be used as sales literature unless preceded or accompanied by a current prospectus.
Past performance results shown in this report should not be considered a representation of future performance. Share price and returns will fluctuate so that shares, when redeemed, may be worth more or less than their original cost. Statements and other information herein are dated and are subject to change.
PRIMECAP, PRIMECAP Odyssey, and the PRIMECAP Odyssey logo are trademarks of PRIMECAP Management Company.
(b) Not applicable.
Item 2. Code of Ethics.
The registrant has adopted a code of ethics that applies to the registrant’s principal executive officers and principal financial officer. The registrant has not made any amendments to its code of ethics during the period covered by this report. The registrant has not granted any waivers from any provisions of the code of ethics during the period covered by this report.
The registrant undertakes to provide to any person without charge, upon request, a copy of its code of ethics by mail when such person calls the registrant at 1-800-729-2307.
Item 3. Audit Committee Financial Expert.
The registrant’s Board of Trustees has determined that there is at least one audit committee financial expert serving on its audit committee. Wayne Smith is the registrant’s “audit committee financial expert” and is considered to be “independent” as each term is defined in Item 3 of Form N-CSR.
Item 4. Principal Accountant Fees and Services.
The registrant has engaged its principal accountant, PricewaterhouseCoopers LLP, to perform audit services, audit-related services, and tax services during the past two fiscal years. “Audit services” refer to performing an audit of the registrant’s annual financial statements or services that are normally provided by the accountant in connection with statutory and regulatory filings or engagements for those fiscal years. “Audit-related services” refer to the assurance and related services by the principal accountant that are reasonably related to the performance of the audit. “Tax services” refer to professional services rendered by the principal accountant for tax compliance, tax advice, and tax planning and specifically relate to the accountant’s review of the registrant’s federal and state tax returns. There were no other services provided by the principal accountant to the registrant during the past two fiscal years. The following table details the aggregate fees billed or expected to be billed to the registrant for each of the last two fiscal years for audit fees, audit-related fees, tax fees and other fees by the principal accountant.
| FYE 10/31/2022 | FYE 10/31/2021 | |||||||
(a) Audit Fees | $ | 156,071 | $ | 142,888 | ||||
(b) Audit-Related Fees | $ | 0 | $ | 0 | ||||
(c) Tax Fees | $ | 18,927 | $ | 17,526 | ||||
(d) All Other Fees | $ | 0 | $ | 0 | ||||
(e)(1) The audit committee has adopted pre-approval policies and procedures that require the audit committee to pre-approve all audit and non-audit services of the registrant, including services provided to any entity affiliated with the registrant. All services were pre-approved and no waivers to the pre-approval requirement were made.
(e)(2) The percentage of fees billed by PricewaterhouseCoopers applicable to non-audit services pursuant to waiver of pre-approval requirement were as follows:
| FYE 10/31/2022 | FYE 10/31/2021 | |||||||
Audit-Related Fees | 0 | % | 0 | % | ||||
Tax Fees | 0 | % | 0 | % | ||||
All Other Fees | 0 | % | 0 | % | ||||
(f) All of the principal accountant’s hours spent on auditing the registrant’s financial statements were attributed to work performed by full-time permanent employees of the principal accountant.
(g) The following table indicates the non-audit fees billed or expected to be billed by the registrant’s accountant for services to the registrant and to the registrant’s investment adviser (and any entity controlling, controlled by, or under common control with the investment adviser) for the last two years.
Non-Audit Related Fees | FYE 10/31/2022 | FYE 10/31/2021 | ||||||
Registrant | $ | 18,927 | $ | 17,526 | ||||
Registrant’s Investment Adviser | $ | 0 | $ | 0 | ||||
(h) The audit committee of the board of trustees/directors has considered whether the provision of non-audit services that were rendered to the registrant’s investment adviser is compatible with maintaining the principal accountant’s independence and has concluded that the provision of such non-audit services by the accountant has not compromised the accountant’s independence.
(i) Not applicable.
(j) Not applicable.
Item 5. Audit Committee of Listed Registrants.
Not applicable to registrants who are not listed issuers (as defined in Rule 10A-3 under the Securities Exchange Act of 1934).
Item 6. Investments.
| (a) | The registrant’s Schedule of Investments is included as part of the report to shareholders filed under Item 1 of this Form. |
| (b) | Not applicable. |
Item 7. Disclosure of Proxy Voting Policies and Procedures for Closed-End Management Investment Companies.
Not applicable to open-end investment companies.
Item 8. Portfolio Managers of Closed-End Management Investment Companies.
Not applicable to open-end investment companies.
Item 9. Purchases of Equity Securities by Closed-End Management Investment Company and Affiliated Purchasers.
Not applicable to open-end investment companies.
Item 10. Submission of Matters to a Vote of Security Holders.
There have been no material changes to the procedures by which shareholders may recommend nominees to the registrant’s board of trustees.
Item 11. Controls and Procedures.
| (a) | The Registrant’s Co-Chief Executive Officers and Chief Financial Officer have reviewed the Registrant’s disclosure controls and procedures (as defined in Rule 30a-3(c) under the Investment Company Act of 1940 (the “Act”)) as of a date within 90 days of the filing of this report, as required by Rule 30a-3(b) under the Act and Rules 13a-15(b) or 15d-15(b) under the Securities Exchange Act of 1934. Based on their review, such officers have concluded that the disclosure controls and procedures are effective in ensuring that information required to be disclosed in this report is appropriately recorded, processed, summarized and reported and made known to them by others within the Registrant and by the Registrant’s service provider. |
| (b) | There were no changes in the Registrant’s internal control over financial reporting (as defined in Rule 30a-3(d) under the Act) that occurred during the period covered by this report that have materially affected, or are reasonably likely to materially affect, the Registrant’s internal control over financial reporting. |
Item 12. Disclosure of Securities Lending Activities for Closed-End Management Investment Companies.
Not applicable to open-end investment companies.
Item 13. Exhibits.
| (a) |
(3) Any written solicitation to purchase securities under Rule 23c-1 under the Act sent or given during the period covered by the report by or on behalf of the registrant to 10 or more persons. Not applicable to open-end investment companies.
(4) Change in the registrant’s independent public accountant. There was no change in the registrant’s independent public accountant for the period covered by this report.
| (b) | Certifications pursuant to Section 906 of the Sarbanes-Oxley Act of 2002. Furnished herewith. |
SIGNATURES
Pursuant to the requirements of the Securities Exchange Act of 1934 and the Investment Company Act of 1940, the registrant has duly caused this report to be signed on its behalf by the undersigned, thereunto duly authorized.
| PRIMECAP Odyssey Funds | ||
| By | /s/ Joel P. Fried | |
| Joel P. Fried, Co-Chief Executive Officer | ||
| Date | December 21, 2022 | |
| By | /s/ Theo A. Kolokotrones | |
| Theo A. Kolokotrones, Co-Chief Executive Officer | ||
| Date | December 21, 2022 | |
| By | /s/ Alfred W. Mordecai | |
| Alfred W. Mordecai, Co-Chief Executive Officer | ||
| Date | December 21, 2022 | |
Pursuant to the requirements of the Securities Exchange Act of 1934 and the Investment Company Act of 1940, this report has been signed below by the following persons on behalf of the registrant and in the capacities and on the dates indicated.
| By | /s/ Joel P. Fried | |
| Joel P. Fried, Co-Chief Executive Officer | ||
| Date | December 21, 2022 | |
| By | /s/ Theo A. Kolokotrones | |
| Theo A. Kolokotrones, Co-Chief Executive Officer | ||
| Date | December 21, 2022 | |
| By | /s/ Alfred W. Mordecai | |
| Alfred W. Mordecai, Co-Chief Executive Officer | ||
| Date | December 21, 2022 | |
| By | /s/ Michael J. Ricks | |
| Michael J. Ricks, Chief Financial Officer | ||
| Date | December 21, 2022 | |