United States
Securities and Exchange Commission
Washington, DC 20549
Schedule 14A
(Rule 14a-101)
INFORMATION REQUIRED IN PROXY STATEMENT
SCHEDULE 14A INFORMATION
Proxy Statement Pursuant to Section 14(a) of the Securities
Exchange Act of 1934
Filed by the Registrant ¨ Filed by a Party other than the Registrant x
Check the appropriate box:
¨ | Preliminary Proxy Statement | |
| ¨ | Confidential, for Use of the Commission Only (as permitted by Rule 14a-6(e)(2)) | |
¨ | Definitive Proxy Statement | |
| x | Definitive Additional Materials | |
| ¨ | Soliciting Material Pursuant to § 240.14a-12 | |
Rand Logistics, Inc.
(Name of Registrant as Specified in its Charter)
JWEST, LLC
(Name of Person(s) Filing Proxy Statement, if Other Than the Registrant)
Payment of Filing Fee (Check the appropriate box):
| x | No fee required. | |||
| ¨ | Fee computed on table below per Exchange Act Rules 14a-6(i)(1) and 0-11. | |||
| (1) | Title of each class of securities to which transaction applies:
| |||
| (2) | Aggregate number of securities to which transaction applies:
| |||
| (3) | Per unit price or other underlying value of transaction computed pursuant to Exchange Act Rule 0-11 (set forth the amount on which the filing fee is calculated and state how it was determined):
| |||
| (4) | Proposed maximum aggregate value of transaction:
| |||
| (5) | Total fee paid:
| |||
| ¨ | Fee paid previously with preliminary materials. | |||
| ¨ | Check box if any part of the fee is offset as provided by Exchange Act Rule 0-11(a)(2) and identify the filing for which the offsetting fee was paid previously. Identify the previous filing by registration statement number, or the Form or Schedule and the date of its filing. | |||
| (1) | Amount Previously Paid:
| |||
| (2) | Form, Schedule or Registration Statement No.:
| |||
| (3) | Filing Party:
| |||
| (4) | Date Filed:
| |||

RLOG: A crisis of confidence
JWEST, LLC
RAND
LOGISTICS, INC.
“Rand Logistics, Inc. is a leading provider of bulk freight shipping services throughout the Great Lakes region. The Company is the only carrier able to offer significant domestic port-to-port services in both Canada and the U.S. on the Great Lakes.”
Sources:
-Quote and slide image obtained from the RLOG website (http://www.randlogisticsinc.com/)
Disclaimer
THESE MATERIALS SHALL NOT CONSTITUTE AN OFFER TO SELL OR THE SOLICITATION OF AN OFFER TO BUY ANY INTERESTS IN ANY FUND MANAGED BY JWEST, LLC OR ANY OF ITS AFFILIATES. SUCH AN OFFER TO SELL OR SOLICITATION OF AN OFFER TO BUY INTERESTS MAY ONLY BE MADE PURSUANT TO DEFINITIVE SUBSCRIPTION DOCUMENTS BETWEEN A FUND AND AN INVESTOR.
The information contained herein reflects the opinions and projections of JWEST, LLC and its affiliates [collectively “JWEST”] as of the date of publication, which is subject to change without notice at any time subsequent to the date of issue. JWEST does not represent that any opinion or projection will be realized. While the information presented herein is believed to be reliable, no representation or warranty is made concerning the accuracy of any data presented. All information provided in this presentation is for informational purposes only and should not be deemed as investment advice or a recommendation to purchase or sell any specific security. JWEST has an economic interest in the price movement of the securities discussed in this presentation, but JWEST’s economic interest is subject to change without notice. This presentation may not be reproduced without prior written permission from JWEST.
The information contained within the body of this presentation is supplemented by footnotes which identify JWEST’s sources, assumptions, estimates, and calculations. This information contained herein should be reviewed in conjunction with the footnotes.
JWEST,LLC
Why is JWEST invested in RLOG stock?
• |
| High barriers to entry |
• |
| Very little direct competition in the river class market |
• |
| Unique asset portfolio |
• |
| Backwards way to play the improving aggregates market |
• |
| High fixed cost business |
• |
| Should have strong incremental margins |
• |
| Belief that RLOG will benefit from commodities moving onto the Great Lakes due to slower train speed from oil to rail |
JWEST, LLC
Let’s start with why the founding members of JWEST have been invested in Rand Logistics (“RLOG”) since 2-14-11.

Underperformance in an
oligopoly? You can’t be serious
JWEST, LLC
Despite RLOG being set up to succeed in a market with very little direct competition, the Company has consistently fallen short of management’s expectations.
How did we get here?
• |
| Lack of focus |
• |
| Lack of leadership |
JWEST,LLC
As will be demonstrated throughout this presentation, we believe RLOG has suffered from a lack of focused and accountable leadership which contributed to missed projections.
Sources:
-Image obtained from http://foreverfail.com/clearly-i-have-made-some-bad-decisions
Delusions of grandeur
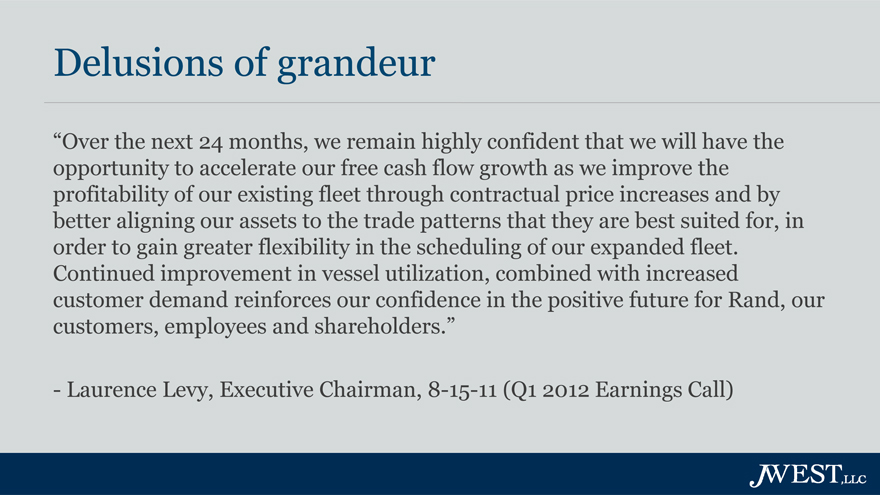
“Over the next 24 months, we remain highly confident that we will have the opportunity to accelerate our free cash flow growth as we improve the profitability of our existing fleet through contractual price increases and by better aligning our assets to the trade patterns that they are best suited for, in order to gain greater flexibility in the scheduling of our expanded fleet. Continued improvement in vessel utilization, combined with increased customer demand reinforces our confidence in the positive future for Rand, our customers, employees and shareholders.”
- Laurence Levy, Executive Chairman, 8-15-11 (Q1 2012 Earnings Call)
JWEST,LLC

Sounds promising…
Tell me more
JWEST,LLC
Sounds promising, but words are just that.... Words.
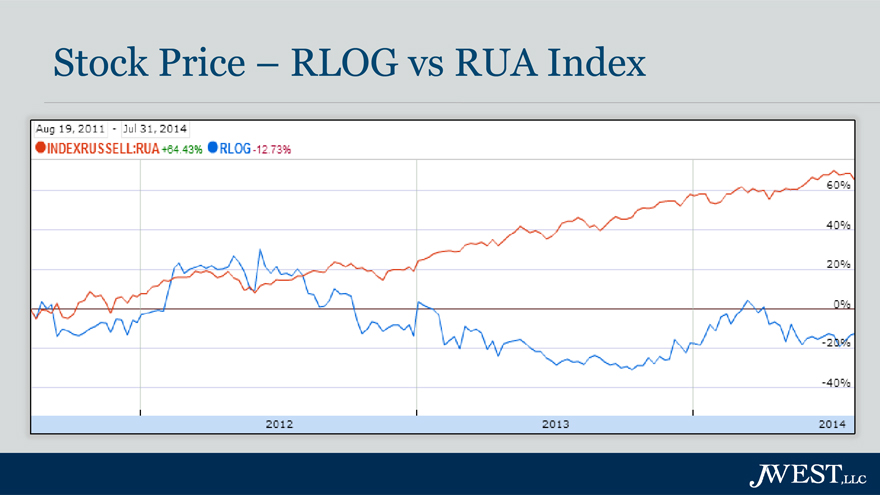
Stock Price – RLOG vs RUA Index
Aug 19, 2011 – Jul 31, 2014
INDEXRUS SELL:RUA +64.43%
RLOG-12.73%
60% 40% 20% 0% -20% -40%
2012 2013 2014
JWEST,LLC
How did the stock perform subsequent to Laurence’s quote?
As you can see from the graph (RLOG in blue and the Russell 3000 Index in orange), RLOG was not even close to living up to our expectations.
Let’s take a look at some of management’s forecasts, and compare them to what actually happened to dig deeper into RLOG’s underperformance.
Sources:
-Screen grab obtained from Google Finance
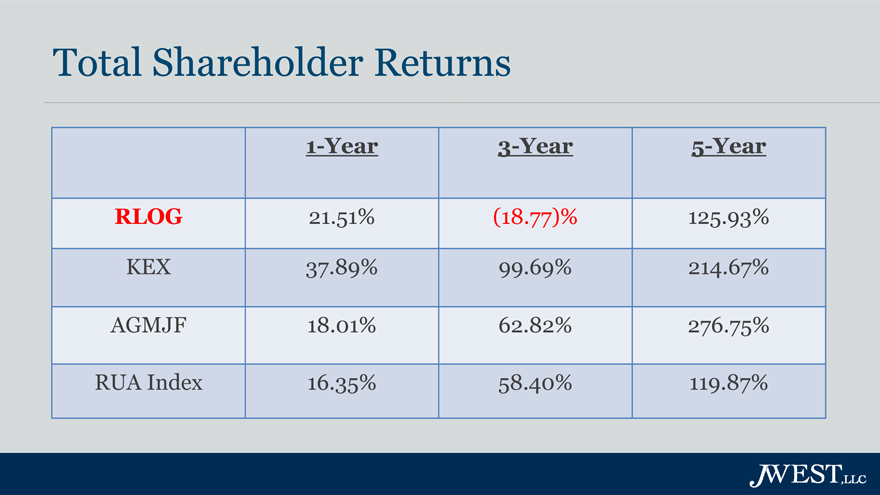
Total Shareholder Returns
1-Year 3-Year 5-Year
RLOG 21.51% (18.77)% 125.93%
KEX 37.89% 99.69% 214.67%
AGMJF 18.01% 62.82% 276.75%
RUA Index 16.35% 58.40% 119.87%
JWEST,LLC
RLOG has under-performed for shareholders compared to relevant peers and indices.
Note that the 5 year returns include a substantial recovery of losses sustained during the financial crisis, resulting in an overstatement for all companies/indices.
Sources:
-Total Shareholder Return numbers obtained from Bloomberg
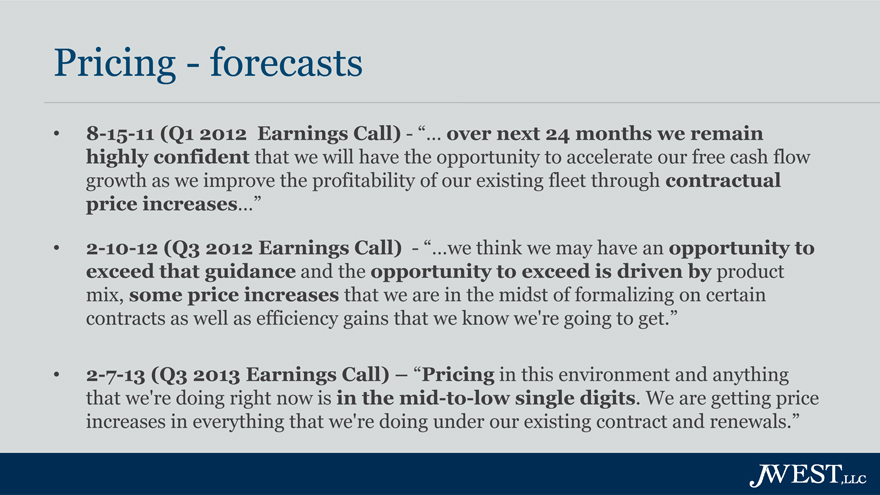
Pricing—forecasts
• |
| 8-15-11 (Q1 2012 Earnings Call) – “… over next 24 months we remain highly confident that we will have the opportunity to accelerate our free cash flow growth as we improve the profitability of our existing fleet through contractual price increases…” |
• |
| 2-10-12 (Q3 2012 Earnings Call)– “…we think we may have an opportunity to exceed that guidance and the opportunity to exceed is driven by product mix, some price increases that we are in the midst of formalizing on certain contracts as well as efficiency gains that we know we’re going to get.” |
• |
| 2-7-13 (Q3 2013 Earnings Call) – “Pricing in this environment and anything that we’re doing right now is in the mid-to-low single digits. We are getting price increases in everything that we’re doing under our existing contract and renewals.” |
JWEST, LLC
As you can see, management has been confident that they would be able to generate growth through contractual price increases starting in 2011.
RLOG’s Actual Results:
Where is the pricing leverage?
• |
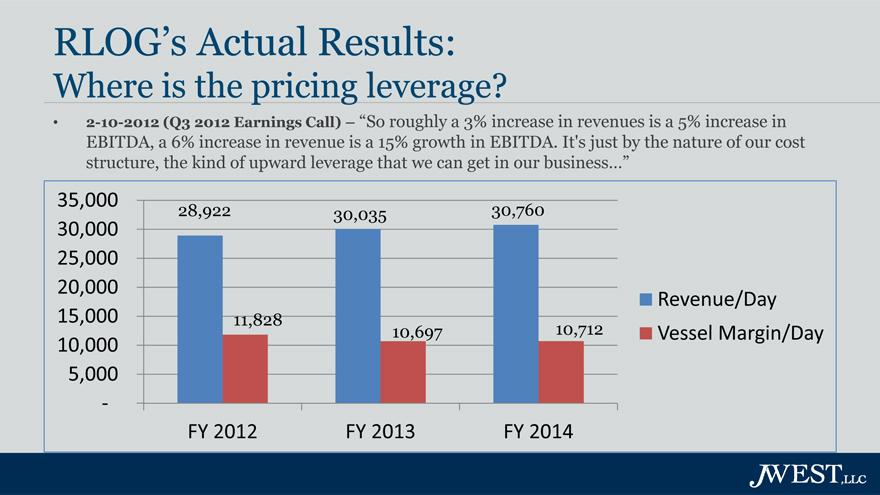
| 2-10-2012 (Q3 2012 Earnings Call) – “So roughly a 3% increase in revenues is a 5% increase in EBITDA, a 6% increase in revenue is a 15% growth in EBITDA. It’s just by the nature of our cost structure, the kind of upward leverage that we can get in our business…” |
35,000 28,922 30,035 30,760
30,000
25,000
20,000 Revenue/Day
15,000 11,828 10,697 10,712 Vessel Margin/Day
10,000
5,000
-
FY 2012 FY 2013 FY 2014
JWEST, LLC
Sources:
-Data obtained from RLOG presentation materials from Q4 Earnings Calls
Pricing – actual
6-12-14 (Q4 2014 Earnings Call) –
Ed Levy - “We haven’t seen price increases yet”
JWEST, LLC
Management over-promised and under-delivered on pricing.
Mechanical Incidents
• |
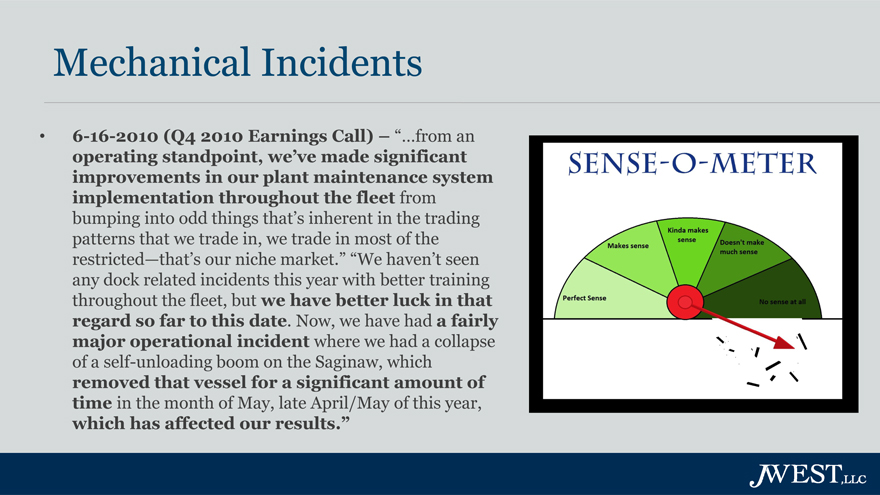
| 6-16-2010 (Q4 2010 Earnings Call) – “…from an operating standpoint, we’ve made significant improvements in our plant maintenance system implementation throughout the fleet from bumping into odd things that’s inherent in the trading patterns that we trade in, we trade in most of the restricted—that’s our niche market.” “We haven’t seen any dock related incidents this year with better training throughout the fleet, but we have better luck in that regard so far to this date. Now, we have had a fairly major operational incident where we had a collapse of a self-unloading boom on the Saginaw, which removed that vessel for a significant amount of time in the month of May, late April/May of this year, which has affected our results.” |
SENSE-O-METER
JWEST, LLC
While stating significant improvements have been made to the maintenance system, management informs investors that they have had yet another maintenance issue causing the loss of a vessel for significant time. Not exactly the improvement investors were hoping for.
Sources:
-Image obtained from
http://www.comicbookmovie.com/fansites/joshw24/news/?a=44976
Mechanical Incidents
• |
| 11-10-2010 (Q2 2011 Earnings Call) – “While we cannot eliminate all incidents, we believe that we have the processes in place to reduce future occurrences of such mechanical incidents to a level, more consistent with our historic experiences.” |
• |
| 2-14-2011 (Q3 2011 Earnings Call)—“During the first six months of fiscal year 2011, we experienced a series of mechanical incidents on our vessels, which collectively resulted in a cumulative financial expense that, as previously stated, management regards as non-recurring. While we normally experience and plan for ordinary course mechanical incidents on our vessels, the financial impact of these incidents far exceeded our historic experience and can be grouped into three distinct categories totaling approximately $4.9 million.” |
JWEST, LLC

Don’t worry, management says it’s under control
PROBLEM SOLVED
JWEST, LLC
Great, sounds like management has these past mechanical incidents under control.
Sources:
-Image obtained from http://m.crazyhyena.com
Lost Sailing Days
140
123
120
100
77 |
|
83 |
|
80 |
|
61 |
|
60 |
|
40 |
|
20 |
|
0
FY 2011 FY 2012 FY 2013 FY 2014
JWEST, LLC
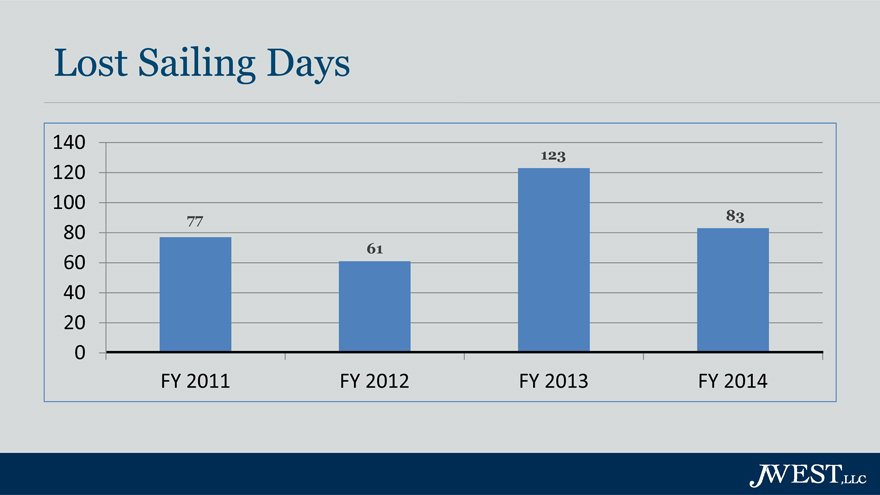
If you recall, the quotes from management on having addressed the problem of mechanical incidents came from FYE 2010 and 2011. So let’s look at what happened in the years following those quotes....
The graph above depicts lost sailing days attributable to mechanical incidents did not improve. In fact, the opposite occurred. In 2013, lost sailing days were nearly double what they were in 2011!
Sources:
- Figures obtained from Earnings Calls
Mechanical Incidents
• |
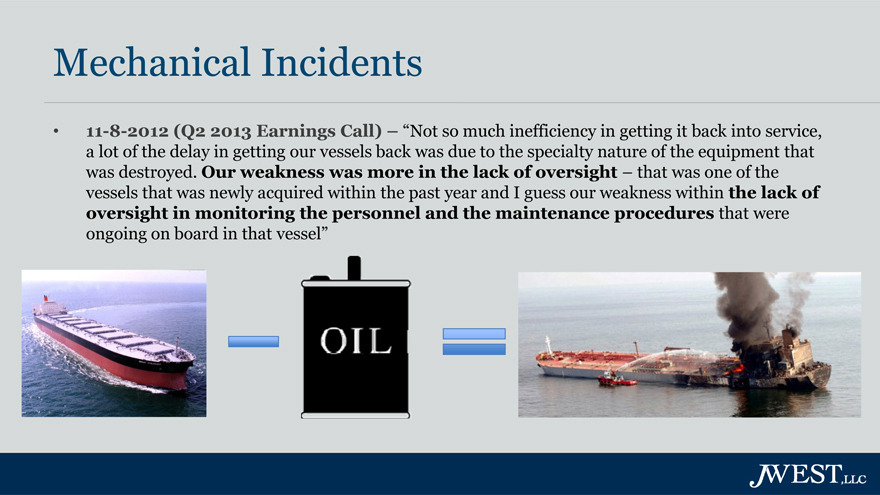
| 11-8-2012 (Q2 2013 Earnings Call) – “Not so much inefficiency in getting it back into service, a lot of the delay in getting our vessels back was due to the specialty nature of the equipment that was destroyed. Our weakness was more in the lack of oversight – that was one of the vessels that was newly acquired within the past year and I guess our weakness within the lack of oversight in monitoring the personnel and the maintenance procedures that were ongoing on board in that vessel” |
JWEST, LLC
Subsequent to this lack of oversight, the Board vacated the CEO position (still currently vacant) and Laurence Levy continued as the Chairman of the Board with no salary reduction.
Where is the oversight?
Confused? Us too.
We believe that a Chief Operating Officer should be appointed to provide the necessary oversight.
Sources:
-Images obtained from:
-http://www.nauticexpo.com/cat/ships/cargo-ships-bulk-carriers-AG-1451.html
-http://www.vectorart.com/store/index.cfm?q=oil%20can
-http://officerofthewatch.com/2013/03/11/bulk-carrier-and-tanker-fatal-collision/
Free Cash Flow - forecasts
• |
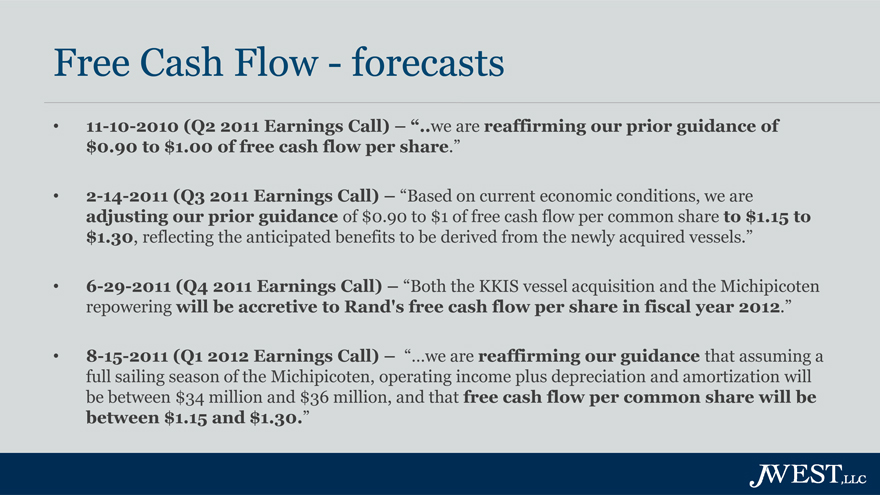
| 11-10-2010 (Q2 2011 Earnings Call) – “..we are reaffirming our prior guidance of $0.90 to $1.00 of free cash flow per share.” |
• |
| 2-14-2011 (Q3 2011 Earnings Call) – “Based on current economic conditions, we are adjusting our prior guidance of $0.90 to $1 of free cash flow per common share to $1.15 to $1.30, reflecting the anticipated benefits to be derived from the newly acquired vessels.” |
• |
| 6-29-2011 (Q4 2011 Earnings Call) – “Both the KKIS vessel acquisition and the Michipicoten repowering will be accretive to Rand’s free cash flow per share in fiscal year 2012.” |
• |
| 8-15-2011 (Q1 2012 Earnings Call) – “…we are reaffirming our guidance that assuming a full sailing season of the Michipicoten, operating income plus depreciation and amortization will be between $34 million and $36 million, and that free cash flow per common share will be between $1.15 and $1.30.” |
JWEST, LLC
Correspondingly, management’s forecasts of free cash flow never materialized.
Actual Free Cash Flow per share –Show me the money!
$1.20
$0.80
$0.40
$ 0.09
$0.00
($0.40)
($ 0.23)
($ 0.53)
($0.80)
($1.20) |
|
($ |
| 1.04) |
FY 2011 FY 2012 FY 2013 FY 2014
JWEST, LLC
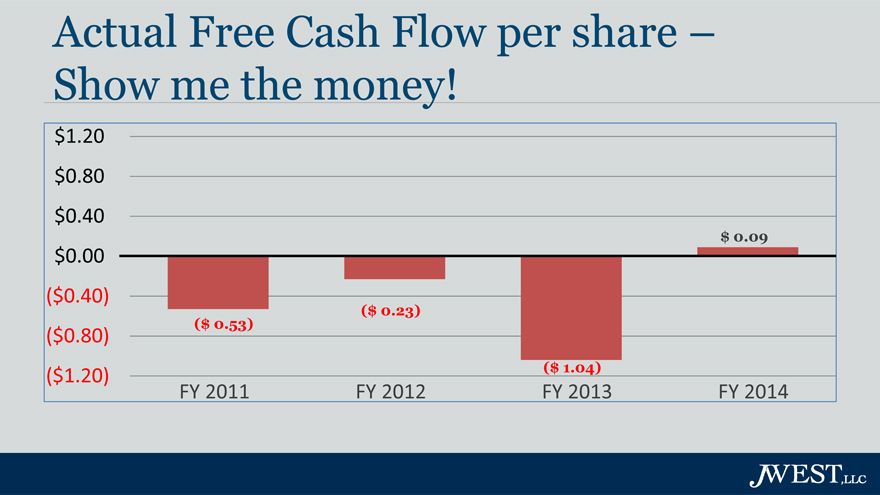
Management over-promised and under-delivered on free cash flow per share.
Sources:
-Actual free cash flow obtained from Bloomberg Financial Statement Analysis
-Free Cash Flow per share is calculated as Free Cash Flow divided by the Average Basic # of shares for the period
Management’s Preferred Dividends forecasts
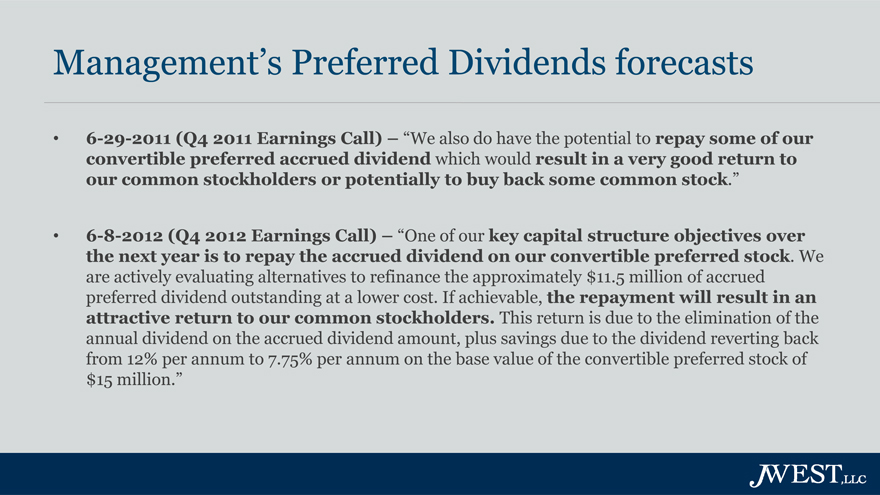
• |
| 6-29-2011 (Q4 2011 Earnings Call) – “We also do have the potential to repay some of our convertible preferred accrued dividend which would result in a very good return to our common stockholders or potentially to buy back some common stock.” |
• |
| 6-8-2012 (Q4 2012 Earnings Call) – “One of our key capital structure objectives over the next year is to repay the accrued dividend on our convertible preferred stock. We are actively evaluating alternatives to refinance the approximately $11.5 million of accrued preferred dividend outstanding at a lower cost. If achievable, the repayment will result in an attractive return to our common stockholders. This return is due to the elimination of the annual dividend on the accrued dividend amount, plus savings due to the dividend reverting back from 12% per annum to 7.75% per annum on the base value of the convertible preferred stock of $15 million.” |
JWEST, LLC

Preferred Dividends — on hold
JWEST,LLC
Instead, management opted to defer paying down a portion of the accrued preferred dividends for several years.
Sources:
-Image obtained from http://dobrador.com/procrastination-workshop/
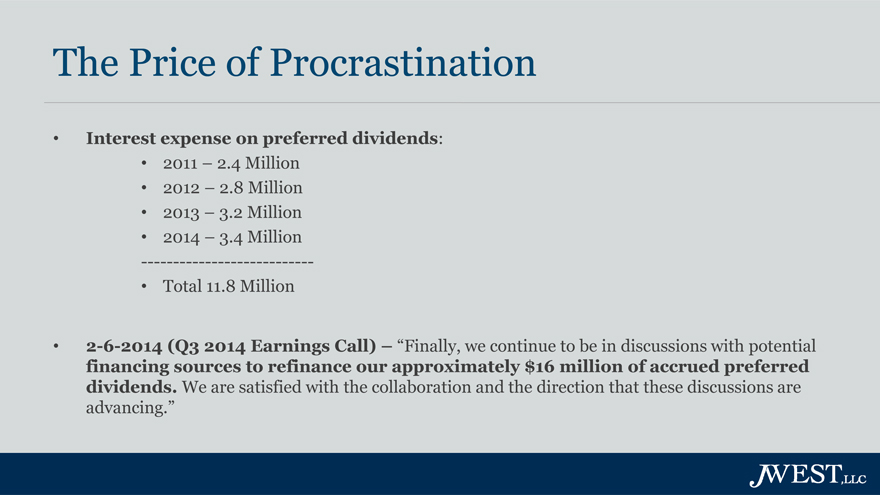
The Price of Procrastination
• |
| Interest expense on preferred dividends: |
• |
| 2011 – 2.4 Million |
• |
| 2012 – 2.8 Million |
• |
| 2013 – 3.2 Million |
• |
| 2014 – 3.4 Million |
—————————————-
• |
| Total 11.8 Million |
• |
| 2-6-2014 (Q3 2014 Earnings Call) – “Finally, we continue to be in discussions with potential financing sources to refinance our approximately $16 million of accrued preferred dividends. We are satisfied with the collaboration and the direction that these discussions are advancing.” |
JWEST, LLC
Sources:
-Interest expense figures obtained from annual 10-K reports

EXTRA EXTRA! READ ALL ABOUT IT!
“As of March 31, 2014, the Company has fully paid all accrued dividends on its preferred stock.”
JWEST, LLC
Finally! Looks like this is a step in the right direction..... Where did RLOG get the money?
Sources:
-Quote was taken from the 2014 10-K filed June 12, 2014
-Image obtained from http://rayedwards.com/advice-or-news/
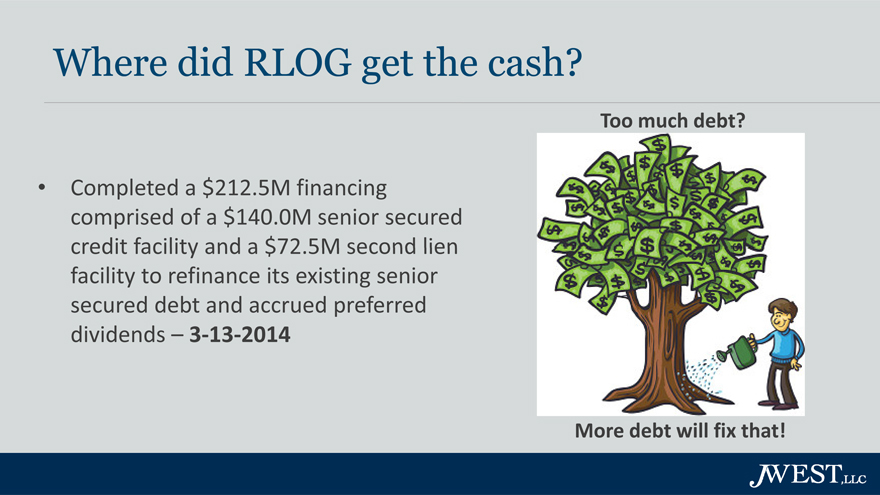
Where did RLOG get the cash?
• |
| Completed a $212.5M financing comprised of a $140.0M senior secured credit facility and a $72.5M second lien facility to refinance its existing senior secured debt and accrued preferred dividends – 3-13-2014 |
More debt will fix that!
Too much debt?
JWEST, LLC
Management took on more debt in order to pay off the accrued preferred dividends.
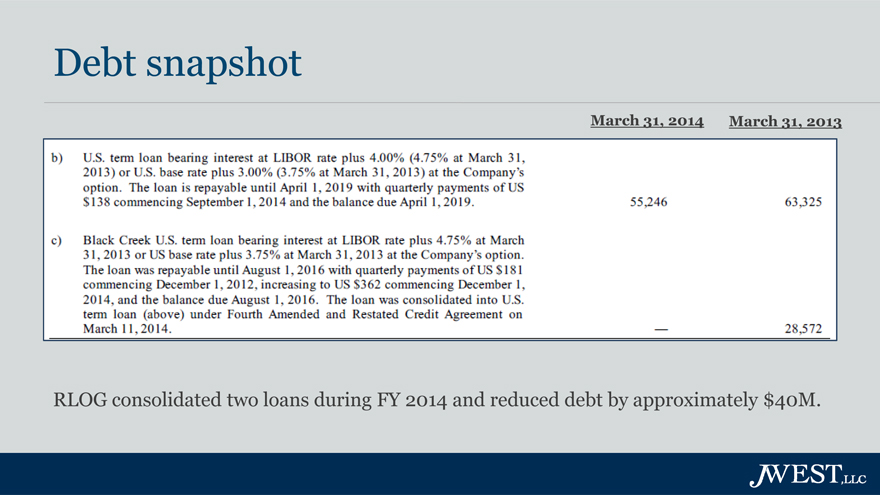
Debt snapshot
March 31, 2014 March 31, 2013
b) U.S. term loan bearing interest at LIBOR rate plus 4.00% (4.75% at March 31, 2013) or U.S. base rate plus 3.00% (3.75% at March 31, 2013) at the Company’s option. The loan is repayable until April 1, 2019 with quarterly payments of US $138 commencing September 1, 2014 and the balance due April 1, 2019.
55,246
63,325
c) Black Creek U.S. term loan bearing interest at LIBOR rate plus 4.75% at March 31, 2013 or US base rate plus 3.75% at March 31, 2013 at the Company’s option. The loan was repayable until August 1, 2016 with quarterly payments of US $181 commencing December 1, 2012, increasing to US $362 commencing December 1, 2014, and the balance due August 1, 2016. The loan was consolidated into U.S. term loan (above) under Fourth Amended and Restated Credit Agreement on March 11, 2014.
—
28,572
RLOG consolidated two loans during FY 2014 and reduced debt by approximately $40M.
JWEST, LLC
Sources:
-Excerpt above taken from the 2014 10-K

Sounds great, but let’s take a closer look
JWEST, LLC
Sources:
-Image obtained from http://slaan.ru/index.php?option=com_content&view=article&id=130&Itemid=267
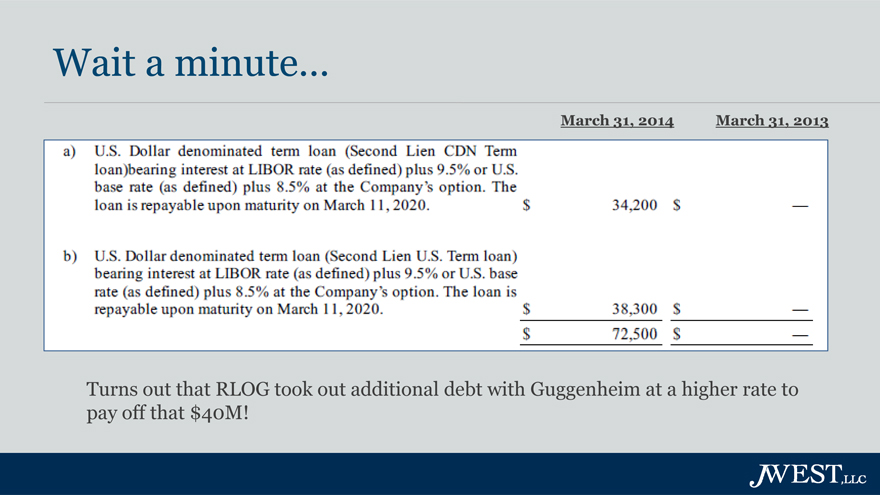
Wait a minute…
March 31, 2014 March 31, 2013
a) U.S. Dollar denominated term Loan (Second Lien CDN Term Loan) bearing interest at LIBOR rate (as defined) plus 9.5% or U.S. base rate (as defined) plus 8.5% at the Company’s option. The loan is repayable upon maturity on March 11, 2020.
$ 34,200
$—
b) U.S. Dollar denominated term loan (Second Lien U.S. term Loan) bearing interest at LIBOR rate (as defined) plus 9.5% or U.S. base rate (as defined) plus 8.5% at the Company’s option. The loan is repayable upon March 11, 2020.
$38,300 $—
$72,500 $—
Turns out that RLOG took out additional debt with Guggenheim at a higher rate to pay off that $40M!
JWEST, LLC
Sources:
-Excerpt above taken from the 2014 10-K
-Note: Guggenheim referenced above is Guggenheim Corporate Funding, LLC
So RLOG used 10% debt to pay down 5% debt?
I’m confused here…
JWEST,LLC
Doesn’t make much sense, does it?
Sources:
-Note: Interest rate percentages are rounded percentages. Actual percentages obtained from the 2014 10-K were within 100 basis points.

More debt?
“We are comfortable with our debt levels, and you know, so are our lenders.” - Laurence Levy
LAND OF MAKE BELIEVE NEXT RIGHT
JWEST,LLC
Sources:
-Quote was taken from the Q4 2011 Earnings Call on 6-29-2011
-Image obtained from http://blog.konstantinos.dk/wp/2014/03/20/markets-of-make-believe/

Pure Retained Earnings
$0
($1,000,000)
($2,000,000)
($3,000,000)
($2,535,000)
($3,067,000)
($3,234,000)
($4,000,000)
($4,028,000)
($5,000,000)
FY 2011 FY 2012 FY 2013 FY 2014
JWEST,LLC
Sources:
- Data obtained from Bloomberg Financial Statement Analysis
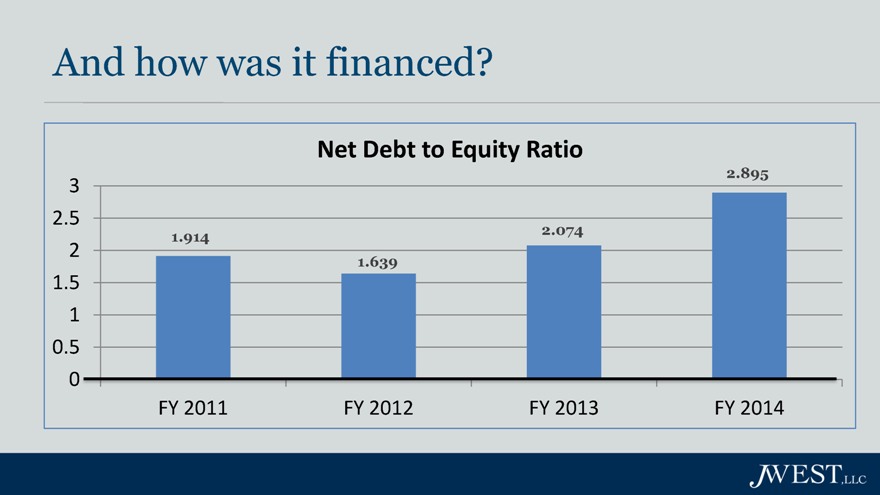
And how was it financed?
Net Debt to Equity Ratio
3
2.5
2
1.5
1
0.5
0
1.914
1.639
2.074
2.895
FY 2011
FY 2012
FY 2013
FY 2014
JWEST,LLC
How were the accrued dividends on the preferred stock financed? Not with Free Cash Flow... with debt of course!!
As a result, our shareholder value is getting destroyed!
Sources:
-Net Debt to Equity Ratios obtained from Bloomberg’s Financial Statement Analysis
Management has reduced shareholder value to…
JWEST,LLC
Management has effectively transferred wealth from shareholders to debtholders.
Sources:
-Image obtained from http://www.bitcoinlab.appspot.com/page/13
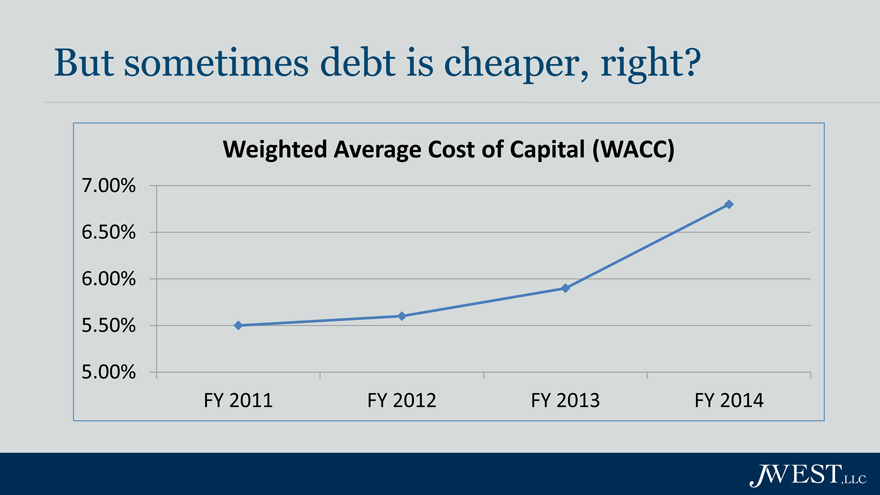
But sometimes debt is cheaper, right?
Weighted Average Cost of Capital (WACC)
7.00%
6.50%
6.00%
5.50%
5.00%
FY 2011 FY 2012 FY 2013 FY 2014
Nice try, guess again!
Sources:
-WACC data obtained from Bloomberg terminal Excel Add-In on 7-23-2014
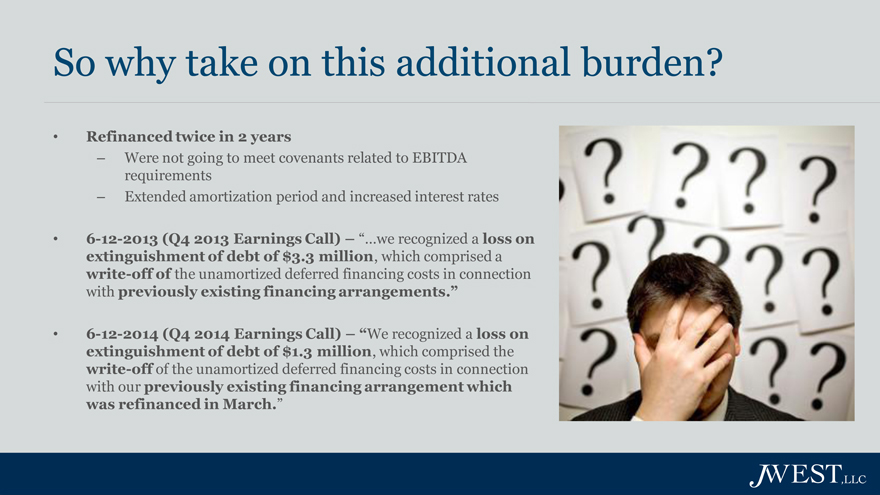
So why take on this additional burden?
• |
| Refinanced twice in 2 years |
– Were not going to meet covenants related to EBITDA requirements
– Extended amortization period and increased interest rates
• |
| 6-12-2013 (Q4 2013 Earnings Call) – “…we recognized a loss on extinguishment of debt of $3.3 million, which comprised a write-off of the unamortized deferred financing costs in connection with previously existing financing arrangements.” |
• |
| 6-12-2014 (Q4 2014 Earnings Call) – “We recognized a loss on extinguishment of debt of $1.3 million, which comprised the write-off of the unamortized deferred financing costs in connection with our previously existing financing arrangement which was refinanced in March.” |
Why would management burden itself with this additional debt? We believe, they lacked the free cash flow and weren’t going to meet EBITDA requirements in the debt covenants. We believe this lack of oversight resulted in a negative impact on the company’s bottom line.
Sources:
-Information obtained from the Third Amended and Restated Credit Agreement, First Amendment to the Third Amended and Restated Credit Agreement, and Fourth Amended and Restated Credit Agreement
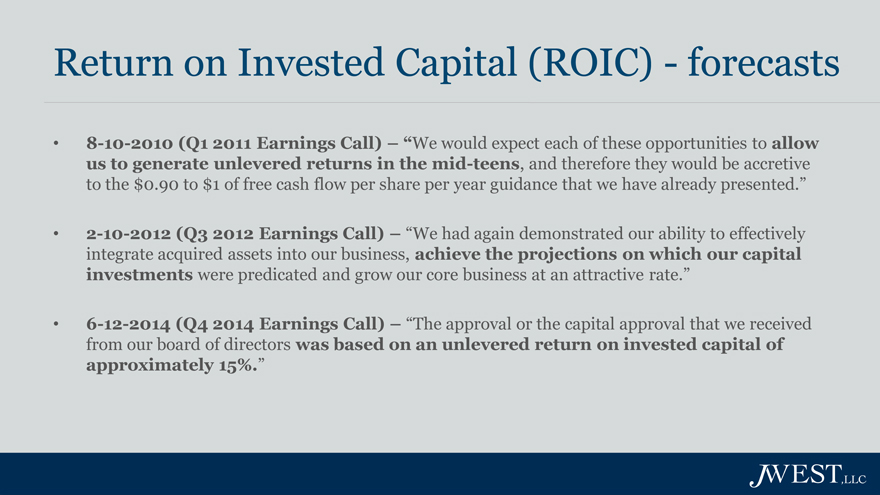
Return on Invested Capital (ROIC)—forecasts
• |
| 8-10-2010 (Q1 2011 Earnings Call) – “We would expect each of these opportunities to allow us to generate unlevered returns in the mid-teens, and therefore they would be accretive to the $0.90 to $1 of free cash flow per share per year guidance that we have already presented.” |
• |
| 2-10-2012 (Q3 2012 Earnings Call) – “We had again demonstrated our ability to effectively integrate acquired assets into our business, achieve the projections on which our capital investments were predicated and grow our core business at an attractive rate.” |
• |
| 6-12-2014 (Q4 2014 Earnings Call) – “The approval or the capital approval that we received from our board of directors was based on an unlevered return on invested capital of approximately 15%.” |
So what is the effect of all this mis-management on the return? Let’s take a look at management’s thoughts.....
Again, sounds promising.... So what actually happened?
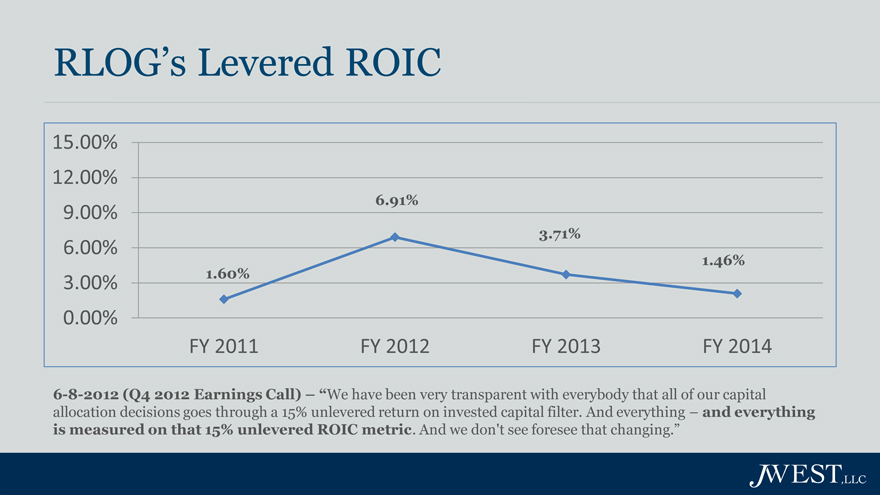
RLOG’s Levered ROIC
15.00%
12.00%
6.91%
9.00%
3.71%
6.00%
1.60% 1.46%
3.00%
0.00%
FY 2011 FY 2012 FY 2013 FY 2014
6-8-2012 (Q4 2012 Earnings Call) – “We have been very transparent with everybody that all of our capital allocation decisions goes through a 15% unlevered return on invested capital filter. And everything – and everything is measured on that 15% unlevered ROIC metric. And we don’t see foresee that changing.”
Where’s the 15% unlevered return?
Management over-promised and under-delivered on ROIC.
Sources:
-ROIC figures were obtained from Bloomberg terminal Excel Add-In on 7-29-2014
-Note: Bloomberg uses Net Operating Profit After Tax (NOPAT) instead of Net Income in its calculation of ROIC
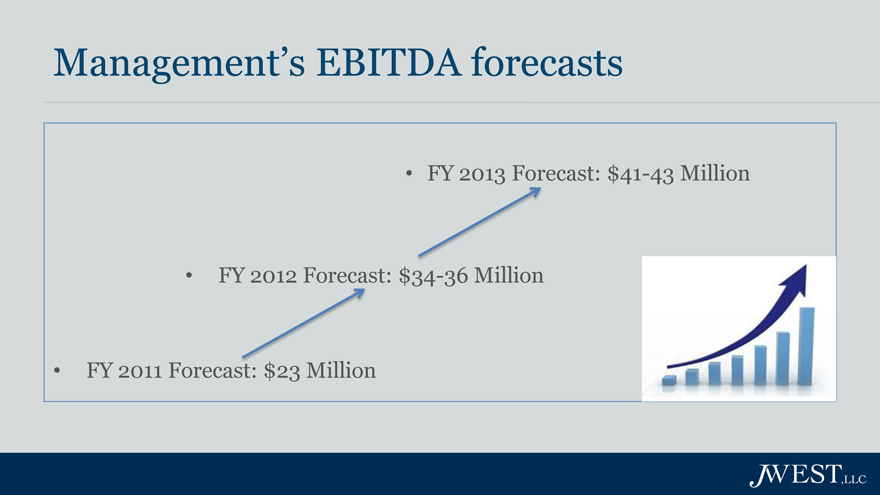
Management’s EBITDA forecasts
• |
| FY 2013 Forecast: $41-43 Million |
• |
| FY 2012 Forecast: $34-36 Million |
• |
| FY 2011 Forecast: $23 Million |
Wow that looks great! How are you going to get there?
<A - Joseph W. McHugh>: “Yes. I think – I guess that’s the way to put it David, I think the three buckets that you ought to be thinking about are – if you take our $19.6, you add back in the one-time incidents – which hopefully don’t recur – and then last year our salt tonnage was down pretty meaningfully, which had a significant impact on our profitability. So if you take the mechanical incidents plus our salt tonnage being down, add those two back and then add the benefit of the KKIS acquisition, those are the three buckets to build up to the $34 to $36.” –Q4 2011 Earnings Call – 6-29-2011
Sources:
-Projected data from Q4 Earnings calls and related supplemental presentations
What really happened…
Only missed it by THIS much
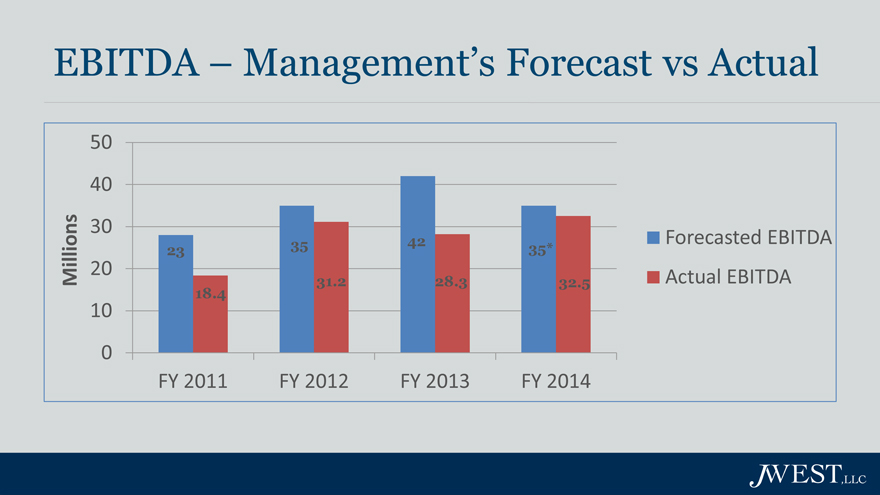
EBITDA – Management’s Forecast vs Actual
50
40
30
35 42 Forecasted EBITDA
23 35*
20
Millions 31.2 28.3 32.5 Actual EBITDA
18.4
10
0
FY 2011 FY 2012 FY 2013 FY 2014
Management over-promised and under-delivered on EBITDA.
Sources:
-Forecasted data from Q4 Earnings Calls and related supplemental presentations
* Calculated by JWest from data obtained from Q4 2013 Earnings Call (12k per day x 3986 days - 12.5G&A)
-Actual EBITDA obtained from Q4 Earnings Calls

There seems to be a theme…
Management has habitually over-promised and under-delivered.
Sources:
-Image obtained from http://www.memecenter.com

Why does RLOG consistently disappoint?
Sources:
-Image obtained from http://david-e-owen.blogspot.com/2013/03/disappointment.html
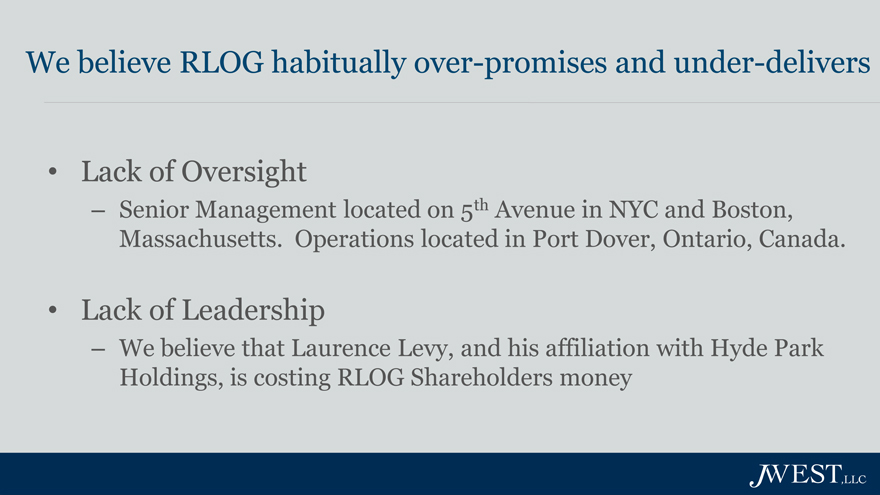
We believe RLOG habitually over-promises and under-delivers
• |
| Lack of Oversight |
– Senior Management located on 5th Avenue in NYC and Boston, Massachusetts. Operations located in Port Dover, Ontario, Canada.
• |
| Lack of Leadership |
– We believe that Laurence Levy, and his affiliation with Hyde Park Holdings, is costing RLOG Shareholders money
RLOG is in dire need of someone to fulfill the role of CEO who can dedicate their time and efforts solely to the company.
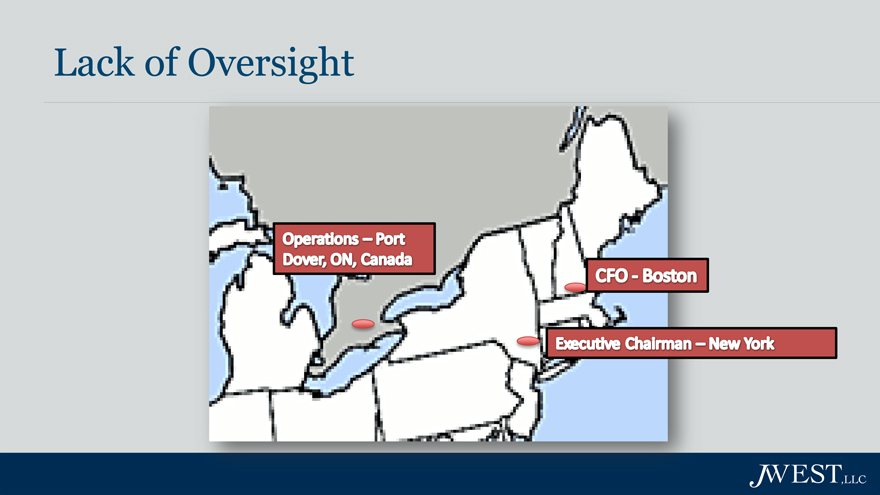
Lack of Oversight
How can management possibly oversee the company from over 450 miles away?
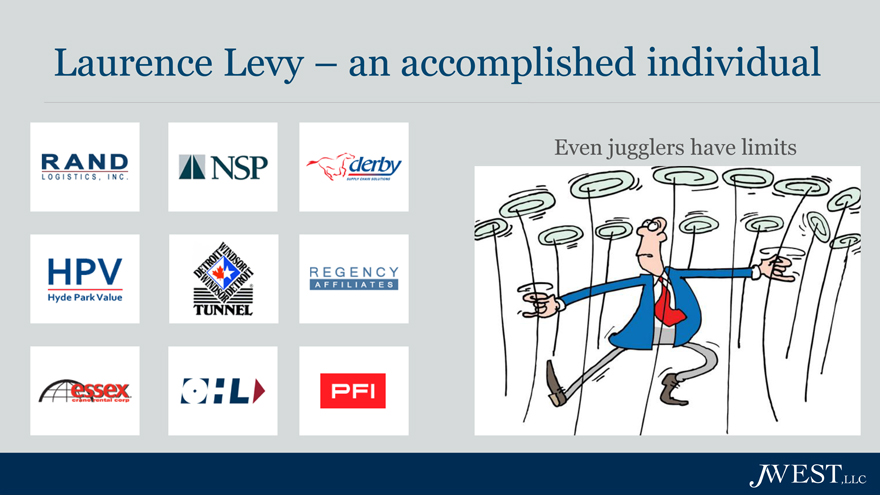
Laurence Levy – an accomplished individual
Even jugglers have limits
Laurence is an accomplished individual with an impressive list of companies he has created. We believe his ability to focus on Rand Logistics Inc. is limited by his involvement in his other ventures. Laurence has been instrumental in accumulating the ships and infrastructure necessary to create the only carrier able to offer significant domestic port-to-port services in both Canada and the U.S. on the Great Lakes. It is now time to turn the company leadership over to a person who can assure maximum operating efficiency and leverage is achieved from these accumulated assets. We believe Rand Logistics, Inc, with $260M in assets and 500+ employees, must have an extremely capable leader who will devote his/her undivided attention to turning the company around.
Sources:
-Logo images obtained from the Hyde Park Holdings website (http://www.hphllc.com/portfolio/html)
-Juggler image obtained from http://ocambonconsulting.blogspot.com/
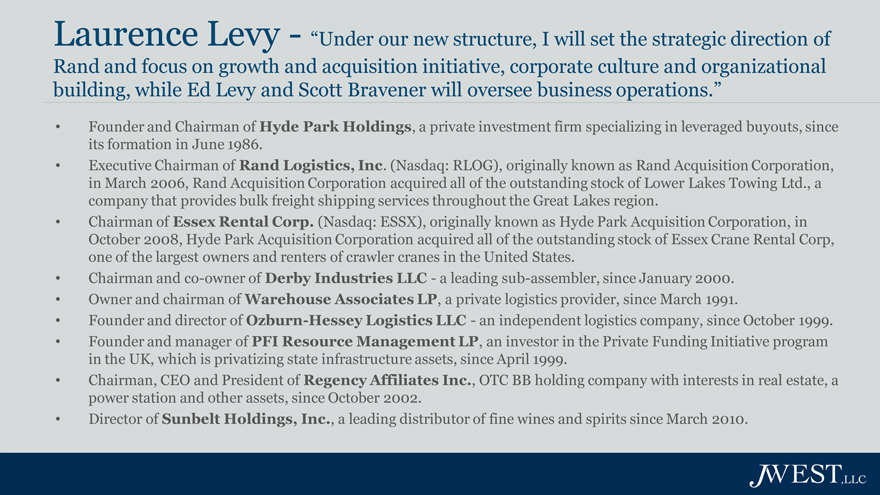
Laurence Levy—“Under our new structure, I will set the strategic direction of
Rand and focus on growth and acquisition initiative, corporate culture and organizational building, while Ed Levy and Scott Bravener will oversee business operations.”
• |
| Founder and Chairman of Hyde Park Holdings, a private investment firm specializing in leveraged buyouts, since its formation in June 1986. |
• |
| Executive Chairman of Rand Logistics, Inc. (Nasdaq: RLOG), originally known as Rand Acquisition Corporation, in March 2006, Rand Acquisition Corporation acquired all of the outstanding stock of Lower Lakes Towing Ltd., a company that provides bulk freight shipping services throughout the Great Lakes region. |
• |
| Chairman of Essex Rental Corp. (Nasdaq: ESSX), originally known as Hyde Park Acquisition Corporation, in October 2008, Hyde Park Acquisition Corporation acquired all of the outstanding stock of Essex Crane Rental Corp, one of the largest owners and renters of crawler cranes in the United States. |
• |
| Chairman and co-owner of Derby Industries LLC—a leading sub-assembler, since January 2000. |
• |
| Owner and chairman of Warehouse Associates LP, a private logistics provider, since March 1991. |
• |
| Founder and director of Ozburn-Hessey Logistics LLC—an independent logistics company, since October 1999. |
• |
| Founder and manager of PFI Resource Management LP, an investor in the Private Funding Initiative program in the UK, which is privatizing state infrastructure assets, since April 1999. |
• |
| Chairman, CEO and President of Regency Affiliates Inc., OTC BB holding company with interests in real estate, a power station and other assets, since October 2002. |
• |
| Director of Sunbelt Holdings, Inc., a leading distributor of fine wines and spirits since March 2010. |
The quote above is a direct quote from Laurence stating his role as the Executive Chairman. As indicated in his biography, we don’t believe Laurence has the time to dedicate to RLOG in order to effectively serve the company in that capacity.
Sources:
-Quote from Laurence Levy obtained from Q4 2013 Earnings Call – 6-12-2013
-Bio obtained from the Hyde Park Holdings website (http://www.hphllc.com/laurence-levy.html)

Self dealings
What’s the impact of all of Laurence’s affiliations on RLOG?
Sources:
-Image obtained from http://vipdictionary.com/collusion
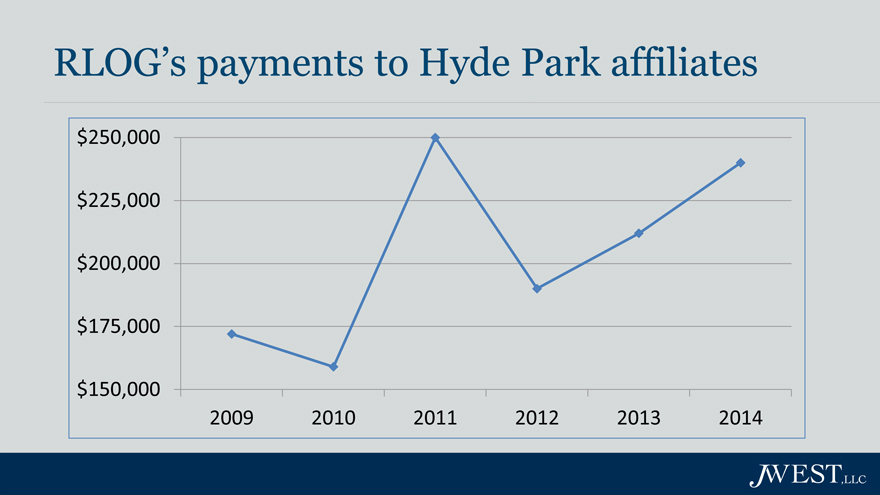
RLOG’s payments to Hyde Park affiliates
$250,000 $225,000 $200,000 $175,000
$150,000
2009 2010 2011 2012 2013 2014
We believe RLOG’s arrangement with Hyde Park and its affiliates is an unnecessary sunk cost. We also believe this arrangement diminishes RLOG’s credibility on Wall Street.
Sources:
-Figures from chart were obtained from the Related Party Transactions footnotes of the annual audited financial statements. Includes office space lease, travel and out-of-pocket expenses.
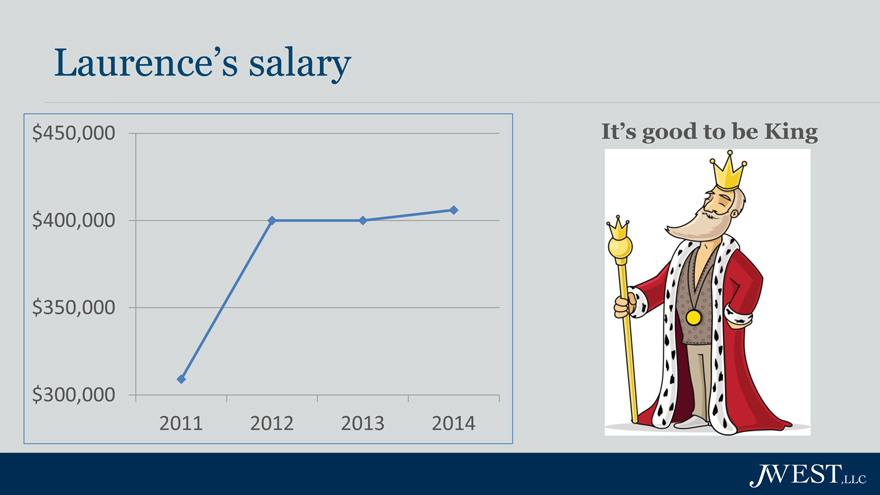
Laurence’s salary
$450,000 It’s good to be King
$400,000
$350,000
$300,000
2011 2012 2013 2014
Laurence’s responsibilities decreased in his move from CEO to the Chairman of the Board. Additionally, company performance didn’t improve. Why is he still making the same amount of money (Base salary)?
“The base salary component of total compensation is relatively stable year over year and generally is adjusted for cost of living adjustments orincreases in responsibility... The Compensation Committee sets the compensation philosophy with respect to base salaries for our executives generally, andreviews the base salary of each executive officer annually in light of our performance, budget and cost containment issues and our overall compensation objectives.”
Sources:
-Data and quotes obtained from the 2013 proxy

How does RLOG get to where it wants to be?
Sources:
-Image obtained from http://s96854.wix.com/feelgreatcoaching
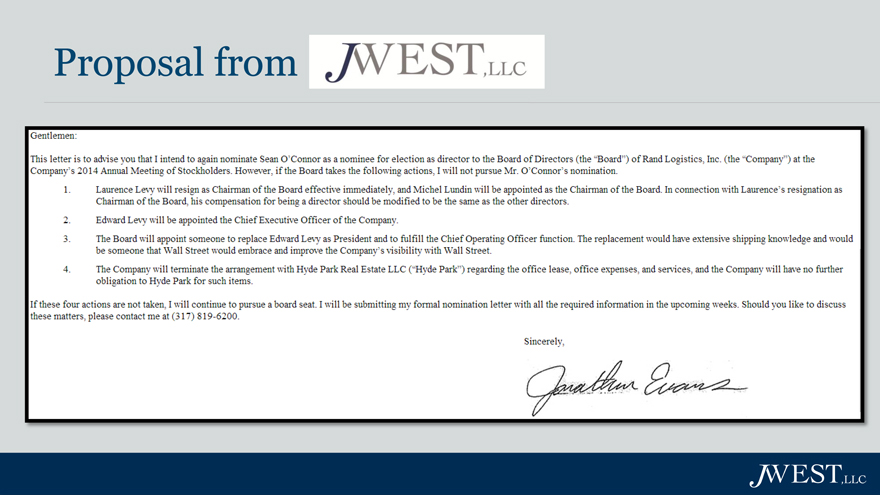
Proposal from
Here is our proposal, as shown in Form SC 13D/A filed 7/1/14.
For more info, please contact us 317-819-6200
Or visit our website at http://jwestllc.net

Sean O’Connor
Sean O’Connor, age 53, is one of the founding members of Dauby O’Connor & Zaleski, LLC, Certified Public Accountants (“DOZ”) and has been in the practice of public accounting for over 30 years. DOZ started as a two man firm in 1987, and has grown to a leader in the real estate arena with clients in over 45 states. DOZ’s revenues have increased each year in the 27 year history of the firm.
Mr. O’Connor is known for his expertise in accounting and tax matters related to the development and management of multifamily housing communities. He has extensive consulting experience in the structuring of private real estate entities formed to develop multifamily housing communities and the management of the same. Mr. O’Connor’s role in the development process includes assistance with financial forecasts and projections, securing construction and permanent financing, and investor capital.
Mr. O’Connor is also the Managing Member of JWEST, a Registered Investment Advisor with approximately $135 million under management, and he holds a 10% interest in JWEST. He has experience as a management consultant and experience in the management/leadership of a substantial private business enterprise, which are two of the criteria that the Corporate Governance/Nominating Committee of the Board seeks in director candidates.
Mr. O’Connor received his Bachelor of Science degree from Indiana University—Bloomington, Indiana. He is a member of the Indiana CPA Society and the American Institute of Certified Public Accountants. He is the Board Chair for Providence Cristo Rey High School in Indianapolis. He is also on the Board of the Indiana Affordable Housing Council.
Mr. O’Connor beneficially owns 26,690 shares of Common Stock of the Company.
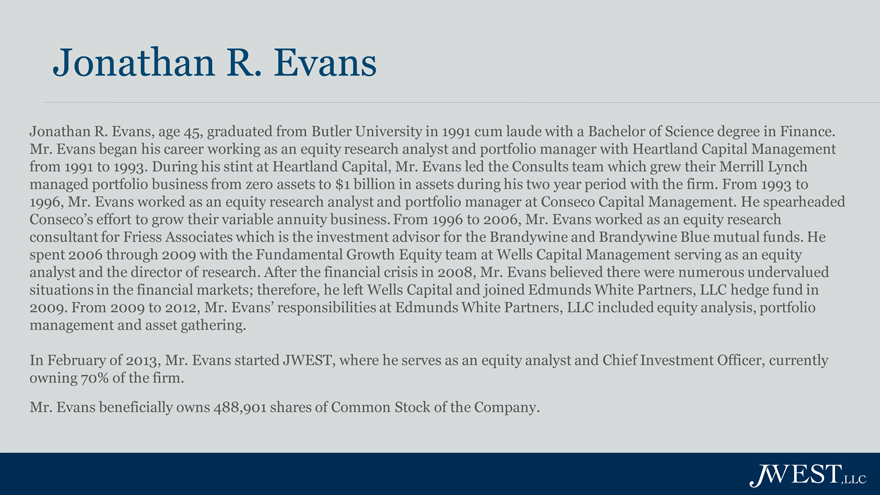
Jonathan R. Evans
Jonathan R. Evans, age 45, graduated from Butler University in 1991 cum laude with a Bachelor of Science degree in Finance. Mr. Evans began his career working as an equity research analyst and portfolio manager with Heartland Capital Management from 1991 to 1993. During his stint at Heartland Capital, Mr. Evans led the Consults team which grew their Merrill Lynch managed portfolio business from zero assets to $1 billion in assets during his two year period with the firm. From 1993 to 1996, Mr. Evans worked as an equity research analyst and portfolio manager at Conseco Capital Management. He spearheaded
Conseco’s effort to grow their variable annuity business. From 1996 to 2006, Mr. Evans worked as an equity research consultant for Friess Associates which is the investment advisor for the Brandywine and Brandywine Blue mutual funds. He spent 2006 through 2009 with the Fundamental Growth Equity team at Wells Capital Management serving as an equity analyst and the director of research. After the financial crisis in 2008, Mr. Evans believed there were numerous undervalued situations in the financial markets; therefore, he left Wells Capital and joined Edmunds White Partners, LLC hedge fund in
2009. From 2009 to 2012, Mr. Evans’ responsibilities at Edmunds White Partners, LLC included equity analysis, portfolio management and asset gathering.
In February of 2013, Mr. Evans started JWEST, where he serves as an equity analyst and Chief Investment Officer, currently owning 70% of the firm.
Mr. Evans beneficially owns 488,901 shares of Common Stock of the Company.
Proxy Disclaimer
JWEST has filed with the Securities and Exchange Commission (“SEC”) a proxy statement and accompanying proxy card to be used to solicit votes for the election of a slate of director nominees at the 2014 annual meeting of stockholders of Rand Logistics, Inc., a Delaware corporation (the “Company,” “RLOG”, “Rand”). JWEST is the beneficial owner of 1,476,127 shares of common stock of the Company.
JWEST STRONGLY ADVISES ALL STOCKHOLDERS IN THE COMPANY TO READ THE PROXY STATEMENT AND OTHER PROXY MATERIALS AS THEY BECOME AVAILABLE, BECAUSE THEY WILL CONTAIN IMPORTANT INFORMATION. SUCH PROXY MATERIALS WILL BE AVAILABLE AT NO CHARGE ON THE SEC’S WEBSITE AT HTTP://WWW.SEC.GOV.
In addition, JWEST will provide copies of the proxy statement without charge upon request.