United States
Securities and Exchange Commission
Washington, DC 20549
Schedule 14A
(Rule 14a-101)
INFORMATION REQUIRED IN PROXY STATEMENT
SCHEDULE 14A INFORMATION
Proxy Statement Pursuant to Section 14(a) of the Securities
Exchange Act of 1934
Filed by the Registrant ¨ Filed by a Party other than the Registrant x
Check the appropriate box:
¨ | Preliminary Proxy Statement | |
| ¨ | Confidential, for Use of the Commission Only (as permitted by Rule 14a-6(e)(2)) | |
¨ | Definitive Proxy Statement | |
| x | Definitive Additional Materials | |
| ¨ | Soliciting Material Pursuant to § 240.14a-12 | |
Rand Logistics, Inc.
(Name of Registrant as Specified in its Charter)
JWEST, LLC
(Name of Person(s) Filing Proxy Statement, if Other Than the Registrant)
Payment of Filing Fee (Check the appropriate box):
| x | No fee required. | |||
| ¨ | Fee computed on table below per Exchange Act Rules 14a-6(i)(1) and 0-11. | |||
| (1) | Title of each class of securities to which transaction applies:
| |||
| (2) | Aggregate number of securities to which transaction applies:
| |||
| (3) | Per unit price or other underlying value of transaction computed pursuant to Exchange Act Rule 0-11 (set forth the amount on which the filing fee is calculated and state how it was determined):
| |||
| (4) | Proposed maximum aggregate value of transaction:
| |||
| (5) | Total fee paid:
| |||
| ¨ | Fee paid previously with preliminary materials. | |||
| ¨ | Check box if any part of the fee is offset as provided by Exchange Act Rule 0-11(a)(2) and identify the filing for which the offsetting fee was paid previously. Identify the previous filing by registration statement number, or the Form or Schedule and the date of its filing. | |||
| (1) | Amount Previously Paid:
| |||
| (2) | Form, Schedule or Registration Statement No.:
| |||
| (3) | Filing Party:
| |||
| (4) | Date Filed:
| |||

September 11, 2014
To the Board of Directors
Rand Logistics, Inc.
Dear Board of Directors:
I understand that the board believes we at JWEST, LLC are just a trading firm trying to make a quick buck through a proxy battle even though we have owned RLOG’s stock unfortunately for over three years. When someone questions your values, thought process, performance and decision making, I am sure that is an uncomfortable position. What I don’t understand is why the board continues to drink the “Kool Aid” from management. I have enclosed two charts which I believe sums up what the board continues to miss with management’s “smoke and mirrors” strategy. Unlevered Free Cash Flow would be a great metric to use if the company was attempting to deleverage the balance sheet. You could show investors how depreciation and amortization is greater than maintenance capex and how the company can produce free cash flow over the cycle to reduce debt. Unfortunately, this is not a strategy which RLOG has employed. This is depicted in Tab #1 as total debt (debt + preferred stock) has gone from $127,071 million in 2011 to $192,290 million in 2014.
In management’s rebuttal slides filed on September 8th, they state that all discretionary growth capital expenditures are based on a return on invested capital threshold. They also proceed to pontificate how disciplined they have been in evaluation of these expenditures. In Tab #2, we show the total dollars RLOG has spent in Discretionary Investments from 2011 thru 2014 which equals $35,542 million. In Tab #3, we show the total dollars RLOG has spent in Upgrades/Conversions from 2011 thru 2014 which equals $38,180 million. Therefore, Tab #4 is the grand total of Discretionary Investments and Upgrades/Conversions which was $73,722 million. Fairly, the board could say that the investments in 2011 of $21,662 million were successful since vessel margin per day increased 34.7% and EBITDA increased 69.4% in 2012 even though the company did miss their EBITDA forecast. What baffles us is how the board can justify the Growth Capex from 2012 thru 2014 of $52,060 million depicted in Tab #5. What benefit did shareholders receive? What ROIC did RLOG achieve? Vessel margin per day decreased from $11,828 per day in 2012 to $10,712 per day in 2014 as shown in Tab #6, and EBITDA only increased a whopping $1.3 million during that time period shown in Tab #7. Therefore, the board authorized the company to spend a total of $52,060 million during those three years to grow EBITDA by $1.3 million. Are we correct that is a 2.5% return on your Growth Capital? It seems to us that the shareholders deserve new board members who would take a more prudent look at Growth Capex.
Best regards,

JWEST, LLC
501 CONGRESSIONAL BLVD., SUITE 300, CARMEL, INDIANA 46032 | JWESTLLC.net | Office 317.819.6200 | Fax 317.819.0056
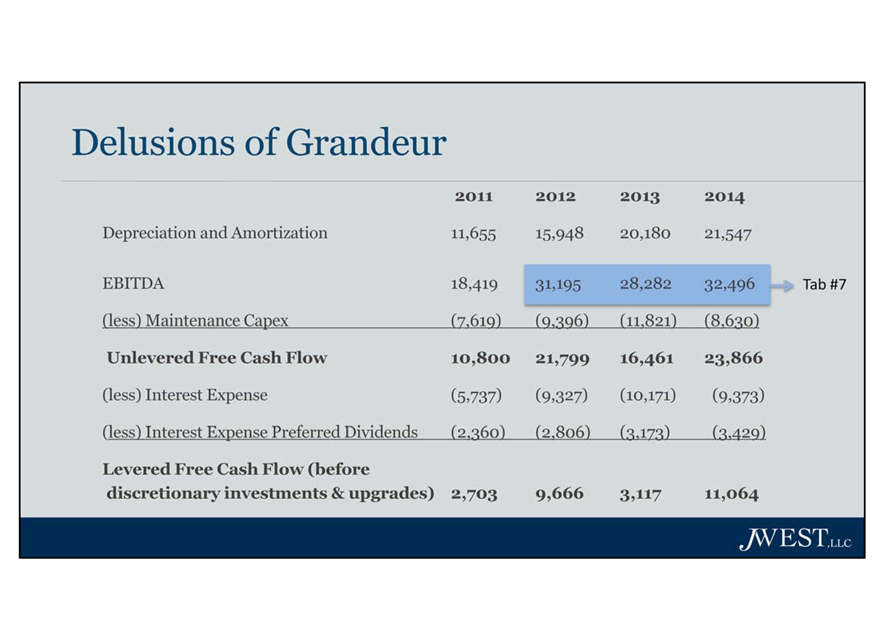 |
Delusions of Grandeur
2011 2012 2013 2014
Depreciation and Amortization 11,655 15,948 20,180 21,547
EBITDA 18,419 31,195 28,282 32,496 Tab #7
(less) Maintenance Capex (7,619) (9,396) (11,821) (8,630)
Unlevered Free Cash Flow 10,800 21,799 16,461 23,866
(less) Interest Expense (5,737) (9,327) (10,171) (9,373)
(less) Interest Expense Preferred Dividends (2,360) (2,806) (3,173) (3,429)
Levered Free Cash Flow (before discretionary investments & upgrades) 2,703 9,666 3,117 11,064
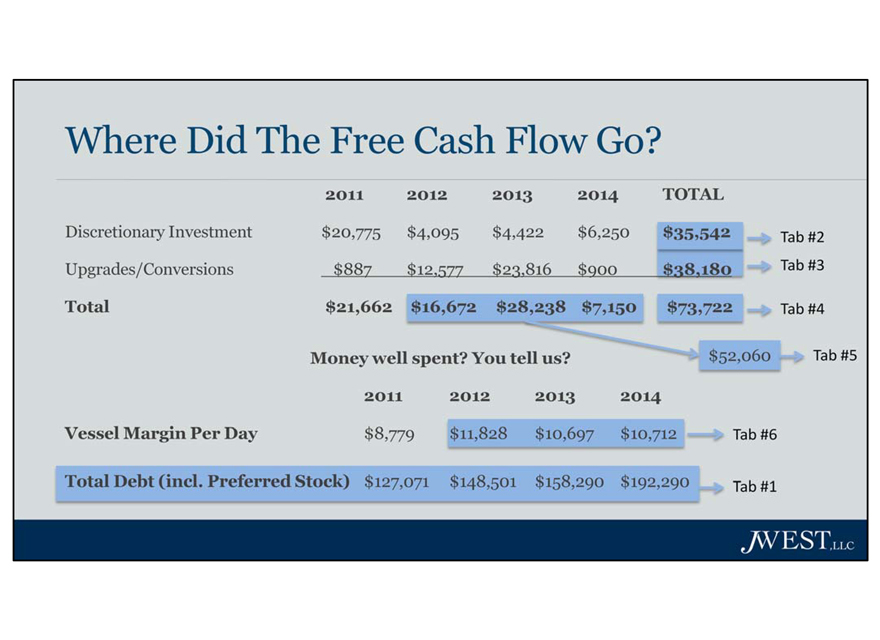 |
Where Did The Free Cash Flow Go?
2011 2012 2013 2014 TOTAL
Discretionary Investment $20,775 $4,095 $4,422 $6,250 $35,542 Tab #2
Upgrades/Conversions $887 $12,577 $23,816 $900 $38,180 Tab #3
Total $21,662 $16,672 $28,238 $7,150 $73,722 Tab #4
Money well spent? You tell us? $52,060 Tab #5
2011 2012 2013 2014
Vessel Margin Per Day $8,779 $11,828 $10,697 $10,712 Tab #6
Total Debt (incl. Preferred Stock) $127,071 $148,501 $158,290 $192,290 Tab #1