RAND LOGISTICS, INC.| | RAND LOGISTICS, INC 500 FIFTH AVENUE 50TH FLOOR NEW YORK, NEW YORK 10110 Telephone: (212) 644-3450 Facsimile: (212) 644-6262 |
September 10, 2014
Jonathan Evans
JWEST LLC
501 Congressional Blvd.
Carmel, IN 46033
Dear Jon:
We always endeavor to provide thoughtful and comprehensive responses to our stockholders. To that end, we write this letter in response to the questions and comments presented in your Sept. 5th letter.
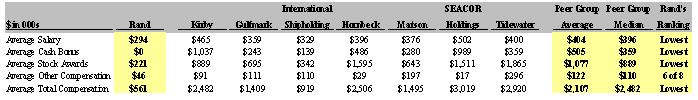
| § | Executive Comp/EBITDA: Surely you recognize that executive compensation/EBITDA is neither a typical nor valid metric when comparing companies with vastly different levels of EBITDA. Specifically, in 2013/FY’14, Rand generated only about 12% of the average EBITDA of its peer group of companies. Said another way, Rand is only one eighth the size of the average of its peers as measured by EBITDA. It is noteworthy that you find it meaningful to compare executive compensation relative to this vastly different scale of EBITDA. The metric of executive compensation/EBITDA is relevant, of course, to tracking an individual company’s compensation levels from year to year, which is why we provided the same for Laurence Levy in our earlier filed materials (showing a 29% decrease in Laurence’s salary as a percentage of EBITDA since 2011). To further address your inquiry regarding executive compensation at Rand, see the following table which shows that, among the noted peer group, Rand ranks the lowest, by far, in average total compensation, average base salary, average cash bonus and average stock award compensation per person for the four named executives of each company. Note specifically that over the four year period ended March 31, 2014 referenced in your letter: |
| Ø | the Rand executives are the only executives in the peer group to have not received any cash bonus; |
| Ø | the Rand executives’ average salary is approximately 27% below the peer group average; |
| Ø | the Rand executives’ average total stock award compensation is approximately 80% below the peer group average; and |
| Ø | the Rand executives’ average total compensation is approximately 73% below the peer group average. |
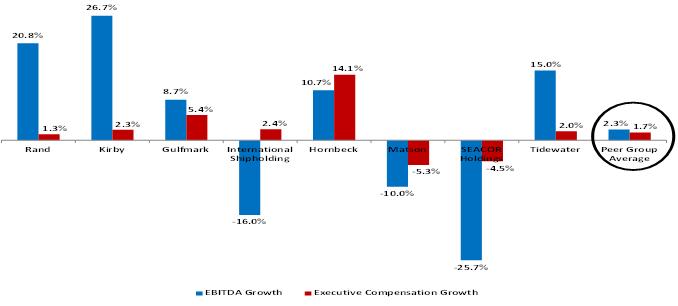
Note further that during the same time period, our management team has grown EBITDA by an annual rate nearly 9 times the average EBITDA growth rate of the peer group while our management’s total compensation has grown at ~21% less than the annual rate of the peer group.
| § | Maintenance Capex vs. Discretionary Growth Capex: As part of our capital allocation decision making process, we continuously evaluate the best use for our excess cash flow to maximize long-term stockholder value. For example, this past winter we elected to invest in one of our vessels to improve its unloading speed. The unlevered return on this discretionary investment was meaningfully in excess of the cost of our capital and met our return criteria, thus creating value to our stockholders. If, as you suggest, we managed our business to achieve maximum cash flow as you calculate it, we would not have made this or potentially other beneficial discretionary investments in our fleet. |
The discretionary cash flow dollars that we elect to spend improving our fleet are deducted from total capex in calculating Unlevered Free Cash Flow in addition to being permanently added to cumulative invested capital for purposes of calculating Return on Invested Capital.
| § | Levered vs. Unlevered Free Cash Flow: We believe that Unlevered Free Cash Flow is among the appropriate metrics for measuring our business performance as well as for calculating Return on Invested Capital. Levered Free Cash Flow would be more appropriate in the calculation of Return on Equity, which stockholders are welcome to calculate as it too has increased over the noted time period. |
| § | 5-Year Stock Performance Chart: We are surprised that you are questioning the use of a five-year period in order to analyze the performance of public company common stock. We believe a five-year performance period is very typical and relevant for these purposes. |
| § | Summary Performance Table: We have used FY’08 as our baseline measurement year as that was the fiscal year we started growing our fleet by acquiring three river class self-unloading vessels and two bulkers. |
| § | Summary of Growth Table: The summary growth table on page 5 of our stockholder presentation is just that, a summary, and it does not attempt to denote the manner in which such growth was funded. The funding of the company’s growth over the six year period presented is widely understood by our stockholders and is readily ascertainable in our publicly available securities filings. |
| § | FY’08 Vessel Margin/Day: As stated in the June 2008 release, our Vessel Margin/Day excluded five recently acquired vessels, including those operated under a time charter with WMS. We subsequently acquired those WMS vessels and have now consolidated their operating performance over the period they were included in our consolidated financial statements into our reported Vessel Margin/Day, as reflected in our presentation materials. |
| § | Why buy additional ships if at less than full capacity?: We are mystified by your implication that no vessels should be added to our fleet unless and until existing vessels have reached full capacity. Tonnage is important, but as we have consistently explained, marine freight revenue and vessel margin per day are at least as important drivers of shareholder value. |
As we believe you are aware, our business is not predicated on moving the same commodity from location A to location B every day. Our trade patterns, trip durations and the density of the commodities that we transport change daily. Given those and other variables, we seek to maximize marine freight revenue and vessel margin rather than standalone tonnage. For example, one vessel can carry 25,000 tons of material on a five day journey for a total of 25,000 tons carried. Alternatively, the same vessel can carry 25,000 tons of the same material on five separate trips over a five day period, for a total of 125,000 tons carried. Under both of these alternatives we are at full capacity, but there are a number of other factors that management analyzes in determining which of these two alternatives is more accretive to vessel margin per day. Moreover, the characteristics of our vessels impact our tonnage carried. Specifically, our bulk carriers account for 50% of the growth of our fleet since FY 2008. These vessels currently comprise approximately 25% of our fleet, but account for less than 9% of our total tonnage carried due to the density of the commodity carried, the longer duration of their trips and the fact that they do not currently participate in backhauls.
In short, your inquiry as to why our tonnage growth has not mirrored our capacity growth shows a lack of understanding of our business.
| § | Rand Comparable Companies: We have endeavored to provide an appropriate group of comparable companies for purposes of comparing our stock performance and have relied on an independent investment bank for such purposes. We would be happy to review your suggested additions, if any, to our comp set, beyond the two companies (one of which is already in our comp set and the other of which is not Jones Act compliant) included in your limited comparison set. |
We trust the foregoing addresses your questions and concern.
On behalf of your Board of Directors,
Michael Lundin
Lead Independent Director