| UNITED STATES SECURITIES AND EXCHANGE COMMISSION | ||
| Washington, D.C. 20549 | ||
FORM N-CSR | ||
| CERTIFIED SHAREHOLDER REPORT OF REGISTERED MANAGEMENT INVESTMENT COMPANIES | ||
| Investment Company Act file number: | (811-21598) |
| Exact name of registrant as specified in charter: | Putnam RetirementReady Funds |
| Address of principal executive offices: | One Post Office Square, Boston, Massachusetts 02109 |
| Name and address of agent for service: | Robert T. Burns, Vice President One Post Office Square Boston, Massachusetts 02109 |
| Copy to: | John W. Gerstmayr, Esq. Ropes & Gray LLP 800 Boylston Street Boston, Massachusetts 02199-3600 |
| Registrant’s telephone number, including area code: | (617) 292-1000 |
| Date of fiscal year end: | July 31, 2012 |
| Date of reporting period: | August 1, 2011 — January 31, 2012 |
Item 1. Report to Stockholders: |
| The following is a copy of the report transmitted to stockholders pursuant to Rule 30e-1 under the Investment Company Act of 1940: | |||
Putnam
RetirementReady®
Funds
| Putnam RetirementReady Fund 2055 | Putnam RetirementReady Fund 2030 |
| Putnam RetirementReady Fund 2050 | Putnam RetirementReady Fund 2025 |
| Putnam RetirementReady Fund 2045 | Putnam RetirementReady Fund 2020 |
| Putnam RetirementReady Fund 2040 | Putnam RetirementReady Fund 2015 |
| Putnam RetirementReady Fund 2035 | Putnam Retirement Income Fund Lifestyle 1 |
Semiannual report
1 | 31 | 12
| Message from the Trustees | 1 | ||
| About the funds | 2 | ||
| Interview with your fund’s portfolio manager | 5 | ||
| Your fund’s performance | 11 | ||
| Your fund’s expenses | 20 | ||
| Terms and definitions | 24 | ||
| Other information for shareholders | 25 | ||
| Financial statements | 26 | ||
Message from the Trustees
Dear Fellow Shareholder:
Markets in early 2012 have signaled a more consistently positive direction, supported by strengthening fundamentals. In the United States, where corporate earnings have been strong for more than a year, the employment picture has also brightened in recent months. The Federal Reserve has pledged to leave rates at historic lows at least through the end of 2014, and the beleaguered U.S. housing market has finally shown signs of recovery. The European debt situation and likely recession in that region continue to weigh heavily on markets, of course, alongside high unemployment here at home. However, we are encouraged by the change in investor sentiment.
We believe there are numerous investment opportunities resulting from the many market dislocations in recent years. Putnam’s rigorous bottom-up, fundamental investment approach is well suited to this environment, and the Putnam team is committed to uncovering returns for our shareholders, while seeking to guard against downside risk.
Please join us in welcoming the return of Elizabeth T. Kennan to the Board of Trustees. Dr. Kennan, who served as a Trustee from 1992 until 2010, has rejoined the Board, effective January 1, 2012. Dr. Kennan is a Partner of Cambus-Kenneth Farm (thoroughbred horse breeding and general farming), and is also President Emeritus of Mount Holyoke College.
We would also like to take this opportunity to welcome new shareholders to the fund and to thank all of our investors for your continued confidence in Putnam.

About the funds
Offering one-step diversification that adjusts automatically over time
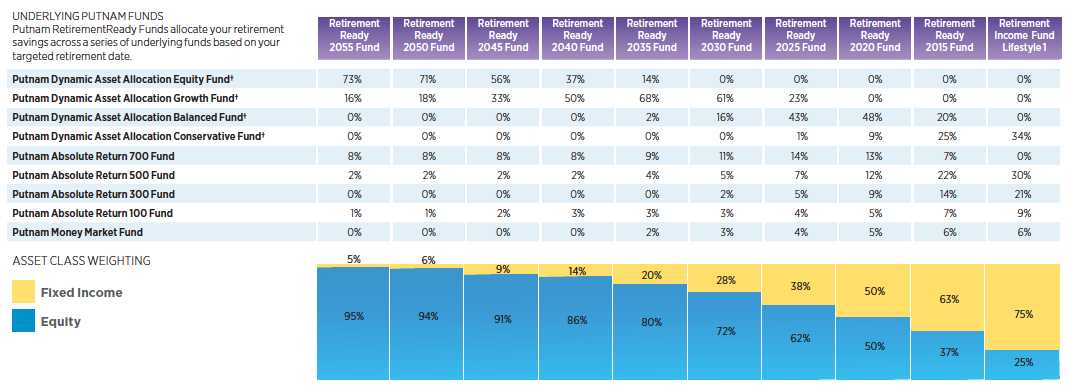
Unpredictable markets and the demands of a busy life can make it a challenge to diversify and monitor your retirement investments. Putnam RetirementReady Funds can ease that challenge for you. The funds provide one-step diversification and automatically shift allocations to reduce risk over time.
Each fund invests in a combination of Putnam portfolios to provide you with exposure to a variety of asset classes and investment styles. A fund’s target date corresponds to the year you expect to begin withdrawing assets — which is typically in retirement. Investment allocations are more aggressive when the target date is far off and gradually become more conservative as this date draws closer. In 2009, Putnam Absolute Return Funds were added to the portfolios, with the goal of reducing volatility even further. These funds represent a significant portion of Putnam Retirement Income Fund Lifestyle 1*, which is designed for investors who are at or near retirement. The principal value of the funds is not guaranteed at any time, including the target date.
While diversification can help protect your returns from excessive volatility, you can still lose money. However, a Putnam RetirementReady Fund offers diversification and professional management while you pursue maximum returns and a level of risk you are comfortable with.
Consider these risks before investing: International investing involves certain risks, such as currency fluctuations, economic instability, and political developments. Additional risks may be associated with emerging-market securities, including illiquidity and volatility. Investments in small and/or midsize companies increase the risk of greater price fluctuations. Lower-rated bonds may offer higher yields in return for more risk. Funds that invest in government securities are not guaranteed. Mortgage-backed securities are subject to prepayment risk. The use of derivatives involves additional risks, such as the potential inability to terminate or sell derivatives positions and the potential failure of the other party to the instrument to meet its obligations. The efforts of some underlying funds to produce lower volatility returns may not be successful and may make it more difficult at times for these funds to achieve their targeted returns. In addition, under certain market conditions, the funds may accept greater volatility than would typically be the case in order to seek their targeted returns. Growth stocks may be more susceptible to earnings disappointments, and value stocks may fail to rebound. Funds that invest in bonds are subject to certain risks including interest-rate risk, credit risk, and inflation risk. As interest rates rise, the prices of bonds fall. Long-term bonds are more exposed to interest-rate risk than short-term bonds. Unlike bonds, bond funds have ongoing fees and expenses. Our allocation of assets among permitted asset categories may hurt performance. Our active trading strategies may lose money or not earn a return sufficient to cover trading and other costs. Our use of leverage increases these risks by increasing investment exposure. The funds may invest in a money market fund for cash management. Money market funds are not insured or guaranteed by the Federal Deposit Insurance Corporation (FDIC) or any other governmental agency. Although money market funds seek to preserve the value of your investment at $1.00 per share, it is possible to lose money by investing in these funds.
*Prior to June 16, 2011, the fund was known as Putnam RetirementReady Maturity Fund.
†Prior to November 30, 2011, these funds were known as Putnam Asset Allocation: Equity Portfolio, Putnam Asset Allocation: Growth Portfolio, Putnam Asset Allocation: Balanced Portfolio, and Putnam Asset Allocation: Conservative Portfolio.
Because of rounding in the calculation of allocations among underlying Putnam funds, the percentages may not add up to 100%, and actual allocations might be more or less than these percentages.
| 2 | 3 |
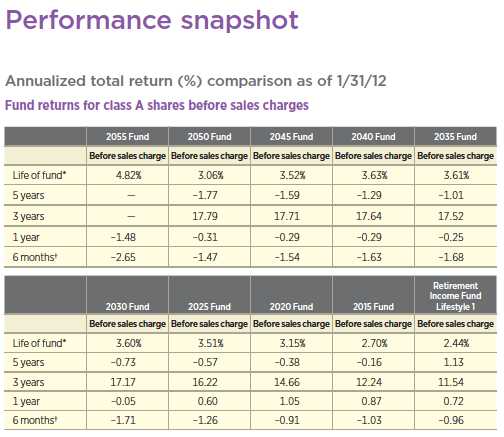
Current performance may be lower or higher than the quoted past performance, which cannot guarantee future results. Share price, principal value, and return will fluctuate, and you may have a gain or a loss when you sell your shares. Performance of class A shares assumes reinvestment of distributions and does not account for taxes. Fund returns in the bar chart do not reflect a sales charge of 4.00% for Retirement Income Fund Lifestyle 1 and 5.75% for all other funds; had they, returns would have been lower. See pages 5 and 11–20 for additional performance information. For a portion of the periods, the funds had expense limitations, without which returns would have been lower. To obtain the most recent month-end performance, visit putnam.com.
* With the exception of Putnam RetirementReady 2050 Fund and 2055 Fund (inceptions: 5/2/05 and 11/30/10, respectively), the inception date of all share classes of RetirementReady Funds is 11/1/04.
† Returns for the six-month period are not annualized, but cumulative.
4
Interview with your fund’s portfolio manager

Jeff, what factors contributed to the wide fluctuations in the global markets during the six months ended January 31, 2012?
In a market driven more by macroeconomic events rather than by investment fundamentals, investors saw some dramatic relative performance moves during the reporting period. Three significant risks contributed to the volatility. First, the European sovereign debt crisis continued to deteriorate, increasing the likelihood that Europe’s banking institutions would be compelled to realize debt-related losses. The situation exacerbated fears that the eurozone’s growth might slow, or even tip into a recession. Second, concerns over weak economic data triggered fears of a double-dip recession in the United States well into the final months of 2011. Lastly, with its export growth, industrial production, and manufacturing activity slowing, the pace of China’s economic growth came into question. Investors had hoped that China and the United States might provide some counterweight to Europe’s ailing economy.
In response to these stresses, investors shifted out of the more vulnerable asset classes and cyclical sectors, whose fates are tied to economic growth, into lower-risk investments that tend to be more resilient in slower-growth markets. Thus, European stocks and bonds of peripheral eurozone markets sold off sharply, defensive stocks in the United States (the health-care, consumer
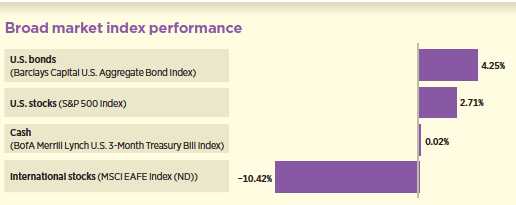
This chart shows the performance of broad market indexes for the six months ended 1/31/12. See pages 4 and 11–20 for fund performance information. Index descriptions can be found on page 24.
5
staples, and utilities sectors) outperformed dramatically, and stocks across parts of Asia fell by 20% through the end of 2011.
However, in January, U.S. stocks rallied on news of employment gains and other indicators that suggested the U.S. economy — and the global economic outlook for that matter — might not be as bleak as was first thought. While all equity markets were lifted by the news, only U.S. stocks closed out the reporting period in positive territory. Consequently, U.S. stocks outperformed non-U.S. stocks for the reporting period, with the S&P 500 Index’s 2.71% return surpassing the –10.42% return for international stocks as measured by the MSCI EAFE Index [ND].
How did Putnam RetirementReady Funds perform in this environment?
By investing in a combination of funds that utilize asset allocation strategies, including absolute return funds that seek to reduce volatility, each Putnam RetirementReady Fund is managed for comprehensive diversification. We believe the effectiveness of this strategy can be seen when the funds’ returns for the six months ended January 31, 2012, are considered in the context of the various asset classes and sectors comprising the financial markets and the portfolios themselves.
On the positive side, the stronger performing U.S. stocks [S&P 500 Index], U.S. bonds [Barclays Capital U.S. Aggregate Bond Index], and information technology stocks [MSCI World Information Technology Index] generated returns of 2.71%, 4.25%, and 2.77%, respectively, for the reporting period. On the other hand, the greatest laggards for the period included Europe [MSCI EAFE Index (ND)] and the MSCI World Energy & Materials Index (ND), which posted returns of –10.42% and –7.69%, respectively, for the same period.
Clearly, one can’t pick 100% of the winners 100% of the time, but we believe smart strategies such as those employed by Putnam RetirementReady Funds can provide downside protection. Through our risk management strategies, we’re able to efficiently rebalance the underlying portfolios in response to market conditions to limit volatility in keeping with the investor’s retirement date. Investment allocations are more aggressive when the target date is far off and gradually become more conservative as this date draws closer.
Prospects for the U.S. economy had improved by the end of the reporting period, providing some positive momentum. What contributed to the change in sentiment?
As the reporting period came to a close on January 31, 2012, the U.S. economy had surprised on the upside. Economists were fearful that growth would decelerate rapidly after S&P’s downgrade of U.S. debt in August 2011. But that did not happen, and, as of this interview, economic data including housing, jobs, consumer confidence, and spending were either stable or slowly improving. Furthermore, although the U.S. economy is still in recovery mode, it is worth noting that U.S. companies generated record profits in 2011.
We believe the economy should continue to improve in the coming months, even if growth is slower than many would like. As the world’s largest economy, signs of a U.S. recovery are welcome news amid Europe’s clear economic deceleration and China’s more measured slowdown.
Interest rates around the world remain at historic lows, given global growth challenges. How has this affected your fixed-income strategy?
We continue to favor a limited exposure to interest-rate risk in the underlying funds, which detracted somewhat from relative returns during the period. With interest rates in a number of markets near historic lows,
6
we believe the potential rewards from a long-duration stance are minimal. That said, we believe there are opportunities to take tactical positions at the long end of the yield curve, which we think will continue to exhibit volatility. While central banks have anchored the short end of the curve, the long end — represented by bonds with maturities of 20 or 30 years — may be forced to absorb all of the policy uncertainty or any additional shocks to the global financial system — providing short-term tactical opportunities.

Do you think that European sovereign debt challenges will continue to set the tone for the global markets?
As has been the case throughout 2011, we believe Europe’s debt woes and policy-makers’ efforts to address the long-term structural challenges are likely to dominate the course of the global markets for the foreseeable future. It’s unlikely that a simple solution exists for overcoming these policy hurdles given the disparity of the needs and goals of the countries involved. In many ways, markets currently reflect this reality; for example, the spread between Italian and German interest rates today closely matches the differences we saw in the pre-European Monetary Union era. In the 1990s, those differences were the result primarily of currency risks, while today those differences are driven by credit risks.
While we believe that the funding arrangements put in place have likely helped the European Union avoid a crisis over the short term, long-term fiscal challenges remain, and the outcome appears anything but certain. We should add, however, that even if Greece eventually were to default on its debt, we believe the direct implications to the U.S. economy would be limited, given that U.S. banks are generally better capitalized than their European counterparts.
What factors do you think will drive global markets in 2012?
We think that geography is likely to be quite meaningful again in 2012. Europe will continue to struggle against an intensifying debt crisis we believe, and steps taken to address the debt crisis will necessarily subdue economic activity there as resources are directed away from more productive uses. Meanwhile, Asian countries in general, and China in particular, appear poised for stronger growth. Equity market performance could follow, with leadership returning to emerging markets and the United States as capital is withdrawn from Europe and deployed in these more attractive areas.
While a slow-growth environment may not be ideal for equity investors or for the global economy as a whole, a somewhat cautionary environment creates a fairly attractive setting for corporate credit in our view. Thus, in the fixed-income universe, the fundamentals across a range of fixed-income sectors remain attractive in our opinion. Defaults in corporate debt are well below the long-term average, and we believe that the default rate is likely to remain low, even in a relatively weak economic environment. As a result, credit risk, gained through exposure to corporate bonds and certain mortgage-backed securities that sold off during the period, continues to appear attractively priced in our estimation.
Investors’ recent flight to quality, which led the ultra-safe and lower-risk assets to outperform during the reporting period, has created compelling valuations in the crisis-sensitive or higher-risk assets that fell so sharply. If
7
macroeconomic worries, primarily over the situation in Europe, recede at all, we believe the market should begin to favor these attractively priced asset classes that underperformed in 2011.
Thank you, Jeff, for your time and insights today.
The views expressed in this report are exclusively those of Putnam Management and are subject to change. They are not meant as investment advice.
Each RetirementReady Fund has a different target date indicating when the fund’s investors expect to retire and begin withdrawing assets from their account. The dates range from 2015 to 2055 in five-year intervals, with the exception of Putnam Retirement Income Fund Lifestyle 1, which is designed for investors at or near retirement. The funds are generally weighted more heavily toward more aggressive, higher-risk investments when the target date of the fund is far off, and more conservative, lower-risk investments when the target date of the fund is near. This means that both the risk of your investment and your potential return are reduced as the target date of the particular fund approaches, although there can be no assurance that any one fund will have less risk or more reward than any other fund. The principal value of the fund is not guaranteed at any time, including the target date.
Portfolio Manager Jeffrey L. Knight is Head of Global Asset Allocation at Putnam. He holds an M.B.A. from the Tuck School of Business at Dartmouth College and a B.A. from Colgate University. A CFA charter-holder, he joined Putnam in 1993 and has been in the investment industry since 1987.
In addition to Jeff, your fund’s portfolio managers are Robert J. Kea, CFA, Joshua B. Kutin, CFA, and Robert J. Schoen.
IN THE NEWS
The U.S. unemployment rate fell to 8.3% in January, with the nation’s employers adding 243,000 jobs, according to the Labor Department. This was the fastest pace of job growth since April 2011 and was the fifth straight month of unemployment rate declines. The nation’s jobless rate is still above the 5.2%-to-6% range that Federal Reserve (Fed) officials say is consistent with maximum employment. According to the Labor Department, 12.8 million Americans remain unemployed. In testimony before the Senate Budget Committee in early February, Fed Chairman Ben S. Bernanke said that the U.S. job market is far from “operating normally.” The Fed chairman reiterated that the Fed’s benchmark interest rate will remain near zero at least through late 2014, and again called on U.S. lawmakers to reduce the federal deficit.
8
Composition of the funds’ underlying investments
Historically, each Putnam RetirementReady Fund invests, to varying degrees, in a variety of Putnam mutual funds. This section describes the goals and strategies of each of the underlying Putnam funds. For more information, please see the funds’ prospectus.
Putnam Absolute Return 100, 300, 500, and 700 Funds
Each fund pursues an “absolute return” strategy that seeks to earn a positive total return over a reasonable period of time (three years or more) regardless of market conditions or general market direction. The target return for each fund is the rate of inflation plus a number of basis points specified in the fund’s name. For example, the Absolute Return 500 Fund seeks to earn a total return of 500 basis points (or 5.00%) over the rate of inflation. The funds pursue their goals through portfolios that are structured to offer varying degrees of risk, expected volatility, and expected returns.
Putnam Dynamic Asset Allocation Equity Fund*
The fund’s portfolio invests mainly in stocks of companies worldwide and is designed for investors seeking long-term growth. The fund typically allocates approximately 75% of its assets to investments in U.S. companies and 25% of its assets to international companies, but allocations may vary. The Portfolio Managers can adjust allocations based on market conditions.
Putnam Dynamic Asset Allocation Growth Fund*
The fund’s portfolio invests in U.S. and international stocks and bonds and is designed for investors seeking long-term growth with moderate risk. The fund’s strategic equity weighting is 80% (the range is 65% to 95%), with the balance invested in a range of fixed-income investments. The Portfolio Managers can adjust allocations based on market conditions.
Putnam Dynamic Asset Allocation Balanced Fund*
The fund’s portfolio is diversified across stocks and bonds in global markets and is designed for investors seeking a combination of growth and current income. The fund’s strategic equity allocation is 60% (the range is 45% to 75%), with the balance invested in bonds and money market instruments. The Portfolio Managers can adjust the allocations to growth- and value-style stocks and fixed-income sectors based on market conditions.
Putnam Dynamic Asset Allocation Conservative Fund*
The fund’s globally diversified portfolio emphasizes bonds over stocks and is designed for investors who want to protect the value of their investment while receiving regular income and protection against inflation. The strategic fixed-income allocation is 70% (with a range of 55% to 85%), with the balance invested in stocks and money market instruments. The Portfolio Managers can adjust allocations based on market conditions.
9
Putnam Money Market Fund
The fund seeks as high a rate of current income as Putnam Management believes is consistent with preservation of capital and maintenance of liquidity. The fund invests mainly in instruments that are high quality and have short-term maturities.
Money market funds are not insured or guaranteed by the Federal Deposit Insurance Corporation (FDIC) or any other governmental agency. Although the fund seeks to preserve the value of your investment at $1.00 per share, it is possible to lose money by investing in the fund.
* Prior to November 30, 2011, these funds were known as Putnam Asset Allocation: Equity Portfolio; Putnam Asset Allocation: Growth Portfolio; Putnam Asset Allocation: Balanced Portfolio; and Putnam Asset Allocation: Conservative Portfolio.
Allocations by fund as of 1/31/12
| Underlying Putnam Fund | Putnam RetirementReady 2055 Fund | Putnam RetirementReady 2050 Fund | Putnam RetirementReady 2045 Fund | Putnam RetirementReady 2040 Fund | Putnam RetirementReady 2035 Fund | Putnam RetirementReady 2030 Fund | Putnam RetirementReady 2025 Fund | Putnam RetirementReady 2020 Fund | Putnam RetirementReady 2015 Fund | Putnam Retirement Income Fund Lifestyle 1 | ||||||||||
| Putnam Dynamic Asset | ||||||||||||||||||||
| Allocation Equity Fund | 73.7% | 71.5% | 56.0% | 37.5% | 13.8% | 0.0% | 0.0% | 0.0% | 0.0% | 0.0% | ||||||||||
| Putnam Dynamic Asset | ||||||||||||||||||||
| Allocation Growth Fund | 16.0% | 18.1% | 33.0% | 50.6% | 68.5% | 61.4% | 23.8% | 0.0% | 0.0% | 0.0% | ||||||||||
| Putnam Dynamic Asset | ||||||||||||||||||||
| Allocation Balanced Fund | 0.0% | 0.0% | 0.0% | 0.0% | 1.9% | 15.8% | 43.2% | 48.4% | 20.0% | 0.0% | ||||||||||
| Putnam Dynamic Asset | ||||||||||||||||||||
| Allocation Conservative Fund | 0.0% | 0.0% | 0.0% | 0.0% | 0.0% | 0.0% | 1.0% | 8.5% | 24.8% | 34.4% | ||||||||||
| Putnam Money Market Fund | 0.5% | 0.4% | 0.4% | 0.4% | 1.4% | 2.6% | 3.6% | 4.8% | 5.8% | 5.8% | ||||||||||
| Putnam Absolute Return | ||||||||||||||||||||
| 700 Fund | 7.2% | 7.2% | 7.2% | 7.2% | 8.2% | 10.8% | 13.2% | 12.9% | 7.3% | 0.0% | ||||||||||
| Putnam Absolute Return | ||||||||||||||||||||
| 500 Fund | 2.1% | 2.1% | 2.1% | 2.1% | 3.7% | 5.0% | 6.6% | 11.5% | 21.5% | 29.9% | ||||||||||
| Putnam Absolute Return | ||||||||||||||||||||
| 300 Fund | 0.0% | 0.0% | 0.0% | 0.0% | 0.2% | 1.7% | 4.9% | 9.0% | 14.0% | 21.0% | ||||||||||
| Putnam Absolute Return | ||||||||||||||||||||
| 100 Fund | 0.5% | 0.7% | 1.2% | 2.1% | 2.4% | 2.7% | 3.7% | 4.9% | 6.5% | 8.9% | ||||||||||
Percentages are based on market value. Portfolio composition will vary over time. Due to rounding, percentages may not equal 100%.
10
Your fund’s performance
This section shows your fund’s performance, price, and distribution information for periods ended January 31, 2012, the end of the first half of its current fiscal year. In accordance with regulatory requirements for mutual funds, we also include performance as of the most recent calendar quarter-end and expense information taken from the fund’s current prospectus. Performance should always be considered in light of a fund’s investment strategy. Data represent past performance. Past performance does not guarantee future results. More recent returns may be less or more than those shown. Investment return and principal value will fluctuate, and you may have a gain or a loss when you sell your shares. Performance information does not reflect any deduction for taxes a shareholder may owe on fund distributions or on the redemption of fund shares. For the most recent month-end performance, please visit the Individual Investors section at putnam.com or call Putnam at 1-800-225-1581. Class R and class Y shares are not available to all investors. See the Terms and Definitions section in this report for definitions of the share classes offered by your fund.
Fund performance Total return for periods ended 1/31/12
| Class A | Class B | Class C | Class M | Class R | Class Y | |||||
| (inception dates) | (11/1/04) | (11/1/04) | (11/1/04) | (11/1/04) | (11/1/04) | (11/1/04) | ||||
| Before | After | Before | After | Net | Net | |||||
| sales | sales | Before | After | Before | After | sales | sales | asset | asset | |
| charge | charge | CDSC | CDSC | CDSC | CDSC | charge | charge | value | value | |
| 2055 Fund* | ||||||||||
| Life of fund | 5.65% | –0.42% | 4.68% | 0.90% | 4.75% | 4.75% | 5.05% | 1.40% | 5.38% | 5.96% |
| Annual average | 4.82 | –0.36 | 4.00 | 0.77 | 4.06 | 4.06 | 4.31 | 1.20 | 4.59 | 5.09 |
| 1 year | –1.48 | –7.16 | –2.23 | –6.98 | –2.17 | –3.11 | –2.00 | –5.42 | –1.71 | –1.21 |
| 6 months | –2.65 | –8.29 | –3.10 | –7.81 | –3.05 | –3.98 | –2.88 | –6.23 | –2.78 | –2.58 |
| 2050 Fund† | ||||||||||
| Life of fund | 22.57% | 15.52% | 16.44% | 16.44% | 16.51% | 16.51% | 18.40% | 14.26% | 20.42% | 24.54% |
| Annual average | 3.06 | 2.16 | 2.28 | 2.28 | 2.29 | 2.29 | 2.53 | 1.99 | 2.79 | 3.30 |
| 5 years | –8.54 | –13.80 | –11.96 | –13.12 | –11.93 | –11.93 | –10.83 | –13.96 | –9.71 | –7.46 |
| Annual average | –1.77 | –2.93 | –2.52 | –2.77 | –2.51 | –2.51 | –2.27 | –2.96 | –2.02 | –1.54 |
| 3 years | 63.43 | 54.03 | 59.71 | 56.71 | 59.82 | 59.82 | 60.97 | 55.33 | 62.18 | 64.60 |
| Annual average | 17.79 | 15.49 | 16.89 | 16.15 | 16.92 | 16.92 | 17.20 | 15.81 | 17.49 | 18.07 |
| 1 year | –0.31 | –6.07 | –1.08 | –5.87 | –1.07 | –2.03 | –0.80 | –4.29 | –0.56 | –0.08 |
| 6 months | –1.47 | –7.10 | –1.93 | –6.68 | –1.85 | –2.80 | –1.73 | –5.16 | –1.66 | –1.39 |
| 2045 Fund‡ | ||||||||||
| Life of fund | 28.52% | 21.13% | 21.77% | 21.77% | 21.71% | 21.71% | 23.94% | 19.60% | 26.30% | 30.87% |
| Annual average | 3.52 | 2.68 | 2.75 | 2.75 | 2.74 | 2.74 | 3.00 | 2.50 | 3.27 | 3.78 |
| 5 years | –7.71 | –13.02 | –11.07 | –12.07 | –11.11 | –11.11 | –10.00 | –13.15 | –8.84 | –6.56 |
| Annual average | –1.59 | –2.75 | –2.32 | –2.54 | –2.33 | –2.33 | –2.09 | –2.78 | –1.83 | –1.35 |
| 3 years | 63.09 | 53.71 | 59.54 | 56.54 | 59.47 | 59.47 | 60.62 | 54.99 | 61.93 | 64.36 |
| Annual average | 17.71 | 15.41 | 16.85 | 16.11 | 16.83 | 16.83 | 17.11 | 15.73 | 17.43 | 18.01 |
| 1 year | –0.29 | –6.05 | –0.97 | –5.79 | –1.04 | –2.00 | –0.80 | –4.31 | –0.51 | –0.02 |
| 6 months | –1.54 | –7.22 | –1.87 | –6.64 | –1.92 | –2.87 | –1.79 | –5.22 | –1.66 | –1.40 |
11
Fund performance Total return for periods ended 1/31/12 cont.
| Class A | Class B | Class C | Class M | Class R | Class Y | |||||
| (inception dates) | (11/1/04) | (11/1/04) | (11/1/04) | (11/1/04) | (11/1/04) | (11/1/04) | ||||
| Before | After | Before | After | Net | Net | |||||
| sales | sales | Before | After | Before | After | sales | sales | asset | asset | |
| charge | charge | CDSC | CDSC | CDSC | CDSC | charge | charge | value | value | |
| 2040 Fund‡ | ||||||||||
| Life of fund | 29.48% | 22.04% | 22.65% | 22.65% | 22.72% | 22.72% | 24.85% | 20.48% | 27.25% | 31.87% |
| Annual average | 3.63 | 2.78 | 2.85 | 2.85 | 2.86 | 2.86 | 3.11 | 2.60 | 3.38 | 3.89 |
| 5 years | –6.29 | –11.68 | –9.74 | –10.86 | –9.71 | –9.71 | –8.63 | –11.83 | –7.44 | –5.10 |
| Annual average | –1.29 | –2.45 | –2.03 | –2.27 | –2.02 | –2.02 | –1.79 | –2.49 | –1.53 | –1.04 |
| 3 years | 62.82 | 53.45 | 59.21 | 56.20 | 59.24 | 59.24 | 60.36 | 54.75 | 61.66 | 64.06 |
| Annual average | 17.64 | 15.34 | 16.77 | 16.03 | 16.78 | 16.78 | 17.05 | 15.67 | 17.36 | 17.94 |
| 1 year | –0.29 | –6.03 | –1.00 | –5.85 | –0.97 | –1.94 | –0.73 | –4.21 | –0.50 | 0.00 |
| 6 months | –1.63 | –7.28 | –1.95 | –6.76 | –1.93 | –2.89 | –1.87 | –5.33 | –1.68 | –1.45 |
| 2035 Fund | ||||||||||
| Life of fund | 29.32% | 21.89% | 22.43% | 22.43% | 22.45% | 22.45% | 24.65% | 20.29% | 26.88% | 31.61% |
| Annual average | 3.61 | 2.77 | 2.83 | 2.83 | 2.83 | 2.83 | 3.08 | 2.58 | 3.34 | 3.86 |
| 5 years | –4.94 | –10.40 | –8.48 | –9.67 | –8.51 | –8.51 | –7.34 | –10.58 | –6.11 | –3.79 |
| Annual average | –1.01 | –2.17 | –1.76 | –2.01 | –1.76 | –1.76 | –1.51 | –2.21 | –1.25 | –0.77 |
| 3 years | 62.32 | 52.98 | 58.65 | 55.65 | 58.58 | 58.58 | 59.83 | 54.24 | 61.12 | 63.47 |
| Annual average | 17.52 | 15.22 | 16.63 | 15.89 | 16.61 | 16.61 | 16.92 | 15.54 | 17.23 | 17.80 |
| 1 year | –0.25 | –5.97 | –1.06 | –5.89 | –1.09 | –2.05 | –0.80 | –4.26 | –0.51 | –0.04 |
| 6 months | –1.68 | –7.35 | –2.12 | –6.90 | –2.15 | –3.10 | –1.98 | –5.42 | –1.80 | –1.62 |
| 2030 Fund | ||||||||||
| Life of fund | 29.26% | 21.83% | 22.40% | 22.40% | 22.41% | 22.41% | 24.63% | 20.27% | 26.88% | 31.54% |
| Annual average | 3.60 | 2.76 | 2.83 | 2.83 | 2.83 | 2.83 | 3.08 | 2.58 | 3.34 | 3.85 |
| 5 years | –3.62 | –9.16 | –7.20 | –8.45 | –7.19 | –7.19 | –6.04 | –9.33 | –4.86 | –2.47 |
| Annual average | –0.73 | –1.90 | –1.48 | –1.75 | –1.48 | –1.48 | –1.24 | –1.94 | –0.99 | –0.50 |
| 3 years | 60.87 | 51.62 | 57.32 | 54.32 | 57.32 | 57.32 | 58.49 | 52.94 | 59.65 | 62.10 |
| Annual average | 17.17 | 14.88 | 16.30 | 15.56 | 16.30 | 16.30 | 16.59 | 15.21 | 16.88 | 17.47 |
| 1 year | –0.05 | –5.78 | –0.83 | –5.70 | –0.81 | –1.78 | –0.59 | –4.10 | –0.33 | 0.15 |
| 6 months | –1.71 | –7.36 | –2.05 | –6.86 | –2.02 | –2.98 | –1.93 | –5.35 | –1.82 | –1.60 |
| 2025 Fund | ||||||||||
| Life of fund | 28.41% | 21.02% | 21.65% | 21.65% | 21.65% | 21.65% | 23.86% | 19.52% | 26.11% | 30.75% |
| Annual average | 3.51 | 2.66 | 2.74 | 2.74 | 2.74 | 2.74 | 2.99 | 2.49 | 3.25 | 3.76 |
| 5 years | –2.81 | –8.40 | –6.36 | –7.64 | –6.35 | –6.35 | –5.19 | –8.51 | –4.01 | –1.59 |
| Annual average | –0.57 | –1.74 | –1.31 | –1.58 | –1.30 | –1.30 | –1.06 | –1.76 | –0.82 | –0.32 |
| 3 years | 56.97 | 47.95 | 53.54 | 50.54 | 53.58 | 53.58 | 54.64 | 49.23 | 55.84 | 58.17 |
| Annual average | 16.22 | 13.95 | 15.36 | 14.61 | 15.37 | 15.37 | 15.64 | 14.28 | 15.94 | 16.51 |
| 1 year | 0.60 | –5.19 | –0.09 | –4.94 | –0.11 | –1.08 | 0.11 | –3.39 | 0.33 | 0.83 |
| 6 months | –1.26 | –6.94 | –1.56 | –6.34 | –1.58 | –2.53 | –1.46 | –4.91 | –1.34 | –1.13 |
12
Fund performance Total return for periods ended 1/31/12 cont.
| Class A | Class B | Class C | Class M | Class R | Class Y | |||||
| (inception dates) | (11/1/04) | (11/1/04) | (11/1/04) | (11/1/04) | (11/1/04) | (11/1/04) | ||||
| Before | After | Before | After | Net | Net | |||||
| sales | sales | Before | After | Before | After | sales | sales | asset | asset | |
| charge | charge | CDSC | CDSC | CDSC | CDSC | charge | charge | value | value | |
| 2020 Fund | ||||||||||
| Life of fund | 25.26% | 18.06% | 18.60% | 18.60% | 18.62% | 18.62% | 20.74% | 16.51% | 23.05% | 27.51% |
| Annual average | 3.15 | 2.31 | 2.38 | 2.38 | 2.38 | 2.38 | 2.63 | 2.13 | 2.90 | 3.41 |
| 5 years | –1.89 | –7.53 | –5.51 | –6.86 | –5.50 | –5.50 | –4.36 | –7.70 | –3.14 | –0.68 |
| Annual average | –0.38 | –1.55 | –1.13 | –1.41 | –1.13 | –1.13 | –0.89 | –1.59 | –0.64 | –0.14 |
| 3 years | 50.76 | 42.09 | 47.38 | 44.38 | 47.43 | 47.43 | 48.45 | 43.25 | 49.60 | 51.87 |
| Annual average | 14.66 | 12.42 | 13.80 | 13.02 | 13.81 | 13.81 | 14.08 | 12.73 | 14.37 | 14.95 |
| 1 year | 1.05 | –4.73 | 0.27 | –4.54 | 0.31 | –0.66 | 0.54 | –3.01 | 0.80 | 1.31 |
| 6 months | –0.91 | –6.59 | –1.30 | –6.04 | –1.27 | –2.22 | –1.21 | –4.69 | –1.04 | –0.80 |
| 2015 Fund | ||||||||||
| Life of fund | 21.34% | 14.36% | 14.92% | 14.92% | 14.88% | 14.88% | 17.02% | 12.93% | 19.19% | 23.55% |
| Annual average | 2.70 | 1.87 | 1.94 | 1.94 | 1.93 | 1.93 | 2.19 | 1.69 | 2.45 | 2.96 |
| 5 years | –0.80 | –6.51 | –4.47 | –5.88 | –4.51 | –4.51 | –3.28 | –6.66 | –2.11 | 0.44 |
| Annual average | –0.16 | –1.34 | –0.91 | –1.20 | –0.92 | –0.92 | –0.66 | –1.37 | –0.43 | 0.09 |
| 3 years | 41.39 | 33.26 | 38.22 | 35.22 | 38.15 | 38.15 | 39.25 | 34.37 | 40.26 | 42.43 |
| Annual average | 12.24 | 10.04 | 11.39 | 10.58 | 11.37 | 11.37 | 11.67 | 10.35 | 11.94 | 12.51 |
| 1 year | 0.87 | –4.91 | 0.10 | –4.68 | 0.08 | –0.87 | 0.36 | –3.13 | 0.64 | 1.13 |
| 6 months | –1.03 | –6.71 | –1.37 | –6.08 | –1.44 | –2.38 | –1.33 | –4.76 | –1.14 | –0.89 |
| Retirement Income Fund Lifestyle 1 | ||||||||||
| Life of fund | 19.10% | 14.33% | 12.80% | 12.80% | 12.90% | 12.90% | 15.03% | 11.29% | 16.94% | 21.26% |
| Annual average | 2.44 | 1.86 | 1.67 | 1.67 | 1.69 | 1.69 | 1.95 | 1.49 | 2.18 | 2.69 |
| 5 years | 5.80 | 1.57 | 1.91 | 0.25 | 1.94 | 1.94 | 3.33 | –0.03 | 4.45 | 7.10 |
| Annual average | 1.13 | 0.31 | 0.38 | 0.05 | 0.39 | 0.39 | 0.66 | –0.01 | 0.87 | 1.38 |
| 3 years | 38.78 | 33.23 | 35.71 | 32.71 | 35.71 | 35.71 | 36.92 | 32.47 | 37.72 | 39.82 |
| Annual average | 11.54 | 10.04 | 10.71 | 9.89 | 10.71 | 10.71 | 11.04 | 9.83 | 11.26 | 11.82 |
| 1 year | 0.72 | –3.31 | –0.04 | –4.97 | –0.05 | –1.03 | 0.37 | –2.89 | 0.42 | 0.96 |
| 6 months | –0.96 | –4.93 | –1.33 | –6.20 | –1.33 | –2.30 | –1.08 | –4.30 | –1.13 | –0.84 |
Current performance may be lower or higher than the quoted past performance, which cannot guarantee future results. After-sales-charge returns for class A and M shares reflect the deduction of the maximum 5.75% and 3.50% sales charge, respectively, levied at the time of purchase. The maximum sales charges for Retirement Income Fund Lifestyle 1 class A and M shares are 4.00% and 3.25%, respectively. Class B share returns after the contingent deferred sales charge (CDSC) reflect the applicable CDSC, which is 5% in the first year, declining over time to 1% in the sixth year, and is eliminated thereafter. Class C share returns after CDSC reflect a 1% CDSC for the first year that is eliminated thereafter. Class R and Y shares have no initial sales charge or CDSC.
For a portion of the periods, these funds had expense limitations, without which returns would have been lower.
Class B share performance does not reflect conversion to class A shares.
* The inception date of Putnam RetirementReady 2055 Fund is 11/30/10, for all share classes.
† The inception date of Putnam RetirementReady 2050 Fund is 5/2/05, for all share classes.
‡ Because no class R shares of the fund were outstanding on 12/20/05 and 12/21/05, class R performance for the period from 12/19/05 to 12/21/05 is based on class A performance, adjusted for the applicable sales charge and the higher operating expenses for class R shares.
13
Comparative index returns For periods ended 1/31/12
| Barclays Capital U.S. | ||
| S&P 500 Index | Aggregate Bond Index | |
| Life of fund* | 34.86% | 47.88% |
| Annual average | 4.21 | 5.54 |
| 5 years | 1.64 | 38.27 |
| Annual average | 0.33 | 6.70 |
| 3 years | 69.54 | 23.87 |
| Annual average | 19.24 | 7.40 |
| 1 year | 4.22 | 8.66 |
| 6 months | 2.71 | 4.25 |
Index results should be compared with fund performance before sales charge, before CDSC, or at net asset value.
* Life-of-fund period begins at 11/1/04, the inception date of all Putnam RetirementReady Funds with the exception of the 2050 and 2055 Funds (inceptions: 5/2/05 and 11/30/10, respectively).
Fund price and distribution information For the six-month period ended 1/31/12
| 2055 Fund | ||||||||
| Distributions | Class A | Class B | Class C | Class M | Class R | Class Y | ||
| Number | 1 | 1 | 1 | 1 | 1 | 1 | ||
| Income | $0.263 | $0.164 | $0.236 | $0.204 | $0.241 | $0.279 | ||
| Long-term capital gains | 0.080 | 0.080 | 0.080 | 0.080 | 0.080 | 0.080 | ||
| Short-term capital gains | 0.021 | 0.021 | 0.021 | 0.021 | 0.021 | 0.021 | ||
| Total | $0.364 | $0.265 | $0.337 | $0.305 | $0.342 | $0.380 | ||
| Before | After | Net | Net | Before | After | Net | Net | |
| sales | sales | asset | asset | sales | sales | asset | asset | |
| Share value | charge | charge | value | value | charge | charge | value | value |
| 7/31/11 | $10.09 | $10.71 | $10.05 | $10.05 | $10.06 | $10.42 | $10.08 | $10.11 |
| 1/31/12 | 9.44 | 10.02 | 9.46 | 9.39 | 9.45 | 9.79 | 9.44 | 9.45 |
| 2050 Fund | ||||||||
| Distributions | Class A | Class B | Class C | Class M | Class R | Class Y | ||
| Number | 1 | 1 | 1 | 1 | 1 | 1 | ||
| Income | $0.448 | $0.384 | $0.367 | $0.161 | $0.437 | $0.485 | ||
| Capital gains | — | — | — | — | — | — | ||
| Total | $0.448 | $0.384 | $0.367 | $0.161 | $0.437 | $0.485 | ||
| Before | After | Net | Net | Before | After | Net | Net | |
| sales | sales | asset | asset | sales | sales | asset | asset | |
| Share value | charge | charge | value | value | charge | charge | value | value |
| 7/31/11 | $12.86 | $13.64 | $12.76 | $12.68 | $12.74 | $13.20 | $12.72 | $12.91 |
| 1/31/12 | 12.20 | 12.94 | 12.11 | 12.06 | 12.35 | 12.80 | 12.05 | 12.22 |
14
Fund price and distribution information For the six-month period ended 1/31/12 cont.
| 2045 Fund | ||||||||
| Distributions | Class A | Class B | Class C | Class M | Class R | Class Y | ||
| Number | 1 | 1 | 1 | 1 | 1 | 1 | ||
| Income | $0.427 | $0.344 | $0.345 | $0.398 | $0.406 | $0.472 | ||
| Capital gains | — | — | — | — | — | — | ||
| Total | $0.427 | $0.344 | $0.345 | $0.398 | $0.406 | $0.472 | ||
| Before | After | Net | Net | Before | After | Net | Net | |
| sales | sales | asset | asset | sales | sales | asset | asset | |
| Share value | charge | charge | value | value | charge | charge | value | value |
| 7/31/11 | $14.37 | $15.25 | $13.32 | $13.42 | $14.08 | $14.59 | $14.68 | $16.77 |
| 1/31/12 | 13.70 | 14.54 | 12.71 | 12.80 | 13.41 | 13.90 | 14.01 | 16.04 |
| 2040 Fund | ||||||||
| Distributions | Class A | Class B | Class C | Class M | Class R | Class Y | ||
| Number | 1 | 1 | 1 | 1 | 1 | 1 | ||
| Income | $0.339 | $0.254 | $0.277 | $0.213 | $0.316 | $0.390 | ||
| Capital gains | — | — | — | — | — | — | ||
| Total | $0.339 | $0.254 | $0.277 | $0.213 | $0.316 | $0.390 | ||
| Before | After | Net | Net | Before | After | Net | Net | |
| sales | sales | asset | asset | sales | sales | asset | asset | |
| Share value | charge | charge | value | value | charge | charge | value | value |
| 7/31/11 | $15.59 | $16.54 | $14.56 | $14.49 | $14.77 | $15.31 | $15.95 | $17.91 |
| 1/31/12 | 14.98 | 15.89 | 14.01 | 13.92 | 14.27 | 14.79 | 15.35 | 17.24 |
| 2035 Fund | ||||||||
| Distributions | Class A | Class B | Class C | Class M | Class R | Class Y | ||
| Number | 1 | 1 | 1 | — | 1 | 1 | ||
| Income | $0.421 | $0.329 | $0.325 | — | $0.403 | $0.471 | ||
| Capital gains | — | — | — | — | — | — | ||
| Total | $0.421 | $0.329 | $0.325 | — | $0.403 | $0.471 | ||
| Before | After | Net | Net | Before | After | Net | Net | |
| sales | sales | asset | asset | sales | sales | asset | asset | |
| Share value | charge | charge | value | value | charge | charge | value | value |
| 7/31/11 | $16.01 | $16.99 | $14.89 | $14.91 | $15.14 | $15.69 | $15.45 | $18.35 |
| 1/31/12 | 15.30 | 16.23 | 14.23 | 14.25 | 14.84 | 15.38 | 14.75 | 17.56 |
| 2030 Fund | ||||||||
| Distributions | Class A | Class B | Class C | Class M | Class R | Class Y | ||
| Number | 1 | 1 | 1 | — | 1 | 1 | ||
| Income | $0.348 | $0.253 | $0.256 | — | $0.336 | $0.401 | ||
| Capital gains | — | — | — | — | — | — | ||
| Total | $0.348 | $0.253 | $0.256 | — | $0.336 | $0.401 | ||
| Before | After | Net | Net | Before | After | Net | Net | |
| sales | sales | asset | asset | sales | sales | asset | asset | |
| Share value | charge | charge | value | value | charge | charge | value | value |
| 7/31/11 | $16.22 | $17.21 | $15.47 | $15.50 | $15.52 | $16.08 | $15.43 | $18.31 |
| 1/31/12 | 15.58 | 16.53 | 14.89 | 14.92 | 15.22 | 15.77 | 14.80 | 17.60 |
15
Fund price and distribution information For the six-month period ended 1/31/12 cont.
| 2025 Fund | ||||||||
| Distributions | Class A | Class B | Class C | Class M | Class R | Class Y | ||
| Number | 1 | 1 | 1 | 1 | 1 | 1 | ||
| Income | $0.563 | $0.460 | $0.476 | $0.482 | $0.544 | $0.621 | ||
| Capital gains | — | — | — | — | — | — | ||
| Total | $0.563 | $0.460 | $0.476 | $0.482 | $0.544 | $0.621 | ||
| Before | After | Net | Net | Before | After | Net | Net | |
| sales | sales | asset | asset | sales | sales | asset | asset | |
| Share value | charge | charge | value | value | charge | charge | value | value |
| 7/31/11 | $17.36 | $18.42 | $16.31 | $16.35 | $16.54 | $17.14 | $16.32 | $17.45 |
| 1/31/12 | 16.56 | 17.57 | 15.58 | 15.60 | 15.80 | 16.37 | 15.54 | 16.61 |
| 2020 Fund | ||||||||
| Distributions | Class A | Class B | Class C | Class M | Class R | Class Y | ||
| Number | 1 | 1 | 1 | 1 | 1 | 1 | ||
| Income | $0.701 | $0.607 | $0.612 | $0.609 | $0.677 | $0.754 | ||
| Capital gains | — | — | — | — | — | — | ||
| Total | $0.701 | $0.607 | $0.612 | $0.609 | $0.677 | $0.754 | ||
| Before | After | Net | Net | Before | After | Net | Net | |
| sales | sales | asset | asset | sales | sales | asset | asset | |
| Share value | charge | charge | value | value | charge | charge | value | value |
| 7/31/11 | $16.45 | $17.45 | $15.90 | $15.95 | $16.14 | $16.73 | $15.89 | $18.19 |
| 1/31/12 | 15.58 | 16.53 | 15.07 | 15.12 | 15.32 | 15.88 | 15.03 | 17.27 |
| 2015 Fund | ||||||||
| Distributions | Class A | Class B | Class C | Class M | Class R | Class Y | ||
| Number | 1 | 1 | 1 | 1 | 1 | 1 | ||
| Income | $0.808 | $0.711 | $0.709 | $0.646 | $0.786 | $0.870 | ||
| Capital gains | — | — | — | — | — | — | ||
| Total | $0.808 | $0.711 | $0.709 | $0.646 | $0.786 | $0.870 | ||
| Before | After | Net | Net | Before | After | Net | Net | |
| sales | sales | asset | asset | sales | sales | asset | asset | |
| Share value | charge | charge | value | value | charge | charge | value | value |
| 7/31/11 | $16.93 | $17.96 | $16.45 | $16.44 | $16.63 | $17.23 | $16.40 | $16.99 |
| 1/31/12 | 15.93 | 16.90 | 15.50 | 15.48 | 15.75 | 16.32 | 15.41 | 15.95 |
16
Fund price and distribution information For the six-month period ended 1/31/12 cont.
| Retirement Income Fund Lifestyle 1 | ||||||||
| Distributions | Class A | Class B | Class C | Class M | Class R | Class Y | ||
| Number | 6 | 1 | 1 | 6 | 6 | 6 | ||
| Income | $0.249 | $0.210 | $0.209 | $0.229 | $0.231 | $0.268 | ||
| Capital gains | — | — | — | — | — | — | ||
| Total | $0.249 | $0.210 | $0.209 | $0.229 | $0.231 | $0.268 | ||
| Before | After | Net | Net | Before | After | Net | Net | |
| sales | sales | asset | asset | sales | sales | asset | asset | |
| Share value | charge | charge | value | value | charge | charge | value | value |
| 7/31/11 | $16.30 | $16.98 | $16.30 | $16.34 | $16.34 | $16.89 | $16.30 | $16.35 |
| 1/31/12 | 15.89 | 16.55 | 15.87 | 15.91 | 15.93 | 16.47 | 15.88 | 15.94 |
The classification of distributions, if any, is an estimate. Before-sales-charge share value and current dividend rate for class A and M shares, if applicable, do not take into account any sales charge levied at the time of purchase. After-sales-charge share value, current dividend rate, and current 30-day SEC yield, if applicable, are calculated assuming that the maximum sales charge (5.75% for class A shares and 3.50% for class M shares for all funds except Retirement Income Fund Lifestyle 1, for which the rates are 4.00% for class A shares and 3.25% for class M shares) was levied at the time of purchase. Final distribution information will appear on your year-end tax forms.
Fund performance as of most recent calendar quarter
Total return for periods ended 12/31/11
| Class A | Class B | Class C | Class M | Class R | Class Y | |||||
| (inception dates) | (11/1/04) | (11/1/04) | (11/1/04) | (11/1/04) | (11/1/04) | (11/1/04) | ||||
| Before | After | Before | After | Net | Net | |||||
| sales | sales | Before | After | Before | After | sales | sales | asset | asset | |
| charge | charge | CDSC | CDSC | CDSC | CDSC | charge | charge | value | value | |
| 2055 Fund* | ||||||||||
| Life of fund | 0.17% | –5.59% | –0.63% | –4.22% | –0.61% | –0.61% | –0.28% | –3.75% | –0.09% | 0.47% |
| Annual average | 0.16 | –5.17 | –0.58 | –3.90 | –0.56 | –0.56 | –0.26 | –3.47 | –0.08 | 0.43 |
| 1 year | –5.26 | –10.71 | –5.96 | –10.53 | –5.94 | –6.85 | –5.65 | –8.99 | –5.49 | –5.00 |
| 6 months | –9.59 | –14.80 | –9.90 | –14.28 | –9.88 | –10.75 | –9.78 | –12.92 | –9.71 | –9.51 |
| 2050 Fund† | ||||||||||
| Life of fund | 16.24% | 9.55% | 10.58% | 10.58% | 10.52% | 10.52% | 12.36% | 8.43% | 14.22% | 18.12% |
| Annual average | 2.28 | 1.38 | 1.52 | 1.52 | 1.51 | 1.51 | 1.76 | 1.22 | 2.01 | 2.53 |
| 5 years | –11.52 | –16.60 | –14.77 | –15.89 | –14.82 | –14.82 | –13.71 | –16.73 | –12.65 | –10.44 |
| Annual average | –2.42 | –3.57 | –3.15 | –3.40 | –3.16 | –3.16 | –2.91 | –3.60 | –2.67 | –2.18 |
| 3 years | 43.02 | 34.80 | 39.87 | 36.87 | 39.80 | 39.80 | 40.93 | 36.00 | 41.94 | 44.08 |
| Annual average | 12.67 | 10.47 | 11.83 | 11.03 | 11.82 | 11.82 | 12.12 | 10.79 | 12.38 | 12.95 |
| 1 year | –4.10 | –9.58 | –4.78 | –9.39 | –4.87 | –5.79 | –4.57 | –7.90 | –4.31 | –3.87 |
| 6 months | –8.48 | –13.73 | –8.80 | –13.22 | –8.84 | –9.72 | –8.68 | –11.86 | –8.58 | –8.39 |
17
Fund performance as of most recent calendar quarter
Total return for periods ended 12/31/11 cont.
| Class A | Class B | Class C | Class M | Class R | Class Y | |||||
| (inception dates) | (11/1/04) | (11/1/04) | (11/1/04) | (11/1/04) | (11/1/04) | (11/1/04) | ||||
| Before | After | Before | After | Net | Net | |||||
| sales | sales | Before | After | Before | After | sales | sales | asset | asset | |
| charge | charge | CDSC | CDSC | CDSC | CDSC | charge | charge | value | value | |
| 2045 Fund‡ | ||||||||||
| Life of fund | 21.95% | 14.94% | 15.64% | 15.64% | 15.62% | 15.62% | 17.75% | 13.63% | 19.90% | 24.18% |
| Annual average | 2.81 | 1.96 | 2.05 | 2.05 | 2.04 | 2.04 | 2.30 | 1.80 | 2.56 | 3.07 |
| 5 years | –10.66 | –15.80 | –13.90 | –14.87 | –13.90 | –13.90 | –12.81 | –15.86 | –11.73 | –9.53 |
| Annual average | –2.23 | –3.38 | –2.95 | –3.17 | –2.95 | –2.95 | –2.70 | –3.39 | –2.46 | –1.98 |
| 3 years | 43.14 | 34.92 | 40.04 | 37.04 | 40.00 | 40.00 | 41.05 | 36.12 | 42.12 | 44.25 |
| Annual average | 12.70 | 10.50 | 11.88 | 11.07 | 11.87 | 11.87 | 12.15 | 10.83 | 12.43 | 12.99 |
| 1 year | –4.03 | –9.53 | –4.73 | –9.37 | –4.69 | –5.62 | –4.46 | –7.81 | –4.23 | –3.74 |
| 6 months | –8.36 | –13.61 | –8.66 | –13.10 | –8.66 | –9.55 | –8.52 | –11.71 | –8.45 | –8.19 |
| 2040 Fund‡ | ||||||||||
| Life of fund | 23.09% | 16.01% | 16.61% | 16.61% | 16.73% | 16.73% | 18.72% | 14.57% | 20.95% | 25.29% |
| Annual average | 2.94 | 2.09 | 2.17 | 2.17 | 2.18 | 2.18 | 2.42 | 1.91 | 2.69 | 3.19 |
| 5 years | –9.20 | –14.42 | –12.58 | –13.67 | –12.52 | –12.52 | –11.47 | –14.57 | –10.34 | –8.07 |
| Annual average | –1.91 | –3.07 | –2.65 | –2.90 | –2.64 | –2.64 | –2.41 | –3.10 | –2.16 | –1.67 |
| 3 years | 43.99 | 35.71 | 40.72 | 37.71 | 40.79 | 40.79 | 41.78 | 36.82 | 42.90 | 45.06 |
| Annual average | 12.92 | 10.71 | 12.06 | 11.26 | 12.08 | 12.08 | 12.34 | 11.02 | 12.64 | 13.20 |
| 1 year | –3.90 | –9.45 | –4.68 | –9.36 | –4.61 | –5.55 | –4.36 | –7.69 | –4.15 | –3.68 |
| 6 months | –8.14 | –13.43 | –8.54 | –13.02 | –8.49 | –9.38 | –8.36 | –11.59 | –8.28 | –8.01 |
| 2035 Fund | ||||||||||
| Life of fund | 23.24% | 16.15% | 16.75% | 16.75% | 16.86% | 16.86% | 18.86% | 14.69% | 20.94% | 25.47% |
| Annual average | 2.96 | 2.11 | 2.18 | 2.18 | 2.20 | 2.20 | 2.44 | 1.93 | 2.69 | 3.21 |
| 5 years | –7.77 | –13.07 | –11.20 | –12.35 | –11.16 | –11.16 | –10.08 | –13.23 | –8.90 | –6.61 |
| Annual average | –1.60 | –2.76 | –2.35 | –2.60 | –2.34 | –2.34 | –2.10 | –2.80 | –1.85 | –1.36 |
| 3 years | 44.55 | 36.24 | 41.30 | 38.30 | 41.33 | 41.33 | 42.36 | 37.37 | 43.46 | 45.64 |
| Annual average | 13.07 | 10.86 | 12.21 | 11.41 | 12.22 | 12.22 | 12.49 | 11.16 | 12.78 | 13.35 |
| 1 year | –3.72 | –9.26 | –4.48 | –9.15 | –4.43 | –5.36 | –4.26 | –7.64 | –3.97 | –3.48 |
| 6 months | –7.81 | –13.09 | –8.20 | –12.68 | –8.15 | –9.05 | –8.06 | –11.29 | –7.94 | –7.67 |
| 2030 Fund | ||||||||||
| Life of fund | 23.87% | 16.75% | 17.39% | 17.39% | 17.32% | 17.32% | 19.47% | 15.29% | 21.65% | 26.09% |
| Annual average | 3.03 | 2.18 | 2.26 | 2.26 | 2.25 | 2.25 | 2.51 | 2.00 | 2.77 | 3.29 |
| 5 years | –6.06 | –11.47 | –9.53 | –10.75 | –9.56 | –9.56 | –8.42 | –11.62 | –7.24 | –4.89 |
| Annual average | –1.24 | –2.41 | –1.98 | –2.25 | –1.99 | –1.99 | –1.74 | –2.44 | –1.49 | –1.00 |
| 3 years | 44.97 | 36.63 | 41.77 | 38.77 | 41.68 | 41.68 | 42.81 | 37.81 | 43.88 | 46.10 |
| Annual average | 13.18 | 10.96 | 12.34 | 11.54 | 12.31 | 12.31 | 12.61 | 11.28 | 12.89 | 13.47 |
| 1 year | –3.12 | –8.68 | –3.82 | –8.55 | –3.86 | –4.81 | –3.57 | –6.95 | –3.36 | –2.81 |
| 6 months | –7.02 | –12.35 | –7.38 | –11.93 | –7.41 | –8.32 | –7.25 | –10.49 | –7.13 | –6.90 |
18
Fund performance as of most recent calendar quarter
Total return for periods ended 12/31/11 cont.
| Class A | Class B | Class C | Class M | Class R | Class Y | |||||
| (inception dates) | (11/1/04) | (11/1/04) | (11/1/04) | (11/1/04) | (11/1/04) | (11/1/04) | ||||
| Before | After | Before | After | Net | Net | |||||
| sales | sales | Before | After | Before | After | sales | sales | asset | asset | |
| charge | charge | CDSC | CDSC | CDSC | CDSC | charge | charge | value | value | |
| 2025 Fund | ||||||||||
| Life of fund | 24.07% | 16.93% | 17.59% | 17.59% | 17.59% | 17.59% | 19.70% | 15.51% | 21.89% | 26.34% |
| Annual average | 3.05 | 2.20 | 2.28 | 2.28 | 2.28 | 2.28 | 2.54 | 2.03 | 2.80 | 3.31 |
| 5 years | –4.57 | –10.06 | –8.08 | –9.33 | –8.05 | –8.05 | –6.93 | –10.19 | –5.74 | –3.34 |
| Annual average | –0.93 | –2.10 | –1.67 | –1.94 | –1.66 | –1.66 | –1.43 | –2.13 | –1.18 | –0.68 |
| 3 years | 43.89 | 35.62 | 40.70 | 37.70 | 40.74 | 40.74 | 41.71 | 36.75 | 42.83 | 44.99 |
| Annual average | 12.90 | 10.69 | 12.06 | 11.25 | 12.07 | 12.07 | 12.32 | 11.00 | 12.62 | 13.18 |
| 1 year | –1.77 | –7.42 | –2.46 | –7.19 | –2.48 | –3.42 | –2.23 | –5.62 | –1.99 | –1.48 |
| 6 months | –5.52 | –10.96 | –5.83 | –10.40 | –5.84 | –6.75 | –5.74 | –9.06 | –5.62 | –5.34 |
| 2020 Fund | ||||||||||
| Life of fund | 21.88% | 14.88% | 15.53% | 15.53% | 15.56% | 15.56% | 17.59% | 13.47% | 19.78% | 24.11% |
| Annual average | 2.80 | 1.95 | 2.03 | 2.03 | 2.04 | 2.04 | 2.28 | 1.78 | 2.55 | 3.06 |
| 5 years | –3.13 | –8.71 | –6.67 | –8.00 | –6.65 | –6.65 | –5.54 | –8.84 | –4.35 | –1.90 |
| Annual average | –0.63 | –1.81 | –1.37 | –1.65 | –1.37 | –1.37 | –1.13 | –1.83 | –0.89 | –0.38 |
| 3 years | 41.34 | 33.21 | 38.22 | 35.22 | 38.26 | 38.26 | 39.21 | 34.34 | 40.27 | 42.45 |
| Annual average | 12.22 | 10.03 | 11.39 | 10.58 | 11.40 | 11.40 | 11.66 | 10.34 | 11.94 | 12.52 |
| 1 year | –0.75 | –6.43 | –1.44 | –6.17 | –1.40 | –2.35 | –1.22 | –4.67 | –0.99 | –0.43 |
| 6 months | –4.17 | –9.68 | –4.52 | –9.10 | –4.53 | –5.45 | –4.44 | –7.79 | –4.33 | –4.02 |
| 2015 Fund | ||||||||||
| Life of fund | 18.75% | 11.92% | 12.55% | 12.55% | 12.50% | 12.50% | 14.65% | 10.63% | 16.72% | 20.92% |
| Annual average | 2.43 | 1.58 | 1.66 | 1.66 | 1.66 | 1.66 | 1.92 | 1.42 | 2.18 | 2.68 |
| 5 years | –1.77 | –7.42 | –5.39 | –6.79 | –5.44 | –5.44 | –4.16 | –7.51 | –3.03 | –0.52 |
| Annual average | –0.36 | –1.53 | –1.10 | –1.40 | –1.11 | –1.11 | –0.85 | –1.55 | –0.61 | –0.10 |
| 3 years | 35.73 | 27.92 | 32.69 | 29.69 | 32.62 | 32.62 | 33.74 | 29.06 | 34.74 | 36.78 |
| Annual average | 10.72 | 8.55 | 9.89 | 9.05 | 9.87 | 9.87 | 10.18 | 8.88 | 10.45 | 11.00 |
| 1 year | –0.50 | –6.25 | –1.24 | –5.96 | –1.25 | –2.20 | –1.01 | –4.48 | –0.71 | –0.24 |
| 6 months | –3.49 | –9.05 | –3.87 | –8.46 | –3.89 | –4.80 | –3.74 | –7.13 | –3.61 | –3.34 |
19
Fund performance as of most recent calendar quarter
Total return for periods ended 12/31/11 cont.
| Class A | Class B | Class C | Class M | Class R | Class Y | |||||
| (inception dates) | (11/1/04) | (11/1/04) | (11/1/04) | (11/1/04) | (11/1/04) | (11/1/04) | ||||
| Retirement Income Fund Lifestyle 1 | ||||||||||
| Life of fund | 17.11% | 12.42% | 10.95% | 10.95% | 11.05% | 11.05% | 13.13% | 9.45% | 15.00% | 19.21% |
| Annual average | 2.23 | 1.65 | 1.46 | 1.46 | 1.47 | 1.47 | 1.73 | 1.27 | 1.97 | 2.48 |
| 5 years | 4.78 | 0.59 | 0.89 | –0.75 | 0.95 | 0.95 | 2.31 | –1.01 | 3.43 | 6.08 |
| Annual average | 0.94 | 0.12 | 0.18 | –0.15 | 0.19 | 0.19 | 0.46 | –0.20 | 0.68 | 1.19 |
| 3 years | 34.96 | 29.56 | 31.95 | 28.95 | 31.96 | 31.96 | 33.14 | 28.81 | 33.93 | 36.00 |
| Annual average | 10.51 | 9.02 | 9.68 | 8.84 | 9.69 | 9.69 | 10.01 | 8.81 | 10.23 | 10.79 |
| 1 year | –0.39 | –4.40 | –1.16 | –6.03 | –1.10 | –2.08 | –0.75 | –3.99 | –0.64 | –0.09 |
| 6 months | –2.77 | –6.65 | –3.18 | –7.96 | –3.18 | –4.14 | –2.88 | –6.04 | –2.94 | –2.64 |
* The inception date of Putnam RetirementReady 2055 Fund is 11/30/10, for all share classes.
† The inception date of Putnam RetirementReady 2050 Fund is 5/2/05, for all share classes.
‡ Because no class R shares of the fund were outstanding on 12/20/05 and 12/21/05, class R performance for the period from 12/19/05 to 12/21/05 is based on class A performance, adjusted for the applicable sales charge and the higher operating expenses for class R shares.
Your fund’s expenses
As a mutual fund investor, you pay ongoing expenses, such as management fees, distribution fees (12b-1 fees), and other expenses. In the most recent six-month period, your fund’s expenses were limited; had expenses not been limited, they would have been higher. Using the following information, you can estimate how these expenses affect your investment and compare them with the expenses of other funds. You may also pay one-time transaction expenses, including sales charges (loads) and redemption fees, which are not shown in this section and would have resulted in higher total expenses. For more information, see your fund’s prospectus or talk to your financial representative.
Expense ratios
| Class A | Class B | Class C | Class M | Class R | Class Y | |
| Putnam RetirementReady 2055 Fund | ||||||
| Estimated net expenses for the fiscal year | ||||||
| ended 7/31/11* | 1.28% | 2.03% | 2.03% | 1.78% | 1.53% | 1.03% |
| Your fund’s estimated total annual operating | ||||||
| expenses for the fiscal year ended 7/31/11 | 35.66% | 36.41% | 36.41% | 36.16% | 35.91% | 35.41% |
| Your fund’s annualized expense ratio for the | ||||||
| six-month period ended 1/31/12† | 0.25% | 1.00% | 1.00% | 0.75% | 0.50% | 0.00% |
| Putnam RetirementReady 2050 Fund | ||||||
| Net expenses for the fiscal year ended 7/31/11* | 1.28% | 2.03% | 2.03% | 1.78% | 1.53% | 1.03% |
| Your fund’s total annual operating expenses for | ||||||
| the fiscal year ended 7/31/11 | 1.50% | 2.25% | 2.25% | 2.00% | 1.75% | 1.25% |
| Your fund’s annualized expense ratio for the | ||||||
| six-month period ended 1/31/12† | 0.25% | 1.00% | 1.00% | 0.75% | 0.50% | 0.00% |
20
Expense ratios cont.
| Class A | Class B | Class C | Class M | Class R | Class Y | |
| Putnam RetirementReady 2045 Fund | ||||||
| Net expenses for the fiscal year ended 7/31/11* | 1.25% | 2.00% | 2.00% | 1.75% | 1.50% | 1.00% |
| Your fund’s total annual operating expenses for | ||||||
| the fiscal year ended 7/31/11 | 1.43% | 2.18% | 2.18% | 1.93% | 1.68% | 1.18% |
| Your fund’s annualized expense ratio for the | ||||||
| six-month period ended 1/31/12† | 0.25% | 1.00% | 1.00% | 0.75% | 0.50% | 0.00% |
| Putnam RetirementReady 2040 Fund | ||||||
| Net expenses for the fiscal year ended 7/31/11* | 1.22% | 1.97% | 1.97% | 1.72% | 1.47% | 0.97% |
| Your fund’s total annual operating expenses for | ||||||
| the fiscal year ended 7/31/11 | 1.39% | 2.14% | 2.14% | 1.89% | 1.64% | 1.14% |
| Your fund’s annualized expense ratio for the | ||||||
| six-month period ended 1/31/12† | 0.25% | 1.00% | 1.00% | 0.75% | 0.50% | 0.00% |
| Putnam RetirementReady 2035 Fund | ||||||
| Net expenses for the fiscal year ended 7/31/11* | 1.17% | 1.92% | 1.92% | 1.67% | 1.42% | 0.92% |
| Your fund’s total annual operating expenses for | ||||||
| the fiscal year ended 7/31/11 | 1.25% | 2.00% | 2.00% | 1.75% | 1.50% | 1.00% |
| Your fund’s annualized expense ratio for the | ||||||
| six-month period ended 1/31/12† | 0.25% | 1.00% | 1.00% | 0.75% | 0.50% | 0.00% |
| Putnam RetirementReady 2030 Fund | ||||||
| Net expenses for the fiscal year ended 7/31/11* | 1.13% | 1.88% | 1.88% | 1.63% | 1.38% | 0.88% |
| Your fund’s total annual operating expenses for | ||||||
| the fiscal year ended 7/31/11 | 1.21% | 1.96% | 1.96% | 1.71% | 1.46% | 0.96% |
| Your fund’s annualized expense ratio for the | ||||||
| six-month period ended 1/31/12† | 0.25% | 1.00% | 1.00% | 0.75% | 0.50% | 0.00% |
| Putnam RetirementReady 2025 Fund | ||||||
| Net expenses for the fiscal year ended 7/31/11* | 1.10% | 1.85% | 1.85% | 1.60% | 1.35% | 0.85% |
| Your fund’s total annual operating expenses for | ||||||
| the fiscal year ended 7/31/11 | 1.18% | 1.93% | 1.93% | 1.68% | 1.43% | 0.93% |
| Your fund’s annualized expense ratio for the | ||||||
| six-month period ended 1/31/12† | 0.25% | 1.00% | 1.00% | 0.75% | 0.50% | 0.00% |
| Putnam RetirementReady 2020 Fund | ||||||
| Net expenses for the fiscal year ended 7/31/11* | 1.06% | 1.81% | 1.81% | 1.56% | 1.31% | 0.81% |
| Your fund’s total annual operating expenses for | ||||||
| the fiscal year ended 7/31/11 | 1.14% | 1.89% | 1.89% | 1.64% | 1.39% | 0.89% |
| Your fund’s annualized expense ratio for the | ||||||
| six-month period ended 1/31/12† | 0.25% | 1.00% | 1.00% | 0.75% | 0.50% | 0.00% |
| Putnam RetirementReady 2015 Fund | ||||||
| Net expenses for the fiscal year ended 7/31/11* | 1.03% | 1.78% | 1.78% | 1.53% | 1.28% | 0.78% |
| Your fund’s total annual operating expenses for | ||||||
| the fiscal year ended 7/31/11 | 1.10% | 1.85% | 1.85% | 1.60% | 1.35% | 0.85% |
| Your fund’s annualized expense ratio for the | ||||||
| six-month period ended 1/31/12† | 0.25% | 1.00% | 1.00% | 0.75% | 0.50% | 0.00% |
21
Expense ratios cont.
| Class A | Class B | Class C | Class M | Class R | Class Y | |
| Putnam Retirement Income Fund Lifestyle 1 | ||||||
| Net expenses for the fiscal year ended 7/31/11* | 0.99% | 1.74% | 1.74% | 1.24% | 1.24% | 0.74% |
| Your fund’s total annual operating expenses for | ||||||
| the fiscal year ended 7/31/11 | 1.06% | 1.81% | 1.81% | 1.31% | 1.31% | 0.81% |
| Your fund’s annualized expense ratio for the | ||||||
| six-month period ended 1/31/12† | 0.25% | 1.00% | 1.00% | 0.50% | 0.50% | 0.00% |
* Reflects Putnam Management’s contractual obligation to limit expenses through 11/30/12.
† Excludes the expense ratios of the underlying Putnam mutual funds.
Fiscal year ended 7/31/11 expense information in this table differs from that shown in the financial highlights of this report because it includes fees and expenses of the underlying Putnam funds in which the fund invests. Expenses are shown as a percentage of average net assets.
Expenses per $1,000
The first table in this section shows the expenses you would have paid on a $1,000 investment in each of the RetirementReady Funds from August 1, 2011, to January 31, 2012. It also shows how much a $1,000 investment would be worth at the close of the period, assuming actual returns and expenses. You may use the information in this table to estimate the expenses that you paid over the period. Simply divide your account value by $1,000, and then multiply the result by the number in the first line (“Expenses paid per $1,000”) for the class of shares you own.
| Class A | Class B | Class C | Class M | Class R | Class Y | |
| Putnam RetirementReady 2055 Fund | ||||||
| Expenses paid per $1,000*† | $1.24 | $4.95 | $4.95 | $3.72 | $2.48 | $— |
| Ending value (after expenses) | $973.50 | $969.00 | $969.50 | $971.20 | $972.20 | $974.20 |
| Putnam RetirementReady 2050 Fund | ||||||
| Expenses paid per $1,000*† | $1.25 | $4.98 | $4.98 | $3.74 | $2.49 | $— |
| Ending value (after expenses) | $985.30 | $980.70 | $981.50 | $982.70 | $983.40 | $986.10 |
| Putnam RetirementReady 2045 Fund | ||||||
| Expenses paid per $1,000*† | $1.25 | $4.98 | $4.98 | $3.74 | $2.49 | $— |
| Ending value (after expenses) | $984.60 | $981.30 | $980.80 | $982.10 | $983.40 | $986.00 |
| Putnam RetirementReady 2040 Fund | ||||||
| Expenses paid per $1,000*† | $1.25 | $4.98 | $4.98 | $3.74 | $2.49 | $— |
| Ending value (after expenses) | $983.70 | $980.50 | $980.70 | $981.30 | $983.20 | $985.50 |
| Putnam RetirementReady 2035 Fund | ||||||
| Expenses paid per $1,000*† | $1.25 | $4.97 | $4.97 | $3.73 | $2.49 | $— |
| Ending value (after expenses) | $983.20 | $978.80 | $978.50 | $980.20 | $982.00 | $983.80 |
| Putnam RetirementReady 2030 Fund | ||||||
| Expenses paid per $1,000*† | $1.25 | $4.98 | $4.98 | $3.73 | $2.49 | $— |
| Ending value (after expenses) | $982.90 | $979.50 | $979.80 | $980.70 | $981.80 | $984.00 |
| Putnam RetirementReady 2025 Fund | ||||||
| Expenses paid per $1,000*† | $1.25 | $4.99 | $4.99 | $3.74 | $2.50 | $— |
| Ending value (after expenses) | $987.40 | $984.40 | $984.20 | $985.40 | $986.60 | $988.70 |
22
Expenses per $1,000 cont.
| Putnam RetirementReady 2020 Fund | ||||||
| Expenses paid per $1,000*† | $1.25 | $4.99 | $5.00 | $3.75 | $2.50 | $— |
| Ending value (after expenses) | $990.90 | $987.00 | $987.30 | $987.90 | $989.60 | $992.00 |
| Putnam RetirementReady 2015 Fund | ||||||
| Expenses paid per $1,000*† | $1.25 | $4.99 | $4.99 | $3.75 | $2.50 | $— |
| Ending value (after expenses) | $989.70 | $986.30 | $985.60 | $986.70 | $988.60 | $991.10 |
| Putnam Retirement Income Fund Lifestyle 1 | ||||||
| Expenses paid per $1,000*† | $1.25 | $4.99 | $4.99 | $2.50 | $2.50 | $— |
| Ending value (after expenses) | $990.40 | $986.70 | $986.70 | $989.20 | $988.70 | $991.60 |
* Expenses for each share class are calculated using the fund’s annualized expense ratio for each class, which represents the ongoing expenses as a percentage of net assets for the six months ended 1/31/12. The expense ratio may differ for each share class.
† Expenses are calculated by multiplying the expense ratio by the average account value for the period; then multiplying the result by the number of days in the period; and then dividing that result by the number of days in the year.
Compare expenses using the SEC’s method
The Securities and Exchange Commission (SEC) has established guidelines to help investors assess fund expenses. Per these guidelines, the following table shows your fund’s expenses based on a $1,000 investment, assuming a hypothetical 5% annualized return. You can use this information to compare the ongoing expenses (but not transaction expenses or total costs) of investing in the fund with those of other funds. All mutual fund shareholder reports will provide this information to help you make this comparison. Please note that you cannot use this information to estimate your actual ending account balance and expenses paid during the period.
| Class A | Class B | Class C | Class M | Class R | Class Y | |
| Putnam RetirementReady | ||||||
| 2055 Fund, 2050 Fund, 2045 Fund | ||||||
| 2040 Fund, 2035 Fund, 2030 Fund | ||||||
| 2025 Fund, 2020 Fund, 2015 Fund | ||||||
| Expenses paid per $1,000*† | $1.27 | $5.08 | $5.08 | $3.81 | $2.54 | $— |
| Ending value (after expenses) | $1,023.88 | $1,020.11 | $1,020.11 | $1,021.37 | $1,022.62 | $1,025.14 |
| Putnam Retirement Income Fund Lifestyle 1 | ||||||
| Expenses paid per $1,000*† | $1.27 | $5.08 | $5.08 | $2.54 | $2.54 | $— |
| Ending value (after expenses) | $1,023.88 | $1,020.11 | $1,020.11 | $1,022.62 | $1,022.62 | $1,025.14 |
* Expenses for each share class are calculated using the fund’s annualized expense ratio for each class, which represents the ongoing expenses as a percentage of net assets for the six months ended 1/31/12. The expense ratio may differ for each share class.
† Expenses are calculated by multiplying the expense ratio by the average account value for the period; then multiplying the result by the number of days in the period; and then dividing that result by the number of days in the year.
| 23 |
Terms and definitions
Important terms
Total return shows how the value of the fund’s shares changed over time, assuming you held the shares through the entire period and reinvested all distributions in the fund.
Before sales charge, or net asset value, is the price, or value, of one share of a mutual fund, without a sales charge. Before-sales-charge figures fluctuate with market conditions, and are calculated by dividing the net assets of each class of shares by the number of outstanding shares in the class.
After sales charge is the price of a mutual fund share plus the maximum sales charge levied at the time of purchase. After-sales-charge performance figures shown here assume the 5.75% maximum sales charge for class A shares and 3.50% for class M shares (4.00% for class A shares and 3.50% for class M shares of Retirement Income Fund Lifestyle 1).
Contingent deferred sales charge (CDSC) is generally a charge applied at the time of the redemption of class B or C shares and assumes redemption at the end of the period. Your fund’s class B CDSC declines over time from a 5% maximum during the first year to 1% during the sixth year. After the sixth year, the CDSC no longer applies. The CDSC for class C shares is 1% for one year after purchase.
Share classes
Class A shares are generally subject to an initial sales charge and no CDSC (except on certain redemptions of shares bought without an initial sales charge).
Class B shares are not subject to an initial sales charge. They may be subject to a CDSC.
Class C shares are not subject to an initial sales charge and are subject to a CDSC only if the shares are redeemed during the first year.
Class M shares have a lower initial sales charge and a higher 12b-1 fee than class A shares and no CDSC (except on certain redemptions of shares bought without an initial sales charge).
Class R shares are not subject to an initial sales charge or CDSC and are available only to certain defined contribution plans.
Class Y shares are not subject to an initial sales charge or CDSC, and carry no 12b-1 fee. They are generally only available to corporate and institutional clients and clients in other approved programs.
Comparative indexes
Barclays Capital U.S. Aggregate Bond Index is an unmanaged index of U.S. investment-grade fixed-income securities.
BofA (Bank of America) Merrill Lynch U.S. 3-Month Treasury Bill Index is an unmanaged index that seeks to measure the performance of U.S. Treasury bills available in the marketplace.
MSCI EAFE Index (ND) is an unmanaged index of equity securities from developed countries in Western Europe, the Far East, and Australasia.
S&P 500 Index is an unmanaged index of common stock performance.
Indexes assume reinvestment of all distributions and do not account for fees. Securities and performance of a fund and an index will differ. You cannot invest directly in an index.
24
Other information for shareholders
Important notice regarding delivery of shareholder documents
In accordance with Securities and Exchange Commission (SEC) regulations, Putnam sends a single copy of annual and semiannual shareholder reports, prospectuses, and proxy statements to Putnam shareholders who share the same address, unless a shareholder requests otherwise. If you prefer to receive your own copy of these documents, please call Putnam at 1-800-225-1581, and Putnam will begin sending individual copies within 30 days.
Proxy voting
Putnam is committed to managing our mutual funds in the best interests of our shareholders. The Putnam funds’ proxy voting guidelines and procedures, as well as information regarding how your fund voted proxies relating to portfolio securities during the 12-month period ended June 30, 2011, are available in the Individual Investors section of putnam.com, and on the SEC’s website, www.sec.gov. If you have questions about finding forms on the SEC’s website, you may call the SEC at 1-800-SEC-0330. You may also obtain the Putnam funds’ proxy voting guidelines and procedures at no charge by calling Putnam’s Shareholder Services at 1-800-225-1581.
Fund portfolio holdings
The funds will file a complete schedule of their portfolio holdings with the SEC for the first and third quarters of each fiscal year on Form N-Q. Shareholders may obtain the funds’ Forms N-Q on the SEC’s website at www.sec.gov. In addition, the funds’ Forms N-Q may be reviewed and copied at the SEC’s Public Reference Room in Washington, D.C. You may call the SEC at 1-800-SEC-0330 for information about the SEC’s website or the operation of the Public Reference Room.
Trustee and employee fund ownership
Putnam employees and members of the Board of Trustees place their faith, confidence, and, most importantly, investment dollars in Putnam mutual funds. As of January 31, 2012, Putnam employees had approximately $325,000,000 and the Trustees had approximately $75,000,000 invested in Putnam mutual funds. These amounts include investments by the Trustees’ and employees’ immediate family members as well as investments through retirement and deferred compensation plans.
25
Financial statements
A guide to financial statements
These sections of the report, as well as the accompanying Notes, constitute the funds’ financial statements.
The fund’s portfolio lists all the funds’ investments and their values as of the last day of the reporting period. Holdings are organized by asset type and industry sector, country, or state to show areas of concentration and diversification.
Statement of assets and liabilities shows how each fund’s net assets and share price are determined. All investment and non-investment assets are added together. Any unpaid expenses and other liabilities are subtracted from this total. The result is divided by the number of shares to determine the net asset value per share, which is calculated separately for each class of shares. (For funds with preferred shares, the amount subtracted from total assets includes the liquidation preference of preferred shares.)
Statement of operations shows each fund’s net investment gain or loss. This is done by first adding up a fund’s earnings — from dividends and interest income — and subtracting its operating expenses to determine net investment income (or loss). Then, any net gain or loss the fund realized on the sales of its holdings — as well as any unrealized gains or losses over the period — is added to or subtracted from the net investment result to determine the fund’s net gain or loss for the fiscal period.
Statement of changes in net assets shows how each fund’s net assets were affected by the fund’s net investment gain or loss, by distributions to shareholders, and by changes in the number of the fund’s shares. It lists distributions and their sources (net investment income or realized capital gains) over the current reporting period and the most recent fiscal year-end. The distributions listed here may not match the sources listed in the Statement of operations because the distributions are determined on a tax basis and may be paid in a different period from the one in which they were earned. Dividend sources are estimated at the time of declaration. Actual results may vary. Any non-taxable return of capital cannot be determined until final tax calculations are completed after the end of the fund’s fiscal year.
Financial highlights provide an overview of each fund’s investment results, per-share distributions, expense ratios, net investment income ratios, and portfolio turnover in one summary table, reflecting the five most recent reporting periods. In a semiannual report, the highlights table also includes the current reporting period.
26
The funds’ portfolios 1/31/12 (Unaudited)
| Putnam RetirementReady 2055 Fund | Shares | Value |
| Absolute Return Funds (9.8%)* | ||
| Putnam Absolute Return 100 Fund (Class Y) | 226 | $2,262 |
| Putnam Absolute Return 300 Fund (Class Y) | — | — |
| Putnam Absolute Return 500 Fund (Class Y) | 935 | 10,019 |
| Putnam Absolute Return 700 Fund (Class Y) | 3,101 | 34,144 |
| Total Absolute Return Funds (cost $46,583) | $46,425 | |
| Asset Allocation Funds (89.7%)* | ||
| Putnam Dynamic Asset Allocation Balanced Fund (Class Y) | — | $— |
| Putnam Dynamic Asset Allocation Conservative Fund (Class Y) | — | — |
| Putnam Dynamic Asset Allocation Equity Fund (Class Y) | 33,701 | 348,127 |
| Putnam Dynamic Asset Allocation Growth Fund (Class Y) | 6,069 | 75,735 |
| Total Asset Allocation Funds (cost $416,872) | $423,862 | |
| Fixed Income Funds (0.5%)* | ||
| Putnam Money Market Fund (Class A) | 2,128 | $2,128 |
| Total Fixed Income Funds (cost $2,128) | $2,128 | |
| Total Investments (cost $465,583) | $472,415 | |
* Percentages indicated are based on net assets of $472,309
| Putnam RetirementReady 2050 Fund | Shares | Value |
| Absolute Return Funds (10.0%)* | ||
| Putnam Absolute Return 100 Fund (Class Y) | 4,438 | $44,378 |
| Putnam Absolute Return 300 Fund (Class Y) | — | — |
| Putnam Absolute Return 500 Fund (Class Y) | 13,118 | 140,499 |
| Putnam Absolute Return 700 Fund (Class Y) | 43,487 | 478,797 |
| Total Absolute Return Funds (cost $681,103) | $663,674 | |
| Asset Allocation Funds (89.6%)* | ||
| Putnam Dynamic Asset Allocation Balanced Fund (Class Y) | — | $— |
| Putnam Dynamic Asset Allocation Conservative Fund (Class Y) | — | — |
| Putnam Dynamic Asset Allocation Equity Fund (Class Y) | 460,238 | 4,754,259 |
| Putnam Dynamic Asset Allocation Growth Fund (Class Y) | 96,759 | 1,207,558 |
| Total Asset Allocation Funds (cost $6,289,489) | $5,961,817 | |
| Fixed Income Funds (0.4%)* | ||
| Putnam Money Market Fund (Class A) | 28,244 | $28,244 |
| Total Fixed Income Funds (cost $28,244) | $28,244 | |
| Total Investments (cost $6,998,836) | $6,653,735 | |
* Percentages indicated are based on net assets of $6,652,285
27
The funds’ portfolios 1/31/12 (Unaudited) cont.
| Putnam RetirementReady 2045 Fund | Shares | Value |
| Absolute Return Funds (10.6%)* | ||
| Putnam Absolute Return 100 Fund (Class Y) | 12,957 | $129,573 |
| Putnam Absolute Return 300 Fund (Class Y) | — | — |
| Putnam Absolute Return 500 Fund (Class Y) | 20,625 | 220,890 |
| Putnam Absolute Return 700 Fund (Class Y) | 68,373 | 752,785 |
| Total Absolute Return Funds (cost $1,131,948) | $1,103,248 | |
| Asset Allocation Funds (89.0%)* | ||
| Putnam Dynamic Asset Allocation Balanced Fund (Class Y) | — | $— |
| Putnam Dynamic Asset Allocation Conservative Fund (Class Y) | — | — |
| Putnam Dynamic Asset Allocation Equity Fund (Class Y) | 566,607 | 5,853,048 |
| Putnam Dynamic Asset Allocation Growth Fund (Class Y) | 276,498 | 3,450,691 |
| Total Asset Allocation Funds (cost $9,688,617) | $9,303,739 | |
| Fixed Income Funds (0.4%)* | ||
| Putnam Money Market Fund (Class A) | 44,057 | $44,057 |
| Total Fixed Income Funds (cost $44,057) | $44,057 | |
| Total Investments (cost $10,864,622) | $10,451,044 | |
* Percentages indicated are based on net assets of $10,448,957
| Putnam RetirementReady 2040 Fund | Shares | Value |
| Absolute Return Funds (11.4%)* | ||
| Putnam Absolute Return 100 Fund (Class Y) | 30,710 | $307,096 |
| Putnam Absolute Return 300 Fund (Class Y) | — | — |
| Putnam Absolute Return 500 Fund (Class Y) | 28,886 | 309,367 |
| Putnam Absolute Return 700 Fund (Class Y) | 95,760 | 1,054,314 |
| Total Absolute Return Funds (cost $1,714,971) | $1,670,777 | |
| Asset Allocation Funds (88.2%)* | ||
| Putnam Dynamic Asset Allocation Balanced Fund (Class Y) | — | $— |
| Putnam Dynamic Asset Allocation Conservative Fund (Class Y) | — | — |
| Putnam Dynamic Asset Allocation Equity Fund (Class Y) | 531,126 | 5,486,532 |
| Putnam Dynamic Asset Allocation Growth Fund (Class Y) | 593,415 | 7,405,823 |
| Total Asset Allocation Funds (cost $13,089,848) | $12,892,355 | |
| Fixed Income Funds (0.4%)* | ||
| Putnam Money Market Fund (Class A) | 61,036 | $61,036 |
| Total Fixed Income Funds (cost $61,036) | $61,036 | |
| Total Investments (cost $14,865,855) | $14,624,168 | |
* Percentages indicated are based on net assets of $14,620,965
28
The funds’ portfolios 1/31/12 (Unaudited) cont.
| Putnam RetirementReady 2035 Fund | Shares | Value |
| Absolute Return Funds (14.5%)* | ||
| Putnam Absolute Return 100 Fund (Class Y) | 55,278 | $552,775 |
| Putnam Absolute Return 300 Fund (Class Y) | 4,340 | 44,660 |
| Putnam Absolute Return 500 Fund (Class Y) | 79,028 | 846,386 |
| Putnam Absolute Return 700 Fund (Class Y) | 171,895 | 1,892,562 |
| Total Absolute Return Funds (cost $3,418,210) | $3,336,383 | |
| Asset Allocation Funds (84.2%)* | ||
| Putnam Dynamic Asset Allocation Balanced Fund (Class Y) | 39,165 | $436,296 |
| Putnam Dynamic Asset Allocation Conservative Fund (Class Y) | — | — |
| Putnam Dynamic Asset Allocation Equity Fund (Class Y) | 307,481 | 3,176,278 |
| Putnam Dynamic Asset Allocation Growth Fund (Class Y) | 1,267,858 | 15,822,867 |
| Total Asset Allocation Funds (cost $19,095,210) | $19,435,441 | |
| Fixed Income Funds (1.4%)* | ||
| Putnam Money Market Fund (Class A) | 317,322 | $317,322 |
| Total Fixed Income Funds (cost $317,322) | $317,322 | |
| Total Investments (cost $22,830,742) | $23,089,146 | |
* Percentages indicated are based on net assets of $23,084,431
| Putnam RetirementReady 2030 Fund | Shares | Value |
| Absolute Return Funds (20.2%)* | ||
| Putnam Absolute Return 100 Fund (Class Y) | 84,035 | $840,352 |
| Putnam Absolute Return 300 Fund (Class Y) | 50,068 | 515,200 |
| Putnam Absolute Return 500 Fund (Class Y) | 146,779 | 1,572,006 |
| Putnam Absolute Return 700 Fund (Class Y) | 304,676 | 3,354,488 |
| Total Absolute Return Funds (cost $6,448,118) | $6,282,046 | |
| Asset Allocation Funds (77.2%)* | ||
| Putnam Dynamic Asset Allocation Balanced Fund (Class Y) | 441,877 | $4,922,510 |
| Putnam Dynamic Asset Allocation Conservative Fund (Class Y) | — | — |
| Putnam Dynamic Asset Allocation Equity Fund (Class Y) | — | — |
| Putnam Dynamic Asset Allocation Growth Fund (Class Y) | 1,532,698 | 19,128,074 |
| Total Asset Allocation Funds (cost $23,151,871) | $24,050,584 | |
| Fixed Income Funds (2.6%)* | ||
| Putnam Money Market Fund (Class A) | 817,439 | $817,439 |
| Total Fixed Income Funds (cost $817,439) | $817,439 | |
| Total Investments (cost $30,417,428) | $31,150,069 | |
* Percentages indicated are based on net assets of $31,142,311
29
The funds’ portfolios 1/31/12 (Unaudited) cont.
| Putnam RetirementReady 2025 Fund | Shares | Value |
| Absolute Return Funds (28.4%)* | ||
| Putnam Absolute Return 100 Fund (Class Y) | 131,505 | $1,315,048 |
| Putnam Absolute Return 300 Fund (Class Y) | 169,806 | 1,747,300 |
| Putnam Absolute Return 500 Fund (Class Y) | 218,077 | 2,335,609 |
| Putnam Absolute Return 700 Fund (Class Y) | 427,289 | 4,704,455 |
| Total Absolute Return Funds (cost $10,378,282) | $10,102,412 | |
| Asset Allocation Funds (68.1%)* | ||
| Putnam Dynamic Asset Allocation Balanced Fund (Class Y) | 1,383,584 | $15,413,122 |
| Putnam Dynamic Asset Allocation Conservative Fund (Class Y) | 37,620 | 354,753 |
| Putnam Dynamic Asset Allocation Equity Fund (Class Y) | — | — |
| Putnam Dynamic Asset Allocation Growth Fund (Class Y) | 679,620 | 8,481,655 |
| Total Asset Allocation Funds (cost $23,399,194) | $24,249,530 | |
| Fixed Income Funds (3.6%)* | ||
| Putnam Money Market Fund (Class A) | 1,287,151 | $1,287,151 |
| Total Fixed Income Funds (cost $1,287,151) | $1,287,151 | |
| Total Investments (cost $35,064,627) | $35,639,093 | |
* Percentages indicated are based on net assets of $35,631,053
| Putnam RetirementReady 2020 Fund | Shares | Value |
| Absolute Return Funds (38.3%)* | ||
| Putnam Absolute Return 100 Fund (Class Y) | 165,199 | $1,651,994 |
| Putnam Absolute Return 300 Fund (Class Y) | 295,060 | 3,036,163 |
| Putnam Absolute Return 500 Fund (Class Y) | 363,576 | 3,893,893 |
| Putnam Absolute Return 700 Fund (Class Y) | 395,855 | 4,358,359 |
| Total Absolute Return Funds (cost $13,316,536) | $12,940,409 | |
| Asset Allocation Funds (56.9%)* | ||
| Putnam Dynamic Asset Allocation Balanced Fund (Class Y) | 1,465,745 | $16,328,397 |
| Putnam Dynamic Asset Allocation Conservative Fund (Class Y) | 305,290 | 2,878,885 |
| Putnam Dynamic Asset Allocation Equity Fund (Class Y) | — | — |
| Putnam Dynamic Asset Allocation Growth Fund (Class Y) | — | — |
| Total Asset Allocation Funds (cost $18,684,416) | $19,207,282 | |
| Fixed Income Funds (4.8%)* | ||
| Putnam Money Market Fund (Class A) | 1,621,807 | $1,621,807 |
| Total Fixed Income Funds (cost $1,621,807) | $1,621,807 | |
| Total Investments (cost $33,622,759) | $33,769,498 | |
* Percentages indicated are based on net assets of $33,761,253
30
The funds’ portfolios 1/31/12 (Unaudited) cont.
| Putnam RetirementReady 2015 Fund | Shares | Value |
| Absolute Return Funds (49.4%)* | ||
| Putnam Absolute Return 100 Fund (Class Y) | 170,296 | $1,702,957 |
| Putnam Absolute Return 300 Fund (Class Y) | 357,004 | 3,673,575 |
| Putnam Absolute Return 500 Fund (Class Y) | 526,590 | 5,639,774 |
| Putnam Absolute Return 700 Fund (Class Y) | 174,620 | 1,922,563 |
| Total Absolute Return Funds (cost $13,272,613) | $12,938,869 | |
| Asset Allocation Funds (44.9%)* | ||
| Putnam Dynamic Asset Allocation Balanced Fund (Class Y) | 471,215 | $5,249,338 |
| Putnam Dynamic Asset Allocation Conservative Fund (Class Y) | 689,909 | 6,505,842 |
| Putnam Dynamic Asset Allocation Equity Fund (Class Y) | — | — |
| Putnam Dynamic Asset Allocation Growth Fund (Class Y) | — | — |
| Total Asset Allocation Funds (cost $11,489,511) | $11,755,180 | |
| Fixed Income Funds (5.8%)* | ||
| Putnam Money Market Fund (Class A) | 1,521,895 | $1,521,895 |
| Total Fixed Income Funds (cost $1,521,895) | $1,521,895 | |
| Total Investments (cost $26,284,019) | $26,215,944 | |
* Percentages indicated are based on net assets of $26,209,213
| Putnam Retirement Income Fund Lifestyle 1 | Shares | Value |
| Absolute Return Funds (59.7%)* | ||
| Putnam Absolute Return 100 Fund (Class Y) | 194,468 | $1,944,675 |
| Putnam Absolute Return 300 Fund (Class Y) | 445,257 | 4,581,690 |
| Putnam Absolute Return 500 Fund (Class Y) | 609,623 | 6,529,065 |
| Putnam Absolute Return 700 Fund (Class Y) | — | — |
| Total Absolute Return Funds (cost $13,435,710) | $13,055,430 | |
| Asset Allocation Funds (34.4%)* | ||
| Putnam Dynamic Asset Allocation Balanced Fund (Class Y) | — | $— |
| Putnam Dynamic Asset Allocation Conservative Fund (Class Y) | 798,405 | 7,528,961 |
| Putnam Dynamic Asset Allocation Equity Fund (Class Y) | — | — |
| Putnam Dynamic Asset Allocation Growth Fund (Class Y) | — | — |
| Total Asset Allocation Funds (cost $7,291,941) | $7,528,961 | |
| Fixed Income Funds (5.8%)* | ||
| Putnam Money Market Fund (Class A) | 1,276,104 | $1,276,104 |
| Total Fixed Income Funds (cost $1,276,104) | $1,276,104 | |
| Total Investments (cost $22,003,755) | $21,860,495 | |
* Percentages indicated are based on net assets of $21,855,419
31
The funds’ portfolios 1/31/12 (Unaudited) cont.
Key to holding’s abbreviations
| ASC 820 | Accounting Standards Codification ASC 820 Fair Value Measurements and Disclosures |
Notes to the funds’ portfolios
Unless noted otherwise, the notes to the funds’ portfolios are for the close of the funds’ reporting period, which ran from August 1, 2011 through January 31, 2012 (the reporting period).
ASC 820 establishes a three-level hierarchy for disclosure of fair value measurements. The valuation hierarchy is based upon the transparency of inputs to the valuation of the fund’s investments. The three levels are defined as follows:
Level 1: Valuations based on quoted prices for identical securities in active markets.
Level 2: Valuations based on quoted prices in markets that are not active or for which all significant inputs are observable, either directly or indirectly.
Level 3: Valuations based on inputs that are unobservable and significant to the fair value measurement.
The following is a summary of the inputs used to value the funds’ net assets as of the close of the reporting period:
| Investments in Securities | ||||
| Fund | Level 1 | Level 2 | Level 3 | Total |
| Putnam RetirementReady 2055 Fund | $472,415 | $— | $— | $472,415 |
| Putnam RetirementReady 2050 Fund | 6,653,735 | — | — | 6,653,735 |
| Putnam RetirementReady 2045 Fund | 10,451,044 | — | — | 10,451,044 |
| Putnam RetirementReady 2040 Fund | 14,624,168 | — | — | 14,624,168 |
| Putnam RetirementReady 2035 Fund | 23,089,146 | — | — | 23,089,146 |
| Putnam RetirementReady 2030 Fund | 31,150,069 | — | — | 31,150,069 |
| Putnam RetirementReady 2025 Fund | 35,639,093 | — | — | 35,639,093 |
| Putnam RetirementReady 2020 Fund | 33,769,498 | — | — | 33,769,498 |
| Putnam RetirementReady 2015 Fund | 26,215,944 | — | — | 26,215,944 |
| Putnam Retirement Income Fund Lifestyle 1 | 21,860,495 | — | — | 21,860,495 |
The accompanying notes are an integral part of these financial statements.
32
Statements of assets and liabilities 1/31/12 (Unaudited)
| Putnam | Putnam | Putnam | Putnam | Putnam | |
| Retirement- | Retirement- | Retirement- | Retirement- | Retirement- | |
| Ready | Ready | Ready | Ready | Ready | |
| ASSETS | 2055 Fund | 2050 Fund | 2045 Fund | 2040 Fund | 2035 Fund |
| Investments in affiliated | |||||
| underlying Putnam Funds, | |||||
| at value (Notes 1 and 6) | $472,415 | $6,653,735 | $10,451,044 | $14,624,168 | $23,089,146 |
| Interest receivable | — | — | — | — | 2 |
| Receivable for shares of | |||||
| the fund sold | 57,263 | 10,515 | 9,953 | 19,743 | 44,957 |
| Receivable for investments sold | 6,431 | 183,698 | 227,457 | 401,396 | 564,797 |
| Receivable from Manager | |||||
| (Note 2) | 228 | 4,146 | 5,652 | 8,772 | 13,629 |
| Total assets | 536,337 | 6,852,094 | 10,694,106 | 15,054,079 | 23,712,531 |
| LIABILITIES | |||||
| Payable for shares of the | |||||
| fund repurchased | 4,505 | 171,420 | 215,967 | 382,143 | 515,216 |
| Payable for investments | |||||
| purchased | 59,188 | 22,934 | 21,538 | 38,996 | 94,539 |
| Payable for distribution fees | |||||
| (Note 2) | 107 | 1,309 | 1,992 | 3,203 | 4,716 |
| Other accrued expenses | 228 | 4,146 | 5,652 | 8,772 | 13,629 |
| Total liabilities | 64,028 | 199,809 | 245,149 | 433,114 | 628,100 |
| Net assets | $472,309 | $6,652,285 | $10,448,957 | $14,620,965 | $23,084,431 |
| REPRESENTED BY | |||||
| Paid-in-capital (unlimited shares | |||||
| authorized) (Notes 1 and 4) | $491,401 | $12,351,713 | $21,072,117 | $28,478,357 | $42,685,977 |
| Undistributed net investment | |||||
| income (distributions in excess | |||||
| of net investment income) (Note 1) | (9,614) | (176,350) | 12,124 | 44,876 | 163,061 |
| Accumulated net realized loss | |||||
| on investments (Note 1) | (16,310) | (5,177,977) | (10,221,706) | (13,660,581) | (20,023,011) |
| Net unrealized appreciation | |||||
| (depreciation) of investments | 6,832 | (345,101) | (413,578) | (241,687) | 258,404 |
| Total — Representing net | |||||
| assets applicable to | |||||
| capital outstanding | $472,309 | $6,652,285 | $10,448,957 | $14,620,965 | $23,084,431 |
(Continued on next page)
33
Statements of assets and liabilities 1/31/12 (Unaudited) cont.
| Putnam | Putnam | Putnam | Putnam | Putnam | |
| COMPUTATION OF | Retirement- | Retirement- | Retirement- | Retirement- | Retirement- |
| NET ASSET VALUE | Ready | Ready | Ready | Ready | Ready |
| AND OFFERING PRICE | 2055 Fund | 2050 Fund | 2045 Fund | 2040 Fund | 2035 Fund |
| Computation of net asset value, offering price and redemption price Class A | |||||
| Net Assets | $272,073 | $3,500,600 | $6,436,232 | $8,451,770 | $13,935,471 |
| Number of shares outstanding | 28,817 | 286,947 | 469,833 | 564,069 | 911,103 |
| Net asset value and | |||||
| redemption price | $9.44 | $12.20 | $13.70 | $14.98 | $15.30 |
| Offering price per class A share | |||||
| (100/94.25 of Class A net | |||||
| asset value)* | $10.02 | $12.94 | $14.54 | $15.89 | $16.23 |
| Computation of net asset value and offering price Class B | |||||
| Net Assets | $12,359 | $151,877 | $146,946 | $441,934 | $567,243 |
| Number of shares outstanding | 1,306 | 12,537 | 11,566 | 31,543 | 39,857 |
| Net asset value and offering price*** | $9.46 | $12.11 | $12.71**** | $14.01 | $14.23 |
| Computation of net asset value and offering price Class C | |||||
| Net Assets | $30,492 | $91,359 | $40,831 | $160,990 | $235,706 |
| Number of shares outstanding | 3,247 | 7,576 | 3,189 | 11,567 | 16,535 |
| Net asset value and offering price*** | $9.39 | $12.06 | $12.80 | $13.92 | $14.25 |
| Computation of net asset value, offering price and redemption price Class M | |||||
| Net Assets | $10,505 | $20,118 | $12,286 | $20,473 | $12,632 |
| Number of shares outstanding | 1,112 | 1,629 | 916 | 1,435 | 851 |
| Net asset value and | |||||
| redemption price | $9.45 | $12.35 | $13.41 | $14.27 | $14.84 |
| Offering price per class M share | |||||
| (100/96.50 of Class M net | |||||
| asset value)* | $9.79 | $12.80 | $13.90 | $14.79 | $15.38 |
| Computation of net asset value, offering price and redemption price Class R | |||||
| Net Assets | $14,500 | $832,155 | $1,084,054 | $2,054,101 | $2,570,455 |
| Number of shares outstanding | 1,536 | 69,056 | 77,401 | 133,834 | 174,325 |
| Net asset value, offering price | |||||
| and redemption value | $9.44 | $12.05 | $14.01 | $15.35 | $14.75 |
| Computation of net asset value, offering price and redemption price Class Y | |||||
| Net Assets | $132,380 | $2,056,176 | $2,728,608 | $3,491,697 | $5,762,924 |
| Number of shares outstanding | 14,006 | 168,204 | 170,152 | 202,550 | 328,107 |
| Net asset value, offering price | |||||
| and redemption value | $9.45 | $12.22 | $16.04 | $17.24 | $17.56 |
| Cost of investments (Note 1) | $465,583 | $6,998,836 | $10,864,622 | $14,865,855 | $22,830,742 |
* On retail sales of less than $50,000. On sales of $50,000 or more the offering price is reduced.
*** Redemption price per share is equal to the net asset value less any applicable contingent deferred sales charge.
**** Net asset value may not recalculate due to rounding of fractional shares.
34
Statements of assets and liabilities 1/31/12 (Unaudited) cont.
| Putnam | Putnam | Putnam | Putnam | Putnam | |
| Retirement- | Retirement- | Retirement- | Retirement- | Retirement | |
| Ready | Ready | Ready | Ready | Income Fund | |
| ASSETS | 2030 Fund | 2025 Fund | 2020 Fund | 2015 Fund | Lifestyle 1 |
| Investments in affiliated | |||||
| underlying Putnam Funds, | |||||
| at value (Notes 1 and 6) | $31,150,069 | $35,639,093 | $33,769,498 | $26,215,944 | $21,860,495 |
| Interest receivable | 6 | 10 | 12 | 12 | 9 |
| Cash | — | — | — | — | 90 |
| Receivable for shares of | |||||
| the fund sold | 24,999 | 29,387 | 30,045 | 22,513 | 212,046 |
| Receivable for investments sold | 409,937 | 395,865 | 488,690 | 358,317 | 172,472 |
| Receivable from Manager | |||||
| (Note 2) | 16,515 | 18,709 | 17,687 | 14,534 | 11,912 |
| Total assets | 31,601,526 | 36,083,064 | 34,305,932 | 26,611,320 | 22,257,024 |
| LIABILITIES | |||||
| Payable for shares of the | |||||
| fund repurchased | 378,561 | 369,700 | 461,607 | 349,543 | 151,558 |
| Payable for investments | |||||
| purchased | 56,995 | 55,786 | 57,242 | 31,524 | 232,971 |
| Payable for distribution fees | |||||
| (Note 2) | 7,144 | 7,816 | 8,143 | 6,506 | 5,164 |
| Other accrued expenses | 16,515 | 18,709 | 17,687 | 14,534 | 11,912 |
| Total liabilities | 459,215 | 452,011 | 544,679 | 402,107 | 401,605 |
| Net assets | $31,142,311 | $35,631,053 | $33,761,253 | $26,209,213 | $21,855,419 |
| REPRESENTED BY | |||||
| Paid-in-capital (unlimited shares | |||||
| authorized) (Notes 1 and 4) | $56,578,900 | $65,421,976 | $65,477,071 | $52,924,904 | $30,375,706 |
| Undistributed net investment | |||||
| income (Note 1) | 302,930 | 467,775 | 531,498 | 415,707 | 4,435 |
| Accumulated net realized loss | |||||
| on investments (Note 1) | (26,472,160) | (30,833,164) | (32,394,055) | (27,063,323) | (8,381,462) |
| Net unrealized appreciation | |||||
| (depreciation) of investments | 732,641 | 574,466 | 146,739 | (68,075) | (143,260) |
| Total — Representing net | |||||
| assets applicable to | |||||
| capital outstanding | $31,142,311 | $35,631,053 | $33,761,253 | $26,209,213 | $21,855,419 |
(Continued on next page)
35
Statements of assets and liabilities 1/31/12 (Unaudited) cont.
| Putnam | Putnam | Putnam | Putnam | Putnam | |
| COMPUTATION OF | Retirement- | Retirement- | Retirement- | Retirement- | Retirement |
| NET ASSET VALUE | Ready | Ready | Ready | Ready | Income Fund |
| AND OFFERING PRICE | 2030 Fund | 2025 Fund | 2020 Fund | 2015 Fund | Lifestyle 1 |
| Computation of net asset value, offering price and redemption price Class A | |||||
| Net Assets | $18,973,760 | $23,845,372 | $25,414,875 | $20,522,454 | $18,550,576 |
| Number of shares outstanding | 1,217,931 | 1,439,564 | 1,631,443 | 1,288,670 | 1,167,292 |
| Net asset value and | |||||
| redemption price | $15.58 | $16.56 | $15.58 | $15.93 | $15.89 |
| Offering price per class A share | |||||
| (100/94.25 of Class A net | |||||
| asset value)* | $16.53 | $17.57 | $16.53 | $16.90 | |
| Offering price per class A share | |||||
| (100/96.00 of Class A net | |||||
| asset value) ** | $16.55 | ||||
| Computation of net asset value and offering price Class B | |||||
| Net Assets | $1,000,244 | $898,574 | $829,553 | $463,211 | $195,602 |
| Number of shares outstanding | 67,191 | 57,679 | 55,034 | 29,893 | 12,325 |
| Net asset value and offering price*** | $14.89 | $15.58 | $15.07 | $15.50 | $15.87 |
| Computation of net asset value and offering price Class C | |||||
| Net Assets | $571,020 | $539,732 | $727,239 | $629,304 | $478,218 |
| Number of shares outstanding | 38,283 | 34,606 | 48,097 | 40,653 | 30,058 |
| Net asset value and offering price*** | $14.92 | $15.60 | $15.12 | $15.48 | $15.91 |
| Computation of net asset value, offering price and redemption price Class M | |||||
| Net Assets | $80,652 | $130,430 | $153,707 | $159,721 | $314,411 |
| Number of shares outstanding | 5,301 | 8,255 | 10,030 | 10,140 | 19,736 |
| Net asset value and | |||||
| redemption price | $15.22**** | $15.80 | $15.32 | $15.75 | $15.93 |
| Offering price per class M share | |||||
| (100/96.50 of Class M net | |||||
| asset value)* | $15.77 | $16.37 | $15.88 | $16.32 | |
| Offering price per class M share | |||||
| (100/96.75 of Class M net | |||||
| asset value)* | $16.47 | ||||
| Computation of net asset value, offering price and redemption price Class R | |||||
| Net Assets | $4,294,106 | $3,518,367 | $3,153,945 | $2,748,079 | $1,347,809 |
| Number of shares outstanding | 290,075 | 226,353 | 209,818 | 178,341 | 84,849 |
| Net asset value, offering price | |||||
| and redemption value | $14.80 | $15.54 | $15.03 | $15.41 | $15.88 |
| Computation of net asset value, offering price and redemption price Class Y | |||||
| Net Assets | $6,222,529 | $6,698,578 | $3,481,934 | $1,686,444 | $968,803 |
| Number of shares outstanding | 353,525 | 403,199 | 201,607 | 105,762 | 60,773 |
| Net asset value, offering price | |||||
| and redemption value | $17.60 | $16.61 | $17.27 | $15.95 | $15.94 |
| Cost of investments (Note 1) | $30,417,428 | $35,064,627 | $33,622,759 | $26,284,019 | $22,003,755 |
* On retail sales of less than $50,000. On sales of $50,000 or more the offering price is reduced.
** On retail sales of less than $100,000. On sales of $100,000 or more the offering price is reduced.
*** Redemption price per share is equal to the net asset value less any applicable contingent deferred sales charge.
**** Net asset value may not recalculate due to rounding of fractional shares.
The accompanying notes are an integral part of these financial statements.
36
Statements of operations For the six months ended 1/31/12 (Unaudited)
| Putnam | Putnam | Putnam | Putnam | Putnam | |
| Retirement- | Retirement- | Retirement- | Retirement- | Retirement- | |
| Ready | Ready | Ready | Ready | Ready | |
| INVESTMENT INCOME | 2055 Fund | 2050 Fund | 2045 Fund | 2040 Fund | 2035 Fund |
| Income distributions from | |||||
| underlying Putnam Fund shares | |||||
| (Note 6) | $1,781 | $29,842 | $56,377 | $98,160 | $205,531 |
| EXPENSES | |||||
| Distribution fees — Class A (Note 2) | 219 | 4,522 | 8,699 | 11,799 | 19,002 |
| Distribution fees — Class B (Note 2) | 61 | 698 | 714 | 2,021 | 2,773 |
| Distribution fees — Class C (Note 2) | 85 | 419 | 187 | 701 | 1,249 |
| Distribution fees — Class M (Note 2) | 39 | 147 | 37 | 67 | 117 |
| Distribution fees — Class R (Note 2) | 30 | 1,760 | 2,464 | 4,822 | 5,798 |
| Audit fees | 99 | 1,949 | 4,165 | 6,209 | 9,460 |
| Reports to shareholder | 155 | 1,215 | 1,331 | 2,225 | 2,463 |
| Amortization of offering costs | |||||
| (Note 1) | 28,061 | — | — | — | — |
| Other fees | 43 | 266 | 397 | 547 | 681 |
| Fees waived and reimbursed by | |||||
| Manager (Note 2) | (28,358) | (3,430) | (5,893) | (8,981) | (12,604) |
| Total expenses | 434 | 7,546 | 12,101 | 19,410 | 28,939 |
| Net investment income | 1,347 | 22,296 | 44,276 | 78,750 | 176,592 |
| Net realized loss on sale of | |||||
| underlying Putnam Fund shares | |||||
| (Notes 1 and 3) | (44,698) | (382,040) | (645,241) | (899,776) | (291,893) |
| Capital gain distribution from | |||||
| underlying Putnam Fund shares | |||||
| (Note 6) | 30,126 | 493,970 | 608,715 | 587,004 | 344,213 |
| Net unrealized appreciation | |||||
| (depreciation) of underlying | |||||
| Putnam Fund shares during | |||||
| the period | 7,332 | (365,975) | (810,609) | (1,164,413) | (1,973,415) |
| Net loss on investments | (7,240) | (254,045) | (847,135) | (1,477,185) | (1,921,095) |
| Net decrease in net assets | |||||
| resulting from operations | $(5,893) | $(231,749) | $(802,859) | $(1,398,435) | $(1,744,503) |
37
Statements of operations For the six months ended 1/31/11 (Unaudited) cont.
| Putnam | Putnam | Putnam | Putnam | Putnam | |
| Retirement- | Retirement- | Retirement- | Retirement- | Retirement | |
| Ready | Ready | Ready | Ready | Income Fund | |
| INVESTMENT INCOME | 2030 Fund | 2025 Fund | 2020 Fund | 2015 Fund | Lifestyle 1 |
| Income distributions from | |||||
| underlying Putnam Fund shares | |||||
| (Note 6) | $361,534 | $540,587 | $614,291 | $486,154 | $396,927 |
| EXPENSES | |||||
| Distribution fees — Class A (Note 2) | 26,609 | 33,689 | 34,797 | 30,111 | 23,681 |
| Distribution fees — Class B (Note 2) | 4,731 | 4,417 | 3,949 | 2,345 | 986 |
| Distribution fees — Class C (Note 2) | 2,632 | 2,499 | 3,359 | 3,088 | 2,449 |
| Distribution fees — Class M (Note 2) | 858 | 592 | 657 | 802 | 789 |
| Distribution fees — Class R (Note 2) | 9,296 | 8,280 | 7,858 | 6,710 | 3,420 |
| Audit fees | 12,705 | 14,581 | 13,871 | 11,278 | 8,701 |
| Reports to shareholder | 3,222 | 3,518 | 3,276 | 2,802 | 5,170 |
| Other fees | 922 | 1,041 | 952 | 837 | 782 |
| Fees waived and reimbursed by | |||||
| Manager (Note 2) | (16,849) | (19,140) | (18,099) | (14,917) | (14,653) |
| Total expenses | 44,126 | 49,477 | 50,620 | 43,056 | 31,325 |
| Net investment income | 317,408 | 491,110 | 563,671 | 443,098 | 365,602 |
| Net realized gain (loss) on sale of | |||||
| underlying Putnam Fund shares | |||||
| (Notes 1 and 3) | 420,965 | 382,194 | 150,264 | 29,464 | (9,705) |
| Net unrealized depreciation of | |||||
| underlying Putnam Fund shares | |||||
| during the period | (2,603,408) | (2,356,266) | (1,833,209) | (1,290,618) | (803,663) |
| Net loss on investments | (2,182,443) | (1,974,072) | (1,682,945) | (1,261,154) | (813,368) |
| Net decrease in net assets | |||||
| resulting from operations | $(1,865,035) | $(1,482,962) | $(1,119,274) | $(818,056) | $(447,766) |
The accompanying notes are an integral part of these financial statements.
38
Statements of changes in net assets
| Putnam RetirementReady 2055 Fund — | For the period 11/30/10 | |
| TOTAL INCREASE IN NET ASSETS | (commencement of | |
| Six months ended 1/31/12* | operations) to 7/31/11 | |
| Operations: | ||
| Net investment income | $1,347 | $1,124 |
| Net realized gain (loss) on underlying Putnam Fund shares | (14,572) | 6,018 |
| Net unrealized appreciation (depreciation) on underlying | ||
| Putnam Fund shares | 7,332 | (500) |
| Net increase (decrease) in net assets resulting from operations | (5,893) | 6,642 |
| Distributions to shareholders (Note 1) | ||
| From ordinary income | ||
| Net investment income | ||
| Class A | (7,418) | (659) |
| Class B | (208) | (648) |
| Class C | (727) | (648) |
| Class M | (219) | (650) |
| Class R | (351) | (652) |
| Class Y | (2,038) | (790) |
| Net realized short-term gain on investments | ||
| Class A | (592) | (90) |
| Class B | (27) | (89) |
| Class C | (65) | (89) |
| Class M | (23) | (89) |
| Class R | (31) | (89) |
| Class Y | (153) | (106) |
| From net realized long-term gain on investments | ||
| Class A | (2,256) | — |
| Class B | (101) | — |
| Class C | (246) | — |
| Class M | (86) | — |
| Class R | (116) | — |
| Class Y | (585) | — |
| Increase from capital share transactions (Note 4) | 232,598 | 198,803 |
| Total increase in net assets | 211,463 | 200,846 |
| NET ASSETS | ||
| Beginning of period (Note 5) | 260,846 | 60,000 |
| End of period | $472,309 | $260,846 |
| Distributions in excess of net investment income and no monies, | ||
| respectively, end of period | $(9,614) | $— |
* Unaudited
39
Statements of changes in net assets cont.
| Putnam RetirementReady 2050 Fund — | ||
| TOTAL INCREASE (DECREASE) IN NET ASSETS | Six months ended 1/31/12* | Year ended 7/31/11 |
| Operations: | ||
| Net investment income | $22,296 | $216,114 |
| Net realized gain on underlying Putnam Fund shares | 111,930 | 1,031,047 |
| Net unrealized depreciation on underlying Putnam Fund shares | (365,975) | (29,107) |
| Net increase (decrease) in net assets resulting from operations | (231,749) | 1,218,054 |
| Distributions to shareholders (Note 1) | ||
| From ordinary income | ||
| Net investment income | ||
| Class A | (127,663) | (400,781) |
| Class B | (4,681) | (6,168) |
| Class C | (2,635) | (5,086) |
| Class M | (248) | (4,954) |
| Class R | (28,583) | (36,858) |
| Class Y | (77,945) | (153,599) |
| Decrease from capital share transactions (Note 4) | (748,206) | (188,850) |
| Total increase (decrease) in net assets | (1,221,710) | 421,758 |
| NET ASSETS | ||
| Beginning of period | 7,873,995 | 7,452,237 |
| End of period | $6,652,285 | $7,873,995 |
| Distributions in excess of net investment income and undistributed | ||
| net investment income, respectively, end of period | $(176,350) | $43,109 |
| Putnam RetirementReady 2045 Fund — | ||
| TOTAL INCREASE (DECREASE) IN NET ASSETS | Six months ended 1/31/12* | Year ended 7/31/11 |
| Operations: | ||
| Net investment income | $44,276 | $440,718 |
| Net realized gain (loss) on underlying Putnam Fund shares | (36,526) | 2,061,500 |
| Net unrealized depreciation on underlying Putnam Fund shares | (810,609) | (162,313) |
| Net increase (decrease) in net assets resulting from operations | (802,859) | 2,339,905 |
| Distributions to shareholders (Note 1) | ||
| From ordinary income | ||
| Net investment income | ||
| Class A | (200,364) | (654,768) |
| Class B | (3,832) | (8,411) |
| Class C | (1,020) | (2,242) |
| Class M | (350) | (458) |
| Class R | (29,498) | (54,157) |
| Class Y | (76,692) | (320,414) |
| Increase (decrease) from capital share transactions (Note 4) | (4,480,474) | 279,629 |
| Total increase (decrease) in net assets | (5,595,089) | 1,579,084 |
| NET ASSETS | ||
| Beginning of period | 16,044,046 | 14,464,962 |
| End of period | $10,448,957 | $16,044,046 |
| Undistributed net investment income, respectively, end of period | $12,124 | $279,604 |
* Unaudited
40
Statements of changes in net assets cont.
| Putnam RetirementReady 2040 Fund — | ||
| TOTAL INCREASE (DECREASE) IN NET ASSETS | Six months ended 1/31/12* | Year ended 7/31/11 |
| Operations: | ||
| Net investment income | $78,750 | $725,686 |
| Net realized gain (loss) on underlying Putnam Fund shares | (312,772) | 2,828,938 |
| Net unrealized depreciation on underlying Putnam Fund shares | (1,164,413) | (46,283) |
| Net increase (decrease) in net assets resulting from operations | (1,398,435) | 3,508,341 |
| Distributions to shareholders (Note 1) | ||
| From ordinary income | ||
| Net investment income | ||
| Class A | (193,347) | (753,293) |
| Class B | (7,727) | (21,843) |
| Class C | (3,122) | (5,613) |
| Class M | (209) | (1,219) |
| Class R | (41,230) | (98,983) |
| Class Y | (81,944) | (470,017) |
| Increase (decrease) from capital share transactions (Note 4) | (8,447,521) | 1,302,788 |
| Total increase (decrease) in net assets | (10,173,535) | 3,460,161 |
| NET ASSETS | ||
| Beginning of period | 24,794,500 | 21,334,339 |
| End of period | $14,620,965 | $24,794,500 |
| Undistributed net investment income, respectively, end of period | $44,876 | $293,705 |
| Putnam RetirementReady 2035 Fund — | ||
| TOTAL INCREASE (DECREASE) IN NET ASSETS | Six months ended 1/31/12* | Year ended 7/31/11 |
| Operations: | ||
| Net investment income | $176,592 | $1,158,055 |
| Net realized gain on underlying Putnam Fund shares | 52,320 | 4,558,581 |
| Net unrealized depreciation on underlying Putnam Fund shares | (1,973,415) | (692,395) |
| Net increase (decrease) in net assets resulting from operations | (1,744,503) | 5,024,241 |
| Distributions to shareholders (Note 1) | ||
| From ordinary income | ||
| Net investment income | ||
| Class A | (382,204) | (905,812) |
| Class B | (13,150) | (21,193) |
| Class C | (5,874) | (10,110) |
| Class M | — | (2,479) |
| Class R | (67,006) | (82,718) |
| Class Y | (165,898) | (495,426) |
| Increase (decrease) from capital share transactions (Note 4) | (10,216,218) | 972,052 |
| Total increase (decrease) in net assets | (12,594,853) | 4,478,555 |
| NET ASSETS | ||
| Beginning of period | 35,679,284 | 31,200,729 |
| End of period | $23,084,431 | $35,679,284 |
| Undistributed net investment income, respectively, end of period | $163,061 | $620,601 |
* Unaudited
41
Statements of changes in net assets cont.
| Putnam RetirementReady 2030 Fund — | ||
| TOTAL INCREASE (DECREASE) IN NET ASSETS | Six months ended 1/31/12* | Year ended 7/31/11 |
| Operations: | ||
| Net investment income | $317,408 | $1,546,366 |
| Net realized gain on underlying Putnam Fund shares | 420,965 | 4,908,326 |
| Net unrealized depreciation on underlying Putnam Fund shares | (2,603,408) | (584,834) |
| Net increase (decrease) in net assets resulting from operations | (1,865,035) | 5,869,858 |
| Distributions to shareholders (Note 1) | ||
| From ordinary income | ||
| Net investment income | ||
| Class A | (419,610) | (955,412) |
| Class B | (16,521) | (25,893) |
| Class C | (9,322) | (13,972) |
| Class M | — | (18,912) |
| Class R | (92,131) | (119,254) |
| Class Y | (158,198) | (415,362) |
| Increase (decrease) from capital share transactions (Note 4) | (12,918,147) | 2,532,812 |
| Total increase (decrease) in net assets | (15,478,964) | 6,853,865 |
| NET ASSETS | ||
| Beginning of period | 46,621,275 | 39,767,410 |
| End of period | $31,142,311 | $46,621,275 |
| Undistributed net investment income, respectively, end of period | $302,930 | $681,304 |
| Putnam RetirementReady 2025 Fund — | ||
| TOTAL INCREASE (DECREASE) IN NET ASSETS | Six months ended 1/31/12* | Year ended 7/31/11 |
| Operations: | ||
| Net investment income | $491,110 | $1,807,960 |
| Net realized gain on underlying Putnam Fund shares | 382,194 | 5,112,767 |
| Net unrealized depreciation on underlying Putnam Fund shares | (2,356,266) | (766,771) |
| Net increase (decrease) in net assets resulting from operations | (1,482,962) | 6,153,956 |
| Distributions to shareholders (Note 1) | ||
| From ordinary income | ||
| Net investment income | ||
| Class A | (794,855) | (1,242,565) |
| Class B | (26,008) | (26,834) |
| Class C | (15,533) | (11,552) |
| Class M | (4,205) | (4,744) |
| Class R | (118,241) | (111,269) |
| Class Y | (274,787) | (448,550) |
| Increase (decrease) from capital share transactions (Note 4) | (13,386,702) | 853,118 |
| Total increase (decrease) in net assets | (16,103,293) | 5,161,560 |
| NET ASSETS | ||
| Beginning of period | 51,734,346 | 46,572,786 |
| End of period | $35,631,053 | $51,734,346 |
| Undistributed net investment income, respectively, end of period | $467,775 | $1,210,294 |
* Unaudited
42
Statements of changes in net assets cont.
| Putnam RetirementReady 2020 Fund — | ||
| TOTAL INCREASE (DECREASE) IN NET ASSETS | Six months ended 1/31/12* | Year ended 7/31/11 |
| Operations: | ||
| Net investment income | $563,671 | $1,690,119 |
| Net realized gain on underlying Putnam Fund shares | 150,264 | 4,563,571 |
| Net unrealized depreciation on underlying Putnam Fund shares | (1,833,209) | (1,311,445) |
| Net increase (decrease) in net assets resulting from operations | (1,119,274) | 4,942,245 |
| Distributions to shareholders (Note 1) | ||
| From ordinary income | ||
| Net investment income | ||
| Class A | (1,113,016) | (1,319,857) |
| Class B | (31,902) | (20,500) |
| Class C | (27,373) | (12,532) |
| Class M | (6,310) | (7,090) |
| Class R | (143,151) | (119,643) |
| Class Y | (194,102) | (316,238) |
| Increase (decrease) from capital share transactions (Note 4) | (12,487,300) | 1,008,833 |
| Total increase (decrease) in net assets | (15,122,428) | 4,155,218 |
| NET ASSETS | ||
| Beginning of period | 48,883,681 | 44,728,463 |
| End of period | $33,761,253 | $48,883,681 |
| Undistributed net investment income, respectively, end of period | $531,498 | $1,483,681 |
| Putnam RetirementReady 2015 Fund — | ||
| TOTAL DECREASE IN NET ASSETS | Six months ended 1/31/12* | Year ended 7/31/11 |
| Operations: | ||
| Net investment income | $443,098 | $1,350,421 |
| Net realized gain on underlying Putnam Fund shares | 29,464 | 2,773,439 |
| Net unrealized depreciation on underlying Putnam Fund shares | (1,290,618) | (671,800) |
| Net increase (decrease) in net assets resulting from operations | (818,056) | 3,452,060 |
| Distributions to shareholders (Note 1) | ||
| From ordinary income | ||
| Net investment income | ||
| Class A | (994,591) | (1,194,331) |
| Class B | (20,937) | (12,913) |
| Class C | (27,475) | (15,717) |
| Class M | (6,293) | (10,530) |
| Class R | (130,764) | (104,459) |
| Class Y | (128,681) | (224,844) |
| Decrease from capital share transactions (Note 4) | (11,842,621) | (2,074,053) |
| Total decrease in net assets | (13,969,418) | (184,787) |
| NET ASSETS | ||
| Beginning of period | 40,178,631 | 40,363,418 |
| End of period | $26,209,213 | $40,178,631 |
| Undistributed net investment income, respectively, end of period | $415,707 | $1,281,350 |
* Unaudited
43
Statements of changes in net assets cont.
| Putnam Retirement Income Fund Lifestyle 1 — | ||
| TOTAL INCREASE (DECREASE) IN NET ASSETS | Six months ended 1/31/12* | Year ended 7/31/11 |
| Operations: | ||
| Net investment income | $365,602 | $859,080 |
| Net realized gain (loss) on underlying Putnam Fund shares | (9,705) | 1,021,995 |
| Net unrealized depreciation on underlying Putnam Fund shares | (803,663) | (598,688) |
| Net increase (decrease) in net assets resulting from operations | (447,766) | 1,282,387 |
| Distributions to shareholders (Note 1) | ||
| From ordinary income | ||
| Net investment income | ||
| Class A | (288,178) | (682,041) |
| Class B | (2,564) | (4,742) |
| Class C | (6,196) | (10,359) |
| Class M | (4,465) | (7,949) |
| Class R | (19,941) | (39,971) |
| Class Y | (39,823) | (156,340) |
| Increase (decrease) from capital share transactions (Notes 4 and 7) | (6,382,914) | 15,170,951 |
| Total increase (decrease) in net assets | (7,191,847) | 15,551,936 |
| NET ASSETS | ||
| Beginning of period | 29,047,266 | 13,495,330 |
| End of period | $21,855,419 | $29,047,266 |
| Undistributed net investment income, respectively, end of period | $4,435 | $— |
* Unaudited
The accompanying notes are an integral part of these financial statements.
44
| This page left blank intentionally. |
45
Financial highlights (For a common share outstanding throughout the period)
Putnam RetirementReady 2055 Fund
| INVESTMENT OPERATIONS: | LESS DISTRIBUTIONS: | RATIOS AND SUPPLEMENTAL DATA: | |||||||||||
| Ratio of net | |||||||||||||
| Ratio | investment | ||||||||||||
| Net asset | Net realized | of expenses | income (loss) | ||||||||||
| value, | and unrealized | Total from | From | From | Total | Net asset | Total return | Net assets, | to average | to average | Portfolio | ||
| beginning | Net investment | gain (loss) | investment | net investment | net realized gain | distribu- | value, end | at net asset | end of period | net assets | net assets | turnover | |
| Period ended | of period | income (loss) a | on investments | operations | income | on investments | tions | of period | value (%) b | (in thousands) | (%) c,d | (%) d | (%) |
| Class A | |||||||||||||
| January 31, 2012 ** | $10.09 | .02 | (.31) | (.29) | (.26) | (.10) | (.36) | $9.44 | (2.65) * | $272 | .13 * | .54 * | 208 * |
| July 31, 2011† | 10.00 | — e | .83 | .83 | (.65) | (.09) | (.74) | 10.09 | 8.53 * | 179 | .17 * | (.01) * | 101 * |
| Class B | |||||||||||||
| January 31, 2012 ** | $10.05 | (.03) | (.30) | (.33) | (.16) | (.10) | (.26) | $9.46 | (3.10) * | $12 | .50 * | (.02) * | 208 * |
| July 31, 2011† | 10.00 | .12 | .67 | .79 | (.65) | (.09) | (.74) | 10.05 | 8.03 * | 17 | .67 * | 1.13 * | 101 * |
| Class C | |||||||||||||
| January 31, 2012 ** | $10.05 | (.02) | (.30) | (.32) | (.24) | (.10) | (.34) | $9.39 | (3.05) * | $30 | .50 * | .07 * | 208 * |
| July 31, 2011† | 10.00 | .16 | .63 | .79 | (.65) | (.09) | (.74) | 10.05 | 8.03 * | 15 | .67 * | 1.58 * | 101 * |
| Class M | |||||||||||||
| January 31, 2012 ** | $10.06 | (.02) | (.29) | (.31) | (.20) | (.10) | (.30) | $9.45 | (2.88) * | $11 | .38 * | .11 * | 208 * |
| July 31, 2011† | 10.00 | .21 | .59 | .80 | (.65) | (.09) | (.74) | 10.06 | 8.16 * | 12 | .50 * | 2.02 * | 101 * |
| Class R | |||||||||||||
| January 31, 2012 ** | $10.08 | — e | (.30) | (.30) | (.24) | (.10) | (.34) | $9.44 | (2.78) * | $15 | .25 * | .31 * | 208 * |
| July 31, 2011† | 10.00 | .23 | .59 | .82 | (.65) | (.09) | (.74) | 10.08 | 8.40 * | 11 | .33 * | 2.23 * | 101 * |
| Class Y | |||||||||||||
| January 31, 2012 ** | $10.11 | .03 | (.31) | (.28) | (.28) | (.10) | (.38) | $9.45 | (2.58) * | $132 | — * | .65 * | 208 * |
| July 31, 2011† | 10.00 | .18 | .68 | .86 | (.66) | (.09) | (.75) | 10.11 | 8.76 * | 28 | — | 1.73 * | 101 * |
See page 66 for notes to financial highlights.
The accompanying notes are an integral part of these financial statements.
| 46 | 47 |
Financial highlights (For a common share outstanding throughout the period)
Putnam RetirementReady 2050 Fund
| INVESTMENT OPERATIONS: | LESS DISTRIBUTIONS: | RATIOS AND SUPPLEMENTAL DATA: | ||||||||||||
| Ratio | Ratio | |||||||||||||
| Net realized | From | of expenses | of net investment | |||||||||||
| Net asset value, | and unrealized | Total from | From | net realized | Total return | Net assets, | to average | income (loss) | Portfolio | |||||
| beginning | Net investment | gain (loss) | investment | net investment | gain | Total | Redemption | Net asset value, | at net asset | end of period | net assets | to average | turnover | |
| Period ended | of period | income (loss) a | on investments | operations | income | on investments | distributions | fees | end of period | value (%) b | (in thousands) | (%) c,d | net assets (%) d | (%) |
| Class A | ||||||||||||||
| January 31, 2012 ** | $12.86 | .04 | (.25) | (.21) | (.45) | — | (.45) | — | $12.20 | (1.47) * | $3,501 | .13 * | .32 * | 35 * |
| July 31, 2011 | 11.88 | .36 | 1.56 | 1.92 | (.94) | — | (.94) | — | 12.86 | 16.33 | 4,196 | .25 | 2.84 | 72 |
| July 31, 2010 | 12.19 | .66 | .90 | 1.56 | (1.87) | — | (1.87) | — e | 11.88 | 12.76 | 4,886 | .25 | 5.36 | 86 |
| July 31, 2009 | 15.83 | .07 | (3.08) | (3.01) | (.19) | (.44) | (.63) | — e | 12.19 | (18.34) | 5,110 | .35 | .64 | 171 |
| July 31, 2008 | 21.18 | .21 | (2.85) | (2.64) | (.51) | (2.20) | (2.71) | — | 15.83 | (14.25) | 7,132 | .35 | 1.13 | 151 |
| July 31, 2007 | 18.79 | .17 | 2.89 | 3.06 | (.33) | (.34) | (.67) | — e | 21.18 | 16.35 | 10,042 | .34 | .81 | 68 |
| Class B | ||||||||||||||
| January 31, 2012 ** | $12.76 | — e | (.27) | (.27) | (.38) | — | (.38) | — | $12.11 | (1.93) * | $152 | .50 * | (.01) * | 35 * |
| July 31, 2011 | 11.77 | .20 | 1.61 | 1.81 | (.82) | — | (.82) | — | 12.76 | 15.52 | 119 | 1.00 | 1.56 | 72 |
| July 31, 2010 | 12.09 | .67 | .79 | 1.46 | (1.78) | — | (1.78) | — e | 11.77 | 11.98 | 105 | 1.00 | 5.45 | 86 |
| July 31, 2009 | 15.69 | (.02) | (3.05) | (3.07) | (.09) | (.44) | (.53) | — e | 12.09 | (19.00) | 137 | 1.10 | (.19) | 171 |
| July 31, 2008 | 21.02 | .06 | (2.83) | (2.77) | (.36) | (2.20) | (2.56) | — | 15.69 | (14.91) | 119 | 1.10 | .31 | 151 |
| July 31, 2007 | 18.71 | .02 | 2.86 | 2.88 | (.23) | (.34) | (.57) | — e | 21.02 | 15.50 | 143 | 1.09 | .12 | 68 |
| Class C | ||||||||||||||
| January 31, 2012 ** | $12.68 | — e | (.25) | (.25) | (.37) | — | (.37) | — | $12.06 | (1.85) * | $91 | .50 * | (.03) * | 35 * |
| July 31, 2011 | 11.74 | .20 | 1.60 | 1.80 | (.86) | — | (.86) | — | 12.68 | 15.46 | 87 | 1.00 | 1.61 | 72 |
| July 31, 2010 | 12.08 | .54 | .92 | 1.46 | (1.80) | — | (1.80) | — e | 11.74 | 11.99 | 65 | 1.00 | 4.44 | 86 |
| July 31, 2009 | 15.70 | (.03) | (3.05) | (3.08) | (.10) | (.44) | (.54) | — e | 12.08 | (19.01) | 46 | 1.10 | (.29) | 171 |
| July 31, 2008 | 21.12 | .05 | (2.81) | (2.76) | (.46) | (2.20) | (2.66) | — | 15.70 | (14.90) | 34 | 1.10 | .29 | 151 |
| July 31, 2007 | 18.72 | (.10) | 2.98 | 2.88 | (.14) | (.34) | (.48) | — e | 21.12 | 15.49 | 16 | 1.09 | (.44) | 68 |
| Class M | ||||||||||||||
| January 31, 2012 ** | $12.74 | (.02) | (.21) | (.23) | (.16) | — | (.16) | — | $12.35 | (1.73) * | $20 | .38 * | (.17) * | 35 * |
| July 31, 2011 | 11.79 | .24 | 1.60 | 1.84 | (.89) | — | (.89) | — | 12.74 | 15.76 | 90 | .75 | 1.85 | 72 |
| July 31, 2010 | 12.12 | .60 | .89 | 1.49 | (1.82) | — | (1.82) | — e | 11.79 | 12.24 | 57 | .75 | 4.92 | 86 |
| July 31, 2009 | 15.74 | — e | (3.05) | (3.05) | (.13) | (.44) | (.57) | — e | 12.12 | (18.78) | 43 | .85 | (.01) | 171 |
| July 31, 2008 | 21.12 | .10 | (2.83) | (2.73) | (.45) | (2.20) | (2.65) | — | 15.74 | (14.69) | 36 | .85 | .54 | 151 |
| July 31, 2007 | 18.74 | (.02) | 2.96 | 2.94 | (.22) | (.34) | (.56) | — e | 21.12 | 15.74 | 29 | .84 | (.11) | 68 |
| Class R | ||||||||||||||
| January 31, 2012 ** | $12.72 | .03 | (.26) | (.23) | (.44) | — | (.44) | — | $12.05 | (1.66) * | $832 | .25 * | .26 * | 35 * |
| July 31, 2011 | 11.77 | .26 | 1.60 | 1.86 | (.91) | — | (.91) | — | 12.72 | 16.04 | 669 | .50 | 2.08 | 72 |
| July 31, 2010 | 12.10 | .62 | .91 | 1.53 | (1.86) | — | (1.86) | — e | 11.77 | 12.56 | 406 | .50 | 5.09 | 86 |
| July 31, 2009 | 15.74 | .02 | (3.05) | (3.03) | (.17) | (.44) | (.61) | — e | 12.10 | (18.58) | 256 | .60 | .18 | 171 |
| July 31, 2008 | 21.12 | .13 | (2.81) | (2.68) | (.50) | (2.20) | (2.70) | — | 15.74 | (14.47) | 150 | .60 | .73 | 151 |
| July 31, 2007 | 18.77 | .08 | 2.92 | 3.00 | (.31) | (.34) | (.65) | — e | 21.12 | 16.08 | 66 | .59 | .38 | 68 |
| Class Y | ||||||||||||||
| January 31, 2012 ** | $12.91 | .05 | (.25) | (.20) | (.49) | — | (.49) | — | $12.22 | (1.39) * | $2,056 | — * | .43 * | 35 * |
| July 31, 2011 | 11.92 | .32 | 1.64 | 1.96 | (.97) | — | (.97) | — | 12.91 | 16.64 | 2,713 | — | 2.48 | 72 |
| July 31, 2010 | 12.22 | .76 | .84 | 1.60 | (1.90) | — | (1.90) | — e | 11.92 | 13.10 | 1,932 | — | 6.11 | 86 |
| July 31, 2009 | 15.89 | .11 | (3.12) | (3.01) | (.22) | (.44) | (.66) | — e | 12.22 | (18.20) | 1,951 | .10 | .95 | 171 |
| July 31, 2008 | 21.26 | .24 | (2.85) | (2.61) | (.56) | (2.20) | (2.76) | — | 15.89 | (14.04) | 3,417 | .10 | 1.26 | 151 |
| July 31, 2007 | 18.84 | .19 | 2.92 | 3.11 | (.35) | (.34) | (.69) | — e | 21.26 | 16.65 | 5,128 | .09 | .90 | 68 |
See page 66 for notes to financial highlights.
The accompanying notes are an integral part of these financial statements.
| 48 | 49 |
Financial highlights (For a common share outstanding throughout the period)
Putnam RetirementReady 2045 Fund
| INVESTMENT OPERATIONS: | LESS DISTRIBUTIONS: | RATIOS AND SUPPLEMENTAL DATA: | ||||||||||||
| Ratio | Ratio | |||||||||||||
| Net realized | From | of expenses | of net investment | |||||||||||
| Net asset value, | and unrealized | Total from | From | net realized | Total return | Net assets, | to average | income (loss) | Portfolio | |||||
| beginning | Net investment | gain (loss) | investment | net investment | gain | Total | Redemption | Net asset value, | at net asset | end of period | net assets | to average | turnover | |
| Period ended | of period | income (loss) a | on investments | operations | income | on investments | distributions | fees | end of period | value (%) b | (in thousands) | (%) c,d | net assets (%) d | (%) |
| Class A | ||||||||||||||
| January 31, 2012 ** | $14.37 | .05 | (.29) | (.24) | (.43) | — | (.43) | — | $13.70 | (1.54) * | $6,436 | .13 * | .38 * | 26 * |
| July 31, 2011 | 13.24 | .40 | 1.71 | 2.11 | (.98) | — | (.98) | — | 14.37 | 16.14 | 8,782 | .25 | 2.77 | 48 |
| July 31, 2010 | 13.23 | .70 | 1.02 | 1.72 | (1.71) | — | (1.71) | — e | 13.24 | 13.01 | 8,985 | .25 | 5.16 | 76 |
| July 31, 2009 | 17.10 | .09 | (3.27) | (3.18) | (.01) | (.68) | (.69) | — e | 13.23 | (17.96) | 10,108 | .35 | .73 | 158 |
| July 31, 2008 | 26.39 | .26 | (3.04) | (2.78) | (.93) | (5.58) | (6.51) | — e | 17.10 | (13.88) | 14,332 | .34 | 1.21 | 134 |
| July 31, 2007 | 24.07 | .25 | 3.64 | 3.89 | (.44) | (1.13) | (1.57) | — e | 26.39 | 16.36 | 22,590 | .33 | .93 | 78 |
| Class B | ||||||||||||||
| January 31, 2012 ** | $13.32 | — e | (.27) | (.27) | (.34) | — | (.34) | — | $12.71 | (1.87) * | $147 | .50 * | .03 * | 26 * |
| July 31, 2011 | 12.34 | .23 | 1.63 | 1.86 | (.88) | — | (.88) | — | 13.32 | 15.27 | 160 | 1.00 | 1.76 | 48 |
| July 31, 2010 | 12.45 | .62 | .90 | 1.52 | (1.63) | — | (1.63) | — e | 12.34 | 12.11 | 119 | 1.00 | 4.86 | 76 |
| July 31, 2009 | 16.25 | (.02) | (3.10) | (3.12) | — | (.68) | (.68) | — e | 12.45 | (18.53) | 138 | 1.10 | (.14) | 158 |
| July 31, 2008 | 25.42 | .09 | (2.89) | (2.80) | (.79) | (5.58) | (6.37) | — e | 16.25 | (14.52) | 158 | 1.09 | .45 | 134 |
| July 31, 2007 | 23.30 | .04 | 3.53 | 3.57 | (.32) | (1.13) | (1.45) | — e | 25.42 | 15.49 | 158 | 1.08 | .16 | 78 |
| Class C | ||||||||||||||
| January 31, 2012 ** | $13.42 | .01 | (.28) | (.27) | (.35) | — | (.35) | — | $12.80 | (1.92) * | $41 | .50 * | .05 * | 26 * |
| July 31, 2011 | 12.46 | .24 | 1.64 | 1.88 | (.92) | — | (.92) | — | 13.42 | 15.24 | 41 | 1.00 | 1.81 | 48 |
| July 31, 2010 | 12.56 | .54 | 1.00 | 1.54 | (1.64) | — | (1.64) | — e | 12.46 | 12.18 | 22 | 1.00 | 4.21 | 76 |
| July 31, 2009 | 16.39 | — e | (3.15) | (3.15) | — | (.68) | (.68) | — e | 12.56 | (18.55) | 13 | 1.10 | .01 | 158 |
| July 31, 2008 | 25.59 | .08 | (2.90) | (2.82) | (.80) | (5.58) | (6.38) | — e | 16.39 | (14.52) | 20 | 1.09 | .40 | 134 |
| July 31, 2007 | 23.40 | .03 | 3.55 | 3.58 | (.26) | (1.13) | (1.39) | — e | 25.59 | 15.48 | 17 | 1.08 | .12 | 78 |
| Class M | ||||||||||||||
| January 31, 2012 ** | $14.08 | .04 | (.31) | (.27) | (.40) | — | (.40) | — | $13.41 | (1.79) * | $12 | .38 * | .29 * | 26 * |
| July 31, 2011 | 13.01 | .28 | 1.72 | 2.00 | (.93) | — | (.93) | — | 14.08 | 15.52 | 9 | .75 | 2.01 | 48 |
| July 31, 2010 | 13.03 | .63 | 1.00 | 1.63 | (1.65) | — | (1.65) | — e | 13.01 | 12.45 | 6 | .75 | 4.71 | 76 |
| July 31, 2009 | 16.93 | .02 | (3.24) | (3.22) | — | (.68) | (.68) | — e | 13.03 | (18.37) | 5 | .85 | .18 | 158 |
| July 31, 2008 | 25.71 | .02 | (2.88) | (2.86) | (.35) | (5.58) | (5.93) | .01 | 16.93 | (14.29) | 7 | .84 | .13 | 134 |
| July 31, 2007 | 23.44 | .14 | 3.52 | 3.66 | (.26) | (1.13) | (1.39) | — e | 25.71 | 15.79 | 1 | .83 | .54 | 78 |
| Class R | ||||||||||||||
| January 31, 2012 ** | $14.68 | .04 | (.30) | (.26) | (.41) | — | (.41) | — | $14.01 | (1.66) * | $1,084 | .25 * | .33 * | 26 * |
| July 31, 2011 | 13.52 | .35 | 1.77 | 2.12 | (.96) | — | (.96) | — | 14.68 | 15.88 | 1,012 | .50 | 2.36 | 48 |
| July 31, 2010 | 13.49 | .61 | 1.10 | 1.71 | (1.68) | — | (1.68) | — e | 13.52 | 12.67 | 644 | .50 | 4.42 | 76 |
| July 31, 2009 | 17.44 | .05 | (3.32) | (3.27) | — | (.68) | (.68) | — e | 13.49 | (18.14) | 335 | .60 | .37 | 158 |
| July 31, 2008 | 26.84 | .17 | (3.06) | (2.89) | (.93) | (5.58) | (6.51) | — | 17.44 | (14.08) | 364 | .59 | .82 | 134 |
| July 31, 2007 | 24.53 | .14 | 3.76 | 3.90 | (.46) | (1.13) | (1.59) | — e | 26.84 | 16.09 | 193 | .58 | .52 | 78 |
| Class Y | ||||||||||||||
| January 31, 2012 ** | $16.77 | .06 | (.32) | (.26) | (.47) | — | (.47) | — | $16.04 | (1.40) * | $2,729 | — * | .41 * | 26 * |
| July 31, 2011 | 15.30 | .47 | 2.02 | 2.49 | (1.02) | — | (1.02) | — | 16.77 | 16.45 | 6,041 | — | 2.82 | 48 |
| July 31, 2010 | 15.05 | .92 | 1.08 | 2.00 | (1.75) | — | (1.75) | — e | 15.30 | 13.28 | 4,689 | — | 5.88 | 76 |
| July 31, 2009 | 19.33 | .13 | (3.68) | (3.55) | (.05) | (.68) | (.73) | — e | 15.05 | (17.77) | 4,366 | .10 | .92 | 158 |
| July 31, 2008 | 28.99 | .31 | (3.38) | (3.07) | (1.01) | (5.58) | (6.59) | — e | 19.33 | (13.66) | 7,181 | .09 | 1.29 | 134 |
| July 31, 2007 | 26.29 | .36 | 3.96 | 4.32 | (.49) | (1.13) | (1.62) | — e | 28.99 | 16.66 | 12,015 | .08 | 1.25 | 78 |
See page 66 for notes to financial highlights.
The accompanying notes are an integral part of these financial statements.
| 50 | 51 |
Financial highlights (For a common share outstanding throughout the period)
Putnam RetirementReady 2040 Fund
| INVESTMENT OPERATIONS: | LESS DISTRIBUTIONS: | RATIOS AND SUPPLEMENTAL DATA: | ||||||||||||
| Ratio | Ratio | |||||||||||||
| Net realized | From | of expenses | of net investment | |||||||||||
| Net asset value, | and unrealized | Total from | From | net realized | Total return | Net assets, | to average | income (loss) | Portfolio | |||||
| beginning | Net investment | gain (loss) | investment | net investment | gain | Total | Redemption | Net asset value, | at net asset | end of period | net assets | to average | turnover | |
| Period ended | of period | income (loss) a | on investments | operations | income | on investments | distributions | fees | end of period | value (%) b | (in thousands) | (%) c,d | net assets (%) d | (%) |
| Class A | ||||||||||||||
| January 31, 2012 ** | $15.59 | .07 | (.34) | (.27) | (.34) | — | (.34) | — | $14.98 | (1.63) * | $8,452 | .13 * | .48 * | 24 * |
| July 31, 2011 | 14.23 | .46 | 1.78 | 2.24 | (.88) | — | (.88) | — | 15.59 | 15.90 | 11,819 | .25 | 2.98 | 45 |
| July 31, 2010 | 13.92 | .70 | 1.14 | 1.84 | (1.53) | — | (1.53) | — e | 14.23 | 13.23 | 11,637 | .25 | 4.84 | 75 |
| July 31, 2009 | 17.50 | .12 | (3.18) | (3.06) | (.04) | (.48) | (.52) | — e | 13.92 | (17.02) | 13,919 | .35 | .93 | 158 |
| July 31, 2008 | 26.10 | .31 | (3.06) | (2.75) | (.93) | (4.92) | (5.85) | — e | 17.50 | (13.48) | 20,919 | .34 | 1.44 | 134 |
| July 31, 2007 | 24.01 | .29 | 3.45 | 3.74 | (.46) | (1.19) | (1.65) | — e | 26.10 | 15.77 | 30,802 | .33 | 1.11 | 60 |
| Class B | ||||||||||||||
| January 31, 2012 ** | $14.56 | .03 | (.33) | (.30) | (.25) | — | (.25) | — | $14.01 | (1.95) * | $442 | .50 * | .20 * | 24 * |
| July 31, 2011 | 13.38 | .32 | 1.67 | 1.99 | (.81) | — | (.81) | — | 14.56 | 15.00 | 434 | 1.00 | 2.21 | 45 |
| July 31, 2010 | 13.17 | .52 | 1.12 | 1.64 | (1.43) | — | (1.43) | — e | 13.38 | 12.39 | 258 | 1.00 | 3.83 | 75 |
| July 31, 2009 | 16.67 | .01 | (3.03) | (3.02) | — | (.48) | (.48) | — e | 13.17 | (17.66) | 226 | 1.10 | .09 | 158 |
| July 31, 2008 | 25.12 | .10 | (2.88) | (2.78) | (.75) | (4.92) | (5.67) | — e | 16.67 | (14.12) | 338 | 1.09 | .50 | 134 |
| July 31, 2007 | 23.25 | .08 | 3.35 | 3.43 | (.37) | (1.19) | (1.56) | — e | 25.12 | 14.91 | 278 | 1.08 | .30 | 60 |
| Class C | ||||||||||||||
| January 31, 2012 ** | $14.49 | .03 | (.32) | (.29) | (.28) | — | (.28) | — | $13.92 | (1.93) * | $161 | .50 * | .24 * | 24 * |
| July 31, 2011 | 13.32 | .27 | 1.70 | 1.97 | (.80) | — | (.80) | — | 14.49 | 14.96 | 137 | 1.00 | 1.88 | 45 |
| July 31, 2010 | 13.16 | .47 | 1.16 | 1.63 | (1.47) | — | (1.47) | — e | 13.32 | 12.37 | 90 | 1.00 | 3.44 | 75 |
| July 31, 2009 | 16.65 | (.02) | (2.99) | (3.01) | — | (.48) | (.48) | — e | 13.16 | (17.62) | 38 | 1.10 | (.14) | 158 |
| July 31, 2008 | 25.20 | .11 | (2.88) | (2.77) | (.86) | (4.92) | (5.78) | — e | 16.65 | (14.11) | 30 | 1.09 | .57 | 134 |
| July 31, 2007 | 23.31 | .01 | 3.42 | 3.43 | (.35) | (1.19) | (1.54) | — e | 25.20 | 14.92 | 18 | 1.08 | .05 | 60 |
| Class M | ||||||||||||||
| January 31, 2012 ** | $14.77 | .01 | (.30) | (.29) | (.21) | — | (.21) | — | $14.27 | (1.87) * | $20 | .38 * | .09 * | 24 * |
| July 31, 2011 | 13.53 | .31 | 1.75 | 2.06 | (.82) | — | (.82) | — | 14.77 | 15.34 | 31 | .75 | 2.11 | 45 |
| July 31, 2010 | 13.32 | .50 | 1.19 | 1.69 | (1.48) | — | (1.48) | — e | 13.53 | 12.65 | 18 | .75 | 3.58 | 75 |
| July 31, 2009 | 16.82 | .02 | (3.04) | (3.02) | — | (.48) | (.48) | — e | 13.32 | (17.46) | 15 | .85 | .13 | 158 |
| July 31, 2008 | 25.24 | .18 | (2.92) | (2.74) | (.76) | (4.92) | (5.68) | — e | 16.82 | (13.90) | 9 | .84 | .88 | 134 |
| July 31, 2007 | 23.32 | .19 | 3.31 | 3.50 | (.39) | (1.19) | (1.58) | — e | 25.24 | 15.19 | 14 | .83 | .76 | 60 |
| Class R | ||||||||||||||
| January 31, 2012 ** | $15.95 | .06 | (.34) | (.28) | (.32) | — | (.32) | — | $15.35 | (1.68) * | $2,054 | .25 * | .44 * | 24 * |
| July 31, 2011 | 14.57 | .42 | 1.82 | 2.24 | (.86) | — | (.86) | — | 15.95 | 15.55 | 2,057 | .50 | 2.63 | 45 |
| July 31, 2010 | 14.23 | .57 | 1.28 | 1.85 | (1.51) | — | (1.51) | — e | 14.57 | 12.97 | 1,278 | .50 | 3.86 | 75 |
| July 31, 2009 | 17.89 | .06 | (3.23) | (3.17) | (.01) | (.48) | (.49) | — e | 14.23 | (17.25) | 622 | .60 | .46 | 158 |
| July 31, 2008 | 26.61 | .20 | (3.06) | (2.86) | (.94) | (4.92) | (5.86) | — e | 17.89 | (13.68) | 499 | .59 | .98 | 134 |
| July 31, 2007 | 24.50 | .20 | 3.55 | 3.75 | (.45) | (1.19) | (1.64) | — e | 26.61 | 15.49 | 158 | .58 | .75 | 60 |
| Class Y | ||||||||||||||
| January 31, 2012 ** | $17.91 | .07 | (.35) | (.28) | (.39) | — | (.39) | — | $17.24 | (1.45) * | $3,492 | — * | .44 * | 24 * |
| July 31, 2011 | 16.23 | .53 | 2.07 | 2.60 | (.92) | — | (.92) | — | 17.91 | 16.17 | 10,316 | — | 2.99 | 45 |
| July 31, 2010 | 15.68 | .86 | 1.26 | 2.12 | (1.57) | — | (1.57) | — e | 16.23 | 13.52 | 8,053 | — | 5.22 | 75 |
| July 31, 2009 | 19.63 | .15 | (3.54) | (3.39) | (.08) | (.48) | (.56) | — e | 15.68 | (16.83) | 6,979 | .10 | 1.05 | 158 |
| July 31, 2008 | 28.57 | .36 | (3.38) | (3.02) | (1.00) | (4.92) | (5.92) | — e | 19.63 | (13.26) | 9,917 | .09 | 1.50 | 134 |
| July 31, 2007 | 26.13 | .40 | 3.74 | 4.14 | (.51) | (1.19) | (1.70) | — e | 28.57 | 16.06 | 16,298 | .08 | 1.39 | 60 |
See page 66 for notes to financial highlights.
The accompanying notes are an integral part of these financial statements.
| 52 | 53 |
Financial highlights (For a common share outstanding throughout the period)
Putnam RetirementReady 2035 Fund
| INVESTMENT OPERATIONS: | LESS DISTRIBUTIONS: | RATIOS AND SUPPLEMENTAL DATA: | ||||||||||||
| Ratio | Ratio | |||||||||||||
| Net realized | From | of expenses | of net investment | |||||||||||
| Net asset value, | and unrealized | Total from | From | net realized | Total return | Net assets, | to average | income (loss) | Portfolio | |||||
| beginning | Net investment | gain (loss) | investment | net investment | gain | Total | Redemption | Net asset value, | at net asset | end of period | net assets | to average | turnover | |
| Period ended | of period | income (loss) a | on investments | operations | income | on investments | distributions | fees | end of period | value (%) b | (in thousands) | (%) c,d | net assets (%) d | (%) |
| Class A | ||||||||||||||
| January 31, 2012 ** | $16.01 | .10 | (.39) | (.29) | (.42) | — | (.42) | — | $15.30 | (1.68) * | $13,935 | .13 * | .69 * | 26 * |
| July 31, 2011 | 14.50 | .52 | 1.67 | 2.19 | (.68) | — | (.68) | — | 16.01 | 15.23 | 18,629 | .25 | 3.32 | 45 |
| July 31, 2010 | 13.62 | .62 | 1.23 | 1.85 | (.97) | — | (.97) | — e | 14.50 | 13.57 | 18,603 | .25 | 4.29 | 65 |
| July 31, 2009 | 17.02 | .14 | (3.00) | (2.86) | (.06) | (.48) | (.54) | — e | 13.62 | (16.22) | 20,418 | .35 | 1.12 | 153 |
| July 31, 2008 | 25.13 | .34 | (2.84) | (2.50) | (.94) | (4.67) | (5.61) | — e | 17.02 | (12.79) | 29,945 | .34 | 1.65 | 127 |
| July 31, 2007 | 23.42 | .33 | 3.17 | 3.50 | (.49) | (1.30) | (1.79) | — e | 25.13 | 15.18 | 43,169 | .33 | 1.30 | 58 |
| Class B | ||||||||||||||
| January 31, 2012 ** | $14.89 | .06 | (.39) | (.33) | (.33) | — | (.33) | — | $14.23 | (2.12) * | $567 | .50 * | .40 * | 26 * |
| July 31, 2011 | 13.55 | .35 | 1.58 | 1.93 | (.59) | — | (.59) | — | 14.89 | 14.35 | 594 | 1.00 | 2.40 | 45 |
| July 31, 2010 | 12.80 | .51 | 1.13 | 1.64 | (.89) | — | (.89) | — e | 13.55 | 12.77 | 421 | 1.00 | 3.74 | 65 |
| July 31, 2009 | 16.07 | .03 | (2.82) | (2.79) | — | (.48) | (.48) | — e | 12.80 | (16.85) | 397 | 1.10 | .23 | 153 |
| July 31, 2008 | 24.06 | .16 | (2.69) | (2.53) | (.79) | (4.67) | (5.46) | — e | 16.07 | (13.46) | 486 | 1.09 | .85 | 127 |
| July 31, 2007 | 22.54 | .13 | 3.05 | 3.18 | (.36) | (1.30) | (1.66) | — e | 24.06 | 14.32 | 510 | 1.08 | .55 | 58 |
| Class C | ||||||||||||||
| January 31, 2012 ** | $14.91 | .06 | (.39) | (.33) | (.33) | — | (.33) | — | $14.25 | (2.15) * | $236 | .50 * | .40 * | 26 * |
| July 31, 2011 | 13.57 | .34 | 1.60 | 1.94 | (.60) | — | (.60) | — | 14.91 | 14.37 | 279 | 1.00 | 2.33 | 45 |
| July 31, 2010 | 12.83 | .42 | 1.21 | 1.63 | (.89) | — | (.89) | — e | 13.57 | 12.69 | 232 | 1.00 | 3.08 | 65 |
| July 31, 2009 | 16.10 | .01 | (2.80) | (2.79) | — | (.48) | (.48) | — e | 12.83 | (16.81) | 126 | 1.10 | .08 | 153 |
| July 31, 2008 | 24.12 | .15 | (2.68) | (2.53) | (.82) | (4.67) | (5.49) | — e | 16.10 | (13.45) | 108 | 1.09 | .78 | 127 |
| July 31, 2007 | 22.69 | .14 | 3.06 | 3.20 | (.47) | (1.30) | (1.77) | — e | 24.12 | 14.31 | 83 | 1.08 | .58 | 58 |
| Class M | ||||||||||||||
| January 31, 2012 ** | $15.14 | — e | (.30) | (.30) | — | — | — | — | $14.84 | (1.98) * | $13 | .38 * | (.04) * | 26 * |
| July 31, 2011 | 13.75 | .37 | 1.63 | 2.00 | (.61) | — | (.61) | — | 15.14 | 14.62 | 75 | .75 | 2.45 | 45 |
| July 31, 2010 | 12.97 | .51 | 1.17 | 1.68 | (.90) | — | (.90) | — e | 13.75 | 12.98 | 65 | .75 | 3.69 | 65 |
| July 31, 2009 | 16.25 | .07 | (2.85) | (2.78) | (.02) | (.48) | (.50) | — e | 12.97 | (16.60) | 58 | .85 | .63 | 153 |
| July 31, 2008 | 24.26 | .21 | (2.72) | (2.51) | (.83) | (4.67) | (5.50) | — e | 16.25 | (13.23) | 53 | .84 | 1.08 | 127 |
| July 31, 2007 | 22.68 | .18 | 3.09 | 3.27 | (.39) | (1.30) | (1.69) | — e | 24.26 | 14.60 | 63 | .83 | .74 | 58 |
| Class R | ||||||||||||||
| January 31, 2012 ** | $15.45 | .10 | (.40) | (.30) | (.40) | — | (.40) | — | $14.75 | (1.80) * | $2,570 | .25 * | .67 * | 26 * |
| July 31, 2011 | 14.04 | .41 | 1.67 | 2.08 | (.67) | — | (.67) | — | 15.45 | 14.91 | 2,361 | .50 | 2.66 | 45 |
| July 31, 2010 | 13.22 | .45 | 1.31 | 1.76 | (.94) | — | (.94) | — e | 14.04 | 13.34 | 1,278 | .50 | 3.21 | 65 |
| July 31, 2009 | 16.57 | .07 | (2.89) | (2.82) | (.05) | (.48) | (.53) | — e | 13.22 | (16.45) | 636 | .60 | .61 | 153 |
| July 31, 2008 | 24.66 | .25 | (2.74) | (2.49) | (.93) | (4.67) | (5.60) | — e | 16.57 | (13.01) | 500 | .59 | 1.28 | 127 |
| July 31, 2007 | 23.08 | .21 | 3.17 | 3.38 | (.50) | (1.30) | (1.80) | — e | 24.66 | 14.89 | 302 | .58 | .83 | 58 |
| Class Y | ||||||||||||||
| January 31, 2012 ** | $18.35 | .11 | (.43) | (.32) | (.47) | — | (.47) | — | $17.56 | (1.62) * | $5,763 | — * | .66 * | 26 * |
| July 31, 2011 | 16.53 | .59 | 1.95 | 2.54 | (.72) | — | (.72) | — | 18.35 | 15.48 | 13,740 | — | 3.24 | 45 |
| July 31, 2010 | 15.40 | .79 | 1.34 | 2.13 | (1.00) | — | (1.00) | — e | 16.53 | 13.86 | 10,601 | — | 4.78 | 65 |
| July 31, 2009 | 19.14 | .20 | (3.36) | (3.16) | (.10) | (.48) | (.58) | — e | 15.40 | (15.98) | 9,867 | .10 | 1.37 | 153 |
| July 31, 2008 | 27.59 | .41 | (3.18) | (2.77) | (1.01) | (4.67) | (5.68) | — e | 19.14 | (12.61) | 17,989 | .09 | 1.77 | 127 |
| July 31, 2007 | 25.53 | .43 | 3.47 | 3.90 | (.54) | (1.30) | (1.84) | — e | 27.59 | 15.47 | 29,456 | .08 | 1.57 | 58 |
See page 66 for notes to financial highlights.
The accompanying notes are an integral part of these financial statements.
| 54 | 55 |
Financial highlights (For a common share outstanding throughout the period)
Putnam RetirementReady 2030 Fund
| INVESTMENT OPERATIONS: | LESS DISTRIBUTIONS: | RATIOS AND SUPPLEMENTAL DATA: | ||||||||||||
| Ratio | Ratio | |||||||||||||
| Net realized | From | of expenses | of net investment | |||||||||||
| Net asset value, | and unrealized | Total from | From | net realized | Total return | Net assets, | to average | income (loss) | Portfolio | |||||
| beginning | Net investment | gain (loss) | investment | net investment | gain | Total | Redemption | Net asset value, | at net asset | end of period | net assets | to average | turnover | |
| Period ended | of period | income (loss) a | on investments | operations | income | on investments | distributions | fees | end of period | value (%) b | (in thousands) | (%) c,d | net assets (%) d | (%) |
| Class A | ||||||||||||||
| January 31, 2012 ** | $16.22 | .13 | (.42) | (.29) | (.35) | — | (.35) | — | $15.58 | (1.71) * | $18,974 | .13 * | .89 * | 25 * |
| July 31, 2011 | 14.70 | .54 | 1.51 | 2.05 | (.53) | — | (.53) | — | 16.22 | 14.08 | 26,432 | .25 | 3.39 | 43 |
| July 31, 2010 | 13.46 | .53 | 1.31 | 1.84 | (.60) | — | (.60) | — e | 14.70 | 13.73 | 25,133 | .25 | 3.66 | 73 |
| July 31, 2009 | 16.85 | .17 | (2.85) | (2.68) | (.11) | (.60) | (.71) | — e | 13.46 | (15.08) | 27,113 | .35 | 1.33 | 148 |
| July 31, 2008 | 24.69 | .39 | (2.70) | (2.31) | (.94) | (4.59) | (5.53) | — e | 16.85 | (12.03) | 38,938 | .34 | 1.93 | 122 |
| July 31, 2007 | 23.13 | .37 | 2.95 | 3.32 | (.51) | (1.25) | (1.76) | — e | 24.69 | 14.57 | 55,378 | .32 | 1.50 | 65 |
| Class B | ||||||||||||||
| January 31, 2012 ** | $15.47 | .09 | (.42) | (.33) | (.25) | — | (.25) | — | $14.89 | (2.05) * | $1,000 | .50 * | .66 * | 25 * |
| July 31, 2011 | 14.06 | .38 | 1.47 | 1.85 | (.44) | — | (.44) | — | 15.47 | 13.20 | 1,015 | 1.00 | 2.48 | 43 |
| July 31, 2010 | 12.92 | .42 | 1.24 | 1.66 | (.52) | — | (.52) | — e | 14.06 | 12.89 | 810 | 1.00 | 3.00 | 73 |
| July 31, 2009 | 16.17 | .05 | (2.70) | (2.65) | — e | (.60) | (.60) | — e | 12.92 | (15.74) | 642 | 1.10 | .38 | 148 |
| July 31, 2008 | 23.91 | .20 | (2.57) | (2.37) | (.78) | (4.59) | (5.37) | — e | 16.17 | (12.70) | 687 | 1.09 | 1.07 | 122 |
| July 31, 2007 | 22.50 | .18 | 2.85 | 3.03 | (.37) | (1.25) | (1.62) | — e | 23.91 | 13.70 | 609 | 1.07 | .74 | 65 |
| Class C | ||||||||||||||
| January 31, 2012 ** | $15.50 | .09 | (.41) | (.32) | (.26) | — | (.26) | — | $14.92 | (2.02) * | $571 | .50 * | .66 * | 25 * |
| July 31, 2011 | 14.11 | .35 | 1.50 | 1.85 | (.46) | — | (.46) | — | 15.50 | 13.20 | 558 | 1.00 | 2.30 | 43 |
| July 31, 2010 | 12.97 | .29 | 1.39 | 1.68 | (.54) | — | (.54) | — e | 14.11 | 12.93 | 376 | 1.00 | 2.07 | 73 |
| July 31, 2009 | 16.24 | .03 | (2.70) | (2.67) | — e | (.60) | (.60) | — e | 12.97 | (15.78) | 144 | 1.10 | .25 | 148 |
| July 31, 2008 | 24.03 | .20 | (2.59) | (2.39) | (.81) | (4.59) | (5.40) | — e | 16.24 | (12.72) | 118 | 1.09 | 1.03 | 122 |
| July 31, 2007 | 22.45 | .11 | 2.93 | 3.04 | (.21) | (1.25) | (1.46) | — e | 24.03 | 13.71 | 90 | 1.07 | .45 | 65 |
| Class M | ||||||||||||||
| January 31, 2012 ** | $15.52 | .01 | (.31) | (.30) | — | — | — | — | $15.22 | (1.93) * | $81 | .38 * | .07 * | 25 * |
| July 31, 2011 | 14.09 | .43 | 1.46 | 1.89 | (.46) | — | (.46) | — | 15.52 | 13.48 | 591 | .75 | 2.80 | 43 |
| July 31, 2010 | 12.93 | .45 | 1.25 | 1.70 | (.54) | — | (.54) | — e | 14.09 | 13.19 | 578 | .75 | 3.21 | 73 |
| July 31, 2009 | 16.20 | .08 | (2.71) | (2.63) | (.04) | (.60) | (.64) | — e | 12.93 | (15.53) | 612 | .85 | .69 | 148 |
| July 31, 2008 | 23.95 | .27 | (2.60) | (2.33) | (.83) | (4.59) | (5.42) | — e | 16.20 | (12.49) | 691 | .84 | 1.38 | 122 |
| July 31, 2007 | 22.55 | .25 | 2.86 | 3.11 | (.46) | (1.25) | (1.71) | — e | 23.95 | 13.99 | 776 | .82 | 1.04 | 65 |
| Class R | ||||||||||||||
| January 31, 2012 ** | $15.43 | .14 | (.43) | (.29) | (.34) | — | (.34) | — | $14.80 | (1.82) * | $4,294 | .25 * | .98 * | 25 * |
| July 31, 2011 | 14.05 | .46 | 1.46 | 1.92 | (.54) | — | (.54) | — | 15.43 | 13.73 | 3,367 | .50 | 3.04 | 43 |
| July 31, 2010 | 12.89 | .29 | 1.45 | 1.74 | (.58) | — | (.58) | — e | 14.05 | 13.50 | 1,875 | .50 | 2.09 | 73 |
| July 31, 2009 | 16.19 | .11 | (2.72) | (2.61) | (.09) | (.60) | (.69) | — e | 12.89 | (15.33) | 582 | .60 | .94 | 148 |
| July 31, 2008 | 24.00 | .29 | (2.57) | (2.28) | (.94) | (4.59) | (5.53) | — e | 16.19 | (12.28) | 704 | .59 | 1.57 | 122 |
| July 31, 2007 | 22.56 | .27 | 2.90 | 3.17 | (.48) | (1.25) | (1.73) | — e | 24.00 | 14.27 | 246 | .57 | 1.10 | 65 |
| Class Y | ||||||||||||||
| January 31, 2012 ** | $18.31 | .16 | (.47) | (.31) | (.40) | — | (.40) | — | $17.60 | (1.60) * | $6,223 | — * | .92 * | 25 * |
| July 31, 2011 | 16.53 | .62 | 1.73 | 2.35 | (.57) | — | (.57) | — | 18.31 | 14.35 | 14,657 | — | 3.42 | 43 |
| July 31, 2010 | 15.06 | .71 | 1.40 | 2.11 | (.64) | — | (.64) | — e | 16.53 | 14.02 | 10,996 | — | 4.32 | 73 |
| July 31, 2009 | 18.74 | .25 | (3.18) | (2.93) | (.15) | (.60) | (.75) | — e | 15.06 | (14.87) | 10,564 | .10 | 1.79 | 148 |
| July 31, 2008 | 26.86 | .47 | (2.99) | (2.52) | (1.01) | (4.59) | (5.60) | — e | 18.74 | (11.84) | 25,779 | .09 | 2.09 | 122 |
| July 31, 2007 | 25.01 | .48 | 3.18 | 3.66 | (.56) | (1.25) | (1.81) | — e | 26.86 | 14.85 | 36,228 | .07 | 1.78 | 65 |
See page 66 for notes to financial highlights.
The accompanying notes are an integral part of these financial statements.
| 56 | 57 |
Financial highlights (For a common share outstanding throughout the period)
Putnam RetirementReady 2025 Fund
| INVESTMENT OPERATIONS: | LESS DISTRIBUTIONS: | RATIOS AND SUPPLEMENTAL DATA: | ||||||||||||
| Ratio | Ratio | |||||||||||||
| Net realized | From | of expenses | of net investment | |||||||||||
| Net asset value, | and unrealized | Total from | From | net realized | Total return | Net assets, | to average | income (loss) | Portfolio | |||||
| beginning | Net investment | gain (loss) | investment | net investment | gain | Total | Redemption | Net asset value, | at net asset | end of period | net assets | to average | turnover | |
| Period ended | of period | income (loss) a | on investments | operations | income | on investments | distributions | fees | end of period | value (%) b | (in thousands) | (%) c,d | net assets (%) d | (%) |
| Class A | ||||||||||||||
| January 31, 2012 ** | $17.36 | .19 | (.43) | (.24) | (.56) | — | (.56) | — | $16.56 | (1.26) * | $23,845 | .13 * | 1.19 * | 24 * |
| July 31, 2011 | 15.98 | .59 | 1.36 | 1.95 | (.57) | — | (.57) | — | 17.36 | 12.30 | 33,235 | .25 | 3.46 | 50 |
| July 31, 2010 | 14.54 | .56 | 1.41 | 1.97 | (.53) | — | (.53) | — e | 15.98 | 13.61 | 32,661 | .25 | 3.56 | 79 |
| July 31, 2009 | 17.78 | .26 | (2.90) | (2.64) | (.15) | (.45) | (.60) | — e | 14.54 | (14.28) | 33,256 | .35 | 1.95 | 139 |
| July 31, 2008 | 25.65 | .47 | (2.68) | (2.21) | (.97) | (4.69) | (5.66) | — e | 17.78 | (11.07) | 46,218 | .34 | 2.18 | 118 |
| July 31, 2007 | 24.30 | .43 | 2.90 | 3.33 | (.55) | (1.43) | (1.98) | — e | 25.65 | 13.91 | 68,996 | .32 | 1.67 | 63 |
| Class B | ||||||||||||||
| January 31, 2012 ** | $16.31 | .14 | (.41) | (.27) | (.46) | — | (.46) | — | $15.58 | (1.56) * | $899 | .50 * | .94 * | 24 * |
| July 31, 2011 | 15.05 | .42 | 1.30 | 1.72 | (.46) | — | (.46) | — | 16.31 | 11.47 | 930 | 1.00 | 2.64 | 50 |
| July 31, 2010 | 13.75 | .41 | 1.33 | 1.74 | (.44) | — | (.44) | — e | 15.05 | 12.65 | 894 | 1.00 | 2.77 | 79 |
| July 31, 2009 | 16.80 | .14 | (2.71) | (2.57) | (.03) | (.45) | (.48) | — e | 13.75 | (14.87) | 777 | 1.10 | 1.09 | 139 |
| July 31, 2008 | 24.55 | .28 | (2.53) | (2.25) | (.81) | (4.69) | (5.50) | — e | 16.80 | (11.74) | 928 | 1.09 | 1.40 | 118 |
| July 31, 2007 | 23.40 | .22 | 2.79 | 3.01 | (.43) | (1.43) | (1.86) | — e | 24.55 | 13.06 | 1,144 | 1.07 | .90 | 63 |
| Class C | ||||||||||||||
| January 31, 2012 ** | $16.35 | .15 | (.42) | (.27) | (.48) | — | (.48) | — | $15.60 | (1.58) * | $540 | .50 * | .96 * | 24 * |
| July 31, 2011 | 15.11 | .38 | 1.34 | 1.72 | (.48) | — | (.48) | — | 16.35 | 11.46 | 517 | 1.00 | 2.37 | 50 |
| July 31, 2010 | 13.81 | .36 | 1.39 | 1.75 | (.45) | — | (.45) | — e | 15.11 | 12.70 | 334 | 1.00 | 2.43 | 79 |
| July 31, 2009 | 16.87 | .12 | (2.70) | (2.58) | (.03) | (.45) | (.48) | — e | 13.81 | (14.88) | 196 | 1.10 | .95 | 139 |
| July 31, 2008 | 24.64 | .28 | (2.53) | (2.25) | (.83) | (4.69) | (5.52) | — e | 16.87 | (11.74) | 151 | 1.09 | 1.39 | 118 |
| July 31, 2007 | 23.45 | .23 | 2.79 | 3.02 | (.40) | (1.43) | (1.83) | — e | 24.64 | 13.07 | 181 | 1.07 | .91 | 63 |
| Class M | ||||||||||||||
| January 31, 2012 ** | $16.54 | .16 | (.42) | (.26) | (.48) | — | (.48) | — | $15.80 | (1.46) * | $130 | .38 * | 1.03 * | 24 * |
| July 31, 2011 | 15.26 | .45 | 1.33 | 1.78 | (.50) | — | (.50) | — | 16.54 | 11.76 | 163 | .75 | 2.79 | 50 |
| July 31, 2010 | 13.95 | .48 | 1.33 | 1.81 | (.50) | — | (.50) | — e | 15.26 | 12.98 | 154 | .75 | 3.18 | 79 |
| July 31, 2009 | 16.96 | .18 | (2.74) | (2.56) | — | (.45) | (.45) | — e | 13.95 | (14.68) | 94 | .85 | 1.36 | 139 |
| July 31, 2008 | 24.72 | .34 | (2.56) | (2.22) | (.85) | (4.69) | (5.54) | — e | 16.96 | (11.53) | 120 | .84 | 1.67 | 118 |
| July 31, 2007 | 23.49 | .29 | 2.80 | 3.09 | (.43) | (1.43) | (1.86) | — e | 24.72 | 13.34 | 295 | .82 | 1.16 | 63 |
| Class R | ||||||||||||||
| January 31, 2012 ** | $16.32 | .18 | (.42) | (.24) | (.54) | — | (.54) | — | $15.54 | (1.34) * | $3,518 | .25 * | 1.20 * | 24 * |
| July 31, 2011 | 15.09 | .49 | 1.31 | 1.80 | (.57) | — | (.57) | — | 16.32 | 12.01 | 3,393 | .50 | 3.04 | 50 |
| July 31, 2010 | 13.77 | .45 | 1.38 | 1.83 | (.51) | — | (.51) | — e | 15.09 | 13.30 | 1,766 | .50 | 3.01 | 79 |
| July 31, 2009 | 16.91 | .18 | (2.73) | (2.55) | (.14) | (.45) | (.59) | — e | 13.77 | (14.49) | 1,097 | .60 | 1.46 | 139 |
| July 31, 2008 | 24.72 | .34 | (2.50) | (2.16) | (.96) | (4.69) | (5.65) | — e | 16.91 | (11.30) | 697 | .59 | 1.77 | 118 |
| July 31, 2007 | 23.54 | .33 | 2.83 | 3.16 | (.55) | (1.43) | (1.98) | — e | 24.72 | 13.64 | 284 | .57 | 1.31 | 63 |
| Class Y | ||||||||||||||
| January 31, 2012 ** | $17.45 | .21 | (.43) | (.22) | (.62) | — | (.62) | — | $16.61 | (1.13) * | $6,699 | — * | 1.30 * | 24 * |
| July 31, 2011 | 16.05 | .60 | 1.41 | 2.01 | (.61) | — | (.61) | — | 17.45 | 12.65 | 13,497 | — | 3.47 | 50 |
| July 31, 2010 | 14.61 | .67 | 1.34 | 2.01 | (.57) | — | (.57) | — e | 16.05 | 13.80 | 10,764 | — | 4.24 | 79 |
| July 31, 2009 | 17.87 | .34 | (2.95) | (2.61) | (.20) | (.45) | (.65) | — e | 14.61 | (14.04) | 11,294 | .10 | 2.48 | 139 |
| July 31, 2008 | 25.77 | .50 | (2.67) | (2.17) | (1.04) | (4.69) | (5.73) | — e | 17.87 | (10.85) | 34,366 | .09 | 2.32 | 118 |
| July 31, 2007 | 24.40 | .51 | 2.89 | 3.40 | (.60) | (1.43) | (2.03) | — e | 25.77 | 14.20 | 51,638 | .07 | 1.96 | 63 |
See page 66 for notes to financial highlights.
The accompanying notes are an integral part of these financial statements.
| 58 | 59 |
Financial highlights (For a common share outstanding throughout the period)
Putnam RetirementReady 2020 Fund
| INVESTMENT OPERATIONS: | LESS DISTRIBUTIONS: | RATIOS AND SUPPLEMENTAL DATA: | ||||||||||||
| Ratio | Ratio | |||||||||||||
| Net realized | From | of expenses | of net investment | |||||||||||
| Net asset value, | and unrealized | Total from | From | net realized | Total return | Net assets, | to average | income (loss) | Portfolio | |||||
| beginning | Net investment | gain (loss) | investment | net investment | gain | Total | Redemption | Net asset value, | at net asset | end of period | net assets | to average | turnover | |
| Period ended | of period | income (loss) a | on investments | operations | income | on investments | distributions | fees | end of period | value (%) b | (in thousands) | (%) c,d | net assets (%) d | (%) |
| Class A | ||||||||||||||
| January 31, 2012 ** | $16.45 | .23 | (.40) | (.17) | (.70) | — | (.70) | — | $15.58 | (.91) * | $25,415 | .13 * | 1.46 * | 23 * |
| July 31, 2011 | 15.44 | .54 | 1.03 | 1.57 | (.56) | — | (.56) | — | 16.45 | 10.30 | 33,513 | .25 | 3.34 | 55 |
| July 31, 2010 | 14.26 | .54 | 1.30 | 1.84 | (.66) | — | (.66) | — e | 15.44 | 12.99 | 34,289 | .25 | 3.54 | 84 |
| July 31, 2009 | 17.01 | .44 | (2.73) | (2.29) | (.23) | (.23) | (.46) | — e | 14.26 | (13.00) | 35,294 | .35 | 3.30 | 138 |
| July 31, 2008 | 23.04 | .52 | (2.29) | (1.77) | (.89) | (3.37) | (4.26) | — e | 17.01 | (9.55) | 53,340 | .34 | 2.58 | 115 |
| July 31, 2007 | 22.04 | .46 | 2.23 | 2.69 | (.56) | (1.13) | (1.69) | — e | 23.04 | 12.36 | 88,759 | .32 | 1.99 | 56 |
| Class B | ||||||||||||||
| January 31, 2012 ** | $15.90 | .18 | (.40) | (.22) | (.61) | — | (.61) | — | $15.07 | (1.30) * | $830 | .50 * | 1.21 * | 23 * |
| July 31, 2011 | 14.94 | .39 | 1.01 | 1.40 | (.44) | — | (.44) | — | 15.90 | 9.46 | 808 | 1.00 | 2.47 | 55 |
| July 31, 2010 | 13.84 | .42 | 1.25 | 1.67 | (.57) | — | (.57) | — e | 14.94 | 12.11 | 695 | 1.00 | 2.87 | 84 |
| July 31, 2009 | 16.46 | .32 | (2.60) | (2.28) | (.11) | (.23) | (.34) | — e | 13.84 | (13.60) | 699 | 1.10 | 2.49 | 138 |
| July 31, 2008 | 22.45 | .33 | (2.20) | (1.87) | (.75) | (3.37) | (4.12) | — e | 16.46 | (10.26) | 794 | 1.09 | 1.75 | 115 |
| July 31, 2007 | 21.57 | .28 | 2.18 | 2.46 | (.45) | (1.13) | (1.58) | — e | 22.45 | 11.53 | 750 | 1.07 | 1.23 | 56 |
| Class C | ||||||||||||||
| January 31, 2012 ** | $15.95 | .18 | (.40) | (.22) | (.61) | — | (.61) | — | $15.12 | (1.27) * | $727 | .50 * | 1.21 * | 23 * |
| July 31, 2011 | 14.99 | .33 | 1.07 | 1.40 | (.44) | — | (.44) | — | 15.95 | 9.43 | 733 | 1.00 | 2.08 | 55 |
| July 31, 2010 | 13.90 | .41 | 1.27 | 1.68 | (.59) | — | (.59) | — e | 14.99 | 12.14 | 483 | 1.00 | 2.75 | 84 |
| July 31, 2009 | 16.55 | .29 | (2.59) | (2.30) | (.12) | (.23) | (.35) | — e | 13.90 | (13.62) | 367 | 1.10 | 2.27 | 138 |
| July 31, 2008 | 22.57 | .33 | (2.21) | (1.88) | (.77) | (3.37) | (4.14) | — e | 16.55 | (10.24) | 236 | 1.09 | 1.77 | 115 |
| July 31, 2007 | 21.61 | .27 | 2.20 | 2.47 | (.38) | (1.13) | (1.51) | — e | 22.57 | 11.53 | 178 | 1.07 | 1.16 | 56 |
| Class M | ||||||||||||||
| January 31, 2012 ** | $16.14 | .19 | (.40) | (.21) | (.61) | — | (.61) | — | $15.32 | (1.21) * | $154 | .38 * | 1.24 * | 23 * |
| July 31, 2011 | 15.16 | .46 | 1.00 | 1.46 | (.48) | — | (.48) | — | 16.14 | 9.74 | 213 | .75 | 2.91 | 55 |
| July 31, 2010 | 14.02 | .46 | 1.27 | 1.73 | (.59) | — | (.59) | — e | 15.16 | 12.38 | 234 | .75 | 3.08 | 84 |
| July 31, 2009 | 16.56 | .37 | (2.62) | (2.25) | (.06) | (.23) | (.29) | — e | 14.02 | (13.38) | 218 | .85 | 2.81 | 138 |
| July 31, 2008 | 22.57 | .39 | (2.22) | (1.83) | (.81) | (3.37) | (4.18) | — e | 16.56 | (10.03) | 440 | .84 | 2.03 | 115 |
| July 31, 2007 | 21.64 | .33 | 2.20 | 2.53 | (.47) | (1.13) | (1.60) | — e | 22.57 | 11.82 | 1,056 | .82 | 1.44 | 56 |
| Class R | ||||||||||||||
| January 31, 2012 ** | $15.89 | .22 | (.40) | (.18) | (.68) | — | (.68) | — | $15.03 | (1.04) * | $3,154 | .25 * | 1.48 * | 23 * |
| July 31, 2011 | 14.98 | .48 | 1.01 | 1.49 | (.58) | — | (.58) | — | 15.89 | 10.04 | 3,172 | .50 | 3.06 | 55 |
| July 31, 2010 | 13.87 | .43 | 1.31 | 1.74 | (.63) | — | (.63) | — e | 14.98 | 12.62 | 1,051 | .50 | 2.89 | 84 |
| July 31, 2009 | 16.57 | .38 | (2.63) | (2.25) | (.22) | (.23) | (.45) | — e | 13.87 | (13.19) | 461 | .60 | 3.01 | 138 |
| July 31, 2008 | 22.60 | .40 | (2.18) | (1.78) | (.88) | (3.37) | (4.25) | — e | 16.57 | (9.78) | 612 | .59 | 2.17 | 115 |
| July 31, 2007 | 21.67 | .39 | 2.20 | 2.59 | (.53) | (1.13) | (1.66) | — e | 22.60 | 12.09 | 232 | .57 | 1.69 | 56 |
| Class Y | ||||||||||||||
| January 31, 2012 ** | $18.19 | .26 | (.43) | (.17) | (.75) | — | (.75) | — | $17.27 | (.80) * | $3,482 | — * | 1.48 * | 23 * |
| July 31, 2011 | 17.01 | .61 | 1.18 | 1.79 | (.61) | — | (.61) | — | 18.19 | 10.60 | 10,446 | — | 3.42 | 55 |
| July 31, 2010 | 15.65 | .69 | 1.37 | 2.06 | (.70) | — | (.70) | — e | 17.01 | 13.21 | 7,976 | — | 4.10 | 84 |
| July 31, 2009 | 18.61 | .55 | (3.00) | (2.45) | (.28) | (.23) | (.51) | — e | 15.65 | (12.77) | 9,010 | .10 | 3.72 | 138 |
| July 31, 2008 | 24.83 | .60 | (2.49) | (1.89) | (.96) | (3.37) | (4.33) | — e | 18.61 | (9.33) | 35,542 | .09 | 2.76 | 115 |
| July 31, 2007 | 23.63 | .56 | 2.38 | 2.94 | (.61) | (1.13) | (1.74) | — e | 24.83 | 12.63 | 52,519 | .07 | 2.26 | 56 |
See page 66 for notes to financial highlights.
The accompanying notes are an integral part of these financial statements.
| 60 | 61 |
Financial highlights (For a common share outstanding throughout the period)
Putnam RetirementReady 2015 Fund
| INVESTMENT OPERATIONS: | LESS DISTRIBUTIONS: | RATIOS AND SUPPLEMENTAL DATA: | ||||||||||||
| Ratio | Ratio | |||||||||||||
| Net realized | From | of expenses | of net investment | |||||||||||
| Net asset value, | and unrealized | Total from | From | net realized | Total return | Net assets, | to average | income (loss) | Portfolio | |||||
| beginning | Net investment | gain (loss) | investment | net investment | gain | Total | Redemption | Net asset value, | at net asset | end of period | net assets | to average | turnover | |
| Period ended | of period | income (loss) a | on investments | operations | income | on investments | distributions | fees | end of period | value (%) b | (in thousands) | (%) c,d | net assets (%) d | (%) |
| Class A | ||||||||||||||
| January 31, 2012 ** | $16.93 | .23 | (.42) | (.19) | (.81) | — | (.81) | — | $15.93 | (1.03) * | $20,522 | .13 * | 1.41 * | 25 * |
| July 31, 2011 | 16.22 | .51 | .79 | 1.30 | (.59) | — | (.59) | — | 16.93 | 8.09 | 29,768 | .25 | 3.06 | 55 |
| July 31, 2010 | 15.25 | .52 | 1.17 | 1.69 | (.72) | — | (.72) | — e | 16.22 | 11.20 | 31,451 | .25 | 3.25 | 90 |
| July 31, 2009 | 18.14 | .66 | (2.84) | (2.18) | (.50) | (.21) | (.71) | — e | 15.25 | (11.40) | 46,905 | .35 | 4.58 | 126 |
| July 31, 2008 | 22.61 | .66 | (1.96) | (1.30) | (.93) | (2.24) | (3.17) | — e | 18.14 | (6.78) | 62,496 | .34 | 3.25 | 109 |
| July 31, 2007 | 21.88 | .58 | 1.67 | 2.25 | (.58) | (.94) | (1.52) | — e | 22.61 | 10.37 | 83,238 | .32 | 2.55 | 69 |
| Class B | ||||||||||||||
| January 31, 2012 ** | $16.45 | .19 | (.43) | (.24) | (.71) | — | (.71) | — | $15.50 | (1.37) * | $463 | .50 * | 1.23 * | 25 * |
| July 31, 2011 | 15.78 | .37 | .77 | 1.14 | (.47) | — | (.47) | — | 16.45 | 7.27 | 485 | 1.00 | 2.27 | 55 |
| July 31, 2010 | 14.88 | .39 | 1.13 | 1.52 | (.62) | — | (.62) | — e | 15.78 | 10.30 | 467 | 1.00 | 2.51 | 90 |
| July 31, 2009 | 17.63 | .52 | (2.73) | (2.21) | (.33) | (.21) | (.54) | — e | 14.88 | (12.04) | 548 | 1.10 | 3.68 | 126 |
| July 31, 2008 | 22.05 | .49 | (1.91) | (1.42) | (.76) | (2.24) | (3.00) | — e | 17.63 | (7.48) | 465 | 1.09 | 2.48 | 109 |
| July 31, 2007 | 21.44 | .40 | 1.63 | 2.03 | (.48) | (.94) | (1.42) | — e | 22.05 | 9.55 | 781 | 1.07 | 1.80 | 69 |
| Class C | ||||||||||||||
| January 31, 2012 ** | $16.44 | .19 | (.44) | (.25) | (.71) | — | (.71) | — | $15.48 | (1.44) * | $629 | .50 * | 1.22 * | 25 * |
| July 31, 2011 | 15.75 | .37 | .77 | 1.14 | (.45) | — | (.45) | — | 16.44 | 7.29 | 668 | 1.00 | 2.28 | 55 |
| July 31, 2010 | 14.88 | .32 | 1.21 | 1.53 | (.66) | — | (.66) | — e | 15.75 | 10.33 | 673 | 1.00 | 2.04 | 90 |
| July 31, 2009 | 17.69 | .54 | (2.76) | (2.22) | (.38) | (.21) | (.59) | — e | 14.88 | (12.06) | 261 | 1.10 | 3.78 | 126 |
| July 31, 2008 | 22.09 | .48 | (1.90) | (1.42) | (.74) | (2.24) | (2.98) | — e | 17.69 | (7.47) | 363 | 1.09 | 2.47 | 109 |
| July 31, 2007 | 21.44 | .39 | 1.62 | 2.01 | (.42) | (.94) | (1.36) | — e | 22.09 | 9.54 | 168 | 1.07 | 1.77 | 69 |
| Class M | ||||||||||||||
| January 31, 2012 ** | $16.63 | .16 | (.39) | (.23) | (.65) | — | (.65) | — | $15.75 | (1.33) * | $160 | .38 * | 1.03 * | 25 * |
| July 31, 2011 | 15.96 | .41 | .78 | 1.19 | (.52) | — | (.52) | — | 16.63 | 7.53 | 329 | .75 | 2.51 | 55 |
| July 31, 2010 | 15.02 | .41 | 1.18 | 1.59 | (.65) | — | (.65) | — e | 15.96 | 10.65 | 385 | .75 | 2.56 | 90 |
| July 31, 2009 | 17.78 | .55 | (2.74) | (2.19) | (.36) | (.21) | (.57) | — e | 15.02 | (11.82) | 262 | .85 | 3.75 | 126 |
| July 31, 2008 | 22.23 | .52 | (1.90) | (1.38) | (.83) | (2.24) | (3.07) | — e | 17.78 | (7.24) | 499 | .84 | 2.71 | 109 |
| July 31, 2007 | 21.54 | .46 | 1.63 | 2.09 | (.46) | (.94) | (1.40) | — e | 22.23 | 9.82 | 156 | .82 | 2.03 | 69 |
| Class R | ||||||||||||||
| January 31, 2012 ** | $16.40 | .23 | (.43) | (.20) | (.79) | — | (.79) | — | $15.41 | (1.14) * | $2,748 | .25 * | 1.47 * | 25 * |
| July 31, 2011 | 15.77 | .46 | .76 | 1.22 | (.59) | — | (.59) | — | 16.40 | 7.80 | 2,822 | .50 | 2.82 | 55 |
| July 31, 2010 | 14.88 | .41 | 1.20 | 1.61 | (.72) | — | (.72) | — e | 15.77 | 10.86 | 2,011 | .50 | 2.63 | 90 |
| July 31, 2009 | 17.75 | .54 | (2.71) | (2.17) | (.49) | (.21) | (.70) | — e | 14.88 | (11.63) | 846 | .60 | 3.89 | 126 |
| July 31, 2008 | 22.24 | .57 | (1.90) | (1.33) | (.92) | (2.24) | (3.16) | — e | 17.75 | (7.02) | 340 | .59 | 2.96 | 109 |
| July 31, 2007 | 21.56 | .49 | 1.66 | 2.15 | (.53) | (.94) | (1.47) | — e | 22.24 | 10.09 | 112 | .57 | 2.16 | 69 |
| Class Y | ||||||||||||||
| January 31, 2012 ** | $16.99 | .23 | (.40) | (.17) | (.87) | — | (.87) | — | $15.95 | (.89) * | $1,686 | — * | 1.39 * | 25 * |
| July 31, 2011 | 16.29 | .55 | .79 | 1.34 | (.64) | — | (.64) | — | 16.99 | 8.32 | 6,108 | — | 3.27 | 55 |
| July 31, 2010 | 15.31 | .58 | 1.16 | 1.74 | (.76) | — | (.76) | — e | 16.29 | 11.47 | 5,376 | — | 3.60 | 90 |
| July 31, 2009 | 18.22 | .76 | (2.92) | (2.16) | (.54) | (.21) | (.75) | — e | 15.31 | (11.16) | 6,133 | .10 | 5.14 | 126 |
| July 31, 2008 | 22.70 | .72 | (1.97) | (1.25) | (.99) | (2.24) | (3.23) | — e | 18.22 | (6.54) | 27,832 | .09 | 3.47 | 109 |
| July 31, 2007 | 21.96 | .63 | 1.67 | 2.30 | (.62) | (.94) | (1.56) | — e | 22.70 | 10.64 | 45,725 | .07 | 2.78 | 69 |
See page 66 for notes to financial highlights.
The accompanying notes are an integral part of these financial statements.
| 62 | 63 |
Financial highlights (For a common share outstanding throughout the period)
Putnam Retirement Income Fund Lifestyle 1
| INVESTMENT OPERATIONS: | LESS DISTRIBUTIONS: | RATIOS AND SUPPLEMENTAL DATA: | ||||||||||||
| Ratio | Ratio | |||||||||||||
| Net realized | From | of expenses | of net investment | |||||||||||
| Net asset value, | and unrealized | Total from | From | net realized | Total return | Net assets, | to average | income (loss) | Portfolio | |||||
| beginning | Net investment | gain (loss) | investment | net investment | gain | Total | Redemption | Net asset value, | at net asset | end of period | net assets | to average | turnover | |
| Period ended | of period | income (loss) a | on investments | operations | income | on investments | distributions | fees | end of period | value (%) b | (in thousands) | (%) c,d | net assets (%) d | (%) |
| Class A | ||||||||||||||
| January 31, 2012 ** | $16.30 | .24 | (.40) | (.16) | (.25) | — | (.25) | — | $15.89 | (.96) * | $18,551 | .13 * | 1.55 * | 23 * |
| July 31, 2011 | 15.87 | .51 | .39 | .90 | (.47) | — | (.47) | — | 16.30 | 5.71 | 21,075 | .25 | 3.16 | 38 |
| July 31, 2010 | 14.92 | .43 | .96 | 1.39 | (.44) | — | (.44) | — e | 15.87 | 9.41 | 10,077 | .25 | 2.71 | 136 |
| July 31, 2009 | 16.85 | .89 | (1.93) | (1.04) | (.89) | — | (.89) | — e | 14.92 | (5.54) | 10,812 | .35 | 6.43 | 137 |
| July 31, 2008 | 19.02 | .71 | (1.28) | (.57) | (.78) | (.82) | (1.60) | — e | 16.85 | (3.37) | 14,607 | .34 | 3.89 | 139 |
| July 31, 2007 | 18.64 | .66 | .70 | 1.36 | (.71) | (.27) | (.98) | — e | 19.02 | 7.43 | 22,651 | .33 | 3.45 | 62 |
| Class B | ||||||||||||||
| January 31, 2012 ** | $16.30 | .19 | (.41) | (.22) | (.21) | — | (.21) | — | $15.87 | (1.33) * | $196 | .50 * | 1.21 * | 23 * |
| July 31, 2011 | 15.90 | .39 | .38 | .77 | (.37) | — | (.37) | — | 16.30 | 4.88 | 206 | 1.00 | 2.43 | 38 |
| July 31, 2010 | 14.94 | .30 | .99 | 1.29 | (.33) | — | (.33) | — e | 15.90 | 8.66 | 42 | 1.00 | 1.91 | 136 |
| July 31, 2009 | 16.88 | .78 | (1.93) | (1.15) | (.79) | — | (.79) | — e | 14.94 | (6.26) | 42 | 1.10 | 5.61 | 137 |
| July 31, 2008 | 19.04 | .56 | (1.28) | (.72) | (.62) | (.82) | (1.44) | — e | 16.88 | (4.12) | 43 | 1.09 | 3.03 | 139 |
| July 31, 2007 | 18.65 | .52 | .71 | 1.23 | (.57) | (.27) | (.84) | — e | 19.04 | 6.65 | 219 | 1.08 | 2.70 | 62 |
| Class C | ||||||||||||||
| January 31, 2012 ** | $16.34 | .19 | (.41) | (.22) | (.21) | — | (.21) | — | $15.91 | (1.33) * | $478 | .50 * | 1.23 * | 23 * |
| July 31, 2011 | 15.93 | .41 | .37 | .78 | (.37) | — | (.37) | — | 16.34 | 4.92 | 496 | 1.00 | 2.50 | 38 |
| July 31, 2010 | 14.97 | .26 | 1.02 | 1.28 | (.32) | — | (.32) | — e | 15.93 | 8.61 | 138 | 1.00 | 1.64 | 136 |
| July 31, 2009 | 16.91 | .83 | (1.98) | (1.15) | (.79) | — | (.79) | — e | 14.97 | (6.25) | 127 | 1.10 | 6.36 | 137 |
| July 31, 2008 | 19.07 | .57 | (1.28) | (.71) | (.63) | (.82) | (1.45) | — e | 16.91 | (4.06) | 1 | 1.09 | 3.14 | 139 |
| July 31, 2007 | 18.66 | .53 | .69 | 1.22 | (.54) | (.27) | (.81) | — e | 19.07 | 6.62 | 1 | 1.08 | 2.77 | 62 |
| Class M | ||||||||||||||
| January 31, 2012 ** | $16.34 | .23 | (.41) | (.18) | (.23) | — | (.23) | — | $15.93 | (1.08) * | $314 | .25 * | 1.46 * | 23 * |
| July 31, 2011 | 15.91 | .38 | .44 | .82 | (.39) | — | (.39) | — | 16.34 | 5.19 | 328 | .72 | 2.36 | 38 |
| July 31, 2010 | 14.95 | .35 | .97 | 1.32 | (.36) | — | (.36) | — e | 15.91 | 8.90 | 315 | .75 | 2.22 | 136 |
| July 31, 2009 | 16.89 | .94 | (2.06) | (1.12) | (.82) | — | (.82) | — e | 14.95 | (6.04) | 394 | .85 | 7.15 | 137 |
| July 31, 2008 | 19.07 | .62 | (1.29) | (.67) | (.69) | (.82) | (1.51) | — e | 16.89 | (3.87) | 125 | .84 | 3.54 | 139 |
| July 31, 2007 | 18.64 | .56 | .71 | 1.27 | (.57) | (.27) | (.84) | — e | 19.07 | 6.88 | 14 | .83 | 2.94 | 62 |
| Class R | ||||||||||||||
| January 31, 2012 ** | $16.30 | .23 | (.42) | (.19) | (.23) | — | (.23) | — | $15.88 | (1.13) * | $1,348 | .25 * | 1.48 * | 23 * |
| July 31, 2011 | 15.87 | .52 | .34 | .86 | (.43) | — | (.43) | — | 16.30 | 5.46 | 1,400 | .50 | 3.22 | 38 |
| July 31, 2010 | 14.92 | .34 | 1.02 | 1.36 | (.41) | — | (.41) | — e | 15.87 | 9.16 | 193 | .50 | 2.18 | 136 |
| July 31, 2009 | 16.85 | .84 | (1.92) | (1.08) | (.85) | — | (.85) | — e | 14.92 | (5.79) | 77 | .60 | 6.10 | 137 |
| July 31, 2008 | 19.03 | .65 | (1.28) | (.63) | (.73) | (.82) | (1.55) | — e | 16.85 | (3.62) | 155 | .59 | 3.63 | 139 |
| July 31, 2007 | 18.64 | .62 | .70 | 1.32 | (.66) | (.27) | (.93) | — e | 19.03 | 7.16 | 81 | .58 | 3.22 | 62 |
| Class Y | ||||||||||||||
| January 31, 2012 ** | $16.35 | .21 | (.35) | (.14) | (.27) | — | (.27) | — | $15.94 | (.84) * | $969 | — * | 1.32 * | 23 * |
| July 31, 2011 | 15.92 | .52 | .41 | .93 | (.50) | — | (.50) | — | 16.35 | 5.95 | 5,542 | — | 3.20 | 38 |
| July 31, 2010 | 14.96 | .49 | .95 | 1.44 | (.48) | — | (.48) | — e | 15.92 | 9.71 | 2,730 | — | 3.13 | 136 |
| July 31, 2009 | 16.90 | .96 | (1.98) | (1.02) | (.92) | — | (.92) | — e | 14.96 | (5.32) | 3,239 | .10 | 6.81 | 137 |
| July 31, 2008 | 19.07 | .75 | (1.28) | (.53) | (.82) | (.82) | (1.64) | — e | 16.90 | (3.12) | 7,191 | .09 | 4.13 | 139 |
| July 31, 2007 | 18.68 | .71 | .71 | 1.42 | (.76) | (.27) | (1.03) | — e | 19.07 | 7.70 | 9,729 | .08 | 3.70 | 62 |
See page 66 for notes to financial highlights.
The accompanying notes are an integral part of these financial statements.
| 64 | 65 |
Financial highlights (Continued)
* Not annualized.
** Unaudited.
† For the period November 30, 2010 (commencement of operations) to July 31, 2011.
a Per share net investment income (loss) has been determined on the basis of the weighted average number of shares outstanding during the period.
b Total return does not reflect the effect of sales charges.
c Expense ratios do not include expenses of the underlying funds.
d Reflects an involuntary contractual expense limitation in effect during the period. As a result of such limitation the expenses for the following periods reflect a reduction of the following based on each fund’s average net assets (Note 2):
| 1/31/12 | 7/31/11 | 7/31/10 | 7/31/09 | 7/31/08 | 7/31/07 | |
| Putnam RetirementReady 2055 Fund | 10.23% | 23.04% | N/A | N/A | N/A | N/A |
| Putnam RetirementReady 2050 Fund | 0.05 | 0.22 | 0.13% | 0.06% | 0.05% | 0.04% |
| Putnam RetirementReady 2045 Fund | 0.05 | 0.18 | 0.08 | 0.02 | 0.02 | 0.01 |
| Putnam RetirementReady 2040 Fund | 0.05 | 0.17 | 0.08 | 0.02 | 0.01 | 0.01 |
| Putnam RetirementReady 2035 Fund | 0.05 | 0.08 | 0.08 | 0.02 | 0.01 | 0.01 |
| Putnam RetirementReady 2030 Fund | 0.05 | 0.08 | 0.08 | 0.02 | 0.01 | 0.01 |
| Putnam RetirementReady 2025 Fund | 0.05 | 0.08 | 0.08 | 0.02 | 0.01 | 0.01 |
| Putnam RetirementReady 2020 Fund | 0.05 | 0.08 | 0.08 | 0.01 | 0.01 | 0.01 |
| Putnam RetirementReady 2015 Fund | 0.05 | 0.07 | 0.07 | 0.01 | <0.01 | 0.01 |
| Putnam Retirement Income Fund | ||||||
| Lifestyle 1 | 0.06 | 0.07 | 0.25 | 0.01 | <0.01 | 0.00 |
e Amount represents less than $0.01 per share.
The accompanying notes are an integral part of these financial statements.
66
Notes to financial statements 1/31/12 (Unaudited)
Note 1: Significant accounting policies
Within the following Notes to financial statements, references to “the SEC” represent the Securities and Exchange Commission and references to “Putnam Management” represent Putnam Investment Management, LLC, the fund’s manager, an indirect wholly-owned subsidiary of Putnam Investments, LLC.
Each of Putnam RetirementReady® Funds: Putnam RetirementReady 2055 Fund, Putnam RetirementReady 2050 Fund, Putnam RetirementReady 2045 Fund, Putnam RetirementReady 2040 Fund, Putnam RetirementReady 2035 Fund, Putnam RetirementReady 2030 Fund, Putnam RetirementReady 2025 Fund, Putnam RetirementReady 2020 Fund, Putnam RetirementReady 2015 Fund, and Putnam Retirement Income Fund Lifestyle 1, (collectively the funds) is a diversified series of Putnam RetirementReady® Funds (the Trust), a Massachusetts business trust registered under the Investment Company Act of 1940, as amended, as an open-end investment company. Each fund, except the Putnam Retirement Income Fund Lifestyle 1, seeks capital appreciation and current income consistent with a decreasing emphasis on capital appreciation and an increasing emphasis on current income as it approaches its target date. The Putnam Retirement Income Fund Lifestyle 1 seeks as high a rate of current income as Putnam Management believes is consistent with preservation of capital.
Currently there are ten separate funds, of which nine have a target date specified by the calendar year in the name of each fund. The target dates are in five-year increments beginning with the year 2015. The tenth fund is named Putnam Retirement Income Fund Lifestyle 1. Amounts invested in each target date fund are allocated among underlying Putnam funds based on the fund’s target date. The target percentages for each target date fund gradually change over time based on the number of years that remain until the target date of the fund so that a fund’s asset allocation will become more conservative as the fund approaches its target date. The asset allocation of each target date fund is designed to provide an investment that Putnam Management believes is neither overly aggressive nor overly conservative for a typical investor planning to retire (or otherwise begin using the invested funds) in the target year. When a fund’s target percentages correspond to those of the Putnam Retirement Income Fund Lifestyle 1, which currently is expected to occur during the latter part of the target year, the fund will be merged into the Putnam Retirement Income Fund Lifestyle 1.
These financial statements report on each fund which may invest in the following Putnam Funds: Putnam Absolute Return 100 Fund, Putnam Absolute Return 300 Fund, Putnam Absolute Return 500 Fund, Putnam Absolute Return 700 Fund, Putnam Dynamic Asset Allocation Balanced Fund (prior to November 30, 2011 this fund was known as Putnam Asset Allocation: Balanced Portfolio), Putnam Dynamic Asset Allocation Conservative Fund (prior to November 30, 2011 this fund was know as Putnam Asset Allocation: Conservative Portfolio), Putnam Dynamic Asset Allocation Equity Fund (prior to September 30, 2011 this fund was know as Putnam Asset Allocation: Equity Portfolio), Putnam Dynamic Asset Allocation Growth Fund (prior to November 30, 2011 this fund was know as Putnam Asset Allocation: Growth Portfolio) and Putnam Money Market Fund (the underlying Putnam Funds), which are managed by Putnam Management. The financial statements of the underlying Putnam Funds contain additional information about the expenses and investments of the underlying Putnam Funds and are available upon request.
Each fund offers class A, class B, class C, class M, class R and class Y shares. Class A and class M shares are sold with a maximum front-end sales charge of 5.75% (4.00% for Putnam Retirement Income Fund Lifestyle 1) and 3.50% (3.25% for Putnam Retirement Income Fund Lifestyle 1), respectively, and generally do not pay a contingent deferred sales charge. Class B shares, which convert to class A shares after approximately eight years, do not pay a front-end sales charge and are subject to a contingent deferred sales charge, if those shares are redeemed within six years of purchase. Class C shares have a one-year 1.00% contingent deferred sales charge and do not convert to class A shares. Class R shares, which are not available to all investors, are sold at net asset value. The expenses for class A, class B, class C, class M and class R shares may differ based on the distribution fee of each class, which is identified in Note 2. Class Y shares, which are sold at net asset value, are generally subject to the same expenses as class A, class B, class C, class M and class R shares, but do not bear a distribution fee. Class Y shares are not available to all investors.
Investment income, realized and unrealized gains and losses and expenses of each fund are borne pro-rata based on the relative net assets of each class to the total net assets of each fund, except that each class bears expenses unique to that class (including the distribution fees applicable to such classes). Each class votes as a class only with respect to its own distribution plan or other matters on which a class vote is required by law or determined by the Trustees. Shares of each class would receive their pro-rata share of the net assets of the fund, if that fund were liquidated. In addition, the Trustees declare separate dividends on each class of shares.
67
In the normal course of business, each fund enters into contracts that may include agreements to indemnify another party under given circumstances. Each fund’s maximum exposure under these arrangements is unknown as this would involve future claims that may be, but have not yet been, made against each fund. However, each fund’s management team expects the risk of material loss to be remote.
The following is a summary of significant accounting policies consistently followed by each fund in the preparation of its financial statements. The preparation of financial statements is in conformity with accounting principles generally accepted in the United States of America and requires management to make estimates and assumptions that affect the reported amounts of assets and liabilities in the financial statements and the reported amounts of increases and decreases in net assets from operations. Actual results could differ from those estimates. Subsequent events after the Statement of assets and liabilities date through the date that the financial statements were issued have been evaluated in the preparation of the financial statements. Unless otherwise noted, the “reporting period” represents the period from August 1, 2011 through January 31, 2012 for each fund.
Security valuation The price of each fund’s shares is based on its net asset value (NAV), which is in turn based on the NAVs of the underlying Putnam Funds in which it invests, which are classified as Level 1. The NAVs of the underlying Putnam Funds are determined based on the policies contained in each underlying Putnam Fund’s financial statements. The NAV per share of each class equals the total value of its assets, less its liabilities, divided by the number of its outstanding shares. Shares are only valued as of the close of regular trading on the New York Stock Exchange each day the exchange is open.
Security transactions and related investment income Security transactions, which consist of shares of the underlying Putnam Funds, are recorded on the trade date (date the order to buy or sell is executed). Gains or losses from the sale of the underlying Putnam Funds are determined on the identified cost basis. Income and capital gain distributions from the underlying Putnam Funds are recorded on the ex-dividend date.
Interfund lending Each fund, along with other Putnam funds, may participate in an interfund lending program pursuant to an exemptive order issued by the SEC. This program allows the funds to borrow from or lend to other Putnam funds that permit such transactions. Interfund lending transactions are subject to each fund’s investment policies and borrowing and lending limits. Interest earned or paid on the interfund lending transaction will be based on the average of certain current market rates. During the reporting period, the funds did not utilize the program.
Federal taxes It is the policy of each fund to distribute all of its taxable income within the prescribed time period and otherwise comply with the provisions of the Internal Revenue Code of 1986, as amended (the Code), applicable to regulated investment companies. It is also the intention of each fund to distribute an amount sufficient to avoid imposition of any excise tax under Section 4982 of the Code. Each fund is subject to the provisions of Accounting Standards Codification ASC 740 Income Taxes (ASC 740). ASC 740 sets forth a minimum threshold for financial statement recognition of the benefit of a tax position taken or expected to be taken in a tax return. The funds did not have any unrecognized tax benefits in the accompanying financial statements. No provision has been made for federal taxes on income, capital gains or unrealized appreciation on securities held nor for excise tax on income and capital gains. Each of the funds’, except Putnam RetirementReady 2055 Fund, federal tax returns for the prior three fiscal years remain subject to examination by the Internal Revenue Service. Putnam RetirementReady 2055 Fund’s federal tax returns for the prior periods remains subject to examination by the Internal Revenue Service.
At July 31, 2011, the following funds had capital loss carryovers in the following amounts, which will expire on the following dates:
| Loss carryover | ||||
| Short-term | Long-term | Total | Expiration | |
| Putnam RetirementReady 2050 Fund | $5,152,330 | $— | $5,152,330 | July 31, 2018 |
| Putnam RetirementReady 2045 Fund | 9,995,400 | — | 9,995,400 | July 31, 2018 |
| Putnam RetirementReady 2040 Fund | 13,088,789 | — | 13,088,789 | July 31, 2018 |
| Putnam RetirementReady 2035 Fund | 19,940,257 | — | 19,940,257 | July 31, 2018 |
| Putnam RetirementReady 2030 Fund | 26,893,103 | — | 26,893,103 | July 31, 2018 |
| Putnam RetirementReady 2025 Fund | 31,215,338 | — | 31,215,338 | July 31, 2018 |
| Putnam RetirementReady 2020 Fund | 32,544,319 | — | 32,544,319 | July 31, 2018 |
| Putnam RetirementReady 2015 Fund | 27,092,778 | — | 27,092,778 | July 31, 2018 |
68
At July 31, 2011, Putnam Retirement Income Fund Lifestyle 1 had a capital loss carryover of $8,371,732 available to the extent allowed by the Code to offset future net capital gain, if any. As a result of the November 5, 2010 merger (see Note 7), Putnam Retirement Income Fund Lifestyle 1 acquired $11,626,268 in capital loss carryovers from Putnam RetirementReady 2010 Fund, which are subject to limitations imposed by the Code. Of this amount, capital loss carryovers of $4,944,177 attributable to the Putnam RetirementReady 2010 Fund are available to the extent allowed by the code to offset future net capital gain, if any. The amounts of the combined carryovers and the expiration dates as of July 31, 2011 are:
| Loss carryover | ||||
| Short-term | Long-term | Total | Expiration | |
| Putnam Retirement Income Fund | $4,405,104 | $— | $4,405,104 | July 31, 2017 |
| Lifestyle 1 | 3,966,628 | — | 3,966,628 | July 31, 2018 |
Under the recently enacted Regulated Investment Company Modernization Act of 2010, the fund will be permitted to carry forward capital losses incurred in taxable years beginning after December 22, 2010 for an unlimited period. However, any losses incurred during those future years will be required to be utilized prior to the losses incurred in pre-enactment tax years. As a result of this ordering rule, pre-enactment capital loss carryforwards may be more likely to expire unused. Additionally, post-enactment capital losses that are carried forward will retain their character as either short-term or long-term capital losses rather than being considered all short-term as under previous law.
The tax basis components of distributable earnings and the federal tax cost as of the close of the reporting period were as follows:
| Cost for | ||||
| Net unrealized | federal | |||
| Unrealized | Unrealized | appreciation | income tax | |
| appreciation | (depreciation) | (depreciation) | purposes | |
| Putnam RetirementReady 2055 Fund | $12,077 | $(6,852) | $5,225 | $467,190 |
| Putnam RetirementReady 2050 Fund | 550,713 | (1,033,391) | (482,678) | 7,136,413 |
| Putnam RetirementReady 2045 Fund | 74,665 | (678,023) | (603,358) | 11,054,402 |
| Putnam RetirementReady 2040 Fund | 108,040 | (608,747) | (500,707) | 15,124,875 |
| Putnam RetirementReady 2035 Fund | 614,661 | (491,331) | 123,330 | 22,965,816 |
| Putnam RetirementReady 2030 Fund | 1,104,187 | (371,568) | 732,619 | 30,417,450 |
| Putnam RetirementReady 2025 Fund | 997,167 | (422,720) | 574,447 | 35,064,646 |
| Putnam RetirementReady 2020 Fund | 611,930 | (465,191) | 146,739 | 33,622,759 |
| Putnam RetirementReady 2015 Fund | 316,595 | (384,679) | (68,084) | 26,284,028 |
| Putnam Retirement Income Fund | 252,150 | (395,435) | (143,285) | 22,003,780 |
| Lifestyle 1 | ||||
Distributions to shareholders Distributions to shareholders from net investment income are recorded by the fund on the ex-dividend date. Distributions from capital gains, if any, are recorded on the ex-dividend date and paid at least annually. The amount and character of income and gains to be distributed are determined in accordance with income tax regulations, which may differ from generally accepted accounting principles. Dividend sources are estimated at the time of declaration. Actual results may vary. Any non-taxable return of capital cannot be determined until final tax calculations are completed after the end of the fund’s fiscal year. Reclassifications are made to the fund’s capital accounts to reflect income and gains available for distribution (or available capital loss carryovers) under income tax regulations.
Expenses of the Trust Expenses directly charged or attributable to any fund will be paid from the assets of that fund. Generally, expenses of the Trust will be allocated among and charged to the assets of each fund on a basis that the Trustees deem fair and equitable, which may be based on the relative assets of each fund or the nature of the services performed and relative applicability to each fund.
Offering costs The offering costs of $84,646 incurred by Putnam RetirementReady 2055 Fund have been fully amortized on a straight-line basis over a twelve-month period as of November 30, 2011. As of the close of the reporting period, Putnam RetirementReady 2055 Fund has reimbursed Putnam Management for the payment of these expenses.
69
Note 2: Management fee, administrative services and other transactions
The funds do not pay a monthly management fee to Putnam Management.
Putnam Management has contractually agreed through November 30, 2012 to reimburse the funds for other expenses (excluding brokerage, interest, taxes, investment-related expenses, such as borrowing costs, extraordinary expenses, payments under the funds’ distribution plans and acquired fund fees and expenses). During the reporting period, each fund’s expenses were reduced by the following amounts as a result of this limit:
| Fees waived and reimbursed by the Manager | |
| Putnam RetirementReady 2055 Fund | $28,358 |
| Putnam RetirementReady 2050 Fund | 3,430 |
| Putnam RetirementReady 2045 Fund | 5,893 |
| Putnam RetirementReady 2040 Fund | 8,981 |
| Putnam RetirementReady 2035 Fund | 12,604 |
| Putnam RetirementReady 2030 Fund | 16,849 |
| Putnam RetirementReady 2025 Fund | 19,140 |
| Putnam RetirementReady 2020 Fund | 18,099 |
| Putnam RetirementReady 2015 Fund | 14,917 |
| Putnam Retirement Income Fund Lifestyle 1 | 14,653 |
Putnam Investments Limited (PIL), an affiliate of Putnam Management, is authorized by the Trustees to manage a separate portion of the assets of each fund as determined by Putnam Management from time to time. Putnam Management pays a quarterly sub-management fee to PIL for its services at an annual rate of 0.35% of the average net assets of the portion of the fund managed by PIL.
Each fund has adopted distribution plans (the Plans) with respect to its class A, class B, class C, class M and class R shares pursuant to Rule 12b–1 under the Investment Company Act of 1940. The purpose of the Plans is to compensate Putnam Retail Management Limited Partnership, a wholly-owned subsidiary of Putnam Investments, LLC and Putnam Retail Management GP, Inc., for services provided and expenses incurred in distributing shares of the funds. The Plans provide for payments by each fund to Putnam Retail Management Limited Partnership at an annual rate of up to 0.35%, 1.00%, 1.00%, 1.00% and 1.00% of the average net assets attributable to class A, class B, class C, class M and class R shares, respectively. The Trustees have approved payment by the funds’ at an annual rate of 0.25%, 1.00%, 1.00%, 0.75% (0.50% for Putnam Retirement Income Fund Lifestyle 1) and 0.50% of the average net assets attributable to class A, class B, class C, class M, and class R shares, respectively.
For the reporting period, Putnam Retail Management Limited Partnership, acting as underwriter, received net commissions from the sale of class A and class M shares, and received contingent deferred sales charges from redemptions of class B and class C shares, in the following amounts:
| Class A Net | Class M Net | Class B | Class C | |
| Commissions | Commissions | CDSC | CDSC | |
| Putnam RetirementReady 2055 Fund | $61 | $— | $251 | $— |
| Putnam RetirementReady 2050 Fund | 358 | 24 | 583 | 14 |
| Putnam RetirementReady 2045 Fund | 815 | 5 | 133 | 16 |
| Putnam RetirementReady 2040 Fund | 1,607 | 56 | — | 24 |
| Putnam RetirementReady 2035 Fund | 2,184 | 4 | 20 | 24 |
| Putnam RetirementReady 2030 Fund | 1,311 | 17 | 1,340 | 59 |
| Putnam RetirementReady 2025 Fund | 4,900 | 6 | 918 | 155 |
| Putnam RetirementReady 2020 Fund | 1,525 | 3 | 502 | 102 |
| Putnam RetirementReady 2015 Fund | 2,305 | — | 75 | 69 |
| Putnam Retirement Income Fund | 5,531 | 5 | — | — |
| Lifestyle 1 | ||||
| Total | $20,597 | $120 | $3,822 | $463 |
70
A deferred sales charge of up to 1.00% and 0.65% (0.40% for Putnam Retirement Income Fund Lifestyle 1) is assessed on certain redemptions of class A and class M shares, respectively. For the reporting period, Putnam Retail Management Limited Partnership, acting as underwriter, received no monies on class A and class M redemptions.
Note 3: Purchases and sales of securities
During the reporting period, cost of purchases and proceeds from sales of underlying Putnam Funds were as follows:
| Purchase cost | Proceeds from sales | |
| Putnam RetirementReady 2055 Fund | $823,666 | $574,815 |
| Putnam RetirementReady 2050 Fund | 2,395,476 | 2,869,199 |
| Putnam RetirementReady 2045 Fund | 3,200,642 | 7,340,337 |
| Putnam RetirementReady 2040 Fund | 4,485,593 | 12,595,802 |
| Putnam RetirementReady 2035 Fund | 6,740,832 | 17,072,331 |
| Putnam RetirementReady 2030 Fund | 8,830,977 | 22,128,807 |
| Putnam RetirementReady 2025 Fund | 10,268,859 | 24,400,115 |
| Putnam RetirementReady 2020 Fund | 9,088,190 | 22,529,863 |
| Putnam RetirementReady 2015 Fund | 7,803,761 | 20,514,630 |
| Putnam Retirement Income Fund Lifestyle 1 | 5,660,768 | 12,040,322 |
Note 4: Capital shares
At the close of the reporting period, there was an unlimited number of shares of beneficial interest authorized. Transactions in capital shares were as follows:
Putnam RetirementReady 2055 Fund
| For the period 11/30/10 | ||||
| (commencement of operations) | ||||
| Six months ended 1/31/12 | to 7/31/11 | |||
| Class A | Shares | Amount | Shares | Amount |
| Shares sold | 52,968 | $486,161 | 43,414 | $440,988 |
| Shares issued in connection with | ||||
| reinvestment of distributions | 1,143 | 10,266 | 76 | 749 |
| 54,111 | 496,427 | 43,490 | 441,737 | |
| Shares repurchased | (42,998) | (384,537) | (26,786) | (275,126) |
| Net increase | 11,113 | $111,890 | 16,704 | $166,611 |
| For the period 11/30/10 | ||||
| (commencement of operations) | ||||
| Six months ended 1/31/12 | to 7/31/11 | |||
| Class B | Shares | Amount | Shares | Amount |
| Shares sold | 159 | $1,459 | 599 | $5,956 |
| Shares issued in connection with | ||||
| reinvestment of distributions | 37 | 336 | 75 | 737 |
| 196 | 1,795 | 674 | 6,693 | |
| Shares repurchased | (563) | (5,056) | (1) | (15) |
| Net increase (decrease) | (367) | $(3,261) | 673 | $6,678 |
71
| For the period 11/30/10 | ||||
| (commencement of operations) | ||||
| Six months ended 1/31/12 | to 7/31/11 | |||
| Class C | Shares | Amount | Shares | Amount |
| Shares sold | 1,678 | $15,279 | 381 | $4,000 |
| Shares issued in connection with | ||||
| reinvestment of distributions | 116 | 1,038 | 75 | 737 |
| 1,794 | 16,317 | 456 | 4,737 | |
| Shares repurchased | (3) | (25) | — | — |
| Net increase | 1,791 | $16,292 | 456 | $4,737 |
| For the period 11/30/10 | ||||
| (commencement of operations) | ||||
| Six months ended 1/31/12 | to 7/31/11 | |||
| Class M | Shares | Amount | Shares | Amount |
| Shares sold | 66 | $584 | 110 | $1,127 |
| Shares issued in connection with | ||||
| reinvestment of distributions | 36 | 328 | 75 | 739 |
| 102 | 912 | 185 | 1,866 | |
| Shares repurchased | (175) | (1,480) | — | — |
| Net increase (decrease) | (73) | $(568) | 185 | $1,866 |
| For the period 11/30/10 | ||||
| (commencement of operations) | ||||
| Six months ended 1/31/12 | to 7/31/11 | |||
| Class R | Shares | Amount | Shares | Amount |
| Shares sold | 406 | $3,478 | — | $— |
| Shares issued in connection with | ||||
| reinvestment of distributions | 55 | 498 | 75 | 741 |
| 461 | 3,976 | 75 | 741 | |
| Shares repurchased | — | — | — | — |
| Net increase | 461 | $3,976 | 75 | $741 |
| For the period 11/30/10 | ||||
| (commencement of operations) | ||||
| Six months ended 1/31/12 | to 7/31/11 | |||
| Class Y | Shares | Amount | Shares | Amount |
| Shares sold | 13,560 | $125,912 | 1,680 | $17,274 |
| Shares issued in connection with | ||||
| reinvestment of distributions | 309 | 2,776 | 91 | 896 |
| 13,869 | 128,688 | 1,771 | 18,170 | |
| Shares repurchased | (2,634) | (24,419) | — | — |
| Net increase | 11,235 | $104,269 | 1,771 | $18,170 |
At the close of the reporting period, three shareholders of record owned 30.3%, 10.5% and 5.2%, respectively, of the outstanding shares of Putnam RetirementReady 2055 Fund.
72
Putnam RetirementReady 2050 Fund
| Six months ended 1/31/12 | Year ended 7/31/11 | |||
| Class A | Shares | Amount | Shares | Amount |
| Shares sold | 60,248 | $704,022 | 217,883 | $2,784,421 |
| Shares issued in connection with | ||||
| reinvestment of distributions | 10,823 | 125,549 | 31,641 | 396,457 |
| 71,071 | 829,571 | 249,524 | 3,180,878 | |
| Shares repurchased | (110,317) | (1,294,114) | (334,589) | (4,267,894) |
| Net decrease | (39,246) | $(464,543) | (85,065) | $(1,087,016) |
| Six months ended 1/31/12 | Year ended 7/31/11 | |||
| Class B | Shares | Amount | Shares | Amount |
| Shares sold | 4,274 | $48,302 | 2,689 | $34,222 |
| Shares issued in connection with | ||||
| reinvestment of distributions | 406 | 4,681 | 494 | 6,168 |
| 4,680 | 52,983 | 3,183 | 40,390 | |
| Shares repurchased | (1,491) | (16,805) | (2,732) | (35,524) |
| Net increase | 3,189 | $36,178 | 451 | $4,866 |
| Six months ended 1/31/12 | Year ended 7/31/11 | |||
| Class C | Shares | Amount | Shares | Amount |
| Shares sold | 861 | $9,866 | 1,174 | $14,940 |
| Shares issued in connection with | ||||
| reinvestment of distributions | 230 | 2,635 | 410 | 5,086 |
| 1,091 | 12,501 | 1,584 | 20,026 | |
| Shares repurchased | (379) | (4,358) | (292) | (3,730) |
| Net increase | 712 | $8,143 | 1,292 | $16,296 |
| Six months ended 1/31/12 | Year ended 7/31/11 | |||
| Class M | Shares | Amount | Shares | Amount |
| Shares sold | 632 | $7,365 | 1,847 | $23,545 |
| Shares issued in connection with | ||||
| reinvestment of distributions | 21 | 248 | 398 | 4,954 |
| 653 | 7,613 | 2,245 | 28,499 | |
| Shares repurchased | (6,076) | (65,722) | (51) | (657) |
| Net increase (decrease) | (5,423) | $(58,109) | 2,194 | $27,842 |
| Six months ended 1/31/12 | Year ended 7/31/11 | |||
| Class R | Shares | Amount | Shares | Amount |
| Shares sold | 24,732 | $277,557 | 25,767 | $328,152 |
| Shares issued in connection with | ||||
| reinvestment of distributions | 2,494 | 28,583 | 2,972 | 36,858 |
| 27,226 | 306,140 | 28,739 | 365,010 | |
| Shares repurchased | (10,764) | (122,419) | (10,689) | (137,375) |
| Net increase | 16,462 | $183,721 | 18,050 | $227,635 |
73
| Six months ended 1/31/12 | Year ended 7/31/11 | |||
| Class Y | Shares | Amount | Shares | Amount |
| Shares sold | 24,765 | $291,612 | 81,177 | $1,047,643 |
| Shares issued in connection with | ||||
| reinvestment of distributions | 6,708 | 77,945 | 12,229 | 153,599 |
| 31,473 | 369,557 | 93,406 | 1,201,242 | |
| Shares repurchased | (73,360) | (823,153) | (45,415) | (579,715) |
| Net increase (decrease) | (41,887) | $(453,596) | 47,991 | $621,527 |
Putnam RetirementReady 2045 Fund
| Six months ended 1/31/12 | Year ended 7/31/11 | |||
| Class A | Shares | Amount | Shares | Amount |
| Shares sold | 79,860 | $1,044,715 | 184,437 | $2,635,641 |
| Shares issued in connection with | ||||
| reinvestment of distributions | 15,280 | 199,248 | 46,780 | 654,453 |
| 95,140 | 1,243,963 | 231,217 | 3,290,094 | |
| Shares repurchased | (236,431) | (3,134,155) | (298,840) | (4,276,976) |
| Net decrease | (141,291) | $(1,890,192) | (67,623) | $(986,882) |
| Six months ended 1/31/12 | Year ended 7/31/11 | |||
| Class B | Shares | Amount | Shares | Amount |
| Shares sold | 1,013 | $12,537 | 5,813 | $78,051 |
| Shares issued in connection with | ||||
| reinvestment of distributions | 317 | 3,832 | 646 | 8,411 |
| 1,330 | 16,369 | 6,459 | 86,462 | |
| Shares repurchased | (1,752) | (21,646) | (4,121) | (54,332) |
| Net increase (decrease) | (422) | $(5,277) | 2,338 | $32,130 |
| Six months ended 1/31/12 | Year ended 7/31/11 | |||
| Class C | Shares | Amount | Shares | Amount |
| Shares sold | 529 | $6,509 | 1,061 | $13,678 |
| Shares issued in connection with | ||||
| reinvestment of distributions | 84 | 1,020 | 170 | 2,230 |
| 613 | 7,529 | 1,231 | 15,908 | |
| Shares repurchased | (449) | (5,803) | (2) | (25) |
| Net increase | 164 | $1,726 | 1,229 | $15,883 |
| Six months ended 1/31/12 | Year ended 7/31/11 | |||
| Class M | Shares | Amount | Shares | Amount |
| Shares sold | 331 | $4,341 | 163 | $2,304 |
| Shares issued in connection with | ||||
| reinvestment of distributions | 27 | 350 | 33 | 458 |
| 358 | 4,691 | 196 | 2,762 | |
| Shares repurchased | (78) | (948) | (13) | (191) |
| Net increase | 280 | $3,743 | 183 | $2,571 |
74
| Six months ended 1/31/12 | Year ended 7/31/11 | |||
| Class R | Shares | Amount | Shares | Amount |
| Shares sold | 14,698 | $195,216 | 37,855 | $559,616 |
| Shares issued in connection with | ||||
| reinvestment of distributions | 2,213 | 29,498 | 3,785 | 54,157 |
| 16,911 | 224,714 | 41,640 | 613,773 | |
| Shares repurchased | (8,480) | (113,886) | (20,294) | (294,954) |
| Net increase | 8,431 | $110,828 | 21,346 | $318,819 |
| Six months ended 1/31/12 | Year ended 7/31/11 | |||
| Class Y | Shares | Amount | Shares | Amount |
| Shares sold | 25,805 | $395,428 | 92,725 | $1,542,875 |
| Shares issued in connection with | ||||
| reinvestment of distributions | 5,001 | 76,315 | 19,607 | 319,601 |
| 30,806 | 471,743 | 112,332 | 1,862,476 | |
| Shares repurchased | (220,893) | (3,173,045) | (58,556) | (965,368) |
| Net increase (decrease) | (190,087) | $(2,701,302) | 53,776 | $897,108 |
Putnam RetirementReady 2040 Fund
| Six months ended 1/31/12 | Year ended 7/31/11 | |||
| Class A | Shares | Amount | Shares | Amount |
| Shares sold | 102,525 | $1,462,221 | 264,520 | $4,063,818 |
| Shares issued in connection with | ||||
| reinvestment of distributions | 13,509 | 192,904 | 49,603 | 751,980 |
| 116,034 | 1,655,125 | 314,123 | 4,815,798 | |
| Shares repurchased | (310,313) | (4,469,707) | (373,563) | (5,799,114) |
| Net decrease | (194,279) | $(2,814,582) | (59,440) | $(983,316) |
| Six months ended 1/31/12 | Year ended 7/31/11 | |||
| Class B | Shares | Amount | Shares | Amount |
| Shares sold | 2,196 | $29,618 | 14,032 | $198,807 |
| Shares issued in connection with | ||||
| reinvestment of distributions | 577 | 7,703 | 1,523 | 21,676 |
| 2,773 | 37,321 | 15,555 | 220,483 | |
| Shares repurchased | (1,064) | (14,176) | (5,010) | (72,092) |
| Net increase | 1,709 | $23,145 | 10,545 | $148,391 |
| Six months ended 1/31/12 | Year ended 7/31/11 | |||
| Class C | Shares | Amount | Shares | Amount |
| Shares sold | 2,217 | $29,706 | 2,731 | $39,828 |
| Shares issued in connection with | ||||
| reinvestment of distributions | 235 | 3,122 | 395 | 5,589 |
| 2,452 | 32,828 | 3,126 | 45,417 | |
| Shares repurchased | (314) | (4,310) | (481) | (6,668) |
| Net increase | 2,138 | $28,518 | 2,645 | $38,749 |
75
| Six months ended 1/31/12 | Year ended 7/31/11 | |||
| Class M | Shares | Amount | Shares | Amount |
| Shares sold | 991 | $13,752 | 976 | $14,653 |
| Shares issued in connection with | ||||
| reinvestment of distributions | 15 | 209 | 85 | 1,219 |
| 1,006 | 13,961 | 1,061 | 15,872 | |
| Shares repurchased | (1,660) | (21,309) | (285) | (4,219) |
| Net increase (decrease) | (654) | $(7,348) | 776 | $11,653 |
| Six months ended 1/31/12 | Year ended 7/31/11 | |||
| Class R | Shares | Amount | Shares | Amount |
| Shares sold | 22,879 | $331,413 | 62,019 | $986,028 |
| Shares issued in connection with | ||||
| reinvestment of distributions | 2,818 | 41,230 | 6,370 | 98,983 |
| 25,697 | 372,643 | 68,389 | 1,085,011 | |
| Shares repurchased | (20,836) | (306,898) | (27,157) | (426,585) |
| Net increase | 4,861 | $65,745 | 41,232 | $658,426 |
| Six months ended 1/31/12 | Year ended 7/31/11 | |||
| Class Y | Shares | Amount | Shares | Amount |
| Shares sold | 31,882 | $523,679 | 158,183 | $2,785,652 |
| Shares issued in connection with | ||||
| reinvestment of distributions | 4,991 | 81,944 | 27,012 | 470,017 |
| 36,873 | 605,623 | 185,195 | 3,255,669 | |
| Shares repurchased | (410,365) | (6,348,622) | (105,271) | (1,826,784) |
| Net increase (decrease) | (373,492) | $(5,742,999) | 79,924 | $1,428,885 |
Putnam RetirementReady 2035 Fund
| Six months ended 1/31/12 | Year ended 7/31/11 | |||
| Class A | Shares | Amount | Shares | Amount |
| Shares sold | 154,947 | $2,295,293 | 396,742 | $6,139,849 |
| Shares issued in connection with | ||||
| reinvestment of distributions | 26,081 | 381,054 | 58,051 | 903,862 |
| 181,028 | 2,676,347 | 454,793 | 7,043,711 | |
| Shares repurchased | (433,383) | (6,430,712) | (574,306) | (9,101,900) |
| Net decrease | (252,355) | $(3,754,365) | (119,513) | $(2,058,189) |
| Six months ended 1/31/12 | Year ended 7/31/11 | |||
| Class B | Shares | Amount | Shares | Amount |
| Shares sold | 2,245 | $30,750 | 15,782 | $233,495 |
| Shares issued in connection with | ||||
| reinvestment of distributions | 961 | 13,075 | 1,458 | 21,193 |
| 3,206 | 43,825 | 17,240 | 254,688 | |
| Shares repurchased | (3,268) | (45,058) | (8,433) | (125,495) |
| Net increase (decrease) | (62) | $(1,233) | 8,807 | $129,193 |
76
| Six months ended 1/31/12 | Year ended 7/31/11 | |||
| Class C | Shares | Amount | Shares | Amount |
| Shares sold | 1,877 | $25,301 | 2,208 | $32,525 |
| Shares issued in connection with | ||||
| reinvestment of distributions | 431 | 5,874 | 694 | 10,099 |
| 2,308 | 31,175 | 2,902 | 42,624 | |
| Shares repurchased | (4,480) | (61,273) | (1,281) | (19,200) |
| Net increase (decrease) | (2,172) | $(30,098) | 1,621 | $23,424 |
| Six months ended 1/31/12 | Year ended 7/31/11 | |||
| Class M | Shares | Amount | Shares | Amount |
| Shares sold | 268 | $3,670 | 1,084 | $16,381 |
| Shares issued in connection with | ||||
| reinvestment of distributions | — | — | 168 | 2,479 |
| 268 | 3,670 | 1,252 | 18,860 | |
| Shares repurchased | (4,389) | (57,410) | (1,019) | (14,152) |
| Net increase (decrease) | (4,121) | $(53,740) | 233 | $4,708 |
| Six months ended 1/31/12 | Year ended 7/31/11 | |||
| Class R | Shares | Amount | Shares | Amount |
| Shares sold | 41,103 | $580,922 | 65,736 | $1,006,390 |
| Shares issued in connection with | ||||
| reinvestment of distributions | 4,756 | 67,006 | 5,496 | 82,718 |
| 45,859 | 647,928 | 71,232 | 1,089,108 | |
| Shares repurchased | (24,325) | (345,134) | (9,498) | (145,357) |
| Net increase | 21,534 | $302,794 | 61,734 | $943,751 |
| Six months ended 1/31/12 | Year ended 7/31/11 | |||
| Class Y | Shares | Amount | Shares | Amount |
| Shares sold | 61,938 | $1,043,718 | 198,852 | $3,599,592 |
| Shares issued in connection with | ||||
| reinvestment of distributions | 9,887 | 165,898 | 27,802 | 495,426 |
| 71,825 | 1,209,616 | 226,654 | 4,095,018 | |
| Shares repurchased | (492,440) | (7,889,192) | (119,438) | (2,165,853) |
| Net increase (decrease) | (420,615) | $(6,679,576) | 107,216 | $1,929,165 |
Putnam RetirementReady 2030 Fund
| Six months ended 1/31/12 | Year ended 7/31/11 | |||
| Class A | Shares | Amount | Shares | Amount |
| Shares sold | 164,329 | $2,468,513 | 586,573 | $9,298,025 |
| Shares issued in connection with | ||||
| reinvestment of distributions | 27,957 | 418,234 | 60,521 | 953,819 |
| 192,286 | 2,886,747 | 647,094 | 10,251,844 | |
| Shares repurchased | (604,477) | (9,164,850) | (726,990) | (11,673,053) |
| Net decrease | (412,191) | $(6,278,103) | (79,896) | $(1,421,209) |
77
| Six months ended 1/31/12 | Year ended 7/31/11 | |||
| Class B | Shares | Amount | Shares | Amount |
| Shares sold | 5,179 | $74,027 | 17,631 | $268,945 |
| Shares issued in connection with | ||||
| reinvestment of distributions | 1,114 | 15,932 | 1,619 | 24,468 |
| 6,293 | 89,959 | 19,250 | 293,413 | |
| Shares repurchased | (4,739) | (66,559) | (11,240) | (172,286) |
| Net increase | 1,554 | $23,400 | 8,010 | $121,127 |
| Six months ended 1/31/12 | Year ended 7/31/11 | |||
| Class C | Shares | Amount | Shares | Amount |
| Shares sold | 3,217 | $46,412 | 9,268 | $142,712 |
| Shares issued in connection with | ||||
| reinvestment of distributions | 651 | 9,322 | 918 | 13,897 |
| 3,868 | 55,734 | 10,186 | 156,609 | |
| Shares repurchased | (1,603) | (23,032) | (816) | (12,613) |
| Net increase | 2,265 | $32,702 | 9,370 | $143,996 |
| Six months ended 1/31/12 | Year ended 7/31/11 | |||
| Class M | Shares | Amount | Shares | Amount |
| Shares sold | 1,250 | $18,403 | 3,913 | $59,548 |
| Shares issued in connection with | ||||
| reinvestment of distributions | — | — | 1,250 | 18,912 |
| 1,250 | 18,403 | 5,163 | 78,460 | |
| Shares repurchased | (34,027) | (463,829) | (8,089) | (125,622) |
| Net decrease | (32,777) | $(445,426) | (2,926) | $(47,162) |
| Six months ended 1/31/12 | Year ended 7/31/11 | |||
| Class R | Shares | Amount | Shares | Amount |
| Shares sold | 74,636 | $1,032,131 | 136,594 | $2,094,359 |
| Shares issued in connection with | ||||
| reinvestment of distributions | 6,479 | 92,131 | 7,934 | 119,254 |
| 81,115 | 1,124,262 | 144,528 | 2,213,613 | |
| Shares repurchased | (9,249) | (134,549) | (59,785) | (923,744) |
| Net increase | 71,866 | $989,713 | 84,743 | $1,289,869 |
| Six months ended 1/31/12 | Year ended 7/31/11 | |||
| Class Y | Shares | Amount | Shares | Amount |
| Shares sold | 64,999 | $1,103,756 | 228,922 | $4,110,421 |
| Shares issued in connection with | ||||
| reinvestment of distributions | 9,361 | 158,198 | 23,374 | 415,362 |
| 74,360 | 1,261,954 | 252,296 | 4,525,783 | |
| Shares repurchased | (521,531) | (8,502,387) | (116,960) | (2,079,592) |
| Net increase (decrease) | (447,171) | $(7,240,433) | 135,336 | $2,446,191 |
78
Putnam RetirementReady 2025 Fund
| Six months ended 1/31/12 | Year ended 7/31/11 | |||
| Class A | Shares | Amount | Shares | Amount |
| Shares sold | 244,305 | $3,983,755 | 679,508 | $11,410,721 |
| Shares issued in connection with | ||||
| reinvestment of distributions | 49,196 | 788,118 | 72,578 | 1,223,668 |
| 293,501 | 4,771,873 | 752,086 | 12,634,389 | |
| Shares repurchased | (768,835) | (12,627,690) | (881,683) | (15,102,759) |
| Net decrease | (475,334) | $(7,855,817) | (129,597) | $(2,468,370) |
| Six months ended 1/31/12 | Year ended 7/31/11 | |||
| Class B | Shares | Amount | Shares | Amount |
| Shares sold | 6,084 | $91,958 | 11,409 | $184,514 |
| Shares issued in connection with | ||||
| reinvestment of distributions | 1,689 | 25,474 | 1,641 | 26,127 |
| 7,773 | 117,432 | 13,050 | 210,641 | |
| Shares repurchased | (7,092) | (109,532) | (15,436) | (248,248) |
| Net increase (decrease) | 681 | $7,900 | (2,386) | $(37,607) |
| Six months ended 1/31/12 | Year ended 7/31/11 | |||
| Class C | Shares | Amount | Shares | Amount |
| Shares sold | 9,366 | $144,121 | 10,733 | $173,377 |
| Shares issued in connection with | ||||
| reinvestment of distributions | 1,028 | 15,519 | 723 | 11,539 |
| 10,394 | 159,640 | 11,456 | 184,916 | |
| Shares repurchased | (7,420) | (112,237) | (1,924) | (30,817) |
| Net increase | 2,974 | $47,403 | 9,532 | $154,099 |
| Six months ended 1/31/12 | Year ended 7/31/11 | |||
| Class M | Shares | Amount | Shares | Amount |
| Shares sold | 2,187 | $34,275 | 2,251 | $37,396 |
| Shares issued in connection with | ||||
| reinvestment of distributions | 275 | 4,205 | 294 | 4,744 |
| 2,462 | 38,480 | 2,545 | 42,140 | |
| Shares repurchased | (4,035) | (61,516) | (2,824) | (45,766) |
| Net decrease | (1,573) | $(23,036) | (279) | $(3,626) |
| Six months ended 1/31/12 | Year ended 7/31/11 | |||
| Class R | Shares | Amount | Shares | Amount |
| Shares sold | 40,148 | $611,662 | 117,867 | $1,895,897 |
| Shares issued in connection with | ||||
| reinvestment of distributions | 7,862 | 118,241 | 6,998 | 111,130 |
| 48,010 | 729,903 | 124,865 | 2,007,027 | |
| Shares repurchased | (29,505) | (452,330) | (34,045) | (551,550) |
| Net increase | 18,505 | $277,573 | 90,820 | $1,455,477 |
79
| Six months ended 1/31/12 | Year ended 7/31/11 | |||
| Class Y | Shares | Amount | Shares | Amount |
| Shares sold | 39,020 | $638,944 | 206,851 | $3,566,653 |
| Shares issued in connection with | ||||
| reinvestment of distributions | 17,099 | 274,787 | 26,510 | 448,550 |
| 56,119 | 913,731 | 233,361 | 4,015,203 | |
| Shares repurchased | (426,620) | (6,754,456) | (130,132) | (2,262,058) |
| Net increase (decrease) | (370,501) | $(5,840,725) | 103,229 | $1,753,145 |
At the close of the reporting period, a shareholder of record owned 5.8% of the outstanding shares of Putnam RetirementReady 2025 Fund.
Putnam RetirementReady 2020 Fund
| Six months ended 1/31/12 | Year ended 7/31/11 | |||
| Class A | Shares | Amount | Shares | Amount |
| Shares sold | 182,041 | $2,855,154 | 867,868 | $13,971,380 |
| Shares issued in connection with | ||||
| reinvestment of distributions | 72,256 | 1,096,118 | 81,883 | 1,309,311 |
| 254,297 | 3,951,272 | 949,751 | 15,280,691 | |
| Shares repurchased | (660,159) | (10,367,903) | (1,133,323) | (18,454,240) |
| Net decrease | (405,862) | $(6,416,631) | (183,572) | $(3,173,549) |
| Six months ended 1/31/12 | Year ended 7/31/11 | |||
| Class B | Shares | Amount | Shares | Amount |
| Shares sold | 6,556 | $99,244 | 15,642 | $242,977 |
| Shares issued in connection with | ||||
| reinvestment of distributions | 2,139 | 31,417 | 1,296 | 20,109 |
| 8,695 | 130,661 | 16,938 | 263,086 | |
| Shares repurchased | (4,487) | (67,789) | (12,631) | (199,500) |
| Net increase | 4,208 | $62,872 | 4,307 | $63,586 |
| Six months ended 1/31/12 | Year ended 7/31/11 | |||
| Class C | Shares | Amount | Shares | Amount |
| Shares sold | 6,615 | $99,842 | 21,299 | $337,014 |
| Shares issued in connection with | ||||
| reinvestment of distributions | 1,853 | 27,309 | 801 | 12,479 |
| 8,468 | 127,151 | 22,100 | 349,493 | |
| Shares repurchased | (6,316) | (94,798) | (8,373) | (129,143) |
| Net increase | 2,152 | $32,353 | 13,727 | $220,350 |
| Six months ended 1/31/12 | Year ended 7/31/11 | |||
| Class M | Shares | Amount | Shares | Amount |
| Shares sold | 305 | $4,651 | 2,106 | $33,433 |
| Shares issued in connection with | ||||
| reinvestment of distributions | 423 | 6,310 | 436 | 6,857 |
| 728 | 10,961 | 2,542 | 40,290 | |
| Shares repurchased | (3,879) | (58,281) | (4,785) | (76,626) |
| Net decrease | (3,151) | $(47,320) | (2,243) | $(36,336) |
80
| Six months ended 1/31/12 | Year ended 7/31/11 | |||
| Class R | Shares | Amount | Shares | Amount |
| Shares sold | 29,031 | $435,571 | 184,795 | $2,926,770 |
| Shares issued in connection with | ||||
| reinvestment of distributions | 9,778 | 143,151 | 7,734 | 119,643 |
| 38,809 | 578,722 | 192,529 | 3,046,413 | |
| Shares repurchased | (28,558) | (428,455) | (63,109) | (999,470) |
| Net increase | 10,251 | $150,267 | 129,420 | $2,046,943 |
| Six months ended 1/31/12 | Year ended 7/31/11 | |||
| Class Y | Shares | Amount | Shares | Amount |
| Shares sold | 30,087 | $519,964 | 167,943 | $3,019,186 |
| Shares issued in connection with | ||||
| reinvestment of distributions | 11,540 | 194,102 | 17,917 | 316,238 |
| 41,627 | 714,066 | 185,860 | 3,335,424 | |
| Shares repurchased | (414,296) | (6,982,907) | (80,375) | (1,447,585) |
| Net increase (decrease) | (372,669) | $(6,268,841) | 105,485 | $1,887,839 |
At the close of the reporting period, a shareholder of record owned 7.1% of the outstanding shares of Putnam RetirementReady 2020 Fund.
Putnam RetirementReady 2015 Fund
| Six months ended 1/31/12 | Year ended 7/31/11 | |||
| Class A | Shares | Amount | Shares | Amount |
| Shares sold | 168,262 | $2,733,081 | 776,123 | $12,933,881 |
| Shares issued in connection with | ||||
| reinvestment of distributions | 63,120 | 984,667 | 72,069 | 1,188,416 |
| 231,382 | 3,717,748 | 848,192 | 14,122,297 | |
| Shares repurchased | (701,398) | (11,457,347) | (1,028,648) | (17,320,026) |
| Net decrease | (470,016) | $(7,739,599) | (180,456) | $(3,197,729) |
| Six months ended 1/31/12 | Year ended 7/31/11 | |||
| Class B | Shares | Amount | Shares | Amount |
| Shares sold | 1,682 | $26,538 | 7,882 | $130,319 |
| Shares issued in connection with | ||||
| reinvestment of distributions | 1,368 | 20,775 | 795 | 12,807 |
| 3,050 | 47,313 | 8,677 | 143,126 | |
| Shares repurchased | (2,605) | (40,840) | (8,840) | (143,942) |
| Net increase (decrease) | 445 | $6,473 | (163) | $(816) |
| Six months ended 1/31/12 | Year ended 7/31/11 | |||
| Class C | Shares | Amount | Shares | Amount |
| Shares sold | 2,292 | $35,641 | 19,837 | $325,163 |
| Shares issued in connection with | ||||
| reinvestment of distributions | 1,295 | 19,650 | 676 | 10,883 |
| 3,587 | 55,291 | 20,513 | 336,046 | |
| Shares repurchased | (3,600) | (56,285) | (22,565) | (368,922) |
| Net decrease | (13) | $(994) | (2,052) | $(32,876) |
81
| Six months ended 1/31/12 | Year ended 7/31/11 | |||
| Class M | Shares | Amount | Shares | Amount |
| Shares sold | 241 | $3,817 | 11,587 | $191,939 |
| Shares issued in connection with | ||||
| reinvestment of distributions | 408 | 6,293 | 648 | 10,530 |
| 649 | 10,110 | 12,235 | 202,469 | |
| Shares repurchased | (10,282) | (160,936) | (16,595) | (273,219) |
| Net decrease | (9,633) | $(150,826) | (4,360) | $(70,750) |
| Six months ended 1/31/12 | Year ended 7/31/11 | |||
| Class R | Shares | Amount | Shares | Amount |
| Shares sold | 30,735 | $477,466 | 81,450 | $1,333,779 |
| Shares issued in connection with | ||||
| reinvestment of distributions | 8,666 | 130,764 | 6,529 | 104,459 |
| 39,401 | 608,230 | 87,979 | 1,438,238 | |
| Shares repurchased | (33,085) | (522,133) | (43,479) | (709,479) |
| Net increase | 6,316 | $86,097 | 44,500 | $728,759 |
| Six months ended 1/31/12 | Year ended 7/31/11 | |||
| Class Y | Shares | Amount | Shares | Amount |
| Shares sold | 15,027 | $245,308 | 83,432 | $1,412,705 |
| Shares issued in connection with | ||||
| reinvestment of distributions | 8,244 | 128,681 | 13,241 | 218,882 |
| 23,271 | 373,989 | 96,673 | 1,631,587 | |
| Shares repurchased | (276,975) | (4,417,761) | (67,277) | (1,132,228) |
| Net increase (decrease) | (253,704) | $(4,043,772) | 29,396 | $499,359 |
At the close of the reporting period, a shareholder of record owned 5.8% of the outstanding shares of Putnam RetirementReady 2015 Fund.
Putnam Retirement Income Fund Lifestyle 1
| Six months ended 1/31/12 | Year ended 7/31/11 | |||
| Class A | Shares | Amount | Shares | Amount |
| Shares sold | 248,640 | $3,931,688 | 338,498 | $5,491,780 |
| Shares issued in connection with | ||||
| reinvestment of distributions | 18,404 | 287,622 | 42,537 | 681,755 |
| Shares issued in connection with the | ||||
| merger of Putnam RetirementReady | ||||
| 2010 Fund | — | — | 932,080 | 15,192,189 |
| 267,044 | 4,219,310 | 1,313,115 | 21,365,724 | |
| Shares repurchased | (392,622) | (6,216,805) | (655,091) | (10,652,298) |
| Net increase (decrease) | (125,578) | $(1,997,495) | 658,024 | $10,713,426 |
82
| Six months ended 1/31/12 | Year ended 7/31/11 | |||
| Class B | Shares | Amount | Shares | Amount |
| Shares sold | 376 | $5,952 | 2,852 | $45,527 |
| Shares issued in connection with | ||||
| reinvestment of distributions | 131 | 2,049 | 239 | 3,812 |
| Shares issued in connection with the | ||||
| merger of Putnam RetirementReady | ||||
| 2010 Fund | — | — | 8,578 | 139,970 |
| 507 | 8,001 | 11,669 | 189,309 | |
| Shares repurchased | (814) | (12,853) | (1,687) | (27,429) |
| Net increase (decrease) | (307) | $(4,852) | 9,982 | $161,880 |
| Six months ended 1/31/12 | Year ended 7/31/11 | |||
| Class C | Shares | Amount | Shares | Amount |
| Shares sold | 3,090 | $48,691 | 14,546 | $238,632 |
| Shares issued in connection with | ||||
| reinvestment of distributions | 394 | 6,158 | 641 | 10,296 |
| Shares issued in connection with the | ||||
| merger of Putnam RetirementReady | ||||
| 2010 Fund | — | — | 18,510 | 302,719 |
| 3,484 | 54,849 | 33,697 | 551,647 | |
| Shares repurchased | (3,792) | (59,841) | (12,020) | (195,787) |
| Net increase (decrease) | (308) | $(4,992) | 21,677 | $355,860 |
| Six months ended 1/31/12 | Year ended 7/31/11 | |||
| Class M | Shares | Amount | Shares | Amount |
| Shares sold | 137 | $2,167 | 1,406 | $22,886 |
| Shares issued in connection with | ||||
| reinvestment of distributions | 285 | 4,465 | 495 | 7,937 |
| Shares issued in connection with the | ||||
| merger of Putnam RetirementReady | ||||
| 2010 Fund | — | — | 5,199 | 84,939 |
| 422 | 6,632 | 7,100 | 115,762 | |
| Shares repurchased | (780) | (12,265) | (6,793) | (110,096) |
| Net increase (decrease) | (358) | $(5,633) | 307 | $5,666 |
| Six months ended 1/31/12 | Year ended 7/31/11 | |||
| Class R | Shares | Amount | Shares | Amount |
| Shares sold | 13,155 | $207,792 | 52,083 | $844,749 |
| Shares issued in connection with | ||||
| reinvestment of distributions | 1,278 | 19,941 | 2,494 | 39,927 |
| Shares issued in connection with the | ||||
| merger of Putnam RetirementReady | ||||
| 2010 Fund | — | — | 57,602 | 938,569 |
| 14,433 | 227,733 | 112,179 | 1,823,245 | |
| Shares repurchased | (15,502) | (245,122) | (38,428) | (621,184) |
| Net increase (decrease) | (1,069) | $(17,389) | 73,751 | $1,202,061 |
83
| Six months ended 1/31/12 | Year ended 7/31/11 | |||
| Class Y | Shares | Amount | Shares | Amount |
| Shares sold | 15,447 | $245,500 | 59,711 | $971,688 |
| Shares issued in connection with | ||||
| reinvestment of distributions | 2,540 | 39,823 | 9,716 | 156,340 |
| Shares issued in connection with the | ||||
| merger of Putnam RetirementReady | ||||
| 2010 Fund | — | — | 144,487 | 2,361,937 |
| 17,987 | 285,323 | 213,914 | 3,489,965 | |
| Shares repurchased | (296,190) | (4,637,876) | (46,453) | (757,907) |
| Net increase (decrease) | (278,203) | $(4,352,553) | 167,461 | $2,732,058 |
At the close of the reporting period, a shareholder of record owned 15.6% of the outstanding shares of Putnam Retirement Income Fund Lifestyle 1.
At the close of the reporting period, Putnam Investments, LLC owned the following shares of each fund:
| Percentage of | |||
| shares | Value at | ||
| Shares owned | outstanding | 1/31/12 | |
| Putnam RetirementReady 2055 Fund class B | 1,107 | 84.80% | $10,472 |
| Putnam RetirementReady 2055 Fund class C | 1,115 | 34.30% | 10,470 |
| Putnam RetirementReady 2055 Fund class M | 1,112 | 100.00% | 10,505 |
| Putnam RetirementReady 2055 Fund class R | 1,116 | 72.70% | 10,535 |
| Putnam RetirementReady 2050 Fund class M | 96 | 5.90% | 1,186 |
| Putnam RetirementReady 2045 Fund class M | 68 | 7.40% | 912 |
| Putnam RetirementReady 2040 Fund class M | 7 | 0.50% | 100 |
Note 5: Initial capitalization and offering of shares
Putnam RetirementReady 2055 Fund was established as a series of the Trust on November 30, 2010. Prior to November 30, 2010, the fund had no operations other than those related to organizational matters, including as noted below, the initial capital contributions by Putnam Investments, LLC and issuance of shares:
| Capital contribution | Shares issued | |
| Class A | $10,000 | 1,000 |
| Class B | $10,000 | 1,000 |
| Class C | $10,000 | 1,000 |
| Class M | $10,000 | 1,000 |
| Class R | $10,000 | 1,000 |
| Class Y | $10,000 | 1,000 |
84
Note 6: Transactions with affiliated issuers
Transactions during the period with companies in which the fund owned at least 5% or more of the outstanding voting securities, or a company which is under common ownership or control were as follows:
Putnam RetirementReady 2055 Fund
| Market value | Market value | |||||
| at beginning | at end | |||||
| of reporting | Purchase | Sale | Investment | Capital gain | of reporting | |
| Affiliates | period | cost | proceeds | income | distributions | period |
| Putnam Absolute Return | ||||||
| 100 Fund | $1,318 | $4,054 | $3,053 | $32 | $— | $2,262 |
| Putnam Absolute Return | ||||||
| 300 Fund | — | — | — | — | — | — |
| Putnam Absolute Return | ||||||
| 500 Fund | 5,819 | 17,827 | 13,273 | 261 | — | 10,019 |
| Putnam Absolute Return | ||||||
| 700 Fund | 19,831 | 60,962 | 45,025 | 1,135 | — | 34,144 |
| Putnam Dynamic Asset | ||||||
| Allocation Balanced Fund | — | — | — | — | — | — |
| Putnam Dynamic Asset | ||||||
| Allocation Conservative Fund | — | — | — | — | — | — |
| Putnam Dynamic Asset | ||||||
| Allocation Equity Fund | 190,948 | 610,083 | 418,807 | — | 30,126 | 348,127 |
| Putnam Dynamic Asset | ||||||
| Allocation Growth Fund | 41,923 | 126,398 | 91,351 | 353 | — | 75,735 |
| Putnam Money Market Fund | 1,092 | 4,342 | 3,306 | — | — | 2,128 |
| Totals | $260,931 | $823,666 | $574,815 | $1,781 | $30,126 | $472,415 |
Market values are shown for those securities affiliated at period end.
Putnam RetirementReady 2050 Fund
| Market value | Market value | |||||
| at beginning | at end | |||||
| of reporting | Purchase | Sale | Investment | Capital gain | of reporting | |
| Affiliates | period | cost | proceeds | income | distributions | period |
| Putnam Absolute Return | ||||||
| 100 Fund | $56,158 | $16,869 | $26,875 | $709 | $— | $44,378 |
| Putnam Absolute Return | ||||||
| 300 Fund | — | — | — | — | — | — |
| Putnam Absolute Return | ||||||
| 500 Fund | 176,674 | 51,036 | 79,791 | 4,173 | — | 140,499 |
| Putnam Absolute Return | ||||||
| 700 Fund | 601,780 | 176,480 | 265,966 | 18,197 | — | 478,797 |
| Putnam Dynamic Asset | ||||||
| Allocation Balanced Fund | — | — | — | — | — | — |
| Putnam Dynamic Asset | ||||||
| Allocation Conservative Fund | — | — | — | — | — | — |
| Putnam Dynamic Asset | ||||||
| Allocation Equity Fund | 5,739,955 | 1,691,200 | 1,997,289 | — | 493,970 | 4,754,259 |
| Putnam Dynamic Asset | ||||||
| Allocation Growth Fund | 1,264,617 | 443,892 | 475,234 | 6,761 | — | 1,207,558 |
| Putnam Money Market Fund | 36,289 | 15,999 | 24,044 | 2 | — | 28,244 |
| Totals | $7,875,473 | $2,395,476 | $2,869,199 | $29,842 | $493,970 | $6,653,735 |
Market values are shown for those securities affiliated at period end.
85
Putnam RetirementReady 2045 Fund
| Market value | Market value | |||||
| at beginning | at end | |||||
| of reporting | Purchase | Sale | Investment | Capital gain | of reporting | |
| Affiliates | period | cost | proceeds | income | distributions | period |
| Putnam Absolute Return | ||||||
| 100 Fund | $195,863 | $41,534 | $102,142 | $2,057 | $— | $129,573 |
| Putnam Absolute Return | ||||||
| 300 Fund | — | — | — | — | — | — |
| Putnam Absolute Return | ||||||
| 500 Fund | 359,457 | 67,765 | 191,554 | 6,535 | — | 220,890 |
| Putnam Absolute Return | ||||||
| 700 Fund | 1,224,426 | 234,637 | 640,989 | 28,462 | — | 752,785 |
| Putnam Dynamic Asset | ||||||
| Allocation Balanced Fund | — | — | — | — | — | — |
| Putnam Dynamic Asset | ||||||
| Allocation Conservative Fund | — | — | — | — | — | — |
| Putnam Dynamic Asset | ||||||
| Allocation Equity Fund | 9,366,189 | 1,763,035 | 4,125,713 | — | 608,715 | 5,853,048 |
| Putnam Dynamic Asset | ||||||
| Allocation Growth Fund | 4,825,995 | 1,071,036 | 2,226,701 | 19,321 | — | 3,450,691 |
| Putnam Money Market Fund | 74,660 | 22,635 | 53,238 | 2 | — | 44,057 |
| Totals | $16,046,590 | $3,200,642 | $7,340,337 | $56,377 | $608,715 | $10,451,044 |
Market values are shown for those securities affiliated at period end.
Putnam RetirementReady 2040 Fund
| Market value | Market value | |||||
| at beginning | at end | |||||
| of reporting | Purchase | Sale | Investment | Capital gain | of reporting | |
| Affiliates | period | cost | proceeds | income | distributions | period |
| Putnam Absolute Return | ||||||
| 100 Fund | $503,885 | $98,042 | $280,353 | $5,017 | $— | $307,096 |
| Putnam Absolute Return | ||||||
| 300 Fund | — | — | — | — | — | — |
| Putnam Absolute Return | ||||||
| 500 Fund | 554,867 | 95,199 | 317,489 | 9,419 | — | 309,367 |
| Putnam Absolute Return | ||||||
| 700 Fund | 1,890,069 | 329,665 | 1,063,612 | 41,078 | — | 1,054,314 |
| Putnam Dynamic Asset | ||||||
| Allocation Balanced Fund | — | — | — | — | — | — |
| Putnam Dynamic Asset | ||||||
| Allocation Conservative Fund | — | — | — | — | — | — |
| Putnam Dynamic Asset | ||||||
| Allocation Equity Fund | 10,064,680 | 1,700,906 | 4,995,451 | — | 587,004 | 5,486,532 |
| Putnam Dynamic Asset | ||||||
| Allocation Growth Fund | 11,669,783 | 2,227,781 | 5,850,652 | 42,642 | — | 7,405,823 |
| Putnam Money Market Fund | 115,282 | 34,000 | 88,245 | 4 | — | 61,036 |
| Totals | $24,798,566 | $4,485,593 | $12,595,802 | $98,160 | $587,004 | $14,624,168 |
Market values are shown for those securities affiliated at period end.
86
Putnam RetirementReady 2035 Fund
| Market value | Market value | |||||
| at beginning | at end | |||||
| of reporting | Purchase | Sale | Investment | Capital gain | of reporting | |
| Affiliates | period | cost | proceeds | income | distributions | period |
| Putnam Absolute Return | ||||||
| 100 Fund | $904,340 | $183,473 | $508,763 | $9,206 | $— | $552,775 |
| Putnam Absolute Return | ||||||
| 300 Fund | — | 73,702 | 28,759 | 521 | — | 44,660 |
| Putnam Absolute Return | ||||||
| 500 Fund | 1,303,699 | 263,155 | 666,061 | 26,246 | — | 846,386 |
| Putnam Absolute Return | ||||||
| 700 Fund | 2,894,827 | 597,783 | 1,442,465 | 75,056 | — | 1,892,562 |
| Putnam Dynamic Asset | ||||||
| Allocation Balanced Fund | — | 660,658 | 273,210 | 2,196 | — | 436,296 |
| Putnam Dynamic Asset | ||||||
| Allocation Conservative Fund | — | — | — | — | — | — |
| Putnam Dynamic Asset | ||||||
| Allocation Equity Fund | 5,880,939 | 1,049,386 | 2,987,606 | — | 344,213 | 3,176,278 |
| Putnam Dynamic Asset | ||||||
| Allocation Growth Fund | 24,246,587 | 3,783,888 | 10,898,440 | 92,292 | — | 15,822,867 |
| Putnam Money Market Fund | 455,562 | 128,787 | 267,027 | 14 | — | 317,322 |
| Totals | $35,685,954 | $6,740,832 | $17,072,331 | $205,531 | $344,213 | $23,089,146 |
Market values are shown for those securities affiliated at period end.
Putnam RetirementReady 2030 Fund
| Market value | Market value | |||||
| at beginning | at end | |||||
| of reporting | Purchase | Sale | Investment | Capital gain | of reporting | |
| Affiliates | period | cost | proceeds | income | distributions | period |
| Putnam Absolute Return | ||||||
| 100 Fund | $1,178,533 | $236,623 | $538,769 | $13,958 | $— | $840,352 |
| Putnam Absolute Return | ||||||
| 300 Fund | 565,218 | 289,734 | 316,134 | 5,992 | — | 515,200 |
| Putnam Absolute Return | ||||||
| 500 Fund | 2,359,702 | 418,652 | 1,110,290 | 48,685 | — | 1,572,006 |
| Putnam Absolute Return | ||||||
| 700 Fund | 4,951,458 | 907,177 | 2,240,418 | 132,903 | — | 3,354,488 |
| Putnam Dynamic Asset | ||||||
| Allocation Balanced Fund | 4,681,172 | 3,106,225 | 2,922,140 | 47,630 | — | 4,922,510 |
| Putnam Dynamic Asset | ||||||
| Allocation Conservative Fund | — | — | — | — | — | — |
| Putnam Dynamic Asset | ||||||
| Allocation Equity Fund | — | — | — | — | — | — |
| Putnam Dynamic Asset | ||||||
| Allocation Growth Fund | 31,594,235 | 3,624,616 | 14,270,521 | 112,317 | — | 19,128,074 |
| Putnam Money Market Fund | 1,300,024 | 247,950 | 730,535 | 49 | — | 817,439 |
| Totals | $46,630,342 | $8,830,977 | $22,128,807 | $361,534 | $— | $31,150,069 |
Market values are shown for those securities affiliated at period end.
87
Putnam RetirementReady 2025 Fund
| Market value | Market value | |||||
| at beginning | at end | |||||
| of reporting | Purchase | Sale | Investment | Capital gain | of reporting | |
| Affiliates | period | cost | proceeds | income | distributions | period |
| Putnam Absolute Return | ||||||
| 100 Fund | $1,876,429 | $375,493 | $879,322 | $22,364 | $— | $1,315,048 |
| Putnam Absolute Return | ||||||
| 300 Fund | 2,291,528 | 612,762 | 1,062,601 | 20,806 | — | 1,747,300 |
| Putnam Absolute Return | ||||||
| 500 Fund | 3,130,883 | 755,943 | 1,426,359 | 74,061 | — | 2,335,609 |
| Putnam Absolute Return | ||||||
| 700 Fund | 6,986,821 | 1,284,881 | 3,195,699 | 190,628 | — | 4,704,455 |
| Putnam Dynamic Asset | ||||||
| Allocation Balanced Fund | 20,705,185 | 4,578,793 | 9,435,360 | 179,326 | — | 15,413,122 |
| Putnam Dynamic Asset | ||||||
| Allocation Conservative Fund | — | 522,555 | 191,686 | 2,378 | — | 354,753 |
| Putnam Dynamic Asset | ||||||
| Allocation Equity Fund | — | — | — | — | — | — |
| Putnam Dynamic Asset | ||||||
| Allocation Growth Fund | 14,951,336 | 1,762,241 | 7,317,810 | 50,961 | — | 8,481,655 |
| Putnam Money Market Fund | 1,802,238 | 376,191 | 891,278 | 63 | — | 1,287,151 |
| Totals | $51,744,420 | $10,268,859 | $24,400,115 | $540,587 | $— | $35,639,093 |
Market values are shown for those securities affiliated at period end.
Putnam RetirementReady 2020 Fund
| Market value | Market value | |||||
| at beginning | at end | |||||
| of reporting | Purchase | Sale | Investment | Capital gain | of reporting | |
| Affiliates | period | cost | proceeds | income | distributions | period |
| Putnam Absolute Return | ||||||
| 100 Fund | $2,307,408 | $400,890 | $983,830 | $29,023 | $— | $1,651,994 |
| Putnam Absolute Return | ||||||
| 300 Fund | 4,120,325 | 865,840 | 1,778,615 | 37,344 | — | 3,036,163 |
| Putnam Absolute Return | ||||||
| 500 Fund | 4,914,837 | 1,444,539 | 2,266,585 | 127,426 | — | 3,893,893 |
| Putnam Absolute Return | ||||||
| 700 Fund | 6,727,782 | 1,015,232 | 3,019,586 | 182,399 | — | 4,358,359 |
| Putnam Dynamic Asset | ||||||
| Allocation Balanced Fund | 26,075,092 | 3,006,185 | 11,833,271 | 210,764 | — | 16,328,397 |
| Putnam Dynamic Asset | ||||||
| Allocation Conservative Fund | 2,463,355 | 1,960,497 | 1,589,458 | 27,242 | — | 2,878,885 |
| Putnam Dynamic Asset | ||||||
| Allocation Equity Fund | — | — | — | — | — | — |
| Putnam Dynamic Asset | ||||||
| Allocation Growth Fund | — | — | — | — | — | — |
| Putnam Money Market Fund | 2,285,317 | 395,007 | 1,058,518 | 93 | — | 1,621,807 |
| Totals | $48,894,116 | $9,088,190 | $22,529,863 | $614,291 | $— | $33,769,498 |
Market values are shown for those securities affiliated at period end.
88
Putnam RetirementReady 2015 Fund
| Market value | Market value | |||||
| at beginning | at end | |||||
| of reporting | Purchase | Sale | Investment | Capital gain | of reporting | |
| Affiliates | period | cost | proceeds | income | distributions | period |
| Putnam Absolute Return | ||||||
| 100 Fund | $2,414,382 | $537,539 | $1,174,144 | $29,645 | $— | $1,702,957 |
| Putnam Absolute Return | ||||||
| 300 Fund | 5,065,750 | 1,318,839 | 2,502,251 | 44,797 | — | 3,673,575 |
| Putnam Absolute Return | ||||||
| 500 Fund | 8,057,659 | 1,763,663 | 3,868,126 | 183,475 | — | 5,639,774 |
| Putnam Absolute Return | ||||||
| 700 Fund | 3,502,207 | 462,468 | 1,859,093 | 80,037 | — | 1,922,563 |
| Putnam Dynamic Asset | ||||||
| Allocation Balanced Fund | 9,987,942 | 1,103,981 | 5,422,677 | 75,028 | — | 5,249,338 |
| Putnam Dynamic Asset | ||||||
| Allocation Conservative Fund | 8,764,380 | 2,241,597 | 4,438,913 | 72,959 | — | 6,505,842 |
| Putnam Dynamic Asset | ||||||
| Allocation Equity Fund | — | — | — | — | — | — |
| Putnam Dynamic Asset | ||||||
| Allocation Growth Fund | — | — | — | — | — | — |
| Putnam Money Market Fund | 2,395,647 | 375,674 | 1,249,426 | 213 | — | 1,521,895 |
| Totals | $40,187,967 | $7,803,761 | $20,514,630 | $486,154 | $— | $26,215,944 |
Market values are shown for those securities affiliated at period end.
Putnam Retirement Income Fund Lifestyle 1
| Market value | Market value | |||||
| at beginning | at end | |||||
| of reporting | Purchase | Sale | Investment | Capital gain | of reporting | |
| Affiliates | period | cost | proceeds | income | distributions | period |
| Putnam Absolute Return | ||||||
| 100 Fund | $2,612,128 | $523,107 | $1,105,733 | $35,406 | $— | $1,944,675 |
| Putnam Absolute Return | ||||||
| 300 Fund | 6,089,576 | 1,221,806 | 2,472,017 | 58,405 | — | 4,581,690 |
| Putnam Absolute Return | ||||||
| 500 Fund | 8,717,716 | 1,719,990 | 3,539,697 | 221,011 | — | 6,529,065 |
| Putnam Absolute Return | ||||||
| 700 Fund | — | — | — | — | — | — |
| Putnam Dynamic Asset | ||||||
| Allocation Balanced Fund | — | — | — | — | — | — |
| Putnam Dynamic Asset | ||||||
| Allocation Conservative Fund | 9,904,673 | 1,860,051 | 4,133,840 | 81,918 | — | 7,528,961 |
| Putnam Dynamic Asset | ||||||
| Allocation Equity Fund | — | — | — | — | — | — |
| Putnam Dynamic Asset | ||||||
| Allocation Growth Fund | — | — | — | — | — | — |
| Putnam Money Market Fund | 1,729,325 | 335,814 | 789,035 | 187 | — | 1,276,104 |
| Totals | $29,053,418 | $5,660,768 | $12,040,322 | $396,927 | $— | $21,860,495 |
Market values are shown for those securities affiliated at period end.
89
Note 7: Acquisition of Putnam RetirementReady 2010 Fund
On November 8, 2010, Putnam Retirement Income Fund Lifestyle 1 issued 932,080, 8,578, 18,510, 5,199, 57,602 and 144,487 class A, class B, class C, class M, class R and class Y shares, respectively, for 990,361, 9,336, 20,437, 5,624, 62,930, and 145,283 class A, class B, class C, class M, class R and class Y shares of Putnam RetirementReady 2010 Fund to acquire that fund’s net assets in a tax-free exchange. The purpose of the transaction, which was to contemplated by the funds’ prospectus, was to combine two Putnam funds with substantially similar investment objectives and investment strategies into a single Putnam fund with a larger asset base and therefore potentially lower expenses for fund shareholders. The investment portfolio of Putnam RetirementReady 2010 Fund, with a fair value of $19,025,161 and an identified cost of $18,067,646 at November 5, 2010, was the principal asset acquired by Putnam Retirement Income Fund Lifestyle 1. The net assets of Putnam Retirement Income Fund Lifestyle 1 and Putnam RetirementReady 2010 Fund on November 5, 2010, were $13,900,864 and $19,020,323, respectively. On November 5, 2010, Putnam RetirementReady 2010 Fund had undistributed net investment loss of $5,304, accumulated net realized (loss) of $11,649,678 and unrealized appreciation of $957,515. The aggregate net assets of Putnam Retirement Income Fund Lifestyle 1 immediately following the acquisition were $32,921,187.
Information presented in the Statement of changes in net assets for the period ended July 31, 2011 reflect only the operations of Putnam Retirement Income Fund Lifestyle 1.
Assuming the acquisition had been completed on August 1, 2010, the fund’s pro forma results of operations for the reporting period are as follows:
| Net investment Income | $909,517 |
| Net gain (loss) on investments | $939,533 |
| Net increase (decrease) in net assets resulting from operations | $1,849,050 |
Because the combined investment portfolios have been managed as a single portfolio since the acquisition was completed, it is not practicable to separate the amounts of revenue and earnings of Putnam RetirementReady 2010 Fund that have been included in Putnam Retirement Income Fund Lifestyle 1’s statement of operations for the current fiscal period.
Note 8: Market and credit risk
In the normal course of business, the underlying Putnam Funds trade financial instruments and enter into financial transactions where risk of potential loss exists due to changes in the market (market risk) or failure of the contracting party to the transaction to perform (credit risk). The underlying Putnam Funds may be exposed to additional credit risk that an institution or other entity with which the fund has unsettled or open transactions will default.
Note 9: New accounting pronouncement
In May 2011, the Financial Accounting Standards Board (FASB) issued Accounting Standards Update (ASU) 2011-04 “Fair Value Measurements and Disclosures (Topic 820) — Amendments to Achieve Common Fair Value Measurement and Disclosure Requirements in U.S. GAAP and IFRS”. ASU 2011-04 amends FASB Topic 820 “Fair Value Measurement” and seeks to develop common requirements for measuring fair value and for disclosing information about fair value measurements in accordance with GAAP. ASU 2011-04 is effective for fiscal years and interim periods beginning after December 15, 2011. Putnam Management is currently evaluating the application of ASU 2011-04 and its impact, if any, on the fund’s financial statements.
90
The Putnam family of funds
The following is a list of Putnam’s open-end mutual funds offered to the public. Investors should carefully consider the investment objective, risks, charges, and expenses of a fund before investing. For a prospectus, or a summary prospectus if available, containing this and other information for any Putnam fund or product, call your financial advisor at 1-800-225-1581 and ask for a prospectus. Please read the prospectus carefully before investing.
| Growth | Income |
| Growth Opportunities Fund | American Government Income Fund |
| International Growth Fund | Diversified Income Trust |
| Multi-Cap Growth Fund | Floating Rate Income Fund |
| Small Cap Growth Fund | Global Income Trust |
| Voyager Fund | High Yield Advantage Fund |
| High Yield Trust | |
| Blend | Income Fund |
| Asia Pacific Equity Fund | Money Market Fund* |
| Capital Opportunities Fund | Short Duration Income Fund |
| Capital Spectrum Fund | U.S. Government Income Trust |
| Emerging Markets Equity Fund | |
| Equity Spectrum Fund | Tax-free income |
| Europe Equity Fund | AMT-Free Municipal Fund |
| Global Equity Fund | Tax Exempt Income Fund |
| International Capital Opportunities Fund | Tax Exempt Money Market Fund* |
| International Equity Fund | Tax-Free High Yield Fund |
| Investors Fund | |
| Multi-Cap Core Fund | State tax-free income funds: |
| Research Fund | Arizona, California, Massachusetts, Michigan, |
| Minnesota, New Jersey, New York, Ohio, | |
| Value | and Pennsylvania. |
| Convertible Securities Fund | |
| Equity Income Fund | Absolute Return |
| George Putnam Balanced Fund | Absolute Return 100 Fund |
| The Putnam Fund for Growth and Income | Absolute Return 300 Fund |
| International Value Fund | Absolute Return 500 Fund |
| Multi-Cap Value Fund | Absolute Return 700 Fund |
| Small Cap Value Fund |
* An investment in a money market fund is not insured or guaranteed by the Federal Deposit Insurance Corporation or any other government agency. Although the fund seeks to preserve the value of your investment at $1.00 per share, it is possible to lose money by investing in the fund.
91
| Global Sector | Putnam RetirementReady Funds — portfolios |
| Global Consumer Fund | with automatically adjusting allocations to |
| Global Energy Fund | stocks, bonds, and money market instruments, |
| Global Financials Fund | becoming more conservative over time. |
| Global Health Care Fund | |
| Global Industrials Fund | RetirementReady 2055 Fund |
| Global Natural Resources Fund | RetirementReady 2050 Fund |
| Global Sector Fund | RetirementReady 2045 Fund |
| Global Technology Fund | RetirementReady 2040 Fund |
| Global Telecommunications Fund | RetirementReady 2035 Fund |
| Global Utilities Fund | RetirementReady 2030 Fund |
| RetirementReady 2025 Fund | |
| Asset Allocation | RetirementReady 2020 Fund |
| Putnam Global Asset Allocation Funds — | RetirementReady 2015 Fund |
| portfolios with allocations to stocks, bonds, | |
| and money market instruments that are | Putnam Retirement Income Lifestyle |
| adjusted dynamically within specified ranges | Funds — portfolios with managed |
| as market conditions change. | allocations to stocks, bonds, and money |
| market investments to generate | |
| Dynamic Asset Allocation Balanced Fund | retirement income. |
| Prior to November 30, 2011, this fund was known as | |
| Putnam Asset Allocation: Balanced Portfolio. | Retirement Income Fund Lifestyle 1 |
| Dynamic Asset Allocation | Prior to June 16, 2011, this fund was known as |
| Conservative Fund | Putnam RetirementReady Maturity Fund. |
| Prior to November 30, 2011, this fund was known as | Retirement Income Fund Lifestyle 2 |
| Putnam Asset Allocation: Conservative Portfolio. | Retirement Income Fund Lifestyle 3 |
| Dynamic Asset Allocation Growth Fund | Prior to June 16, 2011, this fund was known as |
| Prior to November 30, 2011, this fund was known as | Putnam Income Strategies Fund. |
| Putnam Asset Allocation: Growth Portfolio. | |
| Dynamic Risk Allocation Fund |
A short-term trading fee of 1% may apply to redemptions or exchanges from certain funds within the time period specified in the fund's prospectus.
Check your account balances and the most recent month-end performance in the Individual Investors section at putnam.com.
92
Fund information
Founded over 70 years ago, Putnam Investments was built around the concept that a balance between risk and reward is the hallmark of a well-rounded financial program. We manage over 100 funds across income, value, blend, growth, asset allocation, absolute return, and global sector categories.
| Investment Manager | Elizabeth T. Kennan | Mark C. Trenchard |
| Putnam Investment | Kenneth R. Leibler | Vice President and |
| Management, LLC | Robert E. Patterson | BSA Compliance Officer |
| One Post Office Square | George Putnam, III | |
| Boston, MA 02109 | Robert L. Reynolds | Robert T. Burns |
| W. Thomas Stephens | Vice President and | |
| Investment Sub-Manager | Chief Legal Officer | |
| Putnam Investments Limited | Officers | |
| 57–59 St James’s Street | Robert L. Reynolds | James P. Pappas |
| London, England SW1A 1LD | President | Vice President |
| Marketing Services | Jonathan S. Horwitz | Judith Cohen |
| Putnam Retail Management | Executive Vice President, | Vice President, Clerk and |
| One Post Office Square | Principal Executive | Assistant Treasurer |
| Boston, MA 02109 | Officer, Treasurer and | |
| Compliance Liaison | Michael Higgins | |
| Custodian | Vice President, Senior Associate | |
| State Street Bank | Steven D. Krichmar | Treasurer and Assistant Clerk |
| and Trust Company | Vice President and | |
| Principal Financial Officer | Nancy E. Florek | |
| Legal Counsel | Vice President, Assistant Clerk, | |
| Ropes & Gray LLP | Janet C. Smith | Assistant Treasurer and |
| Vice President, Assistant | Proxy Manager | |
| Trustees | Treasurer and Principal | |
| Jameson A. Baxter, Chair | Accounting Officer | Susan G. Malloy |
| Ravi Akhoury | Vice President and | |
| Barbara M. Baumann | Robert R. Leveille | Assistant Treasurer |
| Charles B. Curtis | Vice President and | |
| Robert J. Darretta | Chief Compliance Officer | |
| John A. Hill | ||
| Paul L. Joskow |
This report is for the information of shareholders of Putnam RetirementReady Funds. It may also be used as sales literature when preceded or accompanied by the current prospectus, the most recent copy of Putnam’s Quarterly Performance Summary, and Putnam’s Quarterly Ranking Summary. For more recent performance, please visit putnam.com. Investors should carefully consider the investment objectives, risks, charges, and expenses of a fund, which are described in its prospectus. For this and other information or to request a prospectus, call 1-800-225-1581 toll free. Please read the prospectus carefully before investing. The fund’s Statement of Additional Information contains additional information about the fund’s Trustees and is available without charge upon request by calling 1-800-225-1581.
| Item 2. Code of Ethics: |
| Not applicable |
| Item 3. Audit Committee Financial Expert: |
| Not applicable |
| Item 4. Principal Accountant Fees and Services: |
| Not applicable |
| Item 5. Audit Committee of Listed Registrants |
| Not applicable |
| Item 6. Schedule of Investments: |
| The registrant’s schedule of investments in unaffiliated issuers is included in the report to shareholders in Item 1 above. |
| Item 7. Disclosure of Proxy Voting Policies and Procedures For Closed-End Management Investment Companies: |
| Not applicable |
| Item 8. Portfolio Managers of Closed-End Investment Companies |
| Not Applicable |
| Item 9. Purchases of Equity Securities by Closed-End Management Investment Companies and Affiliated Purchasers: |
| Not applicable |
| Item 10. Submission of Matters to a Vote of Security Holders: |
| Not applicable |
| Item 11. Controls and Procedures: |
| (a) The registrant’s principal executive officer and principal financial officer have concluded, based on their evaluation of the effectiveness of the design and operation of the registrant’s disclosure controls and procedures as of a date within 90 days of the filing date of this report, that the design and operation of such procedures are generally effective to provide reasonable assurance that information required to be disclosed by the registrant in this report is recorded, processed, summarized and reported within the time periods specified in the Commission’s rules and forms. |
| (b) Changes in internal control over financial reporting: Not applicable |
| Item 12. Exhibits: |
| (a)(1) Not applicable |
| (a)(2) Separate certifications for the principal executive officer and principal financial officer of the registrant as required by Rule 30a-2(a) under the Investment Company Act of 1940, as amended, are filed herewith. |
| (b) The certifications required by Rule 30a-2(b) under the Investment Company Act of 1940, as amended, are filed herewith. |
| Putnam RetirementReady Funds |
| By (Signature and Title): |
| /s/Janet C. Smith Janet C. Smith Principal Accounting Officer |
| Date: March 30, 2012 |
| Pursuant to the requirements of the Securities Exchange Act of 1934 and the Investment Company Act of 1940, this report has been signed below by the following persons on behalf of the registrant and in the capacities and on the dates indicated. |
| By (Signature and Title): |
| /s/Jonathan S. Horwitz Jonathan S. Horwitz Principal Executive Officer |
| Date: March 30, 2012 |
| By (Signature and Title): |
| /s/Steven D. Krichmar Steven D. Krichmar Principal Financial Officer |
| Date: March 30, 2012 |