UNITED STATES
SECURITIES AND EXCHANGE COMMISSION
Washington, D.C. 20549
FORM N-CSR
CERTIFIED SHAREHOLDER REPORT OF REGISTERED
MANAGEMENT INVESTMENT COMPANIES
Investment Company Act file number 811-21606
Centaur Mutual Funds Trust
(Exact name of registrant as specified in charter)
475 Park Avenue South, 9th Floor
New York, NY 10016
(Address of principal executive offices) (Zip code)
Ultimus Fund Solutions, LLC
Attn: Zachary P. Richmond
225 Pictoria Drive, Suite 450
Cincinnati, OH 45246
(Name and address of agent for service)
Registrant’s telephone number, including area code: 1-513-587-3400
Date of fiscal year end: February 28
Date of reporting period: August 31, 2023
Form N-CSR is to be used by management investment companies to file reports with the Commission not later than 10 days after the transmission to stockholders of any report that is required to be transmitted to stockholders under Rule 30e-1 under the Investment Company Act of 1940 (17 CFR 270.30e-1). The Commission may use the information provided on Form N-CSR in its regulatory, disclosure review, inspection and policymaking roles.
A registrant is required to disclose the information specified by Form N-CSR, and the Commission will make this information public. A registrant is not required to respond to the collection of information contained in Form N-CSR unless the Form displays a currently valid Office of Management and Budget ("OMB") control number. Please direct comments concerning the accuracy of the information collection burden estimate and any suggestions for reducing the burden to Secretary, Securities and Exchange Commission, 450 Fifth Street, NW, Washington, DC 20549-0609. The OMB has reviewed this collection of information under the clearance requirements of 44 U.S.C. § 3507.
Item 1. Reports to Stockholders.

COPLEY FUND
SEMI-ANNUAL REPORT
August 31, 2023
Investment Results (Unaudited)
Average Annual Total Return(a) as of August 31, 2023
| | | Six Months | | One Year | | Five Years | | Ten Years |
| Copley Fund(b) | | 6.99% | | 9.21% | | 6.70% | | 9.58% |
| S&P 500® Index(c) | | 14.50% | | 15.94% | | 11.12% | | 12.81% |
Total annual operating expenses, as disclosed in the Copley Fund’s (the “Fund”) prospectus dated June 28, 2023, were 1.06% of average daily net assets. Additional information pertaining to the Fund’s expense ratios (not including acquired fund fees and expenses) as of August 31, 2023 can be found in the financial highlights.
The performance quoted represents past performance, which does not guarantee future results. The investment return and principal value of an investment will fluctuate so that an investor’s shares, when redeemed, may be worth more or less than their original cost. The returns shown do not reflect deduction of taxes that a shareholder would pay on the Copley Fund (the “Fund”) distributions or the redemption of Fund shares. Current performance may be lower or higher than the performance quoted. Performance data current to the most recent month end may be obtained by calling 1-888-484-5766.
| (a) | Return figures reflect any change in price per share and assume the reinvestment of all distributions. The Fund’s returns reflect any fee reductions during the applicable period. If such fee reductions had not occurred, the quoted performances would have been lower. |
| (b) | The returns shown are based on the net asset values calculated for shareholder transactions and may differ from the returns shown in the financial highlights, which reflects adjustments made to the net asset value in accordance with accounting principles generally accepted in the United States of America. |
| (c) | S&P 500® Index is a stock market index tracking the performance of 500 large companies listed on stock exchanges in the United States. It is one of the most commonly followed equity indices. |
An investor should consider the investment objectives, risks, charges and expenses of the Fund carefully before investing. The Copley Fund’s prospectus contains this and other important information. To obtain a copy of the Fund’s prospectus please visit our website at https://www.dcmadvisors.com or call 1-888-484-5766 and a copy will be sent to you free of charge. Please read the prospectus carefully before you invest.
The Fund is distributed by Ultimus Fund Distributors, LLC, member FINRA/SIPC
Fund Holdings (Unaudited)
Copley Fund Holdings as of August 31, 2023.*
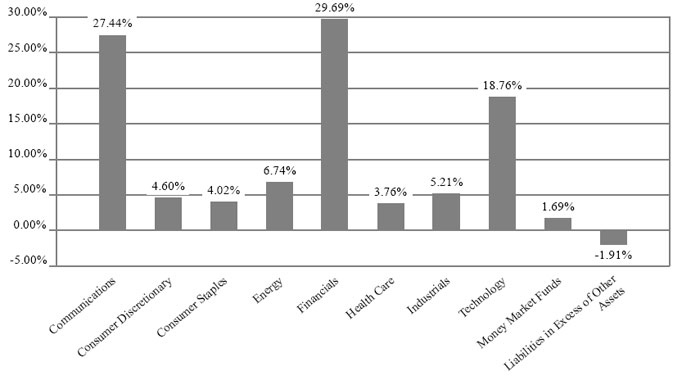
| * | As a percentage of net assets. |
The investment objective of the Copley Fund (the “Fund”) is to seek growth of capital.
Portfolio holdings are subject to change.
Availability of Portfolio Schedule (Unaudited)
The Fund files a complete schedule of portfolio holdings with the Securities and Exchange Commission (the “SEC”) for the first and third quarters of each fiscal year as an exhibit to its reports on Form N-PORT. The Fund’s portfolio holdings are available on the SEC’s website at www.sec.gov or on the Fund’s website at https://www.dcmadvisors.com.
| Copley Fund |
| Schedule of Investments |
| August 31, 2023 (Unaudited) |
| COMMON STOCKS — 100.22% | | Shares | | | Fair Value | |
| Communications — 27.44% | | | | | | | | |
| Alphabet, Inc., Class A(a) | | | 18,950 | | | $ | 2,580,422 | |
| AT&T, Inc. | | | 115,600 | | | | 1,709,724 | |
| Booking Holdings, Inc.(a) | | | 400 | | | | 1,242,012 | |
| Comcast Corp., Class A | | | 93,700 | | | | 4,381,412 | |
| Liberty Broadband Corp. - Series C(a) | | | 10,470 | | | | 979,573 | |
| Liberty Live Group - Series C(a) | | | 12,518 | | | | 421,214 | |
| Liberty Media Corp-Liberty SiriusXM(a) | | | 50,070 | | | | 1,223,711 | |
| Meta Platforms, Inc., Class A(a) | | | 14,400 | | | | 4,260,815 | |
| Netflix, Inc.(a) | | | 7,560 | | | | 3,278,621 | |
| Walt Disney Co. (The)(a) | | | 41,450 | | | | 3,468,536 | |
| | | | | | | | 23,546,040 | |
| Consumer Discretionary — 4.60% | | | | | | | | |
| McDonald’s Corp. | | | 6,730 | | | | 1,892,140 | |
| RH(a) | | | 5,630 | | | | 2,056,019 | |
| | | | | | | | 3,948,159 | |
| Consumer Staples — 4.02% | | | | | | | | |
| PepsiCo, Inc. | | | 7,850 | | | | 1,396,672 | |
| Philip Morris International, Inc. | | | 12,330 | | | | 1,184,420 | |
| Procter & Gamble Co. (The) | | | 5,650 | | | | 872,021 | |
| | | | | | | | 3,453,113 | |
| Energy — 6.74% | | | | | | | | |
| ConocoPhillips | | | 10,900 | | | | 1,297,427 | |
| Marathon Petroleum Corp. | | | 21,790 | | | | 3,110,959 | |
| Phillips 66 | | | 12,070 | | | | 1,377,911 | |
| | | | | | | | 5,786,297 | |
| Financials — 29.69% | | | | | | | | |
| American Express Co. | | | 17,600 | | | | 2,780,624 | |
| American International Group, Inc. | | | 63,300 | | | | 3,704,316 | �� |
| Bank of America Corp. | | | 110,900 | | | | 3,179,502 | |
| Berkshire Hathaway, Inc., Class B(a) | | | 8,760 | | | | 3,155,352 | |
| Goldman Sachs Group, Inc. (The) | | | 9,560 | | | | 3,132,908 | |
| JPMorgan Chase & Co. | | | 16,580 | | | | 2,426,151 | |
| Morgan Stanley | | | 39,150 | | | | 3,333,622 | |
| U.S. Bancorp | | | 27,220 | | | | 994,347 | |
| Wells Fargo & Co. | | | 66,950 | | | | 2,764,366 | |
| | | | | | | | 25,471,188 | |
| Health Care — 3.76% | | | | | | | | |
| AbbVie, Inc. | | | 13,940 | | | | 2,048,623 | |
| Pfizer, Inc. | | | 33,280 | | | | 1,177,446 | |
| | | | | | | | 3,226,069 | |
| Industrials — 5.21% | | | | | | | | |
| Boeing Co. (The)(a) | | | 5,390 | | | | 1,207,522 | |
| CSX Corp. | | | 65,220 | | | | 1,969,644 | |
| Raytheon Technologies Corp. | | | 15,000 | | | | 1,290,600 | |
| | | | | | | | 4,467,766 | |
| Technology — 18.76% | | | | | | | | |
| Apple, Inc. | | | 33,180 | | | | 6,233,527 | |
| | | | | | | | | |
See accompanying notes which are an integral part of these financial statements.
Copley Fund
Schedule of Investments (continued)
August 31, 2023 (Unaudited)
| COMMON STOCKS — 100.22% - continued | | Shares | | | Fair Value | |
| Technology — 18.76% - continued | | | | | | | | |
| Microsoft Corp. | | | 18,350 | | | $ | 6,014,396 | |
| Oracle Corp. | | | 32,000 | | | | 3,852,480 | |
| | | | | | | | 16,100,403 | |
| Total Common Stocks (Cost $75,958,925) | | | | | | | 85,999,035 | |
| | | | | | | | | |
| MONEY MARKET FUNDS - 1.69% | | | | | | | | |
| Federated Hermes Treasury Obligations Fund, Institutional Shares, 5.20%(b) | | | 1,451,882 | | | | 1,451,882 | |
| | | | | | | | | |
| Total Money Market Funds (Cost $1,451,882) | | | | | | | 1,451,882 | |
| | | | | | | | | |
| Total Investments — 101.91% (Cost $77,410,807) | | | | | | | 87,450,917 | |
| | | | | | | | | |
| Liabilities in Excess of Other Assets — (1.91)% | | | | | | | (1,635,816 | ) |
| | | | | | | | | |
| NET ASSETS — 100.00% | | | | | | $ | 85,815,101 | |
| (a) | Non-income producing security. |
| (b) | Rate disclosed is the seven day effective yield as of August 31, 2023. |
See accompanying notes which are an integral part of these financial statements.
| Copley Fund |
| Statement of Assets and Liabilities |
| August 31, 2023 (Unaudited) |
| Assets | | | | |
| Investments in securities, at fair value (cost $77,410,807) | | $ | 87,450,917 | |
| Receivable for fund shares sold | | | 43 | |
| Dividends and interest receivable | | | 180,049 | |
| Taxes receivable | | | 400,679 | |
| Prepaid expenses | | | 8,707 | |
| Total Assets | | | 88,040,395 | |
| Liabilities | | | | |
| Payable to Advisor | | | 47,354 | |
| Payable to affiliates | | | 10,962 | |
| Deferred income taxes, net | | | 2,108,423 | |
| Other accrued expenses | | | 58,555 | |
| Total Liabilities | | | 2,225,294 | |
| Net Assets | | $ | 85,815,101 | |
| Net Assets consist of: | | | | |
| Paid-in capital | | | 592,489 | |
| Accumulated earnings | | | 85,222,612 | |
| Net Assets | | $ | 85,815,101 | |
| Shares outstanding (unlimited number of shares authorized, no par value) | | | 592,489 | |
| Net asset value per share | | $ | 144.84 | |
See accompanying notes which are an integral part of these financial statements.
| Copley Fund |
| Statement of Operations |
| For the period ended August 31, 2023 (Unaudited) |
| Investment Income | | | | |
| Dividend income | | $ | 859,119 | |
| Interest income | | | 24,358 | |
| Total investment income | | | 883,477 | |
| Expenses | | | | |
| Advisor | | | 272,077 | |
| Audit and tax | | | 74,830 | |
| Administration | | | 28,825 | |
| Fund accounting | | | 21,417 | |
| Report printing | | | 13,762 | |
| Transfer agent | | | 12,600 | |
| Legal | | | 11,436 | |
| Professional fees | | | 9,898 | |
| Insurance | | | 9,366 | |
| Trustee | | | 6,786 | |
| Custodian | | | 2,905 | |
| Registration | | | 711 | |
| Miscellaneous | | | 8,308 | |
| Total expenses | | | 472,921 | |
| Total operating expenses | | | 472,921 | |
| Net investment income before tax benefit | | | 410,556 | |
| Tax Benefit | | | — | |
| Net Investment Income | | | 410,556 | |
| Net Realized and Change in Unrealized Gain (Loss) on Investments | | | | |
| Realized loss from investment transactions, net deferred tax benefit of $22,779 | | | (85,694 | ) |
| Net change in unrealized appreciation of investments, including deferred income tax benefit of $1,366,207 | | | 5,331,156 | |
| Net realized and change in unrealized gain (loss) on investments | | | 5,245,462 | |
| Net increase in net assets resulting from operations | | $ | 5,656,018 | |
See accompanying notes which are an integral part of these financial statements.
| Copley Fund |
| Statements of Changes in Net Assets |
| | | For the Six | | | For the Year | |
| | | Months Ended | | | Ended February | |
| | | August 31, 2023 | | | 28, 2023 | |
| | | (Unaudited) | | | | |
| Increase (Decrease) in Net Assets due to: | | | | | | | | |
| Operations | | | | | | | | |
| Net investment income, net of income tax (benefit)/expense | | $ | 410,556 | | | $ | 820,911 | |
| Net realized loss on investment transactions, net of income tax expense/(benefit) | | | (85,694 | ) | | | (1,331,709 | ) |
| Change in unrealized appreciation (depreciation) of investments, including deferred income tax expense/(benefit) | | | 5,331,156 | | | | (3,902,530 | ) |
| Net increase (decrease) in net assets resulting from operations | | | 5,656,018 | | | | (4,413,328 | ) |
| | | | | | | | | |
| Capital Transactions | | | | | | | | |
| Proceeds from shares sold | | | 195,618 | | | | 693,169 | |
| Amount paid for shares redeemed | | | (2,320,390 | ) | | | (5,609,007 | ) |
| Net decrease in net assets resulting from capital transactions | | | (2,124,772 | ) | | | (4,915,838 | ) |
| Total Increase (Decrease) in Net Assets | | | 3,531,246 | | | | (9,329,166 | ) |
| | | | | | | | | |
| Net Assets | | | | | | | | |
| Beginning of period | | $ | 82,283,855 | | | $ | 91,613,021 | |
| End of period | | $ | 85,815,101 | | | $ | 82,283,855 | |
| | | | | | | | | |
| Share Transactions | | | | | | | | |
| Shares sold | | | 1,389 | | | | 5,107 | |
| Shares redeemed | | | (16,703 | ) | | | (42,629 | ) |
| Net decrease in shares outstanding | | | (15,314 | ) | | | (37,522 | ) |
See accompanying notes which are an integral part of these financial statements.
| Copley Fund |
| Financial Highlights |
(For a share outstanding during each period)
| | | For the Six | | | | | | | | | | | | | | | | |
| | | Months | | | For the | | | For the | | | For the | | | For the | | | For the | |
| | | Ended | | | Year Ended | | | Year Ended | | | Year Ended | | | Year Ended | | | Year Ended | |
| | | August 31, | | | February | | | February | | | February | | | February | | | February | |
| | | 2023 | | | 28, 2023 | | | 28, 2022 | | | 28, 2021 | | | 29, 2020(a) | | | 28, 2019(a) | |
| | | (Unaudited) | | | | | | | | | | | | | | | | |
| Selected Per Share Data: | | | | | | | | | | | | | | | | | | | | | | | | |
| Net asset value, beginning of period | | $ | 135.38 | | | $ | 141.96 | | | $ | 134.92 | | | $ | 117.91 | | | $ | 110.58 | | | $ | 97.69 | |
| Investment operations: | | | | | | | | | | | | | | | | | | | | | | | | |
| Net investment income(b) | | | 0.69 | | | | 1.35 | | | | 0.55 | | | | 3.16 | | | | 3.26 | | | | 2.59 | |
| Net realized and unrealized gain (loss) on investments | | | 8.77 | | | | (7.93 | ) | | | 6.49 | | | | 13.85 | | | | 4.07 | | | | 10.30 | |
| Total from investment operations | | | 9.46 | | | | (6.58 | ) | | | 7.04 | | | | 17.01 | | | | 7.33 | | | | 12.89 | |
| Net asset value, end of period | | $ | 144.84 | | | $ | 135.38 | | | $ | 141.96 | | | $ | 134.92 | | | $ | 117.91 | | | $ | 110.58 | |
| Total Return(c) | | | 6.99 | % (d) | | | (4.64 | %) | | | 5.22 | % | | | 14.43 | % | | | 6.63 | % | | | 13.19 | % |
| Ratios and Supplemental Data: | | | | | | | | | | | | | | | | | | | | | | | | |
| Net assets, end of period (000 omitted) | | $ | 85,815 | | | $ | 82,284 | | | $ | 91,613 | | | $ | 95,042 | | | $ | 94,121 | | | $ | 96,882 | |
| Ratios before fee waiver: | | | | | | | | | | | | | | | | | | | | | | | | |
| Ratio of total expenses, including net regular and deferred taxes, to average net assets(e) | | | 1.14 | % (f) | | | (0.65 | )% | | | 2.43 | % | | | 3.50 | % | | | 1.81 | % (g) | | | 3.43 | % |
| Ratio of net investment and operating income (loss), including regular and deferred taxes, to average net assets | | | 1.06 | % (f) | | | 2.57 | % | | | (0.98 | )% | | | 5.36 | % | | | 2.02 | % (g) | | | 0.78 | % |
| Ratios after fee waiver: | | | | | | | | | | | | | | | | | | | | | | | | |
| Ratio of total expenses, including net regular and deferred taxes, to average net assets(e) | | | 1.14 | % | | | (0.71 | )% | | | 2.36 | % | | | 3.48 | % | | | 1.81 | % (g) | | | 3.43 | % |
| Ratio of net investment and operating income (loss) to average net assets | | | 1.06 | % (f) | | | 2.63 | % | | | (0.92 | )% | | | 5.38 | % | | | 2.02 | % (g) | | | 0.78 | % |
| Portfolio turnover rate | | | 1.07 | % (d) | | | 156.15 | % | | | 111.25 | % | | | 119.33 | % | | | 24.64 | % | | | — | % |
| (a) | Net asset values, net investment income per share, total returns and ratios of total expenses and net investment and operating income (loss) have been restated on an “as-if” basis. See Note 6 in the Notes to Financial Statements. |
| (b) | Calculation based on the average number of shares outstanding during the period. |
| (c) | Total return is calculated assuming a purchase of shares at net asset value on the first day and a sale at net asset value on the last day of the period. Distributions are assumed, for the purpose of this calculation, to be reinvested at the ex-dividend date net asset value per share on their respective payment dates. |
| (e) | Includes operating expenses from the Operating Division and subsidiary of $31,995 and $17,572, for fiscal years ending 2020 and 2019, respectively. |
| (g) | Includes advisory fees reimbursed to the Fund and included in investment advisory fees, net. |
See accompanying notes which are an integral part of these financial statements.
| Copley Fund |
| Notes to the Financial Statements |
| August 31, 2023 (Unaudited) |
NOTE 1. ORGANIZATION
The Copley Fund (the “Fund”) is organized as a separate, diversified series of the Centaur Mutual Funds Trust (the “Trust”). The Fund is the successor of Copley Fund, Inc. (the “Predecessor Fund”) and assumed the assets and liabilities of the Predecessor Fund (the “Reorganization”) and continued operations on December 1, 2022. The Trust is an open-ended management investment company and is organized as a Delaware statutory trust and is registered under the Investment Company Act of 1940 (the “1940 Act”), as amended.
The Fund’s investment objective is to seek growth of capital.
NOTE 2. SIGNIFICANT ACCOUNTING POLICIES
The following is a summary of significant accounting policies consistently followed by the Fund. The policies are in conformity with accounting principles generally accepted in the United States of America (“GAAP”). The Fund is considered an investment company for financial reporting purposes under GAAP.
Estimates
The preparation of financial statements in conformity with GAAP requires management to make estimates and assumptions that affect the reported amounts of assets and liabilities and disclosure of contingent assets and liabilities at the date of the financial statements and the reported amounts of increases and decreases in net assets from operations during the reporting period. Actual results could differ from those estimates.
Regulatory update – Tailored Shareholder Reports for Mutual Funds and Exchange-Traded Funds (“ETFs”)
Effective January 24, 2023, the Securities and Exchange Commission (the “SEC”) adopted rule and form amendments to require mutual funds and ETFs to transmit concise and visually engaging streamlined annual and semiannual reports to shareholders that highlight key information. Other information, including financial statements, will no longer appear in a streamlined shareholder report but must be available online, delivered free of charge upon request, and filed on a semiannual basis on Form N-CSR. The rule and form amendments have a compliance date of July 24, 2024. At this time, management is evaluating the impact of these amendments on the shareholder reports for the Fund.
Investment Valuation
The Fund’s investments in securities are carried at fair value. Securities listed on an exchange or quoted on a national market system are normally determined at the time regular trading closes on the New York Stock Exchange (“NYSE”), currently 4:00 p.m.
| Copley Fund |
| Notes to the Financial Statements (continued) |
| August 31, 2023 (Unaudited) |
Eastern Time. Securities traded in the Nasdaq over-the-counter market are generally valued at the Nasdaq Official Closing Price. Other securities traded in the over-the-counter market and listed securities for which no sale was reported on that date are valued at the most recent bid price.
Securities and assets for which representative market quotations are not readily available or which cannot be accurately valued using the Fund’s normal pricing procedures are valued at fair value as determined by DCM Advisors, LLC (the “Advisor”), as the Fund’s valuation designee, in accordance with policies adopted by the Board of Trustees (the “Board”). Fair value pricing may be used, for example, in situations where (i) a portfolio security is so thinly traded that there have been no transactions for that security over an extended period of time; (ii) the exchange on which the portfolio security is principally traded closes early; or (iii) trading of the portfolio security is halted during the day and does not resume prior to the Fund’s net asset value calculation. A portfolio security’s “fair value” price may differ from the price next available for that portfolio security using the Trust’s normal pricing procedures.
Fair Value Measurement
GAAP establishes a framework for measuring fair value and expands disclosure about fair value measurements. Various inputs are used in determining the value of the Fund’s investments. These inputs are summarized in the three broad levels listed below:
| ● | Level 1 – Unadjusted quoted prices in active markets for identical investments and/or registered investment companies where the value per share is determined and published and is the basis for current transactions for identical assets or liabilities at the valuation date |
| ● | Level 2 – Other significant observable inputs (including, but not limited to, quoted prices for an identical security in an inactive market, quoted prices for similar securities, interest rates, prepayment speeds, credit risk, etc.) |
| ● | Level 3 – Significant unobservable inputs (including the Fund’s own assumptions in determining fair value of investments based on the best information available) |
The availability of observable inputs can vary from security to security and is affected by a wide variety of factors, including, for example, the type of security, whether the security is new and not yet established in the marketplace, the liquidity of markets, and other characteristics particular to the security. To the extent that valuation is based on models or inputs that are less observable or unobservable in the market, the determination of fair value requires more judgment. Accordingly, the degree of judgment exercised in determining fair value is greatest for instruments categorized Level 3.
| Copley Fund |
| Notes to the Financial Statements (continued) |
| August 31, 2023 (Unaudited) |
An investment asset’s or liability’s level within the fair value hierarchy is based on the lowest level input, individually or in the aggregate, that is significant to fair value measurement.
The valuation techniques used by the Fund to measure fair value during the six months ended August 31, 2023 maximized the use of observable inputs and minimized the use of unobservable inputs.
The inputs or methodology used for valuing securities are not necessarily an indication of the risk associated with investing in those securities.
The following is a summary of the inputs used to value the Fund’s investments as of August 31, 2023:
| | | | | | Valuation Inputs | | | | | | | |
| Assets | | Level 1 | | | Level 2 | | | Level 3 | | | Total | |
| Common Stocks (a) | | $ | 85,999,035 | | | $ | — | | | $ | — | | | $ | 85,999,035 | |
| Money Market Funds | | | 1,451,882 | | | | — | | | | — | | | | 1,451,882 | |
| Total | | $ | 87,450,917 | | | $ | — | | | $ | — | | | $ | 87,450,917 | |
| (a) | Refer to Schedule of Investments for sector classifications. |
The Fund did not hold any investments at the end of the reporting period for which significant unobservable inputs (Level 3) were used in determining fair value; therefore, no reconciliation of Level 3 securities is included for this reporting period.
Investment Transactions and Investment Income
Investment transactions are accounted for as of the date purchased or sold (trade date) for financial reporting purposes. Dividend income is recorded on the ex-dividend date. Interest income is recorded on the accrual basis. Gains and losses are determined on the identified cost basis, which is the same basis used for federal income tax purposes.
Purchases and Sales of Investment Securities
For the six months ended August 31, 2023, purchases and sales of investment securities, other than short-term investments, were $896,239 and $2,971,341, respectively.
There were no purchases or sales of long-term U.S. government obligations during the six months ended August 31, 2023.
Cash and Cash Equivalents
The Fund considers all highly liquid investments with a maturity of three months or less when acquired and money market mutual funds to be cash equivalents. The carrying amount of cash and cash equivalents approximates its fair value due to its short-term nature.
| Copley Fund |
| Notes to the Financial Statements (continued) |
| August 31, 2023 (Unaudited) |
Expenses
Expenses incurred by the Trust that do not relate to the Fund are allocated to the individual funds of the Trust based on each fund’s relative net assets or another appropriate basis (as determined by the Board).
Dividends and Distributions
Net investment income and net realized gains are not distributed, but rather are accumulated with the Fund and used to pay expenses, to effect redemptions, to make additional investments or held in cash as a reserve.
Federal Income Taxes
The Fund files tax returns as a regular corporation and accordingly the financial statements include provisions for current and deferred income taxes.
The Fund recognizes the tax benefits of uncertain tax positions only when the position is “more likely than not” to be sustained assuming examination by tax authorities. Management reviewed the tax positions and concluded that no liability for unrecognized tax benefits should be recorded related to uncertain tax positions taken. The Fund identifies its major tax jurisdictions as U.S. Federal and the State of Delaware. The Fund recognizes interest and penalties, if any, related to income taxes as income tax expense on the Statement of Operations.
NOTE 3. FEES AND OTHER TRANSACTIONS WITH AFFILIATES AND OTHER SERVICE PROVIDERS
Advisor
DCM Advisors, LLC (the “Advisor”) is the investment advisor to the Fund. The Advisor serves in the capacity of investment advisor to the Fund pursuant to an investment advisory agreement with the Trust on behalf of the Fund. The Advisor receives monthly compensation based on the Fund’s average daily net assets at an annual rate of 0.65% of the first $500 million of net assets, and 0.62% of any net assets exceeding $500 million.
For the six months ended August 31, 2023, the fee for investment advisory services totaled $272,077.
Administrator
Ultimus Fund Solutions, LLC (the “Administrator”) provides administration, fund accounting, and transfer agency services to the Fund. The Fund pays the Administrator fees in accordance with the Master Services Agreement for such services. In addition, the
| Copley Fund |
| Notes to the Financial Statements (continued) |
| August 31, 2023 (Unaudited) |
Fund pays out-of-pocket expenses including but not limited to postage, supplies and cots of pricing its portfolio securities.
Northern Lights Compliance Services, LLC (“NLCS”), an affiliate of the Administrator, provides a Chief Compliance Officer to the Trust, as well as related compliance services pursuant to a consulting agreement between NLCS and the Trust.
Distributor
Ultimus Fund Distributors, LLC (the “Distributor”) serves as the Trust’s Distributor. The Distributor acts as an agent for the Trust and the distributor of its shares. The Distributor is compensated by the Advisor for its services provided to the Trust. The Distributor operates as a wholly-owned subsidiary of the Administrator.
Certain officers of the Trust are employees of the Administrator and the Distributor.
NOTE 4. FEDERAL TAX INFORMATION
At August 31, 2023, the net unrealized appreciation (depreciation) and tax cost of investments for tax purposes was as follows:
| Aggregate gross unrealized appreciation for all investments for which there was an excess of value over cost, net of $2,725,861 tax effect | | $ | 12,980,293 | |
| Aggregate gross unrealized depreciation for all investments for which there was an excess of cost over value, net of $617,438 tax effect | | | (2,940,183 | ) |
| Net unrealized appreciation on investments | | $ | 10,040,110 | |
| Tax cost of investments | | $ | 77,410,807 | |
The Federal income tax provision (benefit) is summarized as follows:
| | | 2023 | |
| Current: | | | | |
| Federal(a) | | $ | (22,779 | ) |
| Deferred*: | | | | |
| Federal | | | 1,343,428 | |
| * | Net deferred income tax benefit relates to net unrealized depreciation of investments, realized losses and net investment loss including the dividends received deduction (DRD). |
| Copley Fund |
| Notes to the Financial Statements (continued) |
| August 31, 2023 (Unaudited) |
Deferred income taxes reflect the net tax effects of temporary differences between the carrying amounts of assets and liabilities for financial reporting purposes and the amounts used for income tax purposes. At August 31, 2023, the net deferred tax liabilities are summarized as follows:
| Net deferred tax liability: | | | | |
| Unrealized gain on investments | | $ | 2,108,423 | |
| Realized losses on investments | | | (22,779 | ) |
| Net deferred tax liability | | $ | 2,085,644 | |
NOTE 5. COMMITMENT AND CONTINGENCIES
Since the Fund accumulates its net investment income rather than distributing it, the Fund may be subject to the imposition of the federal accumulated earnings tax. The accumulated earnings tax is imposed on a corporation’s accumulated taxable income at a rate of 20%.
Accumulated taxable income is defined as adjusted taxable income minus the sum of the dividends paid deduction and the accumulated earnings credit. The dividends paid deduction and accumulated earnings credit are available in calculating excess earnings subject to this tax.
NOTE 6. NAV RESTATEMENT
The Fund has restated certain components of its 2020 and 2019 financial highlights related to the Predecessor Fund on an “as-if” basis (reflecting the effect on net asset value and per share net asset value of the adjustments to the fiscal year 2021 opening net asset balance, as if they had been recorded in the period investment advisory fees were received) resulting from the death of Irving Levine (100% owner of CFSC) in 2018 and the resulting transfer of ownership of CFSC from Mr. Levine to his Estate. This effective transfer or assignment of the advisory agreement between the Predecessor Fund and CFSC was not submitted to, or otherwise approved by, the Predecessor Fund’s shareholders. As a result of extensive discussions with the SEC, CFSC was ordered to refund to the Predecessor Fund all investment advisory fees it received from the Predecessor Fund since Mr. Levine’s death (a total of $966,896, of which $200,000 was remitted during the year ended February 29, 2020 and the balance was remitted during the year ended February 28, 2021) and did not receive any investment advisory fees until the advisory agreement was approved by the Predecessor Fund’s shareholders, on October 13, 2020. The reversal of the investment advisory fees on a tax effected basis from the previous periods amounted to $713,254, which was reflected as an opening balance sheet adjustment on the statement of changes in net assets for the year ended February 28, 2021.
| Copley Fund |
| Notes to the Financial Statements (continued) |
| August 31, 2023 (Unaudited) |
NOTE 7. RISKS
The Fund is exposed to credit risk if counterparties fail to perform pursuant to the terms of their obligations. In addition to its investments, the Fund is subject to credit risk to the extent a custodian or broker with whom it conducts business is unable to fulfill contractual obligations.
Equity risk is the risk that the market values of equities, such as common stocks or equity related investments, may decline due to general market conditions, such a political or macroeconomic factors. Additionally, equities may decline in value due to specific factors affecting a related industry or industries. Equity securities and equity related investments generally have greater market price volatility than fixed income securities.
NOTE 8. SECTOR RISK
If the Fund has significant investments in the securities of issuers within a particular sector, any development affecting that sector will have a greater impact on the value of the net assets of the Fund than would be the case if the Fund did not have significant investments in that sector. In addition, this may increase the risk of loss in the Fund and increase the volatility of the Fund’s NAV per share. For instance, economic or market factors, regulatory changes or other developments may negatively impact all companies in a particular sector, and therefore the value of the Fund’s portfolio will be adversely affected. As of August 31, 2023, the Fund had 29.69% and 27.44% of the value of its net assets invested in stocks within the Financials and Communications sectors respectively.
NOTE 9. TRUSTEE COMPENSATION
As of August 31, 2023, there were two Trustees, each of whom are not “interested persons” (as defined in the 1940 Act) of the Trust (the “Independent Trustees”). Each Independent Trustee receives a fee of $20,000 each year plus $500 per series of the Trust per meeting. The officers of the Trust will not receive compensation from the Trust for performing the duties of their offices. All Trustees and officers are reimbursed for any out-of-pocket expenses incurred in connection with attendance at meetings.
NOTE 9. SUBSEQUENT EVENTS
Management of the Fund has evaluated the need for disclosures and/or adjustments resulting from subsequent events through the date at which these financial statements were issued. Based upon this evaluation, management has determined there were no items requiring adjustment of the financial statements or additional disclosure.
| Summary of Fund Expenses (Unaudited) |
As a shareholder of the Fund, you incur two types of costs: (1) transaction costs and (2) ongoing costs, including management fees and other Fund expenses. These examples are intended to help you understand your ongoing costs (in dollars) of investing in the Fund and to compare these costs with the ongoing costs of investing in other funds. The example is based on an investment of $1,000 invested at the beginning of the period and held for the entire period from March 1, 2023 through August 31, 2023.
Actual Expenses
The first line of the table below provides information about actual account values and actual expenses. You may use the information in this line, together with the amount you invested, to estimate the expenses that you paid over the period. Simply divide your account value by $1,000 (for example, an $8,600 account value divided by $1,000 = 8.6), then multiply the result by the number in the first line under the heading “Expenses Paid During Period” to estimate the expenses you paid on your account during this period.
Hypothetical Example for Comparison Purposes
The second line of the table below provides information about hypothetical account values and hypothetical expenses based on the Fund’s actual expense ratio and an assumed rate of return of 5% per year before expenses, which is not the Fund’s actual return. The hypothetical account values and expenses may not be used to estimate the actual ending account balance or expenses you paid for the period. You may use this information to compare the ongoing costs of investing in the Fund and other funds. To do so, compare this 5% hypothetical example with the 5% hypothetical examples that appear in the shareholder reports of other funds.
Expenses shown in the table are meant to highlight your ongoing costs only and do not reflect any transactional costs. Therefore, the second line of the table below is useful in comparing ongoing costs only and will not help you determine the relative total costs of owning different funds. In addition, if transaction costs were included, your costs would have been higher.
| | | Beginning | | | Ending | | | | | | |
| | | Account | | | Account | | | Expenses | | | |
| | | Value | | | Value | | | Paid | | | Annualized |
| | | March 1, | | | August 31, | | | During | | | Expense |
| | | 2023 | | | 2023 | | | Period(a) | | | Ratio(b) |
| Copley Fund | | | | | | | | | | | | | | |
| | Actual | | $ | 1,000.00 | | | $ | 1,069.90 | | | $ | 30.89 | | | 5.92% |
| | Hypothetical(c) | | $ | 1,000.00 | | | $ | 995.36 | | | $ | 29.78 | | | 5.92% |
| (a) | Expenses are equal to the Fund’s annualized expense ratios, multiplied by the average account value over the period, multiplied by 184/365 (to reflect the one-half year period). |
| (b) | Expenses include the reserve the Fund is required to calculate and deduct, reflecting the federal income tax which would have to be paid if the Fund’s portfolio were liquidated and a capital gains tax, at the regular corporate tax rate, would be payable on all gains. |
| (c) | Hypothetical assumes 5% annual return before expenses. |
| Additional Information (Unaudited) |
PROXY VOTING POLICIES AND VOTING RECORD
Both (i) a description of the Trust’s Proxy Voting and Disclosure Policy and the Advisor’s Proxy Voting and Disclosure Policy are included as Appendix B to the Fund’s Statement of Additional Information and (ii) information regarding how the Trust voted proxies relating to the Fund’s portfolio securities during the most recent 12-month period ended June 30th are available, without charge, upon request, by calling the Trust at 1-888-484-5766, or on the on the SEC’s website at www. sec.gov.
QUARTERLY PORTFOLIO HOLDINGS
The Trust files each Fund’s complete schedule of portfolio holdings with the SEC for the first and third quarters of each fiscal year as an exhibit to its reports on Form N-PORT, within sixty days after the end of the period. The Fund’s portfolio holdings are available on the SEC’s website at www.sec.gov and on the Fund’s website at https://www.dcmadvisors.com.
Rev: September 2020
| FACTS | WHAT DOES THE CENTAUR MUTUAL FUNDS TRUST DO WITH YOUR PERSONAL INFORMATION? |
| |
| Why? | Financial companies choose how they share your personal information. Federal law gives consumers the right to limit some but not all sharing. Federal law also requires us to tell you how we collect, share, and protect your personal information. Please read this notice carefully to understand what we do. |
| |
| What? | The types of personal information we collect and share depend on the product or service you have with us. This information can include: ■ Social Security number ■ Account balances and account transactions ■ Checking account information and wire transfer instructions When you are no longer our customer, we continue to share your information as described in this notice. |
| |
| How? | All financial companies need to share customers’ personal information to run their everyday business. In the section below, we list the reasons financial companies can share their customers’ personal information; the reasons the Centaur Mutual Funds Trust chooses to share; and whether you can limit this sharing. |
| |
| Reasons we can share your personal information | Does the
Centaur
Mutual Funds
Trust share? | Can you limit
this Sharing? |
| For our everyday business purposes —such as to process your transactions, maintain your account(s), respond to court orders and legal investigations, or report to credit bureaus | Yes | No |
| For our marketing purposes —to offer our products and services to you | No | We do not share. |
| For joint marketing with other financial companies | No | We do not share. |
| For our affiliates’ everyday business purposes — information about your transactions and experiences | No | We do not share. |
| For our affiliates’ everyday business purposes — information about your creditworthiness | No | We do not share. |
| For nonaffiliates to market to you | No | We do not share. |
| | | | |
| Questions? | Call 1-888-484-5766 |
| Who we are |
| Who is providing this notice? | The Centaur Mutual Funds Trust
Copley Fund |
| What we do |
| How does the Centaur Mutual Funds Trust protect my personal information? | To protect your personal information from unauthorized access and use, we use security measures that comply with federal law. These measures include computer safeguards and secured files and buildings. We require any companies that help provide our services to you to protect the confidentiality of the personal information they receive. |
| How does the Centaur Mutual Funds Trust collect my personal information? | We collect your personal information, for example, when you ■ open an account or give us your account information ■ make deposits or withdrawals from our account ■ pay us by check or make a wire transfer We also collect your personal information from other companies. |
| Why can’t I limit all sharing? | Federal law gives you the right to limit only ■ sharing for affiliates’ everyday business purposes – information about your creditworthiness ■ affiliates from using your information to market to you ■ sharing for nonaffiliates to market to you State laws and individual companies may give you additional rights to limit sharing. |
| Definitions |
| Affiliates | Companies related by common ownership or control. They can be financial and nonfinancial companies. ■ DCM Advisors, LLC, an affiliate of Dinosaur Group Holdings, LLC, is the investment advisor to the Copley Fund and is an affiliate of the Centaur Mutual Funds Trust. |
| Nonaffiliates | Companies not related by common ownership or control. They can be financial and nonfinancial companies. ■ The Centaur Mutual Funds Trust does not share your personal information with nonaffiliates so they can market to you. |
| Joint marketing | A formal agreement between nonaffiliated financial companies that together market financial products or services to you. ■ The Centaur Mutual Funds Trust does not jointly market. |
| |
| |
| |
| |
| |
| |
| |
| |
| |
| |
| |
| |
| |
| |
| |
| |
| |
| |
| |
| |
| |
| |
| |
| |
| |
| The Centaur Mutual Funds Trust is distributed by Ultimus Fund Distributors, LLC |
| |
| |
| |
| |
| |
| |
| |
| |
| |
| |
| |
| |
| |
| |
| |
| |
| |
| |
| |
| |
| |
| |
| |
| |
| Copley-SAR-23 |
Item 2. Code of Ethics.
NOT APPLICABLE – disclosed with annual report
Item 3. Audit Committee Financial Expert.
NOT APPLICABLE – disclosed with annual report
Item 4. Principle Accountant Fees and Services.
NOT APPLICABLE – disclosed with annual report
Item 5. Audit Committee of Listed Companies.
NOT APPLICABLE – applies to listed companies only
Item 6. Schedule of Investments.
Schedule filed with Item 1.
Item 7. Disclosure of Proxy Voting Policies and Procedures for Closed-End Management Investment Companies.
NOT APPLICABLE – applies to closed-end funds only
Item 8. Portfolio Managers of Closed-End Investment Companies.
NOT APPLICABLE – applies to closed-end funds only
Item 9. Purchases of Equity Securities by Closed-End Management Investment Company and Affiliated Purchasers.
NOT APPLICABLE – applies to closed-end funds only
Item 10. Submission of Matters to a Vote of Security Holders.
NOT APPLICABLE
Item 11. Controls and Procedures.
(a) The registrant’s Principal Executive Officer and Principal Financial Officer have concluded that the registrant's disclosure controls and procedures (as defined in Rule 30a-3(c) under the Act) are effective in design and operation and are sufficient to form the basis of the certifications required by Rule 30a-2 under the Act, based on their evaluation of these disclosure controls and procedures within 90 days of the filing of this report on Form N-CSR.
(b) There were no changes in the registrant’s internal control over financial reporting (as defined in Rule 30a-3(d) under the Act (17 CFR 270.30a-3(d)) that occurred during the period covered by this report that have materially affected or are reasonably likely to materially affect, the registrant’s internal control over financial reporting.
Item 12. Disclosure of Securities Lending Activities for Closed-End Investment Companies.
NOT APPLICABLE
Item 13. Exhibits.
(a)(1) NOT APPLICABLE – filed with annual report
(a)(2) Certifications pursuant to Rule 30a-2(a) are attached hereto.
(a)(3) Not applicable.
(b) Certifications pursuant to Rule 30a-2(b) are furnished herewith.
SIGNATURES
Pursuant to the requirements of the Securities Exchange Act of 1934 and the Investment Company Act of 1940, the registrant has duly caused this report to be signed on its behalf by the undersigned, thereunto duly authorized.
(Registrant) Centaur Mutual Funds Trust
| By (Signature and Title)* | /s/ Marc Rappaport |
| | Marc Rappaport, Principal Executive Officer |
| Date | November 03, 2023 | |
| | | |
Pursuant to the requirements of the Securities Exchange Act of 1934 and the Investment Company Act of 1940, this report has been signed below by the following persons on behalf of the registrant and in the capacities and on the dates indicated.
| By (Signature and Title)* | /s/ Marc Rappaport |
| | Marc Rappaport, Principal Executive Officer |
| Date | November 03, 2023 | |
| | | |
| By (Signature and Title)* | /s/ Zachary P. Richmond |
| | Zachary P. Richmond, Treasurer |