UNITED STATES
SECURITIES AND EXCHANGE COMMISSION
Washington, D.C. 20549
FORM N-CSR
CERTIFIED SHAREHOLDER REPORT OF REGISTERED
MANAGEMENT INVESTMENT COMPANIES
Investment Company Act file number 811-21606
Centaur Mutual Funds Trust
(Exact name of registrant as specified in charter)
470 Park Avenue South, 9th Floor
New York, NY 10016
(Address of principal executive offices) (Zip code)
Ultimus Fund Solutions, LLC
Attn: Zachary P. Richmond
225 Pictoria Drive, Suite 450
Cincinnati, OH 45246
(Name and address of agent for service)
Registrant’s telephone number, including area code: 1-513-587-3400
Date of fiscal year end: October 31
Date of reporting period: April 30, 2021
Form N-CSR is to be used by management investment companies to file reports with the Commission not later than 10 days after the transmission to stockholders of any report that is required to be transmitted to stockholders under Rule 30e-1 under the Investment Company Act of 1940 (17 CFR 270.30e-1). The Commission may use the information provided on Form N-CSR in its regulatory, disclosure review, inspection and policymaking roles.
A registrant is required to disclose the information specified by Form N-CSR, and the Commission will make this information public. A registrant is not required to respond to the collection of information contained in Form N-CSR unless the Form displays a currently valid Office of Management and Budget ("OMB") control number. Please direct comments concerning the accuracy of the information collection burden estimate and any suggestions for reducing the burden to Secretary, Securities and Exchange Commission, 450 Fifth Street, NW, Washington, DC 20549-0609. The OMB has reviewed this collection of information under the clearance requirements of 44 U.S.C. § 3507.
Item 1. Reports to Stockholders.
| |
| |
| |
| |
| |
| |
| |
 |
| |
| |
| |
| |
| |
| |
| DCM/INNOVA HIGH EQUITY INCOME INNOVATION FUND |
| |
| |
| |
| |
| |
| |
| LEBENTHAL ULTRA SHORT TAX-FREE INCOME FUND |
| |
| |
| |
| |
| |
| |
| |
| |
| SEMI-ANNUAL REPORT |
| April 30, 2021 |
| Centaur Mutual Funds Trust |
| Message from the Chief Executive Officer |
| April 30, 2021 (Unaudited) |
We have to do more.
That is the message I give to the talented team of portfolio managers and analysts at DCM Advisors.
We have to do more for investors in terms of income generation. We have to do more in terms of tax-savvy facets within our portfolios. And to their credit, the team has responded and risen to the call to action.
Just yesterday I glanced at the 7-day yield of our Lebenthal Ultra Short Tax-Free Income Fund and noticed it was well in excess of my expectations. (As many of you may know, I keep my family’s cash in the Fund.)
Similarly, at a Board of Trustees meeting earlier this year, we looked at a list of Morningstar’s funds in the Large Cap Blend universe ranked by Trailing Twelve Month (TTM) Yield. S&P 500 funds and ETFs fall into this category and our solution in this space (the DCM/INNOVA High Equity Income Innovation Fund) specifically endeavors to have a low tracking error with the S&P 500 (“hugs” the S&P 500, if you will.) The average fund in this category produced a TTM yield of less than 1.5% which is no surprise—the S&P 500 as of the end of this Semi-Annual reporting period (April 30, 2021) produced a TTM yield of 1.4%. Once again, our solution in this space generates a TTM yield well in excess of the funds on that list. And when I say well in excess, I am referring to an amount that is greater than 4 times in size, 6.70%.
So, our investment team has risen to the occasion of doing more for shareholders in terms of producing income. And they are not resting on their laurels. The spirit of this team is one of constantly searching for ways to manage risk and deliver more for shareholders. Each morning I watch Gregory Serbe, the Portfolio manager of the Lebenthal Ultra Short Tax-Free Income Fund, scour the current offerings for solid, investment-grade municipal securities that offer excess yield versus recent market transactions. He is patient but more so, he is persistent and relentless in his quest for undervalued jewels for the Lebenthal Ultra Short Tax-Free Income Fund. No easy feat in an environment many have described as anemic as far as yield: somehow roughly 50 years of experience in municipals has been a friend to patience and sharpened his abilities to know where to “hunt”, what to avoid and what to scoop up for our Lebenthal Ultra Short Tax-Free Income Fund shareholders. Hence, this is not a case of “the early bird gets the worm” but more “the eagle patiently stalks and knows precisely when to strike.”
And the investment team working with Dr. Vijay Chopra, the Portfolio manager of the DCM/INNOVA High Equity Income Innovation Fund, did not rest on their laurels having produced a TTM Yield of 6.70%2 for shareholders of the DCM/INNOVA High Equity Income Innovation Fund. In the spirit of “doing more for shareholders”, they
| Semi-Annual Report | April 30, 2021 | 1 |
| Centaur Mutual Funds Trust |
| Message from the Chief Executive Officer |
| April 30, 2021 (Unaudited) |
produced something nobody saw but shareholders (like myself) appreciated greatly: they produced zero capital gains distributions in December at calendar year-end. Zero. This despite having produced very attractive double-digit total returns for the calendar year 2020 (+12.78%). Shareholders of equity income funds and S&P 500 ETFs generally find capital gains distributions a detracting element, especially when a shareholder is “inheriting” existing capital gains. I am in this camp and I worked with the team to develop a program that actively harvests losses throughout the year to offset gains. I felt we could do more for shareholders in the area of tax efficiency. And the team has done just that.
And we’re far from done seeking ways to do more for our shareholders, of which I am one.
Our portfolio managers took the weekend, away from the markets, to step back and write about what transpired during the November 1 to April 30 reporting period. You will read about many factors affecting the markets—inflation, tax proposals, vaccines, growth rates and interest rates—and you will hopefully get a sense of what I have come to know and love about them: steady, experienced hands, clear thinking, and consistent execution of a successful process.
Thank you for your trust and the opportunity to apply our talents to produce attractive investment returns for you. We’d like to do more.

Marc Rappaport
Chief Executive Officer
DCM Advisors
| 1 | Source: Charles Schwab Asset Management Money Fund Yields https://www.schwabassetmanagement.com/products/money-fund-yields |
| DCM/INNOVA High Equity Income Innovation Fund |
| Letter from the Portfolio Manager |
| April 30, 2021 (Unaudited) |
The DCM/INNOVA High Equity Income Innovation Fund’s (the “Fund’s”) first fiscal half year which ended on April 30, 2021 reaped the benefits of the resolution of two main sources of uncertainty that were hanging over the economy and financial markets in 2020. The first was the outcome of the US Presidential elections and the second was the outlook for the containment of the COVID-19 pandemic.
The US Presidential elections were too close to call heading into the polls on November 3rd, 2020. The market also feared that election results might not be known for weeks after the election and this would be an overhang on the economy and financial markets. One prevailing narrative was that if President Trump lost the election, the stock market would tank. A Democratic “sweep” would lead to less investor-friendly policies such as increased regulation and corporate taxation. The opposing narrative was that a Vice President Joe Biden victory would lead to additional fiscal stimulus through more generous unemployment benefits and perhaps a large infrastructure package. That would lead to a stronger economy in the short run.
The election uncertainty was resolved within a few days of the election with Joe Biden becoming the next President. More importantly, the outcome did not result in the strong Democratic dominance in the House and Senate with which the market had been concerned. (Democrats lost seats in the House and did not improve their position in the Senate to the extent legislation could “sail through”.) With the clouds of political uncertainty lifted, the focus shifted to earnings and vaccine advancements helping to “reopen” an economy in which analysts were revising growth expectations higher. Both earnings and vaccine news were strong, and the market rallied over the fiscal half year with the Fund returning 26.99% for the six months ended April 30, 2021.
The release of strongly positive test results for the Pfizer-BioNTech vaccine (showing an over 90% efficacy) on November 9, 2020 lit a fire under equity returns. There was a huge rotation in equities from high-valuation, mega-cap technology stocks into beaten-down energy, financials, and travel-related stocks and the Fund kept up with many of these sector and factor shifts. The FDA approved the Pfizer-BioNTech vaccine on December 11 and the Moderna vaccine on December 18, 2020. Earnings estimates for the fourth quarter of 2020 and the first quarter of 2021 were revised upwards strongly. Sales were recovering and forward guidance for the fourth quarter and 2021 was revised upward by many companies. The Fund kept up with the S&P index in its second fiscal quarter ending on April 30, 2021 with total returns of 12.92% compared with the S&P index returns of 12.98%.
After Growth outperformed Value for over 13 years (since 2007), Value came back into favor starting in late August 2020. Value outperformed Growth over the Fund’s fiscal half year, with the Russell 1000 Value index returning 36.3% compared with the 24.3%
| Semi-Annual Report | April 30, 2021 | 3 |
| DCM/INNOVA High Equity Income Innovation Fund |
| Letter from the Portfolio Manager |
| April 30, 2021 (Unaudited) |
returns of the Russell Growth index. This 12% outperformance of Value over Growth followed an underperformance of 36.8% over the Fund’s previous fiscal year ending on October 31, 2020.
The best performing sectors over the fiscal half year were Energy, Financials, Industrials and Materials which were up 75.9%, 53.4%, 35.4% and 32.6%. Defensive sectors such as Utilities, Consumer Staples and Health Care lagged the market with returns of 8.8%, 13.1% and 20.3%. Many of the mega-cap Technology, Media and Telecom stocks that had powered the market since the end of 2019 took a breather over the Fund’s first fiscal half year.
While equities rallied strongly, bonds suffered as 10-year Government bond yields rose from 88 basis points to 163 basis points over the course of the Fund’s fiscal first half year. Inflation expectations also picked up with the 10-year breakeven inflation rates going from 1.7% to 2.4%. The Fed continued with its relaxed stance towards inflation under the belief that the pickup in inflation is transitory.
Anticipating the growth in the economy as the election and vaccine-related uncertainty diminished, we positioned the portfolio away from expensive growth stocks towards beaten down value stocks in cyclical sectors. In mid-October, we trimmed our position in Alphabet, Electronic Arts and Amazon and added Caterpillar, Discover Financial Services and General Motors. In mid-November, we added Financials such as Regions Financial Corp, Truist Financial Corp, and Jefferies Financial Group. We also added Disney which we expected to do well as the economy reopened and pent-up demand for travel resumed. In late February 2021 we trimmed Amazon and Facebook and added Honeywell, HCA Healthcare and Methode Electronics.
The Fund’s overweights in Industrials, Materials, Energy and Financials contributed positively to performance. However, the Fund’s stock selection within Health Care, Information Technology and Energy detracted from performance.
We continue to be encouraged by the results of our innovative dividend income process for the quarter. The Fund pays dividends on a monthly basis and the payout over the fiscal first half year corresponds to an annual net dividend yield of 5.5%. The Fund has a trailing 12-month net yield of 6.7% as of the end of April 2021.
| DCM/INNOVA High Equity Income Innovation Fund |
| Letter from the Portfolio Manager |
| April 30, 2021 (Unaudited) |
Current positioning
The Fund held 86 equity securities diversified across sectors as of April 30, 2021, and the top five equity holdings as of the end of this period were Alphabet, Apple, Microsoft, Dow and Qorvo. The Fund has overweight positions relative to the S&P 500 index in Industrials, Materials, Financials and Energy, and underweight positions in Health Care, Consumer Discretionary, Information Technology and Consumer Staples sectors.
The forecast PE ratio of the Fund of 15.4x is well below that of the S&P index at 21.4x. The Price-to-Book ratio of companies in the Fund is 2.5x; much lower than the 4.5x value for the S&P index reflecting its weighting in value-oriented stocks.
We believe that the Fund is appropriately positioned to perform in-line with the S&P 500, while the income it generates (yield) is expected to exceed the benchmark. We are very positive on the outlook for dividend income generation heading into the fiscal second quarter.

Vijay Chopra, PhD, CFA
Senior Portfolio Manager
| Semi-Annual Report | April 30, 2021 | 5 |
| Lebenthal Ultra Short Tax-Free Income Fund |
| Letter from the Portfolio Manager |
| April 30, 2021 (Unaudited) |
In our last report, we described the impact that COVID-19 had not only on the municipal bond market, but on all of us. Now, three months later, while we cannot say that everything has returned to a pre-pandemic state, with the growing availability of various vaccines, there are many positive signs of hope going forward. With that as a backdrop, what were the other themes that dominated these six months? While the tumultuous political environment captured headlines on both sides of the political spectrum, the fiscal impact of COVID-19 had influence on the attitudes, concerns, and expectations of the direction of the economy.
| 1.) | The Background. In March of 2020, with the explosive growth of the virus, the Fed dropped short term taxable rates to a range from 0.00% to 0.25% in an effort to stimulate the economy. Businesses shut, the expression “work from home” became the generally understood initials WFH, and the main goal of most people was to stay healthy and safe. As the economy slowed, municipal budgets were stressed by declining revenues and increasing expenses. The Fed even had an optional emergency loan program for state and local governments. However, the fiscal stimulus provided by the Federal Government started to ease the risks of cash deficits experienced by state and local governments. As we close this reporting period, with the general impression that things are slowly starting to mend, inflation and future tax rates have begun to enter the dialogue. |
| 2.) | Inflation and Tax Rates. The US Government has borrowed trillions of dollars to stimulate the economy, help municipalities, provide support for beleaguered unemployed workers, and generate job creation. Even prior to the pandemic, the Federal Government was running a substantial deficit. The flip side to the positives provided by the stimulus expenditures is the fear of inflation and what it could do on a long-term basis to the economy. While the memory of the Weimar Republic is a distant event, the inflation of the late 1970’s and early 1980’s, and what it took to combat it, is a clear memory. Given that the tax rates had been lowered, the market is viewing a possible tax rate increase as a potential solution to offset the large borrowings. These diverse elements helped the municipal bond market go from stressed to favored. Using month end numbers from the start of November to the end of April, the following chart shows the change in investment attitudes for the tax-free market. Ten-year maturity municipal rates went from higher than the comparable ten-year Treasury Notes to substantially lower yields. The Treasury rates come from the morning postings on Bloomberg Analytics and the municipal rates for premier rate municipal issuers are calculated by MMD (Municipal Market Data), in our opinion, the municipal bond industry standard analytical service. |
| Lebenthal Ultra Short Tax-Free Income Fund |
| Letter from the Portfolio Manager |
| April 30, 2021 (Unaudited) |
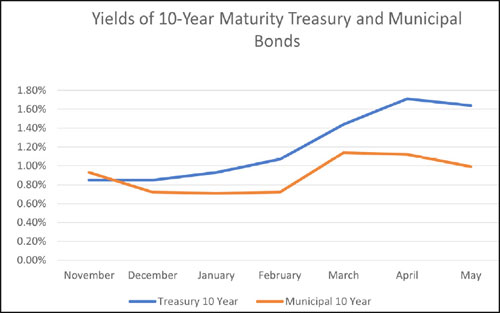
Source: Bloomberg
When it became clear that there were not going to be widespread municipalities facing potential defaults, and that the Treasury was going to be an active issuer of debt securities, investors began to reinvest in municipal bonds. Not only was the credit fear eased, but the probability of tax rate increases surfaced. There are many proposals in Congress, so the final outcome is not set yet. However, if income and capital gains tax rates are increased, as is being debated, the fundamental value of a tax-exempt bond increases dramatically. Thus, the widening gap in the above chart shows investors favoring the tax-free alternative in their investment options.
| 3.) | Short Maturity Tax-Free Securities. The fund invests in short maturity securities, to keep liquidity for our shareholders. Part of the portfolio holds variable rate demand notes. The balance is invested in short term, fixed rate, fixed maturity bonds. As was mentioned above, the Fed has kept short rates in a range of 0% to .25%. Short maturity tax exempt rates were in a similar pattern. The index for variable rate municipal securities is a weekly publication from SIFMA (the Securities Industry and Financial Markets Association). During the Fund’s semiannual reporting period ended, it fluctuated in a range from .11% down to .06%. As a result, the Fund has used more fixed rate, fixed maturity investment grade bonds to be able to capture higher rates while still having a good quality portfolio. They have tended to be in the .30% to .50% range, providing investors with attractive relative yields. |
| Semi-Annual Report | April 30, 2021 | 7 |
| Lebenthal Ultra Short Tax-Free Income Fund |
| Letter from the Portfolio Manager |
| April 30, 2021 (Unaudited) |
| 4.) | Fund Activity. We have continued to invest conservatively. To try to spread any potential risk, the portfolio is diversified across the various municipal bond general obligation bond and specific revenue bond industries. This is the fundamental infrastructure that helps us in our daily activities. |
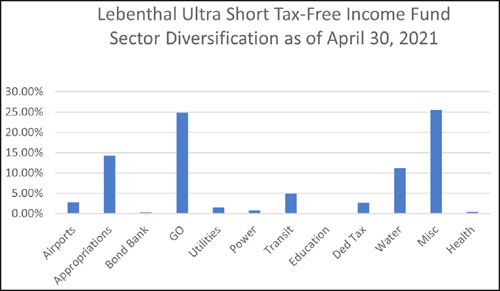
Source: Bloomberg
| 5.) | Our Outlook. We have seen the market cope with stagflation, inflation, New York City’s credit crisis, oil shocks, war, terrorism, and now the pandemic. Through it all, it has maintained a fundamental value that municipal bondholders must be paid. We see improving conditions and yet remain ever watchful and conservative. |

Gregory Serbe
Senior Portfolio Manager
Past performance is not predictive of future performance. Investment results and principal value will fluctuate so that shares, when redeemed, may be worth more or less than their original cost. Current performance may be higher or lower than the performance data quoted. Performance data current to the most recent month end are available by calling 1-888-484-5766.
| Lebenthal Ultra Short Tax-Free Income Fund |
| Letter from the Portfolio Manager |
| April 30, 2021 (Unaudited) |
An investor should consider the investment objectives, risks, charges and expenses of the Funds carefully before investing. The Funds’ prospectus contains this and other important information. To obtain a copy of the Funds’ prospectus please visit the Funds’ website at http://www.dcmmutualfunds.com or call 1-888-484-5766 and a copy will be sent to you free of charge. Please read the prospectus carefully before you invest. The Funds are distributed by Ultimus Fund Distributors, LLC.
The Letter to Shareholders seeks to describe some of the investment advisor’s current opinions and views of the financial markets. Although the investment advisor believes it has a reasonable basis for any opinions or views expressed, actual results may differ, sometimes significantly so, from those expected or expressed. The securities held by the Funds that are discussed in the Letter to Shareholders were held during the period covered by this Report. They do not comprise the entire investment portfolio of the Funds, may be sold at any time and may no longer be held by the Funds. For a complete list of securities held by the Funds as of April 30, 2021, please see the Schedules of Investments sections of the semi-annual report. The opinions of DCM Advisors, LLC with respect to those securities may change at any time.
Statements in the Letter to Shareholders that reflect projections or expectations for future financial or economic performance of the Funds and the market in general and statements of the Funds’ plans and objectives for future operations are forward-looking statements. No assurance can be given that actual results or events will not differ materially from those projected, estimated, assumed, or anticipated in any such forward-looking statements. Important factors that could result in such differences, in addition to factors noted with such forward-looking statements, include, without limitation, general economic conditions, such as inflation, recession, and interest rates. Past performance is not a guarantee of future results.
| Semi-Annual Report | April 30, 2021 | 9 |
| DCM/INNOVA High Equity Income Innovation Fund |
| Performance Update |
| April 30, 2021 (Unaudited) |
Average Annual Total Returns for the period ended April 30, 2021*
| | One | Five | Ten | Since |
| | Year | Year | Year | Inception(a) |
| DCM/INNOVA High Equity Income Innovation Fund | 44.39% | 11.01% | 8.42% | 9.34% |
| S&P 500® Total Return Index(b) | 45.98% | 17.42% | 14.17% | 10.36% |
| Dow Jones U.S. Select Dividend Total Return Index(c) | 53.35% | 11.93% | 12.50% | 8.66% |
| | | | | |
| | | | | Expense |
| | | | | Ratios(d) |
| Gross | | | | 3.43% |
| With Applicable Waivers | | | | 1.57% |
The performance quoted represents past performance, which does not guarantee future results. The investment return and principal value of an investment will fluctuate so that an investor’s shares, when redeemed, may be worth more or less than their original cost. The returns shown do not reflect the deduction of taxes that a shareholder would pay on the DCM/INNOVA High Equity Income Innovation Fund (the “DCM/INNOVA Fund”) distributions or the redemption of shares. Current performance may be lower or higher than the performance quoted. Performance data current to the most recent month end may be obtained by calling (888) 484-5766.
| * | Return figures reflect any change in price per share and assume the reinvestment of all distributions. The DCM/INNOVA Fund’s returns reflect any fee reductions during the applicable period. If such fee reductions had not occurred, the quoted performances would have been lower. |
| (a) | The DCM/INNOVA Fund’s inception date – March 16, 2005 (Date of Initial Public Investment). |
| (b) | S&P 500 Total Return Index is a widely recognized unmanaged index of equity securities and is representative of a broader domestic equity market and range of securities than is found in the DCM/ INNOVA Fund’s portfolio. |
| (c) | The Dow Jones U.S. Select Dividend Total Return Index consists of 100 of the highest dividend-yielding securities (excluding Real Estate Investment Trusts (REITs)) in the Dow Jones U.S. Index, a broad-based index representative of the total market for the United States equity securities. Individuals cannot invest directly in an index; however, an individual can invest in exchange-traded funds or other investment vehicles that attempt to track the performance of a benchmark index. |
| (d) | The expense ratios shown are from the DCM/INNOVA Fund’s prospectus dated April 26, 2021. Additional information pertaining to the expense ratios as of April 30, 2021 can be found in the financial highlights. |
An investor should consider the investment objectives, risks, charges and expenses of the Fund carefully before investing. The DCM/INNOVA Fund’s prospectus contains this and other important information. To obtain a copy of the Fund’s prospectus please visit our website at http://www.dcmmutualfunds.com or call (888) 484-5766 and a copy will be sent to you free of charge. Please read the prospectus carefully before you invest.
The DCM/INNOVA Fund is distributed by Ultimus Fund Distributors, LLC., Member FINRA/SIPC.
| Lebenthal Ultra Short Tax-Free Income Fund |
| Performance Update |
| April 30, 2021 (Unaudited) |
Average Annual Total Returns for the period ended April 30, 2021*
| | | Since |
| | One Year | Inception(a) |
| Lebenthal Ultra Short Tax-Free Income Fund - Class I Shares | 0.22% | 0.40% |
| Lebenthal Ultra Short Tax-Free Income Fund - Class A Shares (Without Load) | 0.00% | 0.18% |
| Lebenthal Ultra Short Tax-Free Income Fund - Class A Shares (With Load) | -0.50% | -0.19% |
| Bloomberg Barclays 1 Year Municipal Bond Index(b) | 1.75% | 1.51% |
| SIFMA Municipal Swap Index(c) | -72.73% | -91.50% |
| | | |
| | Expense Ratios(d) |
| | Class A Shares | Class I Shares |
| Gross | 3.13% | 2.88% |
| With Applicable Waivers | 0.75% | 0.50% |
The performance quoted represents past performance, which does not guarantee future results. The investment return and principal value of an investment will fluctuate so that an investor’s shares, when redeemed, may be worth more or less than their original cost. The returns shown do not reflect the deduction of taxes that a shareholder would pay on the Lebenthal Ultra Short Tax-Free Income Fund (the “Lebenthal Fund”) distributions or the redemption of shares. Current performance may be lower or higher than the performance quoted. In the case of investments at or above $250,000, a contingent deferred sales charge (CDSC) of up to 0.25% may be charged on Class A shares redeemed within 12 months of purchase if you paid no sales charge on the original purchase and a finder’s fee was paid. Performance data current to the most recent month end may be obtained by calling (888) 484-5766.
| * | Return figures reflect any change in price per share and assume the reinvestment of all distributions. The Lebenthal Fund’s returns reflect any fee reductions during the applicable period. If such fee reductions had not occurred, the quoted performances would have been lower. |
| (a) | The Lebenthal Fund’s inception date – December 30, 2019 (Date of Initial Public Investment). |
| (b) | Bloomberg Barclays 1 Year Municipal Bond Index is an unmanaged index of municipal bonds with a remaining maturity of one to two years. Individuals cannot invest directly in an index; however, an individual can invest in exchange-traded funds or other investment vehicles that attempt to track the performance of a benchmark index. |
| (c) | The Securities Industry and Financial Markets Association Municipal Swap Index (“SIFMA Municipal Swap Index”) is a 7-day high-grade market index comprised of tax-exempt Variable Rate Demand Obligations (“VRDOs”) with certain characteristics. It is a short-term index which reflects activity in the VRDO market. |
| (d) | The expense ratios shown are from the Lebenthal Fund’s prospectus dated April 26, 2021. Additional information pertaining to the expense ratios as of April 30, 2021 can be found in the financial highlights. |
| Semi-Annual Report | April 30, 2021 | 11 |
| Lebenthal Ultra Short Tax-Free Income Fund |
| Performance Update |
| April 30, 2021 (Unaudited) |
An investor should consider the investment objectives, risks, charges and expenses of the Lebenthal Fund carefully before investing. The Lebenthal Fund’s prospectus contains this and other important information. To obtain a copy of the Lebenthal Fund’s prospectus please visit our website at http://www.dcmmutualfunds.com or call (888) 484-5766 and a copy will be sent to you free of charge. Please read the prospectus carefully before you invest.
The Lebenthal Fund is distributed by Ultimus Fund Distributors, LLC., Member FINRA/SIPC.
| DCM/INNOVA High Equity Income Innovation Fund |
| Schedule of Investments |
| April 30, 2021 (Unaudited) |
| | | Shares | | | Fair Value | |
| COMMON STOCKS — 97.35% | | | | | | | | |
| | | | | | | | | |
| Communications — 11.21% | | | | | | | | |
| Alphabet, Inc., Class A(a) | | | 200 | | | $ | 470,700 | |
| Comcast Corp., Class A | | | 1,100 | | | | 61,765 | |
| Interpublic Group of Cos., Inc. | | | 4,000 | | | | 127,000 | |
| Liberty Media Corp.-Liberty Sirius XM, Class C(a) | | | 2,500 | | | | 113,075 | |
| Lumen Technologies, Inc. | | | 8,600 | | | | 110,338 | |
| News Corp., Class A | | | 2,500 | | | | 65,488 | |
| TEGNA, Inc. | | | 2,600 | | | | 52,156 | |
| Walt Disney Co. (The)(a) | | | 800 | | | | 148,816 | |
| | | | | | | | 1,149,338 | |
| | | | | | | | | |
| Consumer Discretionary — 8.74% | | | | | | | | |
| Amazon.com, Inc.(a) | | | 30 | | | | 104,023 | |
| Chipotle Mexican Grill, Inc.(a) | | | 70 | | | | 104,442 | |
| Dana, Inc. | | | 2,400 | | | | 60,720 | |
| General Motors Co. | | | 2,500 | | | | 143,049 | |
| Lear Corp. | | | 600 | | | | 110,304 | |
| Lithia Motors, Inc., Class A | | | 150 | | | | 57,657 | |
| Methode Electronics, Inc. | | | 1,200 | | | | 53,916 | |
| Patrick Industries, Inc. | | | 600 | | | | 53,760 | |
| Schaeffler AG, Preferred Shares | | | 11,000 | | | | 99,093 | |
| Starbucks Corp. | | | 950 | | | | 108,766 | |
| | | | | | | | 895,730 | |
| | | | | | | | | |
| Consumer Staples — 3.83% | | | | | | | | |
| Andersons, Inc. (The) | | | 1,600 | | | | 45,952 | |
| Bunge Ltd. | | | 900 | | | | 75,978 | |
| Lamb Weston Holdings, Inc. | | | 850 | | | | 68,425 | |
| Philip Morris International, Inc. | | | 800 | | | | 76,000 | |
| PriceSmart, Inc. | | | 700 | | | | 58,828 | |
| Sysco Corp. | | | 800 | | | | 67,784 | |
| | | | | | | | 392,967 | |
| | | | | | | | | |
| Energy — 6.47% | | | | | | | | |
| Archrock, Inc. | | | 4,500 | | | | 42,030 | |
| Chevron Corp. | | | 450 | | | | 46,382 | |
| Exxon Mobil Corp. | | | 900 | | | | 51,516 | |
| Marathon Petroleum Corp. | | | 2,520 | | | | 140,237 | |
| ONEOK, Inc. | | | 1,900 | | | | 99,446 | |
| Phillips 66 | | | 1,560 | | | | 126,220 | |
| ProPetro Holding Corp.(a) | | | 5,000 | | | | 48,150 | |
| Williams Cos., Inc. (The) | | | 4,500 | | | | 109,620 | |
| | | | | | | | 663,601 | |
| See Notes to Financial Statements |
| |
| Semi-Annual Report | April 30, 2021 | 13 |
| DCM/INNOVA High Equity Income Innovation Fund |
| Schedule of Investments |
| April 30, 2021 (Unaudited) |
| | | Shares | | | Fair Value | |
| COMMON STOCKS — 97.35% (CONTINUED) | | | | | | | | |
| | | | | | | | | |
| Financials — 16.64% | | | | | | | | |
| BlackRock, Inc. | | | 130 | | | $ | 106,509 | |
| CNA Financial Corp.(a) | | | 2,880 | | | | 135,158 | |
| Comerica, Inc. | | | 1,000 | | | | 75,160 | |
| Discover Financial Services | | | 1,400 | | | | 159,600 | |
| Financial Institutions, Inc. | | | 3,000 | | | | 95,790 | |
| First Republic Bank | | | 500 | | | | 91,620 | |
| Jefferies Financial Group, Inc. | | | 4,500 | | | | 146,295 | |
| JPMorgan Chase & Co. | | | 700 | | | | 107,667 | |
| KeyCorp | | | 6,000 | | | | 130,560 | |
| Principal Financial Group, Inc. | | | 1,600 | | | | 102,192 | |
| Prudential Financial, Inc. | | | 1,500 | | | | 150,540 | |
| Regions Financial Corp. | | | 7,000 | | | | 152,600 | |
| Swiss Life Holding AG | | | 250 | | | | 121,786 | |
| Truist Financial Corp. | | | 2,200 | | | | 130,482 | |
| | | | | | | | 1,705,959 | |
| | | | | | | | | |
| Health Care — 2.84% | | | | | | | | |
| Ensign Group, Inc. (The) | | | 750 | | | | 64,388 | |
| HCA Healthcare, Inc. | | | 400 | | | | 80,424 | |
| Hill-Rom Holdings, Inc. | | | 500 | | | | 55,110 | |
| Hologic, Inc.(a) | | | 1,400 | | | | 91,770 | |
| | | | | | | | 291,692 | |
| | | | | | | | | |
| Industrials — 14.07% | | | | | | | | |
| Advanced Energy Industries, Inc. | | | 650 | | | | 71,702 | |
| Caterpillar, Inc. | | | 550 | | | | 125,461 | |
| CSX Corp. | | | 700 | | | | 70,525 | |
| Cummins, Inc. | | | 200 | | | | 50,408 | |
| Deere & Co. | | | 520 | | | | 192,841 | |
| Honeywell International, Inc. | | | 260 | | | | 57,990 | |
| Pentair PLC | | | 2,500 | | | | 161,275 | |
| Quanta Services, Inc. | | | 2,200 | | | | 212,608 | |
| SITC International Holdings Co., Ltd. | | | 30,000 | | | | 114,511 | |
| Sweco AB | | | 5,000 | | | | 89,183 | |
| Trane Technologies PLC | | | 600 | | | | 104,298 | |
| United Rentals, Inc.(a) | | | 600 | | | | 191,970 | |
| | | | | | | | 1,442,772 | |
| See Notes to Financial Statements |
| |
| 14 | www.dcmmutualfunds.com |
| DCM/INNOVA High Equity Income Innovation Fund |
| Schedule of Investments |
| April 30, 2021 (Unaudited) |
| | | Shares | | | Fair Value | |
| COMMON STOCKS — 97.35% (CONTINUED) | | | | | | | | |
| | | | | | | | | |
| Materials — 10.79% | | | | | | | | |
| Albemarle Corp. | | | 800 | | | $ | 134,536 | |
| BASF SE | | | 1,500 | | | | 120,938 | |
| Boliden AB | | | 2,600 | | | | 101,288 | |
| Dow, Inc. | | | 3,900 | | | | 243,750 | |
| Eagle Materials, Inc. | | | 900 | | | | 124,326 | |
| Freeport-McMoRan, Inc. | | | 3,000 | | | | 113,130 | |
| LyondellBasell Industries N.V., Class A | | | 1,000 | | | | 103,740 | |
| Owens Corning | | | 1,700 | | | | 164,577 | |
| | | | | | | | 1,106,285 | |
| | | | | | | | | |
| Real Estate — 1.26% | | | | | | | | |
| Covivio | | | 1,450 | | | | 129,315 | |
| | | | | | | | | |
| Technology — 19.00% | | | | | | | | |
| Advanced Micro Devices, Inc.(a) | | | 1,900 | | | | 155,078 | |
| Apple, Inc. | | | 3,200 | | | | 420,672 | |
| Axcelis Technologies, Inc.(a) | | | 2,000 | | | | 83,060 | |
| Benchmark Electronics, Inc. | | | 1,800 | | | | 54,036 | |
| Broadcom, Inc. | | | 230 | | | | 104,926 | |
| Cadence Design Systems, Inc.(a) | | | 900 | | | | 118,593 | |
| Cisco Systems, Inc. | | | 1,500 | | | | 76,365 | |
| Cognyte Software Ltd.(a) | | | 900 | | | | 23,517 | |
| Corning, Inc. | | | 2,000 | | | | 88,420 | |
| Intel Corp. | | | 900 | | | | 51,777 | |
| Microsoft Corp. | | | 1,600 | | | | 403,488 | |
| Qorvo, Inc.(a) | | | 1,200 | | | | 225,803 | |
| QUALCOMM, Inc. | | | 700 | | | | 97,160 | |
| Verint Systems, Inc.(a) | | | 900 | | | | 43,713 | |
| | | | | | | | 1,946,608 | |
| | | | | | | | | |
| Utilities — 2.50% | | | | | | | | |
| AES Corp. | | | 4,500 | | | | 125,190 | |
| Fortum Oyj | | | 5,000 | | | | 131,310 | |
| | | | | | | | 256,500 | |
| | | | | | | | | |
| Total Common Stocks (Cost $7,550,034) | | | | | | | 9,980,767 | |
| See Notes to Financial Statements |
| |
| Semi-Annual Report | April 30, 2021 | 15 |
| DCM/INNOVA High Equity Income Innovation Fund |
| Schedule of Investments |
| April 30, 2021 (Unaudited) |
| | | Shares | | | Fair Value | |
| BUSINESS DEVELOPMENT COMPANIES — 0.05% | | | | | | | | |
| | | | | | | | | |
| Financials — 0.05% | | | | | | | | |
| Ares Capital Corp. | | | 271 | | | $ | 5,217 | |
| | | | | | | | | |
| Total Business Development Companies (Cost $5,159) | | | | | | | 5,217 | |
| | | | | | | | | |
| MONEY MARKET FUNDS — 1.71% | | | | | | | | |
| Fidelity Investments Money Market Government Portfolio, Class I, 0.01% (b) | | | 175,587 | | | | 175,587 | |
| | | | | | | | | |
| Total Money Market Funds (Cost $175,587) | | | | | | | 175,587 | |
| | | | | | | | | |
| Total Investments — 99.11% (Cost $7,730,780) | | | | | | | 10,161,571 | |
| | | | | | | | | |
| Other Assets in Excess of Liabilities — 0.89% | | | | | | | 91,727 | |
| | | | | | | | | |
| NET ASSETS — 100.00% | | | | | | $ | 10,253,298 | |
| (a) | Non-income producing security. |
| (b) | Rate disclosed is the seven day effective yield as of April 30, 2021. |
| See Notes to Financial Statements |
| |
| 16 | www.dcmmutualfunds.com |
| DCM/INNOVA High Equity Income Innovation Fund |
| Schedule of Investments |
| April 30, 2021 (Unaudited) |
| Summary of Investments (Unaudited) | | % of Net Assets | | | Value | |
| Common Stocks | | | | | | | | |
| Communications | | | 11.21 | % | | $ | 1,149,338 | |
| Consumer Discretionary | | | 8.74 | % | | | 895,730 | |
| Consumer Staples | | | 3.83 | % | | | 392,967 | |
| Energy | | | 6.47 | % | | | 663,601 | |
| Financials | | | 16.64 | % | | | 1,705,959 | |
| Health Care | | | 2.84 | % | | | 291,692 | |
| Industrials | | | 14.07 | % | | | 1,442,772 | |
| Materials | | | 10.79 | % | | | 1,106,285 | |
| Real Estate | | | 1.26 | % | | | 129,315 | |
| Technology | | | 19.00 | % | | | 1,946,608 | |
| Utilities | | | 2.50 | % | | | 256,500 | |
| Business Development Companies | | | 0.05 | % | | | 5,217 | |
| Money Market Funds | | | 1.71 | % | | | 175,587 | |
| Other Assets in Excess of Liabilities | | | 0.89 | % | | | 91,727 | |
| Total | | | 100.00 | % | | $ | 10,253,298 | |
| See Notes to Financial Statements |
| |
| Semi-Annual Report | April 30, 2021 | 17 |
| Lebenthal Ultra Short Tax-Free Income Fund |
| Schedule of Investments |
| April 30, 2021 (Unaudited) |
| | | Principal | | | | |
| | | Amount | | | Fair Value | |
| MUNICIPAL BONDS — 99.14% | | | | | | | | |
| | | | | | | | | |
| Alaska — 3.19% | | | | | | | | |
| Alaska Housing Finance Corp. Home Mortgage Revenue Bonds, Series 2007 A, 0.06%, 12/1/2041(a) | | $ | 300,000 | | | $ | 300,000 | |
| | | | | | | | | |
| Arizona — 0.38% | | | | | | | | |
| Pima County AZ Certificates of Participation, Series 2020 A, 5.00%, 12/1/2021 | | | 35,000 | | | | 35,981 | |
| | | | | | | | | |
| California — 1.57% | | | | | | | | |
| Los Angeles CA Unified School District General Obligation Refunding Bonds, Series 2011 A-1, 5.00%, 7/1/2021 | | | 30,000 | | | | 30,234 | |
| Oakland Joint Powers Financing Authority Lease Revenue Refunding Bonds, Series 2018, 5.00%, 11/1/2021 | | | 65,000 | | | | 66,572 | |
| Redding Elementary School District Refunding Certificates of Participation, Series 2018, 4.00%, 9/1/2021 | | | 50,000 | | | | 50,612 | |
| | | | | | | | 147,418 | |
| | | | | | | | | |
| Colorado — 1.89% | | | | | | | | |
| Pueblo County CO Certificates of Participation, Series 2012, 5.00%, 9/15/2021 | | | 175,000 | | | | 178,099 | |
| | | | | | | | | |
| Connecticut — 4.28% | | | | | | | | |
| Connecticut State General Obligation Bonds, Series 2013 A, 5.00%, 10/15/2021 | | | 70,000 | | | | 71,527 | |
| Connecticut State General Obligation Bonds, Series 2014 F, 5.00%, 11/15/2021 | | | 35,000 | | | | 35,906 | |
| Connecticut State General Obligation Refunding Bonds, Series 2012 C, 5.00%, 6/1/2021 | | | 40,000 | | | | 40,146 | |
| Connecticut State Health & Educational Facilities Authority Revenue Refunding Bonds, Series 2014 O, 4.00%, 11/1/2021 | | | 250,000 | | | | 254,628 | |
| | | | | | | | 402,207 | |
| See Notes to Financial Statements |
| |
| 18 | www.dcmmutualfunds.com |
| Lebenthal Ultra Short Tax-Free Income Fund |
| Schedule of Investments |
| April 30, 2021 (Unaudited) |
| | | Principal | | | | |
| | | Amount | | | Fair Value | |
| MUNICIPAL BONDS — 99.14% (CONTINUED) | | | | | | | | |
| | | | | | | | | |
| District of Columbia — 5.85% | | | | | | | | |
| District of Columbia Carnegie Endowment for International Peace Revenue Bonds, Series 2006, 0.05%, 11/1/2045(a) | | $ | 300,000 | | | $ | 300,000 | |
| District of Columbia Water & Sewer Authority Revenue Bonds, Series 2014 B-2, 0.06%, 10/1/2050(a) | | | 250,000 | | | | 250,000 | |
| | | | | | | | 550,000 | |
| | | | | | | | | |
| Florida — 8.24% | | | | | | | | |
| City of Port St Lucie FL Utility System Revenue Refunding Bonds, 4.00%, 9/1/2021 | | | 65,000 | | | | 65,791 | |
| County of Osceola FL Sales Tax Revenue Refunding Bonds, Series 2016 A, 4.00%, 10/1/2021 | | | 40,000 | | | | 40,615 | |
| County of Osceola FL Tourist Development Tax Revenue and Refunding Improvement Bonds, Series 2012, 5.00%, 10/1/2021 | | | 40,000 | | | | 40,778 | |
| Jacksonville FL Capital Improvement Refunding Revenue Bonds, Series 2012, 5.00%, 10/1/2022 | | | 110,000 | | | | 117,389 | |
| JEA Electric System Revenue Bonds, Series 2013 A, 5.00%, 10/1/2021 | | | 25,000 | | | | 25,495 | |
| JEA Electric System Revenue Bonds, Series 2013 3-A, 5.00%, 10/1/2022 | | | 35,000 | | | | 37,382 | |
| JEA Florida Water & Sewer System Revenue Bonds, Series 2008 B, 0.08%, 10/1/2041(a) | | | 300,000 | | | | 300,000 | |
| Key West FL Utility Board Electric Revenue System Revenue Refunding Bonds, Series 2014, 5.00%, 10/1/2021 | | | 60,000 | | | | 61,199 | |
| Miami-Dade County Expressway Authority Toll System Revenue and Refunding Bonds, Series 2014 B, 5.00%, 7/1/2021 | | | 25,000 | | | | 25,189 | |
| Miami-Dade County Expressway Authority Toll System Revenue Bonds, Series 2014 A, 5.00%, 7/1/2021 | | | 60,000 | | | | 60,455 | |
| | | | | | | | 774,293 | |
| | | | | | | | | |
| Georgia — 0.54% | | | | | | | | |
| Atlanta GA Airport Revenue General Refunding Bonds, Series 2019 E, 5.00%, 7/1/2021 | | | 50,000 | | | | 50,388 | |
| See Notes to Financial Statements |
| |
| Semi-Annual Report | April 30, 2021 | 19 |
| Lebenthal Ultra Short Tax-Free Income Fund |
| Schedule of Investments |
| April 30, 2021 (Unaudited) |
| | | Principal | | | | |
| | | Amount | | | Fair Value | |
| MUNICIPAL BONDS — 99.14% (CONTINUED) | | | | | | | | |
| | | | | | | | | |
| Illinois — 7.10% | | | | | | | | |
| Cook County IL Sales Tax Revenue Bonds, Series 2012, 5.00%, 11/15/2021 | | $ | 120,000 | | | $ | 123,138 | |
| Illinois Finance Authority Revenue Bonds, Series 2014 A, 5.00%, 10/1/2021 | | | 85,000 | | | | 86,679 | |
| Illinois Finance Authority Revenue Bonds, Series 2013 B, 4.00%, 1/1/2022 | | | 30,000 | | | | 30,776 | |
| Illinois Finance Authority Revenue Bonds, Series 2003 B, 0.03%, 7/1/2033(a) | | | 200,000 | | | | 200,000 | |
| Illinois State General Obligation Bonds, Series 2014, 5.00%, 5/1/2021 | | | 35,000 | | | | 35,000 | |
| Illinois State General Obligation Bonds, Series 2013, 5.00%, 7/1/2021 | | | 60,000 | | | | 60,443 | |
| Illinois State General Obligation Bonds, Series 2017 D, 5.00%, 11/1/2021 | | | 25,000 | | | | 25,561 | |
| Illinois State General Obligation Refunding Bonds, Series 2012, 5.00%, 8/1/2021 | | | 50,000 | | | | 50,563 | |
| Lake County IL Community School District General Obligation Bonds, 4.00%, 11/1/2021 | | | 25,000 | | | | 25,463 | |
| Regional Transportation Authority Illinois Revenue Refunding Bonds, Series 2001 B, 5.50%, 6/1/2021 | | | 30,000 | | | | 30,120 | |
| | | | | | | | 667,743 | |
| | | | | | | | | |
| Iowa — 1.07% | | | | | | | | |
| Des Moines Area Community College Plant Fund Capital Loan Notes, 4.00%, 6/1/2021 | | | 25,000 | | | | 25,073 | |
| Des Moines General Obligation Annual Appropriation Bonds, Series 2017 C, 4.00%, 6/1/2021 | | | 75,000 | | | | 75,215 | |
| | | | | | | | 100,288 | |
| | | | | | | | | |
| Kansas — 0.91% | | | | | | | | |
| Leavenworth County KS Unified School District 464 General Obligation Refunding and Improvement Bonds, Series 2019 A, 4.00%, 9/1/2021 | | | 85,000 | | | | 86,040 | |
| | | | | | | | | |
| Kentucky — 5.22% | | | | | | | | |
| Kentucky State Asset/Liability Commission Agency Fund Revenue Bonds, Series 2013 A, 5.00%, 9/1/2021 | | | 130,000 | | | | 132,039 | |
| Kentucky State Property & Building Commission Revenue and Revenue Refunding Bonds, Series 2002, 5.50%, 8/1/2021 | | | 50,000 | | | | 50,647 | |
| See Notes to Financial Statements |
| |
| 20 | www.dcmmutualfunds.com |
| Lebenthal Ultra Short Tax-Free Income Fund |
| Schedule of Investments |
| April 30, 2021 (Unaudited) |
| | | Principal | | | | |
| | | Amount | | | Fair Value | |
| MUNICIPAL BONDS — 99.14% (CONTINUED) | | | | | | | | |
| | | | | | | | | |
| Kentucky — 5.22% (Continued) | | | | | | | | |
| Kentucky State Property & Buildings Commission Agency Fund Revenue Bonds, Series 2017, 3.00%, 10/1/2021 | | $ | 45,000 | | | $ | 45,508 | |
| Kentucky State Property & Buildings Commission Revenue and Revenue Refunding Bonds, Series 2011 A, 5.00%, 8/1/2021 | | | 50,000 | | | | 50,587 | |
| Kentucky State Property & Buildings Commission Revenue Bonds, Series 2018, 5.00%, 5/1/2021 | | | 40,000 | | | | 40,000 | |
| Kentucky State Property & Buildings Commission Revenue Bonds, Series 2018, 5.00%, 5/1/2022 | | | 35,000 | | | | 36,685 | |
| Kentucky Turnpike Authority Revenue Bonds, Series 2015 B, 5.00%, 7/1/2021 | | | 100,000 | | | | 100,748 | |
| Louisville & Jefferson County Metropolitan Sewer District Revenue Bonds, Series 2016 C, 5.00%, 5/15/2021 | | | 35,000 | | | | 35,053 | |
| | | | | | | | 491,267 | |
| | | | | | | | | |
| Louisiana — 0.96% | | | | | | | | |
| Louisiana Stadium & Exposition District Senior Revenue Refunding Bonds, Series 2013 A, 5.00%, 7/1/2021 | | | 90,000 | | | | 90,661 | |
| | | | | | | | | |
| Maine — 0.27% | | | | | | | | |
| City of Portland ME General Airport Revenue Refunding Bonds, Series 2013, 5.00%, 7/1/2021 | | | 25,000 | | | | 25,172 | |
| | | | | | | | | |
| Maryland — 3.19% | | | | | | | | |
| Washington Suburban Sanitary District General Obligation Bonds, Series 2016 B-4, 0.05%, 6/1/2023 (a) | | | 200,000 | | | | 200,000 | |
| Washington Suburban Sanitary District General Obligation Bonds, Series 2015 B-3, 0.07%, 6/1/2023 (a) | | | 100,000 | | | | 100,000 | |
| | | | | | | | 300,000 | |
| | | | | | | | | |
| Michigan — 0.32% | | | | | | | | |
| Detroit MI Sewage Disposal System Revenue Refunding Second Lien Bonds, Series 2005 B, 5.50%, 7/1/2021 | | | 30,000 | | | | 30,243 | |
| See Notes to Financial Statements |
| |
| Semi-Annual Report | April 30, 2021 | 21 |
| Lebenthal Ultra Short Tax-Free Income Fund |
| Schedule of Investments |
| April 30, 2021 (Unaudited) |
| | | Principal | | | | |
| | | Amount | | | Fair Value | |
| MUNICIPAL BONDS — 99.14% (CONTINUED) | | | | | | | | |
| | | | | | | | | |
| Minnesota — 0.33% | | | | | | | | |
| St Paul Port Authority Revenue Tax-Exempt Limited Tax Supported Refunding Bonds, Series 2017 1, 5.00%, 3/1/2022 | | $ | 30,000 | | | $ | 31,217 | |
| | | | | | | | | |
| Nevada — 2.24% | | | | | | | | |
| Clark County NV Passenger Facility Charge Revenue Refunding Bonds, Series 2019 E, 5.00%, 7/1/2021 | | | 125,000 | | | | 125,957 | |
| Clark County NV School District General Obligation Limited Tax Refunding Bonds, Series 2012 A, 5.00%, 6/15/2021 | | | 35,000 | | | | 35,190 | |
| Clark County NV School District General Obligation Limited Tax Refunding Bonds, Series 2015 B, 5.00%, 6/15/2021 | | | 50,000 | | | | 50,271 | |
| | | | | | | | 211,418 | |
| | | | | | | | | |
| New Jersey — 10.88% | | | | | | | | |
| Jersey City NJ General Obligation Improvement Bonds, Series 2018, 5.00%, 12/1/2021 | | | 35,000 | | | | 35,959 | |
| Maplewood Township NJ General Improvement Bonds, Series 2018, 5.00%, 2/15/2022 | | | 50,000 | | | | 51,919 | |
| New Jersey Economic Development Authority Revenue Refunding Bonds, Series 2015 XX, 5.00%, 6/15/2021 | | | 165,000 | | | | 165,892 | |
| New Jersey Economic Development Authority Revenue Refunding Bonds, Series 2017 B, 5.00%, 11/1/2021 | | | 35,000 | | | | 35,818 | |
| New Jersey Economic Development Authority Revenue Refunding Bonds, Series 2005 K, 5.25%, 12/15/2021 | | | 15,000 | | | | 15,461 | |
| New Jersey State Educational Facilities Authority Revenue Bonds, Series 2014, 5.00%, 6/15/2021 | | | 50,000 | | | | 50,271 | |
| New Jersey State Educational Facilities Authority Revenue Bonds, Series 2014 A, 5.00%, 7/1/2021 | | | 40,000 | | | | 40,292 | |
| New Jersey State General Obligation Bonds, Series 2016, 5.00%, 6/1/2022 | | | 35,000 | | | | 36,815 | |
| New Jersey State General Obligation Bonds, Refunding Bonds, Series 2016 T, 5.00%, 6/1/2021 | | | 300,000 | | | | 301,087 | |
| New Jersey State Transportation Trust Fund Transportation Program Revenue Bonds, Series 2012 AA, 5.00%, 6/15/2021 | | | 50,000 | | | | 50,271 | |
| See Notes to Financial Statements |
| |
| 22 | www.dcmmutualfunds.com |
| Lebenthal Ultra Short Tax-Free Income Fund |
| Schedule of Investments |
| April 30, 2021 (Unaudited) |
| | | Principal | | | | |
| | | Amount | | | Fair Value | |
| MUNICIPAL BONDS — 99.14% (CONTINUED) | | | | | | | | |
| | | | | | | | | |
| New Jersey — 10.88% (Continued) | | | | | | | | |
| New Jersey State Transportation Trust Fund Authority Revenue Bonds, Series 2006 A, 5.50%, 12/15/2021 | | $ | 200,000 | | | $ | 206,448 | |
| The Passaic County NJ Improvement Authority Government Loan Revenue Bonds, 4.00%, 6/15/2021 | | | 35,000 | | | | 35,155 | |
| | | | | | | | 1,025,388 | |
| | | | | | | | | |
| New Mexico — 1.07% | | | | | | | | |
| New Mexico Institute of Mining & Technology Revenue Bonds, 5.00%, 7/1/2021 | | | 100,000 | | | | 100,759 | |
| | | | | | | | | |
| New York — 18.95% | | | | | | | | |
| Battery Park City Authority Junior Revenue Bonds, Series 2019 D-1, 0.03%, 11/1/2038(a) | | | 300,000 | | | | 300,000 | |
| Dutchess County Local Development Corp. Revenue Bonds, Series 2015 A, 5.00%, 7/1/2021 | | | 130,000 | | | | 130,949 | |
| Hempstead Town NY Local Development Corp. Revenue Refunding Bonds, 4.00%, 10/1/2021 | | | 25,000 | | | | 25,375 | |
| Long Island Power Authority Electric System General Revenue Bonds, Series 2016 B, 5.00%, 9/1/2021 | | | 50,000 | | | | 50,801 | |
| Metropolitan Transportation Authority Revenue Bonds, Series 2018 C-2, 5.00%, 9/1/2021 | | | 30,000 | | | | 30,462 | |
| Nassau County NY General Obligation Improvement Bonds, Series 2016 A, 5.00%, 1/1/2022 | | | 50,000 | | | | 51,585 | |
| New York City Trust for Cultural Resources Revenue Bonds, Series 2009 A, 0.03%, 7/1/2032(a) | | | 250,000 | | | | 250,000 | |
| New York City Trust for Cultural Resources Revenue Bonds, Series 2006 A-2, 0.03%, 10/1/2036(a) | | | 200,000 | | | | 200,000 | |
| New York NY General Obligation Bonds, Series 2012 A-1, 4.00%, 10/1/2021 | | | 35,000 | | | | 35,559 | |
| New York State Dormitory Authority Revenue Bonds, Series 2015 A, 5.00%, 5/1/2021 | | | 40,000 | | | | 40,000 | |
| New York State Dormitory Authority Revenue Bonds, Series 2012 A, 5.00%, 5/15/2021 | | | 25,000 | | | | 25,038 | |
| New York State Dormitory Authority Revenue Bonds, Series 2007 C, 5.25%, 7/1/2021 | | | 55,000 | | | | 55,428 | |
| New York State Dormitory Authority Revenue Bonds, Series 2012 H, 5.00%, 10/1/2021 | | | 55,000 | | | | 56,063 | |
| New York State Dormitory Authority Revenue Bonds, Series 2018 A, 5.00%, 10/1/2021 | | | 25,000 | | | | 25,483 | |
| See Notes to Financial Statements |
| |
| Semi-Annual Report | April 30, 2021 | 23 |
| Lebenthal Ultra Short Tax-Free Income Fund |
| Schedule of Investments |
| April 30, 2021 (Unaudited) |
| | | Principal | | | | |
| | | Amount | | | Fair Value | |
| MUNICIPAL BONDS — 99.14% (CONTINUED) | | | | | | | | |
| | | | | | | | | |
| New York — 18.95% (Continued) | | | | | | | | |
| New York State Dormitory Authority Revenue Bonds, Series 2012 A, 5.00%, 7/1/2022 | | $ | 35,000 | | | $ | 37,002 | |
| New York State Dormitory Authority Revenue Bonds, Series 2011 A, 5.00%, 7/1/2021 | | | 40,000 | | | | 40,309 | |
| New York State Dormitory Authority Revenue Bonds, Series 2015 B, 5.00%, 7/1/2021 | | | 35,000 | | | | 35,270 | |
| New York State Energy Research & Development Authority Facilities Revenue Bonds, Series 2005 A-3, 0.05%, 5/1/2039(a) | | | 300,000 | | | | 300,000 | |
| Schenectady County Capital Resources Corp. Tax-Exempt Revenue Bonds, Series 2012 A, 5.00%, 7/1/2021 | | | 60,000 | | | | 60,448 | |
| Triborough Bridge & Tunnel Authority Revenue Bonds, Series 2012 B, 4.00%, 11/15/2021 | | | 30,000 | | | | 30,625 | |
| | | | | | | | 1,780,397 | |
| | | | | | | | | |
| North Dakota — 0.53% | | | | | | | | |
| West Fargo ND Refunding Improvement Bonds, Series 2020 A, 2.00%, 5/1/2021 | | | 50,000 | | | | 50,000 | |
| | | | | | | | | |
| Ohio — 5.32% | | | | | | | | |
| Ohio State General Obligation Infrastructure Improvement Bonds, Series 2004 A, 0.04%, 2/1/2023(a) | | | 200,000 | | | | 200,000 | |
| Ohio Water Development Authority Water Pollution Control Loan Fund Revenue Bonds, Series 2016 A, 0.04%, 12/1/2036(a) | | | 300,000 | | | | 300,000 | |
| | | | | | | | 500,000 | |
| | | | | | | | | |
| Pennsylvania — 6.39% | | | | | | | | |
| Allegheny County PA Sanitary Authority Sewer Revenue Bonds, Series 2015, 5.00%, 12/1/2021 | | | 30,000 | | | | 30,827 | |
| Commonwealth of Pennsylvania General Obligation Bonds, Series 2015 D, 5.00%, 8/15/2021 | | | 40,000 | | | | 40,551 | |
| Delaware River Joint Toll Bridge Commission Bridge Revenue Refunding Bonds, Series 2019 B, 5.00%, 7/1/2021 | | | 30,000 | | | | 30,232 | |
| Pennsylvania Turnpike Commission Turnpike Revenue Bonds, Series 2013 C, 5.00%, 12/1/2021 | | | 50,000 | | | | 51,414 | |
| See Notes to Financial Statements |
| |
| 24 | www.dcmmutualfunds.com |
| Lebenthal Ultra Short Tax-Free Income Fund |
| Schedule of Investments |
| April 30, 2021 (Unaudited) |
| | | Principal | | | | |
| | | Amount | | | Fair Value | |
| MUNICIPAL BONDS — 99.14% (CONTINUED) | | | | | | | | |
| | | | | | | | | |
| Pennsylvania — 6.39% (Continued) | | | | | | | | |
| Pennsylvania Turnpike Commission Turnpike Revenue Refunding Bonds, Series 2019, 5.00%, 12/1/2021 | | $ | 55,000 | | | $ | 56,555 | |
| Pennsylvania Turnpike Commission Turnpike Subordinate Revenue Refunding Bonds, Series 2016, 5.00%, 6/1/2021 | | | 170,000 | | | | 170,622 | |
| Philadelphia Authority for Industrial Development City Service Agreement Revenue Bonds, Series 2017, 5.00%, 12/1/2021 | | | 25,000 | | | | 25,669 | |
| State Public School Building Authority PA School Lease Revenue Refunding Bonds, Series 2016 A, 5.00%, 6/1/2021 | | | 195,000 | | | | 195,697 | |
| | | | | | | | 601,567 | |
| | | | | | | | | |
| Puerto Rico — 0.75% | | | | | | | | |
| Commonwealth of Puerto Rico General Obligation Bonds, Series 2002 A, 5.50%, 7/1/2021 | | | 70,000 | | | | 70,306 | |
| | | | | | | | | |
| Rhode Island — 0.27% | | | | | | | | |
| Rhode Island Health and Educational Building Corp. Higher Educational Facilities Revenue Refunding Bonds, Series 2013 D, 5.00%, 9/15/2021 | | | 25,000 | | | | 25,433 | |
| | | | | | | | | |
| Virginia — 3.19% | | | | | | | | |
| Fairfax County VA Economic Development Revenue Bonds, Series 2003 A, 0.02%, 12/1/2033(a) | | | 300,000 | | | | 300,000 | |
| | | | | | | | | |
| Washington — 0.92% | | | | | | | | |
| Energy Northwest Columbia Generating Station Electric Revenue and Refunding Bonds, Series 2014 A, 5.00%, 7/1/2021 | | | 35,000 | | | | 35,274 | |
| Port of Seattle WA Revenue Intermediate Lien Revenue Refunding Bonds, Series 2012 A, 5.00%, 8/1/2021 | | | 50,000 | | | | 50,557 | |
| | | | | | | | 85,831 | |
| See Notes to Financial Statements |
| | |
| Semi-Annual Report | April 30, 2021 | 25 |
| Lebenthal Ultra Short Tax-Free Income Fund |
| Schedule of Investments |
| April 30, 2021 (Unaudited) |
| | | Principal | | | | |
| | | Amount/ | | | | |
| | | Shares | | | Fair Value | |
| MUNICIPAL BONDS — 99.14% (CONTINUED) | | | | | | | | |
| | | | | | | | | |
| Wisconsin — 3.32% | | | | | | | | |
| Brookfield Community Development & Redevelopment Community Development Revenue Bonds, Series 2015 A, 1.85%, 6/1/2021 | | $ | 50,000 | | | $ | 50,059 | |
| City of Madison WI General Obligation Promissory Notes, Series 2018 A, 4.00%, 10/1/2021 | | | 35,000 | | | | 35,560 | |
| Milwaukee WI General Obligation Promissory Notes, Series 2012 N-2, 5.00%, 5/1/2021 | | | 100,000 | | | | 99,999 | |
| Milwaukee WI General Obligation Promissory Notes, Series 2011 N-3, 5.00%, 5/15/2021 | | | 30,000 | | | | 30,044 | |
| Milwaukee WI Redevelopment Authority Lease Revenue Bonds, Series 2016 A, 3.00%, 11/15/2021 | | | 25,000 | | | | 25,374 | |
| Milwaukee WI Sewerage System Revenue Bonds, Series 2013 S-5, 5.00%, 6/1/2021 | | | 35,000 | | | | 35,127 | |
| Wisconsin State Master Lease Certificates of Participation, Series 2018 A, 5.00%, 9/1/2021 | | | 35,000 | | | | 35,552 | |
| | | | | | | | 311,715 | |
| Total Municipal Bonds (Cost $9,314,455) | | | | | | | 9,323,831 | |
| | | | | | | | | |
| MONEY MARKET FUNDS — 0.28% | | | | | | | | |
| Blackrock Liquidity Funds T-Fund, Institutional Shares, 0.02% (b) | | | 26,316 | | | | 26,316 | |
| | | | | | | | | |
| Total Money Market Funds (Cost $26,316) | | | | | | | 26,316 | |
| | | | | | | | | |
| Total Investments — 99.42% (Cost $9,340,771) | | | | | | | 9,350,147 | |
| | | | | | | | | |
| Other Assets in Excess of Liabilities — 0.58% | | | | | | | 54,266 | |
| | | | | | | | | |
| NET ASSETS — 100.00% | | | | | | $ | 9,404,413 | |
| (a) | Variable rate security. Certain variable rate securities are not based on a published reference rate and spread but are determined by the issuer or agent and are based on current market conditions. These securities, therefore, do not indicate a reference rate and spread. |
| (b) | Rate disclosed is the seven day effective yield as of April 30, 2021. |
| See Notes to Financial Statements |
| |
| 26 | www.dcmmutualfunds.com |
| Lebenthal Ultra Short Tax-Free Income Fund |
| Schedule of Investments |
| April 30, 2021 (Unaudited) |
| Summary of Investments (Unaudited) | | % of Net Assets | | | Value | |
| Municipal Bonds | | | | | | | | |
| Alaska | | | 3.19 | % | | $ | 300,000 | |
| Arizona | | | 0.38 | % | | | 35,981 | |
| California | | | 1.57 | % | | | 147,418 | |
| Colorado | | | 1.89 | % | | | 178,099 | |
| Connecticut | | | 4.28 | % | | | 402,207 | |
| District of Columbia | | | 5.85 | % | | | 550,000 | |
| Florida | | | 8.24 | % | | | 774,293 | |
| Georgia | | | 0.54 | % | | | 50,388 | |
| Illinois | | | 7.10 | % | | | 667,743 | |
| Iowa | | | 1.07 | % | | | 100,288 | |
| Kansas | | | 0.91 | % | | | 86,040 | |
| Kentucky | | | 5.22 | % | | | 491,267 | |
| Louisiana | | | 0.96 | % | | | 90,661 | |
| Maine | | | 0.27 | % | | | 25,172 | |
| Maryland | | | 3.19 | % | | | 300,000 | |
| Michigan | | | 0.32 | % | | | 30,243 | |
| Minnesota | | | 0.33 | % | | | 31,217 | |
| Nevada | | | 2.24 | % | | | 211,418 | |
| New Jersey | | | 10.88 | % | | | 1,025,388 | |
| New Mexico | | | 1.07 | % | | | 100,759 | |
| New York | | | 18.95 | % | | | 1,780,397 | |
| North Dakota | | | 0.53 | % | | | 50,000 | |
| Ohio | | | 5.32 | % | | | 500,000 | |
| Pennsylvania | | | 6.39 | % | | | 601,567 | |
| Puerto Rico | | | 0.75 | % | | | 70,306 | |
| Rhode Island | | | 0.27 | % | | | 25,433 | |
| Virginia | | | 3.19 | % | | | 300,000 | |
| Washington | | | 0.92 | % | | | 85,831 | |
| Wisconsin | | | 3.32 | % | | | 311,715 | |
| Money Market | | | 0.28 | % | | | 26,316 | |
| Other Assets in Excess of Liabilities | | | 0.58 | % | | | 54,266 | |
| Total | | | 100.00 | % | | $ | 9,404,413 | |
| See Notes to Financial Statements |
| |
| Semi-Annual Report | April 30, 2021 | 27 |
| Centaur Mutual Funds Trust |
| Statements of Assets and Liabilities |
| April 30, 2021 (Unaudited) |
| | | DCM/INNOVA | | | Lebenthal | |
| | | High Equity | | | Ultra Short | |
| | | Income Innovation | | | Tax-Free Income | |
| | | Fund | | | Fund | |
| Assets | | | | | | | | |
| Investments in securities, at fair value (cost $7,730,780 and $9,340,771) | | $ | 10,161,571 | | | $ | 9,350,147 | |
| Foreign currencies, at value (cost $3,757 and $–) | | | 3,736 | | | | — | |
| Receivable for fund shares sold | | | 200 | | | | 861 | |
| Dividends and interest receivable | | | 52,314 | | | | 89,607 | |
| Tax reclaims receivable | | | 29,961 | | | | — | |
| Receivable from Adviser | | | 7,140 | | | | 19,709 | |
| Prepaid expenses | | | 27,532 | | | | 39,699 | |
| Total Assets | | | 10,282,454 | | | | 9,500,023 | |
| | | | | | | | | |
| Liabilities | | | | | | | | |
| Payable for investments purchased | | | — | | | | 60,510 | |
| Payable for distributions to shareholders | | | — | | | | 870 | |
| Accrued 12b-1 fees - Class A | | | — | | | | 30 | |
| Payable to Administrator | | | 15,297 | | | | 14,254 | |
| Other accrued expenses | | | 13,859 | | | | 19,946 | |
| Total Liabilities | | | 29,156 | | | | 95,610 | |
| Net Assets | | $ | 10,253,298 | | | $ | 9,404,413 | |
| | | | | | | | | |
| Net Assets consist of: | | | | | | | | |
| Paid-in capital | | | 8,397,257 | | | | 9,395,047 | |
| Accumulated earnings | | | 1,856,041 | | | | 9,366 | |
| Net Assets | | $ | 10,253,298 | | | $ | 9,404,413 | |
| See Notes to Financial Statements |
| |
| 28 | www.dcmmutualfunds.com |
| Centaur Mutual Funds Trust |
| Statements of Assets and Liabilities |
| April 30, 2021 (Unaudited) |
| | | DCM/INNOVA | | | Lebenthal | |
| | | High Equity | | | Ultra Short | |
| | | Income Innovation | | | Tax-Free Income | |
| | | Fund | | | Fund | |
| Class I Shares: | | | | | | | | |
| Net Assets | | | | | | $ | 9,374,380 | |
| Shares outstanding (unlimited number of shares authorized, no par value) | | | | | | | 936,491 | |
| Net asset value, offering and redemption price per share | | | | | | $ | 10.01 | |
| Class A Shares: | | | | | | | | |
| Net Assets | | | | | | $ | 30,033 | |
| Shares outstanding (unlimited number of shares authorized, no par value) | | | | | | | 3,004 | |
| Net asset value, offering and redemption price per share (a) | | | | | | $ | 10.00 | |
| Offering price per share (100%/(100%-0.50% (maximum sales charge)) of net asset value adjusted to the nearest cent) | | | | | | $ | 10.05 | |
| | | | | | | | | |
| Net Assets | | $ | 10,253,298 | | | | | |
| Shares outstanding (unlimited number of shares authorized, no par value) | | | 728,210 | | | | | |
| Net asset value, offering and redemption price per share | | $ | 14.08 | | | | | |
| (a) | In the case of investments at or above $250,000, a contingent deferred sales charge (“CDSC”) of up to 0.25% may be charged on shares redeemed within 12 months of purchase if no sales charge on the original purchase and a finder’s fee was paid. |
| See Notes to Financial Statements |
| |
| Semi-Annual Report | April 30, 2021 | 29 |
| Centaur Mutual Funds Trust |
| Statements of Operations |
| For the six months ended April 30, 2021 (Unaudited) |
| | | DCM/INNOVA | | | Lebenthal | |
| | | High Equity | | | Ultra Short | |
| | | Income Innovation | | | Tax-Free Income | |
| | | Fund | | | Fund | |
| Investment Income | | | | | | | | |
| Dividend income (net of foreign taxes withheld of $35,455 and $–) | | $ | 391,684 | | | $ | 15 | |
| Interest income | | | — | | | | 23,050 | |
| Total investment income | | | 391,684 | | | | 23,065 | |
| | | | | | | | | |
| Expenses | | | | | | | | |
| Advisor | | | 35,038 | | | | 19,591 | |
| Administration | | | 20,329 | | | | 19,088 | |
| Registration | | | 15,229 | | | | 24,814 | |
| Fund accounting | | | 14,817 | | | | 16,624 | |
| Legal | | | 12,411 | | | | 14,068 | |
| Custodian | | | 10,371 | | | | 2,480 | |
| Insurance | | | 7,759 | | | | 3,214 | |
| Audit and tax | | | 7,686 | | | | 9,422 | |
| Transfer agent | | | 7,439 | | | | 5,942 | |
| Report printing | | | 2,972 | | | | 3,325 | |
| Trustee | | | 1,398 | | | | 1,396 | |
| Pricing | | | 1,206 | | | | 5,800 | |
| 12b-1 fees- Investor class | | | — | | | | 52 | |
| Miscellaneous | | | 14,262 | | | | 11,524 | |
| Interest | | | 74 | | | | — | |
| Total expenses | | | 150,991 | | | | 137,340 | |
| Fees waived by Advisor | | | (80,696 | ) | | | (114,412 | ) |
| Fees voluntarily waived by Advisor | | | — | | | | (4,664 | ) |
| Net operating expenses | | | 70,295 | | | | 18,264 | |
| Net investment income | | | 321,389 | | | | 4,801 | |
| | | | | | | | | |
| Net Realized and Change in Unrealized Gain (Loss) on Investments | | | | | | | | |
| Net realized gain (loss) on: | | | | | | | | |
| Investment securities | | | 734,061 | | | | — | |
| Foreign currency translations | | | (23,505 | ) | | | — | |
| Change in unrealized appreciation (depreciation) on: | | | | | | | | |
| Investment securities | | | 1,152,736 | | | | (2,648 | ) |
| Foreign currency translations | | | 249 | | | | — | |
| Net realized and unrealized gain (loss) on investment securities and foreign currency translations | | | 1,863,541 | | | | (2,648 | ) |
| Net increase in net assets resulting from operations | | $ | 2,184,930 | | | $ | 2,153 | |
| See Notes to Financial Statements |
| |
| 30 | www.dcmmutualfunds.com |
| DCM/INNOVA High Equity Income Innovation Fund |
| Statements of Changes in Net Assets |
| | | For the | | | | |
| | | Six Months Ended | | | For the | |
| | | April 30, 2021 | | | Year Ended | |
| | | (Unaudited) | | | October 31, 2020 | |
| Increase (Decrease) in Net Assets due to: | | | | | | | | |
| Operations | | | | | | | | |
| Net investment income | | $ | 321,389 | | | $ | 602,348 | |
| Net realized gain (loss) on investment securities and foreign currency translations | | | 710,556 | | | | (1,262,038 | ) |
| Change in unrealized appreciation (depreciation) on investment securities and foreign currency translations | | | 1,152,985 | | | | 884,870 | |
| Net increase in net assets resulting from operations | | | 2,184,930 | | | | 225,180 | |
| | | | | | | | | |
| Distributions From | | | | | | | | |
| Earnings | | | (273,916 | ) | | | (639,617 | ) |
| Return of capital | | | — | | | | (23,084 | ) |
| Total Distributions | | | (273,916 | ) | | | (662,701 | ) |
| | | | | | | | | |
| Capital Transactions | | | | | | | | |
| Proceeds from shares sold | | | 563,226 | | | | 569,464 | |
| Reinvestment of distributions | | | 262,883 | | | | 633,576 | |
| Amount paid for shares redeemed | | | (697,923 | ) | | | (2,613,653 | ) |
| Net increase (decrease) in net assets resulting from capital transactions | | | 128,186 | | | | (1,410,613 | ) |
| Total Increase (Decrease) in Net Assets | | | 2,039,200 | | | | (1,848,134 | ) |
| | | | | | | | | |
| Net Assets | | | | | | | | |
| Beginning of period | | | 8,214,098 | | | | 10,062,232 | |
| End of period | | $ | 10,253,298 | | | $ | 8,214,098 | |
| | | | | | | | | |
| Share Transactions | | | | | | | | |
| Shares sold | | | 42,194 | | | | 49,884 | |
| Shares issued in reinvestment of distributions | | | 19,630 | | | | 55,113 | |
| Shares redeemed | | | (53,440 | ) | | | (246,215 | ) |
| Net increase (decrease) in shares outstanding | | | 8,384 | | | | (141,218 | ) |
| See Notes to Financial Statements |
| |
| Semi-Annual Report | April 30, 2021 | 31 |
| Lebenthal Ultra Short Tax-Free Income Fund |
| Statements of Changes in Net Assets |
| | | For the | | | | |
| | | Six Months Ended | | | For the | |
| | | April 30, 2021 | | | Period Ended | |
| | | (Unaudited) | | | October 31, 2020(a) | |
| Increase (Decrease) in Net Assets due to: | | | | | | | | |
| Operations | | | | | | | | |
| Net investment income | | $ | 4,801 | | | $ | 25,841 | |
| Net realized loss on investment securities transactions | | | — | | | | (5 | ) |
| Change in unrealized appreciation on investment securities | | | (2,648 | ) | | | 12,024 | |
| Net increase in net assets resulting from operations | | | 2,153 | | | | 37,860 | |
| | | | | | | | | |
| Distributions From | | | | | | | | |
| Earnings | | | | | | | | |
| Class I Shares | | | (4,806 | ) | | | (25,838 | ) |
| Class A Shares | | | — | | | | (46 | ) |
| Total Distributions | | | (4,806 | ) | | | (25,884 | ) |
| | | | | | | | | |
| Capital Transactions — Class I Shares | | | | | | | | |
| Proceeds from shares sold | | | 2,511 | | | | 9,332,000 | |
| Reinvestment of distributions | | | 4,754 | | | | 25,769 | |
| Amount paid for shares redeemed | | | (10 | ) | | | — | |
| Total Class I Shares | | | 7,255 | | | | 9,357,769 | |
| | | | | | | | | |
| Capital Transactions — Class A Shares | | | | | | | | |
| Proceeds from shares sold | | | 5,200 | | | | 45,000 | |
| Reinvestment of distributions | | | (20,180 | ) | | | 46 | |
| Total Class A | | | (14,980 | ) | | | 45,046 | |
| | | | | | | | | |
| Net increase (decrease) in net assets resulting from capital transactions | | | (7,725 | ) | | | 9,402,815 | |
| Total Increase (Decrease) in Net Assets | | | (10,378 | ) | | | 9,414,791 | |
| | | | | | | | | |
| Net Assets | | | | | | | | |
| Beginning of period | | | 9,414,791 | | | | — | |
| End of period | | $ | 9,404,413 | | | $ | 9,414,791 | |
| See Notes to Financial Statements |
| |
| 32 | www.dcmmutualfunds.com |
| Lebenthal Ultra Short Tax-Free Income Fund |
| Statements of Changes in Net Assets |
| | | For the | | | | |
| | | Six Months Ended | | | For the | |
| | | April 30, 2021 | | | Period Ended | |
| | | (Unaudited) | | | October 31, 2020(a) | |
| Share Transactions — Class I Shares | | | | | | |
| Shares sold | | | 251 | | | | 933,190 | |
| Shares issued in reinvestment of distributions | | | 475 | | | | 2,576 | |
| Shares redeemed | | | (1 | ) | | | — | |
| Total Class I | | | 725 | | | | 935,766 | |
| | | | | | | | | |
| Share Transactions — Class A Shares | | | | | | | | |
| Shares sold | | | 520 | | | | 4,498 | |
| Shares issued in reinvestment of distributions | | | (2,018 | ) | | | 4 | |
| Total Class A | | | (1,498 | ) | | | 4,502 | |
| | | | | | | | | |
| Net increase (decrease) in shares outstanding | | | (773 | ) | | | 940,268 | |
| (a) | For the period December 30, 2019 (commencement of operations) to October 31, 2020. |
| See Notes to Financial Statements |
| |
| Semi-Annual Report | April 30, 2021 | 33 |
| DCM/INNOVA High Equity Income Innovation Fund |
| Financial Highlights |
For a share outstanding during each period.
| | | For the | | | | | | | | | | | | | | | | |
| | | Six Months | | | | | | | | | | | | | | | | |
| | | Ended | | | For the | | | For the | | | For the | | | For the | | | For the | |
| | | April 30, | | | Year Ended | | | Year Ended | | | Year Ended | | | Year Ended | | | Year Ended | |
| | | 2021 | | | October 31, | | | October 31, | | | October 31, | | | October 31, | | | October 31, | |
| | | (Unaudited) | | | 2020 | | | 2019 | | | 2018 | | | 2017 | | | 2016 | |
| Selected Per Share Data: | | | | | | | | | | | | | | | | | | | | | | | | |
| Net asset value, beginning of period | | $ | 11.41 | | | $ | 11.69 | | | $ | 13.01 | | | $ | 14.25 | | | $ | 12.81 | | | $ | 12.83 | |
| Investment operations: | | | | | | | | | | | | | | | | | | | | | | | | |
| Net investment income (loss) | | | 0.45 | | | | 0.82 | | | | 0.17 | | | | (0.11 | ) | | | (0.17 | ) | | | (0.12 | ) |
| Net realized and unrealized gain (loss) on investments | | | 2.60 | | | | (0.23 | ) | | | 0.16 | | | | 0.35 | | | | 2.24 | | | | 0.75 | |
| Total from investment operations | | | 3.05 | | | | 0.59 | | | | 0.33 | | | | 0.24 | | | | 2.07 | | | | 0.63 | |
| Less distributions to shareholders from: | | | | | | | | | | | | | | | | | | | | | | | | |
| Net investment income | | | (0.38 | ) | | | (0.84 | ) | | | — | | | | — | | | | — | | | | — | |
| Net realized gains | | | — | | | | — | | | | (1.65 | ) | | | (1.48 | ) | | | (0.63 | ) | | | (0.65 | ) |
| Return of capital | | | — | | | | (0.03 | ) | | | — | | | | — | | | | — | | | | — | |
| Total distributions | | | (0.38 | ) | | | (0.87 | ) | | | (1.65 | ) | | | (1.48 | ) | | | (0.63 | ) | | | (0.65 | ) |
| Paid in capital from redemption fees | | | — | | | | — | | | | — | | | | — | | | | — | | | | — | (a) |
| Net asset value, end of period | | $ | 14.08 | | | $ | 11.41 | | | $ | 11.69 | | | $ | 13.01 | | | $ | 14.25 | | | $ | 12.81 | |
| Total Return(b) | | | 26.99 | % (c) | | | 5.29 | % | | | 3.21 | % | | | 1.80 | % | | | 16.73 | % | | | 5.25 | % |
| Ratios and Supplemental Data: | | | | | | | | | | | | | | | | | | | | | | | | |
| Net assets, end of period (000 omitted) | | $ | 10,253 | | | $ | 8,214 | | | $ | 10,062 | | | $ | 25,251 | | | $ | 25,692 | | | $ | 25,923 | |
| Ratio of gross expenses to average net assets | | | 3.23 | % (d) | | | 3.36 | % | | | 3.15 | % | | | 2.56 | % | | | 2.55 | % | | | 2.81 | % |
| Ratio of net expenses to average net assets | | | 1.50 | % (d) | | | 1.50 | % | | | 1.70 | % | | | 1.95 | % | | | 1.95 | % | | | 1.95 | % |
| Ratio of net investment income (loss) to average net assets | | | 6.87 | % (d) | | | 6.81 | % | | | 1.13 | % | | | (0.84 | )% | | | (1.19 | )% | | | (0.89 | )% |
| Portfolio turnover rate | | | 213 | % (c) | | | 435 | % | | | 338 | % | | | 142 | % | | | 126 | % | | | 127 | % |
| (a) | Rounds to less than $0.005 per share. |
| (b) | Total return represents the rate that the investor would have earned or lost on an investment in the Fund, assuming reinvestment of distributions. |
See Notes to Financial Statements
| Lebenthal Ultra Short Tax-Free Income Fund - Class I Shares |
| Financial Highlights |
For a share outstanding during each period.
| | | For the | | | | |
| | | Six Months | | | For the | |
| | | Ended | | | Period | |
| | | April 30, | | | Ended | |
| | | 2021 | | | October 31, | |
| | | (Unaudited) | | | 2020(a) | |
| Selected Per Share Data: | | | | | | | | |
| Net asset value, beginning of period | | $ | 10.01 | | | $ | 10.00 | |
| Investment operations: | | | | | | | | |
| Net investment income | | | 0.01 | | | | 0.04 | |
| Net realized and unrealized gain on investments | | | — | (b) | | | 0.01 | |
| Total from investment operations | | | 0.01 | | | | 0.05 | |
| Less distributions to shareholders from: | | | | | | | | |
| Net investment income | | | (0.01 | ) | | | (0.04 | ) |
| Total distributions | | | (0.01 | ) | | | (0.04 | ) |
| Net asset value, end of period | | $ | 10.01 | | | $ | 10.01 | |
| Total Return(c) | | | 0.05 | % (d) | | | 0.48 | % (d) |
| Ratios and Supplemental Data: | | | | | | | | |
| Net assets, end of period (000 omitted) | | $ | 9,374 | | | $ | 9,370 | |
| Ratio of gross expenses to average net assets | | | 2.94 | % (e) | | | 2.87 | % (e) |
| Ratio of net expenses to average net assets | | | 0.39 | % (e) | | | 0.43 | % (e) |
| Ratio of net investment income to average net assets | | | 0.10 | % (e) | | | 0.41 | % (e) |
| Portfolio turnover rate | | | 3 | % (d) | | | 88 | % (d) |
| (a) | For the period December 30, 2019 (commencement of operations) to October 31, 2020. |
| (b) | Rounds to less than $0.005 per share. |
| (c) | Total return represents the rate that the investor would have earned or lost on an investment in the Fund, assuming reinvestment of distributions. |
See Notes to Financial Statements
| Semi-Annual Report | April 30, 2021 | 35 |
| Lebenthal Ultra Short Tax-Free Income Fund - Class A Shares |
| Financial Highlights |
For a share outstanding during each period.
| | | For the | | | | |
| | | Six Months | | | For the | |
| | | Ended | | | Period | |
| | | April 30, | | | Ended | |
| | | 2021 | | | October 31, | |
| | | (Unaudited) | | | 2020(a) | |
| Selected Per Share Data: | | | | | | | | |
| Net asset value, beginning of period | | $ | 10.01 | | | $ | 10.00 | |
| Investment operations: | | | | | | | | |
| Net investment income (loss) | | | (0.01 | ) | | | 0.02 | |
| Net realized and unrealized gain on investments | | | — | (b) | | | 0.01 | |
| Total from investment operations | | | (0.01 | ) | | | 0.03 | |
| Less distributions to shareholders from: | | | | | | | | |
| Net investment income | | | — | | | | (0.02 | ) |
| Total distributions | | | — | | | | (0.02 | ) |
| Net asset value, end of period | | $ | 10.00 | | | $ | 10.01 | |
| Total Return(c) | | | (0.10 | )% (d) | | | 0.35 | % (d) |
| Ratios and Supplemental Data: | | | | | | | | |
| Net assets, end of period (000 omitted) | | $ | 30 | | | $ | 45 | |
| Ratio of gross expenses to average net assets | | | 3.14 | % (e) | | | 3.12 | % (e) |
| Ratio of net expenses to average net assets | | | 0.64 | % (e) | | | 0.68 | % (e) |
| Ratio of net investment income (loss) to average net assets | | | (0.14 | )% (e) | | | 0.12 | % (e) |
| Portfolio turnover rate | | | 3 | % (d) | | | 88 | % (d) |
| (a) | For the period December 30, 2019 (commencement of operations) to October 31, 2020. |
| (b) | Rounds to less than $0.005 per share. |
| (c) | Total return represents the rate that the investor would have earned or lost on an investment in the Fund, assuming reinvestment of distributions. Calculation does not reflect front-end sales charge or contingent deferred sales charge (“CDSC”). |
See Notes to Financial Statements
| Centaur Mutual Funds Trust |
| Notes to Financial Statements |
| April 30, 2021 (Unaudited) |
The DCM/INNOVA High Equity Income Innovation Fund (formerly known as the DCM/ INNOVA High Dividend Income Innovation Fund) (the “DCM/INNOVA Fund”) and the Lebenthal Ultra Short Tax-Free Income Fund (the “Lebenthal Fund”) (each a “Fund” and, collectively the “Funds”), are each organized as diversified series of the Centaur Mutual Funds Trust (the “Trust”). The DCM/INNOVA Fund commenced operations on March 16, 2005 and was formally known as the Centaur Total Return Fund. The Lebenthal Fund commenced operations on December 30, 2019. The Trust is an open ended-management investment company and is organized as a Delaware statutory trust and is registered under the Investment Company Act of 1940 (the “1940 Act”), as amended.
The investment objective of the DCM/INNOVA Fund is to seek maximum total return through a combination of capital appreciation and current income. The investment objective of the Lebenthal Fund is to seek a high level of current income exempt from federal income tax consistent with relative stability of principal. The Lebenthal Fund invests primarily in municipal securities, the income from which is exempt from federal income tax.
The Lebenthal Fund currently offers two classes of shares; Class A Shares and Class I Shares. Each class of shares represents an interest in the Lebenthal Fund, has the same rights and is identical in all material respects, except that the classes bear different (or no) levels of sales loads and different expenses, certain class specific expenses will be borne solely by the class to which such expenses are attributable, and each class has exclusive voting rights with respect to matters relating to its own distribution arrangements. Class A Shares are subject to a front-end sales charge of 0.50% which is waived for purchases of $250,000 or greater. Unless you are otherwise eligible to purchase Class A shares without a sales charge, a CDSC of up to 0.25% will be charged on Class A shares redeemed within 12 months of purchase if you paid no sales charge on the original purchase and a finder’s fee was paid.
| 2. | SIGNIFICANT ACCOUNTING POLICIES |
The following is a summary of significant accounting policies consistently followed by the Funds. The policies are in conformity with accounting principles generally accepted in the United States of America (“GAAP”). The Funds are considered investment companies for financial reporting purposes under GAAP.
| Semi-Annual Report | April 30, 2021 | 37 |
| Centaur Mutual Funds Trust |
| Notes to Financial Statements |
| April 30, 2021 (Unaudited) |
Estimates
The preparation of financial statements in conformity with GAAP requires management to make estimates and assumptions that affect the reported amounts of assets and liabilities and disclosure of contingent assets and liabilities at the date of the financial statements and the reported amounts of increases and decreases in the net assets from operations during the reported period. Actual results could differ from those estimates.
Investment Valuation
The Funds’ investments in securities are carried at fair value. Securities listed on an exchange or quoted on a national market system are valued at the last sales price as of 4:00 p.m. Eastern Time. Securities traded in the NASDAQ over-the-counter market are generally valued at the NASDAQ Official Closing Price. Other securities traded in the over-the-counter market and listed securities for which no sale was reported on that date are valued at the most recent bid price.
Fixed income securities will ordinarily be traded on the over-the-counter market. When market quotations are readily available, fixed income securities will be valued based on prices provided by the pricing service. The prices provided by the pricing service are generally determined with consideration given to institutional bid and last sale prices and take into account securities prices, yields, maturities, call features, ratings, institutional trading in similar groups of securities, and developments related to specific securities. Such fixed income securities may also be priced based upon a matrix system of pricing similar bonds and other fixed income securities.
Securities and assets for which representative market quotations are not readily available or which cannot be accurately valued using the Funds normal pricing procedures are valued at fair value as determined under policies approved by the Board of Trustees (the “Board”). Fair value pricing may be used, for example, in situations where (i) a portfolio security is so thinly traded that there have been no transactions for that security over an extended period of time; (ii) the exchange on which the portfolio security is principally traded closes early; or (iii) trading of the portfolio security is halted during the day and does not resume prior to the Funds’ net asset value calculation. A portfolio security’s “fair value” price may differ from the price next available for that portfolio security using the Trust’s normal pricing procedures.
| Centaur Mutual Funds Trust |
| Notes to Financial Statements |
| April 30, 2021 (Unaudited) |
Fair Value Measurement
GAAP establishes a framework for measuring fair value and expands disclosure about fair value measurements. Various inputs are used in determining the value of the Funds’ investments. These inputs are summarized in the three broad levels listed below:
| Level 1 | – | Unadjusted quoted prices in active markets for identical investments and/or registered investment companies where the value per share is determined and published and is the basis for current transactions for identical assets or liabilities at the valuation date |
| |
| Level 2 | – | Other significant observable inputs (including, but not limited to, quoted prices for an identical security in an inactive market, quoted prices for similar securities, interest rates, prepayment speeds, credit risk, etc.) |
| |
| Level 3 | – | Significant unobservable inputs (including the Funds’ own assumptions in determining the fair value of investments based on the best information available) |
The availability of observable inputs can vary from security to security and is affected by a wide variety of factors, including, for example, the type of security, whether the security is new and not yet established in the marketplace, the liquidity of markets, and other characteristics particular to the security. To the extent that valuation is based on models or inputs that are less observable or unobservable in the market, the determination of fair value requires more judgment. Accordingly, the degree of judgment exercised in determining fair value is greatest for instruments categorized in Level 3.
An investment asset’s or liability’s level within the fair value hierarchy is based on the lowest level input, individually or in the aggregate, that is significant to fair value measurement.
The valuation techniques used by the Funds to measure fair value during the six months ended April 30, 2021 maximized the use of observable inputs and minimized the use of unobservable inputs.
| Semi-Annual Report | April 30, 2021 | 39 |
| Centaur Mutual Funds Trust |
| Notes to Financial Statements |
| April 30, 2021 (Unaudited) |
The inputs or methodology used for valuing securities are not necessarily an indication of the risk associated with investing in those securities. The following is a summary of the inputs used in valuing the Funds’ assets and liabilities as of April 30, 2021.
| DCM/INNOVA Fund | | | | | | | | | | | | |
| Investments in Securities at Value | | Level 1 | | | Level 2 | | | Level 3 | | | Total | |
| Assets | | | | | | | | | | | | |
| Common Stocks | | $ | 9,980,767 | | | $ | — | | | $ | — | | | $ | 9,980,767 | |
| Business Development Companies | | | 5,217 | | | | — | | | | — | | | | 5,217 | |
| Money Market Funds | | | 175,587 | | | | — | | | | — | | | | 175,587 | |
| Total | | $ | 10,161,571 | | | $ | — | | | $ | — | | | $ | 10,161,571 | |
| | | | | | | | | | | | | | | | | |
| Lebenthal Fund | | | | | | | | | | | | |
| Investments in Securities at Value | | Level 1 | | | Level 2 | | | Level 3 | | | Total | |
| Assets | | | | | | | | | | | | | | | | |
| Municipal Bonds | | $ | — | | | $ | 9,323,832 | | | $ | — | | | $ | 9,323,832 | |
| Money Market Funds | | | 26,315 | | | | — | | | | — | | | | 26,315 | |
| Total | | $ | 26,315 | | | $ | 9,323,832 | | | $ | — | | | $ | 9,350,147 | |
The Funds did not hold any investments at the end of the reporting period for which significant unobservable inputs (Level 3) were used in determining fair value; therefore, no reconciliation of Level 3 securities is included for this reporting period.
Municipal Securities Risk
The Lebenthal Fund invests primarily in municipal securities. The risk of municipal securities generally depends on the financial and credit status of the issuer. Changes in a municipality’s financial health may make it difficult for the municipality to make interest and principal payments when due. Municipal obligations can be significantly affected by political and economic changes, including inflation, as well as uncertainties in the municipal market related to taxation, legislative changes, or the rights of municipal security holders. Municipal bonds have varying levels of sensitivity to changes in interest rates. Interest rate risk is generally lower for shorter-term Municipal bonds and higher for long term Municipal bonds.
Sector Focus Risk
While the DCM/INNOVA Fund does not focus its investments on a particular sector, the DCM/INNOVA Fund may, at times, be more heavily invested in certain sectors, which may cause the value of its shares to be especially sensitive to factors and economic
| Centaur Mutual Funds Trust |
| Notes to Financial Statements |
| April 30, 2021 (Unaudited) |
risks that specifically affect those sectors and may cause the DCM/INNOVA Fund’s share price to fluctuate more widely than the shares of a mutual fund that invests in a broader range of industries.
Foreign Currency Translation
Portfolio securities and other assets and liabilities denominated in foreign currencies are translated into U.S. dollars based on the exchange rate of such currencies against U.S. dollars on the date of valuation. Purchases and sales of securities and income items denominated in foreign currencies are translated into U.S. dollars at the exchange rate in effect on the transaction date. The Funds do not separately report the effect of changes in foreign exchange rates from changes in market prices on securities held. Such changes are included in net realized and unrealized gain or loss from investments.
Realized foreign exchange gains or losses arise from sales of foreign currencies, currency gains or losses realized between the trade and settlement dates on securities transactions and the difference between the recorded amounts of dividends, interest, and foreign withholding taxes, and the U.S. dollar equivalent of the amounts actually received or paid. Net unrealized foreign exchange gains and losses arise from changes in foreign exchange rates on foreign denominated assets and liabilities other than investments in securities held at the end of the reporting period.
Investment Transactions and Investment Income
Investment transactions are accounted for as of the date purchased or sold (trade date) for financial reporting purposes. Dividend income is recorded on the ex-dividend date. Certain dividends from foreign securities will be recorded as soon as the Funds are informed of the dividend if such information is obtained subsequent to the ex-dividend date. Interest income is recorded on the accrual basis and includes amortization of discounts and premiums. Gains and losses are determined on the identified cost basis, which is the same basis used for federal income tax purposes.
Expenses
Expenses that are directly related to one of the Funds are charged to that Fund. Expenses not directly billed to a particular Fund are allocated proportionally among all Funds in relation to net assets of each Fund or another reasonable allocation method. Expenses specifically attributable to any class are borne by that class. Income, realized gains and losses, unrealized appreciation and depreciation, and fund-wide expenses not allocated to a particular class shall be allocated to each class based on the net assets of that class in relation to the net assets of the entire Fund.
| Semi-Annual Report | April 30, 2021 | 41 |
| Centaur Mutual Funds Trust |
| Notes to Financial Statements |
| April 30, 2021 (Unaudited) |
Dividend Distributions
The Funds generally distribute net investment income (if any) on a monthly basis. Distributions from capital gains (if any) are generally declared and distributed annually. Dividends and distributions to shareholders are recorded on ex-date.
Fees on Redemptions
Prior to February 28, 2016, the DCM/INNOVA Fund charged a redemption fee of 2.00% on redemptions of its shares occurring within one year following the issuance of such shares. The redemption fee was not a fee to finance sales or sales promotion expenses, but was paid to the DCM/INNOVA Fund to defray the costs of liquidating an investor and discouraging short-term trading of the DCM/INNOVA Fund’s shares. No redemption fees were imposed on the redemption of shares representing dividends or capital gains distributions, or on amounts representing capital appreciation of shares.
Federal Income Taxes
As of and during the six months ended April 30, 2021, the Funds did not have a liability for any unrecognized tax benefits. The Funds file U.S. federal, state, and local tax returns as required. The Funds’ tax returns are subject to examination by the relevant tax authorities until expiration of the applicable statute of limitations which is generally three years after the filing of the tax return. Tax returns for open years have incorporated no uncertain tax positions that require a provision for income taxes.
The Funds’ policy is to continue to comply with the requirements of the Internal Revenue Code that are applicable to regulated investment companies and to distribute all their taxable income to their shareholders. The Funds also intend to distribute sufficient net investment income and net capital gains, if any, so that they will not be subject to excise tax on undistributed income and gains. Therefore, no federal income tax or excise tax provision is required.
| 3. | FEES AND OTHER TRANSACTIONS WITH AFFILIATES |
Advisor
DCM Advisors, LLC (the “Advisor”) is the investment advisor for the Funds. The Advisor serves in the capacity of investment advisor to each Fund pursuant to an investment advisory agreement with the Trust on behalf of the respective Fund. The Advisor receives monthly compensation based on each Fund’s average daily net assets at the annual rate of 0.75% for the DCM/INNOVA Fund and 0.42% for the Lebenthal Fund. For the six months ended April 30, 2021, the Advisor earned fees of $35,038 and $19,591
| Centaur Mutual Funds Trust |
| Notes to Financial Statements |
| April 30, 2021 (Unaudited) |
from the DCM/INNOVA Fund and the Lebenthal Fund, respectively. At April 30, 2021, the Advisor owed $7,140 and $19,709 to the DCM/INNOVA Fund and the Lebenthal Fund, respectively, pursuant to the expense limitation agreement described below.
The Advisor has entered into Expense Limitation Agreements with the DCM/INNOVA Fund and the Lebenthal Fund under which the Advisor has contractually agreed to reduce the amount of the investment advisory fees to be paid to the Advisor by the Funds and to assume other expenses of the Funds, if necessary, in an amount that limits the Funds’ annual operating expenses (exclusive of interest, taxes, brokerage commissions, other expenditures which are capitalized in accordance with generally accepted accounting principles, other extraordinary expenses not incurred in the ordinary course of the Funds’ business, dividend expense on securities sold short, “acquired fund fees and expenses,” and amounts, if any, payable pursuant to a plan adopted in accordance with Rule 12b-1 under the 1940 Act) to not more than 1.50% of the average daily net assets of the DCM/ INNOVA Fund through April 30, 2022 and not more than 0.49% of the average daily net assets of the Lebenthal Fund through April 30, 2022. For the six months ended April 30, 2021, the Advisor waived fees and reimbursed expenses for $80,696 and $114,412 for the DCM/INNOVA Fund and the Lebenthal Fund, respectively. The Expense Limitation Agreement may not be terminated prior to that date without the approval of the Board.
In addition to the expense limitations previously noted, effective June 25, 2020, the Advisor has agreed to a voluntarily waiver of ten basis points (0.10%) of the Lebenthal Fund’s average daily net assets. The Advisor is not entitled to the reimbursement of any fees voluntarily waived or expenses reimbursed. During the six months ended April 30, 2021, the Advisor voluntarily waived fees of $4,664 for the Lebenthal Fund.
Administrator
Ultimus Fund Solutions, LLC (the “Administrator”) provides administration, fund accounting, compliance and transfer agency services to the Funds. The Funds pay the Administrator fees in accordance with the Master Services Agreement for such services. In addition, the Funds pay out-of-pocket expenses including but not limited to postage, supplies and costs of pricing its portfolio securities.
Distributor
Ultimus Fund Distributors, LLC (the “Distributor”) serves as the Trust’s Distributor. The Distributor acts as an agent for the Trust and the distributor of its shares. The Distributor is compensated by the Advisor for its services provided to the Trust. The Distributor operates as a wholly-owned subsidiary of the Administrator.
Certain officers of the Trust are employees of the Administrator and the Distributor.
| Semi-Annual Report | April 30, 2021 | 43 |
| Centaur Mutual Funds Trust |
| Notes to Financial Statements |
| April 30, 2021 (Unaudited) |
| 4. | DISTRIBUTION PLAN AND FEES |
The Trust, with respect to the Lebenthal Fund, has adopted a Distribution Plan (the “Plan”) for its Class A Shares in accordance with Rule 12b-1 under the 1940 Act. The Plan allows the Fund to pay for certain expenses related to the distribution of its shares (12b-1 fees”), including, but not limited to, payments to securities dealers and other persons (including the Distributor and its affiliates) who are engaged in the sale of shares of the Lebenthal Fund and who may be advising investors regarding the purchase, sale or retention of the Lebenthal Fund shares; expenses of maintaining personnel who engage in or support distribution of shares or who render shareholder support services not otherwise provided by the Transfer Agent or the Trust; expenses of formulating and implementing marketing and promotional activities, including direct mail promotions and mass media advertising; expenses of preparing, printing and distributing sales literature and prospectuses and statements of additional information and reports for recipients other than existing shareholders; expenses of obtaining such information, analysis and reports with respect to marketing and promotional activities as the Trust may, from time to time, deem advisable; and any other expenses related to the distribution of the Lebenthal Fund shares. The annual limitation for payment of expenses pursuant to the Plan is 0.25% per annum of the Lebenthal Fund’s average daily net assets allocable to the Class A Shares. For the six months ended April 30, 2021, the Class A Shares incurred 12b-1 fees of $52. As of April 30, 2021 the Lebenthal Fund owed the Distributor $30.
| 5. | PURCHASES AND SALES OF INVESTMENT SECURITIES |
For the six months ended April 30, 2021, purchase and sales of investment securities other than short-term investments were as follows:
| | | DCM/INNOVA | | | Lebenthal | |
| | | Fund | | | Fund | |
| Purchases | | $ | 19,304,252 | | | $ | 163,163 | |
| Sales | | $ | 19,191,031 | | | $ | 1,180,000 | |
There were no purchases or sales of long-term U.S. government obligations during the six months ended April 30, 2021.
| Centaur Mutual Funds Trust |
| Notes to Financial Statements |
| April 30, 2021 (Unaudited) |
Distributions are determined in accordance with Federal income tax regulations, which differ from GAAP, and, therefore, may differ significantly in amount or character from net investment income and realized gains for financial reporting purposes. Financial reporting records are adjusted for permanent book/tax differences to reflect tax character but are not adjusted for temporary differences.
Management has reviewed the Funds’ tax positions to be taken on federal income tax returns for the open tax years of 2018, 2019 and 2020 and during the six months ended April 30, 2021, and has determined that the Funds do not have a liability for uncertain tax positions. The Funds recognize interest and penalties, if any, related to unrecognized tax benefits as income tax expense in the Statement of Operations. During the year, the Funds did not incur any interest or penalties.
As of April 30, 2021, the aggregate cost of investments, gross unrealized appreciation (depreciation) and net unrealized appreciation for Federal tax purposes was as follows:
| | | DCM/INNOVA | | | Lebenthal | |
| | | Fund | | | Fund | |
| Gross Unrealized Appreciation | | $ | 2,483,728 | | | $ | 9,628 | |
| Gross Unrealized Depreciation | | | (50,367 | ) | | | (252 | ) |
| Net Unrealized Appreciation | | $ | 2,433,361 | | | $ | 9,376 | |
| Cost of Investments for Income Tax Purposes | | $ | 7,733,350 | | | $ | 9,340,771 | |
Distributions paid during the fiscal years ended October 31, 2020 and October 31, 2019 were characterized for tax purposes as follows:
| | | DCM/INNOVA | | | Lebenthal | |
| | | Fund | | | Fund | |
| | | 2020 | | | 2019 | | | 2020 | |
| Distributions paid from: | | | | | | | | | | | | |
| Ordinary Income | | $ | 639,617 | | | $ | 597,890 | | | $ | 603 | |
| Tax Exempt Income | | | — | | | | — | | | | 25,281 | |
| Long-Term Capital Gains | | | — | | | | 1,632,906 | | | | — | |
| Return of Capital | | | 23,084 | | | | — | | | | — | |
| Total distributions paid | | $ | 662,701 | | | $ | 2,230,796 | | | $ | 25,884 | |
| Semi-Annual Report | April 30, 2021 | 45 |
| Centaur Mutual Funds Trust |
| Notes to Financial Statements |
| April 30, 2021 (Unaudited) |
As of October 31, 2020, the components of distributable earnings on a tax basis were as follows:
| | | DCM/INNOVA | | | Lebenthal | |
| | | Fund | | | Fund | |
| Accumulated Capital Losses | | $ | (1,331,023 | ) | | $ | (5 | ) |
| Net Unrealized Appreciation | | | 1,276,050 | | | | 12,024 | |
| Total Distributable Earnings | | $ | (54,973 | ) | | $ | 12,019 | |
As of October 31, 2020, the DCM/INNOVA Fund and the Lebenthal Fund had short-term capital loss carryforwards available to offset future gains and not subject to expiration in the amount of $1,331,023 and $5, respectively.
| 7. | COMMITMENTS AND CONTINGENCIES |
Under the Trust’s organizational documents, its Officers and Trustees are indemnified against certain liabilities arising out of the performance of their duties to the Funds. In addition, in the normal course of business, the Trust entered into contracts with its service providers, on behalf of the Funds, and others that provide for general indemnifications. The Funds’ maximum exposure under these arrangements is unknown, as this would involve future claims that may be made against the Funds. The Funds expect the risk of loss to be remote.
As of April 30, 2021, there were three Trustees, two of whom are not “interested persons” (as defined in the 1940 Act) of the Trust (the “Independent Trustees”). Each Trustee who is not an interested person of the Trust receives a fee of $2,000 each year plus $500 per series of the Trust per meeting. The officers of the Trust will not receive compensation from the Trust for performing the duties of their offices. All Trustees and officers are reimbursed for any out-of-pocket expenses incurred in connection with attendance at meetings.
Management of the Funds has evaluated the need for disclosure and/or adjustments resulting from subsequent events through the date these financial statements were issued. Based upon this evaluation, management has determined that there are no other items requiring adjustment of the financial statements
| Centaur Mutual Funds Trust |
| Summary of Fund Expenses |
| April 30, 2021 (Unaudited) |
As a shareholder of the Funds, you incur two types of costs: (1) transaction costs and (2) ongoing costs, including management fees and other Fund expenses. This example is intended to help you understand your ongoing costs (in dollars) of investing in the Funds and to compare these costs with the ongoing costs of investing in other mutual funds. The example is based on an investment of $1,000 invested at the beginning of the period and held for the entire period as indicated below.
Actual Expenses – The first line of the table below provides information about the actual account values and actual expenses. You may use the information in this line, together with the amount you invested, to estimate the expenses that you paid over the period. Simply divide your account value by $1,000 (for example, an $8,600 account value divided by $1,000 = 8.6), then multiply the result by the number in the first line under the heading entitled “Expenses Paid During Period” to estimate the expenses you paid on your account during this period.
Hypothetical Example for Comparison Purposes – The second line of the table below provides information about hypothetical account values and hypothetical expenses based on the Funds’ actual expense ratio and an assumed annual rate of return of 5% before expenses, which is not the Funds’ actual return. The hypothetical account values and expenses may not be used to estimate the actual ending account balance or expenses you paid for the period. You may use this information to compare the ongoing costs of investing in the Funds and other funds by comparing this 5% hypothetical example with the 5% hypothetical examples that appear in the shareholder reports of other funds. Please note that the expenses shown in the table are meant to highlight your ongoing costs only and do not reflect any direct costs, such as wire fees or low balance fees. Therefore, the second line of the table is useful in comparing ongoing costs and will not help you determine the relative total costs of owning different funds. In addition, if these direct costs were included, your costs would be higher.
| Semi-Annual Report | April 30, 2021 | 47 |
| Centaur Mutual Funds Trust |
| Summary of Fund Expenses |
| April 30, 2021 (Unaudited) |
| | | Beginning | | Ending | | Expenses | | Annualized |
| | | Account Value, | | Account Value, | | Paid During | | Expense |
| | | November 1, 2020 | | April 30, 2021 | | Period(a) | | Ratio |
| DCM/INNOVA Fund | | | | | | | | |
| Actual | | $1,000.00 | | $1,269.90 | | $8.45 | | 1.50% |
| Hypothetical (5% return before expenses) | | $1,000.00 | | $1,017.35 | | $7.51 | | 1.50% |
| | | | | | | | | |
| Lebenthal Fund - Class A Shares | | | | | | | | |
| Actual | | $1,000.00 | | $999.00 | | $3.16 | | 0.64% |
| Hypothetical (5% return before expenses) | | $1,000.00 | | $1,021.64 | | $3.19 | | 0.64% |
| | | | | | | | | |
| Lebenthal Fund - Class I Shares | | | | | | | | |
| Actual | | $1,000.00 | | $1,000.50 | | $1.94 | | 0.39% |
| Hypothetical (5% return before expenses) | | $1,000.00 | | $1,022.86 | | $1.96 | | 0.39% |
| (a) | Expenses are equal to the Funds’ annualized expense ratio multiplied by the average account value over the period, multiplied by the number of days in the most recent fiscal half year (181), divided by 365. |
| Centaur Mutual Funds Trust |
| Additional Information |
| April 30, 2021 (Unaudited) |
| 1. | PROXY VOTING POLICIES AND VOTING RECORD |
Both (i) a description of the Trust’s Proxy Voting and Disclosure Policy and the Advisor’s Proxy Voting and Disclosure Policy are included as Appendix B to the Funds’ Statement of Additional Information and (ii) information regarding how the Trust voted proxies relating to the Funds’ portfolio securities during the most recent 12-month period ended June 30th are available, without charge, upon request, by calling the Trust at (888) 484-5766, or on the on the Securities and Exchange Commissions (“SEC”) website at https://www.sec.gov.
| 2. | QUARTERLY PORTFOLIO HOLDINGS |
The Trust files each Fund’s complete schedule of portfolio holdings with the SEC for the first and third quarters of each fiscal year as an exhibit to its reports on Form N-PORT, within sixty days after the end of the period. The Funds’ portfolio holdings are available on the SEC’s website at https://www.sec.gov.
| Semi-Annual Report | April 30, 2021 | 49 |
| DCM/INNOVA High Equity Income Innovation Fund |
| Investment Advisory Agreement Approval |
| April 30, 2021 (Unaudited) |
The Board of Trustees (the “Board”), including the Independent Trustees voting separately, reviewed and approved the Investment Advisory Agreement (the “Investment Advisory Agreement”) between the DCM/INNOVA High Equity Income Innovation Fund (the “DCM/INNOVA Fund”) and DCM Advisors LLC (the “Advisor”) for an additional 1-year term commencing March 7, 2021. The Board approved the Investment Advisory Agreements at a video conference meeting in lieu of an in-person meeting, pursuant to SEC Order. The meeting was held on March 3, 2021 and all of the Trustees were present via video conference.
Legal counsel advised the Board during its deliberations. Additionally, the Board received and reviewed a substantial amount of information provided by the Advisor in response to requests of the Board and counsel. In deciding whether to approve the Investment Advisory Agreement, the Trustees considered the best interests of the DCM/INNOVA Fund and its shareholders. The Board considered, among other things: (1) the nature, extent and quality of the services to be provided by the Advisor; (2) the investment management capabilities and experience of the Advisor; (3) the performance of the Advisor; (4) the costs of the services to be provided and profits to be realized by the Advisor from its relationship with the DCM/INNOVA Fund; (5) the extent to which economies of scale may be realized as the DCM/INNOVA Fund grows and whether advisory fee levels reflect these economies of scale for the benefit of the Fund’s investors; (6) the Advisor’s practices regarding brokerage and portfolio transactions; (7) possible conflicts of interest; and (8) other topics or issues
| (i) | The nature, extent, and quality of the services to be provided by the Advisor. In this regard, the Board reviewed the services being provided by the Advisor to the DCM/INNOVA Fund including, without limitation, its experience and personnel, the background and experience of the portfolio manager, Dr. Chopra, the Advisor’s compliance procedures, its investment advisory services provided to the DCM/INNOVA Fund since becoming the DCM/INNOVA Fund’s investment adviser, its coordination of services for the DCM/INNOVA Fund among the Fund’s service providers, its compliance procedures and practices and practices, and its efforts to promote the DCM/INNOVA Fund and assist in distribution of DCM/INNOVA Fund shares. After reviewing the foregoing information and further information provided by the Advisor (e.g., descriptions of the Advisor’s business and its Form ADV), the Board concluded that the quality, extent, and nature of the services provided by the Advisor are satisfactory and adequate for the DCM/INNOVA Fund. |
| DCM/INNOVA High Equity Income Innovation Fund |
| Investment Advisory Agreement Approval |
| April 30, 2021 (Unaudited) |
| (ii) | The Performance of the DCM/INNOVA Fund and the Advisor. The Board compared the DCM/INNOVA Fund’s performance to the performance of its Lipper category, Morningstar Category, custom peer group, and various indicies. Among other measures, the Board also considered the DCM/INNOVA Fund’s dividend yield as compared to the dividend yield of its Morningstar Category and custom peer group. After evaluating the performance of the Advisors in such capacities, the Board concluded that the performance of the Advisor was satisfactory. |
| (iii) | Cost of Services and Profits Realized by the Advisor with respect to the DCM/INNOVA Fund. In this regard, the Board considered the Advisor’s staffing, personnel, and methods of operating; the financial condition of the Advisor and its parent organization, Dinosaur Group Holdings, LLC, a Delaware limited liability company (“DGH”), and the level of the Advisor’s commitment to the DCM/INNOVA Fund; the asset levels of the DCM/INNOVA Fund; and the overall expenses of the DCM/INNOVA Fund, including the advisory fees under the Investment Advisory Agreement. The Board considered the Advisor’s financial statements and the Advisor’s financial commitment to the DCM/INNOVA Fund. The Board noted the investment advisory fee contained in the Investment Advisory Agreement and compared the fees to funds of similar objective and size. The Board also noted that the Advisor agreed to an expense limitation agreement (an “ELA”) and took into account the Advisor’s commitment to continue the expense limitation agreement for the DCM/INNOVA Fund until at least April 30, 2022. |
The Board also considered potential benefits to the Advisor in continuing to manage the DCM/INNOVA Fund, including promotion of the Advisor’s name and the ability to place accounts in the DCM/INNOVA Fund. The Board compared the fees and expenses of the DCM/INNOVA Fund to the average and median advisory fees and expense ratios of funds in the Morningstar US Fund Allocation--50% to 70% Equity category and other funds within Morningstar categories comparable to the DCM/INNOVA Fund. In considering the comparison of fees and expense ratios between the DCM/ INNOVA Fund and comparable funds, the Board looked at the differences in the types of funds being compared, the style of investment management, the size of comparable funds and the nature of the investment strategies. The Board noted that the DCM/INNOVA Fund’s advisory fee (0.75%) is
| Semi-Annual Report | April 30, 2021 | 51 |
| DCM/INNOVA High Equity Income Innovation Fund |
| Investment Advisory Agreement Approval |
| April 30, 2021 (Unaudited) |
below the Custom Peer Group’s average (0.91%) and median (1.00%) and above Morningstar Large Cap Blend Category’s average (0.58%) and median (0.55%).
The Board also compared the advisory fee under the Investment Advisory Agreement to the fees the Advisor charges other clients. The Board noted that the fee structure applicable to the Advisor’s other clients was not indicative of any unreasonableness with respect to the advisory fee under the Investment Advisory Agreement. Following these comparisons and upon further consideration and discussion of the foregoing, the Board concluded that the advisory fee paid to the Advisor by the DCM/INNOVA Fund under the Investment Advisory Agreement is fair and reasonable in relation to the nature and quality of the services to be provided by the Advisor.
| (iv) | The extent to which economies of scale would be realized as the DCM/ INNOVA Fund grows and whether advisory fee levels reflect these economies of scale for the benefit of the Fund’s investors. In this regard, the Board considered that the fee arrangement of the Fund with the Advisor involves both an advisory fee and an expense limitation agreement. The Board noted that the advisory fee rate under the Investment Advisory Agreement remains the same at all asset levels, and that the DCM/INNOVA Fund was not likely to experience the benefit of economies of scale absent substantial growth in the DCM/INNOVA Fund’s capital. Additionally, the Board noted that the DCM/INNOVA Fund had benefited from the expense cap under the ELA and will continue to experience benefits from the ELA until the DCM/ INNOVA Fund’s assets grow to a level where its expenses otherwise fall below the expense cap limit. In addition, the Board noted that the DCM/ INNOVA Fund could benefit from economies of scale under its agreements with service providers other than the Advisor if the DCM/INNOVA Fund were to gather additional assets. Following further discussion of the asset level of the DCM/INNOVA Fund and expectations for growth and levels of fees, the Board determined that the fee arrangements with the Advisor will provide benefits through the expense limitation agreement and that, at the DCM/INNOVA Fund’s current and projected asset levels, the arrangement with the Advisor is fair and reasonable. |
| (v) | The Advisor’s practices regarding brokerage and portfolio transactions. In this regard, the Board considered the historical and anticipated portfolio turnover rates for the DCM/INNOVA Fund. The Board also considered the |
| DCM/INNOVA High Equity Income Innovation Fund |
| Investment Advisory Agreement Approval |
| April 30, 2021 (Unaudited) |
Advisor’s policies and procedures, to seek best execution for the DCM/ INNOVA Fund’s portfolio transactions. The Board considered the process by which evaluations are made of the overall reasonableness of commissions paid; the Advisor’s method and basis for selecting and evaluating broker-dealers used; any anticipated allocation of portfolio business to persons affiliated with the Advisor; and the extent to which the Advisor anticipates allocating portfolio business to broker-dealers who provide research, statistical or other services (“soft dollars”). After further review and discussion, the Board determined that the Advisor’s practices regarding brokerage and portfolio transactions are satisfactory.
| (vi) | Possible conflicts of interest. In evaluating the possibility for conflicts of interest, the Board considered such matters as the experience and abilities of the Advisor’s personnel to be assigned to the DCM/INNOVA Fund; the basis of decisions to buy or sell securities for the DCM/INNOVA Fund and/ or the Advisor’s other accounts; the process for allocating trades amongst the Advisor’s clients; the method for bunching of portfolio securities transactions; and the substance and administration of the Advisor’s code of ethics, specifically as it relates to possible conflicts of interest. Following further consideration and discussion, the Board found for the DCM/INNOVA Fund, that the Advisor’s standards and practices relating to the identification and mitigation of potential conflicts of interests to be satisfactory. |
| (vii) | Other topics or issues. In this regard, the Board considered the Advisor’s compliance policies and procedures. The Board also considered the Advisor’s insurance coverage, risk management program and regulatory history and the Advisor’s discussion of the recent SEC exam. After further review and discussion, the Board indicated its satisfaction with the Advisor’s operations as they related to the DCM/INNOVA Fund. |
Following its consideration of all of the foregoing and taking into account the totality of all factors discussed at this Board Meeting and previous meetings, the Board, including a majority of the Independent Trustees voting separately, unanimously approved the continuance of the Investment Advisory Agreement. No single factor was considered in isolation or to be determinative to the decision of the Trustees to approve the continuance of the Investment Advisory Agreement and each Trustee may have attributed different weights to the various factors noted above. Rather, the Trustees concluded, in light of their weighing and balancing all factors, that approval of the continuance of the Investment Advisory Agreement was in the best interests of the DCM/INNOVA Fund and its shareholders.
| Semi-Annual Report | April 30, 2021 | 53 |
| Lebenthal Ultra Short Tax-Free Income Fund |
| Investment Advisory Agreement Approval |
| April 30, 2021 (Unaudited) |
The Board of Trustees (the “Board”), including the Independent Trustees voting separately, reviewed and approved the Investment Advisory Agreement (the “Investment Advisory Agreement”) between the Lebenthal Ultra Short Tax-Free Income Fund (the “Lebenthal Fund”) and DCM Advisors LLC (the “Advisor”) for an initial 2-year term commencing December 30, 2019. The Board approved the Investment Advisory Agreement at an in-person meeting held on September 9, 2019, and all of the Trustees were present.
Legal counsel advised the Board during its deliberations. Additionally, the Board received and reviewed a substantial amount of information provided by the Advisor in response to requests of the Board and counsel. In deciding whether to approve the Investment Advisory Agreement, the Trustees considered the best interests of the Lebenthal Fund and its shareholders. The Board considered, among other things: (1) the nature, extent and quality of the services to be provided by the Advisor; (2) the investment management capabilities and experience of the Advisor; (3) the performance of the Advisor; (4) the costs of the services to be provided and profits to be realized by the Advisor from its relationship with the Lebenthal Fund; (5) the extent to which economies of scale may be realized as the Lebenthal Fund grows and whether advisory fee levels reflect these economies of scale for the benefit of the Fund’s investors; (6) the Advisor’s practices regarding brokerage and portfolio transactions; (7) possible conflicts of interest; and (8) other topics or issues.
| (i) | The nature, extent, and quality of services to be provided by the Advisor. In this regard, the Board considered the responsibilities the Advisor would have under the proposed Investment Advisory Agreement for the Lebenthal Fund. The Board also considered the proposed services that the Advisor would provide to the Lebenthal Fund including, without limitation, the Advisor’s procedures for formulating investment recommendations and assuring compliance with the Lebenthal Fund’s investment objective and limitations, proposed initial marketing and distribution efforts, and the Advisor’s compliance procedures and practices. The Board also considered the services already provided by the Advisor to the current series of the Trust, as well as services provided in connection with the organization of the Lebenthal Fund. After reviewing the foregoing information and further information provided by the Advisor (e.g., descriptions of the Advisor’s business and the Advisor’s Form ADV), the Board concluded that the quality, extent, and nature of the services to be provided by the Advisor are satisfactory and adequate for the Lebenthal Fund. |
| Lebenthal Ultra Short Tax-Free Income Fund |
| Investment Advisory Agreement Approval |
| April 30, 2021 (Unaudited) |
| (ii) | The investment management capabilities and experience of the Advisor. In this regard, the Board considered the investment management experience of the Advisor. The Board considered its discussion with representatives of the Advisor regarding the investment objective and strategies for the Lebenthal Fund and the Advisor’s experience and plans for implementing such strategies. In particular, the Board reviewed information from the Advisor regarding the proposed portfolio manager’s prior experience in managing portfolios with an investment objective and strategy similar to the Lebenthal Fund. After consideration of these and other factors, as well as the Advisor’s capabilities and experience in managing the current series of the Trust, the Board determined that the Advisor has the requisite knowledge and experience to serve as investment advisor for the Lebenthal Fund. |
| (iii) | The costs of the services to be provided and profits to be realized by the Advisor from its relationship with the Lebenthal Fund. In this regard, the Board considered the Advisor’s methods of operation; the education and experience of the Advisor’s personnel; its compliance program, policies, and procedures; its financial condition and the level of commitment to the Lebenthal Fund; the projected asset levels of the Lebenthal Fund; and the overall expenses of the Lebenthal Fund, including the advisory fee. The Board reviewed the proposed expense limitation agreement and noted the benefit to the Lebenthal Fund from the Advisor’s commitment to reduce its advisory fee or reimburse other operating expenses through December 31, 2021. The Board discussed the Advisor’s financial condition and its ability to satisfy its financial commitments to the Lebenthal Fund. The Board considered the support of the Advisor’s parent company in assuring that the Advisor has adequate capital to meet its obligations. The Board also considered potential benefits for the Advisor in managing the Lebenthal Fund, including promotion of the Advisor’s name. The Board compared the Lebenthal Fund’s proposed advisory fee and overall expense ratio to other comparable funds (in terms of the type of fund, the style of investment management, the projected size of the Lebenthal Fund, and the nature of the investment strategies). The Board noted that the Lebenthal Fund’s advisory fee (0.42%) is higher than the peer group’s average (0.285%), but below the highest advisory fee (0.50%) in the peer group. The Board further noted that the proposed overall annual expense ratio inclusive of the waiver (0.49% for both share classes) for the Lebenthal Fund is below the peer group’s average (0.519%). The Board also considered the investment style |
| Semi-Annual Report | April 30, 2021 | 55 |
| Lebenthal Ultra Short Tax-Free Income Fund |
| Investment Advisory Agreement Approval |
| April 30, 2021 (Unaudited) |
and strategy of the Lebenthal Fund versus its peer group. Upon further consideration and discussion of the foregoing, the Board concluded that the proposed advisory fee and total expense limit for the Lebenthal Fund were within the range of what would have been negotiated at arms-length in light of all the surrounding circumstances and were fair and reasonable.
| (iv) | The extent to which the Lebenthal Fund and its investors would benefit from economies of scale. In this regard, the Board considered the proposed Investment Advisory Agreement and the proposed Expense Limitation Agreement. The Board determined that while the proposed advisory fee was flat and would stay the same as asset levels increased, the shareholders of the Lebenthal Fund would benefit from the expense limitation agreement until the Lebenthal Fund’s assets grew to a level where its expenses otherwise fall below the expense limit. Following further discussion of the Lebenthal Fund’s projected asset levels, expectations for growth, and level of fees, the Board determined that the Lebenthal Fund’s fee arrangements with the Advisor would provide benefits through the proposed Expense Limitation Agreement, and the Board could review the arrangements going forward as necessary. After further discussion, the Board concluded the Lebenthal Fund’s arrangement with the Advisor was fair and reasonable in relation to the nature and quality of services to be provided by the Advisor and would benefit the Lebenthal Fund and its shareholders. |
| (v) | Brokerage and portfolio transactions. The Board considered the Advisor’s policies and procedures as they relate to seeking best execution for its clients. The Board also considered the anticipated portfolio turnover rate for the Lebenthal Fund; the method and basis for selecting and evaluating broker-dealers used to complete the Lebenthal Fund’s portfolio transactions; any anticipated allocation of portfolio business to persons affiliated with the Advisor; and the extent to which the Lebenthal Fund’s trades may be allocated to soft-dollar arrangements. After further review and discussion, the Board determined that the Advisor’s practices regarding brokerage and portfolio transactions for the Lebenthal Fund were satisfactory. |
| (vi) | Possible conflicts of interest. In evaluating the possibility for conflicts of interest, the Board considered such matters as the experience and abilities of the advisory personnel to be assigned to the Lebenthal Fund and the Advisor’s process for allocating trades among the Lebenthal Fund and potential future clients with similar types of investment objectives and strategies. The Board also considered the substance and administration of |
| Lebenthal Ultra Short Tax-Free Income Fund |
| Investment Advisory Agreement Approval |
| April 30, 2021 (Unaudited) |
the Advisor’s Code of Ethics. Following further consideration and discussion, the Board determined that Advisor’s standards and practices relating to the identification and mitigation of potential conflicts of interests for the Lebenthal Fund were satisfactory.
After discussion of the factors noted above and in reliance of the information provided by the Advisor and Trust management and taking into account the totality of all factors discussed and information presented, the Board indicated its desire to approve the investment Advisory Agreement and the Expense Limitation Agreement. It was noted that in the Trustees’ deliberations regarding the approval of the Investment Advisory Agreement, the Trustees did not identify any particular information or factor that was all-important or controlling, and that each individual Trustee may have attributed different weights to the various factors listed above.
| Semi-Annual Report | April 30, 2021 | 57 |
Revised September 2020
| FACTS | WHAT DOES THE CENTAUR MUTUAL FUNDS TRUST DO WITH YOUR PERSONAL INFORMATION? |
| |
| Why? | Financial companies choose how they share your personal information. Federal law gives consumers the right to limit some but not all sharing. Federal law also requires us to tell you how we collect, share, and protect your personal information. Please read this notice carefully to understand what we do. |
| |
| What? | The types of personal information we collect and share depend on the product or service you have with us. This information can include: ● Social Security number and assets ● Account balances and transaction history ● Checking account information and wire transfer instructions When you are no longer our customer, we continue to share your information as described in this notice. |
| |
| How? | All financial companies need to share customers’ personal information to run their everyday business. In the section below, we list the reasons financial companies can share their customers’ personal information; the reasons the Centaur Mutual Funds Trust chooses to share; and whether you can limit this sharing. |
REASONS WE CAN SHARE YOUR PERSONAL
INFORMATION | Does the Centaur
Mutual Funds Trust share? | Can you limit this sharing? |
For our everyday business purposes — such as to process your transactions, maintain your account(s), respond to court orders and legal investigations, or report to credit bureaus | Yes | No |
For our marketing purposes — to offer our products and services to you | No | We do not share. |
| For joint marketing with other financial companies | No | We do not share. |
For our affiliates’ everyday business purposes — information about your transactions and experiences | No | We do not share. |
For our affiliates’ everyday business purposes — information about your creditworthiness | No | We do not share. |
| For nonaffiliates to market to you | No | We do not share. |
| QUESTIONS? | Call 1-888-484-5766 |
| CENTAUR PRIVACY POLICY | Page 2 | |
| WHO WE ARE |
| Who is providing this notice? | The Centaur Mutual Funds Trust
DCM/INNOVA High Equity Income Innovation Fund
Lebenthal Ultra Short Tax-Free Income Fund |
| WHAT WE DO |
How does the Centaur
Mutual Funds Trust
protect my personal
information? | To protect your personal information from unauthorized access and use, we use security measures that comply with federal law. These measures include computer safeguards and secured files and buildings. We require any companies that help provide our services to you to protect the confidentiality of the personal information they receive. |
How does the Centaur
Mutual Funds Trust collect my personal information? | We collect your personal information, for example, when you ● open an account or give us your account information ● make deposits or withdrawals from our account ● pay us by check or make a wire transfer We also collect your personal information from other companies. |
Why can’t I limit all
sharing? | Federal law gives you the right to limit only ● sharing for affiliates’ everyday business purposes – information about your creditworthiness ● affiliates from using your information to market to you ● sharing for nonaffiliates to market to you State laws and individual companies may give you additional rights to limit sharing. |
| |
| DEFINITIONS |
| Affiliates | Companies related by common ownership or control. They can be financial and nonfinancial companies. ● DCM Advisors, LLC, an affiliate of Dinosaur Group Holdings, LLC, is the investment advisor to the Funds and is an affiliate of the Centaur Mutual Funds Trust. |
| Nonaffiliates | Companies not related by common ownership or control. They can be financial and nonfinancial companies. ● The Centaur Mutual Funds Trust does not share information with nonaffiliates so they can market to you. |
| Joint marketing | A formal agreement between nonaffiliated financial companies that together market financial products or services to you. ● The Centaur Mutual Funds Trust does not jointly market. |
| Semi-Annual Report | April 30, 2021 | 59 |
THIS PAGE INTENTIONALLY LEFT BLANK
THIS PAGE INTENTIONALLY LEFT BLANK
| |
| |
| |
| |
| |
| |
| |
| |
| |
| |
| |
| |
| |
| |
| |
| |
| |
| |
| |
| |
| |
| |
| |
| |
| |
| |
| |
| |
| |
| |
| |
| |
| |
| |
| |
| |
| |
| |
| |
| |
| |
| |
| |
| |
| |
| |
| |
| |
| |
| |
| |
| |
| |
| |
| Centaur-SAR-21 |
| |
| |
| The Centaur Mutual Funds Trust is distributed by Ultimus Fund Distributors, LLC. |
Item 2. Code of Ethics. NOT APPLICABLE – disclosed with annual report
Item 3. Audit Committee Financial Expert. NOT APPLICABLE- disclosed with annual report
Item 4. Principle Accountant Fees and Services. NOT APPLICABLE- disclosed with annual report
Item 5. Audit Committee of Listed Companies. NOT APPLICABLE – applies to listed companies only
Item 6. Schedule of Investments. Schedule filed with Item 1.
Item 7. Disclosure of Proxy Voting Policies and Procedures for Closed-End Management Investment Companies. NOT APPLICABLE – applies to closed-end funds only
Item 8. Portfolio Managers of Closed-End Investment Companies. NOT APPLICABLE – applies to closed-end funds only
Item 9. Purchases of Equity Securities by Closed-End Management Investment Company and Affiliated Purchasers. NOT APPLICABLE – applies to closed-end funds only
Item 10. Submission of Matters to a Vote of Security Holders.
NOT APPLICABLE
Item 11. Controls and Procedures.
(a) The registrant’s Principal Executive Officer and Principal Financial Officer have concluded that the registrant's disclosure controls and procedures (as defined in Rule 30a-3(c) under the Act) are effective in design and operation and are sufficient to form the basis of the certifications required by Rule 30a-2 under the Act, based on their evaluation of these disclosure controls and procedures within 90 days of the filing of this report on Form N-CSR.
(b) There were no changes in the registrant’s internal control over financial reporting (as defined in Rule 30a-3(d) under the Act (17 CFR 270.30a-3(d)) that occurred during the period covered by this report that have materially affected or are reasonably likely to materially affect, the registrant’s internal control over financial reporting.
Item 12. Disclosure of Securities Lending Activities for Closed-End Investment Companies.
Not Applicable.
Item 13. Exhibits.
(a)(1) Not Applicable – filed with annual report
(a)(2) Certifications pursuant to Rule 30a-2(a) are attached hereto.
(a)(3) Not applicable.
(b) Certifications pursuant to Rule 30a-2(b) are furnished herewith.
SIGNATURES
Pursuant to the requirements of the Securities Exchange Act of 1934 and the Investment Company Act of 1940, the registrant has duly caused this report to be signed on its behalf by the undersigned, thereunto duly authorized.
(Registrant) Centaur Mutual Funds Trust
| By (Signature and Title)* | /s/ David R. Carson |
| | David R. Carson, Principal Executive Officer |
Pursuant to the requirements of the Securities Exchange Act of 1934 and the Investment Company Act of 1940, this report has been signed below by the following persons on behalf of the registrant and in the capacities and on the dates indicated.
| By (Signature and Title)* | /s/ David R. Carson |
| | David R. Carson, Principal Executive Officer |
| By (Signature and Title)* | /s/ Zachary P. Richmond |
| | Zachary P. Richmond, Treasurer |