UNITED STATES
SECURITIES AND EXCHANGE COMMISSION
Washington, D.C. 20549
FORM N-CSR
CERTIFIED SHAREHOLDER REPORT OF REGISTERED
MANAGEMENT INVESTMENT COMPANIES
Investment Company Act file number : 811-21606
Centaur Mutual Funds Trust
(Exact name of registrant as specified in charter)
1460 Main Street, Suite 324
Southlake, Texas 76092
(Address of principal executive offices) (Zip code)
Simon H. Berry, Esq.
Ultimus Fund Solutions LLC
225 Pictoria Drive, Suite 450
Cincinnati, Ohio 45246
(Name and address of agent for service)
Registrant’s telephone number, including area code: 1-513-587-3400
Date of fiscal year end: October 31
Date of reporting period: April 30, 2018
Form N-CSR is to be used by management investment companies to file reports with the Commission not later than 10 days after the transmission to stockholders of any report that is required to be transmitted to stockholders under Rule 30e-1 under the Investment Company Act of 1940 (17 CFR 270.30e-1). The Commission may use the information provided on Form N-CSR in its regulatory, disclosure review, inspection and policymaking roles.
A registrant is required to disclose the information specified by Form N-CSR, and the Commission will make this information public. A registrant is not required to respond to the collection of information contained in Form N-CSR unless the Form displays a currently valid Office of Management and Budget ("OMB") control number. Please direct comments concerning the accuracy of the information collection burden estimate and any suggestions for reducing the burden to Secretary, Securities and Exchange Commission, 450 Fifth Street, NW, Washington, DC 20549-0609. The OMB has reviewed this collection of information under the clearance requirements of 44 U.S.C. § 3507.
Item 1. Reports to Stockholders.
Centaur Total Return Fund | |
Shareholder Letter | 1 |
Performance Update | 6 |
Schedule of Investments | 7 |
Statement of Assets and Liabilities | 11 |
Statement of Operations | 12 |
Statements of Changes in Net Assets | 13 |
Financial Highlights | 14 |
Notes to Financial Statements | 15 |
Summary of Fund Expenses | 23 |
Additional Information | 24 |
Statements in this Semi-Annual Report that reflect projections or expectations of future financial or economic performance of the Fund and of the market in general and statements of the Fund’s plans and objectives for future operations are forward-looking statements. No assurance can be given that actual results or events will not differ materially from those projected, estimated, assumed or anticipated in any such forward-looking statements. Important factors that could result in such differences, in addition to the other factors noted with such forward-looking statements, include, without limitation, general economic conditions such as inflation, recession and interest rates. Past performance is not a guarantee of future results.
Investment in the Fund is subject to investment risks, including the possible loss of some or all of the principal amount invested. There can be no assurance that the Fund will be successful in meeting its investment objective. Generally, the Fund will be subject to the following additional risks: market risk, management style risk, sector focus risk, foreign securities risk, credit risk, interest rate risk, maturity risk, investment grade securities risk, junk bonds or lower-rated securities risk, derivative instruments risk, valuation risk for non-exchange traded options, risk from writing call options, real estate securities risk, MLP risk, Royalty Trust risk, risks related to other equity securities, and risks related to portfolio turnover. More information about these risks and other risks can be found in the Fund’s prospectus and statement of additional information. When the Fund sells covered call options, the Fund gives up additional appreciation in the stock above the strike price since there is the obligation to sell the stock at the covered call option’s strike price.
The performance information quoted in this Semi-Annual Report represents past performance, which is not a guarantee of future results. Investment return and principal value of an investment will fluctuate so that an investor’s shares, when redeemed, may be worth more or less than their original cost. Current performance may be lower or higher than the performance data quoted. An investor may obtain performance data current to the most recent month-end by visiting www.centaurmutualfunds.com.
The securities held by the Fund that are discussed in the Shareholder Letter were held during the period covered by this Semi-Annual Report. They do not comprise the entire investment portfolio of the Fund, may be sold at any time and may no longer be held by the Fund. For a complete list of securities held by the Fund as of April 30, 2018, please see the Schedule of Investments section of this report. The opinions of the Fund’s advisor with respect to those securities may change at any time.
An investor should consider the investment objectives, risks, and charges and expenses of the Fund carefully before investing. The prospectus contains this and other information about the Fund. A copy of the prospectus is available at www.centaurmutualfunds.com or by calling Shareholder Services at (1-888-484-5766). The prospectus should be read carefully before investing.
Centaur Total Return Fund | Shareholder Letter |
| | April 30, 2018 (Unaudited) |
Dear Centaur Total Return Fund Investors:
The Centaur Total Return Fund (the “Fund) produced a return of 3.75% for the six months ending April 30, 2018. Our primary benchmark, the Dow Jones U.S. Select Dividend Total Return Index, experienced a gain of 3.50% for the same period, while the S&P 500® Total Return Index returned 3.82%. For the one-year period ending April 30, 2018, the Fund returned 12.60% versus the primary benchmark’s return of 9.09% and the S&P 500® Total Return Index return of 13.27%.
For the trailing 5-year period ending April 30, 2018, the Fund has produced an annualized return of 7.50% versus the primary benchmark’s return of 12.01% annualized over the same period. The S&P 500® Total Return Index has returned 12.96% annualized for the five years.
For the trailing 10-year period ending April 30, 2018, the Fund has produced an annualized return of 9.26% versus the primary benchmark’s return of 9.42% annualized over the same period. The S&P 500® Total Return Index has returned 9.02% annualized for the ten years. These comparisons, in addition to the inception-to-date comparative figures, are shown in the table below.
(For the Fund’s most up-to-date performance information, please see our web site at www.centaurmutualfunds.com.)
Performance as of April 30, 2018
Average Annual Total Returns | Past 1 Year | Past 5 Years | Past 10 Years | Since Inception* |
Centaur Total Return Fund | 12.60% | 7.50% | 9.26% | 9.04% |
S&P 500® Total Return Index | 13.27% | 12.96% | 9.02% | 8.54% |
Dow Jones U.S. Select Dividend Total Return Index | 9.09% | 12.01% | 9.42% | 7.98% |
Performance shown is for the period ended April 30, 2018. The performance data quoted above represents past performance, which is not a guarantee of future results. Investment return and principal value of an investment in the Fund will fluctuate so that an investor’s shares, when redeemed, may be worth more or less than their original cost. Current performance may be lower or higher than the performance data quoted. To obtain more current performance data regarding the Fund, including performance data current to the Fund’s most recent month-end, please visit www.centaurmutualfunds.com. The performance data quoted above does not reflect the deduction of the redemption fee and if reflected, the redemption fee would reduce the performance quoted.
The S&P 500® Total Return Index is the Standard & Poor’s composite index of 500 stocks a widely recognized index of common stock prices.
The Dow Jones U.S. Select Dividend Total Return Index is an index of 100 dividend-paying stocks selected according to a methodology developed and administered by Dow Jones & Co. It is not possible to invest in indices (like the S&P 500® Total Return Index and the U.S. Select Dividend Total Return Index) that are unmanaged and do not incur fees and charges.
* | The Fund’s inception date is March 16, 2005. |
Total Annual Operating Expenses
| Net Expense
Ratio** | Gross Expense
Ratio*** |
Centaur Total Return Fund | 2.10% | 2.70% |
** | The net expense ratio reflects a contractual expense limitation that continues through February 28, 2019. Thereafter, the expense limitation may be changed or terminated at any time. Performance would have been lower without this expense limitation. The Net Expense Ratio above does not correlate to the ratio of total expenses provided in the Financial Highlights table of the Fund’s Semi Annual Report for the period ended April 30, 2018, as the Financial Highlights table does not include Acquired Fund Fees and Expenses. |
*** | Gross expense ratio is from the Fund’s prospectus dated February 28, 2018. |
| | |
Semi-Annual Report | April 30, 2018 | 1 |
Centaur Total Return Fund | Shareholder Letter |
| | April 30, 2018 (Unaudited) |
In previous letters we have provided a performance table for your consideration that shows calendar year performance rather than the more conventional mutual fund performance tables. Mutual fund performance is usually presented on a trailing basis (for example, 1 year, 3 years, 5 years, etc) as compared to a benchmark index, and this presentation for our Fund appears above. Below is a slightly different presentation of the Fund’s performance by calendar year with comparisons to the S&P 500® Total Return Index (under the column “S&P500”) and to our primary benchmark, the Dow Jones U.S. Select Dividend Total Return Index (under the column “DJ US DIV”). Please note that the figures for 2005 represent the performance from the Fund’s launch date in March through year-end; the 2018 figures represent the performance for the first four calendar months of 2018 through April 30, 2018.
CALENDAR YEAR RETURNS VERSUS BENCHMARKS 2005-2018
YEAR | TILDX | S&P500 | DJ US DIV |
2005* | 9.24% | 7.21% | 5.38% |
2006 | 15.75% | 15.79% | 19.54% |
2007 | -0.63% | 5.49% | - 5.16% |
2008 | -20.55% | -37.00% | -30.97% |
2009 | 43.98% | 26.46% | 11.13% |
2010 | 20.64% | 15.06% | 18.32% |
2011 | -2.33% | 2.11% | 12.42% |
2012 | 17.94% | 16.00% | 10.84% |
2013 | 16.78% | 32.39% | 29.06% |
2014 | 7.20% | 13.69% | 15.36% |
2015 | -4.65% | 1.38% | -1.64% |
2016 | 11.34% | 11.96% | 21.98% |
2017 | 13.52% | 21.83% | 15.44% |
2018** | 2.71% | -0.38% | -1.32% |
INCEPTION | 211.42% | 193.17% | 173.79% |
* | 2005 return is from the Fund’s launch on March 16, 2005 through December 31, 2005. |
** | 2018 return is for the YTD period through April 30. |
Portfolio Update
As of April 30, 2018, the Centaur Total Return Fund was approximately 53% invested in equities (common stock) and closed-end funds spread across 17 holdings. The Fund owned warrants, comprising approximately 0.7% of Fund assets and also owned options on various securities that comprised approximately 2.3% of Fund assets, partially offset by covered call liabilities that comprised less than 0.2% of the Fund’s assets. Cash and money market funds represented approximately 41% of the Fund’s assets. The top ten investments represented approximately 43% of Fund assets.
| | |
2 | www.centaurmutualfunds.com |
Centaur Total Return Fund | Shareholder Letter |
| | April 30, 2018 (Unaudited) |
As of April 30, 2018, our top 10 positions were as follows:
Position | % of Fund Assets |
Berkshire Hathaway, Inc., Class B | 6.60% |
Facebook, Inc., Class A | 5.51% |
Alphabet, Inc., Class C | 5.50% |
Brown & Brown, Inc. | 5.18% |
Fairfax Financial Holdings Ltd. | 4.67% |
AerCap Holdings N.V. | 4.18% |
Alleghany Corporation | 3.22% |
Interactive Brokers Group, Inc., Class A | 2.97% |
McKesson Corporation | 2.66% |
Boulder Growth & Income Fund, Inc. | 2.58% |
TOTAL | 43.07% |
Please refer to the Schedule of Investments section of the Semi Annual Report for a complete listing of the Fund holdings and the amount each represents of the portfolio. Holdings are subject to change without notice.
Semi Annual 2018 Fund Update
For the Fund’s six month period running from October 31, 2017, to April 30, 2018, the Fund generated a return of 3.75%, which was a bit better than the Fund’s primary benchmark and captured ~98% of the S&P 500® return despite a very substantial cash position that averaged approximately 50% of Fund assets during the period.
The six months ending April 30th started with the broad U.S. stock market pushing higher through the months of November, December, and January. The Fund began the period with an unusually heavy cash position (roughly 58%) due to valuation concerns, and as a result the Fund trailed the benchmark indices during these initial three months of strong market performance. Volatility then briefly returned to the stock market in February after a nearly two-year absence. After not having a sell-off of greater than 3% in 2017, the S&P 500® index suddenly dropped by roughly 10% over the course of five trading days in early February. This sell-off pushed all the major indices into the red for the year by February 7th before a late-month recovery pushed returns back into the positive by February month-end.
The market story of early February was the sudden and spectacular collapse of several volatility-linked exchange-traded funds and notes designed to allow investors to generate income by selling volatility, which has been a one-way money maker for several years. Unfortunately, many of these vehicles were designed to go to zero if volatility spiked sufficiently in a brief enough period of time.
In our view, these were strategies created to enable investors to play their hands at picking up dollars in front of a steam roller. After many years of effortlessly gathering up the dollar bills, investors eventually forgot that the steamroller even existed. Inevitably, the steam roller finally had its day. The market remained choppy through the end of March in the wake of the widely reported (and subsequently highly politicized) Facebook data scandal before recovering to end the reporting period with a stronger April as stocks rebounded and the Facebook news began to recede from the headlines.
For us, the heightened volatility and temporarily lower stock prices represented a window of opportunity to deploy capital, such that by the end of April the cash position of the Fund declined to 44% and market exposure (after adjusting the leverage of the Fund’s option positions) rose to just over 70%. While we were pleased to be able to find some actionable ideas during the market decline, the sell-off was relatively brief and fairly uniform across most of the securities we own or follow. In our view, stocks selling for a 10% discount to recently reached all-time high price levels are not obviously bargains, so to some extent our buying was more an act of buying into fear rather than buying purely on the valuation merits. Nonetheless, we are satisfied that we added to either the best values we could find or to the positions in which we have reasonably high conviction on a value/safety basis.
| | |
Semi-Annual Report | April 30, 2018 | 3 |
Centaur Total Return Fund | Shareholder Letter |
| | April 30, 2018 (Unaudited) |
Three Recent Purchases
I’d like to highlight some of our recent buying activity from the February to April time period to provide some flavor on what we have been seeing and doing. Obviously, one of the major themes during the spring was the Facebook data and privacy scandal referred to in the commentary above. This was, in our view, one of those classic “conviction checks” where an investor must determine relatively quickly whether the new information represents opportunity or whether it represents unacceptable danger and respond accordingly. In such scandals, the news often seems very bad in the short term and creates a strong negative media and market reaction. After assessing the information available and its likely near and longer-term impact to the company, we took the position that the Facebook scandal would be unlikely to be terribly damaging to the company in the longer term despite the intense media and political scrutiny. We obviously must acknowledge our limitations at making predictions of this kind, but our view was ultimately that the scandal was an opportunity to add to our existing Facebook investment at attractive prices. As sort of a tertiary decision, we also added to the Fund’s existing position in Alphabet, as that stock also declined under the weight of the media scrutiny.
Our general view remains that both Facebook and Alphabet are extremely well-positioned businesses and, after working hard to better understand them, we think are probably much cheaper on a valuation basis than one might expect given the ever-present FAANG narrative. Of course there are risks associated with owning these businesses, but we felt that the prices prevailing in late February and early March effectively discounted the risks to an acceptable degree.
Another example of our buying activity was our decision to purchase shares of Fairfax Financial Holdings during early 2018. Fairfax is a business that we’ve long admired and one that has been a successful investment for the Fund in the past. It’s been nearly eight years since the Fund last owned shares, but we have continued to monitor the business and the share price in the interim. In early 2018, we concluded that the stock price, business value, and future prospects for Fairfax finally aligned in a way that we could get excited about.
Our decision to buy Fairfax wasn’t predicated entirely on the valuation; the stock has been cheaper on various metrics at times over the past several years. Rather, our decision to invest was due to our belief that Fairfax’s business outlook is better than it has been for many years, and the company is also much more strongly positioned to pursue the opportunities available to it than it has been in recent years.
Finally, we purchased shares of Sony Corporation during the period, and have added to the investment subsequent to April 30th such that as of this writing Sony is a meaningful investment for the Fund. Sony has enjoyed a long and impressive business history, but the business had gradually lost momentum and relevance, particularly during the decade prior to 2012. However, in recent years Sony has mounted an impressive comeback driven by new management that has, in our view, done an effective job of re-focusing the sprawling conglomerate to emphasize those areas where it has the strongest advantages. Today, Sony’s major business units seem to be well-positioned in some of the more attractive growth markets we can identify. Sony is one of three companies (and the leader) in video gaming hardware and the surrounding ecosystem with its PlayStation business. Sony Music is one of three major players in a space that is benefitting dramatically from the digital migration of music, and Sony is also one of the top players in movies and TV production, where it has been showing strong improvement. There are a lot of other assets in place at Sony (too many to describe briefly), but suffice it to say that after doing our research, we came to the conclusion that Sony offers considerable value for a reasonable price. Based on our valuation efforts we think the stock is priced at roughly 10-11X the annualized average free cash flow generated by the core non-financial businesses. We think this valuation leaves plenty of opportunity for favorable returns if Sony continues to execute, and we also see potential for Sony to enact various corporate actions to better showcase the value of some of its unique assets over time, which could take the form of a spin-off or the sale of one or more of Sony’s business units.
Final Thoughts
The recent volatility ETF blow-up represents an interesting case study in the perils of price-insensitive investor behavior.
Effectively, there were large numbers of investors selling volatility insurance at incredibly cheap prices at a time when volatility was the lowest in recorded history. But it was a trade that had worked beautifully, minting seemingly reliable and consistent income for many years – until suddenly it didn’t. One wonders how many of these investors were aware of the risks they were taking, or carefully thinking about whether they were getting adequately paid to take those risks.
Given the many trends that have driven asset flows towards price and risk agnostic investing and away from absolute return and risk conscious strategies, I am concerned that new risks are being introduced to the investing landscape that will ultimately become very difficult for investors to evaluate and mitigate. I think the industrialization of investment portfolios and the concentration of market
| | |
4 | www.centaurmutualfunds.com |
Centaur Total Return Fund | Shareholder Letter |
| | April 30, 2018 (Unaudited) |
exposure into fewer but much larger pools of capital that use the same or similar approaches has reduced the diversity of actionable opinion in the market. I think it is easy to be fooled by the notion that the explosion of different vehicles for investing means that there are lots of places to find non-correlated market exposure. The array of market opinion may be as wide as it has ever been, but the dollar buying power of that diversity of opinion is probably as narrow as it has ever been. It seems to me that there will likely be very little buying power available to step in to the market and arrest a significant market decline at reasonable levels if the big pools of commoditized market exposure all act to sell the same securities at the same time. In addition to the need to consider the standard valuation risks that come with the territory of investing in what is likely the most expensive stock market in history, I believe an investor today must also consider the more opaque risks related to the changing structure of the market. The implosion of the short volatility ETFs could be a canary in the coal mine.
If value investing is about ensuring as high a chance of a reasonable return as possible on deployed capital while still maintaining a margin of safety against potentially significant capital losses, it’s probably harder to walk that thin line today than it has ever been.
The Fund’s current positioning seems to us like a reasonable compromise in keeping that line somewhere in sight. We would expect the Fund’s portfolio to capture an acceptable portion of available gains in the scenario of further market strength while giving us substantial buying power in the case of a declining market and to respond to opportunities as we identify them.
As always, we appreciate your continued confidence in us and in the Fund.
Respectfully submitted,

Zeke Ashton
Portfolio Manager, Centaur Total Return Fund
| | |
Semi-Annual Report | April 30, 2018 | 5 |
Centaur Total Return Fund | Performance Update |
| | April 30, 2018 (Unaudited) |
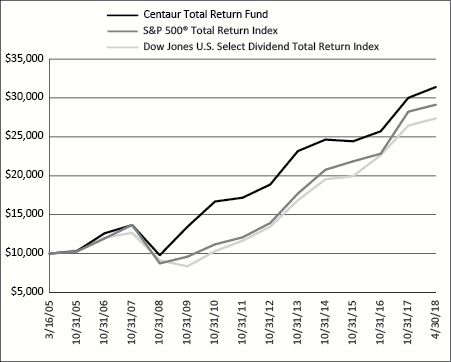
Growth of $10,000 Investment (Unaudited)
For the period from March 16, 2005 to April 30, 2018:
Performance Returns for the period ended April 30, 2018
Average Annual
Total Returns | One
Year | Five
Year | Ten
Year | Since
Inception* | Gross Expense
Ratio** |
Centaur Total Return Fund | 12.60% | 7.50% | 9.26% | 9.04% | 2.70% |
Cumulative Total Investment Returns | Since
Inception* | Final Value of
$10,000
Investment |
Centaur Total Return Fund | 211.42% | $31,142 |
S&P 500® Total Return Index | 193.17% | $29,317 |
Dow Jones U.S. Select Dividend Total Return Index | 173.79% | $27,379 |
This graph assumes an initial $10,000 investment at March 6, 2005, the inception date of The Centaur Total Return Fund (the “Fund”). All dividends and distributions are reinvested, if any. This graph depicts the performance of the Fund versus the S&P 500 Total Return Index and the Dow Jones U.S. Select Dividend Total Return Index. It is important to note the Fund is a professionally managed mutual fund while the indices are not available for investment and are unmanaged. The comparison is shown for illustrative purposes only.
* | The Fund’s inception date – March 16, 2005 (Date of Initial Public Investment). |
** | The gross expense ratio shown is from the Fund’s prospectus dated February 28, 2018. This number may vary from the expense ratio shown elsewhere in this report because it is based on a different time period and does not include Acquired Fund Fees and expenses or expense waivers. |
Performance quoted above represents past performance, which is no guarantee of future results. Investment return and principal value will fluctuate so that shares, when redeemed, may be worth more or less than their original cost. Current performance may be lower or higher than the performance data quoted. An investor may obtain performance data, current to the most recent month-end, by visiting www.centaurmutualfunds.com.
The graph and table do not reflect the deduction of taxes that a shareholder would pay on Fund distributions or the redemption of Fund shares. Average annual total returns are historical in nature and measure net investment income and capital gain or loss from portfolio investments assuming reinvestments of dividends, if any.
| | |
6 | www.centaurmutualfunds.com |
Centaur Total Return Fund | Schedule of Investments |
| | April 30, 2018 (Unaudited) |
| | | Shares | | | Fair
Value | |
| COMMON STOCKS — 48.02% | | | | | | |
| | | | | | | |
| Consumer Discretionary — 3.28% | | | | | | |
PICO Holdings, Inc. (a) | | | 30,000 | | | $ | 361,500 | |
| Sony Corporation ADR | | | 10,000 | | | | 458,300 | |
| | | | | | | | 819,800 | |
| Financials — 24.36% | | | | | | | | |
Alleghany Corporation (a) | | | 1,400 | | | | 804,538 | |
Berkshire Hathaway, Inc., Class B (a) | | | 8,500 | | | | 1,646,705 | |
| Brown & Brown, Inc. | | | 47,500 | | | | 1,293,424 | |
| E-L Financial Corporation Ltd. | | | 600 | | | | 374,339 | |
| Fairfax Financial Holdings Ltd. | | | 2,100 | | | | 1,166,088 | |
Hallmark Financial Services, Inc. (a) | | | 5,000 | | | | 51,350 | |
Interactive Brokers Group, Inc., Class A (b) | | | 10,000 | | | | 742,000 | |
| | | | | | | | 6,078,444 | |
| Health Care — 5.18% | | | | | | | | |
| Haw Par Corporation Ltd. | | | 60,000 | | | | 630,302 | |
| McKesson Corporation | | | 4,250 | | | | 663,893 | |
| | | | | | | | 1,294,195 | |
| Industrials — 4.18% | | | | | | | | |
AerCap Holdings N.V. (a) | | | 20,000 | | | | 1,042,600 | |
| | | | | | | | | |
| Information Technology — 11.02% | | | | | | | | |
Alphabet, Inc., Class C (a) | | | 1,350 | | | | 1,373,396 | |
Facebook, Inc., Class A (a) | | | 8,000 | | | | 1,376,000 | |
| | | | | | | | 2,749,396 | |
| | | | | | | | | |
| Total Common Stocks (Cost $10,210,989) | | | | | | | 11,984,435 | |
| | | | | | | | | |
| CLOSED-END FUNDS — 5.01% | | | | | | | | |
| | | | | | | | | |
| Adams Diversified Equity Fund, Inc. | | | 20,000 | | | | 297,600 | |
| Boulder Growth & Income Fund, Inc. | | | 60,000 | | | | 643,800 | |
| Central Securities Corporation | | | 11,500 | | | | 310,040 | |
| | | | | | | | | |
| Total Closed-End Funds Cost ($1,087,468) | | | | | | | 1,251,440 | |
See Notes to Financial Statements | |
Semi-Annual Report | April 30, 2018 | 7 |
Centaur Total Return Fund | Schedule of Investments |
| | April 30, 2018 (Unaudited) |
| | | Shares | | | Fair
Value | |
| WARRANTS — 0.69% | | | | | | |
| American International Group, Inc., Strike Price $45, Expires 1/19/2021 | | | 10,000 | | | $ | 173,100 | |
| Total Warrants Cost ($167,614) | | | | | | | 173,100 | |
| Description | | Number of Contracts | | | Notional Amount | | | Exercise
Price | | | Expiration
Date | | Fair
Value | |
| PUT OPTIONS PURCHASED — 0.22% | | | | | | | | | | | | | | |
| | | | | | | | | | | | | | | |
| iShares International Treasury Bond ETF | | | 150 | | | $ | 230,700 | | | $ | 51.00 | | | July 2018 | | $ | 20,250 | |
| SPDR S&P 500 ETF Trust | | | 100 | | | | 2,645,100 | | | | 265.00 | | | May 2018 | | | 33,800 | |
| | | | | | | | | | | | | | | | | | | |
| Total Put Options Purchased (Cost $41,595) | | | | | | | | | | | | | | | | | 54,050 | |
| | | | | | | | | | | | | | | | | | | |
| CALL OPTIONS PURCHASED — 2.03% | | | | | | | | | | | | | | | | | | |
| | | | | | | | | | | | | | | | | | | |
| AerCap Holdings NV | | | 200 | | | | 1,042,600 | | | | 50.00 | | | July 2018 | | | 69,000 | |
| Brown & Brown, Inc. | | | 480 | | | | 1,307,040 | | | | 25.00 | | | June 2018 | | | 124,800 | |
| Cisco Systems Inc. | | | 240 | | | | 1,602,960 | | | | 40.00 | | | May 2018 | | | 112,800 | |
| Cisco Systems, Inc. | | | 50 | | | | 221,450 | | | | 40.00 | | | June 2018 | | | 24,700 | |
| Franklin Covey Co. | | | 130 | | | | 317,200 | | | | 25.00 | | | July 2018 | | | 19,825 | |
| GoDaddy, Inc. | | | 70 | | | | 451,920 | | | | 65.00 | | | May 2018 | | | 16,800 | |
| iShares Silver Trust | | | 300 | | | | 461,400 | | | | 14.50 | | | June 2018 | | | 31,200 | |
| PowerShares DB Agriculture ETF | | | 200 | | | | 385,000 | | | | 20.00 | | | July 2018 | | | 5,000 | |
| PowerShares DB Agriculture ETF | | | 150 | | | | 288,750 | | | | 18.00 | | | January 2019 | | | 30,750 | |
| Sony Corp. | | | 100 | | | | 458,300 | | | | 45.00 | | | May 2018 | | | 15,750 | |
| Sony Corp. | | | 75 | | | | 343,725 | | | | 50.00 | | | May 2018 | | | 525 | |
| SPDR S&P 500 ETF Trust | | | 25 | | | | 661,275 | | | | 265.00 | | | May 2018 | | | 7,950 | |
| Verisign, Inc. | | | 45 | | | | 528,390 | | | | 110.00 | | | June 2018 | | | 48,150 | |
| | | | | | | | | | | | | | | | | | | |
| Total Call Options Purchased (Cost $506,649) | | | | | | | | | | | | | | | | | 507,250 | |
See Notes to Financial Statements | |
8 | www.centaurmutualfunds.com |
Centaur Total Return Fund | Schedule of Investments |
| | April 30, 2018 (Unaudited) |
| | | Shares | | | Fair
Value | |
| MONEY MARKET FUNDS — 41.49% | | | | | | |
Fidelity Investments Money Market Government Portfolio, Class I, 1.58%(c) | | | 10,358,323 | | | $ | 10,358,323 | |
| Total Money Market Funds (Cost $10,358,323) | | | | | | | 10,358,323 | |
| Total Investments — 97.46% (Cost $22,372,638) | | | | | | | 24,328,598 | |
| Other Assets in Excess of Liabilities — 2.54% | | | | | | | 635,003 | |
| NET ASSETS — 100.00% | | | | | | $ | 24,963,601 | |
(a) | Non-income producing security. |
(b) | All or a portion of the security is held as collateral for written options. |
(c) | Rate disclosed is the seven day effective yield as of April 30, 2018. |
ADR — American Depositary Receipt
ETF — Exchange-Traded Fund
SPDR — Standard & Poor’s Depositary Receipt
The sectors shown on the schedule of investments are based on the Global Industry Classification Standard, or GICS® (“GICS”). The GICS was developed by and/or is the exclusive property of MSCI, Inc. and Standard & Poor’s Financial Services LLC (“S&P”). GICS is a service mark of MSCI, Inc. and S&P and has been licensed for use by Ultimus Fund Solutions, LLC.
| Description | | Number of Contracts | | | Notional Amount | | | Exercise
Price | | | Expiration
Date | | Fair
Value | |
| Written Call Options | | | | | | | | | | | | | | |
| | | | | | | | | | | | | | | |
| Interactive Brokers Group, Inc. | | | 30 | | | $ | 222,600 | | | $ | 75.00 | | | September 2018 | | $ | (15,900 | ) |
| Interactive Brokers Group, Inc. | | | 30 | | | | 222,600 | | | | 70.00 | | | September 2018 | | | (25,200 | ) |
| | | | | | | | | | | | | | | | | | | |
| Total Written Call Options (Premiums Received $42,560) | | | | | | | | | | | | | | | | $ | (41,100 | ) |
See Notes to Financial Statements | |
Semi-Annual Report | April 30, 2018 | 9 |
Centaur Total Return Fund | Schedule of Investments |
| | April 30, 2018 (Unaudited) |
| Summary of Investments | | % of Net Assets | | | Value | |
| Common Stocks | | | | | | |
| Consumer Discretionary | | | 3.28 | % | | $ | 819,800 | |
| Financials | | | 24.36 | % | | | 6,078,444 | |
| Health Care | | | 5.18 | % | | | 1,294,195 | |
| Industrials | | | 4.18 | % | | | 1,042,600 | |
| Information Technology | | | 11.02 | % | | | 2,749,396 | |
| Closed-End Funds | | | 5.01 | % | | | 1,251,440 | |
| Equity Options | | | | | | | | |
| Call Options Purchased | | | 2.03 | % | | | 507,250 | |
| Put Options Purchased | | | 0.22 | % | | | 54,050 | |
| Warrants | | | 0.69 | % | | | 173,100 | |
| Money Market Funds | | | 41.49 | % | | | 10,358,323 | |
| Other Assets in Excess of Liabilities | | | 2.54 | % | | | 635,003 | |
| Total | | | 100.00 | % | | $ | 24,963,601 | |
See Notes to Financial Statements | |
10 | www.centaurmutualfunds.com |
Centaur Total Return Fund | Statement of Assets and Liabilities |
| | April 30, 2018 (Unaudited) |
| Assets | | | |
| Investments in securities at fair value (cost $22,372,638) | | $ | 24,328,598 | |
| Deposit held by broker for options | | | 451,332 | |
| Receivable for fund shares sold | | | 453 | |
| Receivable for investments sold | | | 221,779 | |
| Dividends receivable | | | 13,661 | |
| Prepaid expenses | | | 31,646 | |
| Total Assets | | | 25,047,469 | |
| | | | | |
| Liabilities | | | | |
| Options written, at value (premium received $42,560) | | | 41,100 | |
| Payable for fund shares redeemed | | | 152 | |
| Payable to Adviser | | | 17,982 | |
| Payable to Administrator | | | 9,554 | |
| Other accrued expenses | | | 15,080 | |
| Total Liabilities | | | 83,868 | |
| Net Assets | | $ | 24,963,601 | |
| | | | | |
| Net Assets consist of: | | | | |
| Paid-in capital | | | 22,005,859 | |
| Accumulated net investment loss | | | (187,286 | ) |
| Accumulated undistributed net realized gain on investments, written options and foreign currency transactions | | | 1,187,608 | |
| Net unrealized appreciation on: | | | | |
| Investment securities | | | 1,955,960 | |
| Written options contracts | | | 1,460 | |
| Net Assets | | $ | 24,963,601 | |
| Shares outstanding (unlimited number of shares authorized, no par value) | | | 1,881,916 | |
| Net Asset Value, Offering and Redemption Price Per Share | | $ | 13.26 | |
See Notes to Financial Statements | |
Semi-Annual Report | April 30, 2018 | 11 |
Centaur Total Return Fund | Statement of Operations |
| | For the six months ended April 30, 2018 (Unaudited) |
| Investment Income | | | |
| Dividend income (net of foreign taxes withheld of $675) | | $ | 122,538 | |
| Total Investment Income | | | 122,538 | |
| | | | | |
| Expenses | | | | |
| Investment Adviser | | | 189,082 | |
| Fund accounting | | | 26,056 | |
| Administration | | | 24,795 | |
| Registration | | | 16,322 | |
| Legal | | | 13,223 | |
| Insurance | | | 9,484 | |
| Transfer agent | | | 8,926 | |
| Audit and tax | | | 7,785 | |
| Report printing | | | 5,661 | |
| Custodian | | | 5,392 | |
| Trustee | | | 3,968 | |
| Pricing | | | 310 | |
| Miscellaneous | | | 9,933 | |
| Total Expenses | | | 320,937 | |
| Fees waived by Adviser | | | (76,504 | ) |
| Net Operating Expenses | | | 244,433 | |
| Net Investment Loss | | | (121,895 | ) |
| | | | | |
| Net Realized and Change in Unrealized Gain (Loss) on Investments | | | | |
| Net realized gain on investment securities transactions and foreign currency transactions | | | 1,678,121 | |
| Net realized loss on written option transactions | | | (485,240 | ) |
| Net change in unrealized depreciation of investment securities and foreign currency translations | | | (190,381 | ) |
| Net change in unrealized appreciation of written options contracts | | | 69,657 | |
| Net Realized and Change in Unrealized Gain on Investments | | | 1,072,157 | |
| Net Increase in Net Assets Resulting From Operations | | $ | 950,262 | |
See Notes to Financial Statements | |
12 | www.centaurmutualfunds.com |
Centaur Total Return Fund | Statements of Changes in Net Assets |
| | |
| | | For the
Six Months
Ended
April 30, 2018
(Unaudited) | | | For the
Year Ended
October 31, 2017 | |
| Increase (Decrease) in Net Assets due to: | | | | | | |
| Operations | | | | | | |
| Net investment loss | | $ | (121,895 | ) | | $ | (308,734 | ) |
| Net realized gain on investment securities transactions and foreign currency transactions | | | 1,192,881 | | | | 2,893,662 | |
| Net change in unrealized appreciation (depreciation) of investment securities | | | (120,724 | ) | | | 1,423,107 | |
| Net Increase in Net Assets Resulting From Operations | | | 950,262 | | | | 4,008,035 | |
| | | | | | | | | |
| Distributions From | | | | | | | | |
| Net realized gains | | | (2,637,932 | ) | | | (1,266,793 | ) |
| Total Distributions | | | (2,637,932 | ) | | | (1,266,793 | ) |
| | | | | | | | | |
| Capital Transactions | | | | | | | | |
| Proceeds from shares sold | | | 1,110,906 | | | | 1,790,988 | |
| Reinvestment of distributions | | | 2,559,454 | | | | 1,204,762 | |
| Amount paid for shares redeemed | | | (2,710,659 | ) | | | (5,968,227 | ) |
| Net Increase (Decrease) in Net Assets Resulting From Capital Transactions | | | 959,701 | | | | (2,972,477 | ) |
| Total Decrease in Net Assets | | | (727,969 | ) | | | (231,235 | ) |
| | | | | | | | | |
| Net Assets | | | | | | | | |
| Beginning of period | | | 25,691,570 | | | | 25,922,805 | |
| End of period | | $ | 24,963,601 | | | $ | 25,691,570 | |
| | | | | | | | | |
| Accumulated net investment loss | | $ | (187,286 | ) | | $ | (65,391 | ) |
| | | | | | | | | |
| Share Transactions | | | | | | | | |
| Shares sold | | | 84,427 | | | | 134,361 | |
| Shares issued in reinvestment of distributions | | | 198,407 | | | | 94,122 | |
| Shares redeemed | | | (203,981 | ) | | | (449,182 | ) |
| Net Increase (Decrease) in Shares Outstanding | | | 78,853 | | | | (220,699 | ) |
See Notes to Financial Statements | |
Semi-Annual Report | April 30, 2018 | 13 |
Centaur Total Return Fund | Financial Highlights |
| | For a share outstanding during each of the periods presented. |
| | | For the
Six Months
Ended
April 30,
2018
(Unaudited) | | | For the
Year Ended
October 31,
2017 | | | For the
Year Ended
October 31,
2016 | | | For the
Year Ended
October 31,
2015 | | | For the
Year Ended
October 31,
2014 | | | For the
Year Ended
October 31,
2013 | |
| Net Asset Value, Beginning of Period | | $ | 14.25 | | | $ | 12.81 | | | $ | 12.83 | | | $ | 13.97 | | | $ | 15.97 | | | $ | 14.06 | |
| | | | | | | | | | | | | | | | | | | | | | | | | |
| Income from investment operations: | | | | | | | | | | | | | | | | | | | | | | | | |
| Net investment income (loss) | | | (0.06 | ) | | | (0.17 | ) | | | (0.12 | ) | | | (0.17 | ) | | | (0.12 | ) | | | (0.12 | ) |
| Net realized and unrealized gain on investments | | | 0.56 | | | | 2.24 | | | | 0.75 | | | | 0.05 | | | | 0.90 | | | | 3.12 | |
| Total from Investment Operations | | | 0.50 | | | | 2.07 | | | | 0.63 | | | | (0.12 | ) | | | 0.78 | | | | 3.00 | |
| | | | | | | | | | | | | | | | | | | | | | | | | |
| Less Distributions: | | | | | | | | | | | | | | | | | | | | | | | | |
| Net investment income | | | — | | | | — | | | | — | | | | — | | | | (0.02 | ) | | | (0.22 | ) |
| Net realized gains on investments | | | (1.49 | ) | | | (0.63 | ) | | | (0.65 | ) | | | (1.03 | ) | | | (2.78 | ) | | | (0.88 | ) |
| Total distributions | | | (1.49 | ) | | | (0.63 | ) | | | (0.65 | ) | | | (1.03 | ) | | | (2.80 | ) | | | (1.10 | ) |
| | | | | | | | | | | | | | | | | | | | | | | | | |
| Paid in Capital: | | | | | | | | | | | | | | | | | | | | | | | | |
| Paid in capital from redemption fees | | | — | | | | — | | | | — | * | | | 0.01 | | | | 0.02 | | | | 0.01 | |
| | | | | | | | | | | | | | | | | | | | | | | | | |
| Net Asset Value, End of Period | | $ | 13.26 | | | $ | 14.25 | | | $ | 12.81 | | | $ | 12.83 | | | $ | 13.97 | | | $ | 15.97 | |
| | | | | | | | | | | | | | | | | | | | | | | | | |
Total Return (a) | | | 3.75 | %(b) | | | 16.73 | % | | | 5.25 | % | | | (0.87 | )% | | | 6.38 | % | | | 22.74 | % |
| | | | | | | | | | | | | | | | | | | | | | | | | |
| Net Assets, End of Period (in thousands) | | $ | 24,964 | | | $ | 25,692 | | | $ | 25,923 | | | $ | 30,375 | | | $ | 45,186 | | | $ | 65,469 | |
| | | | | | | | | | | | | | | | | | | | | | | | | |
| Ratio of Gross Expenses to Average Net Assets | | | 2.55 | %(c) | | | 2.55 | % | | | 2.81 | % | | | 2.44 | % | | | 2.21 | % | | | 2.15 | % |
| Ratio of Net Expenses to Average Net Assets | | | 1.95 | %(c) | | | 1.95 | % | | | 1.95 | % | | | 1.95 | % | | | 1.95 | % | | | 1.95 | % |
Ratio of Net Investment Income (Loss) to
Average Net Assets | | | (0.97 | )%(c) | | | (1.19 | )% | | | (0.89 | )% | | | (0.94 | )% | | | (0.63 | )% | | | (0.78 | )% |
| | | | | | | | | | | | | | | | | | | | | | | | | |
| Portfolio Turnover Rate | | | 69 | %(b) | | | 126 | % | | | 127 | % | | | 112 | % | | | 135 | % | | | 170 | % |
(a) | Total return in the above table represents the rate that the investor would have earned or lost on an investment in the Fund, assuming reinvestment of dividends |
* | Amount less than $0.005 per share. |
See Notes to Financial Statements | |
14 | www.centaurmutualfunds.com |
Centaur Total Return Fund | Notes to Financial Statements |
| | April 30, 2018 (Unaudited) |
1. ORGANIZATION
The Centaur Total Return Fund (the “Fund”), is an investment portfolio of The Centaur Mutual Funds Trust (the “Trust”), which is organized as a Delaware statutory trust and is registered under the Investment Company Act of 1940 (the “1940 Act”), as amended, as an open-ended management investment company. The Fund is classified as diversified as defined in the 1940 Act.
The Fund commenced operations on March 16, 2005. The investment objective of the Fund is to seek maximum total return through a combination of capital appreciation and current income. The Fund invests in equity securities of companies that Centaur Capital Partners, L.P. (the “Adviser”) believes are undervalued in the securities markets, but which also offer high dividend yields relative to the yield of the broad market averages.
2. SIGNIFICANT ACCOUNTING POLICIES
The following is a summary of significant accounting policies consistently followed by the Fund. The policies are in conformity with accounting principles generally accepted in the United States of America (“GAAP”). The Fund is considered an investment company for financial reporting purposes under GAAP.
Estimates
The preparation of financial statements in conformity with GAAP requires management to make estimates and assumptions that affect the reported amounts of assets and liabilities and disclosure of contingent assets and liabilities at the date of the financial statements and the reported amounts of increases and decreases in the net assets from operations during the reported period. Actual results could differ from those estimates.
Investment Valuation
The Fund’s investments in securities are carried at fair value. Securities listed on an exchange or quoted on a national market system are valued at the last sales price as of 4:00 p.m. Eastern Time. Securities traded in the NASDAQ over-the-counter market are generally valued at the NASDAQ Official Closing Price. Other securities traded in the over-the-counter market and listed securities for which no sale was reported on that date are valued at the most recent bid price. Securities and assets for which representative market quotations are not readily available or which cannot be accurately valued using the Fund’s normal pricing procedures are valued at fair value as determined under policies approved by the Trustees. Fair value pricing may be used, for example, in situations where (i) a portfolio security is so thinly traded that there have been no transactions for that security over an extended period of time; (ii) the exchange on which the portfolio security is principally traded closes early; or (iii) trading of the portfolio security is halted during the day and does not resume prior to the Fund’s net asset value calculation. A portfolio security’s “fair value” price may differ from the price next available for that portfolio security using the Fund’s normal pricing procedures.
Option Valuation
Exchange-listed options are valued at their last quoted sales price as reported on their primary exchange as of 4:00 p.m. Eastern Time (the “Valuation Time”). For purposes of determining the primary exchange for each exchange-traded portfolio option the following shall apply: (i) if the option is traded on the Chicago Board Options Exchange (“CBOE”), the CBOE shall be considered the primary exchange for such option, unless the Adviser instructs Ultimus Fund Solutions, LLC (“Ultimus” or the “Administrator”) in writing to use a different exchange as the primary exchange for such option; and (ii) if the option does not trade on the CBOE, the Adviser shall instruct the Administrator in writing as to the primary exchange for such option. Unlisted options for which market quotations are readily available are valued at the last quoted sales price at the Valuation Time. If an option is not traded on the valuation date, the option shall be priced at the mean of the last quoted bid and ask prices as of the Valuation Time. An option may be valued using Fair Valuation when (i) the option does not trade on the valuation date; and (ii) reliable last quoted bid and ask prices as of the Valuation Time are not readily available.
| | |
Semi-Annual Report | April 30, 2018 | 15 |
Centaur Total Return Fund | Notes to Financial Statements |
| | April 30, 2018 (Unaudited) |
Fair Value Measurement
GAAP establishes a framework for measuring fair value and expands disclosure about fair value measurements. Various inputs are used in determining the value of the Fund’s investments. These inputs are summarized in the three broad levels listed below:
Level 1 – | Unadjusted quoted prices in active markets for identical investments and/or registered investment companies where the value per share is determined and published and is the basis for current transactions for identical assets or liabilities at the valuation date |
Level 2 – | Other significant observable inputs (including, but not limited to, quoted prices for an identical security in an inactive market, quoted prices for similar securities, interest rates, prepayment speeds, credit risk, etc.) |
Level 3 – | Significant unobservable inputs (including the Fund’s own assumptions in determining the fair value of investments based on the best information available) |
The availability of observable inputs can vary from security to security and is affected by a wide variety of factors, including, for example, the type of security, whether the security is new and not yet established in the marketplace, the liquidity of markets, and other characteristics particular to the security. To the extent that valuation is based on models or inputs that are less observable or unobservable in the market, the determination of fair value requires more judgment. Accordingly, the degree of judgment exercised in determining fair value is greatest for instruments categorized in Level 3.
An investment asset’s or liability’s level within the fair value hierarchy is based on the lowest level input, individually or in the aggregate, that is significant to fair value measurement.
The valuation techniques used by the Fund to measure fair value during the six months ended April 30, 2018 maximized the use of observable inputs and minimized the use of unobservable inputs.
The inputs or methodology used for valuing securities are not necessarily an indication of the risk associated with investing in those securities. The following is a summary of the inputs used in valuing the Fund’s assets and liabilities as of April 30, 2018.
| Investments in Securities at Value | | Level 1 | | | Level 2 | | | Level 3 | | | Total | |
| Assets | | | | | | | | | | | | |
| Common Stocks | | $ | 11,610,096 | | | $ | 374,339 | | | $ | — | | | $ | 11,984,435 | |
| Closed-End Funds | | | 1,251,440 | | | | — | | | | — | | | | 1,251,440 | |
| Warrants | | | 173,100 | | | | — | | | | — | | | | 173,100 | |
| Put Options Purchased | | | 33,800 | | | | 20,250 | | | | — | | | | 54,050 | |
| Call Options Purchased | | | 371,925 | | | | 135,325 | | | | — | | | | 507,250 | |
| Money Market Securities | | | 10,358,323 | | | | — | | | | — | | | | 10,358,323 | |
| Total | | $ | 23,798,684 | | | $ | 529,914 | | | $ | — | | | $ | 24,328,598 | |
| Other Financial Instruments | | | | | | | | | | | | |
| Liabilities | | | | | | | | | | | | |
| Written Options | | $ | (41,100 | ) | | $ | — | | | $ | — | | | $ | (41,100 | ) |
| Total | | $ | (41,100 | ) | | $ | — | | | $ | — | | | $ | (41,100 | ) |
| | |
16 | www.centaurmutualfunds.com |
Centaur Total Return Fund | Notes to Financial Statements |
| | April 30, 2018 (Unaudited) |
For the period ended April 30, 2018, there have been no significant changes to the Fund’s fair value methodologies. The Fund did not hold any investments at any time during the reporting period in which significant unobservable inputs were used in determining fair value; therefore, no reconciliation of Level 3 securities is included for this reporting period. The following is a summary of the transfer between Level 1 and Level 2 of the fair value hierarchy as of April 30, 2018 based on input levels assigned at October 31, 2017:
| | | Transfers from
Level 1 to Level 2 | |
| Common Stocks | | $ | 374,339 | |
Underlying Investment In Other Investment Companies
The Fund currently seeks to achieve its investment objectives by investing a portion of its assets in Fidelity Investments Money Market Fund – Government Portfolio (the “Fidelity Fund”). The Fund may redeem its investment from the Fidelity Fund at any time if the Adviser determines that it is in the best interest of the Fund and its shareholders to do so.
The performance of the Fund may be directly affected by the performance of the Fidelity Fund. The financial statements of the Fidelity Fund, a series of the Fidelity Funds, including the portfolio of investments, are included in the Fidelity Fund’s NCSR filing dated May 25, 2018, available at www.sec.gov or can be found at www.fidelity.com and should be read in conjunction with the Fund’s financial statements. As of April 30, 2018, the percentage of net assets invested in the Fidelity Fund was 41.49%.
Derivative Financial Instruments
The following discloses the Fund’s use of derivative instruments:
The Fund’s investment objective not only permits the Fund to purchase investment securities, it also allows the Fund to enter into various types of derivative contracts, such as purchased and written options. In doing so, the Fund will employ strategies in differing combinations to permit it to increase, decrease, or change the level or types of exposure to market factors. Central to those strategies are features inherent to derivatives that make them more attractive for this purpose than equity or debt securities; they require little or no initial cash investment, they can focus exposure on only certain selected risk factors, and they may not require the ultimate receipt or delivery of the underlying security (or securities) to the contract. This may allow the Fund to pursue its objectives more quickly and efficiently than if it were to make direct purchases or sales of securities capable of affecting a similar response to market factors.
Market Risk Factors: In pursuit of the investment objectives, the Fund may seek to use derivatives to increase or decrease its exposure to the following market risk factors:
Equity Risk: Equity risk relates to the change in value of equity securities as they relate to increases or decreases in the general market.
Foreign Exchange Rate Risk: Foreign exchange rate risk relates to the change in the U.S. dollar value of a security held that is denominated in a foreign currency. The value of a foreign currency denominated security will decrease as the dollar appreciates against the currency, while the value of the foreign currency denominated security will increase as the dollar depreciates against the currency.
Risk of Investing in Derivatives
The Fund’s use of derivatives can result in losses due to unanticipated changes in the market risk factors and the overall market.
Derivatives may have little or no initial cash investment relative to their market value exposure and therefore can produce significant gains or losses in excess of their cost. This use of embedded leverage allows the Fund to increase its market value exposure relative to its net assets and can substantially increase the volatility of the Fund’s performance.
Additional associated risks from investing in derivatives also exist and potentially could have significant effects on the valuation of the derivatives and the Fund. Typically, the associated risks are not the risks that the Fund is attempting to increase or decrease exposure to, per the investment objectives, but are the additional risks from investing in derivatives.
One example of these associated risks is liquidity risk, which is the risk that the Fund will not be able to sell the derivative in the open market in a timely manner, and counterparty credit risk, which is the risk that the counterparty will not fulfill its obligation to the Fund.
| | |
Semi-Annual Report | April 30, 2018 | 17 |
Centaur Total Return Fund | Notes to Financial Statements |
| | April 30, 2018 (Unaudited) |
Option Writing/Purchasing
The Fund may write or purchase option contracts to adjust risk and return of its overall investment positions. When the Fund writes or purchases an option, an amount equal to the premium received or paid by the Fund is recorded as a liability or an asset and is subsequently adjusted to the current market value of the option written or purchased. Premiums received or paid from writing or purchasing options that expire unexercised are treated by the Fund on the expiration date as realized gains or losses. The difference between the premium and the amount paid or received on affecting a closing purchase or sale transaction, including brokerage commissions, is also treated as a realized gain or loss. If an option is exercised, the premium paid or received is added to or subtracted from the cost of the purchase or proceeds from the sale in determining whether the Fund has realized a gain or loss on investment transactions. Risks from entering into option transactions arise from the potential inability of counterparties to meet the terms of the contracts, the potential inability to enter into closing transactions because of an illiquid secondary market and from unexpected movements in security values.
Statement of Assets and Liabilities – Fair Value of Derivative Instruments as of April 30, 2018:
| Risk Exposure | | Asset
Derivatives
Statement of
Assets and
Liabilities Location | | Fair Value | | | Liability
Derivatives
Statement of
Assets and
Liabilities Location | | Fair Value | |
| Equity (Purchased Options Contracts) | | Investments in securities, at fair value | | $ | 561,300 | | | N/A | | | N/A | |
| Equity (Written Options Contracts) | | N/A | | | N/A | | | Options written, at value | | $ | 41,100 | |
The effect of derivative instruments on the Statement of Operations for the six months ended April 30, 2018:
| Risk Exposure | | Statement of Operations Location | | Realized Gain of Derivatives
Recognized in Income | | | Change in Unrealized Appreciation/(Depreciation) on Derivatives
Recognized in Income | |
| Equity (Warrants) | | Net realized gain on investment securities transactions/ Net change in unrealized appreciation of investment securities | | $ | — | | | $ | 5,486 | |
| Equity (Purchased Options Contracts) | | Net realized gain on investment securities transactions/ Net change in unrealized appreciation of investment securities | | | 280,996 | | | | (21,169 | ) |
Equity (Written Options Contracts) | | Net realized gain on written option transactions/ Net change in unrealized depreciation of option contracts | | | (485,240 | ) | | | 69,657 | |
Average month-end contracts outstanding for the Fund during the six months ended April 30, 2018 was as follows:
| Derivative Type | | Unit of Measurement | | | Monthly Average | |
| Options | | | Contracts | | | $ | 629 | |
| | |
18 | www.centaurmutualfunds.com |
Centaur Total Return Fund | Notes to Financial Statements |
| | April 30, 2018 (Unaudited) |
Balance Sheet Offsetting Information
During the ordinary course of business, the Fund may enter into transactions subject to enforceable netting agreements or other similar arrangements (“netting agreements”). Generally, the right to offset in netting agreements allows a Fund to offset any exposure to a specific counterparty with any collateral received or delivered to that counterparty based on the terms of the agreement. Generally, a Fund manages its cash collateral and securities collateral on a counterparty basis. As of April 30, 2018, the Fund was not invested in any portfolio securities or derivatives that could be netted subject to netting arrangements.
Foreign Currency Translation
Portfolio securities and other assets and liabilities denominated in foreign currencies are translated into U.S. dollars based on the exchange rate of such currencies against U.S. dollars on the date of valuation. Purchases and sales of securities and income items denominated in foreign currencies are translated into U.S. dollars at the exchange rate in effect on the transaction date. The Fund does not separately report the effect of changes in foreign exchange rates from changes in market prices on securities held. Such changes are included in net realized and unrealized gain or loss from investments.
Realized foreign exchange gains or losses arise from sales of foreign currencies, currency gains or losses realized between the trade and settlement dates on securities transactions and the difference between the recorded amounts of dividends, interest, and foreign withholding taxes, and the U.S. dollar equivalent of the amounts actually received or paid. Net unrealized foreign exchange gains and losses arise from changes in foreign exchange rates on foreign denominated assets and liabilities other than investments in securities held at the end of the reporting period.
Investment Transactions and Investment Income
Investment transactions are accounted for as of the date purchased or sold (trade date) for financial reporting purposes. Dividend income is recorded on the ex-dividend date. Certain dividends from foreign securities will be recorded as soon as the Fund is informed of the dividend if such information is obtained subsequent to the ex-dividend date. Interest income is recorded on the accrual basis and includes amortization of discounts and premiums. Gains and losses are determined on the identified cost basis, which is the same basis used for federal income tax purposes.
Expenses
The Fund bears expenses incurred specifically for the Fund and general Trust expenses.
Dividend Distributions
The Fund may declare and distribute dividends from net investment income (if any) at the end of each month or calendar quarter. Distributions from capital gains (if any) are generally declared and distributed annually. Dividends and distributions to shareholders are recorded on ex-date.
Fees on Redemptions
Prior to February 28, 2016, the Fund charged a redemption fee of 2.00% on redemptions of Fund’s shares occurring within one year following the issuance of such shares. The redemption fee is not a fee to finance sales or sales promotion expenses, but is paid to the Fund to defray the costs of liquidating an investor and discouraging short-term trading of the Fund’s shares. No redemption fee will be imposed on the redemption of shares representing dividends or capital gains distributions, or on amounts representing capital appreciation of shares.
Warrants
The Fund may invest in warrants. The Fund may purchase warrants issued by domestic and foreign companies to purchase newly created equity securities consisting of common and/or preferred stock. Warrants are derivatives that give the holder the right, but not the obligation to purchase equity issues of the company issuing the warrants, or a related company, at a fixed price either on a date certain or during a set period. The equity security underlying a warrant is authorized at the time the warrant is issued or is issued together with the warrant.
| | |
Semi-Annual Report | April 30, 2018 | 19 |
Centaur Total Return Fund | Notes to Financial Statements |
| | April 30, 2018 (Unaudited) |
Investing in warrants can provide a greater potential for profit or loss than an equivalent investment in the underlying security, and, thus, can be a speculative investment. At the time of issue, the cost of a warrant is substantially less than the cost of the underlying security itself, and price movements in the underlying security are generally magnified in the price movements of the warrant. This leveraging effect enables the investor to gain exposure to the underlying security with a relatively low capital investment.
This leveraging increases an investor’s risk; however, in the event of a decline in the value of the underlying security, a complete loss of the amount invested in the warrant may result. In addition, the price of a warrant tends to be more volatile than, and may not correlate exactly to, the price of the underlying security. If the market price of the underlying security is below the exercise price of the warrant on its expiration date, the warrant will generally expire without value. The value of a warrant may decline because of a decline in the value of the underlying security, the passage of time, changes in interest rates or in the dividend or other policies of the company whose equity underlies the warrant or a change in the perception as to the future price of the underlying security, or any combination thereof. Warrants generally pay no dividends and confer no voting or other rights other than to purchase the underlying security.
Federal Income Taxes
As of and during the six months ended April 30, 2018, the Fund did not have a liability for any unrecognized tax benefits. The Fund files U.S. federal, state, and local tax returns as required. The Fund’s tax returns are subject to examination by the relevant tax authorities until expiration of the applicable statute of limitations which is generally three years after the filing of the tax return. Tax returns for open years have incorporated no uncertain tax positions that require a provision for income taxes.
The Fund’s policy is to continue to comply with the requirements of the Internal Revenue Code that are applicable to regulated investment companies and to distribute all its taxable income to its shareholders. The Fund also intends to distribute sufficient net investment income and net capital gains, if any, so that it will not be subject to excise tax on undistributed income and gains. Therefore, no federal income tax or excise tax provision is required.
3. TRANSACTIONS WITH AFFILIATES
Adviser
Centaur Capital Partners, L.P. is the Fund’s investment adviser (the “Adviser”). The Fund pays the Adviser a monthly fee based upon the average daily net assets of the Fund and calculated at an annual rate of 1.50%. For the six months ended April 30, 2018 the Adviser earned advisory fees of $189,082.
The Adviser has entered into an Expense Limitation Agreement with the Fund under which it has agreed to reduce the amount of the investment advisory fees to be paid to the Advisor by the Fund and to assume other expenses of the Fund, if necessary, in an amount that limits the Fund’s annual operating expenses (exclusive of interest, taxes, brokerage commissions, other expenditures which are capitalized in accordance with generally accepted accounting principles, other extraordinary expenses not incurred in the ordinary course of the Fund’s business, dividend expense on securities sold short, “acquired fund fees and expenses,” and amounts, if any, payable pursuant to a plan adopted in accordance with Rule 12b-1 under the Investment Company Act of 1940, as amended (“1940 Act”)) to not more than 1.95% of the average daily net assets of the Fund for the period ending February 28, 2019. For the six months ended April 30, 2018, the Adviser waived/reimbursed expenses in the amount of $76,504.
Administrator
Ultimus Fund Solutions, LLC (the “Administrator”) provides administration, fund accounting, compliance and transfer agency services to the Fund. The Fund pays the Administrator fees in accordance with the Master Services Agreement for such services. In addition, the Fund pays out-of-pocket expenses including but not limited to postage, supplies and costs of pricing its portfolio securities.
Distributor
Ultimus Fund Distributors, LLC (the “Distributor”) serves as the Trust’s Distributor. The Distributor acts an agent for the Trust and the distributor of its shares. The Distributor is compensated by the Adviser for its services provided to the Trust.
Certain officers of the Trust are also officers of the Adviser or the Administrator.
| | |
20 | www.centaurmutualfunds.com |
Centaur Total Return Fund | Notes to Financial Statements |
| | April 30, 2018 (Unaudited) |
4. PURCHASES AND SALES OF INVESTMENT SECURITIES
The aggregate cost of purchases and proceeds from sales of investment securities, excluding short-term securities, are $7,871,416 and $9,602,394, respectively, for the six months ended April 30, 2018. There were no purchases or sales of U.S. government securities for the six months ended April 30, 2018.
5. FEDERAL INCOME TAXES
Distributions are determined in accordance with Federal income tax regulations, which differ from GAAP, and, therefore, may differ significantly in amount or character from net investment income and realized gains for financial reporting purposes. Financial reporting records are adjusted for permanent book/tax differences to reflect tax character but are not adjusted for temporary differences.
Management has reviewed the Fund’s tax positions to be taken on federal income tax returns for the open tax years of 2015, 2016 and 2017 and during the six months ended April 30, 2018, and has determined that the Fund does not have a liability for uncertain tax positions. The Fund recognizes interest and penalties, if any, related to unrecognized tax benefits as income tax expense in the Statement of Operations. During the period, the Fund did not incur any interest or penalties.
As of April 30, 2018, the aggregate cost of investments, gross unrealized appreciation and net unrealized depreciation for Federal tax purposes was as follows:
| | | Cost of
Investments
for Income Tax
Purposes | | | Gross Unrealized
Appreciation | | | Gross Unrealized
Depreciation | | | Net Unrealized
Appreciation | |
| Centaur Total Return Fund | | $ | 22,840,443 | | | $ | 2,067,470 | | | $ | (169,083 | ) | | $ | 1,898,387 | |
Distributions paid during the fiscal years ended October 31, were characterized for tax purposes as follows:
| | | For the fiscal
year ended | | Ordinary Income | | | Long-Term
Capital Gains | |
| Centaur Total Return Fund | | October 31, 2017 | | $ | 725,592 | | | $ | 541,201 | |
| | | October 31, 2016 | | | 960,176 | | | | 527,789 | |
As of October 31, 2017, the components of distributable earnings on a tax basis were as follows:
| | | Undistributed
Ordinary Income | | | Undistributed
Long Term
Capital Gains | | | Accumulated Capital Losses | | | Net Unrealized
Appreciation | | | Total
Distributable Earnings | |
| Centaur Total Return Fund | | $ | 1,706,922 | | | $ | 931,007 | | | $ | (11,628 | ) | | $ | 2,019,111 | | | $ | 4,645,412 | |
As of October 31, 2017, the Fund had no accumulated capital loss carryforwards.
6. COMMITMENTS AND CONTINGENCIES
Under the Trust’s organizational documents, its Officers and Trustees are indemnified against certain liabilities arising out of the performance of their duties to the Fund. In addition, in the normal course of business, the Trust entered into contracts with its service providers, on behalf of the Fund, and others that provide for general indemnifications. The Fund’s maximum exposure under these arrangements is unknown, as this would involve future claims that may be made against the Fund. The Fund expects the risk of loss to be remote.
| | |
Semi-Annual Report | April 30, 2018 | 21 |
Centaur Total Return Fund | Notes to Financial Statements |
| | April 30, 2018 (Unaudited) |
7. TRUSTEE COMPENSATION
As of April 30, 2018, there were two Trustees, both of whom are not “interested persons” (as defined in the 1940 Act) of the Trust (the “Independent Trustees”). Each of the Independent Trustees receives a fee of $2,000 each year plus $500 per series of the Trust per meeting attended in person and $200 per series of the Trust per meeting attended by telephone. The officers of the Trust will not receive compensation from the Trust for performing the duties of their offices. All Trustees and officers are reimbursed for any out-of-pocket expenses incurred in connection with attendance at meetings.
8. SUBSEQUENT EVENTS
Management of the Fund has evaluated the need for disclosure and/or adjustments resulting from subsequent events through the date these financial statements were issued. Based upon this evaluation, management has determined there were no items requiring adjustment of the financial statements or additional disclosure.
| | |
22 | www.centaurmutualfunds.com |
Centaur Total Return Fund | Summary of Fund Expenses |
| | April 30, 2018 (Unaudited) |
As a shareholder of the Fund, you incur two types of costs: (1) transaction costs, which may include redemption fees for shares redeemed within one year and (2) ongoing costs, including management fees and other Fund expenses. This example is intended to help you understand your ongoing costs (in dollars) of investing in the Fund and to compare these costs with the ongoing costs of investing in other mutual funds. The example is based on an investment of $1,000 invested at the beginning of the period and held for the entire period as indicated below.
Actual Expenses – The first line of the table below provides information about the actual account values and actual expenses. You may use the information in this line, together with the amount you invested, to estimate the expenses that you paid over the period. Simply divide your account value by $1,000 (for example, an $8,600 account value divided by $1,000 = 8.6), then multiply the result by the number in the first line under the heading entitled “Expenses Paid During Period” to estimate the expenses you paid on your account during this period.
Hypothetical Example for Comparison Purposes – The second line of the table below provides information about hypothetical account values and hypothetical expenses based on the Fund’s actual expense ratio and an assumed annual rate of return of 5% before expenses, which is not the Fund’s actual return. The hypothetical account values and expenses may not be used to estimate the actual ending account balance or expenses you paid for the period. You may use this information to compare the ongoing costs of investing in the Fund and other funds by comparing this 5% hypothetical example with the 5% hypothetical examples that appear in the shareholder reports of other funds. Please note that the expenses shown in the table are meant to highlight your ongoing costs only and do not reflect any direct costs, such as wire fees or low balance fees. Therefore, the second line of the table is useful in comparing ongoing costs and will not help you determine the relative total costs of owning different funds. In addition, if these direct costs were included, your costs would be higher.
| Beginning
Account Value,
November 1, 2017 | Ending
Account Value,
April 30, 2018 | Expense
Ratio(a) | Expense
Paid During
Period(b) |
Actual | $ 1,000.00 | $ 1,037.50 | 1.95% | $ 9.80 |
Hypothetical (5% return before expenses) | $ 1,000.00 | $ 1,015.18 | 1.95% | $ 9.69 |
(a) | Annualized, based on the Fund’s most recent fiscal half year expenses. |
(b) | Expenses are equal to the Fund’s annualized expense ratio multiplied by the average account value over the period, multiplied by the number of days in the most recent fiscal half year (181), divided by 365. |
| | |
Semi-Annual Report | April 30, 2018 | 23 |
Centaur Total Return Fund | Additional Information |
| | April 30, 2018 (Unaudited) |
1. PROXY VOTING POLICIES AND VOTING RECORD
A copy of the Trust’s Proxy Voting and Disclosure Policy and the Advisor’s Proxy Voting and Disclosure Policy are included as Appendix B to the Fund’s Statement of Additional Information and are available, (1) without charge, upon request, by calling (1-888-484-5766) and (2) on the SEC’s website at http://ww.sec.gov. Information regarding how the Fund voted proxies relating to portfolio securities during the most recent 12-month period ended June 30 will be available (1) without charge, upon request, by calling the Fund at the number above and (2) on the SEC’s website at http://www.sec.gov.
2. QUARTERLY PORTFOLIO HOLDINGS
The Fund files its complete schedule of portfolio holdings with the SEC for the first and third quarters of each fiscal year on Form N-Q. The Fund’s Forms N-Q are available on the SEC’s website at http://www.sec.gov. You may review and make copies at the SEC’s Public Reference Room in Washington, D.C. You may also obtain copies after paying a duplicating fee by writing the SEC’s Public Reference Section, Washington, D.C. 20549-0102 or by electronic request to publicinfo@sec.gov, or is available without charge, upon request, by calling the Fund at 1-888-484-5766. Information on the operation of the Public Reference Room may be obtained by calling the SEC at 1-800-SEC-0330, (1-800-732-0330).
| | |
24 | www.centaurmutualfunds.com |
FACTS | WHAT DOES THE CENTAUR MUTUAL FUNDS TRUST DO WITH YOUR PERSONAL INFORMATION? |
| | |
Why? | Financial companies choose how they share your personal information. Federal law gives consumers the right to limit some but not all sharing. Federal law also requires us to tell you how we collect, share, and protect your personal information. Please read this notice carefully to understand what we do. |
| | |
What? | The types of personal information we collect and share depend on the product or service you have with us. This information can include: ● Social Security number and assets ● Account balances and transaction history ● Checking account information and wire transfer instructions When you are no longer our customer, we continue to share your information as described in this notice. |
| | |
How? | All financial companies need to share customers’ personal information to run their everyday business. In the section below, we list the reasons financial companies can share their customers’ personal information; the reasons the Centaur Mutual Funds Trust chooses to share; and whether you can limit this sharing. |
REASONS WE CAN SHARE YOUR PERSONAL INFORMATION | Does the Centaur
Mutual Funds Trust
share? | Can you limit
this sharing? |
For our everyday business purposes — such as to process your transactions, maintain your account(s), respond to court orders and legal investigations, or report to credit bureaus | Yes | No |
For our marketing purposes — to offer our products and services to you | No | We do not share. |
For joint marketing with other financial companies | No | We do not share. |
For our affiliates’ everyday business purposes — information about your transactions and experiences | No | We do not share. |
For our affiliates’ everyday business purposes — information about your creditworthiness | No | We do not share. |
For nonaffiliates to market to you | No | We do not share. |
Questions? | Call 1-888-484-5766 | |
| | |
Semi-Annual Report | April 30, 2018 | 25 |
CENTAUR PRIVACY POLICY | Page 2 | |
WHO WE ARE |
Who is providing this notice? | The Centaur Mutual Funds Trust, on behalf of the Centaur Total Return Fund, each a series of the Trust. |
WHAT WE DO |
How does the Centaur Mutual Funds Trust protect my personal information? | To protect your personal information from unauthorized access and use, we use security measures that comply with federal law. These measures include computer safeguards and secured files and buildings. We require any companies that help provide our services to you to protect the confidentiality of the personal information they receive. |
How does the Centaur Mutual Funds Trust collect my personal information? | We collect your personal information, for example, when you ● open an account or give us your account information ● make deposits or withdrawals from our account ● pay us by check or make a wire transfer We also collect your personal information from other companies. |
Why can’t I limit all sharing? | Federal law gives you the right to limit only ● sharing for affiliates’ everyday business purposes – information about your creditworthiness ● affiliates from using your information to market to you ● sharing for nonaffiliates to market to you State laws and individual companies may give you additional rights to limit sharing. |
DEFINITIONS |
Affiliates | Companies related by common ownership or control. They can be financial and nonfinancial companies. ● Centaur Capital Partners LP, the investment advisor, is an affiliate of the Centaur Mutual Funds Trust. |
Nonaffiliates | Companies not related by common ownership or control. They can be financial and nonfinancial companies. ● The Centaur Mutual Funds Trust does not share information with nonaffiliates so they can market to you. |
Joint marketing | A formal agreement between nonaffiliated financial companies that together market financial products or services to you. ● The Centaur Mutual Funds Trust does not jointly market. |
| | |
26 | www.centaurmutualfunds.com |
THIS PAGE INTENTIONALLY LEFT BLANK
THIS PAGE INTENTIONALLY LEFT BLANK
THIS PAGE INTENTIONALLY LEFT BLANK

Item 2. Code of Ethics. NOT APPLICABLE – disclosed with annual report
Item 3. Audit Committee Financial Expert. NOT APPLICABLE- disclosed with annual report
Item 4. Principle Accountant Fees and Services. NOT APPLICABLE – disclosed with annual report
Item 5. Audit Committee of Listed Companies. NOT APPLICABLE – applies to listed companies only
Item 6. Schedule of Investments. Schedule filed with Item 1.
Item 7. Disclosure of Proxy Voting Policies and Procedures for Closed-End Management Investment Companies. NOT APPLICABLE – applies to closed-end funds only
Item 8. Portfolio Managers of Closed-End Investment Companies. NOT APPLICABLE – applies to closed-end funds only
Item 9. Purchases of Equity Securities by Closed-End Management Investment Company and Affiliated Purchasers. NOT APPLICABLE – applies to closed-end funds only
Item 10. Submission of Matters to a Vote of Security Holders.
NOT APPLICABLE
Item 11. Controls and Procedures.
(a) The registrant’s Principal Executive Officer and Principal Financial Officer have concluded that the registrant's disclosure controls and procedures (as defined in Rule 30a-3(c) under the Act) are effective in design and operation and are sufficient to form the basis of the certifications required by Rule 30a-2 under the Act, based on their evaluation of these disclosure controls and procedures within 90 days of the filing of this report on Form N-CSR.
(b) There were no changes in the registrant’s internal control over financial reporting (as defined in Rule 30a-3(d) under the Act (17 CFR 270.30a-3(d)) that occurred during the period covered by this report that have materially affected or are reasonably likely to materially affect, the registrant’s internal control over financial reporting.
Item 12. Disclosure of Securities Lending Activities for Closed-End Investment Companies.
Not Applicable.
Item 13. Exhibits.
(a)(1) Not Applicable – filed with annual report
(a)(2) Certifications pursuant to Rule 30a-2(a) are attached hereto.
(a)(3) Not applicable.
(b) Certifications pursuant to Rule 30a-2(b) are furnished herewith.
SIGNATURES
Pursuant to the requirements of the Securities Exchange Act of 1934 and the Investment Company Act of 1940, the registrant has duly caused this report to be signed on its behalf by the undersigned, thereunto duly authorized.
| (Registrant) | Centaur Mutual Funds Trust | |
| | | |
| By (Signature and Title)* | /s M. Ezekial Ashton | |
| | M. Ezekial Ashton, President and Executive Officer | |
| | | |
| Date | 6/27/2018 | |
Pursuant to the requirements of the Securities Exchange Act of 1934 and the Investment Company Act of 1940, this report has been signed below by the following persons on behalf of the registrant and in the capacities and on the dates indicated.
| By (Signature and Title)* | /s/ M. Ezekial Ashton | |
| | M. Ezekial Ashton, President and Executive Officer | |
| | | |
| Date | 6/27/2018 | |
| | | |
| By (Signature and Title)* | /s/ Gennifer Ashton | |
| | Gennifer Ashton, Treasurer and Principal Accounting Officer |
| | | |
| Date | 6/27/2018 | |