UNITED STATES
SECURITIES AND EXCHANGE COMMISSION
Washington, D.C. 20549
FORM N-CSR
CERTIFIED SHAREHOLDER REPORT OF REGISTERED
MANAGEMENT INVESTMENT COMPANIES
811-21606
(Investment Company Act File Number)
Centaur Mutual Funds Trust
(Exact Name of Registrant as Specified in Charter)
1460 Main Street, Suite 234
Southlake, TX 76092
(Address of Principal Executive Offices)
ALPS Fund Services, Inc.
1290 Broadway, Suite 1100
Denver, CO 80203
(Name and Address of Agent for Service)
(303) 623-2577
(Registrant’s Telephone Number)
Date of Fiscal Year End: October 31
Date of Reporting Period: April 30, 2015
| Item 1. | Reports to Stockholders. |
TABLE OF CONTENTS
| Centaur Total Return Fund | |
| Shareholder Letter | 1 |
| Performance Update | 7 |
| Disclosure of Fund Expenses | 8 |
| Schedule of Investments | 9 |
| Statement of Assets and Liabilities | 12 |
| Statement of Operations | 13 |
| Statements of Changes in Net Assets | 14 |
| Financial Highlights | 15 |
| Notes to Financial Statements | 16 |
| Additional Information | 23 |
Statements in this Semi-Annual Report that reflect projections or expectations of future financial or economic performance of the Fund and of the market in general and statements of the Fund’s plans and objectives for future operations are forward-looking statements. No assurance can be given that actual results or events will not differ materially from those projected, estimated, assumed or anticipated in any such forward-looking statements. Important factors that could result in such differences, in addition to the other factors noted with such forward-looking statements, include, without limitation, general economic conditions such as inflation, recession and interest rates. Past performance is not a guarantee of future results.
Investment in the Fund is subject to investment risks, including the possible loss of some or all of the principal amount invested. There can be no assurance that the Fund will be successful in meeting its investment objective. Generally, the Fund will be subject to the following additional risks: market risk, management style risk, sector focus risk, foreign securities risk, non-diversified fund risk, credit risk, interest rate risk, maturity risk, investment grade securities risk, junk bonds or lower-rated securities risk, derivative instruments risk, valuation risk for non-exchange traded options, risk from writing call options, real estate securities risk, MLP risk, Royalty Trust risk, Risks Related to other equity securities, and portfolio turnover risk. More information about these risks and other risks can be found in the Fund’s prospectus and statement of additional information. When the Fund sells covered call options, the Fund gives up additional appreciation in the stock above the strike price since there is the obligation to sell the stock at the covered call option’s strike price.
The performance information quoted in this semi-annual report represents past performance, which is not a guarantee of future results. Investment return and principal value of an investment will fluctuate so that an investor’s shares, when redeemed, may be worth more or less than their original cost. Current performance may be lower or higher than the performance data quoted. A redemption fee of 2% of the amount redeemed is imposed on redemptions of Fund shares occurring within one year following the issuance of such shares. An investor may obtain performance data current to the most recent month-end by visiting www.centaurmutualfunds.com.
An investor should consider the investment objectives, risks, and charges and expenses of the Fund carefully before investing. The prospectus contains this and other information about the Fund. A copy of the prospectus is available at www.centaurmutualfunds.com or by calling Shareholder Services at (1-888-484-5766). The prospectus should be read carefully before investing.
| Centaur Total Return Fund | Shareholder Letter |
| | April 30, 2015 (Unaudited) |
Dear Centaur Total Return Fund Investors:
The Fund produced a return of 3.70% for the year ending April 30, 2015. Our primary benchmark, the Dow Jones U.S. Select Dividend Total Return Index, experienced a gain of 8.42% for the same period, while the S&P 500® Total Return Index returned 12.98%.
For the trailing 5-year period ending April 30, 2015, the Fund has produced an annualized return of 9.42% versus the primary benchmark’s return of 14.85% annualized over the same period. The S&P 500® Total Return Index has returned 14.33% annualized for the five years.
For the trailing 10-year period ending April 30, 2015, the Fund has produced an annualized return of 9.70% versus the primary benchmark’s return of 7.26% annualized over the same period. The S&P 500® Total Return Index has returned 8.32% annualized for the ten years.
The inception-to-date return figures for the Fund and comparisons to the benchmarks are similar to the 10-year figures given the Fund’s launch date of March 2005.
(For the Fund’s most up-to-date performance information, please see our web site at www.centaurmutualfunds.com.)
| | | | | | | | | | | | | |
| | Performance as of April 30, 2015 Average Annual Total Returns | Past 1 Year | | Past 5 Years | | Past 10 Years | Since Inception* | |
| | Centaur Total Return Fund | 3.70% | | | 9.42% | | | 9.70% | | 9.56% | |
| | S&P 500® Total Return Index | 12.98% | | | 14.33% | | | 8.32% | | 7.95% | |
| | Dow Jones U.S. Select Dividend Total Return Index | 8.42% | | | 14.85% | | | 7.26% | | 7.06% | |
| | | | |
| | Performance shown is for the period ended April 30, 2015. The performance data quoted above represents past performance, which is not a guarantee of future results. Investment return and principal value of an investment in the Fund will fluctuate so that an investor’s shares, when redeemed, may be worth more or less than their original cost. Current performance may be lower or higher than the performance data quoted. To obtain more current performance data regarding the Fund, including performance data current to the Fund’s most recent month-end, please visit www.centaurmutualfunds.com. A 2% redemption fee is charged upon redemption of the Fund’s shares occurring within one year of the issuance of such shares. The performance data quoted above does not reflect the deduction of the redemption fee and if reflected, the redemption fee would reduce the performance quoted. | |
| | | | |
| | The S&P 500® Total Return Index is the Standard & Poor’s composite index of 500 stocks a widely recognized index of common stock prices. | |
| | | | |
| | The Dow Jones U.S. Select Dividend Total Return Index is an index of 100 dividend-paying stocks selected according to a methodology developed and administered by Dow Jones & Co. It is not possible to invest in indices (like the S&P 500® Total Return Index and the U.S. Select Dividend Total Return Index) that are unmanaged and do not incur fees and charges. | |
| | | | |
| | * | The Fund’s inception date is March 16, 2005. | |
| | | | | | |
| | Total Annual Operating Expenses | | | |
| | | Net Expense
Ratio** | Gross Expense
Ratio*** | |
| | Centaur Total Return Fund | 2.13% | 2.39% | |
| | | | |
| | ** | The net expense ratio reflects a contractual expense limitation that continues through September 3, 2016. Thereafter, the expense limitation may be changed or terminated at any time. Performance would have been lower without this expense limitation. The Net Expense Ratio above does not correlate to the ratio of total expenses provided in the Financial Highlights table of the Fund’s Semi-Annual Report for the period ended April 30, 2015, as the Financial Highlights table does not include Acquired Fund Fees and Expenses. | |
| | *** | Gross expense ratio is from the Fund’s prospectus dated February 27, 2015. | |
| | | | |
Ten Year Anniversary and Thoughts on Recent Performance
The Centaur Total Return Fund achieved its 10-year anniversary in March 2015. This milestone provides a good opportunity to discuss how the Fund has performed over time across various market environments. Mutual fund performance is usually presented on a trailing basis (for example, 1 year, 3 years, 5 years, etc) as compared to a benchmark index, and in fact just such a table for our Fund appears on the previous page. While this convention is useful, it can sometimes also fail to capture important context.
| | |
| Semi-Annual Report | April 30, 2015 | 1 |
| Centaur Total Return Fund | Shareholder Letter |
| | April 30, 2015 (Unaudited) |
Below is a slightly different presentation of the Fund’s performance by calendar year with comparisons to the S&P 500® Total Return Index (under the column “S&P500”) and to our primary benchmark, the Dow Jones U.S. Select Dividend Total Return Index (under the column “DJ US DIV”). Please note that the figures for 2005 represent the performance from the Fund’s launch date in March through year-end; the 2015 figures represent the performance for the first four months of 2015. As the table shows, from inception to end the April 2015, the Fund has out-performed our primary benchmark with a total return of 151.2% versus 99.5%.
| | CALENDAR YEAR RETURNS VERSUS BENCHMARKS 2005-2015 | | |
| | YEAR | TILDX | S&P500 | DJ US DIV | | |
| | 2005* | 9.24% | 7.21% | 5.38% | | |
| | 2006 | 15.75% | 15.79% | 19.54% | | |
| | 2007 | ‐0.63% | 5.49% | ‐ 5.16% | | |
| | 2008 | ‐20.55% | ‐37.00% | ‐30.97% | | |
| | 2009 | 43.98% | 26.46% | 11.13% | | |
| | 2010 | 20.64% | 15.06% | 18.32% | | |
| | 2011 | ‐2.33% | 2.11% | 12.42% | | |
| | 2012 | 17.94% | 16.00% | 10.84% | | |
| | 2013 | 16.78% | 32.39% | 29.06% | | |
| | 2014 | 7.20% | 13.69% | 15.36% | | |
| | 2015** | 0.15% | 1.92% | ‐0.43% | | |
| | TOTAL | 151.20% | 116.80% | 99.50% | | |
| | * | 2005 return from the Fund’s launch on March 16, 2005 through December 31 | | |
| | ** | 2015 return is for the YTD period through April 30 | | |
The table above also much better illustrates the arc of the Fund’s performance over time. Namely, one can see that the Fund performed quite well for the first eight of the roughly ten years of its existence. In our view, the Fund navigated the 2008‐2009 crisis and recovery far better than most equity investment vehicles. Beginning in 2013, however, the Fund’s performance began to diverge unfavorably when compared to the benchmarks.
As we look back on 2013, if we were to take a snapshot of where the Fund stood through the first nine months of that year, we would see that as of September 30, 2013, the Fund had returned 13.43% year-to-date while the benchmarks had returned between 19.0% and 19.8%. At that point, the Fund’s returns relative to the benchmarks for various historical periods looked like this:
| Annualized Return as of 9/30/2013 | 1YR | 3YR | 5YR | Since Inception |
| Centaur Total Return Fund | 20.14% | 12.38% | 15.10% | 10.12% |
S&P 500® Total Return Index | 19.34% | 16.27% | 10.02% | 6.36% |
| Dow Jones Select Dividend Total Return | 19.45% | 16.80% | 9.00% | 5.66% |
From that point on, our two benchmark indices blasted off to finish 2013 with an amazing fourth quarter (with the S&P500 up more than 13% in the final three months) and then continued to perform well in 2014. Meanwhile, the Fund has captured a rather small percentage of these market gains.
In this letter, we will attempt to address this recent stretch of lackluster Fund performance as candidly as possible.
Three Factors
While explaining the underwhelming performance of the Fund over the last nineteen months is neither pleasant nor easy, we think it boils down to three simple factors. To rip off the band-aid quickly, since early 2013 the Fund has generally been 1) under-invested relative to the fully invested benchmarks; 2) has not been able to fully exploit the covered call component of the Fund’s strategy due to unacceptably low option premiums; and 3) has not enjoyed any really big “home run” winners from our portfolio investments over the past couple of years relative to various other periods in the Fund’s performance record.
| | |
| 2 | www.centaurmutualfunds.com |
| Centaur Total Return Fund | Shareholder Letter |
| | April 30, 2015 (Unaudited) |
That’s the “Cliff Notes” version. In the more lengthy discussion below, we will delve a little deeper into the three factor explanation provided above. However, the purpose of this letter is not for us to make excuses for the Fund’s inability to keep pace with a rising market in what appears to us to be the late hours of a bull market party. Rather, we simply want to make our case for why we have invested your capital in the manner that we have, and why we believe that doing so was and still remains a prudent course of action despite its recent (and we hope temporary) negative impact on the Fund’s performance.
Let’s start with valuations. From our perspective, roughly since mid-2013 we have perceived that U.S. stocks in general have been priced somewhere within a range of fully valued to significantly over-valued, at least relative to the type of valuations that we have historically been able to fully invest the Fund’s capital. We should point out that rich overall market valuation by itself hasn’t always prevented us from buying securities. After all, even in a fully valued market there can still be a lot of cheap stocks. Indeed, there have been past market periods in which prices for the general market seemed broadly unappealing to us, and yet we managed to keep the Fund heavily invested. Given the Fund’s concentrated nature and the Fund’s relatively small size we have in the past usually been able to root out enough bargains, often amongst small-cap companies, to keep the Fund well invested.
The problem with the recent market environment hasn’t been so much the overall valuations as much as the fact that there is very little price variation between securities. This is quite unusual in our experience as investors. Those readers old enough to remember the late 1990’s may also recall that even in the midst of the biggest stock market bubble of all time, one could buy “old economy” stocks for a song because the market was fully enamored with the “new economy.” Unfortunately, such a bifurcated market does not exist today. As a result of the correlation amongst securities prices, we are seeing fewer opportunities to buy discounted securities, and it takes more research time for us to find new investments because we may have to look at many ideas before finding one we like. At the same time, we have continued to trim or sell securities owned by the Fund as they reach our estimate of full value, and a certain number of positions are sold as a natural course as events or new information changes our conviction in either our valuation work or the risk factors underlying each investment. This dynamic has meant that we have struggled to replace sold ideas with new investments. The Fund’s cash level has continued to hover in a range of roughly 25-30% of the portfolio’s asset value since late 2012. In 2012 we were fortunate and managed to capture the full market return despite being only about 80% invested during the year on average, but since early 2013 even the invested portion of our portfolio has struggled to keep up with the strong stock market performance and the cash has only served to slow us down further.
The second factor is that the market has exhibited a long period of very low volatility. This is of particular importance to us because the market’s view of volatility is a key factor in how options are priced, and combined with low interest rates (another pricing input) has dramatically reduced the attractiveness of selling covered calls. In the past, the Fund has been able to generate meaningful income from selling covered call options against certain Fund holdings when option prices were attractive. The flexibility to employ covered calls also has often allowed us to productively deploy capital even in market environments that featured a relative scarcity of bargain securities, so long as there had been recent volatility. If we encountered a security that was even only slightly undervalued, we often found that attractive option prices allowed us purchase the security and sell covered calls against it, thereby creating a worthwhile total return opportunity for our capital. This has not been the case in the last several years, and because selling covered calls is an activity with a tightly capped upside, we have always been highly selective in picking our spots. There have been very few spots for our covered call strategy in recent years. As of this writing, the Fund has only one active covered call position.
In addition to the limited covered call opportunities, the lack of stock market volatility means that there have simply been fewer opportunities for us to buy into new or existing ideas on price weakness due to broad market selling. A broad market correction of 10-15% every eighteen months or so is actually almost ideal for us, as it increases our opportunities to re-stock the portfolio with bargain securities. More helpful still is if such a sell-off is followed by subdued price action for a number of weeks or months, allowing us time to research new ideas if our existing wish list of previously studied securities don’t shake out enough new investment opportunities.
The final point mentioned previously is that the Fund’s portfolio hasn’t produced any major home run performers in the past two years. In a market in which businesses with obviously exciting (or even only potentially exciting) future prospects have been bid to extraordinarily high valuations, we have tended to own the type of plodding, unexciting, or out-of-favor ideas that represent decent value but are much less likely to deliver explosive returns. As best we can tell, the Fund’s ratio of winners to losers is not dramatically different than it has been in prior periods, but the magnitude of the winners is somewhat less exciting than it has historically been. We believe that this can also be partly explained by factors 1 and 2, because in the recent environment our new purchases have been, on average, less undervalued when we buy them and therefore have less room to run before reaching a valuation at which we typically sell.
This is Definitely Not Normal
Hopefully we’ve been able to explain that the Fund has not recently performed as we would normally expect in large part because we’ve encountered an investing environment that is fairly unique in its characteristics. Today’s combination of high valuation and the lengthy duration of low price volatility appear to us to be an anomaly, historically speaking.
| | |
| Semi-Annual Report | April 30, 2015 | 3 |
| Centaur Total Return Fund | Shareholder Letter |
| | April 30, 2015 (Unaudited) |
Though we are wary of assigning too much significance to commonly mentioned broad-based indicators of overall market valuation, such as the P/E ratio for an entire index or ratios such as the total stock market value relative to Gross Domestic Product (GDP), we will note that we do pay attention to the work of a select few practitioners whose methods have been shown to be useful in identifying dangerous valuation levels in the past. One of these is GMO LLC, a global asset management firm, which regularly publishes 7-year asset class forecasts based on its own proprietary research; a recent version from May 2015 projects “real returns” adjusted for inflation for the next seven years for both U.S. stocks and bonds to be negative. Various other indicators show that while the overall U.S. stock market has been more expensive than the current level on various metrics on at least two occasions (those being the late 1920s and 1999-2000), due to high correlations the median stock may be more highly valued today that at either of those historical instances. Just as a reminder, those were not great times for investors to be rushing to buy stocks, though of course in both cases investors were doing just that. Our own gauge for market attractiveness is largely based on how much effort it takes us to find stocks that meet our criteria for value and capital preservation, and on this basis, we have no trouble believing that the broad market is very expensive relative to historical norms. Certainly we’ve never encountered a market in which finding stocks we perceive to be obvious bargains is as difficult as this one. This observation won’t prevent us from buying stocks if we find opportunities we like, but recognizing where one might be in the valuation cycle is important. We don’t believe it is a time to stretch to get fully invested to try to keep up with other investors or to beat a benchmark, but if we find a compelling investment opportunity tomorrow, we will buy it.
The absence of downside market volatility is also quite unusual. A research note published by Deutsche Bank in May 2015 noted that since 1957, the S&P500 falls by 10% on average once about every 18 months. Since coming out of the financial crisis in 2009, the S&P500 has put two of the longest stretches without a 10% correction back to back, with but one “official” 10% sell-off that occurred back in 2011 (and which was closer to 20%). There was a very close call in October 2014, when the S&P500 very nearly dropped by 10%, but this sell-off was very brief, and unfortunately for us the market immediately rebounded to new highs. Even so, we were able to deploy capital quickly during that short window of opportunity, which set the Fund up for a decent fourth calendar quarter 2014 performance. As value investors, we do need occasional volatility in the markets to shake out some bargains, which are usually best created by sellers motivated to get out at any price. It is our sense that the longer the market goes without substantial downside volatility, the more complacent investors tend to get, and the more risk they feel comfortable taking. While recent downside volatility has been muted, when volatility did erupt in 2011, we had one of the most volatile years in memory.
For our covered call strategy to work really well, we need what we will call “healthy” volatility, with a 10% sell-off every 18-24 months once again being close to the ideal. Extreme volatility such as that experienced in 2011 tends not to be ideal for our covered call strategy, usually because we’d rather take advantage of cheap prices simply by purchasing stocks outright when they are deeply undervalued and then waiting to sell covered calls on certain positions as the stock prices get closer to our fair value targets.
Three Choices
While we don’t have any control over the type of market environment we encounter or what prices other investors are willing to pay for stocks, we do have a choice in how we respond as the market moves over time. In this case, we could choose to relax our buying standards a bit to allow us to remain fully invested or we could relax our selling discipline to allow us to hold our securities beyond our traditional full value levels in the hopes of getting greater participation in a market rise. Alternatively, we could deploy our covered call strategy despite the fact that current option premiums we’d receive are not nearly as good as what we routinely garnered in the past, and thereby stay more fully invested.
Taking the covered call question first, we are not at all tempted to change our standards there, simply because selling covered calls is an activity akin to selling insurance, where one receives the certainty of a relatively modest payment to bear the risk of a potentially large loss for a specified period of time. This type of activity is all about risk assessment, and it is critical that one gets well paid for the risk assumed. Covered call selling can be a terrific source of income generation and tends to benefit the Fund in choppy sideways markets and, to a lesser extent, can help cushion losses in a modest down market. However, the success of the strategy relies on nuanced judgment and absolute discipline, and cutting corners here won’t help us much in a strongly rising market in any case. We will simply remain opportunistic in our use of covered calls as we have in the past.
We have from time to time considered whether our valuation standards are too strict and our risk aversion excessive when it comes to buying stocks. We tend to use a high hurdle rate relative to the market, and it is true that the Fund’s performance would often benefit from the willingness to pay up slightly in a rising market environment such as we’ve experienced recently. Our valuation models are not simplistic and we try not to be dogmatic in our approach. We conduct significant research on every idea to ensure that we understand the company not just quantitatively but qualitatively. We have historically always been willing to assign higher valuations to businesses of obviously higher quality. Overall we believe that our standards are reasonable and allow us to deploy capital in all but the most expensive market environments. In many different environments prior to 2013 we’ve been well rewarded for our discipline and patience, and eighteen months of making less money than others isn’t enough evidence in our minds to convince us that we need to change.
| | |
| 4 | www.centaurmutualfunds.com |
| Centaur Total Return Fund | Shareholder Letter |
| | April 30, 2015 (Unaudited) |
If there has been a concern, it is that in a fully valued market we have occasionally resorted to purchasing lower quality businesses where the primary attraction is a cheap price as opposed to a great business. We have learned that it would often be better to focus on businesses of higher quality where a mistake of paying a price that is initially 10% too high can often made back with the passage of time. With lower quality businesses, when we get them wrong we tend to suffer larger stock price declines; in addition, a higher percentage of the losses tend to be permanent. On the other hand, we have enjoyed some big winners from some of these ideas. Nevertheless, we do believe we can get a little better in this area and because we tend to be more careful about valuation than most, we may be able to afford a small amount of wiggle room if we are looking at a great business that is getting close to our buying range. Similarly, we may benefit from extending our holding period for the highest quality businesses in our portfolio a bit further into the fair value range before selling our position. After all, they are not easy to replace, and rarely do great businesses “go on sale.” We do want to be cautious in this arena and not be influenced by Mr. Market to move our standards, so let me be clear that we are only talking about those businesses that are clearly of unusually high quality and reliability.
Overall, we don’t believe that there is anything that has gone wrong with our investing approach or process that explains the Fund’s rather unexciting recent performance. Rather, we believe that experiencing an extended period of under-performance every now and again is inevitable for any actively managed strategy, and that this is very much the type of environment that we would expect to find most challenging from a relative performance standpoint.
We want to complete our discussion by stating that holding ample cash in the portfolio is not something we consider to be a bad thing; it only becomes uncomfortable after a lengthy period of rising market prices. In a falling market cash has the potential to be a strategic weapon of great value. Further, we do believe that the market’s overall valuation is currently in a rarified zone that has only a few historical precedents, and on those occasions where valuations were similar, subsequent investor experience was, to put it mildly, unpleasant. It may be that this time is different and that historically low interest rates, if they persist indefinitely into the future, can ultimately justify today’s elevated market valuation. We think it is unwise to bet your capital on that possibility.
Over long periods of time, the stock market tends to be mean-reverting, and we sense that after a relentless six year stretch of rising stock prices this particular bull market may be getting stretched. Having witnessed first-hand the 80% decline in the NASDAQ index over a three-year period and having much more recently managed the Fund through the 2008-2009 crisis we do not forget that points can come off the stock market scoreboard much faster than people perceive. Should we encounter even a garden variety 10-15% market correction at some point in 2015, the Fund’s cash position and our ability to put it to work quickly could become a very valuable luxury not available to us were we to encounter such a scenario fully invested.
Portfolio Update
As of April 30, 2015 the Centaur Total Return Fund was approximately 78.5% invested in equities, warrants, and convertible bonds spread across 29 holdings, offset by covered call liabilities equal to less than 0.02% of the Fund’s assets. Cash and money market funds represented approximately 21% of the Fund’s assets. The top ten investments represented approximately 43% of Fund assets.
As of April 30, 2015 our top 10 positions were as follows:
| Position | % of Fund Assets |
| International Speedway Corp., Class A | 5.82% | |
| Alleghany Corp. | 5.54% | |
| Kulicke & Soffa Industries, Inc. | 5.03% | |
| Blucora 4.25% convertible bond maturing 4/1/2019 | 4.92% | |
| EMC Corp. | 4.14% | |
| Speedway Motorsports, Inc. | 3.81% | |
| Tetragon Financial Group, Ltd. | 3.63% | |
| Keysight Technologies, Inc. | 3.54% | |
| Berkshire Hathaway, Inc., Class B | 3.48% | |
| Perry Ellis International, Inc. | 3.33% | |
| TOTAL | 43.24% | |
Please refer to the Schedule of Investments section of the Annual Report for a complete listing of the Fund holdings and the amount each represents of the portfolio. Holdings are subject to change without notice.
| | |
| Semi-Annual Report | April 30, 2015 | 5 |
| Centaur Total Return Fund | Shareholder Letter |
| | April 30, 2015 (Unaudited) |
Commentary on Fund Holdings
We will highlight some of the Fund’s recent portfolio holdings in this letter, though with the disclaimer that the Fund’s holdings can and do change in accordance with market prices and with new information.
The Fund’s largest investment takes the form of two publicly traded NASCAR companies, International Speedway and Speedway Motorsports. Between them, these two companies own virtually all the tracks that host the NASCAR racing events, and therefore represent somewhat unique assets. In NASCAR, unlike other professional sports, the venue owner receives a very healthy share of the revenue generated by the sport. NASCAR’s popularity has declined in recent years after hitting a peak in the late 1990s, but the sport still draws a very loyal fan base to its events. We believe that recent attendance figures may point to a modest rebound, given that the NASCAR fan base may only now be starting to emerge fully from the effects of the economic downturn. In addition, NASCAR signed a 10-year TV extension that runs through 2024 that compares favorably to the prior deal and which provides significant revenue and profit visibility going forward. We believe the stocks are attractively valued and that at the Fund’s purchase prices, the market valuations were considerably lower than our estimate for the replacement cost for the tracks. At April 30, 2015, the two securities together comprised 9.5% of the Fund’s NAV.
Our position in Blucora takes the form of convertible bonds that mature in April 2019. The bonds pay us 4.25% interest, but include a convertibility function that allows us the option to convert into common shares at a premium to today’s price. This particular investment is one that we would categorize as low risk / low reward, but there is a possibility that the reward could turn out to be much better than that. Blucora’s primary asset is TaxAct, which is an online tax return business that competes with Quicken’s TurboTax and similar services. The company also owns a legacy search engine business as well as an integrated e-commerce business that primarily offers consumer electronics at value prices. What we find intriguing about the bond is that we believe the company is a very high quality credit given that it has sufficient cash on the balance sheet to pay off the bonds and its business is highly cash generative. We therefore believe that credit risk is low, and we are quite confident that our capital will be repaid at maturity. The potential upside comes from the possibility that the business turns out to be better than the market currently perceives between now and 2019. We calculate that if Blucora simply generates cash at a rate consistent with 2014’s performance for the next several years and allowed that cash to pile up on the balance sheet between now and 2019, the incremental value could easily push the stock price to a figure well above the conversion price, thereby offering us potential equity-like returns with bond-like risk. The Fund had approximately 4.9% of NAV invested in the Blucora bonds as of April 30, 2015.
Acknowledgements
Normally we would end our letter at this point, but given the Fund’s recent 10-year milestone we would like to offer a few words of acknowledgment. That the Fund has managed to survive ten years is something of a miracle, given that it was launched on a tiny budget and has never been marketed to any extent. And though managing a little mutual fund for ten years is not exactly a herculean feat, we at Centaur Capital have invested a good bit of our own money and a whole lot of ourselves into this venture over the last decade. We are truly grateful to have had the opportunity.
First and foremost, a mutual fund can’t very well exist without investors. We would therefore like to thank the Fund’s investors. We consider it an immense honor to be entrusted with your capital, and we will do our best to protect and grow your investment.
Our thanks also go to Whitney Tilson and Glenn Tongue, who as our joint venture partners helped us launch the Fund back in 2005 as the Tilson Dividend Fund. We would also like to acknowledge the Fund’s directors: James Speed, Thomas Douglass, and the recently retired Jack Brinson. Tom Steed of Kilpatrick Townsend has served as the mutual fund trust legal counsel for the duration, and we are grateful for his outstanding service. Thanks also to Morris Simkin, who has served as independent counsel to the board. Rick Schumacher has taken on fund-related tasks and projects of all shapes and sizes with his unique combination of skill and good humor. Finally, we wish to thank the nice people at ALPS Fund Services, which handles the day-to-day operations of the Fund, and who have been a pleasure to work with.
Respectfully submitted,
Zeke Ashton
Portfolio Manager, Centaur Total Return Fund
| | |
| 6 | www.centaurmutualfunds.com |
| Centaur Total Return Fund | Performance Update |
| | April 30, 2015 (Unaudited) |
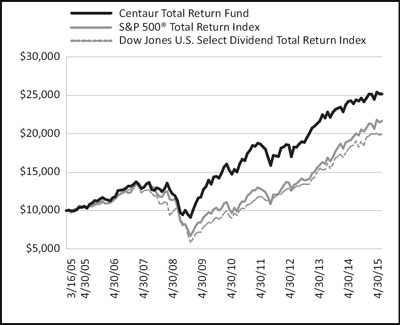
Growth of $10,000 Investment (Unaudited)
For the period from March 16, 2005 (Date of Initial Public Investment) to April 30, 2015
Performance Returns for the period ended April 30, 2015
Average
Annual Total Returns | | One Year | | | Five Year | | | Ten Year | | | Since
Inception* | | | Gross
Expense
Ratio** | |
| Centaur Total Return Fund | | | 3.70% | | | | 9.42% | | | | 9.70% | | | | 9.56% | | | | 2.39% | |
Cumulative Total Investment Returns | | Since
Inception* | | | Final Value of
$10,000 Investment | |
| Centaur Total Return Fund | | | 151.95% | | | $ | 25,195 | |
S&P 500® Total Return Index | | | 116.88% | | | $ | 21,688 | |
| Dow Jones U.S. Select Dividend Total Return Index | | | 99.46% | | | $ | 19,946 | |
This graph assumes an initial $10,000 investment at March 16, 2005 (Date of Initial Public Investment). The Centaur Total Return Fund (the “Fund”) charges a redemption fee of 2% of the amount redeemed on redemptions of fund shares occurring within one year following the issuance of such shares. All dividends and distributions are reinvested, if any. This graph depicts the performance of the Fund versus the S&P 500 Total Return Index and the Dow Jones U.S. Select Dividend Total Return Index. It is important to note the Fund is a professionally managed mutual fund while the indices are not available for investment and are unmanaged. The comparison is shown for illustrative purposes only.
| * | The Fund’s inception date – March 16, 2005 (Date of Initial Public Investment). |
| ** | The gross expense ratio shown is from the Fund’s prospectus dated February 27, 2015. This number may vary from the expense ratio shown elsewhere in this report because it is based on a different time period and, if applicable, does not include fee or expense waivers. |
Performance quoted above represents past performance, which is no guarantee of future results. Investment return and principal value will fluctuate so that shares, when redeemed, may be worth more or less than their original cost. Current performance may be lower or higher than the performance data quoted. An investor may obtain performance data, current to the most recent month-end, by visiting www.centaurmutualfunds.com.
The graph and table do not reflect the deduction of taxes that a shareholder would pay on Fund distributions or the redemption of Fund shares. Average annual total returns are historical in nature and measure net investment income and capital gain or loss from portfolio investments assuming reinvestments of dividends, if any.
| | |
| Semi-Annual Report | April 30, 2015 | 7 |
| Centaur Total Return Fund | Disclosure of Fund Expenses |
| | April 30, 2015 (Unaudited) |
As a shareholder of the Fund, you incur two types of costs: (1) transaction costs, which may include redemption fees for shares redeemed within one year and (2) ongoing costs, including management fees and other Fund expenses. This example is intended to help you understand your ongoing costs (in dollars) of investing in the Fund and to compare these costs with the ongoing costs of investing in other mutual funds. The example is based on an investment of $1,000 invested at the beginning of the period and held for the entire period as indicated below.
Actual Expenses – The first line of the table below provides information about the actual account values and actual expenses. You may use the information in this line, together with the amount you invested, to estimate the expenses that you paid over the period. Simply divide your account value by $1,000 (for example, an $8,600 account value divided by $1,000 = 8.6), then multiply the result by the number in the first line under the heading entitled “Expenses Paid During Period” to estimate the expenses you paid on your account during this period.
Hypothetical Example for Comparison Purposes – The second line of the table below provides information about hypothetical account values and hypothetical expenses based on the Fund’s actual expense ratio and an assumed annual rate of return of 5% before expenses, which is not the Fund’s actual return. The hypothetical account values and expenses may not be used to estimate the actual ending account balance or expenses you paid for the period. You may use this information to compare the ongoing costs of investing in the Fund and other funds by comparing this 5% hypothetical example with the 5% hypothetical examples that appear in the shareholder reports of other funds. Please note that the expenses shown in the table are meant to highlight your ongoing costs only and do not reflect any direct costs, such as wire fees or low balance fees. Therefore, the second line of the table is useful in comparing ongoing costs and will not help you determine the relative total costs of owning different funds. In addition, if these direct costs were included, your costs would be higher.
| | | Beginning
Account Value
November 1, 2014 | | | Ending
Account Value
April 30, 2015 | | | Expense
Ratio(a) | | | Expense
Paid During
Period
November 1, 2014 to
April 30, 2015(b) | |
| Actual | | $ | 1,000.00 | | | $ | 1,021.40 | | | | 1.95 | % | | $ | 9.77 | |
| Hypothetical (5% return before expenses) | | $ | 1,000.00 | | | $ | 1,015.12 | | | | 1.95 | % | | $ | 9.74 | |
| (a) | Annualized, based on the Fund’s most recent fiscal half year expenses. |
| (b) | Expenses are equal to the Fund’s annualized expense ratio multiplied by the average account value over the period, multiplied by the number of days in the most recent fiscal half year (181), divided by 365. |
| 8 | www.centaurmutualfunds.com |
| Centaur Total Return Fund | Schedule of Investments |
| | April 30, 2015 (Unaudited) |
| | | Shares | | | Value | |
| COMMON STOCKS - 69.85% | | | | | | |
| | | | | | | |
| Consumer Discretionary - 17.69% | | | | | | |
Iconix Brand Group, Inc.(a) | | | 40,000 | | | | 1,052,400 | |
| International Speedway Corp., Class A | | | 65,000 | | | | 2,363,400 | |
Perry Ellis International, Inc.(a) | | | 56,500 | | | | 1,351,480 | |
The Priceline Group, Inc.(a) | | | 700 | | | | 866,467 | |
| Speedway Motorsports, Inc. | | | 67,500 | | | | 1,545,750 | |
| | | | | | | | 7,179,497 | |
| Consumer Staples - 2.32% | | | | | | | | |
| Vector Group, Ltd. | | | 42,500 | | | | 941,375 | |
| | | | | | | | | |
| Financials - 25.05% | | | | | | | | |
Alleghany Corp.(a) | | | 4,750 | | | | 2,249,220 | |
Berkshire Hathaway, Inc., Class B(a) | | | 10,000 | | | | 1,412,100 | |
| Brookfield Real Estate Services, Inc. | | | 58,500 | | | | 692,885 | |
| Charter Financial Corp. | | | 45,000 | | | | 538,650 | |
| Clifton Bancorp, Inc. | | | 55,000 | | | | 750,750 | |
| Fifth Street Asset Management, Inc. | | | 72,500 | | | | 799,675 | |
| Fifth Street Finance Corp. | | | 62,500 | | | | 445,625 | |
Greenlight Capital Re, Ltd., Class A(a) | | | 30,000 | | | | 911,700 | |
| Tetragon Financial Group, Ltd. | | | 150,000 | | | | 1,473,000 | |
| Webster Financial Corp. | | | 25,000 | | | | 895,750 | |
| | | | | | | | 10,169,355 | |
| Health Care - 2.69% | | | | | | | | |
CryoLife, Inc.(b) | | | 25,000 | | | | 255,000 | |
| Trinity Biotech PLC, Sponsored ADR | | | 50,000 | | | | 838,500 | |
| | | | | | | | 1,093,500 | |
| Information Technology - 22.10% | | | | | | | | |
Acxiom Corp.(a)(b) | | | 30,000 | | | | 523,800 | |
Blucora, Inc.(a) | | | 50,000 | | | | 683,500 | |
| EMC Corp. | | | 62,500 | | | | 1,681,875 | |
| FLIR Systems, Inc. | | | 25,000 | | | | 772,250 | |
Immersion Corp.(a)(b)(c) | | | 75,000 | | | | 812,250 | |
Keysight Technologies, Inc.(a) | | | 43,000 | | | | 1,438,780 | |
Kulicke & Soffa Industries, Inc.(a) | | | 135,000 | | | | 2,039,850 | |
| QUALCOMM, Inc. | | | 15,000 | | | | 1,020,000 | |
| | | | | | | | 8,972,305 | |
| | | | | | | | | |
| Total Common Stocks (Cost $26,673,599) | | | | | | | 28,356,032 | |
| | | | | | | | | |
| CLOSED-END FUNDS - 2.04% | | | | | | | | |
| | | | | | | | | |
| Equity Funds - 2.04% | | | | | | | | |
| British Empire Securities and General Trust PLC | | | 100,000 | | | | 828,901 | |
| | | | | | | | | |
| | | | | | | | | |
| Total Closed-End Funds (Cost $851,043) | | | | | | | 828,901 | |
| See Notes to Financial Statements. | |
| Semi-Annual Report | April 30, 2015 | 9 |
| Centaur Total Return Fund | Schedule of Investments |
| | April 30, 2015 (Unaudited) |
| | | Principal Value | | | Value | |
| CONVERTIBLE CORPORATE BONDS - 3.25% | | | | | | |
| | | | | | | |
| Information Technology - 3.25% | | | | | | |
| Blucora, Inc., 4.25%, 4/1/2019 | | $ | 1,400,000 | | | | 1,316,875 | |
| | | | | | | | | |
| Total Convertible Corporate Bonds (Cost $1,498,217) | | | | | | | 1,316,875 | |
| | | | | | | | | |
| | | Shares | | | Value | |
| WARRANTS - 3.31% | | | | | | | | |
| | | | | | | | | |
| Financials - 3.31% | | | | | | | | |
| JPMorgan Chase & Co., Strike Price: $42.39, Expires: 10/28/2018 | | | 33,500 | | | | 790,935 | |
| The PNC Financial Services Group, Inc., Strike Price: $67.33, Expires: 12/31/2018 | | | 22,000 | | | | 552,640 | |
| | | | | | | | | |
| Total Warrants (Cost $1,116,687) | | | | | | | 1,343,575 | |
| | | | | | | | | |
| SHORT TERM INVESTMENTS - 17.19% | | | | | | | | |
| | | | | | | | | |
Fidelity Institutional Money Market Fund - Government Portfolio, 0.010%(d) | | | 6,977,235 | | | | 6,977,235 | |
| | | | | | | | | |
| Total Short Term Investments (Cost $6,977,235) | | | | | | | 6,977,235 | |
| | | | | | | | | |
| Total Value of Investments (Cost $37,116,781) - 95.64% | | | | | | $ | 38,822,618 | |
| | | | | | | | | |
Other Assets in Excess of Liabilities - 4.36%(e) | | | | | | | 1,771,263 | |
| | | | | | | | | |
| Net Assets - 100.00% | | | | | | $ | 40,593,881 | |
(a) | Non-income producing investment. |
(b) | Portion of security is subject to call options written. |
(c) | Security position is partially held in a segregated account as collateral for written options for a market value of $568,575. |
(d) | Represents 7 day effective yield. |
(e) | Includes cash which is being held as collateral for written options in the amount of $200,000. |
| Schedule of Written Options | | | | | Exercise Price | | Maturity Date | | Value | |
| WRITTEN CALL OPTIONS - 0.14% | | | | | | | | | | |
| Acxiom Corp. | | | 70 | | | $ | 20.00 | | 8/21/2015 | | $ | (4,375 | ) |
| CryoLife, Inc. | | | 200 | | | | 10.00 | | 7/17/2015 | | | (15,000 | ) |
| CryoLife, Inc. | | | 50 | | | | 10.00 | | 10/16/2015 | | | (5,875 | ) |
| Immersion Corp. | | | 100 | | | | 12.50 | | 8/21/2015 | | | (6,000 | ) |
| Immersion Corp. | | | 100 | | | | 10.00 | | 8/21/2015 | | | (16,000 | ) |
| Immersion Corp. | | | 100 | | | | 12.50 | | 11/20/2015 | | | (9,500 | ) |
| | | | | | | | | | | | | | |
| Total Written Call Options (Premiums Received $55,336) | | | | | | | | $ | (56,750 | ) |
| Common Abbreviations: |
| ADR | - | American Depositary Receipt. |
| Ltd. | - | Limited. |
| PLC | - | Public Limited Company. |
| See Notes to Financial Statements. | |
| 10 | www.centaurmutualfunds.com |
| Centaur Total Return Fund | Schedule of Investments |
| | April 30, 2015 (Unaudited) |
| Summary of Investments | | % of Net Assets | | | Value | |
| Common Stocks | | | | | | |
| Consumer Discretionary | | | 17.69 | % | | $ | 7,179,497 | |
| Consumer Staples | | | 2.32 | | | | 941,375 | |
| Financials | | | 25.05 | | | | 10,169,355 | |
| Health Care | | | 2.69 | | | | 1,093,500 | |
| Information Technology | | | 22.10 | | | | 8,972,305 | |
| Closed-End Funds | | | 2.04 | | | | 828,901 | |
| Convertible Corporate Bonds | | | 3.25 | | | | 1,316,875 | |
| Warrants | | | 3.31 | | | | 1,343,575 | |
| Short Term & Other Assets in Excess of Liabilities | | | 21.55 | | | | 8,748,498 | |
| Total | | | 100.00 | % | | $ | 40,593,881 | |
| See Notes to Financial Statements. | |
| Semi-Annual Report | April 30, 2015 | 11 |
| Centaur Total Return Fund | Statement of Assets and Liabilities |
| | April 30, 2015 (Unaudited) |
| Assets: | | | |
| Investments, at cost | | $ | 37,116,781 | |
| Investments, at value | | $ | 38,822,618 | |
| Deposit held by broker for options | | | 200,000 | |
| Foreign cash, at value (Cost $4,105) | | | 4,121 | |
| Receivables: | | | | |
| Investments sold | | | 2,278,875 | |
| Dividends and interest | | | 22,631 | |
| Other assets | | | 77,792 | |
| | | | | |
| Total Assets | | | 41,406,037 | |
| | | | | |
| Liabilities: | | | | |
| Call options written, at value (premiums received $55,336) | | | 56,750 | |
| Payables: | | | | |
| Investments purchased | | | 666,446 | |
| Fund shares repurchased | | | 1,667 | |
| Accrued expenses: | | | | |
| Advisory fees | | | 35,106 | |
| Trustees’ fees and expenses | | | 847 | |
| Custodian fees | | | 4,156 | |
| Legal fees | | | 901 | |
| Audit and tax preparation fees | | | 7,009 | |
| Fund Administration fees | | | 15,429 | |
| Transfer Agency Fees | | | 10,314 | |
| Printing fees | | | 13,204 | |
| Other expenses | | | 327 | |
| | | | | |
| Total Liabilities | | | 812,156 | |
| | | | | |
| Net Assets | | $ | 40,593,881 | |
| | | | | |
| Net Assets Consist of: | | | | |
| Paid-in Capital | | $ | 37,482,655 | |
| Accumulated net investment loss | | | (341,490 | ) |
| Accumulated net realized gain on investments, written options and foreign currency transactions | | | 1,749,558 | |
| Net unrealized appreciation on investments, written options and foreign currency translations | | | 1,703,158 | |
| Net Assets | | $ | 40,593,881 | |
| Shares Outstanding, no par value (unlimited authorized shares) | | | 3,070,563 | |
Net Asset Value, Offering Price and Redemption Price Per Share* | | $ | 13.22 | |
* | Redemption price may differ from NAV if redemption fee is applied. |
| See Notes to Financial Statements. | |
| 12 | www.centaurmutualfunds.com |
| Centaur Total Return Fund | Statement of Operations |
| | For the Six Months Ended April 30, 2015 (Unaudited) |
| Investment Income: | | | |
| Interest | | $ | 11,289 | |
| Dividends | | | 195,855 | |
| Foreign tax withheld | | | (5,855 | ) |
| Total Investment Income | | | 201,289 | |
| | | | | |
| Expenses: | | | | |
| Advisory fees (note 3) | | | 320,716 | |
| Administration fees | | | 87,077 | |
| Transfer agent fees | | | 35,221 | |
| Registration and filing administration fees | | | 14,241 | |
| Custody fees | | | 6,903 | |
| Legal fees | | | 13,408 | |
| Audit and tax preparation fees | | | 7,009 | |
| Printing expenses | | | 7,266 | |
| Trustees’ fees and expenses | | | 5,846 | |
| Insurance expenses | | | 9,529 | |
| Other operating expenses | | | 2,316 | |
| Total Expenses | | | 509,532 | |
| Expenses waived by Advisor (note 3) | | | (92,605 | ) |
| Net Expenses | | | 416,927 | |
| | | | | |
| Net Investment Loss | | | (215,638 | ) |
| | | | | |
| Net Realized and Unrealized Gain (Loss) from Investments, Written Options and Foreign Currency: | | | | |
| Net realized gain (loss) from : | | | | |
| Investments | | | 1,876,799 | |
| Written options | | | 23,890 | |
| Foreign currency transactions | | | (64,423 | ) |
| Net realized gain | | | 1,836,266 | |
| Change in unrealized depreciation on: | | | | |
| Investments | | | (692,608 | ) |
| Written options | | | (830 | ) |
| Foreign currency translations | | | (612 | ) |
| Net unrealized depreciation | | | (694,050 | ) |
| Net Realized and Unrealized Gain on Investments, Written Options and Foreign Currency | | | 1,142,216 | |
| | | | | |
| Net Increase in Net Assets Resulting From Operations | | $ | 926,578 | |
| See Notes to Financial Statements. | |
| Semi-Annual Report | April 30, 2015 | 13 |
| Centaur Total Return Fund | Statements of Changes in Net Assets |
| | | For the Six | | | For the | |
| | | Months Ended | | | Year Ended | |
| | | April 30, 2015 (Unaudited) | | | October 31, 2014 | |
| Operations: | | | | | | |
| Net investment loss | | $ | (215,638 | ) | | $ | (340,384 | ) |
| Net realized gain from investments, written options and foreign currency transactions | | | 1,836,266 | | | | 3,475,005 | |
| Change in unrealized appreciation (depreciation) on investments, written options and foreign currency translations | | | (694,050 | ) | | | 34,193 | |
| Net Increase in Net Assets Resulting from Operations | | | 926,578 | | | | 3,168,814 | |
| | | | | | | | | |
| Distributions to Shareholders: (note 5) | | | | | | | | |
| Net investment income | | | – | | | | (93,496 | ) |
| Net realized gains on investments | | | (3,261,072 | ) | | | (11,041,723 | ) |
| Decrease in Net Assets Resulting from Distributions | | | (3,261,072 | ) | | | (11,135,219 | ) |
| | | | | | | | | |
| Capital Share Transactions: | | | | | | | | |
| Shares sold | | | 1,308,144 | | | | 5,483,275 | |
| Redemption fees | | | 4,012 | | | | 49,924 | |
| Reinvested distributions | | | 2,926,847 | | | | 10,198,764 | |
| Shares redeemed | | | (6,496,784 | ) | | | (28,048,567 | ) |
| Decrease from Capital Share Transactions | | | (2,257,781 | ) | | | (12,316,604 | ) |
| Net Decrease in Net Assets | | | (4,592,275 | ) | | | (20,283,009 | ) |
| | | | | | | | | |
| Net Assets: | | | | | | | | |
| Beginning of period | | | 45,186,156 | | | | 65,469,165 | |
| End of period* | | $ | 40,593,881 | | | $ | 45,186,156 | |
| | | | | | | | | |
| *Including Accumulated Net Investment Loss | | $ | (341,490 | ) | | $ | (125,852 | ) |
| | | | | | | | | |
| Share Information: | | | | | | | | |
| Shares sold | | | 97,927 | | | | 383,714 | |
| Reinvested distributions | | | 224,969 | | | | 786,335 | |
| Shares redeemed | | | (485,958 | ) | | | (2,036,227 | ) |
| Net Decrease in Capital Shares | | | (163,062 | ) | | | (866,178 | ) |
| Shares Outstanding, Beginning of Period | | | 3,233,625 | | | | 4,099,803 | |
| Shares Outstanding, End of Period | | | 3,070,563 | | | | 3,233,625 | |
| See Notes to Financial Statements. | |
| 14 | www.centaurmutualfunds.com |
| Centaur Total Return Fund | Financial Highlights |
| | For a share outstanding during each of the periods presented. |
| | | For the Six Months Ended April 30, 2015 (Unaudited) | | For the Year Ended October 31, 2014 | | For the Year Ended October 31, 2013 | | For the Year Ended October 31, 2012 | | For the Year Ended October 31, 2011 | | For the Year Ended October 31, 2010 | |
| Net Asset Value, Beginning of Period | | $ | 13.97 | | | $ | 15.97 | | | $ | 14.06 | | | $ | 13.13 | | | $ | 12.93 | | | $ | 10.41 | |
| Income from Investment Operations: | | | | | | | | | | | | | | | | | | | | | | | | |
| Net investment income (loss) | | | (0.07 | ) | | | (0.12 | ) | | | (0.12 | ) | | | 0.01 | | | | 0.05 | (a) | | | 0.00 | (b) |
| Net realized and unrealized gain on investments | | | 0.35 | | | | 0.90 | | | | 3.12 | | | | 1.20 | | | | 0.26 | (a) | | | 2.50 | |
| Total from Investment Operations | | | 0.28 | | | | 0.78 | | | | 3.00 | | | | 1.21 | | | | 0.31 | | | | 2.50 | |
| | | | | | | | | | | | | | | | | | | | | | | | | |
| Less Distributions: | | | | | | | | | | | | | | | | | | | | | | | | |
| From net investment income | | | – | | | | (0.02 | ) | | | (0.22 | ) | | | (0.07 | ) | | | (0.07 | ) | | | – | |
| From net realized gains on investments | | | (1.03 | ) | | | (2.78 | ) | | | (0.88 | ) | | | (0.26 | ) | | | (0.11 | ) | | | – | |
| Total Distributions | | | (1.03 | ) | | | (2.80 | ) | | | (1.10 | ) | | | (0.33 | ) | | | (0.18 | ) | | | – | |
| | | | | | | | | | | | | | | | | | | | | | | | | |
| Paid in Capital: | | | | | | | | | | | | | | | | | | | | | | | | |
| Paid in capital (from redemption fees) | | | 0.00 | (b) | | | 0.02 | | | | 0.01 | | | | 0.05 | | | | 0.07 | | | | 0.02 | |
| Total paid in capital | | | 0.00 | | | | 0.02 | | | | 0.01 | | | | 0.05 | | | | 0.07 | | | | 0.02 | |
| | | | | | | | | | | | | | | | | | | | | | | | | |
| Net Asset Value, End of Period | | $ | 13.22 | | | $ | 13.97 | | | $ | 15.97 | | | $ | 14.06 | | | $ | 13.13 | | | $ | 12.93 | |
| | | | | | | | | | | | | | | | | | | | | | | | | |
Total Return(c) | | | 2.14 | %(d) | | | 6.38 | % | | | 22.74 | % | | | 9.86 | % | | | 2.93 | % | | | 24.21 | % |
| | | | | | | | | | | | | | | | | | | | | | | | | |
| Net Asset Value, End of Period (in thousands) | | $ | 40,594 | | | $ | 45,186 | | | $ | 65,469 | | | $ | 62,771 | | | $ | 79,340 | | | $ | 34,462 | |
| | | | | | | | | | | | | | | | | | | | | | | | | |
| Average Net Assets for the Period (in thousands) | | $ | 43,117 | | | $ | 53,791 | | | $ | 63,690 | | | $ | 71,761 | | | $ | 72,885 | | | $ | 15,616 | |
| | | | | | | | | | | | | | | | | | | | | | | | | |
Ratio of Gross Expenses to Average Net Assets(e) | | | 2.38 | %(f) | | | 2.21 | % | | | 2.15 | % | | | 2.12 | % | | | 2.05 | % | | | 2.78 | % |
Ratio of Net Expenses to Average Net Assets(e) | | | 1.95 | %(f) | | | 1.95 | % | | | 1.95 | % | | | 1.95 | % | | | 1.95 | % | | | 1.95 | % |
| Ratio of Net Investment Income (Loss) to Average Net Assets | | | (1.01 | )%(f) | | | (0.63 | %) | | | (0.78 | %) | | | 0.24 | % | | | 0.13 | % | | | 0.09 | % |
| | | | | | | | | | | | | | | | | | | | | | | | | |
| Portfolio Turnover Rate | | | 66 | %(d) | | | 135 | % | | | 170 | % | | | 91 | % | | | 110 | % | | | 89 | % |
(a) | The amount shown for a share outstanding throughout the year may not correlate with the Statement of Operations for the year due to the timing of sales and redemptions of Fund shares in relation to income earned and/or fluctuating market value of the investments of the Fund. |
(b) | Actual amount is less than $0.01 per share. |
(c) | Includes adjustments in accordance with accounting principles generally accepted in the United States of America and, consequently, the net asset value for financial reporting purposes and the returns based upon those net asset values may differ from the net asset values and returns for shareholder transactions. |
(e) | The expense ratios listed above reflect total expenses prior to any waivers and reimbursements (gross expense ratio) and after any waivers and reimbursements (net expense ratio). |
| See Notes to Financial Statements. | |
| Semi-Annual Report | April 30, 2015 | 15 |
| Centaur Total Return Fund | Notes to Financial Statements |
| | April 30, 2015 (Unaudited) |
The Centaur Total Return Fund (the “Fund”), is an active investment portfolio of The Centaur Mutual Funds Trust, (the “Trust”) which is organized as a Delaware statutory trust and is registered under the Investment Company Act of 1940 (the “1940 Act”), as amended, as an open-ended management investment company. Prior to October 31, 2013, the Fund was known as The Tilson Dividend Fund and the Trust was known as The Tilson Investment Trust. The Fund is classified as non-diversified as defined in the 1940 Act.
The Fund commenced operations on March 16, 2005. The investment objective of the Fund is to seek maximum total return through a combination of capital appreciation and current income. The Fund invests in companies that Centaur Capital Partners, L.P. (the “Advisor”) believes to be undervalued in their respective markets, but which also offer high dividend yields relative to the average yields of the broad market.
| 2. SIGNIFICANT ACCOUNTING POLICIES |
The following is a summary of significant accounting policies consistently followed by the Fund. The policies are in conformity with accounting principles generally accepted in the United States of America (“GAAP”). The Fund is considered an investment company for financial reporting purposes under GAAP.
Estimates
The preparation of financial statements in conformity with GAAP requires management to make estimates and assumptions that affect the reported amounts of assets and liabilities and disclosure of contingent assets and liabilities at the date of the financial statements and the reported amounts of increases and decreases in the net assets from operations during the reported period. Actual results could differ from those estimates.
Investment Valuation
The Fund’s investments in securities are carried at fair value. Securities listed on an exchange or quoted on a national market system are valued at the last sales price as of 4:00 p.m. Eastern Time. Securities traded in the NASDAQ over-the-counter market are generally valued at the NASDAQ Official Closing Price. Other securities traded in the over-the-counter market and listed securities for which no sale was reported on that date are valued at the most recent bid price. Securities and assets for which representative market quotations are not readily available or which cannot be accurately valued using the Fund’s normal pricing procedures are valued at fair value as determined in good faith under policies approved by the Trustees. Fair value pricing may be used, for example, in situations where (i) a portfolio security is so thinly traded that there have been no transactions for that security over an extended period of time; (ii) the exchange on which the portfolio security is principally traded closes early; or (iii) trading of the portfolio security is halted during the day and does not resume prior to the Fund’s net asset value calculation. A portfolio security’s “fair value” price may differ from the price next available for that portfolio security using the Fund’s normal pricing procedures. Instruments with maturities of 60 days or less are valued at amortized cost, which approximates market value.
Option Valuation
Exchange-listed options are valued at their last quoted sales price as reported on their primary exchange as of 4 p.m. Eastern Time (the “Valuation Time”). For purposes of determining the primary exchange for each exchange-traded portfolio option the following shall apply: (i) if the option is traded on the Chicago Board Options Exchange (“CBOE”), the CBOE shall be considered the primary exchange for such option, unless the Advisor instructs the Administrator in writing to use a different exchange as the primary exchange for such option; and (ii) if the option does not trade on the CBOE, the Advisor shall instruct the Administrator in writing as to the primary exchange for such option. Unlisted options for which market quotations are readily available are valued at the last quoted sales price at the Valuation Time. If an option is not traded on the valuation date, the option shall be priced at the mean of the last quoted bid and ask prices as of the Valuation Time. An option may be valued using Fair Valuation when (i) the option does not trade on the valuation date; and (ii) reliable last quoted bid and ask prices as of the Valuation Time are not readily available.
Fair Value Measurement
GAAP establishes a framework for measuring fair value and expands disclosure about fair value measurements. Various inputs are used in determining the value of the Fund’s investments. These inputs are summarized in the three broad levels listed below:
Level 1 – | Unadjusted quoted prices in active markets for identical, unrestricted assets or liabilities that the Fund has the ability to access at the measurement date; |
Level 2 – | Quoted prices which are not active, quoted prices for similar assets or liabilities in active markets or inputs other than quoted prices that are observable (either directly or indirectly) for substantially the full term of the asset or liability; and |
Level 3 – | Significant unobservable prices or inputs (including the Fund’s own assumptions in determining the fair value of investments) where there is little or no market activity for the asset or liability at the measurement date. |
| 16 | www.centaurmutualfunds.com |
| Centaur Total Return Fund | Notes to Financial Statements |
| | April 30, 2015 (Unaudited) |
The availability of observable inputs can vary from security to security and is affected by a wide variety of factors, including, for example, the type of security, whether the security is new and not yet established in the marketplace, the liquidity of markets, and other characteristics particular to the security. To the extent that valuation is based on models or inputs that are less observable or unobservable in the market, the determination of fair value requires more judgment. Accordingly, the degree of judgment exercised in determining fair value is greatest for instruments categorized in Level 3.
An investment asset’s or liability’s level within the fair value hierarchy is based on the lowest level input, individually or in the aggregate, that is significant to fair value measurement.
The valuation techniques used by the Fund to measure fair value during the six months ended April 30, 2015 maximized the use of observable inputs and minimized the use of unobservable inputs.
The inputs or methodology used for valuing securities are not necessarily an indication of the risk associated with investing in those securities. The following is a summary of the inputs used in valuing the Fund’s assets and liabilities as of April 30, 2015:
| Centaur Total Return Fund | | | | | | | | | | | | |
| Investments in Securities at Value | | Level 1 | | | Level 2 | | | Level 3 | | | Total | |
| Assets | | | | | | | | | | | | |
| Common Stocks | | $ | 28,356,032 | | | $ | – | | | $ | – | | | $ | 28,356,032 | |
| Closed‐End Funds | | | 828,901 | | | | – | | | | – | | | | 828,901 | |
| Convertible Corporate Bonds | | | – | | | | 1,316,875 | | | | – | | | | 1,316,875 | |
| Warrants | | | 1,343,575 | | | | – | | | | – | | | | 1,343,575 | |
| Short Term Investments | | | 6,977,235 | | | | – | | | | – | | | | 6,977,235 | |
| Total | | $ | 37,505,743 | | | $ | 1,316,875 | | | $ | – | | | $ | 38,822,618 | |
| Other Financial Instruments | | | | | | | | | | | | | | | | |
| Liabilities | | | | | | | | | | | | | | | | |
| Written Options | | $ | (56,750 | ) | | $ | – | | | $ | – | | | $ | (56,750 | ) |
| Total | | $ | (56,750 | ) | | $ | – | | | $ | – | | | $ | (56,750 | ) |
For the six months ended April 30, 2015, there have been no significant changes to the Fund’s fair value methodologies. The Fund recognizes transfers between levels as of the end of the annual period in which the transfer occurred. During the six months ended April 30, 2015, there were no transfers between Level 1, Level 2 and Level 3 for the Fund.
For the six months ended April 30, 2015, the Fund did not have investments with significant unobservable inputs (Level 3) used in determining
fair value.
Underlying Investment In Other Investment Companies
The Fund currently seeks to achieve its investment objectives by investing a portion of its assets in Fidelity Institutional Money Market Fund. The Fund may redeem its investment from the Fidelity Institutional Money Market Fund at any time if the Advisor determines that it is in the best interest of the Fund and its shareholders to do so.
The performance of the Fund may be directly affected by the performance of the Fidelity Institutional Money Market Fund. The financial statements of the Fidelity Institutional Money Market Fund, a series of the Fidelity Funds, including the portfolio of investments, are included in the Fidelity Institutional Money Market Fund’s NCSR filing dated May 28, 2015, available at www.sec.gov or can be found at www.fidelity.com and should be read in conjunction with the Fund’s financial statements. As of April 30, 2015, the percentage of net assets invested in the Fidelity Institutional Money Market Fund was 17.19%.
Derivative Financial Instruments
The following discloses the Fund’s use of derivative instruments.
The Fund’s investment objective not only permits the Fund to purchase investment securities, it also allows the Fund to enter into various types of derivative contracts such as purchased and written options. In doing so, the Fund will employ strategies in differing combinations to permit it to increase, decrease, or change the level or types of exposure to market factors. Central to those strategies are features inherent to derivatives that make them more attractive for this purpose than equity or debt securities; they require little or no initial cash investment, they can focus exposure on only certain selected risk factors, and they may not require the ultimate receipt or delivery of the underlying security (or securities) to the contract. This may allow the Fund to pursue its objectives more quickly and efficiently than if it were to make direct purchases or sales of securities capable of affecting a similar response to market factors.
| Semi-Annual Report | April 30, 2015 | 17 |
| Centaur Total Return Fund | Notes to Financial Statements |
| | April 30, 2015 (Unaudited) |
Market Risk Factors: In pursuit of the investment objectives, the Fund may seek to use derivatives to increase or decrease its exposure to the following market risk factors:
Equity Risk: Equity risk relates to the change in value of equity securities as they relate to increases or decreases in the general market.
Foreign Exchange Rate Risk: Foreign exchange rate risk relates to the change in the U.S. dollar value of a security held that is denominated in a foreign currency. The value of a foreign currency denominated security will decrease as the dollar appreciates against the currency, while the value of the foreign currency denominated security will increase as the dollar depreciates against the currency.
Risk of Investing in Derivatives
The Fund’s use of derivatives can result in losses due to unanticipated changes in the market risk factors and the overall market.
Derivatives may have little or no initial cash investment relative to their market value exposure and therefore can produce significant gains or losses in excess of their cost. This use of embedded leverage allows the Fund to increase its market value exposure relative to its net assets and can substantially increase the volatility of the Fund’s performance.
Additional associated risks from investing in derivatives also exist and potentially could have significant effects on the valuation of the derivatives and the Fund. Typically, the associated risks are not the risks that the Fund is attempting to increase or decrease exposure to, per the investment objectives, but are the additional risks from investing in derivatives.
One example of these associated risks is liquidity risk, which is the risk that the Fund will not be able to sell the derivative in the open market in a timely manner, and counterparty credit risk, which is the risk that the counterparty will not fulfill its obligation to the Fund.
Option Writing/Purchasing
The Fund may write or purchase option contracts to adjust risk and return of its overall investment positions. When the Fund writes or purchases an option, an amount equal to the premium received or paid by the Fund is recorded as a liability or an asset and is subsequently adjusted to the current market value of the option written or purchased. Premiums received or paid from writing or purchasing options that expire unexercised are treated by the Fund on the expiration date as realized gains or losses. The difference between the premium and the amount paid or received on affecting a closing purchase or sale transaction, including brokerage commissions, is also treated as a realized gain or loss. If an option is exercised, the premium paid or received is added to or subtracted from the cost of the purchase or proceeds from the sale in determining whether the Fund has realized a gain or loss on investment transactions. Risks from entering into option transactions arise from the potential inability of counterparties to meet the terms of the contracts, the potential inability to enter into closing transactions because of an illiquid secondary market and from unexpected movements in security values. Written option activity for the fiscal year ended April 30, 2015 was as follows:
Centaur Total Return Fund Option Contracts Written for the six months ended April 30, 2015 | | Contracts | | | Premiums Received | |
| Options Outstanding, Beginning of Year | | | 100 | | | $ | 8,416 | |
| Options written | | | 1,250 | | | | 123,049 | |
| Options closed | | | (630 | ) | | | (67,713 | ) |
| Options exercised | | | (100 | ) | | | (8,416 | ) |
| Options Outstanding, End of the Period | | | 620 | | | $ | 55,336 | |
| 18 | www.centaurmutualfunds.com |
| Centaur Total Return Fund | Notes to Financial Statements |
| | April 30, 2015 (Unaudited) |
Statement of Assets and Liabilities – Fair Value of Derivative Instruments as of April 30, 2015(a):
| | | | | | | | | | | |
| Risk Exposure | | Asset Derivatives Statement of Assets and Liabilities Location | | Fair Value | | Liability Derivatives Statement of Assets and Liabilities Location | | | Fair Value | |
Equity Contracts
(Warrants) | | Investments, at Value | | $ | 1,343,575 | | N/A | | | | N/A | |
Equity Contracts
(Written Options Contracts) | | N/A | | | N/A | | Call options written, at value | | | $ | 56,750 | |
| | | | | $ | 1,343,575 | | | | | $ | 56,750 | |
| (a) | For open derivative instruments as of April 30, 2015, see the Schedule of Investments, which is also indicative of the activity for the six months ended April 30, 2015. |
The effect of derivative instruments on the Statement of Operations for the six months ended April 30, 2015:
| Risk Exposure | | Statement of Operations Location | | Realized Gain (Loss) on Derivatives Recognized in Income | | | Change in Unrealized Appreciation (Depreciation) on Derivatives Recognized in Income | |
| Equity Contracts (Warrants) | | Net realized gain (loss) from: Investments/Change in unrealized appreciation (depreciation) on: Investments | | $ | 41,310 | | | $ | 71,677 | |
| Equity Contracts (Purchased Options Contracts) | | Change in unrealized appreciation (depreciation) on: Investments | | | (57,259 | ) | | | 43,579 | |
| Equity Contracts (Written Options Contracts) | | Net realized gain (loss) from: Written options/Change in unrealized appreciation (deprecation) on: Written options | | | 23,890 | | | | (830 | ) |
| Total | | | | $ | 7,941 | | | $ | 114,426 | |
Foreign Currency Translation
Portfolio securities and other assets and liabilities denominated in foreign currencies are translated into U.S. dollars based on the exchange rate of such currencies against U.S. dollars on the date of valuation. Purchases and sales of securities and income items denominated in foreign currencies are translated into U.S. dollars at the exchange rate in effect on the transaction date. The Fund does not separately report the effect of changes in foreign exchange rates from changes in market prices on securities held. Such changes are included in net realized and unrealized gain or loss
from investments.
Realized foreign exchange gains or losses arise from sales of foreign currencies, currency gains or losses realized between the trade and settlement dates on securities transactions and the difference between the recorded amounts of dividends, interest, and foreign withholding taxes, and the U.S. dollar equivalent of the amounts actually received or paid. Net unrealized foreign exchange gains and losses arise from changes in foreign exchange rates on foreign denominated assets and liabilities other than investments in securities held at the end of the reporting period.
Investment Transactions and Investment Income
Investment transactions are accounted for as of the date purchased or sold (trade date). Dividend income is recorded on the ex-dividend date. Certain dividends from foreign securities will be recorded as soon as the Fund is informed of the dividend if such information is obtained subsequent to the ex-dividend date. Interest income is recorded on the accrual basis and includes amortization of discounts and premiums. Gains and losses are determined on the identified cost basis, which is the same basis used for federal income tax purposes.
Expenses
The Fund bears expenses incurred specifically for the Fund and general Trust expenses.
| Semi-Annual Report | April 30, 2015 | 19 |
| Centaur Total Return Fund | Notes to Financial Statements |
| | April 30, 2015 (Unaudited) |
Dividend Distributions
The Fund may declare and distribute dividends from net investment income (if any) at the end of each calendar quarter. Distributions from capital gains (if any) are generally declared and distributed annually. Dividends and distributions to shareholders are recorded on ex-date.
Fees on Redemptions
The Fund charges a redemption fee of 2.00% on redemptions of Fund’s shares occurring within one year following the issuance of such shares. The redemption fee is not a fee to finance sales or sales promotion expenses, but is paid to the Fund to defray the costs of liquidating an investor and discouraging short-term trading of the Fund’s shares. No redemption fee will be imposed on the redemption of shares representing dividends or capital gains distributions, or on amounts representing capital appreciation of shares. The redemption fees charged for the six months ended April 30, 2015 was $4,012.
Warrants
The Fund may invest in warrants. The Fund may purchase warrants issued by domestic and foreign companies to purchase newly created equity securities consisting of common and/or preferred stock. Warrants are derivatives that give the holder the right, but not the obligation to purchase equity issues of the company issuing the warrants, or a related company, at a fixed price either on a date certain or during a set period. The equity security underlying a warrant is authorized at the time the warrant is issued or is issued together with the warrant.
Investing in warrants can provide a greater potential for profit or loss than an equivalent investment in the underlying security, and, thus, can be a speculative investment. At the time of issue, the cost of a warrant is substantially less than the cost of the underlying security itself, and price movements in the underlying security are generally magnified in the price movements of the warrant. This leveraging effect enables the investor to gain exposure to the underlying security with a relatively low capital investment.
This leveraging increases an investor’s risk; however, in the event of a decline in the value of the underlying security, a complete loss of the amount invested in the warrant may result. In addition, the price of a warrant tends to be more volatile than, and may not correlate exactly to, the price of the underlying security. If the market price of the underlying security is below the exercise price of the warrant on its expiration date, the warrant will generally expire without value. The value of a warrant may decline because of a decline in the value of the underlying security, the passage of time, changes in interest rates or in the dividend or other policies of the company whose equity underlies the warrant or a change in the perception as to the future price of the underlying security, or any combination thereof. Warrants generally pay no dividends and confer no voting or other rights other than to purchase the underlying security.
Federal Income Taxes
As of and during the six months ended April 30, 2015, the Fund did not have a liability for any unrecognized tax benefits. The Fund files U.S. federal, state, and local tax returns as required. The Fund’s tax returns are subject to examination by the relevant tax authorities until expiration of the applicable statute of limitations which is generally three years after the filing of the tax return. Tax returns for open years have incorporated no uncertain tax positions that require a provision for income taxes.
The Fund’s policy is to continue to comply with the requirements of the Internal Revenue Code that are applicable to regulated investment companies and to distribute all its taxable income to its shareholders. The Fund also intends to distribute sufficient net investment income and net capital gains, if any, so that it will not be subject to excise tax on undistributed income and gains. Therefore, no federal income tax or excise tax provision is required.
| 3. TRANSACTIONS WITH AFFILIATES |
Advisor
Effective September 3, 2013, the Fund entered into an advisory agreement with Centaur Capital Partners, L.P. (the “Advisor”). The Fund pays the Advisor a monthly fee based upon the average daily net assets of the Fund and calculated at an annual rate of 1.50%. For the six months ended April 30, 2015, the Advisor earned advisory fees of $320,716.
Effective September 3, 2013, the Advisor entered into a contractual agreement (“Expense Limit Agreement”) with the Fund through September 3, 2015, to waive a portion of its advisory fee and to reimburse the Fund for other expenses to the extent necessary so that the total expenses incurred by the Fund (exclusive of interest, taxes, brokerage commissions, other expenditures which are capitalized in accordance with GAAP, other extraordinary expenses, dividend expense on securities sold short, “acquired fund fees and expenses” and 12b-1 fees) do not exceed 1.95% of the average daily net assets of the Fund. For the six months ended April 30, 2015, the Advisor waived/reimbursed expenses in the amount
of $92,605.
| 20 | www.centaurmutualfunds.com |
| Centaur Total Return Fund | Notes to Financial Statements |
| | April 30, 2015 (Unaudited) |
Administrator
ALPS Fund Services, Inc. (“ALPS” or the “Administrator”) serves as the Trust’s administrator pursuant to an Administration, Bookkeeping and Pricing Services Agreement (“Administration Agreement”) with the Trust which became effective as of September 30, 2011. The Administrator is also reimbursed by the Trust for certain out-of-pocket expenses.
Compliance Services
ALPS provides services which assist the Trust’s Chief Compliance Officer in monitoring and testing the policies and procedures of the Trust in conjunction with requirements under Rule 38a-1 under the 1940 Act. ALPS is compensated under the Administration Agreement for these services.
Transfer Agent
ALPS serves as transfer, dividend paying, and shareholder servicing agent for the Fund. ALPS is compensated based upon an annual base fee. The Transfer Agent is also reimbursed by the Fund for certain out-of-pocket expenses.
Distributor
ALPS Distributors, Inc. (the “Distributor”) serves as the Fund’s distributor. The Distributor acts as an agent for the Fund and the distributor of its shares.
Certain officers of the Trust are also officers of the Advisor, the Distributor or the Administrator.
| 4. PURCHASES AND SALES OF INVESTMENT SECURITIES |
The aggregate cost of purchases and proceeds from sales of investment securities, excluding short-term securities, are $19,996,173 and $21,484,840, respectively, for the six months ended April 30, 2015.
Distributions are determined in accordance with Federal income tax regulations, which differ from GAAP, and, therefore, may differ significantly in amount or character from net investment income and realized gains for financial reporting purposes. Financial reporting records are adjusted for permanent book/tax differences to reflect tax character but are not adjusted for temporary differences.
Management has reviewed the Fund’s tax positions to be taken on federal income tax returns for the open tax years of 2011, 2012 and 2013, and as of and during the fiscal year ended October 31, 2014, and has determined that the Fund does not have a liability for uncertain tax positions. The Fund recognizes interest and penalties, if any, related to unrecognized tax benefits as income tax expense in the Statement of Operations. During the period, the Fund did not incur any interest or penalties.
Distributions paid during the fiscal years ended October 31, were characterized for tax purposes as follows:
| | For the fiscal year ended | | Ordinary Income | | | Long-Term Capital Gain | |
| Centaur Total Return Fund | 10/31/2014 | | $ | 8,833,048 | | | $ | 2,302,171 | |
| Centaur Total Return Fund | 10/31/2013 | | | 4,497,492 | | | | – | |
As of April 30, 2015, the aggregate cost of investments, gross unrealized appreciation and net unrealized depreciation for Federal tax purposes was as follows:
| | Cost of Investments for Income Tax Purposes | | | Gross Unrealized Appreciation | | | Gross Unrealized Depreciation | | | Net Unrealized Appreciation | |
| Centaur Total Return Fund | | $ | 37,346,458 | | | | 2,478,709 | | | $ | (1,002,549 | ) | | $ | 1,476,160 | |
The difference between book basis and tax basis net unrealized appreciation/(depreciation) is attributable to the deferral of losses from wash sales, and the mark to market of passive foreign investment companies.
| Semi-Annual Report | April 30, 2015 | 21 |
| Centaur Total Return Fund | Notes to Financial Statements |
| | April 30, 2015 (Unaudited) |
| 6. COMMITMENTS AND CONTINGENCIES |
Under the Trust’s organizational documents, its Officers and Trustees are indemnified against certain liabilities arising out of the performance of their duties to the Fund. In addition, in the normal course of business, the Trust entered into contracts with its service providers, on behalf of the Fund, and others that provide for general indemnifications. The Fund’s maximum exposure under these arrangements is unknown, as this would involve future claims that may be made against the Fund. The Fund expects the risk of loss to be remote.
As of April 30, 2015 there were two Trustees, both of whom are not “interested persons” (as defined in the 1940 Act) of the Trust (the “Independent Trustees”). Each of the Independent Trustees receives a fee of $2,000 each year plus $500 per series of the Trust per meeting attended in person and $200 per series of the Trust per meeting attended by telephone. The officers of the Trust will not receive compensation from the Trust for performing the duties of their offices. All Trustees and officers are reimbursed for any out-of-pocket expenses incurred in connection with attendance at meetings.
The Fund has evaluated the need for disclosures and/or adjustments resulting from subsequent events through the date of issuance of these financial statements. This evaluation did not result in any subsequent events that require disclosure and/or adjustments.
| 22 | www.centaurmutualfunds.com |
| Centaur Total Return Fund | Additional Information |
| | April 30, 2015 (Unaudited) |
| 1. PROXY VOTING POLICIES AND VOTING RECORD |
A copy of the Trust’s Proxy Voting and Disclosure Policy and the Advisor’s Proxy Voting and Disclosure Policy are included as Appendix B to the Fund’s Statement of Additional Information and are available, (1) without charge, upon request, by calling (1-888-484-5766) and (2) on the SEC’s website at http://ww.sec.gov. Information regarding how the Fund voted proxies relating to portfolio securities during the most recent 12-month period ended June 30 will be available (1) without charge, upon request, by calling the Fund at the number above and (2) on the SEC’s website
at http://www.sec.gov.
| 2. QUARTERLY PORTFOLIO HOLDINGS |
The Fund files its complete schedule of portfolio holdings with the SEC for the first and third quarters of each fiscal year on Form N-Q. The Fund’s Forms N-Q are available on the SEC’s website at http://www.sec.gov. You may review and make copies at the SEC’s Public Reference Room in Washington, D.C. You may also obtain copies after paying a duplicating fee by writing the SEC’s Public Reference Section, Washington, D.C. 20549-0102 or by electronic request to publicinfo@sec.gov, or is available without charge, upon request, by calling the Funds at 1-888-484-5766. Information on the operation of the Public Reference Room may be obtained by calling the SEC at 1-800-SEC-0330, (1-800-732-0330).
| Semi-Annual Report | April 30, 2015 | 23 |
Not applicable to semiannual reports.
| Item 3. | Audit Committee Financial Expert. |
Not applicable to semiannual reports.
| Item 4. | Principal Accountant Fees and Services. |
Not applicable to semiannual reports.
| Item 5. | Audit Committee of Listed Registrants. |
Not applicable.
| a. | A copy of the schedule of investments of unaffiliated issuers as of the close of the reporting period is included as part of the report to shareholders filed under Item 1 of this Form N-CSR. |
| Item 7. | Disclosure of Proxy Voting Policies and Procedures for Closed-End Management Investment Companies. |
Not applicable.
| Item 8. | Portfolio Managers of Closed-End Management Investment Companies. |
Not applicable.
| Item 9. | Purchases of Equity Securities by Closed-End Management Investment Company and Affiliated Purchasers. |
Not applicable.
| Item 10. | Submission of Matters to a Vote of Security Holders. |
There have been no material changes to the procedures by which shareholders may recommend nominees to the Trust’s Board of Trustees since the Trust last provided disclosure as to such procedures in response to the requirements of Item 407(c)(2)(iv) of Regulation S-K (as required by Item 22(b)(15) of Schedule 14A), or this Item.
| Item 11. | Controls and Procedures. |
| (a) | The registrant’s principal executive officer and principal financial officer have concluded that the registrant’s disclosure controls and procedures are effective based on their evaluation of these disclosure controls and procedures as of a date within 90 days of the filing of this report. |
| (b) | There were no changes in the registrant’s internal control over financial reporting that occurred during the registrant’s second fiscal quarter of the period covered by this report that have materially affected, or are reasonably likely to materially affect, the registrant’s internal control over financial reporting. |
(a)(1) Not applicable to semiannual reports.
(a)(2) Certifications required by Item 12.(a)(2) of Form N-CSR are filed herewith as Exhibit EX‑99.CERT.
(a)(3) Not applicable.
(b) Certifications required by Item 12.(b) of Form N-CSR are filed herewith as Exhibit EX‑99.906CERT.
SIGNATURES
Pursuant to the requirements of the Securities Exchange Act of 1934 and the Investment Company Act of 1940, the registrant has duly caused this report to be signed on its behalf by the undersigned, thereunto duly authorized.
Centaur Mutual Funds Trust
| By: | (Signature and Title) | /s/ M. Ezekial Ashton |
| | | M. Ezekial Ashton |
| Date: | July 6, 2015 | President and Principal Executive Officer |
Pursuant to the requirements of the Securities Exchange Act of 1934 and the Investment Company Act of 1940, this report has been signed below by the following persons on behalf of the registrant and in the capacities and on the dates indicated.
| By: | (Signature and Title) | /s/ M. Ezekial Ashton |
| | | M. Ezekial Ashton |
| Date: | July 6, 2015 | President and Principal Executive Officer |
| By: | (Signature and Title) | /s/ Gennifer Ashton |
| | | Gennifer Ashton |
| Date: | July 6, 2015 | Treasurer and Principal Financial Officer |