Table Of ContentsUNITED STATES
SECURITIES AND EXCHANGE COMMISSION
WASHINGTON, D.C. 20549
_________________
FORM 10-K
_________________
☒ | ANNUAL REPORT PURSUANT TO SECTION 13 OR 15(d) OF THE SECURITIES EXCHANGE ACT OF 1934 For the fiscal year ended December 31, 2013 |
OR
☐ | TRANSITION REPORT PURSUANT TO SECTION 13 OR 15(d) OF THE SECURITIES EXCHANGE ACT OF 1934 For the transition period from to |
Commission file number: 001-34749
_________________
REACHLOCAL, INC.
(Exact name of registrant as specified in its charter)
_________________
Delaware | 20-0498783 |
(State or other jurisdiction of incorporation or organization) | (I.R.S. Employer Identification No.) |
| |
21700 Oxnard Street, Suite 1600 Woodland Hills, California | 91367 |
(Address of principal executive offices) | (Zip Code) |
(818) 274-0260
(Registrant’s telephone number, including area code)
None
(Former name, former address and former fiscal year, if changed since last report)
________________
Securities registered pursuant to Section 12(b) of the Act:
Title of each class | Name of each exchange on which registered |
Common Stock, $0.00001 par value per share | The NASDAQ Stock Market LLC |
Securities registered pursuant to Section 12(g) of the Act:
None
(Title of Class)
(Title of Class)
___________________
Indicate by check mark if the registrant is a well-known seasoned issuer, as defined in Rule 405 of the Securities Act. Yes ☐ No ☒
Indicate by check mark if the registrant is not required to file reports pursuant to Section 13 or Section 15(d) of the Exchange Act. Yes ☐ No ☒
Indicate by check mark whether the registrant (1) has filed all reports required to be filed by Section 13 or 15(d) of the Securities Exchange Act of 1934 during the preceding 12 months (or for such shorter period that the registrant was required to file such reports), and (2) has been subject to such filing requirements for the past 90 days. Yes ☒ No ☐
Indicate by check mark whether the registrant has submitted electronically and posted on its corporate Web site, if any, every Interactive Data File required to be submitted and posted pursuant to Rule 405 of Regulation S-T during the preceding 12 months (or for such shorter period that the registrant was required to submit and post such files). Yes ☒ No ☐
Indicate by check mark if disclosure of delinquent filers pursuant to Item 405 of Regulation S-K is not contained herein, and will not be contained, to the best of registrant’s knowledge, in definitive proxy or information statements incorporated by reference in Part III of this Form 10-K or any amendment to this Form 10-K. ☐
Indicate by check mark whether the registrant is a large accelerated filer, an accelerated filer, or a non-accelerated filer. See definitions of “large accelerated filer,” “accelerated filer” and “smaller reporting company” in Rule 12b-2 of the Exchange Act.
Large accelerated filer | ☐ | Accelerated filer | ☒ |
| | | |
Non-accelerated filer | ☐ (Do not check if a smaller reporting company) | Smaller reporting company | ☐ |
Indicate by check mark whether the registrant is a shell company (as defined in Rule 12b-2 of the Exchange Act). Yes ☐ No ☒
As of June 30, 2013, the aggregate market value of the common stock held by non-affiliates of the registrant was $127,718,771 based on a closing price of $12.26 on the NASDAQ Global Market on such date.
Class | Outstanding at February 28, 2014 |
Common Stock, $0.00001 par value per share | 28,835,132 shares |
Documents Incorporated by Reference
Portions of the registrant’s Proxy Statement relating to the registrant’s 2014 Annual Meeting of Stockholders are incorporated by reference into Part III of this Annual Report on Form 10-K where indicated.
REACHLOCAL, INC.
INDEX TO FORM 10-K
PARTI
CAUTIONARY NOTICE REGARDING FORWARD-LOOKING STATEMENTS
In this document, ReachLocal, Inc. and its subsidiaries are referred to as “we,” “our,” “us,” the “Company” or “ReachLocal.”
This Annual Report on Form 10-K contains “forward-looking statements” that involve risks and uncertainties, as well as assumptions that, if they never materialize or prove incorrect, could cause our results to differ materially from those expressed or implied by such forward-looking statements. The statements contained in this Annual Report on Form 10-K that are not purely historical are forward-looking statements within the meaning of Section 27A of the Securities Act of 1933, as amended (the “Securities Act”), and Section 21E of the Securities Exchange Act of 1934, as amended (the “Exchange Act”). Forward-looking statements are often identified by the use of words such as, but not limited to, “anticipate,” “believe,” “can,” “continue,” “could,” “estimate,” “expect,” “intend,” “may,” “will,” “plan,” “project,” “seek,” “should,” “target,” “will,” “would,” and similar expressions or variations intended to identify forward-looking statements. These statements are based on the beliefs and assumptions of our management based on information currently available to management. Such forward-looking statements are subject to risks, uncertainties and other important factors that could cause actual results and the timing of certain events to differ materially from future results expressed or implied by such forward-looking statements. Factors that could cause or contribute to such differences include, but are not limited to, those identified below, and those discussed in the section titled “Risk Factors” included in this Annual Report on Form 10-K. Furthermore, such forward-looking statements speak only as of the date of this report. Except as required by law, we undertake no obligation to update any forward-looking statements to reflect events or circumstances after the date of such statements.
Item 1. Business.
Business Overview
ReachLocal’s mission is to help local small- to medium-sized businesses (SMBs) around the world acquire, transact with and retain customers. We began in 2004 with the goal of helping SMBs move their advertising spend from traditional media and yellow pages to online search. While we have sold to a variety of SMBs and will continue to do so, our present focus is on what we refer to as Premium SMBs. A Premium SMB generally has 10 to 30 employees, $1 to $10 million in annual revenue and spends approximately $40,000 annually on marketing. Premium SMBs have become increasingly sophisticated in their understanding of online marketing. However, we believe that Premium SMBs have not changed their desire for a single, unified solution to their marketing needs. Our goal is to be the “one-stop shop” for SMBs’ online marketing needs.
With the rollout of ReachSearch in 2005, we pioneered the provisioning of search engine marketing services (SEM) on a mass scale for SMBs through the use of our technology platform. ReachSearch combines search engine marketing optimized across multiple publishers, call tracking and call recording services, and industry leading campaign performance transparency. This product enabled us to become one of the largest adTech companies focusing on the SMB marketplace. ReachSearch remains the leading SEM offering for SMBs in the market and was recently recognized by Google in the United States with its 2013 “Best Quality Accounts” award. However, ReachSearch does not solve all of the marketing challenges of our SMB clients. We have therefore added additional elements to our platform including our display product, ReachDisplay, our behavioral targeting product, ReachRetargeting, and other products that are primarily focused on leveraging third-party media to drive leads to our clients. Today we drive over 5 million leads to our clients each month.
We also recognize that even successfully driving leads to our clients, does not represent a complete solution to our SMBs’ online marketing needs. This leads to our next major product rollout—ReachEdge. The launch of ReachEdge in 2013 was our first step to move beyond being a media-driven lead generation business to offer integrated solutions that address the majority of the online marketing needs of our clients.ReachEdge is a marketing automation platform that includes a responsive website solution designed to enhance lead tracking and conversion, and includes tools for capturing web traffic information and converting leads into new customers for our clients. ReachEdge represents a significant step to allow us to leverage our collection of critical lead generation and conversion data in order to enhance the performance of our online marketing services for the benefit of our clients.Each ReachEdge site also includes a mobile optimized version of the site reflecting that leads for local businesses are increasingly coming from mobile devices. We believe that ReachEdge can both significantly enhance a client’s ability to convert leads into customers and, over time, could substantially increase our share of our clients’ marketing expenditures. ReachEdge further enhances the ability of our clients to convert leads that we are generating for them through ReachSearch and our other products, while at the same time providing even further transparency into the efficacy of our advertising products. This automated platform will form the basis for a multiproduct engagement with our clients.
We plan to over time add further dynamic optimization functionality to ReachEdge, as well as features that create a more seamless relationship between our clients and their customers, such as real-time appointment booking and search engine optimization (SEO). Many SMBs already spend marketing dollars in these categories, and we hope to shift some of that spending to our integrated solutions. Our ReachSEO product is in beta and is presently expected to be widely introduced during the second quarter of 2014. ReachSEO will drive organic search traffic to our client websites with a range of features, including site optimization, custom content, and distribution of site listings across hundreds of directories.
Since the September 2013 launch of ReachEdge, we have sold over 1,200 units through December 2013. We will introduce ReachEdge in certain of our international markets in 2014. While ReachSearch will, for the foreseeable future, continue to represent the significant majority of our revenue, we believe that the expansion of our product suite moves us closer to our goal of becoming the one-stop shop for our clients and will provide our clients with significantly greater value as our products are used together.
We have also focused on international expansion. Our first expansion was in Australia in 2006. We have subsequently entered Europe (the United Kingdom, Germany, the Netherlands, Austria and Belgium), Japan and Brazil. We intend to open our first office in Mexico in 2014. We also serve other countries through our resellers, including a franchisee.
During 2013 we made significant changes to our Direct Local sales model. We substantially expanded our inside sales force (a dedicated telemarketing sale force). Our inside sales force was designed to expand our geographic reach while reducing selling costs. In late 2012 we had only four inside sales people; by the end of the 2013 we had approximately 90 inside sales people in North America. We will be expanding our inside sales forces in Europe and Asia-Pacific in 2014 as we continue to seek to deepen our presence in our international markets while driving down our customer acquisition costs.
We also commenced a significant realignment of our sales force in North America, which will continue through 2014. Historically, we sold our products directly, through our “feet-on-the-street” sales force of internet marketing consultants, or IMCs. IMCs both generated new business and remained the primary contact for their clients. This sales structure worked well for a company that was primarily selling one product and we believe that our substantial corps of experienced IMCs has historically provided us with a significant competitive advantage. As we move more deeply into integrated solutions, however, we believe we require more specialization within our sales structure and beginning in late 2013, we have shifted our North American sales organization to a hunter/farmer model. Our Sales Executives (SEs), our hunters, are experts in new client generation, and they are compensated for generating new clients. Our Account Executives (AEs), our farmers, are product experts and they excel at client retention and account growth, and they are compensated for retaining and upselling existing clients. This realignment will also make our sales force more agile by allowing us to more directly and effectively incent desired sales activity. We believe that these changes will substantially aid us in achieving our new goal of becoming a true integrated technology solutions company. In some of our international markets, such as Australia, Japan and Brazil, we are already using this model or a derivation of this model. We plan to similarly realign our sales organization in Europe in the future.
We believe that the transformation of our product suite to focus on integrated solutions and our changes in our go-to-market strategy will position us for future profitable growth by better meeting our clients needs, increasing operational efficiencies, reducing the costs of client acquisition and increasing the value to us of our client relationships.
We operate on five continents, and we served approximately 23,900 SMB clients around the world with approximately 35,200 campaigns running at December 31, 2013.We had revenues of $514.1 million in 2013 and $455.0 million in 2012, representing an increase of 13.0%; Adjusted EBITDA of $32.8 million in 2013 and $28.1 million in 2012, representing an increase of 28.5%; $6.2 million of operating income in 2013 and $4.9 million of operating income in 2012; and $2.5 million net loss in 2013 and a $0.2 million net loss in 2012. For more financial information, see our Consolidated Financial Statements, beginning on page F-1, and see Part II, Item 7, “Management’s Discussion and Analysis of Financial Condition and Results of Operations – Non-GAAP Financial Measures” for our definition of Adjusted EBITDA, why we present it and a reconciliation of our Adjusted EBITDA to loss from operations for each of the periods presented.
Industry Overview
Online marketing services for SMBs is a $390 billion market according to Borrell Associates Inc. Over the past decade, the market for online marketing services for SMBs and other local businesses has undergone rapid and fundamental changes. The delivery and consumption of local online marketing services, like all media, has become fragmented and digitized. Consumers are searching on Google, checking reviews on Yelp and Citysearch, buying coupons on Groupon, and asking their friends for their opinions through Facebook and Twitter. Accordingly, for SMBs to prosper in this evolving world, they need to possess a tool kit that enables them to reach and interact with consumers in the same manner that consumers are seeking their services. This consumer-led digital transformation has profoundly disrupted the ways that businesses of all sizes need to acquire, transact with, maintain and retain their customers. As the Internet continues to grow and evolve, we believe that these trends will accelerate. To keep pace with this transformation, we believe that SMBs need to follow their customers and move an increasing portion of their marketing efforts and spend online. Accordingly, we believe that the market opportunity is huge and as we expand our product suite we will further differentiate our company from competitors.
The ReachLocal Solution
We provide SMBs with a suite of products that are optimized for their needs. Our products are designed to work the way that SMBs work. They are easy to use and cost-effective solutions to enable our clients to acquire, maintain and retain customers. While we have sold to a wide variety of SMBs and will continue to do so, our sweet spot is what we refer to as the Premium SMB. A Premium SMB generally has 10 to 30 employees, $1 to $10 million in annual revenue and spends approximately $40,000 annually on marketing. In addition, over the past 12 to 18 months, we have focused on certain core verticals, which include Home Services (such as plumbers), Professional Services (such as lawyers and accountants), Specialty Services (such as travel agents) and Healthcare (such as doctors and dentists). We also provide solutions to multi-location advertisers, such as franchises and other businesses that have multiple locations across a number of cities and states.
Our Products
We offer a comprehensive technology suite of online marketing and reporting solutions designed to deliver efficacy and insight to our clients.
Our products include:
| | • | ReachSearch. Our award winning ReachSearch is focused on assuring that our clients’ advertisements appear prominently among the search results when local consumers enter certain keywords on leading local search sites such as Google, Yahoo! and Bing. ReachSearch is optimized for local markets in each country for which it has been released. ReachSearch, which was offered in each of our territories through 2013, accounted for 87% of our revenue during each of 2011, 2012 and 2013. In addition, starting in 2013, we commenced providing mobile optimized websites to all of our clients which purchase ReachSearch, as over a third of searches are now being conducted through mobile devices (smartphones and tablets). |
| | • | ReachDisplay. Our ReachDisplay product is primarily focused on maximizing the exposure for an SMB by displaying ads for the advertiser on websites, that in the aggregate, reach an estimated 90% of the U.S. online audience. We offer a number of display advertising products across a wide variety of publishing partners, including multiple display networks and demand-side platforms. Our ReachDisplay product was introduced in 2009 and we continue to add new publishers and options as display advertising on the Internet evolves. |
| | • | ReachRetargeting. Our ReachRetargeting products allow us to target consumers who have previously visited a specific client’s website, either through a ReachSearch campaign or a ReachDisplay campaign, or who have previously searched for a client’s keywords. When the potential customer visits any other site within our retargeting network, we can market to the target customer on behalf of that SMB. |
| | • | TotalTrack®, TotalLiveChat™, TotalVideoNow™, TotalBannerNow™. As part of our mission to provide a comprehensive suite of digital marketing solutions to SMBs, we have developed various products to address specific marketing needs, such as lead optimization, online analytics and digital creative solutions. |
In 2013, we introducedReachEdge, our most important new product introduction to date. ReachEdge is a marketing automation platform that includes a responsive website solution designed to enhance lead tracking and conversion, and includes tools for capturing web traffic information and converting leads into new customers for our clients. With ReachEdge, we are working to solve the critical problem of lead conversion. While we have proven quite adept at generating leads for our clients, we now want to provide our clients with tools necessary to significantly improve their conversion of those leads to customers. In addition to providing a website designed to maximize lead conversion, ReachEdge also provides functionality that manages the leads generated by our other products. For example, ReachEdge notifies our client of new leads in real time via text message, email or the ReachLocal mobile app, so that the client is able follow up within minutes. ReachEdge also helps the client stay top of mind during the customer decision-making process by automatically sending new prospects targeted emails and sending alerts to the client’s staff reminding them to follow up on each lead. Our ReachEdge product is competitively priced for our target SMBs on a subscription model. By the end of 2013, we had sold over 1,200 subscriptions.
With ReachEdge as a platform, we can also provide our clients with other marketing tools such as real-time appointment booking, customer loyalty programs and other retention marketing services, all managed and measured through the single, simple to use ReachEdge environment. We are launching the first of these new products, our new search engine optimization product, ReachSEO, in the second quarter of 2014. ReachSEO is designed to boost the visibility of our ReachEdge customers on the top search engines.
Our Distribution Approach
Sales Organization
In 2006, we executed on a strategy to build the first pure-play online advertising distributed sales force, our Internet Marketing Consultants (IMCs). Our IMCs have historically served as both advisor and seller of online marketing for our target clients in what we refer to as our Direct Local channel. Our IMCs were the principal driver of our revenue growth through 2013. However, in view of sales challenges we were confronting, particularly in North America, and the substantial expansion in our product suite with the introduction of ReachEdge, we determined in 2013 to make significant changes to our go-to-market strategy.
The first change was the addition of an inside sales force to complement our outside sales force. This change was the result of our determination that there were many markets that could benefit from our product suite but could not be reached cost effectively by our outside sales force. We tested this approach by a pilot in smaller markets throughout the United States. We determined that, in addition to using an inside sale force to sell to smaller markets, an inside sales force would allow us to reach smaller clients effectively. Based on promising results, we increased our inside sales force from only four inside sales people in late 2012 to approximately 90 inside sales people in North American at December 31, 2013. We plan to continue the expansion of our inside sales force both domestically and in selected international markets in 2014.
The second change was the bifurcation of our outside sales force in North America.Historically, our growth in North America has been driven by the number of IMCs, with a focus on converting Underclassmen IMCs (less than one year of tenure with the company) into Upperclassmen IMCs (one year or more tenure). This was based on our determination that the number of Upperclassmen IMCs was the primary engine of our revenue growth in North America and other parts of the world. While this model proved effective, we have determined that it does not optimize our ability to sell an integrated solution to Premium SMBs.Accordingly, beginning in late 2013, we shifted our North American sales organization to a hunter/farmer model. Our Sales Executives (SEs), our hunters, are experts in new client generation, and they are compensated to generate new clients. Our Account Executives (AEs), our farmers, are product experts and excel at client retention and account growth and they are compensated based on retention and upselling existing clients. We believe that these changes will substantially aid us in achieving our new goal of becoming a true integrated solutions company. In some of our international markets, such as Australia, Japan and Brazil, we are already using this model or a derivation of this model with positive results. We will also, over time, modify our sales organization in Europe to this model.In North America, we have kept a number of our “big book” IMCs in their current roles, however, their “books” are already managed by teams which include support equivalent to the Account Executive function. This realignment resulted in the elimination of a number of field and service jobs, and the transition of a number of people who fit better in new roles and responsibilities. In addition, over the past 12 to 18 months, we have focused on certain core verticals, which include Home Services (such as plumbers), Professional Services (such as lawyers and accountants), Specialty Services (such travel agents) and Healthcare (such as doctors and dentists). This verticalization of our sales force enables the development of greater sector expertise which enhances our ability to sell into each such vertical.
We have also focused on international expansion. Our first expansion was in Australia in 2006. We have subsequently entered Europe (the United Kingdom, Germany, the Netherlands, Austria and Belgium), Japan and Brazil. We intend to open our first office in Mexico in 2014. However, we intend to focus in 2014 on growing our operations in our existing large market locations including Germany, Brazil and Japan, which we believe present substantially larger market opportunities than Australia, currently our largest international market.
We also employ a separate sales channel targeting national brands, franchises and strategic accounts with operations in multiple local markets and select third-party agencies and resellers. We refer to this as our NBAR channel. The sales process for the NBAR channel typically has substantially longer lead times than in our Direct Local channel. In addition, the national brand clients often involve complexity due to operational and marketing requirements that are not normally required by our Direct Local clients.
In addition, we sell and provide access to our technology platform to select third-party agencies and resellers in customer segments where they have sales forces with established relationships with their SMB client bases. We currently have over 750 agencies and resellers actively selling on our technology platform. We have a team that is responsible for identifying potential agencies and resellers, training their sales forces to sell our products and services and supporting the relationships on an ongoing basis. In addition, in 2012, we entered into our first franchise relationship, in which a third party was given the exclusive right to exploit and resell certain ReachLocal products in selected Eastern European markets under the ReachLocal name.
Customer Service
Our customer service organization is responsible for providing ongoing support to our sales forces, advertisers and resellers, including technical assistance with the use of our platform, as well as providing product- and campaign-specific technical assistance and recommendations to our SMB clients. We also field an advanced campaign management team that is responsible for supporting and optimizing the overall performance of the products on a category-by-category level. Our platform has a set of administrator-only tools that is used by the campaign management team to efficiently evaluate the success of ongoing campaigns and to recommend ways for our clients to improve their performance.
With a combination of employees in each of our regional markets and India, we have a dedicated team focused on the provisioning and review of campaigns before they are deployed. This team is responsible for reviewing the keywords that are automatically generated by our platform, ensuring that the creative aspects of the campaign and editorial standards conform to best practices. This team employs automated tools to increase the number of campaigns that can be provisioned per person, per day.
We employ a broad technical and service organization to ensure our products operate within standards, to provide our clients with ongoing support, and to provide our clients with product- and campaign-specific technical assistance and recommendations. In the first quarter of 2014, we substantially revamped our service organization in North America to align it with the restructuring of our sales force discussed above. Given that one of the key roles of the AE is to manage existing clients, the AEs now provide the first line of customer support.
Our Strategy
We believe that the market for online marketing services for SMBs is still in its early stages and the market is still highly fragmented, providing us with significant opportunities for growth. Our strategy for pursuing this opportunity includes the following key components:
| • | Integrated, Optimized Platform—One-Stop Shop.Our platform addresses the dual challenge of optimizing marketing expenditures and managing multiple sources of leads and conversion workflows. The significant fragmentation of the online marketing world makes it difficult for SMBs to sift through the various products and services being offered to address their online marketing needs. Our strategy is to provide a single integrated solution to SMBs so that they need not look elsewhere for the bulk of their online marketing needs. Accordingly, one of the key pillars of our strategy is continued product innovation that provides for products that meet our clients’ evolving needs for an integrated solution. |
| | | |
| • | Drive Down Customer Acquisition Cost.Our transition from our traditional IMC model in North America to a model that empowers sales people by separating new client generation from client management and upselling, is just one of the ways that we are streamlining our sales force. The initial success of our inside sales force in the North America has led us not only to expand the size of that sales force, but to introduce an inside sales force in Europe and Asia-Pacific in 2014. We believe that our inside sales force has the capacity to bring our products to market on a more cost-effective basis, particularly in smaller markets. In addition, we are deploying additional technology to make the selling process more efficient, such as budget generation tools that can be used to help clients determine the right amount of money to spend on online marketing to maximize their return on investment. |
| | | |
| • | Deepen our Presence Internationally. The local challenge is a global one, and we have found our product and distribution solutions to be well received in our international markets. Our international IMCs have generally been more productive than our domestic IMCs and we therefore intend to continue growing our international sales force and make other investments in service of those markets. Historically we have aggresively expanded into new countries. In 2014, however, while we will open our first office in Mexico, we will focus on deepening our presence in our current international markets. |
Product and Technology Development and Technology Operations
We devote a substantial portion of our resources to developing new solutions and enhancing existing solutions, conducting product and quality assurance testing, and improving our core technology. We have approximately 200 product and engineering professionals located in various locations in the United States and India.
Our platform integrations account for 98%+ of search engine and 90%+ online audience coverage resulting in more than 2.4 billion impressions, on average, every month. Our automated platform makes more than 8 million optimizations resulting in more than 5 million leads generated for our clients, on average, each month.
Our technology platform has been built to scale globally. We have a large number of customer facing services which reside in eight data centers spanning five countries and we keep more than a 99.91% service availability. Our primary data center hardware is co-located in El Segundo, California, with a major business continuity and disaster recovery data center hosted in Chandler, Arizona. We also maintain smaller regional data centers, including redundant facilities at various locations to support our domestic and international operations. We continuously monitor the performance and availability of our products and have well documented procedures to respond to incidents. In addition, we utilize cloud computing providers for certain of our products and services.
We architect our applications to enable us to scale our operations quickly while reducing deployment costs. We have a highly-available, scalable infrastructure that employs hardware load-balancers, redundant interconnected network switches and firewalls, replicated databases and fault-tolerant storage devices. Our research and development expenses were $9.5 million, $8.9 million, and $7.5 million, during 2013, 2012 and 2011, respectively, and our capitalized software development costs were $11.5 million, $7.6 million, and $6.8 million, during 2013, 2012 and 2011, respectively. We expect our research and development expenses and capitalized software development costs to continue to increase as we invest in new product initiatives, significantly improving and expanding our technology platform, and increasing the pace of international launches of new products and solutions.
Intellectual Property
Our success and ability to compete is dependent in part on our ability to develop and maintain the proprietary aspects of our technology and operate without infringing upon the proprietary rights of others. We have patent applications pending on some of our technology, but rely primarily on a combination of copyright, trade secret and trademark laws, confidentiality procedures, contractual provisions and other similar measures to protect our proprietary technology and information. Among other practices, we enter into confidentiality agreements with our employees, consultants and business partners, and we control access to and distribution of our proprietary information.
We consider trademark registration for some of our product names, slogans and logos in the United States and in some foreign countries. ReachLocal and TotalTrack are registered U.S. trademarks on an ongoing basis. We have also registered ReachLocal, ReachCast and TotalTrack as trademarks in a number of international territories. Other trademarks we use are ReachSearch, ReachDisplay, ReachRetargeting, and ReachEdge.
We are the registrant of the Internet domain name for our websites as well as for our proxy services, in addition to the international extensions of those domains. The information on, or accessible through, our websites does not constitute part of, and is not incorporated into, this Annual Report.
We also participate actively in free and open-source software (FOSS) programs, which afford us opportunities to lead technology discussions in the industry and across leading technology conferences.
Clients
We currently primarily sell to SMB clients, national brands, agencies and resellers. No single client, national brand, agency or reseller represents more than 10% of our total consolidated revenue.
Competition
The market for local online advertising solutions is intensely competitive and rapidly changing, and with the introduction of new technologies and market entrants, we expect competition to intensify in the future. Many of our current and potential competitors enjoy substantial competitive advantages, such as greater name recognition, longer operating histories and larger marketing budgets, as well as substantially greater financial, technical and other resources. In addition, many of our current and potential competitors have established marketing relationships and access to larger customer bases.
Our competitors include:
| • | Online Publishers. We compete with large Internet marketing providers such as Google, Yahoo! and Microsoft. These providers typically offer their products and services through disparate, online-only, self-service platforms. |
| • | Traditional, Offline Media Companies. We compete with traditional yellow page, newspaper, television and radio companies that, in many cases, have large, direct sales forces and digital publishing properties. |
| • | Local SMB Marketing Providers.The market for internet marketing services is highly fragmented and there are a number of smaller companies which provide internet marketing services and may be able to offer such services at highly competitive prices. |
| | | |
| | • | SMB Marketing Technology Providers. We also compete with technology companies providing online marketing platforms focused on the SMB market such as Angie’s List, Groupon, Intuit, Web.com, Wix, and Yelp, and, in some cases, building significant direct sales forces. |
| • | New Competitors in New Markets. We recently launched ReachEdge which is a marketing system that combines an optimized website and automated lead management. We are also developing other new subscription and SaaS products designed to provide SMBs additional tools to convert leads to customers, retain customers, and transact with customers. In each case, as we enter new markets we will encounter new competitors. While we believe that there are no competitors that offer an integrated solution similar to ReachEdge, there are a number of companies that offer various related services, such as Web.com, Wix and Constant Contact, as well as smaller start-ups. |
Government Regulation
We are subject to general business regulations and laws as well as regulations and laws specifically governing the Internet. Existing and future laws and regulations may impede the growth of the Internet or other online services. These regulations and laws may cover taxation, tariffs, user privacy, data protection, pricing, content, copyrights, distribution, electronic contracts and other communications, consumer protection, broadband residential Internet access and the characteristics and quality of services. It is not clear how existing laws governing issues such as property ownership, sales and other taxes, libel and personal privacy apply to the Internet. Unfavorable resolution of these issues may substantially harm our business and operating results.
The Company
ReachLocal, Inc. was incorporated as a Delaware corporation in 2003.In 2006, we entered our first market outside of North America through a joint venture in Australia, and in 2009, we acquired the remaining interest in the joint venture. We entered the United Kingdom and Canada in 2008, Germany and the Netherlands in 2011, Japan and Brazil in 2012, and Austria and Belgium in 2013. We also serve clients in certain other countries through our resellers, including a franchisee.
Employees
At December 31, 2013, we had approximately 2,100 employees worldwide. Approximately 58 of our employees in Brazil were subject to a collective bargaining agreement. None of our other employees is represented by a labor union. We believe that relations with our employees are good.
Available Information
We file reports with the Securities and Exchange Commission (the “SEC”), including annual reports on Form 10-K, quarterly reports on Form 10-Q, current reports on Form 8-K and any other filings required by the SEC. We make available free of charge in the investor relations section of our corporate website (http://investors.reachlocal.com) our annual report on Form 10-K, quarterly reports on Form 10-Q, current reports on Form 8-K, and all amendments to those reports as soon as reasonably practicable after such material is electronically filed with or furnished to the SEC. References to the Company’s corporate website address in this report are intended to be inactive textual references only, and none of the information contained on our website is part of this report or incorporated in this report by reference. Further, a copy of this Annual Report on Form 10-K is located at the SEC’s Public Reference Room at 100 F Street, NE, Washington, D.C. 20549. Information on the operation of the Public Reference Room can be obtained by calling the SEC at 1-800-SEC-0330.
Item 1A. Risk Factors.
You should carefully consider the risks described below and the other information in this Annual Report on Form 10-K.
Risks Related to Our Business
Our operations and financial results are subject to various risks and uncertainties, including a declining growth rate in North America, that could adversely affect our business, financial condition, results of operations, and the trading price of our common stock.
Our current business and future prospects are difficult to evaluate. We commenced operations in late 2004 in North America, and developed a strategy for taking advantage of what we believe is a shift of local marketing budgets from traditional media formats to digital media formats. Our strategy allowed us to grow rapidly. However, our growth rate in North America has slowed and, as a result, our overall growth rate has also declined. In 2013, our North America revenues, which accounted for 66% of our 2013 revenues, grew by 4.5% versus 13.1% and 19.7% growth in 2012 and 2011, respectively. We are expanding internationally, realigning our North American sales force and introducing new go-to-market strategies, and introducing new products to continue to grow our business, but we cannot assure you that our strategy will be successful and that our growth rate will not decline further. In particular, although our international salespeople are currently considerably more productive than our North American salespeople, as those markets mature over time, our international salespeople’s productivity may decline further, putting further pressure on our growth rate and results of operations.
You must also consider our business and prospects in light of the risks and difficulties we encounter as a company in the rapidly evolving online marketing industry. These risks and difficulties include:
| • | our limited number of product offerings and the difficulties and risks associated with developing and selling new products and solutions, including, in particular, new subscription and software-as-a-service (SaaS) products; |
| • | successfully entering new markets, domestically and internationally; |
| • | successfully executing new sales and go-to-market strategies and approaches, including the realignment of our North American sales force; |
| • | maintaining the effectiveness of our technology platform, and adapting our technology to new market opportunities and challenges; |
| • | competition from existing and new competitors, technologies, and products; |
| • | reaching and maintaining profitability; |
| • | continuing to attract new SMB clients, many of which have not previously advertised online and may not understand the value to their businesses of our products and services; and |
| • | effectively managing continued growth in our sales force, personnel and operations. |
Failing to successfully address these challenges or others could significantly harm our business, financial condition, results of operations and the trading price of our common stock.
We have incurred significant operating losses in the past and may incur significant operating losses in the future.
At December 31, 2013, we had an accumulated deficit of approximately $29.6 million, and we may incur net operating losses in the future. We expect our operating expenses to continue to increase in the future as we expand our operations. Our business strategy contemplates hiring significant numbers of additional salespeople, both in new and existing markets, as well as making substantial investments in new and existing products, which will require significant expenditures. If our revenue does not grow to offset these increased expenses, we will not be profitable. We also expect that a variety of factors, including increased competition and the maturation of our business, may continue to cause our revenue growth rate to decline in the future, and we cannot assure you that our revenue will continue to grow or will not decline. As a result, you should not consider our historical revenue growth as indicative of our future performance. Furthermore, if our operating expenses exceed our expectations, our financial performance will be adversely affected.
We cannot be certain that the significant steps that we have taken to strengthen our North American market will work.
Commencing in the fourth quarter of 2013, we realigned our sales infrastructure in North America, which disrupted revenue growth in that quarter and is expected to continue to affect revenue adversely through the first half of 2014. We aligned the North American sales team into two specialist groups—those that acquire new clients, and those that manage clients—and continue to look for ways of optimizing our go-to-market strategy. While we believe this realignment will reaccelerate growth in North America, we cannot be certain that it will be successful. We also cannot be certain that the slowdown attributable to this realignment that we experienced in the fourth quarter of 2013, and which we expect to hamper results in the first half of 2014, will not depress results beyond that time frame.
We have undergone significant management changes in 2013 and presently have an Interim Chief Executive Officer.
In 2013, Zorik Gordon, founder and CEO, Nathan Hanks, founder and President, and Michael Kline, founder and Chief Strategy Officer, each left the Company. David Carlick, the Chairman of our Board of Directors, became interim CEO and Josh Claman, formerly our Chief Revenue Officer, was promoted to President. The Board is leading a search to find a new CEO. No assurance can be made, however, as to when we will hire a new CEO. The existing management team is actively managing the business in accordance with a business strategy approved by the Board of Directors. However, if we are unable to hire a permanent CEO in a timely manner, it may adversely impact our ability to execute on our strategic plans.
We depend on key personnel to operate our business, and our workforce has undergone significant disruption in 2013 and in 2014 which may adversely affect performance and tenure.
We believe that our future success is highly dependent on the contributions of our executive officers, as well as our ability to attract and retain highly skilled managerial, sales, technical and finance personnel. Qualified individuals are in high demand, and we may incur significant costs to attract them. All of our U.S. officers and other U.S. employees are at-will employees, which means they may terminate their employment relationship with us at any time, and their knowledge of our business and industry would be extremely difficult to replace. If we are unable to attract and retain our executive officers and key employees, our business, operating results and financial condition will be harmed.
In an effort to streamline our operations towards a goal of improving our operating results, we have engaged in two modest reductions in force since the third quarter of 2013, which has contributed to some unease and a drop in morale within our work force. While we have taken reasonable steps to ensure that our key people are adequately incented to stay with the Company, we cannot be certain that such incentives will be sufficient to keep our top performers.
Volatility or lack of performance in our stock price and limitations imposed by the size of our equity plan, may also affect our ability to attract and retain our key employees. Some of our executive officers have become vested in a substantial amount of stock or stock options. Employees may be more likely to leave us if the shares they own or the shares underlying their options have significantly appreciated in value relative to the original purchase prices of the shares or the exercise prices of the options, or if the exercise prices of the options that they hold are significantly above the market price of our common stock.
Our new product, ReachEdge, is an important part of our product roadmap and is a largely untested product concept that may not gain market acceptance or may not perform as we intend.
We have recently launched ReachEdge, which is an automated marketing system that combines an optimized website and automated lead management. The success of this new product is subject to numerous risks and uncertainties, such as uncertain customer acceptance, the difficulties of designing a complex software product, integrating ReachEdge with our existing technology and third-party service providers, training our salespeople to sell ReachEdge, and gaining market acceptance. Because the product is complex and incorporates a variety of proprietary and third-party software, ReachEdge may have errors or defects that could result in unanticipated downtime for our customers and harm to our reputation and our business. Internet-based services frequently contain undetected errors when first introduced or when new versions or enhancements are released. In addition, our customers may use ReachEdge in unanticipated ways that may cause a disruption in service for other customers attempting to access their data. Since our customers may use this product for important aspects of their business, such as lead generation, lead management, scheduling, and other services, any errors, defects, disruptions in service or other performance problems, could damage our customers’ businesses and result in financial losses, which would hurt our reputation. As a result, customers could elect to not renew, or delay or withhold payment to us, we could lose future sales or customers may make warranty or other claims against us. In addition, ReachEdge is a relatively novel product and, therefore, wide market acceptance cannot be assured. A substantial component of our ReachEdge platform is outsourced to a third party. While we believe that our relationship with such third party is sound, if the relationship were to deteriorate, our ability to sell and maintain ReachEdge could be substantially degraded.
We purchase most of our media from Google, and our business could be adversely affected if Google takes actions that are adverse to our interests or if we fail to meet advertiser or spend targets necessary for receiving rebates from Google. Similar actions from Yahoo!, Microsoft and other media providers could adversely affect our business, though to a lesser degree.
Nearly all of our cost of revenue is for the purchase of media, and a substantial majority of the media we purchase is from Google. Google accounts for a large majority of all U.S. searches, and Google’s share in foreign markets is often even greater. As a result, we expect that our business will depend upon media purchases from Google for the foreseeable future. This dependence makes us vulnerable to actions that Google may take to change the manner in which it sells AdWords, as described below, or conducts its business on a number of levels:
| • | Google Can Choose to Change the Terms and Conditions Upon Which it Does Business with Us and our Clients. Google can act unilaterally to change the terms and conditions for our purchase of media or the purchase of Google products, and Google has done so in the past. Future changes by Google to the terms and conditions upon which we purchase media could materially and adversely affect our business. |
| • | Competitive Risk. Google offers its products directly to SMBs through an online self-service option. Google enjoys substantial competitive advantages over us, such as substantially greater financial, technical and other resources. In addition, Google continues to launch products that are targeted directly at SMBs, which Google does not always make available to third parties. While we cannot assess at this time the effect of Google’s offering such products directly to SMBs, the prices charged by Google for direct service are lower than the prices we charge for the same media. |
| • | Technology Risk. Our technology platform interacts with Google through publicly available application programming interfaces, or APIs. If Google were to discontinue the availability of all or a portion of these APIs to us, we may have to change our technology, incur additional costs or discontinue certain products or services that we currently offer our clients. Any of these changes could adversely affect our ability to provide effective online marketing and reporting solutions to our clients. In addition, Google may decide to alter the amount it charges us for the right to use its APIs, which would decrease our gross margin absent any change in our pricing to our customers. |
| • | Editorial Control. Google closely monitors the experience of end-users, and from time-to-time, its editorial personnel request that companies alter their services based on Google’s determination that aspects of such services could adversely affect the end-user experience and/or avoid providing Google-dependent services to certain types of clients. For example, each of our media products includes TotalTrack, a tracking service powered by our proprietary reverse proxy technology and tracking code. If Google were to determine that the tracking URLs utilized by our TotalTrack service adversely affects the end-user’s experience, Google could require us to alter or suspend the way we implement our tracking solutions. Such a change would significantly decrease our ability to optimize our clients’ advertising campaigns and limit our ability to provide the level of campaign performance reporting that we currently provide to our clients. |
| • | Rebate/Incentive Risk.Google retains broad authority with respect to its rebate programs and has, from time to time, canceled rebate programs. In the second quarter of 2011, we entered into reseller agreements with Google that, among other things, provide us with certain performance bonuses if certain advertiser and spend targets, including share of retail requirements, are met. If we fail to meet those targets, and do not qualify for the rebates, our operating results would be harmed. Our reseller agreements with Google expire May 1, 2014 in Europe and Asia-Pacific, and June 30, 2014 in North America, and are subject to broad mutual termination rights and there is no assurance of renewal. Termination of those agreements would negatively affect our cost of revenue. |
In addition, any new developments or rumors of developments regarding Google’s business practices that affect the local online advertising industry may create perceptions with our customers or investors that our ability to compete has been impaired.
The above risks also apply to other publishers from whom we purchase media, including Yahoo! and Microsoft.
We purchase a significant majority of our media from Google, Microsoft and Yahoo! in an auction marketplace. If we are unable to purchase media from any one of these companies, if prices for media significantly increase or if the manner in which the media is sold changes, our business could be adversely affected.
Our success depends on our ability to purchase media from Google, Microsoft and Yahoo! at reasonable prices so that we can provide our clients with a reasonable return on the advertising expenditures they make through us. We generally purchase this media in an auction marketplace. Increased competition or other factors may cause the cost of the media that we purchase from Google, Yahoo! and Microsoft to rise. In particular, if our expectation that local SMB advertising will increasingly migrate to the Internet is correct, the marketing budget available to bid in these auctions will increase and the price of media may increase substantially. An increase in the cost of media in these marketplaces without a corresponding increase in our media buying efficiency could result in an increase in our cost of revenue as a percentage of revenue even if our business expands. In addition, such an increase could result in an increase in the prices we must charge our clients or a decrease in our ability to fulfill our clients’ service expectations. Furthermore, the Internet search companies that operate these media marketplaces may change the operating rules or bidding procedures in ways that decrease the effectiveness of the technology that we use to optimize our purchases or otherwise prevent us from purchasing media at reasonable prices or at all. Any change in our ability to provide effective online marketing campaigns to our clients may adversely affect our ability to attract and retain clients.
The market in which we participate is intensely competitive, particularly in North America, and if we do not compete effectively, our operating results could be harmed.
The market for online marketing solutions is intensely competitive and rapidly changing, and with the emergence of new technologies and market entrants, we expect competition to intensify in the future.
Our competitors include:
| • | Internet Online Publishers. We compete with large Internet marketing providers such as Google, Yahoo! and Microsoft. These providers typically offer their products and services through disparate, online-only, self-service platforms. |
| • | Traditional, Offline Media Companies. We compete with traditional yellow page, newspaper, television and radio companies that, in many cases, have large, direct sales forces and digital publishing properties. |
| • | Local SMB Marketing Providers.The market for internet marketing services is highly fragmented and there are a number of smaller companies which provide internet marketing services and may be able to offer such services at highly competitive prices. |
| | | |
| | • | SMB Marketing Technology Providers. We also compete with technology companies providing online marketing platforms focused on the SMB market such as Angie’s List, Groupon, Intuit, Web.com, Wix, and Yelp, and, in some cases, building significant direct sales forces. |
| • | New Competitors in New Markets. We recently launched ReachEdge, a new software-as-a-service, or SaaS, product, which is a marketing system that combines an optimized website and automated lead management. We are also developing other new subscription and SaaS products designed to provide SMBs additional tools to convert leads to customers, retain customers, and transact with customers. In each case, as we enter new markets we will encounter new competitors. |
Many of our current and potential competitors enjoy substantial competitive advantages, such as greater name recognition, longer operating histories, substantially greater financial, technical and other resources and, in some cases, the ability to combine their online marketing products with traditional offline media such as newspapers or yellow pages. These companies may use these advantages to offer products similar to ours at a lower price, develop different products to compete with our current solutions and respond more quickly and effectively than we can to new or changing opportunities, technologies, standards or client requirements. In particular, if major Internet search companies such as Google, Yahoo! and Microsoft decide to devote greater resources to develop and market online advertising offerings directly to SMBs, greater numbers of our clients and potential clients may choose to purchase online advertising services directly from these competitors, particularly if and as the ease of their self-service models increases. In addition, many of our current and potential competitors have established marketing relationships with and access to larger client bases and are heavily investing in recruiting sales personnel, which might affect our ability to achieve our salespeople hiring targets.
As the market for local online advertising increases, we expect new competitors, business models and solutions to emerge, some of which may be superior to ours. We also believe that the marketplace for online media is more transparent than other media marketplaces. Our competitors may use information available to them to price their products at a discount to the prices that we currently offer. Clients and potential clients might adopt competitive products and services in lieu of purchasing our solutions, even if our online marketing and reporting solutions are more effective than those offered by our competitors, if we are not able to differentiate our products and convince clients that our products are more effective that our competitors’ offerings. For all of these reasons, we may not be able to compete successfully against our current and potential competitors.
Our future success depends in part on our ability to effectively develop and sell additional products and solutions.
We invest in the development of new products and solutions with the expectation that we will be able to effectively offer them to our clients. We are developing, and may in the future develop or acquire, other products and solutions that address new segments of an SMB’s marketing activities. We are also developing subscription and SaaS products, such as ReachEdge, which present different challenges from those we have faced in the past. Our future revenue depends in part on our ability to stay competitive with our product and service offerings, including providing integrated solutions to our clients. Our ability to develop and launch new products on our expected timelines, or at all, is subject to numerous risks and uncertainties, such as the difficulties of designing complex software products, achieving desired functionality and integrating the new products with our existing technology.
The sale of new or additional features, products and services, the value or utility of which may be different from our current products and services or less easily understood by our clients, may require increasingly sophisticated and costly sales efforts and increased operating expenses, as well as additional training of our salespeople and education for our SMB clients. New product launches require the investment of resources in advance of any revenue generation. If new products fail to achieve market acceptance, we may never realize a return on this investment. If these efforts are not successful, our business may suffer. Many SMBs have modest advertising budgets. Accordingly, we cannot assure you that our SMB clients will increase their aggregate spending as a result of the introduction of new products and services or that the successful introduction of new products or services will not adversely affect sales of our current products and services through cannibalization of our current products or disharmony created by consumer offerings that could be perceived as in competition with our current customers. Any such adverse impact on our current media products could also adversely affect our publisher rebates.
We may be unsuccessful in managing or growing our international operations, which could harm our business, operating results and financial condition.
We currently have international sales operations in Australia, the United Kingdom, Canada, Germany, the Netherlands, Japan, Brazil, Austria and Belguim, and campaign support services in India. Revenue from international operations outside North America accounted for 33.5%, 28.1% and 22.9% of total revenue for the years ended December 31, 2013, 2012 and 2011, respectively. Over the long term, we intend to expand our international operations. We may incur losses or otherwise fail to enter new markets successfully.
Our ability to operate internationally involves various risks, including the need to invest significant resources, the possibility that returns on such investments will not be achieved in the near future and competitive environments with which we are unfamiliar. Our international operations may not prove to be successful in certain or any markets. In addition, we have incurred and expect to continue to incur significant expenses as we attempt to establish our presence in particular international markets. Our current and any future international expansion plans will require management attention and resources and may be unsuccessful. Furthermore, in many international markets, we would not be the first entrant, and greater competition may exist with stronger brand recognition than we have faced in our current markets. Different privacy, censorship and liability standards and regulations and different intellectual property laws in foreign countries may cause our business and operating results to suffer.
Our international operations may also fail to succeed due to other risks inherent in foreign operations, including:
| • | difficulties or delays in developing a network of clients in one or more international markets; |
| • | legal, political or systemic restrictions on the ability of U.S. companies to market products and services or otherwise do business in foreign countries; |
| • | different regulatory requirements, including regulation of internet services, privacy and data protection, banking and money transmitting, and selling, that may limit or prevent the offering of our products in some jurisdictions; |
| • | international intellectual property laws that may be insufficient to protect our intellectual property or permit us to successfully defend ourselves or our intellectual property in international lawsuits; |
| • | different employee/employer relationships and the existence of workers’ councils and labor unions, which could make it more difficult to terminate underperforming salespeople; |
| • | difficulties in staffing and managing foreign operations; |
| • | greater difficulty in accounts receivable collection; |
| • | currency fluctuations or a weakening U.S. dollar, which can increase costs of international expansion; |
| • | potential adverse tax consequences, including the difficulty of repatriating money; |
| • | lack of infrastructure to adequately conduct electronic commerce transactions; and |
| • | price controls or other restrictions on foreign currency. |
As a result of these obstacles, we may find it impossible or prohibitively expensive to continue or expand our international operations and replicate our business model, which could harm our business, operating results and financial condition.
Failure to adequately recruit, train and retain our salespeople would impede our growth and could harm our business, operating results and financial condition.
Our ability to maintain or grow revenue and achieve profitability will depend, in part, on increasing the size of our direct sales force. Commencing in the fourth quarter of 2013, we realigned our sales infrastructure in North America into two specialist groups: Sales Executives (SEs), our hunters, and Account Executives (AEs), our farmers. If many of our SEs and AEs do not perform well in their new roles, or are unhappy with the realignment, we may experience greater than anticipated attrition. We are also increasing our inside sales force in North America and intend to launch inside sales operations in Asia-Pacific and Europe. Inside sales SEs require different skills than outside salespeople and we may have difficulty growing these operations as intended. If our salespeople attrition is greater than anticipated, our business will be harmed. In addition, as more companies seek to capitalize on the shift to online media, competition for knowledgeable and qualified online media sales personnel will increase, and hiring for the new SE and AE roles may be more difficult than it has been hiring IMCs historically. Moreover, employees that we hire from our competitors have in the past, and may in the future, be subject to claims of breach of noncompetition and non-solicitation obligations owed to their former employers, which could impact our ability to attract and hire high-quality candidates and potentially subject us to litigation. If we are unable to effectively recruit, train and retain salespeople, we may not be able to grow our sales force, our revenue may suffer or our costs may increase.
One of our international growth strategies is to enter new international markets through franchise or reseller arrangements, and our franchisee OxataSMB has not performed as contemplated.
In July 2012, the Company entered into a franchise agreement with OxataSMB B.V. permitting it to operate and resell our services under the ReachLocal brand in Slovakia, Czech Republic, Hungary, Poland and Russia. At the same time, we entered into a market development loan agreement with OxataSMB pursuant to which we agreed to provide financing to OxataSMB of up to €2.9 million ($3.7 million), of which €1.45 million ($1.9 million) was immediately advanced and €0.92 million ($1.2 million) was advanced in August 2013. The OxataSMB operations have not performed as contemplated, and as a result, the Company recorded a $3.3 million impairment of the loan receivable and related interest from OxataSMB and a $1.6 million provision for bad debt related to the trade receivable from OxataSMB. While we continue to do business with OxataSMB and now require media spend to be paid in advance, it’s possible that OxataSMB could fail. As we expand into other international markets, in addition to entering markets directly, we may enter through a franchisee or a reseller (as we have in New Zealand and Singapore). The success of such strategy will depend on a number of factors, including whether our franchisees and resellers have the experience and financial resources to be effective operators and remain aligned with us on operating, promotional and capital-intensive initiatives, and the potential impact on us if they experience operational problems or project a brand image inconsistent with our values, particularly if our contractual and other rights and remedies are limited by local law or otherwise, or are costly to exercise. Difficulties of one or more of our international franchisee or reseller arrangements could result in losses stemming from related strategic investments, delay penetration into and/or negatively affect our brand in certain international markets, and distract management and absorb product development resources.
More consumers are using devices other than personal computers to access the Internet and accessing new platforms to make search queries. If we are unable to effectively reach consumers on the Internet on behalf of our customers, our business could be adversely affected.
The number of people who access the internet through devices other than personal computers, including mobile phones and tablets, has increased dramatically in the past few years. Mobile search advertising is growing very rapidly and may offer lower conversion rates for our customers, which if not offset by lower costs, may make search engine marketing less attractive for our customers. In addition, the lower resolution, functionality, and memory associated with some alternative devices may alter consumers’ use of the Internet, including search engines and other websites where we publish advertisements on behalf of customers. For example, search queries are increasingly being undertaken via “apps” tailored to particular devices or niches, or via social media platforms, which could affect our ability to deliver advertising results to our clients if we are unable to effectively reach consumers via those apps.
The impact of worldwide economic conditions, including the resulting effect on advertising budgets, may adversely affect our business, operating results and financial condition.
Our performance is subject to worldwide economic conditions and their impact on levels of advertising. In addition, as we increase our international footprint, we will become more sensitive to economic conditions outside of North America. We believe that the economic conditions remain challenging in North America and internationally, which have adversely affected our business.
To the extent that economic difficulties continue, or worldwide economic conditions materially deteriorate, our existing and potential clients may no longer consider investment in our online marketing solutions a necessity, or may elect to reduce advertising budgets. Historically, economic downturns have resulted in overall reductions in advertising spending. In particular, online marketing advertising solutions may be viewed by some of our existing and potential clients as a lower priority and may be among the first expenditures reduced as a result of unfavorable economic conditions. These developments could cause us to respond by temporarily reducing hiring or taking other measures and could have an adverse effect on our business, operating results and financial condition.
We are exposed to fluctuations in currency exchange rates.
Because we conduct a significant and growing portion of our business outside the United States but report our financial results in U.S. dollars, we face exposure to adverse movements in currency exchange rates. Our foreign operations are exposed to foreign exchange rate fluctuations as the financial results are translated from the local currency into U.S. dollars upon consolidation. If the U.S. dollar weakens against foreign currencies, the translation of these foreign currency denominated transactions will result in increased revenue, operating expenses and net income (or loss). If the U.S. dollar strengthens against foreign currencies, however, the translation of these foreign currency denominated transactions will result in decreased revenue, operating expenses and net income (or loss). For example, the strengthening of the U.S. dollar against the foreign currencies in which we do business resulted in a reduction in 2013 revenue of $7.8 million, principally driven by a 7% reduction in the average value of the Australian dollar relative to the prior year. As exchange rates vary, sales and other operating results, when translated, may differ materially from expectations. In addition, approximately 44% of our cash balances are denominated in currencies other than the U.S. dollar, and the value of such holdings will increase or decrease along with the weakness or strength of the U.S. dollar, respectively. We plan to implement a hedging strategy in 2014 to try to reduce the effect of fluctuating currency rates on our business, but there can be no assurances that such a hedging strategy will accomplish our objectives or that it will not result in losses.
If we fail to increase the number of our clients or retain existing clients, our revenue and our business will be harmed.
Our ability to grow our business depends in large part on maintaining and expanding our client base. To do so, we must convince prospective clients of the benefits of our technology platform and existing clients of the continuing value of our products and services. As the online media options for SMBs proliferate and our clients become more familiar with such options, we cannot assure you that we will be successful in maintaining or expanding our client base.
SMB marketing and advertising campaigns are often sporadic and difficult to predict, as they may be driven by seasonal promotions or business dynamics, evolving product and service offerings, available budgets and other factors. Some SMBs advertise only periodically, such as to promote sales or special offers. Because we need to address these business considerations of our clients, we do not require clients to enter into long-term obligations to purchase our products and services. Many cancel soon after completing their initial contract terms and some cancel early. We must continually add new clients both to replace clients who choose to cancel or not to renew their advertising campaigns and to grow our business beyond our current client base. A client’s decision to cancel or not to renew may be based on a number of factors, including dissatisfaction with our products and services, inability to continue operations and spending levels or because their campaigns were event-driven or otherwise intentionally limited in scope or duration. If our clients increasingly fail to fulfill their contracts or increasingly do not renew their advertising campaigns with us, or if we are unable to attract new clients in numbers greater than the number of clients that we lose, our client base will decrease and our business, financial condition and operating results will be adversely affected.
A significant portion of our revenue is generated by our national brands, agencies and resellers. If we are not able to maintain relationships with one or more of them, our sales may suffer and our revenue may decline.
We distribute our products and services through a separate sales force for national brands with operations in multiple local markets, as well as select third-party agencies and resellers. More generally, because national brands, agencies and resellers typically represent an aggregated group of SMB clients, if our relationship with one or more of these persons or companies were restricted or terminated, our sales would decrease and our revenue would be adversely affected, potentially materially. In addition, our strategy of distributing our products and services to our clients through our Direct Local channel and through our National Brands, Agencies and Resellers channel may result in distribution channel conflicts. Our Direct Local sales efforts may compete with our third-party agency and resellers and, to the extent different third-party agencies and resellers target the same clients, they may also come into conflict with each other. While we have certain policies in place to address these potential conflicts, there can be no assurance that these channel conflicts will not materially adversely affect our relationship with existing third-party agencies and resellers or adversely affect our ability to attract new third-party agencies and resellers. In the event that any of our relationships with existing third-party agencies and resellers are terminated or we are unable to attract new third-party agencies and resellers as a result of these distribution channel conflicts, our sales may suffer and our revenue may decline.
If SMBs increasingly opt to perform advertising tasks on their own, their demand for our products and services would decrease, negatively affecting our revenue.
Large Internet marketing providers such as Google, Yahoo! and Microsoft offer online advertising products and services through self-service platforms. As SMBs become more familiar with and experienced in interacting online, they may prefer to actively manage their own Internet presence and their demand for our products and services may decrease. We cannot predict the evolving experiences and preferences of SMBs, which may become more fully integrated into digitized modes of commerce and communication, and cannot assure you that we can develop our products and services in a manner that will suit their needs and expectations faster or more effectively than our competitors, or at all. If we are not able to do so, our results of operations would suffer.
We expect a number of factors to cause our operating results to fluctuate on a quarterly and annual basis, which may make it difficult to predict our future performance.
Our revenue and operating results could vary significantly from quarter-to-quarter and year-to-year because of a variety of factors, many of which are outside of our control. As a result, comparing our operating results on a period-to-period basis may not be meaningful. In addition to other risk factors discussed in this section, factors that may contribute to the variability of our quarterly and annual results include:
| • | unilateral actions taken by Google or other media providers; |
| • | seasonal variations in advertising budgets and media pricing; |
| • | seasonal variations in salespeople hiring; |
| • | the rate at which SMBs migrate their advertising spending online; |
| • | the timing and stage of product and technology development; |
| • | our ability to develop, introduce and manage SaaS products; |
| • | the impact of fluctuations in currency exchange rates, particularly the relative strength of the US Dollar to the currencies in the countries in which we do business and its impact on our consolidated revenues and results of operations; |
| • | the impact of worldwide economic conditions on our revenue and expenses; |
| • | the timing of and our ability to enter new markets and manage expansion in new markets; |
| • | our ability to appropriately set the price of non-media products; |
| • | our ability to accurately forecast revenue and appropriately plan our expenses; |
| • | the attraction and retention of qualified employees and key personnel; |
| • | the effectiveness of our internal controls; |
| • | our ability to effectively manage our growth; |
| • | our ability to successfully manage any future acquisitions of businesses, solutions or technologies; |
| • | interruptions in service and any related impact on our reputation; |
| • | the effects of natural or man-made catastrophic events; and |
| • | changes in government regulation affecting our business. |
As a result of these and other factors, the results of any prior quarterly or annual periods should not be relied upon as indications of our future operating performance. In addition, our operating results may not meet the expectations of investors.
Growth may place significant demands on our management and our infrastructure.
We have experienced substantial growth in the size and complexity of our business. This growth has placed and may continue to place significant demands on our management and our operational and financial infrastructure. As our operations grow in size, scope and complexity, we will need to improve and upgrade our systems and infrastructure to offer an increasing number of clients enhanced solutions, features and functionality. The expansion of our systems and infrastructure will require us to commit substantial financial, operational and technical resources in advance of an increase in the volume of business, with no assurance that the volume of business will increase. Continued growth could also strain our ability to maintain reliable service levels for our clients, develop and improve our operational, financial and management controls, enhance our reporting systems and procedures and recruit, train and retain highly skilled personnel. Managing our growth will require significant expenditures and allocation of valuable management resources. If we fail to maintain the necessary level of discipline and efficiency in our organization as it grows, our business, operating results and financial condition would be harmed.
Our ability to deliver our products depends upon the quality, availability, policies and prices of certain third-party service providers.
We rely on third parties to provide technology and services that are integrated into our solutions. Examples include our call tracking and recording services, and certain aspects of ReachEdge. In certain geographies, we rely on a single service provider for some of these services. In the event the provider were to terminate our relationship or stop providing these services, our ability to provide the affected products could be impaired. We may not be able to find an alternative provider in time to avoid a disruption of our services or at all, and we cannot be certain that such provider’s services would be compatible with our products without significant modifications or cost, if at all. Our proxy servers, which underlie key elements of our tracking services, require the use of various domains and IP address blocks. If domain registrars, website hosting companies or Internet service providers determined that our use of such domains and IP blocks were in violation of their terms of service or internet policies, such companies could elect to block our traffic. For example, several website hosting companies have blocked traffic from our reverse proxy servers for a group of our SMB clients, resulting in our inability to provide our full tracking services to those clients. Our ability to address or mitigate these risks may be limited. The failure of all or part of our tracking services could result in a loss of clients and associated revenue and could harm our results of operations.
We rely on bandwidth providers, data centers and other third parties for key aspects of the process of providing online marketing solutions to our clients, and any failure or interruption in the services provided by these third parties could harm our ability to operate our business and damage our reputation.
We rely on third-party vendors, including data center, software as a service, cloud computing Internet infrastructure and bandwidth providers. Any disruption in the services provided by these third-party providers or any failure of these third-party providers to handle current or higher volumes of use could significantly harm our business. Any financial or other difficulties our providers face may have negative effects on our business, the nature and extent of which we cannot predict. We exercise little control over these third-party vendors, which increases our vulnerability to problems with the services they provide. We have experienced and expect to continue to experience interruptions and delays in service and availability for such elements. Any errors, failures, interruptions or delays experienced in connection with these third-party technologies and information services could negatively impact our relationship with our clients and adversely affect our brand and our business and could expose us to liabilities to third parties.
Client complaints or negative publicity about our customer service or other business practices could adversely affect our reputation and brand.
Client complaints or negative publicity about our technology, personnel or customer service could severely diminish confidence in and the use of our products and services. Effective customer service requires significant personnel expense, and this expense, if not managed properly, could significantly impact our operating results. Moreover, failure to provide our clients with high-quality customer experiences for any reason could substantially harm our reputation and our brand and adversely affect our efforts to develop as a trusted provider of online marketing and reporting solutions for the SMB market.
Rapid technological changes may render our online marketing and reporting solutions obsolete or decrease the attractiveness of our solutions to our clients.
To remain competitive, we must continue to enhance and improve the functionality and features of our technology platform. The Internet, access to the Internet and the online marketing and advertising industry are rapidly changing. Our competitors are constantly developing new products and services in online marketing and advertising. As a result, we must continue to invest significant resources in order to enhance our existing products and services and introduce new products and services that clients can easily and effectively use. If competitors introduce new solutions embodying new technologies, or if new industry practices emerge, our existing technology may become obsolete. Our future success will depend on our ability to:
| • | enhance our existing solutions; |
| • | develop new solutions and technologies that address the increasingly sophisticated and varied needs of our prospective clients; and |
| • | respond to technological advances and emerging industry practices on a cost-effective and timely basis. |
Developing our online marketing and reporting solutions and the underlying technology entail significant technical and business risks. We may use new technologies ineffectively, or we may fail to adapt our technology platform and network infrastructure to client requirements or emerging industry practices. If we face material delays in introducing new or enhanced solutions, our clients may forego the use of our solutions in favor of those of our competitors.
Future acquisitions could disrupt our business and harm our financial condition and operating results.
Our success will depend, in part, on our ability to expand our offerings and markets and grow our business in response to changing technologies, client demands and competitive pressures. In some circumstances we may determine to do so through the acquisition of complementary businesses, solutions or technologies rather than through internal development. The identification of suitable acquisition candidates can be difficult, time-consuming and costly, and we may not be able to successfully complete identified acquisitions. Furthermore, even if we successfully complete an acquisition, we may not be able to successfully assimilate and integrate the business, technologies, solutions, personnel or operations of the company that we acquired, particularly if key personnel of an acquired company decide not to work for us. We may also inherit liability for activities of the acquired company before the acquisition, including violations of laws, rules and regulations, intellectual property disputes, commercial disputes, tax liabilities and other known and unknown liabilities. In addition, we may borrow to complete an acquisition, which would increase our costs, or issue equity securities, which would dilute our stockholders’ ownership and could adversely affect the price of our common stock. Historically, we have primarily grown organically, rather than through acquisitions. As a result, we have somewhat limited experience in identifying and executing acquisition opportunities. Acquisitions may also involve the entry into geographic or business markets in which we have little or no prior experience. Consequently, we may not achieve anticipated benefits of the acquisitions which could harm our operating results.
We make strategic investments from time to time and if they are unsuccessful, it could harm our financial condition.
We have made strategic investments in the past, such as the market development loan to OxataSMB, a franchisee, and may make additional similar or different strategic investments in the future. Such investments may not prove profitable or successful for us and may result in the partial or total loss of our invested capital. For example, the OxataSMB operations have not performed as contemplated, and as a result, at December 31, 2013, the Company recorded a $3.3 million impairment of the OxataSMB loan receivable and related interest and a $1.6 million provision for bad debt related to a trade receivable from OxataSMB. In addition, strategic investments, such as with OxataSMB, may involve future commitments to provide further capital and we cannot assure you any such further investments will be desirable if, and when made, or will prove profitable over the long term.
We may require additional capital to respond to business opportunities, challenges, acquisitions or unforeseen circumstances. If capital is not available to us, our business, operating results and financial condition may be harmed.
We may require additional capital to operate or expand our business. In addition, some of our product development initiatives may require substantial additional capital resources before they begin to generate material revenue. Additional funds may not be available when we need them, on terms that are acceptable to us, or at all. Any debt financing secured by us in the future could involve restrictive covenants relating to our capital raising activities and other financial and operational matters, which may make it more difficult for us to obtain additional capital and to pursue business opportunities, including potential acquisitions. If we do not have funds available to enhance our solutions, maintain the competitiveness of our technology or pursue business opportunities, we may not be able to service our existing clients or acquire new clients, which could have an adverse effect on our business, operating results and financial condition.
Our business is subject to the risks of earthquakes, fires, floods and other natural catastrophic events and to interruption by man-made problems such as computer viruses or terrorism.
Our systems and operations are vulnerable to damage or interruption from earthquakes, fires, floods, power losses, telecommunications failures, terrorist attacks, acts of war, human errors, break-ins and similar events. For example, a significant natural disaster, such as an earthquake, fire or flood, could have a material adverse impact on our business, operating results and financial condition, and our insurance coverage will likely be insufficient to compensate us for losses that may occur. Our servers may also be vulnerable to computer viruses, break-ins and similar disruptions from unauthorized tampering with our computer systems, which could lead to interruptions, delays, loss of critical data or the unauthorized disclosure of confidential intellectual property or client data. We may not have sufficient protection or recovery plans in certain circumstances, such as natural disasters affecting the Los Angeles area, and our business interruption insurance may be insufficient to compensate us for losses that may occur. As we rely heavily on our servers, computer and communications systems and the Internet to conduct our business and provide high quality customer service, such disruptions could negatively impact our ability to run our business, which could have an adverse effect on our operating results and financial condition.
If our security measures are breached and unauthorized access is obtained to a client’s data, our service may be perceived as not being secure and clients may curtail or stop using our service.
Our service involves the storage and transmission of clients’ proprietary information, such as credit card and bank account numbers, and security breaches could expose us to a risk of loss of this information, litigation and possible liability. Our payment services may be susceptible to credit card and other payment fraud schemes, including unauthorized use of credit cards, debit cards or bank account information, identity theft or merchant fraud.
If our security measures are breached in the future as a result of third-party action, employee error, malfeasance or otherwise, and as a result, someone obtains unauthorized access to our clients’ data, our reputation will be damaged, our business may suffer and we could incur significant liability. Because techniques used to obtain unauthorized access or to sabotage systems change frequently and generally are not recognized until launched against a target, we may be unable to anticipate these techniques or to implement adequate preventative measures. If an actual or perceived breach of our security occurs, the market perception of the effectiveness of our security measures could be harmed and we could lose sales and clients.
We provide services to clients in regulated industries (such as healthcare, financial and legal) in the United States and internationally. Clients in these regulated industries often have additional country-specific statutory and customer-specific contractual requirements. If we are not able to meet these changing requirements we could face litigation and could lose customers in those industries.
We are subject to a number of risks related to credit card payments we accept. If we fail to be in compliance with applicable credit card rules and regulations, we may incur additional fees, fines and ultimately, the revocation of the right to use the credit card company, which would have a material adverse effect on our business, financial condition or results of operations.
A majority of our clients’ campaigns were paid for using a credit card or debit card. For credit and debit card payments, we pay interchange and other fees, which may increase over time and raise our operating expenses and adversely affect our net income. We are also subject to payment card association operating rules, certification requirements and rules governing electronic funds transfers, which could change or be reinterpreted to make it difficult or impossible for us to comply. We believe we are compliant with the Payment Card Industry Data Security Standard, which incorporates Visa’s Cardholder Information Security Program, MasterCard’s Site Data Protection standard, and American Express' Data Security Operating Policy and Discover Information Security & Compliance (DISC) program. However, there is no guarantee that we will maintain such compliance or that compliance will prevent illegal or improper use of our payment system. If we fail to comply with these rules or requirements, we may be subject to fines and higher transaction fees and lose our ability to accept credit and debit card payments from our clients. A failure to adequately control fraudulent credit card transactions would result in significantly higher credit card-related costs and could have a material adverse effect on our business, financial condition or results of operations.
Our revenue may be negatively affected if we are required to charge sales tax or other transaction taxes on all or a portion of our past and future sales to customers located in jurisdictions where we are currently not collecting and reporting tax.
We have not historically collected, or had imposed upon us, sales or other transaction taxes related to the products and services we sell, except for certain corporate level taxes and transaction level taxes outside of the United States. However, sales of our new ReachEdge product are taxable in many state, local, and foreign jurisdictions, of which one or more may seek to impose additional sales or other transaction tax obligations on us in the future. A successful assertion by any state, local jurisdiction or country in which we do business that we should be collecting sales or other transaction taxes on the sale of our products or services could result in substantial tax liabilities related to past sales, create increased administrative burdens or costs, discourage clients from purchasing products or services from us, decrease our ability to compete or otherwise substantially harm our business and results of operations. The imposition of new laws requiring the collection of sales or other transaction taxes on the sale of our products or services (or the introduction of new products or services that are subject to existing transaction taxes) could create increased administrative burdens or costs, discourage clients from purchasing products or services from us, decrease our ability to compete or otherwise substantially harm our business and results of operations.
The intended tax benefits of our corporate structure and intercompany arrangements depend on the application of the tax laws of various jurisdictions and on how we operate our business.
Our corporate structure and intercompany arrangements, including the manner in which we develop and use our intellectual property and the transfer pricing of our intercompany transactions, are intended to reduce our worldwide effective tax rate. The application of the tax laws of various jurisdictions, including the United States, to our international business activities is subject to interpretation and depends on our ability to operate our business in a manner consistent with our corporate structure and intercompany arrangements. The taxing authorities of the jurisdictions in which we operate may challenge our methodologies for valuing developed technology or intercompany arrangements, including our transfer pricing, or determine that the manner in which we operate our business does not achieve the intended tax consequences, which could increase our worldwide effective tax rate and harm our financial position and results of operations.
Our corporate structure includes legal entities located in jurisdictions with income tax rates lower than the U.S. statutory tax rate. Our intercompany arrangements allocate income to such entities in accordance with arm’s-length principles and commensurate with functions performed, risks assumed and ownership of valuable corporate assets. We believe that income taxed in certain foreign jurisdictions at a lower rate relative to the U.S. statutory rate will have a beneficial impact on our worldwide effective tax rate.
Significant judgment is required in evaluating our tax positions and determining our provision for income taxes. During the ordinary course of business, there are many transactions and calculations for which the ultimate tax determination is uncertain. For example, our effective tax rates could be adversely affected by earnings being lower than anticipated in countries where we have lower statutory rates and higher than anticipated in countries where we have higher statutory rates, by changes in foreign currency exchange rates or by changes in the relevant tax, accounting and other laws, regulations, principles and interpretations. As we operate in numerous taxing jurisdictions, the application of tax laws can be subject to diverging and sometimes conflicting interpretations by tax authorities of these jurisdictions. It is not uncommon for taxing authorities in different countries to have conflicting views, for instance, with respect to, among other things, the manner in which the arm’s length standard is applied for transfer pricing purposes, or with respect to the valuation of intellectual property. In addition, tax laws are dynamic and subject to change as new laws are passed and new interpretations of the law are issued or applied. In particular, there is uncertainty in relation to the U.S. tax legislation in terms of the future corporate tax rate but also in terms of the U.S. tax consequences of income derived from intellectual property related income earned overseas in low tax jurisdictions.
Our existing corporate structure and intercompany arrangements have been implemented in a manner we believe is in compliance with current prevailing tax laws. However, the tax benefits which we intend to eventually derive could be undermined if we are unable to adapt the manner in which we operate our business and due to changing tax laws.
Failure to adequately protect our intellectual property could substantially harm our business and operating results.
Because our business is heavily dependent on our intellectual property, including our proprietary technology, the protection of our intellectual property rights is crucial to the success of our business. We rely on a combination of intellectual property rights, including trade secrets, patent applications, copyrights and trademarks, as well as contractual restrictions, to safeguard our intellectual property. These afford only limited protection. Despite our efforts to protect our proprietary rights, unauthorized parties may attempt to copy aspects of our online marketing and reporting solutions, technology, software and functionality or obtain and use information that we consider proprietary. Moreover, policing our proprietary rights is difficult and may not always be effective. In particular, because we sell our solutions internationally, we may need to enforce our rights under the laws of countries that do not protect proprietary rights to as great an extent as do the laws of the United States.
Our proprietary technology is not currently protected by any issued patents, and policing our rights to such technology may be hindered if we are unable to obtain any patents. In addition, the type and extent of patent claims that may be issued to us in the future is uncertain, and any patents that are issued may not contain claims that permit us to stop competitors from using similar technology. In light of the costs of obtaining patent protection, at times we may choose not to protect certain innovations that later on prove to be highly important. To the extent that the various technologies underlying any patent applications are determined to be business methods, the law around these types of patents is rapidly developing, and pending changes may impact our ability to protect our technology and proprietary use thereof through patents.
We have registered ReachLocal and other trademarks as trademarks in the United States and in certain other countries. Some of our trade names are not eligible to receive trademark protection. Also, trademark protection may not be available, or sought by us, in every country in which our technology and products are available online. Competitors may adopt service names similar to ours, or purchase our trademarks and confusingly similar terms as keywords in Internet search engine advertising programs, thereby impeding our ability to build brand identity and possibly leading to client confusion. In addition, there could be potential trade name or trademark infringement claims brought by owners of other registered trademarks or trademarks that incorporate variations of the term ReachLocal or our other trademarks.
Litigation or proceedings before the U.S. Patent and Trademark Office or other governmental authorities and administrative bodies in the United States and abroad may be necessary in the future to enforce our intellectual property rights, to protect our patent rights, trade secrets and domain names and to determine the validity and scope of the proprietary rights of others. Our efforts to enforce or protect our proprietary rights may be ineffective and could result in substantial costs and diversion of resources and could substantially harm our operating results.
Confidentiality agreements with employees and others may not adequately prevent disclosure of trade secrets and other proprietary information.
In order to protect our proprietary technology and processes, we rely in part on confidentiality agreements with our employees, licensees, independent contractors and other advisors. These agreements may not effectively prevent disclosure of confidential information and may not provide an adequate remedy in the event of unauthorized disclosure of confidential information. In addition, others may independently discover trade secrets and proprietary information, and in such cases, we could not assert any trade secret rights against such parties. Costly and time-consuming litigation could be necessary to enforce and determine the scope of our proprietary rights, and failure to obtain or maintain trade secret protection could adversely affect our competitive business position.
Assertions by third parties of infringement by us of their intellectual property rights could result in significant costs and substantially harm our business and operating results.
Companies in the Internet, technology and media industries own large numbers of patents, copyrights, trademarks and trade secrets and frequently litigate or threaten litigation based on allegations of infringement or other violations of intellectual property rights. Other parties have asserted, and may in the future assert, that we have infringed their intellectual property rights. These types of litigations may involve patent holding companies or other adverse patent owners who have no relevant product revenue, and therefore our own issued and pending patents, if any, may provide little or no deterrence. In addition, we have been and could in the future become involved in disputes over the use of keywords by our clients, to the extent such clients’ competitors allege the use of such keywords on our technology platform violates such competitors’ trademark rights. We cannot predict whether assertions of third-party intellectual property rights or claims arising from such assertions will substantially harm our business and operating results. If we are forced to defend against any infringement claims, whether they are with or without merit or are determined in our favor, we may face costly litigation and diversion of technical and management personnel. Furthermore, an adverse outcome of a dispute may require us to pay damages, potentially including treble damages and attorneys’ fees, if we are found to have willfully infringed a party’s patent or copyright rights; cease making, licensing or using solutions that are alleged to incorporate the intellectual property of others; expend additional development resources to redesign our solutions; and enter into potentially unfavorable royalty or license agreements in order to obtain the right to use necessary technologies. Royalty or licensing agreements, if required, may be unavailable on terms acceptable to us, or at all. Over time, we expect that we will increasingly be subject to infringement claims as the number of competitors in our industry segment grows or as our presence and visibility within the industry increases.
We could lose clients if we or our media partners fail to detect click-through or other fraud on advertisements in a manner that is acceptable to our clients.
We are exposed to the risk of fraudulent clicks or actions on our third-party publishers’ websites. We may lose clients, or in the future, we may have to refund revenue that our clients have paid to us and that was later attributed to, or suspected to be caused by, click-through fraud. Click-through fraud occurs when an individual clicks on an ad displayed on a website or an automated system is used to create such clicks with little to no intent of viewing the underlying content. If fraudulent clicks are not detected, the affected clients may become dissatisfied with our campaigns, which in turn may lead to loss of clients and the related revenue.
Our business is subject to complex and evolving U.S. and foreign laws and regulations regarding privacy, data protection, and other matters. Many of these laws and regulations are subject to change and uncertain interpretation, and could result in claims, changes to our business practices, increased cost of operations, or otherwise harm our business.
We are subject to a variety of laws and regulations in the United States and abroad that involve matters central to our business, including user privacy, rights of publicity, data protection, content, intellectual property, distribution, electronic contracts and other communications, competition, protection of minors, consumer protection, taxation, and online payment services. Foreign data protection, privacy, and other laws and regulations are often more restrictive than those in the United States. These U.S. federal and state and foreign laws and regulations are constantly evolving and can be subject to significant change. In addition, the application and interpretation of these laws and regulations are often uncertain. These laws and regulations could have a significant impact on online advertising services depending on how these laws and regulations are interpreted and enforced. It is also clear that the laws and regulations are intending to regulate behavioral targeting, the availability of which could become highly limited are eliminated entirely. Our product suite does not rely heavily on the use of behavioral targeting, but we do offer a display remarketing product, which involves showing a consumer an ad for the website of a client that the consumer has previously visited.
In addition, a number of proposals are pending before federal, state, and foreign legislative and regulatory bodies that could significantly affect our business. For example, a revision to the 1995 European Union Data Protection Directive is currently being considered by European legislative bodies that may include more stringent operational requirements for data processors and significant penalties for non-compliance. Similarly, there have been a number of recent legislative proposals in the United States, at both the federal and state level, that would impose new obligations in areas such as privacy, data protection and data breach notifications. Some of the proposed changes to U.S. and European law could require that we obtain prior consent before using cookies or other tracking technologies or provide a “do not track” mechanism in certain circumstances. These existing and proposed laws and regulations can be costly to comply with and can delay or impede the development of new products, result in negative publicity, increase our operating costs, require significant management time and attention, and subject us to claims or other remedies, including fines or demands that we modify or cease existing business practices.
We process, store and use personal information and other data, which subjects us to governmental regulation and other legal obligations related to privacy. Our actual or perceived failure to comply with such obligations could harm our business.
We receive, store and process personal information and other user data, including credit card information for certain users. There are numerous federal, state and local laws around the world regarding privacy and the storing, sharing, use, processing, disclosure and protection of personal information and other user data, the scope of which are changing, subject to differing interpretations, and may be inconsistent between countries or conflict with other rules. It is possible that these obligations may be interpreted and applied in a manner that is inconsistent from one jurisdiction to another and may conflict with other rules or our practices. Any failure or perceived failure by us to comply with our privacy policies, our privacy-related obligations to users or other third parties, or our privacy-related legal obligations, or any compromise of security that results in the unauthorized release or transfer of personally identifiable information or other user data, may result in governmental enforcement actions, litigation or negative publicity and could cause our clients to lose trust in us, which could have an adverse effect on our business. Additionally, if third parties with whom we work, such as our publishers or our providers of telephony services, violate applicable laws or our policies, such violations may also put our users’ information at risk and could have an adverse effect on our business.
Some of our services may utilize “open source” software, and any failure to comply with the terms of one or more of these open source licenses could negatively affect our business.
Some of our services may utilize software licensed by its authors or other third parties under so-called “open source” licenses, including, but not limited to, the GNU General Public License and the GNU Lesser General Public License. Some of those licenses may require that we make available source code for modifications or derivative works we create using the open source software, that we provide notices with our products and that we license any modifications or derivative works under an open source license or rights of further use to third parties. If we combine our proprietary software with open source software, we could be required to release the source code of our proprietary software. Although we take steps to ensure that our software engineers properly isolate our proprietary software they design from open source software components, we may not control the product development efforts of our engineers and we cannot be certain that they have not inappropriately incorporated open source software into our proprietary technologies. If an author or other third party that distributes open source software were to obtain a judgment against us based on allegations that we had not complied with the terms of any applicable open source license, we could be subject to liability for copyright infringement damages and breach of contract. In addition, we could be enjoined from selling our services that contained the open source software and required to make the source code for the open source software available, to grant third parties certain rights of further use of our software or to remove the open source software from our services, which could disrupt our distribution and sale of some of our services.
Government regulation of the Internet is evolving, and unfavorable changes could substantially harm our business and operating results.
We are subject to general business regulations and laws as well as regulations and laws specifically governing the Internet. Existing and future laws and regulations may impede the growth in use of the Internet and online services. The application of existing laws to the Internet and online services governing issues such as property ownership, sales and other taxes, libel and personal privacy has not yet been settled. Unfavorable resolution of these issues may substantially harm our business and operating results. Other laws and regulations that have been adopted, or may be adopted in the future, that may affect our business include those covering user privacy, data protection, spyware, “do not email” lists, access to high speed and broadband service, pricing, taxation, tariffs, patents, copyrights, trademarks, trade secrets, export of encryption technology, electronic contracting, click-fraud, acceptable content, search terms, lead generation, behavioral targeting, consumer protection, and quality of products and services. Any changes in regulations or laws that hinder growth of the Internet generally or that decrease the acceptance of the Internet as a communications, commercial and advertising medium could adversely affect our business. See also Part 1, Item 1A, “Risk Factors—Our business is subject to complex and evolving U.S. and foreign laws and regulations regarding privacy, data protection, and other matters. Many of these laws and regulations are subject to change and uncertain interpretation, and could result in claims, changes to our business practices, increased cost of operations, or otherwise harm our business.”
Risks Related to Owning Our Common Stock
Our stock price may be volatile, and the value of an investment in our common stock may decline.
Shares of our common stock were sold in our initial public offering in May 19, 2010 at a price of $13.00 per share, and our common stock has subsequently traded as high as $28.39 and as low as $6.05. An active, liquid and orderly market for our common stock may not be sustained, which could depress the trading price of our common stock. The trading price of our common stock may be subject to wide fluctuations in response to various factors, some of which are beyond our control, including:
| • | our operating performance and the operating performance of similar companies; |
| • | the overall performance of the equity markets; |
| • | the number of shares of our common stock publicly owned and available for trading; |
| • | changes in the amounts and frequency of share repurchases; |
| • | threatened or actual litigation; |
| • | changes in laws or regulations relating to our solutions; |
| • | any major change in our board of directors or management; |
| • | publication of research reports about us or our industry or changes in recommendations or withdrawal of research coverage by securities analysts; |
| • | large volumes of sales of our shares of common stock by existing stockholders; and |
| • | general political and economic conditions. |
In addition, the stock market in general, and the market for Internet-related companies in particular, has experienced extreme price and volume fluctuations that have often been unrelated or disproportionate to the operating performance of those companies. Securities class action litigation has often been instituted against companies following periods of volatility in the overall market and in the market price of a company’s securities. This litigation, if instituted against us, could result in very substantial costs, divert our management’s attention and resources and harm our business, operating results and financial condition. In addition, the recent distress in the financial markets has also resulted in extreme volatility in security prices.
Future sales of shares of our common stock by stockholders could depress the price of our common stock.
As of February 28, 2014, approximately 54% of our common stock is held by our directors, officers and entities affiliated with our directors, including approximately 44% beneficially owned by VantagePoint Capital Partners and approximately 9% beneficially owned by Rho Ventures. In addition, these percentages may increase as we repurchase shares of our common stock pursuant to our $47 million share repurchase program, of which approximately $10.7 million was available for repurchase as of February 28, 2014 (see Part II, Item 5, “Common Stock Repurchases”). Such shares have not been subject to lock-up agreements since November 2010. VantagePoint and Rho Ventures were our two primary venture capital investors and have owned their shares for a considerable length of time. If VantagePoint or Rho Ventures decides to exit its investments in us, it could negatively impact the price of our common stock. During August and November of 2012, Rho Ventures sold an aggregate of 575,000 shares, and during February of 2014, Rho Ventures sold 100,000 shares.
A number of members of our management team have adopted 10b5-1 trading plans covering approximately 150,000 shares of common stock as of December 31, 2013. In addition, insiders may seek to sell shares without the adoption of trading plans. If there are substantial sales of our common stock in the public market, the trading price of our common stock could decline significantly. In addition, as of December 31, 2013, approximately 6.7 million shares subject to outstanding options under our 2004 Stock Plan and our Amended and Restated 2008 Stock Incentive Plan are eligible for sale in the public market in the future, subject to certain legal and contractual limitations. If these additional shares are sold, or if it is perceived that they will be sold, in the public market, the price of our common stock could decline substantially.
If securities or industry analysts do not publish research or publish inaccurate or unfavorable research about our business, our stock price and trading volume could decline.
The trading market for our common stock depends in part on the research and reports that securities or industry analysts publish about us or our business. If one or more of the analysts who cover us downgrade our stock or publish inaccurate or unfavorable research about our business, our stock price would likely decline. If one or more of these analysts cease coverage of our company or fail to publish reports on us regularly, demand for our stock could decrease, which might cause our stock price and trading volume to decline.
Investment funds managed by VantagePoint Capital Partners own a substantial amount of our stock and have significant influence over our business. In the aggregate, insiders own a majority of our outstanding stock.
As of February 28, 2014, VantagePoint Capital Partners, one of our early venture capital investors, beneficially owned approximately 44% of our outstanding common stock. As a result, VantagePoint has significant influence over the outcome of matters submitted to our stockholders for approval, including the election of directors. VantagePoint’s significant ownership also could affect the market price of our common stock by, for example, delaying, deferring or preventing a change in corporate control, impeding a merger, consolidation, takeover or other business combination involving us, or discouraging a potential acquiror from making a tender offer or otherwise attempting to obtain control of us. Alan Salzman, the Chief Executive Officer of Vantage Point, serves as a member of our board of directors.
As of February 28, 2014, our current directors and executive officers as a group beneficially owned approximately 54% of our outstanding common stock (including all shares issuable with respect to options held by such holders).
Certain provisions in our charter documents and Delaware law could discourage takeover attempts and lead to management entrenchment.
Our certificate of incorporation and bylaws contain provisions that could have the effect of delaying or preventing changes in control or changes in our management without the consent of our board of directors, including, among other things:
| • | a classified board of directors with three-year staggered terms, which may delay the ability of stockholders to change the membership of a majority of our board of directors; |
| • | no cumulative voting in the election of directors, which limits the ability of minority stockholders to elect director candidates; |
| • | the ability of our board of directors to determine to issue shares of preferred stock and to determine the price and other terms of those shares, including preferences and voting rights, without stockholder approval, which could be used to significantly dilute the ownership of a hostile acquirer; |
| • | the exclusive right of our board of directors to elect a director to fill a vacancy created by the expansion of our board of directors or the resignation, death or removal of a director, which prevents stockholders from being able to fill vacancies on our board of directors; |
| • | a prohibition on stockholder action by written consent, which forces stockholder action to be taken at an annual or special meeting of our stockholders; |
| • | the requirement that a special meeting of stockholders may be called only by the chairman of our board of directors, the Chief Executive Officer, the president (in absence of a Chief Executive Officer) or our board of directors, which may delay the ability of our stockholders to force consideration of a proposal or to take action, including the removal of directors; |
| • | the requirement for the affirmative vote of holders of at least 662/3% of the voting power of all of the then outstanding shares of the voting stock, voting together as a single class, to amend the provisions of our certificate of incorporation relating to the issuance of preferred stock and management of our business or our bylaws, which may inhibit the ability of an acquiror from amending our certificate of incorporation or bylaws to facilitate a hostile acquisition; |
| • | the ability of our board of directors, by majority vote, to amend the bylaws, which may allow our board of directors to take additional actions to prevent a hostile acquisition and inhibit the ability of an acquiror from amending the bylaws to facilitate a hostile acquisition; and |
| • | advance notice procedures that stockholders must comply with in order to nominate candidates to our board of directors or to propose matters to be acted upon at a stockholders’ meeting, which may discourage or deter a potential acquiror from conducting a solicitation of proxies to elect the acquiror’s own slate of directors or otherwise attempting to obtain control of us. |
We are also subject to certain anti-takeover provisions under Delaware law. Under Delaware law, a corporation may not, in general, engage in a business combination with any holder of 15% or more of its capital stock unless the holder has held the stock for three years or, among other things, our board of directors has approved the transaction.
Item 1B. Unresolved Staff Comments.
None.
Item 2. Properties.
We do not own any real estate. We lease 38,592 square-feet for our corporate office in Woodland Hills, California, and 76,157 square-feet for our corporate and sales offices in Plano, Texas. Upon completion during the second half of 2014, we intend to consolidate our current Plano, Texas offices into 100,000 square-feet of new office space in Plano, Texas. We also have over 75 leases for sales offices, support facilities and data centers in other locations in North America and overseas.
Item 3. Legal Proceedings.
From time to time, we are involved in legal proceedings arising in the ordinary course of our business. We believe that there is no litigation pending that is likely to have a material adverse effect on our financial position, results of operations and or cash flows.
Item 4. Mine Safety Disclosures.
Not applicable.
PART II
Item 5. Market for Registrant’s Common Equity, Related Stockholder Matters and Issuer Purchases of Equity Securities.
Our common stock has been traded on The Nasdaq Global Select Market since May 20, 2010 under the symbol “RLOC.” The following table sets forth the high and low sales prices for our common stock as reported by The Nasdaq Global Select Market for the period indicated.
| | | 2012 | | | 2013 | |
| | | High | | | Low | | | High | | | Low | |
First quarter | | $ | 9.85 | | | $ | 6.05 | | | $ | 15.08 | | | $ | 11.76 | |
Second quarter | | $ | 11.75 | | | $ | 6.25 | | | $ | 17.39 | | | $ | 12.05 | |
Third quarter | | $ | 13.98 | | | $ | 9.71 | | | $ | 14.45 | | | $ | 10.27 | |
Fourth quarter | | $ | 13.76 | | | $ | 9.99 | | | $ | 13.15 | | | $ | 11.41 | |
At February 28, 2014, we had approximately 32 stockholders of record of our common stock. We have never declared or paid, and do not anticipate declaring or paying, any cash dividends on our common stock. Any future determination as to the declaration and payment of dividends, and share repurchases, if any, will be at the discretion of our board of directors and will depend on then existing conditions, including our financial condition, operating results, contractual restrictions, capital requirements, business prospects and other factors our board of directors may deem relevant.
Stock Price Performance Graph
This performance graph shall not be deemed “soliciting material” or to be “filed” with the Securities and Exchange Commission for purposes of Section 18 of the Exchange Act or otherwise subject to the liabilities under that Section, and shall not be deemed to be incorporated by reference into any filing of ReachLocal, Inc. under the Securities Act or the Exchange Act.
The following graph compares, for the period from May 20, 2010 through December 31, 2013, the total cumulative stockholder return on our common stock with the total cumulative return of the NASDAQ Composite Index and the RDG Internet Composite Index. The graph assumes a $100 investment at the beginning of the period in our common stock, the stocks represented in the NASDAQ Composite Index and the stocks represented in the RDG Internet Composite Index, and reinvestment of any dividends. Historical stock price performance should not be relied upon as an indication of future stock price performance:
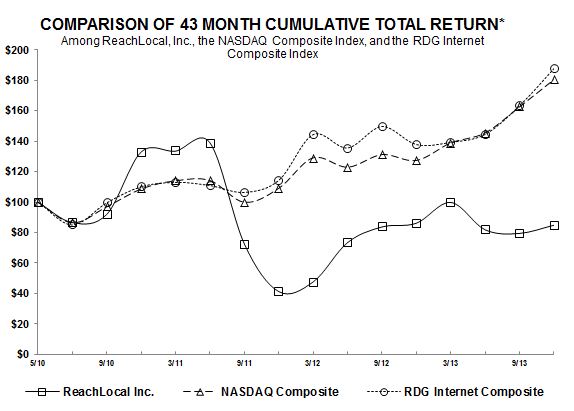
*$100 invested on 5/20/10 in stock or 4/30/10 in index, including reinvestment of dividends.
| | | 5/20/10 | | | 6/10 | | | 12/10 | | | 6/11 | | | 12/11 | | | 6/12 | | | 12/12 | | | 6/13 | | | 12/13 | |
| | | | | | | | | | | | | | | | | | | | | | | | | | | | | | | | | | | | | |
ReachLocal Inc. | | | 100.00 | | | | 86.58 | | | | 132.91 | | | | 139.05 | | | | 41.26 | | | | 73.43 | | | | 86.18 | | | | 81.84 | | | | 84.85 | |
NASDAQ Composite | | | 100.00 | | | | 86.46 | | | | 108.71 | | | | 114.22 | | | | 109.16 | | | | 123.02 | | | | 127.44 | | | | 145.55 | | | | 180.59 | |
RDG Internet Composite | | | 100.00 | | | | 85.04 | | | | 110.13 | | | | 110.99 | | | | 114.35 | | | | 135.65 | | | | 137.86 | | | | 144.56 | | | | 187.71 | |
Recent Sales of Unregistered Securities
On February 8, 2011, we agreed to issue up to 21,297 shares of common stock as partial deferred consideration for the acquisition of DealOn, LLC, and on February 8, 2012, August 8, 2012 and February 8, 2013, we issued 10,649, 5,324 and 5,324, respectively, of such shares of our common stock.
On February 22, 2010, we agreed to issue up to 364,632 shares of common stock as partial deferred consideration for the acquisition of SMB:LIVE Corporation, and on February 22, 2011, August 22, 2011 and February 22, 2012, we issued 90,062, 93,346 and 181,224, respectively, of such shares of our common stock.
Common Stock Repurchases
On November 4, 2011, we announced that our Board of Directors authorized the repurchase of up to $20.0 million of our outstanding common stock. On December 13, 2012, we announced that our Board of Directors increased our share repurchase program by $6.0 million, and on March 4, 2013, we announced that our Board of Directors increased our share repurchase program by an additional $21.0 million, to a total authorization of $47.0 million. At December 31, 2013, we had executed repurchases of $36.3 million of our common stock under the program. There were no repurchases during the quarter ended December 31, 2013. Purchases may be made from time-to-time in open market or privately negotiated transactions as determined by our management. The amount and timing of the share repurchase will depend on business and market conditions, stock price, trading restrictions, acquisition activity, and other factors. The share repurchase program does not obligate us to acquire any particular amount of common stock, and the repurchase program may be suspended or discontinued at any time at our discretion.
Item 6. Selected Financial Data.
The data set forth below are qualified in their entirety by reference to, and should be read in conjunction with Part II, Item 7, “Management’s Discussion and Analysis of Financial Condition and Results of Operations” and the consolidated financial statements, related notes and other financial information included elsewhere in this report. The consolidated statements of operations data for the years ended December 31, 2013, 2012 and 2011 and the consolidated balance sheet data as of December 31, 2013 and 2012 are derived from our audited consolidated financial statements included elsewhere in this report. The consolidated statements of operations data for the years ended December 31, 2010 and 2009 and the consolidated balance sheet data as of December 31, 2011, 2010 and 2009 are derived from our audited consolidated financial statements not included in this report. In addition, as a result of the disposal of our ClubLocal business and the winding down of the operations of Bizzy, we have reclassified and presented all related historical financial information as “discontinued operations” in the accompanying Consolidated Balance Sheets, Consolidated Statements of Operations and Consolidated Statements of Cash Flows. Historical results are not necessarily indicative of the results to be expected in the future.
| | | Years Ended December 31, | |
| | | 2013 | | | 2012 | | | 2011 | | | 2010 | | | 2009 | |
(in thousands, except per share data) | | | | | | | | | | | | | | | | | | | | |
Consolidated Statements of Operations: | | | | | | | | | | | | | | | | | | | | |
Revenue | | $ | 514,070 | | | $ | 454,957 | | | $ | 375,241 | | | $ | 291,689 | | | $ | 203,117 | |
Cost of revenue (1) | | | 256,450 | | | | 226,482 | | | | 190,559 | | | | 159,018 | | | | 112,218 | |
Operating expenses: | | | | | | | | | | | | | | | | | | | | |
Selling and marketing (1) | | | 182,854 | | | | 164,168 | | | | 139,929 | | | | 108,529 | | | | 76,089 | |
Product and technology (1) | | | 22,240 | | | | 18,980 | | | | 15,602 | | | | 9,957 | | | | 4,657 | |
General and administrative (1) | | | 46,362 | | | | 40,378 | | | | 33,470 | | | | 23,880 | | | | 15,731 | |
Total operating expenses | | | 251,456 | | | | 223,526 | | | | 189,001 | | | | 142,366 | | | | 96,477 | |
Operating income (loss) | | | 6,164 | | | | 4,949 | | | | (4,319 | ) | | | (9,695 | ) | | | (5,578 | ) |
Gain on acquisition of ReachLocal Australia | | | — | | | | — | | | | — | | | | — | | | | 16,223 | |
Other income (expense), net | | | 586 | | | | 556 | | | | 928 | | | | 601 | | | | (7 | ) |
| | | | | | | | | | | | | | | | | | | | | |
| | | | | | | | | | | | | | | | | | | | | |
Income (loss) from continuing operations before income taxes | | | 6,750 | | | | 5,505 | | | | (3,391 | ) | | | (9,094 | ) | | | 10,638 | |
Income tax provision (benefit) | | | 3,699 | | | | 1,340 | | | | 735 | | | | (540 | ) | | | 217 | |
Income (loss) from continuing operations | | | 3,051 | | | | 4,165 | | | | (4,126 | ) | | | (8,554 | ) | | | 10,421 | |
| | | | | | | | | | | | | | | | | | | | | |
Loss from discontinued operations, net of income taxes | | | (5,534 | ) | | | (4,397 | ) | | | (6,215 | ) | | | (2,844 | ) | | | (601 | ) |
Net income (loss) | | | (2,483 | ) | | | (232 | ) | | | (10,341 | ) | | | (11,398 | ) | | | 9,820 | |
| | | | | | | | | | | | | | | | | | | | | |
Undistributed income attributable to preferred stockholders | | | — | | | | — | | | | — | | | | — | | | | 8,638 | |
Net income (loss) available to common stockholders | | $ | (2,483 | ) | | $ | (232 | ) | | $ | (10,341 | ) | | $ | (11,398 | ) | | $ | 1,182 | |
| | | | | | | | | | | | | | | | | | | | | |
Net income (loss) per share: | | | | | | | | | | | | | | | | | | | | |
| | | | | | | | | | | | | | | | | | | | | |
Basic: | | | | | | | | | | | | | | | | | | | | |
Income (loss) from continuing operations | | $ | 0.11 | | | $ | 0.15 | | | $ | (0.14 | ) | | $ | (0.43 | ) | | $ | 0.28 | |
| | | | | | | | | | | | | | | | | | | | | |
Loss from discontinued operations, net of income taxes | | $ | (0.20 | ) | | $ | (0.16 | ) | | $ | (0.21 | ) | | $ | (0.14 | ) | | $ | (0.10 | ) |
Net income (loss) per share (2) | | $ | (0.09 | ) | | $ | (0.01 | ) | | $ | (0.36 | ) | | $ | (0.57 | ) | | $ | 0.19 | |
| | | | | | | | | | | | | | | | | | | | | |
Diluted: | | | | | | | | | | | | | | | | | | | | |
Income (loss) from continuing operations | | $ | 0.10 | | | $ | 0.14 | | | $ | (0.14 | ) | | $ | (0.43 | ) | | $ | 0.23 | |
| | | | | | | | | | | | | | | | | | | | | |
Loss from discontinued operations, net of income taxes | | $ | (0.19 | ) | | $ | (0.15 | ) | | $ | (0.21 | ) | | $ | (0.14 | ) | | $ | (0.10 | ) |
Net income (loss) per share (2) | | $ | (0.09 | ) | | $ | (0.01 | ) | | $ | (0.36 | ) | | $ | (0.57 | ) | | $ | 0.13 | |
| | | | | | | | | | | | | | | | | | | | | |
Weighted average common shares used in the computation of income (loss) per share: | | | | | | | | | | | | | | | | | | | | |
Basic | | | 27,764 | | | | 28,348 | | | | 28,974 | | | | 19,867 | | | | 6,283 | |
Diluted | | | 29,051 | | | | 28,896 | | | | 28,974 | | | | 19,867 | | | | 7,901 | |
_____________
(1) | Stock-based compensation, net of capitalization, and depreciation and amortization included in the above line items (in thousands): |
| | | Years Ended December 31, | |
| | | 2013 | | | 2012 | | | 2011 | | | 2010 | | | 2009 | |
Stock-based compensation: | | | | | | | | | | | | | | | | | | | | |
Cost of revenue | | $ | 697 | | | $ | 258 | | | $ | 200 | | | $ | 244 | | | $ | 86 | |
Selling and marketing | | | 3,040 | | | | 1,756 | | | | 1,402 | | | | 1,202 | | | | 566 | |
Product and technology | | | 627 | | | | 1,194 | | | | 1,387 | | | | 1,104 | | | | 117 | |
General and administrative | | | 7,141 | | | | 6,261 | | | | 5,549 | | | | 3,374 | | | | 2,347 | |
| | | $ | 11,505 | | | $ | 9,469 | | | $ | 8,538 | | | $ | 5,924 | | | $ | 3,116 | |
| | | Years Ended December 31, | |
| | | 2013 | | | 2012 | | | 2011 | | | 2010 | | | 2009 | |
Depreciation and amortization: | | | | | | | | | | | | | | | | | | | | |
Cost of revenue | | $ | 761 | | | $ | 706 | | | $ | 645 | | | $ | 364 | | | $ | 261 | |
Selling and marketing | | | 2,925 | | | | 2,418 | | | | 1,443 | | | | 1,038 | | | | 889 | |
Product and technology | | | 10,214 | | | | 8,924 | | | | 6,764 | | | | 3,822 | | | | 1,741 | |
General and administrative | | | 1,196 | | | | 1,554 | | | | 1,422 | | | | 1,078 | | | | 430 | |
| | | $ | 15,096 | | | $ | 13,602 | | | $ | 10,274 | | | $ | 6,302 | | | $ | 3,321 | |
| | | December 31, | |
| | | 2013 | | | 2012 | | | 2011 | | | 2010 | | | 2009 | |
(in thousands) | | | | | | | | | | | | | | | | | | | | |
Consolidated Balance Sheet Data: | | | | | | | | | | | | | | | | | | | | |
Cash, cash equivalents and short-term investments | | $ | 80,277 | | | $ | 95,469 | | | $ | 85,169 | | | $ | 88,114 | | | $ | 43,416 | |
Working capital | | $ | (289 | ) | | $ | 11,513 | | | $ | 17,524 | | | $ | 27,082 | | | $ | (6,606 | ) |
Total assets | | $ | 186,009 | | | $ | 185,696 | | | $ | 166,437 | | | $ | 151,399 | | | $ | 97,761 | |
Total liabilities | | $ | 107,641 | | | $ | 103,810 | | | $ | 84,150 | | | $ | 69,383 | | | $ | 55,643 | |
Total stockholders’ equity | | $ | 78,368 | | | $ | 81,886 | | | $ | 82,287 | | | $ | 82,016 | | | $ | 42,118 | |
| | | Year Ended December 31, | |
| | | 2013 | | | 2012 | | | 2011 | | | 2010 | | | 2009 | |
(in thousands) | | | | | | | | | | | | | | | | | | | | |
Other Financial Data: | | | | | | | | | | | | | | | | | | | | |
Net cash provided by operating activities | | $ | 26,687 | | | $ | 42,343 | | | $ | 18,522 | | | $ | 17,675 | | | $ | 14,308 | |
Capital expenditures (3) | | $ | 19,748 | | | $ | 15,013 | | | $ | 11,974 | | | $ | 8,526 | | | $ | 4,613 | |
Non-GAAP Financial Measures: | | | | | | | | | | | | | | | | | | | | |
Adjusted EBITDA (4) | | $ | 32,801 | | | $ | 28,052 | | | $ | 15,915 | | | $ | 3,133 | | | $ | 1,920 | |
Underclassmen Expense (5) (6) | | $ | 48,944 | | | $ | 45,250 | | | $ | 44,488 | | | $ | 36,073 | | | $ | 26,824 | |
| | | December 31, | |
| | | 2013 | | | 2012 | | | 2011 | | | 2010 | | | 2009 | |
Other Operational Data: | | | | | | | | | | | | | | | | | | | | |
Number of IMCs: | | | | | | | | | | | | | | | | | | | | |
Upperclassmen (6) | | | 442 | | | | 419 | | | | 372 | | | | 286 | | | | 235 | |
Underclassmen (6) | | | 482 | | | | 405 | | | | 424 | | | | 379 | | | | 280 | |
Total (6) | | | 924 | | | | 824 | | | | 796 | | | | 665 | | | | 515 | |
Active Advertisers (7) | | | 23,900 | | | | 22,000 | | | | 19,100 | | | | 16,900 | | | | 14,700 | |
Active Campaigns (8) | | | 35,200 | | | | 32,500 | | | | 27,500 | | | | 22,700 | | | | 18,600 | |
______________
(2) | See Note 2 to our consolidated financial statements for an explanation of the method used to calculate basic and diluted net income per share of common stock. |
(3) | Represents purchases of property and equipment and the amount of software development costs capitalized, in aggregate, excluding stock-based compensation and the acquisition of ReachLocal Australia in September 2009, and excluding capital expenditures related to the discontinued operations of Bizzy and ClubLocal. |
(4) | See Part II, Item 7, “Management’s Discussion and Analysis of Financial Condition and Results of Operations – Non-GAAP Financial Measures” for our definition of Adjusted EBITDA, why we present it and for a reconciliation of our Adjusted EBITDA to loss from operations for the years ended December 31, 2013, 2012 and 2011. |
(5) | See Part II, Item 7, “Management’s Discussion and Analysis of Financial Condition and Results of Operations – Non-GAAP Financial Measures” for our definition of Underclassmen Expense. |
(6) | In connection with the realignment of our North American sales force in December 2013, the job descriptions of the outside sales force in North America changed. As a result of the realignment, we will no longer be reporting Underclassmen Expense or IMC counts. The non-GAAP calculations presented here for the period ended December 31, 2013 are made on a pro forma basis as if the realignment had not occurred and the salespeople employed on December 31, 2013 had retained their previous job roles and maturities. |
(7) | Active Advertisers is a number we calculate to approximate the number of clients directly served through our Direct Local channel as well as clients served through our National Brands, Agencies and Resellers channel. We calculate Active Advertisers by adjusting the number of Active Campaigns to combine clients with more than one Active Campaign as a single Active Advertiser. Clients with more than one location are generally reflected as multiple Active Advertisers. Because this number includes clients served through the National Brands, Agencies and Resellers channel, Active Advertisers includes entities with which we do not have a direct client relationship. Numbers are rounded to the nearest hundred. |
(8) | Active Campaigns is a number we calculate to approximate the number of individual products or services we are managing under contract for Active Advertisers. For example, if we were performing both ReachSearch and ReachDisplay campaigns for a client, we consider that two Active Campaigns. Similarly, if a client purchased ReachSearch campaigns for two different products or purposes, we consider that two Active Campaigns. Numbers are rounded to the nearest hundred. |
Item 7. Management’s Discussion and Analysis of Financial Condition and Results of Operations.
You should read the following discussion together with Part II, Item 6, “Selected Financial Data” and our consolidated financial statements and the related notes included elsewhere in this Annual Report. This discussion contains forward-looking statements about our business and operations. Our actual results may differ materially from those we currently anticipate as a result of many factors, including those we describe in Part I, Item 1A, “Risk Factors” and elsewhere in this Annual Report. See Part I, “Cautionary Notice Regarding Forward-Looking Statements.”
Overview
ReachLocal’s mission is to help local small- to medium-sized businesses (SMBs) around the world acquire, transact with, and retain customers. We began in 2004 with the goal of helping SMBs move their advertising spend from traditional media and yellow pages to online search. While we have sold to a variety of SMBs and will continue to do so, our present focus is on what we refer to as Premium SMBs. A Premium SMB generally has 10 to 30 employees, $1 to $10 million in annual revenue and spends approximately $40,000 annually on marketing. Premium SMBs have become increasingly sophisticated in their understanding of online marketing. However, we believe that Premium SMBs have not changed their desire for a single, unified solution to their marketing needs. Our goal is to be the “one-stop shop” for SMBs’ online marketing needs.
With the rollout of ReachSearch in 2005, we pioneered the provisioning of search engine marketing services (SEM) on a mass scale for SMBs through the use of our technology platform. ReachSearch combines search engine marketing optimized across multiple publishers, call tracking and call recording services, and industry leading campaign performance transparency. This product enabled us to become one of the largest adTech companies focusing on the SMB marketplace. ReachSearch remains the leading SEM offering for SMBs in the market and was recently recognized by Google in the United States with its 2013 “Best Quality Accounts” award. However, ReachSearch does not solve all of the marketing challenges of our SMB clients. We have therefore added additional elements to our platform including our display product, ReachDisplay, our behavioral targeting product, ReachRetargeting, and other products that are primarily focused on leveraging third-party media to drive leads to our clients. Today we drive over 5 million leads to our clients each month.
We also recognize that even successfully driving leads to our clients, does not represent a complete solution to our SMBs’ online marketing needs. This leads to our next major product rollout—ReachEdge. The launch of ReachEdge in 2013 was our first step to move beyond being a media-driven lead generation business to offer integrated solutions that address the majority of the online marketing needs of our clients.ReachEdge is a marketing automation platform that includes a responsive website solution designed to enhance lead tracking and conversion, and includes tools for capturing web traffic information and converting leads into new customers for our clients. ReachEdge represents a significant step to allow us to leverage our collection of critical lead generation and conversion data in order to enhance the performance of our online marketing services for the benefit of our clients.Each ReachEdge site also includes a mobile optimized version of the site reflecting that leads for local businesses are increasingly coming from mobile devices. We believe that ReachEdge can both significantly enhance a client’s ability to convert leads into customers and, over time, could substantially increase our share of our clients’ marketing expenditures. ReachEdge further enhances the ability of our clients to convert leads that we are generating for them through ReachSearch and our other products, while at the same time providing even further transparency into the efficacy of our advertising products. This automated platform will form the basis for a multiproduct engagement with our clients.
We plan to over time add further dynamic optimization functionality to ReachEdge, as well as features that create a more seamless relationship between our clients and their customers, such as real-time appointment booking and search engine optimization (SEO). Many SMBs already spend marketing dollars in these categories, and we hope to shift some of that spending to our integrated solutions. Our ReachSEO product is in beta and is presently expected to be widely introduced during the second quarter of 2014. ReachSEO will drive organic search traffic to our client websites with a range of features, including site optimization, custom content, and distribution of site listings across hundreds of directories.
Since the September 2013 lauch of ReachEdge, we have sold over 1,200 units through December 2013. We will introduce ReachEdge in certain of our international markets in 2014. While ReachSearch will, for the foreseeable future, continue to represent the significant majority of our revenue, we believe that the expansion of our product suite moves us closer to our goal of becoming the one-stop shop for our clients and will provide our clients with significantly greater value as our products are used together.
We have also focused on international expansion. Our first expansion was in Australia in 2006. We have subsequently entered Europe (the United Kingdom, Germany, the Netherlands, Austria and Belgium), Japan and Brazil. We intend to open our first office in Mexico in 2014. However, we intend to focus in 2014 on growing our operations in our existing large market locations including Germany, Brazil and Japan, which we believe present substantially larger market opportunities than Australia, currently our largest international market.
During 2013 we made significant changes to our Direct Local sales model. We substantially expanded our inside sales force (a dedicated telemarketing sale force). Our inside sales force was designed to expand our geographic reach while reducing selling costs. In late 2012 we had only four inside sales people; by the end of the 2013 we had approximately 90 inside sales people in North America. We will be expanding our inside sales forces in Europe and Asia-Pacific in 2014 as we continue to seek to deepen our presence in our international markets while driving down our customer acquisition costs.
We also commenced a significant realignment of our sales force in North America, which will continue through 2014. Historically, we sold our products directly, through our “feet-on-the-street” sales force of internet marketing consultants, or IMCs. IMCs both generated new business and remained the primary contact for their clients. This sales structure worked well for a company that was primarily selling one product and we believe that our substantial corps of experienced IMCs has historically provided us with a significant competitive advantage. As we move more deeply into integrated solutions, however, we believe we require more specialization within our sales structure and beginning in late 2013, we have shifted our North American sales organization to a hunter/farmer model. Our Sales Executives (SEs), our hunters, are product experts and excel at new client generation, and they are compensated for generating new clients. Our Account Executives (AEs), our farmers, are experts in client retention and account growth, and they are compensated for retaining and upselling existing clients. This realignment will also make our sales force more agile by allowing us to more directly and effectively incent desired sales activity. We believe that these changes will substantially aid us in achieving our new goal of becoming a true integrated technology solutions company. In some of our international markets, such as Australia, Japan and Brazil, we are already using this model or a derivation of this model. We plan to similarly realign our sales organization in Europe in the future.
We believe that the transformation of our product suite to focus on integrated solutions and our changes in our go-to-market strategy will position us for future profitable growth by better meeting our clients’ needs, increasing operational efficiencies, reducing the costs of client acquisition and increasing the value to us of our client relationships.
In addition to our Direct Local channel, we also employ a separate sales channel targeting national brands, franchises and strategic accounts with operations in multiple local markets and select third-party agencies and resellers. We refer to this as our NBAR channel. In addition, we sell and provide access to our technology platform to select third-party agencies and resellers in customer segments where they have sales forces with established relationships with their SMB client bases. We currently have over 750 agencies and resellers actively selling on our technology platform. In 2012, we entered into our first franchise relationship, in which a third party was given the exclusive right to exploit and resell certain ReachLocal products in selected Eastern European markets under the ReachLocal name.
Operating Metrics
We regularly review a number of other financial and operating metrics to evaluate our business, determine the allocation of resources and make decisions regarding business strategies. In the past, metrics relating to our IMCs were important to how we conducted our business. As a result of the realignment of our sales force described above, however, the number of our IMCs will be of much less significance. Accordingly, this Annual Report on Form 10-K will be the last time in which we will report IMC counts or Underclassmen Expense, because we believe those metrics will be neither comparable nor relevant in the future. Unless otherwise stated, IMC counts and Underclassmen Expense for 2013 are reported in this Annual Report on Form 10-K on a pro-forma basis as if the realignment had not occurred and the salespeople employed on December 31, 2013 had retained their previous job roles and maturities.
The following table shows certain key operating metrics for the three years ended December 31, 2013, 2012 and 2011.
| | | December 31, | |
| | | 2013 | | | 2012 | | | 2011 | |
Number of IMCs (at period end): | | | | | | | | | | | | |
Upperclassmen (1) | | | 442 | | | | 419 | | | | 372 | |
Underclassmen (1) | | | 482 | | | | 405 | | | | 424 | |
Total (1) | | | 924 | | | | 824 | | | | 796 | |
| | | | | | | | | | | | | |
Underclassmen Expense for the year ended (in thousands) (1) (2) | | $ | 48,944 | | | $ | 45,250 | | | $ | 44,488 | |
| | | | | | | | | | | | | |
Active Advertisers (at period end) (3) | | | 23,900 | | | | 22,000 | | | | 19,100 | |
| | | | | | | | | | | | | |
Active Campaigns (at period end) (4) | | | 35,200 | | | | 32,500 | | | | 27,500 | |
(1) | In connection with the realignment of our North American sales force in December 2013, the job descriptions of the outside sales force in North America changed. As a result of the realignment, we will no longer be reporting Underclassmen Expense or IMC counts. The non-GAAP calculations presented here for the period ended December 31, 2013 are made on a pro forma basis as if the realignment had not occurred and the salespeople employed on December 31, 2013 had retained their previous job roles and maturities. |
(2) | See Part II, Item 7, “Management’s Discussion and Analysis of Financial Condition and Results of Operations – Non-GAAP Financial Measures” for our definition of Underclassmen Expense. |
(3) | See Part II, Item 6, “Selected Financial Data” for our definition of Active Advertisers. |
(4) | See Part II, Item 6, “Selected Financial Data” for our definition of Active Campaigns. |
Number of IMCs
Our ongoing investment in our sales force has historically been the principal engine for our growth.
We refer to IMCs with 12 months or less of experience as Underclassmen and those with greater experience as Upperclassmen. In particular, our revenue growth has in the past been driven by the increase in the number of our Upperclassmen, who are significantly more productive than our Underclassmen. Our revenue growth has also been driven by the increase in the number of our international salespeople as our international salespeople are on average more productive than our North American salespeople, which we attribute to lower levels of competition and lower existing online advertising consumption by SMBs in those markets.
Total IMCs at December 31, 2013 increased from December 31, 2012 due to increases in the number of Upperclassmen and Underclassmen to support our continued international growth. This total includes those involved in our inside sales efforts.
As discussed previously, as a result of the sales realignment, we believe IMC counts will no longer be comparable or relevant in the future. As a result, this will be the last time we report IMC counts.
Underclassmen Expense
Underclassmen Expense is a number we have historically calculated to approximate our investment in Underclassmen and is comprised of the selling and marketing expenses we allocate to Underclassmen during a reporting period. Underclassmen have not, in the aggregate, made a positive contribution to operating income. Our largest operating expenses have included the hiring, training and retention of Underclassmen in support of our goal of developing more Upperclassmen.
Underclassmen Expense includes the direct salaries and allocated benefits of the Underclassmen (excluding commissions and other variable compensation), training and sales organization expenses, including depreciation, allocated based on relative headcount and marketing expenses allocated based on relative revenue. While we believe that Underclassmen Expense has in the past provided useful information regarding our approximate investment in Underclassmen, the methodology we use to arrive at our estimated Underclassmen Expense was developed internally by management, is not a concept or method recognized by GAAP and other companies may use different methodologies to calculate or approximate measures similar to Underclassmen Expense. Accordingly, our calculation of Underclassmen Expense may not be comparable to similar measures used by other companies.
In addition, due to the North American sales force realignment in December 2013, we believe Underclassmen Expense will no longer be a comparable or relevant metric in the future. As a result, this will be the last time we report Underclassmen Expense.
Active Advertisers and Active Campaigns
We track the number of Active Advertisers and Active Campaigns to evaluate the growth, scale and diversification of our business. We also use these metrics to determine the needs and capacity of our sales forces, our support organization and other personnel and resources. Active Advertisers and Active Campaigns increased in 2013 due to an increase in the productivity of our sales force driven by their increased tenure, an increase in the number of products available for our salespeople to sell, and growth within our NBAR channel.
Basis of Presentation
Discontinued Operations
As a result of the winding down of the operations of Bizzy and the contribution of our ClubLocal business to a new entity in exchange for a minority equity interest, we have reclassified and presented all related historical financial information with respect to Bizzy and ClubLocal as “discontinued operations” in the Consolidated Balance Sheets, Consolidated Statements of Operations and Consolidated Statements of Cash Flows. In addition, we have excluded all ClubLocal and Bizzy related activities from the following discussions, unless specifically referenced.
Sources of Revenue
We derive our revenue principally from the provision and sale of online marketing services to our clients. Revenue includes (i) the sale of our ReachSearch, ReachDisplay, ReachRetargeting and other products based on a package pricing model in which our clients commit to a fixed fee that includes the media, optimization, reporting and tracking technologies of our technology platform, and the personnel dedicated to support and manage their campaigns; (ii) the sale of our ReachEdge, TotalLiveChat, ReachCast, TotalTrack, and other products and services; and (iii) set-up, management and service fees associated with these products and other services. We distribute our products and services directly through our outside and inside sales force, who are focused on serving SMBs in their local markets through a consultative process, which we refer to as our Direct Local channel, as well as a separate sales force targeting our National Brands, Agencies and Resellers channel. The sales cycle for sales to SMBs ranges from one day to over a month. Sales to our National Brands, Agencies and Resellers clients generally require several months.
We typically enter into multi-month agreements for the delivery of our products. Under our agreements, our Direct Local clients typically pay, in advance, a fixed fee on a monthly basis, which includes all charges for the included technology and media services, management, third-party content and other costs and fees. We record these prepayments as deferred revenue and only record revenue for income statement purposes as we purchase media and perform other services on behalf of clients. Certain Direct Local clients are extended credit privileges, with payment generally due in 30 days. There were $4.2 million and $1.6 million of accounts receivable related to our Direct Local channel at December 31, 2013 and 2012, respectively.
Our National Brands, Agencies and Resellers clients enter into agreements of various lengths or that are indefinite. Our National Brands, Agencies and Resellers clients either pay in advance or are extended credit privileges with payment generally due in 30 to 60 days. There were $4.6 million and $3.8 million of accounts receivables related to our National Brands, Agencies and Resellers at December 31, 2013 and 2012, respectively.
Cost of Revenue
Cost of revenue consists primarily of the costs of online media acquired from third-party publishers. Media cost is classified as cost of revenue in the period in which the corresponding revenue is recognized. From time to time, publishers offer us rebates based upon various factors and operating rules, including the amount of media purchased. We record these rebates in the period in which they are earned as a reduction to cost of revenue and the corresponding payable to the applicable publisher, or as an other receivable, as appropriate. Cost of revenue also includes the third-party telephone and information services costs, other third-party service provider costs, data center and third-party hosting costs, credit card processing fees, and other direct costs.
In addition, cost of revenue includes costs to manage and operate our various solutions and technology infrastructure, other than costs associated with our sales force, which are reflected as selling and marketing expenses. Cost of revenue includes salaries, benefits, bonuses and stock-based compensation for the related staff, and allocated overhead such as depreciation expense, rent and utilities. Cost of revenue also includes the amortization and impairment charges on certain acquired intangible assets.
Operating Expenses
Selling and Marketing.Selling and marketing expenses consist primarily of personnel and related expenses for our selling and marketing staff, including salaries and wages, commissions and other variable compensation, benefits, bonuses and stock-based compensation; travel and business costs; training, recruitment, marketing and promotional events; advertising; other brand building and product marketing expenses; and occupancy, technology and other direct overhead costs. A portion of the compensation for employees in the sales organization is based on commissions and other variable compensation. In addition, the cost of agency commissions is included in selling and marketing expenses. Customer acquisition commissions are capitalized and amortized over the initial contract term.
Product and Technology.Product and technology expenses consist primarily of personnel and related expenses for our product development and engineering professionals, including salaries, benefits, bonuses and stock-based compensation, and the cost of third-party contractors and certain third-party service providers and other expenses, including occupancy, technology and other direct overhead costs. Technology operations costs, including related personnel and third-party costs, are included in product and technology expenses. We capitalize a portion of costs for software development and, accordingly, include amortization of those costs as product and technology expenses as our technology platform addresses all aspects of our activities, including supporting the selling and consultation process, online publisher integration, efficiencies and optimization, providing insight to our clients into the results and effects of their online advertising campaigns and supporting all of the financial and other back-office functions of our business.
Product and technology expenses also include the amortization of the technology obtained in acquisitions and expenses of the deferred payment obligations related to acquisitions attributable to product and technology personnel. Product and technology costs do not include the costs to operate and deliver our solutions to clients which are included in cost of revenue.
General and Administrative.General and administrative expenses consist primarily of personnel and related expenses for board, executive, legal, finance, human resources and corporate communications, including wages, benefits, bonuses and stock-based compensation, professional fees, insurance premiums and other expenses, including occupancy, technology and other direct overhead, public company costs and other corporate expenses.
Critical Accounting Policies and Estimates
The preparation of our consolidated financial statements in conformity with U.S. generally accepted accounting principles, or GAAP, requires us to make estimates and assumptions that affect the reported amounts of assets and liabilities and disclosure of contingent assets and liabilities at the date of the consolidated financial statements and the reported amounts of revenue and expenses. We continually evaluate our estimates, judgments and assumptions based on available information and experience. Because the use of estimates is inherent in the financial reporting process, actual results could differ from those estimates.
We believe that the following critical accounting policies involve our more significant judgments, assumptions and estimates and, therefore, could have the greatest potential impact on our consolidated financial statements:
| • | Software development costs |
| • | Long-lived and intangible assets |
| • | Stock-based compensation |
| • | Variable interest entities |
| • | Investments in third parties |
| • | Income taxes |
| | | |
| | • | Common stock repurchase and retirement |
Revenue Recognition
We recognize revenue for our services when all of the following criteria are satisfied:
| • | persuasive evidence of an arrangement exists; |
| • | services have been performed; |
| • | the selling price is fixed or determinable; and |
| • | collectability is reasonably assured. |
We recognize revenue as the cost for the third-party media is incurred, which is upon delivery of the marketing services to our clients. We recognize revenue for our ReachSearch product as clicks are recorded on sponsored links on the various search engines and for our ReachDisplay and ReachRetargeting product when the display advertisements record impressions or as otherwise provided in our agreement with the applicable publisher. We recognize revenue for our ReachEdge, ReachCast and other products with a defined license or service period on a straight line basis over the applicable license or service period. We recognize revenue when we charge set-up, management service or other fees on a straight line basis over the term of the related campaign contract or the completion of any obligation for services, if shorter. Revenue from our ReachCommerce product consists of licensing and booking fees. Licensing fees are recognized on a straight line basis over the duration of the license, and booking fees are recognized as incurred. When we receive advance payments from clients, we record these amounts as deferred revenue until the revenue is recognized. When we extend credit, we record a receivable when the revenue is recognized.
When we sell through agencies, we either receive payment in advance of services or in some cases extend credit. We pay each agency an agreed-upon commission based on the revenue we earn or cash we receive. Some agency clients that have been extended credit may offset the amount otherwise due to us by any commissions they have earned. We evaluate whether it is appropriate to record the gross amount of campaign revenue or the net amount earned after commissions. As we are the primary party obligated in the arrangement, subject to the credit risk, with discretion over both price and media, we recognize the gross amount of such sales as revenue and any commissions are recognized as a selling and marketing expense.
We offer incentives to clients in exchange for minimum commitments. In these circumstances, we estimate the amount of the incentives that will be earned by clients and adjust the recognition of revenue to reflect such incentives. Estimates are either based upon a statistical analysis of previous campaigns for which such incentives were offered, or calculated on a straight line basis over the life of the campaign.
We also have a small number of resellers, including a franchisee. Resellers integrate our services, including ReachSearch, ReachDisplay and ReachRetargeting, into their product offerings. In most cases, the resellers integrate with our technology platform through a custom Application Programming Interface (API). Resellers are responsible for the price and specifications of the integrated product offered to their clients. Resellers pay us in arrears, net of commissions and other adjustments. We recognize revenue generated under reseller agreements net of the agreed-upon commissions and other adjustments earned or retained by the reseller, as we believe that the reseller has retained sufficient control and bears sufficient risks to be considered the primary obligor in those arrangements.
We account for sales and similar taxes imposed on our services on a net basis in the consolidated statements of operations.
Software Development Costs
We capitalize costs to develop software when we have determined that the development efforts will result in new or additional functionality or new products. Costs capitalized as internal use software are amortized on a straight-line basis over the estimated three-year useful life, or less as appropriate. Costs incurred prior to meeting these criteria and costs associated with ongoing maintenance are expensed as incurred and are recorded along with amortization of capitalized software development costs as product and technology expenses within the accompanying consolidated statements of operations. We monitor our existing capitalized software costs and reduce its carrying value as the result of releases that render previous features or functions obsolete or otherwise reduce the value of previously capitalized costs.
Goodwill
We have total goodwill of $42.1 million as of both December 31, 2013 and December 31, 2012, related to our acquired businesses. We operate in one reportable segment, in accordance with ASC 280,Segment Reporting, and have identified two reporting units—North America and Australia—for purposes of evaluating goodwill. These reporting units each constitute a business or group of businesses for which discrete financial information is available and is regularly reviewed by each reporting unit’s management. North America’s assigned goodwill was $9.7 million and Australia’s assigned goodwill was $32.4million as of both December 31, 2013 and December 31, 2012. We review the carrying amounts of goodwill for possible impairment whenever events or changes in circumstance indicate that the related carrying amount may not be recoverable. We perform our annual assessment of goodwill impairment as of the first day of each fourth quarter.
We follow the amended guidance for assessing qualitative factors to determine whether it is more likely than not that the fair value of a reporting unit is less than its carrying amount, in accordance with ASC 350-20,Intangibles – Goodwill and Other. Entities are provided with the option of first performing a qualitative assessment on any of its reporting units to determine whether further quantitative impairment testing is necessary. An entity may also bypass the qualitative assessment for any reporting unit in any period and proceed directly to the quantitative impairment test. If an entity determines that it is more likely than not that the fair valueof a reporting unit is less than its carrying amount, then performing a two-step impairment test is necessary. The first step of the impairment test involves comparing the estimated fair values of each of our reporting units with their respective carrying amounts, including goodwill. If the estimated fair value of a reporting unit exceeds its carrying amount, including goodwill, goodwill is considered not to be impaired and no additional steps are necessary. If, however, the estimated fair value of the reporting unit is less than its carrying amount, including goodwill, then the second step is performed to compare the carrying amount of the goodwill with its implied fair value. If the carrying amount of goodwill exceeds the implied fair value of that goodwill, an impairment loss is recognized in an amount equal to the excess. We estimate fair value utilizing the projected discounted cash flow method and discount rate determined by management commensurate with the risk inherent in our business model.
We performed our annual assessment of goodwill impairment as of the first day of the fourth quarter of 2013 and 2012, and determined that it was more likely than not that there was no impairment of goodwill. Accordingly, no impairment of goodwill was recorded as of December 31, 2013 and 2012.
Long-Lived and Intangible Assets
We report finite-lived, acquisition-related intangible assets at acquisition date fair value, net of accumulated amortization. Identifiable intangible assets are amortized on a straight-line basis over their estimated useful lives of three years, or one year, in the case of certain customer relationships. Straight-line amortization is used because no other pattern over which the economic benefits will be consumed can be reliably determined.
Management reviews the carrying values of long-lived assets, including intangible assets, for possible impairment whenever events or changes in circumstance indicate that the related carrying amount may not be recoverable. In our analysis of other finite lived amortizable intangible assets, we apply the guidance of ASC 350-20,Intangibles – Goodwill and Other, in determining whether any impairment conditions exist. An impairment loss is recognized to the extent that the carrying amount exceeds the asset’s fair value. Intangible assets are attributable to the various developed technologies and client relationships of the businesses we have acquired. Long-lived assets to be disposed of are reported at the lower of carrying amount or estimated fair value less cost to sell.
Stock-Based Compensation
We account for stock-based compensation based on fair value. We follow the attribution method, which reduces current stock-based compensation expenses recorded by the effect of anticipated forfeitures. We estimate forfeitures based upon our historical experience.
The fair value of each award is estimated on the date of the grant and amortized over the requisite service period, which is the vesting period. We use the Black-Scholes option pricing model to estimate the fair value of stock option awards on the date of grant. Determining the fair value of stock option awards at the grant date under this model requires judgment, including estimating volatility, expected term and risk-free interest rate. The fair value of restricted stock and restricted stock unit awards is based on the closing market price of our common stock on the date of the grant. In addition, we use a Monte Carlo simulation to estimate the fair value of market-based performance-vesting restricted stock and restricted stock units. Determining the fairvalue of these awards at the grant date under this model requires judgment including estimating volatility, risk-free rate and expected future stock price. We determine the probability of achievement of performance milestones for non-market based performance vesting restricted stock and restricted stock units, and recognize expense based on the fair value of the award if it is probable that the performance milestone will be achieved. The assumptions used in calculating the fair value of stock-based awards represent management’s estimate based on judgment and subjective future expectations. These estimates involve inherent uncertainties. If any of the assumptions used in the Black-Scholes model or Monte Carlo simulations significantly changes, stock-based compensation for future awards may differ materially from the awards granted previously.
Variable Interest Entities
In accordance with ASC 810,Consolidations, the applicable accounting guidance for the consolidation of variable interest entities, or VIEs, we analyze our interests, including agreements, loans, guarantees, and equity investments, on a periodic basis to determine if such interests are variable interests. If variable interests are identified, then the related entity is assessed to determine if it is a VIE. Our analysis includes both quantitative and qualitative reviews. We base our quantitative analysis on the forecasted cash flows of the entity, and our qualitative analysis on the design of the entity, its organizational structure including its decision-making authority, and relevant agreements. If we determine that the entity is a VIE, we then assess if we must consolidate the VIE as its primary beneficiary. Our determination of whether we are the primary beneficiary is based upon qualitative and quantitative analyses, which assess the purpose and design of the VIE, the nature of the VIE’s risks and the risks that we absorb, the power to direct activities that most significantly impact the economic performance of the VIE, and the obligation to absorb losses or the right to receive benefits that could be significant to the VIE.
Accounts Receivable
We perform ongoing credit evaluations of our customers and adjust credit limits based upon payment history, the customer’s creditworthiness and various other factors, as determined by our review of their credit information. We monitor collections and payments from our customers and maintain an allowance for estimated credit losses based on our historical experience and any customer-specific collection issues that we have identified.
Loan Receivable
We record loan receivables at carrying value, net of potential allowance for losses. Losses on receivables are recorded when probable and estimable. In the fourth quarter of 2013, we fully impaired the loan outstanding from our franchisee (see Note 7 to our consolidated financial statements, “Variable Interest Entities” for more information). Interest income on loan receivables is accrued on a monthly basis over the life of the loan, and interest recognition is suspended upon impairment of loan principal.
Investments in Third Parties
We account for investments in third parties under the cost method, which is periodically assessed for other-than-temporary impairment. If we determine that an other-than-temporary impairment has occurred, we will write-down the investment to its fair value. The fair value of a cost method investment is not evaluated if there are no identified events or changes in circumstances that may have a significant adverse effect on the fair value of the investment. However, if such significant adverse events were identified, we would estimate the fair value of the cost method investment considering available information at the time of the event, such as current cash position, earnings and cash flow forecasts, recent operational performance and any other readily available data.
Income Taxes
We use the asset and liability method of accounting for income taxes. Significant judgment is required in determining the consolidated provision for income taxes and evaluating our tax positions. In the ordinary course of business, there are many transactions and calculations for which the ultimate tax settlement is uncertain. As a result, we recognize tax liabilities based on estimates of whether additional taxes and interest will be due. These tax liabilities are recognized when, despite our belief that our tax return positions are supportable, we believe that it is more likely than not that those positions may not be fully sustained upon review by tax authorities.
For the periods presented, income tax expense represents income taxes imposed by federal, state, foreign and local tax jurisdictions applicable to our activities. We are otherwise generating net operating losses in the various tax jurisdictions in which we operate. We believe that it is likely that taxes imposed by state, local and foreign jurisdictions will increase in magnitude, particularly to the extent we become profitable in certain foreign jurisdictions before the time we obtain profitability on a consolidated basis.
During the year ended December 31, 2013, we released $4.0 million of our valuation allowance previously established against our U.S. net deferred tax assets. Management’s conclusion to release the valuation allowance on its U.S. deferred tax assets was due to, among other reasons, (i) the three-year cumulative pre-tax accounting income realized in the U.S., (ii) two years of sustained quarterly pre-tax accounting income, and (iii) significant forecasted pre-tax accounting income. We continue to maintain a valuation allowance of $16.8 million against our net foreign deferred tax assets, which when released may have a favorable impact on our effective tax rate. We continue to monitor the valuation allowance at each reporting period, and at this time, it is uncertain when such a release will occur.
U.S. income and foreign withholding taxes have not been recognized on the excess of the amount for financial reporting over the tax basis of investments in foreign subsidiaries in the amount of $5.2 million that are essentially permanent in duration. This amount becomes taxable upon a repatriation of assets from the subsidiary or a sale or liquidation of the subsidiary. Deferred income taxes on these earnings have not been provided because these amounts are expected to be reinvested indefinitely outside of the U.S.
We are required to file income tax returns in the United States and various foreign jurisdictions, which requires us to interpret the applicable tax laws and regulations in effect in such jurisdictions. Such returns are, and from time to time, have been subject to audit by the various federal, state and foreign taxing authorities, which may disagree with our tax positions. We believe that our accruals for tax liabilities are adequate for all open audit years based on our assessment of many factors, including past experience and interpretations of tax law. We review and update our estimates in light of changing facts and circumstances, such as the closing of a tax audit, the lapse of a statute of limitations or a material change in estimate. To the extent that the final tax outcome of these matters differs from our expectations, such differences will impact income tax expense in the period in which such determination is made.
Common Stock Repurchase and Retirement
Common stock repurchased is retired, and the excess of the cost over the par value of the common shares repurchased is recorded as a reduction to additional paid-in capital.
Results of Operations
Comparison of the Years Ended December 31, 2013, 2012 and 2011
| | | Years Ended December 31, | |
| | | 2013 | | | 2012 | | | 2011 | |
(in thousands, except per share data) | | | | | | | | | | | | |
Revenue | | $ | 514,070 | | | $ | 454,957 | | | $ | 375,241 | |
Cost of revenue (1) | | | 256,450 | | | | 226,482 | | | | 190,559 | |
Operating expenses: | | | | | | | | | | | | |
Selling and marketing (1) | | | 182,854 | | | | 164,168 | | | | 139,929 | |
Product and technology (1) | | | 22,240 | | | | 18,980 | | | | 15,602 | |
General and administrative (1) | | | 46,362 | | | | 40,378 | | | | 33,470 | |
Total operating expenses | | | 251,456 | | | | 223,526 | | | | 189,001 | |
Operating income (loss) | | | 6,164 | | | | 4,949 | | | | (4,319 | ) |
Other income, net | | | 586 | | | | 556 | | | | 928 | |
Income (loss) from continuing operations before income taxes | | | 6,750 | | | | 5,505 | | | | (3,391 | ) |
Income tax provision | | | 3,699 | | | | 1,340 | | | | 735 | |
Income (loss) from continuing operations | | | 3,051 | | | | 4,165 | | | | (4,126 | ) |
Loss from discontinued operations, net of income taxes | | | (5,534 | ) | | | (4,397 | ) | | | (6,215 | ) |
Net loss | | $ | (2,483 | ) | | $ | (232 | ) | | $ | (10,341 | ) |
| | | | | | | | | | | | | |
Net income (loss) per share: | | | | | | | | | | | | |
| | | | | | | | | | | | | |
Basic: | | | | | | | | | | | | |
Income (loss) from continuing operations | | $ | 0.11 | | | $ | 0.15 | | | $ | (0.14 | ) |
Loss from discontinued operations, net of income taxes | | $ | (0.20 | ) | | $ | (0.16 | ) | | $ | (0.21 | ) |
Net loss per share | | $ | (0.09 | ) | | $ | (0.01 | ) | | $ | (0.36 | ) |
| | | | | | | | | | | | | |
Diluted: | | | | | | | | | | | | |
Income (loss) from continuing operations | | $ | 0.10 | | | $ | 0.14 | | | $ | (0.14 | ) |
Loss from discontinued operations, net of income taxes | | $ | (0.19 | ) | | $ | (0.15 | ) | | $ | (0.21 | ) |
Net loss per share | | $ | (0.09 | ) | | $ | (0.01 | ) | | $ | (0.36 | ) |
| | | | | | | | | | | | | |
Weighted average common shares used in the computation of income (loss) per share: | | | | | | | | | | | | |
Basic | | | 27,764 | | | | 28,348 | | | | 28,974 | |
Diluted | | | 29,051 | | | | 28,896 | | | | 28,974 | |
______________
(1) | Stock-based compensation, net of capitalization, and depreciation and amortization included in the above line-items (in thousands): |
| | | Years Ended December 31, | |
| | | 2013 | | | 2012 | | | 2011 | |
Stock-based compensation: | | | | | | | | | | | | |
Cost of revenue | | $ | 697 | | | $ | 258 | | | $ | 200 | |
Selling and marketing | | | 3,040 | | | | 1,756 | | | | 1,402 | |
Product and technology | | | 627 | | | | 1,194 | | | | 1,387 | |
General and administrative | | | 7,141 | | | | 6,261 | | | | 5,549 | |
| | | $ | 11,505 | | | $ | 9,469 | | | $ | 8,538 | |
| | | | | | | | | | | | | |
Depreciation and amortization: | | | | | | | | | | | | |
Cost of revenue | | $ | 761 | | | $ | 706 | | | $ | 645 | |
Selling and marketing | | | 2,925 | | | | 2,418 | | | | 1,443 | |
Product and technology | | | 10,214 | | | | 8,924 | | | | 6,764 | |
General and administrative | | | 1,196 | | | | 1,554 | | | | 1,422 | |
| | | $ | 15,096 | | | $ | 13,602 | | | $ | 10,274 | |
Revenue
| | | Years Ended December 31, | | | | | | | | | |
| | | 2013 | | | 2012 | | | 2011 | | | 2013-2012 % Change | | | 2012-2011 % Change | |
(in thousands) | | | | | | | | | | | | | | | | | | | | |
Direct Local | | $ | 410,278 | | | $ | 359,119 | | | $ | 291,444 | | | | 14.2 | % | | | 23.2 | % |
National Brands, Agencies and Resellers | | | 103,792 | | | | 95,838 | | | | 83,797 | | | | 8.3 | % | | | 14.4 | % |
Total revenue | | $ | 514,070 | | | $ | 454,957 | | | $ | 375,241 | | | | 13.0 | % | | | 21.2 | % |
| | | December 31, | | | | | | | | | |
| | | 2013 | | | 2012 | | | 2011 | | | | | | | | | |
(in thousands) | | | | | | | | | | | | | | | | | | | | |
Number of IMCs: | | | | | | | | | | | | | | | | | | | | |
Upperclassmen | | | 442 | | | | 419 | | | | 372 | | | | 5.5 | % | | | 12.6 | % |
Underclassmen | | | 482 | | | | 405 | | | | 424 | | | | 19.0 | % | | | (4.5 | )% |
Total | | | 924 | | | | 824 | | | | 796 | | | | 12.1 | % | | | 3.5 | % |
Active Advertisers | | | 23,900 | | | | 22,000 | | | | 19,100 | | | | 8.6 | % | | | 15.2 | % |
Active Campaigns | | | 35,200 | | | | 32,500 | | | | 27,500 | | | | 8.3 | % | | | 18.2 | % |
Direct Local revenue increased by $51.2 million in 2013 compared to 2012. The increase was largely driven by an increase in the number of IMCs in our international markets, and the productivity of our expanded North American inside sales force. Our revenue growth in international markets was partially offset by the substantial strengthening of the U.S. dollar compared to certain foreign currencies, particularly the Australian Dollar, and the loss of a large advertiser in the UK during the second quarter of 2013.
During the three months ended December 31, 2013, the Company realigned its North American Direct Local sales force and as a result of the transition, revenue in that channel decreased 0.8% as compared to the prior year period and 4.7% as compared to the three months ended September 30, 2013. Growth in our Direct Local channel in North America will depend on the success of our sales force realignment, new go-to-market strategies and new products, which may not provide immediate results. In addition, growth in our Direct Local channel will depend on our success in developing and launching new products and solutions, increasing penetration in our international markets and the growth of our inside sales force. Total IMCs in 2013 increased as compared to the preceding year due to an increase in the number of international IMCs as we continue to grow internationally.
The increases in National Brands, Agencies and Resellers revenue of $8.0 million in 2013 compared to 2012 was due to growth in the number of international Agencies and Resellers clients and domestic National Brands clients, partially offset by a decrease in the number of domestic Agencies and Resellers clients.
Direct Local revenue increased by $67.7 million in 2012 compared to 2011, of which $1.1 million was associated with our inside sales. The increase was largely attributable to an increase in the number of Upperclassmen and the productivity of Upperclassmen driven by their increased tenure. Also contributing to the increase was growth in the number of international IMCs who, on average, are more productive than our IMCs in North America, which we attribute to lower levels of competition and growing online advertising demand by SMBs in those markets. The number of Underclassmen at the end of 2012 was slightly lower than at the end of 2011 due to slightly lower IMC hiring rates in 2012. During 2012, our strategy regarding hiring and maturation of IMCs was to maintain a more constant level of IMC hiring globally—as opposed to prior years when we sought to increase Underclassmen more substantially—while shifting the hiring to our newer international markets and focusing on improving Upperclassmen productivity in our more established markets.
The increase in National Brands, Agencies and Resellers revenue of $12.0 million in 2012 compared to 2011 was due to an increase of $5.6 million attributable to our National Brands clients, and $6.4 million attributable to our Agencies and Resellers. These increases were primarily driven by increased spending by existing National Brands clients and existing Agencies and Resellers clients, as well as an increase in the number of Agencies and Resellers clients.
Cost of Revenue
| | | Years Ended December 31, | | | | | | | | | | | Years Ended December 31, | |
| | | 2013 | | | 2012 | | | 2011 | | | 2013-2012 % Change | | | 2012-2011 % Change | | | 2013 | | | 2012 | | | 2011 | |
(in thousands) | | | | | | | | | | | | | | | | | | | | | | (as a percentage of revenue) | |
Cost of revenue | | $ | 256,450 | | | $ | 226,482 | | | $ | 190,559 | | | | 13.2 | % | | | 18.9 | % | | | 49.9 | % | | | 49.8 | % | | | 50.8 | % |
Cost of revenue as a percentage of revenue was essentially flat in 2013 compared to 2012. Cost of revenue as a percentage of revenue was positively impacted by improved media buying efficiencies and the change in our geographic, product and service mix, offset by an increase in service and support costs and a decrease in publisher rebates. Publisher rebates as a percentage of revenue decreased to 4.2% of revenue in 2013, from 4.6% in 2012 as a result of a shift in product mix.
The decrease in our cost of revenue as a percentage of revenue in 2012 compared to 2011 was primarily due to an increase in publisher rebates, partially offset by the change in our geographic, product and service mix. As we enter new markets, the initial sales focus is on our ReachSearch product, which affects our product and service mix and has a higher cost of revenue than our other products. Publisher rebates as a percentage of revenue increased to 4.6% of revenue in 2012 from 3.2% in 2011.
Our cost of revenue as a percentage of revenue will be affected in the future by the mix and relative amount of media we purchase to fulfill service requirements, the availability and amount of publisher rebates, the cost of third-party service providers that we use as part of our solutions, the mix of products and solutions we offer, our geographic mix, our media buying efficiency, and the costs of support and delivery.
Operating Expenses
Over the past several years, we have significantly increased the scope of our operations. We intend to continue to increase our sales force, product and solutions offerings and the infrastructure to support them. In growing our business, particularly in international markets, and in developing new products and solutions, we are incurring expenses to support our long-term growth plans, acknowledging that these investments may put pressure on near-term periodic operating results and increase our operating expenses as a percentage of revenue.
Selling and Marketing
| | | Years Ended December 31, | | | | | | | | | | | Years Ended December 31, | |
| | | 2013 | | | 2012 | | | 2011 | | | 2013-2012 % Change | | | 2012-2011 % Change | | | 2013 | | | 2012 | | | 2011 | |
(in thousands) | | | | | | | | | | | | | | | | | | | | | | (as a percentage of revenue) | |
Salaries, benefits and other costs | | $ | 130,653 | | | $ | 115,307 | | | $ | 98,784 | | | | 13.3 | % | | | 16.7 | % | | | 25.4 | % | | | 25.3 | % | | | 26.3 | % |
Commission expense | | | 52,201 | | | | 48,861 | | | | 41,145 | | | | 6.8 | % | | | 18.8 | % | | | 10.2 | | | | 10.7 | | | | 11.0 | |
Total selling and marketing | | $ | 182,854 | | | $ | 164,168 | | | $ | 139,929 | | | | 11.4 | % | | | 17.3 | % | | | 35.6 | % | | | 36.1 | % | | | 37.3 | % |
| | | | | | | | | | | | | | | | | | | | | | | | | | | | | | | | | |
Underclassmen Expense included above, excluding commissions | | $ | 48,944 | | | $ | 45,250 | | | $ | 44,488 | | | | 8.2 | % | | | 1.7 | % | | | | | | | | | | | | |
The increase in selling and marketing salaries, benefits and other costs in absolute dollars in 2013 compared to 2012 was primarily due to an increase in the number of IMCs and the proportion of international IMCs (who have historically been paid higher base salaries than North American IMCs) as a result of our international expansion.
The increase in commission expense in absolute dollars in 2013 compared to 2012 was due to increased sales. Commission expense as a percentage of revenue decreased compared to 2012 due to a decrease in commission rates as a percentage of revenue in North America, driven by the shift of revenue to our account managers and account executives who have lower commission rates than IMCs, and a higher percentage of revenue from our international Direct Local channel, for which we have historically paid lower commission rates. Commission expense includes commissions and other variable compensation. Our recent North American sales force realignment has changed the mix of base salary and commissions for many North American salespeople, which may have the effect starting in 2014 of shifting commission expense to salaries, benefits and other costs, although the actual impact will ultimately depend on the relative productivity of the new positions.
Underclassmen Expense increased as compared to the preceding year, reflecting hiring in certain international markets and for the North American inside sales group, partially offset by decreased hiring of outside IMCs in North America.
The increase in selling and marketing salaries, benefits and other costs in absolute dollars in 2012 compared to 2011 was primarily due to an increase in our IMC headcount and related recruiting, training and facilities costs, as well as increased advertising costs. The slight decrease in these costs as a percentage of revenue was primarily due to increased productivity and operational scale in our established markets, partially offset by expenses related to our entrance into new international markets and new product initiatives.
The increase in commission expense in absolute dollars for 2012 compared to 2011 was due to increased sales. As a percentage of revenue, commission expense was slightly lower compared to the prior year. Commission expense includes commissions and other variable compensation.
Product and Technology
| | | Years Ended December 31, | | | | | | | | | | | Years Ended December 31, | |
| | | 2013 | | | 2012 | | | 2011 | | | 2013-2012 % Change | | | 2012-2011 % Change | | | 2013 | | | 2012 | | | 2011 | |
(in thousands) | | | | | | | | | | | | | | | | | | | | | | (as a percentage of revenue) | |
Product and technology expenses | | $ | 22,240 | | | $ | 18,980 | | | $ | 15,602 | | | | 17.2 | % | | | 21.7 | % | | | 4.3 | % | | | 4.2 | % | | | 4.2 | % |
Capitalized software development costs from product and technology resources | | | 11,510 | | | | 7,636 | | | | 6,776 | | | | 50.7 | % | | | 12.7 | % | | | 2.2 | | | | 1.7 | | | | 1.8 | |
Total product and technology costs expensed and capitalized | | $ | 33,750 | | | $ | 26,616 | | | $ | 22,378 | | | | 26.8 | % | | | 18.9 | % | | | 6.6 | % | | | 5.9 | % | | | 6.0 | % |
The increase in product and technology expenses in absolute dollars in 2013 compared to 2012 was primarily attributable to $6.0 million of increased salaries and compensation expense as a result of increased headcount related to the ongoing development of our technology platform and new product initiatives such as ReachEdge, and $1.2 million of increased amortization expense related to previously capitalized software development costs and acquired intangibles. The increases were partially offset by $3.9 million of increased capitalization due to an increase in capitalizable projects, including those relating to our new product initiatives. We expect our product and technology expenses to continue to increase as we invest in new product initiatives, significantly improving and expanding our technology platform, and increasing the pace of international launches of new products and solutions.
The increase in product and technology expenses in absolute dollars in 2012 compared to 2011 was primarily attributable to $2.4 million of increased salaries and compensation expense as a result of increased headcount related to the ongoing development of our technology platform and new product initiatives, partially offset by increased capitalization due to an increase in capitalizable projects, including those related to our new product initiatives, and $1.8 million of increased amortization expense related to previously capitalized software development costs and acquired intangibles.
General and Administrative
| | | Years Ended December 31, | | | | | | | | | | | Years Ended December 31, | |
| | | 2013 | | | 2012 | | | 2011 | | | 2013-2013 % Change | | | 2012-2011 % Change | | | 2013 | | | 2012 | | | 2011 | |
(in thousands) | | | | | | | | | | | | | | | | | | | | | | (as a percentage of revenue) | |
General and administrative | | $ | 46,362 | | | $ | 40,378 | | | $ | 33,470 | | | | 15.2 | % | | | 20.6 | % | | | 9.0 | % | | | 8.9 | % | | | 8.9 | % |
The increase in general and administrative expenses in absolute dollars in 2013 compared to 2012 was primarily due to impairment charges of $4.9 million related to amounts due from OxataSMB, our Eastern European franchisee, $3.0 million of expenses related to the transition out of the Company of several members of our founding management, including $1.4 million of incremental stock-based compensation expense, and a $0.7 million increase in our provision for bad debt associated with a higher level of sales on credit terms. These increases were partially offset by a decrease of $1.8 million in facilities and other employee-related costs, and a $0.7 million decrease in professional fees, which consist of tax, consulting, audit and legal fees.
The increase in general and administrative expenses in absolute dollars in 2012 compared to 2011 was primarily due to $6.8 million of increased employee and facilities costs to support the growth of the business, including our international expansion, and $0.7 million of increased stock-based compensation expense, partially offset by $0.5 million of decreased professional fees, which consist of tax, consulting, audit and legal fees.
We expect general and administrative expenses to increase in absolute dollars as we continue to add personnel and incur additional professional fees and other expenses to support our continued domestic and international growth.
Other Income (Expense), Net
Other income, net increased in 2013 compared to 2012 due to foreign exchange rate fluctuations on invested balances. Other income, net also consists of interest income resulting from invested balances.
Other income, net decreased in 2012 compared to 2011 due to foreign exchange rate fluctuations and lower interest rates on invested balances.
Provision for Income Taxes
Our effective tax rate for 2013 and 2012 was 54.8% and 24.3%, respectively. The income tax provision of $3.7 million and $1.3 million for 2013 and 2012, respectively, relates primarily to U.S. Federal and State taxes as well as certain foreign income taxes. The overall increase in tax expense in 2013 compared to the same period in 2012 was primarily due to higher income tax expense in the United States as 2012 tax expense in the United States was offset by a change in the valuation allowance, and due to higher profitability in the United States. The increased expense in the US was partially offset by the release of the valuation allowance in 2013, which reduced income tax expense by approximately $4.0 million. See Note 11 “Income Taxes” for more information.
The income tax provision of $1.3 million and $0.7 million for 2012 and 2011, respectively, relates to federal, state and foreign income taxes, including the deferred tax impact of prior business combinations. The income tax benefit of $0.5 million for 2010 was primarily attributable to the acquisition of SMB:LIVE, in which we recorded one-time discrete tax benefit of $0.7 million, which was partially offset by state, local and foreign income taxes of $0.2 million.
Due to the uncertainty of the timing and ultimate realization of our deferred tax assets, we have recorded a valuation allowance against most of our foreign deferred tax assets. As such, future tax expense will consist primarily of Federal and State income taxes and our future tax rate will fluctuate based upon the percentage of domestic and foreign income or loss.
Loss from Discontinued Operations
In the fourth quarter of 2013, our Board of Directors approved a plan to dispose of our ClubLocal business, and on February 18, 2014, we completed the contribution of our ClubLocal business to a new entity in exchange for a minority interest in the entity. This business has been accounted for as discontinued operations for all periods presented.
On November 1, 2011, we announced that we would wind down the operations of Bizzy and determined that Bizzy would be considered a discontinued operation starting with the third quarter of 2011. In connection with this decision, we recorded a charge of $4.0 million in 2011 to reflect the impairment of capitalized software development costs, personnel and severance costs, operating losses, facilities and other costs.
Non-GAAP Financial Measures
In addition to our GAAP results discussed above, we believe Adjusted EBITDA is useful to investors in evaluating our operating performance. Historically we have also viewed Underclassmen Expense as useful to show our investment in Underclassmen, but due to the sales force realignment, we believe it will no longer be comparable or relevant in the future. As a result, after this Annual Report on Form 10-K we will no longer report Underclassmen Expense.
For the years ended December 31, 2013, 2012 and 2011, our Adjusted EBITDA and Underclassmen Expense were as follows:
| | | Years Ended December 31, | |
Non-GAAP Financial Measures (unaudited): | | 2013 | | | 2012 | | | 2011 | |
(in thousands) | | | | | | | | | | | | |
Adjusted EBITDA (1) | | $ | 32,801 | | | $ | 28,052 | | | $ | 15,915 | |
Underclassmen Expense (2) | | $ | 48,944 | | | $ | 45,250 | | | $ | 44,488 | |
(1) | Adjusted EBITDA. We define Adjusted EBITDA as net income (loss) from continuing operations before interest, income taxes, depreciation and amortization expenses, excluding, when applicable, stock-based compensation, the effects of accounting for business combinations (including any impairment of acquired intangibles and, in the case of the acquisition of SMB:LIVE, the deferred cash consideration), restructuring charges, and amounts included in other non-operating income or expense. Adjusted EBITDA for 2012 reflects the reclassification of ClubLocal to discontinued operations. |
(2) | Underclassmen Expense. We define Underclassmen Expense as our investment in Underclassmen, which is comprised of the selling and marketing expenses we allocate to Underclassmen during a reporting period. The amount includes the direct salaries and allocated benefits of the Underclassmen (excluding commissions and other variable compensation), training and sales organization expenses including depreciation allocated based on relative headcount and marketing expenses allocated based on relative revenue. The non-GAAP calculations presented here for the period ended December 31, 2013 are made on a pro forma basis as if the sales realignment had not occurred and the salespeople employed on December 31, 2013 had retained their previous job roles and maturities. While we believe that Underclassmen Expense provides useful information regarding our approximated investment in Underclassmen, the methodology we use to arrive at our estimated Underclassmen Expense was developed internally by the Company, is not a concept or method recognized by GAAP and other companies may use different methodologies to calculate or approximate measures similar to Underclassmen Expense. Accordingly, our calculation of Underclassmen Expense may not be comparable to similar measures used by other companies. Due to the North American sales force realignment in December 2013, we believe Underclassmen Expense will no longer be a comparable or relevant metric in the future. As a result, this will be the last time we report Underclassmen Expense. |
Our management uses Adjusted EBITDA because (i) it is a key basis upon which our management assesses our operating performance; (ii) it may be a factor in the evaluation of the performance of our management in determining compensation; (iii) we use it, in conjunction with GAAP measures such as revenue and income (loss) from operations, for operational decision-making purposes; and (iv) we believe it is one of the primary metrics investors use in evaluating Internet marketing companies.
We believe that Adjusted EBITDA permits an assessment of our operating performance, in addition to our performance based on our GAAP results that is useful in assessing the progress of the business. By excluding (i) the effects of accounting for business combinations and associated acquisition and integration costs, which obscure the measurable performance of the business operations; (ii) restructuring charges; (iii) depreciation and amortization and other non-operating income and expense, each of which may vary from period to period without any correlation to underlying operating performance; and (iv) stock-based compensation, which is a non-cash expense, we believe that we are able to gain a fuller view of the operating performance of the business. We provide information relating to our Adjusted EBITDA so that investors have the same data that we employ in assessing our overall operations. We believe that trends in our Adjusted EBITDA are a valuable indicator of operating performance on a consolidated basis and of our ability to produce operating cash flow to fund working capital needs, capital expenditures and investments in Underclassmen.
In addition, we believe that Adjusted EBITDA and similar measures are widely used by investors, securities analysts, ratings agencies and other interested parties in our industry as a measure of financial performance and debt-service capabilities. Our use of Adjusted EBITDA has limitations as an analytical tool, and you should not consider it in isolation or as a substitute for analysis of our results as reported under GAAP. Some of these limitations are:
| • | Adjusted EBITDA does not reflect our cash expenditures for capital equipment or other contractual commitments; |
| • | Although depreciation and amortization are non-cash charges, the assets being depreciated and amortized may have to be replaced in the future, and Adjusted EBITDA does not reflect capital expenditure requirements for such replacements; |
| • | Adjusted EBITDA does not reflect changes in, or cash requirements for, our working capital needs; |
| • | Adjusted EBITDA does not consider the potentially dilutive impact of issuing equity-based compensation to our management team and employees; |
| • | Adjusted EBITDA does not reflect the potentially significant interest expense or the cash requirements necessary to service interest or principal payments on indebtedness we may incur in the future; |
| • | Adjusted EBITDA does not reflect income and expense items that relate to our financing and investing activities, any of which could significantly affect our results of operations or be a significant use of cash; |
| • | Adjusted EBITDA does not reflect certain tax payments that may represent a reduction in cash available to us; and |
| • | Other companies, including companies in our industry, calculate Adjusted EBITDA measures differently, which reduces its usefulness as a comparative measure. |
Adjusted EBITDA is not intended to replace operating income (loss), net income (loss) and other measures of financial performance reported in accordance with GAAP. Rather, Adjusted EBITDA is a measure of operating performance that you may consider in addition to those measures. Because of these limitations, Adjusted EBITDA should not be considered as a measure of discretionary cash available to us to invest in the growth of our business. We compensate for these limitations by relying primarily on our GAAP results, including cash flows provided by operating activities, and using total Adjusted EBITDA as a supplemental financial measure.
The following table presents a reconciliation of Adjusted EBITDA to our loss from operations for each of the periods indicated:
| | | Years Ended December 31, | |
| | | 2013 | | | 2012 | | | 2011 | |
(in thousands) | | | | | | | | | | | | |
Operating income | | $ | 6,164 | | | $ | 4,949 | | | $ | (4,319 | ) |
Add: | | | | | | | | | | | | |
Depreciation and amortization | | | 15,096 | | | | 13,602 | | | | 10,274 | |
Stock-based compensation, net | | | 11,505 | | | | 9,469 | | | | 8,538 | |
Acquisition and integration costs | | | 36 | | | | 32 | | | | 1,422 | |
Adjusted EBITDA | | $ | 32,801 | | | $ | 28,052 | | | $ | 15,915 | |
Liquidity and Capital Resources
| | | Years Ended December 31, | |
Consolidated Statements of Cash Flow Data: | | 2013 | | | 2012 | | | 2011 | |
(in thousands) | | | | | | | | | | | | |
Net cash provided by operating activities, continuing operations | | $ | 30,688 | | | $ | 46,604 | | | $ | 20,394 | |
Net cash used in investing activities, continuing operations | | $ | (21,631 | ) | | $ | (23,275 | ) | | $ | (11,241 | ) |
Net cash used in financing activities, continuing operations | | $ | (11,097 | ) | | $ | (9,180 | ) | | $ | (973 | ) |
| Net cash used by discontinued operations | | | (7,182 | ) | | | (5,584 | ) | | | (3,012 | ) |
At December 31, 2013, we had cash and cash equivalents of $79.7 million and short-term investments of $0.5 million. Cash and cash equivalents consist of cash, money market accounts and certificates of deposit. Short term investments consist of certificates of deposit with original maturities in excess of three months but less than 12 months. To date, we have experienced no loss of our invested cash, cash equivalents or short-term investments, although some of those balances are subject to foreign currency exchange risk (see Item 7A, “Foreign Currency Exchange Risk,” for more information). We cannot, however, provide any assurances that access to our invested cash, cash equivalents and short-term investments will not be impacted by adverse conditions in the financial markets. At December 31, 2013, we had no long-term indebtedness for borrowed money and are not subject to any restrictive bank covenants. At December 31, 2013, we had $1.4 million in restricted certificates of deposit to secure letters of credit issued to landlords and others.
At December 31, 2013, we had significant internal product and technology resources working on projects that met the criteria for capitalization as software development costs and others that did not, although none of the projects in process were long-term projects (greater than one year). The amount capitalized for such projects in future periods will be evaluated by management and will impact the portion of costs for those internal resources that reduces net cash provided by operating activities and the portion of such costs used in investing activities. Funding for the committed capital expenditures, including software development costs, is expected to be provided by operating cash flows.
We have financed our operations, our expansion of our sales force, the extension of our Direct Local channel into new territories, and product expansion, primarily through cash provided by operations. Deferred revenue arising from prepayment by the great majority of our clients and vendor trade financing, principally for the purchase of media, have historically been major components of our cash flow from operations. In general, to the extent our revenue from our Direct Local channel continues to grow, we would expect both the amount of deferred revenue from customer prepayments and the amount of vendor financing for purchased media to increase. However, we have experienced an increase in customers with credit terms in 2013, which partially offsets the increase in cash provided by operating activities associated with prepayments. Should revenue from the Direct Local channel decrease, the amount of deferred revenue and vendor financing would likely decrease, which, subject to changes in other accounts, would cause net cash provided by operations to be reduced.
Due to our recent share repurchases and capital expenditures, our current liabilities exceed our current assets. However, we believe that our available cash and cash flows generated from operations will be sufficient to satisfy our working capital and planned investing and financing activities to support our long-term growth strategy, including share repurchases and capital expenditure requirements, for at least the next 12 months. Although we expect that cash flow from operations and our existing cash balances will be sufficient to continue funding our expansion activities, these investments, including investments in developing new products and services for our clients or future acquisitions of business, solutions or technologies, could require us to seek additional equity or debt financing, and that financing may not be available on terms favorable to us or at all. In addition, we intend to continue to increase our investment in the development of new products and services for our clients, and our service, sales and marketing infrastructure to reach our clients, which could require significant capital and entail non-capitalized expenses that could decrease our income from operations.
Operating Activities
Net cash provided by operating activities decreased by $15.7 million in 2013 compared to 2012. The decrease in cash flow from operating activities in 2013 was due to changes in working capital, primarily due to higher accounts receivable related to an increase in the number of advertisers on credit terms, lower growth in deferred revenue relative to 2012 as revenue growth slowed in 2013 and fewer customers paid in advance due to the growth in advertisers on credit terms, and lower growth in accounts payable and accrued expenses relative to 2012 due to timing. These declines were partially offset by higher income from continuing operations adjusted for non-cash items.
Net cash provided by operating activities increased by $23.8 million in 2012 compared to 2011. Income from continuing operations adjusted for non-cash items increased by $11.7 million. In addition, cash flow from operating activities was favorably impacted by increases in accounts payable and accrued expenses of $12.6 million due to growth of the business and the fluctuation in timing of payments to certain vendors, including the normalization of rebates receivable, and increases in deferred revenue, rent and other liabilities of $7.7 million due to the growth of our business.
Investing Activities
Our primary investing activities have consisted of capitalized software development costs, purchases of property and equipment, investments in a partnership, short-term investments, and business acquisitions. Cash outflow from capitalization of software costs increased by $2.8 million year-over-year in 2013 from 2012, reflecting our increased investment in our products, technology, facilities, and newer markets, and our purchases of property and equipment increased by $1.9 million year-over-year. Purchases of property and equipment and capitalization of software costs will vary from period to period due to the timing of the expansion of our operations and our software development efforts. We expect to continue to use capital for acquisitions, purchases of property and equipment, and development of software.
During 2013, we had maturities of certificates of deposits and short-term investments aggregating $2.6 million. We also invested $2.5 million in a privately held partnership and provided additional financing of $1.2 million to OxataSMB. Later, in 2013, we determined that the loan to OxataSMB was likely uncollectible and accordingly, impaired the full loan amount and related accrued interest. The impairment is included as part of our operating activities. In addition, we made a final payment of $0.4 million on the deferred obligations related to the DealOn acquisition.
Our capitalization of software costs increased by $2.3 million year-over-year in 2012 from 2011, reflecting our increased investment in our products, technology, facilities, and newer markets, and our purchases of property and equipment increased by $0.7 million year-over-year. On June 29, 2012, we entered into a market development loan agreement with OxataSMB pursuant to which we agreed to provide financing to OxataSMB of up to €2.9 million ($3.7 million), of which €1.45 million ($1.9 million) was advanced in 2012. In addition, during 2012, we made acquisition related payments of $4.0 million, consisting of payments on deferred obligations related to the DealOn and SMB:LIVE acquisitions totaling $1.6 million, and payment for the RealPractice acquisition of $2.6 million. We also purchased certificates of deposits and short-term investments of $9.1 million, offset by maturities aggregating $6.6 million.
Financing Activities
Net cash used in financing activities increased by $1.9 million in 2013 compared to 2012 primarily due to higher repurchases of our common stock, partially offset by higher proceeds from the exercise of stock options. Our cash used in financing activities during 2013 resulted primarily from $19.0 million of cash used to repurchase our common stock pursuant to our share repurchase program, partially offset by $6.7 million in proceeds from exercise of stock options and $1.2 million of realized excess tax benefits from stock-based awards.
Net cash used in financing activities increased by $8.2 million in 2012 compared to 2011 primarily due to higher repurchases of our common stock, partially offset by higher proceeds from exercise of stock options. Our cash used in financing activities during 2012 resulted primarily from using $11.0 million of cash to settle the purchase of shares of our common stock pursuant to our share repurchase program, partially offset by $1.8 million in proceeds from exercise of stock options.
Future cash flows from financing activities may be affected by our repurchases of our common stock. On November 4, 2011, we announced that our Board of Directors authorized the repurchase of up to $20.0 million of our outstanding common stock. On December 13, 2012, we announced that our Board of Directors increased the total authorized repurchase amount to $26.0 million, and on March 4, 2013, we announced that our Board of Directors increased the total authorized repurchase amount by an additional $21.0 million, to a total authorization of $47.0 million. At December 31, 2013, we had executed repurchases of $36.3 million of our common stock under the program. Purchases may be made from time-to-time in open market or privately negotiated transactions as determined by our management. The amount and timing of the share repurchase will depend on business and market conditions, stock price, trading restrictions, acquisition activity, and other factors. The share repurchase program does not obligate us to acquire any particular amount of common stock, and the repurchase program may be suspended or discontinued at any time at our discretion.
Balance Sheet Arrangements
At December 31, 2013, we did not have any off-balance sheet arrangements.
Contractual Obligations
At December 31, 2013, the remaining deferred payment obligation related to the RealPractice acquisition was $0.3 million. The final payment was made on January 6, 2014.
We lease our primary office space in Woodland Hills, California; Plano, Texas; and other locations under various cancelable and non-cancelable operating leases that will expire between 2014 and 2021. We have no debt obligations. All property and equipment have been purchased for cash, and we have no capital lease obligations recorded in the financial statements.
At December 31, 2013, future minimum payments under non-cancelable operating leases are as follows (in thousands):
| | | Payments Under Operating Leases | |
Less than 1 year | | $ | 11,030 | |
1-3 years | | | 17,605 | |
3-5 years | | | 10,304 | |
More than 5 years | | | 14,095 | |
Total future minimum payments | | $ | 53,034 | |
We have long-term purchase obligations outstanding with vendors, of which $3.5 million is due within a year, $14.9 million is due between 1 to 3 years, and $3.8 million is due between 3 to 5 years.
Recent Accounting Pronouncements
In July 2013, the Financial Accounting Standards Board ("FASB") issued Accounting Standards Update No. 2013-11, Presentation of an Unrecognized Tax Benefit When a Net Operating Loss Carryforward, a Similar Tax Loss, or a Tax Credit Carryforward Exists. The amendments in this update require an unrecognized tax benefit, or a portion of an unrecognized tax benefit, to be presented in the financial statements as a reduction to a deferred tax asset for a net operating loss carryforward, a similar tax loss, or a tax credit carryforward, except asfollows. To the extent a net operating loss carryforward, a similar tax loss, or a tax credit carryforward is not available at the reporting date under the tax law of the applicable jurisdiction to settle any additional income taxes that would result from the disallowance of a tax position or the tax law of the applicable jurisdiction does not require the entity to use, and the entity does not intend to use, the deferred tax asset for such purpose, the unrecognized tax benefit should be presented in the financial statements as a liability and should not be combined with deferred tax assets. The assessment of whether a deferred tax asset is available is based on the unrecognized tax benefit and deferred tax asset that exist at the reporting date and should be made presuming disallowance of the tax position at the reporting date. The amendments in this update do not require new recurring disclosures. The amendments in this update were effective for the Company as of January 1, 2014. Implementation of this update did not have a material impact on our consolidated financial statements.
Item 7A. Quantitative and Qualitative Disclosures About Market Risk.
We are exposed to market risk in the ordinary course of our business. These risks primarily include interest rate, foreign exchange and inflation risks.
Interest Rate Fluctuation Risk
We do not have any long-term indebtedness for borrowed money. Our investments include cash, cash equivalents and short-term investments. Cash and cash equivalents and short-term investments consist of cash, money market accounts and certificates of deposit. The primary objective of our investment activities is to preserve principal while maximizing income without significantly increasing risk. We do not enter into investments for trading or speculative purposes. Our investments are exposed to market risk due to a fluctuation in interest rates, which may affect our interest income and the fair market value of our investments. Due to the short-term nature of our investment portfolio, we do not believe an immediate 10% increase in interest rates would have a material effect on the fair market value of our portfolio, and therefore we do not expect our operating results or cash flows to be materially affected to any degree by a sudden change in market interest rates.
Foreign Currency Exchange Risk
We have foreign currency risks related to our investments, revenue and operating expenses denominated in currencies other than the U.S. dollar, principally the Australian dollar, the British pound sterling, the Canadian dollar, the euro, the Japanese yen, the Indian rupee, and the Brazilian real. For the year ended December 31, 2013, a 10% strengthening of the U.S. dollar relative to these foreign currencies would have resulted in a decrease in revenue of $18.9 million, but an increase in operating income of $1.1 million. A 10% weakening of the U.S. dollar relative to these foreign currencies, however, would have resulted in an increase in revenue of $18.9 million, but a decrease in operating income of $1.1 million. As exchange rates vary, sales and other operating results, when translated, may differ materially from expectations. In addition, approximately 44% of our cash balances are denominated in currencies other than the U.S. dollar, and the value of such holdings will increase or decrease along with the weakness or strength of the U.S. dollar, respectively. We plan to implement a hedging strategy in 2014 to try to reduce the effect of fluctuating currency rates on our business, but there can be no assurances that such a hedging strategy will accomplish our objectives or that it will not result in losses.
Inflation Risk
We do not believe that inflation has had a material effect on our business, financial condition or results of operations. If our costs were to become subject to significant inflationary pressures, we may not be able to fully offset such higher costs through price increases. Our inability or failure to do so could harm our business, financial condition and results of operations.
Item 8. Financial Statements and Supplementary Data.
Please refer to Item 15—Exhibits and Financial Statement Schedules.
Item 9. Changes in and Disagreements With Accountants on Accounting and Financial Disclosure.
None.
Item 9A. Controls and Procedures.
(a) | Evaluation of Disclosure Controls and Procedures |
Under the supervision and with the participation of our management, including our Chief Executive Officer and Chief Financial Officer, we have evaluated the effectiveness of our disclosure controls and procedures pursuant to Exchange Act Rules 13a-15(e) and 15d-15(e) as of December 31, 2013. Based on that evaluation, our Chief Executive Officer and Chief Financial Officer have concluded that these disclosure controls and procedures were effective to provide reasonable assurance that information required to be disclosed by us in reports we file or submit under the Exchange Act is (1) recorded, processed, summarized and reported within the time periods specified in the Securities and Exchange Commission’s rules and forms, and (2) is accumulated and communicated to our management, including our Chief Executive Officer and Chief Financial Officer, as appropriate to allow timely decisions regarding required disclosure.
(b) | Management’s Annual Report on Internal Control Over Financial Reporting |
Our management is responsible for establishing and maintaining adequate internal control over financial reporting as defined in Rules 13a-15(f) and 15d-15(f) under the Exchange Act. Under the supervision and with the participation of our management, including our Chief Executive Officer and Chief Financial Officer, we conducted an evaluation of the effectiveness of our internal control over financial reporting based on criteria established in the framework in the 1992Internal Control—Integrated Frameworkissued by the Committee of Sponsoring Organizations of the Treadway Commission. Based on this evaluation, our management concluded that our internal control over financial reporting was effective as of December 31, 2013.
Because of its inherent limitations, internal control over financial reporting may not prevent or detect all misstatements. A control system no matter how well designed and operated, can provide only reasonable assurance with respect to financial statement preparation and presentation. Also, projections of any evaluation of effectiveness to future periods are subject to the risk that controls may become inadequate because of changes in conditions, or that the degree of compliance with the policies or procedures may deteriorate.
Grant Thornton LLP, an independent registered public accounting firm, has audited the effectiveness of our internal control over financial reporting as of December 31, 2013, as stated in their report, which is included in Item 8 of this Annual Report on Form 10-K.
(c) | Changes in Internal Control Over Financial Reporting |
There have been no changes in our internal control over financial reporting that occurred during the quarter ended December 31, 2013 that have materially affected, or are reasonably likely to materially affect, our internal control over financial reporting.
Item 9B. Other Information.
None.
PART III
Item 10. Directors, Executive Officers and Corporate Governance.
The information required by this item is incorporated herein by reference to our Proxy Statement for our 2014 Annual Meeting of Stockholders.
We have adopted a code of business conduct and ethics applicable to our directors, officers (including our principal executive officer and principal financial officer) and employees. The Code of Business Conduct and Ethics is available on the investor relations section of our website at www.reachlocal.com under “Corporate Governance.”
We intend to satisfy the disclosure requirement under Item 5.05 of Form 8-K regarding an amendment to, or waiver from, a provision of this Code of Business Conduct and Ethics by posting such information on our website, at the address and location specified above and, to the extent required by the listing standards of The NASDAQ Stock Market, by filing a Current Report on Form 8-K with the SEC, disclosing such information.
Item 11. Executive Compensation.
The information required by this item is incorporated herein by reference to our Proxy Statement for our 2014 Annual Meeting of Stockholders.
Item 12. Security Ownership of Certain Beneficial Owners and Management and Related Stockholder Matters.
The information required by this item is incorporated herein by reference to our Proxy Statement for our 2014 Annual Meeting of Stockholders.
Item 13. Certain Relationships and Related Transactions, and Director Independence.
The information required by this item is incorporated herein by reference to our Proxy Statement for our 2014 Annual Meeting of Stockholders.
Item 14. Principal Accountant Fees and Services.
The information required by this item is incorporated herein by reference to our Proxy Statement for our 2014 Annual Meeting of Stockholders.
PART IV
Item 15. Exhibits, Financial Statement Schedules.
We have filed the following documents as part of this Annual Report on Form 10-K:
| | Page |
| | |
(1) | ReachLocal, Inc. Consolidated Financial Statements | |
| | |
| Reports of Independent Registered Public Accounting Firm | F-2 |
| Consolidated Balance Sheets | F-4 |
| Consolidated Statements of Operations | F-5 |
| Consolidated Statements of Comprehensive Loss | F-6 |
| Consolidated Statements of Stockholders’ Equity | F-7 |
| Consolidated Statements of Cash Flows | F-8 |
| Notes to the Consolidated Financial Statements | F-9 |
REPORT OF INDEPENDENT REGISTERED PUBLIC ACCOUNTING FIRM
Board of Directors and Stockholders
ReachLocal, Inc.
We have audited the accompanying consolidated balance sheets of ReachLocal, Inc. (the “Company”) as of December 31, 2013 and 2012, and the related consolidated statements of operations, comprehensive loss, stockholders’ equity, and cash flows for each of the three years in the period ended December 31, 2013. These financial statements are the responsibility of the Company’s management. Our responsibility is to express an opinion on these financial statements based on our audits.
We conducted our audits in accordance with the standards of the Public Company Accounting Oversight Board (United States). Those standards require that we plan and perform the audit to obtain reasonable assurance about whether the financial statements are free of material misstatement. An audit includes examining, on a test basis, evidence supporting the amounts and disclosures in the financial statements. An audit also includes assessing the accounting principles used and significant estimates made by management, as well as evaluating the overall financial statement presentation. We believe that our audits provide a reasonable basis for our opinion.
In our opinion, the consolidated financial statements referred to above present fairly, in all material respects, the financial position of ReachLocal, Inc. as of December 31, 2013 and 2012, and the results of its operations and its cash flows for each of the three years in the period ended December 31, 2013, in conformity with accounting principles generally accepted in the United States of America.
We also have audited, in accordance with the standards of the Public Company Accounting Oversight Board (United States), the Company’s internal control over financial reporting as of December 31, 2013, based on criteria established in the 1992Internal Control—Integrated Framework issued by the Committee of Sponsoring Organizations of the Treadway Commission (COSO) and our report dated March 4, 2014 expressed an unqualified opinion.
/s/ GRANT THORNTON LLP
Irvine, California
March 4, 2014
REPORT OF INDEPENDENT REGISTERED PUBLIC ACCOUNTING FIRM
Board of Directors and Stockholders
ReachLocal, Inc.
We have audited the internal control over financial reporting of ReachLocal, Inc. (the “Company”) as of December 31, 2013, based on criteria established in the 1992Internal Control—Integrated Framework issued by the Committee of Sponsoring Organizations of the Treadway Commission (COSO). The Company’s management is responsible for maintaining effective internal control over financial reporting and for its assessment of the effectiveness of internal control over financial reporting, included in the accompanying Management’s Annual Report on Internal Control Over Financial Reporting. Our responsibility is to express an opinion on the Company’s internal control over financial reporting based on our audit.
We conducted our audit in accordance with the standards of the Public Company Accounting Oversight Board (United States). Those standards require that we plan and perform the audit to obtain reasonable assurance about whether effective internal control over financial reporting was maintained in all material respects. Our audit included obtaining an understanding of internal control over financial reporting, assessing the risk that a material weakness exists, testing and evaluating the design and operating effectiveness of internal control based on the assessed risk, and performing such other procedures as we considered necessary in the circumstances. We believe that our audit provides a reasonable basis for our opinion.
A company’s internal control over financial reporting is a process designed to provide reasonable assurance regarding the reliability of financial reporting and the preparation of financial statements for external purposes in accordance with generally accepted accounting principles. A company’s internal control over financial reporting includes those policies and procedures that (1) pertain to the maintenance of records that, in reasonable detail, accurately and fairly reflect the transactions and dispositions of the assets of the company; (2) provide reasonable assurance that transactions are recorded as necessary to permit preparation of financial statements in accordance with generally accepted accounting principles, and that receipts and expenditures of the company are being made only in accordance with authorizations of management and directors of the company; and (3) provide reasonable assurance regarding prevention or timely detection of unauthorized acquisition, use, or disposition of the company’s assets that could have a material effect on the financial statements.
Because of its inherent limitations, internal control over financial reporting may not prevent or detect misstatements. Also, projections of any evaluation of effectiveness to future periods are subject to the risk that controls may become inadequate because of changes in conditions, or that the degree of compliance with the policies or procedures may deteriorate.
In our opinion, the Company maintained, in all material respects, effective internal control over financial reporting as of December 31, 2013, based on criteria established in the 1992Internal Control—Integrated Framework issued by COSO.
We also have audited, in accordance with the standards of the Public Company Accounting Oversight Board (United States), the consolidated financial statements of the Company as of and for the year ended December 31, 2013, and our report dated March 4, 2014 expressed an unqualified opinion on those financial statements.
/s/ GRANT THORNTON LLP
Irvine, California
March 4, 2014
REACHLOCAL, INC.
CONSOLIDATED BALANCE SHEETS
(in thousands, except per share data)
| | | December 31, 2013 | | | December 31, 2012 | |
Assets | | | | | | | | |
Current Assets: | | | | | | | | |
Cash and cash equivalents | | $ | 79,732 | | | $ | 92,320 | |
Short-term investments | | | 545 | | | | 3,149 | |
Accounts receivable, net of allowance for doubtful accounts of $2,212 and $259 at December 31, 2013 and December 31, 2012, respectively | | | 9,699 | | | | 5,689 | |
Other receivables and prepaid expenses | | | 8,746 | | | | 8,889 | |
Deferred tax assets | | | 1,250 | | | | — | |
Assets of discontinued operations | | | 3,415 | | | | 1,256 | |
Total current assets | | | 103,387 | | | | 111,303 | |
| | | | | | | | | |
Property and equipment, net | | | 12,903 | | | | 11,040 | |
Capitalized software development costs, net | | | 17,300 | | | | 13,558 | |
Restricted certificates of deposit | | | 1,436 | | | | 1,226 | |
Intangible assets, net | | | 1,270 | | | | 2,442 | |
Other assets | | | 7,630 | | | | 4,044 | |
Goodwill | | | 42,083 | | | | 42,083 | |
Total assets | | $ | 186,009 | | | $ | 185,696 | |
| | | | | | | | | |
Liabilities and Stockholders’ Equity | | | | | | | | |
Current Liabilities: | | | | | | | | |
Accounts payable | | $ | 36,970 | | | $ | 35,233 | |
Accrued compensation and benefits | | | 17,280 | | | | 14,496 | |
Deferred revenue | | | 33,013 | | | | 34,142 | |
Other current liabilities | | | 15,089 | | | | 14,887 | |
Liabilities of discontinued operations | | | 1,324 | | | | 1,032 | |
Total current liabilities | | | 103,676 | | | | 99,790 | |
Deferred rent and other liabilities | | | 3,965 | | | | 4,020 | |
Total liabilities | | | 107,641 | | | | 103,810 | |
| | | | | | | | | |
Commitments and contingencies (Note 8) | | | | | | | | |
| | | | | | | | | |
Stockholders’ Equity: | | | | | | | | |
Common stock, $0.00001 par value—140,000 shares authorized; 28,259 and 28,154 shares issued and outstanding at December 31, 2013 and December 31, 2012, respectively | | | — | | | | — | |
Receivable from stockholder | | | (73 | ) | | | (89 | ) |
Additional paid-in capital | | | 111,934 | | | | 110,573 | |
Accumulated deficit | | | (29,559 | ) | | | (27,076 | ) |
Accumulated other comprehensive loss | | | (3,934 | ) | | | (1,522 | ) |
Total stockholders’ equity | | | 78,368 | | | | 81,886 | |
Total liabilities and stockholders’ equity | | $ | 186,009 | | | $ | 185,696 | |
See notes to consolidated financial statements.
REACHLOCAL, INC.
CONSOLIDATED STATEMENTS OF OPERATIONS
(in thousands, except per share data)
| | | Years Ended December 31, | |
| | | 2013 | | | 2012 | | | 2011 | |
Revenue | | $ | 514,070 | | | $ | 454,957 | | | $ | 375,241 | |
Cost of revenue | | | 256,450 | | | | 226,482 | | | | 190,559 | |
Operating expenses: | | | | | | | | | | | | |
Selling and marketing | | | 182,854 | | | | 164,168 | | | | 139,929 | |
Product and technology | | | 22,240 | | | | 18,980 | | | | 15,602 | |
General and administrative | | | 46,362 | | | | 40,378 | | | | 33,470 | |
Total operating expenses | | | 251,456 | | | | 223,526 | | | | 189,001 | |
Operating income (loss) | | | 6,164 | | | | 4,949 | | | | (4,319 | ) |
Other income, net | | | 586 | | | | 556 | | | | 928 | |
Income (loss) from continuing operations before income taxes | | | 6,750 | | | | 5,505 | | | | (3,391 | ) |
Income tax provision | | | 3,699 | | | | 1,340 | | | | 735 | |
Income (loss) from continuing operations | | | 3,051 | | | | 4,165 | | | | (4,126 | ) |
Loss from discontinued operations, net of income taxes of $3,036, $186, and $0 for years ended December 31, 2013, 2012, and 2011, respectively | | | (5,534 | ) | | | (4,397 | ) | | | (6,215 | ) |
Net loss | | $ | (2,483 | ) | | $ | (232 | ) | | $ | (10,341 | ) |
| | | | | | | | | | | | | |
Net income (loss) per share: | | | | | | | | | | | | |
| | | | | | | | | | | | | |
Basic: | | | | | | | | | | | | |
Income (loss) from continuing operations | | $ | 0.11 | | | $ | 0.15 | | | $ | (0.14 | ) |
Loss from discontinued operations, net of income taxes | | $ | (0.20 | ) | | $ | (0.16 | ) | | $ | (0.21 | ) |
Net loss per share | | $ | (0.09 | ) | | $ | (0.01 | ) | | $ | (0.36 | ) |
| | | | | | | | | | | | | |
Diluted: | | | | | | | | | | | | |
Income (loss) from continuing operations | | $ | 0.10 | | | $ | 0.14 | | | $ | (0.14 | ) |
Loss from discontinued operations, net of income taxes | | $ | (0.19 | ) | | $ | (0.15 | ) | | $ | (0.21 | ) |
Net loss per share | | $ | (0.09 | ) | | $ | (0.01 | ) | | $ | (0.36 | ) |
| | | | | | | | | | | | | |
Weighted average common shares used in the computation of income (loss) per share: | | | | | | | | | | | | |
Basic | | | 27,764 | | | | 28,348 | | | | 28,974 | |
Diluted | | | 29,051 | | | | 28,896 | | | | 28,974 | |
See notes to consolidated financial statements.
REACHLOCAL, INC.
CONSOLIDATED STATEMENTS OF COMPREHENSIVE LOSS
(in thousands)
| | | Years Ended December 31, | |
| | | 2013 | | | 2012 | | | 2011 | |
Net loss | | $ | (2,483 | ) | | $ | (232 | ) | | $ | (10,341 | ) |
Other comprehensive loss: | | | | | | | | | | | | |
Foreign currency translation adjustments | | | (2,412 | ) | | | (1,247 | ) | | | (282 | ) |
Comprehensive loss | | $ | (4,895 | ) | | $ | (1,479 | ) | | $ | (10,623 | ) |
See notes to consolidated financial statements.
REACHLOCAL, INC.
CONSOLIDATED STATEMENTS OF STOCKHOLDERS’ EQUITY
(in thousands)
| | |
Common Stock | | | Receivable from | | | Additional Paid-in | | | Accumulated | | | Accumulated Other Comprehensive Income | | | Total Stockholders’ | |
| | | Shares | | | Amount | | | Stockholder | | | Capital | | | Deficit | | | (Loss) | | | Equity | |
Balance as of December 31, 2010 | | | 28,165 | | | $ | — | | | $ | (87 | ) | | $ | 98,593 | | | $ | (16,497 | ) | | $ | 7 | | | $ | 82,016 | |
Issuance of common stock related to stock-based compensation plans | | | 993 | | | | — | | | | — | | | | 5,495 | | | | — | | | | — | | | | 5,495 | |
Stock-based compensation | | | — | | | | — | | | | — | | | | 9,682 | | | | — | | | | — | | | | 9,682 | |
Common and restricted stock issued in business combinations | | | 266 | | | | — | | | | — | | | | 2,191 | | | | — | | | | — | | | | 2,191 | |
Common stock repurchase | | | (872 | ) | | | — | | | | — | | | | (6,468 | ) | | | — | | | | — | | | | (6,468 | ) |
Net loss | | | — | | | | — | | | | — | | | | — | | | | (10,341 | ) | | | — | | | | (10,341 | ) |
Foreign currency translation adjustments | | | — | | | | — | | | | — | | | | — | | | | (6 | ) | | | (282 | ) | | | (288 | ) |
| | | | | | | | | | | | | | | | | | | | | | | | | | | | | |
Balance as of December 31, 2011 | | | 28,552 | | | | — | | | | (87 | ) | | | 109,493 | | | | (26,844 | ) | | | (275 | ) | | | 82,287 | |
Issuance of common stock related to stock-based compensation plans | | | 521 | | | | — | | | | — | | | | 1,783 | | | | — | | | | — | | | | 1,783 | |
Stock-based compensation | | | — | | | | — | | | | — | | | | 9,805 | | | | — | | | | — | | | | 9,805 | |
Common and restricted stock issued in business combinations | | | 197 | | | | — | | | | — | | | | 455 | | | | — | | | | — | | | | 455 | |
Common stock repurchase | | | (1,116 | ) | | | — | | | | — | | | | (10,963 | ) | | | — | | | | — | | | | (10,963 | ) |
Net loss | | | — | | | | — | | | | — | | | | — | | | | (232 | ) | | | — | | | | (232 | ) |
Foreign currency translation adjustments | | | — | | | | — | | | | (2 | ) | | | — | | | | — | | | | (1,247 | ) | | | (1,249 | ) |
| | | | | | | | | | | | | | | | | | | | | | | | | | | | | |
Balance as of December 31, 2012 | | | 28, 154 | | | | — | | | | (89 | ) | | | 110,573 | | | | (27,076 | ) | | | (1,522 | ) | | | 81,886 | |
Issuance of common stock related to stock-based compensation plans | | | 1,495 | | | | — | | | | — | | | | 6,827 | | | | — | | | | — | | | | 6,827 | |
Stock-based compensation | | | — | | | | — | | | | — | | | | 12,186 | | | | — | | | | — | | | | 12,186 | |
Common and restricted stock issued in business combinations | | | 5 | | | | — | | | | — | | | | 126 | | | | — | | | | — | | | | 126 | |
Common stock repurchase | | | (1,395 | ) | | | — | | | | — | | | | (18,963 | ) | | | — | | | | — | | | | (18,963 | ) |
Excess tax benefits from stock-based awards | | | — | | | | — | | | | — | | | | 1,185 | | | | — | | | | — | | | | 1,185 | |
Net loss | | | — | | | | — | | | | — | | | | — | | | | (2,483 | ) | | | — | | | | (2,483 | ) |
Foreign currency translation adjustments | | | — | | | | — | | | | 16 | | | | — | | | | — | | | | (2,412 | ) | | | (2,396 | ) |
| | | | | | | | | | | | | | | | | | | | | | | | | | | | | |
Balance as of December 31, 2013 | | | 28,259 | | | $ | — | | | $ | (73 | ) | | $ | 111,934 | | | $ | (29,559 | ) | | $ | (3,934 | ) | | $ | 78,368 | |
See notes to consolidated financial statements.
REACHLOCAL, INC.
CONSOLIDATED STATEMENTS OF CASH FLOWS
(in thousands)
| | | Years Ended December 31, | |
| | | 2013 | | | 2012 | | | 2011 | |
Cash flows from operating activities: | | | | | | | | | | | | |
Income (loss) from continuing operations | | $ | 3,051 | | | $ | 4,165 | | | $ | (4,126 | ) |
Adjustments to reconcile income (loss) from continuing operations, net of income taxes, to net cash provided by operating activities: | | | | | | | | | | | | |
Depreciation and amortization | | | 15,096 | | | | 13,602 | | | | 10,274 | |
Stock-based compensation | | | 11,505 | | | | 9,469 | | | | 8,538 | |
Excess tax benefits from stock-based awards | | | (1,185 | ) | | | — | | | | — | |
Provision for doubtful accounts | | | 2,304 | | | | 13 | | | | 172 | |
Impairment of loan to franchisee | | | 3,279 | | | | — | | | | 764 | |
Deferred taxes, net | | | (3,500 | ) | | | 212 | | | | 185 | |
Changes in operating assets and liabilities: | | | | | | | | | | | | |
Accounts receivable | | | (6,317 | ) | | | (1,396 | ) | | | (1,077 | ) |
Other receivables and prepaid expenses | | | 121 | | | | 360 | | | | (5,740 | ) |
Other assets | | | (1,175 | ) | | | (118 | ) | | | (673 | ) |
Accounts payable and accrued expenses | | | 7,987 | | | | 12,604 | | | | 6,609 | |
Deferred revenue, rent and other liabilities | | | (478 | ) | | | 7,693 | | | | 5,468 | |
Net cash provided by operating activities, continuing operations | | | 30,688 | | | | 46,604 | | | | 20,394 | |
Net cash used in operating activities, discontinued operations | | | (4,001 | ) | | | (4,261 | ) | | | (1,872 | ) |
Net cash provided by operating activities | | | 26,687 | | | | 42,343 | | | | 18,522 | |
Cash flows from investing activities: | | | | | | | | | | | | |
Additions to property, equipment and software | | | (19,748 | ) | | | (15,013 | ) | | | (11,974 | ) |
Acquisitions, net of acquired cash | | | (363 | ) | | | (3,976 | ) | | | (6,342 | ) |
Loan to franchisee | | | (1,221 | ) | | | (1,863 | ) | | | — | |
Investment in partnership | | | (2,500 | ) | | | — | | | | — | |
Purchases of certificates of deposits and short-term investments | | | (360 | ) | | | (9,069 | ) | | | (574 | ) |
Maturities of certificates of deposits and short-term investments | | | 2,561 | | | | 6,646 | | | | 7,649 | |
Net cash used in investing activities, continuing operations | | | (21,631 | ) | | | (23,275 | ) | | | (11,241 | ) |
Net cash used in investing activities, discontinued operations | | | (3,181 | ) | | | (1,323 | ) | | | (1,140 | ) |
Net cash used in investing activities | | | (24,812 | ) | | | (24,598 | ) | | | (12,381 | ) |
| | | | | | | | | | | | | |
Cash flows from financing activities: | | | | | | | | | | | | |
Proceeds from exercise of stock options | | | 6,681 | | | | 1,783 | | | | 5,495 | |
Excess tax benefits from stock-based awards | | | 1,185 | | | | — | | | | — | |
Common stock repurchases | | | (18,963 | ) | | | (10,963 | ) | | | (6,468 | ) |
Net cash used in financing activities | | | (11,097 | ) | | | (9,180 | ) | | | (973 | ) |
Effect of exchange rate changes on cash and cash equivalents | | | (3,366 | ) | | | (770 | ) | | | (549 | ) |
Net change in cash and cash equivalents | | | (12,588 | ) | | | 7,795 | | | | 4,619 | |
Cash and cash equivalents—beginning of year | | | 92,320 | | | | 84,525 | | | | 79,906 | |
Cash and cash equivalents—end of year | | $ | 79,732 | | | $ | 92,320 | | | $ | 84,525 | |
Supplemental disclosure of other cash flow information: | | | | | | | | | | | | |
Cash paid for interest | | $ | — | | | $ | — | | | $ | — | |
Cash paid for income taxes | | $ | 3,474 | | | $ | 1,040 | | | $ | 151 | |
Supplemental disclosure of non-cash investing and financing activities: | | | | | | | | | | | | |
Capitalized software development costs resulting from stock-based compensation and deferred payment obligations | | $ | 443 | | | $ | 301 | | | $ | 1,144 | |
Deferred payment obligation increase (decrease) | | $ | (122 | ) | | $ | (195 | ) | | $ | 1,850 | |
| Unpaid purchases of property and equipment | | $ | 83 | | | $ | 211 | | | $ | 556 | |
See notes to consolidated financial statements.
REACHLOCAL, INC.
NOTES TO CONSOLIDATED FINANCIAL STATEMENTS
1. Organization and Description of Business
ReachLocal, Inc. (the “Company”) was incorporated in the state of Delaware in August 2003. The Company’s operations are located in North America, Australia, the United Kingdom, Germany, the Netherlands, Japan, Brazil, Austria, Belgium, and India. The Company’s mission is to help small- and medium-sized businesses (“SMBs”) acquire, transact with, and retain customers. The Company offers a comprehensive suite of online marketing solutions, including a marketing system that combines an optimized website and automated lead management (ReachEdge), search engine marketing (ReachSearch™), display advertising (ReachDisplay™), display retargeting (ReachRetargeting™), Web presence (ReachCast™), online marketing analytics (TotalTrack®), and assisted chat service (TotalLiveChat™), each targeted to the SMB market. The Company delivers its suite of services to SMBs through a combination of its proprietary technology platform, its sales force of outside and inside salespeople, and select third-party agencies and resellers.
2. Summary of Significant Accounting Policies
Principles of Consolidation
The consolidated financial statements include the accounts of ReachLocal, Inc. and its wholly-owned subsidiaries. All significant intercompany balances and transactions have been eliminated in consolidation.
Reclassifications and Adjustments
Certain prior period amounts have been reclassified to conform to the current period presentation.
Use of Estimates
The preparation of financial statements in conformity with accounting principles generally accepted in the United States requires management to make estimates and assumptions that affect the reported amounts of assets and liabilities and disclosure of contingent assets and liabilities at the date of the financial statements and the reported amounts of revenue and expenses during the reporting periods. Actual results may differ from those estimates.
Foreign Currency Translation
The Company’s operations are conducted in several countries around the world, and the financial statements of its foreign subsidiaries are reported in the applicable foreign currencies (functional currencies). Financial information is translated from the applicable functional currency to the U.S. dollar, the reporting currency, for inclusion in the Company’s consolidated financial statements. Revenue and expenses are translated at average exchange rates prevailing during the period, and assets and liabilities are translated at exchange rates in effect at the balance sheet date. Resulting translation adjustments are included as a component of accumulated other comprehensive income (loss), net in stockholders’ equity. Foreign currency translation adjustments are generally not adjusted for income taxes as they are primarily related to indefinite investments in foreign subsidiaries. Foreign exchange transaction gains and losses are included in other income (expense), net in the accompanying consolidated statements of operations. Exchange gains and losses on intercompany balances that are considered permanently invested are also included as a component of accumulated other comprehensive loss in stockholders’ equity.
Cash and Cash Equivalents
The Company reports all highly liquid short-term investments with original maturities of three months or less at the time of purchase as cash equivalents. As of December 31, 2013 and 2012, cash equivalents consist of demand deposits and money market accounts. Cash equivalents are stated at cost, which approximates fair value.
Short-Term Investments
The Company classifies investments as short-term when the original maturity is less than one year, or when the Company intends to sell the investment within one year. As of December 31, 2013 and 2012, short-term investments consisted of certificates of deposit. All of the short-term investments are classified as available-for-sale.
Accounts Receivable
The Company performs ongoing credit evaluations of its customers and adjusts credit limits based upon payment history, the customer’s creditworthiness and various other factors, as determined by its review of their credit information. The Company monitors collections and payments from its customers and maintains an allowance for estimated credit losses based upon its historical experience and any customer-specific collection issues that it has identified.
Restricted Cash
Restricted cash represents certificates of deposit held at financial institutions, which are pledged as collateral for letters of credit related to lease commitments. The restrictions will lapse when the letters of credit expire at the end of the respective lease terms in 2021. As of December 31, 2013 and 2012, the Company had restricted certificates of deposit in the amounts of $1.4 million and $1.2 million, respectively. Restricted certificates of deposit are classified as non-current assets.
Concentrations of Credit Risk
Financial instruments that potentially subject the Company to concentration of credit risk consist primarily of cash and cash equivalents, restricted cash, short-term investments and accounts receivable. The Company holds its cash and cash equivalents, short-term investments and restricted cash with major financial institutions around the world.
Cash and cash equivalents and certificates of deposit are deposited with a limited number of financial institutions in the United States, Canada, Australia, United Kingdom, India, the Netherlands, Germany, Japan and Brazil. The balances held at any one financial institution are generally in excess of Federal Deposit Insurance Corporation insurance limits or, in foreign territories, local insurance limits. To date, the Company has not experienced any loss or lack of access to cash in its operating accounts. However, the Company can provide no assurances that access to its cash and cash equivalents will not be impacted by adverse conditions in the financial markets. As of December 31, 2013, domestic bank balances in excess of insured limits were $46.6 million. The Company had $30.8 million in excess of insured limits in foreign bank accounts as of December 31, 2013.
The Company’s customers are dispersed both geographically and across a broad range of industries. Receivables are generated primarily through the direct local and agencies and resellers channels. Management performs ongoing evaluation of trade receivables for collectability and provides an allowance for potentially uncollectible accounts. The following table summarizes the change in the Company’s allowance for doubtful accounts for each of the three years ended December 31, 2013, 2012 and 2011 (in thousands):
| | | 2013 | | | 2012 | | | 2011 | |
Allowance for doubtful accounts as of the beginning of the year | | $ | 259 | | | $ | 363 | | | $ | 373 | |
Additions charged to expense | | | 2,328 | | | | 13 | | | | 172 | |
Write-offs | | | (375 | ) | | | (117 | ) | | | (182 | ) |
Allowance for doubtful accounts as of the end of the year | | $ | 2,212 | | | $ | 259 | | | $ | 363 | |
As of December 31, 2013 and 2012, no client accounted for 10% or more of the total accounts receivable balance, except for a receivable from OxataSMB which accounted for 13% as of December 31, 2013, and which has been fully reserved.
During 2013, 2012, and 2011, no client accounted for 10% or more of the Company’s total revenue.
During 2013, the Company’s cost of revenue was primarily for the purchase of media and the media the Company purchased was primarily from Google and Yahoo!. During 2012 and 2011, the Company’s cost of revenue was primarily for the purchase of media from Google, Yahoo! and Bing.
Other receivables and prepaid expenses included $5.5 million and $5.9 million of non-trade receivables from media vendors at December 31, 2013 and 2012, respectively.
Property and Equipment
Property and equipment are recorded at cost and depreciated using the straight-line method over the estimated useful life of the assets or, where applicable and if shorter, over the lease term. Upon retirement or sale, the cost of assets disposed of and the related accumulated depreciation are eliminated from the accounts and any resulting gain or loss is credited or charged to operations. Repairs and maintenance costs are expensed as incurred.
Estimated useful lives of assets are as follows:
Computer hardware and software (in years) | 3 |
Office equipment (in years) | 5 |
Furniture and fixtures (in years) | 7 |
Leasehold improvements | The lesser of their expected useful lives or the remaining lease term. |
Software Development Costs
The Company capitalizes costs to develop software when management has determined that the development efforts will result in new or additional functionality or new products. Costs capitalized as internal use software are amortized on a straight-line basis over the estimated three-year useful life. Costs incurred prior to meeting these criteria and costs associated with ongoing maintenance are expensed as incurred and are recorded along with amortization of capitalized software development costs as product and technology expenses within the accompanying consolidated statements of operations. The Company monitors its existing capitalized software costs and reduces its carrying value as the result of releases that render previous features or functions obsolete or otherwise reduce the value of previously capitalized costs.
Goodwill
The Company’s total goodwill of $42.1 million as of both December 31, 2013 and 2012 is related to the Company’s acquired businesses. The Company operates in one reportable segment, in accordance with Accounting Standards Codification (“ASC”) 280,Segment Reporting, and has identified two reporting units—North America and Australia—for purposes of evaluating goodwill. These reporting units each constitute a business or group of businesses for which discrete financial information is available and is regularly reviewed by each reporting unit’s management. North America’s assigned goodwill was $9.7 million and Australia’s assigned goodwill was $32.4 million as of both December 31, 2013 and 2012. The Company reviews the carrying amounts of goodwill for possible impairment whenever events or changes in circumstances indicate that the related carrying amount may not be recoverable. The Company performs its annual assessment of goodwill impairment as of the first day of each fourth quarter.
The Company follows the amended guidance for assessing qualitative factors to determine whether it is more likely than not that the fair value of a reporting unit is less than its carrying amount, in accordance with ASC 350-20,Intangibles – Goodwill and Other. Entities are provided with the option of first performing a qualitative assessment on any of its reporting units to determine whether further quantitative impairment testing is necessary. An entity may also bypass the qualitative assessment for any reporting unit in any period and proceed directly to the quantitative impairment test. If an entity determines that it is more likely than not that the fair value of a reporting unit is less than its carrying amount, then performing a two-step impairment test is necessary. The first step of the impairment test involves comparing the estimated fair values of each of our reporting units with their respective carrying amounts, including goodwill. If the estimated fair value of a reporting unit exceeds its carrying amount, including goodwill, goodwill is considered not to be impaired and no additional steps are necessary. If, however, the estimated fair value of the reporting unit is less than its carrying amount, including goodwill, then the second step is performed to compare the carrying amount of the goodwill with its implied fair value. If the carrying amount of goodwill exceeds the implied fair value of that goodwill, an impairment loss is recognized in an amount equal to the excess. The Company estimates fair value utilizing the projected discounted cash flow method and a discount rate determined by the Company to be commensurate with the risk inherent in its business model.
The Company performed its annual assessment of goodwill impairment as of the first day of the fourth quarter of 2013 and 2012, and determined that it was more likely than not that there was no impairment of goodwill and accordingly, no impairment of goodwill was recorded.
Long-Lived and Intangible Assets
The Company reports finite-lived, acquisition-related intangible assets at acquisition date fair value, net of accumulated amortization. Identifiable intangible assets are amortized on a straight-line basis over their estimated useful lives of three years, or one year, in the case of certain customer relationships. Straight-line amortization is used because no other pattern over which the economic benefits will be consumed can be reliably determined.
The Company reviews the carrying values of long-lived assets, including intangible assets, for possible impairment whenever events or changes in circumstances indicate that the related carrying amount may not be recoverable. In its analysis of other finite lived amortizable intangible assets, the Company applies the guidance of ASC 350-20,Intangibles – Goodwill and Other, in determining whether any impairment conditions exist. An impairment loss is recognized to the extent that the carrying amount exceeds the asset’s fair value. Intangible assets are attributable to the various developed technologies and client relationships of the businesses the Company has acquired. Long-lived assets to be disposed of are reported at the lower of carrying amount or estimated fair value less cost to sell.
Leases
The Company leases various facilities under agreements accounted for as operating leases. For leases that contain escalation or rent concessions provisions, management recognizes rent expense during the lease term on a straight-line basis over the term of the lease. The difference between rent paid and straight-line rent expense is recorded as a deferred rent liability in the accompanying consolidated balance sheets.
Revenue Recognition
The Company recognizes revenue for its services when all of the following criteria are satisfied:
| • | persuasive evidence of an arrangement exists; |
| • | services have been performed; |
| • | the selling price is fixed or determinable; and |
| • | collectability is reasonably assured. |
The Company recognizes revenue as the cost for the third-party media is incurred, which is upon delivery of marketing services for its clients. The Company recognizes revenue for its ReachSearch product as clicks are recorded on sponsored links on the various search engines and for its ReachDisplay and ReachRetargeting products when the display advertisements record impressions or as otherwise provided in its agreement with the applicable publisher. The Company recognizes revenue for ReachEdge, ReachCast and other products with a defined license or service period on a straight line basis over the applicable license or service period. The Company recognizes revenue when it charges set-up, management service or other fees on a straight-line basis over the term of the related campaign contract or the completion of any obligation for services, if shorter. Revenue from the Company’s ReachCommerce product consists of licensing and booking fees. Licensing fees are recognized on a straight line basis over the duration of the license, and booking fees are recognized as incurred.
When the Company receives advance payments from clients, it records these amounts as deferred revenue until the revenue is recognized. When the Company extends credit, it records a receivable when the revenue is recognized.
The Company offers incentives to clients in exchange for minimum commitments. In these circumstances, management estimates the amount of the incentives that will be earned by clients and adjusts the recognition of revenue to reflect such incentives. Estimates are either based upon a statistical analysis of previous campaigns for which such incentives were offered, or calculated on a straight line basis over the life of the campaign.
When the Company sells through agencies, it either receives payment in advance of services or in some cases extends credit. The Company pays each agency an agreed-upon commission based on the revenue it earns or cash it receives. Some agency clients who have been extended credit may offset the amount otherwise due to the Company by any commissions they have earned. Management evaluates whether it is appropriate to record the gross amount of campaign revenue or the net amount earned after commissions. As the Company is the primary party obligated in the arrangement, subject to the credit risk, with discretion over both price and media, management recognizes the gross amount of such sales as revenue and any commissions are recognized as a selling and marketing expense.
The Company also has a small number of resellers, including a franchisee. Resellers integrate the Company’s services, including ReachSearch, ReachDisplay, and TotalTrack, into their product offerings. In most cases, the resellers integrate with the Company’s technology platform through a custom Application Programming Interface (API). Resellers are responsible for the price and specifications of the integrated product offered to their clients. Resellers pay the Company in arrears, net of commissions and other adjustments. Management recognizes revenue generated under reseller agreements net of the agreed-upon commissions and other adjustments earned or retained by the reseller, as management believes that the reseller has retained sufficient control and bears sufficient risks to be considered the primary obligor in those arrangements.
The Company accounts for sales and similar taxes imposed on its services on a net basis in the consolidated statements of operations.
Cost of Revenue
Cost of revenue consists primarily of the cost of media acquired from third-party publishers. Media cost is classified as cost of revenue in the corresponding period in which revenue is recognized. From time to time, publishers offer the Company rebates based upon various factors and operating rules, including the amount of media purchased. Management records these rebates in the period in which they are earned as a reduction to cost of revenue and the corresponding payable to the applicable publisher, or as an other receivable, as appropriate. Cost of revenue also includes third-party telephone and information services costs, other third-party service provider costs, data center and third-party hosting costs, credit card processing fees, third-party content and other direct costs. In addition, cost of revenue includes costs to manage and operate our various solutions and technology infrastructure, other than costs associated with the Company’s sales force, which are reflected as selling and marketing expenses. Cost of revenue includes salaries, benefits, bonuses and stock-based compensation for the related staff, and allocated overhead such as depreciation expense, rent and utilities.
Selling and Marketing Expenses
Selling and marketing expenses consist primarily of personnel and related expenses for selling and marketing staff, including salaries and wages, commissions and other variable compensation, benefits, bonuses and stock-based compensation; travel and business costs; training, recruitment, marketing and promotional events; advertising; other brand building and product marketing expenses; and occupancy, technology and other direct overhead costs. A portion of the compensation for employees in the sales organization is based on commissions and other variable compensation. In addition, the cost of agency commissions is included in selling and marketing expenses.
Product and Technology Expenses
Product and technology expenses consist primarily of personnel and related expenses for product development and engineering professionals, including salaries, benefits, bonuses and stock-based compensation, and the cost of third-party contractors and certain other third-party service providers and other expenses, including occupancy, technology and other direct overhead costs. Technology operations costs, including related personnel and third-party costs, are included in product and technology expenses. The Company capitalizes a portion of its software development costs (Note 6) and, accordingly, includes amortization of those costs as costs of product and technology, as our technology platform and the Company’s other systems address all aspects of the Company’s activities, including supporting the selling and consultation process, online publisher integration, efficiencies and optimization, providing insight to clients into the results and effects of their online advertising campaigns and supporting all of the financial and other back-office functions of the business. Product and technology expenses also include the amortization of the technology obtained in acquisitions and the expenses of deferred payment obligations related to product and technology personnel. Product and technology costs do not include the costs to operate and deliver our solutions to clients, which are included in Cost of Revenue.
General and Administrative Expenses
General and administrative expenses consist primarily of personnel and related expenses for board, executive, legal, finance, human resources and corporate communications, including wages, benefits, bonuses and stock-based compensation, professional fees, insurance premiums and other expenses, including occupancy, technology and other direct overhead, public company costs and other corporate expenses.
Advertising Expenses
The Company expenses advertising as incurred. Advertising expense was $1.7 million, $1.1 million and $1.3 million for the years ended December 31, 2013, 2012 and 2011, respectively, and was recorded in sales and marketing expense in the Consolidated Statements of Operations.
Stock-Based Compensation
The Company accounts for stock-based compensation based on fair value. The Company follows the attribution method, which reduces current stock-based compensation expenses recorded by the effect of anticipated forfeitures. Management estimates forfeitures based upon its historical experience.
The fair value of each award is estimated on the date of the grant and amortized over the requisite service period, which is the vesting period. The Company uses the Black-Scholes option pricing model to estimate the fair value of stock option awards on the date of grant. Determining the fair value of stock option awards at the grant date under this model requires judgment, including estimating volatility, expected term and risk-free interest rate. The fair value of restricted stock and restricted stock unit awards is based on the closing market price of the Company's common stock on the date of grant. In addition, the Company uses a Monte Carlo simulation model to estimate the fair value of market-based performance-vesting restricted stock and restricted stock units. Determining the fair value of these awards at the grant date under this model requires judgment, including estimating volatility, risk-free rate and expected future stock price. The Company determines the probability of achievement of performance milestones for non-market based performance vesting restricted stock and restricted stock units, and recognize expense based on the fair value of the award if it is probable that the performance milestone will be achieved. The assumptions used in calculating the fair value of stock-based awards represent management’s estimate based on judgment and subjective future expectations. The assumptions used in calculating the fair value of stock-based awards represent management’s estimate based on judgment and subjective future expectations. These estimates involve inherent uncertainties. If any of the assumptions used in the Black-Scholes or Monte Carlo simulation models significantly change, stock-based compensation for future awards may differ materially from the awards granted previously.
Variable Interest Entities
In accordance with ASC 810,Consolidations, the applicable accounting guidance for the consolidation of variable interest entities (“VIE”), the Company analyzes its interests, including agreements, loans, guarantees, and equity investments, on a periodic basis to determine if such interests are variable interests. If variable interests are identified, then the related entity is assessed to determine if it is a VIE. The Company’s analysis includes both quantitative and qualitative reviews. The Company bases its quantitative analysis on the forecasted cash flows of the entity, and its qualitative analysis on the design of the entity, its organizational structure including its decision-making authority, and relevant agreements. If the Company determines that the entity is a VIE, the Company then assesses if it must consolidate the VIE as its primary beneficiary. The Company’s determination of whether it is the primary beneficiary is based upon qualitative and quantitative analyses, which assess the purpose and design of the VIE, the nature of the VIE’s risks and the risks that the Company absorbs, the power to direct activities that most significantly impact the economic performance of the VIE, and the obligation to absorb losses or the right to receive benefits that could be significant to the VIE (see Note 7, “Variable Interest Entities”, for more information).
Loan Receivable
The Company records loan receivables at carrying value, net of potential allowance for losses. Losses on receivables are recorded when probable and estimable. In the fourth quarter of 2013, the Company fully impaired the loan outstanding fromOxataSMB B.V. (“OxataSMB”), its Eastern European franchisee (see Note 7, “Variable Interest Entities” for more information). Interest income on loan receivables is accrued on a monthly basis over the life of the loan, and interest recognition is suspended upon impairment of loan principal.
Investments in Third Parties
The Company accounts for investments in third parties under the cost method, which is periodically assessed for other-than-temporary impairment. If the Company determines that an other-than-temporary impairment has occurred, it will write-down the investment to its fair value. The fair value of a cost method investment is not evaluated if there are no identified events or changes in circumstances that may have a significant adverse effect on the fair value of the investment. However, if such significant adverse events were identified, the Company would estimate the fair value of its cost method investment considering available information at the time of the event, such as current cash position, earnings and cash flow forecasts, recent operational performance and any other readily available data.
Common Stock Repurchase and Retirement
Common stock repurchased is retired, and the excess of the cost over the par value of the common shares repurchased is recorded to additional paid-in capital.
Net Income (Loss) Per Share
Basic net income (loss) per share is computed by dividing the net income (loss) for the period by the weighted average number of common shares outstanding during the period. Diluted net income (loss) per share is computed by dividing the net income (loss) for the period by the weighted average number of common and potential dilutive shares outstanding during the period, to the extent such shares are dilutive. Potential dilutive shares are composed of incremental common shares issuable upon the exercise of stock options, warrants and unvested restricted shares using the treasury stock method. The Company was in a net loss position for the years ended December 31, 2013, 2012 and 2011, and therefore the number of diluted shares was equal to the number of basic shares for each of these periods.
The following potentially dilutive securities have been excluded from the calculation of diluted net loss per common share as they would be anti-dilutive for the periods below (in thousands):
| | | Years Ended December 31, | |
| | | 2013 | | | 2012 | | | 2011 | |
Deferred stock consideration and unvested restricted stock | | | 216 | | | | 59 | | | | 185 | |
Stock options and warrant | | | 3,534 | | | | 6,336 | | | | 4,571 | |
| | | | 3,750 | | | | 6,395 | | | | 4,756 | |
Basic income (loss) from continuing operations per share is computed by dividing income from continuing operations for the period by the weighted average number of common shares outstanding during the period. Diluted income from continuing operations per share is computed by dividing income from continuing operations for the period by the weighted average number of common and potential dilutive shares outstanding during the period, to the extent such shares are dilutive.
The following table sets forth the computation of basic and diluted income from continuing operations per share (in thousands, except per share amounts):
| | | Years Ended December 31, | |
| | | 2013 | | | 2012 | | | 2011 | |
Numerator: | | | | | | | | | | | | |
Income (loss) from continuing operations | | $ | 3,051 | | | $ | 4,165 | | | $ | (4,126 | ) |
Denominator: | | | | | | | | | | | | |
Weighted average common shares used in computation of income (loss) from continuing operations per share | | | 27,764 | | | | 28,348 | | | | 28,974 | |
Deferred stock consideration and restricted stock | | | 199 | | | | 58 | | | | — | |
Stock options and warrants | | | 1,088 | | | | 490 | | | | — | |
| | | | | | | | | | | | | |
Weighted average common shares used in computation of income (loss) per share from continuing operations, diluted | | | 29,051 | | | | 28,896 | | | | 28,974 | |
| | | | | | | | | | | | | |
Income (loss) per share from continuing operations, basic | | $ | 0.11 | | | $ | 0.15 | | | $ | (0.14 | ) |
| | | | | | | | | | | | | |
Income (loss) per share from continuing operations, diluted | | $ | 0.10 | | | $ | 0.14 | | | $ | (0.14 | ) |
The following table sets forth the computation of basic and diluted loss from discontinued operations, net of income taxes, per share (in thousands, except per share amounts):
| | | Years Ended December 31, | |
| | | 2013 | | | 2012 | | | 2011 | |
Numerator: | | | | | | | | | | | | |
Loss from discontinued operations, net of income taxes | | $ | (5,534 | ) | | $ | (4,397 | ) | | $ | (6,215 | ) |
Denominator: | | | | | | | | | | | | |
Weighted average common shares used in computation of loss from discontinued operations, net of income taxes, per share | | | 27,764 | | | | 28,348 | | | | 28,974 | |
Deferred stock consideration and restricted stock | | | 199 | | | | 58 | | | | — | |
Stock options and warrants | | | 1,088 | | | | 490 | | | | — | |
| | | | | | | | | | | | | |
Weighted average common shares used in computation of income (loss) per share from continuing operations, diluted | | | 29,051 | | | | 28,896 | | | | 28,974 | |
| | | | | | | | | | | | | |
Loss per share from discontinued operations operations, net of income taxes, basic | | $ | (0.20 | ) | | $ | (0.16 | ) | | $ | (0.21 | ) |
| | | | | | | | | | | | | |
Loss per share from discontinued operations, net of income taxes, diluted | | $ | (0.19 | ) | | $ | (0.15 | ) | | $ | (0.21 | ) |
Income Taxes
The Company records income taxes using the asset and liability method which requires the recognition of deferred tax assets and liabilities for the expected future tax consequences of events that have been recognized in its financial statements or tax returns. In estimating future tax consequences, all expected future events other than enactments or changes in the tax law or rates are considered. Valuation allowances are provided when necessary to reduce deferred tax assets to the amount expected to be realized.
The Company records tax benefits for income tax positions only if it is “more-likely-than-not” to be sustained based solely on its technical merits as of the reporting date. Management considers many factors when evaluating and estimating tax positions and tax benefits, which may require periodic adjustments and which may differ from actual outcomes. The Company follows a comprehensive model for the financial statement recognition, measurement, presentation and disclosure of uncertain tax positions taken or expected to be taken in income tax returns. The Company’s policy is to recognize interest and penalties related to tax in income tax expense.
Recent Accounting Pronouncements
In July 2013, the Financial Accounting Standards Board (“FASB”) issued Accounting Standards Update No. 2013-11, Presentation of an Unrecognized Tax Benefit When a Net Operating Loss Carryforward, a Similar Tax Loss, or a Tax Credit Carryforward Exists. The amendments in this update require an unrecognized tax benefit, or a portion of an unrecognized tax benefit, to be presented in the financial statements as a reduction to a deferred tax asset for a net operating loss carryforward, a similar tax loss, or a tax credit carryforward, except as follows. To the extent a net operating loss carryforward, a similar tax loss, or a tax credit carryforward is not available at the reporting date under the tax law of the applicable jurisdiction to settle any additional income taxes that would result from the disallowance of a tax position or the tax law of the applicable jurisdiction does not require the entity to use, and the entity does not intend to use, the deferred tax asset for such purpose, the unrecognized tax benefit should be presented in the financial statements as a liability and should not be combined with deferred tax assets. The assessment of whether a deferred tax asset is available is based on the unrecognized tax benefit and deferred tax asset that exist at the reporting date and should be made presuming disallowance of the tax position at the reporting date. The amendments in this update do not require new recurring disclosures. The amendments in this update were effective for the Company as of January 1, 2014. Implementation of this update did not have a material impact on the Company’s consolidated financial statements.
3. Fair Value of Financial Instruments
The Company applies the fair value hierarchy for its financial instruments including cash and cash equivalents, and short term investments. Fair value is defined as the exchange price that would be received for an asset or paid to transfer a liability (an exit price) in the principal or most advantageous market for the asset or liability in an orderly transaction between market participants on the measurement date. Valuation techniques used to measure fair value maximize the use of observable inputs and minimize the use of unobservable inputs. The fair value hierarchy is based on three levels of inputs, of which the first two are considered observable and the last is considered unobservable, that are used to measure fair value:
| • | Level 1—Quoted prices in active markets for identical assets or liabilities. |
| • | Level 2—Inputs other than Level 1 that are observable, either directly or indirectly, such as quoted prices for similar assets or liabilities, quoted prices in markets that are not active, or other inputs that are observable or can be corroborated by observable market data for substantially the full term of the assets or liabilities. |
| • | Level 3—Unobservable inputs that are supported by little or no market activity and that are significant to the fair value of the assets or liabilities. The following table summarizes the basis used to measure certain of the Company’s financial assets that are carried at fair value (in thousands): |
| | | | | | | Basis of Fair Value Measurement | |
| | | Balance at December 31, 2013 | | | Quoted Prices in Active Markets for Identical Items (Level 1) | | | Significant Other Observable Inputs (Level 2) | | | Significant Unobservable Inputs (Level3) | |
Short-term investments | | $ | 545 | | | $ | 545 | | | $ | — | | | $ | — | |
Restricted certificates of deposit | | $ | 1,436 | | | $ | — | | | $ | 1,436 | | | $ | — | |
| | | | | | | Basis of Fair Value Measurement | |
| | | Balance at December 31, 2012 | | | Quoted Prices in Active Markets for Identical Items (Level 1) | | | Significant Other Observable Inputs (Level 2) | | | Significant Unobservable Inputs (Level3) | |
Short-term investments | | $ | 3,149 | | | $ | 3,149 | | | $ | — | | | $ | — | |
Restricted certificates of deposit | | $ | 1,226 | | | $ | — | | | $ | 1,226 | | | $ | — | |
The following table provides information about assets not carried at fair value in the Company’s Condensed Consolidated Balance Sheets (in thousands):
| | | December 31, 2013 | | | December 31, 2012 | |
| | | Carrying amount | | | Estimated fair value | | | Carrying amount | | | Estimated fair value | |
Loan receivable | | $ | — | | | $ | — | | | $ | 1,954 | | | $ | 1,954 | |
The OxataSMB loan receivable was not actively traded and its fair value was estimated based on valuation methodologies using current market interest rate data adjusted for inherent credit risk (see Note 7, “Variable Interest Entities”, for more information).
The Company also has an investment in a service provider that is a privately held partnership. The Company’s ownership is less than 20% and the Company does not have significant influence. The investment is accounted for under the cost method, which is periodically assessed for other-than-temporary impairment. If the Company determines that an other-than-temporary impairment has occurred, it will write-down the investment to its fair value. The fair value of a cost method investment is not evaluated if there are no identified events or changes in circumstances that may have a significant adverse effect on the fair value of the investment. However, if such significant adverse events were identified, the Company would estimate the fair value of its cost method investment considering available information at the time of the event, such as current cash position, earnings and cash flow forecasts, recent operational performance and any other readily available data. The carrying amount of the Company’s cost method investment was $2.5 million as of December 31, 2013, and is included in “Other assets” in the accompanying Condensed Consolidated Balance Sheet.
4. Acquisitions
Acquisition of RealPractice
On July 3, 2012, the Company acquired certain technology, advertisers and hired certain employees of RealPractice, Inc. (“RealPractice”). RealPractice provides the Company with a platform for building a marketing automation and lead conversion.
At closing, the Company paid $2.6 million in cash of the estimated $2.9 million purchase price. The remaining amount of $0.3 million was paid in cash on the 18-month anniversary of the closing date, on January 6, 2014. The Company also issued 150,292 restricted stock units to the hired employees, which are accounted for as stock-based compensation over the period in which they are earned. On January 6, 2014, the Company made the final deferred payment in connection with the RealPractice acquisition in the amount of $0.3 million.
The Company recorded acquired assets and liabilities at their respective fair values. The following table summarizes the fair value of acquired assets and liabilities (in thousands):
Assets acquired: | | | | |
Intangible assets | | $ | 2,550 | |
Goodwill | | | 317 | |
Other | | | 53 | |
Total assets acquired | | | 2,920 | |
Liabilities assumed: | | | | |
Deferred revenue | | | (20 | ) |
Total fair value of net assets acquired | | $ | 2,900 | |
Intangible assets acquired from RealPractice included customer relationships of $0.1 million and technology of $2.5 million, which are amortized over one and three years, their respective estimated useful lives, using the straight line method.
Acquisition costs in connection with the RealPractice acquisition was immaterial for the year ended December 30, 2012.
Acquisition of DealOn
On February 8, 2011, the Company acquired all of the outstanding member interests of DealOn, LLC (“DealOn”) for consideration of up to approximately $9.6 million in cash and stock. DealOn was a deal commerce company that operated in the United States and provided the Company with a deal commerce platform.
On the closing date, the Company paid $5.8 million in cash and issued 82,878 shares of its common stock, valued at $1.9 million based on fair value of the Company’s stock on the acquisition date. The balance of the purchase price of $2.0 million (the “DealOn Deferred Consideration”) was paid in cash of $1.5 million and in 21,297 shares of the Company’s common stock in 2012 and 2013. Pursuant to the terms of its 2011 acquisition of DealOn, on February 8, 2012, the Company made a deferred payment in the amount of $0.5 million, net of the working capital adjustment and certain other adjustments, and issued 10,649 shares of its common stock. On August 8, 2012, the Company made an additional deferred payment in the amount of $0.4 million and issued 5,324 shares of its common stock. On February 8, 2013, the Company made the final deferred payment in connection with the DealOn acquisition in the amount of $0.4 million and issued 5,324 shares of its common stock.
For purposes of determining the Company’s acquisition consideration, management discounted the DealOn Deferred Consideration to its then present value, or $1.9 million, and recorded this amount at the time of acquisition. The Company accrued interest on the deferred consideration originally recorded. The Company recorded the acquired assets and liabilities at their respective fair values. The following table summarizes the fair value of assets and liabilities acquired (in thousands):
Assets acquired: | | | | |
Intangible assets | | $ | 2,080 | |
Goodwill | | | 7,648 | |
Other | | | 59 | |
Total assets acquired | | | 9,787 | |
Liabilities assumed: | | | | |
Accounts payable and accrued expenses | | | (221 | ) |
Total fair value of net assets acquired | | $ | 9,566 | |
During 2011, the Company recorded a $0.8 million impairment charge to intangible assets related to customer relationships acquired in the DealOn acquisition. This impairment is recorded in Cost of Revenue and resulted from a diminution in value attributable to a change in the Company’s business strategy for ReachDeals and the elimination of its dedicated deal sales force. Revenue from the acquired legacy products and services are immaterial for the years ended December 31, 2012 and 2011, respectively.
The intangible assets acquired from DealOn included customer relationships of $1.2 million, developed technology of $0.6 million, and trademarks of $0.3 million.
In connection with the DealOn acquisition, the Company incurred approximately $0.4 million in costs that are reflected in general and administrative expense in the accompanying Consolidated Statements of Operations for the year ended December 31, 2011.
Acquisition of SMB:LIVE
On February 22, 2012, the Company paid $0.6 million in cash and issued 181,224 shares of its common stock as the final payment in connection with the acquisition of SMB:LIVE Corporation.
Intangible Assets
As of December 31, 2013, intangible assets from acquisitions included developed technology of $1.3 million (net of accumulated amortization of $1.8 million) amortized over three years. As of December 31, 2012, intangible assets from acquisitions included developed technology of $2.4 million (net of accumulated amortization of $2.9 million) amortized over three years, and customer relationships of $25,000 (net of accumulated amortization of $25,000) amortized over one year. Based on the current amount of intangibles subject to amortization, the estimated amortization expense over the remaining lives is as follows (in thousands):
Years Ending December 31, | | | | |
2014 | | $ | 853 | |
2015 | | | 417 | |
Total | | $ | 1,270 | |
For the years ended December 31, 2013, 2012 and 2011, amortization expense related to acquired intangibles was $1.2 million, $2.2 million and $2.3 million, respectively.
5. Property and Equipment
Property and equipment consisted of the following (in thousands):
| | | December 31, | |
| | | 2013 | | | 2012 | |
Computer hardware and software | | $ | 16,558 | | | $ | 13,279 | |
Office equipment | | | 1,981 | | | | 1,599 | |
Furniture and fixtures | | | 4,694 | | | | 4,234 | |
Leasehold improvements | | | 8,545 | | | | 5,656 | |
Assets not placed in service | | | 305 | | | | 177 | |
| | | | 32,083 | | | | 24,945 | |
Less: Accumulated depreciation and amortization | | | (19,180 | ) | | | (13,905 | ) |
| | | $ | 12,903 | | | $ | 11,040 | |
Depreciation expense for property and equipment was $5.5 million, $5.0 million and $3.2 million for the years ended December 31, 2013, 2012 and 2011, respectively.
6. Software Development Costs
Capitalized software development costs consisted of the following (in thousands):
| | | December 31, | |
| | | 2013 | | | 2012 | |
Capitalized software development costs | | $ | 42,538 | | | $ | 30,715 | |
Accumulated amortization | | | (25,238 | ) | | | (17,157 | ) |
Capitalized software development costs, net | | $ | 17,300 | | | $ | 13,558 | |
The Company recorded amortization expense of $8.1 million, $6.4 million and $4.7 million for the years ended December 31, 2013, 2012 and 2011, respectively. As of December 31, 2013 and 2012, $2.8 million and $2.9 million, respectively, of capitalized software development costs were related to projects still in process.
7. Variable Interest Entities
On July 6, 2012, the Company completed a transaction with OxataSMB, in which the Company entered into a franchise agreement with OxataSMB permitting OxataSMB to operate and resell the Company’s services under the ReachLocal brand in Slovakia, Czech Republic, Hungary, Poland and Russia. Pursuant to the franchise agreement, OxataSMB receives access to our technology platform, training, marketing and branding materials, media purchasing, campaign management and provisioning, sourcing of telephony, and technical support. The Company does not anticipate OxataSMB will pursue activities other than as a franchisee. In addition, the Company entered into a market development loan agreement with OxataSMB pursuant to which the Company agreed to provide financing to OxataSMB of up to €2.9 million ($3.7 million), of which €1.45 million ($1.9 million) was advanced in 2012. In August 2013, the Company advanced an additional €0.92 million ($1.2 million) to OxataSMB. The loan has a two-year term, maturing on June 29, 2014, and accrues interest at 4% per annum, but does not require principal or interest payments for the first two years, which may be extended over an additional 36 months based on achievement of certain milestones. Prior to advancement of the loan in 2012, OxataSMB had €1.45 million ($2.0 million) of contributed capital. In addition, the Company has an option to buy OxataSMB at an independently-determined fair value at the end of the initial loan term, subject to extension.
On December 31, 2013, the Company assessed the collectability of the loan and determined that it was likely that OxataSMB will be unable to repay it. Therefore, the full loan amount and accumulated interest receivable of $3.3 million was impaired and recorded in general and administrative expense in the Statement of Operations. The Company also determined that a receivable from OxataSMB of €1.2 million ($1.6 million) for Reach Search is also likely uncollectible and therefore, reserved the full amount of the receivable as bad-debt expense.The Company will still allow OxataSMB to use the Company’s platform, but will require media spend to be paid in advance until the past due receivables become current.
OxataSMB is considered a VIE with respect to the Company because, depending on its performance, OxataSMB may not have sufficient equity to finance its activities without additional financial support. Based on the Company’s initial assessment in 2012, the Company was not the primary beneficiary of OxataSMB because it did not have: (1) the power to direct the activities that most significantly impact OxataSMB’s economic performance or (2) the obligation to absorb losses of OxataSMB or the right to receive benefits from OxataSMB that could potentially be significant. Therefore, the Company did not consolidate the results of OxataSMB, and transactions with OxataSMB results were accounted for similarly to the Company’s resellers. At December 31, 2013, as a result of the impairment of the full amount of OxataSMB loan and accumulated interest receivable, and the reserve for the full amount of OxataSMB’s media receivable, the Company’s exposure to OxataSMB’s losses had increased, and therefore, the Company determined that a triggering event had occurred and decided to reassess OxataSMB’s status as a primary beneficiary. Based on its reassessment, the Company reaffirmed that the Company was not the primary beneficiary of OxataSMB and therefore, consolidation of its activities was not required.
8. Commitments and Contingencies
Operating Leases
The Company leases office facilities under operating lease agreements that expire at various dates through 2021. The terms of the majority of the Company’s lease agreements provide for rental payments on a graduated basis. The Company recognizes rent expense on a straight-line basis over the lease term.
Rental expense, principally for leased office space under operating lease commitments, was $11.9 million, $11.4 million and $9.7 million for the years ended December 31, 2013, 2012 and 2011, respectively.
As of December 31, 2013, future minimum payments under cancelable and non-cancelable operating leases are as follows (in thousands):
Years Ended December 31, | | | | |
2014 | | $ | 11,030 | |
2015 | | | 9,774 | |
2016 | | | 7,831 | |
2017 | | | 5,815 | |
2018 | | | 4,489 | |
Thereafter | | | 14,095 | |
| | | $ | 53,034 | |
Purchase Obligations
The Company has long-term purchase obligations outstanding with vendors, of which $3.5 million is due within a year, $14.9 million is due between 1 to 3 years, and $3.8 million is due between 3 to 5 years.
Letters of Credit and Restricted Certificates of Deposit
As of December 31, 2013 and 2012, the Company maintained letters of credit totaling $1.4 million and $1.2 million, respectively, to secure its obligations under facility operating lease agreements. The letters of credit are collateralized by restricted certificates of deposit and automatically renew for successive one-year periods over the duration of the lease term. As of December 31, 2013 and 2012, the Company was required to maintain cash reserve balances of at least $1.4 million and $1.2 million, respectively, to secure these letters of credit. These amounts were classified as restricted certificates of deposit in the accompanying Consolidated Balance Sheets.
Litigation
The Company is subject to various legal proceedings and claims arising in the ordinary course of business. Although occasional adverse decisions or settlements may occur, management believes that the final disposition of such matters will not have a material adverse effect on the Company’s financial position, results of operations or cash flows.
9. Stockholder’s Equity
Warrants
In November 2009, the Company issued a warrant to a consultant to purchase up to 15,000 shares of common stock at an exercise price of $10.91 per share, which expires in November 2014. As of December 31, 2013, the warrant was fully vested but unexercised.
Common Stock Repurchases
On November 4, 2011, the Company announced that its Board of Directors authorized the repurchase of up to $20.0 million of the Company’s outstanding common stock. On December 13, 2012, the Company announced the Board of Directors increased the total authorized repurchase amount by $6.0 million, to a total authorization of $26.0 million, and on March 4, 2013, the Company announced that its Board of Directors increased the total authorized repurchase amount by an additional $21.0 million, to a total authorization of $47.0 million. At December 31, 2013, the Company had executed repurchases of 3.4 million shares of its common stock under the program for an aggregate of $36.3 million, of which $18.9 million or 1.4 million shares were repurchased during the year ended December 31, 2013. Purchases may be made from time-to-time in open market or privately negotiated transactions as determined by the Company’s management. The amount and timing of the share repurchase will depend on business and market conditions, stock price, trading restrictions, acquisition activity, and other factors. The share repurchase program does not obligate the Company to acquire any particular amount of common stock, and the repurchase program may be suspended or discontinued at any time at the Company’s discretion.
Shares Reserved For Future Issuance
The following table shows the number of shares of common stock reserved for future issuance as of December 31, 2013 (in thousands):
Stock options | | | 7,218 | |
Restricted stock units | | | 599 | |
Warrants | | | 15 | |
Deferred compensation | | | 17 | |
| | | | 7,849 | |
10. Stock-Based Compensation
Stock Option Plans
On April 21, 2004, the Company adopted the 2004 Stock Plan (the “2004 Plan”), as amended. Grants under the 2004 Plan may be incentive stock options or nonqualified stock options or awards. The 2004 Plan is administered by the Company’s board of directors, which has the authority to designate participants and determine the number and type of awards to be granted, the time at which awards are exercisable, the method of payment and any other terms or conditions of the awards. The vesting of these awards varies subject to the participant’s period of future service, or otherwise at the discretion of the Company’s board of directors. The majority of awards vest over four years and have a term of 10 years. There were no shares available for grant under the 2004 Plan as of December 31, 2013 and 2012.
On July 1, 2008, the Company adopted the 2008 Stock Incentive Plan (the “2008 Plan”) and retired the 2004 Plan. Options outstanding under the 2004 Plan are unaffected by the retirement of the 2004 Plan. The aggregate number of shares of the Company’s common stock available for issuance pursuant to awards granted under the 2008 Plan is equal to the sum of (x) 5,471,350 plus (y) any shares of the Company’s common stock subject to awards under the 2004 Plan that terminate, expire or lapse for any reason or are settled in cash after the date the 2008 Plan originally became effective, and (z) an annual increase in shares on the first day of each year beginning in 2011 and ending in 2018. The annual increase will be equal to the lesser of (A) 2,500,000 shares (as adjusted for stock splits, stock combinations, stock dividends and similar matters), (B) 4.5% of the Company’s common stock outstanding on the last day of the prior year or (C) such smaller number of shares as may be determined by the Board. The 2008 Plan is administered by the Company’s Compensation Committee, which has the authority to designate participants and determine the number and type of awards to be granted, the time at which awards are exercisable, the method of payment and any other terms or conditions of the awards. The vesting of these awards vary subject to the participant’s period of future service, or otherwise at the discretion of the Compensation Committee. The majority of awards issued under the 2008 Plan vest over four years and have a term of seven years. There were 484,540 shares available for grant under the 2008 Plan as of December 31, 2013. On January 1, 2014, an additional 1,271,655 shares were added to the pool under the evergreen provision.
Stock Options
The following table summarizes stock option activity (in thousands, except years and per share amounts):
| | | Number of Shares | | | Weighted Average Exercise Price per Share | | | Weighted Average Remaining Contractual Life (in years) | | | Aggregate Intrinsic Value | |
| | | | | | | | | | | | | | | | | |
Outstanding at December 31, 2012 | | | 7,052 | | | $ | 10.71 | | | | | | | | | |
| | | �� | | | | | | | | | | | | | | |
Granted | | | 1,248 | | | $ | 13.26 | | | | | | | | | |
Exercised | | | (877 | ) | | $ | 7.62 | | | | | | | | | |
Forfeited | | | (690 | ) | | $ | 11.90 | | | | | | | | | |
| | | | | | | | | | | | | | | | | |
Outstanding at December 31, 2013 | | | 6,733 | | | $ | 11.44 | | | | 4.2 | | | $ | 11,626 | |
| | | | | | | | | | | | | | | | | |
Vested and exercisable at December 31, 2013 | | | 4,377 | | | $ | 11.18 | | | | 3.3 | | | $ | 8,808 | |
| | | | | | | | | | | | | | | | | |
Unvested at December 31, 2013, net of estimated forfeitures | | | 2,223 | | | $ | 11.90 | | | | 5.9 | | | $ | 2,738 | |
The assumptions utilized for purposes of the Black-Scholes pricing model are summarized as follows:
| • | Volatility—As the Company has limited trading history for its common stock, the expected stock price volatility was estimated by taking a combination of 1) the median historic price volatility for industry peers based on daily price observations over a period equivalent to the expected term of the stock option grants and 2) the Company’s own historic price volatility based on daily price observations since May 2010. Industry peers consist of several public companies in the technology industry similar in size, stage of life cycle and financial leverage. Management did not rely on implied volatilities of traded options in its industry peers’ common stock because the volume of activity was relatively low. |
| • | Expected term—The expected term was estimated using the simplified method allowed under Securities and Exchange Commission Staff Accounting Bulletin No. 107,Share-Based Payment. Management uses this method because it has limited historical data to estimate future terms and it is unable to obtain objective, measurable and comparative historical data of comparable companies. |
| • | Risk free rate—The risk free interest rate is based on the yields of U.S. Treasury securities with maturities similar to the expected term of the options for each option group. |
| • | Dividend yield—The Company has never declared or paid any cash dividends and does not presently plan to pay cash dividends in the foreseeable future. Consequently, management used an expected dividend yield of zero. |
In addition, management estimates the forfeiture rate based on its historical experience with forfeitures and reviews estimated forfeiture rates each period-end, and makes changes as factors affecting the forfeiture rate calculations and assumptions change.
The following table summarizes the weighted average assumptions used to estimate the fair value of stock options granted during the years ended December 31, 2013, 2012 and 2011.
| | | Years Ended December 31, | |
| | | 2013 | | | 2012 | | | 2011 | |
Expected dividend yield | | | 0 | % | | | 0 | % | | | 0 | % |
Risk-free interest rate | | | 0.95 | % | | | 0.74 | % | | | 1.88 | % |
Expected life (in years) | | | 4.81 | | | | 4.86 | | | | 4.75 | |
Expected volatility | | | 59 | % | | | 60 | % | | | 57 | % |
Weighted average fair value per share | | $ | 6.33 | | | $ | 6.10 | | | $ | 9.65 | |
The aggregate intrinsic value of stock options exercised during the years ended December 31, 2013, 2012 and 2011 were $5.3 million, $1.9 million and $14.2 million, respectively. The total grant-date fair value of shares vested during the years ended December 31, 2013, 2012 and 2011 were $4.2 million, $2.0 million and $6.1 million, respectively.
The options outstanding and vested and exercisable as of December 31, 2013 have been segregated into ranges for additional disclosure as follows (number of options in thousands):
| | | | | | | | | | | | | | Options Outstanding | | | Options Vested and Exercisable | |
| |
Range of Exercise Prices (in dollars) | | | Number | | | Weighted Average Remaining Contractual Life (in years) | | | Weighted Average Exercise Price | | | Number | | | Weighted Average Exercise Price | |
| | $ | 0.00 | - | 5.00 | | | | | | | | | | 154 | | | | 2.11 | | | $ | 0.47 | | | | 154 | | | $ | 0.47 | |
| | $ | 5.01 | - | 10.00 | | | | | | | | | | 1,361 | | | | 5.00 | | | $ | 8.48 | | | | 840 | | | $ | 8.70 | |
| | $ | 10.01 | - | 15.00 | | | | | | | | | | 4,887 | | | | 4.00 | | | $ | 12.09 | | | | 3,112 | | | $ | 11.66 | |
| | $ | 15.01 | - | 20.00 | | | | | | | | | | 205 | | | | 5.16 | | | $ | 16.96 | | | | 155 | | | $ | 17.02 | |
| | $ | 20.01 | - | 25.00 | | | | | | | | | | 113 | | | | 4.13 | | | $ | 22.21 | | | | 107 | | | $ | 22.27 | |
| | $ | 25.01 | - | 30.00 | | | | | | | | | | 13 | | | | 4.32 | | | $ | 25.51 | | | | 9 | | | $ | 25.51 | |
| | | | | | | | | | | | | | | 6,733 | | | | 4.20 | | | $ | 11.44 | | | | 4,377 | | | $ | 11.18 | |
Stock Option Exchange
On May 29, 2012, the Company commenced an offer to exchange options to purchase shares of its common stock with an exercise price equal to or greater than $10.91 per share or, for the Company’s executive officers subject to Section 16 of the Securities Exchange Act of 1934, as amended (“executive officers”), $16.71 per share, for replacement options to purchase a lesser number of shares of common stock having an exercise price equal to the fair market value of the Company’s common stock on the replacement grant date, or for replacement options issued to the Company’s executive officers, an exercise price equal to the greater of the fair market value of the Company’s common stock on the replacement grant date or $13 per share.
The stock option exchange closed on June 25, 2012. All exchanged options were cancelled at that time and immediately thereafter, the Company granted replacement options under the Amended and Restated ReachLocal 2008 Stock Incentive Plan. Employees other than executive officers received options covering an aggregate of 158,752 shares, each with an exercise price of $10.56, which was the closing price of the Company’s common stock on the NASDAQ Global Select Market on June 25, 2012, and executive officers received options covering an aggregate of 396,998 shares, each with an exercise price of $13.00. After cancelling exchanged options to purchase an aggregate of 834,875 shares and granting replacement options to purchase an aggregate of 555,750 shares, the Company’s total number of shares subject to outstanding stock options was reduced by 279,125 shares.
The fair value of the replacement options granted was measured as the total of the unrecognized compensation cost of the original options exchanged plus any incremental compensation cost of the replacement options. The incremental compensation cost of the replacement options was measured as the excess of the fair value of the replacement options over the fair value of the exchanged options immediately before cancellation. The total remaining unrecognized compensation expense related to the exchanged options and the incremental compensation cost of the replacement options will be recognized over the four-year vesting period of the replacement options. The incremental compensation expense of the replacement options was immaterial.
Restricted Stock and Restricted Stock Units
The Company may issue restricted stock and restricted stock units in conjunction with acquisitions and long-term employee incentive programs. These shares of restricted stock and restricted stock units have vesting periods of 4 years. Stock-based compensation expense related to restricted stock units was $3.0 million, $1.7 million and $0.7 million for the years ended December 31, 2013, 2012, and 2011, respectively.
The following table summarizes restricted stock and restricted stock unit awards (in thousands, except per share amounts):
| | | Number of shares | | | Weighted Average Grant Date Fair Value | |
Unvested at December 31, 2012 | | | 382 | | | $ | 11.09 | |
Granted | | | 1,054 | | | $ | 11.50 | |
Forfeited | | | (139 | ) | | $ | 7.57 | |
Vested | | | (140 | ) | | $ | 10.94 | |
Unvested at December 31, 2013 | | | 1,157 | | | $ | 9.44 | |
Grants during 2013 included 506,000 market-based performance-vesting shares of restricted stock and restricted stock units that will each vest based on achievement of both Company stock price targets and continued service. The grant date fair value of these awards was estimated using a Monte Carlo simulation model and was $5.52 per share. On November 7, 2013, 363,000 of these awards were granted additional vesting conditions such that vesting would also be based on service period, and the fair value of these awards were determined based on appropriate accounting guidance. In addition, 30,000 performance-vesting shares of restricted stock were granted during the period that would have vested based on achievement of certain business performance milestones. The grant date fair value of this award based on the Company’s closing stock price on that date was $13.45 per share and expense would have been recognized based on the achievement of the business performance milestones. At December 31, 2013, the performance condition was not met and the Company determined that it was not probable that the performance condition would be achieved, and therefore, no expense was recorded. In January 2014, however, the entire award was cancelled as the performance milestones were no longer achievable due to changes in business strategy.
Stock-based compensation expense
The Company records stock-based compensation expense, net of amounts capitalized, as stock-based compensation in association with software development costs. The following table summarizes stock-based compensation (in thousands):
| | | Years Ended December 31, | |
| | | 2013 | | | 2012 | | | 2011 | |
Stock-based compensation | | $ | 11,948 | | | $ | 9,695 | | | $ | 9,682 | |
Less: Capitalized stock-based compensation | | | 443 | | | | 226 | | | | 1,144 | |
Stock-based compensation expense, net | | $ | 11,505 | | | $ | 9,469 | | | $ | 8,538 | |
Stock-based compensation, net of capitalization, is included in the accompanying consolidated statements of operations, within the following captions (in thousands):
| | | Years Ended December 31, | |
| | | 2013 | | | 2012 | | | 2011 | |
Stock-based compensation expense, net | | | | | | | | | | | | |
Cost of revenue | | $ | 697 | | | $ | 258 | | | $ | 200 | |
Selling and marketing | | | 3,040 | | | | 1,756 | | | | 1,402 | |
Product and technology | | | 627 | | | | 1,194 | | | | 1,387 | |
General and administrative | | | 7,141 | | | | 6,261 | | | | 5,549 | |
| | | $ | 11,505 | | | $ | 9,469 | | | $ | 8,538 | |
Stock-based compensation for the year ended December 31, 2013 included $1.3 million of expense related to the modification and acceleration of certain unvested stock options and restricted stock pursuant to the separation agreements between the Company and its former Chief Executive Officer, and between the Company and its former President.
As of December 31, 2013, there was $23.5 million of unrecognized stock-based compensation related to restricted stock, restricted stock units and outstanding stock options, net of estimated forfeitures. This amount is expected to be recognized over a weighted average period of 1.4 years. Future stock-based compensation expense for these awards may differ in the event actual forfeitures deviate from management’s estimates.
11. Income Taxes
The components of income (loss) from continuing operations before income taxes were (in thousands):
| | | Years Ended December 31, | |
| | | 2013 | | | 2012 | | | 2011 | |
United States | | $ | 25,044 | | | $ | 16,679 | | | $ | (1,689 | ) |
Foreign | | | (18,294 | ) | | | (11,174 | ) | | | (1,702 | ) |
| | | $ | 6,750 | | | $ | 5,505 | | | $ | (3,391 | ) |
The provision for income taxes for the years ended December 31, 2013, 2012 and 2011, consists primarily of federal, state and foreign income taxes payable in the various jurisdictions in which the Company operates.
Significant components of the provision for income taxes are as follows (in thousands):
| | | Years Ended December 31, | |
| | | 2013 | | | 2012 | | | 2011 | |
Current: | | | | | | | | | | | | |
Federal | | $ | 5,687 | | | $ | — | | | | — | |
State | | | 1,134 | | | | 957 | | | $ | 205 | |
Foreign | | | 378 | | | | 171 | | | | 345 | |
| | | | 7,199 | | | | 1,128 | | | | 550 | |
Deferred: | | | | | | | | | | | | |
Federal | | | (930 | ) | | | 6,704 | | | | 509 | |
State | | | (4,048 | ) | | | 1,097 | | | | 769 | |
Foreign | | | (8,884 | ) | | | (3,634 | ) | | | (1,618 | ) |
| | | | (13,862 | ) | | | 4,167 | | | | (340 | ) |
Valuation allowance | | | 10,362 | | | | (3,955 | ) | | | 525 | |
Income tax provision | | $ | 3,699 | | | $ | 1,340 | | | $ | 735 | |
Income taxes payable as of December 31, 2013 and 2012 amounted to $0.9 million and $0.5 million, respectively, and were classified within “Other current liabilities” in the accompanying Consolidated Balance Sheets.
The provision for income taxes differs from the amount computed by applying the federal statutory income tax rate to income before income taxes as follows (in thousands):
| | | Years Ended December 31, | |
| | | 2013 | | | 2012 | | | 2011 | |
Income tax expense (benefit) at the federal statutory rate | | $ | 2,295 | | | $ | 1,792 | | | $ | (1,153 | ) |
State income tax, net of federal tax benefit | | | (1,923 | ) | | | 1,356 | | | | 643 | |
Foreign income taxes, net | | | (3,841 | ) | | | 578 | | | | (43 | ) |
Non-deductible stock-based compensation | | | 1,149 | | | | 75 | | | | 398 | |
Research and development credits | | | (2,629 | ) | | | — | | | | — | |
Change in valuation allowance | | | 7,887 | | | | (1,480 | ) | | | 525 | |
Deferred tax adjustments | | | 617 | | | | — | | | | — | |
Other | | | 144 | | | | (981 | ) | | | 365 | |
| | | $ | 3,699 | | | $ | 1,340 | | | $ | 735 | |
The components of deferred income tax assets and liabilities are as follows (in thousands):
| | | December 31, | |
| | | 2013 | | | 2012 | |
Deferred tax assets: | | | | | | | | |
Accruals and provisions | | $ | 3,513 | | | $ | 3,785 | |
Intangible assets | | | 382 | | | | 404 | |
State taxes | | | 309 | | | | 325 | |
Stock options | | | 4,396 | | | | 2,475 | |
Federal and state credits | | | 2,426 | | | | — | |
Net operating loss carryforward | | | 17,001 | | | | 8,140 | |
Gross deferred tax assets | | | 28,027 | | | | 15,129 | |
Less: valuation allowance | | | (16,774 | ) | | | (8,947 | ) |
Net deferred tax assets | | | 11,253 | | | | 6,182 | |
Deferred tax liabilities: | | | | | | | | |
Capitalized software | | | (7,066 | ) | | | (4,024 | ) |
Fixed assets | | | (1,084 | ) | | | (2,555 | ) |
Net deferred tax asset (liabilities) | | $ | 3,103 | | | $ | (397 | ) |
In the accompanying Consolidated Balance Sheet, the current portion of net deferred tax assets is included in “Deferred tax assets” and the non-current portion of deferred tax assets is included in “Other assets”. The non-current portion of net deferred tax liabilities from 2012 is included in “Deferred rent and other liabilities” in the accompanying Consolidated Balance Sheet.
The following table summarizes the Company’s net operating loss carry-forwards as of December 31, 2013:
Net operating loss: | | Balance at December 31, 2013 (in thousands) | | Beginning Expiration Year |
| | | | | | |
State | | $ | 10,933 | | Various jurisdictions from 2020 to 2030 |
Foreign | | $ | 47,543 | | Generally do not expire, but are subject to certain limitations |
The federal NOL and research and development credit carryforwards per the income tax returns filed included unrecognized tax benefits taken in prior years. According to the application of ASC 740, they are larger than the NOLs for which a deferred tax asset is recognized for financial statement purposes.
As of December 31, 2013, we had gross federal and state research and development credit carryforwards of approximately $3.8 million and $2.8 million, respectively. The federal carryovers begin to expire in 2029, while the state carryovers have an indefinite carryover period.
As of December 31, 2013, we also had gross California Enterprise Zone Credits of $1.1 million which begin to expire in 2024.
As a result of certain realization requirements of ASC 718, the table of deferred tax assets and liabilities shown above does not include certain deferred tax assets as of December 31, 2013 and December 31, 2012 that arose directly from tax deductions related to equity compensation greater than the amount of compensation recognized for financial reporting. Equity will be increased by $2.1 million if and when such deferred tax assets are ultimately realized. The Company uses ASC 740 ordering when determining when excess benefits have been utilized.
For the years ended December 31, 2013 and 2012, the Company recorded valuation allowances of $16.8 million and $8.9 million, respectively. In 2013, the net valuation allowance increased by $7.9 million primarily due to deferred tax assets associated with net operating losses in foreign jurisdictions, offset by the release of the valuation allowance associated with U.S. net deferred tax assets. During 2013, management reevaluated the Company’s need for the full valuation allowance previously recorded against its U.S. and foreign deferred tax assets and concluded it is more likely than not that all of its U.S. deferred tax assets will be realized. Management’s decision to release the valuation on the Company’s U.S. deferred tax assets was due to, among other reasons, cumulative profits in recent years as well as forecasted profits in this jurisdiction. Due to historic cumulative losses in certain foreign jurisdictions, management has concluded that a full valuation against its foreign deferred tax assets is still warranted.
In 2012, the net valuation allowance decreased by $4.0 million, primarily due to the utilization of net operating losses in certain U.S. and foreign jurisdictions. In 2011, the net valuation allowance increased by $3.0 million due in part to the generation of additional deferred tax assets associated with net operating losses in certain U.S. and foreign jurisdictions.
U.S. income and foreign withholding taxes have not been recognized on the excess of the amount for financial reporting over the tax basis of investments in foreign subsidiaries in the amount of $5.2 million that are essentially permanent in duration. This amount becomes taxable upon a repatriation of assets from a subsidiary or a sale or liquidation of a subsidiary. Deferred income taxes on these earnings have not been provided because these amounts are expected to be reinvested indefinitely outside of the U.S. Determination of the amount of any unrecognized deferred income tax liability on this temporary difference is not practicable because of the complexities of the hypothetical calculation.
At December 31, 2013, the Company had gross unrecognized tax benefits of approximately $1.7 million. Of this total, approximately $1.6 million would affect the Company’s effective tax rate if recognized. The Company classifies liabilities for unrecognized tax benefits for which it does not anticipate payment or receipt of cash within one year in non-current other liabilities.
A reconciliation of the beginning and ending amounts of gross unrecognized tax benefits is as follows (in thousands):
| | | December 31, | |
| | | 2013 | | | 2012 | | | 2011 | |
Unrecognized tax benefits – beginning balance | | $ | 824 | | | $ | 824 | | | $ | 785 | |
Gross increases – tax positions taken in prior period | | | 642 | | | | — | | | | 39 | |
Gross increases– tax positions taken in current period | | | 234 | | | | — | | | | — | |
Unrecognized tax benefits – ending balance | | $ | 1,700 | | | $ | 824 | | | $ | 824 | |
The Company does not expect significant changes to the unrecognized tax benefits in the next 12 months.
The Company recognizes interest and penalties related to uncertain tax positions in income tax expense. Related to the unrecognized tax benefits noted above, the Company accrued no additional interest or penalties during 2013 and in total, as of December 31, 2013, has recognized a liability for interest and penalties of $0.1 million.
The Company and its subsidiaries file income tax returns in the U.S. federal, various state and foreign jurisdictions. With the use of net operating losses in recent periods and the filing in additional states, certain statutes will begin to expire as early as 2016, but the majority remain open at this time.
12. 401(k) Plan
In February 2007, the Company established a defined contribution savings plan under Section 401(k) of the Internal Revenue Code. The plan is available to all full-time employees and allows participants to defer a portion of their annual compensation on a pre-tax basis. The Company may contribute to the plan at the discretion of its board of directors. No contributions have been made to the plan during the years ended December 31, 2013, 2012 and 2011.
13. Segment Information
The Company operates in one operating segment. The Company’s chief operating decision maker (“CODM”) manages the Company’s operations on a consolidated basis for purposes of evaluating financial performance and allocating resources.
Revenue by geographic region with respect to the Direct Local channel and National Brands is based on the physical location of the sales office, and with respect to Agencies and Resellers, is based on the physical location of the agency or reseller. The following summarizes revenue by geographic region (in thousands):
| | | Years Ended December 31, | |
| | | 2013 | | | 2012 | | | 2011 | |
Revenue: | | | | | | | | | | | | |
North America | | $ | 341,737 | | | $ | 327,124 | | | $ | 289,249 | |
International | | | 172,333 | | | | 127,833 | | | | 85,992 | |
| | | $ | 514,070 | | | $ | 454,957 | | | $ | 375,241 | |
Long Lived Assets: | | | | | | | | | | | | |
North America | | $ | 5,896 | | | $ | 6,369 | | | | | |
International | | | 7,168 | | | | 4,696 | | | | | |
| | | $ | 13,064 | | | $ | 11,065 | | | | | |
The results of the Australia geographic region have been included in the Company’s consolidated financial statements and include revenues of $85.0 million, $72.6 million, and $56.2 million in 2013, 2012 and 2011, respectively. Long-lived assets of the Australia geographic region were $2.3 million and $1.7 million at December 31, 2013 and 2012, respectively.
14. Discontinued Operations
ClubLocal
The Company performed a strategic review of this business and concluded that ClubLocal was no longer core to the Company’s strategy. In the fourth quarter of 2013, the Company’s Board of Directors approved a plan to dispose of the Company’s ClubLocal business, and on February 18, 2014, the Company completed the contribution of its ClubLocal business to a new entity (see Note 16, “Subsequent Events,” for more information). This business has been accounted for as discontinued operations for all periods presented. Long-lived assets of ClubLocal to be disposed of include software development costs of $3.0 million and property, plant, and equipment of $0.2 million.
Bizzy
On November 1, 2011, the Company announced that it would wind down the operations of Bizzy and determined that Bizzy would be considered a discontinued operation as of the third quarter of 2011. In connection with this decision, the Company recorded a charge of $4.0 million in 2011 to reflect the impairment of capitalized software development costs, personnel and severance costs, operating losses, facilities and other costs.
The net sales and loss before income taxes from the discontinued operations consisted of the following:
| | | Years Ended December 31, | |
| | | 2013 | | | 2012 | | | 2011 | |
| | | | | | | | | | | | | |
Net sales | | $ | 1,108 | | | $ | 397 | | | $ | — | |
Loss before income taxes | | $ | (8,570 | ) | | $ | (4,583 | ) | | $ | (6,215 | ) |
15. Quarterly Information (Unaudited)
The following table sets forth unaudited and quarterly financial data for the four quarters of each of 2013 and 2012. As a result of the disposal of the Company’s ClubLocal business and the winding down of the operations of Bizzy, management has reclassified and presented all related historical financial information as “discontinued operations” in the following Consolidated Statements of Operations.
| | | Dec 31, 2013 | | | Sept 30, 2013 | | | June 30, 2013 | | | Mar 31, 2013 | | | Dec 31, 2012 | | | Sept 30, 2012 | | | June 30, 2012 | | | Mar 31, 2012 | |
Revenue | | $ | 132,893 | | | $ | 132,813 | | | $ | 126,757 | | | $ | 121,607 | | | $ | 120,045 | | | $ | 118,720 | | | $ | 112,189 | | | $ | 104,003 | |
Cost of revenue | | $ | 65,662 | | | $ | 66,083 | | | $ | 63,599 | | | $ | 61,106 | | | $ | 59,411 | | | $ | 59,171 | | | $ | 55,529 | | | $ | 52,371 | |
Income from continuing operations | | $ | 728 | | | $ | 650 | | | $ | 1,321 | | | $ | 352 | | | $ | 893 | | | $ | 2,273 | | | $ | 1,285 | | | $ | (286 | ) |
Loss from discontinued operations, net of income taxes | | $ | (1,313 | ) | | $ | (1,772 | ) | | $ | (1,462 | ) | | $ | (987 | ) | | $ | (1,287 | ) | | $ | (1,473 | ) | | $ | (953 | ) | | $ | (720 | ) |
Net income (loss) | | $ | (585 | ) | | $ | (1,122 | ) | | $ | (141 | ) | | $ | (635 | ) | | $ | (394 | ) | | $ | 836 | | | $ | 332 | | | $ | (1,006 | ) |
| | | | | | | | | | | | | | | | | | | | | | | | | | | | | | | | | |
Net income (loss) per share: | | | | | | | | | | | | | | | | | | | | | | | | | | | | | | | | |
| | | | | | | | | | | | | | | | | | | | | | | | | | | | | | | | | |
Basic: | | | | | | | | | | | | | | | | | | | | | | | | | | | | | | | | |
Income (loss) from continuing operations | | $ | 0.03 | | | $ | 0.02 | | | $ | 0.05 | | | $ | 0.01 | | | $ | 0.03 | | | $ | 0.08 | | | $ | 0.05 | | | $ | (0.01 | ) |
Loss from discontinued operations, net of income taxes | | $ | (0.05 | ) | | $ | (0.06 | ) | | $ | (0.05 | ) | | $ | (0.04 | ) | | $ | (0.04 | ) | | $ | (0.05 | ) | | $ | (0.03 | ) | | $ | (0.02 | ) |
Net income (loss) per share | | $ | (0.02 | ) | | $ | (0.04 | ) | | $ | (0.01 | ) | | $ | (0.02 | ) | | $ | (0.01 | ) | | $ | 0.03 | | | $ | 0.01 | | | $ | (0.03 | ) |
| | | | | | | | | | | | | | | | | | | | | | | | | | | | | | | | | |
Diluted: | | | | | | | | | | | | | | | | | | | | | | | | | | | | | | | | |
Income (loss) from continuing operations | | $ | 0.03 | | | $ | 0.02 | | | $ | 0.04 | | | $ | 0.01 | | | $ | 0.03 | | | $ | 0.08 | | | $ | 0.04 | | | $ | (0.01 | ) |
Loss from discontinued operations, net of income taxes | | $ | (0.05 | ) | | $ | (0.06 | ) | | $ | (0.05 | ) | | $ | (0.04 | ) | | $ | (0.04 | ) | | $ | (0.05 | ) | | $ | (0.03 | ) | | $ | (0.02 | ) |
Net income (loss) per share | | $ | (0.02 | ) | | $ | (0.04 | ) | | $ | (0.01 | ) | | $ | (0.02 | ) | | $ | (0.01 | ) | | $ | 0.03 | | | $ | 0.01 | | | $ | (0.03 | ) |
16. Subsequent Events
On February 18, 2014, the Company closed a transaction in which it transferred its ClubLocal business to a new entity in exchange for a minority equity interest. The other equity owners of the new entity include Groupon, Inc., which led a $7.5 million financinground that closed concurrently, and a group of financial and operating investors including former officers and founders of ReachLocal, Inc., Zorik Gordon and Michael Kline.
On January 30, 2014, the Company’s board of directors authorized a plan to reduce the Company’s North American workforce and realestate obligations and delegated authority to the Company’s management to determine specific actions with respect to such plan. On February 7, 2014, the Company implemented the restructuring plan, which will be substantially completed during the first quarter of 2014 and fully completed by year end.
The Company estimates it will incur approximately $1.5 million to $2.5 million in total restructuring charges, of which approximately $1.4 million to $2.0 million are expected to result in future cash expenditures. These first quarter costs will consist of severance and other employee-related costs (approximately $0.4 million to $0.5 million), lease and contract termination costs (approximately $1.0 million to $1.5 million), and other costs (approximately $0.1 million to $0.5 million).
EXHIBITINDEX
Exhibit No. | | Description of Document |
| |
3.01 | | Amended and Restated Certificate of Incorporation of ReachLocal, Inc., dated May 19, 2010 (incorporated by reference to Exhibit 3.01 of the Company’s Annual Report on Form 10-K for the year ended December 31, 2010 (File No. 001-34749) filed with the SEC on March 28, 2011) |
| |
3.02 | | Amended and Restated Bylaws of ReachLocal, Inc. (incorporated by reference to Exhibit 3.02 of the Company’s Annual Report on Form 10-K for the year ended December 31, 2010 (File No. 001-34749) filed with the SEC on March 28, 2011) |
| |
4.01 | | Form of ReachLocal, Inc. Common Stock Certificate (incorporated by reference to Exhibit 4.01 of the Company’s Amendment No. 3 to the Registration Statement on Form S-1 (File No. 333-163905) filed with the SEC on April 27, 2010) |
| |
4.02 | | Second Amended and Restated Investors’ Rights Agreement, by and among ReachLocal, Inc., the Investors listed on Exhibit A, Exhibit B, Exhibit C and Exhibit D thereto, and the Founders listed on Exhibit E thereto, dated as of September 17, 2007 and as amended as of July 1, 2008, May 14, 2009, and May 18, 2009 (incorporated by reference to Exhibit 4.02 of the Company’s Amendment No. 1 to the Registration Statement on Form S-1 (File No. 333-163905) filed with the SEC on February 2, 2010) |
| |
4.03 | | Stockholders Agreement, by and between ReachLocal, Inc. and NetUs Pty Limited ACN 117 674 030, dated as of September 11, 2009 (incorporated by reference to Exhibit 4.03 of the Company’s Amendment No. 1 to the Registration Statement on Form S-1 (File No. 333-163905) filed with the SEC on February 2, 2010) |
| | |
10.01* | | Form of Indemnification Agreement for Directors and Executive Officers (incorporated by reference to Exhibit 10.01 of the Company’s Annual Report on Form 10-K for the year ended December 31, 2012 (File No. 001-34749) filed with the SEC on March 11, 2013) |
| |
10.02* | | Offer Letter between ReachLocal, Inc. and Zorik Gordon, dated May 14, 2004 (incorporated by reference to Exhibit 10.10 of the Company’s Amendment No. 1 to the Registration Statement on Form S-1 (File No. 333-163905) filed with the SEC on February 2, 2010) |
| |
10.03* | | Offer Letter between ReachLocal, Inc. and Michael Kline, dated May 14, 2004 (incorporated by reference to Exhibit 10.11 of the Company’s Amendment No. 1 to the Registration Statement on Form S-1 (File No. 333-163905) filed with the SEC on February 2, 2010) |
| | |
10.04* | | Offer of Employment by and between ReachLocal, Inc. and Ross G. Landsbaum, dated as of May 30, 2008 (incorporated by reference to Exhibit 10.12 of the Company’s Amendment No. 1 to the Registration Statement on Form S-1 (File No. 333-163905) filed with the SEC on February 2, 2010) |
| | |
10.05* | | Offer of Employment by and between ReachLocal, Inc. and Nathan Hanks, dated as of May 6, 2009 (incorporated by reference to Exhibit 10.14 of the Company’s Amendment No. 1 to the Registration Statement on Form S-1 (File No. 333-163905) filed with the SEC on February 2, 2010) |
| | |
10.06* | | Amendment to Offer Letter between ReachLocal, Inc. and Zorik Gordon, dated February 22, 2010 (incorporated by reference to Exhibit 10.19 of the Company’s Amendment No. 3 to the Registration Statement on Form S-1 (File No. 333-163905) filed with the SEC on April 27, 2010) |
| | |
10.07* | | Amendment to Offer Letter between ReachLocal, Inc. and Michael Kline, dated February 22, 2010 (incorporated by reference to Exhibit 10.20 of the Company’s Amendment No. 3 to the Registration Statement on Form S-1 (File No. 333-163905) filed with the SEC on April 27, 2010) |
| | |
10.08* | | Amendment to Offer of Employment between ReachLocal, Inc. and Nathan Hanks, dated February 22, 2010 (incorporated by reference to Exhibit 10.21 of the Company’s Amendment No. 3 to the Registration Statement on Form S-1 (File No. 333-163905) filed with the SEC on April 27, 2010) |
| | |
10.09* | | Offer Letter between ReachLocal, Inc. and John Mazur, dated January 14, 2008, as amended (incorporated by reference to Exhibit 10.01 of the Company’s Quarterly Report on Form 10-Q for the quarter ended March 31, 2012 (File No. 001-34749) filed with the SEC on May 4, 2012) |
| | |
10.10* | | Secondment Letter between ReachLocal, Inc. and John Mazur, dated January 1, 2012 (incorporated by reference to Exhibit 10.02 of the Company’s Quarterly Report on Form 10-Q for the quarter ended March 31, 2012 (File No. 001-34749) filed with the SEC on May 4, 2012) |
| | |
10.11* | | Transition Agreement between ReachLocal, Inc. and Michael Kline, dated November 1, 2012 (incorporated by reference to Exhibit 10.02 of the Company’s Quarterly Report on Form 10-Q for the quarter ended September 30, 2012 (File No. 001-34749) filed with the SEC on November 6, 2012) |
| |
10.12* | | Amendment to Transition Agreement between ReachLocal, Inc. and Michael Kline, dated August 7, 2013 (incorporated by reference to Exhibit 10.01 of the Company’s Quarterly Report on Form 10-Q for the quarter ended September 30, 2013 (File No. 001-34749) filed with the SEC on November 6, 2013) |
| | |
10.13* | | Separation Agreement and General Release between ReachLocal, Inc. and Zorik Gordon, dated September 4, 2013 (incorporated by reference to Exhibit 10.02 of the Company’s Quarterly Report on Form 10-Q for the quarter ended September 30, 2013 (File No. 001-34749) filed with the SEC on November 6, 2013) |
| | |
10.14* | | Separation Agreement and General Release between ReachLocal, Inc. and Nathan Hanks, dated November 1, 2013 (incorporated by reference to Exhibit 10.03 of the Company’s Quarterly Report on Form 10-Q for the quarter ended September 30, 2013 (File No. 001-34749) filed with the SEC on November 6, 2013) |
| | |
10.15* | | Separation Agreement and General Release between ReachLocal, Inc. and John Mazur, dated December 9, 2013 |
| | | |
10.16* | | Offer Letter between ReachLocal, Inc. and Josh Claman, dated May 17, 2012 (incorporated by reference to Exhibit 10.03 of the Company’s Quarterly Report on Form 10-Q for the quarter ended March 31, 2013 (File No. 001-34749) filed with the SEC on May 9, 2013) |
| | |
10.17* | | Form of Amended and Restated Restricted Stock Purchase Agreement (incorporated by reference to Exhibit 10.15 of the Company’s Amendment No. 1 to the Registration Statement on Form S-1 (File No. 333-163905) filed with the SEC on February 2, 2010) |
| |
10.18* | | Share Purchase Agreement, by and among ReachLocal, Inc. and the Persons listed on Annex A thereto, dated as of September 11, 2009 (incorporated by reference to Exhibit 10.16 of the Company’s Amendment No. 2 to the Registration Statement on Form S-1 (File No. 333-163905) filed with the SEC on February 24, 2010) |
| |
10.19* | | ReachLocal, Inc. Incentive Bonus Plan, effective as of February 21, 2010 (incorporated by reference to Exhibit 10.17 of the Company’s Amendment No. 3 to the Registration Statement on Form S-1 (File No. 333-163905) filed with the SEC on April 27, 2010) |
| |
10.20* | | ReachLocal, Inc. Director Stock Plan (incorporated by reference to Exhibit 10.18 of the Company’s Amendment No. 3 to the Registration Statement on Form S-1 (File No. 333-163905) filed with the SEC on April 27, 2010) |
| |
10.21* | | 2009 Executive Bonus Plan, effective as of January 1, 2009 (incorporated by reference to Exhibit 10.08 of the Company’s Amendment No. 1 to the Registration Statement on Form S-1 (File No. 333-163905) filed with the SEC on February 2, 2010) |
| |
10.22* | | ReachLocal, Inc. Change in Control and Severance Policy for Senior Management, effective as of February 21, 2010 (incorporated by reference to Exhibit 10.09 of the Company’s Amendment No. 3 to the Registration Statement on Form S-1 (File No. 333-163905) filed with the SEC on April 27, 2010) |
| |
10.23* | | ReachLocal, Inc. 2004 Stock Plan, adopted April 21, 2004, as amended as of April 8, 2005, July 31, 2006 and September 17, 2007 (incorporated by reference to Exhibit 10.04 of the Company’s Amendment No. 1 to the Registration Statement on Form S-1 (File No. 333-163905) filed with the SEC on February 2, 2010) |
10.24* | | Amended and Restated ReachLocal, Inc. 2008 Stock Incentive Plan (incorporated by reference to Exhibit 10.34 of the Company’s Annual Report on Form 10-K for the year ended December 31, 2010 (File No. 001-34749) filed with the SEC on March 28, 2011) |
| |
10.25* | | Form of Stock Option Agreement (incorporated by reference to Exhibit 10.28 of the Company’s Annual Report on Form 10-K for the year ended December 31, 2011 (File No. 001-34749) filed with the SEC on March 15, 2012) |
| |
10.26* | | Form of Restricted Stock Unit Award Agreement (incorporated by reference to Exhibit 10.01 of the Company’s Quarterly Report on Form 10-Q for the quarter ended June 30, 2012 (File No. 001-34749) filed with the SEC on August 3, 2012) |
| |
10.27* | | Form of Restricted Stock Award Agreement (incorporated by reference to Exhibit 10.02 of the Company’s Quarterly Report on Form 10-Q for the quarter ended June 30, 2012 (File No. 001-34749) filed with the SEC on August 3, 2012) |
| | |
10.28* | | Form of Performance-Vesting Restricted Stock Unit Award Agreement (incorporated by reference to Exhibit 10.23 of the Company’s Annual Report on Form 10-K for the year ended December 31, 2012 (File No. 001-34749) filed with the SEC on March 11, 2013) |
| | |
10.29* | | Form of Performance-Vesting Restricted Stock Award Agreement (incorporated by reference to Exhibit 99.1 of the Company’s Form 8-K (File No. 001-34749) filed with the SEC on February 15, 2013) |
| | |
10.30* | | Form of Stock Option Agreement (Regulation D Early Exercise) (incorporated by reference to Exhibit 10.06 of the Company’s Amendment No. 1 to the Registration Statement on Form S-1 (File No. 333-163905) filed with the SEC on February 2, 2010) |
| | |
10.31* | | Form of Stock Option Agreement (Rule 701) (incorporated by reference to Exhibit 10.07 to the Company’s Amendment No. 1 to the Registration Statement on Form S-1 (File No. 333-163905) filed with the SEC on February 2, 2010) |
| | |
10.32* | | Form of Non-Employee Director Stock Option Agreement (incorporated by reference to Exhibit 10.1 of the Company’s Quarterly Report on Form 10-Q for the quarter ended June 30, 2011 (File No. 001-34749) filed with the SEC on August 4, 2011) |
| | |
10.33* | | Form of Interim-Employee Director Restricted Stock Award Agreement |
| | | |
10.34 | | Lease Agreement, dated as of June 2, 2006, between ReachLocal, Inc. and CB Parkway Business Center, Ltd., as amended (incorporated by reference to Exhibit 10.02 of the Company’s Amendment No. 1 to the Registration Statement on Form S-1 (File No. 333-163905) filed with the SEC on February 2, 2010) |
| | |
10.35 | | Fifth Amendment to Lease Agreement, dated November 27, 2012, among ARI - International Business Park, LLC, ARI - IBP 1, LLC, ARI - IBP 2, LLC, ARI - IBP 3, LLC, ARI - IBP 4, LLC, ARI - IBP 5, LLC, ARI - IBP 6, LLC, ARI - IBP 7, LLC, ARI - IBP 8, LLC, ARI - IBP 9, LLC, ARI - IBP 11, LLC, and ARI - IBP 12, LLC, acting by and through Billingsley Property Services, Inc., as agent for Landlord, and ReachLocal, Inc. (incorporated by reference to Exhibit 99.01 of the Company’s Current Report on Form 8-K (File No. 001-34749) filed with the SEC on November 29, 2012) |
| | |
10.36 | | Office Lease, dated as of August 30, 2006, by and between ReachLocal, Inc. and Douglas Emmett 2000, LLC, as amended (incorporated by reference to Exhibit 10.03 of the Company’s Amendment No. 3 to the Registration Statement on Form S-1 (File No. 333-163905) filed with the SEC on April 27, 2010) |
| | |
10.37 | | Second Amendment to Office Lease, dated as of September 1, 2010, between Douglas Emmett 2000, LLC, as Landlord and ReachLocal, Inc., as Tenant (incorporated by reference to Exhibit 10.1 to the Company’s Quarterly Report on Form 10-Q for the quarter ended September 30, 2010 (File No. 001-34749) filed with the Securities and Exchange Commission on November 4, 2010) |
| | |
10.38 | | Third Amendment to Office Lease, dated as of July 22, 2011, between Douglas Emmett 2000, LLC, as Landlord and ReachLocal, Inc., as Tenant (incorporated by reference to Exhibit 10.1 of the Company’s Quarterly Report on Form 10-Q for the quarter ended September 30, 2011 (File No. 001-34749) filed with the SEC on November 7, 2011) |
10.39 | | Lease Agreement, dated as of February 2, 2010, among ARI – International Business Park, LLC, ARI- IBP 1, LLC, ARI - IBP 2, LLC, ARI - IBP 3, LLC, ARI - IBP 4, LLC, ARI - IBP 5, LLC, ARI - IBP 6, LLC, ARI - IBP 7, LLC, ARI - IBP 8, LLC, ARI - IBP 9, LLC, ARI - IBP 11, LLC, and ARI - IBP 12, LLC, acting by and through Billingsley Property Services, Inc., as agent for Landlord, and ReachLocal, Inc., as amended (incorporated by reference to Exhibit 10.37 of the Company’s Annual Report on Form 10-K for the year ended December 31, 2011 (File No. 001-34749) filed with the SEC on March 15, 2012) |
| | |
10.40 | | Fourth Amendment to Lease Agreement, dated November 27, 2012, among ARI - International Business Park, LLC, ARI - IBP 1, LLC, ARI - IBP 2, LLC, ARI - IBP 3, LLC, ARI - IBP 4, LLC, ARI - IBP 5, LLC, ARI - IBP 6, LLC, ARI - IBP 7, LLC, ARI - IBP 8, LLC, ARI - IBP 9, LLC, ARI - IBP 11, LLC, and ARI - IBP 12, LLC, acting by and through Billingsley Property Services, Inc., as agent for Landlord, and ReachLocal, Inc. (incorporated by reference to Exhibit 99.02 of the Company’s Current Report on Form 8-K (File No. 001-34749) filed with the SEC on November 29, 2012) |
| | | |
10.41 | | Consolidated Amendment to Lease Agreement, dated June 17, 2013, among ARI-International Business Park, LLC, ARI-IBP 1, LLC, ARI-IBP 2, LLC, ARI-IBP 3, LLC, ARI-IBP 4, LLC, ARI-IBP 5, LLC, ARI-IBP 6, LLC, ARI-IBP 7, LLC, ARI-IBP 8, LLC, ARI-IBP 9, LLC, ARI-IBP 11, LLC, and ARI-IBP 12, LLC, acting by and through Billingsley Property Services, Inc., as agent for Landlord, and ReachLocal, Inc. (incorporated by reference to Exhibit 10.02 of the Company’s Quarterly Report on Form 10-Q for the quarter ended June 30, 2013 (File No. 001-34749) filed with the SEC on August 7, 2013) |
| | |
10.42 | | Fifth Amendment to Lease Agreement, dated July 22, 2013, among ARI - International Business Park, LLC, ARI - IBP 1, LLC, ARI - IBP 2, LLC, ARI - IBP 3, LLC, ARI - IBP 4, LLC, ARI - IBP 5, LLC, ARI - IBP 6, LLC, ARI - IBP 7, LLC, ARI - IBP 8, LLC, ARI - IBP 9, LLC, LLC, ARI - IBP 11, LLC, and ARI - IBP 12, LLC, acting by and through Billingsley Property Services, Inc., as agent for Landlord, and ReachLocal, Inc. (incorporated by reference to Exhibit 10.04 of the Company’s Quarterly Report on Form 10-Q for the quarter ended June 30, 2013 (File No. 001-34749) filed with the SEC on August 7, 2013) |
| | |
10.43 | | Lease Agreement, dated June 17, 2013, between EPC-IBP 16, LLC and ReachLocal (incorporated by reference to Exhibit 10.01 of the Company’s Quarterly Report on Form 10-Q for the quarter ended June 30, 2013 (File No. 001-34749) filed with the SEC on August 7, 2013) |
| | |
10.44 | | Side Letter, dated June 17, 2013, between EPC-IBP 16, LLC and ReachLocal, Inc. (incorporated by reference to Exhibit 10.03 of the Company’s Quarterly Report on Form 10-Q for the quarter ended June 30, 2013 (File No. 001-34749) filed with the SEC on August 7, 2013) |
| | |
10.45 | | Google Inc. AdWords Reseller Addendum, dated April 25, 2011, between ReachLocal, Inc. and Google Inc. (incorporated by reference to Exhibit 10.1 of the Company’s Quarterly Report on Form 10-Q for the quarter ended March 31, 2011 (File No. 001-34749) filed with the SEC on May 16, 2011) |
| | |
10.46 | | Amendment to the Google Inc. AdWords Reseller Addendum, dated November 1, 2011, between ReachLocal, Inc. and Google Inc. (incorporated by reference to Exhibit 10.39 of the Company’s Annual Report on Form 10-K for the year ended December 31, 2011 (File No. 001-34749) filed with the SEC on March 15, 2012) |
| | |
10.47 | | Amendment 2 to the Google Inc. AdWords Reseller Addendum, dated February 10, 2014, between ReachLocal, Inc. and Google Inc. |
| | | |
10.48 | | Google AdWords Reseller Agreement, dated May 9, 2011, between ReachLocal Netherlands B.V. and Google Ireland Limited (incorporated by reference to Exhibit 10.2 of the Company’s Quarterly Report on Form 10-Q for the quarter ended March 31, 2011 (File No. 001-34749) filed with the SEC on May 16, 2011) |
| | |
10.49 | | Amendment Number Three to the Google Adwords Reseller Agreement, dated August 17, 2012, between ReachLocal Netherlands B.V. and Google Ireland Limited (incorporated by reference to Exhibit 10.01 of the Company’s Quarterly Report on Form 10-Q for the quarter ended September 30, 2012 (File No. 001-34749) filed with the SEC on November 6, 2012) |
| |
10.50 | Amendment Number Four to the Google Adwords Reseller Agreement, dated January 30, 2013, between ReachLocal Europe BV and Google Ireland Limited (incorporated by reference to Exhibit 10.01 of the Company’s Quarterly Report on Form 10-Q for the quarter ended March 31, 2013 (File No. 001-34749) filed with the SEC on May 9, 2013) |
| |
10.51 | Amendment Number Five to the Google Adwords Reseller Agreement, dated April 17, 2013, between ReachLocal Europe BV and Google Ireland Limited (incorporated by reference to Exhibit 10.02 of the Company’s Quarterly Report on Form 10-Q for the quarter ended March 31, 2013 (File No. 001-34749) filed with the SEC on May 9, 2013) |
| |
21.01 | List of subsidiaries of ReachLocal, Inc. |
| |
23.01 | Consent of Independent Registered Public Accounting Firm |
| |
24.01 | Power of Attorney (included on signature page to this Annual Report on Form 10-K) |
| |
31.01 | Certification of the Chief Executive Officer pursuant to Rules 13a-14(a) and 15d-14(a) of the Securities Exchange Act of 1934, as amended, as adopted pursuant to Section 302 of the Sarbanes-Oxley Act of 2002 |
| |
31.02 | Certification of the Chief Financial Officer pursuant to Rules 13a-14(a) and 15d-14(a) of the Securities Exchange Act of 1934, as amended, as adopted pursuant to Section 302 of the Sarbanes-Oxley Act of 2002 |
| |
32.01 | Certification of the Chief Executive Officer pursuant to 18 U.S.C. Section 1350, as adopted pursuant to Section 906 of the Sarbanes-Oxley Act of 2002 |
| |
32.02 | Certification of the Chief Financial Officer pursuant to 18 U.S.C. Section 1350, as adopted pursuant to Section 906 of the Sarbanes-Oxley Act of 2002 |
| | |
| 101.INSXBRL | Instance Document |
| | |
| 101.SCHXBRL | Taxonomy Extension Schema Document |
| | |
| 101.CALXBRL | Taxonomy Extension Calculation Linkbase Document |
| | |
| 101.DEFXBRL | Taxonomy Extension Definition Linkbase Document |
| | |
101.LABXBRL | Taxonomy Extension Label Linkbase Document |
| | |
| 101.PREXBRL | Taxonomy Extension Presentation Linkbase Document |
_________________
* | Indicates management contract or compensatory plan, contract or arrangement. |
SIGNATURES
Pursuant to the requirements of Section 13 or 15(d) of the Securities Exchange Act of 1934, the registrant has duly caused this report to be signed on its behalf by the undersigned, thereunto duly authorized, as of March 4, 2014.
| REACHLOCAL, INC. | |
| | | |
| By: | /s/ David Scott Carlick | |
| Name: | David Scott Carlick | |
| Title: | Interim Chief Executive Officer | |
POWER OF ATTORNEY
Each person whose individual signature appears below hereby authorizes and appoints Zorik Gordon and Ross G. Landsbaum, and each of them, with full power of substitution and resubstitution and full power to act without the other, as his or her true and lawful attorney-in-fact and agent to act in his or her name, place and stead and to execute in the name and on behalf of each person, individually and in each capacity stated below, solely for the purposes of filing any and all amendments to this Annual Report on Form 10-K, and to file the same, with all exhibits thereto, and other documents in connection therewith, with the Securities and Exchange Commission, granting unto said attorneys-in-fact and agents, and each of them, full power and authority to do and perform each and every act and thing, ratifying and confirming all that said attorneys-in-fact and agents or any of them or their or his substitute or substitutes may lawfully do or cause to be done by virtue thereof solely for the purposes stated therein.
Pursuant to the requirements of the Securities Exchange Act of 1934, this report has been signed below by the following persons on behalf of the registrant and in the capacities on the date indicated.
Signature | | Title | | Date |
| | | | |
/s/ David Scott Carlick | | Interim Chief Executive Officer, Director | | March 4, 2014 |
David Scott Carlick | | (Principal Executive Officer) | | |
| | | | |
/s/ Ross G. Landsbaum | | Chief Financial Officer | | March 4, 2014 |
Ross G. Landsbaum | | (Principal Financial Officer) | | |
| | | | |
/s/ Daniel Della Flora | | Senior Vice President, Chief Accounting Officer | | March 4, 2014 |
Daniel Della Flora | | (Principal Accounting Officer) | | |
| | | | |
/s/ Robert Dykes | | Director | | March 4, 2014 |
Robert Dykes | | | | |
| | | | |
/s/ James Geiger | | Director | | March 4, 2014 |
James Geiger | | | | |
| | | | |
/s/ Habib Kairouz | | Director | | March 4, 2014 |
Habib Kairouz | | | | |
| | | | |
/s/ Alan Salzman | | Director | | March 4, 2014 |
Alan Salzman | | | | |
PAGE 60