UNITED STATES
SECURITIES AND EXCHANGE COMMISSION
Washington, D.C. 20549
FORM 8-K
CURRENT REPORT
Pursuant to Section 13 or 15(d) of the
Securities Exchange Act of 1934
Date of Report (Date of earliest event reported): September 27, 2006
B of I HOLDING, INC.
(Exact name of registrant as specified in its charter)
| | | | |
| Delaware | | 000-51201 | | 33-0867444 |
(State or other jurisdiction of
incorporation) | | (Commission File Number) | | (IRS Employer Identification
Number) |
| | |
| 12777 High Bluff Drive, Suite 100, San Diego, CA | | 92130 |
| (Address of principal executive offices) | | (Zip Code) |
Registrant’s telephone number, including area code: (858) 350-6200
Not Applicable
(Former name or former address, if changed since last report.)
Check the appropriate box below if the Form 8-K filing is intended to simultaneously satisfy the filing obligation of the registrant under any of the following provisions:
| ¨ | Written communications pursuant to Rule 425 under the Securities Act (17 CFR 230.425) |
| ¨ | Soliciting material pursuant to Rule 14a-12 under the Exchange Act (17 CFR 240.14a-12) |
| ¨ | Pre-commencement communications pursuant to Rule 14d-2(b) under the Exchange Act (17 CFR 240.14d-2(b)) |
| ¨ | Pre-commencement communications pursuant to Rule 13e-4(c) under the Exchange Act (17 CFR 240.13e-4(c)) |
| Item 7.01 | Regulation FD Disclosure. |
BofI Holding, Inc. (the “Registrant”) is presenting a slide show at the Wall Street Analyst Forum’s 17th Annual Analyst Conference at the Princeton Club in New York, NY on Wednesday, September 27, 2006 at 10:30 AM. A copy of the information in the slide show is attached below and is incorporated herein by reference. This Form 8-K and the information attached below shall not be deemed to be “filed” for purposes of Section 18 of the Securities Exchange Act of 1934, as amended (“Exchange Act”), nor shall it be incorporated by reference into a filing under the Securities Act of 1933, as amended (“Securities Act”), or the Exchange Act, except as expressly set forth by specific reference in such a filing. The furnishing of the information in this report is not intended to, and does not, constitute a determination or admission by the Registrant that the information in this report is material or complete, or that investors should consider this information before making an investment decision with respect to any security of the Registrant or any of its affiliates. The information in the materials is presented as of September 27, 2006, and the Registrant does not assume any obligation to update such information in the future.
Safe Harbor Statement
Statements contained in the slide show presentation that state expectations or predictions about the future are forward-looking statements intended to be covered by the safe harbor provisions of the Securities Act and the Exchange Act. The Registrant’s actual results could differ materially from those projected in such forward-looking statements. Factors that could affect those results include “Risk Factors” and the other factors appearing in the documents that the Registrant has filed with the Securities and Exchange Commission.
Set forth below, are the presentation materials:
Safe Harbor Statements contained in the slide show presentation that state expectations or predictions about the future are forward-looking statements intended to be covered by the safe harbor provisions of the Securities Act and the Exchange Act. The Registrant’s actual results could differ materially from those projected in such forward-looking statements. Factors that could affect those results include “Risk Factors” and the other factors appearing in the documents that the Registrant has filed with the Securities and Exchange Commission. 2 |
Equity Snapshot Exchange/Symbol: NASDAQ/BOFI Price (9/15/2006): $6.93 Shares Outstanding: 8.38 M Market Capitalization: $58.10 M BV Per Share (06/30/06 - mrq) $7.77 Price/Book (9/15/06 price/mrq) : 0.89X Total Assets (06/30/06 - mrq): $737.84 M Publicly traded since: March 15, 2005 Price/Earnings (9/15/06 price/ttm) 20.38X 3 |
Corporate Overview To be the premier low-cost operator in the consumer financial services industry MISSION STATEMENT • Federally charted savings bank • Regulated by the Office of Thrift Supervision • Deposits insured by the Federal Deposit Insurance Corporation BofI Holding, Inc. BofI Trust 1 (Trust Preferred) Bank of Internet USA BANK OF INTERNET USA 4 |
Investment Highlights The Internet creates an opportunity for a more efficient banking model BofI has a unique, low-cost and scalable operating model Proprietary software and technology Strong record of growth and profitability Portfolio of high quality assets nationwide Attractive valuation – book value 5 |
Mature Industries Evolving to Lowest Cost Producers 6 |
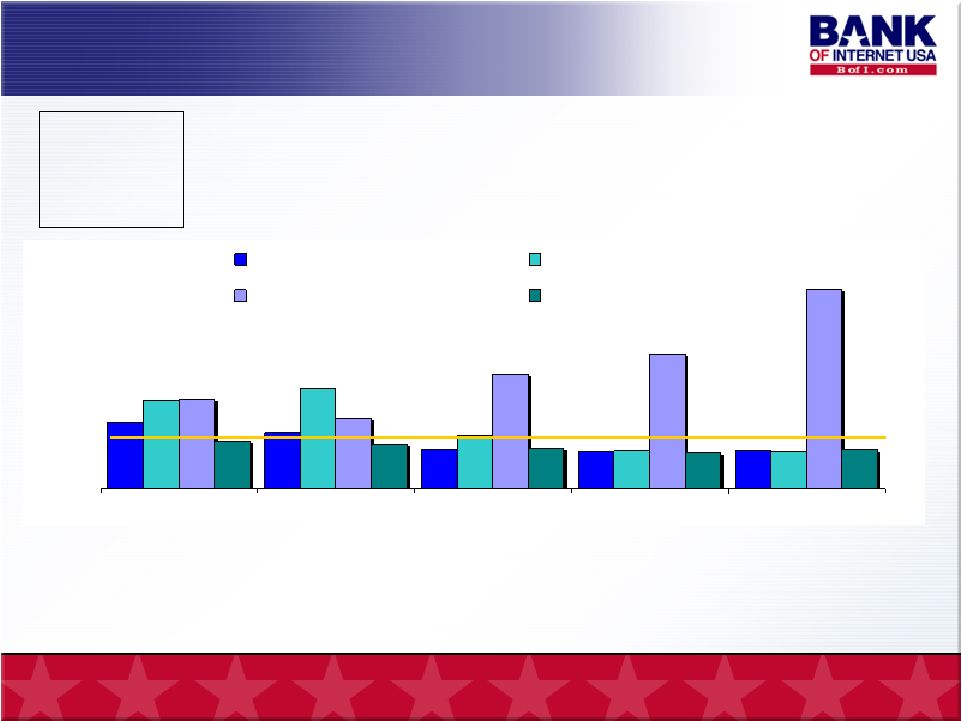
73 62 98 111 99 78 126 221 41 41 44 40 41 58 148 42 45 39 49 52 0 25 50 75 100 125 150 175 200 Dec-02 Dec-03 Dec-04 Dec-05 6 Mo Jun-06 ING Bank, FSB ($60.9B) E*Trade Bank ($36.8B) Net Bank ($4.2B) Bank of Internet ($0.7B) 7 Comparison of Efficiency Ratios* Bank Industry Average: 56 Source: FDIC, “Statistics on Depository Institutions – For Each Calendar Year.” Data does not include holding companies. * Efficiency ratio = non-interest expense as a percentage of net interest income plus non-interest income |
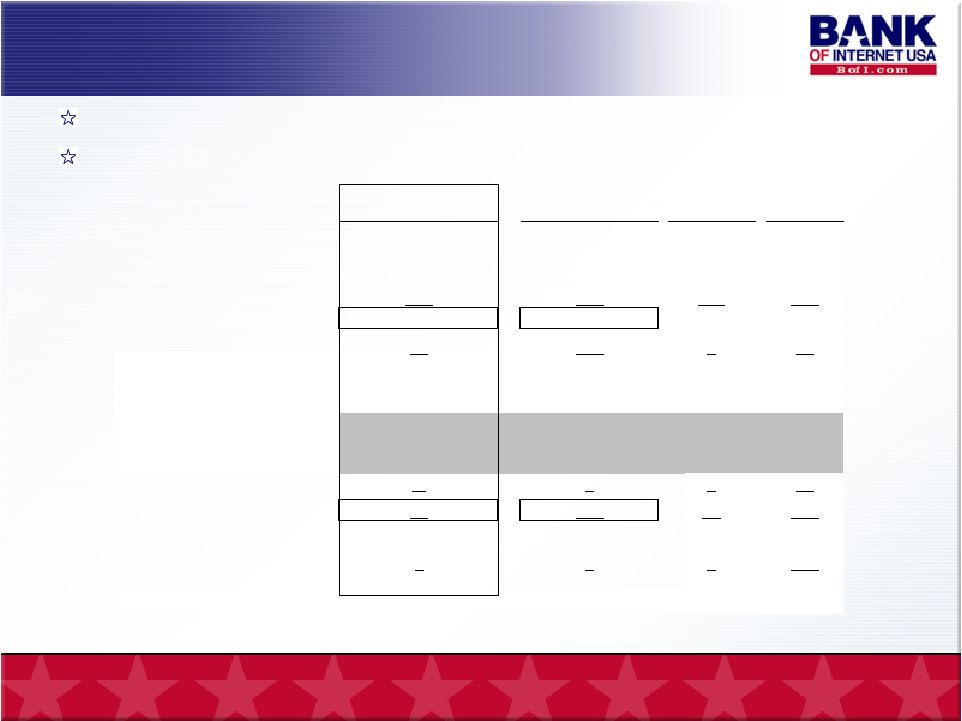
Common-sized income statement comparison BofI earnings through lower costs Income Statement Comparison Bank of All S&Ls- Assets Internet USA (1) $100 Mil - $1 Bil ING Bank NetBank (In basis points on average assets) Income: Interest income 494 559 481 581 Interest expense 347 256 365 346 Net interest income 147 303 116 235 Fees and other income 15 121 1 49 Subtotal - Income 162 424 117 284 Operating overhead: Personnel 34 160 20 292 Premises & equipment 13 45 8 114 Other G & A 21 88 20 281 Loan loss provision -2 8 0 18 Subtotal - Overhead 65 302 48 706 Pre-tax operating earnings 97 122 69 -422 Securities gains 0 9 0 152 Pre-tax earnings 97 131 69 -270 Source: FDIC - Statistics on Depository Institutions – Six months ended June 30, 2006. (1) Excludes operating income and expense of BofI Holding, Inc. Holding company data is also not included in competitor information. 8 |
• Outsource core banking system • Proprietary CRM and fraud control • No legacy systems Building Blocks for Successful Execution COST EFFECTIVE PROCESS • Assembly-line simplicity • Streamlined deposit & loan approval • Real-time customer information SCALABLE TECHNOLOGY • Superior risk management • Quality underwriting • Intelligent product selection EXPERIENCED MANAGEMENT • Self-service design • Efficient automation • Minimal manual intervention AUTOMATED SERVICE 9 |
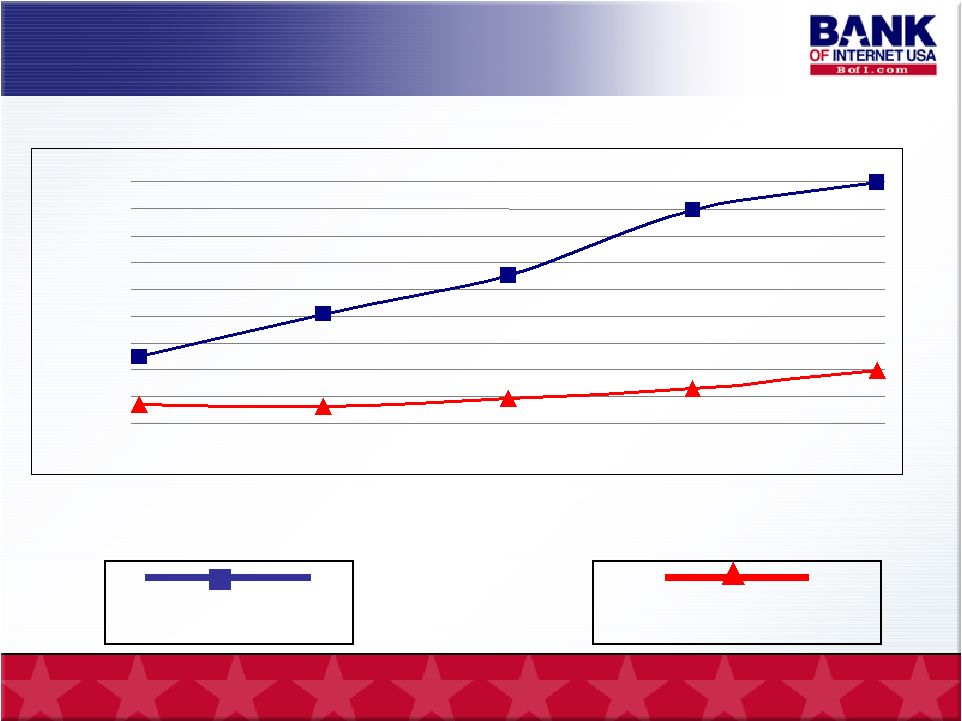
Annual Net Interest Income vs Noninterest Expense $218,000 $273,000 $405,000 $609,000 $738,000 2002 2003 2004 2005 2006 Assets in Thousands Net Interest Income (in 000s) Noninterest Expense EXCLUDING SALARY & WAGES 10 For the Fiscal Years Ended June 30 $1,000 $2,000 $3,000 $4,000 $5,000 $6,000 $7,000 $8,000 $9,000 $10,000 |
$0 $5 $10 $15 $20 $25 $30 Demonstrated Scalability Assets per Employee at Fiscal Year End (At Year Ends June 30, and at December 31, 2005) (full-time equivalent employees) (Dollars in millions) Source: FDIC 14 Employees $0 Assets 25 Employees $738M Assets 20 Employees $273M Assets 2001 2002 2003 2004 2005 2006 Bank Industry Average = $6.9 million 11 |
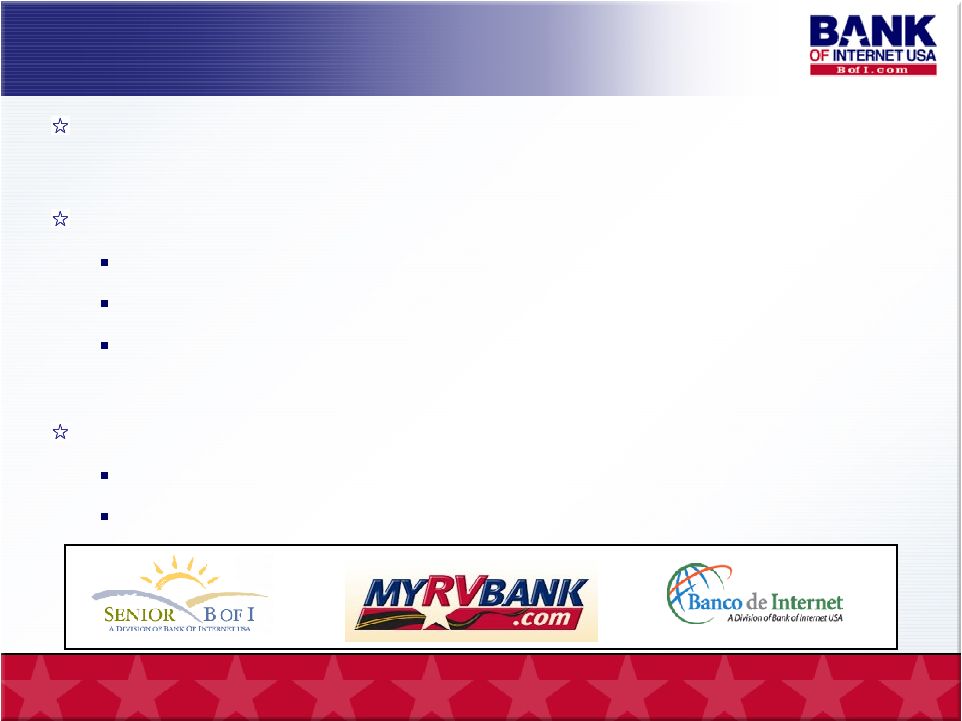
Consumer Focused Product Strategy Internet search- consumer direct: Google, Bankrate, etc. Demographic-specific websites: Senior Bank Site – launched January 2006 My RV Bank – launched August 2006 Banco de Internet – to be implemented New initiative - marketing through affiliates / social networking: Adding senior executive position Obtained regulatory approval for unique compensation plan 12 |
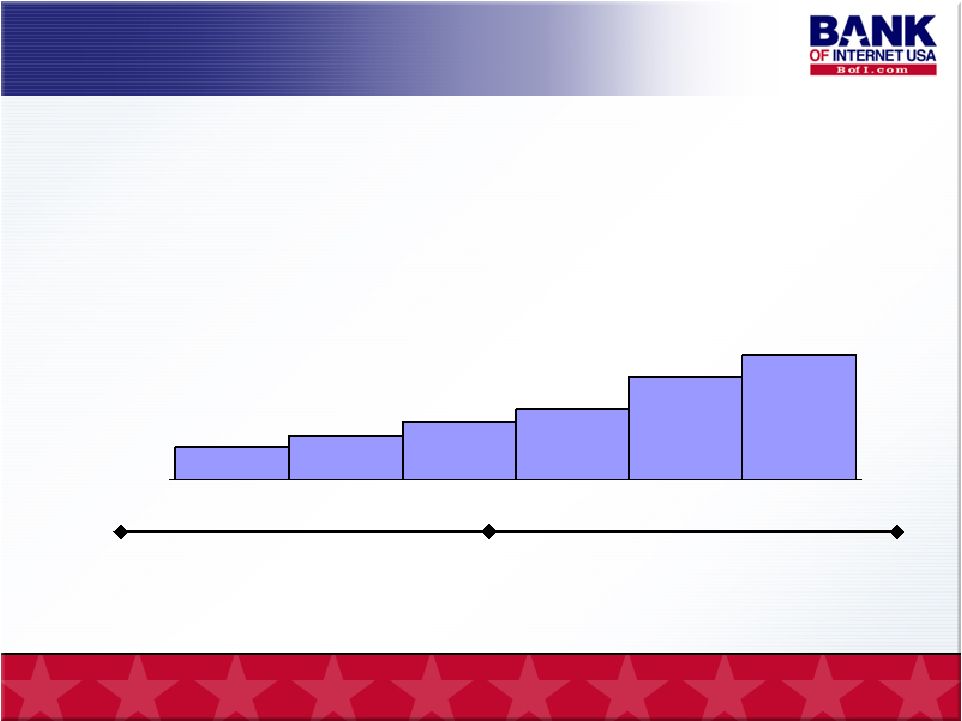
6,367 9,569 13,653 19,827 22,468 0 10,000 20,000 2002 2003 2004 2005 2006 Total Number of Deposit Accounts Strong Track Record of Growth 13 * * At each fiscal year end June 30. |
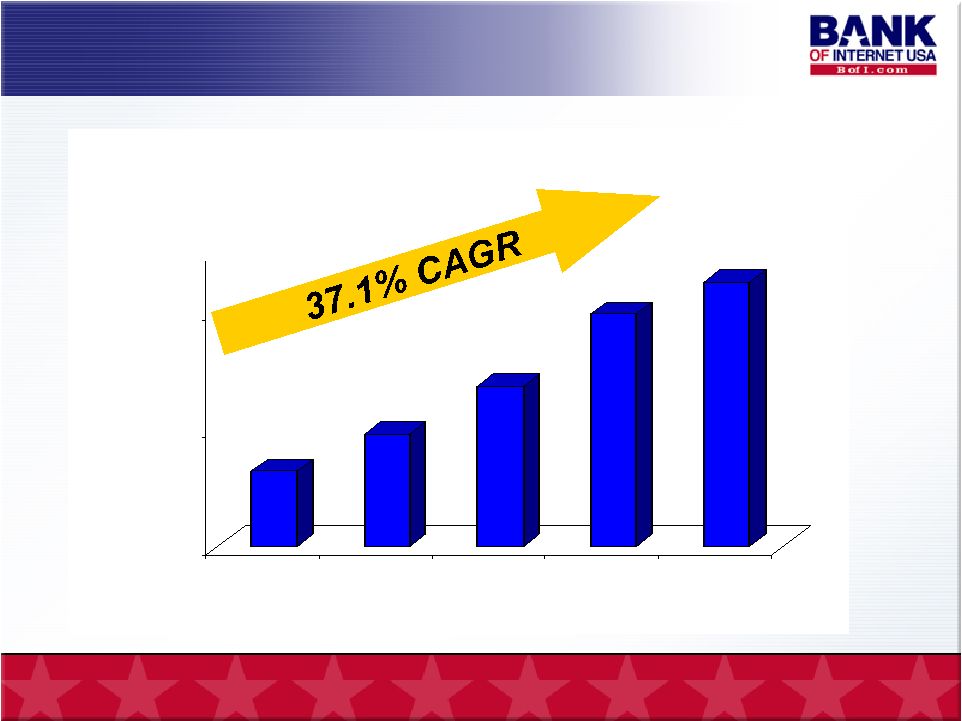
$217.6 $273.5 $405.0 $609.5 $737.8 $0 $200 $400 $600 $800 $1,000 2002 2003 2004 2005 2006 Total Assets ($ in millions) Strong Track Record of Growth 14 * At each fiscal year end June 30. * |
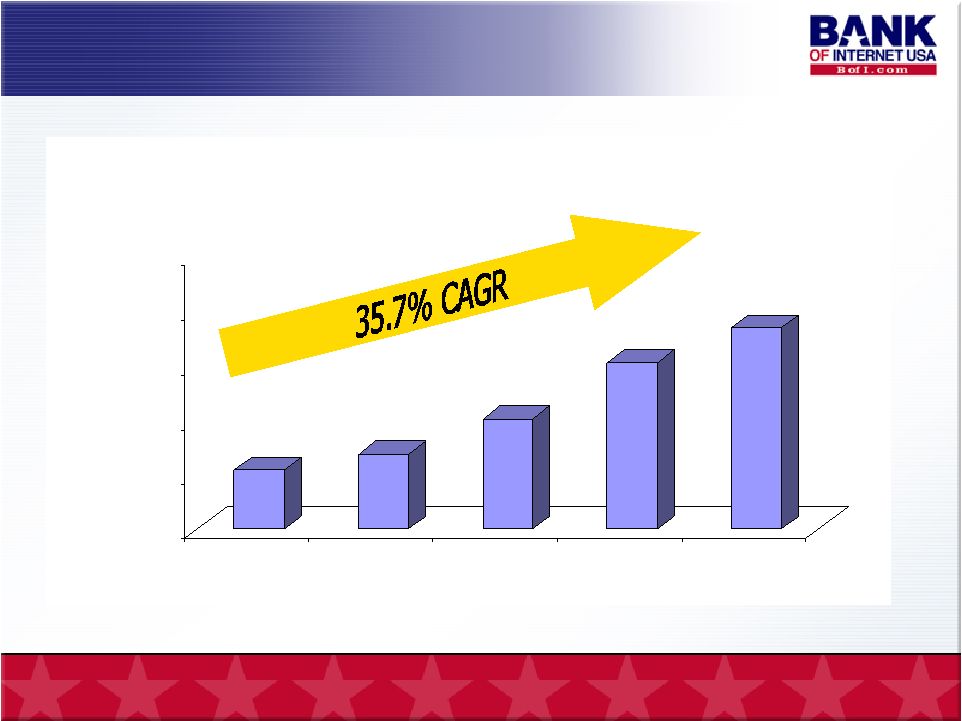
$3,497 $5,088 $6,530 $8,969 $9,955 $0 $2,000 $4,000 $6,000 $8,000 $10,000 2002 2003 2004 2005 2006 Net Interest Income ($ in thousands) Strong Track Record of Growth 15 * For each fiscal year ended June 30. * |
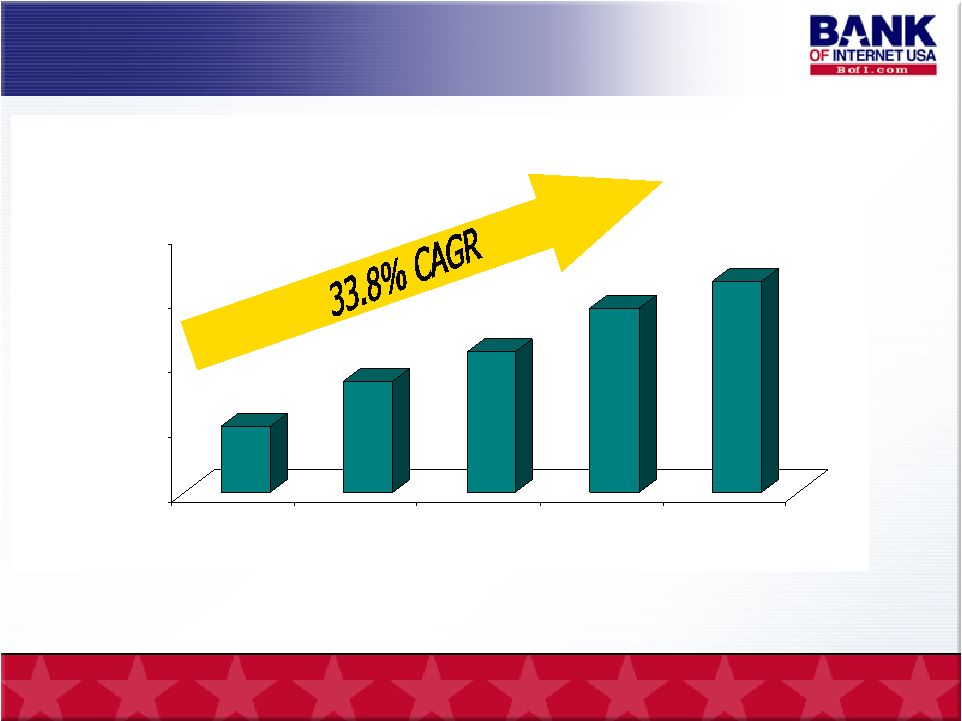
$1,020 $1,730 $2,175 $2,869 $3,266 $- $1,000 $2,000 $3,000 $4,000 2002 2003 2004 2005 2006 Net Income ($ in thousands) Strong Track Record of Growth 16 * * For each fiscal year ended June 30. |
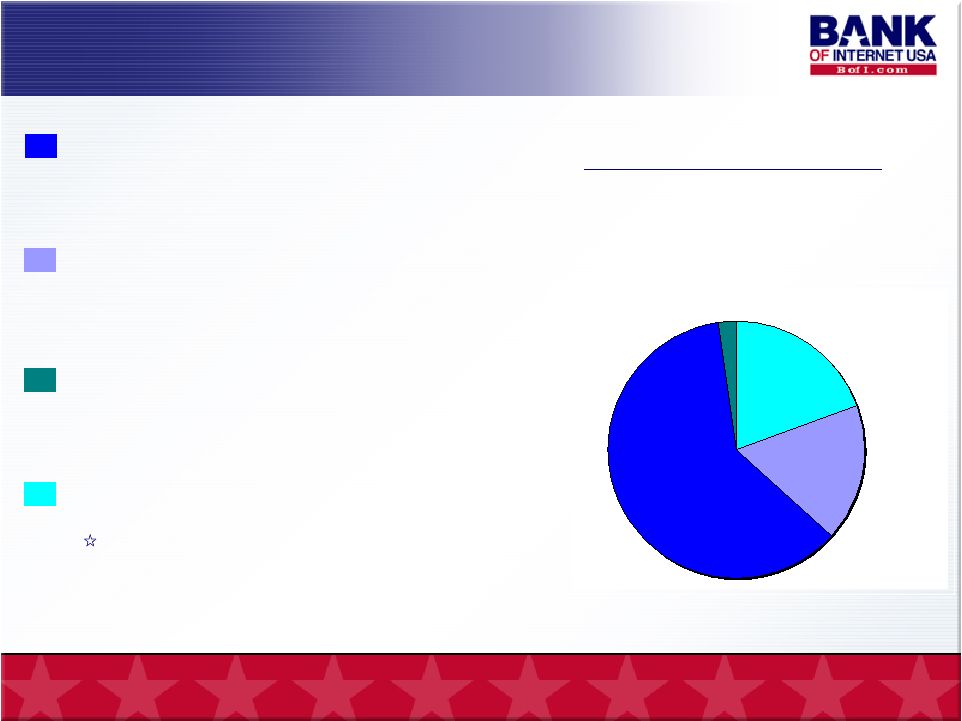
Multifamily mortgages – 62% Single family mortgage – 17% Commercial real estate loans – 2% Mortgage-backed securities – 19% FNMA, FHLMC, GNMA Investment in High Quality Assets 19% 17% 62% 2% Investments by Type June 30, 2006 17 |
4% 5% 36% 8% 10% 5% 6% 7% 19% California - Southern California - Northern Washington Colorado Arizona Texas Oregon Florida All other states Geographic Breakdown Mortgage Loans As of June 30, 2006 18 |
History of Quality Assets Since inception through June 30, 2006, BOFI has had no mortgage-loan: Write-offs Foreclosure sales Restructurings No subprime lending or risky mortgage-backed securities. Loan portfolio is supported by exceptional LTVs Allowance for Loan Losses $0 $500 $1,000 $1,500 Jun-02 Jun-03 Jun-04 Jun-05 Jun-06 0.24% 0.26% 0.28% 0.30% 0.32% 0.34% Allowance for loan loss Allowance as % of gross loans Ave Loan to Value (LTV) by Mortgage Type June 30, 2006 52% 47% 50% 60% 62% 46% 38% 51% 0% 10% 20% 30% 40% 50% 60% 70% Single Family Multifamily Commercial Total Average Median 19 |
Liability Growth by Type ($ in Millions) (At June 30, 2006) $0 $100 $200 $300 $400 $500 $600 2001 2002 2003 2004 2005 2006 ($000) Checking and savings Time deposits Advances from FHLB Stable Deposit Base, Managed Interest Rate Risk More than 22,000 online deposit customers 36% of accounts are checking and savings 80% of all checking and savings accounts opened between July 1, 2004 and June 30, 2006 are still open 88% of all Senior checking accounts opened between July 1, 2004 and June 30, 2006 are still open FHLB Advances - Principally used as a hedging vehicle – use fixed rate advances to help match maturities of hybrid-arm loan re-pricing. Mix of Funding ($ in millions) June 30, 2006 $129.8 $65.0 $228.2 $236.2 Time deposits- less $100k Time deposits- $100k+ Checking and savings accounts Advances from FHLB 20 |
Capital Structure Initial Public Offering - March 2005 Added $31.3 million in equity and 3,052,174 common shares; 36% of total shares outstanding of 8,561,725 Provides capital to grow bank Dividends No dividends paid on common shares $5.2 million in convertible preferred with 6% dividend Stock Options Under FASB 123R start expensing stock options effective 7/1/05. Operating results for fiscal 2006 included $409,000, of stock option expense, a reduction 3 cents per fully diluted share for fiscal 2006 Stock Buyback Re-purchased 163,500 shares during fiscal 2006 at average price of $8.10 per share. 21 |
Banking Environment Challenges Maintain Net Interest Margin Until the flat yield curve reverses, BofI net interest margins will narrow with asset growth. BofI’s low cost structure, compared to traditional banks of similar asset size, allows profit with a smaller net interest margin and better opportunity to deploy excess capital Move into consumer lending to generate additional interest income Risk Premiums and Competition for Mortgage Loans Many mortgage lenders have relaxed credit standards BofI’s low overhead loan origination structure reduces pressure to originate loans for portfolio and promotes selective purchases of whole loans and MBS Real Estate Bubble? BofI Reduces Risk by: No subprime lending Low loan to value and geographic diversification 22 |
Selected Annual Financial Data and BOFI Goals For or At the Year Ended YoY % Chg 2005 2006 (fav /-unfav) Goals(2) Net Income (000s) 2,869 $ 3,266 $ 14% Diluted Earnings Per Share 0.40 $ 0.34 $ -15% Return on Avg Common Stockholders' Equity 6.73% 4.56% -32% 10.00% Efficiency Ratio (1) 48.05% 51.20% -7% 40.00% Total Assets (000s) 609,508 $ 737,835 $ 21% $ 1 Billion Loans Held For Investment (000s) 486,872 $ 533,641 $ 10% Total Deposits (000s) 361,051 $ 424,204 $ 17% Book Value Per Common Share 7.47 $ 7.77 $ 4% (1) Non-interest expense divided by the sum of net interest income and non-interest income. (2) Rates are annualized. June 30, 23 |
Growth Strategy Build Bank Size and Efficiency Use IPO capital to grow to $1 billion Improve efficiency ratio to 40% or lower Improve ROE to 10% or greater Expand Products Capabilities Home Equity Loans Launched online originations in late July 2006. Move from seven states to about 50 states by November. Auto / Recreational Vehicle Loans – to be announced Build Affiliate Relationships for Deposit, Loans and Fee Income Mortgage Lending Opportunistic purchases Establish relationships with other mortgage lenders for non-portfolio product 24 |
Home Equity Loan Snap Shot 25 • Offering Top Rates to Most Credit Worthy Customers • Sample of $1.8 million in originations, weighted average: – Balance = $95,000 – 1 st Mortgage =$313,000 – Combined Loan to Value= 60% – FICO= 757 – High of 802 and low of 672 – Debt to Income= 41% • Average Rate = 7.28% • Compares Favorably to 5.18% Loan Portfolio Yield for Fiscal 2006 |
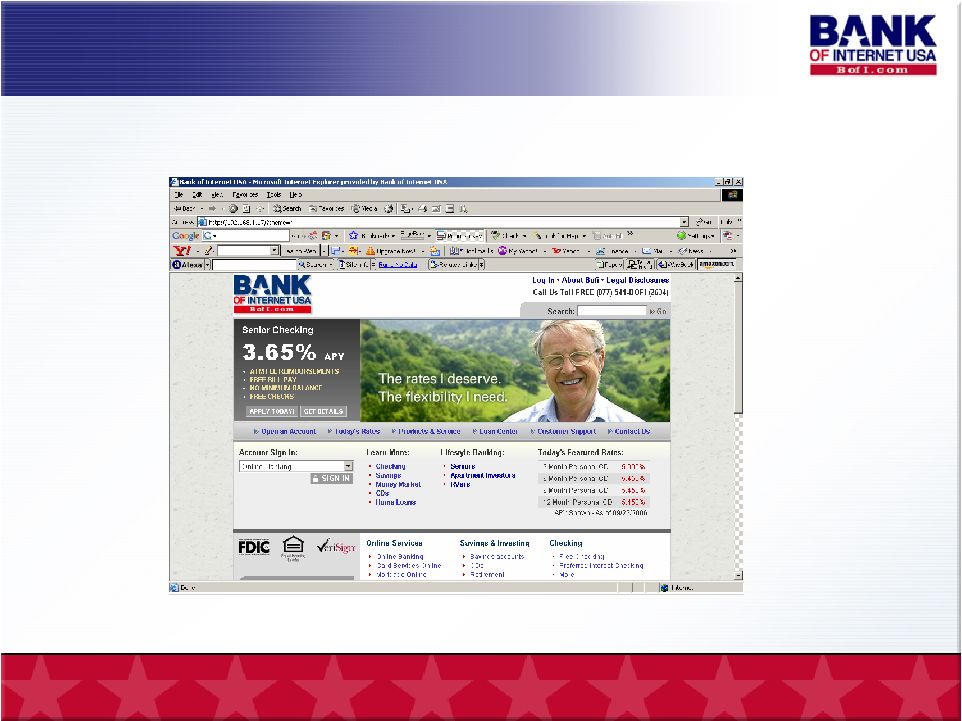
Website Re-fresh 26 • Reorganizing for Better Navigation – November 2006 |
Experienced Management Team Gary Lewis Evans President and CEO 30 + years management experience in commercial and savings banking Andrew Micheletti Vice President and CFO 25 + years experience in financial management, accounting and auditing Michael J. Berengolts VP and Chief Technology Officer 10 + years experience in technology and information systems management 27 |
Investment Highlights 28 The Internet creates an opportunity for a more efficient banking model BofI has a unique, low-cost and scalable operating model Proprietary software and technology Strong record of growth and profitability Portfolio of high quality assets nationwide Attractive valuation – book value |
SIGNATURES
Pursuant to the requirements of the Securities Exchange Act of 1934, the registrant has duly caused this report to be signed on its behalf by the undersigned hereunto duly authorized.
| | | | | | | | |
| | | | B of I HOLDING, INC. |
| | | |
| Date: September 27, 2006 | | | | By: | | /s/ Gary Lewis Evans |
| | | | | | | | Gary Lewis Evans President and Chief Executive Officer |