 Sidoti & Company, LLC First 2010 Micro Cap Conference January 11, 2010 Andy Micheletti, CFO Exhibit 99.1 |
Safe Harbor This presentation contains forward-looking statements within the meaning of the Private Securities Litigation Reform Act of 1995 (the “Reform Act”). The words “believe,” “expect,” “anticipate,” “estimate,” “project,” or the negation thereof or similar expressions constitute forward-looking statements within the meaning of the Reform Act. These statements may include, but are not limited to, projections of revenues, income or loss, estimates of capital expenditures, plans for future operations, products or services, and financing needs or plans, as well as assumptions relating to these matters. Such statements involve risks, uncertainties and other factors that may cause actual results, performance or achievements of the Company and its subsidiaries to be materially different from any future results, performance or achievements expressed or implied by such forward-looking statements. For a discussion of these factors, we refer you to the Company's reports filed with the Securities and Exchange Commission, including its Annual Report on Form 10-K for the year ended June 30, 2009 and its Quarterly Earnings Report on Form 10-Q for the quarter ended September 30, 2009. In light of the significant uncertainties inherent in the forward-looking statements included herein, the inclusion of such information should not be regarded as a representation by the Company or by any other person or entity that the objectives and plans of the Company will be achieved. For all forward- looking statements, the Company claims the protection of the safe-harbor for forward- looking statements contained in the Reform Act. |
 What We Have Accomplished Over the Last Two Years Percentage increase in net income from Q1’08 ($747k) to Q1’10 ($3.7mm) Improvement in efficiency ratio Q1’08 (63.0%) to Q1’10 (28.4%) Percentage increase in net interest margin from Q1’08 (1.24%) to Q1’10 (3.88%) 1 396% (55%) 213% |
 Corporate Profile $1.3 billion asset savings and loan holding company (1) 10 years operating history, publically traded on NASDAQ since 2005 Headquartered in single branch location in San Diego, CA 30,000 deposit and loan customers 64 employees ($21 million in assets per employee) Market Capitalization of $82 million (2) Price/Tangible Book Value = 0.98x (2) 1. Quarter ended September 30th 2. As of 1/6/10 closing price of $10.00 per share. 2 |
 Primary Businesses Deposit Products Highly efficient operations (9 CSRs; 26,000 accounts) Full-featured products Online Retail Loan Origination Self-service operations Ability to adjust asset class and credit standards quickly Low fixed costs Wholesale Banking Wide network of seller relationships Significant due diligence experience Strong track record Servicing Experience across multiple asset classes 4,000 loans 3 |
 Our Business Model Is More Profitable Because Our Costs Are Lower Salaries and Benefits Premises and Equipment 1. Bank of Internet USA only for three months ended 9/30/09 - the most recent data on FDIC website. Excludes BofI Holding company to compare to FDIC data. 2. Commercial banks by asset size. FDIC reported for three months ended 9/30/09. Total of 557 institutions $0.5-$1 billion. 3. FDIC reported for three months ended 9/30/09. Total of 440 institutions $1-$10 billion. BofI (1) 0.39% 0.11% Banks $1-$10bn (3) 1.29% 0.37% Other Non-interest Expense 0.43% 1.48% Total Non-interest Expense 0.93% 3.14% Core Business Margin 2.83% 0.09% 1.51% 0.40% 1.37% 3.28% 0.13% Banks $0.5-$1bn (2) Net Interest Income 3.76% 3.23% 3.41% as % of average assets 4 |
 Our Credit Quality Is Best-In-Class Assets 30-89 days delinquent Assets >90 days delinquent BofI (1) 0.44% 0.24% Banks $1-$10bn (2) 1.00% 0.22% Assets In Non-Accrual 0.35% 2.83% Banks $0.5-$1bn (2) 1.03% 0.21% 2.54% 1. Bank of Internet USA only at 9/30/09 (excludes BofI Holding, Inc. to compare to FDIC data). 2. Commercial banks by asset size. FDIC reported at 9/30/09. Total of 557 institutions $0.5-$1 billion and 440 institutions $1-$10 billion. 5 as % of assets |
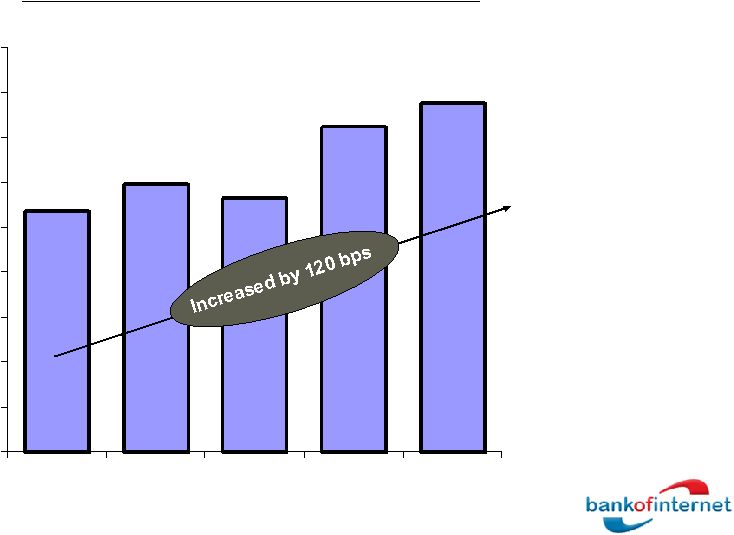 2.68% 2.98% 2.82% 3.62% 3.88% 0.00% 0.50% 1.00% 1.50% 2.00% 2.50% 3.00% 3.50% 4.00% 4.50% Q1'09 Q2'09 Q3'09 Q4'09 Q1'10 Net Interest Margin Improvement Consolidated Net Interest Margin Last 5 Quarters 6 |
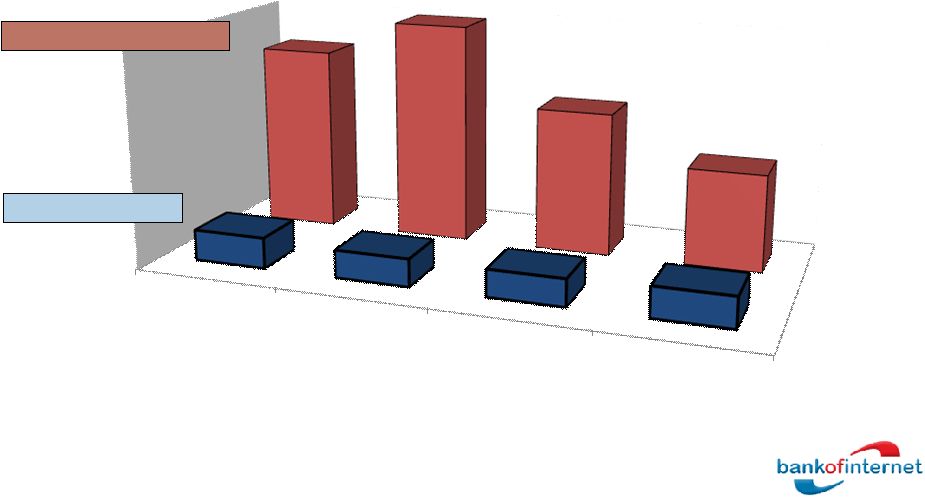
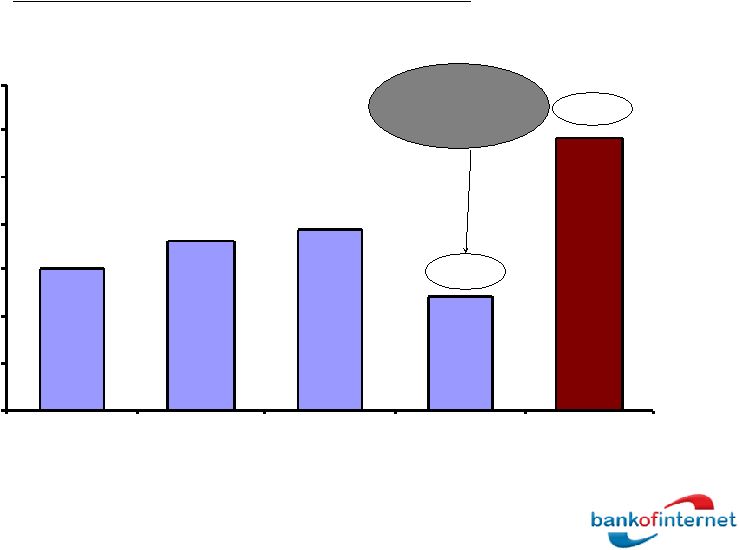 30.09% 35.98% 38.54% 24.02% 58.62% 0.00% 10.00% 20.00% 30.00% 40.00% 50.00% 60.00% 70.00% Q2'09 Q3'09 Q4'09 Q1'10 Banks(1) And Our Efficiency Ratio Improved Dramatically Efficiency Ratio (Bank of Internet USA, for the quarter ended) Source: FDIC statistics on depository institutions. All data excludes holding companies for banks. 1. Reported by FDIC – 440 commercial banks with $1-$10 billion in assets for the quarter ended 9/30/09. One of the lowest rates in the industry 7 |
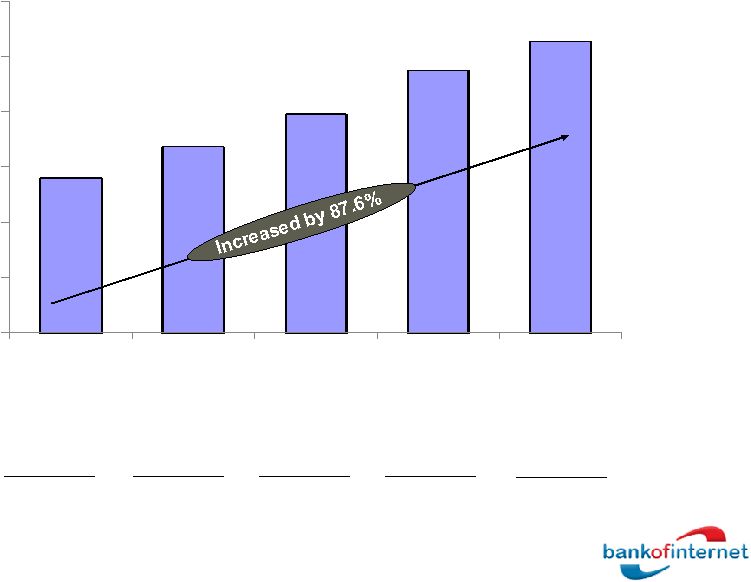
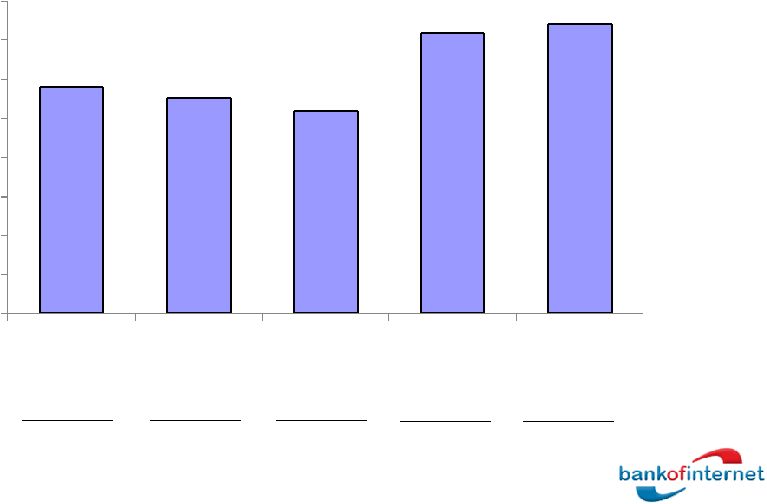 $2,893 $2,761 $2,594 $3,604 $3,708 $0 $500 $1,000 $1,500 $2,000 $2,500 $3,000 $3,500 $4,000 Q1'09(1) Q2'09 Q3'09 Q4'09 Q1'10 Resulting In Higher After-Tax Net Income and Return On Equity ($ in 000s) 1. Q1’09 excludes $4.7mm after tax loss on sale of Fannie Mae preferred stock due to US government conservatorship. Return On Equity 17. 20% 15.68% ( 1) 14.63% 13.18% 17.52% 8 |
 $2,809 $3,374 $3,956 $4,754 $5,270 $0 $1,000 $2,000 $3,000 $4,000 $5,000 $6,000 Q1'09 Q2'09 Q3'09 Q4'09 Q1'10 Allowance For Loan Loss 9 107.6% 84.4% 207.6% 114.6% % of Non- Performing Loans 167.4% |
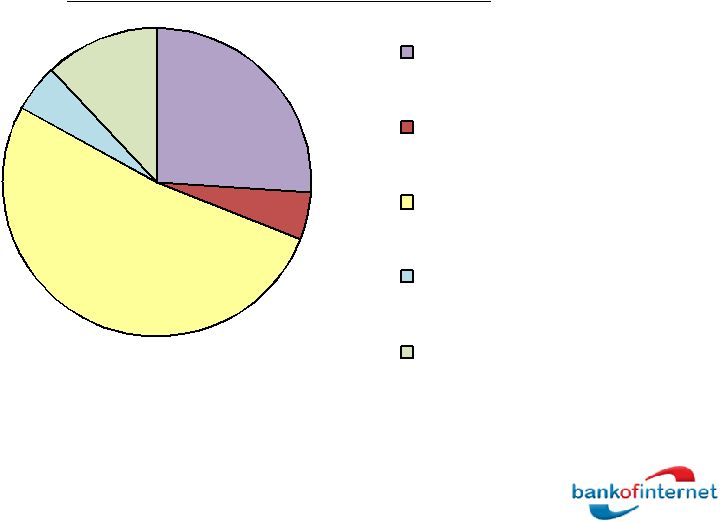 26% 5% 52% 5% 12% SF Residential Home Equity Multifamily Commercial Consumer & Other Loan Diversity – September 30, 2009 100% = $608 mm Loan Portfolio (1) 10 1. Gross loans before premiums, discounts and allowances. |
 Single Family Multifamily Commercial Home Equity 0.59 0.53 0.52 0.58 3.57 4.80 2.76 1.86 Loan Portfolio – Years Seasoned / Loan to Value Weighted-Average Years Since Origination and Weighted-Average Loan to Value, by Loan Type, at 9/30/09 (Number of Years or LTV) WA Years of Seasoning WA Loan to Value 11 |
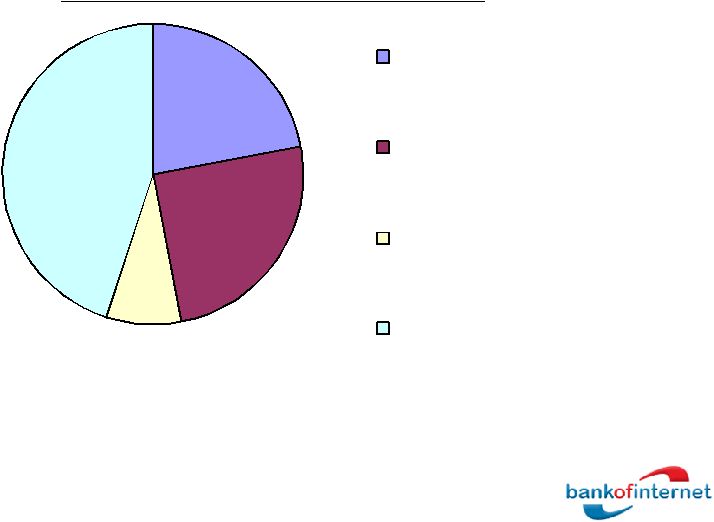 22% 25% 8% 45% Time Deposits <$100k Time Deposits >$100k Demand Savings Deposits – September 30, 2009 100% = $764 mm Deposits 12 |
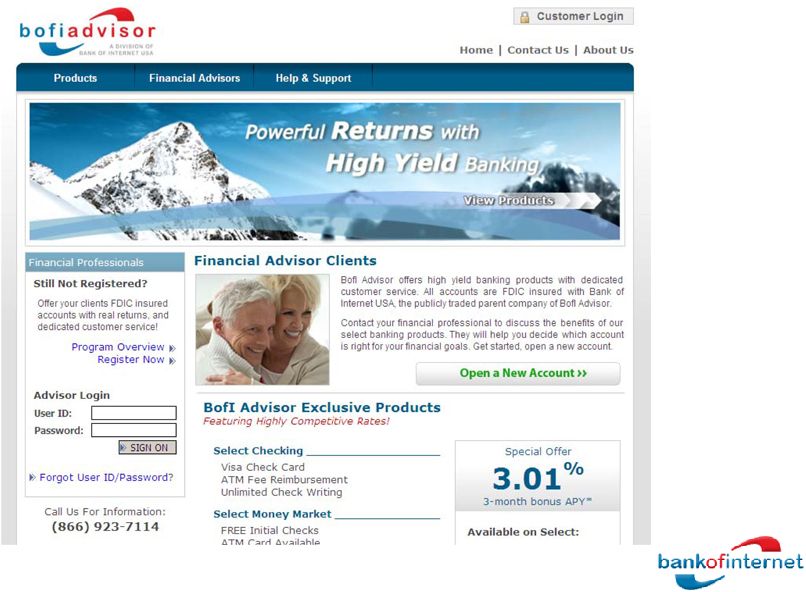 BofI Advisor Represents A Promising Channel Extension For Deposit and Loan Referrals 13 |
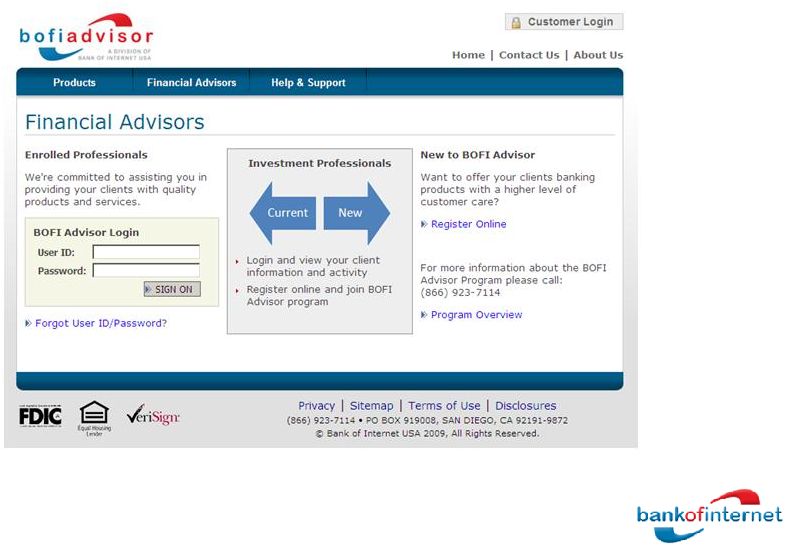 BofI Advisor Allows Us To Quickly And Easily Add Financial Professionals 14 |
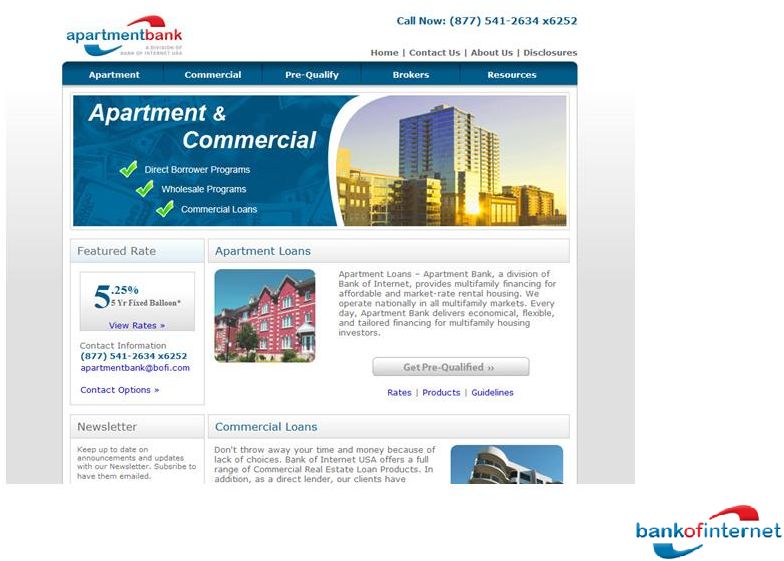 15 We Revised and Updated Our Apartment Bank Site … |
 … And Achieved A Top 3 Organic Ranking 16 |
 Experienced Management Team 27 Key Management Gary Lewis Evans Chief Operating Officer Greg Garrabrants President and CEO 15+ Years Finance / Consulting Previous Experience: 2+ Years with B of I - McKinsey & Co - Major Savings Bank MBA, J.D., CFA Age: 38 - Goldman Sachs - Deloitte & Touche Andrew Micheletti SVP & Chief Financial Officer 17 30+ Years Banking Previous Experience: 10+ Years with B of I - La Jolla Bank; CEO - RTC MS Finance Age: 61 - Home Fed - Marina 25+ Years Financial Services Previous Experience: 9+ Years with B of I - LPL Financial; CFO - Telespectrum CPA, BS Accounting Age: 52 - Imperial Savings - Deloitte & Touche |
 Investment Considerations High-Quality Consumer Franchise Attractive Valuation Scalability Strong Credit Quality Significant Earnings Upside Potential 18 |
 |