
Axos Financial, Inc. Investor Presentation August 2020 NYSE: AX
Safe Harbor This presentation contains forward-looking statements within the meaning of the Private Securities Litigation Reform Act of 1995 (the “Reform Act”). The words “believe,” “expect,” “anticipate,” “estimate,” “project,” or the negation thereof or similar expressions constitute forward-looking statements within the meaning of the Reform Act. These statements may include, but are not limited to, projections of revenues, income or loss, projected consummation of pending acquisitions, estimates of capital expenditures, plans for future operations, products or services, the effects of the COVID-19 pandemic, and financing needs or plans, as well as assumptions relating to these matters. Such statements involve risks, uncertainties and other factors that may cause actual results, performance or achievements of the Company and its subsidiaries to be materially different from any future results, performance or achievements expressed or implied by such forward- looking statements. For a discussion of these factors, we refer you to the Company's reports filed with the Securities and Exchange Commission, including its Annual Report on Form 10-K for the year ended June 30, 2019 and our last earnings press release. In light of the significant uncertainties inherent in the forward-looking statements included herein, the inclusion of such information should not be regarded as a representation by the Company or by any other person or entity that the objectives and plans of the Company will be achieved. For all forward-looking statements, the Company claims the protection of the safe-harbor for forward-looking statements contained in the 1 Reform Act.
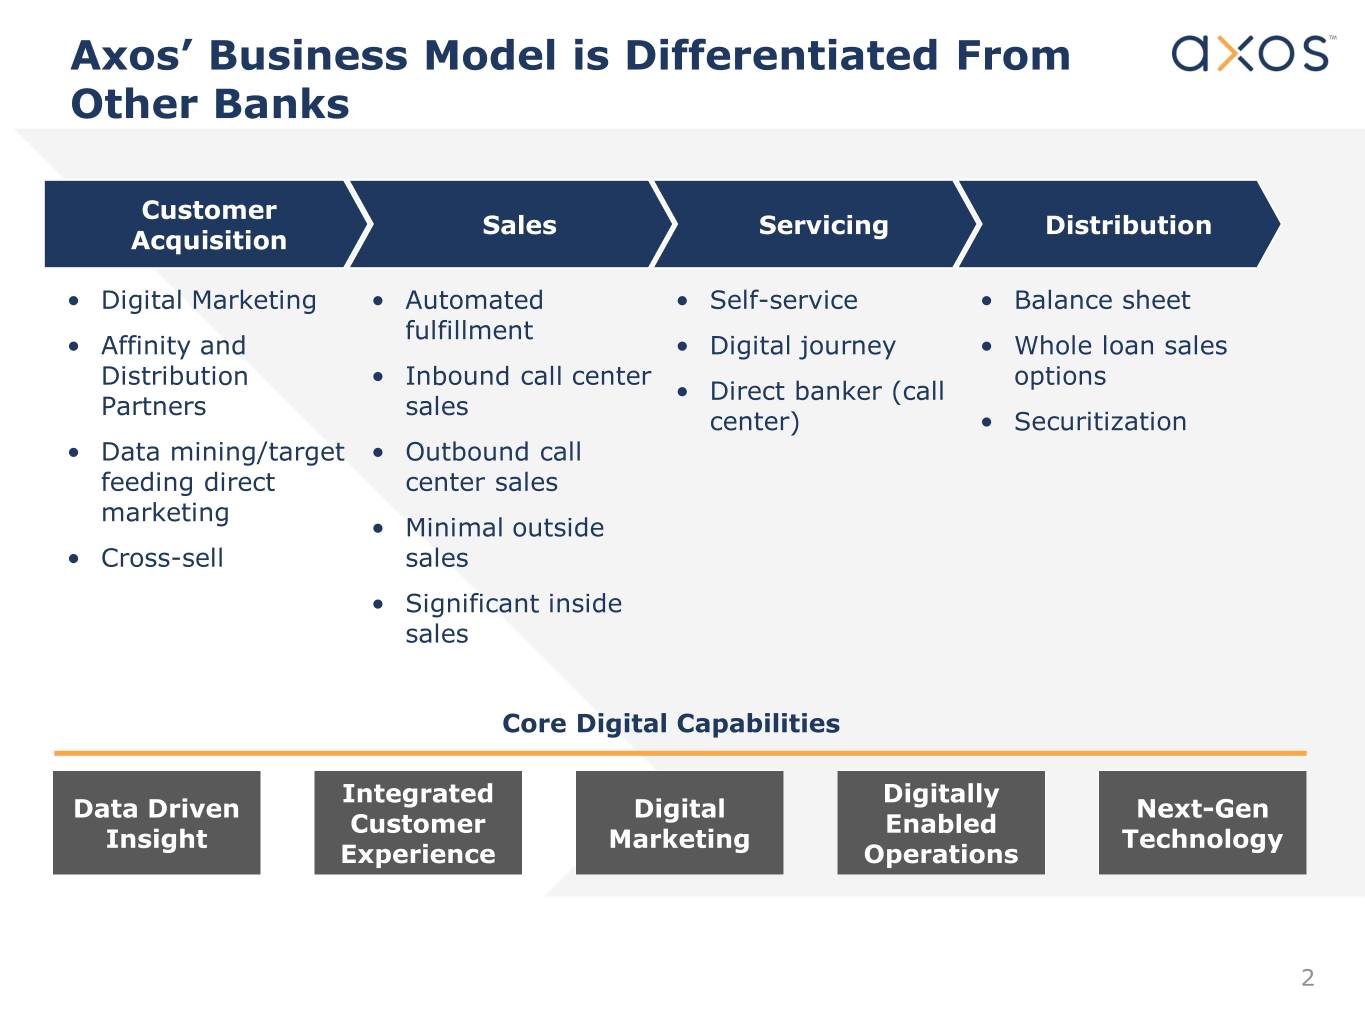
Axos’ Business Model is Differentiated From Other Banks Customer Sales Servicing Distribution Acquisition • Digital Marketing • Automated • Self-service • Balance sheet fulfillment • Affinity and • Digital journey • Whole loan sales Distribution • Inbound call center options • Direct banker (call Partners sales center) • Securitization • Data mining/target • Outbound call feeding direct center sales marketing • Minimal outside • Cross-sell sales • Significant inside sales Core Digital Capabilities Integrated Digitally Data Driven Digital Next-Gen Customer Enabled Insight Marketing Technology Experience Operations 2
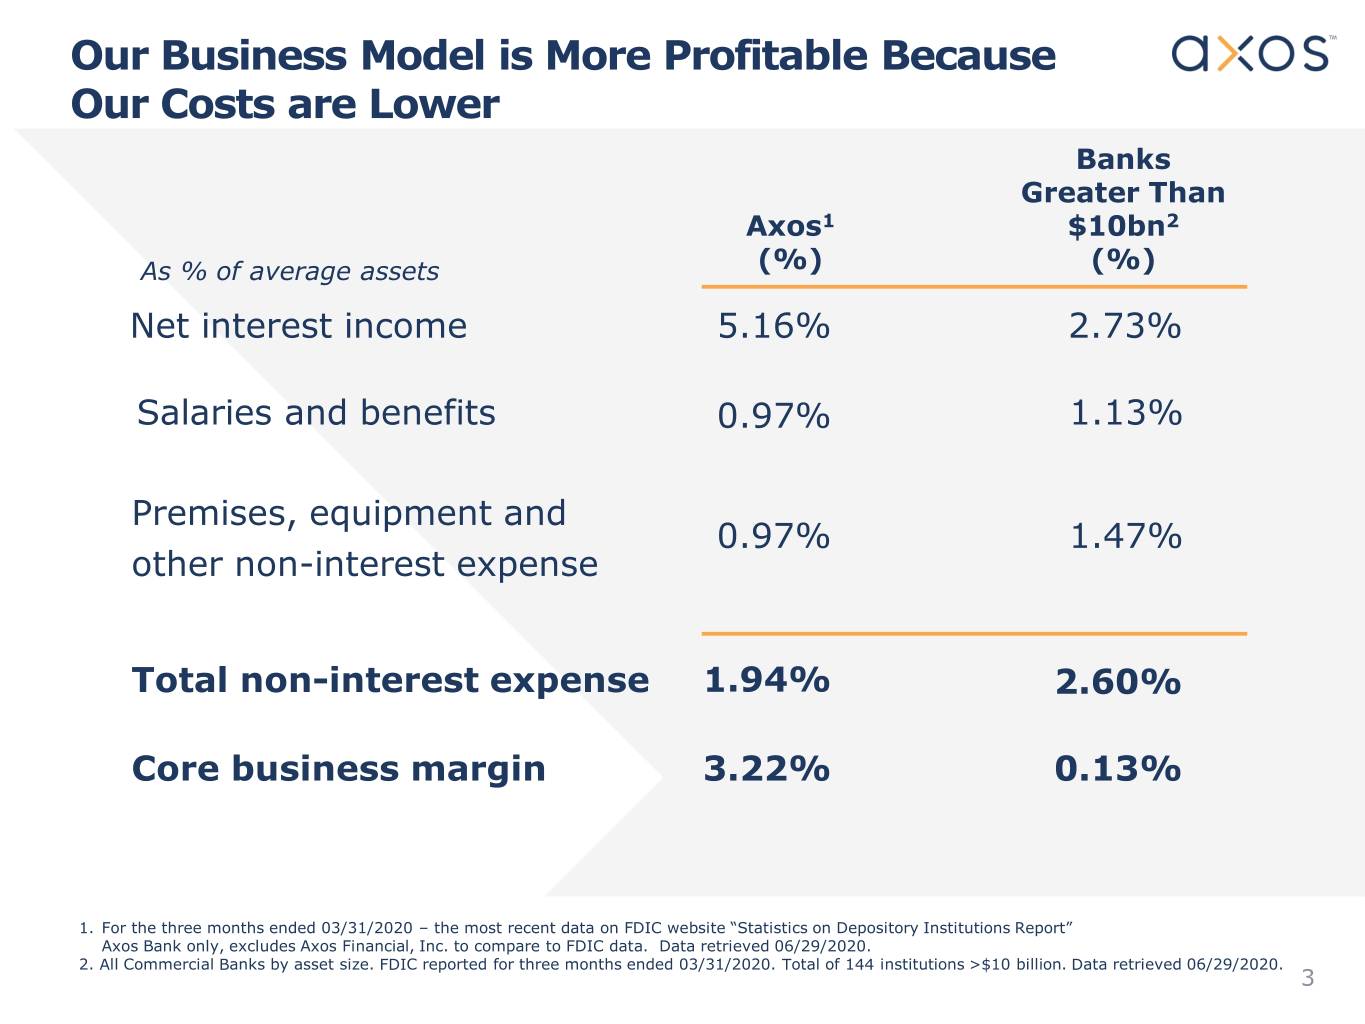
Our Business Model is More Profitable Because Our Costs are Lower Banks Greater Than Axos1 $10bn2 As % of average assets (%) (%) Net interest income 5.16% 2.73% Salaries and benefits 0.97% 1.13% Premises, equipment and 0.97% 1.47% other non-interest expense Total non-interest expense 1.94% 2.60% Core business margin 3.22% 0.13% 1. For the three months ended 03/31/2020 – the most recent data on FDIC website “Statistics on Depository Institutions Report” Axos Bank only, excludes Axos Financial, Inc. to compare to FDIC data. Data retrieved 06/29/2020. 2. All Commercial Banks by asset size. FDIC reported for three months ended 03/31/2020. Total of 144 institutions >$10 billion. Data retrieved 06/29/2020. 3
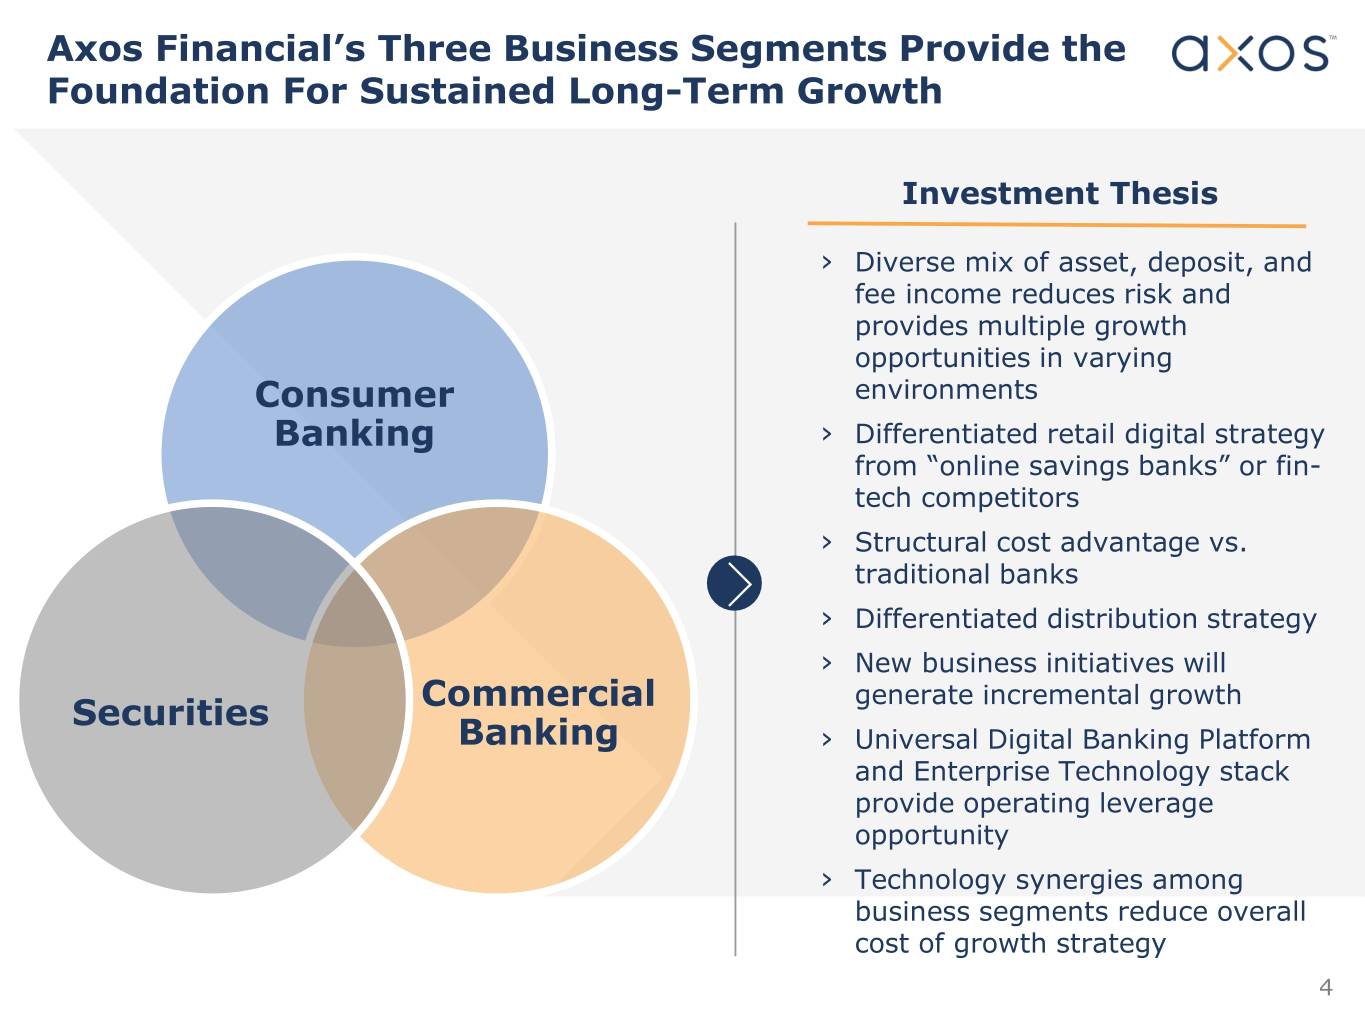
Axos Financial’s Three Business Segments Provide the Foundation For Sustained Long-Term Growth Investment Thesis › Diverse mix of asset, deposit, and fee income reduces risk and provides multiple growth opportunities in varying Consumer environments Banking › Differentiated retail digital strategy from “online savings banks” or fin- tech competitors › Structural cost advantage vs. traditional banks › Differentiated distribution strategy › New business initiatives will Commercial generate incremental growth Securities Banking › Universal Digital Banking Platform and Enterprise Technology stack provide operating leverage opportunity › Technology synergies among business segments reduce overall cost of growth strategy 4
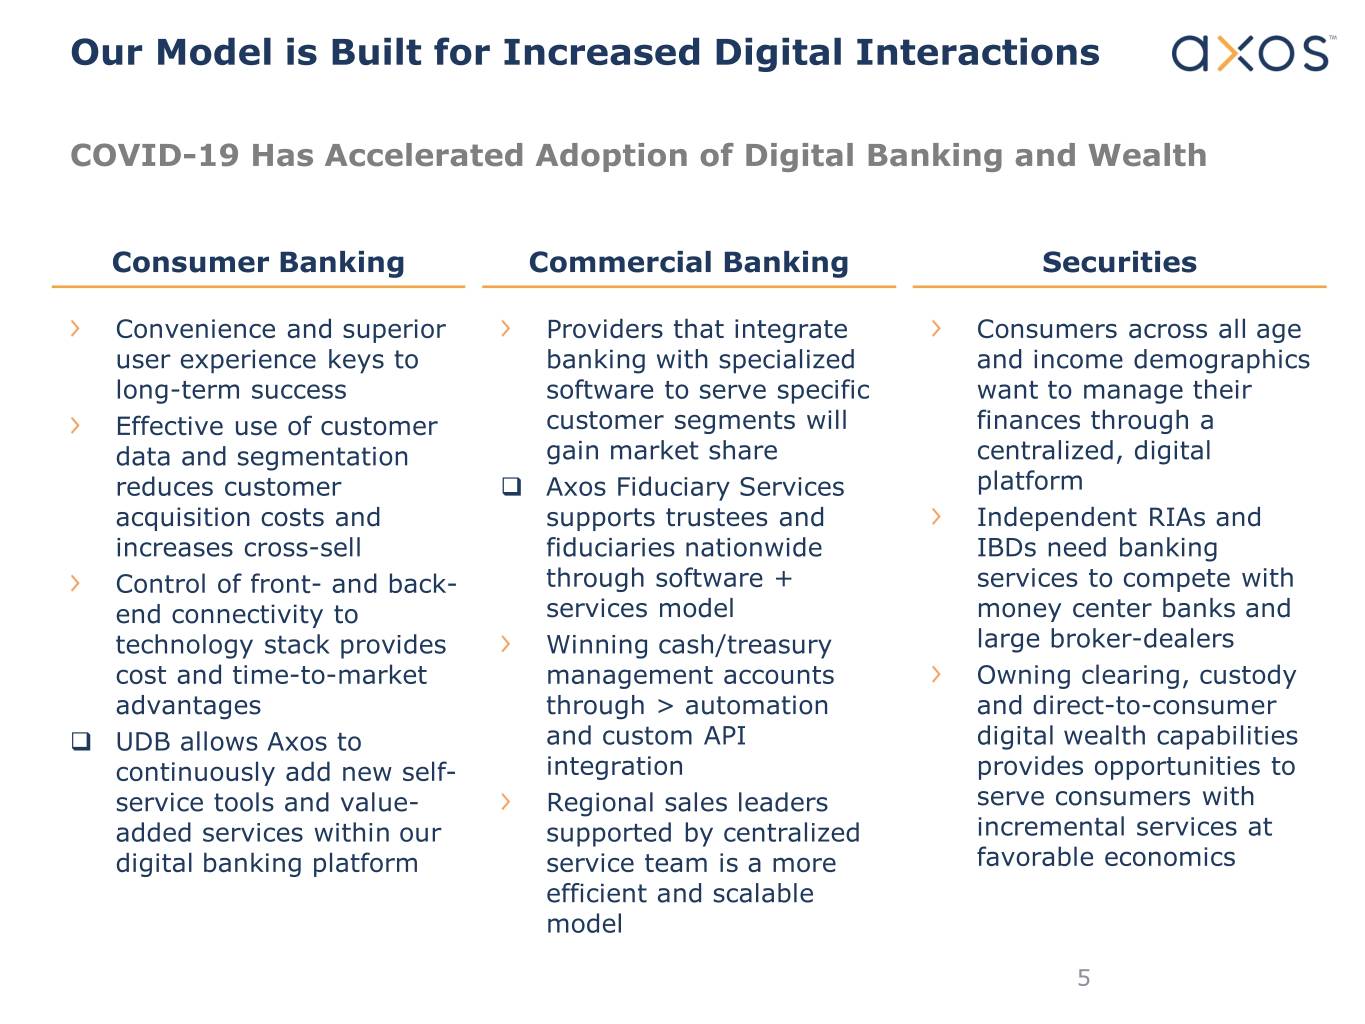
Our Model is Built for Increased Digital Interactions COVID-19 Has Accelerated Adoption of Digital Banking and Wealth Consumer Banking Commercial Banking Securities Convenience and superior Providers that integrate Consumers across all age user experience keys to banking with specialized and income demographics long-term success software to serve specific want to manage their Effective use of customer customer segments will finances through a data and segmentation gain market share centralized, digital reduces customer Axos Fiduciary Services platform acquisition costs and supports trustees and Independent RIAs and increases cross-sell fiduciaries nationwide IBDs need banking Control of front- and back- through software + services to compete with end connectivity to services model money center banks and technology stack provides Winning cash/treasury large broker-dealers cost and time-to-market management accounts Owning clearing, custody advantages through > automation and direct-to-consumer UDB allows Axos to and custom API digital wealth capabilities continuously add new self- integration provides opportunities to service tools and value- Regional sales leaders serve consumers with added services within our supported by centralized incremental services at digital banking platform service team is a more favorable economics efficient and scalable model 5
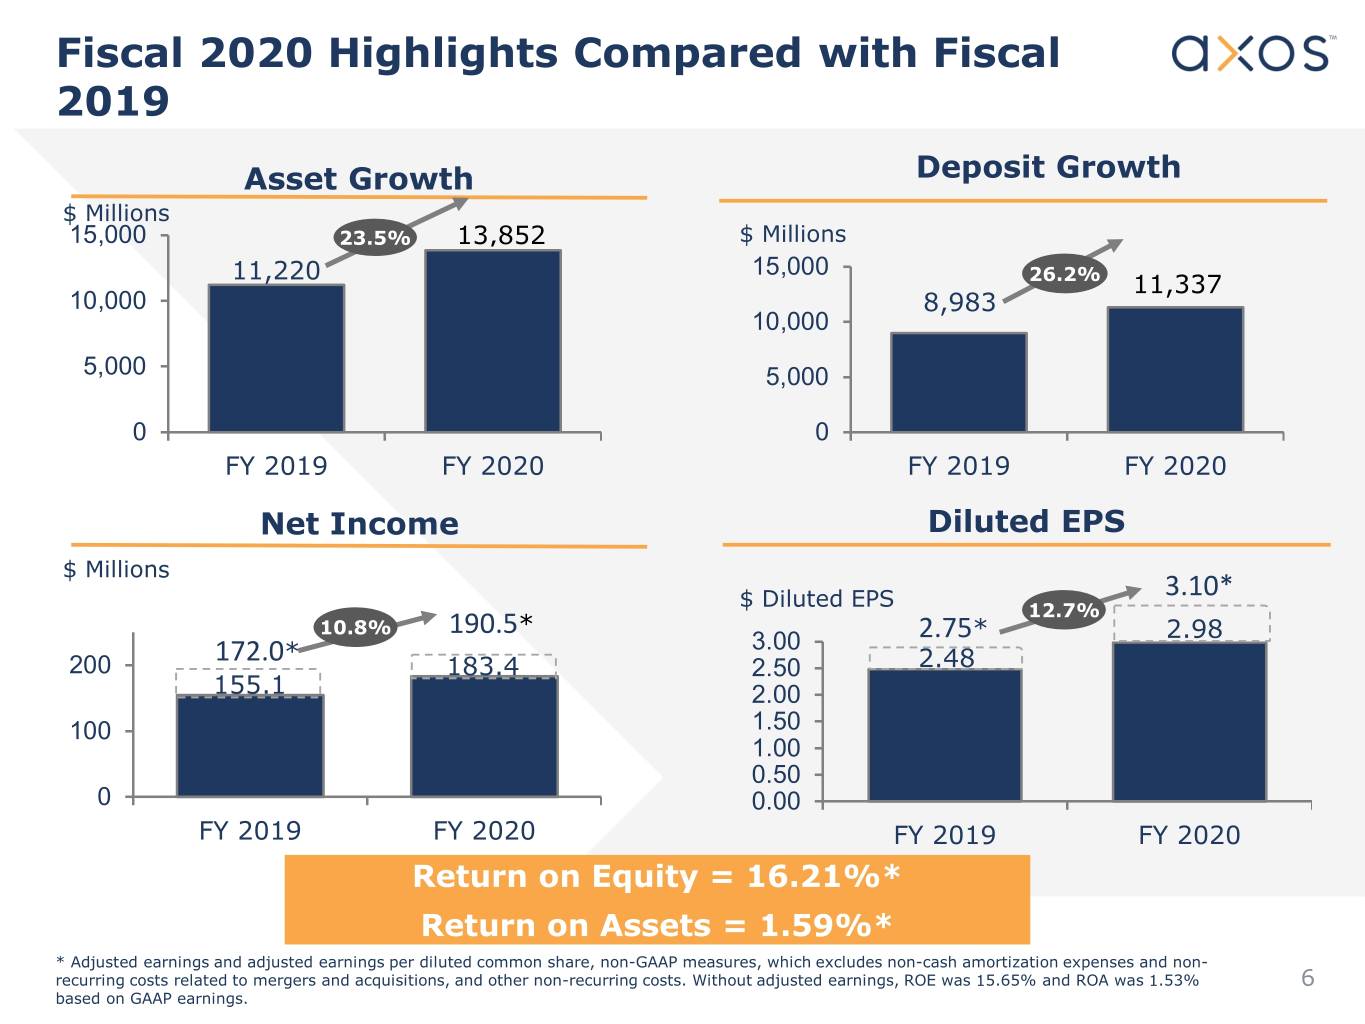
Fiscal 2020 Highlights Compared with Fiscal 2019 Asset Growth Deposit Growth $ Millions 15,000 23.5% 13,852 $ Millions 11,220 15,000 26.2% 11,337 10,000 8,983 10,000 5,000 5,000 0 0 FY 2019 FY 2020 FY 2019 FY 2020 Net Income Diluted EPS $ Millions 3.10* $ Diluted EPS 12.7% 10.8% 190.5* 2.75* 2.98 172.0* 3.00 200 183.4 2.50 2.48 155.1 2.00 100 1.50 1.00 0.50 0 0.00 FY 2019 FY 2020 FY 2019 FY 2020 Return on Equity = 16.21%* Return on Assets = 1.59%* * Adjusted earnings and adjusted earnings per diluted common share, non-GAAP measures, which excludes non-cash amortization expenses and non- recurring costs related to mergers and acquisitions, and other non-recurring costs. Without adjusted earnings, ROE was 15.65% and ROA was 1.53% 6 based on GAAP earnings.

Fiscal 2020 Fourth Quarter Highlights Compared with Fiscal 2019 Fourth Quarter Asset Growth Deposit Growth $ Millions 15,000 13,852 $ Millions 23.5% 11,220 15,000 11,337 10,000 26.2% 10,000 8,983 5,000 5,000 0 0 Q4 2019 Q4 2020 Q4 2019 Q4 2020 Net Income Diluted EPS $ Millions $ Diluted EPS 0.78* 100 1.00 14.7% 47.1* 0.68* 11.6% 0.80 0.75 42.2* 0.66 45.3 0.60 50 40.6 0.40 0.20 0 0.00 Q4 2019 Q4 2020 Q4 2019 Q4 2020 Return on Equity = 15.24%* Return on Assets = 1.51%* * Adjusted earnings and adjusted earnings per diluted common share, non-GAAP measures, which excludes non-cash amortization expenses and non- recurring costs related to mergers and acquisitions, and other non-recurring costs. Without adjusted earnings, ROE was 14.71% and ROA was 1.45% 7 based on GAAP earnings.
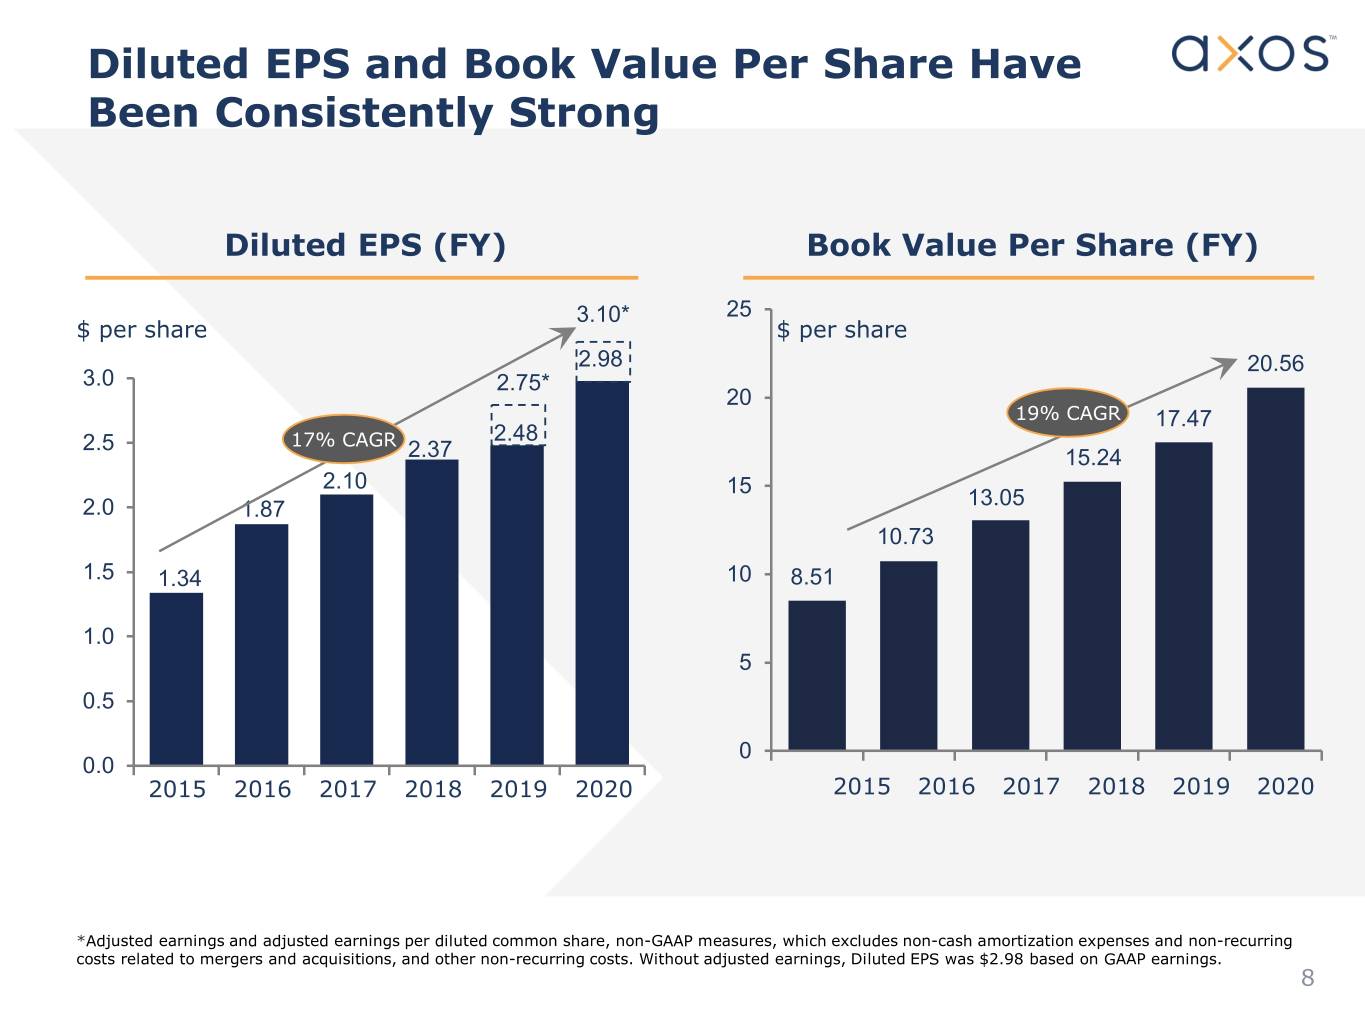
Diluted EPS and Book Value Per Share Have Been Consistently Strong Diluted EPS (FY) Book Value Per Share (FY) 3.10* 25 $ per share $ per share 2.98 20.56 3.0 2.75* 20 19% CAGR 17.47 2.5 17% CAGR 2.48 2.37 15.24 2.10 15 13.05 2.0 1.87 10.73 1.5 1.34 10 8.51 1.0 5 0.5 0 0.0 2015 2016 2017 2018 2019 2020 2015 2016 2017 2018 2019 2020 *Adjusted earnings and adjusted earnings per diluted common share, non-GAAP measures, which excludes non-cash amortization expenses and non-recurring costs related to mergers and acquisitions, and other non-recurring costs. Without adjusted earnings, Diluted EPS was $2.98 based on GAAP earnings. 8
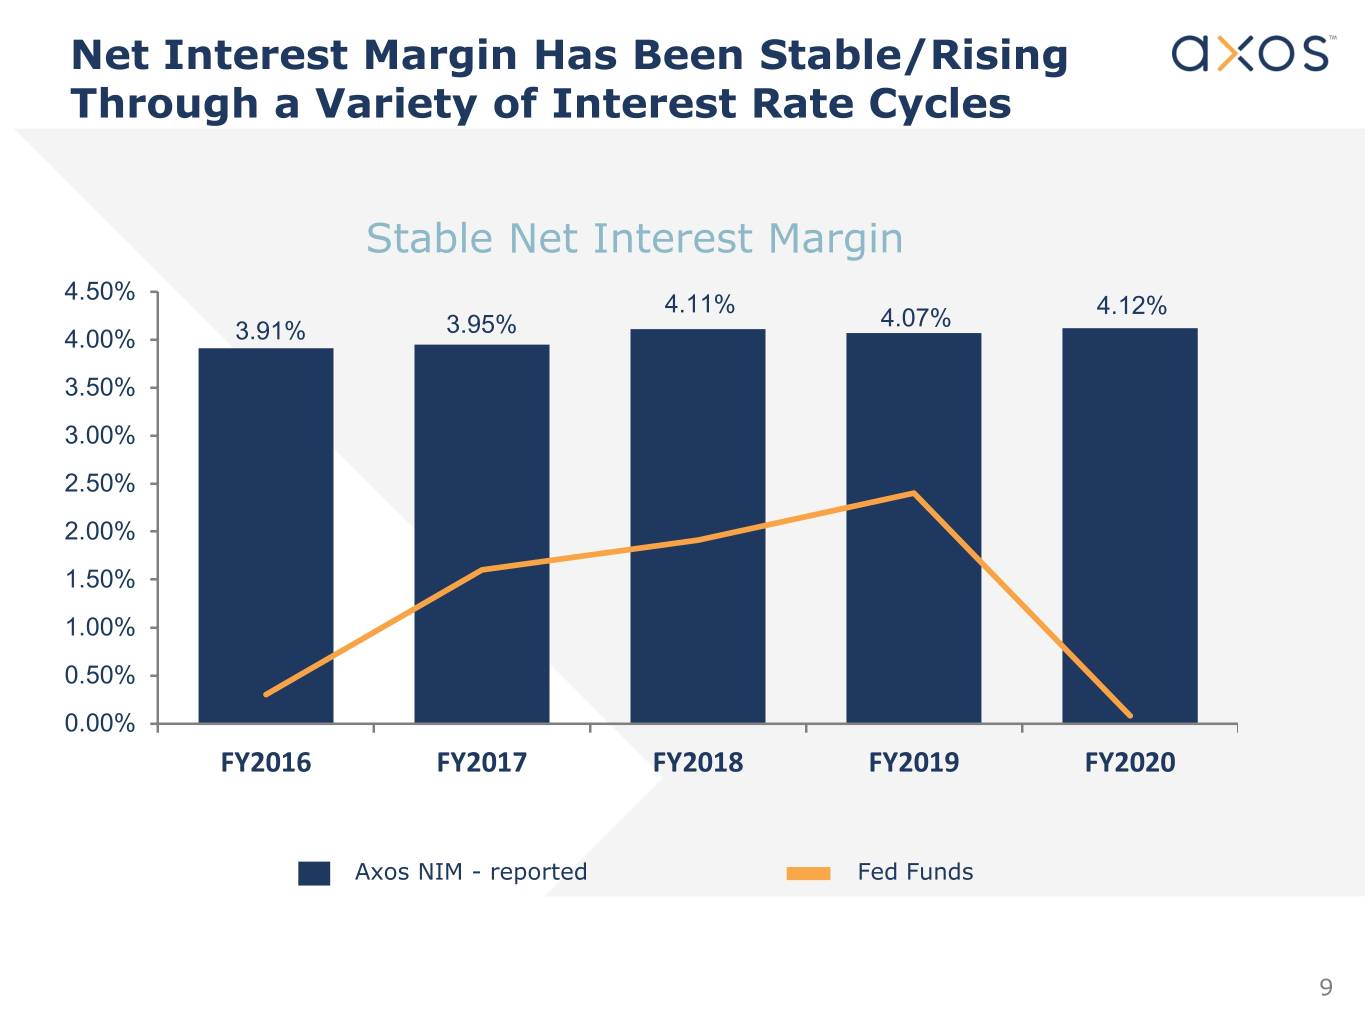
Net Interest Margin Has Been Stable/Rising Through a Variety of Interest Rate Cycles Stable Net Interest Margin 4.50% 4.11% 4.12% 3.95% 4.07% 4.00% 3.91% 3.50% 3.00% 2.50% 2.00% 1.50% 1.00% 0.50% 0.00% FY2016 FY2017 FY2018 FY2019 FY2020 Axos NIM - reported Fed Funds 9

Axos is a Top Quartile Performer Versus Bank Peer Group Axos Bank Peer Group Percentile ROAA 2.03% 0.41% 95% Return on equity 22.26% 5.43% 96% G&A 1.90% 2.61% 22% Efficiency ratio 33.03% 67.38% 4% The 96% on ROE means that the Bank outperformed 96% of all banks. The 22% G&A ranking means that only 22% of banks spend less on G&A than Axos. Peer group includes savings banks greater than $1 billion. Source: Uniform Bank Performance Report (UBPR) as of 3/31/20; data retrieved 06/30/2020. Note: Peer group is all savings banks with assets greater than $1 billion for quarter ended 3/31/2020. 10
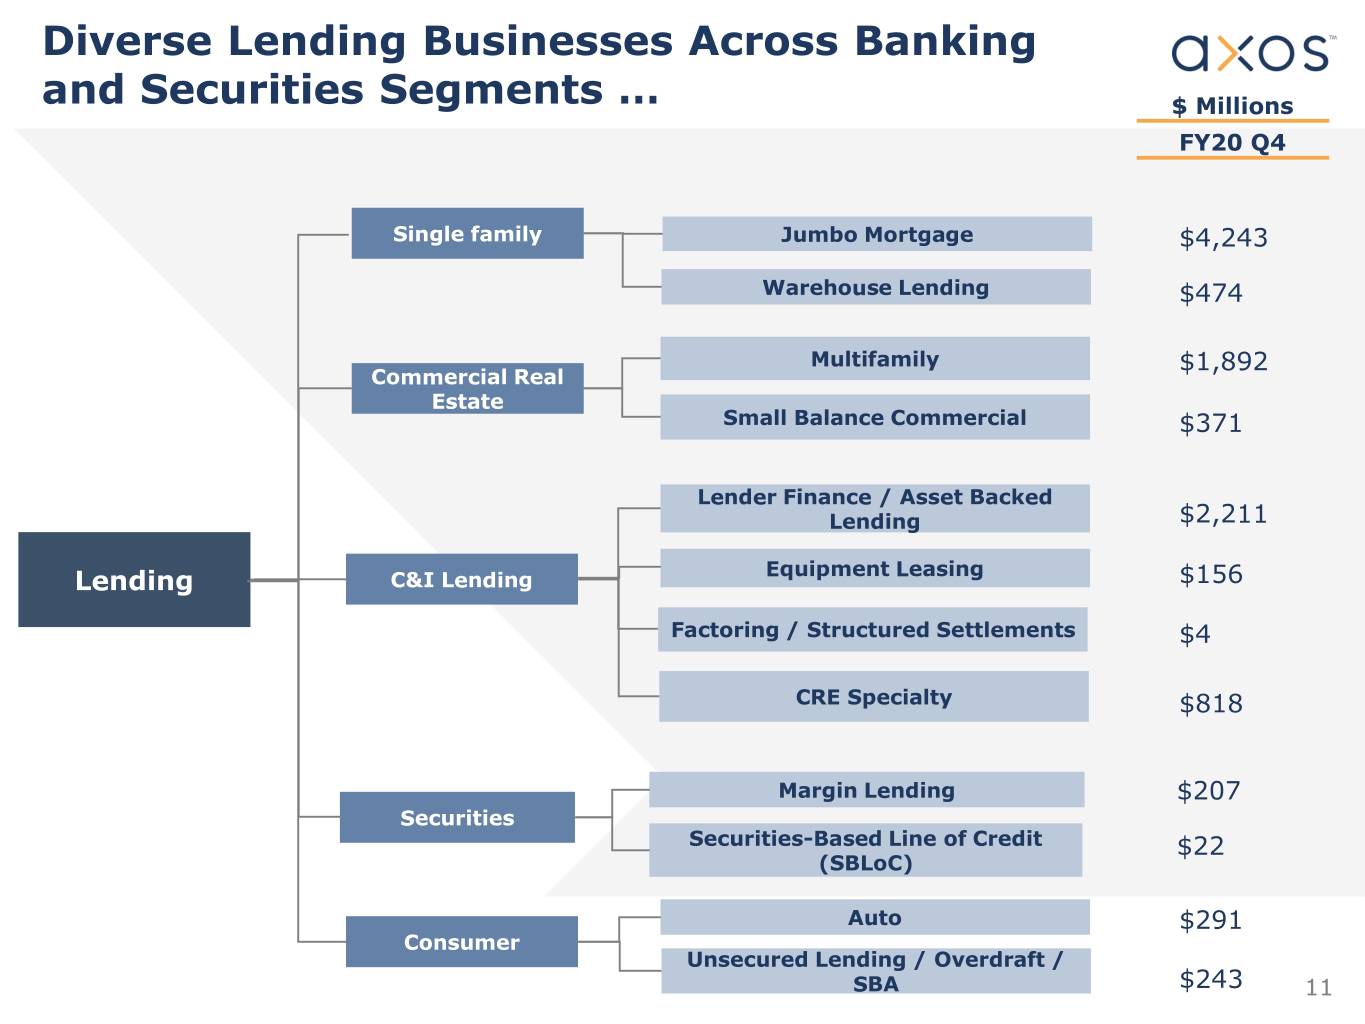
Diverse Lending Businesses Across Banking and Securities Segments … $ Millions FY20 Q4 Single family Jumbo Mortgage $4,243 Warehouse Lending $474 Multifamily $1,892 Commercial Real Estate Small Balance Commercial $371 Lender Finance / Asset Backed Lending $2,211 Equipment Leasing Lending C&I Lending $156 Factoring / Structured Settlements $4 CRE Specialty $818 Margin Lending $207 Securities Securities-Based Line of Credit $22 (SBLoC) Auto $291 Consumer Unsecured Lending / Overdraft / SBA $243 11
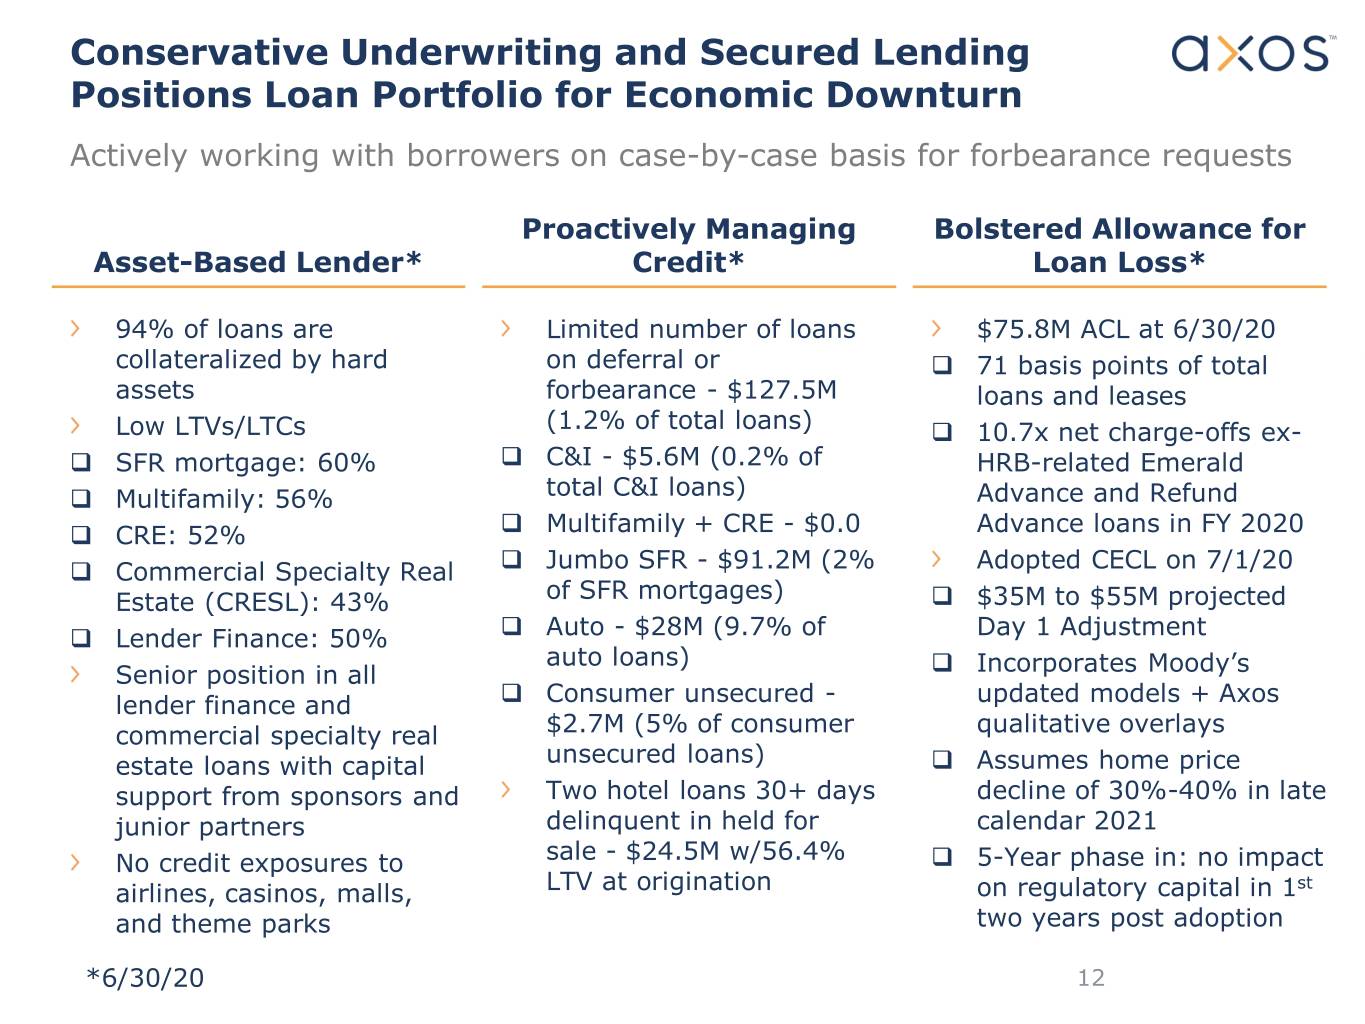
Conservative Underwriting and Secured Lending Positions Loan Portfolio for Economic Downturn Actively working with borrowers on case-by-case basis for forbearance requests Proactively Managing Bolstered Allowance for Asset-Based Lender* Credit* Loan Loss* 94% of loans are Limited number of loans $75.8M ACL at 6/30/20 collateralized by hard on deferral or 71 basis points of total assets forbearance - $127.5M loans and leases Low LTVs/LTCs (1.2% of total loans) 10.7x net charge-offs ex- SFR mortgage: 60% C&I - $5.6M (0.2% of HRB-related Emerald Multifamily: 56% total C&I loans) Advance and Refund CRE: 52% Multifamily + CRE - $0.0 Advance loans in FY 2020 Commercial Specialty Real Jumbo SFR - $91.2M (2% Adopted CECL on 7/1/20 Estate (CRESL): 43% of SFR mortgages) $35M to $55M projected Lender Finance: 50% Auto - $28M (9.7% of Day 1 Adjustment auto loans) Senior position in all Incorporates Moody’s lender finance and Consumer unsecured - updated models + Axos commercial specialty real $2.7M (5% of consumer qualitative overlays estate loans with capital unsecured loans) Assumes home price support from sponsors and Two hotel loans 30+ days decline of 30%-40% in late junior partners delinquent in held for calendar 2021 No credit exposures to sale - $24.5M w/56.4% 5-Year phase in: no impact airlines, casinos, malls, LTV at origination on regulatory capital in 1st and theme parks two years post adoption *6/30/20 12

Our Asset Growth has been Driven by Strong and Profitable Organic Loan Production Net Loan Portfolio – End of Last Five Quarters ($ in Thousands) 10Q $12,000,000 $10,631,349 $10,141,397 $10,372,921 $10,000,000 $9,382,124 $9,784,217 $8,000,000 $6,000,000 $4,000,000 $2,000,000 $- Q4 2019 Q1 2020 Q2 2020 Q3 2020 Q4 2020 Average Multifamily 53% 53% 53% 54% 56% Loan to Value Single family 57% 57% 57% 57% 60% 13
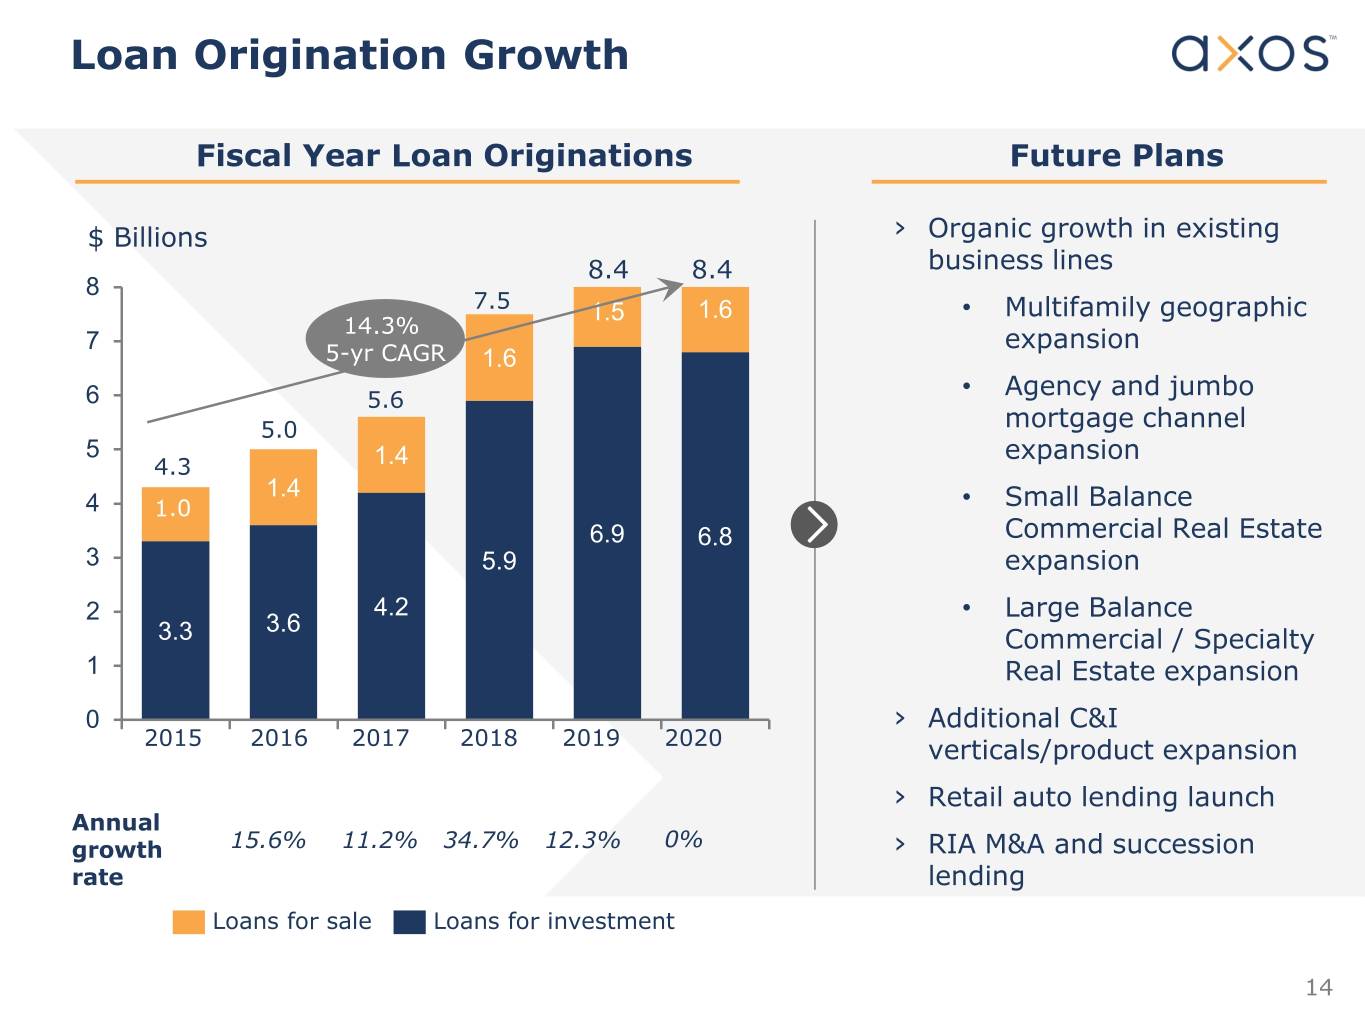
Loan Origination Growth Fiscal Year Loan Originations Future Plans $ Billions › Organic growth in existing 8.4 8.4 business lines 8 7.5 1.5 1.6 • Multifamily geographic 14.3% 7 expansion 5-yr CAGR 1.6 Agency and jumbo 6 5.6 • 5.0 mortgage channel 5 expansion 4.3 1.4 1.4 4 1.0 • Small Balance 6.9 6.8 Commercial Real Estate 3 5.9 expansion 4.2 • Large Balance 2 3.6 3.3 Commercial / Specialty 1 Real Estate expansion 0 › Additional C&I 2015 2016 2017 2018 2019 2020 verticals/product expansion › Retail auto lending launch Annual growth 15.6% 11.2% 34.7% 12.3% 0% › RIA M&A and succession rate lending Loans for sale Loans for investment 14
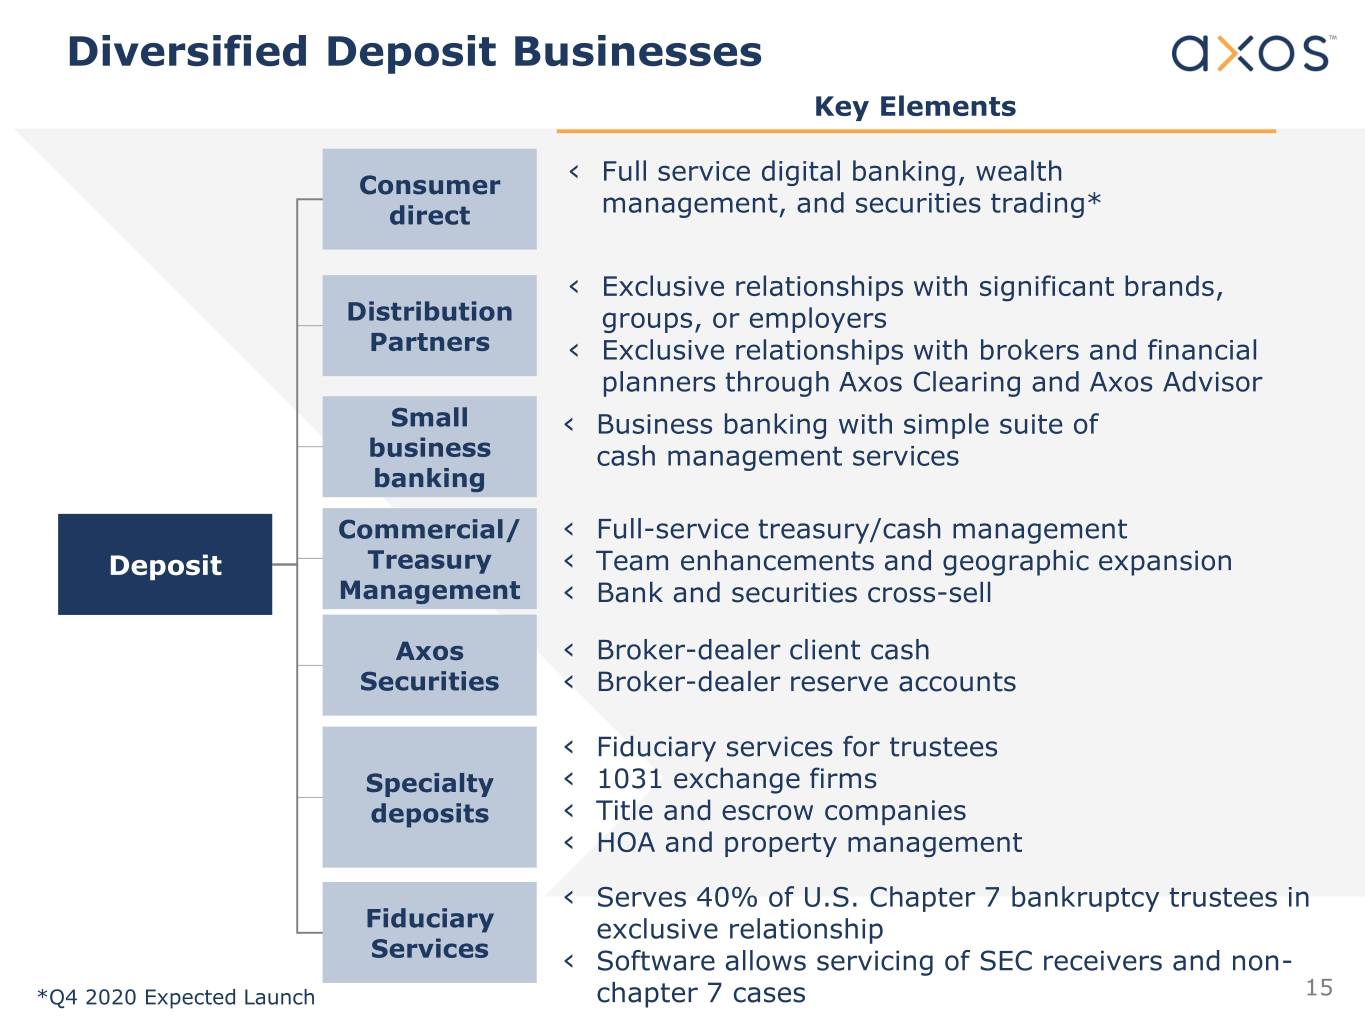
Diversified Deposit Businesses Key Elements Full service digital banking, wealth Consumer ‹ direct management, and securities trading* ‹ Exclusive relationships with significant brands, Distribution groups, or employers Partners ‹ Exclusive relationships with brokers and financial planners through Axos Clearing and Axos Advisor Small ‹ Business banking with simple suite of business cash management services banking Commercial/ ‹ Full-service treasury/cash management Deposit Treasury ‹ Team enhancements and geographic expansion Management ‹ Bank and securities cross-sell Axos ‹ Broker-dealer client cash Securities ‹ Broker-dealer reserve accounts ‹ Fiduciary services for trustees Specialty ‹ 1031 exchange firms deposits ‹ Title and escrow companies ‹ HOA and property management ‹ Serves 40% of U.S. Chapter 7 bankruptcy trustees in Fiduciary exclusive relationship Services ‹ Software allows servicing of SEC receivers and non- *Q4 2020 Expected Launch chapter 7 cases 15

Deposit Growth in Checking, Business, and Savings Was Achieved While Transforming the Mix of Deposits June 30, 2013 June 30, 2020 100% of Deposits = $2.1 billion 100% of Deposits = $11.3 billion Checking and other demand Savings – IRA deposits 2% 19% Time deposits 20% Checking and other demand deposits Time 50% 47%% deposits 31% 31% Savings Savings Checking Growth (6/2013 – 6/2020) = 1,272% Savings Growth (6/2013 – 6/2020) = 476% 16
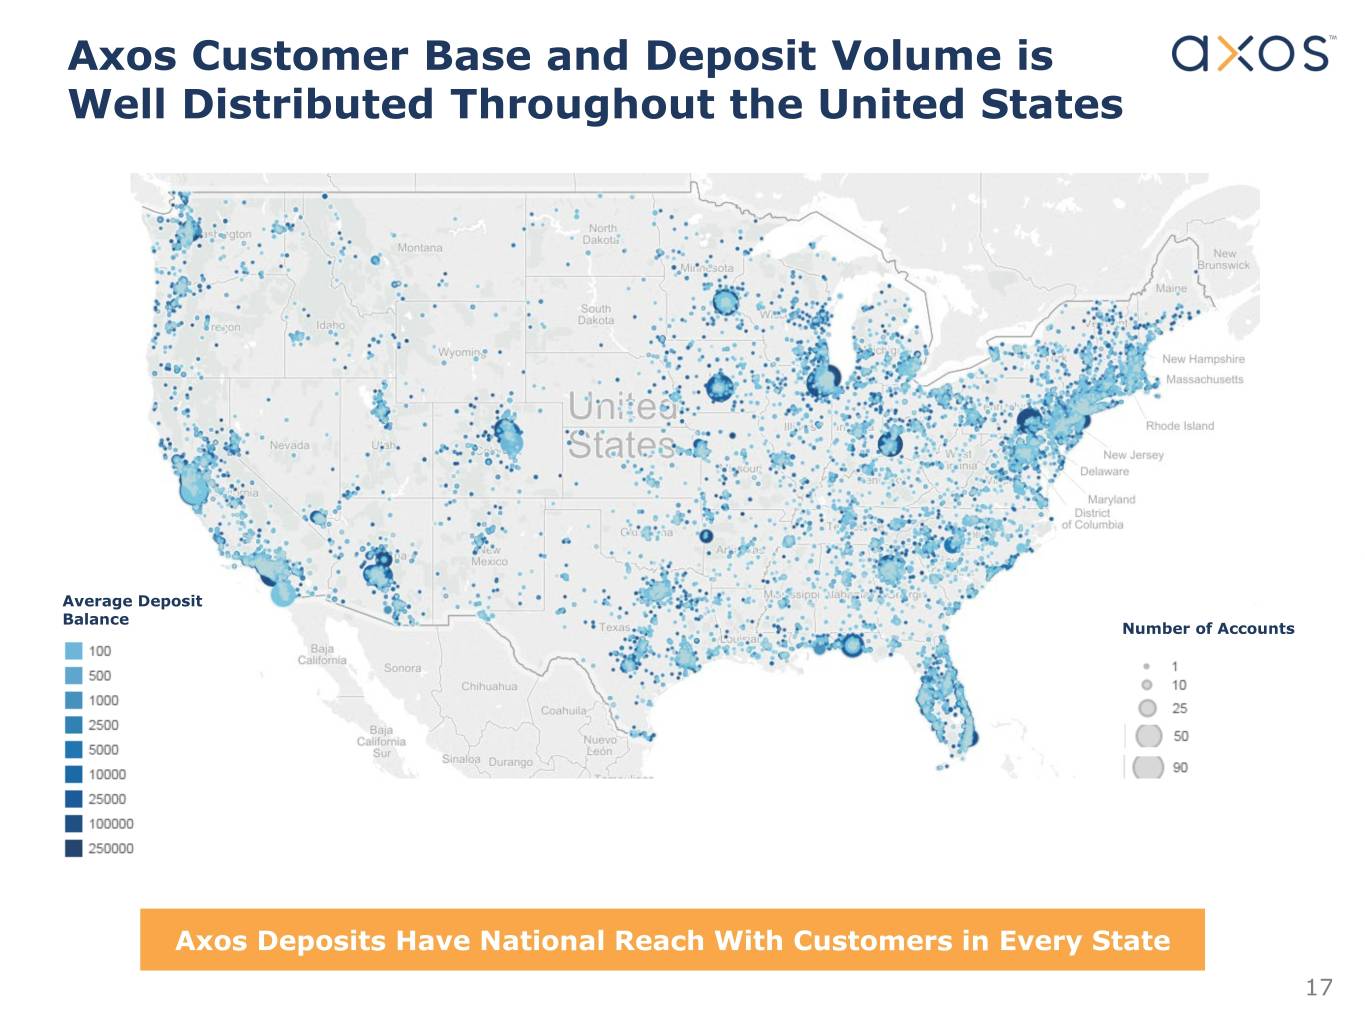
Axos Customer Base and Deposit Volume is Well Distributed Throughout the United States Average Deposit Balance Number of Accounts Axos Deposits Have National Reach With Customers in Every State 17
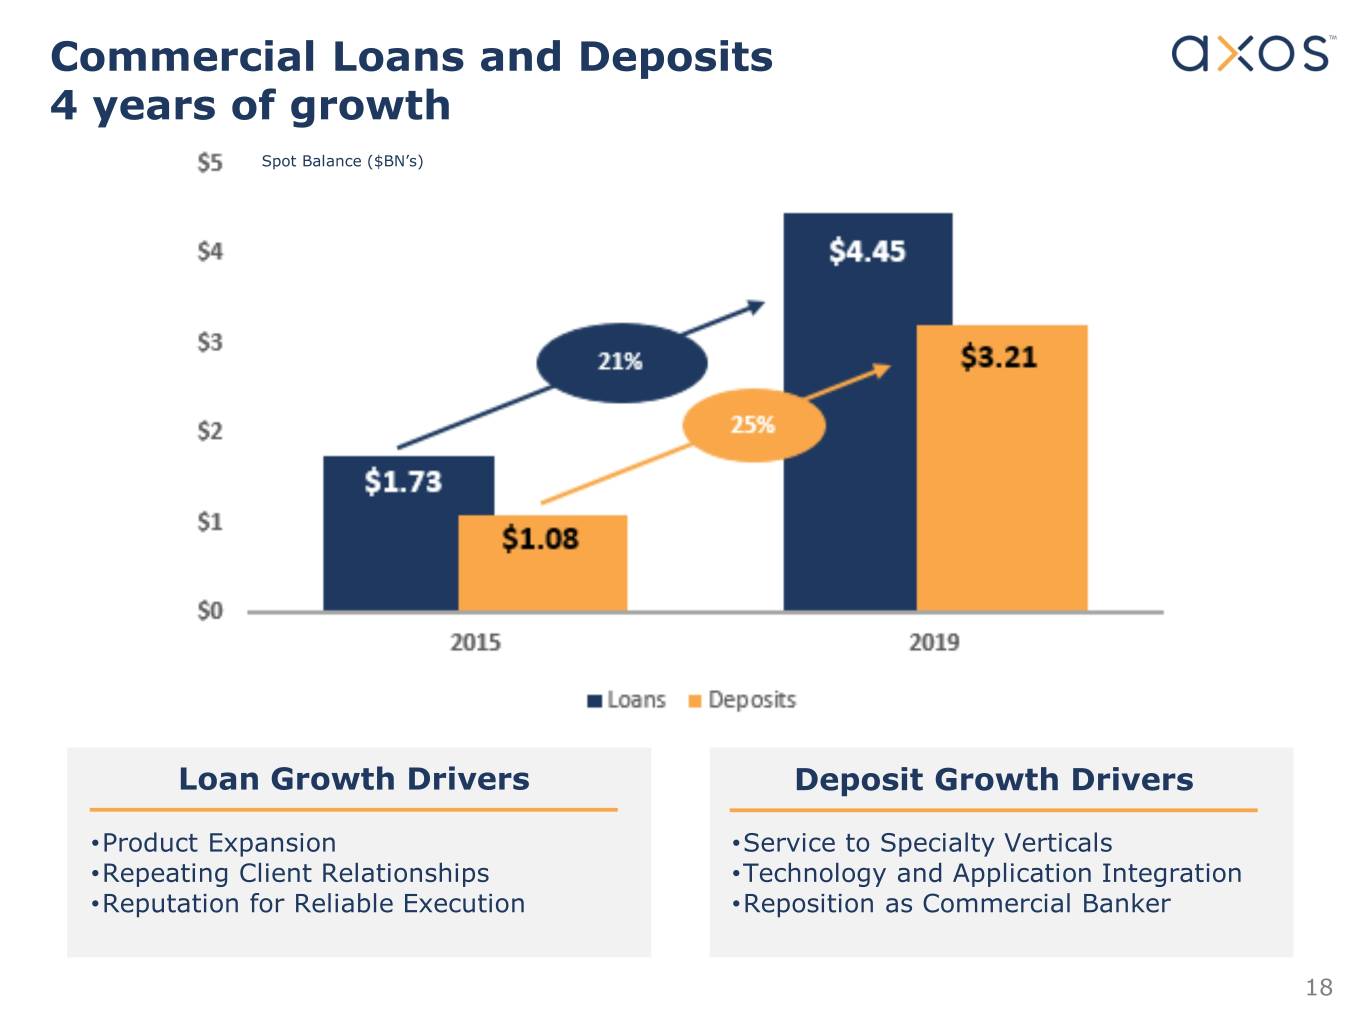
Commercial Loans and Deposits 4 years of growth Spot Balance ($BN’s) Loan Growth Drivers Deposit Growth Drivers •Product Expansion •Service to Specialty Verticals •Repeating Client Relationships •Technology and Application Integration •Reputation for Reliable Execution •Reposition as Commercial Banker 18
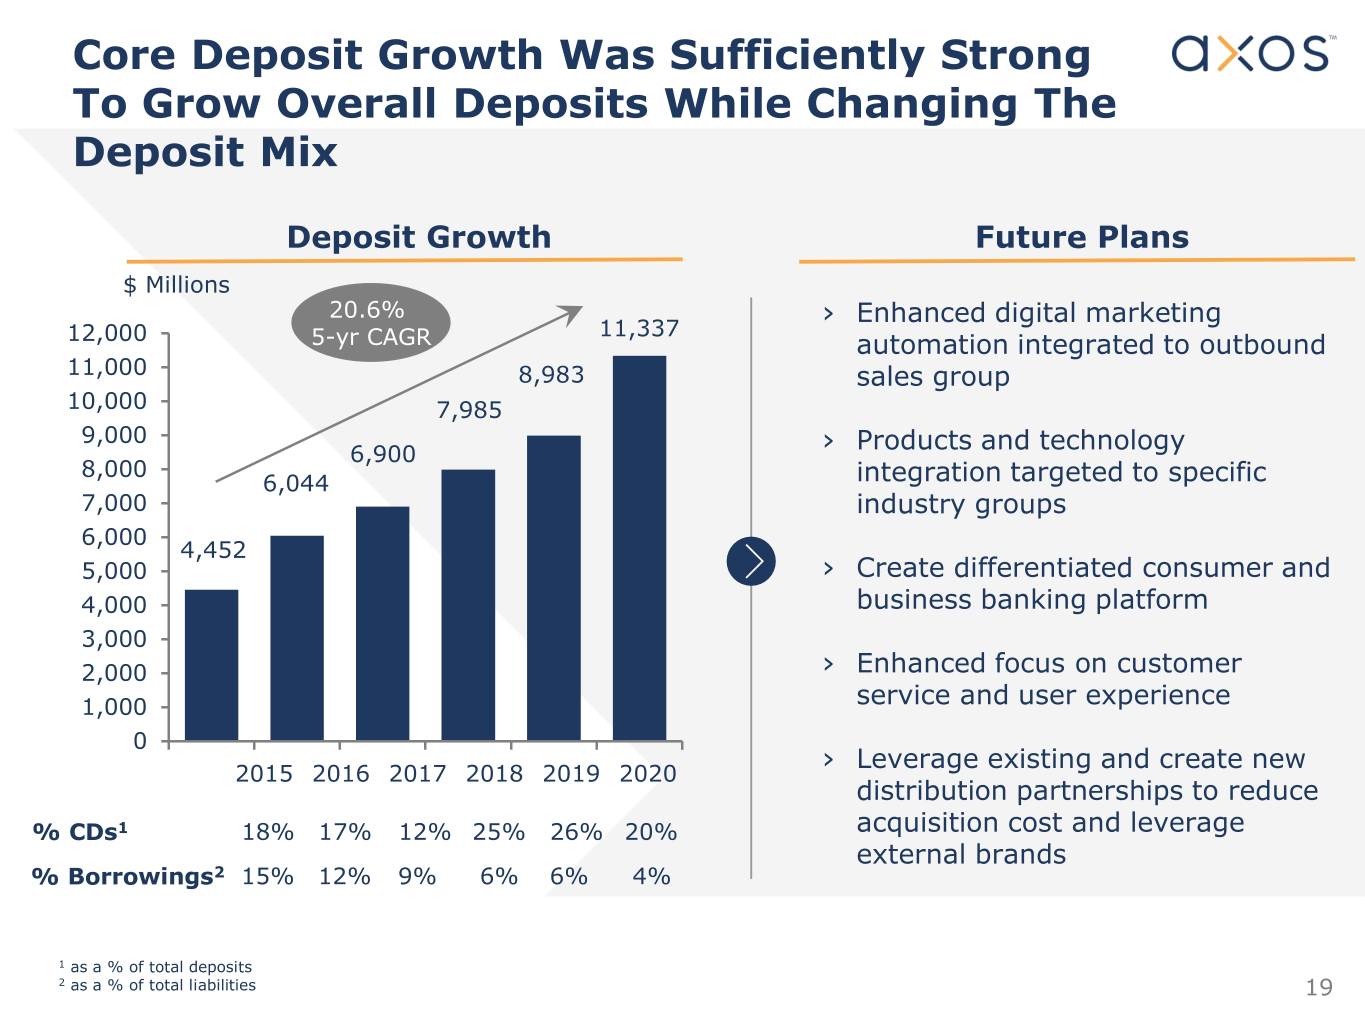
Core Deposit Growth Was Sufficiently Strong To Grow Overall Deposits While Changing The Deposit Mix Deposit Growth Future Plans $ Millions 20.6% › Enhanced digital marketing 11,337 12,000 5-yr CAGR automation integrated to outbound 11,000 8,983 sales group 10,000 7,985 9,000 Products and technology 6,900 › 8,000 6,044 integration targeted to specific 7,000 industry groups 6,000 4,452 5,000 › Create differentiated consumer and 4,000 business banking platform 3,000 2,000 › Enhanced focus on customer 1,000 service and user experience 0 Leverage existing and create new 2015 2016 2017 2018 2019 2020 › distribution partnerships to reduce % CDs1 18% 17% 12% 25% 26% 20% acquisition cost and leverage external brands % Borrowings2 15% 12% 9% 6% 6% 4% 1 as a % of total deposits 2 as a % of total liabilities 19
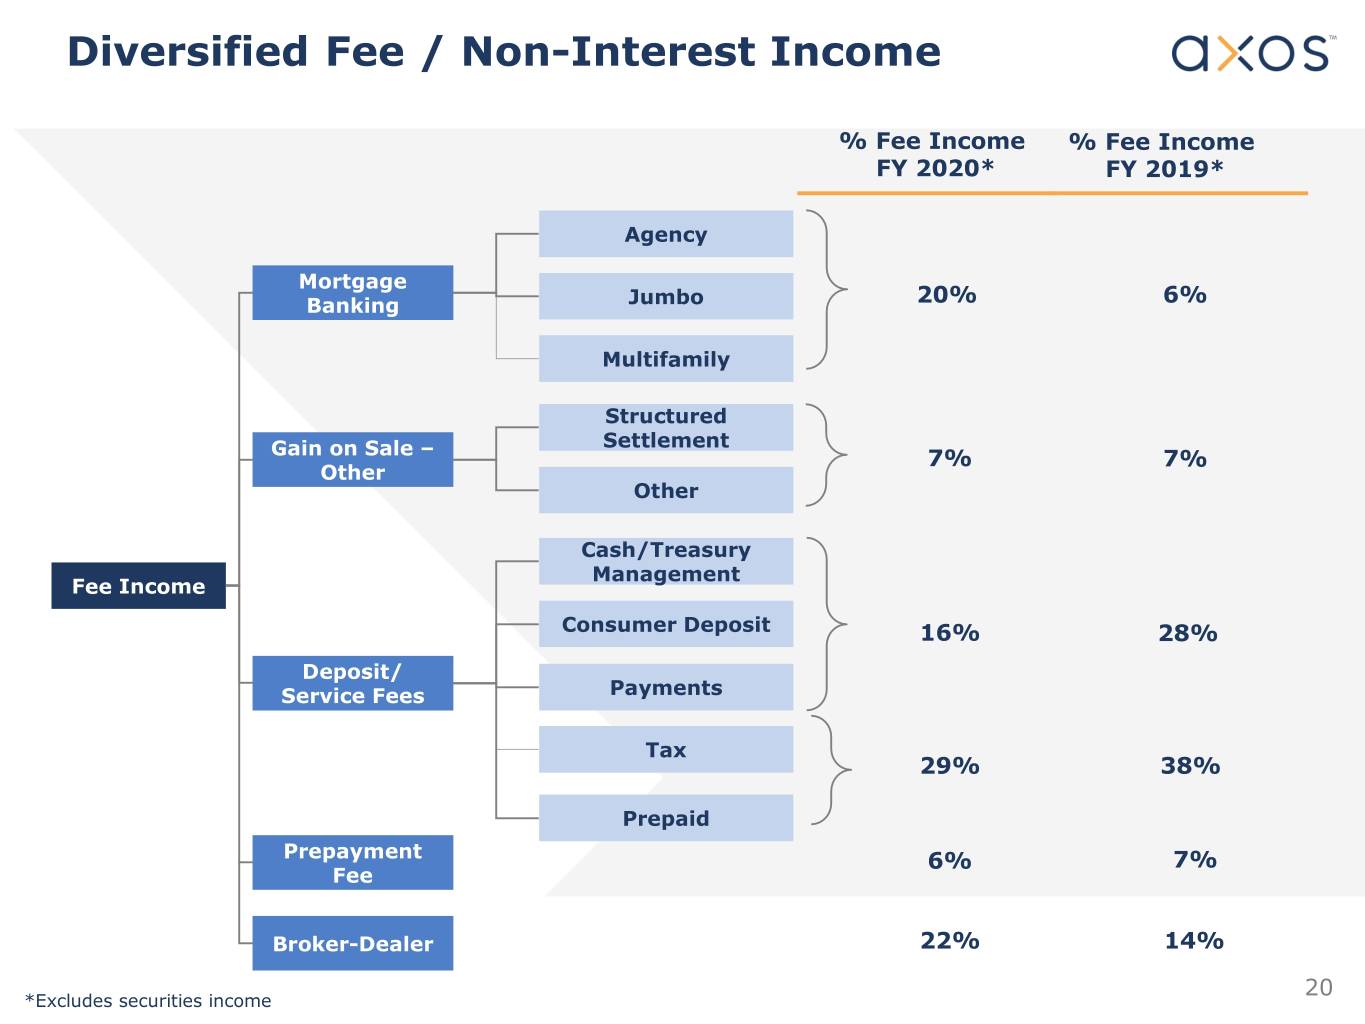
Diversified Fee / Non-Interest Income % Fee Income % Fee Income FY 2020* FY 2019* Agency Mortgage Banking Jumbo 20% 6% Multifamily Structured Settlement Gain on Sale – 7% 7% Other Other Cash/Treasury Management Fee Income Consumer Deposit 16% 28% Deposit/ Service Fees Payments Tax 29% 38% Prepaid Prepayment 6% 7% Fee Broker-Dealer 22% 14% 20 *Excludes securities income

Axos Securities Overview Monetizing synergies by integrating Banking products and services to Securities customers, RIAs, and IBDs Consumer Banking Axos Clearing 62 IBDs Consumer Deposit Accounts Securities Clearing & 110,000 Clients ODL/Margin Accounts Custody Jumbo Single Family Mortgage Loans Axos Invest Commercial Banking Digital Wealth & 24,000 Clients Securities-Backed Lines of Credit Personal Financial Management Cash Management Commercial Property Refinancing Axos Securities Axos Axos Trading¹ Expected Launch Digital Solutions Self-Directing Q4 2020 . Trading Universal Digital Platform Account Opening Platform Access to ~135,000 Clients ¹ Target “go-live” Q4 2020 21

Securities Strategy Leveraging Bank’s existing digital platforms allows for a unique integrated and flexible Banking and Securities product features Onboard Clients Rich Banking and “Single-Pane” Faster Securities features Independent RIAs Universal Universal Introducing End Clients Broker-Dealers Enrollment Digital Bank Platform Platform Self-Directed Trading 22
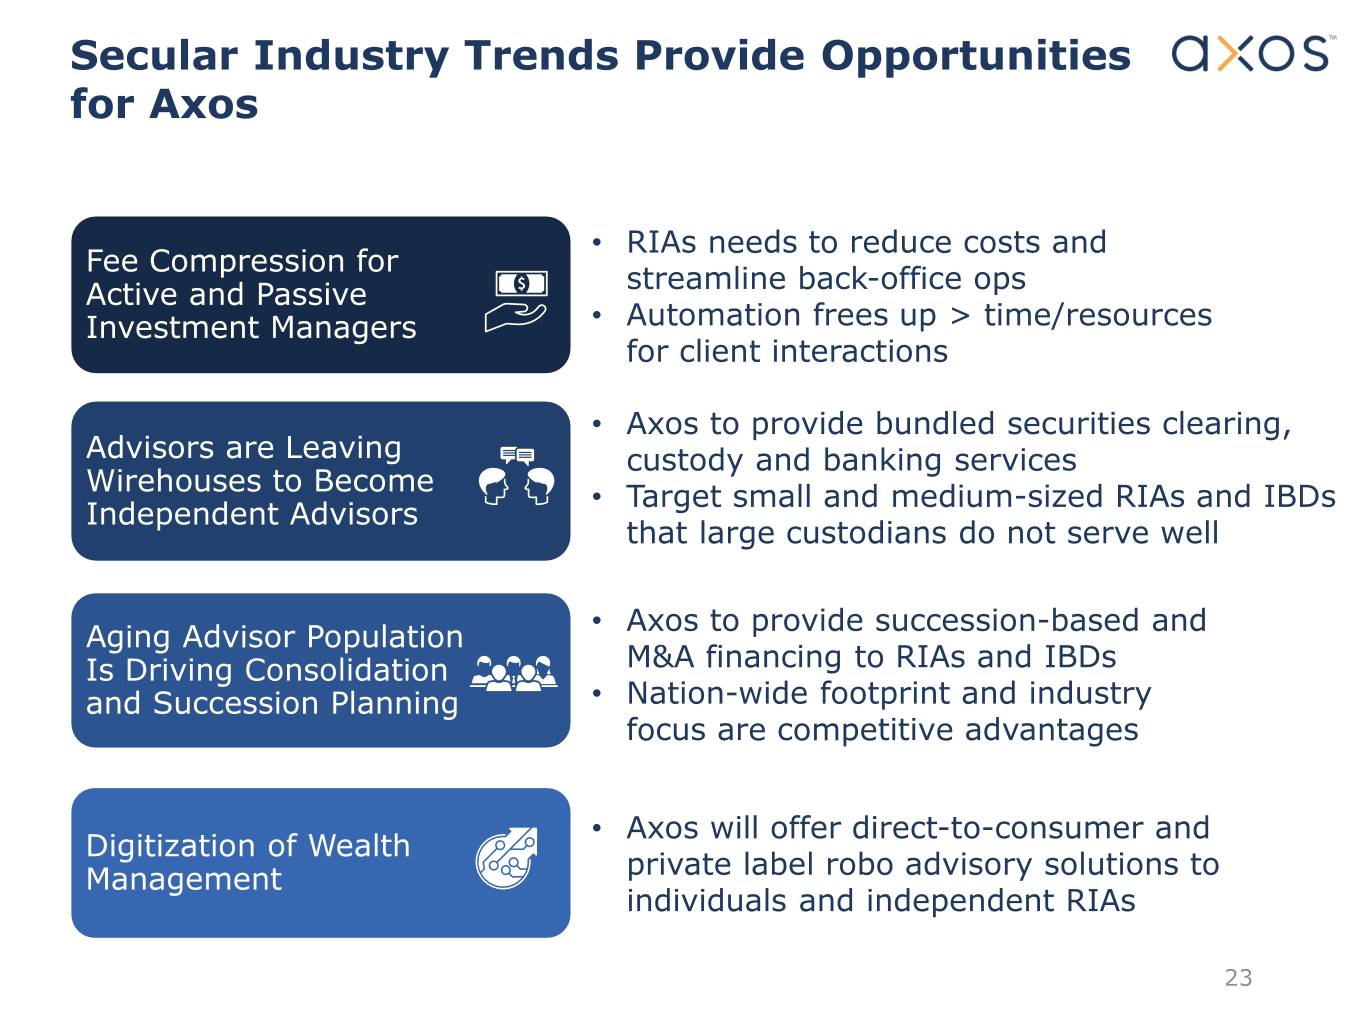
Secular Industry Trends Provide Opportunities for Axos • RIAs needs to reduce costs and Fee Compression for streamline back-office ops Active and Passive Investment Managers • Automation frees up > time/resources for client interactions • Axos to provide bundled securities clearing, Advisors are Leaving custody and banking services Wirehouses to Become • Target small and medium-sized RIAs and IBDs Independent Advisors that large custodians do not serve well • Axos to provide succession-based and Aging Advisor Population Is Driving Consolidation M&A financing to RIAs and IBDs and Succession Planning • Nation-wide footprint and industry focus are competitive advantages • Axos will offer direct-to-consumer and Digitization of Wealth Management private label robo advisory solutions to individuals and independent RIAs 23

Business Segment Overview – Axos Invest . Free financial digital advisor that helps clients achieve their goals by Core automating the financial planning process. Services . Provides premium packages for clients who want additional value beyond our core services. . High Conversion Rates – Platform has been able to sustain 20% conversion rate with low client attrition. Customer . Low Acquisition Costs– Compared to industry standards, historic Behavior acquisition costs have sub – $50/per client (funded account). . Sticky Accounts – Clients trust our advice with 49% following our recommendations within first week. Customer . Do-It-Yourself Mass Market Served 32,000+ sticky customer accounts with opportunities to cross-sell banking and premium services 24
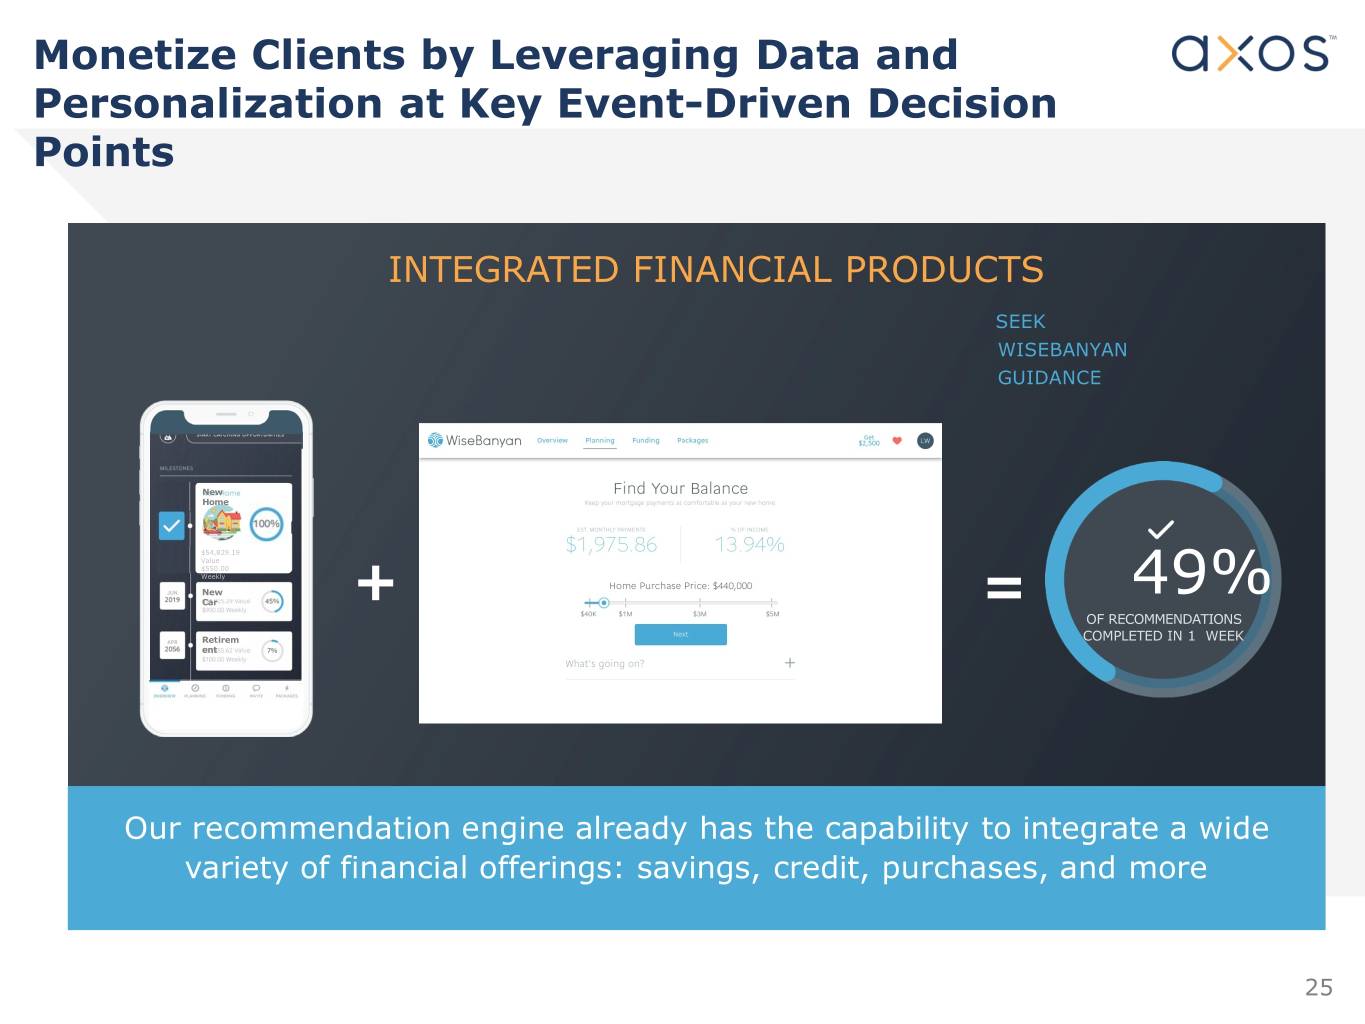
Monetize Clients by Leveraging Data and Personalization at Key Event-Driven Decision Points INTEGRATED FINANCIAL PRODUCTS SEEK WISEBANYAN GUIDANCE New Home $54,829.19 Value $550.00 Weekly New Car + = 49% OF RECOMMENDATIONS Retirem COMPLETED IN 1 WEEK ent Our recommendation engine already has the capability to integrate a wide variety of financial offerings: savings, credit, purchases, and more 25

Key Goals of Universal Digital Bank › Increase chance of offering right product at the right time and Personalization place › Personalization is the right antidote for too much choice, too much content, and not enough time › Eventual artificial intelligence tools assist sale of banking products such as deposits, loans, and mortgages Self-Service › Products optimized by channel, recipient and journey › Self service saves time and cost (e.g., activate and de-activate debit-card in platform, send wires via self-service) › Easy integration of third-party features (e.g., biometrics) Facilitate › Access to value added tools (e.g., robo-advisory, automated savings Partnerships features) either proprietary or third party › Enable creative customer acquisition partners › Provide holistic and interactive and intuitive design experience Customizable › Integrate online experience with other channels Experience › Artificial intelligence and big data credit models enable quick Cross-Sell credit decisions › Customized product recommendations based upon analytical determination of need 26

Personalization Solution Will Increase Consumer Engagement and Lifetime Value Goal is to present customers with customized and relevant offers at the right time via the right channel Establish a central hub for Target unknown customer information needed prospects and to identify + prioritize lookalikes relevant opportunities Contact customers via marketing automation solutions O nline Websites Banking Present relevant Enrollment Mobile App personalized content across digital properties 27

As We Fully Digitize All Front-End Customer Interactions, Operational Efficiency Gains Also Become Possible • Provide compelling customer value proposition to use online banking Online Banking • Intelligent, personalized, automated campaigns to develop Customer customer confidence in our messages • Utilization of multiple channels to deliver information that Interaction reflects customer preferences • Expand digital channels and leverage omnichannel AI Hub across multiple channels, to streamline interactions Customer Self ̶ Easy to use self help via intelligent, automated platforms Service such as conversational.ai to make it easy to get what’s wanted, when it’s wanted, anytime, anywhere ̶ Customer seamlessly switches from one channel to another e.g. IVR, Chatbot, Facebook Messenger, etc. • Customer centric operational efficiencies reduce cost, while Operational accelerating delivery of customer requests Efficiency • Efficiencies are delivered using tools such as our robotic process automation platform, or low code platform to automate high volume, repetitive processes 28
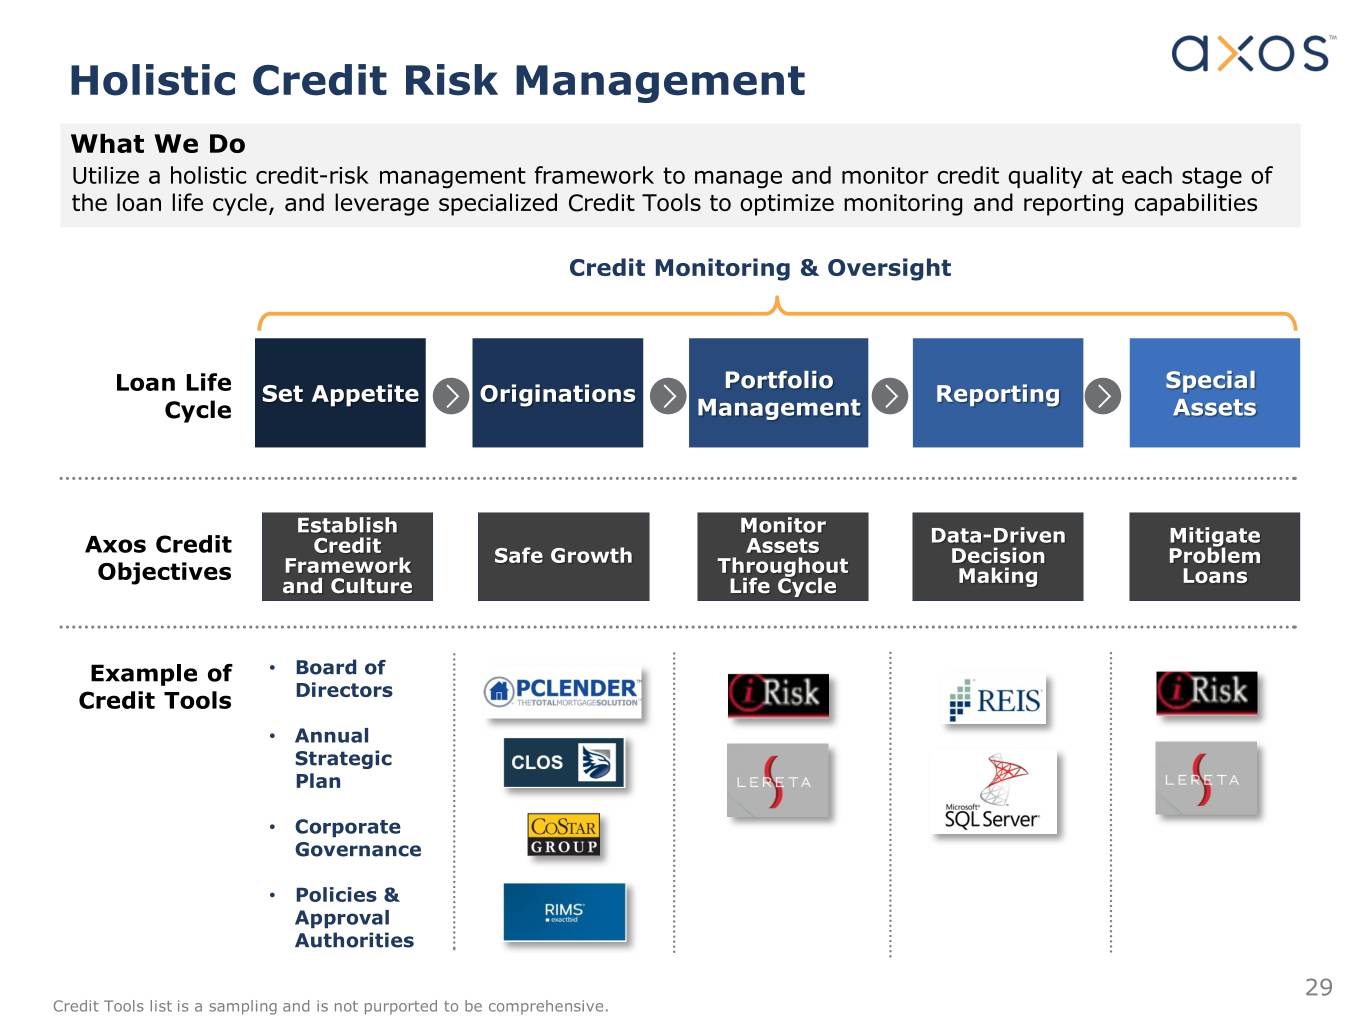
Holistic Credit Risk Management What We Do Utilize a holistic credit-risk management framework to manage and monitor credit quality at each stage of the loan life cycle, and leverage specialized Credit Tools to optimize monitoring and reporting capabilities Credit Monitoring & Oversight Portfolio Special Loan Life Set Appetite Originations Reporting Cycle Management Assets Establish Monitor Data-Driven Mitigate Axos Credit Credit Safe Growth Assets Framework Throughout Decision Problem Objectives Making Loans and Culture Life Cycle Example of • Board of Credit Tools Directors • Annual Strategic Plan • Corporate Governance • Policies & Approval Authorities 29 Credit Tools list is a sampling and is not purported to be comprehensive.
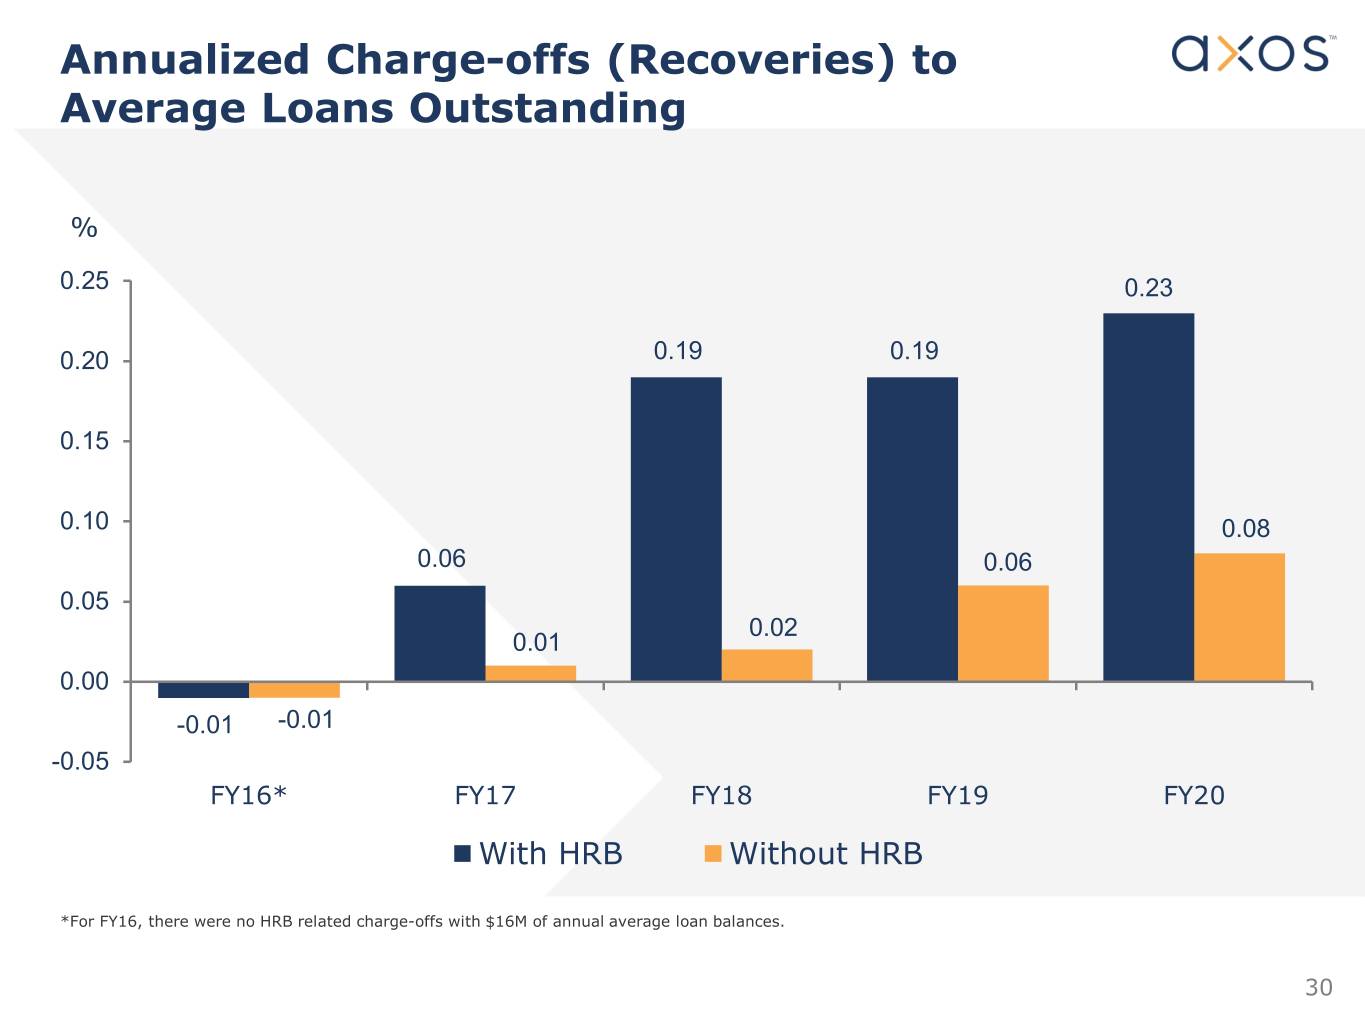
Annualized Charge-offs (Recoveries) to Average Loans Outstanding % 0.25 0.23 0.20 0.19 0.19 0.15 0.10 0.08 0.06 0.06 0.05 0.02 0.01 0.00 -0.01 -0.01 -0.05 FY16* FY17 FY18 FY19 FY20 With HRB Without HRB *For FY16, there were no HRB related charge-offs with $16M of annual average loan balances. 30
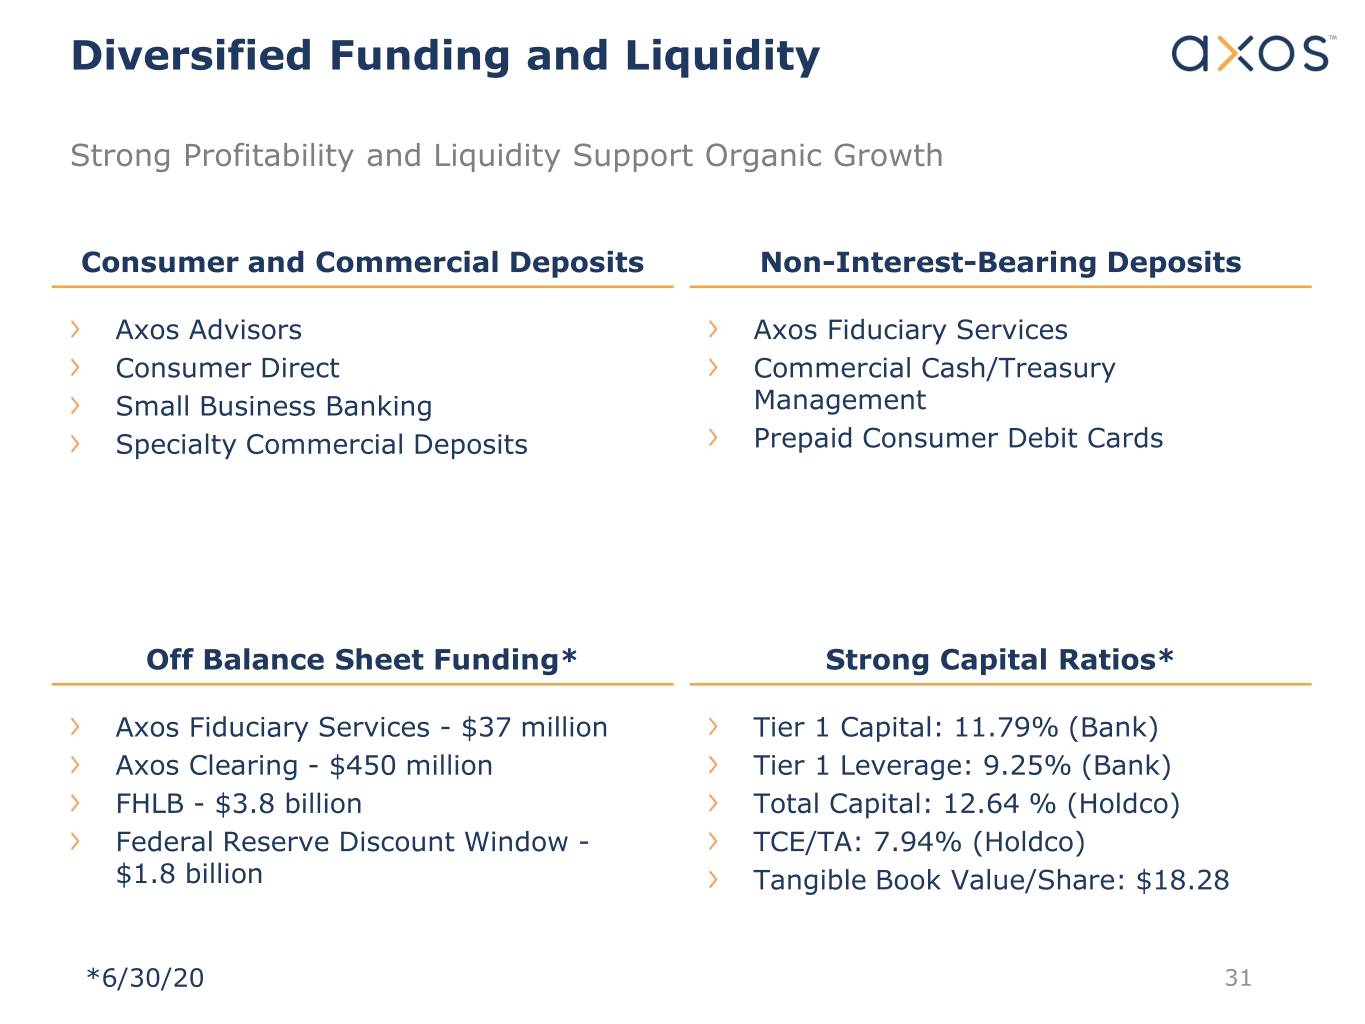
Diversified Funding and Liquidity Strong Profitability and Liquidity Support Organic Growth Consumer and Commercial Deposits Non-Interest-Bearing Deposits Axos Advisors Axos Fiduciary Services Consumer Direct Commercial Cash/Treasury Small Business Banking Management Specialty Commercial Deposits Prepaid Consumer Debit Cards Off Balance Sheet Funding* Strong Capital Ratios* Axos Fiduciary Services - $37 million Tier 1 Capital: 11.79% (Bank) Axos Clearing - $450 million Tier 1 Leverage: 9.25% (Bank) FHLB - $3.8 billion Total Capital: 12.64 % (Holdco) Federal Reserve Discount Window - TCE/TA: 7.94% (Holdco) $1.8 billion Tangible Book Value/Share: $18.28 *6/30/20 31
Contact Information Greg Garrabrants, President and CEO Andy Micheletti, EVP/CFO investors@axosfinancial.com www.axosfinancial.com Johnny Lai, VP Corporate Development and Investor Relations Phone: 858.649.2218 Mobile: 858.245.1442 jlai@axosfinancial.com 32


