UNITED STATES
SECURITIES AND EXCHANGE COMMISSION
SECURITIES AND EXCHANGE COMMISSION
Washington, D.C. 20549
FORM 6-K
REPORT OF FOREIGN PRIVATE ISSUER PURSUANT TO RULE 13A-16 OR 15D-16 UNDER THE
SECURITIES EXCHANGE ACT OF 1934
For the month of December, 2018
Commission File Number 32297
CPFL Energy Incorporated
(Translation of Registrant's name into English)
Rodovia Engenheiro Miguel Noel Nascentes Burnier, km 2,5, parte
CEP 13088-140 - Parque São Quirino, Campinas - SP
Federative Republic of Brazil
CEP 13088-140 - Parque São Quirino, Campinas - SP
Federative Republic of Brazil
(Address of principal executive office)
Indicate by check mark whether the registrant files or will file annual reports under cover Form 20-F or Form 40-F. Form 20-F ___X___ Form 40-F _______
Indicate by check mark if the registrant is submitting the Form 6-K in paper as permitted by Regulation S-T Rule 101(b)(1): [ ]
Indicate by check mark if the registrant is submitting the Form 6-K in paper as permitted by Regulation S-T Rule 101(b)(7): [ ]
If "Yes" is marked, indicate below the file number assigned to the registrant in connection with Rule 12g3-2(b): 82-_________________
Indicate by check mark if the registrant is submitting the Form 6-K in paper as permitted by Regulation S-T Rule 101(b)(1): [ ]
Indicate by check mark if the registrant is submitting the Form 6-K in paper as permitted by Regulation S-T Rule 101(b)(7): [ ]
Indicate by check mark whether the registrant by furnishing the information contained in this Form is also thereby furnishing the information to the Commission pursuant to Rule 12g3-2(b) under the Securities Exchange Act of 1934.
Yes _______ No ___X____If "Yes" is marked, indicate below the file number assigned to the registrant in connection with Rule 12g3-2(b): 82-_________________
.
(Free Translation of the original in Portuguese)
Standard Financial Statements – DFP – Date: December 31, 2018 - CPFL Energia S.A.
Table of Contents | |
Company Data | |
Capital Composition | 1 |
Individual financial statements | |
Statement of Financial Position - Assets | 2 |
Statement of Financial Position - Liabilities and Equity | 3 |
Statement of Income | 4 |
Statement of Comprehensive Income | 5 |
Statement of Cash Flows – Indirect Method | 6 |
Statement of Changes in Equity | |
01/01/2018 to 12/31/2018 | 7 |
01/01/2017 to 12/31/2017 | 8 |
Statements of Value Added | 9 |
Consolidated Interim Financial Statements | |
Statement of Financial Position - Assets | 10 |
Statement of Financial Position - Liabilities and Equity | 11 |
Statement of Income | 12 |
Statement of Comprehensive Income | 13 |
Statement of Cash Flows - Indirect Method | 14 |
Statement of Changes in Equity | |
01/01/2018 to 12/31/2018 | 15 |
01/01/2017 to 12/31/2017 | 16 |
Statements of Value Added | 17 |
Management Report | 18 |
Notes to Interim financial statements | 37 |
Reports | |
Independent Auditor’s Report - Unqualified | 124 |
Management declaration on financial statements | 128 |
Management declaration on independent auditor’s report | 129 |
(Free Translation of the original in Portuguese)
Standard Financial Statements – DFP – Date: December 31, 2018 - CPFL Energia S.A.
Capital Composition
Number of Shares (In units) | Closing Date 12/31/2018 |
Paid-in capital |
|
Common | 1,017,914,746 |
Preferred | 0 |
Total | 1,017,914,746 |
Treasury Stock | 0 |
Common | 0 |
Preferred | 0 |
Total | 0 |
1
(Free Translation of the original in Portuguese)
Standard Financial Statements – DFP – Date: December 31, 2018 - CPFL Energia S.A.
Individual Financial Statements
Statement of Financial Position – Assets
(In thousands of Brazilian reais - R$) | ||||
| ||||
Code | Description | Current Year 12/31/2018 | Previous Year 12/31/2017 | Prior Year 12/31/2016 |
1 | Total assets | 10,807,954 | 9,463,648 | - |
1.01 | Current assets | 799,599 | 275,382 | - |
1.01.01 | Cash and cash equivalents | 79,364 | 6,581 | - |
1.01.06 | Taxes recoverable | 18,087 | 63,751 | - |
1.01.06.01 | Current taxes recoverable | 18,087 | 63,751 | - |
1.01.06.01.01 | Income tax and social contribution to be offset | 9,441 | 17,052 | - |
1.01.06.01.02 | Other taxes recoverable | 8,646 | 46,699 | - |
1.01.08 | Other current assets | 702,148 | 205,050 | - |
1.01.08.03 | Other | 702,148 | 205,050 | - |
1.01.08.03.01 | Other receivables | 417 | 243 | - |
1.01.08.03.04 | Dividends and interest on capital | 701,731 | 204,807 | - |
1.02 | Noncurrent assets | 10,008,355 | 9,188,266 | - |
1.02.01 | Long-term assets | 191,019 | 629,352 | - |
1.02.01.07 | Deferred taxes | 112,522 | 145,778 | - |
1.02.01.07.02 | Deferred tax assets | 112,522 | 145,778 | - |
1.02.01.09 | Receivables from related parties | 72,933 | 127,147 | - |
1.02.01.09.02 | Receivables from subsidiaries | 72,933 | 127,147 | - |
1.02.01.10 | Other noncurrent assets | 5,564 | 356,427 | - |
1.02.01.10.04 | Escrow Deposits | 703 | 665 | - |
1.02.01.10.07 | Advance for future capital increase | - | 350,000 | - |
1.02.01.10.10 | Other receivables | 4,861 | 5,762 | - |
1.02.02 | Investments | 9,816,139 | 8,557,673 | - |
1.02.02.01 | Equity interests | 9,816,139 | 8,557,673 | - |
1.02.02.01.02 | Equity interests in subsidiaries | 9,816,139 | 8,557,673 | - |
1.02.03 | Property, plant and equipment | 1,087 | 1,170 | - |
1.02.03.01 | Property, plant and equipment - in servce | 1,087 | 1,170 | - |
1.02.04 | Intangible assets | 110 | 71 | - |
1.02.04.01 | Intangible assets | 110 | 71 | - |
2
(Free Translation of the original in Portuguese)
Standard Financial Statements – DFP – Date: December 31, 2018 - CPFL Energia S.A.
Individual Financial Statements
Statement of Financial Position – Liabilities and Equity
(In thousands of Brazilian reais - R$) | ||||
Code | Description | Current Year 12/31/2018 | Previous Year 12/31/2017 | Prior Year 12/31/2016 |
2 | Total liabilities | 10,807,954 | 9,463,648 | - |
2.01 | Current liabilities | 531,380 | 303,812 | - |
2.01.02 | Trade payables | 2,854 | 1,644 | - |
2.01.02.01 | Domestic suppliers | 2,854 | 1,644 | - |
2.01.03 | Taxes payable | 13,519 | 717 | - |
2.01.03.01 | Federal taxes | 13,500 | 717 | - |
2.01.03.01.01 | Income tax and social contribution payable | 8,261 | - | - |
2.01.03.01.02 | Other taxes | 5,239 | 717 | - |
2.01.03.03 | Municipal taxes | 19 | - | - |
2.01.04 | Borrowings | - | 1,938 | - |
2.01.04.02 | Debentures | - | 1,938 | - |
2.01.04.02.02 | Interest paid on debentures | - | 1,938 | - |
2.01.05 | Other liabilities | 515,007 | 299,513 | - |
2.01.05.02 | Others | 515,007 | 299,513 | - |
2.01.05.02.01 | Dividends and interest on capital payable | 491,602 | 281,919 | - |
2.01.05.02.07 | Other payables | 23,405 | 17,594 | - |
2.02 | Noncurrent liabilities | 13,825 | 198,308 | - |
2.02.01 | Borrowings | - | 184,388 | - |
2.02.01.02 | Debentures | - | 184,388 | - |
2.02.01.02.01 | Debentures | - | 184,388 | - |
2.02.02 | Other liabilities | 13,584 | 13,320 | - |
2.02.02.02 | Others | 13,584 | 13,320 | - |
2.02.02.02.04 | Other payables | 13,584 | - | - |
2.02.04 | Provisons | 241 | 600 | - |
2.02.04.01 | Tax, social security, labor and civil provisions | 241 | 600 | - |
2.02.04.01.02 | Social security and labor provisions | - | 57 | - |
2.02.04.01.04 | Civil provisions | 241 | 543 | - |
2.03 | Equity | 10,262,749 | 8,961,528 | - |
2.03.01 | Issued capital | 5,741,284 | 5,741,284 | - |
2.03.02 | Capital reserves | 469,257 | 468,014 | - |
2.03.04 | Earnings reserves | 4,428,502 | 2,916,736 | - |
2.03.04.01 | Legal reserve | 900,992 | 798,090 | - |
2.03.04.02 | Statutory reserve | 3,527,510 | 2,118,646 | - |
2.03.08 | Other comprehensive income | (376,294) | (164,506) | - |
2.03.08.01 | Accumulated comprehensive income | (376,294) | (164,506) | - |
3
(Free Translation of the original in Portuguese)
Standard Financial Statements – DFP – Date: December 31, 2018 - CPFL Energia S.A.
Individual Financial Statements
Statement of income
(In thousands of Brazilian reais – R$) | ||||
Code | Description | Current Year | Prior Year | Prior Year |
01/01/2018 to 12/31/2018 | 01/01/2017 to 12/31/2017 | 01/01/2016 to 12/31/2016 | ||
3.01 | Net operating revenue | 1 | 1 | - |
3.03 | Gross profit | 1 | 1 | - |
3.04 | Operating income (expenses) | 2,206,914 | 1,306,995 | - |
3.04.02 | General and administrative expenses | (43,930) | (42,771) | - |
3.04.05 | Others operating expenses | 9 | - | - |
3.04.06 | Share of profit (loss) of investees | 2,250,835 | 1,349,766 | - |
3.05 | Profit before finance income (costs) and taxes | 2,206,915 | 1,306,996 | - |
3.06 | Finance income (costs) | (27,300) | (56,471) | - |
3.06.01 | Finance income | (22,160) | 12,983 | - |
3.06.02 | Financial expenses | (5,140) | (69,454) | - |
3.07 | Profit (loss) before taxes on income | 2,179,615 | 1,250,525 | - |
3.08 | Income tax and social contribution | (121,575) | (70,775) | - |
3.08.01 | Current | (88,317) | (45,481) | - |
3.08.02 | Deferred | (33,258) | (25,294) | - |
3.09 | Profit (loss) from continuing operations | 2,058,040 | 1,179,750 | - |
3.11 | Profit (loss) for the period | 2,058,040 | 1,179,750 | - |
4
(Free Translation of the original in Portuguese)
Standard Financial Statements – DFP – Date: December 31, 2018 - CPFL Energia S.A.
Individual Financial Statements
Statement of Comprehensive Income
(In thousands of Brazilian reais – R$) | ||||
Code | Description | Current Year | Prior Year | Prior Year |
01/01/2018 to 12/31/2018 | 01/01/2017 to 12/31/2017 | 01/01/2016 to 12/31/2016 | ||
4.01 | Profit for the period | 2,058,040 | 1,179,750 | - |
4.02 | Other comprehensive income | (220,817) | 96,000 | - |
4.02.01 | Comprehensive income for the period of subsidiaries | (220,817) | 96,000 | - |
4.03 | Total comprehensive income for the year | 1,837,223 | 1,275,750 | - |
5
(Free Translation of the original in Portuguese)
Standard Financial Statements – DFP – Date: December 31, 2018 - CPFL Energia S.A.
Individual Financial Statements
Statement of Cash Flows – Indirect Method
(In thousands of Brazilian reais – R$) | ||||
Code | Description | Current year | Previous Year | Prior Year |
6.01 | Cash flows from operating activities | 566,167 | 1,061,750 | - |
6.01.01 | Cash generated from operations | (68,204) | (37,443) | - |
6.01.01.01 | Profit before taxes | 2,179,615 | 1,250,525 | - |
6.01.01.02 | Depreciation and amortization | 201 | 217 | - |
6.01.01.03 | Provision for tax, civil and labor risks | (117) | 61 | - |
6.01.01.05 | Interest on debts, inflation adjusment and exchange rate changes | 2,932 | 61,520 | - |
6.01.01.07 | Equity interests in associates and joint ventures | (2,250,835) | (1,349,766) | - |
6.01.02 | Changes in assets and liabilities | 718,840 | 1,218,475 | - |
6.01.02.02 | Dividend and interest on capital received | 596,100 | 1,172,336 | - |
6.01.02.03 | Taxes recoverable | 109,719 | 65,182 | - |
6.01.02.05 | Escrow deposits | (25) | 68 | - |
6.01.02.10 | Other operating assets | 1,147 | 20,485 | - |
6.01.02.11 | Trade payables | 1,210 | (2,116) | - |
6.01.02.12 | Other taxes and social contributions | 4,541 | 263 | - |
6.01.02.16 | Tax, civil and labor risks paid | (259) | (466) | - |
6.01.02.19 | Other operating liabilities | 6,407 | (37,277) | - |
6.01.03 | Others | (84,469) | (119,282) | - |
6.01.03.01 | Interest paid on debts and debentures | (4,235) | (71,844) | - |
6.01.03.02 | Income tax and social contribution paid | (80,234) | (47,438) | - |
6.02 | Net cash generated by (used in) investing activities | (28,283) | (465,175) | - |
6.02.01 | Purchases of property, plant and equipment | (286) | (185) | - |
6.02.02 | Securities, pledges and restricted deposits | (250) | - | - |
6.02.04 | Purchases of intangible assets | (42) | (51) | - |
6.02.06 | Advances for future capital increases | (82,415) | (383,340) | - |
6.02.07 | Intragroup loans | 54,710 | (72,199) | - |
6.02.09 | Capital increase in existing investment |
| (9,400) |
|
6.03 | Net cash from financing activities | (465,101) | (654,966) | - |
6.03.05 | Repayment of principal of borrowings and debentures | (186,000) | (434,000) | - |
6.03.08 | Dividends and interest on capital paid | (279,101) | (220,966) | - |
6.05 | Increase (decrease) in cash and cash equivalents | 72,783 | (58,391) | - |
6.05.01 | Cash and cash equivalents at the beginning of the year | 6,581 | 64,972 | - |
6.05.02 | Cash and cash equivalents at the end of the year | 79,364 | 6,581 | - |
6
(Free Translation of the original in Portuguese)
Standard Financial Statements – DFP – Date: December 31, 2018 - CPFL Energia S.A.
Individual Financial Statements
Statement of Changes in Equity – from January 1, 2018 to December 31, 2018
(In thousands of Brazilian reais – R$) | |||||||
Code | Description | Issued capital | Capital reserves, | Earnings reserves | Retained earnings/accumulated losses | Other comprehensive income | Equity |
5.01 | Opening balances | 5,741,284 | 468,014 | 2,916,737 | - | (164,506) | 8,961,529 |
5.03 | Adjusted opening balances | 5,741,284 | 468,014 | 2,916,737 | - | (164,506) | 8,961,529 |
5.04 | Capital transactions with shareholders | - | 1,238 | - | (488,785) | - | (487,547) |
5.04.06 | Dividends | - | - | - | (488,785) | - | (488,785) |
5.04.08 | Other changes | - | 1,238 | - | - | - | 1,238 |
5.05 | Total comprehensive income | - | - | - | 1,975,433 | (186,671) | 1,788,762 |
5.05.01 | Profit for the year | - | - | - | 2,058,040 | - | 2,058,040 |
5.05.02 | Other comprehensive income | - | - | - | (82,607) | (186,671) | (269,278) |
5.05.02.03 | Equity on comprehensive income of subsidiaries | - | - | - | (82,607) | (186,671) | (269,278) |
5.06 | Internal changes in equity | - | 5 | 1,511,766 | (1,486,648) | (25,118) | 5 |
5.06.01 | Recognition of reserves | - | - | 102,902 | (102,902) | - | - |
5.06.06 | Equity on comprehensive income of subsidiaries | - | - | - | 25,118 | (25,118) | - |
5.06.07 | Changes in statutory reserve in the year | - | - | 1,408,864 | (1,408,864) | - | - |
5.06.08 | Other changes | - | 5 | - | - | - | 5 |
5.07 | Closing balances | 5,741,284 | 469,257 | 4,428,503 | - | (376,295) | 10,262,749 |
7
(Free Translation of the original in Portuguese)
Standard Financial Statements – DFP – Date: December 31, 2018 - CPFL Energia S.A.
Individual Financial Statements
Statement of Changes in Equity – from January 1, 2017 to December 31, 2017
(In thousands of Brazilian reais – R$) | |||||||
Code | Description | Issued capital | Capital reserves, stock options and treasury stock | Earnings reserves | Retained earnings/accumulated losses | Other comprehensive income | Equity |
5.01 | Opening balances | 5,741,284 | 468,014 | 1,995,355 | - | (234,632) | 7,970,021 |
5.03 | Adjusted opening balances | 5,741,284 | 468,014 | 1,995,355 | - | (234,632) | 7,970,021 |
5.04 | Capital transactions with shareholders | - | - | (7,820) | (276,423) | - | (284,243) |
5.04.08 | Prescribed dividend | - | - | - | 3,768 | - | 3,768 |
5.04.10 | Dividend proposal approved | - | - | (7,820) | (280,191) | - | (288,011) |
5.05 | Total comprehensive income | - | - | - | 1,179,750 | 96,000 | 1,275,750 |
5.05.01 | Profit for the year | - | - | - | 1,179,750 | - | 1,179,750 |
5.05.02 | Other comprehensive income | - | - | - | - | 96,000 | 96,000 |
5.06 | Internal changes in equity | - | - | 929,201 | (903,327) | (25,874) | - |
5.06.01 | Recognition of reserves | - | - | 58,988 | (58,988) | - | - |
5.06.06 | Equity on comprehensive income of subsidiaries | - | - | - | 25,874 | (25,874) | - |
5.06.07 | Changes in statutory reserve in the year | - | - | 870,213 | (870,213) | - | - |
5.07 | Closing balances | 5,741,284 | 468,014 | 2,916,736 | - | (164,506) | 8,961,528 |
8
(Free Translation of the original in Portuguese)
Standard Financial Statements – DFP – Date: December 31, 2018 - CPFL Energia S.A.
Individual Financial Statements
Statement of Value Added
(In thousands of Brazilian reais – R$) |
| |||
Code | Description | Current Year | Prior Year | Prior Year |
7.01 | Revenues | 329 | 237 | - |
7.01.01 | Sales of goods and services | 1 | 1 | - |
7.01.03 | Revenues related to construction of own assets | 328 | 236 | - |
7.02 | Inputs purchased from thrid parties | (12,857) | (10,322) | - |
7.02.02 | Materials, energy, third-party services and others | (11,127) | (8,425) | - |
7.02.04 | Others | (1,730) | (1,897) | - |
7.03 | Gross value added | (12,528) | (10,085) | - |
7.04 | Retentions | (201) | (217) | - |
7.04.01 | Depreciation, amortization and depletion | (201) | (217) | - |
7.05 | Wealth created by the Company | (12,729) | (10,302) | - |
7.06 | Wealth received in transfer | 2,268,815 | 1,391,611 | - |
7.06.01 | Share of profit (loss) of investees | 2,250,835 | 1,349,766 | - |
7.06.02 | Finance income | 17,980 | 41,845 | - |
7.07 | Total wealth for distribution | 2,256,086 | 1,381,309 | - |
7.08 | Wealth distributed | 2,256,086 | 1,381,309 | - |
7.08.01 | Personnel and charges | 27,035 | 27,248 | - |
7.08.01.01 | Salaries and wages | 10,679 | 15,690 | - |
7.08.01.02 | Benefits | 14,885 | 10,184 | - |
7.08.01.03 | FGTS (Severance Pay Fund) | 1,471 | 1,374 | - |
7.08.02 | Taxes, fees and contributions | 165,840 | 104,770 | - |
7.08.02.01 | Federal | 165,799 | 104,738 | - |
7.08.02.02 | State | 41 | 32 | - |
7.08.03 | Lenders and lessors | 5,171 | 69,541 | - |
7.08.03.01 | Interest | 5,135 | 69,311 | - |
7.08.03.02 | Rentals | 36 | 230 | - |
7.08.04 | Interest on capital | 2,058,040 | 1,179,750 | - |
7.08.04.02 | Dividend (including additional dividend proposed) | 546,274 | 250,550 | - |
7.08.04.03 | Retained earnings / Loss for the year | 1,511,766 | 929,200 | - |
9
(Free Translation of the original in Portuguese)
Standard Financial Statements – DFP – Date: December 31, 2018 - CPFL Energia S.A.
Consolidated Financial Statements
Statement of Financial Position – Assets
(In thousands of Brazilian reais – R$) |
|
|
| |
Code | Descrição da Conta | Current Year 12/31/2018 | Previous Year 12/31/2017 | Prior Year 12/31/2016 |
1 | Total assets | 42,211,530 | 41,282,912 | - |
1.01 | Current assets | 9,402,316 | 9,581,212 | - |
1.01.01 | Cash and cash equivalents | 1,891,457 | 3,249,642 | - |
1.01.03 | Trade receivables | 4,547,951 | 4,301,283 | - |
1.01.03.01 | Consumers | 4,547,951 | 4,301,283 | - |
1.01.06 | Taxes recoverable | 411,256 | 395,046 | - |
1.01.06.01 | Current taxes recoverable | 411,256 | 395,046 | - |
1.01.06.01.01 | Income tax and social contribution to be offset | 123,739 | 88,802 | - |
1.01.06.01.02 | Other taxes recoverable | 287,517 | 306,244 | - |
1.01.07 | Prepaid expenses | 172,155 | 80,600 | - |
1.01.08 | Other current assets | 2,379,497 | 1,554,641 | - |
1.01.08.03 | Others | 2,379,497 | 1,554,641 | - |
1.01.08.03.01 | Otherns receivables | 638,850 | 843,633 | - |
1.01.08.03.02 | Derivatives | 309,484 | 444,029 | - |
1.01.08.03.04 | Dividends and interest on capital | 100,182 | 56,145 | - |
1.01.08.03.06 | Sector financial asset | 1,330,981 | 210,834 | - |
1.02 | Noncurrent assets | 32,809,214 | 31,701,700 | - |
1.02.01 | Long-term assets | 11,862,870 | 10,323,201 | - |
1.02.01.04 | Trade receivables | 752,795 | 236,539 | - |
1.02.01.04.01 | Consumers | 752,795 | 236,539 | - |
1.02.01.07 | Deferred taxes | 956,380 | 943,199 | - |
1.02.01.07.02 | Deferred tax assets | 956,380 | 943,199 | - |
1.02.01.08 | Prepaid expenses | 6,367 | 20,043 | - |
1.02.01.09 | Receivables from related parties | - | 8,612 | - |
1.02.01.09.03 | Receivables from subsidiaries | - | 8,612 | - |
1.02.01.10 | Other noncurrent assets | 10,147,328 | 9,114,808 | - |
1.02.01.10.03 | Derivatives | 347,507 | 203,901 | - |
1.02.01.10.04 | Escrow deposits | 854,374 | 839,990 | - |
1.02.01.10.05 | Income tax and social contribution to be offset | 67,966 | 61,464 | - |
1.02.01.10.06 | Other taxes recoverable | 185,725 | 171,980 | - |
1.02.01.10.08 | Sector financial asset | 7,430,149 | 6,545,668 | - |
1.02.01.10.09 | Investments at cost | 116,654 | 116,654 | - |
1.02.01.10.10 | Others receivables | 921,073 | 820,149 | - |
1.02.01.10.11 | Sector financial asset | 223,880 | 355,002 | - |
1.02.02 | Investments | 980,362 | 1,001,550 | - |
1.02.02.01 | Equity interests | 980,362 | 1,001,550 | - |
1.02.02.01.04 | Equity interests in joint ventures | 980,362 | 1,001,550 | - |
1.02.03 | Property, plant and equipment | 9,456,614 | 9,787,125 | - |
1.02.03.01 | Property, plant and equipment - in servce | 9,245,853 | 9,535,933 | - |
1.02.03.03 | Property, plant and equipment - in progress | 210,761 | 251,192 | - |
1.02.04 | Intangible assets | 10,509,368 | 10,589,824 | - |
1.02.04.01 | Intangible assets | 10,509,368 | 10,589,824 | - |
1.02.04.01.01 | Concession contract | 9,380,810 | 10,522,932 | - |
1.02.04.01.02 | Goodwill | 6,115 | 6,115 | - |
1.02.04.01.03 | Other intangible assets | 76,010 | 60,777 | - |
1.02.04.01.04 | Contractual assets in progress | 1,046,433 | - | - |
10
(Free Translation of the original in Portuguese)
Standard Financial Statements – DFP – Date: December 31, 2018 - CPFL Energia S.A.
Consolidated Financial Statements
Statement of Financial Position – Liabilities and Equity
(In thousands of Brazilian reais - R$) | ||||
Code | Description | Current Year 12/31/2018 | Previous Year 12/31/2017 | Prior Year 12/31/2016 |
2 | Total liabilities | 42,211,530 | 41,282,912 | - |
2.01 | Current liabilities | 8,415,132 | 11,378,688 | - |
2.01.01 | Payroll and related taxes | 119,252 | 116,080 | - |
2.01.01.02 | Payroll taxes | 119,252 | 116,080 | - |
2.01.01.02.01 | Estimated payroll | 119,252 | 116,080 | - |
2.01.02 | Trade payables | 2,398,085 | 3,296,870 | - |
2.01.02.01 | Domestic suppliers | 2,398,085 | 3,296,870 | - |
2.01.03 | Taxes payable | 765,438 | 710,303 | - |
2.01.03.01 | Federal taxes | 327,658 | 300,768 | - |
2.01.03.01.01 | Income tax and social contribution | 100,450 | 81,457 | - |
2.01.03.01.02 | Other taxes | 227,208 | 219,311 | - |
2.01.03.02 | State taxes | 430,149 | 403,492 | - |
2.01.03.03 | Municipal taxes | 7,631 | 6,043 | - |
2.01.04 | Borrowings | 3,363,465 | 5,292,679 | - |
2.01.04.01 | Borrowings | 2,446,113 | 3,589,606 | - |
2.01.04.01.01 | In local currency | 876,777 | 1,258,329 | - |
2.01.04.01.02 | In foreign currency | 1,569,336 | 2,331,277 | - |
2.01.04.02 | Debentures | 917,352 | 1,703,073 | - |
2.01.05 | Other payables | 1,768,892 | 1,962,756 | - |
2.01.05.02 | Others | 1,768,892 | 1,962,756 | - |
2.01.05.02.01 | Dividends and interest on capital payable | 532,608 | 297,744 | - |
2.01.05.02.04 | Derivatives | 8,139 | 10,230 | - |
2.01.05.02.05 | Sector financial liability | - | 40,111 | - |
2.01.05.02.06 | Use of public asset | 11,570 | 10,965 | - |
2.01.05.02.07 | Other payables | 979,296 | 961,306 | - |
2.01.05.02.08 | Regulatory charges | 150,656 | 581,600 | - |
2.01.05.02.09 | Other payables | 86,623 | 60,800 | - |
2.02 | Noncurrent liabilities | 21,264,015 | 18,717,880 | - |
2.02.01 | Borrowings | 17,013,339 | 14,875,904 | - |
2.02.01.01 | Borrowings | 8,989,846 | 7,402,450 | - |
2.02.01.01.01 | In local currency | 4,927,927 | 4,884,253 | - |
2.02.01.01.02 | In foreign currency | 4,061,919 | 2,518,197 | - |
2.02.01.02 | Debentures | 8,023,493 | 7,473,454 | - |
2.02.02 | Other liabilities | 2,135,089 | 1,631,253 | - |
2.02.02.02 | Others | 2,135,089 | 1,631,253 | - |
2.02.02.02.03 | Trade payables | 333,036 | 128,438 | - |
2.02.02.02.04 | Private pension plan | 1,156,639 | 880,360 | - |
2.02.02.02.05 | Derivatives | 23,659 | 84,576 | - |
2.02.02.02.06 | Sector financial liability | 46,703 | 8,385 | - |
2.02.02.02.07 | Use of public asset | 89,965 | 83,766 | - |
2.02.02.02.08 | Other payables | 475,396 | 426,889 | - |
2.02.02.02.09 | Other taxes, fees and contributions | 9,691 | 18,839 | - |
2.02.03 | Deferred taxes | 1,136,227 | 1,249,589 | - |
2.02.03.01 | Deferred income tax and social contribution | 1,136,227 | 1,249,589 | - |
2.02.03.01.01 | Deferred income tax and social contribution | 1,126,141 | 1,239,046 | - |
2.02.03.01.02 | Others deferred taxes | 10,086 | 10,543 | - |
2.02.04 | Provisions | 979,360 | 961,134 | - |
2.02.04.01 | Tax, social security, labor and civil provisions | 979,360 | 961,134 | - |
2.02.04.01.01 | Tax provisions | 389,823 | 347,291 | - |
2.02.04.01.02 | Social security and labor provisions | 219,314 | 224,258 | - |
2.02.04.01.04 | Civil provisions | 281,304 | 291,388 | - |
2.02.04.01.05 | Others provisions | 88,919 | 98,197 | - |
2.03 | Consolidated equity | 12,532,383 | 11,186,344 | - |
2.03.01 | Issued capital | 5,741,284 | 5,741,284 | - |
2.03.02 | Capital reserves | 469,257 | 468,014 | - |
2.03.04 | Earnings reserves | 4,428,502 | 2,916,736 | - |
2.03.04.01 | Legal reserve | 900,992 | 798,090 | - |
2.03.04.02 | Statutory reserve | 3,527,510 | 2,118,646 | - |
2.03.08 | Other comprehensive income | (376,294) | (164,506) | - |
2.03.09 | Noncontrolling interests | 2,269,634 | 2,224,816 | - |
11
(Free Translation of the original in Portuguese)
Standard Financial Statements – DFP – Date: December 31, 2018 - CPFL Energia S.A.
Consolidated Financial Statements
Statement of income
(In thousands of Brazilian reais – R$) | ||||
Code | Description | Current Year | Prior Year | Prior Year |
01/01/2018 to 12/31/2018 | 01/01/2017 to 12/31/2017 | 01/01/2016 to 12/31/2016 | ||
3.02 | Cost of electric energy services | (22,347,258) | (21,747,273) | - |
3.02.01 | Cost of electric energy | (17,838,165) | (16,901,518) | - |
3.02.02 | Cost of operation | (2,733,754) | (2,771,145) | - |
3.02.03 | Cost of services rendered to third parties | (1,775,339) | (2,074,610) | - |
3.03 | Gross profit | 5,789,369 | 4,997,632 | - |
3.04 | Operating expenses/income | (1,746,705) | (1,663,408) | - |
3.04.01 | Selling expenses | (608,184) | (590,232) | - |
3.04.01.01 | Allowance for doubtful accounts | (169,259) | (155,097) | - |
3.04.01.02 | Others selling expenses | (438,925) | (435,135) | - |
3.04.02 | General and administrative expenses | (987,291) | (947,072) | - |
3.04.05 | Other operating expenses | (485,428) | (438,494) | - |
3.04.06 | Share of profit (loss) of investees | 334,198 | 312,390 | - |
3.05 | Profit before finance income (costs) and taxes | 4,042,664 | 3,334,224 | - |
3.06 | Finance income (costs) | (1,102,687) | (1,487,554) | - |
3.06.01 | Finance income | 762,413 | 880,314 | - |
3.06.02 | Financial expenses | (1,865,100) | (2,367,868) | - |
3.07 | Profit before taxes | 2,939,977 | 1,846,670 | - |
3.08 | Income tax and social contribution | (773,982) | (603,628) | - |
3.08.01 | Current | (805,845) | (540,618) | - |
3.08.02 | Deferred | 31,863 | (63,010) | - |
3.09 | Profit from continuing operations | 2,165,995 | 1,243,042 | - |
3.11 | Consolidated profit for the period | 2,165,995 | 1,243,042 | - |
3.11.01 | Attributable to owners of the Company | 2,058,040 | 1,179,750 | - |
3.11.02 | Attributable to noncontrolling interests | 107,955 | 63,292 | - |
3.99.01.01 | ON | 2.02 | 1.16 | - |
3.99.02.01 | ON | 2.01 | 1.16 | - |
12
(Free Translation of the original in Portuguese)
Standard Financial Statements – DFP – Date: December 31, 2018 - CPFL Energia S.A.
Consolidated Financial Statements
Statement of Comprehensive Income
(In thousands of Brazilian reais – R$) | ||||
Code | Description | Current Year | Prior Year | Prior Year |
01/01/2018 to 12/31/2018 | 01/01/2017 to 12/31/2017 | 01/01/2016 to 12/31/2016 | ||
4.02 | Other comprehensive income | (220,817) | 96,000 | - |
4.02.03 | Actuarial gains (losses), net of tax effects | (238,780) | 96,000 | - |
4.02.04 | Credit risk in mark to market of financial liabilities | 17,963 | - | - |
4.03 | Consolidated comprehensive income for the period | 1,945,178 | 1,339,042 | - |
4.03.01 | Attributable to owners of the Company | 1,837,223 | 1,275,750 | - |
4.03.02 | Attributable to noncontrolling interests | 107,955 | 63,292 | - |
13
(Free Translation of the original in Portuguese)
Standard Financial Statements – DFP – Date: December 31, 2018 - CPFL Energia S.A.
Consolidated Financial Statements
Statement of Cash Flows – Indirect Method
(In thousands of Brazilian reais – R$) | ||||
Code | Description | Current year | Previous Year | Previous Year |
6.01 | Net cash from operating activities | 856,686 | 2,034,024 | - |
6.01.01 | Cash generated from operations | 5,919,953 | 5,506,768 | - |
6.01.01.01 | Profit before taxes | 2,939,977 | 1,846,670 | - |
6.01.01.02 | Depreciation and amortization | 1,594,064 | 1,529,052 | - |
6.01.01.03 | Provision for tax, civil and labor risks | 153,977 | 176,609 | - |
6.01.01.04 | Allowance for doubtful accounts | 169,259 | 155,097 | - |
6.01.01.05 | Interest on debts, inflation adjustment and exchange rate changes | 1,117,742 | 1,863,311 | - |
6.01.01.06 | Pension plan expense (income) | 89,909 | 113,898 | - |
6.01.01.07 | Share of profit (loss) of investees | (334,198) | (312,390) | - |
6.01.01.08 | Reversal of impairment | - | 20,437 | - |
6.01.01.09 | Loss (gain) on disposal of noncurrent assets | 216,275 | 132,195 | - |
6.01.01.10 | Deferred taxes (PIS and COFINS) | (457) | 963 | - |
6.01.01.11 | Others | (26,595) | (19,074) | - |
6.01.02 | Changes in assets and liabilities | (2,893,526) | (1,288,116) | - |
6.01.02.01 | Consumers, concessionaries and licensees | (1,006,291) | (722,406) | - |
6.01.02.02 | Dividend and interest on capital received | 311,347 | 730,178 | - |
6.01.02.03 | Taxes recoverable | 92,090 | 68,184 | - |
6.01.02.04 | Escrow deposits | 22,926 | (248,128) | - |
6.01.02.05 | Sectorial financial asset | (846,216) | (425,004) | - |
6.01.02.06 | Receivables - CDE | 59,196 | (29,354) | - |
6.01.02.07 | Concession financial assets (transmission companies) | - | (56,665) | - |
6.01.02.09 | Other operating assets | (47,836) | 91,607 | - |
6.01.02.10 | Trade payables | (848,880) | 565,945 | - |
6.01.02.11 | Other taxes and social contributions | (59,102) | (261,194) | - |
6.01.02.12 | Other taxes and social contributions | (107,668) | (79,724) | - |
6.01.02.13 | Regulatory charges | (430,944) | 215,522 | - |
6.01.02.15 | Tax, civil and labor risks paid | (215,873) | (206,788) | - |
6.01.02.16 | Sector financial liability | (64,361) | (1,089,592) | - |
6.01.02.17 | Payables - amounts provided by the CDE | 71,779 | 17,544 | - |
6.01.02.18 | Other operating liabilities | 176,307 | 141,759 | - |
6.01.03 | Others | (2,169,741) | (2,184,628) | - |
6.01.03.01 | Interest paid on debts and debentures | (1,353,339) | (1,846,453) | - |
6.01.03.02 | Income tax and social contribution paid | (816,402) | (338,175) | - |
6.02 | Net cash from investing activities | (1,850,687) | (2,509,321) | - |
6.02.01 | Purchases of property, plant and equipment | (275,986) | (685,856) | - |
6.02.02 | Securities, pledges and restricted deposits | 212,831 | (93,933) | - |
6.02.04 | Purchases of intangible assets | (16,863) | (1,884,577) | - |
6.02.07 | Sale of noncurrent assets | - | 26,807 | - |
6.02.08 | Intragroup loans | - | 36,639 | - |
6.02.10 | Capital increase in existing investee | (1,096) | 91,599 | - |
6.02.16 | Additions of contract asset – in progress | (1,769,573) | - | - |
6.03 | Net cash from financing activities | (364,185) | (2,440,057) | - |
6.03.01 | Capital increase of noncontrolling shareholder | 7,994 | (122,791) | - |
6.03.04 | Borrowings and debentures raised | 9,610,814 | 3,398,084 | - |
6.03.05 | Repayment of principal of borrowings and debentures | (10,204,257) | (5,273,261) | - |
6.03.06 | Settlement of derivatives | 543,427 | (102,641) | - |
6.03.08 | Dividend and interest on capital paid | (322,163) | (336,934) | - |
6.03.10 | Payment of business combination | - | (2,514) | - |
6.05 | Increase (decrease) in cash and cash equivalents | (1,358,186) | (2,915,354) | - |
6.05.01 | Cash and cash equivalents at the beginning of the period | 3,249,643 | 6,164,997 | - |
6.05.02 | Cash and cash equivalents at the end of the period | 1,891,457 | 3,249,643 | - |
14
(Free Translation of the original in Portuguese)
Standard Financial Statements – DFP – Date: December 31, 2018 - CPFL Energia S.A.
Consolidated Financial Statements
Statement of Changes in Equity – from January 1, 2018 to December 31, 2018
(In thousands of Brazilian reais – R$) | |||||||||
Code | Description | Issued capital | Capital reserves, | Earnings reserves | Retained earnings/accumulated losses | Other comprehensive income | Equity | Noncontrolling interests | Consolidated equity |
5.01 | Opening balances | 5,741,284 | 468,014 | 2,916,737 | - | (164,506) | 8,961,529 | 2,224,816 | 11,186,345 |
5.03 | Adjusted opening balances | 5,741,284 | 468,014 | 2,916,737 | - | (164,506) | 8,961,529 | 2,224,816 | 11,186,345 |
5.04 | Capital transactions with owners | - | 1,238 | - | (488,785) | - | (487,547) | (63,024) | (550,571) |
5.04.06 | Dividend | - | - | - | (488,785) | - | (488,785) | (68,685) | (557,470) |
5.04.08 | Other changes | - | 1,238 | - | - | - | 1,238 | 5,661 | 6,899 |
5.05 | Total comprehensive income | - | - | - | 1,975,433 | (186,671) | 1,788,762 | 107,955 | 1,896,717 |
5.05.01 | Profit for the period | - | - | - | 2,058,040 | - | 2,058,040 | 107,955 | 2,165,995 |
5.05.02 | Other comprehensive income | - | - | - | (82,607) | (186,671) | (269,278) | - | (269,278) |
5.05.02.01 | Financial instruments adjustment | - | - | - | (125,162) | 78,953 | (46,209) | - | (46,209) |
5.05.02.02 | Tax on financial instruments adjustment | - | - | - | 42,555 | (26,844) | 15,711 | - | 15,711 |
5.05.02.06 | Other comprehensive income - actuarial gains (losses) | - | - | - | - | (238,780) | (238,780) | - | (238,780) |
5.06 | Internal changes in equity | - | 5 | 1,511,766 | (1,486,648) | (25,118) | 5 | (113) | (108) |
5.06.01 | Recognition of reserves | - | - | 102,902 | (102,902) | - | - | - | - |
5.06.04 | Realization of deemed cost of property, plant and equipment | - | - | - | 38,057 | (38,057) | - | - | - |
5.06.05 | Tax effect on realization of deemed cost | - | - | - | (12,939) | 12,939 | - | - | - |
5.06.07 | Changes in statutory reserve in the year | - | - | 1,408,864 | (1,408,864) | - | - | - | - |
5.06.08 | Other changes | - | 5 | - | - | - | 5 | (113) | (108) |
5.07 | Closing balances | 5,741,284 | 469,257 | 4,428,503 | - | (376,295) | 10,262,749 | 2,269,634 | 12,532,383 |
15
(Free Translation of the original in Portuguese)
Standard Financial Statements – DFP – Date: December 31, 2018 - CPFL Energia S.A.
Consolidated Financial Statements
Statement of Changes in Equity – from January 1, 2017 to December 31, 2017
(In thousands of Brazilian reais – R$) | |||||||||
| |||||||||
Code | Description | Paid-in capital | Capital reserves, stock options and treasury stock | Earnings reserves | Retained earnings/accumulated losses | Other comprehensive income | Equity | Noncontrolling interests | Consolidated equity |
5.01 | Opening balances | 5,741,284 | 468,014 | 1,995,355 | - | (234,632) | 7,970,021 | 2,402,647 | 10,372,668 |
5.03 | Adjusted opening balances | 5,741,284 | 468,014 | 1,995,355 | - | (234,632) | 7,970,021 | 2,402,647 | 10,372,668 |
5.04 | Capital transactions with shareholders | - | - | (7,820) | (276,423) | - | (284,243) | (241,011) | (525,254) |
5.04.01 | Capital increase | - | - | - | - | - | - | (122,791) | (122,791) |
5.04.08 | Prescribed dividends | - | - | - | 3,768 | - | 3,768 | - | 3,768 |
5.04.09 | Interim dividend | - | - | - | - | - | - | (7,226) | (7,226) |
5.04.10 | Dividend proposal approved | - | - | (7,820) | (280,191) | - | (288,011) | (110,994) | (399,005) |
5.05 | Total comprehensive income | - | - | - | 1,179,750 | 96,000 | 1,275,750 | 63,292 | 1,339,042 |
5.05.01 | Profit for the year | - | - | - | 1,179,750 | - | 1,179,750 | 63,292 | 1,243,042 |
5.05.02 | Other comprehensive income | - | - | - | - | 96,000 | 96,000 | - | 96,000 |
5.06 | Internal changes in equity | - | - | 929,201 | (903,327) | (25,874) | - | (112) | (112) |
5.06.01 | Recognition of reserves | - | - | 58,988 | (58,988) | - | - | - | - |
5.06.05 | Changes in statutory reserve in the year | - | - | 870,213 | (870,213) | - | - | - | - |
5.06.06 | Realization of deemed cost of property, plant and equipment | - | - | - | 39,202 | (39,202) | - | - | - |
5.06.07 | Tax on realization of deemed cost | - | - | - | (13,328) | 13,328 | - | - | - |
5.06.09 | Other changes in noncontrolling interests | - | - | - | - | - | - | (112) | (112) |
5.07 | Closing balances | 5,741,284 | 468,014 | 2,916,736 | - | (164,506) | 8,961,528 | 2,224,816 | 11,186,344 |
16
(Free Translation of the original in Portuguese)
Standard Financial Statements – DFP – Date: December 31, 2018 - CPFL Energia S.A.
Consolidated Financial Statements
Statement of Value Added
(In thousands of Brazilian reais – R$) |
|
|
| |
Code | Description | Current Year | Prior Year | Prior Year |
7.01 | Revenues | 42,759,621 | 40,687,927 | - |
7.01.01 | Sales of goods and services | 40,854,038 | 37,980,073 | - |
7.01.02 | Other revenues | 1,772,222 | 2,073,422 | - |
7.01.02.01 | Revenue from construction of concession infrastructure | 1,772,222 | 2,073,422 | - |
7.01.03 | Revenues related to construction of own assets | 302,620 | 789,529 | - |
7.01.04 | Allowance for doubtful debts | (169,259) | (155,097) | - |
7.02 | Inputs purchased from third parties | (23,378,560) | (23,119,553) | - |
7.02.01 | Cost of sales and services | (19,757,090) | (18,772,477) | - |
7.02.02 | Materials, energy, third-party services and others | (2,878,987) | (3,611,796) | - |
7.02.04 | Others | (742,483) | (735,280) | - |
7.03 | Gross value added | 19,381,061 | 17,568,374 | - |
7.04 | Retentions | (1,602,182) | (1,534,034) | - |
7.04.01 | Depreciation and amortization | (1,315,323) | (1,247,819) | - |
7.04.02 | Others | (286,859) | (286,215) | - |
7.04.02.01 | Amortization of concession intangible asset | (286,859) | (286,215) | - |
7.05 | Wealth created by the company | 17,778,879 | 16,034,340 | - |
7.06 | Wealth received in transfer | 1,183,083 | 1,279,056 | - |
7.06.01 | Interest in subsidiaries, associates and joint ventures | 334,198 | 312,391 | - |
7.06.02 | Financial income | 848,885 | 966,665 | - |
7.07 | Total wealth for distribution | 18,961,962 | 17,313,396 | - |
7.08 | Wealth distributed | 18,961,962 | 17,313,396 | - |
7.08.01 | Personnel and charges | 1,390,996 | 1,397,454 | - |
7.08.01.01 | Salaries and wages | 795,377 | 813,004 | - |
7.08.01.02 | Benefits | 530,120 | 516,208 | - |
7.08.01.03 | FGTS (Severance Pay Fund) | 65,499 | 68,242 | - |
7.08.02 | Taxes, fees and contributions | 13,452,580 | 12,181,755 | - |
7.08.02.01 | Federal | 7,231,289 | 6,696,508 | - |
7.08.02.02 | State | 6,195,062 | 5,460,674 | - |
7.08.02.03 | Municipal | 26,229 | 24,573 | - |
7.08.03 | Lenders and lessors | 1,952,391 | 2,491,145 | - |
7.08.03.01 | Interest | 1,879,399 | 2,418,119 | - |
7.08.03.02 | Rentals | 72,992 | 73,026 | - |
7.08.04 | Interest on capital | 2,165,995 | 1,243,042 | - |
7.08.04.02 | Dividend (including additional dividend proposed) | 581,029 | 272,294 | - |
7.08.04.03 | Retained earnings / Loss for the year | 1,584,966 | 970,748 | - |
17
(Free Translation of the original in Portuguese)
Standard Financial Statements – DFP – Date: December 31, 2018 - CPFL Energia S.A.
Management Report
Dear Shareholders,
In compliance with the law and the Bylaws of CPFL Energia S.A. (“CPFL Energia” or “Company”), the Management of the Company hereby submits to you the Management Report and financial statements of the Company, along with the reports of the independent auditor and fiscal council for the fiscal year ended December 31, 2018.All comparisons herein are made with consolidated figures for fiscal year 2017, except when specified otherwise.
1. Opening remarks
The CPFL group continued to be very active in 2018, promoting improvements in its operations and management, as well as following the unfolding of the political and economic scenarios of Brazil in its markets.
The 2018 results reflected the growth of energy sales in all consumption classes, our discipline in cost and expense management, as well as the drop in interest rates in Brazil.
Electricity sales to final consumers (quantity of electricity billed to final consumers) totaled 53,091 GWh, a reduction of 0.5%. Industrial and commercial classes registered reductions of 5.6% and 0.1%, respectively, reflecting the slow recovery of economy activity, while residencial class increased by 2.6%. Electricity sales to wholesaler’s, through other concessionaires, licensees and authorized reached 17,757 GWh, an increase of 8.7%.
CPFL group’s operating cash generation, measured by EBITDA, reached R$ 5,637 million in 2018 (+15.9%), reflecting the positive results of all business segments. We highlight the distribution segment, whose EBITDA reached R$ 3,004 million in 2018 (+34.5%), mainly reflecting the results coming from the conclusion of the tariff revision process (4th cycle) of CPFL Paulista, RGE Sul (both in April 2018) and RGE (in June 2018). In addition, the Company is promoting organizational reviews in order to simplify its processes and structure, aiming at greater efficiency and focus on business.
We continue working on value initiatives and in our investment plan in 2018, with financial discipline, efforts and commitment of our teams. We invested R$ 2,060 million in this period.
Among the value initiatives, it is worth mentioning the participation of CPFL Geração in the following transmission auctions: (i) in June 2018, the company won Lot 9 (Maracanaú II substation), in Ceará, and (ii) in December 2018, the company won Lots 5 (Itá substation), in Santa Catarina, and 11 (Osório 3, Porto Alegre 1 and Vila Maria substations), in Rio Grande do Sul.
We also had the creation of CPFL Soluções, which brings together services and products previously offered under the brands CPFL Brasil, CPFL Serviços and CPFL Eficiência. In this way, we have an integrated platform for interaction with customers seeking solutions for energy trading, energy efficiency, distributed generation, energy infrastructure and consulting services.
It should also be noted that CPFL promoted the merger of the distribution company RGE (“Merged Company”) into RGE Sul (“Mergee Company”). The grouping of the concessions of the two companies was carried out through the merger of the assets held by the Merged Company by the Mergee Company on December 31, 2018.
We also had the startup of the Boa Vista II SHPP (installed capacity of 29.9 MW), in November 2018, and the participation of CPFL Renováveis in the A-6 Auction of August 2018. Thecompany won with the following projects: (i) Cherobim SHPP, with 28.0 MW of installed capacity, located in Paraná state, and (ii) Gameleira Wind Complex, with 69.3 MW of installed capacity, located in Rio Grande do Norte state.
18
(Free Translation of the original in Portuguese)
Standard Financial Statements – DFP – Date: December 31, 2018 - CPFL Energia S.A.
Still in relation to CPFL Renováveis, we had the Mandatory Tender Offer of the company on November 26. As a result of the auction, State Grid acquired 243,771,824 common shares issued by the company, representing 48.39% of the capital stock of the company. The common shares were acquired at the price of R$ 16.85, totaling the amount of R$ 4.1 billion. State Grid and CPFL Geração (indirectly controlled by State Grid) jointly held 503,520,623 common shares issued by the company, equivalent to 99.94% of the total share capital of the company.
CPFL Energia’s capital structure and consolidated leverage remained at adequate levels. The Company’s net debt reached 3.05 times EBITDA at the end of the quarter, under the criteria to measure our financial covenants, lower than in the previous year. It is worth mentioning that the reductions in interest rates benefited the Company.
Finally, CPFL’s management remains optimistic about the advances of the Brazilian electricity sector and remains confident in its business platform, which is increasingly prepared and well positioned to face the challenges and opportunities in the country.
19
(Free Translation of the original in Portuguese)
Standard Financial Statements – DFP – Date: December 31, 2018 - CPFL Energia S.A.
SHAREHOLDERS’ STRUCTURE (simplified)
CPFL Energia is a holding company that owns stake in other companies:
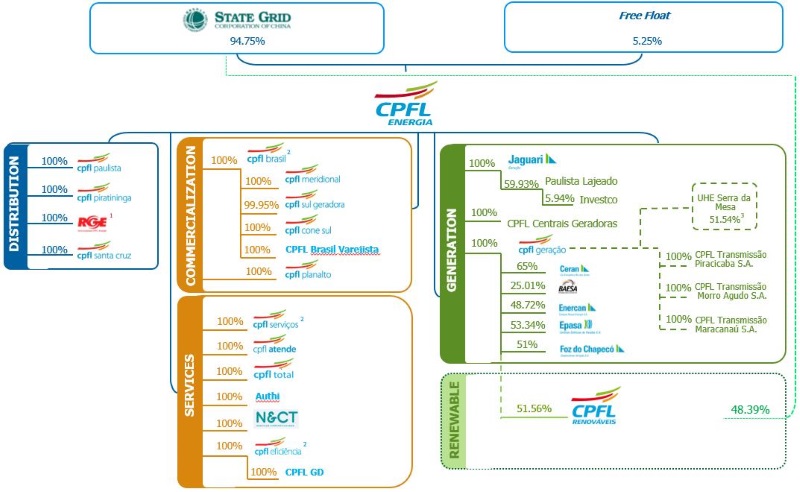
Reference date: 12/31/2018
Notes:
(1) RGE is held by CPFL Energia (89.0107%) and CPFL Brasil (10.9893% );
(2) (2) CPFL Soluções = CPFL Brasil + CPFL Serviços + CPFL Eficiência;
(3) 51.54% stake of the availability of power and energy of Serra da Mesa HPP, regarding the Power Purchase Agreement between CPFL Geração and Furnas.
2. Comments on the macroeconomic and regulatory scenario
Macroeconomic Scenario
After three years of sharp contraction between 2014 and 2016, a period marked by several political upheavals, the Brazilian economy started a slow and irregular recovery in 2017 and 2018. However, numerous allegations of corruption and the truck drivers’ strike in May 2018 put the brakes on the reforms agenda and slowed down the pace of economic recovery.
Moreover, external demand, which had been helping in the recovery of the domestic economy until early 2018, recorded a significant downturn. Some of Brazil’s main trade partners such asChina and the European Union have been registering significant economic slowdown, while Argentina, the main destination of our manufactured exports, has been facing strong economic contraction. In this scenario, Brazil’s industrial output ended last year virtually stagnant.
20
(Free Translation of the original in Portuguese)
Standard Financial Statements – DFP – Date: December 31, 2018 - CPFL Energia S.A.
Despite the sluggish economic recovery and the still high fiscal vulnerability, several of Brazil’s macroeconomic fundamentals improved during 2017 and 2018. The highlight was the decline in inflation and the taming of inflationary expectations. Comfortably meeting the inflation targets in a scenario where the idleness of our economy remains high, especially in the labor market, allowed the Central Bank to reduce the basic interest rate to historic lows, which helped unbind the credit market.
The year 2019 begins with more favorable expectations, as indicated by the improvement in diverse financial indicators. In fact, “Brazil risk” has been recoiling in light of expectations that the reforms, especially the pension reform, will be taken up by the new government; and the Brazilian stock market has been registering significant gains, bucking the trend of corrections seen in foreign markets.
In a stable foreign exchange scenario, inflationary expectations have remained anchored to the targets: according to forecasts by market institutions, the average increase in the IPCA rate, which serves as the benchmark for inflation targets, is around 4% for 20191, slightly below the target of 4.25% set for this year. As a result, the Central Bank is expected to maintain its monetary policy on the expansionist mode for a while longer. The average of market forecasts for the Selic interest rate at the end of this year is around 7%1 p.a.
The stimulus that the expansionist monetary policy will give the credit market, combined with the trend (albeit slow and irregular) of declining unemployment and increasing household income, should drive household consumption, which should continue its moderate acceleration during 2019. The improvement in business confidence, on the other hand, based on the expected resumption of reforms, could impart greater dynamism to the resumption of investments, which, for now, recovered a very modest part of the sharp downturn registered during the recession.
Despite the more promising expectations, the scenario for 2019 continues to face risks that cannot be ignored. The main risk continues to be political: any frustrations with the resumption of reforms would sharply increase exchange rate volatility and worsen business confidence, with impacts on consumption and investments. The external environment continues to be challenging, with the world’s leading economies cooling down.
Thus, growth projections for the Brazilian economy continue to indicate a still moderate pace of recovery. The average of forecasts made by market institutions indicate that GDP will grow from 1.1/% in 2018 as reported by IBGE to around 2.5% in 20191. Weakened external demand and fiscal adjustment measures, which weigh on government consumption and public investment, tend to limit the pace of recovery in the short term. Thus, GDP is expected to return to its level in early 2014 only in mid-2020.
REGULATORY ENVIRONMENT
The main changes in the sector regulations in 2018 in the distribution segment are outlined below:
1) The Brazilian Electricity Regulatory Agency (Aneel) amended, through Normative Resolution 820/2018, the rules for establishing the Board of Consumers of Electricity when grouping the concession areas;
1 Data from the Central Bank of Brazil’s Focus market readout on Jan. 18, 2019.
21
(Free Translation of the original in Portuguese)
Standard Financial Statements – DFP – Date: December 31, 2018 - CPFL Energia S.A.
2) ANEEL amended Normative Resolution 716/2016, which deals with the procedures applicable when grouping electricity distribution concession areas subject to joint corporate control and the tariff treatment of the new concession area. The amendment was made through Normative Resolution 835/2018, aimed at adjusting the wording of the grouping agreements for concessions that did not join the new concession contract model;
3) Redraft of the Electricity Sector Accounting Manual (MCSE), approved by Normative Resolution 814/2018, in two dimensions: procedural and in principle;
4) Amendment of sub-module 2.4 of Tariff Regulation Procedures (PRORET), implemented by Normative Resolution 807/2018, which defines maintaining the current weighted average cost of capital (WACC) until December 2019, as well as advancing, from January 2020, of the public hearing process for reviewing the methodology to be applied;
5) Update of sub-modules 2.2 and 2.2A of Tariff Regulation Procedures (PRORET), approved by Normative Resolution 806/2018, establishing new efficiency levels for calculating regulatory operational costs in the tariff review processes of distributors as from 2018;
6) Update of Sub-module 6.8 of PRORET, which addresses Dynamic Pricing. The amendments were split into two stages: the first to discuss and define the ranges and triggers for activating each level of Dynamic Pricing; and the second to improve the pass-through methodology of the Centralization Account of Dynamic Pricing Funds (CCRBT). The amendments were authorized by Normative Resolutions 811/2018 and 826/2018;
7) Update of the Rules for Electricity Trading applicable to the Accounting and Settlement System (SCL), through Normative Resolution 833, for complying with Normative Resolution 824/2018, related to the Mechanism for Sale of Surplus (MVE);
8) Creation of PRORET sub-module 5.4 through Normative Resolution 837/2018, to regulate the System Service Fees (ESS) and the Reserve Energy Fees (ERR) for transferring tariff to distributors;
9) Regulation of the Energy Reserve Account (CONER) through Normative Resolution 829/2018, in order to attain the best cost/benefit ratio between collection of charges, refund of surplus in the CONER balance and the security level of the account to fulfill its obligations to pay generators contracted with reserve energy;
10)Creation of PRORET sub-module 12.6 through Normative Resolution 836/2018 to regulate the methodology for calculating the quotas of the Angra 1 and Angra 2 Generation Plants and the Itaipu Hydroelectric Plant.
11)Decree 9,642/2018, which amended Decree 7,891/2013, regarding the gradual reduction in discounts granted in the Distribution System Use Tariff and the electricity supply system, in compliance with the final report of the Plan for Structural Reduction of Expenses of the Energy Development Account (CDE) proposed by the Ministry of Mines & Energy (MME), as well as the exclusion of cumulative tariff benefits to certain consumer classes and economic activities;
22
(Free Translation of the original in Portuguese)
Standard Financial Statements – DFP – Date: December 31, 2018 - CPFL Energia S.A.
ELECTRICITY TARIFFS AND PRICES
Distribution Segment
· Annual Tariff Adjustment (ATA):
The following distribution companies had tariffs adjusted in 2018:
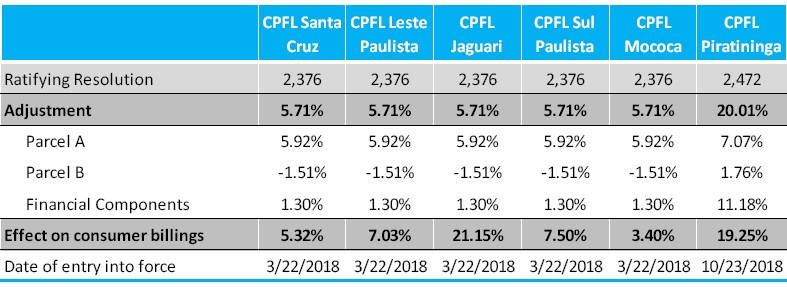
Considering the merger of the concessions CPFL Santa Cruz / CPFL Leste Paulista / CPFL Jaguari / CPFL Sul Paulista e CPFL Mococa in 12/31/2017, the same percentage of adjustment was considered for all the concessions, but the effect on consumer billings is different for each one of the concessions.
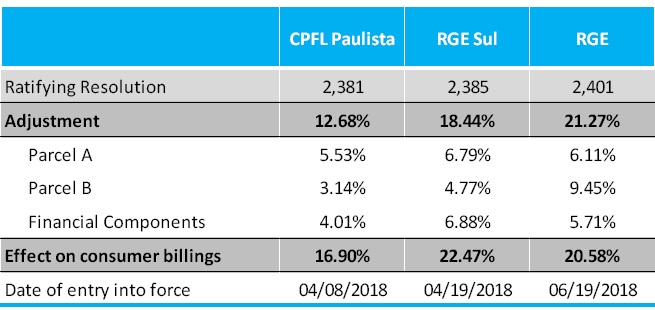
· Periodical Tariff Revision (PTR):
The following distribution companies went through the tariff revision process in 2018:
23
(Free Translation of the original in Portuguese)
Standard Financial Statements – DFP – Date: December 31, 2018 - CPFL Energia S.A.
CPFL Paulista
On April 3, 2018, Aneel approved the results of the fourth Periodic Tariff Review of the distributor CPFL Paulista. The average impact to be perceived by consumers is 16.90% and details can be found in the table above.
RGE Sul
On April 17, 2018, Aneel approved the results of the fourth Periodic Tariff Review of the distributor RGE Sul. The average impact to be perceived by consumers is 22.47% and details can be found in the table above.
RGE
On June 19, 2018, Aneel approved the results of the fourth Periodic Tariff Review of the distributor RGE. The average impact to be perceived by consumers is 20.58% and details can be found in the table above
Generation Segment
Electricity sale contracts of generators contain specific adjustment clauses, whose main index is the average annual variation measured by the IGP-M. Contracts signed in the Regulated Contracting Environment (ACR) are indexed to the IPCA, and bilateral contracts signed by the indirect subsidiary Campos Novos Energia (Enercan) use a combination of dollar and IGP-M indexes.
3. Operating Performance
ENERGY SALES
In 2018, electricity sales to final consumers (quantity of electricity billed to final consumers) totaled 53,091 GWh, a reduction of 0.5% (285 GWh) compared to 2017.
It is noteworthy the performance of the residential segment, which accounted 37.0% of the electricity sales to final consumers:
· Residential Class: increase of 2.6%, reflecting the slow recovery of economy activity.
· Commercial Class: reduction of 0.1%, reflecting the lower sales of the distribution companies to the captive market, due to the migration of customers to the free market. This effect was partially offset by the higher sales made by the commercialization companies to free customers.
· Industrial Class: reduction of 5.6%, reflecting the lower sales of the distribution companies to the captive market, due to the migration of customers to the free market, and the lower sales made by the commercialization companies and by the assets of renewable generation (controlled by CPFL Renováveis) to free customers.
Electricity sales to wholesaler’s, through other concessionaires, licensees and authorized reached 20,631 GWh, which represented an increase of 26.3% (4.294 GWh), mainy due to the increase in sales by the commercialization companies (through bilateral contracts).
24
(Free Translation of the original in Portuguese)
Standard Financial Statements – DFP – Date: December 31, 2018 - CPFL Energia S.A.
PERFORMANCE IN THE ELECTRICITY DISTRIBUTION SEGMENT
The Group maintained its strategy of encouraging the dissemination and sharing of best management and operational practices at its distributors in an effort to increase operational efficiency and improve the quality of services provided to clients.
Find below the results posted by distributors in the main indicators that measure quality and reliability of power supply. The Equivalent Duration of Interruptions (SAIDI) measures the average duration, in hours, of interruptions suffered by consumers in the year, while the SAIFI (Equivalent Frequency of Interruptions) measures the average number of interruptions suffered per consumer per year.

PERFORMANCE IN THE ELECTRICITY GENERATION SEGMENT
In 2018, the installed capacity of the Generation segment of CPFL group totaled 3,272 MW, considering its 51.56% interest in CPFL Renováveis.
On December 31, 2018, the portfolio of CPFL Renováveis totaled 2,133 MW of installed capacity in operation, comprising 40 SHPPs (453 MW), 45 wind farms (1,309 MW), 8 biomass-powered thermal power plants (370 MW) and 1 solar plant (1 MW).
In November 2018, the Boa Vista II SHPP, with 29.9 MW of installed capacity and located in the municipality of Varginha, Minas Gerais state, started operations, with more than one year of anticipation.
It is important to highlight the participation of CPFL Renováveis in the A-6 Auction of August 2018. The company won with the following projects: (i) Cherobim SHPP, with 28.0 MW of installed capacity, located in Paraná state, and (ii) Gameleira Wind Complex, with 69.3 MW of installed capacity, located in Rio Grande do Norte state. The startup of these projects is schedule to 2024.
4. Economic and Financial Performance
The Management’s comments on economic and financial performance and the operating results should be read together with the financial statements and notes to the financial statements.
Operating Revenue
Gross operating revenue was of R$ 42,626 million, representing an increase of 6.4% (R$ 2,573 million), due to the increases: (i) of 12.9% (R$ 3,324 million) in electricity sales to final consumers; (ii) of 19.7% (R$ 796 million) in other operating income; and (iii) of 68.8% (R$ 141 million) in the update of concession’s financial asset. These effects were partially offset bythe reduction of 11.3% (R$ 694 million) in the electricity sales to wholesalers, the variation of R$ 693 million in the sectoral financial assets and liabilities, from an asset of R$ 1,901 million in 2017 to an asset of R$ 1,208 million in 2018, and the reduction of 14.5% (R$ 301 million) in the revenue with construction of concession infrastructure.
25
(Free Translation of the original in Portuguese)
Standard Financial Statements – DFP – Date: December 31, 2018 - CPFL Energia S.A.
Deductions from operating revenue were of R$ 14,490 million, presenting an increase of 8.9% (R$ 1,181 million). Net operating revenue was of R$ 28,137 million, representing an increase of 5.2% (R$ 1,392 million).
Operating Cash Flow - EBITDA
EBITDA is a non-accounting measurement calculated by Management as the sum of income, taxes, financial income/loss, depreciation and amortization. This measurement serves as an indicator of management performance and is usually monitored by the market. Management complied with the concepts of CVM Instruction 527 of October 4, 2012, while calculating this non-accounting measurement.
Reconciliation of Net Income and EBITDA | ||
2018 | 2017 | |
Net Income | 2,165,995 | 1,243,042 |
Depreciation and Amortization | 1,594,065 | 1,529,052 |
Assets Surplus Value Amortization | 579 | 579 |
Financial Income/Loss | 1,102,687 | 1,487,554 |
Social Contribution | 213,673 | 168,728 |
Income Tax | 560,310 | 434,901 |
EBITDA | 5,637,308 | 4,863,856 |
Operating cash flow, as measured by EBITDA, reached R$ 5,637 million, an increase of 15.9% (R$ 773 million), mainly due to the increase of 5.2% (R$ 1,392 million) in net operating revenue, the reduction of 5.6% (R$ 297 million) in operating costs and expenses, including expenses with private pension fund and costs with construction of concession infrastructure, and the increase of 7.0% (R$ 22 million) in equity income. These effects were partially offset by the increase of 5.5% (R$ 937 million) in costs with energy purchase and sector charges.
Net Income
In 2018, net income reached R$ 2,166 million, an increase of 74.2% (R$ 923 million), mainly due to the increase of 15.9% (R$ 773 million) in EBITDA and the reduction of 25.9% (R$ 385 million) in net financial expenses. These effects were partially offset by the increases of R$ 170 million in Income Tax and Social Contribution and of 4.3% (R$ 65 million) in depreciation and amortization.
Allocation of Net Income from the Fiscal Year
The Company’s Bylaws require the distribution of at least 25% of net income adjusted according to law, as dividends to its shareholders. The proposal for allocation of net incomefrom the fiscal year is shown below:
26
(Free Translation of the original in Portuguese)
Standard Financial Statements – DFP – Date: December 31, 2018 - CPFL Energia S.A.
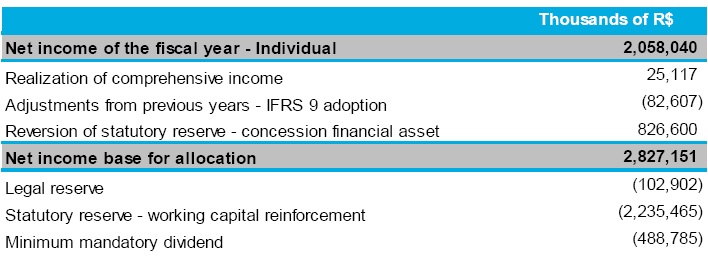
Minimum Mandatory Dividend (25%)
The Board of Directors propose the payment of R$ 489 million in dividends to holders of common shares traded on B3 S.A. – Brasil, Bolsa, Balcão (B3). This proposed amount corresponds to R$ 0.480182232 per share, related to the fiscal year of 2018.
Statutory Reserve – Working Capital Reinforcement
For this fiscal year, considering the current macro scenario with an incipient economic recovery, and also considering the uncertainties regarding hydrology, the Company’s Management is proposing the allocation of R$ 2,235 million to the statutory reserve - working capital reinforcement.
Debt
At the close of 2018, gross financial debt (including derivatives) of the Company reached R$ 19,752 million, presenting an increase of 0.7%. Cash and cash equivalents totaled R$ 1,891 million, a decrease of 41.8%. As such, net financial debt increased 9.1% to R$ 17,860 million.
5. Investments
In 2018, investments of R$ 2,062 million were made in business maintenance and expansion, of which R$ 1,770 million was destined to distribution, R$ 237 million to generation (R$ 225 million to renewable generation and R$ 12 million to conventional generation) and R$ 56 million to commercialization, services and others.In addition,we investedR$ 3 million inthetransmission segment and,according to the requirements of IFRIC 15, it wasrecorded as “Contractual Asset ofTransmission Companies” (in other credits).
CPFL Energia’s investments in 2018 include:
Distribution: investments in expansion, maintenance, improvement, automation, modernization and strengthening the electricity system to meet market growth, in operational infrastructure, customer service and research and development programs, among other areas. On December 31, 2018, our distributors had 9.6 million customers, an increase of 0.2 million customers. Our distribution network consisted of 323,979 kilometers of distribution lines (adding 5,961 kilometers of lines), including 464,627 distribution transformers (adding 6,886 transformers). Our five distribution subsidiaries had 12,564 kilometers of high voltage distribution lines of between 34.5 kV and 138 kV (adding 60 kilometers of lines). On that date,we had 548 transformer substations, from high voltage to medium voltage, for subsequent distribution (adding 01 substation), with total transformer capacity of 18,578 MVA (adding 110 MVA);
27
(Free Translation of the original in Portuguese)
Standard Financial Statements – DFP – Date: December 31, 2018 - CPFL Energia S.A.
Generation: in 2018, were invested R$ 237 million, of which R$ 12 million of conventional generation and R$ 225 million of renewable generation, mainly focused on the Boa Vista II SHPP, that began operations in November 2018.
6. Corporate Governance
The corporate governance model adopted by CPFL Energia and its subsidiaries is based on the principles of transparency, equity, accountability and corporate responsibility.
In 2018, CPFL completed 14 years of its IPO on the B3 and the New York Stock Exchange (NYSE). With more than 100 years of history in Brazil, the Company has its shares listed on the Novo Mercado segment of the B3 with Level III ADRs on the NYSE, both special listing segments for companies that comply with corporate governance best practices. All CPFL shares are common shares, entitling shareholders the right to vote with 100% Tag Along rights guaranteed in case of sale of shareholding control.
CPFL’s Management is composed of the Board of Directors (Board), its decision-making authority, and the Board of Executive Officers, its executive body. The Board is responsible for defining the strategic business direction of the holding company and subsidiaries, and is composed of 7 members, two of whom are independent members, whose term of office is 1 year and who are eligible for reelection.
The Charter of the Board establishes the procedures for evaluating the directors, under the leadership of the Chairman, as well as their key duties and rights.
The Board has set up three advisory committees (Management, Risks and Sustainability Processes, People Management and Related Parties), which support the Board in its decisions and monitor relevant and strategic issues, such as people and risk management, sustainability, monitoring of internal audit, analysis of transactions with related parties of shareholders pertaining to the controlling block and handling of incidents recorded through complaint hotlines and ethical conduct channels.
The Board of Executive Officers is made up of 1 Chief Executive Officer, 1 Deputy Chief Executive Officer and 8 Executive Vice Presidents, all with terms of office of two years, eligible for reelection, who are responsible for executing the strategy of CPFL Energia and its subsidiaries, as defined by the Board of Directors in line with corporate governance guidelines. To ensure alignment of governance practices, the Chief Executive Officer and the Deputy Chief Executive Officer sit on the Boards of Directors of companies that make up the CPFL group.
CPFL has a permanent Fiscal Council, consisting of 3 members and 3 alternate members, which also performs the functions of the Audit Committee, in compliance with the Sarbanes-Oxley Act (SOX) rules applicable to foreign companies listed on U.S. stock exchanges.
The guidelines and documents on corporate governance are available at the Investor Relations website http://www.cpfl.com.br/ir.
28
(Free Translation of the original in Portuguese)
Standard Financial Statements – DFP – Date: December 31, 2018 - CPFL Energia S.A.
7. Capital Markets
The shares of CPFL Energia, which have a free float of 5,25% (up to December 31, 2018), are listed both on the São Paulo Stock Exchange (B3) and the New York Stock Exchange (NYSE).
In 2018, CPFL Energia shares depreciated 49.1% on the BM&FBovespa and 29.4% on the NYSE, closing the year at R$ 28.85 per share and US$ 14.80 per ADR, respectively. The average daily trading volume in 2018 was R$ 12.8 million, of which R$ 11.1 million on the BM&FBovespa and R$ 1.7 million on the NYSE, representing a decrease of 73.7% over 2017. Number of trades on the BM&FBovespa decreased 49.1%, from a daily average of 3,230 trades in 2017 to 1,645 in 2018.
8. Sustainability and Corporate Responsibility
We develop initiatives aimed at generating shared value between the company and its stakeholder groups in order to ensure competitiveness, through excellence in operations, and contribute to better economic, social and environmental conditions in the areas of influence. In line with the strategic plan of the CPFL Group, the commitments and business guidelines aim to promote sustainable development and are incorporated into the decision-making process and actions. See the highlights below.
Sustainability platform: management tool that includes performance indicators and targets related to issues that are important for the sustainability of the CPFL Group, which are defined based on its positioning and strategy for the short, medium and long terms, as well as from the perspective of its key stakeholder groups. Starting 2018, we have incorporated the United Nation Sustainable Development Goals (SDG) in the Platform as part of our implementation process.
Sustainability Committee:executive management body responsible for monitoring the Platform, evaluating and recommending the inclusion of sustainability criteria and guidelines in the decision-making process, monitoring trends and critical topics for the sustainable development of the company.
Climate Change:we maintain a strategic focus on low carbon businesses and projects that aim to combat climate change and its effects, such as the internal study on carbon pricing and structuring the group’s portfolio of low carbon products. Moreover, we work together with organizations such as the Global Compact Brazil, the Brazilian Business Council for Sustainable Development (CEBDS), World Business Council for Sustainable Development (WBCSD), Fundação Getúlio Vargas (FGV), Business Initiatives on Climate (IEC), and other business initiatives and groups.
Ethics Management and Development System (SGDE):The SGDE currently consists of seven elements, which are considered key for the operations of the holding company and its subsidiaries in the ethics management culture. These are: (i) Code of Ethical Conduct; (ii) Ethics and Business Conduct Committee (COMET); (iii) Charter of COMET; (iv) External Ethics Channel; (v) Complaints Processing Commission (CPD); (vi) Disclosure Plan; and (vii) Training. We can highlight the following initiatives carried out in 2018: a) Integrity Pills (internal communications) specifically on the guidelines of the Code of Ethical Conduct; b) On-site training on Integrity and Ethics for Sensitive Stakeholders (Legal, Regulatory, HR, Government), Electricians and CPFL Atende employees (Call Center); c) Event to celebrateInternational Anticorruption Day, which included, among others, a debate on the issue and featured the CEO of CPFL Energia at the time(Andre Dorf) and other guests: Alípio Casali (philosopher and member of the Ethics Committee), Ricardo Voltolini (consultant and author) and Marcela Varani (journalist); d) Lecture on Integrity, Compliance and Ethics by a renowned Compliance professional for CPFL Energia executives. The Ethics and Business Conduct Committee also held 11 meetings in 2018 to discuss topics related to ethics management and to analyze suggestions, queries and complaints received during the period.
29
(Free Translation of the original in Portuguese)
Standard Financial Statements – DFP – Date: December 31, 2018 - CPFL Energia S.A.
Human Resources Management: the company ended 2018 with 12,976 employees (13,008 in 2017), which represents a turnover rate of 16.25% (17.24% in 2017). The Group companies maintained their management and training programs focused on honing skills of strategic importance to the business, leadership succession, boosting productivity, as well as occupational health and safety. Average training hours per employee in 2018 stood at 55.64 (hours), higher than the average of 47 hours as per the Sextant Survey 2017 for the Energy Market and 32 hours for the General Market. In 2018, we rebranded the University which, as CPFL University, had a new positioning and the belief that “Education expands Potential” (brand essence). With this, we presented our 4 Schools to the company: Leadership, Business and Innovation, Service Excellence and Operational Excellence.
That year we also concluded the 1st Cycle of the “Flying High” and “Leader Take-off” Programs, which brought the best leadership practices to 150 managers and over 700 leaders, respectively. Another important corporate initiative was the launch of the “Expanding Horizons” Program, which extends into 2019 strengthening the actions of 35 executives of the CPFL Energia Group.
The year also saw the unification of the learning platforms, integrated with the entire CPFL Group Employee Registry (Multi HR) which brought agility, improved performance and reach of the training programs offered by the company.
Value Network: In 2018, three Value Network meetings were held.
The meetings were attended by main suppliers of materials and intensive labor services for the CPFL Group.
The first meeting was held on May 23, 2018 and featured the following lectures:
· Management, Excellence, Ethics – Marcos Bardagi (Chief Operations Officer of the National Quality Foundation - FNQ);
· Integrity Program - Helio Takashi Ito (Manager - Risks, Audit and Compliance of the CPFL group);
· Information on SUPRE – FUNCOGE (Symposium on Procurement and Logistics of Companies in the Electricity Sector).
The second meeting was held on September 25, 2018, featuring two lectures:
· Labor Reform: Current scenario – Dr. Jorge Gonzaga Matsumoto (Partner at Bichara Advogados);
· Safety at Contracted Companies - Marcos Victor Lopes (Health and Workplace Safety Manager)
The final meeting of the year, held on December 5, 2018, featured the following lectures:
· Macroeconomic Scenario - Silvio Campos Neto (Senior Economist at Tendências Consultoria)
· Challenges facing the Electricity Sector - Rafael Calaes (Strategy Manager of the CPFL Group)
· New Supplier Financial Portal - André Barbosa (Cash Management Specialist in the CPFL Group).
30
(Free Translation of the original in Portuguese)
Standard Financial Statements – DFP – Date: December 31, 2018 - CPFL Energia S.A.
Community relations:(i) Culture and Sports – In 2018, the CPFL Institute celebrated 15 seasons of cultural programming, consolidating its activities across Brazil and integrated into a single network of cultural, social and sports programs. The year 2018 represented a milestone, with initiatives in 106 cities across six states, reaching over 300,000 people. One of the new features in the cultural agenda wasParklet Musical, a plaza-on-wheels that occupied areas originally intended for parking lots in 33 cities. The project was part of the CPFL Circuit, which also included Cine Solar film sessions, running, hiking and bike touring events, totaling 180 activities that involved 47,000 people. Another highlight was the Chinese Culture Month in September, with activities at the Café Filosófico CPFL and concerts by the Zhejiang Symphonic Orchestra. The special agenda totaled 30 events in 5 cities and reached 25,000 people. At the CPFL Institute headquarters in Campinas, Café Filosófico CPFL totaled 33 sessions, with 7,000 in the audience and 930,000 accesses to the live broadcasts on social media. Also at the headquarters, Cine CPFL screened 96 films, the Contemporary Music had 14 concerts, while special events included 2 film festivals (13th Latin American Film Festival of São Paulo and the 41st International Film Festival of São Paulo) and 1 music festival (5th Brazilian Contemporary Music Festival), totaling an audience of 5,500 people. In social media, CPFL Institute reached 1.5 million people (combining live webcasts and 600,000 followers in digital platforms), produced 20 new audiovisual productions (available on YouTube) and uploaded 875 videos on the CPFL Institute Play app. As a private social investment vehicle of the CPFL Group, the CPFL Institute, in 2018 reinforced its commitment to local development, promoting the strengthening of public policies. All of which sought to stimulate social leadership by building a large knowledge network. Investments in cultural and sports initiatives totaled R$18,217.47;(ii) Support for Municipal Councils for the Rights of Children and Adolescents (CMDCA) (1% of Income Tax) – In 2018, the Group companies donated R$2.1 million to the Municipal Funds for Children and Adolescents of 15 municipalities in the concession area. The donation will support the Councils in implementing projects and in a specific training and institutional development program in 2019;(iii) Support to Municipal Councils for the Rights of the Elderly – CMDI (1% of Income Tax)-In 2018, the Group companies donated R$1.9 million to the Municipal Funds for the Elderly in three cities to support technological development projects and a training program for elderly wings in two hospitals, including the Cancer Hospital in Barretos;(iv) Volunteer Work –In 2018, 21 initiatives were rolled out that directly engaged 560 volunteers. The actions organized in nine cities in the concession area benefitted approximately 3,300 people directly and indirectly;(v) Support to Pronon - National Support Program for Oncological Services (1% of Income Tax) -In 2018, the Group companies donated R$1.9 million to support technological development projects at Cancer Hospitals in four municipalities in the concession area;(vi) Energy Efficiency (0.5% of Net Operating Income) – the goal of the Energy Efficiency Program is to promote the efficient and rational use of electricity through projects. In 2018, we invested R$67.6 million in energy efficiency projects. We also concluded 44 projects in 2018, whose numbers are: among low-income consumers, 56,513 homes and 107 public buildings were serviced, involving the regularization of 1,370 illegal connections, replacement of 2,000 refrigerators, 115,826 light bulbs with more efficient (LED) bulbs, installation of 4,000 solar heaters and 7,820 heat exchangers. among customers classified as Government Agencies, Utilities, Industry, Commercial or Residential, we serviced 42 public buildings, 19 hospitals, 3 commercial buildings, 96 schools, 1 condo and 7,199 homes, resulting in the replacement of 105,984 light bulbs with more efficient (LED) models, 32,521 lighting systems (fixtures, bulbs and ballasts) and the installation of 23 pumps, 3 chillers, 2 cooling towers, 62 motors, 2 compressors, 38 air-conditioning equipment and 7,199 refrigerators; in the Educational category, we held training programs for 107,274 students and 5,154 teachers in 461 schools in 158 cities; lastly, we replaced 443 motors at 17 industrial plants under Aneel’s Bonus Motors Priority Project. In 2018, R$81.4 million (0.4%) were allocated to the Energy Efficiency Program and R$20.3 million (0.1%) were provisioned, in accordance with Law 13,280/2016, to be passed through at an opportune moment to PROCEL; (vii) Projeto GeekieThe goal of this projectis to reduce students learning gaps and provide training for regional teachers and managers through the implementation of an online adaptive learning platform. In 2018,
31
(Free Translation of the original in Portuguese)
Standard Financial Statements – DFP – Date: December 31, 2018 - CPFL Energia S.A.
approximately 18 thousand students from 41 public schools in Caxias do Sul / RS were attended. The investment was R $ 1.3 million, amount financed with funds from BNDES. (viii) Tamboro Project– aims to implement new educational methodologies by using an adaptive learning platform based on games. In 2018, approximately 7,000 students in 14 public schools in Santos, São Paulo, benefitted from the project. The investment amounted to R$1.3 million, which was financed by the Social Subcredit facility of the BNDES; (ix) ToLife Project-Implementation of a system for classifying clinical risk and organizing patient flows at emergency care units in public hospitals and/or hospitals that serve the National Health System (SUS). In 2018, six health care units in Campinas, including the facility at Unicamp, three units in Sorocaba and one in Americana, all in São Paulo, benefitted from the project. The investment was R$182,000, which was financed by the Social Subcredit facility of the BNDES;(x) Community Library Project– aims to democratize access to literature and to put into practice Federal Law 12,244/10, which determines that by 2020 all educational institutions in Brazil must have a library. In 2018, two libraries were built in the state of São Paulo (Marília and Bebedouro), and two libraries in Igrejinha and Nova Hartz, Rio Grande do Sul. The investment was R$846,000, which was financed by the Social Subcredit facility of the BNDES; Local social investment initiatives were carried out in 128 cities and impacted around 230,000 people.(xi) Electrician School– organized in partnership with SENAI, in over 10 Training Centers in the state of São Paulo and four in Rio Grandedo Sul, it provides training in the function of distribution electricians in order to mitigate risks arising from the shortage of such professionals in the market. It configures a social investment because it offers free training in the communities where it operates, in addition to offering job opportunities, since the company has hired many of these new electricians. In 2018, we trained 250 new electricians and 141 are still undergoing training. In all, 190 were hired. For 2019, there are plans to organize 43 Electrician Schools - 9 in Rio Grande do Sul and 34 in São Paulo.
Environment management:(i) In 2018, CPFL Energia’s 2017 greenhouse gas emissions inventory received the Gold Seal from the Brazilian GHG Protocol Program. All inventory-related information is available at: http://registropublicodeemissoes.com.br/participantes/1077 and (ii) each Group company implemented projects to mitigate the social and environmental impacts of its projects, with the following worth mention:
Energy Generation – Foz do Chapecó HEP – Integrated Management System (SGI)In November 2018, Foz do Chapecó Energia earned a recommendation for maintaining the ISOs 9001:2015 and 14001:2015 and OHSAS 18001:2007 standards from the British Standards Institution (BSI). The recommendation came after an audit conducted between November 26 and 30.Social and Environmental Management:Some of the 2018 highlights in the social and environmental domain were: (i) the release of approximately 208,000 fingerlings into the plant reservoir as part of the initiatives to repopulate the lake. (ii) Conclusion of the construction of three fishing support points upstream to the plant, in the state of Santa Catarina; Fishermen associations connected to each of these structures received the necessary funds for construction after signing the agreement; (iii) transfer of R$3.5 million through tax incentive laws to sponsor projects that serve municipalities covered by the project. Among the highlights are the after-school projects featuring dance and drama lessons and sports activities, covering around 1,500 children and teens in four cities. With regard to infrastructure, Foz do Chapecó Energia allocated funds for renovating elderly community centers, lighting of sports courts, public pools for water aerobics and also for the finishing stage of the Museu dos Balseiros, a project fully supported by the company since the beginning. (iv) the Friendly Neighbor program was created to encourage people living near the plant to preserve the Permanent Preservation Area (APP) of the reservoir. In addition to rewarding the reservoir’s neighbors with cash prizes, the company brought the initiatives into the public eye to make them examples of good environmental practices; (v) the Biofábrica, a laboratory producing genetically high-quality plants, distributed 14,000 fruit seedlings to farmers in Alpestre, Caxambu do Sul and Rio dos Índios. Besides the plants, the farmers received guidance on planting, fertilizing, plant care during the diverse stages of cultivation
32
(Free Translation of the original in Portuguese)
Standard Financial Statements – DFP – Date: December 31, 2018 - CPFL Energia S.A.
and biological pest control, since the whole process is organic.Research & Development:In 2018, Foz do Chapecó Energia invested R$9.8 million in its Research & Development Program, with R$3.3 million allocated to the National Scientific and Technological Development Fund (FNDCT) and R$1.7 million to the Ministry of Mines and Energy. Another R$4.8 million were directly invested in projects involving universities, research centers and technology companies. Ethics Code and Channel: implementation and dissemination of the Ethics Code in the company and the integrity channel, increasing transparency in internal processes and among the company’s suppliers.
In 2018,Ceran consolidated its Sustainability and External Social Investments Policy, wherein it sponsored 61 social projects and selected 33 that received investments of R$6.3 million, of which R$1.9 million came from CERAN's project incentive through its own cash and tax incentive laws, and the balance funded by partners and proponent drivenoffsets. It launched the hotline, linked to its Ethics and Integrity in Business Conduct Program pursuant to Federal Law 12,846/2013, in 2017 www.canalintegro.com.br/energiaetica. The Company has a certified Integrated Management System at its headquarters and in its plants (Monte Claro, Castro Alves and 14 de Julho), according to ISO standards 9001, ISO 14001 and OHSAS 18001, which at the end of 2018, after third-party audit, were recommended for recertification; With regard to Research & Development, CERAN invested around R$1.8 million in 13 projects – three strategical, six cooperative, three own projects and one management project. On Workplace Safety, considering the three plants at the complex, it registered 6,681 days without accidents with lost time injuries. Regarding Environmental Education, 2018 marked a process of consolidating partnerships with the region to strengthen local initiatives focusing on environmental preservation. One such example was the creation of a group of regional institutions including the State Prosecution Office, Municipal Governments, Environmental Police, NGOs and businesses to join hands to control, inhibit and raise awareness among reservoir users for the preservation of APP areas.
Campos Novos HEP (Enercan) -(i) in 2018, it launched its hotline for complaints (www.canalintegro.com.br/energiaetica) following its Ethics and Integrity in Business Conduct Program pursuant to Federal Law 12,846/2013 launched in 2017; (ii) the initiatives supported for regional development in the cultural, social and environmental and economic areas received applications from 110 projects, from which 47 were selected and received R$19.8 million in financial aid, and of that amount R$4.2 million came from ENERCAN through tax incentive laws and own funds, while the balance was funded by partnerships and proponent driven offsets; (iii) for the seventh straight year, ENERCAN implemented the Conservation Project for Permanent Preservation Areas (PPA) in partnership with residents along the reservoir of the Campos Novos HEP, rewarding the eight best initiatives. Currently the program has approximately 46% of the lake’s neighboring residents participating in it; (iv) in 2019, it published its 2018 Greenhouse Gas Emissions Inventory through FGV’s GHG Protocol platform, earning the silver seal; (v) it released 39,000 fingerlings of native fish species into Campos Novos HEP’s reservoirs, a program that has an in vivo gene bank of migrating species from the Uruguay River basin, where the fingerlings are nurtured for release; (vi) under the R&D Program, Aneel invested R$3.6 million in 14 projects; (vii) regarding Workplace Safety, a special milestone was that on December 28, 2018, ENERCAN celebrated 11 years without any workplace accidents, totaling 4,018 days without any accident recorded. Still in the area of workplace safety, the program to identify potential accidents detected and resolved 271 potential incidents since implementation in May 2016. It is estimated that 27 accidents with minor injuries and 2 serious accidents were avoided. (viii) Regarding its Integrated Management System, in 2018 ENERCAN earned the ISO 9001 certificate, thus integrating with the system it already had in place, which had the ISO 14001 and OHSAS 18001 certifications.
Barra Grande HEP (BAESA) -(i) In 2018, the Social and Environmental Responsibility Program received applications from 37 projects, selecting 11 projects and six social initiatives, which received financial aid of R$853,000, of which 82.4% were funded by partnerships and offsets and are focused on income generation, environment, culture, sports, public safety and
33
(Free Translation of the original in Portuguese)
Standard Financial Statements – DFP – Date: December 31, 2018 - CPFL Energia S.A.
social development. In 2018, the company did not receive funds from tax incentive laws and invested its own funds in the projects; (ii) it held the seventh edition of the Program to Encourage Conservation of the Permanent Preservation Area of the Reservoir, which rewards sixteen (16) residents from the region who developed the best environmental conservation and preservation practices, an increase of 6 families rewarded in this edition; (iii) BAESA's transparency and consistency in the 2018 declaration of greenhouse gas emissions (GHG) earned it the Silver Seal from the GHG Protocol; (iv) held a workshop on indicators to reevaluate the materiality matrix of its Sustainability Report in the GRI G4 standard, which will be published in the essential version; (v) in the environmental domain, 2018 marked the start of a new three (3) year cycle of the Experimental Program of the release of fingerlings of native species into the reservoir of Barra Grande HEP, totaling 177,300 fingerlings released into the lake during the four years of the program. The program has an in vivo gene bank of migrating species from the Uruguay River basin from where the fingerlings originate; (vi) regarding workplace safety, the project recorded 3,884 days without accidents with lost time injuries, more than 10 years from the last accident on record. Another highlight in the area of workplace safety is the program to identify potential accidents, which detected and resolved 641 potential incidents since its implementation in May 2012. It is estimated that 64 accidents with minor injuries and 6 serious accidents were avoided; (vii) within its Environmental Management System, in 2018 it received the ISO 9001 certification, thus integrating the system with the ISO 14001 and OHSAS 18001 certifications, which it already had; (viii) In relation to corporate affairs between the project and the neighboring communities, the activities of the two Community Advisory Councils (CCC) are noteworthy. They were created by the project, with one made up of community representatives of cities in the state of Rio Grande do Sul and the other from cities in the state of Santa Catarina. Any individual or legal entity, civil or military government agent who is interested in the project join the CCCs, actively participating in discussions and planning environmental initiatives, social projects, social communication and other activities carried out by the project, in meetings held every two months.
Energy distribution -(i) its Advanced Stations are periodically assessed for environmental risks and legal requirements, and a ranking system and action plan for improvements are in place; (ii) for environmental emergencies, the distributors have agreements with a specialized company and an environmental insurance. For minor incidents, the Advanced Stations and vehicles equipped with hydraulic equipment carry environmental emergency kits for immediate use; (iii) CPFL Paulista, CPFL Piratininga, RGE and CPFL Santa Cruz, in partnership with the municipal governments of twenty-nine cities in their concession areas, expanded the Arborização + Segura Project, which seeks to revitalize urban afforestation by replacing trees that pose risks to residents and the power grid with species that require less pruning and coexist better with the grid.
9. Independent Auditors
KPMG Auditores Independentes (KPMG) was engaged by CPFL Energia to audit the financial statements of the Company as an independent auditor. In accordance with CVM Instruction 381/03, we inform that in 2017 KPMG provided services not related to external audit, whose aggregate fees were more than 5% of all fees paid for the audit service (corporate, regulatory and SOX).
34
(Free Translation of the original in Portuguese)
Standard Financial Statements – DFP – Date: December 31, 2018 - CPFL Energia S.A.
For the fiscal year ended on December 31, 2018, KPMG provided, in addition to the audit of corporate and regulatory financial statements, review of interim information and SOX audit, the following services:
Nature | Contract | Duration | ||
Compliance with financial covenants |
| 12/28/2016 |
| Fiscal Years from 2017 to 2021 |
Previously agreed procedures – Audit of R&D projects |
| 08/18/2016 |
| 24 months |
Accounting reports for corporate restructurings |
| 09/01/2017 |
| Less than 1 year |
Tax compliance services – Bookkeeping and Tax Accounting (ECF) |
| 12/28/2016 |
| Fiscal Years from 2017 to 2021 |
Other tax compliance services |
| 09/01/2017 |
| 24 months |
Previously agreed procedures - Tax rectifications of previous years |
| 05/03/2018 and 07/05/2018 |
| 12 months |
Bookkeeping and Tax Accounting (ECD) – fiscal year 2017 |
| 05/18/2018 |
| 24 months |
IFRS training |
| 09/14/2018 |
| Less than 1 year |
Legal advisory related to SISCOSERV / EFD / Social Tax |
| 10/04/2018 |
| 24 months |
Due Diligence |
| 03/02/2018 |
| 12 months |
We contracted a total of R$ 1,981 thousand for the above services, which corresponds to approximately 40% of the fees for external audit of the corporate and regulatory financial statements, revision of interim information and SOX audit for the fiscal year 2018, of the Company and its subsidiaries.
The hiring of independent auditors, in accordance with the Bylaws, is recommended by the Audit Board. The Board of Directors deliberates on the selection or removal of independent auditors.
Pursuant to CVM Instruction 381/03, KPMG represented to the Management of CPFL Energia that the provision of the above-mentioned services does not affect the independence and objectivity required for the performance of external audit services.
10. Acknowledgements
The Management of CPFL Energia thanks its shareholders, customers, suppliers and communities in the areas of operations of its subsidiaries for their trust in the Company in2018. It also thanks, in a special way, its employees for their competence and dedication in meeting the objectives and targets set.
35
(Free Translation of the original in Portuguese)
Standard Financial Statements – DFP – Date: December 31, 2018 - CPFL Energia S.A.
The Management
For more information on the performance of this and other companies of the CPFL Energia Group, visitwww.cpfl.com.br/ir
36
(Free Translation of the original in Portuguese)
Standard Financial Statements – DFP – Date: December 31, 2018 - CPFL Energia S.A.
NOTES TO FINANCIAL STATEMENTS
SUMMARY
ASSET | 2 | |
LIABILITY AND EQUITY | 3 | |
STATEMENT OF INCOME | 4 | |
STATEMENT OF COMPREHENSIVE INCOME | 5 | |
STATEMENT OF CHANGES IN SHAREHOLDER’ EQUITY | 6 | |
STATEMENT OF CASH FLOW | 7 | |
STATEMENT OF VALUE ADDED | 8 | |
( 1 ) | OPERATIONS | 9 |
( 2 ) | PRESENTATION OF THE FINANCIAL STATEMENTS | 11 |
( 3 ) | SUMMARY OF SIGNIFICANT ACCOUNTING POLICIES | 13 |
( 4 ) | FAIR VALUE MEASUREMENT | 26 |
( 5 ) | CASH AND CASH EQUIVALENTS | 27 |
( 6 ) | CONSUMERS, CONCESSIONAIRES AND LICENSEES | 28 |
( 7 ) | TAXES RECOVERABLE | 30 |
( 8 ) | SECTOR FINANCIAL ASSET AND LIABILITY | 30 |
( 9 ) | DEFERRED TAX ASSETS AND LIABILITIES | 32 |
( 10 ) | CONCESSION FINANCIAL ASSET | 36 |
( 11 ) | OTHER RECEIVABLES | 37 |
( 12 ) | INVESTMENTS | 38 |
( 13 ) | PROPERTY, PLANT AND EQUIPMENT | 43 |
( 14 ) | INTANGIBLE ASSETS | 45 |
( 15 ) | TRADE PAYABLES | 47 |
( 16 ) | BORROWINGS | 47 |
( 17 ) | DEBENTURES | 52 |
( 18 ) | PRIVATE PENSION PLAN | 55 |
( 19 ) | REGULATORY CHARGES | 61 |
( 20 ) | TAXES, FEES AND CONTRIBUTIONS PAYABLES | 61 |
( 21 ) | PROVISION FOR TAX, CIVIL AND LABOR RISKS AND ESCROW DEPOSITS | 62 |
( 22 ) | OTHER PAYABLES | 64 |
( 23 ) | EQUITY | 65 |
( 24 ) | EARNINGS PER SHARE | 67 |
( 25 ) | NET OPERATING REVENUE | 68 |
( 26 ) | COST OF ELECTRIC ENERGY | 70 |
( 27 ) | OPERATING COSTS AND EXPENSES | 71 |
( 28 ) | FINANCE INCOME (COSTS) | 72 |
( 29 ) | SEGMENT INFORMATION | 72 |
( 30 ) | RELATED PARTY TRANSACTIONS | 73 |
( 31 ) | INSURANCE | 74 |
( 32 ) | RISK MANAGEMENT | 75 |
( 33 ) | FINANCIAL INSTRUMENTS | 77 |
( 34 ) | NON-CASH TRANSACTIONS | 83 |
( 35 ) | COMMITMENTS | 83 |
37
(Free Translation of the original in Portuguese)
Standard Financial Statements – DFP – Date: December 31, 2018 - CPFL Energia S.A.
![]()
CPFL Energia S.A. | |||||||||
Statements of financial position at December 31, 2018 and December 31, 2017 | |||||||||
(in thousands of Brazilian Reais) | |||||||||
Note | Parent company | Consolidated | |||||||
ASSETS | December 31, 2018 | December 31, 2017 | December 31, 2018 | December 31, 2017 | |||||
Current assets | |||||||||
Cash and cash equivalents | 5 | 79,364 | 6,581 | 1,891,457 | 3,249,642 | ||||
Consumers, concessionaires and licensees | 6 | - | - | 4,547,951 | 4,301,283 | ||||
Dividends and interest on capital | 12 | 701,731 | 204,807 | 100,182 | 56,145 | ||||
Income tax and social contribution to be offset | 7 | 9,441 | 17,051 | 123,739 | 88,802 | ||||
Other taxes recoverable | 7 | 8,646 | 46,699 | 287,517 | 306,244 | ||||
Derivatives | 33 | - | - | 309,484 | 444,029 | ||||
Sector financial asset | 8 | - | - | 1,330,981 | 210,834 | ||||
Concession financial asset | 10 | - | - | - | 23,736 | ||||
Other receivables | 11 | 417 | 243 | 811,005 | 900,498 | ||||
Total current assets | 799,599 | 275,383 | 9,402,316 | 9,581,211 | |||||
Noncurrent assets | |||||||||
Consumers, concessionaires and licensees | 6 | - | - | 752,795 | 236,539 | ||||
Intragroup loans | 30 | 72,933 | 127,147 | - | 8,612 | ||||
Escrow Deposits | 21 | 703 | 665 | 854,374 | 839,990 | ||||
Income tax and social contribution to be offset | 7 | - | - | 67,966 | 61,464 | ||||
Other taxes recoverable | 7 | - | - | 185,725 | 171,980 | ||||
Sector financial assets | 8 | - | - | 223,880 | 355,003 | ||||
Derivatives | 33 | - | - | 347,507 | 203,901 | ||||
Deferred tax assets | 9 | 112,522 | 145,779 | 956,380 | 943,199 | ||||
Advance for future capital increase | 12 | - | 350,000 | - | - | ||||
Concession financial asset | 10 | - | - | 7,430,149 | 6,545,668 | ||||
Investments at cost | - | - | 116,654 | 116,654 | |||||
Other receivables | 11 | 4,863 | 5,761 | 927,440 | 840,192 | ||||
Investments | 12 | 9,816,139 | 8,557,673 | 980,362 | 1,001,550 | ||||
Property, plant and equipment | 13 | 1,087 | 1,170 | 9,456,614 | 9,787,125 | ||||
Contract asset – in progress | 14 | - | - | 1,046,433 | - | ||||
Intangible assets | 14 | 110 | 71 | 9,462,935 | 10,589,824 | ||||
Total noncurrent assets | 10,008,356 | 9,188,265 | 32,809,214 | 31,701,702 | |||||
Total assets | 10,807,954 | 9,463,648 | 42,211,530 | 41,282,912 | |||||
The accompanying notes are an integral part of these financial statements.
38
(Free Translation of the original in Portuguese)
Standard Financial Statements – DFP – Date: December 31, 2018 - CPFL Energia S.A.
![]()
CPFL Energia S.A. | |||||||||
Statements of financial position at December 31, 2018 and December 31, 2017 | |||||||||
(in thousands of Brazilian Reais) | |||||||||
Note | Parent company |
| Consolidated | ||||||
LIABILITIES AND EQUITY | December 31, 2018 |
| December 31, 2017 | December 31, 2018 | December 31, 2017 | ||||
Current liabilities | |||||||||
Trade payables | 15 | 2,854 | 1,644 | 2,398,085 | 3,296,870 | ||||
Borrowings | 16 | - | - | 2,446,113 | 3,589,607 | ||||
Debentures | 17 | - | 1,938 | 917,352 | 1,703,073 | ||||
Private pension plan | 18 | - | - | 86,623 | 60,801 | ||||
Regulatory charges | 19 | - | - | 150,656 | 581,600 | ||||
Income tax and social contribution payable | 20 | 8,261 | - | 100,450 | 81,457 | ||||
Other taxes, fees and contributions | 20 | 5,258 | 717 | 664,989 | 628,846 | ||||
Dividends | 491,602 | 281,919 | 532,608 | 297,744 | |||||
Estimated payroll | - | - | 119,252 | 116,080 | |||||
Derivatives | 33 | - | - | 8,139 | 10,230 | ||||
Sector financial liability | 8 | - | - | - | 40,111 | ||||
Use of public asset | - | - | 11,570 | 10,965 | |||||
Other payables | 22 | 23,405 | 17,594 | 979,296 | 961,306 | ||||
Total current liabilities | 531,380 | 303,812 | 8,415,132 | 11,378,688 | |||||
Noncurrent liabilities | |||||||||
Trade payables | 15 | - | - | 333,036 | 128,438 | ||||
Borrowings | 16 | - | - | 8,989,846 | 7,402,450 | ||||
Debentures | 17 | - | 184,388 | 8,023,493 | 7,473,454 | ||||
Private pension plan | 18 | - | - | 1,156,639 | 880,360 | ||||
Other taxes, fees and contributions | 20 | - | - | 9,691 | 18,839 | ||||
Deferred tax liabilities | 9 | - | - | 1,136,227 | 1,249,591 | ||||
Provision for tax, civil and labor risks | 21 | 241 | 600 | 979,360 | 961,134 | ||||
Derivatives | 33 | - | - | 23,659 | 84,576 | ||||
Sector financial liability | 8 | - | - | 46,703 | 8,385 | ||||
Use of public asset | - | - | 89,965 | 83,766 | |||||
Other payables | 22 | 13,584 | 13,320 | 475,396 | 426,889 | ||||
Total noncurrent liabilities | 13,825 | 198,308 | 21,264,015 | 18,717,880 | |||||
Equity | 23 | ||||||||
Issued capital | 5,741,284 | 5,741,284 | 5,741,284 | 5,741,284 | |||||
Capital reserves | 469,257 | 468,014 | 469,257 | 468,014 | |||||
Legal reserve | 900,992 | 798,090 | 900,992 | 798,090 | |||||
Statutory reserve - concession financial asset | - | 826,600 | - | 826,600 | |||||
Statutory reserve - working capital improvement | 3,527,510 | 1,292,046 | 3,527,510 | 1,292,046 | |||||
Accumulated comprehensive income | (376,294) | (164,506) | (376,294) | (164,506) | |||||
10,262,749 | 8,961,528 | 10,262,749 | 8,961,528 | ||||||
Equity attributable to noncontrolling interests | - | - | 2,269,634 | 2,224,816 | |||||
Total equity | 10,262,749 | 8,961,528 | 12,532,383 | 11,186,344 | |||||
Total liabilities and equity | 10,807,954 | 9,463,648 | 42,211,530 | 41,282,912 | |||||
The accompanying notes are an integral part of these financial statements
39
(Free Translation of the original in Portuguese)
Standard Financial Statements – DFP – Date: December 31, 2018 - CPFL Energia S.A.
![]()
CPFL Energia S.A. | |||||||||
Statements of income for the years ended on December 31, 2018 and 2017 | |||||||||
(in thousands of Brazilian Reais, except for Earnings per share) | |||||||||
Parent company | Consolidated | ||||||||
Note | 2018 |
| 2017 |
| 2018 |
| 2017 | ||
Net operating revenue | 25 | 1 | 1 | 28,136,627 | 26,744,905 | ||||
Cost of electric energy services | |||||||||
Cost of electric energy | 26 | - | - | (17,838,165) | (16,901,518) | ||||
Cost of operation | 27 | - | - | (2,733,754) | (2,771,145) | ||||
Cost of services rendered to third parties | 27 | - | - | (1,775,339) | (2,074,611) | ||||
|
|
|
| ||||||
Gross profit | 1 | 1 | 5,789,369 | 4,997,632 | |||||
Operating expenses | 27 | ||||||||
Allowance for doubtful accounts | - | - | (169,259) | (155,097) | |||||
Selling expenses | - | - | (438,925) | (435,135) | |||||
General and administrative expenses | (43,930) | (42,771) | (987,291) | (947,072) | |||||
Other operating expenses | 9 | - | (485,427) | (438,494) | |||||
|
|
|
| ||||||
Income from electric energy services | (43,920) | (42,770) | 3,708,467 | 3,021,834 | |||||
Equity interests in subsidiaries, associates and joint ventures | 12 | 2,250,835 | 1,349,766 | 334,198 | 312,390 | ||||
Financial income (expenses) | 28 | ||||||||
Financial income | (22,160) | 12,983 | 762,413 | 880,314 | |||||
Financial expenses | (5,140) | (69,454) | (1,865,100) | (2,367,868) | |||||
(27,300) | (56,471) | (1,102,687) | (1,487,554) | ||||||
Profir before taxes | 2,179,615 | 1,250,525 | 2,939,977 | 1,846,670 | |||||
Social contribution | 9 | (30,814) | (16,950) | (213,673) | (168,728) | ||||
Income tax | 9 | (90,760) | (53,825) | (560,310) | (434,901) | ||||
(121,575) | (70,775) | (773,982) | (603,629) | ||||||
Profit for the year | 2,058,040 | 1,179,750 | 2,165,995 | 1,243,042 | |||||
Profit (loss) for the year attributable to owners of the Company | 2,058,040 | 1,179,750 | |||||||
Profit (loss) for the year attributable to noncontrolling interests | 107,955 | 63,292 | |||||||
Basic earnings per share attributable to owners of the Company (R$): | 24 | 2.02 | 1.16 | ||||||
Diluted earnings per share attributable to owners of the Company (R$): | 24 | 2.01 | 1.15 | ||||||
The accompanying notes are an integral part of these financial statements
40
(Free Translation of the original in Portuguese)
Standard Financial Statements – DFP – Date: December 31, 2018 - CPFL Energia S.A.
![]()
CPFL Energia S.A. | ||||
Statements of comprehensive income for the years ended December 31, 2018 and 2017 | ||||
(In thousands of Brazilian reais - R$) | ||||
Parent company | ||||
2018 |
| 2017 | ||
Profit for the year | 2,058,040 | 1,179,750 | ||
Other comprehensive income | ||||
Items that will not be reclassified subsequently to profit or loss | ||||
Comprehensive income for the year of subsidiaries | (238,780) | 96,000 | ||
Items that will be reclassified subsequently to profit or loss | ||||
Comprehensive income for the year of subsidiaries | 17,963 | - | ||
Total comprehensive income for the year - individual | 1,837,223 | 1,275,750 | ||
Consolidated | ||||
2018 |
| 2017 | ||
Profit for the year | 2,165,995 | 1,243,042 | ||
Other comprehensive income | ||||
Items that will not be reclassified subsequently to profit or loss | ||||
- Actuarial gains (losses), net of tax effects | (238,780) | 96,000 | ||
Items that will be reclassified subsequently to profit or loss | ||||
- Credit risk in mark to market of financial liabilities | 17,963 | - | ||
Total comprehensive income for the year | 1,945,178 | 1,339,042 | ||
Attributable to owners of the Company | 1,837,223 | 1,275,750 | ||
Attributable to noncontrolling interests | 107,955 | 63,292 | ||
The accompanying notes are an integral part of these financial statements
41
(Free Translation of the original in Portuguese)
Standard Financial Statements – DFP – Date: December 31, 2018 - CPFL Energia S.A.
![]()
CPFL Energia S.A. | |||||||||||||||||||||||||
Statements of changes in shareholders' equity for the years ended December 31, 2018 and 2017 | |||||||||||||||||||||||||
(In thousands of Brazilian reais - R$) | |||||||||||||||||||||||||
Earning reserves | Accumulated comprehensive income | Noncontrolling interests |
| ||||||||||||||||||||||
|
| Statutory reserves |
|
|
|
|
|
|
| ||||||||||||||||
Issued capital | Capital reserve | Legal reserve | Concession financial asset | Working capital improvement | Dividends | Deemed cost | Private pension plan / Credit risk in mark to market | Retained earnings | Total | Accumulated comprehensive income | Other equity components |
| Total equity | ||||||||||||
Balance at December 31, 2016 | 5,741,284 | 468,014 | 739,102 | 702,928 | 545,505 | 7,820 | 431,713 | (666,346) | - | 7,970,021 | 13,572 | 2,389,076 | 10,372,668 | ||||||||||||
Total comprehensive income | - | - | - | - | - | - | - | 96,000 | 1,179,750 | 1,275,750 | - | 63,292 | 1,339,042 | ||||||||||||
Profit for the year | - | - | - | - | - | - | - | - | 1,179,750 | 1,179,750 | - | 63,292 | 1,243,042 | ||||||||||||
Other comprehensive income - actuarial gains (losses) | - | - | - | - | - | - | - | 96,000 | - | 96,000 | - | - | 96,000 | ||||||||||||
Internal changes in equity | - | - | 58,988 | 123,673 | 746,541 | - | (25,873) | - | (903,327) | - | (1,739) | 1,625 | (113) | ||||||||||||
Realization of deemed cost of property, plant and equipment | - | - | - | - | - | - | (39,202) | - | 39,202 | - | (2,634) | 2,634 | - | ||||||||||||
Tax effect on realization of deemed cost | - | - | - | - | - | - | 13,329 | - | (13,329) | - | 896 | (896) | - | ||||||||||||
Recognition of legal reserve | - | - | 58,988 | - | - | - | - | - | (58,988) | - | - | - | - | ||||||||||||
Changes in statutory reserve in the year | - | - | - | 123,673 | 746,541 | - | - | - | (870,213) | - | - | - | - | ||||||||||||
Other changes in noncontrolling interests | - | - | - | - | - | - | - | - | - | - | - | (113) | (113) | ||||||||||||
Capital transactions with owners | - | - | - | - | - | (7,820) | - | - | (276,423) | (284,243) | - | (241,011) | (525,254) | ||||||||||||
Capital increase (decrease) | - | - | - | - | - | - | - | - | - | - | - | (122,791) | (122,791) | ||||||||||||
Unclaimed dividend | - | - | - | - | - | - | - | - | 3,768 | 3,768 | - | - | 3,768 | ||||||||||||
Interim dividend | - | - | - | - | - | - | - | - | - | - | - | (7,226) | (7,226) | ||||||||||||
Dividend proposal approved | - | - | - | - | - | (7,820) | - | - | (280,191) | (288,011) | - | (110,994) | (399,005) | ||||||||||||
Balance at December 31, 2017 | 5,741,284 | 468,014 | 798,090 | 826,600 | 1,292,046 | - | 405,840 | (570,346) | - | 8,961,528 | 11,833 | 2,212,983 | 11,186,344 | ||||||||||||
Total comprehensive income | - | - | - | - | - | - | - | (186,671) | 1,975,433 | 1,788,762 | - | 107,955 | 1,896,717 | ||||||||||||
Profit for the year | - | - | - | - | - | - | - | 2,058,040 | 2,058,040 | - | 107,955 | 2,165,995 | |||||||||||||
Other comprehensive income - credit risk in mark to market of financial liabilities | - | - | - | - | - | - | 52,109 | (34,146) | 17,963 | - | - | 17,963 | |||||||||||||
Effects of first adoption of IFRS 9 / CPC 48 | - | - | - | - | - | - | - | (48,461) | (48,461) | - | - | (48,461) | |||||||||||||
Other comprehensive income - actuarial gains (losses) | - | - | - | - | - | - | (238,780) | - | (238,780) | - | - | (238,780) | |||||||||||||
Internal changes in equity | - | 5 | 102,902 | (826,600) | 2,235,465 | - | (25,118) | - | (1,486,648) | 5 | (1,777) | 1,664 | (108) | ||||||||||||
Realization of deemed cost of property, plant and equipment | - | - | - | - | - | - | (38,057) | - | 38,057 | - | (2,693) | 2,693 | - | ||||||||||||
Tax effect on realization of deemed cost | - | - | - | - | - | - | 12,939 | - | (12,939) | - | 916 | (916) | - | ||||||||||||
Recognition of legal reserve | - | - | 102,902 | - | - | - | - | - | (102,902) | - | - | - | - | ||||||||||||
Changes in statutory reserve in the year | - | - | - | (826,600) | 2,235,465 | - | - | - | (1,408,864) | - | - | - | - | ||||||||||||
Other changes | - | 5 | - | - | - | - | - | - | 5 | - | (113) | (108) | |||||||||||||
Capital transactions with owners | - | 1,238 | - | - | - | - | - | - | (488,785) | (487,547) | - | (63,024) | (550,571) | ||||||||||||
Interim dividend | - | - | - | - | - | - | - | - | - | - | (4,452) | (4,452) | |||||||||||||
Dividend proposal approved | - | - | - | - | - | - | - | (488,785) | (488,785) | - | (64,233) | (553,018) | |||||||||||||
Other changes | - | 1,238 | - | - | - | - | - | - | 1,238 | - | 5,661 | 6,899 | |||||||||||||
Balance at December 31, 2018 | 5,741,284 | 469,257 | 900,992 | - | 3,527,510 | - | 380,721 | (757,016) | - | 10,262,749 | 10,055 | 2,259,578 | 12,532,383 | ||||||||||||
The accompanying notes are an integral part of these financial statements.
42
(Free Translation of the original in Portuguese)
Standard Financial Statements – DFP – Date: December 31, 2018 - CPFL Energia S.A.
![]()
CPFL Energia S/A | ||||||||
Statements of cash flow for the years ended December 31, 2018 and 2017 | ||||||||
(in thousand of Brazilian Reais - R$) | ||||||||
Parent Company |
| Consolidated | ||||||
December 31, 2018 | December 31, 2017 | December 31, 2018 | December 31, 2017 | |||||
Profit before taxes | 2,179,615 | 1,250,525 | 2,939,977 | 1,846,670 | ||||
Adjustment to reconcile profit to cash from operating activities | ||||||||
Depreciation and amortization | 201 | 217 | 1,594,064 | 1,529,052 | ||||
Provision for tax, civil and labor risks | (117) | 61 | 153,977 | 176,609 | ||||
Allowance for doubtful accounts | - | - | 169,259 | 155,097 | ||||
Interest on debts, inflation adjustment and exchange rate changes | 2,932 | 61,520 | 1,117,742 | 1,863,311 | ||||
Pension plan expense (income) | - | - | 89,909 | 113,898 | ||||
Equity interests in associates and joint ventures | (2,250,835) | (1,349,766) | (334,198) | (312,390) | ||||
Impairment | - | - | - | 20,437 | ||||
Loss (gain) on disposal of noncurrent assets | - | - | 216,275 | 132,195 | ||||
Deferred taxes (PIS and COFINS) | - | - | (457) | 963 | ||||
Others | - | - | (26,595) | (19,074) | ||||
(68,204) | (37,443) | 5,919,953 | 5,506,768 | |||||
Decrease (increase) in operating assets | ||||||||
Consumers, concessionaires and licensees | - | - | (1,006,291) | (722,406) | ||||
Dividend and interest on capital received | 596,100 | 1,172,336 | 311,347 | 730,178 | ||||
Taxes recoverable | 109,719 | 65,182 | 92,090 | 68,184 | ||||
Escrow deposits | (25) | 68 | 22,926 | (248,128) | ||||
Sector financial asset | - | - | (846,216) | (425,004) | ||||
Receivables - CDE | - | - | 59,196 | (29,354) | ||||
Concession financial assets (transmission companies) | - | - | - | (56,665) | ||||
Other operating assets | 1,147 | 20,485 | (47,835) | 91,607 | ||||
Increase (decrease) in operating liabilities | ||||||||
Trade payables | 1,210 | (2,116) | (848,880) | 565,945 | ||||
Other taxes and social contributions | 4,541 | 263 | (59,102) | (261,194) | ||||
Other liabilities with private pension plan | - | - | (107,668) | (79,724) | ||||
Regulatory charges | - | - | (430,944) | 215,522 | ||||
Tax, civil and labor risks paid | (259) | (466) | (215,873) | (206,788) | ||||
Sector financial liability | - | - | (64,361) | (1,089,592) | ||||
Payables - amounts provided by the CDE | - | - | 71,779 | 17,544 | ||||
Other operating liabilities | 6,407 | (37,277) | 176,308 | 141,759 | ||||
Cash flows provided (used) by operations | 650,636 | 1,181,032 | 3,026,428 | 4,218,652 | ||||
Interest paid on debts and debentures | (4,235) | (71,844) | (1,353,339) | (1,846,453) | ||||
Income tax and social contribution paid | (80,234) | (47,438) | (816,402) | (338,175) | ||||
Net cash from operating activities | 566,167 | 1,061,750 | 856,686 | 2,034,024 | ||||
Investing activities | ||||||||
Purchases of property, plant and equipment | (286) | (185) | (275,986) | (685,856) | ||||
Purchases of contract asset – in progress | - | - | (1,769,573) | - | ||||
Purchases and construction of intangible assets | (42) | (51) | (16,864) | (1,884,577) | ||||
Securities, pledges and restricted deposits | (250) | - | 212,831 | (93,933) | ||||
Decrease (increase) of capital in subsidiaries | - | (9,400) | (1,096) | 91,599 | ||||
Sale of noncurrent assets | - | - | - | 26,807 | ||||
Advances for future capital increases | (82,415) | (383,340) | - | - | ||||
Intragroup loans | 54,710 | (72,199) | - | 36,639 | ||||
|
|
|
| |||||
Net cash generated by (used) In investing activities | (28,283) | (465,175) | (1,850,687) | (2,509,321) | ||||
Financing activities | ||||||||
Capital increase of no controlling shareholder | - | - | 7,994 | (122,791) | ||||
Borrowings and debentures raised | - | - | 9,610,814 | 3,398,084 | ||||
Repayment of principal of borrowings and debentures | (186,000) | (434,000) | (10,204,257) | (5,273,261) | ||||
Repayment of derivatives | - | - | 543,427 | (102,641) | ||||
Dividend and interest on capital paid | (279,101) | (220,966) | (322,163) | (336,934) | ||||
Business combination payment | - | - | - | (2,514) | ||||
Net cash generated by (used in) financing activities | (465,101) | (654,966) | (364,185) | (2,440,057) | ||||
Net increase (decrease) in cash and cash equivalents | 72,782 | (58,390) | (1,358,186) | (2,915,354) | ||||
Cash and cash equivalents at the beginning of the year | 6,581 | 64,971 | 3,249,642 | 6,164,996 | ||||
Cash and cash equivalents at the end of the year | 79,364 | 6,581 | 1,891,457 | 3,249,642 | ||||
The accompanying notes are an integral part of these financial statements.
43
(Free Translation of the original in Portuguese)
Standard Financial Statements – DFP – Date: December 31, 2018 - CPFL Energia S.A.
![]()
CPFL Energia S.A. | |||||||
Statements of value added for the years ended December 31, 2018 and 2017 | |||||||
(in thousand of Brazilian Reais - R$) | |||||||
Parent Company |
| Consolidated | |||||
2018 | 2017 | 2018 | 2017 | ||||
1 - Revenues | 329 | 237 | 42,759,621 | 40,687,927 | |||
1.1 Operating revenues | 1 | 1 | 40,854,038 | 37,980,073 | |||
1.2 Revenue related to the construction of own assets | 328 | 236 | 302,620 | 789,529 | |||
1.3 Revenue from construction of concession infrastructure | - | - | 1,772,222 | 2,073,423 | |||
1.4 Allowance for doubtful accounts | - | - | (169,259) | (155,097) | |||
2 - (-) Inputs | (12,858) | (10,322) | (23,378,560) | (23,119,553) | |||
2.1 Electricity purchased for resale | - | - | (19,757,090) | (18,772,477) | |||
2.2 Material | (625) | (150) | (1,349,291) | (1,895,728) | |||
2.3 Outsourced services | (10,502) | (8,275) | (1,529,696) | (1,716,068) | |||
2.4 Others | (1,731) | (1,897) | (742,483) | (735,280) | |||
3 - Gross value added (1+2) | (12,528) | (10,085) | 19,381,061 | 17,568,374 | |||
4 - Retentions | (201) | (217) | (1,602,182) | (1,534,035) | |||
4.1 Depreciation and amortization | (201) | (217) | (1,315,323) | (1,247,819) | |||
4.2 Amortization of intangible assets of concession | - | - | (286,859) | (286,215) | |||
5 - Net value added generated (3+4) | (12,730) | (10,302) | 17,778,879 | 16,034,340 | |||
6 - Value Added received in transfer | 2,268,815 | 1,391,611 | 1,183,083 | 1,279,057 | |||
6.1 Financial Income | 17,980 | 41,845 | 848,885 | 966,666 | |||
6.2 Interest in subsidiaries, associates and joint ventures | 2,250,835 | 1,349,766 | 334,198 | 312,390 | |||
7 - Value Added to be distributed (5+6) | 2,256,086 | 1,381,309 | 18,961,962 | 17,313,396 | |||
8 - Distribution of value added | |||||||
8.1 Personnel and charges | 27,035 | 27,247 | 1,390,996 | 1,397,454 | |||
8.1.1 Direct remuneration | 10,679 | 15,690 | 795,377 | 813,004 | |||
8.1.2 Benefits | 14,885 | 10,184 | 530,120 | 516,208 | |||
8.1.3 Government severance indemnity fund for employees - F.G.T.S | 1,471 | 1,374 | 65,499 | 68,242 | |||
8.2 Taxes, fees and contributions | 165,840 | 104,770 | 13,452,580 | 12,181,755 | |||
8.2.1 Federal | 165,799 | 104,738 | 7,231,289 | 6,696,508 | |||
8.2.2 Estate | 41 | 32 | 6,195,062 | 5,460,674 | |||
8.2.3 Municipal | - | - | 26,230 | 24,572 | |||
8.3 Lenders and lessors | 5,170 | 69,541 | 1,952,391 | 2,491,145 | |||
8.3.1 Interest | 5,136 | 69,311 | 1,879,399 | 2,418,119 | |||
8.3.2 Rental | 35 | 230 | 72,992 | 73,026 | |||
8.4 Interest on capital | 2,058,040 | 1,179,750 | 2,165,995 | 1,243,042 | |||
8.4.1 Dividend (including additional proposed) | 546,274 | 250,550 | 581,029 | 272,294 | |||
8.4.2 Retained earnings | 1,511,766 | 929,201 | 1,584,966 | 970,748 | |||
2,256,086 | 1,381,309 | 18,961,962 | 17,313,396 | ||||
The accompanying notes are an integral part of these financial statements.
44
(Free Translation of the original in Portuguese)
Standard Financial Statements – DFP – Date: December 31, 2018 - CPFL Energia S.A.
CPFL ENERGIA S.A.
NOTES TO THE FINANCIAL STATEMENTS
AT DECEMBER 31, 2018 AND 2017
(Amounts in thousands of Brazilian reais – R$, unless otherwise stated)
( 1 ) OPERATIONS
CPFL Energia S.A. (“CPFL Energia” or “Company”) is a publicly-held corporation incorporated for the principal purpose of operating as a holding company, with equity interests in other companies primarily engaged in electric energy distribution, generation and commercialization activities in Brazil.
The Company’s registered office is located at Rodovia Engenheiro Miguel Noel Nascentes Burnier, km 2,5, Parque São Quirino - Campinas - SP - Brazil.
The Company has direct and indirect interests in the following subsidiaries and joint-ventures:
Energy distribution | Company type | Equity interest | Location (state) | Number of municipalities | Approximate number of consumers (in thousands) | Concession period | End of the concession | |||||||
Companhia Paulista de Força e Luz ("CPFL Paulista") | Publicly-held corporation | Direct | Interior of São Paulo | 234 | 4,496 | 30 years | November 2027 | |||||||
Companhia Piratininga de Força e Luz ("CPFL Piratininga") | Publicly-held corporation | Direct | Interior and coast of São Paulo | 27 | 1,756 | 30 years | October 2028 | |||||||
RGE Sul Distribuidora de Energia S.A. ("RGE") (g) | Publicly-held corporation | Direct and Indirect | Interior of Rio Grande do Sul | 373 | 2,871 | 30 years | November 2027 | |||||||
Companhia Jaguari de Energia ("CPFL Santa Cruz") (e) | Privately-held corporation | Direct | Interior of São Paulo, Paraná and Minas Gerais | 45 | 457 | 30 years | July 2045 |
Installed power (MW) | ||||||||||||
Energy generation | Company type | Equity interest | Location (state) | Number of plants / type of energy | Total | CPFL share | ||||||
CPFL Geração de Energia S.A. | Publicly-held corporation | Direct | São Paulo and Goiás | 3 Hydropower (a) | 1295 | 678 | ||||||
CERAN - Companhia Energética Rio das Antas | Privately-held corporation | Indirect | Rio Grande do Sul | 3 Hydropower | 360 | 234 | ||||||
Foz do Chapecó Energia S.A. | Privately-held corporation | Indirect | Santa Catarina and | 1 Hydropower | 855 | 436 | ||||||
Campos Novos Energia S.A. | Privately-held corporation | Indirect | Santa Catarina | 1 Hydropower | 880 | 429 | ||||||
BAESA - Energética Barra Grande S.A. | Publicly-held corporation | Indirect | Santa Catarina and | 1 Hydropower | 690 | 173 | ||||||
Centrais Elétricas da Paraíba S.A. | Privately-held corporation | Indirect | Paraíba | 2 Thermal | 342 | 182 | ||||||
Paulista Lajeado Energia S.A. | Privately-held corporation | Indirect | Tocantins | 1 Hydropower | 903 | 38 | ||||||
CPFL Energias Renováveis S.A. | Publicly-held corporation | Indirect | (c) | (c) | (c) | (c) | ||||||
CPFL Centrais Geradoras Ltda ("CPFL Centrais Geradoras") | Limited liability company | Direct | São Paulo and Minas Gerais | 6 SHPs | 4 | 4 | ||||||
Energy commercialization | Company type | Core activity | Equity interest | |||
CPFL Comercialização Brasil S.A. ("CPFL Brasil") | Privately-held corporation | Energy commercialization | Direct | |||
Clion Assessoria e Comercialização de Energia Elétrica Ltda. | Limited liability company | Commercialization and provision of energy services | Indirect | |||
CPFL Comercialização Cone Sul S.A. ("CPFL Cone Sul") | Privately-held corporation | Energy commercialization | Indirect | |||
CPFL Planalto Ltda. ("CPFL Planalto") | Limited liability company | Energy commercialization | Direct | |||
CPFL Brasil Varejista S.A. ("CPFL Brasil Varejista") | Privately-held corporation | Energy commercialization | Indirect |
45
(Free Translation of the original in Portuguese)
Standard Financial Statements – DFP – Date: December 31, 2018 - CPFL Energia S.A.
Provision of services | Company type | Core activity | Equity interest | |||
CPFL Serviços, Equipamentos, Industria e Comércio S.A. | Privately-held corporation | Manufacturing, commercialization, rental and maintenance of electro-mechanical equipment and service provision | Direct | |||
NECT Serviços Administrativos Ltda ("Nect") | Limited liability company | Provision of administrative services | Direct | |||
CPFL Atende Centro de Contatos e Atendimento Ltda. ("CPFL Atende") | Limited liability company | Provision of call center services | Direct | |||
CPFL Total Serviços Administrativos Ltda. ("CPFL Total") | Limited liability company | Collection services | Direct | |||
CPFL Eficiência Energética S.A ("CPFL Eficiência") | Privately-held corporation | Energy efficiency management | Direct | |||
TI Nect Serviços de Informática Ltda. ("Authi") | Limited liability company | Provision of IT services | Direct | |||
CPFL GD S.A ("CPFL GD") | Privately-held corporation | Provision of maintenance services for energy generation companies | Indirect | |||
Others | Company type | Core activity | Equity interest | |||
CPFL Jaguari de Geração de Energia Ltda ("Jaguari Geração") | Limited liability company | Holding company | Direct | |||
Chapecoense Geração S.A. ("Chapecoense") | Privately-held corporation | Holding company | Indirect | |||
Sul Geradora Participações S.A. ("Sul Geradora") | Privately-held corporation | Holding company | Indirect | |||
CPFL Telecom S.A ("CPFL Telecom") | Privately-held corporation | Telecommunication services | Direct | |||
CPFL Transmissão Piracicaba S.A ("CPFL Transmissão Piracicaba") | Privately-held corporation | Energy transmission services | Indirect | |||
CPFL Transmissão Morro Agudo S.A ("CPFL Transmissão Morro Agudo") | Privately-held corporation | Energy transmission services | Indirect | |||
CPFL Transmissão Maracanaú S.A. (“CPFL Maracanaú”) (f) | Privately-held corporation | Energy transmission services | Indirect |
a) CPFL Geração has 51.54% of the assured energy and power of the Serra da Mesa hydropower plant, which concession is owned by Furnas.
b) Paulista Lajeado holds a 7% interest in the installed power of Investco S.A. (5.94% interest in total capital).
c) CPFL Renováveis has operations in the states of São Paulo, Minas Gerais, Mato Grosso, Santa Catarina, Ceará, Rio Grande do Norte, Paraná and Rio Grande do Sul and its main activities are: (i) holding investments in companies of the renewable energy segment; (ii) identification, development, and exploration of generation potentials; and (iii) sale of electric energy. At December 31, 2018, CPFL Renováveis had a portfolio of 110 projects of 2,480.1 MW of installed capacity (2,132.7 MW in operation):
· Hydropower generation: 44 SHP’s (514.9 MW) with 40SHPs in operation (453.1MW) and 4 SHPs under construction/development (61.8 MW);
· Wind power generation: 57 projects (1,594.1 MW) with 45projects in operation (1,308.5MW) and 12projects under construction/development (285.6 MW);
· Biomass power generation: 8 plants in operation (370MW);
· Solar power generation:1solar plant in operation (1.1MW).
d) The joint venture Chapecoense has as its direct subsidiary Foz do Chapecó and fully consolidates its financial statements.
e) As described in note 12.5.2, on December 31, 2017, approval was given for the merger of the subsidiaries Companhia Luz e Força Santa Cruz, Companhia Leste Paulista de Energia, Companhia Jaguari de Energia, Companhia Sul Paulista de Energia and Companhia Luz e Força de Mococa into Companhia Jaguari de Energia, which adopted the trade name “CPFL Santa Cruz”.
46
(Free Translation of the original in Portuguese)
Standard Financial Statements – DFP – Date: December 31, 2018 - CPFL Energia S.A.
f) In August 2018, CPFL Transmissão Maracanaú S.A. was established with the purpose of exploring concessions for electric power transmission, including the construction, operation and maintenance of basic grid transmission facilities.
g) As described in note 12.6.1, on December 4, 2018 the merger of RGE with RGE Sul was approved. Since January 1, 2019, the operations of these subsidiaries have been carried out only by RGE Sul, which adopted the trade name “RGE”.
( 2 ) PRESENTATION OF THE FINANCIAL STATEMENTS
2.1 Basis of preparation
The individual (Parent Company) and consolidated financial statements have been prepared in accordance with International Financial Reporting Standards – IFRS, issued by the International Accounting Standard Board – IASB, and accounting practices adopted in Brazil.
Accounting practices adopted in Brazil encompass those included in Brazilian corporate law and the technical pronouncements, guidelines and interpretations issued by the Accounting Pronouncements Committee (Comitê de Pronunciamentos Contábeis - CPC) and approved by the Brazilian Securities Commission (Comissão de Valores Mobiliários – CVM).
The Company and the subsidiaries (“Group”) also follows the guidelines of the Accounting Manual of the Brazilian Electricity Sector and the standards laid down by the Brazilian Electricity Regulatory Agency (Agência Nacional de Energia Elétrica – ANEEL), when these do not conflict with the accounting practices adopted in Brazil and/or International Financial Reporting Standards.
Management states that all material information of the financial statements is disclosed and corresponds to what is used in the Group's management.
The financial statements were approved by Management and authorized for issue on March 11, 2019.
2.2 Basis of measurement
The financial statements has been prepared on the historical cost basis except for the following items recorded in the statements of financial position: i) derivative financial instruments measured at fair value and ii) non derivative financial instruments measured at fair value through profit or loss. The classification of the fair value measurement in the level 1, 2 or 3 categories (depending on the degree of observance of the variables used) is presented in note 33 – Financial Instruments.
2.3 Use of estimates and judgments
The preparation of the financial statements requires the Group’s management to make judgments, estimates and assumptions that affect the application of accounting policies and the reported amounts of assets, liabilities, income and expenses.
By definition, the accounting estimates are rarely the same as the actual results. Accordingly, the Group’s management review the estimates and assumptions on an ongoing basis, based on previous experience and other relevant factors. Adjustments resulting from revisions to accounting estimates are recognized in the period in which the estimates are revised and applied on a prospective basis.
The main accounts that require the adoption of estimates and assumptions, which are subject to a greater degree of uncertainty and may result in a material adjustment if these estimates and assumptions suffer significant changes in subsequent periods, are:
· Note 6 – Consumers, concessionaires and licensees (Allowance for doubtful accounts: key assumptions regarding to the expected credit loss - ECL);
47
(Free Translation of the original in Portuguese)
Standard Financial Statements – DFP – Date: December 31, 2018 - CPFL Energia S.A.
- Note 8 – Sector financial asset and liability (certain financial components that can be raised without prior methodology);
- Note 9 – Deferred tax assets and liabilities (recognition of assets: availability of future taxable profit against which the tax losses can be utilized);
- Note 10 – Concession financial asset (assumptions for fair value measurement, based on significant unobservable inputs, see note 33);
- Note 11 – Other receivables (allowance for doubtful accounts: key assumptions regarding to the expected credit loss - ECL);
- Note 13 – Property, plant and equipment (application of defined useful lives and key assumptions regarding recoverable amounts);
- Note 14 – Intangible assets and Contract asset in progress (key assumptions regarding recoverable amounts);
- Note 18 – Private pension plan (key actuarial assumptions used in the measurement of defined benefit obligations);
- Note 21 – Provision for tax, civil and labor risks and escrow deposits (recognition and measurement: key assumptions on the probability and magnitude of outflow of resources); and
- Note 25 – Net operating revenue (assumptions for measurement of unbilled supply and Distribution System Usage Tariff - TUSD ).
2.4 Functional currency and presentation currency
The Group’s functional currency is the Brazilian Real, and the individual and consolidated financial statements is being presented in thousands of reais. Figures are rounded only after sum-up of the amounts. Consequently, when summed up, the amounts stated in thousands of reais may not tally with the rounded totals.
2.5 Segment information
An operating segment is a component of the Company (i) that engages in operating activities from which it earns revenues and incurs expenses, (ii) whose operating results are regularly reviewed by Management to make decisions about resources to be allocated and assess the segment's performance, and (iii) for which individual financial information is available.
The Group’s officers use reports to make strategic decisions, segmenting the business into: (i) electric energy distribution activities (“Distribution”); (ii) electric energy generation and transmission from conventional sources activities (“Generation”); (iii) electric energy generation activities from renewable sources (“Renewables”); (iv) energy commercialization activities (“Commercialization”); (v) service activities (“Services”); and (vi) other activities not listed in the previous items.
The presentation of the operating segments includes items directly attributable to them, as well as any allocations required, including intangible assets, see note 29 for further details.
2.6 Information on equity interests
The Company's equity interests in direct and indirect subsidiaries and joint ventures are described in note 1.Except for (i) the companies ENERCAN, BAESA, Chapecoense and EPASA, which use the equity method of accounting, and (ii) the investment measured at cost by the subsidiary Paulista Lajeado in Investco S.A., all other entities are fully consolidated.
48
(Free Translation of the original in Portuguese)
Standard Financial Statements – DFP – Date: December 31, 2018 - CPFL Energia S.A.
At December 31, 2018 and 2017 the noncontrolling interests in the consolidated balances refer to interests held by third parties in subsidiaries CERAN, Paulista Lajeado and CPFL Renováveis.
2.7 Statement of value added
The Company has prepared the individual and consolidated statements of value added (“DVA”) in conformity with technical pronouncement CPC 09 - Statement of Value Added, which are presented as an integral part of the financial statements in accordance with accounting practices adopted in Brazil and as supplementary information to the financial statements in accordance with IFRS, as this statement is neither provided for nor required by IFRS.
( 3 ) SUMMARY OF SIGNIFICANT ACCOUNTING POLICIES
The significant accounting policies used in the preparation of these individual and consolidated financial statements are described below. These policies have been consistently applied in all reporting periods, except for the new accounting pronouncements and interpretations adopted by the Group on January 1, 2018 described in note 3.17.
Due to the transition methods chosen by the Group in the application of certain new accounting standards, the comparative information of these financial statements has not been restated and the cumulative effects of the initial application on January 1, 2018 were recognized directly in Retained Earnings.
3.1 Cash and cash equivalents
In the statements of cash flows, cash and cash equivalents include negative balances of overdraft accounts that are immediately payable and are an integral part of the Group’s cash management.
Cash and cash equivalents comprise the balances of cash and financial investments with original maturities of three months or less from the contract date, which are subject to an insignificant risk of change in fair value at the settlement date and are used by the Group in the management of short-term obligations.
3.2 Concession agreements
Distribution subsidiaries:
ICPC 01 (R1) and IFRIC 12 – Service Concession Arrangements establish general guidelines for the recognition and measurement of obligations and rights related to concession agreements and apply to situations in which the granting authority controls or regulates which services the concessionaire should provide with the infrastructure, to whom the services should be provided and at what price, and controls any significant residual interest in the infrastructure at the end of the concession period.
When these definitions are met, the infrastructure of distribution concessionaires is segregated at the time of construction in accordance with the CPC and IFRS requirements, so that the following are recognized in the financial statements (i) an intangible asset corresponding to the right to operate the concession and collect from the users of public utilities, and (ii) a financial asset corresponding to the unconditional contractual right to receive cash (indemnity) by transferring control of the assets at the end of the concession.
The concession financial asset of distribution is measured at fair value, determined in accordance with the remuneration base for the concession assets, pursuant to the legislation in force established by the regulatory authority (ANEEL), and takes into consideration changes in the fair value, mainly based on factors such as new replacement value, and adjustment for IPCA (Extended Consumer Price Index) to the subsidiaries of the distribution segment. The financial asset of distribution is classified at fair value through profit or loss, with the corresponding fair value changes entry in an operating income/expense account in the statement of profit or loss for the year (notes 4 and 25).
49
(Free Translation of the original in Portuguese)
Standard Financial Statements – DFP – Date: December 31, 2018 - CPFL Energia S.A.
The remaining amount is recognized as an intangible asset and relates to the right to charge consumers for electric energy distribution services, and is amortized in accordance with the consumption pattern that reflects the estimated economic benefit to the end of the concession.
Considering that (i) the tariff model does not provide for a profit margin for the infrastructure of discos construction services, (ii) the way in which the subsidiaries manage the constructions by using a high level of outsourcing, and (iii) the fact that there is no provision for profit margin on construction in the Group‘s business plans, Management is of the opinion that the margins on this operation are irrelevant, and therefore no mark-up to the cost is considered in revenue. The construction revenues and costs are therefore presented in the statement of profit or loss for the year in the same amounts.
Transmission subsidiaries:
The Group’s transmission companies are responsible for constructing and operating the transmission infrastructure (two distinct performance obligations) in order to carry the energy from the generation centers to the distribution points, according to their concession arrangements.
The energy transmission company has the obligation to maintain its transmission infrastructure available to its users to guarantee the receipt of the Permitted Annual Revenue (RAP) during the concession agreement term. These receipts represent the consideration for the construction and operation of the transmission infrastructure. Potential unamortized investments generate the right to indemnity at the end of the concession arrangement
Until December 31, 2017, the transmission infrastructure was classified as a financial asset and measured at amortized cost. With the adoption of IFRS 15 / CPC 47 on January 1, 2018, as the right to bill goods and services is conditioned to the satisfaction of other performance obligations the consideration receivable is now classified as a "Contract Asset”.
3.3 Financial Instruments
Policyapplicable from January 1, 2018
- Financial Assets
Financial assets are recognized initially on the date that they are originated or on the trade date at which the Company or its subsidiaries become parties to the contractual provisions of the instrument. Derecognition of a financial asset occurs when the contractual rights to the cash flows from the asset expire or when the risks and rewards of ownership of the financial asset are transferred.
Subsequent Measurement and gains and losses: Policy applicable from January 1, 2018
Financial assets measured at fair value through profit or loss (FVTPL) | These assets are subsequently measured at fair value. Net gains or losses, including interest or dividend income, are recognized in profit or loss. |
Financial assets at amortized cost | These assets are subsequently measured at amortized cost using the effective interest method. The amortized cost is reduced by impairment losses. Interest income, foreign exchange gains and losses and impairment are recognized in profit or loss. Any gain or loss on the derecognition is recognized in profit or loss. |
Debt investments at fair value through other comprehensive income (FVOCI) | These assets are subsequently measured at fair value. Net gains and losses are recognized in other comprehensive income, except the interest income calculated using the effective interest method, foreign exchange gains and losses and impairment, that are recognized in profit or loss. In the moment of the derecognition, the accumulated gain or loss in other comprehensive income (loss) is reclassified to profit or loss for the period. |
Equity instruments at fair value through other comprehensive income | These assets are subsequently measured at fair value. Changes in fair value are recognized in other comprehensive income (loss) and never will be reclassified in profit or loss. Dividends are recognized as gains in profit or loss (unless the dividend clearly represents a recovery of part of the investment cost). |
50
(Free Translation of the original in Portuguese)
Standard Financial Statements – DFP – Date: December 31, 2018 - CPFL Energia S.A.
Subsequent measurement and gain and loss: Policy applicable before January 1, 2018
Financial assets measured at fair value through profit or loss (FVTPL) | These assets are subsequently measured at fair value. Net gains or losses, including interest or dividend income, are recognized in profit or loss. |
Held-tomaturityfinancial assets | These assets are measured at amortized cost using the effective interest method. |
Loansand receivables | These assets are measured at amortized cost using the effective interest method. |
Available-for-salefinancialassets | These assets are measured at fair value and changes therein (other than impairment losses, interest income and foreign currency differences on debt instruments), are recognized in Other Comprehensive Income and accumulated in the fair value reserve.When these assets were derecognized, the gain or loss accumulated in equityare reclassified to profit or loss. |
The rights of indemnity at the end of the concession term of the distribution subsidiaries are classified as measured at fair value through profit or loss and the changes in the fair value of this asset are recognized in profit or loss.
Financial assets are not reclassified subsequent to their initial recognition unless the Group changes its business model for managing financial assets, in which case all affected financial assets are reclassified on the first day of the first reporting period following the change in the business model.
Amortized cost:A financial asset is measured at amortized cost if it meets both of the following conditions and is not designated as at FVTPL.
o it is held within a business model whose objective is to hold assets to collect contractual cash flows; and
o its contractual terms give rise on specified dates to cash flows that are related solely to payments of principal and interest on the principal amount outstanding.
Fair Value through Other Comprehensive Income (FVOCI): A debt investment is measured at FVOCI if it meets both of the following conditions and is not designated as at FVTPL:
o it is held withinabusinessmodelwhoseobjectiveis archieved by both collectingcontractualcash flows and selling financial assets ;and
o its contractual terms give rise on specified dates to cash flows that are solely payments of principal and interest on the principal amount outstanding.
On initial recognition of an equity investment that is not held for trading, the Group may irrevocably elect to present subsequent changes in the investment’s fair value in Other Comprehensive Income. This election is made on an investment-by-investment basis.
All financial assets not classified as measured at amortized cost or FVOCI as described above are measured at FVTPL. This includes all derivative financial assets (see Note 33). On initial recognition, the Group mayirrevocably designate a non derivative financial asset that otherwise meets the requirements to be measured at amortized cost or at FVOCI as at FVTPL if doing so eliminates or significantly reduces an accounting mismatch that would otherwise arise.
51
(Free Translation of the original in Portuguese)
Standard Financial Statements – DFP – Date: December 31, 2018 - CPFL Energia S.A.
Business model assessment:
The Group makes an assessment of the objective of the business model in which a financial asset is held at a portfolio level because this best reflects the way the business is managed and information is provided to management. The information considered includes the stated policies and objectives for the portfolio and the operation of those policies in practice. These include whether:
- management’s strategy focuses on earning contractual interest income, maintaining a particular interest rate profile, matching the duration of the financial assets to the duration of any related liabilities or expected cash outflows or realizing cash flows through the sale of the assets;
- how the performance of the portfolio is evaluated and reported to the Group’s management;
- therisksthataffecttheperformanceofthebusinessmodel(andthefinancialassetsheldwithin thatbusinessmodel)andhowthoserisksaremanaged;
- how managers of the business are compensated – e.g. whether compensation is based on the fair value of the assets managed or the contractual cash flows collected; and
- thefrequency,volumeandtimingofsalesoffinancialassetsinpriorperiods,thereasonsforsuchsalesandexpectationsaboutfuturesalesactivity.
The transfers of financial assets to third parties in transactions that do not qualify for derecognition are not considered sales for this purpose, consistent with the Group’s continuing recognition of the assets.
Financial assets that are held for trading or are managed and whose performance is evaluated on a fair value basis are measured at FVTPL.
Assessment whether contractual cash flows are solely payments of principal and interest:
For the purposes of this assessment, ‘principal’ is defined as the fair value of the financial asset on initial recognition. ‘Interest’ is defined as consideration for the time value of money and for the credit risk associated with the principal amount outstanding during a particular period of time and for other basic lending risks and costs (e.g. liquidity risk and administrative costs), as well as a profit margin.
In assessing whether the contractual cash flows are solely payments of principal and interest, the Group considers the contractual terms of the instrument. This includes assessing whether the financial asset contains a contractual term that could change the timing or amount of contractual cash flows such that it would not meet this condition. In making this assessment, the Group considers:
o contingenteventsthatwouldchangetheamountortimingofcashflows;
o termsthatmayadjustthecontractualcouponrate,includingvariable‑ratefeatures;
o prepaymentandextensionfeatures;and
o terms that limit the Group’s claim to cash flows from specified assets (e.g. based on the performance of an asset).
For transactions involving the purchase and sale of energy by the trading subsidiaries, the Group has an accounting policy defined according to the business strategy with instruments measured at amortized cost, which refer to agreements already entered into and still held with the purpose of receipt or delivery of energy in accordance with the requirements by the company related to purchase or sale. The transactions are usually long term and are never settled by the net cash amount or with another financial instrument and, even if some contract has a certain flexibility, the strategy of the Group’s portfolio is not changed for this reason.
52
(Free Translation of the original in Portuguese)
Standard Financial Statements – DFP – Date: December 31, 2018 - CPFL Energia S.A.
- Financial liabilities
Financial liabilities are initially recognized on the date that they are originated or on the trade date at which the Company or its subsidiaries become a party to the contractual provisions of the instrument. The Group have the following main financial liabilities:
(i) Measured at fair value through profit or loss: these are financial liabilities that are: (i) held for trading,
(ii) Designated at fair value in order to match the effects of recognition of income and expenses to obtain more relevant and consistent accounting information, or (iii) derivatives. These liabilities are measured at fair value, which fair value changes recognized in profit or loss except for changes in fair value attributable to credit risk which are recognized in comprehensive income.
(iii) Measured at amortized cost: these are other financial liabilities not classified into the previous category. They are measured initially at fair value net of any cost attributable to the transaction and subsequently measured at amortized cost using the effective interest rate method.
The Group recognizes financial guarantees when these are granted to non-controlled entities or when the financial guarantee is granted at a percentage higher than the Company's interest to cover commitments of joint ventures. Such guarantees are initially measured at fair value, by recognizing (i) a liability corresponding to the risk of non-payment of the debt, which is amortized against finance income simultaneously and in proportion to amortization of the debt, and (ii) an asset equivalent to the right to compensation by the guaranteed party or a prepaid expense under the guarantees, which is amortized by receipt of cash from other shareholders or at the effective interest rate over the term of the guarantee. After initial recognition, guarantees are measured periodically at the higher of the amount determined in accordance with CPC 25 / IAS 37 and the amount initially recognized less accumulated amortization.
Financial assets and liabilities are offset and presented at their net amount when there is a legal right to offset the amounts and the intent to realize the asset and settle the liability simultaneously.
The classifications of financial instruments (assets and liabilities) are described in Note 33.
- Issued Capital
Common shares are classified as equity. Additional costs directly attributable to share issues and share options are recognized as a deduction from equity, net of any tax effects.
3.4 Property, plant and equipment
Items of property, plant and equipment are measured at acquisition, construction or formation cost less accumulated depreciation and, if applicable, accumulated impairment losses. Cost also includes any other costs attributable to bringing the assets to the place and in a condition to operate as intended by Management, the cost of dismantling the items and restoring the site on which they are located and capitalized borrowing costs on qualifying assets.
The replacement cost of items of property, plant and equipment is recognized if it is probable that it will involve economic benefits for the subsidiaries and if the cost can be reliably measured, and the value of the replaced item is written off. Maintenance costs are recognized in profit or loss as they are incurred.
Depreciation is calculated on a straight-line basis, at annual rates of 2% to 20%, taking into consideration the estimated useful life of the assets, as instructed and defined by the Granting Authority.
Gains and losses on disposal/write-off of an item of property, plant and equipment are determined by comparing the proceeds from disposal with the carrying amount of the asset, and are recognized net within other operating income/expenses.
Assets and facilities used in the electric generation, transmission and distribution activities are tied to these services and may not be removed, donated, disposed of, assigned or pledged in mortgage without the prior and express authorization of the ANEEL. The ANEEL, through Resolution No. 20 of February 3, 1999, amended by Normative Resolution No. 691 of December 8, 2015, releases Public Electric Energy Utilityconcessionaires from prior authorization for release of assets of no use to the concession, but determines that the proceeds from the disposal be deposited in a restricted bank account for use in the acquisition of new assets related to electric energy services.
53
(Free Translation of the original in Portuguese)
Standard Financial Statements – DFP – Date: December 31, 2018 - CPFL Energia S.A.
3.5 Intangible assets and Contract asset – in progress
Includes rights related to non-physical assets such as goodwill and concession exploitation rights, software and rights-of-way.
Goodwill that arises on the acquisition of subsidiaries is measured based on the difference between the fair value of the consideration transferred for acquisition of a business and the net fair value of the assets, adding the portion of noncontrolling interests and liabilities of the subsidiary acquired.
Goodwill is subsequently measured at cost less accumulated impairment losses. Goodwill and other intangible assets with indefinite useful lives, if any, are not subject to amortization and are tested annually for impairment.
Negative goodwill is recognized as a gain in the statement of profit or loss in the year of the business acquisition.
In the individual financial statements, fair value adjustments (value added) of net assets acquired in business combinations are included in the carrying amount of the investment and the amortization is classified in the individual statement of income as “equity interest in associates and joint ventures” in accordance with ICPC 09 (R2). In the consolidated financial statements, the amount is stated as intangible asset and its amortization is classified in the consolidated statement of profit and loss as “amortization of concession intangible asset” in other operating expense.
Intangible assets corresponding to the right to operate concessions may have three origins, as follows:
(i) Acquisitions through business combinations: the portion arising from business combinations that corresponds to the right to operate the concession amortized in straight-line method over the remaining period of the concessions.
(ii) Investments in infrastructure (application of ICPC01 (R1) and IFRIC 12 – Concession contracts) - in progress: under the electric energy distribution concession agreements with the subsidiaries, the recognized intangible asset corresponds to the concessionaires' right to charge the consumers for use of the concession infrastructure. Since the exploration term is defined in the agreement, intangible assets with defined useful lives are amortized over the concession period in proportion to a curve that reflects the consumption pattern in relation to the expected economic benefits. For further information, see note 3.2.
Items comprised in the infrastructure are directly tied to the Company’s electric energy distribution operation and shall comply with the same regulatory rules described in item 3.4.
(iii) Use of public asset: certain generation concessions were granted with the condition of payments to the federal government for use of public asset. On the signing date of the respective agreements, the Company’s subsidiaries recognized intangible assets and the corresponding liabilities, at present value. The intangible assets, capitalized by interest incurred on the obligation until the start-up date, are amortized on a straight-line basis over the remaining period of each concession.
As of January 1, 2018, the concession infrastructure assets of the distribution companies must be classified as contract assets during the construction or improvement period in accordance with the criteria of CPC 47 / IFRS 15.
54
(Free Translation of the original in Portuguese)
Standard Financial Statements – DFP – Date: December 31, 2018 - CPFL Energia S.A.
3.6 Impairment
Policyapplicable from January 1, 2018
- Financial assets
CPC 48 / IFRS 9 replaces the 'incurred loss’ model in IAS 39 / CPC 38 with an ‘expected credit loss’ (ECL) model.
The Group assesses evidence of impairment for certain receivables at both an individual and a collective level. Receivables that are not individually significant are collectively assessed for impairment. Collective assessment is carried out by grouping together assets with similar risk characteristics.
The Group recognizes impairment losses for ECLs on: (i) financial assets measured at amortized cost; (ii) debt investments measured at FVOCI, when applicable; and (iii) contract assets.
The Group measures impairment allowances, adopting the simplified method of recognizing, at an amount equal to lifetime ECLs, except for debt securities that are determined to have low credit risk at the reporting date, which are measured at 12-month ECLs.
When determining whether the credit risk of a financial asset has increased significantly since initial recognition and when estimating the expected credit losses, the Group considers a simplified approach of default assessment which consists in measuring the expected loss of a financial asset equivalent to the lifetime expected credit loss of an asset including reasonable and supportable information that is relevant and available without undue cost or effort. This includes both quantitative and qualitative information and analysis, based on the Group's historical experience and informed credit assessment and including forward-looking information.
The Group considers a financial asset to be in default when the borrower has not complied with its contractual payment obligations and is unlikely to pay its obligations.
The Group uses an allowance matrix based on its historical default rates observed along the expected lifetime of the trade receivables to estimate the expected credit losses for the lifetime of the asset where the history of losses is adjusted to consider the effects of the current conditions and its forecasts of future conditions that did not affect the period in which the historical data were based.
The methodology developed by the Group resulted in apercentage of expected loss for bills of consumers, concessionaires and licens that is in compliance with IFRS 9 described as expected credit losses, comprising in a single percentage the probability of loss weighted by the expected loss and possible results, that is, comprising the Probability of Default (“PD”), Exposure At Default (“EAD”) and Loss Given Default (“LGD”).
At each reporting date, the Group assesses whether financial assets carried at amortized cost and debt securities at FVOCI, when applicable, are credit-impaired.A financial asset is ‘credit‑impaired’ when one ormoreeventsthathaveadetrimentalimpactontheestimatedfuturecashflowsofthefinancial asset haveoccurred.
Evidence that a financial asset is credit‑impaired includes the following observable data:
o significantfinancialdifficultyoftheborrowerorissuer;
o abreachofcontract;
o therestructuringofaloanoradvancebytheGroupontermsthattheGroupwouldnotconsider otherwise;
o itisprobablethattheborrowerwillenterbankruptcyorotherfinancialreorganization;or
o thedisappearanceofanactivemarketforasecuritybecauseoffinancialdifficulties.
Impairment losses related to consumers, concessionaires and licensees recognized in financial assets and other receivables, including contract assets, are recognized in profit orloss.
- Non-financial assets
Non-financial assets that have indefinite useful lives, such as goodwill, are tested annually for impairment to assess whether the asset's carrying amount does not exceed its recoverable amount. Other assets subjectto amortization are tested for impairment whenever events or changes in circumstances indicate that the carrying amount may be impaired.
55
(Free Translation of the original in Portuguese)
Standard Financial Statements – DFP – Date: December 31, 2018 - CPFL Energia S.A.
An impairment loss is recognized if the carrying amount of an asset exceeds its estimated recoverable amount, which is the greater of (i) its fair value less costs to sell or (ii) its value in use.
The assets (e.g. goodwill, concession intangible asset) are segregated and grouped together at the lowest level that generates identifiable cash flows (the "cash generating unit", or CGU). If there is an indication of impairment, the loss is recognized in profit or loss. Except in the case of goodwill impairment, which cannot be reversed in the subsequent period, impairment analysis are reassessed for any possibility of reversals.
3.7 Provisions
A provision is recognized if, as a result of a past event, there is a legal or constructive obligation that can be estimated reliably, and it is probable (more likely than not) that an outflow of economic resources will be required to settle the obligation. When applicable, provisions are determined by discounting the expected future cash outflows at a rate that reflects current market assessment and the risks specific to the liability.
3.8 Employee benefits
Certain subsidiaries have post-employment benefits and pension plans, recognized. Although the plans have particularities, they have the following characteristics:
(i) Defined contribution plan: a post-employment benefit plan under which the Sponsor pays fixed contributions into a separate entity and will have no liability for the actuarial deficits of the plan. The obligations are recognized as an expense in the statement of profit or loss in the periods during which the services are rendered.
(ii) Defined benefit plan: The net obligation is calculated as the difference between the present value of the actuarial obligation based on assumptions, biometric studies and interest rates in line with market rates, and the fair value of the plan assets as of the reporting date. The actuarial liability is calculated annually by independent actuaries, under the responsibility of Management, using the projected unit credit method. Actuarial gains and losses are recognized in other comprehensive income when they occur. Net interest (income or expense) is calculated by applying the discount rate at the beginning of the period to the net amount of the defined benefit asset or liability. When applicable, the cost of past services is recognized immediately in profit or loss.
If the plan records a surplus and it becomes necessary to recognize an asset, the recognition is limited to the present value of future economic benefits available in the form of reimbursements or future reductions in contributions to the plan.
3.9 Dividend and Interest on capital
Under Brazilian law, the Company is required to distribute a mandatory minimum annual dividend of 25% of profit adjusted in accordance with the Company´s bylaws. A provision may only be made for the minimum mandatory dividend, and dividends declared but not yet approved are only recognized as a liability in the financial statements after approval by the competent body. According to Law 6.404/76, the amounts paid out to shareholders in excess of the mandatory minimum dividend, will therefore be held in equity, in the “additional dividend proposed” account, as they do not meet the present obligation criteria at the reporting date.
As established in the Company's bylaws and in accordance with current Corporate law, the Board of Directors is responsible for declaring an interim dividend and interest on capital determined in a half-yearly statement of income. An interim dividend and interest on capital declared at the base date of June 30, if any, is only recognized as a liability in the Company's financial statement after the date of the Board of Directors’ decision.
Interest on capital receives the same treatment as dividend and is also stated in changes in equity. The withholding income tax on interest on capital is always recognized as a charge to equity with a balancingitem in liabilities upon the proposal for its payment, even if not yet approved, since it meets the criterion of obligation at the time of Management’s proposal.
56
(Free Translation of the original in Portuguese)
Standard Financial Statements – DFP – Date: December 31, 2018 - CPFL Energia S.A.
3.10Revenue Recognition
Policyapplicable from January 1, 2018
The operating revenue in the normal course of the subsidiaries’ activities is measured at the consideration received or receivable. The operating revenue is recognized when it represents the transfer of promised goods or services to customers in an amount that reflects the consideration to which the company expects to be entitled in exchange for those goods or services.
IFRS 15 / CPC 47 establishes a revenue recognition model that considers five steps: (i) identify the contract with a customer; (ii) identify the performance obligations in the contract; (iii) determine the transaction price; (iv) allocate the transaction price to the performance obligations in the contract; and (v) recognize revenue when (or as) the entity satisfies a performance obligation.
Thus, revenue is recognized only when (or if) the performance obligation is satisfied, that is, when the “control” of the goods or services of a certain transaction is actually transferred to the customer.
The revenue from electric energy distribution is recognized when the energy is supplied. The energy distribution subsidiaries perform the reading of their customers consumption based on a reading routine (calendar and reading route) and invoice monthly the consumption of MWh based on the reading performed for each consumer. As a result, part of the energy distributed during the month is not billed at the end of the month and, consequently, an estimate is developed by Management and recorded as “Unbilled”. This unbilled revenue estimate is calculated using as a base the total volume of energy of each distributor made available in the month and the annualized rate of technical and commercial losses.
The revenue from energy generation sales is recognized based on the assured energy and at tariffs specified in the terms of the supply contracts or the current market price, as appropriate.
The revenue from energy commercialization is recognized based on bilateral contracts with market agents and properly registered with the Electric Energy Commercialization Chamber – CCEE.
The revenue from services provided is recognized when the service is provided, under a service agreement between the parties.
The revenue from construction contracts is recognized based on the reach of the performance obligation over time, considering the fulfillment of one of the following criteria:
(a) thecustomer simultaneously receives and consumes the benefits provided by the entity’s performance as the entity performs;
(b) theentity’s performance creates or enhances an asset (for example, work in progress) that the customer controls as the asset is created or enhanced;
(c) theentity’s performance does not create an asset with an alternative use to the entity and the entity has an enforceable right to payment for performance completed to date.
Theprovision of infrastructure construction services is recognized in accordance with CPC 47 / IFRS 15, against a contract asset.
The revenues of the transmission companies, recognized as operating revenue, are:
· Construction revenue: Refers to the services of construction of electric energy transmission facilities. These are recognized according to the percentage of completion of the construction works.
· Financing component: Refers to the interest recognized under the accrual basis method on the amount receivable from the construction revenue.
57
(Free Translation of the original in Portuguese)
Standard Financial Statements – DFP – Date: December 31, 2018 - CPFL Energia S.A.
· Revenue from operation and maintenance: Refers to the services of operation and maintenance of electric energy transmission facilities aimed at non-interruption of availability of these facilities, recognized based on incurred costs.
No single consumer accounts for 10% or more of the Group’s totalrevenue.
3.11 Income tax and social contribution
Income tax and social contribution expenses are calculated and recognized in accordance with the legislation in force and comprise current and deferred taxes. Income tax and social contribution are recognized in the statement of profit or loss except to the extent that they relate to items recognized directly in equity or other comprehensive income, when the net amounts of these tax effects are already recognized, and those arising from the initial recognition in business combinations.
Current taxes are the expected taxes payable or receivable/recoverable on the taxable profit or loss. Deferred taxes are recognized for temporary differences between the carrying amounts of assets and liabilities for accounting purposes and the equivalent amounts used for tax purposes and for tax loss carryforwards.
The Company and certain subsidiaries recognized in their financial statements the effects of tax loss carryforwards and temporarily nondeductible differences, based on projections of future taxable profits, approved annually by the Boards of Directors and examined by the Fiscal Council. The subsidiaries also recognized tax credits relating to the benefit of merged intangible, which are amortized on a straight-line basis over the remaining period of each concession agreement.
Deferred tax assets and liabilities are offset if there is a legally enforceable right to offset current tax liabilities and assets, and they relate to taxes levied by the same tax authority on the same taxable entity.
Deferred income tax and social contribution assets are reviewed at each annual reporting date and are reduced to the extent that it is no longer probable that the related taxes benefit will be realized.
3.12 Earnings per share
Basic earnings per share are calculated by dividing the profit or loss for the year attributable to the controlling shareholders by the weighted average number of shares outstanding during the year. Diluted earnings per share are calculated by dividing the profit or loss for the year attributable to the controlling shareholders, adjusted by the effects of instruments that potentially would have impacted the profit or loss for the year by the weighted average of the number of shares outstanding, adjusted by the effects of all dilutive potential convertible notes for the reporting periods, in accordance with CPC 41 / IAS 33.
3.13 Government grants – CDE
Government grants are only recognized when it is reasonably certain that these amounts will be received by the Group. They are recognized in profit or loss for the periods in which the Group recognizes as income the discounts granted in relation to the low-income subsidy and other tariff discounts.
The subsidies received through funds from the Energy Development Account - CDE (note 25) have the main purpose of offsetting discounts granted and expenses already incurred in order to provide immediate financial support to the distribution companies, in accordance with CPC 07 / IAS 20.
3.14 Sector financial asset and liability
According to the tariff pricing mechanism applicable to the distribution companies, the energy tariffs should be set at a price level (price cap) that ensures the economic and financial equilibrium of the concession. Therefore, the concessionaires and licensees are authorized to charge their consumers (after review andratification by ANEEL) for: (i) the annual tariff increase; and (ii) every four or five years, according to each concession agreement, the periodic review for purposes of reconciliation of part of Parcel B (controllable costs) and adjustment of Parcel A (non-controllable costs).
58
(Free Translation of the original in Portuguese)
Standard Financial Statements – DFP – Date: December 31, 2018 - CPFL Energia S.A.
The distributors' revenue is mainly comprised of the sale of electric energy and for the delivery (transmission) of the electric energy through the distribution infrastructure (network). The distribution concessionaires' revenue is affected by the volume of energy delivered and the tariff. The electric energy tariff is comprised of two parcels which reflect a breakdown of the revenue:
· Parcel A (non-controllable costs): this parcel should be neutral in relation to the entity's performance, i.e., the costs incurred by the distributors, classifiable as Parcel A, is fully passed through the consumer or borne by the Granting Authority; and
· Parcel B (controllable costs): comprised of capital expenditure on investments in infrastructure, operational costs and maintenance and remuneration to the providers of capital. It is this parcel that actually affects the entity's performance, since it has no guarantee of tariff neutrality and thus involves an intrinsic business risk.
This tariff pricing mechanism can cause temporary differences arising from the difference between the budgeted costs (Parcel A and other financial components) included in the tariff at the beginning of the tariff period and those actually incurred while it is in effect. This difference constitutes a right of the concessionaire to receive cash when the budgeted costs included in the tariff are lower than those actually incurred, or an obligation to pay if the budgeted costs are higher than those actually incurred.
3.15 Business combination
Business combinations are accounted for by applying the acquisition method. The consideration transferred including the recognized amount of any noncontrolling interest in the acquiree, less the recognized fair value of the identifiable assets acquired and liabilities assumed, all measured at the acquisition date. Costs related to the acquisition are recognized in profit or loss, when incurred.
At the acquisition date, other assets and liabilities are recognized at fair value, except for: (i) deferred taxes, (ii) employee benefits, and (iii) share-based payments.
The noncontrolling interests are initially measured either at fair value or at the noncontrolling interests’ proportionate share of the acquiree’s identifiable net assets. The measurement method is chosen on a transaction-by-transaction basis.
The excess of the consideration transferred, added to the portion of noncontrolling interests, over the fair value of the identifiable assets (including the concession intangible asset) and net liabilities assumed at the acquisition date are recognized as goodwill. In the event that the fair value of the identifiable assets and net liabilities assumed exceeds the consideration transferred, a bargain purchase is identified and the gain is recognized in the statement of profit or loss at the acquisition date.
3.16 Basis of consolidation
(i) Business combinations
The Company measures goodwill as the fair value of the consideration transferred including the recognized amount of any noncontrolling interest in the acquiree, less the recognized fair value of the identifiable assets acquired and liabilities assumed, all measured at the acquisition date.
(ii) Subsidiaries and joint ventures
The financial statements of subsidiaries are included in the consolidated financial statements from the date that control commences until the date that control ceases. Joint ventures are accounted for using the equity method of accounting from the moment joint control is established.
59
(Free Translation of the original in Portuguese)
Standard Financial Statements – DFP – Date: December 31, 2018 - CPFL Energia S.A.
The accounting policies of subsidiaries and joint ventures taken into consideration for purposes of consolidation and/or equity method of accounting, as applicable, are aligned with the Group's accounting policies.
In the individual (parent company) financial statements, the financial information on subsidiaries and joint ventures are accounted for under the equity method. In the consolidated financial statements, the information on joint ventures is accounted for under the equity method.
The consolidated financial statements include the balances and transactions of the Company and its subsidiaries. The balances and transactions of assets, liabilities, income and expenses have been fully consolidated for the subsidiaries. Prior to consolidation into the Company's financial statements, the financial statements of subsidiaries CPFL Geração, CPFL Brasil, CPFL Jaguari Geração, CPFL Eficiência Energética and CPFL Renováveis are fully consolidated into those of their subsidiaries.
Intragroup balances and transactions, and any income and expenses derived from these transactions, are eliminated in preparing the consolidated financial statements. Unrealized gains arising from transactions with equity accounted investees are eliminated against the investment to the extent of the CPFL Energia interest in the investee. Unrealized losses are eliminated in the same way as unrealized gains, but only to the extent that there is no evidence of impairment.
In the case of subsidiaries, the portion related to noncontrolling interests is stated in equity and in the statements of profit or loss and comprehensive income in each period presented.
The balances of joint ventures, as well as the Company’s interest in each of them are described in note 12.4.
(iii) Acquisition of noncontrolling interests
Accounted for as transaction among shareholders. Consequently, no gain or goodwill is recognized as a result of such transaction.
3.17 New standards and interpretations
A number of standards and interpretations have been issued and/or revised by the IASB and the CPC and are effective for accounting periods beginning January 1, 2018.
a) IFRS 9 / CPC 48 - Financial instruments.
Effective for the financial statements of an entity prepared in accordance with IFRS for annual periods beginning on or after January 1, 2018, IFRS 9 /CPC 48 standard establishes new requirements for classification and measurement of financial assets and liabilities. Financial assets become classified into three categories based on the business model within which they are held and the characteristics of their contractual cash flows: (i) measured at fair value trough profit or loss and; (ii) measured at amortized cost; and (iii) measured at fair value through other comprehensive income.
For financial liabilities, the main change relates to the requirements established by IAS 39/ CPC 38 that changes in the fair value of a financial liability designated as at fair value through profit or loss attributable to changes in the credit risk of that liability be presented in other comprehensive income and not in the statement of profit or loss.
Regarding the impairment of financial assets, IFRS 9 / CPC 48 requires the expected credit loss model, instead to the incurred credit loss model mentioned in IAS 39 / CPC 38. The expected credit loss model requires that the company accounts for expected credit losses and changes in those expected credit losses at each reporting date to reflect changes in credit risk since initial recognition. That is, it is no longer necessary for a credit event to have occurred before credit losses are recognized.
With respect to the changes relating to hedge accounting, IFRS 9 / CPC 48 retains the three types of hedge accounting mechanisms in IAS 39, but brings greater flexibility regarding the types of instruments eligible for hedge accounting. There was an increase in the types of transactions that qualify as hedging instrument and the types of risk components of non-financial items eligible for hedge accounting. Inaddition, the effectiveness test has been renewed and replaced with the principle of an “economic relationship”. Also, the retrospective assessment of hedge effectiveness is no longer required and additional disclosure requirements relating to an entity’s risk management activities have been introduced.
60
(Free Translation of the original in Portuguese)
Standard Financial Statements – DFP – Date: December 31, 2018 - CPFL Energia S.A.
The Group’s distribution subsidiaries have material assets, recorded as financial asset of concession, previously classified as “available for sale”, according to the requirements of IAS 39 / CPC 38. These assets represent the right to indemnity at the end of the concession period of the distribution subsidiaries. The designation of these instruments as available for sale occurred due to non-classification into the other three categories described in IAS 39 / CPC 38 (loans and receivables, fair value through profit or loss and held to maturity). These assets has been classified as measured at fair value through profit or loss according to the new standard(IFRS 9 / CPC48), and the effects of the subsequent measurement have been recognized in profit or loss. On 2018 the amount registered related to this assets was R$ 7,430,149 (R$ 6,569,404 at 2017) and there were no material impacts related to the initial recognition due to the classification of financial assets.
The sector financial assets recorded in the Group’s distribution companies related to the tariff definition mechanism, in respect of the timing differences between the budged costs and those that are actually incurred, were previously recorded as “loans and receivables” in accordance with the requirements of IAS 39 / CPC 38. After the application of IFRS 9 / CPC 48, these financial assets are classified as amortized cost. In 2018 the recorded amount for these assets was R$ 1,554,861 (R$ 565,837 in 2017) and there were no impacts on measurement of the balances as a result of the change in classification.
Accordingly, there was no significant measurement impact on the Group’s consolidated financial statements due to the initial adoption related to the classification of financial assets.
Moreover, as the Group does not apply hedge accounting, Management concluded that there were no material impact on the information disclosed or amounts recognized in its consolidated financial statements as a result of the amendments to the standard about this topic.
As regards the changes in the calculation of impairment of financial instruments, the accumulated effects of the initial adoption were recognized retrospectively on January 1st 2018, representing a reduction of R$73,426 (R$48,461net of tax effects) from the “Consumers, concessionaires and permit holders” line item.
Considering the changes in credit risk, the financial liabilities, which were designated at fair value through profit or loss up to the 2017 statements, generated impacts on the entries about changes in credit risk in other comprehensive income, instead of directly in the income statement for the year. The accumulated effects of the initial adoption were recognized retrospectively on January 1, 2018, amounting to a loss of R$ 51,736 (R$ 34,146 net of tax effects) in retained earnings, which the counterpart was the account of other comprehensive income.
b) IFRS 15 / CPC 47– Revenue from contracts with customers
IFRS 15 / CPC 47 establishes a model for entities to use in accounting for revenue from contracts with customers and will supersede the current guidance on revenue recognition in IAS 18/CPC 30 (R1) - Revenue, IAS 11/CPC 17 (R1) – Construction Contracts and related interpretations.
This standard establishes that an entity shall recognize revenue to depict the transfer (or promise) of goods or services to customers in an amount that reflects the consideration to which the entity expects to be entitled in exchange for those goods or services. The standard introduces a 5-step approach to revenue recognition: (i) identify the contract with a customer; (ii) identify the performance obligations in the contract; (iii) determine the transaction price; (iv) allocate the transaction price to the performance obligations in the contract; and (v) recognize revenue if and when the entity satisfies a performance obligation.
According requirements of the pronouncement the entity recognizes revenue only when (or as) the performance obligation is satisfied, that is, when the “control” over the goods or services of a certain operation is transferred to the customer. In addition, this standard will establish further details in the disclosures related to contracts with customers.
61
(Free Translation of the original in Portuguese)
Standard Financial Statements – DFP – Date: December 31, 2018 - CPFL Energia S.A.
Beginning January 1, 2018, the Group’s management assessed the effects on its consolidated financial statements, comprising the new model of five steps mentioned above, and the compensation for non-compliance with technical indicators is considered as a variable consideration under step (iii) above, and it is now recognized as operating revenue, in line item Other Income, whereas until December 31, 2017 it was recognized in Other Operating Expenses. The amount recognized in 2018 was R$ 57,630 (note 25).
The distribution companies have infrastructure concession assets during the construction period, previously recorded as “intangible assets”. These assets are now recorded as “contract asset in progress” according to IFRS 15 / CPC 47 requirements. This change had no material impacts on consolidated financial statements (see note 3.5 – Intangible assets and Contract asset in progress).
In addition, the transmission subsidiaries had assets previously classified as financial assets, “loans and receivables”, according to the requirements of IAS 39 / CPC 38, comprising two components: the right to receive the “Permitted Annual Revenue– RAP” to be received over the concession period and the indemnity at the end of the concession. These two components are now classified as contract asset, according to the requirements of IFRS 15/ CPC 47 . This change did not have material impacts on the Group’s consolidated financialstatements. (see note 3.2 – transmission subsidiaries)
c) IFRIC 22 / ICPC 21 – Foreign currency transactions and advance consideration
Issued on December 8, 2016, IFRIC 22 addresses the exchange rate to be used in transactions that involve the consideration paid or received in advance in foreign currency transactions, IFRIC will be effective for annual periods beginning on or after January 1, 2018.
The Group’s foreign currency transactions are currently restricted to debt instruments with international financial institutions, measured at fair value, and to the purchase of electricity from Itaipu.
As assets and liabilities measured at fair value are outside the scope of this interpretation and there are no advance payments on operations with Itaipu, Groups’ Management believes that IFRIC 22 will not have material impacts on its consolidated financial statements.
3.18Newstandards and interpretations not yet effective and not adopted in advance
A number of new standards and amendments to standards and IFRS interpretations were issued by the IASB and are not yet effective for the year ended December 31, 2018. The Group has not adopted these changes in these financial statements:
a) IFRS 16 / CPC 06 (R2) - Leases
The Group evaluated the potential effect of the adoption of CPC 06 (R2) / IFRS 16 and expects an immaterial impact in the consolidated financial statements.
Issued on January 13, 2016, establishes, in the lessee’s view, a new form for accounting for leases currently classified as operating leases, which are now recognized similarly to leases classified as finance leases. As regards the lessors, it virtually retains the requirements of IAS 17 / CPC 06 (R1), including only some additional disclosure aspects.
IFRS 16 introduces a single, on‑balance sheet lease accounting model for lessees. A lessee recognizes a right‑of‑use asset representing its right to use the underlying asset and a lease liability representing its obligation to make lease payments. There are recognition exemptions for short‑term leases and leases of low‑value items. Lessor accounting remains similar to the current standard – i.e. lessors continue to classify leases as finance or operating leases.
IFRS 16 replaces existing leases guidance, including CPC 06 / IAS 17 Leases, ICPC 03 / IFRIC 4 Determining whether an Arrangement contains a Lease, SIC‑15 and SIC‑27Complementary Aspects of Lease Transactions.
62
(Free Translation of the original in Portuguese)
Standard Financial Statements – DFP – Date: December 31, 2018 - CPFL Energia S.A.
IFRS 16 / CPC 06 (R2) will be effective for annual reporting periods beginning on or after January 1, 2019. The Group has assessed the pronouncement and believes its adoption will not have material impacts on these financial statements.
b) IFRIC 23 / ICPC 22 –Uncertainty over Tax Treatments
Issued in May 2017 in order to clarify the accounting for tax positions that may not be accepted by the tax authorities in regard to IRPJ and CSLL matters. In general lines, the main point of analysis of the interpretation refers to the probability of acceptance by the tax authorities of the tax treatment chosen by the Group.
IFRS 23 / ICPC 22 will be effective for annual reporting periods beginning on or after January 1, 2019. The Group has preliminarily assessed the interpretation and does not expect material impacts on the adoption of this interpretation.
c) Annual Improvements to IFRSs 2015 – 2017 Cycle
Annually IASB discusses and decides on the proposed improvements to IFRS, as they arise during the year. On December 12, 2017, measures related to the 2015-2017 cycle were published, beginning on January 1, 2019.
IFRS 3 Business Combinations and IFRS 11 Joint Ventures – clarify that when an entity obtains the control of a business that is a joint operation, it remeasures the previously held equity interests in that business. Regarding IFRS 11, it clarifies that when an entity obtains the joint control of a business that is a joint operation, the entity does not transfer the previously held equity interests in that business.
IAS 12 Income Taxes – clarifies the requirements regarding the effects of the recognition of the income tax on dividends related to transactions or events that generated profits to be distributed.
IAS 23 Borrowing Costs – clarifies that if any borrowing remains outstanding after the related asset is available for use or sale, such borrowing becomes part of the amounts that an entity borrows generally when calculating the capitalization rate on borrowings in general.
Based on a preliminary assessment, Management believes that the application of these amendments will not have a material impact on the disclosures and amounts recognized in its consolidated financial statements.
( 4 ) FAIR VALUE MEASUREMENT
A number of the Group’s accounting policies and disclosures require the fair value measurement, for both financial and non-financial assets and liabilities. Fair values have been determined for measurement and / or disclosure purposes based on the following methods. When applicable, additional information on the assumptions made in the fair value measurement is disclosed in the notes specific to that asset or liability.
Accordingly, the Group measures fair value in accordance with IFRS 13 / CPC 46, which defines the fair value as the price estimate for which an unforced transaction for the sale of the asset or transfer of the liability would occur between market participants under current market conditions at the measurement date.
- Property, plant and equipment and intangible assets
The fair value of property, plant and equipment and intangible assets recognized as a result of a business combination is based on market values. The market value of these assets is the estimated value for which an asset could be exchanged on the valuation date between knowledgeable interested parties in an unforced transaction between market participants at the measurement date. The fair value of items of property, plant and equipment is based on the market approach and cost approaches using quoted market prices for similar items when available and replacement cost when appropriate.
63
(Free Translation of the original in Portuguese)
Standard Financial Statements – DFP – Date: December 31, 2018 - CPFL Energia S.A.
- Financial instruments
Financial instruments measured at fair value are valued based on quoted prices in an active market, or, if such prices are not available, they are assessed using pricing models, applied individually to each transaction, taking into consideration future cash flows, based on the contractual conditions, discounted to present value at rates obtained from market interest curves, having as a basis, whenever available, information obtained from the websites of B3 S.A. and “Associação Brasileira das Entidades dos Mercados Financeiro e de Capitais – ANBIMA” (note 33) and also includes the debtor's credit risk rate.
The right to compensation, to be paid by the Federal Government when the distribution concessionaires’ assets are handed over at the end of the concession period are classified as measured at fair value through profit or loss. The methodology adopted for fair value measurement of these assets is based on the tariff review process for distributors. This process, conducted every four or five years according to each concessionaire, involves assessing the replacement price of the distribution infrastructure, in accordance with criteria established by the granting authority (“ANEEL”). This valuation basis is used for pricing the tariff, which is adjusted annually up to the next tariff review, based on the parameter of the main inflation indices.
Accordingly, at the time of the tariff review, each distribution concessionaire adjusts the position of the financial asset base for compensation at the amounts ratified by the granting authority and uses the Extended Consumer Price Index (“IPCA”) as the best estimate to adjust the original base to the adjusted value at subsequent dates, in accordance with the tariff review process.
( 5 ) CASH AND CASH EQUIVALENTS
Parent company | Consolidated | ||||||
December 31, 2018 | December 31, 2017 | December 31, 2018 | December 31, 2017 | ||||
Bank balances | 2,824 | 508 | 422,968 | 365,031 | |||
Short-term financial investments | 76,540 | 6,073 | 1,468,489 | 2,884,611 | |||
Overnight investment (a) | - | 42 | 66 | 178,444 | |||
Bank certificates of deposit (b) | 9,220 | - | 462,551 | 785,074 | |||
Repurchase agreements secured on debentures (b) | 67,320 | - | 177,050 | 3,268 | |||
Investment funds (c) | - | 6,032 | 828,822 | 1,917,825 | |||
Total | 79,364 | 6,581 | 1,891,457 | 3,249,642 | |||
a) Bank account balances, which earn daily interest by investment in repurchase agreements secured on Bank Certificate Deposit (CDB) and interest of 15% of the variation in the Interbank Certificate of Deposit (CDI).
b) Short-term investments in Bank Certificates of Deposit (CDB) and secured debentures with major financial institutions that operate in the Brazilian financial market, with daily liquidity, short term maturity, low credit risk and interest equivalent, on average, to 100,3% of the CDI.
c) Exclusive Fund investments, with daily liquidity and interest equivalent, on average, to 79% of the CDI, subject to floating rates tied to the CDI linked to federal government bonds, CDBs, financial bills and secured debentures of major financial institutions, with low credit risk and short term maturity.
( 6 ) CONSUMERS, CONCESSIONAIRES AND LICENSEES
The consolidated balance includes mainly activities from the supply of electric energy, broken down as follows at December 31, 2018 and 2017:
64
(Free Translation of the original in Portuguese)
Standard Financial Statements – DFP – Date: December 31, 2018 - CPFL Energia S.A.
Consolidated | ||||||||||
Past due | Total | |||||||||
Amounts coming due | until 90 days | > 90 days | December 31, 2018 | December 31, 2017 | ||||||
Current | ||||||||||
Consumer classes | ||||||||||
Residential | 803,215 | 584,688 | 71,283 | 1,459,186 | 1,113,604 | |||||
Industrial | 327,266 | 84,260 | 68,658 | 480,184 | 483,630 | |||||
Commercial | 334,052 | 101,357 | 31,075 | 466,483 | 382,470 | |||||
Rural | 90,955 | 23,606 | 8,831 | 123,392 | 98,663 | |||||
Public administration | 77,064 | 19,651 | 2,336 | 99,051 | 88,910 | |||||
Public lighting | 59,769 | 9,906 | 8,192 | 77,868 | 67,533 | |||||
Public utilities | 102,258 | 14,531 | 5,051 | 121,840 | 100,843 | |||||
Billed | 1,794,579 | 837,999 | 195,426 | 2,828,004 | 2,335,653 | |||||
Unbilled | 1,158,106 | - | - | 1,158,106 | 1,008,486 | |||||
Financing of consumers' debts | 169,265 | 28,913 | 26,725 | 224,903 | 206,937 | |||||
CCEE transactions | 170,793 | 2,955 | 1,428 | 175,176 | 413,067 | |||||
Concessionaires and licensees | 421,571 | - | 6,790 | 428,361 | 539,322 | |||||
Others | 34,001 | - | - | 34,002 | 36,011 | |||||
3,748,315 | 869,867 | 230,369 | 4,848,552 | 4,539,476 | ||||||
Allowance for doubtful accounts | (300,601) | (238,193) | ||||||||
Total | 4,547,951 | 4,301,283 | ||||||||
Noncurrent | ||||||||||
Financing of consumers' debts | 196,635 | - | - | 196,635 | 217,944 | |||||
Free energy | 6,360 | - | - | 6,360 | 5,976 | |||||
CCEE transactions | 231,551 | 318,249 | - | 549,800 | 41,301 | |||||
434,546 | 318,249 | - | 752,795 | 265,221 | ||||||
Allowance for doubtful accounts | - | (28,683) | ||||||||
Total | 752,795 | 236,539 | ||||||||
Financing of Consumers' Debts -Refers to the negotiation of overdue receivables from consumers, principally public administration. Payment of some of these receivables is guaranteed by the debtors, by pledging the bank accounts through which their ICMS (VAT) revenue is received.
Electric Energy Commercialization Chamber (CCEE) transactions -The amounts refer to the sale of electric energy on the spot market. The noncurrent amounts mainly comprise: (i) adjustments of entries made by the CCEE in response to certain legal decisions (preliminary decisions) in the accounting processes for the period from September 2000 to December 2002; (ii) provisional accounting entries established by the CCEE; and (iii) opening balances due to the CCEE temporary situation in function of injuctions from generating companies due to the hydrological scenario and its financial impacts over free market. The subsidiaries consider that there is no significant risk on the realization of these assets and consequently no allowance was recognized for these transactions.
Concessionaires and licensees- Refer basically to receivables for the supply of electric energy to other concessionaires and licensees, mainly by the subsidiaries CPFL Geração, CPFL Brasil and CPFL Renováveis.
Allowance for doubtful accounts
The allowance for doubtful debts is set up based on the expected credit loss (ECL), adopting the simplified method of recognizing, based on the history and future probability of default.
Movements in the allowance for doubtful accounts are shown below:
65
(Free Translation of the original in Portuguese)
Standard Financial Statements – DFP – Date: December 31, 2018 - CPFL Energia S.A.
Consumers, concessionaires and licensees | Other | Total | |||
At December 31, 2016 | (261,525) | (27,992) | (289,517) | ||
Allowance - reversal (recognition) | (263,668) | (1,439) | (265,107) | ||
Recovery of revenue | 110,008 | - | 110,008 | ||
Write-off of accrued receivables | 148,309 | 52 | 148,361 | ||
At December 31, 2017 | (266,876) | (29,379) | (296,255) | ||
Allowance - reversal (recognition) | (277,802) | 1,419 | (276,383) | ||
Recovery of revenue | 107,122 | - | 107,122 | ||
Effects on first adoption of IFRS 9 / CPC 48 | (72,687) | (738) | (73,426) | ||
Write-off of accrued receivables | 209,641 | - | 209,641 | ||
At December 31, 2018 | (300,601) | (28,698) | (329,299) | ||
Current | (300,601) | (28,698) | (329,299) | ||
Noncurrent | - | - | - |
66
(Free Translation of the original in Portuguese)
Standard Financial Statements – DFP – Date: December 31, 2018 - CPFL Energia S.A.
( 7 ) TAXES RECOVERABLE
Parent company | Consolidated | ||||||
December 31, 2018 | December 31, 2017 | December 31, 2018 | December 31, 2017 | ||||
Current | |||||||
Prepayments of social contribution – CSLL | - | 227 | 12,373 | 7,257 | |||
Prepayments of income tax - IRPJ | 49 | 1,725 | 36,972 | 21,887 | |||
Income tax and social contribution to be offset | 9,392 | 15,099 | 74,395 | 59,658 | |||
Income tax and social contribution to be offset | 9,441 | 17,051 | 123,739 | 88,802 | |||
Withholding income tax - IRRF on interest on capital | 7,909 | 43,467 | 8,163 | 43,841 | |||
Withholding income tax - IRRF | 346 | 2,893 | 92,210 | 103,277 | |||
State VAT - ICMS to be offset | - | - | 125,669 | 104,843 | |||
Social Integration Program - PIS | 65 | 56 | 9,970 | 8,447 | |||
Contribution for Social Security Funding - COFINS | 326 | 283 | 46,741 | 37,699 | |||
Others | - | - | 4,764 | 8,137 | |||
Others taxes to be offset | 8,646 | 46,699 | 287,517 | 306,244 | |||
|
|
|
| ||||
Total current | 18,087 | 63,751 | 411,256 | 395,045 | |||
Noncurrent | |||||||
Social contribution to be offset - CSLL | - | - | 62,458 | 58,856 | |||
Income tax to be offset - IRPJ | - | - | 5,508 | 2,608 | |||
Income tax and social contribution to be offset | - | - | 67,966 | 61,464 | |||
State VAT - ICMS to be offset | - | - | 174,596 | 159,624 | |||
Social Integration Program - PIS | - | - | 1,060 | 1,024 | |||
Contribution for Social Security Funding - COFINS | - | - | 4,885 | 4,719 | |||
Others | - | - | 5,185 | 6,613 | |||
Others taxes to be offset | - | - | 185,725 | 171,980 | |||
Total noncurrent | - | - | 253,691 | 233,444 | |||
Withholding income tax - IRRF – Relates mainly to IRRF on financial investments.
Social contribution to be offset – CSLL – In noncurrent, it refers basically to the final unappealable favorable decision in a lawsuit filed by the subsidiary CPFL Paulista. The subsidiary CPFL Paulista is awaiting the authorization for utilization of credit from the Federal Revenue in order to carry out its subsequent offset.
State VAT - ICMS to be offset – In noncurrent, it refers mainly to the credit recorded on purchase of assets that results in the recognition of property, plant and equipment, intangible assets and financial assets.
( 8 ) SECTOR FINANCIAL ASSET AND LIABILITY
The breakdown of the balances of sector financial asset and liability and the movement for the year are as follows:
67
(Free Translation of the original in Portuguese)
Standard Financial Statements – DFP – Date: December 31, 2018 - CPFL Energia S.A.
Consolidated | |||||||||||||||||||
At of December 31, 2017 | Operating revenue (note 25) | Finance income or expense (note 28) | Receipt | At of December 31, 2018 | |||||||||||||||
Deferred | Approved | Total | Constitution | Through billing | Monetary adjustment | Tariff flag | Deferred | Approved | Total | ||||||||||
Parcel "A" | 924,943 | (235,916) | 689,026 | 1,416,031 | 656 | 90,658 | (297,340) | 1,306,751 | 592,281 | 1,899,031 | |||||||||
CVA (*) | |||||||||||||||||||
CDE (**) | (235,901) | (263,520) | (499,422) | 352,202 | 358,731 | (10,630) | - | 208,156 | (7,275) | 200,881 | |||||||||
Electric energy cost | 1,625,759 | (18,280) | 1,607,479 | 416,476 | (599,527) | 93,538 | (297,340) | 586,027 | 634,599 | 1,220,626 | |||||||||
ESS and EER (***) | (974,091) | (167,048) | (1,141,139) | (686,829) | 878,350 | (63,412) | - | (562,800) | (450,230) | (1,013,030) | |||||||||
Proinfa | (610) | (17,961) | (18,572) | 8,456 | 13,411 | 80 | - | 246 | 3,129 | 3,375 | |||||||||
Basic network charges | (20,163) | 23,387 | 3,224 | 69,335 | (16,318) | 3,540 | - | 36,256 | 23,526 | 59,782 | |||||||||
Pass-through from Itaipu | 959,518 | 125,860 | 1,085,378 | 1,222,806 | (781,341) | 79,596 | - | 1,141,254 | 465,184 | 1,606,438 | |||||||||
Transmission from Itaipu | 7,802 | 7,806 | 15,608 | 38,876 | (11,909) | 1,648 | - | 31,784 | 12,439 | 44,222 | |||||||||
Neutrality of sector charges | 32,566 | 112,084 | 144,651 | (81,435) | (110,305) | (2,044) | - | (40,763) | (8,370) | (49,133) | |||||||||
Overcontracting | (469,937) | (38,244) | (508,181) | 76,143 | 269,565 | (11,657) | - | (93,409) | (80,721) | (174,130) | |||||||||
Other financial components | (193,496) | 21,812 | (171,685) | (327,883) | 119,112 | (10,419) | - | (275,550) | (115,325) | (390,875) | |||||||||
Total | 731,447 | (214,104) | 517,341 | 1,088,148 | 119,768 | 80,240 | (297,340) | 1,031,201 | 476,956 | 1,508,156 | |||||||||
Current assets | 210,834 | 1,330,981 | |||||||||||||||||
Noncurrent assets | 355,003 | 223,880 | |||||||||||||||||
Current liabilities | (40,111) | - | |||||||||||||||||
Noncurrent liabilities | (8,385) | (46,703) | |||||||||||||||||
(*) Deferred tariff costs and gains variations from Parcel “A” items
(**) Energy Development Account – CDE
(***) System Service Charge (ESS) and Reserve Energy Charge (EER)
a) CVA
Refers to the variations of the Parcel A account, in accordance with note 3.14. These amounts are adjusted based on the SELIC rate and are compensated in the subsequent tariff processes.
b) Neutrality of sector charges
This refers to the neutrality of the sector charges contained in the electric energy tariffs, calculating the monthly differences between the amounts billed relating to such charges and the respective amounts considered at the time the distributors’ tariff was set.
c) Overcontracting
Electric energy distribution concessionaires are required to guarantee 100% of their energy market through contracts approved, registered and ratified by ANEEL. It is also assured to the distribution concessionaires that costs or revenues derived from energy surplus will be passed through the tariffs, limited to 5% of the energy load requirement. These amounts are adjusted based on SELIC rate and are compensated in the subsequent tariff processes.
d) Other financial components
Refers mainly to: (i) excess demand and excess reactive power that, will be amortized upon the approval of the 5th periodic tariff review cycle; (ii) refund of the research and development - “R&D” related to the amount overpaid to the National Treasury in the period from 2010 to 2012 for the 0.30% surcharge on Net Operating Revenue - ROL (iii) recalculations of the tariff processes and (iv) Tariff effect arising from the bilateral agreement between the parties signatories of the Power Trading Chamber in the Regulated Environment – CCEAR.
68
(Free Translation of the original in Portuguese)
Standard Financial Statements – DFP – Date: December 31, 2018 - CPFL Energia S.A.
( 9 ) DEFERRED TAX ASSETS AND LIABILITIES
9.1 Breakdown of tax assets and liabilities
Parent company | Consolidated | ||||||
December 31, 2018 | December 31, 2017 | December 31, 2018 | December 31, 2017 | ||||
Social contribution credit/(debit) | |||||||
Tax losses carryforwards | 29,750 | 38,216 | 137,577 | 103,903 | |||
Tax benefit of merged intangible | - | - | 97,288 | 105,065 | |||
Temporarily nondeductible/taxable differences | (355) | (408) | (292,257) | (305,677) | |||
Subtotal | 29,395 | 37,808 | (57,392) | (96,708) | |||
Income tax credit / (debit) | |||||||
Tax losses carryforwards | 84,113 | 109,103 | 382,359 | 303,543 | |||
Tax benefit of merged intangible | - | - | 315,189 | 342,262 | |||
Temporarily nondeductible/taxable differences | (986) | (1,132) | (809,917) | (844,948) | |||
Subtotal | 83,127 | 107,971 | (112,369) | (199,141) | |||
PIS and COFINS credit/(debit) | |||||||
Temporarily nondeductible/taxable differences | - | - | (10,086) | (10,543) | |||
Total | 112,522 | 145,779 | (179,847) | (306,392) | |||
Total tax credit | 112,522 | 145,779 | 956,380 | 943,199 | |||
Total tax debit | - | - | (1,136,227) | (1,249,591) | |||
9.2 Tax benefit of merged intangible asset
Refers to the tax benefit calculated on the intangible assets derived from the acquisition of subsidiaries, as shown in the following table, which were merged and are recognized in accordance with the concepts of CVM Instructions No. 319/1999 and No. 349/2001 and ICPC 09 (R2) - Individual Financial Statements, Separate Financial Statements, Consolidated financial statements and Application of the Equity Method. The benefit is being realized in proportion to the tax amortization of the merged intangible assets that originated them as per CPC 27 and CPC 04 (R1) - Clarification of acceptable methods of depreciation and amortization, over the remaining concession period, as shown in note 14.
Consolidated | |||||||
December 31, 2018 | December 31, 2017 | ||||||
Social contribution | Income tax | Social contribution | Income tax | ||||
CPFL Paulista | 41,246 | 114,572 | 45,872 | 127,421 | |||
CPFL Piratininga | 10,180 | 34,938 | 11,215 | 38,491 | |||
RGE | - | - | 21,513 | 88,843 | |||
RGE Sul (RGE) | 45,863 | 153,618 | 26,466 | 73,515 | |||
CPFL Geração | - | 12,061 | - | 13,992 | |||
Total | 97,288 | 315,189 | 105,065 | 342,262 | |||
69
(Free Translation of the original in Portuguese)
Standard Financial Statements – DFP – Date: December 31, 2018 - CPFL Energia S.A.
9.3 Accumulated balances on nondeductible temporary / taxable differences
Consolidated | |||||||||||
December 31, 2018 | December 31, 2017 | ||||||||||
Social contribution | Income tax | PIS/COFINS | Social contribution | Income tax | PIS/COFINS | ||||||
Temporarily nondeductible/taxable differences | |||||||||||
Provision for tax, civil and labor risks | 57,635 | 160,096 | - | 53,687 | 149,130 | - | |||||
Private pension fund | 2,913 | 8,093 | - | 2,331 | 6,476 | - | |||||
Allowance for doubtful accounts | 30,316 | 84,211 | - | 27,354 | 75,985 | - | |||||
Free energy supply | 9,166 | 25,462 | - | 8,382 | 23,284 | - | |||||
Research and development and energy efficiency programs | 27,506 | 76,405 | - | 21,851 | 60,697 | - | |||||
Personnel-related provisions | 5,208 | 14,467 | - | 4,111 | 11,420 | - | |||||
Depreciation rate difference | 4,764 | 13,235 | - | 5,535 | 15,374 | - | |||||
Derivatives | (58,698) | (163,051) | - | (48,848) | (135,690) | - | |||||
Recognition of concession - adjustment of intangible asset (IFRS/CPC) | (6,399) | (17,775) | - | (7,291) | (20,253) | - | |||||
Recognition of concession - adjustment of financial asset (IFRS/CPC) | (148,561) | (410,608) | (7,823) | (117,527) | (324,387) | (7,881) | |||||
Actuarial losses (IFRS/CPC) | 26,001 | 72,223 | - | 25,716 | 71,432 | - | |||||
Financial instruments (IFRS/CPC) | (5,111) | (14,194) | - | (5,291) | (14,694) | - | |||||
Others | (18,834) | (52,471) | (2,263) | (15,803) | (41,815) | (2,662) | |||||
Temporarilynondeductible differences - accumulated | |||||||||||
Property, plant and equipment - adjustment of deemed cost (IFRS/CPC) | (48,806) | (135,572) | - | (51,961) | (144,336) | - | |||||
Actuarial losses (IFRS/CPC) | 58,071 | 161,307 | - | 36,607 | 101,687 | - | |||||
Temporarilynondeductible differences - business combination - CPFL Renováveis | |||||||||||
Deferred taxes - asset: | |||||||||||
Provision for tax, civil and labor risks | 11,620 | 32,277 | - | 13,188 | 36,635 | - | |||||
Fair value of property, plant and equipment (negative value added of assets) | 19,817 | 55,047 | - | 21,294 | 59,150 | - | |||||
Deferred taxes - liability: | |||||||||||
Value added derived from determination of demed cost | (24,690) | (68,584) | - | (26,201) | (72,779) | - | |||||
Intangible asset - exploration right/authorization | (227,199) | (631,106) | - | (246,669) | (685,190) | - | |||||
Other temporary differences | (6,976) | (19,379) | - | (6,145) | (17,071) | - | |||||
Total | (292,257) | (809,917) | (10,086) | (305,677) | (844,947) | (10,543) | |||||
9.4 Expected period of recovery
The expected period of recovery of the deferred tax assets recorded in noncurrent assets derived from temporarily nondeductible / taxable differences and tax benefit of merged intangible assets is based on the average period of realization of each item included in deferred assets, and tax loss carryforwards are based on the projections of future profits, approved by the Board of Directors and reviewed by the Fiscal Council. They are comprised as follows:
Consolidated | |
Expectations of Recovery | |
2019 | 187,256 |
2020 | 245,183 |
2021 | 228,756 |
2022 | 181,577 |
2023 | 222,874 |
2024 to 2026 | 528,714 |
2027 to 2029 | 256,211 |
2030 to 2032 | 37,636 |
2033 to 2035 | 18,234 |
2036 to 2038 | 4,068 |
Total | 1,910,508 |
70
(Free Translation of the original in Portuguese)
Standard Financial Statements – DFP – Date: December 31, 2018 - CPFL Energia S.A.
9.5 Reconciliation of the income tax and social contribution amounts recognized in the statements of profit or loss for 2018 and 2017:
Parent company | |||||||
2018 | 2017 | ||||||
Social contribution | Income tax | Social contribution | Income tax | ||||
Income before taxes | 2,179,615 | 2,179,615 | 1,250,525 | 1,250,525 | |||
Reconciliation to reflect effective rate: | |||||||
Equity in subsidiaries | (2,250,835) | (2,250,835) | (1,349,766) | (1,349,766) | |||
Amortization of intangible asset acquired | (13,528) | - | (13,528) | - | |||
Interest on capital income | 424,892 | 424,892 | 289,783 | 289,783 | |||
Other permanent additions (exclusions), net | 14,840 | 22,449 | 11,319 | 24,757 | |||
Tax base | 354,984 | 376,121 | 188,333 | 215,299 | |||
Statutory rate | 9% | 25% | 9% | 25% | |||
Tax credit/(debit) | (31,949) | (94,030) | (16,950) | (53,825) | |||
Recorded (unrecognizad) tax credit,net | 1,134 | 3,270 | - | - | |||
Total | (30,814) | (90,760) | (16,950) | (53,825) | |||
Current | (22,401) | (65,916) | (10,792) | (34,689) | |||
Deferred | (8,414) | (24,844) | (6,158) | (19,136) | |||
Consolidated | |||||||
2018 | 2017 | ||||||
Social contribution | Income tax | Social contribution | Income tax | ||||
Profit before taxes | 2,939,977 | 2,939,977 | 1,846,670 | 1,846,670 | |||
Reconciliation to reflect effective rate: | |||||||
Equity in subsidiaries | (334,198) | (334,198) | (312,390) | (312,390) | |||
Amortization of intangible asset acquired | 48,649 | 62,756 | 48,649 | 62,756 | |||
Effect of presumed profit system | (242,700) | (289,923) | (198,554) | (237,739) | |||
Adjustment of revenue from excess demand and excess reactive power | 153,302 | 153,302 | 134,778 | 134,778 | |||
Interest on capital income | - | (52,336) | - | (71,340) | |||
Other permanent additions (exclusions), net | 101,581 | 87,162 | 74,015 | 82,631 | |||
Tax base | 2,666,611 | 2,566,740 | 1,593,168 | 1,505,366 | |||
Statutory rate | 9% | 25% | 9% | 25% | |||
Tax credit/(debit) | (239,995) | (641,685) | (143,385) | (376,341) | |||
Recorded (unrecognizad) tax credit,net | 26,323 | 81,375 | (25,342) | (58,559) | |||
Total | (213,673) | (560,310) | (168,728) | (434,901) | |||
Current | (227,464) | (578,381) | (153,543) | (387,076) | |||
Deferred | 13,792 | 18,071 | (15,185) | (47,825) | |||
Amortization of intangible asset acquired– Refers to the permanent nondeductible portion of amortization of intangible assets derived from the acquisition of investees. In the parent company, these amounts are classified in the line item of equity in subsidiaries, in conformity with ICPC 09 (R2) (Note 14).
Recognized (unrecognized) tax credit, net -the recognized tax credit refers to the amount of tax credit on tax loss carryforwards recorded as a result of review of projections of future profits. The unrecognized tax credit refers to losses generated for which currently is not probable that sufficient future taxable profits will be generated to absorb them.
The deferred income tax and social contribution revenue recorded in the statement of profit or loss in the amount of R$ 31,863 refers to (i) income tax and social contribution losses (income of R$ 112,491); (ii) taxbenefit of the merged goodwill (expense of R$ 34,850) and (iii) temporary differences (expense of R$ 45,778).
71
(Free Translation of the original in Portuguese)
Standard Financial Statements – DFP – Date: December 31, 2018 - CPFL Energia S.A.
9.6 Deferred income tax and social contribution recognized directly in equity
The deferred income tax and social contribution recognized directly in equity (other comprehensive income) in 2018 and 2017 were as follows:
Consolidated | |||||||
2018 | 2017 | ||||||
Social Contribution | Income tax | Social Contribution | Income tax | ||||
Actuarial losses (gains) | 313,243 | 313,243 | (166,857) | (166,857) | |||
Limits on the asset ceiling | 6,617 | 6,617 | 21,399 | 21,399 | |||
Basis of calculation | 319,860 | 319,860 | (145,458) | (145,458) | |||
Statutory rate | 9% | 25% | 9% | 25% | |||
Calculated taxes | (28,787) | (79,965) | 13,092 | 36,365 | |||
Limitation on recognition (reversal) of tax credits | 7,325 | 20,347 | - | - | |||
Taxes recognized in other comprehensive income | (21,462) | (59,618) | 13,092 | 36,365 | |||
9.7 Unrecognized tax credits
As of December 31, 2018, the parent company has tax credits on tax loss carryforwards that were not recognized amounting to R$ 82,573 since at present there is no reasonable assurance of the generation of future taxable profits. This amount can be recognized in the future, according to the annual reviews of taxable profit projections.
Some subsidiaries have also income tax and social contribution credits on tax loss carryforwards that were not recognized because currently there is no reasonable assurance that sufficient future taxable profits will be generated to absorb them. At December 31, 2018, the main subsidiaries that have such income tax and social contribution credits are CPFL Renováveis (R$ 794,240),RGE Sul (R$ 127,449), Sul Geradora (R$ 72,673), CPFL Telecom (R$ 32,983), and CPFL Jaguari Geração (R$ 2,473). These tax losses can be carried forward indefinitely.
72
(Free Translation of the original in Portuguese)
Standard Financial Statements – DFP – Date: December 31, 2018 - CPFL Energia S.A.
( 10 ) CONCESSION FINANCIAL ASSET
Distribution | Transmission | Consolidated | |||
At December 31, 2016 | 5,193,511 | 180,333 | 5,373,844 | ||
Current | - | 10,700 | 10,700 | ||
Noncurrent | 5,193,511 | 169,633 | 5,363,144 | ||
Additions | 972,254 | 46,261 | 1,018,515 | ||
Adjustment of expected cash flow | 212,294 | - | 212,294 | ||
Adjustment - financial asset measured at amortized cost | - | 27,807 | 27,807 | ||
Cash inputs - RAP | - | (15,677) | (15,677) | ||
Disposals | (35,039) | - | (35,039) | ||
Business combination | (12,338) | - | (12,338) | ||
At December 31, 2017 | 6,330,681 | 238,723 | 6,569,404 | ||
Current | - | 23,736 | 23,736 | ||
Noncurrent | 6,330,681 | 214,987 | 6,545,668 | ||
Additions | 783,713 | - | 783,713 | ||
Adjustment of expected cash flow | 362,073 | - | 362,073 | ||
Disposals | (46,318) | - | (46,318) | ||
Adption of IFRS 15 / CPC 47 (note 3) | - | (238,723) | (238,723) | ||
At December 31, 2018 | 7,430,149 | - | 7,430,149 | ||
Noncurrent | 7,430,149 | - | 7,430,149 |
The amount refers to the financial asset corresponding to the right established in the concession agreements of the energy distributors to receive cash by compensation upon the return of the assets to the granting authority at the end of the concession, measured at fair value.
According to the current tariff model, the remuneration for this asset is recognized in profit or loss upon billing to consumers and the realization occurs upon receipt of the electric energy bills. Moreover, the difference to adjust the balance at fair value (new replacement value - “VNR” - note 4) is recognized as a balancing item to the operating income account (note 25) in the statement of profit or loss for the year (R$362,073 as of December 31, 2018 and R$212,294 as of December 31, 2017).
73
(Free Translation of the original in Portuguese)
Standard Financial Statements – DFP – Date: December 31, 2018 - CPFL Energia S.A.
( 11 ) OTHER RECEIVABLES
Consolidated | ||||||||
Current | Noncurrent | |||||||
December 31, 2018 | December 31, 2017 | December 31, 2018 | December 31, 2017 | |||||
Advances - Fundação CESP | 3,929 | 7,851 | 6,797 | 6,797 | ||||
Advances to suppliers | 4,031 | 31,981 | - | - | ||||
Pledges, funds and restricted deposits | 77,442 | 159,291 | 524,461 | 621,489 | ||||
Orders in progress | 142,708 | 158,707 | 6,844 | 5,062 | ||||
Services rendered to third parties | 9,281 | 8,530 | - | - | ||||
Energy pre-purchase agreements | - | - | 25,390 | 26,260 | ||||
Prepaid expenses | 172,155 | 80,600 | 6,367 | 20,043 | ||||
GSF renegotiation | 13,701 | 19,629 | 5,782 | 17,359 | ||||
Receivables - CDE | 183,710 | 242,906 | - | - | ||||
Advances to employees | 22,287 | 19,658 | - | - | ||||
Contract asset of transmission | 23,535 | - | 226,117 | - | ||||
Others | 186,923 | 200,724 | 125,681 | 143,183 | ||||
(-) Allowance for doubtful debts (note 6) | (28,698) | (29,379) | - | - | ||||
Total | 811,005 | 900,498 | 927,440 | 840,192 | ||||
Pledges, funds and restricted deposits:refer to guarantees offered for transactions conducted in the CCEE and investments required by the subsidiaries’ loans agreements.
Orders in progress:encompass costs and revenues related to ongoing decommissioning or disposal of intangible assets and the service costs related to expenditure on projects in progress under the Energy Efficiency (“PEE”) and Research and Development programs (“P&D”). Upon the closing of the respective projects, the balances are amortized against the respective liability recognized in Other Payables (note 22).
Energy pre-purchase agreements:refer to prepayments made by subsidiaries, which will be settled with energy to be supplied in the future.
GSF Renegotiation: refers to the GSF premium paid in advance by the subsidiaries Ceran, CPFL Jaguari Geração (Paulista Lajeado) and CPFL Renováveis, related to the transfer of the hydrological risks to the Centralizing Account for Tariff Flag Resources (“CCRBT”), amortized as other operating expenses on a straight-line basis.
Receivables – CDE: refer to:(i) low-income subsidies amounting to R$ 12,536 (R$ 15,930 at December 31, 2017), (ii) other tariff discounts granted to consumers amounting to R$ 170,858 (R$ 224,936 at December 31, 2017), and (iii) tariff discounts – court injunctions amounting to R$ 317 (R$ 2,039 at December 31, 2017)
At 2018, the subsidiaries offset the receivables relating to the CDE account with the payables relating to the Energy Development Account (CDE) (note 22) amounting to R$ 2,875 authorized by Order No. 1,576/2016.
Contract asset of transmission companies:refers to the construction services in progress that will create a right to receive the “Permitted Annual Revenue – RAP” over the concession period as well as an indemnity at the end of the concession of the transmission subsidiaries. (see note 3.2 – transmission subsidiaries)
74
(Free Translation of the original in Portuguese)
Standard Financial Statements – DFP – Date: December 31, 2018 - CPFL Energia S.A.
( 12 ) INVESTMENTS
Parent company | Consolidated | ||||||
December 31, 2018 | December 31, 2017 | December 31, 2018 | December 31, 2017 | ||||
Permanent equity interests - equity method | |||||||
By equity method of the subsidiary | 9,088,049 | 7,804,431 | 970,302 | 990,910 | |||
Advances for future capital increases | 82,395 | 33,340 | - | - | |||
Subtotal | 9,170,444 | 7,837,771 | 970,302 | 990,910 | |||
Fair value of assets, net | 639,640 | 713,848 | 10,060 | 10,640 | |||
Goodwill | 6,054 | 6,054 | - | - | |||
Total | 9,816,139 | 8,557,673 | 980,362 | 1,001,550 | |||
At December 31, 2018, the advance for future capital increase refers to advances mainly to the subsidiaries CPFL Eficiência (R$ 42,200) and CPFL Serviços (R$ 39,900). At December 31, 2017, the advance for future capital increase refers to advances mainly to the subsidiary CPFL Telecom (R$ 33,340).
12.1Permanent equity interests – equity method
The main information on investments in direct permanent equity interests is as follows:
| December 31, 2018 | December 31, 2018 | December 31, 2017 | 2018 | 2017 | |||||||||||||
Investment | Number of shares (thousand) | Total assets | Issued capital |
| Equity | Profit or loss for the year | Share of equity of investees |
| Share of profit (loss) of investees | |||||||||
CPFL Paulista | 880,653 | 9,353,492 | 1,273,423 | 1,910,866 | 649,516 | 1,910,866 | 1,370,403 | 649,516 | 280,354 | |||||||||
CPFL Piratininga | 53,096,770 | 3,910,404 | 240,144 | 516,235 | 182,654 | 516,235 | 461,059 | 182,654 | 152,080 | |||||||||
CPFL Santa Cruz | - | - | - | - | - | - | - | - | 23,447 | |||||||||
CPFL Leste Paulista | - | - | - | - | - | - | - | - | 9,589 | |||||||||
CPFL Sul Paulista | - | - | - | - | - | - | - | - | 10,545 | |||||||||
CPFL Jaguari | 359,058 | 1,203,345 | 170,413 | 392,040 | 81,191 | 392,040 | 340,463 | 81,191 | 11,720 | |||||||||
CPFL Mococa | - | - | - | - | - | - | - | - | 6,999 | |||||||||
RGE | - | - | - | - | 232,731 | - | 1,680,334 | 232,731 | 117,700 | |||||||||
RGE Sul | 1,125 | 9,673,681 | 2,788,106 | 3,692,338 | 300,379 | 3,286,587 | 1,228,317 | 255,854 | 57,305 | |||||||||
CPFL Geração | 205,492,020 | 5,866,850 | 1,043,922 | 2,625,465 | 766,451 | 2,625,465 | 2,354,115 | 766,451 | 594,026 | |||||||||
CPFL Jaguari Geração (*) | 40,108 | 62,176 | 40,108 | 58,656 | 13,592 | 58,656 | 50,970 | 13,592 | 15,709 | |||||||||
CPFL Brasil | 3,000 | 1,357,522 | 3,000 | 72,680 | 91,502 | 72,680 | 96,093 | 91,502 | 94,455 | |||||||||
CPFL Planalto (*) | 630 | 2,810 | 630 | 2,444 | 3,567 | 2,444 | 3,293 | 3,567 | 3,550 | |||||||||
CPFL Serviços | 1,564,844 | 238,414 | 105,105 | 120,929 | (24,076) | 120,929 | 105,105 | (24,076) | (12,863) | |||||||||
CPFL Atende (*) | 13,991 | 28,016 | 13,991 | 19,363 | 9,527 | 19,363 | 19,338 | 9,527 | 7,128 | |||||||||
Nect (*) | 2,059 | 28,796 | 2,059 | 16,558 | 19,087 | 16,558 | 15,515 | 19,087 | 17,392 | |||||||||
CPFL Total (*) | 9,005 | 23,173 | 9,005 | 19,953 | 21,690 | 19,953 | 20,624 | 21,690 | 20,865 | |||||||||
CPFL Jaguariuna (*) | - | - | - | - | - | - | - | - | (8,360) | |||||||||
CPFL Telecom | 119,780 | 6,860 | 1,833 | 5,465 | 4,442 | 5,465 | 2,018 | 4,442 | (14,021) | |||||||||
CPFL Centrais Geradoras | 16,128 | 18,689 | 16,128 | 15,998 | 618 | 15,998 | 16,177 | 618 | 735 | |||||||||
CPFL Participações | 48,164 | 132,152 | 48,164 | - | (11,908) | 85,744 | 55,252 | (11,908) | (2,582) | |||||||||
AUTHI (*) | 10 | 30,772 | 10 | 21,463 | 28,604 | 21,463 | 18,694 | 28,604 | 24,912 | |||||||||
Subtotal - by subsidiary's equity | 9,170,444 | 7,837,770 | 2,325,042 | 1,410,685 | ||||||||||||||
Amortization of fair value adjustment of assets | - | - | (74,207) | (60,918) | ||||||||||||||
Total | 9,170,444 | 7,837,770 | 2,250,835 | 1,349,766 | ||||||||||||||
(*) number of quotas
Fair value adjustments (value added) of net assets acquired in business combinations are classified in the parent’s statement of profit or loss in the group of Investments. In the parent company’s statement of profit or loss, the amortization of the fair value adjustments (value added) of net assets of R$ 74,207 (R$ 60,918 at December 2017) is classified in line item “share of profit (loss) of investees”, in conformity with ICPC 09 (R2).
The movements, in the parent company, of the balances of investments in subsidiaries for years of 2018 and 2017 are as follows:
75
(Free Translation of the original in Portuguese)
Standard Financial Statements – DFP – Date: December 31, 2018 - CPFL Energia S.A.
Investment | Investment at December 31, 2017 | Capital increase | Share of profit (loss) of investees | Share of profit (loss) of investees (OCI) |
| Effects on first adoption of IFRS 9 / CPC 48 |
| Dividend and Interest on capital |
| Advances for future capital increases / Others |
| Corporate restructuring (Note 12.5) |
| Investment at December 31, 2018 | ||||
CPFL Paulista | 1,370,403 | 350,000 | 649,516 | (168,019) | (18,453) | (272,581) | - | - | 1,910,866 | |||||||||
CPFL Piratininga | 461,059 |
| - | 182,654 | (43,507) | (11,996) | (71,975) | - | - | 516,235 | ||||||||
CPFL Santa Cruz | 340,463 | - | 81,191 | 1,376 | (1,556) | (29,433) | - | - | 392,040 | |||||||||
RGE | 1,680,334 | - | 232,731 | (2,135) | (7,148) | - | - | (1,903,782) | - | |||||||||
RGE Sul (RGE) | 1,228,317 | - | 255,854 | 562 | (7,121) | (98,763) | 9 | 1,907,728 | 3,286,587 | |||||||||
CPFL Geração | 2,354,115 | - | 766,451 | (6,220) | - | (490,124) | 1,243 | - | 2,625,465 | |||||||||
CPFL Jaguari Geração | 50,970 | - | 13,592 | - | - | (5,906) | - | - | 58,656 | |||||||||
CPFL Brasil | 96,093 | - | 91,502 | (2,873) | (2,187) | (93,717) | - | (16,138) | 72,680 | |||||||||
CPFL Planalto | 3,293 | - | 3,567 | - | - | (4,417) | - | - | 2,444 | |||||||||
CPFL Serviços | 105,105 | - | (24,076) | - | - | - | 39,900 | - | 120,929 | |||||||||
CPFL Atende | 19,338 | - | 9,527 | - | - | (9,501) | - | - | 19,363 | |||||||||
Nect | 15,515 | - | 19,087 | - | - | (18,044) | - | - | 16,558 | |||||||||
CPFL Total | 20,624 | - | 21,690 | - | - | (22,361) | - | - | 19,953 | |||||||||
CPFL Telecom | 2,018 | 33,360 | 4,442 | - | - | (1,111) | (33,245) | - | 5,465 | |||||||||
CPFL Centrais Geradoras | 16,177 | - | 618 | - | - | (798) | - | - | 15,998 | |||||||||
CPFL Eficiência | 55,252 | - | (11,908) | - | - | - | 42,400 | - | 85,744 | |||||||||
AUTHI | 18,694 | - | 28,604 | - | - | (25,835) | - | - | 21,463 | |||||||||
7,837,770 | 383,360 | 2,325,042 | (220,816) | (48,461) | (1,144,566) | 50,307 | (12,192) | 9,170,444 |
Investment | Investment at of December 31, 2016 | Capital increase /payment of capital | Share of profit (loss) of investees | Share of profit (loss) of investees (OCI) | Dividend and Interest on capital | Advances for future capital increases | Corporate restructuring (Note 12.6) | Investment at of December 31, 2017 | ||||||||
CPFL Paulista | 1,063,400 | - | 280,354 | 95,461 | (68,812) | - | - | 1,370,403 | ||||||||
CPFL Piratininga | 355,755 |
| - | 152,080 | (1,198) | (45,578) | - | - | 461,059 | |||||||
Companhia Luz e Força Santa Cruz | 140,520 | - | 23,447 | - | (15,357) | - | (148,610) | - | ||||||||
CPFL Leste Paulista | 52,853 | - | 9,589 | - | (7,002) | - | (55,439) | - | ||||||||
CPFL Sul Paulista | 58,895 | - | 10,545 | - | (8,244) | - | (61,195) | - | ||||||||
Companhia Jaguari de Energia (CPFL Santa Cruz) | 30,255 | - | 11,720 | - | (2,489) | - | 300,978 | 340,463 | ||||||||
CPFL Mococa | 33,824 | - | 6,999 | - | (5,089) | - | (35,733) | - | ||||||||
RGE | 1,614,320 | - | 117,700 | (1,366) | (50,319) | - | - | 1,680,334 | ||||||||
RGE Sul | - | - | 57,305 | 435 | - | - | 1,170,577 | 1,228,317 | ||||||||
CPFL Geração | 2,158,384 | - | 594,026 | 2,536 | (400,831) | - | - | 2,354,115 | ||||||||
CPFL Jaguari Geração | 45,099 | - | 15,709 | - | (9,837) | - | - | 50,970 | ||||||||
CPFL Brasil | 109,054 | - | 94,455 | 135 | (102,639) | - | (4,911) | 96,093 | ||||||||
CPFL Planalto | 2,101 | - | 3,550 | - | (2,358) | - | - | 3,293 | ||||||||
CPFL Serviços | 97,968 | 76,000 | (12,863) | - | - | (56,000) | - | 105,105 | ||||||||
CPFL Atende | 17,150 | - | 7,128 | - | (4,941) | - | - | 19,338 | ||||||||
Nect | 10,295 | - | 17,392 | - | (12,172) | - | - | 15,515 | ||||||||
CPFL Total | 27,570 | (10,000) | 20,865 | - | (17,811) | - | - | 20,624 | ||||||||
CPFL Jaguariuna | 1,256,161 | 1,299,520 | (8,360) | - | - | (1,299,520) | (1,247,801) | - | ||||||||
CPFL Telecom | (19,302) | 31,000 | (14,021) | - | - | 4,340 | - | 2,018 | ||||||||
CPFL Centrais Geradoras | 15,459 | - | 735 | - | (17) | - | - | 16,177 | ||||||||
CPFL Eficiência | 61,543 | - | (2,582) | - | (3,708) | - | - | 55,252 | ||||||||
Authi | 16,810 | (2,600) | 24,912 | (20,428) | 18,694 | |||||||||||
7,148,112 | 1,393,920 | 1,410,685 | 96,003 | (777,632) | (1,351,180) | (82,135) | 7,837,770 |
In the consolidated, the investment balances refer to interests in joint ventures accounted for using the equity method:
Investments in joint ventures | December 31, 2018 | December 31, 2017 | 2018 | 2017 | ||||
Share of equity | Share of profit (loss) | |||||||
Baesa | 175,189 | 187,654 | 791 | 11,849 | ||||
Enercan | 175,122 | 176,998 | 101,392 | 85,808 | ||||
Chapecoense | 378,558 | 385,870 | 127,250 | 120,651 | ||||
EPASA | 241,433 | 240,388 | 105,343 | 94,663 | ||||
Fair value adjustments of assets,net | 10,060 | 10,640 | (579) | (579) | ||||
980,363 | 1,001,550 | 334,198 | 312,390 | |||||
12.2Fair value adjustments and goodwill
Fair value adjustments refer basically to the right to the concession acquired through business combinations. The goodwill refers basically to acquisitions of investments and is based on projections of future profits.
In the financial statements, these amounts are classified as Intangible Assets (note 14).
76
(Free Translation of the original in Portuguese)
Standard Financial Statements – DFP – Date: December 31, 2018 - CPFL Energia S.A.
12.3Dividends and interest on capital receivable
At December 31, 2018 and 2017, the Company has the following amounts receivable from the subsidiaries below, relating to dividends and interest on capital:
Parent company | |||||||||||
Dividends | Interest on capital | Total | |||||||||
Subsidiary | December 31, 2018 | December 31, 2017 | December 31, 2018 | December 31, 2017 | December 31, 2018 | December 31, 2017 | |||||
CPFL Paulista | 92,596 | 49,798 | 110,214 | - | 202,810 | 49,798 | |||||
CPFL Piratininga | 6,226 | - | 31,708 | - | 37,934 | - | |||||
CPFL Santa Cruz | - | 24,918 | 19,160 | 13,960 | 19,160 | 38,878 | |||||
RGE (*) | - | 50,319 | - | - | - | 50,319 | |||||
RGE Sul | 26,795 | - | 94,312 | - | 121,107 | - | |||||
CPFL Geração | 71,099 | - | 102,436 | - | 173,535 | - | |||||
CPFL Centrais Geradoras | 815 | 17 | - | - | 815 | 17 | |||||
CPFL Jaguari Geração | 3,398 | - | - | - | 3,398 | - | |||||
CPFL Brasil | 111,083 | 20,748 | 2,451 | 2,361 | 113,534 | 23,109 | |||||
CPFL Planalto | - | 888 | - | - | - | 888 | |||||
CPFL Atende | - | 1,003 | 876 | 620 | 876 | 1,623 | |||||
Nect Serviços | - | 4,348 | - | - | - | 4,348 | |||||
CPFL Telecom | 1,111 | - | - | - | 1,111 | - | |||||
CPFL Eficiência | 12,195 | 12,195 | 15,104 | 17,404 | 27,299 | 29,599 | |||||
AUTHI | 151 | 6,228 | - | - | 151 | 6,228 | |||||
325,469 | 170,461 | 376,261 | 34,344 | 701,731 | 204,807 | ||||||
(*)In 12.31.2018 this subsidiary was merged in to RGE SUL
The consolidated balance includes dividends and interest on capital receivable amounting to R$ 100,182 at December 31, 2018 and R$ 56,145 at December 31, 2017 related basically to joint ventures.
After resolutions of the AGMs/EGMs of its subsidiaries, the Company recognized in 2018 R$ 576,247 relating to dividends and interest on capital for 2017. In addition, the subsidiaries declared in 2018 (i) R$ 29,046 relating to interim dividends on the interim results for 2018, (ii) interest on capital on the results for 2018 of R$ 361,158 and (iii) R$ 126,574 relating to minimum mandatory dividend for 2018.
From the amounts recognized as receivables, R$ 596,100 were paid to the Company by subsidiaries in 2018.
12.4Noncontrolling interests and joint ventures
The disclosure of interests in subsidiaries, in accordance with IFRS 12 and CPC 45, is as follows:
77
(Free Translation of the original in Portuguese)
Standard Financial Statements – DFP – Date: December 31, 2018 - CPFL Energia S.A.
12.4.1 Movements in noncontrolling interests
CERAN | CPFL Renováveis | Paulista Lajeado | Total | |||||
At December 31, 2016 | 263,719 | 2,060,963 | 77,966 | 2,402,648 | ||||
Equity Interests and voting capital | 35.00% | 48.40% | 40.07% | |||||
Equity attributable to noncontrolling interests | 37,949 | 13,720 | 11,623 | 63,292 | ||||
Dividends | (92,832) | (16,619) | (8,769) | (118,220) | ||||
Increase (decrease) in capital | (122,806) | 15 | - | (122,791) | ||||
Other movements | - | - | (113) | (113) | ||||
At December 31, 2017 | 86,031 | 2,058,079 | 80,707 | 2,224,816 | ||||
Equity Interests and voting capital | 35.00% | 48.40% | 40.07% | |||||
Equity attributable to noncontrolling interests | 34,731 | 62,470 | 10,754 | 107,955 | ||||
Dividends | (44,314) | (13,511) | (10,860) | (68,685) | ||||
Other movements | - | 5,656 | (108) | 5,548 | ||||
At December 31, 2018 | 76,448 | 2,112,693 | 80,493 | 2,269,634 | ||||
Equity Interests and voting capital | 35.00% | 48.44% | 40.07% |
12.4.2 Summarized financial information on subsidiaries that have noncontrolling interests
The summarized financial information on subsidiaries that have noncontrolling interests at December 31, 2018 and 2017, is as follows:
December 31, 2018 | December 31, 2017 | |||||||||||
| CERAN | CPFL Renováveis | Paulista Lajeado | CERAN | CPFL Renováveis | Paulista Lajeado | ||||||
Current assets | 80,367 | 1,330,819 | 15,499 | 110,566 | 1,623,645 | 48,037 | ||||||
Cash and cash equivalents | 32,729 | 876,571 | 5,687 | 37,043 | 950,215 | 24,086 | ||||||
Noncurrent assets | 799,390 | 10,845,036 | 144,863 | 848,445 | 11,232,357 | 120,677 | ||||||
Current liabilities | 246,482 | 1,396,120 | 33,883 | 198,624 | 1,957,000 | 42,525 | ||||||
Borrowings and debentures | 106,555 | 819,993 | - | 105,844 | 1,259,105 | 36,453 | ||||||
Other financial liabilities | 13,406 | 7,670 | 282 | 12,360 | 7,258 | 264 | ||||||
Noncurrent liabilities | 414,852 | 6,528,563 | 1,033 | 514,583 | 6,760,025 | 258 | ||||||
Borrowings and debentures | 316,581 | 4,738,841 | - | 422,166 | 5,251,704 | - | ||||||
Other financial liabilities | 89,965 | - | - | 83,766 | - | - | ||||||
Equity | 218,423 | 4,251,172 | 125,446 | 245,804 | 4,138,977 | 125,931 | ||||||
Equity attributable to owners of the Company | 218,423 | 4,147,795 | 125,446 | 245,804 | 4,032,448 | 125,931 | ||||||
Equity attributable to noncontrolling interests | - | 103,377 | - | - | 106,529 | - | ||||||
2018 | 2017 | |||||||||||
CERAN | CPFL Renováveis | Paulista Lajeado | CERAN | CPFL Renováveis | Paulista Lajeado | |||||||
Net operating revenue | 333,289 | 1,936,319 | 52,510 | 321,743 | 1,959,084 | 38,278 | ||||||
Operacional costs and expenses | (95,321) | (727,557) | (26,115) | (103,671) | (737,472) | (10,566) | ||||||
Depreciation and amortization | (41,378) | (623,106) | (4) | (45,212) | (617,017) | (4) | ||||||
Interest income | 6,191 | 93,076 | 691 | 30,489 | 126,041 | 2,089 | ||||||
Interest expense | (53,629) | (517,403) | (614) | (40,202) | (648,571) | (4,050) | ||||||
Income tax expense | (48,239) | 37,276 | (3,145) | (54,099) | (74,125) | (2,911) | ||||||
Profit (loss) for the year | 99,230 | 118,805 | 26,838 | 108,427 | 19,645 | 29,006 | ||||||
Attributable to owners of the Company | 99,230 | 109,264 | 26,838 | 108,427 | 11,484 | 29,006 | ||||||
Attributable to noncontrolling interests | - | 9,542 | - | - | 8,162 | - | ||||||
12.4.3 Joint ventures
The summarized financial information on joint ventures at December 31, 2018 and December 31, 2017, is as follows:
78
(Free Translation of the original in Portuguese)
Standard Financial Statements – DFP – Date: December 31, 2018 - CPFL Energia S.A.
December 31, 2018 | December 31, 2017 | |||||||||||||||
Enercan | Baesa | Chapecoense | Epasa | Enercan | Baesa | Chapecoense | Epasa | |||||||||
Current assets | 208,326 | 68,956 | 345,737 | 327,084 | 182,843 | 124,361 | 329,721 | 319,222 | ||||||||
Cash and cash equivalents | 66,519 | 17,425 | 184,002 | 18,269 | 48,695 | 17,873 | 116,425 | 74,741 | ||||||||
Noncurrent assets | 1,033,320 | 966,664 | 2,604,162 | 502,618 | 1,101,291 | 1,030,904 | 2,745,989 | 531,527 | ||||||||
Current liabilities | 385,271 | 50,639 | 424,635 | 152,168 | 291,010 | 121,369 | 426,695 | 157,343 | ||||||||
Borrowings and debentures | 137,225 | - | 138,706 | 34,473 | 140,090 | 63,154 | 138,788 | 34,299 | ||||||||
Other financial liabilities | 5,869 | 34,832 | 74,156 | 1,346 | 4,085 | 17,113 | 67,897 | 993 | ||||||||
Noncurrent liabilities | 496,953 | 284,391 | 1,782,993 | 224,933 | 629,850 | 283,456 | 1,892,407 | 242,765 | ||||||||
Borrowings and debentures | 383,358 | - | 1,045,402 | 151,964 | 510,874 | - | 1,172,181 | 186,373 | ||||||||
Other financial liabilities | 26,936 | 272,079 | 734,630 | - | 25,115 | 265,250 | 716,986 | - | ||||||||
Equity | 359,422 | 700,590 | 742,271 | 452,601 | 363,273 | 750,440 | 756,608 | 450,641 | ||||||||
2018 | 2017 | |||||||||||||||
Enercan | Baesa | Chapecoense | Epasa | Enercan | Baesa | Chapecoense | Epasa | |||||||||
Net operating revenue | 591,875 | 321,142 | 863,861 | 840,005 | 580,430 | 412,329 | 829,525 | 789,402 | ||||||||
Operacional costs and expenses | (188,756) | (214,448) | (191,749) | (562,097) | (273,339) | (265,955) | (186,638) | (518,352) | ||||||||
Depreciation and amortization | (50,051) | (50,609) | (117,858) | (34,525) | (52,773) | (50,621) | (126,811) | (35,640) | ||||||||
Interest income | 4,793 | 4,176 | 15,729 | 5,106 | 32,849 | 4,906 | 24,639 | 6,102 | ||||||||
Interest expense | (46,042) | (53,946) | (191,818) | (17,491) | (31,135) | (27,986) | (183,237) | (26,197) | ||||||||
Income tax and social contribution expenses | (101,484) | (1,229) | (124,284) | (38,740) | (88,229) | (25,442) | (123,307) | (39,892) | ||||||||
Profit (loss) for the year | 208,100 | 3,164 | 249,510 | 197,481 | 176,113 | 47,385 | 236,570 | 177,458 | ||||||||
Equity Interests and voting capital | 48.72% | 25.01% | 51.00% | 53.34% | 48.72% | 25.01% | 51.00% | 53.34% | ||||||||
Even holding more than 50% of the equity interest in Epasa and Chapecoense, the subsidiary CPFL Geração controls these investments jointly with other shareholders. The analysis of the classification of the type of investment is based on the Shareholders' Agreement of each joint venture.
The borrowings from the BNDES obtained by the joint ventures ENERCAN, BAESA and Chapecoense establish restrictions on the payment of dividend to subsidiary CPFL Geração above the minimum mandatory dividend of 25% without the prior consent of the BNDES.
12.4.4 Joint operation
Through its wholly-owned subsidiary CPFL Geração, the Company holds part of the assets of the Serra da Mesa hydropower plant, located on the Tocantins River, in Goias State. The concession and the right to operate the hydropower plant are held by Furnas Centrais Elétricas S.A. In order to maintain these assets operating jointly with Furnas (jointly operation), CPFL Geração was assured 51.54% of the installed power of 1,275 MW (657 MW) and the assured energy of mean 637.5 MW (mean 328.57 MW) until 2028.
12.5 Corporate restructurings in 2017
12.5.1 Merger of CPFL Jaguariúna
At the Extraordinary General Meetings (“EGM”) held on December 15, 2017, approval was given for the merger of CPFL Jaguariúna into RGE Sul. Accordingly, the merged company was wound up and RGE Sul became the successor to its assets, rights and obligations.
At the time of the merger, the concepts of CVM Instructions No. 319/99 and 349/01 were applied, which resulted in the recognition of a goodwill rectifying account, generating a tax credit of R$ 99,981 (note 9). To reassess its investments, the Company and CPFL Brasil recognized, proportionally to its investments in RGE Sul, (i) a reassessed concession intangible asset of R$ 148,487 and R$ 45,594 respectively, totaling R$ 194,081, corresponding to the fair value adjustment of the intangible assets relating to the distribution infrastructure and the right to operate the concession; and (ii) a net adjustment corresponding to the surplus value and decrease in value in the amounts of R$ 66,607 and R$ 20,452, respectively, corresponding to the fair value of the provision for tax, civil and labor risks, decrease in value of consumers, and surplus value of indemnification asset. Both amounts are non-deductible for tax purposes for the Company and for CPFL Brasil.
12.5.2 Grouping of subsidiaries Companhia Luz e Força Santa Cruz, Companhia Leste Paulista de Energia, Companhia Jaguari de Energia, Companhia Sul Paulista de Energia and Companhia Luz e Força de Mococa
On November 21, 2017, ANEEL through Resolution No. 6,723/2017 authorized the grouping of the power distribution companies Companhia Luz e Força Santa Cruz, Companhia Leste Paulista deEnergia, Companhia Jaguari de Energia, Companhia Sul Paulista de Energia and Companhia Luz e Força de Mococa, pursuant to Normative Resolution No, 716/2016 of May 3, 2016.Effective as of January 1, 2018, the operations of these subsidiaries are controlled only by Companhia Jaguari de Energia, which adopted the trade name “CPFL Santa Cruz”. This operation was approved by the EGM held on December 31, 2017 at the grouped companies.
79
(Free Translation of the original in Portuguese)
Standard Financial Statements – DFP – Date: December 31, 2018 - CPFL Energia S.A.
12.6 Corporate restructurings in 2018
12.6.1 Merger of RGE and RGE Sul
On December 4, 2018, through Authorizing Resolution No. 7,499/2018 ANEEL authorized the merger of the electric energy distribution companies RGE and RGE Sul, in accordance with Normative Resolution No. 716/2016 of May 3, 2016. Since January 1, 2019 the operations of these subsidiaries are carried out only by RGE Sul, which adopted the trade name “RGE”. This operation was approved at the Extraordinary General Meeting (“EGM”) held on December 31,2018.
80
(Free Translation of the original in Portuguese)
Standard Financial Statements – DFP – Date: December 31, 2018 - CPFL Energia S.A.
( 13 ) PROPERTY, PLANT AND EQUIPMENT
Consolidated | |||||||||||||||
Land | Reservoirs, dams and water mains | Buildings, construction and improvements | Machinery and equipment | Vehicles | Furniture and fittings | In progress | Total | ||||||||
At December 31, 2016 | 176,145 | 1,394,162 | 1,153,220 | 6,655,391 | 76,217 | 7,562 | 250,302 | 9,712,998 | |||||||
Historical cost | 206,330 | 2,060,191 | 1,652,934 | 9,066,408 | 106,920 | 21,507 | 250,302 | 13,364,592 | |||||||
Accumulated depreciation | (30,185) | (666,028) | (499,714) | (2,411,017) | (30,704) | (13,945) | - | (3,651,594) | |||||||
Additions | - | - | - | 772 | 2,978 | - | 753,137 | 756,887 | |||||||
Disposals | (22) | (132) | (140) | (32,336) | (2,248) | (635) | (8,332) | (43,845) | |||||||
Transfers | 2,950 | 400 | 154,737 | 574,944 | 20,434 | 1,484 | (754,948) | - | |||||||
Transfers from/to other assets - cost | (1,893) | 6,393 | (154,880) | 98,579 | (126) | (330) | 11,033 | (41,224) | |||||||
Depreciation | (8,004) | (79,276) | (59,736) | (431,393) | (18,055) | (1,332) | - | (597,795) | |||||||
Write-off of depreciation | 2 | 124 | 120 | 9,529 | 1,379 | 387 | - | 11,540 | |||||||
Transfers from/to other assets - depreciation | (683) | (2,413) | 1,930 | 9,690 | (8) | 108 | - | 8,624 | |||||||
Business combination | - | - | - | - | (4,800) | - | - | (4,800) | |||||||
Impairment reversal | - | - | (474) | (14,787) | - | - | - | (15,261) | |||||||
At December 31, 2017 | 168,494 | 1,319,257 | 1,094,777 | 6,870,389 | 75,771 | 7,245 | 251,192 | 9,787,125 | |||||||
Historical cost | 207,365 | 2,066,850 | 1,652,178 | 9,693,512 | 122,540 | 22,026 | 251,192 | 14,015,662 | |||||||
Accumulated depreciation | (38,870) | (747,593) | (557,400) | (2,823,123) | (46,769) | (14,782) | - | (4,228,537) | |||||||
Additions | - | - | - | - | - | - | 296,165 | 296,165 | |||||||
Disposals | (8) | - | (7,908) | (16,434) | (3,517) | (31) | (8,478) | (36,376) | |||||||
Transfers | 20,181 | 151,754 | 41,464 | 101,468 | 12,250 | 793 | (327,908) | - | |||||||
Transfers from/to other assets - cost | (2,755) | - | (100,720) | 106,775 | - | 6 | (6,584) | (3,279) | |||||||
Depreciation | (8,082) | (79,237) | (61,540) | (432,524) | (19,402) | (546) | - | (601,329) | |||||||
Write-off of depreciation | 2 | - | - | 8,180 | 2,032 | 44 | - | 10,259 | |||||||
Transfers from/to other assets - depreciation | (994) | - | 20,714 | (22,706) | (2) | - | - | (2,987) | |||||||
Others | - | - | 15 | 645 | - | - | 6,373 | 7,033 | |||||||
At December 31, 2018 | 176,839 | 1,391,775 | 986,800 | 6,615,793 | 67,135 | 7,512 | 210,760 | 9,456,614 | |||||||
Historical cost | 224,783 | 2,218,604 | 1,585,723 | 9,905,396 | 131,549 | 23,039 | 210,760 | 14,299,854 | |||||||
Accumulated depreciation | (47,944) | (826,829) | (598,923) | (3,289,603) | (64,415) | (15,527) | - | (4,843,240) | |||||||
Average depreciation rate 2018 | 3.86% | 3.65% | 3.96% | 4.45% | 13.89% | 3.70% | |||||||||
Average depreciation rate 2017 | 3.86% | 3.93% | 3.69% | 4.53% | 13.09% | 8.31% | |||||||||
81
(Free Translation of the original in Portuguese)
Standard Financial Statements – DFP – Date: December 31, 2018 - CPFL Energia S.A.
The balance of construction in progress, in the consolidated balances, refers mainly to works in progress of operating and/or under development subsidiaries, especially for the projects of CPFL Renováveis, which has construction in progress of R$ 139,614 at December 31, 2018 (R$ 197,305 at December 31, 2017).
In conformity with CPC 20 (R1) and IAS 23, the interest on borrowings taken by subsidiaries to finance the works is capitalized during the construction phase. In the consolidated balances, for the year of 2018 R$ 10,591 were capitalized at the rate of 8.74% p.a. (R$ 29,817 , at the rate of 8.80% p.a., at 2017) (note 28).
In the consolidated balances, the depreciation amounts are recognized in the statement of profit or loss in line item “Depreciation and amortization” (note 27).
At December 31, 2018, the total amount of property, plant and equipment pledged as collateral for borrowings, as mentioned in note 16, is approximately R$ 4,237,048, mainly relating to the subsidiary CPFL Renováveis (R$ 4,183,534).
13.1 Impairment testing
For all the reporting years the Company assesses whether there are indicators of impairment of its assets that would require an impairment test. The assessment was based on external and internal information sources, taking into account fluctuations in interest rates, changes in market conditions and other factors.
In 2017, due to the changes in the Brazilian political, economic and energy scenario, the subsidiary CPFL Renováveis recognized a loss of R$ 15,261 relating to property, plant and equipment of the Bio Baia Formosa and Solar Tanquinho projects. This loss was recognized in the statement of profit or loss in line item “Other operating expenses” (note 27). For 2018, based on the mentioned assessment of any indicators, it was not necessary to set up a provision for impairment. The provision for impairment were based on the assessment of the cash-generating units comprising fixed assets of those subsidiaries which, separately, are not featured as an operating segment (note 29). Additionally, during 2018 and 2017 the Company did not change the form of aggregation of the assets for identification of these cash-generating units.
Fair value was measured by using the cost approach, a valuation technique that reflects the amount that would be required at present to replace the service capacity of an asset (normally referred to as the cost of substitution or replacement). A provision for impairment of assets, when applicable, is recognized owing to the unfavorable scenario for the business of these subsidiaries and is calculated based on their fair values, net of selling expenses.
82
(Free Translation of the original in Portuguese)
Standard Financial Statements – DFP – Date: December 31, 2018 - CPFL Energia S.A.
( 14 ) INTANGIBLE ASSETS AND CONTRACT ASSET IN PROGRESS
14.1. Intangible Assets
Consolidated | |||||||||||||
Goodwill | Concession right | Other intangible assets | Total | ||||||||||
Acquired in business combinations | Distribution infrastructure - operational | Distribution infrastructure - in progress | Public utilities | ||||||||||
At December 31, 2016 | 6,115 | 4,466,516 | 5,550,502 | 666,008 | 27,324 | 59,147 | 10,775,613 | ||||||
Historical cost | 6,152 | 7,602,941 | 11,987,109 | 666,008 | 35,840 | 183,138 | 20,481,188 | ||||||
Accumulated amortization | (37) | (3,136,425) | (6,436,607) | - | (8,516) | (123,990) | (9,705,576) | ||||||
Additions | - | - | - | 1,898,434 | - | 9,344 | 1,907,778 | ||||||
Amortization | - | (286,215) | (639,292) | - | (1,419) | (9,390) | (936,318) | ||||||
Transfer - intangible assets | - | - | 814,643 | (814,643) | - | - | - | ||||||
Transfer - financial asset | - | - | 131 | (972,385) | - | - | (972,254) | ||||||
Disposal and transfer - other assets | - | (16,244) | (91,214) | 48,061 | - | 1,723 | (57,674) | ||||||
Corporate restructuring (Note 12.6.1) | - | (26,766) | (73,215) | - | - | - | (99,981) | ||||||
Impairment | - | (5,129) | - | - | - | (47) | (5,176) | ||||||
Business combination | - | (15,057) | (7,108) | - | - | - | (22,165) | ||||||
At December 31, 2017 | 6,115 | 4,117,105 | 5,554,447 | 825,476 | 25,904 | 60,777 | 10,589,824 | ||||||
Historical cost | 6,152 | 7,558,645 | 11,442,528 | 825,476 | 35,840 | 174,407 | 20,043,048 | ||||||
Accumulated amortization | (37) | (3,441,540) | (5,888,080) | - | (9,936) | (113,630) | (9,453,223) | ||||||
Additions | - | - | - | - | - | 18,670 | 18,670 | ||||||
Amortization | - | (286,858) | (703,511) | - | (1,419) | (8,989) | (1,000,777) | ||||||
Transfer - contract assets - in progress | - | - | 723,813 | - | - | - | 723,813 | ||||||
Transfer - financial asset | - | - | 52,803 | - | - | - | 52,803 | ||||||
Disposal and transfer - other assets | - | (63,187) | (43,419) | - | - | 5,504 | (101,102) | ||||||
| - | - | - | (825,476) | - | - | (825,476) | ||||||
Others | - | 5,130 | - | - | - | 47 | 5,177 | ||||||
At December 31, 2018 | 6,115 | 3,772,188 | 5,584,136 | - | 24,485 | 76,009 | 9,462,935 | ||||||
Historical cost | 6,152 | 7,495,458 | 11,909,149 | - | 35,840 | 217,542 | 19,664,141 | ||||||
Accumulated amortization | (37) | (3,723,270) | (6,325,012) | - | (11,355) | (141,532) | (10,201,206) | ||||||
In the consolidated financial statements the amortization of intangible assets is recognized as follows: (i) “depreciation and amortization” for amortization of distribution infrastructure intangible assets, use of public asset and other intangible assets; and (ii) “amortization of concession intangible asset” for amortization of the intangible asset acquired in business combination (note 27).
In conformity with CPC 20 (R1) and IAS 23, the interest on borrowings taken by subsidiaries for construction financing is capitalized during the construction stage for qualifying assets. In the consolidated, for of the year of 2018, R$ 18,015 were capitalized at a rate of 7.99% p.a.. In 2017, R$ 20,726 were capitalized, at a rate of 8.17% p.a..
14.1.1 Intangible asset acquired in business combinations
The breakdown of the intangible asset related to the right to operate the concessions acquired in business combinations is as follows:
83
(Free Translation of the original in Portuguese)
Standard Financial Statements – DFP – Date: December 31, 2018 - CPFL Energia S.A.
Consolidated | |||||||||||
December 31, 2018 | December 31, 2017 | Annual amortization rate | |||||||||
Historic cost | Accumulated amortization | Net value | Net value | 2018 | 2017 | ||||||
Intangible asset - acquired in business combinations | |||||||||||
Intangible asset acquired, not subsumed | |||||||||||
CPFL Paulista | 304,861 | (216,988) | 87,873 | 97,858 | 3.28% | 3.28% | |||||
CPFL Piratininga | 39,065 | (26,335) | 12,730 | 14,025 | 3.32% | 3.31% | |||||
RGE | - | - | - | 1,752 | - | 4.70% | |||||
RGE Sul (RGE) | 3,768 | (2,193) | 1,575 | - | 4.70% | - | |||||
CPFL Geração | 54,555 | (37,333) | 17,221 | 19,067 | 3.38% | 3.38% | |||||
CPFL Jaguari Geração | 7,896 | (4,121) | 3,775 | 4,044 | 3.41% | 3.41% | |||||
CPFL Renováveis | 3,653,906 | (1,051,284) | 2,602,622 | 2,818,331 | 5.90% | 4.16% | |||||
Subtotal | 4,064,052 | (1,338,255) | 2,725,797 | 2,955,077 | |||||||
Intangible asset acquired and subsumed | |||||||||||
RGE | - | - | - | 234,297 | - | 2.11% | |||||
RGE Sul (RGE) | 1,433,007 | (971,212) | 461,795 | 279,553 | 3.63% | 9.09% | |||||
CPFL Geração | 426,450 | (333,430) | 93,020 | 102,987 | 2.34% | 2.34% | |||||
Subtotal | 1,859,457 | (1,304,642) | 554,816 | 616,837 | |||||||
Intangible asset acquired and merged – reassembled | |||||||||||
CPFL Paulista | 1,074,026 | (786,870) | 287,156 | 319,360 | 3.00% | 3.00% | |||||
CPFL Piratininga | 115,762 | (78,039) | 37,723 | 41,560 | 3.31% | 3.31% | |||||
RGE | - | - | - | 125,785 | - | 4.09% | |||||
CPFL Jaguari Geração | 15,275 | (8,837) | 6,438 | 6,898 | 3.01% | 3.01% | |||||
RGE Sul (RGE) | 366,887 | (206,630) | 160,256 | 51,588 | 4.67% | 9.09% | |||||
Subtotal | 1,571,949 | (1,080,375) | 491,574 | 545,191 | |||||||
Total | 7,495,458 | (3,723,270) | 3,772,187 | 4,117,105 | |||||||
The intangible asset acquired in business combinations is related to the right to operate the concessions and comprises:
- Intangible asset acquired, not subsumed
Refers basically to the intangible asset from acquisition of the shares held by noncontrolling interests prior to adoption of CPC 15 and IFRS 3.
- Intangible asset acquired and subsumed
Refers to the intangible asset from the acquisition of subsidiaries that were incorporated into the respective equity, without application of CVM legal instructions No. 319/1999 and No. 349/2001, that is, without segregation of the related tax benefit installment amount.
- Intangible asset acquired and merged – reassembled
In order to comply with ANEEL requirements and avoid the amortization of the intangible asset resulting from the merger of parent company causing a negative impact on dividend paid to noncontrolling interests, the subsidiaries applied the concepts of CVM legal instructions No. 319/1999 and No. 349/2001 to the intangible asset. A reserve was therefore recognized to adjust the intangible, against a special goodwill reserve on the merger of equity in each subsidiary, so that the effect of the transaction on the equity reflects the tax benefit of the merged intangible asset. These changes affected the Company's investment in subsidiaries, and in order to adjust this, a nondeductible intangible asset was recognized for tax purposes.
14.2. Impairment testing
For all the reporting years the Company assesses whether there are indicators of impairment of its assets that would require an impairment test. The assessment was based on external and internal information sources, taking into account fluctuations in interest rates, changes in market conditions and other factors.
84
(Free Translation of the original in Portuguese)
Standard Financial Statements – DFP – Date: December 31, 2018 - CPFL Energia S.A.
In 2017, the subsidiary CPFL Renováveis recognized a loss of R$ 5,176, relating to intangible assets acquired in the business combination of the Pedra Cheirosa I and Bio Formosa projects.For2018, based on the mentioned assessment of any indicators, it was not necessary to set up a provision for impairment.
The provision for impairment were based on the assessment of the cash-generating units comprising intangible assets of those subsidiaries which, separately, are not featured as an operating segment (note 29). Additionally, during 2018 and 2017 the Company did not change the form of aggregation of the assets for identification of these cash-generating units.
Fair value was measured by using the cost approach, a valuation technique that reflects the amount that would be required at present to replace the service capacity of an asset (normally referred to as the cost of substitution or replacement). A provision for impairment of assets was recognized owing to the unfavorable scenario for the business of these subsidiaries and it was calculated based on their fair values, net of selling expenses.
14.3Contract asset - in progress
Accordingly with IFRS 15 / CPC 47, concession infrastructure assets of the distribution companies during the construction period, previously recorded as intangible in progress, must be classified as contract assets (note 3).
Consolidated | |
At December 31, 2017 | - |
Adoption of IFRS 15 / CPC 47 (note 3) | 825,476 |
Additions | 1,787,588 |
Transfer - intangible assets | (723,813) |
Transfer - financial asset | (836,516) |
Disposal and transfer - other assets | (6,303) |
At December 31, 2018 | 1,046,433 |
Noncurrent | 1,046,433 |
( 15 ) TRADE PAYABLES
| Consolidated | |||
December 31, 2018 | December 31, 2017 | |||
Current | ||||
System service charges | 62,674 | 413 | ||
Energy purchased | 1,607,116 | 2,248,748 | ||
Electricity network usage charges | 205,656 | 252,170 | ||
Materials and services | 368,344 | 650,538 | ||
Free energy | 154,296 | 145,002 | ||
Total | 2,398,085 | 3,296,870 | ||
Noncurrent | ||||
Energy purchased | 333,036 | 128,438 | ||
( 16 ) BORROWINGS
The movements in borrowings are as follows:
85
(Free Translation of the original in Portuguese)
Standard Financial Statements – DFP – Date: December 31, 2018 - CPFL Energia S.A.
Consolidated | ||||||||||||||
At December 31, 2017 | Raised | Repayment | Interest, inflation adjustment and mark to market | Exchange rates | Interest paid | At December 31, 2018 | ||||||||
Measured at cost | ||||||||||||||
Local currency | ||||||||||||||
Fixed Rate | 900,257 | 166,404 | (173,528) | 53,283 | - | (53,641) | 892,776 | |||||||
Post Fixed Rate | ||||||||||||||
TJLP and TLP | 3,449,468 | 1,315,898 | (442,504) | 288,171 | - | (262,744) | 4,348,289 | |||||||
Selic | 140,099 | - | (33,875) | 11,251 | - | (3,358) | 114,117 | |||||||
CDI | 1,541,278 | 23,359 | (1,112,713) | 72,957 | - | (138,609) | 386,272 | |||||||
IGP-M | 57,291 | - | (10,511) | 9,788 | - | (4,679) | 51,889 | |||||||
UMBNDES | 2,293 | - | (500) | 515 | - | (156) | 2,152 | |||||||
Others | 74,740 | 32,418 | (45,807) | 6,477 | - | (1,426) | 66,403 | |||||||
Total at cost | 6,165,427 | 1,538,079 | (1,819,438) | 442,442 | - | (464,613) | 5,861,896 | |||||||
Borrowing costs * | (31,816) | (35,984) | - | 10,607 | - | - | (57,193) | |||||||
Measured at fair value | ||||||||||||||
Foreign currency | ||||||||||||||
Dollar | 4,698,184 | 2,666,880 | (3,289,857) | 170,383 | 774,483 | (164,965) | 4,855,108 | |||||||
Euro | 218,814 | 879,500 | (215,824) | 3,348 | (1,873) | (4,466) | 879,499 | |||||||
Mark to market | (58,552) | - | - | (44,799) | - | - | (103,351) | |||||||
Total at fair value | 4,858,446 | 3,546,380 | (3,505,681) | 128,932 | 772,610 | (169,431) | 5,631,255 | |||||||
Total | 10,992,057 | 5,048,475 | (5,325,119) | 581,980 | 772,610 | (634,044) | 11,435,958 | |||||||
Current | 3,589,607 | 2,446,113 | ||||||||||||
Noncurrent | 7,402,450 | 8,989,846 | ||||||||||||
(*) In accordance with CPC 48/IFRS 9, this refers to borrowing costs directly attributable to the issuance of the respective debts.
The detail on borrowings are as follows:
86
(Free Translation of the original in Portuguese)
Standard Financial Statements – DFP – Date: December 31, 2018 - CPFL Energia S.A.
Consolidated | ||||||||||
Category | Annual interest | December 31, 2018 | December 31, 2017 | Maturity range | Collateral | |||||
Measured at cost - Local Currency | ||||||||||
Pre fixed | ||||||||||
FINEM | Fixed rate de 2.5% to 8% | (a) | 418,336 | 546,504 | 2011 to 2024 | (i) CPFL Energia and State Grid Brazil Power guarantee (ii) Receivables; (iii) Pledge of shares of CPFL Renováveis and SPE; (iv) Pledge of emergents rights authorized by ANEEL; iv) Lines of creditor rights and related revenues. | ||||
FINAME | Fixed rate de 2.5% to 10% | (a) | 48,672 | 71,780 | 2012 to 2025 | (i) Liens on equipment (ii) Liens on revenues; (iii) Guarantee of CPFL Energia (iv) Liens on assets | ||||
FINEP | Fixed rate from 3.5% to 8% | 6,576 | 10,482 | 2013 to 2021 | Bank guarantee | |||||
Bank loans | Fixed rate of 9.5% to 10.14% and discount for timely payment of 15% and 25% | 419,191 | 271,492 | 2009 to 2037 | (i) Liens on emergents rights; (ii) Liens on equipment and receivables (ii) Pledge of revenues (iv) Bank guaranteee (v) CPFL Renovaveis guarantee | |||||
892,776 | 900,257 | |||||||||
Post Fixed | ||||||||||
TJLP and TLP | ||||||||||
FINEM | TJLP and TJLP + from 1.72% to 3.4% | (b) | 3,128,625 | 3,406,017 | 2009 to 2033 | (i) Bank guarantee (ii) CPFL Energia guarantee (iii) Pledge of receivables, equipment and assignment of credit and concession rights authorized by ANEEL and shares os SPE (iv) Liens on equipment and receivables (v) guarantee of Bioenergia S.A., CPFL Renováveis, CPFL Energia and State Grid Brazil Power | ||||
FINEM | TLP + 4.74% to 4.80% | (b) | 1,190,169 | - | 2027 to 2028 | CPFL Energia guarantee and receivables | ||||
FINAME | TJLP + 2.2% to 4.2% | (b) | 20,935 | 23,181 | 2017 to 2027 | (i) CPFL Energia guarantee (ii) Liens on equipment and receivables | ||||
FINEP | TJLP and TJLP -1% | 3,491 | 13,997 | 2016 to 2024 | Bank guarantee | |||||
Bank loans | TJLP + 2.99% to 3.1% | 5,069 | 6,273 | 2005 to 2023 | (i) Pledge of receivables, equipment and assignment of credit and concession rights (ii) CPFL Energia guarantee | |||||
4,348,289 | 3,449,468 | |||||||||
SELIC | ||||||||||
FINEM | SELIC + 2.19% to 2.66% | (c) | 108,752 | 134,260 | 2015 to 2022 | (i)State Grid Brazil Power and CPFL Energia guarantee and receivables (ii) CPFL Energia guarantee | ||||
FINAME | SELIC + 2.70% to 3.90% | 5,365 | 5,840 | 2016 to 2022 | CPFL Energia guarantee and liens on equipment and receivables | |||||
114,117 | 140,099 | |||||||||
CDI | ||||||||||
Bank loans | (i) From 100.00% to 109.50% of CDI | (c) | 208,384 | 885,715 | 2012 to 2024 | (i) CPFL Energia and CPFL Renováveis guarantee (ii) CPFL Renováveis promissory note (iii) CPFL Energia guarantee | ||||
Bank loans | (i) 104% of CDI | 177,888 | 443,035 | 2017 to 2023 | No guarantee | |||||
Promissory note | (i) 105% of CDI | - | 110,523 | 2018 | CPFL Energia and CPFL Renováveis guarantee | |||||
Promissory note | CDI + 3.80% | - | 102,006 | 2017 to 2018 | No guarantee | |||||
386,272 |
| 1,541,278 | ||||||||
IGPM | ||||||||||
Bank loans | IGPM + 8.63% | 51,889 | 57,291 | 2011 to 2024 | (i) Liens on equipment and receivables (ii) Pledge of shares of SPE and rights authorized by ANEEL and receivables of operation contracts | |||||
UMBNDES | ||||||||||
Bank loans | UMBNDES + from 1.99% to 5% | 2,152 | 2,293 | 2006 to 2023 | (i) Pledge of shares, credit rights and assignment of credit and concession rights and incomes assignment (ii) CPFL Guarantee | |||||
Other | ||||||||||
Other | 66,403 | 74,740 | 2007 to 2038 | (i) Promissory notes, (ii) Bank guarantee, (iii) Credit RIghts ; (iv) Pledge of shares; (v) Liens on machinery, equipment and receivables and (vi) CPFL Renováveis guarantee | ||||||
Total - Local currency | 5,861,896 | 6,165,427 | ||||||||
Borrowing costs (*) | (57,193) | (31,816) | ||||||||
Measured at fair value - Foreing Currency | ||||||||||
Dollar | ||||||||||
Bank loans (Law 4.131) | US$ + Libor 3 months + from 0.80% to 3% | - | 2,879,241 | 2017 to 2022 | CPFL Energia guarantee and promissory notes | |||||
Bank loans (Law 4.131) | US$ + Libor 3 months + from 0.8% to 1.55% | (c) | 1,866,418 | 704,572 | 2017 to 2022 | CPFL Energia guarantee and promissory notes | ||||
Bank loans (Law 4.131) | US$ +from 1.93% to 4.32% | 2,988,689 | 1,114,370 | 2017 to 2021 | CPFL Energia guarantee and promissory notes | |||||
4,855,108 | 4,698,184 | |||||||||
Euro | ||||||||||
Bank loans (Law 4.131) | Euro + from 0.42% to 0.96% | 879,499 | 218,814 | 2019 to 2021 | CPFL Energia guarantee and promissory notes | |||||
Mark to market | (103,351) | (58,552) | ||||||||
Total in foreign currency | 5,631,255 | 4,858,446 | ||||||||
Total | 11,435,958 | 10,992,057 | ||||||||
(*) In accordance with CPC 48/IFRS 9, this refers to borrowing costs directly attributable to the issuance of the respective debts., measured at cost. | ||||||||||
The subsidiaries hold swaps converting the operating cost of currency variation to interest tax variation in reais.For further information about the considered rates, see note 33. | ||||||||||
Effective rate: | ||||||||||
(a) 30% to 70% of CDI | (b) 60% to 110% of CDI | (c) 100% to 130% of CDI | ||||||||
87
(Free Translation of the original in Portuguese)
Standard Financial Statements – DFP – Date: December 31, 2018 - CPFL Energia S.A.
As segregated in the tables above, in conformity with CPC 48 and IFRS 9, the Group classified their debts as (i) financial liabilities measured at amortized cost, and (ii) financial liabilities measured at fair value through profit or loss.
The objective of the classification as financial liabilities of borrowings measured at fair value is to reduce the effects of the recognition of gains and losses derived from fair valuing debt-related derivatives in order to reduce the accounting mismatch. At December 31, 2018, the balance of the borrowings measured at fair value was R$ 5,631,255 (R$ 4,858,445 at December 31, 2017).
Changes in the fair values of these borrowings are recognized in the finance income / expense of the Group, except for the component of credit risk calculation, which is recorded in other comprehensive income. At December 31, 2018, the accumulated gains of R$ 103,351 (R$ 58,552 at December 31, 2017) on marking the borrowings to market, offset by the losses of R$ 65,678 (losses of R$ 51,145 at December 31, 2017) of marking to market the derivative financial instruments contracted as a hedge against foreign exchange variations (note 33), resulted in a total net gain of R$ 37,673 (R$ 7,407 at December 31, 2017).
The maturities of the principal of borrowings recorded in noncurrent liabilities are scheduled as follows:
Maturity | Consolidated |
2020 | 1,397,666 |
2021 | 1,669,749 |
2022 | 2,402,921 |
2023 | 844,340 |
2024 | 606,929 |
2025 to 2029 | 1,607,254 |
2030 to 2034 | 435,200 |
2035 to 2039 | 105,994 |
2040 to 2044 | 5,617 |
Subtotal | 9,075,670 |
Mark to market | (85,824) |
Total | 8,989,846 |
The main indexes used for adjusting borrowings for inflation and the indebtedness profile in local and foreign currency, already considering the effects of the derivative instruments, are as follows:
Consolidated | |||||||
Accumulated variation % p.a. | % of debt | ||||||
Index | 2018 | 2017 | December 31, 2018 | December 31, 2017 | |||
IGP-M | 7.54 | (0.52) | 0.45 | 0.52 | |||
TJLP and TLP | 6.72 and 7.42 | 7.00 | 38.02 | 31.38 | |||
CDI | 6.40 | 6.89 | 52.62 | 59.49 | |||
Others | 8.90 | 8.60 | |||||
100.00 | 100.00 | ||||||
88
(Free Translation of the original in Portuguese)
Standard Financial Statements – DFP – Date: December 31, 2018 - CPFL Energia S.A.
Main additions in the year:
R$ thousand |
| |||||||||
Category | Total approved | Released in 2018 | Released net of fundraising costs | Interest payment | Utilization | |||||
Local Currency | ||||||||||
Pre fixed | ||||||||||
Bank Loan | 170,152 | 166,404 | 164,601 | Montlhy | Subsidiary's investment plan | |||||
Post Fixed | ||||||||||
CDI | ||||||||||
Bank Loan (a) | 16,000 | 16,000 | 16,000 | Bullet | Working Capital | |||||
Bank Loan (a) | 7,360 | 7,360 | 7,360 | Semiannually | Working Capital | |||||
TJLP and TLP | ||||||||||
FINEM | 209,510 | 125,515 | 124,130 | Montlhy | Subsidiary's investment plan | |||||
FINEM | 2,608,634 | 1,190,000 | 1,161,994 | Montlhy | Subsidiary's investment plan | |||||
FINAME (a) | 79,331 | 384 | 384 | Quarterly | Working Capital | |||||
Other | ||||||||||
Bank Loan | 39,054 | 32,418 | 30,903 | Montlhy | Subsidiary's investment plan | |||||
Foreing Currency | ||||||||||
Dólar | ||||||||||
Bank Loan (Law 4.131) | 2,666,880 | 2,666,880 | 2,666,880 | Quarterly | Working Capital | |||||
Euro | ||||||||||
Bank Loan (Law 4.131) | 879,500 | 879,500 | 879,500 | Quarterly | Working Capital | |||||
6,676,421 | 5,084,461 | 5,051,752 | ||||||||
(a) There is no restrictive financial covenant.
Prepayment:
In 2018, R$ 2,202,406 were settled in advance relating to borrowings with original maturities to June 2024.
Covenants
Borrowings raised by Group companies require the compliance with certain restrictive financial clauses, under penalty of restriction in the distribution of dividends and/or advance maturity of the related debts. Furthermore, failure to comply with the obligations or restrictions mentioned may result in default in relation to other contractual obligations (cross default), depending on each borrowing agreement.
The calculations are made on an annual or semiannual basis, as appropriate. As the maximum and minimum ratios vary among the contracts, we present below the most critical parameters of each ratio, considering all contracts in effect at December 31, 2018.
Ratios required for the individual financial statements of the subsidiaries CPFL Paulista, CPFL Piratininga, CPFL Santa Cruz and RGE:
· Debt indebtedness divided by EBITDA maximum between 3.50 and 3.75 and
· Debt indebtedness divided by the sum of Equity and Debt indebtedness maximum of 0.9.
Ratios required for the individual financial statements of subsidiaries of CPFL Renováveis owners of the contract:
· Debt Service Coverage Ratio (DCSR) minimum between 1 and 1.3.
· Company capitalization ratio minimum between 25% and 39.5%.
· General Indebtedness Ratio maximum of 80%.
Ratios required for the consolidated statements of CPFL Renováveis
· Debt indebtedness divided by EBITDA maximum of 3.75 and
· Net Debt divided by the sum of Equity and Net Debt maximum of 0.55.
89
(Free Translation of the original in Portuguese)
Standard Financial Statements – DFP – Date: December 31, 2018 - CPFL Energia S.A.
Ratios required for the consolidated financial statements of CPFL Energia
· Debt indebtedness divided by EBITDA maximum of 3.75 and
· Debt indebtedness divided by the sum of Equity and Debt indebtedness maximum of 0,72.
· EBITDA divided by the finance income/expense results minimum of 2.25.
Ratio required in the consolidated financial statements of State Grid Brazil Power Participações S.A.
· Equity divided by Total Assets (disregarding the effects of IFRIC 12/OCPC 01) minimum of to 0.3.
For purposes of determining covenants, the definition of EBITDA at the Company takes into consideration mainly the consolidation of subsidiaries, associates and joint ventures based on the Company’s direct or indirect interests in those companies (for both EBITDA and assets and liabilities).
In 2018, CPFL Renováveis obtained from BNDES a waiver from the acceleration of maturity for non-compliance with the DCSR in the financial statements of its subsidiary Bio Ester and with the financial ratios DCSR, Debt indebtedness divided by EBITDA and Equity divided by the sum of Equity and Debt indebtedness in the financial statements of its subsidiaries Bio Coopcana and Bio Alvorada. On the same occasion CPFL Renovavéis also obtained a waiver from the requirement of compliance with the mentioned ratios as from 2019.
In 2018, the subsidiary CPFL Piratininga obtained from BNDES and onlending banks authorization for waiver from the obligation to comply with the financial ratio Net Debt to EBITDA contained in the financing agreements for the year ended December 31, 2018.
The Group’s management monitors these ratios on a systematic and constant basis, so that all conditions are met.The Group’s management believes that all covenants and financial and non-financial clauses whose indicators are properly complied at December 31, 2018, except by the mentioned above about the non direct subsidiary CPFL Renováveisfor which the holding had the proper approvals from the finance institutions.
( 17 ) DEBENTURES
The movements in debentures are as follows:
Consolidated | ||||||||||||
At December 31, 2017 | Raised | Repayment | Interest, inflation adjustment and market to mark | Exchange rates | At December 31, 2018 | |||||||
Category | ||||||||||||
Measured at cost - Post fixed | ||||||||||||
TJLP | 495,408 | - | (46,768) | 37,539 | (5,080) | 481,099 | ||||||
CDI | 7,446,556 | 4,163,000 | (4,832,370) | 592,746 | (652,185) | 6,717,747 | ||||||
IPCA | 1,311,432 | - | - | 118,026 | (62,030) | 1,367,428 | ||||||
Total at cost | 9,253,396 | 4,163,000 | (4,879,138) | 748,311 | (719,295) | 8,566,274 | ||||||
Borrowing costs (*) | (76,870) | (17,261) | - | 34,334 | - | (59,796) | ||||||
Measured at fair value - Post fixed | ||||||||||||
IPCA | - | 416,600 | - | 10,389 | - | 426,989 | ||||||
Mark to market | - | - | - | 7,378 | - | 7,378 | ||||||
Total at fair value | - | 416,600 | - | 17,767 | - | 434,367 | ||||||
Total | 9,176,527 | 4,562,339 | (4,879,138) | 800,412 | (719,295) | 8,940,845 | ||||||
Current | 1,703,073 | 917,352 | ||||||||||
Noncurrent | 7,473,454 | 8,023,493 | ||||||||||
(*) In accordance with CPC 48/IFRS 9, this refers to borrowing costs directly attributable to the issuance of the respective debts.
The detail on debentures are as follows :
90
(Free Translation of the original in Portuguese)
Standard Financial Statements – DFP – Date: December 31, 2018 - CPFL Energia S.A.
Consolidated | ||||||||||
Category | Annual Interest | December 31, 2018 | December 31, 2017 | Maturity range | Collateral | |||||
Measured at cost - Post fixed | ||||||||||
TJLP | TJLP + 1% | (d) | 481,099 | 495,408 | 2009 to 2029 | Liens | ||||
CDI | (i) From 105.75% to 129.5% of CDI | (a) | 5,858,319 | 6,727,437 | 2015 to 2024 | (i) CPFL Energia and CPFL-R guarantee (ii) Guarantee of CPFL Energia | (iii) Fiduciary assignment of PCH Holding dividends | ||||
From 107.75% to 114.50% of CDI | (a) | 859,428 | 719,119 | 2018 to 2022 | No guarantee | |||||
IPCA | IPCA + from 4.42% to 5.86% | (b) (c) | 1,367,428 | 1,311,432 | 2019 to 2027 | CPFL Energia guarantee | ||||
8,566,274 | 9,253,396 | |||||||||
Borrowing costs (*) | (59,796) | (76,870) | ||||||||
Measured at fair value - Post fixed | ||||||||||
IPCA | IPCA + 5.80% | (b) | 426,989 | - | 2024 to 2026 | CPFL Energia guarantee | ||||
Mark to market | 7,378 | - | ||||||||
434,367 | - | |||||||||
Total consolidated | 8,940,845 | 9,176,526 | ||||||||
Some debentures hold swaps converting IPCA variation to CDI variation.For further information about the considered rates, see note 33. | ||||||||||
Effective rates: | ||||||||||
(a)From 105.4% to 144.6% of CDI | CDI + from 0.75% to 4.76% | ||||||||||
(b) IPCA + 4,42% to 6,31% | ||||||||||
(c) From 101.74% to 103.3% of CDI | ||||||||||
(d) TJLP + 3.48% | ||||||||||
As shown in the table above, the Company, in compliance with CPC 48/IFRS 9, classified its debentures as (i) financial liabilities measured at amortized cost; and (ii) financial liabilities measured at fair value through profit or loss.
The classification of debentures measured at fair value as financial liabilities is aimed at matching the effects of the recognition of revenues and expenses derived from the mark-to-market of hedging derivatives linked to such debentures, in order to obtain a more relevant and consistent accounting information. As at December 31, 2018, the balance of debentures designated at fair value totaled R$ 434,367.
The changes in the fair values of these debentures are recognized in the Company’s finance income (costs), except for the component of credit risk calculation, which is recognized in other comprehensive income. As at December 31, 2018, the accumulated losses obtained from the mark-to-market of such debentures amounted to R$ 7,378 which, offset by the gains obtained from the mark-to-market of the derivative instruments of R$ 21,012, undertaken to hedge the interest rate changes (note 33), generated a total gain of R$ 13,634.
The maturities of the principal of debentures recognized in noncurrent liabilities are as follows:
Maturity | Consolidated | |
2020 | 303,327 | |
2021 | 3,578,382 | |
2022 | 1,571,891 | |
2023 | 1,055,538 | |
2024 | 819,690 | |
2025 to 2029 | 577,107 | |
2030 to 2034 | 110,180 | |
Subtotal | 8,016,115 | |
Mark to market | 7,378 | |
Total | 8,023,493 |
91
(Free Translation of the original in Portuguese)
Standard Financial Statements – DFP – Date: December 31, 2018 - CPFL Energia S.A.
Main additions in the year:
The amounts obtained from the main additions were used in the investment plan, refinancing of debts and improvement of working capital of subsidiaries and the payment of interest is semiannual.
R$ thousand | ||||||||
Category | Issue | Quantity issued | Released in 2018 | Released net of fundraising costs | ||||
Post Fixed | ||||||||
CDI | ||||||||
CPFL Paulista | 9th issue | 1,380,000 | 1,380,000 | 1,379,022 | ||||
CPFL Piratininga | 9th issue | 215,000 | 215,000 | 214,739 | ||||
CPFL Brasil | 4th issue | 115,000 | 115,000 | 114,848 | ||||
CPFL Santa Cruz | 2nd issue | 190,000 | 190,000 | 189,737 | ||||
RGE | 9th issue | 220,000 | 220,000 | 219,733 | ||||
RGE Sul | 6th issue | 520,000 | 300,000 | 299,677 | ||||
CPFL Geração | 10th issue | 190,000 | 190,000 | 189,838 | ||||
CPFL Geração | 11th issue | 1,400,000 | 1,400,000 | 1,397,949 | ||||
CPFL Renováveis | 8th issue | 153,000 | 153,000 | 151,245 | ||||
IPCA | ||||||||
CPFL Piratininga | 10th issue | 197,000 | 197,000 | 191,764 | ||||
RGE Sul | 7th issue | 219,600 | 219,600 | 213,787 | ||||
4,579,600 | 4,562,339 | |||||||
Pre-payment
At 2018, R$3,247,401 of debenture were paid in advance, whose due dates were from April 2019 to September 2021.
RESTRICTIVE COVENANTS
The debentures issued by the Group companies require the compliance with certain financial covenants.
The calculations are made on an annual or semiannual basis, as appropriate. As the maximum and minimum ratios vary among the contracts, we present below the most critical parameters of each ratio, considering all contracts in effect at December 31, 2018.
Ratios required in the individual financial statements of the subsidiaries of CPFL Renováveis, issuers of debentures:
· Debt Service Coverage Ratio (DSCR) minimum of 1.2.
· Net Debt divided by Dividends Received maximum 3.5.
Ratios required in the consolidated financial statements of CPFL Renováveis for debentures issued by CPFL Renováveis and its subsidiaries
· Debt indebtness divided by EBITDA maximum of 4.0.
· EBITDA divided by Finance Income (Costs) minimum of 1.75.
Ratios required in the consolidated financial statements of CPFL Energia
· Net indebtness divided by EBITDA maximum between 3 and 3.75.
· EBITDA divided by Finance Income (Costs) minimum of 2.25.
92
(Free Translation of the original in Portuguese)
Standard Financial Statements – DFP – Date: December 31, 2018 - CPFL Energia S.A.
On June 19, 2018, CPFL Renováveis obtained from debenture holders a waiver from the requirement of compliance with the Debt Service Coverage Ratio and the Debt Service Coverage Ratio of the Transaction related to the 1st issue of debentures of CPFL Renováveis.
The Group’s management monitors these ratios on a systematic and constant basis, so that all conditions are met. The Group’s management believes that all covenants and financial clauses are properly compliedat December 31, 2018, except by the mentioned above about the non direct subsidiary CPFL Renováve is for which the holding had the proper approvals from the finance institutions.
(18 ) PRIVATE PENSION PLAN
The subsidiaries sponsor supplementary retirement and pension plans for their employees, with the following characteristics :
18.1Characteristics
CPFL Paulista
The plan currently in force for the employees of the subsidiary CPFL Paulista through FUNCESP is a Mixed Benefit Plan, with the following characteristics:
(i) Defined Benefit Plan (“BD”) – in force until October 31, 1997 – a defined benefit plan, which grants a Proportional Supplementary Defined Benefit (“BSPS”), in the form of a lifetime income convertible into a pension, to participants enrolled prior to October 31, 1997, the amount being defined in proportion to the accumulated past service time up to that date, based on compliance with the regulatory requirements for granting. The total responsibility for coverage of actuarial deficits of this plan falls to the subsidiary.
(ii) Mixed model, as from November 1, 1997, which covers:
- benefits for risk (disability and death), under a defined benefit plan, in which the subsidiary assumes responsibility for Plan’s actuarial deficit, and
- scheduled retirement, under a variable contribution plan, consisting of a benefit plan, which is a defined contribution plan up to the granting of the income, and does not generate any actuarial liability for the subsidiary. The benefit plan only becomes a defined benefit plan, consequently generating actuarial responsibility for the subsidiary, after the granting of a lifetime income, convertible or not into a pension.
Additionally, the subsidiary’s Managers may opt for a Free Benefit Generator Plan – PGBL (defined contribution), operated by either Banco do Brasil or Bradesco.
CPFL Piratininga
As a result of the spin-off of Bandeirante Energia S.A. (subsidiary’s predecessor), the subsidiary CPFL Piratininga assumed the responsibility for the actuarial liabilities of that company’s employees retired and terminated until the date of spin-off, as well as for the obligations relating to the active employees transferred to the subsidiary.
On April 2, 1998, the Secretariat of Pension Plans – “SPC” approved the restructuring of the retirement plan previously maintained by Bandeirante, creating a "Proportional Supplementary Defined Benefit Plan – BSPS”, and a "Mixed Benefit Plan", with the following characteristics:
(i) Defined Benefit Plan (“BD”) - in force until March 31, 1998 – a defined benefit plan, which grants a Proportional Supplementary Defined Benefit (BSPS), in the form of a lifetime income convertible into a pension to participants enrolled until March 31, 1998, in an amount calculated in proportion to the accumulated past service time up to that date, based on compliance with the regulatory requirements for granting. In the event of death while working or the onset of a disability, the benefits incorporate theentire past service time. The subsidiary has full responsibility for covering the actuarial deficits of this Plan.
93
(Free Translation of the original in Portuguese)
Standard Financial Statements – DFP – Date: December 31, 2018 - CPFL Energia S.A.
(ii) Defined Benefit Plan - in force after March 31, 1998 – defined-benefit type plan, which grants a lifetime income convertible into a pension based on the past service time accumulated after March 31, 1998, based on 70% of the average actual monthly salary for the last 36 months of active service. In the event of death while working or the onset of a disability, the benefits incorporate the entire past service time. The responsibility for covering the actuarial deficits of this Plan is equally divided between the subsidiary and the participants.
(iii) Variable Contribution Plan – implemented together with the Defined Benefit plan effective after March 31, 1998. This is a defined-contribution type pension plan up to the granting of the income, and generates no actuarial liability for the subsidiary. The pension plan only becomes a Defined Benefit type plan after the granting of the lifetime income, convertible (or not) into a pension, and accordingly starts to generate actuarial liabilities for the subsidiary.
Additionally, the subsidiary’s Managers may opt for a Free Benefit Generator Plan – PGBL (defined contribution), operated by either Banco do Brasil or Bradesco.
RGE Sul (RGE)
The subsidiary RGE has retirement and pension plans for its employees and former employees managed by Fundação CEEE de Previdência Privada, comprising:
(i) “Plan 1” (“Plano Único RGE”): A “defined benefit” plan with benefit level equal to 100% of the inflation adjusted average of the last salaries, deducting the presumed benefit from the Social Security, with a Segregated Net Asset. that is closed to new participants since 1997. This plan was recorded at the dissolved Rio Grande Energia S.A. until the merger of the distribution companies approved on December 31, 2018, as mentioned in note 12.6.1; and
(ii) “Plan 2” (“Plano Único RGE Sul”): A “defined benefit” plan that is closed to new participants since February 2011. The subsidiary’s contribution matches the contribution from the benefitted employees, in the proportion of one for one, including as regards the Fundação’s administrative funding plan.
For employees hired after the closing of the plans of Fundação CEEE, “defined contribution” private pension plans were implemented, being Bradesco Vida e Previdência for employees hired between 1997 and 2018 by the dissolved Rio Grande Energia S.A., and Itauprev for employees hired by RGE as from 2011, as well as for new employees to be hired after the event of merger of the distribution companies.
CPFL Santa Cruz
With the grouping event mentioned in note 12.5.2, the company’s official plan is the CMSPREV, managed by IHPREV Fundo de Pensão. The same plan was maintained for employees that had the benefits plan managed by BB Previdência - Fundo de Pensão from Banco do Brasil.
CPFL Geração
The employees of the subsidiary CPFL Geração participate in the same pension plan as CPFL Paulista.
In addition, managers may opt for a Free Benefit Generator Plan – PGBL (defined contribution), operated by either Banco do Brasil or Bradesco.
94
(Free Translation of the original in Portuguese)
Standard Financial Statements – DFP – Date: December 31, 2018 - CPFL Energia S.A.
18.2 Movements in the defined benefit plans
December 31, 2018 | |||||||||||
CPFL Paulista | CPFL Piratininga | CPFL Geração | RGE Sul (RGE) | Total | |||||||
Plan 1 (*) | Plan 2 | ||||||||||
Present value of actuarial obligations | 5,123,238 | 1,416,391 | 119,964 | 382,993 | 553,493 | 7,596,079 | |||||
Fair value of plan's assets | (4,215,431) | (1,205,647) | (98,836) | (413,043) | (463,571) | (6,396,529) | |||||
Present value of obligations (fair value of assets), net | 907,807 | 210,744 | 21,128 | (30,050) | 89,922 | 1,199,550 | |||||
Effect of asset ceiling | - | - | - | 30,050 | - | 30,050 | |||||
Net actuarial liability recognized in the statement of financial position | 907,807 | 210,744 | 21,128 | - | 89,922 | 1,229,600 | |||||
December 31, 2017 | |||||||||||
CPFL Paulista | CPFL Piratininga | CPFL Geração | RGE | RGE Sul (RGE) | Total | ||||||
Plan 1 (*) | Plan 2 | ||||||||||
Present value of actuarial obligations | 4,615,061 | 1,247,462 | 110,801 | 365,924 | 524,293 | 6,863,541 | |||||
Fair value of plan's assets | (3,925,061) | (1,105,738) | (94,378) | (387,322) | (446,670) | (5,959,170) | |||||
Present value of obligations (fair value of assets), net | 690,000 | 141,724 | 16,424 | (21,399) | 77,623 | 904,369 | |||||
Effect of asset ceiling | - | - | - | 21,399 | - | 21,399 | |||||
Net actuarial liability recognized in the statement of financial position | 690,000 | 141,724 | 16,424 | - | 77,623 | 925,768 | |||||
(*) Plan 1 was recorded at the dissolved RGE until the merger of the distribution companies as of October 31, 2018, as mentioned in note 12.6.1.
The movements in the present value of the actuarial obligations and the fair value of the plan’s assets are as follows :
CPFL Paulista | CPFL Piratininga | CPFL Geração | RGE Sul (RGE) | Total | |||||||
Plan 1 (*) | Plan 2 | ||||||||||
Present value of actuarial obligations at December 31, 2016 | 4,524,008 | 1,202,596 | 108,486 | 352,879 | 480,081 | 6,668,050 | |||||
Gross current service cost | 707 | 3,153 | 73 | 270 | 2,153 | 6,356 | |||||
Interest on actuarial obligations | 476,613 | 127,561 | 11,431 | 37,395 | 50,927 | 703,927 | |||||
Participants' contributions transferred during the year | 37 | 2,044 | - | 302 | 990 | 3,373 | |||||
Actuarial loss (gain): effect of changes in demographic assumptions | 225 | 328 | 14 | 326 | 16,490 | 17,383 | |||||
Actuarial loss (gain): effect of financial assumptions | (6,993) | (3,586) | (372) | (45) | 8,153 | (2,843) | |||||
Benefits paid during the year | (379,536) | (84,634) | (8,831) | (25,203) | (34,501) | (532,705) | |||||
Present value of actuarial obligations at December 31, 2017 | 4,615,061 | 1,247,462 | 110,801 | 365,924 | 524,293 | 6,863,541 | |||||
Gross current service cost | 835 | 4,365 | 78 | 175 | 2,790 | 8,243 | |||||
Interest on actuarial obligations | 421,083 | 114,628 | 10,109 | 33,552 | 48,218 | 627,590 | |||||
Participants' contributions transferred during the year | 24 | 2,078 | - | 395 | 842 | 3,339 | |||||
Actuarial loss (gain): effect of changes in demographic assumptions | - | - | - | - | 345 | 345 | |||||
Actuarial loss (gain): effect of financial assumptions | 485,142 | 135,540 | 8,409 | 8,921 | 12,774 | 650,786 | |||||
Benefits paid during the year | (398,907) | (87,682) | (9,433) | (25,974) | (35,769) | (557,765) | |||||
Present value of actuarial obligations at December 31, 2018 | 5,123,238 | 1,416,391 | 119,964 | 382,993 | 553,493 | 7,596,079 | |||||
CPFL Paulista | CPFL Piratininga | CPFL Geração | RGE Sul (RGE) | Total | |||||||
Plan 1 (*) | Plan 2 | ||||||||||
Fair value of actuarial assets at December 31, 2016 | (3,723,563) | (1,062,638) | (89,533) | (347,906) | (405,251) | (5,628,892) | |||||
Expected return during the year | (392,819) | (113,470) | (9,437) | (37,412) | (43,258) | (596,396) | |||||
Participants' contributions transferred during the year | (37) | (2,044) | - | (302) | (990) | (3,373) | |||||
Sponsors' contributions | (50,308) | (17,296) | (753) | (7,296) | (6,169) | (81,822) | |||||
Actuarial loss (gain) | (137,870) | 5,076 | (3,486) | (19,610) | (25,503) | (181,393) | |||||
Benefits paid during the year | 379,536 | 84,634 | 8,831 | 25,203 | 34,501 | 532,705 | |||||
Fair value of actuarial assets at December 31, 2017 | (3,925,061) | (1,105,738) | (94,378) | (387,322) | (446,670) | (5,959,170) | |||||
Expected return during the year | (359,588) | (102,621) | (8,634) | (35,950) | (41,166) | (547,959) | |||||
Participants' contributions transferred during the year | (24) | (2,078) | - | (395) | (842) | (3,339) | |||||
Sponsors' contributions | (65,096) | (25,460) | (1,027) | (7,643) | (6,712) | (105,938) | |||||
Actuarial loss (gain) | (264,569) | (57,432) | (4,230) | (7,707) | (3,950) | (337,888) | |||||
Benefits paid during the year | 398,907 | 87,682 | 9,433 | 25,974 | 35,769 | 557,765 | |||||
Fair value of actuarial assets at December 31, 2018 | (4,215,431) | (1,205,647) | (98,836) | (413,043) | (463,571) | (6,396,529) | |||||
(*) Plan 1 was recorded at the dissolved RGE until the merger of the distribution companies as of October 31, 2018, as mentioned in note 12.6.1.
18.3 Movements in recognized assets and liabilities
The movements in net liability are as follows:
95
(Free Translation of the original in Portuguese)
Standard Financial Statements – DFP – Date: December 31, 2018 - CPFL Energia S.A.
CPFL Paulista | CPFL Piratininga | CPFL Geração | RGE Sul (RGE) | Total | |||||||
Plan 1 (*) | Plan 2 | ||||||||||
Net actuarial liability at December 31, 2017 | 690,000 | 141,724 | 16,424 | - | 77,623 | 925,770 | |||||
Expenses (income) recognized in the statement of profit or loss | 62,330 | 16,372 | 1,553 | (188) | 9,842 | 89,909 | |||||
Sponsors' contributions transferred during the year | (65,096) | (25,460) | (1,027) | (7,643) | (6,712) | (105,938) | |||||
Actuarial loss (gain): effect of changes in demographic assumptions | - | - | - | - | 345 | 345 | |||||
Actuarial loss (gain): effect of changes in financial assumptions | 485,142 | 135,540 | 8,409 | 8,921 | 12,774 | 650,786 | |||||
Actuarial loss (gain): return on actuarial assets | (264,569) | (57,432) | (4,230) | (7,707) | (3,950) | (337,888) | |||||
Effect of asset ceiling | - | - | - | 6,617 | - | 6,617 | |||||
Net actuarial liability at December 31, 2018 | 907,807 | 210,744 | 21,129 | - | 89,922 | 1,229,600 | |||||
Other contributions | 13,662 | ||||||||||
Total liability | 1,243,263 | ||||||||||
Current | 86,623 | ||||||||||
Noncurrent | 1,156,639 | ||||||||||
CPFL Paulista | CPFL Piratininga | CPFL Geração | RGE | RGE Sul (RGE) | Total | ||||||
Plan 1 | Plan 2 | ||||||||||
Net actuarial liability at December 31, 2016 | 800,445 | 139,958 | 18,954 | 4,972 | 74,830 | 1,039,158 | |||||
Expenses (income) recognized in the statement of profit or loss | 84,501 | 17,244 | 2,067 | 253 | 9,822 | 113,887 | |||||
Sponsors' contributions transferred during the year | (50,308) | (17,296) | (753) | (7,296) | (6,169) | (81,822) | |||||
Actuarial loss (gain): effect of changes in demographic assumptions | 225 | 328 | 14 | 326 | 16,490 | 17,383 | |||||
Actuarial loss (gain): effect of financial assumptions | (6,993) | (3,586) | (372) | (45) | 8,153 | (2,843) | |||||
Actuarial loss (gain): return on actuarial assets | (137,870) | 5,076 | (3,486) | (19,610) | (25,503) | (181,393) | |||||
Effect of asset ceiling | - | - | - | 21,399 | - | 21,399 | |||||
Net actuarial liability at December 31, 2017 | 690,000 | 141,724 | 16,424 | - | 77,623 | 925,768 | |||||
Other contributions | 15,391 | ||||||||||
Total liability | 941,160 | ||||||||||
Current | 60,801 | ||||||||||
Noncurrent | 880,360 | ||||||||||
(*) Plan 1 was recorded at the dissolved RGE until the merger of the distribution companies as of October 31, 2018, as mentioned in note 12.6.1.
18.4 Expected contributions and benefits
The expected contributions to the plans for 2019 are shown below:
Expected contributions | |
2019 | |
CPFL Paulista | 122,135 |
CPFL Piratininga | 39,924 |
CPFL Geração | 2,525 |
RGE Sul (RGE) - Plan 1 | 7,711 |
RGE Sul (RGE) - Plan 2 | 6,731 |
Total | 179,026 |
The expected benefits to be paid by in the next 10 years are shown below:
Expected benefits to be paid | ||||||
2019 | 2020 | 2021 | 2022 | 2023 to 2028 | Total | |
CPFL Paulista | 410,624 | 423,081 | 434,881 | 446,071 | 2,869,682 | 4,584,339 |
CPFL Piratininga | 93,740 | 97,514 | 102,140 | 106,107 | 731,143 | 1,130,644 |
CPFL Geração | 9,638 | 9,966 | 10,202 | 10,423 | 66,555 | 106,784 |
RGE Sul (RGE) - Plan 1 | 27,450 | 28,595 | 29,541 | 30,583 | 206,698 | 322,867 |
RGE Sul (RGE) - Plan 2 | 36,279 | 37,900 | 39,473 | 41,197 | 281,811 | 436,660 |
Total | 577,731 | 597,056 | 616,237 | 634,381 | 4,155,889 | 6,581,294 |
At December 31, 2018, the average duration of the defined benefit obligation was 9.3 years for CPFL Paulista, 11.2 years for CPFL Piratininga, 9.5 years for CPFL Geração, 10.1 years for RGE Plan 1 and 11.2 years for RGE Plan 2.
96
(Free Translation of the original in Portuguese)
Standard Financial Statements – DFP – Date: December 31, 2018 - CPFL Energia S.A.
18.5 Recognition of private pension plan income and expense
Based on the opinion of external actuarial estimate, the Group’s management presents the actuarial estimate of the expenses and/or income to be recognized in 2019 and the income/expense recognized in 2018 and 2017 are as follows:
2019 estimated | |||||||||||
CPFL Paulista | CPFL Piratininga | CPFL Geração | RGE Sul (RGE) | Total | |||||||
Plan 1 | Plan 2 | ||||||||||
Service cost | 925 | 5,447 | 84 | 185 | 2,352 | 8,993 | |||||
Interest on actuarial obligations | 449,173 | 125,059 | 10,507 | 34,342 | 48,796 | 667,877 | |||||
Expected return on plan assets | (372,121) | (107,795) | (8,699) | (37,500) | (40,947) | (567,062) | |||||
Expected return on plan assets | - | - | - | 2,795 | - | 2,795 | |||||
Total expense (income) | 77,977 | 22,711 | 1,892 | (178) | 10,201 | 112,603 | |||||
2018 actual | |||||||||||
CPFL Paulista | CPFL Piratininga | CPFL Geração | RGE Sul (RGE) | Total | |||||||
Plan 1 (*) | Plan 2 | ||||||||||
Service cost | 835 | 4,365 | 78 | 175 | 2,790 | 8,243 | |||||
Interest on actuarial obligations | 421,083 | 114,628 | 10,109 | 33,552 | 48,218 | 627,590 | |||||
Expected return on plan assets | (359,588) | (102,621) | (8,634) | (35,950) | (41,166) | (547,959) | |||||
Effect of asset ceiling | - | - | - | 2,035 | - | 2,035 | |||||
Total expense (income) | 62,330 | 16,372 | 1,553 | (188) | 9,842 | 89,909 | |||||
2017 actual | |||||||||||
CPFL Paulista | CPFL Piratininga | CPFL Geração | RGE | RGE Sul (RGE) | Total | ||||||
Plan 1 | Plan 2 | ||||||||||
Service cost | 707 | 3,153 | 73 | 270 | 2,153 | 6,356 | |||||
Interest on actuarial obligations | 476,613 | 127,561 | 11,431 | 37,395 | 50,927 | 703,927 | |||||
Expected return on plan assets | (392,819) | (113,470) | (9,437) | (37,412) | (43,258) | (596,396) | |||||
Total expense (income) | 84,501 | 17,244 | 2,067 | 253 | 9,822 | 113,887 | |||||
(*) Plan 1 was recorded at the dissolved RGE until the merger of the distribution companies as of October 31, 2018, as mentioned in note 12.6.1.
The main assumptions taken into consideration in the actuarial calculation at the end of the reporting period were as follows:
CPFL Paulista, CPFL Geração and CPFL Piratininga | Plan 1 | Plan 2 | ||||||||||
RGE Sul (RGE) |
| RGE | RGE Sul (RGE) | |||||||||
December 31, 2018 | December 31, 2017 | December 31, 2018 | December 31, 2017 | December 31, 2018 | December 31, 2017 | |||||||
Nominal discount rate for actuarial liabilities: | 9.10% p.a. | 9.51% p.a. | 9.30% p.a. | 9.51% p.a. | 9.10% p.a. | 9.51% p.a. | ||||||
Nominal return rate on plan assets: | 9.10% p.a. | 9.51% p.a. | 9.30% p.a. | 9.51% p.a. | 9.10% p.a. | 9.51% p.a. | ||||||
Estimated rate of nominal salary increase: | 5.56% p.a.(*) | 6.08% p.a.(*) | 6.13% p.a. | 6.13% p.a. | 5.97% p.a. | 6.10% p.a. | ||||||
Estimated rate of nominal benefits increase: | 4.00% p.a. | 4.00% p.a. | 4.00% p.a. | 4.00% p.a. | 4.00% p.a. | 4.00% p.a. | ||||||
Estimated long-term inflation rate (basis for the nominal rates above) | 4.00% p.a. | 4.00% p.a. | 4.00% p.a. | 4.00% p.a. | 4.00% p.a. | 4.00% p.a. | ||||||
General biometric mortality table: | AT-2000 (-10) | AT-2000 (-10) | BR-EMS sb v.2015 | BR-EMS sb v.2015 | BR-EMS sb v.2015 | BR-EMS sb v.2015 | ||||||
Biometric table for the onset of disability: | Low Light | Low Light | Medium Light | Medium Light | Medium Light | Medium Light | ||||||
Expected turnover rate: | ExpR_2012 | ExpR_2012 | Null | Null | Null | Null | ||||||
Likelihood of reaching retirement age: | After 15 years of filiation and 35 years of service time for men and 30 years of service time for women | 100% when a beneficiary of the plan first becomes eligible for a benefit | 100% when a beneficiary first becomes eligible for a full benefit | 100% one year after when a beneficiary of the plan first becomes eligible for a benefit | 100% when a beneficiary first becomes eligible for a full benefit | 100% one year after when a beneficiary of the plan first becomes eligible for a benefit | ||||||
(*) The estimated nominal increase in salaries for CPFL Piratininga was 6.39% on December 31, 2018 and 2017.
18.6 Plan assets
The following tables show the allocation (by asset segment) of the assets of the Group CPFL pension plans, at December 31, 2018 and 2017 managed by FUNCESP and Fundação CEEE. The tables also show the distribution of the guarantee resources established as target for 2019, obtained in light of the macroeconomic scenario in December 2018.
Assets managed by the plans are as follows:
97
(Free Translation of the original in Portuguese)
Standard Financial Statements – DFP – Date: December 31, 2018 - CPFL Energia S.A.
Assets managed by FUNCESP | Assets managed by Fundação CEEE | |||||||||||||||
CPFL Paulista and CPFL Geração | CPFL Piratininga | RGE Sul (RGE) | ||||||||||||||
Plan 1 | Plan 2 | |||||||||||||||
2018 | 2017 | 2018 | 2017 | 2018 | 2017 | 2018 | 2017 | |||||||||
Fixed rate | 77% | 77% | 81% | 80% | 78% | 79% | 77% | 78% | ||||||||
Federal governament bonds | 55% | 53% | 53% | 49% | 68% | 64% | 67% | 65% | ||||||||
Corporate bonds (financial institutions) | 3% | 4% | 5% | 7% | 5% | 9% | 5% | 8% | ||||||||
Corporate bonds (non financial institutions) | 1% | 1% | 1% | 1% | 3% | 3% | 3% | 3% | ||||||||
Multimarket funds | 4% | 2% | 4% | 2% | 2% | 2% | 2% | 1% | ||||||||
Other fixed income investments | 15% | 17% | 18% | 22% | - | - | - | - | ||||||||
Variable income | 15% | 15% | 14% | 14% | 18% | 18% | 18% | 18% | ||||||||
Investiment funds - shares | 15% | 15% | 13% | 14% | 18% | 18% | 18% | 18% | ||||||||
Structured investments | 2% | 3% | 2% | 3% | 1% | 1% | 1% | 1% | ||||||||
Equity funds | - | - | - | - | - | 1% | 1% | 1% | ||||||||
Real estate funds | - | - | - | - | 1% | 1% | 1% | 1% | ||||||||
Multimarket fund | 2% | 3% | 2% | 3% | - | - | - | - | ||||||||
Total quoted in an active market | 94% | 94% | 97% | 97% | 96% | 98% | 96% | 97% | ||||||||
Real estate | 3% | 3% | 2% | 2% | 2% | 1% | 2% | 1% | ||||||||
Transactions with participants | 1% | 1% | 2% | 2% | 2% | 2% | 2% | 2% | ||||||||
Other investments | 1% | 1% | - | - | - | - | - | - | ||||||||
Total not quoted in an active market | 6% | 6% | 3% | 3% | 4% | 2% | 4% | 3% | ||||||||
The plan assets do not include any properties occupied or assets used by the Company.
Target for 2019 | |||||||
FUNCESP | Fundação CEEE | ||||||
CPFL Paulista and CPFL Geração | CPFL Piratininga | RGE Sul (RGE) | |||||
Plan 1 | Plan 2 | ||||||
Fixed income investments | 70.9% | 72.8% | 78.0% | 77.0% | |||
Variable income investments | 9.6% | 8.9% | 16.0% | 16.0% | |||
Real estate | 4.6% | 2.3% | 3.0% | 3.0% | |||
Transactions with participants | 2.1% | 2.9% | 2.0% | 3.0% | |||
Structured investments | 5.8% | 6.0% | 1.0% | 1.0% | |||
Investments abroad | 7.0% | 7.2% | 0.0% | 0.0% | |||
100.0% | 100.0% | 100.0% | 100.0% | ||||
The allocation target for 2019 was based on the recommendations for allocation of assets made at the end of 2018 by FUNCESP and Fundação CEEE, in their Investment Policy. This target may change at any time during 2019, in light of changes in the macroeconomic situation or in the return on assets, among other factors.
The asset management aims at maximizing the return on investments, but always seeking to minimize the risks of actuarial deficit. Accordingly, investments are always made considering the liability that they must honor. The two main studies for Funcesp and Fundação CEEE to achieve the investment management objectives are the Asset Liability Management – ALM and the Technical Study of Compliance and Appropriateness of the Real Interest Rate, both conducted at least once a year, taking into consideration the projected flow of benefit payments (liability flow) of the pension plans managed by the Foundations.
The ALM study is used as a base to define the strategic allocation of assets, which comprises the target participations in the asset classes of interest, from the identification of efficient combinations of assets, considering the existence of liabilities and the need for return, immunization and liquidity of each plan, considering projections of risk and return. The simulations generated by the ALM studies assist in the definition of the minimum and maximum limits of allocation in the different asset classes, defined in the plans’ Investment Policy, which is also used as a risk control mechanism.
The Technical Study of Compliance and Appropriateness of the Real Interest Rate aims at proving the appropriateness and compliance of the annual real interest rate to be adopted in the actuarial valuation of the plans and the projected annual real rate of return of the investments, considering their projected flows of revenues and expenses.
These studies are used as a base to determine the assumptions of estimated real return of the pension plans’ investments for short-term and long-term horizons and assist in the analysis of their liquidity, sincethey consider the flow of benefit payments against the assets considered liquid. The main assumptions considered in the studies are, in addition to the liability flow projections, the macroeconomic and asset price projections, through which estimates of the expected short-term and long-term profitability are obtained, taking into account the current portfolios of the benefit plans.
98
(Free Translation of the original in Portuguese)
Standard Financial Statements – DFP – Date: December 31, 2018 - CPFL Energia S.A.
18.7 Sensitivity analysis
The significant actuarial assumptions for determining the defined benefit obligation are discount rate and mortality. The following sensitivity analyses were based on reasonably possible changes in the assumptions at the end of the reporting period, with the other assumptions remaining constant.
In the presentation of the sensitivity analysis, the present value of the defined benefit obligation was calculated using the projected unit credit method at the end of the reporting period, the same method used to calculate the defined benefit obligation recognized in the statement of income, according to CPC 33 / IAS 19.
See below the effects on the defined benefit obligation if the discount rate were 0.25 percentage points lower (higher) and if general biometric mortality table were to be softened (aggravated) in one year:
Increase (decrease) | CPFL Paulista | CPFL Piratininga | CPFL Geração | RGE Sul (RGE) |
| |||||||||
Plan 1 | Plan 2 | Total | ||||||||||||
Nominal discount* | -0.25 p.p. | 120,829 | 40,114 | 2,889 | 9,833 | 15,681 | 189,347 | |||||||
+0.25 p.p. | (115,987) | (38,248) | (2,768) | (9,411) | (14,945) | (181,359) | ||||||||
General biometric mortality table** | +1 year | (119,802) | (26,753) | (2,718) | (5,313) | (10,617) | (165,202) | |||||||
-1 year | 118,129 | 26,122 | 2,684 | 5,257 | 10,359 | 162,551 | ||||||||
* Company’s assumption based on the actuarial report for the nominal discount rate was 9.3% p.a. for the Plan 1 and 9.1% p.a for the other plans. The projected rates are increased or decreased by 0.25 p.p. to 9.05% and 9.55% p.a. to the Plan 1 and 8.85% p.a and 9.35% p.a. for the other plans.
** Company’s assumption based on the actuarial report for the mortality table was AT-2000 (-10) for FUNCESP and BREMS sb v.2015 for Fundação CEEE. The projections were performed with 1 year of aggravation or softening on the respective mortality tables.
18.8 Investment risk
The major part of the resources of the Company’s benefit plans is invested in the fixed income segment and, within this segment, the greater part of the funds is invested in federal government bonds, indexed to the IGP-M, IPCA and SELIC, which are the index for adjustment of the actuarial liabilities of the Company’s plans (defined benefit plans), representing the matching between assets and liabilities.
Management of the Company’s benefit plans is monitored by the Investment and Pension Plan Management Committee, which includes representatives of active and retired employees, as well as members appointed by the Company. Among the duties of the Committee are the analysis and approval of investment recommendations made by FUNCESP investment managers, which occurs at least quarterly.
FUNCESP and Fundação CEEE uses the following tools to control market risks in the fixed income and variable income segments: VaR, Tracking Risk, Tracking Error and Stress Test.
FUNCESP's and Fundação CEEE’s Investment Policy determines additional restrictions that, along those established by law, define the percentage of diversification for investments and stablish the plans strategy as credit risk in assets issued or underwritten by the same legal entity.
99
(Free Translation of the original in Portuguese)
Standard Financial Statements – DFP – Date: December 31, 2018 - CPFL Energia S.A.
( 19 ) REGULATORY CHARGES
Consolidated | |||
December 31, 2018 | December 31, 2017 | ||
Financial compensation for the use of water resources | 1,701 | 1,256 | |
Global reversal reserve - RGR | 17,288 | 17,545 | |
ANEEL inspection fee -TFSEE | 5,470 | 2,061 | |
Energy development account - CDE | - | 262,213 | |
Tariff flags and others | 126,196 | 298,525 | |
Total | 150,656 | 581,600 | |
Tariff flags and others – Refer basically to the amount to be passed through to the Centralizing Account of Tariff Flag Resources (“CCRBT”), whose amount receivable was recognized through the issue of electricity bills (note 25.4).
Energy development account – CDE: The 2017 balance refers to(i) annual quota of CDE in the amount of R$ 138,135 (ii) quota for the return of CDE contribution for the period from January, 2013 to January, 2014 in the amount of R$47,429 (iii) quota for the return of Regulated Contracting Environment Account (“ACR account”) contribution for the period from February to December, 2014, in the amount of R$76,649. At 2018 the subsidiaries anticipated the payment of CDE quotas of December 2018 and they also matched the amounts payable and the amounts receivable – CDE (note 11), in the amount of R$2,875.
( 20 ) TAXES, FEES AND CONTRIBUTIONS
Consolidated | |||
December 31, 2018 | December 31, 2017 | ||
Current | |||
IRPJ (corporate income tax) | 73,058 | 59,026 | |
CSLL (social contribution on net income) | 27,392 | 22,430 | |
Income tax and social contribution | 100,450 | 81,457 | |
ICMS (State VAT) | 430,149 | 403,492 | |
PIS (tax on revenue) | 30,760 | 32,486 | |
COFINS (tax on revenue) | 152,945 | 141,757 | |
Income tax withholding on interest on capital | 7,909 | - | |
Other taxes | 43,225 | 51,111 | |
Other taxes | 664,989 | 628,846 | |
Total current | 765,438 | 710,303 | |
Noncurrent | |||
ICMS (State VAT) | 772 | - | |
PIS (Tax on revenue) | - | 18,839 | |
PIS/COFINS payment | 8,919 | - | |
Other taxes | 9,691 | 18,839 | |
Total noncurrent | 9,691 | 18,839 | |
100
(Free Translation of the original in Portuguese)
Standard Financial Statements – DFP – Date: December 31, 2018 - CPFL Energia S.A.
( 21 ) PROVISION FOR TAX, CIVIL AND LABOR RISKS AND ESCROW DEPOSITS
Consolidated | |||||||
December 31, 2018 | December 31, 2017 | ||||||
Provision for tax,civil and labor risks | Escrow Deposits | Provision for tax,civil and labor risks | Escrow Deposits | ||||
Labor | 219,314 | 103,760 | 224,258 | 122,194 | |||
Civil | 281,304 | 99,604 | 291,388 | 97,100 | |||
Tax | |||||||
FINSOCIAL | 39,727 | 99,146 | 33,473 | 95,903 | |||
Income Tax | 154,717 | 401,381 | 150,020 | 382,884 | |||
Others | 195,379 | 150,472 | 163,798 | 140,289 | |||
389,823 | 650,999 | 347,291 | 619,077 | ||||
Others | 88,920 | 12 | 98,196 | 1,620 | |||
Total | 979,360 | 854,374 | 961,134 | 839,990 | |||
The movements in the provision for tax, civil, labor and other risks are shown below:
Consolidated | |||||||||||
December 31, 2017 | Additions | Reversals | Payments | Monetary adjustment | December 31, 2018 | ||||||
Labor | 224,258 | 85,081 | (42,869) | (79,369) | 32,212 | 219,314 | |||||
Civil | 291,388 | 122,626 | (51,944) | (111,404) | 30,638 | 281,304 | |||||
Tax | 347,291 | 53,407 | (31,414) | (8,078) | 28,617 | 389,823 | |||||
Others | 98,196 | 23,753 | (20,562) | (17,022) | 4,551 | 88,920 | |||||
Total | 961,134 | 284,867 | (146,789) | (215,873) | 96,018 | 979,360 | |||||
The provision for tax, civil, labor and other risks was based on the assessment of the risks of losing the lawsuits to which the Group is part, where the likelihood of loss is probable in the opinion of the outside legal counselors and the Management of the Group.
The principal pending issues relating to litigation, lawsuits and tax assessments are summarized below:
a. Labor:The main labor lawsuits relate to claims filed by former employees or labor unions for payment of salary adjustments (overtime, salary parity, severance payments and other claims).
b. Civil
Bodily injury -refer mainlyto claims for indemnities relating to accidents in the Company's electrical grids, damage to consumers, vehicle accidents, etc.
Tariff increase -refer to various claims by industrial consumers as a result of tariff increases imposed by DNAEE Administrative Rules 38 and 45, of February 27 and March 4, 1986, when the “Plano Cruzado” economic plan price freeze was in effect.
c. Tax
FINSOCIAL – Refers to the challenge at court of the increase in the rate and collection of FINSOCIAL (tax on revenue). The subsidiary CPFL Paulista filed a termination action to discuss the decision issued in an ordinary suit on the lawfulness of the collection of the increases in FINSOCIAL rates from June 1989 to October 1991, which were declared unconstitutional by the SupremeFederal Court (STF) for companies that are not exclusively providers of services, situation in which the subsidiary is classified, and that therefore the collection should be made at the rate of 0.5%.
101
(Free Translation of the original in Portuguese)
Standard Financial Statements – DFP – Date: December 31, 2018 - CPFL Energia S.A.
At the time the ordinary action was filed, the subsidiary made a full judicial deposit of the FINSOCIAL amount considered due (0.5%) and the increases in its rates (rates of 1%, 1.2% and 2%).
After the final decision of the STF in regard to the termination action of the subsidiary, it was decided that the subsidiary should return to the lower court to prove its condition of seller of goods. Thus, the subsidiary submitted a claim requiring its recognition as such and, consequently, the withdrawal of the judicial deposit on its behalf, in respect of the amount of the increase in rates (amount that exceeds 0.5%). As at December 31, 2018, this claim is pending analysis by the court authorities.
The outside legal counsel and Management classify as (i) probable the likelihood of loss in regard to the deposited amount related to the rate of 0.5%, of R$ 39,727 as at December 31, 2018 and (ii) possible the likelihood of loss in connection with the amount related to the increase in rates of R$ 59,419.
Income Tax–the provision of R$ 151,811 (R$ 147,100 at December 31, 2017) recognized by the subsidiary CPFL Piratininga refers to the lawsuit for tax deductibility of CSLL in the determination of corporate income tax - IRPJ.
Other tax– Refers to other lawsuits in progress at the judicial and administrative levels due to the operation of the businesses of the subsidiaries, related to tax matters involving INSS, FGTS, SAT and Pis and Cofins.
With regard to Pis and Cofins, the subsidiaries filed a lawsuit to discuss the application of Decree No. 8,426/15, which increased the respective rates levied on finance income from 0% to 4.65%. Having its preliminary injunction to suspend the collection of such taxes accepted, some Group’s companies have since then accrued the amounts that were not paid to the Brazilian Federal Revenue in view of the injunction. As at December 31, 2018, the balance related to this lawsuit is R$ 157,520.
d. Others: The line item of “others” refers mainly to lawsuits involving regulatory matters.
Possible losses
The Group is part to other lawsuits in which Management, supported by its external legal counselors, believes that the chances of a successful outcome are possible, that is, it is more likely than not that there will be no disbursement for these cases due to a solid defensive position in these cases. It is not yet possible to predict the outcome of the courts’ decisions or any other decisions in similar proceedings considered probable or remote.
The claims relating to possible losses at December 31, 2018 and 2017 were as follows:
Consolidated | |||||
December 31, 2018 | December 31, 2017 | Main reasons for claims: | |||
Labor | 786,901 | 686,538 | Work accidents, risk premium for dangerousness at workplace and overtime | ||
Civil | 1,630,630 | 1,178,671 | Personal injury, environmental impacts and overfed tariffs | ||
Tax | 6,199,589 | 5,100,151 | ICMS, FINSOCIAL, PIS and COFINS, Social contribution and Income tax | ||
Regulatory | 139,593 | 140,695 | Technical, commercial and economic-financial supervisions | ||
Total | 8,756,713 | 7,106,055 | |||
(a) Tax :
(i) There is a discussion about the deductibility for income tax of the expense recognized in 1997 relating to the commitment assumed in regard to the pension plan of employees of the subsidiary CPFL Paulista with Fundação CESP in the estimated amount of R$ 1,226,965 with a vinculated escrow deposit in the amount of R$ 206,874 and financial guarantee (letter of guarantee e guarantee insurance).
102
(Free Translation of the original in Portuguese)
Standard Financial Statements – DFP – Date: December 31, 2018 - CPFL Energia S.A.
(ii) in 2016, the subsidiary CPFL Renováveis received a tax infringement notice in the amount of R$ 327,547 relating to the collection of Withholding Income Tax - IRRF on the remuneration of capital gain incurred with parties resident and/or domiciled abroad, arising from the sale of Jantus SL in December 2011, for which the Company’s management, supported by the opinion of its outside legal counselors, classified the likelihood of a favorable outcome as possible;
(iii) in 2016 the subsidiary CPFL Geração received a tax infringement notice in the inflation adjusted amount of R$ 414,470 related to the collection of IRPJ and CSLL for the calendar year 2011, calculated on the alleged capital gain identified on the acquisition of ERSA Energias Renováveis S.A. and on the recording of differences in the fair value remeasurement of SMITA Empreendimentos e Participações S.A., company acquired in a downstream merger, for which the Company’s management, supported by the opinion of its outside legal counselors, classified the likelihood of a favorable outcome as possible.
(b) Labor:
As regards labor contingencies, there is a discussion about the possibility of changing the inflation adjustment index adopted by the Labor Court. Currently there is a decision from the Supreme Federal Court (STF) that suspends the change ruled by the Superior Labor Court (TST), which intended to replace the index currently adopted by the Labor Court (“TR”) by the IPCA-E. The Supreme Court considered that the TST’s decision entailed an unlawful interpretation and was not compliant with the determination of the effects of prior court decisions, violating its competence to decide on a constitutional matter. In view of such decision, and until a final decision is issued by the STF, the current index adopted by the Labor Court (“TR”) remains valid, which has been acknowledged by the TST in recent decisions. Therefore, the Group’s management considers the risk of losses as possible and as the matter still requires definition by the Courts, it is not possible to reasonably estimate the amounts involved. In addition, in accordance with Law No. 13,467 of November 11, 2017, the TR is the inflation adjustment index of the Labor Court since the law came into effect.
Based on the opinion of their outside legal counselors, the Group’s management believes that the amounts provided for reflect the current best estimate.
( 22 ) OTHER PAYABLES
Consolidated | |||||||
Current | Noncurrent | ||||||
December 31, 2018 | December 31, 2017 | December 31, 2018 | December 31, 2017 | ||||
Consumers and concessionaires | 93,612 | 93,068 | 47,831 | 44,473 | |||
Energy efficiency program - PEE | 183,225 | 186,621 | 120,563 | 110,931 | |||
Research & Development - P&D | 110,495 | 103,308 | 72,941 | 68,780 | |||
EPE / FNDCT / PROCEL (*) | 38,052 | 15,612 | - | - | |||
Reversion fund | 1,712 | - | 14,327 | 17,750 | |||
Advances | 197,470 | 300,214 | 48,724 | 22,255 | |||
Tariff discounts - CDE | 96,819 | 25,040 | - | - | |||
Provision for socio environmental costs | 22,709 | 16,360 | 110,261 | 107,814 | |||
Payroll | 15,674 | 20,747 | - | - | |||
Profit sharing | 95,502 | 80,518 | 20,575 | 16,273 | |||
Collection agreements | 85,018 | 72,483 | - | - | |||
Guarantees | - | - | 5,515 | 5,959 | |||
Business combination | 7,598 | 6,927 | |||||
Others | 31,410 | 40,408 | 34,659 | 32,654 | |||
Total | 979,296 | 961,306 | 475,396 | 426,889 | |||
103
(Free Translation of the original in Portuguese)
Standard Financial Statements – DFP – Date: December 31, 2018 - CPFL Energia S.A.
(*) EPE - Empresa de Pesquisa Energética;
FNDCT - Fundo Nacional de Desenvolvimento Científico;
PROCEL - Programa Nacional de Conservação de Energia Elétrica.
Consumers and concessionaires: refer to liabilities with consumers in connection with bills paid twice and adjustments of billing to be offset or returned to consumers as well the participation of consumers in the “Programa de Universalização” program.
Research & Development and Energy Efficiency Programs: the subsidiaries recognized liabilities relating to amounts already billed in tariffs (1% of net operating revenue), but not yet invested in the research & development and energy efficiency programs. These amounts are subject to adjustment at the SELIC rate, through the date of their realization.
Advances: refer mainly to advances from customers in relation to advance billing by the subsidiary CPFL Renováveis, before the energy or service has actually been provided or delivered.
Provision for socio environmental costs and asset retirement:refers mainly to provisions recognized by the indirect subsidiary CPFL Renováveis in relation to socio environmental licenses as a result of events that have already occurred and obligations to remove assets arising from contractual and legal requirements related to leasing of land on which the wind farms are located. Such costs are accrued against property, plant and equipment and will be depreciated over the remaining useful life of the asset.
Tariff discounts – CDE:refer to the difference between the tariff discount granted to consumers and the amounts received via the CDE.
Profit sharing:mainly comprised by:
(i) in accordance with a collective labor agreement, the Group introduced an employee profit-sharing program, based on the achievement of operating and financial targets previously established;
(ii) Long-Term Incentive Program: refers to the Long-Term Incentive Plan for the Group’s Executives, approved by the Board of Directors, which consists in an incentive in financial resources based on salary multiples and that are driven by the company’s results and average performance in the three fiscal years after each concession.
( 23 ) EQUITY
The shareholders’ interest in the Company’s Equity at December 31, 2018 and 2017 is shown below:
Number of shares | ||||||||
December 31, 2018 | December 31, 2017 | |||||||
Shareholders | Common shares | Interest % | Common shares | Interest % | ||||
State Grid Brazil Power Participações S.A. | 730,435,698 | 71.76% | 730,435,698 | 71.76% | ||||
ESC Energia S.A. | 234,086,204 | 23.00% | 234,086,204 | 23.00% | ||||
Members of the Executive Board | 189 | 0.00% | 189 | 0.00% | ||||
Other shareholders | 53,392,655 | 5.25% | 53,392,655 | 5.25% | ||||
Total | 1,017,914,746 | 100.00% | 1,017,914,746 | 100.00% | ||||
23.1 Changes in shareholding structure and Public Tender Offer (“MTO”).
On January 2017, was signed Share Purchase Agreement between State Grid Brazil Power Participações SA.(“State Grid Brazil”), Camargo Corrêa S.A., Caixa de Previdência dos Funcionários do Banco do Brasil – PREVI, Fundação CESP, Fundação Sistel de Seguridade Social, Fundação Petrobras de Seguridade Social – PETROS, Fundação SABESP de Seguridade Social — SABESPREV, and certain other parties, had been signed.After finalizing the transaction, State Grid Brazil became the parent company of CPFL Energia with 54.64% of the Company’s voting capital and Company´s total capital.
104
(Free Translation of the original in Portuguese)
Standard Financial Statements – DFP – Date: December 31, 2018 - CPFL Energia S.A.
On November 2017, respectively, the Company informed that it had successfully conducted the public offering auction on the trading system of B3 S.A.– Brasil, Bolsa, Balcão (“Auction”). As a result of the auction, State Grid Brazil acquired 408,357,085 common shares of the Company, representing 88.44% of the total shares object of the Public Offering and 40.12% of the Company’s capital. The common shares were acquired for the price of R$ 27.69, totaling R$ 11,307,408. State Grid Brazil started holding, jointly with ESC Energia S.A., 964,521,902 common shares of the Company, increasing its joint interest from 54.64% to 94.75% of the Company’s total capital.
According to B3 S.A. – Brasil Bolsa Balcão regulation, after incurred the period of the 18 months from November 30, 2017 it is required the Company to take a decision of reestablish the minimum floating required or delist its shares from the public stock market. The Company´ and its shareholders are evaluating their options considering requirements.
23.2 Capital reserve
Refers basically to: (i) record arising from the business combination of CPFL Renováveis in the amount of R$ 228,322 in 2011, (ii) effect of the public offering of shares of subsidiary CPFL Renováveis in 2013, amounting to R$ 59,308, as a result of the reduction of the indirect interest in CPFL Renováveis, (iii) effect of the association between CPFL Renováveis and DESA, amounting to R$ 180,297 in 2014, and (iv) other movements with no change of control amounting to R$1,243. In accordance with ICPC 09 (R2) and IFRS 10 / CPC 36, these effects were recognized as transactions between shareholders, directly in Equity.
23.3 Earnings reserve
The balance of earnings reserve at December 31, 2018 is R$ 4,428,503 that refers to : i) Legal Reserve of R$ 900,992; e ii) statutory reserve - working capital improvement of R$ 3,527,511
23.4 Accumulated comprehensive income
Accumulated comprehensive income is comprised of:
(i) Deemed cost: Refers to the recognition of the fair value adjustment of the deemed cost of the generating plants' property, plant and equipment, of R$ 380,721;
(ii) Private pension plan: the debt balance of R$ 809,126 (net of income taxes) refers to the effects recognized directly in comprehensive income, in accordance with IAS 19 / CPC 33 (R2); and
(iii) Effects of the credit risk in the mark to market of financial liabilities, net of income taxes, in accordance with IFRS 9 / CPC 48 (credit amount of R$ 52,109).
23.5 Dividends
At the Board of Directors’ Meeting held on April 27, 2018, approval was given for the declaration dividend for 2017 in the amount of R$ 280,191.
The Company also declared in 2018 R$ 488,785 relating to minimum mandatory dividend, as set forth by Law 6,404/76, and for each share the amount of R$ 0.480182232 was attributed.
In 2018, the Company paid R$ 279,101 relating to the dividend for 2018.
23.6 Termination of the statutory reserve of the concession financial asset
On April´s 27th , 2018 shareholders meeting it was approved the termination os the statutory reserve of the concession financial asset and the transfer of the reserve amount (R$826,600) to Retained Earnings.
105
(Free Translation of the original in Portuguese)
Standard Financial Statements – DFP – Date: December 31, 2018 - CPFL Energia S.A.
23.7 Allocation profit for the year
The Company’s bylaws establish the payment of minimum dividend of 25% of the profit for the year, adjusted as required by law, to the holders of its shares.
The proposal for allocation of profit for the year is shown in the table below:
2018 | |
Profit for the year - Parent company | 2,058,040 |
Realization of comprehensive income | 25,117 |
Adjustment of previous period - Adoption IFRS 9/CPC 48 | (82,607) |
Statutory reserve - concession financial asset - reversal | 826,600 |
Profit base for allocation | 2,827,151 |
Legal reserve | (102,902) |
Statutory reserve - working capital improvement | (2,235,465) |
Mandatory dividend | (488,785) |
For the year ended by December 31, 2018, considering the slow economic recovery scenario and the lack of previsibility for the hydrologic situation, the Company’s management is proposing to be allocated the total amount of R$ 2,235,465 as statutory reserve – working capital improvement.
( 24 ) EARNINGS PER SHARE
Earnings per share – basic and diluted
The calculation of the basic and diluted earnings per share as at December 31, 2018 and 2017 was based on the profit for the year attributable to controlling shareholders and the weighted average number of common shares outstanding during the reporting years. Specifically for the calculation of diluted earnings per share, the dilutive effects of instruments convertible into shares are considered, as shown below:
2018 | 2017 | |||
Numerator | ||||
Profit attributable to controlling shareholders | 2,058,040 | 1,179,750 | ||
Denominator | ||||
Weighted average number of shares held by shareholders | 1,017,914,746 | 1,017,914,746 | ||
Earnings per share - basic | 2.02 | 1.16 | ||
Numerator | ||||
Profit attributable to controlling shareholders | 2,058,040 | 1,179,750 | ||
Dilutive effect of convertible debentures of subsidiary CPFL Renováveis (*) | (7,525) | (11,966) | ||
Profit attributable to controlling shareholders | 2,050,515 | 1,167,784 | ||
Denominator | ||||
Weighted average number of shares held by shareholders | 1,017,914,746 | 1,017,914,746 | ||
Earnings per share - diluted | 2.01 | 1.15 |
(*) The dilutive effect of the numerator in the calculation of diluted earnings per share considers the dilutive effects of the debentures convertible into shares issued by subsidiaries of the indirect subsidiary CPFL Renováveis. The effects were calculated based on the assumption that these debentures would be converted into common shares of the subsidiaries at the beginning of each year.
106
(Free Translation of the original in Portuguese)
Standard Financial Statements – DFP – Date: December 31, 2018 - CPFL Energia S.A.
( 25 ) NET OPERATING REVENUE
| Consolidated | |||||||||||
Number of Consumers | In GWh | R$ thousand | ||||||||||
Revenue from Electric Energy Operations | 2018 | 2017 | 2018 | 2017 | 2018 | 2017 | ||||||
Consumer class | ||||||||||||
Residential | 8,544,035 | 8,330,237 | 19,618 | 19,122 | 13,549,879 | 11,663,084 | ||||||
Industrial | 58,241 | 59,825 | 13,834 | 14,661 | 5,188,778 | 5,095,840 | ||||||
Commercial | 532,592 | 545,095 | 10,211 | 10,220 | 6,038,086 | 5,498,867 | ||||||
Rural | 361,908 | 359,106 | 3,583 | 3,762 | 1,334,868 | 1,173,569 | ||||||
Public administration | 60,685 | 60,639 | 1,459 | 1,456 | 879,910 | 787,967 | ||||||
Public lighting | 11,659 | 11,230 | 2,003 | 1,964 | 767,246 | 654,950 | ||||||
Public services | 10,194 | 9,790 | 2,348 | 2,157 | 1,150,227 | 978,286 | ||||||
(-) Adjustment of revenues from excess demand and excess reactive power | - | - | - | - | - | (65,991) | ||||||
Billed | 9,579,314 | 9,375,922 | 53,057 | 53,342 | 28,908,995 | 25,786,572 | ||||||
Own comsuption | - | - | 34 | 34 | - | - | ||||||
Unbilled (net) | - | - | - | - | 112,441 | (89,575) | ||||||
(-) Reclassificacion to Network Usage Charge - TUSD - Captive Consumers | - | - | - | - | (11,095,762) | (9,273,840) | ||||||
Electricity sales to final consumers | 9,579,314 | 9,375,922 | 53,091 | 53,376 | 17,925,674 | 16,423,157 | ||||||
Furnas Centrais Elétricas S.A. | 2,875 | 3,026 | 544,342 | 565,592 | ||||||||
Other concessionaires and licensees | 17,757 | 16,337 | 3,825,201 | 3,240,571 | ||||||||
(-) Reclassificacion to Network Usage Charge - TUSD - Captive Consumers | - | - | (96,717) | (56,528) | ||||||||
Spot market energy | 3,828 | 8,194 | 1,082,945 | 2,340,463 | ||||||||
Electricity sales to wholesalers | 24,459 | 27,557 | 5,355,771 | 6,090,098 | ||||||||
Revenue due to Network Usage Charge - TUSD - Captive Consumers | 11,192,479 | 9,330,368 | ||||||||||
Revenue due to Network Usage Charge - TUSD - Free Consumers | 2,650,565 | 2,137,566 | ||||||||||
Compensation paid for failure to comply with the limits of continuity | (57,630) | - | ||||||||||
(-) Adjustment of revenues from excess demand and excess reactive power | - | (21,861) | ||||||||||
Revenue from construction of concession infrastructure | 1,772,222 | 2,073,423 | ||||||||||
Sector financial asset and liability (Note 8) | 1,207,917 | 1,900,837 | ||||||||||
Concession financial asset - fair value adjustment (Note 10) | 345,015 | 204,443 | ||||||||||
Energy development account - CDE - Low-income, Tariff discounts - judicial injunctions ,and other tariff discounts | 1,536,366 | 1,419,128 | ||||||||||
Other revenues and income | 697,878 | 496,340 | ||||||||||
Other operating revenues | 19,344,812 | 17,540,244 | ||||||||||
Total gross operating revenue | 42,626,257 | 40,053,498 | ||||||||||
Deductions from operating revenues | ||||||||||||
ICMS | (6,188,323) | (5,455,718) | ||||||||||
PIS | (659,352) | (603,050) | ||||||||||
COFINS | (3,037,164) | (2,777,626) | ||||||||||
ISS | (16,871) | (15,929) | ||||||||||
Global reversal reserve - RGR | (247) | (2,952) | ||||||||||
Energy development account - CDE | (4,016,362) | (3,185,693) | ||||||||||
Research and development and energy efficiency | (207,653) | (191,997) | ||||||||||
PROINFA | (151,718) | (166,743) | ||||||||||
Tariff flags and others | (178,536) | (878,460) | ||||||||||
Others | (33,404) | (30,425) | ||||||||||
(14,489,630) | (13,308,593) | |||||||||||
Net operating revenue | 28,136,627 | 26,744,905 | ||||||||||
25.1 Adjustment of revenues from excess demand and excess reactive power
As provided for in Sub-module 2.1 of the Tariff Regulation Procedures – PRORET, approved through Normative Resolution No. 457/2011 and Decision No. 245/2016, since the 4th cycle of period tariff review of the distribution subsidiaries, the revenues earned from excess demand and excess reactive power have been recorded as sector liability. Since May 2015 for subsidiary CPFL Piratininga, September 2015 for subsidiary Companhia Jaguari de Energia (“CPFL Santa Cruz”), November 2017 for subsidiaries CPFL Paulista and RGE Sul , and January 2018 for subsidiary RGE. The recorded amounts will be amortized as from the 5th cycle, when they will be deducted from Portion B (portion of manageable costs of the tariffs), except for subsidiary Companhia Jaguari de Energia (“CPFL Santa Cruz”), whose amortization started in the Annual Tariff Review – RTA of March 2017 due to the renewal of its concession in 2015.
.
107
(Free Translation of the original in Portuguese)
Standard Financial Statements – DFP – Date: December 31, 2018 - CPFL Energia S.A.
25.2 Periodic tariff review (“RTP”) and Annual tariff adjustment (“RTA”)
2018 | 2017 | |||||||||
Distributor | Month | RTA / RTP | Effect perceived by consumers (a) | RTA / RTP | Effect perceived by consumers (a) | |||||
CPFL Paulista | April | 12.68% | 16.90% | -0.80% | -10.50% | |||||
CPFL Piratininga | October | 20.01% | 19.25% | 7.69% | 17.28% | |||||
RGE | June | 21.27% | 20.58% | 3.57% | 5.00% | |||||
RGE Sul | April | 18.45% | 22.47% | -0.20% | -6.43% | |||||
CPFL Santa Cruz | March | (b) | (b) | -1.28% | -10.37% | |||||
CPFL Leste Paulista | March | (b) | (b) | 0.76% | -3.28% | |||||
CPFL Jaguari de Energia (CPFL Santa Cruz) | March | 5.71% | (b) | 2.05% | -8.42% | |||||
CPFL Sul Paulista | March | (b) | (b) | 1.64% | -4.15% | |||||
CPFL Mococa | March | (b) | (b) | 1.65% | -2.56% | |||||
(a) Represents the average effect perceived by the consumer, as a result of the elimination from the tariff base of financial components that had been added in the prior tariff adjustment.
(b) As mentioned in note 12.5.2, at December 31, 2018, the EGM approved the grouping of subsidiaries Companhia Luz e Força Santa Cruz, Companhia Leste Paulista de Energia, Companhia Jaguari de Energia, Companhia Sul Paulista de Energia e Companhia Luz and Força de Mococa.In accordance with Normative Resolution No716, of May 3, 2016, until the first tariff review of the grouped concessionaire, which will take place in March 2021, ANEEL may apply the procedure that divides over time the variation in the tariffs of the former concessions and the unified tariff. This occurred in the tariff adjustment of March 2018.
On March 13, 2018, the ANEEL published REH No. 2,376, which set the average annual tariff adjustment of Companhia Jaguari de Energia (“CPFL Santa Cruz”), effective as of March 22, 2018, at 5.71%, 4.41% regarding the economic tariff adjustment and 1.30% regarding relevant financial components. The average effect to be perceived by consumers of the original concessions are:
Jaguari | Mococa | Leste Paulista | Sul Paulista | Santa Cruz | ||||||
Effect perceived by consumers | 21.15% | 3.40% | 7.03% | 7.50% | 5.32% |
25.3 Energy Development Account (CDE) – Low income, other tariff subsidies and tariff discounts - injunctions
Law 12,783 of January 11, 2013 determined that the amounts related to the low-income subsidy, as well as other tariff discounts shall be fully subsidized by amount from the CDE.
Income of R$1,536,366 was recognized in 2018 (R$ 1,419,128 in 2017), of which (i) R$78,081 for the low-income subsidy (R$96,882 in 2017), (ii) R$1,354,845 for other tariff discounts (R$1,226,777 in 2017) and (iii) R$103,440 for tariff discounts – CCRBT injunctions and subsidy (R$ 95,469 in 2017); These items were recorded against other receivables in line item Receivables – CDE (note 11) and other payables in line item Tariff discounts – CDE (note 22.)
25.4 Tariff flags
The system of application of Tariff Flags was created by means of Normative Resolution No. 547/2013 in effect as from January 1, 2015. Such mechanism is intended essentially to signal to consumers the conditions of electric energy generation in the National Interconnected System - SIN. A green flag indicates favorable conditions and the tariff does not rise. A yellow flag indicates less favorable conditions, and the redflag, segregated into two levels, is activated in more critical conditions. For every 100 KWh consumed, before tax effects, the yellow flag results in increases of R$1.00 in the tariff, while the red flag, depending on the level, of R$ 3.00 (level 1) and R$ 5.00 (level 2). The informed amounts are in effect since the decision of the Collegiate Board in Public Hearing No. 61/2017, as from November 1, 2017.
108
(Free Translation of the original in Portuguese)
Standard Financial Statements – DFP – Date: December 31, 2018 - CPFL Energia S.A.
In 2018, ANEEL approved the Tariff Flags billed from November 2017 to October 2018. The amount approved in this period was R$1,205,247. Out of this amount, R$297,340, referring to November and December 2017, were used to offset part of the sector financial asset and liability (note 8) and R$ 907,907, referring to the January to October 2018 approval, due to Closing Order No. 4,356 of December 22, 2017, were classified as sector financial asset and liability. The amount of R$ 126,185, with respect to the tariff flag billed for November and December 2018, was not approved and is recorded in regulatory fees (note 19).
25.5 Energy development account (“CDE”)
ANEEL, by means of Ratifying Resolution (“REH”) No. 2,358 of December 19, 2017, amended by REH No. 2,368 of February 9, 2018, established the definitive annual quotas of CDE for the year 2018. These quotas comprise: (i) annual quota of the CDE – USAGE account; and (ii) quota of the CDE – Energy account, related to part of the CDE contributions received by the electric energy distribution concessionaires in the period from January 2013 to January 2014, which should be charged from consumers and passed on to the CDE Account in up to five years from the RTE of 2015. Nevertheless, ANEEL (Brazilian Electricity Regulatory Agency) through Public Hearing 37/2018 reviewed the 2018 budget and determined a new quota for the energy development account “CDE – USAGE” for the months from September to December 2018 and maintained unaltered the quota for “CDE – Energy”, according to Ratifying Resolution REH 2,446 of September 4, 2018. Furthermore, by means of REH No. 2.004 of December 15, 2015, ANEEL established another quota intended for the amortization of the ACR Account, whose amount were updated by REH No. 2.231, of April 25, 2017, with payment and transfer to the CDE Account for the period of April 2017 to March 2018. The same resolution defined the amounts for the period of April 2018 to March 2020.
( 26 ) COST OF ELECTRIC ENERGY
Consolidated | ||||||||
GWh | R$ thousand | |||||||
Electricity purchased for resale | 2018 | 2017 | 2018 | 2017 | ||||
Itaipu Binacional | 11,117 | 11,779 | 2,668,346 | 2,350,858 | ||||
PROINFA | 1,111 | 1,142 | 330,638 | 293,161 | ||||
Energy purchased through auction in the regulated market, bilateral contracts and spot market | 61,461 | 65,053 | 13,969,953 | 14,536,257 | ||||
PIS and COFINS credit | - | - | (1,502,673) | (1,562,779) | ||||
Subtotal | 73,689 | 77,974 | 15,466,265 | 15,617,498 | ||||
Electricity network usage charge | ||||||||
Basic network charges | 2,114,720 | 1,541,629 | ||||||
Transmission from Itaipu | 266,153 | 159,896 | ||||||
Connection charges | 162,852 | 122,536 | ||||||
Charges for use of the distribution system | 48,811 | 39,451 | ||||||
System service charges - ESS net ofCONER pass through (*) | (106,002) | (452,978) | ||||||
Reserve energy charges - EER | 134,824 | (303) | ||||||
PIS and COFINS credit | (249,458) | (126,213) | ||||||
Subtotal | 2,371,901 | 1,284,020 | ||||||
Total | 17,838,165 | 16,901,518 | ||||||
(*) Energy reserve account | ||||||||
109
(Free Translation of the original in Portuguese)
Standard Financial Statements – DFP – Date: December 31, 2018 - CPFL Energia S.A.
( 27 ) OPERATING COSTS AND EXPENSES
Consolidated | |||||||||||||||||||||||
|
|
| Services rendered to third parties | Operating Expenses |
|
| |||||||||||||||||
Operating costs | Sales | General | Other | Total | |||||||||||||||||||
2018 | 2017 | 2018 | 2017 | 2018 | 2017 | 2018 | 2017 | 2018 | 2017 | 2018 | 2017 | ||||||||||||
Personnel | 901,333 | 882,150 | - | 2 | 172,700 | 170,859 | 340,442 | 324,147 | - | - | 1,414,475 | 1,377,158 | |||||||||||
Private Pension Plans | 89,909 | 113,887 | - | - | - | - | - | - | - | - | 89,909 | 113,887 | |||||||||||
Materials | 228,001 | 222,650 | 888 | 1,061 | 9,089 | 2,444 | 20,100 | 23,818 | - | - | 258,078 | 249,973 | |||||||||||
Third party services | 210,234 | 251,549 | 2,294 | 1,856 | 166,693 | 186,525 | 312,533 | 287,221 | - | - | 691,754 | 727,151 | |||||||||||
Depreciation and amortization | 1,237,627 | 1,143,795 | - | - | 4,260 | 5,403 | 65,319 | 93,639 | - | - | 1,307,206 | 1,242,837 | |||||||||||
Costs of infrastructure construction | - | - | 1,772,162 | 2,071,698 | - | - | - | - | - | - | 1,772,162 | 2,071,698 | |||||||||||
Others | 66,650 | 157,113 | (6) | (7) | 255,442 | 225,000 | 248,897 | 218,247 | 485,427 | 438,494 | 1,056,410 | 1,038,847 | |||||||||||
Collection fees | - | 11,710 | - | - | 87,432 | 68,757 | - | - | - | - | 87,432 | 80,467 | |||||||||||
Allowance for doubtful accounts | - | - | - | - | 169,259 | 155,097 | - | - | - | - | 169,259 | 155,097 | |||||||||||
Leases and rentals | 43,898 | 52,734 | - | - | - | (148) | 22,898 | 19,740 | - | - | 66,796 | 72,326 | |||||||||||
Publicity and advertising | 21 | 202 | - | - | 15 | 1 | 19,155 | 17,412 | - | - | 19,191 | 17,615 | |||||||||||
Legal, judicial and indemnities | - | - | - | - | - | - | 186,686 | 188,355 | - | - | 186,686 | 188,355 | |||||||||||
Donations, contributions and subsidies | 2,053 | 88 | - | - | - | 2 | 5,108 | 3,924 | - | - | 7,161 | 4,014 | |||||||||||
Gain (loss) on disposal, retirement and other noncurrent assets | - | - | - | - | - | - | - | - | 210,840 | 132,195 | 210,840 | 132,195 | |||||||||||
Amortization of concession intangible asset | - | - | - | - | - | - | - | - | 286,858 | 286,215 | 286,858 | 286,215 | |||||||||||
Amotization of the risk premium paid -GSF | 13,413 | 9,594 | - | - | - | - | - | - | - | - | 13,413 | 9,594 | |||||||||||
Fee for the use of water | 11,140 | 8,656 | - | - | - | - | - | - | - | - | 11,140 | 8,656 | |||||||||||
Impairment | - | - | - | - | - | - | - | - | - | 20,437 | - | 20,437 | |||||||||||
Others | (3,875) | 74,130 | (6) | (7) | (1,264) | 1,291 | 15,049 | (11,184) | (12,271) | (353) | (2,367) | 63,877 | |||||||||||
Total | 2,733,754 | 2,771,145 | 1,775,339 | 2,074,611 | 608,184 | 590,232 | 987,291 | 947,072 | 485,427 | 438,494 | 6,589,995 | 6,821,554 | |||||||||||
110
(Free Translation of the original in Portuguese)
Standard Financial Statements – DFP – Date: December 31, 2018 - CPFL Energia S.A.
( 28 ) FINANCE INCOME (COSTS)
Consolidated | |||
2018 | 2017 | ||
Financial income (costs) | |||
Income from financial investments | 222,773 | 457,255 | |
Late payment interest and fines | 276,350 | 265,455 | |
Adjustment for inflation of tax credits | 14,819 | 19,623 | |
Adjustment for inflation of escrow deposits | 37,322 | 49,502 | |
Adjustment for inflation and exchange rate changes | 70,201 | 60,999 | |
Discount on purchase of ICMS credit | 33,779 | 16,386 | |
Adjustments to the sector financial asset (note 8) | 80,240 | - | |
PIS and COFINS on other finance income | (46,217) | (48,322) | |
PIS and COFINS on interest on capital | (39,355) | (27,798) | |
Others | 112,503 | 87,214 | |
Total | 762,413 | 880,314 | |
Financial costs | |||
Interest on debts | (1,328,693) | (1,661,060) | |
Adjustment for inflation and exchange rate changes | (368,141) | (540,053) | |
(-) Capitalized interest | 28,606 | 50,543 | |
Adjustments to the sector financial liability ( note 8) | - | (82,333) | |
Use of public asset | (17,759) | (8,048) | |
Others | (179,114) | (126,917) | |
Total | (1,865,100) | (2,367,868) | |
Financial expenses, net | (1,102,687) | (1,487,554) | |
Interests were capitalized at an average rate of 8.27% p.a. in 2018 (8.54% p.a. in 2017) on qualifying assets, in accordance with CPC 20 (R1) and IAS 23.
In line item of adjustment for inflation and exchange rate changes, the expense includes the effects of gains of R$ 617,545 at 2018 (loss of R$ 235,852 at 2017) on derivative instruments (note 33).
( 29 ) SEGMENT INFORMATION
The segregation of the Group’s operating segments is based on the internal financial information and management structure and is made by type of business: electric energy distribution, electric energy generation (conventional and renewable sources), electric energy commercialization and services rendered activities.
Profit or loss, assets and liabilities per segment include items directly attributable to the segment, as well as those that can be allocated on a reasonable basis, if applicable. Prices charged between segments are determined based on similar market transactions. Note 1 presents the subsidiaries according to their areas of operation and provides further information on each subsidiary and its business line and segment.
As of 2018, due to the way the Group’s new management monitors the segment results, intangible assets acquired in business combination that were previously allocated to the respective segments started to be presented in the parent company in which it is recorded, in the segment “Others.” In order to keep the comparability, 2017’ information are been disclosed in the same criteria.
The information segregated by segment is presented below, according to the criteria established by the Group’s officers:
111
(Free Translation of the original in Portuguese)
Standard Financial Statements – DFP – Date: December 31, 2018 - CPFL Energia S.A.
2018 |
| Distribution | Generation (conventional source) | Generation | Commercialization | Services | Total | Other (*) | Elimination | Total | ||||||||
Net operating revenue | 22,457,079 | 661,831 | 1,468,254 | 3,491,300 | 58,163 | 28,136,627 | - | - | 28,136,627 | |||||||||
(-) Intersegment revenues | 10,238 | 482,548 | 468,065 | 5,152 | 474,646 | 1,440,650 | - | (1,440,650) | - | |||||||||
Cost of electric energy | (15,022,304) | (102,421) | (320,346) | (3,352,745) | - | (18,797,816) | - | 959,650 | (17,838,165) | |||||||||
Operating costs and expenses | (4,440,783) | (104,606) | (407,211) | (47,287) | (437,709) | (5,437,597) | (39,333) | 481,000 | (4,995,931) | |||||||||
Depreciation and amortization | (766,796) | (116,372) | (623,106) | (2,346) | (22,521) | (1,531,143) | (62,922) | - | (1,594,064) | |||||||||
Income from electric energy service | 2,237,434 | 820,979 | 585,655 | 94,074 | 72,579 | 3,810,721 | (102,255) | - | 3,708,467 | |||||||||
Equity | - | 334,198 | - | - | - | 334,198 | - | - | 334,198 | |||||||||
Finance income | 574,685 | 75,844 | 131,694 | 46,102 | 5,782 | 834,107 | (22,092) | (49,602) | 762,413 | |||||||||
Finance expenses | (884,583) | (324,121) | (635,820) | (59,128) | (5,908) | (1,909,559) | (5,143) | 49,602 | (1,865,100) | |||||||||
Profit (loss) before taxes | 1,927,537 | 906,899 | 81,530 | 81,049 | 72,453 | 3,069,467 | (129,490) | - | 2,939,977 | |||||||||
Income tax and social contribution | (495,120) | (137,089) | 37,276 | (27,945) | (29,529) | (652,408) | (121,575) | - | (773,982) | |||||||||
Profit (loss) for the year | 1,432,416 | 769,810 | 118,805 | 53,104 | 42,924 | 2,417,060 | (251,065) | - | 2,165,995 | |||||||||
Total assets | 24,124,896 | 4,327,070 | 12,175,855 | 933,121 | 476,476 | 42,037,419 | 1,643,260 | (1,469,148) | 42,211,530 | |||||||||
Purchases of PP&E and intangible assets | 1,769,569 | 11,517 | 225,202 | 2,926 | 52,855 | 2,062,069 | 353 | - | 2,062,422 | |||||||||
2017 |
| Distribution | Generation (conventional source) | Generation | Commercialization | Services | Total | Other (*) | Elimination | Total | ||||||||
Net operating revenue | 21,068,435 | 741,842 | 1,489,932 | 3,402,804 | 40,611 | 26,743,625 | 1,281 | - | 26,744,905 | |||||||||
(-) Intersegment revenues | 8,182 | 448,427 | 469,152 | 11,297 | 444,935 | 1,381,993 | - | (1,381,993) | - | |||||||||
Cost of electric energy | (14,146,739) | (147,380) | (348,029) | (3,196,028) | - | (17,838,176) | - | 936,658 | (16,901,518) | |||||||||
Operating costs and expenses | (4,695,445) | (156,345) | (389,443) | (47,296) | (398,188) | (5,686,717) | (51,121) | 445,336 | (5,292,502) | |||||||||
Depreciation and amortization | (703,601) | (120,554) | (617,017) | (3,054) | (19,760) | (1,463,986) | (65,066) | - | (1,529,052) | |||||||||
Income from electric energy service | 1,530,833 | 765,990 | 604,596 | 167,724 | 67,598 | 3,136,740 | (114,906) | - | 3,021,834 | |||||||||
Equity | - | 312,390 | - | - | - | 312,390 | - | - | 312,390 | |||||||||
Finance income | 597,203 | 108,433 | 137,765 | 25,895 | 11,349 | 880,644 | 20,505 | (20,835) | 880,314 | |||||||||
Finance expenses | (1,163,689) | (437,009) | (648,571) | (58,801) | (7,101) | (2,315,170) | (73,532) | 20,835 | (2,367,868) | |||||||||
Profit (loss) before taxes | 964,347 | 749,805 | 93,789 | 134,818 | 71,846 | 2,014,605 | (167,933) | - | 1,846,670 | |||||||||
Income tax and social contribution | (299,510) | (95,688) | (74,125) | (44,527) | (16,994) | (530,845) | (72,784) | - | (603,629) | |||||||||
Profit (loss) for the year | 664,837 | 654,117 | 19,665 | 90,290 | 54,852 | 1,483,761 | (240,717) | - | 1,243,042 | |||||||||
Total assets | 22,040,918 | 4,682,527 | 12,856,002 | 975,877 | 454,961 | 41,010,285 | 1,628,107 | (1,355,480) | 41,282,912 | |||||||||
Purchases of PP&E and intangible assets | 1,882,502 | 8,973 | 621,046 | 2,927 | 54,149 | 2,569,598 | 835 | - | 2,570,433 |
The line item “Total assets” for 2018 and 2017 is presented excluding, in each segment, the recorded investments related to other segments.
(*) Others – refer basically to assets and transactions which are not related to any of the identified segments.
( 30 ) RELATED PARTY TRANSACTIONS
As of December 31, 2018, the Company’s controlling shareholders are as follows:
· State Grid Brazil Power Participações S.A.
Indirect subsidiary of State Grid Corporation of China, a Chinese state-owned company primarily engaged in developing and operating businesses in the electric energy sector.
· ESC Energia S.A.
Subsidiary of State Grid Brazil Power Participações S.A.
The direct and indirect interests in operating subsidiaries are described in note 1.
Controlling shareholders, subsidiaries, associates, joint ventures and entities under common control and that in some way exercise significant influence over the Company and its subsidiaries and associates were considered as related parties.
The main transactions are listed below:
a) Purchase and sale of energy and charges -refer basically to energy purchased or sold by distribution, commercialization and generation subsidiaries through short or long-term agreements and tariffs for the use of the distribution system (TUSD). Such transactions, when conducted in the free market, are carried out under conditions considered by the Company as similar to market conditions at the time of the trading, according to internal policies previously established by the Company’s management. When conducted in the regulated market, the prices charged are set through mechanisms established by the regulatory authority.
b) Intangible assets, Property, plant and equipment, Materials and Service– refers mainly to rendered services in advisory and management of energy plants, consulting and engineering.
c) Advances –refer to advances for investments in research and development.
112
(Free Translation of the original in Portuguese)
Standard Financial Statements – DFP – Date: December 31, 2018 - CPFL Energia S.A.
To ensure that the trading transactions with related parties are conducted under usual market conditions, the Group set up a “Related Parties Committee”, comprising representatives of the controlling shareholders, of the Company and an independent member, which analyzes the main transactions with related parties.
Management has considered the closeness of relationship with the related party together with other factors to determine the level of detail of the disclosed transactions and believes that significant information regarding transactions with related parties has been adequately disclosed.
The total compensation of key management personnel in 2018, in accordance with CVM Decision 560/2008, was R$ 90,783 (R$ 73,670 in 2017). This amount comprises R$ 78,335 (R$ 64,516 in 2017) in respect of short-term benefits and R$ 2,160 (R$ 1,516 in 2017) of post-employment benefits, and a recovery of R$ 10,288 of expenses related to other long-term benefits ( R$ 7,638 in 2017) , and refers to the amount registered under the accrual method.
Transactions with entities under common control basically refers to transmission system charge paid by the Company’s subsidiaries to the direct or indirect subsidiaries of State Grid Corporation of China.
Transactions involving controlling shareholders, entities under common control or significant influence and joint ventures:
Consolidated | |||||||||||||||
ASSETS |
| LIABILITIES |
| INCOME | EXPENSES | ||||||||||
December 31, 2018 | December 31, 2017 | December 31, 2018 | December 31, 2017 | 2018 | 2017 | 2018 | 2017 | ||||||||
Advances | |||||||||||||||
BAESA – Energética Barra Grande S.A. | - | - | 657 | 691 | - | - | - | - | |||||||
Foz do Chapecó Energia S.A. | - | - | 930 | 979 | - | - | - | - | |||||||
ENERCAN - Campos Novos Energia S.A. | - | - | 1,155 | 1,212 | - | - | - | - | |||||||
EPASA - Centrais Elétricas da Paraiba | - | - | 418 | 440 | - | - | - | - | |||||||
Energy purchase and sales, and charges | |||||||||||||||
Entities under common control (State Grid of China subsidiaries) | - | - | 16 | 13,330 | - | - | 152,369 | 91,302 | |||||||
BAESA – Energética Barra Grande S.A. | - | - | 2,993 | 13,169 | 12 | - | 44,575 | 80,362 | |||||||
Foz do Chapecó Energia S.A. | - | 41,850 | 37,415 | 18 | - | 490,713 | 381,193 | ||||||||
ENERCAN - Campos Novos Energia S.A. | 943 | 823 | 78,639 | 51,381 | 10,338 | 8,763 | 354,430 | 281,530 | |||||||
EPASA - Centrais Elétricas da Paraiba | - | - | 13,397 | 19,458 | 19 | - | 143,845 | 137,376 | |||||||
Intangible Assets, property plant and equipment, materials and service rendered | |||||||||||||||
BAESA – Energética Barra Grande S.A. | 2 | 153 | - | - | 2,225 | 1,582 | - | - | |||||||
Foz do Chapecó Energia S.A. | 15 | 2 | - | - | 2,143 | 1,726 | - | - | |||||||
ENERCAN - Campos Novos Energia S.A. | 2 | 152 | - | - | 1,902 | 1,665 | - | - | |||||||
EPASA - Centrais Elétricas da Paraíba S.A. | 534 | 416 | - | - | 3 | (469) | - | - | |||||||
Intragroup loans | |||||||||||||||
EPASA - Centrais Elétricas da Paraíba S.A. | - | - | - | - | - | 327 | - | - | |||||||
Dividends and interest on capital | - | - | - | ||||||||||||
BAESA – Energética Barra Grande S.A. | 3 | 108 | - | - | - | - | - | - | |||||||
Chapecoense Geração S.A. | 33,733 | 32,734 | - | - | - | - | - | - | |||||||
ENERCAN - Campos Novos Energia S.A. | 65,010 | 21,184 | - | - | - | - | - | - | |||||||
Others | - | ||||||||||||||
Instituto CPFL | - | - | - | - | - | - | 4,151 | 3,613 | |||||||
( 31 ) INSURANCE
The subsidiaries maintain insurance policies with coverage based on specialized advice and takes into account the nature and degree of risk. The amounts are considered sufficient to cover any significant losses on assets and/or responsibilities. The main insurance policies are:
113
(Free Translation of the original in Portuguese)
Standard Financial Statements – DFP – Date: December 31, 2018 - CPFL Energia S.A.
Description | Type of coverage | December 31, 2018 | ||
Concession financial asset / Intangible assets | Fire, lightning, explosion, machinery breakdown, electrical damage and engineering risk | 7,630,552 | ||
Transport | National transport | 502,930 | ||
Stored materials | Fire, lightning, explosion and robbery | 249,501 | ||
Automobiles | Comprehensive cover | 14,585 | ||
Civil liability | Electric energy distributors and others | 268,000 | ||
Personnel | Group life and personal accidents | 745,991 | ||
Others | Operational risks and others | 352,931 | ||
Total | 9,764,489 |
For the civil liability insurance of the officers, the insured amount is shared among the companies of the CPFL Energia Group. The premium is paid individually by each company involved, and the revenue is the base for the apportionment criterion.
( 32 ) RISK MANAGEMENT
The Group’s businesses comprise mainly the generation, trading and distribution of electricity. As concessionaire of public services, the activities and/or tariffs of its major subsidiaries are regulated by ANEEL.
Risk management structure
At CPFL Group, the risk management is conducted through a structure that involves the Board of Directors and Supervisory Board, Advisory Committees, Executive Board, Internal Audit, Corporate Risks and Compliance Management and business areas. This management is regulated by the Corporate Risk Management Policy, which describes the risk management model as well as the attributions of each agent and the exposures of the main risks.
The Board of Directors of CPFL Energia is responsible for deciding on the risk limit methodologies recommended by the Executive Board, and for being aware of the exposures and mitigation plans presented in the event these limits are exceeded. This forum is also responsible for being aware of and monitoring any important weaknesses in controls and/or processes, as well as relevant regulatory compliance failures, following up on the plans proposed by the Executive Board to correct them.
The Advisory Committee(s) of the Board of Directors, in its role(s) of technical body(ies), is responsible for becoming aware of (i) the risk monitoring models, (ii) the exposures to risks, and (iii) the control levels (including their effectiveness), and follow the mitigation actions indicated for the reframing of the exposures of the approved limits, supporting the Board of Directors in the performance of its statutory role related to risk management .
The Fiscal Council of CPFL Energia is responsible for, among other things, certifying that Management has means to identify the risks on the preparation and disclosure of the financial statements to which the CPFL Group is exposed as well as for monitoring the effectiveness of the control environment.
The Executive Board of CPFL Energia is responsible for conducting businesses within the risk limits defined, and should take the required measures to avoid that the exposure to risks exceeds such limits and report any excess of the limit to the Board of Directors of CPFL Energia, presenting mitigation actions.
The Internal Audit, Risks and Compliance Management is responsible for the (i) coordination of the risk management process at the CPFL Group, developing and keeping updated Corporate Risk Management methodologies that involve the identification, measurement, monitoring and reporting of the risks to which the CPFL Group is exposed; (ii) periodic monitoring of the risk exposures and monitoring of the implementation of mitigation actions by the business managers; (iii) monitoring and reporting of the status of the mitigation plans signaled by for reclassification of the exposures to the approved limits; and (iv) assessment of theinternal control environment of the CPFL Group companies and interaction with the respective Business Managers, seeking the definition of action plans in the event of deficiencies identified.
114
(Free Translation of the original in Portuguese)
Standard Financial Statements – DFP – Date: December 31, 2018 - CPFL Energia S.A.
The business areas have the primary responsibility for the management of the risks inherent to its processes, and should conduct them within the exposure limits defined and implementing mitigation plans for the main exposures as well as develop and maintain an proper envirorment of operational controls to effectiveness and business continuity and its associated business units.
The main market risk factors that affect the businesses are as follows:
Foreign exchange risk: This risk derives from the possibility of the Group incurring losses and cash constraints due to fluctuations in exchange rates, increasing the balances of liabilities denominated in foreign currency or decreasing the portion of revenue arising from annual adjustment of part of the tariff based on the fluctuation of the dollar, in power sale agreements of the joint venture ENERCAN. The exposure related to funding in foreign currency is hedged by swap transactions. The exposure related to ENERCAN revenue, proportional to the interest held by the Company, is hedged by financial instruments such as the zero cost collar described in note 33.b.1. The quantification of these risks is presented in note 33. In addition, the subsidiaries are exposed in their operating activities to fluctuations in exchange rates on purchase of electricity from Itaipu. The compensation mechanism - CVA protects the distribution subsidiaries against any economic losses.
Interest rate risk and inflation indexes: This risk arises due to the possibility of the Group incurring losses due to fluctuations in interest rates and in inflation indexes, which would increase the finance costs related to borrowings and debentures. The quantification of this risk is presented in note 33.
Credit risk:this risk arises from the possibility of the subsidiaries incurring losses resulting from difficulties in collecting amounts billed to customers. This risk is managed by the sales and services segments through norms and guidelines applied in terms of the approval, guarantees required and monitoring of the operations. In the distribution segment, even though it is highly pulverized, the risk is managed through monitoring of defaults, collection measures and cutting off supply. In the generation segment there are contracts under the regulated environment (ACR) and bilateral agreements that call for the posting of guarantees.
Risk of under/overcontracting from distributors:risk inherent to the energy distribution business in the Brazilian market to which the distributors of the CPFL Group and all distributors in the market are exposed. Distributors are prevented from fully passing through the costs of their electric energy purchases in two situations: (i) volume of energy contracted above 105% of the energy demanded by consumers and (ii) level of contracts lower than 100% of such demanded energy. In the first case, the energy contracted above 105% is sold in the CCEE (Electric Energy Trading Chamber) and is not passed through to consumers, that is, in PLD (Spot price used to valuate the energy traded in the spot market – “Preço de Liquidação de Diferenças”) scenarios lower than the purchase price of these contracts, there is a loss for the concession. In the second case, the distributors are required to purchase energy at the PLD amount at the CCEE and do not have guarantees of full pass-through to the consumer tariffs, there is a penalty for insufficiency of contractual guarantee. These situations may be mitigated if the distributors are entitled to exposures or involuntary surpluses.
Market risk of commercialization companies:this risk arises from the possibility of commercialization companies incurring losses due to variations in the prices that will value the positions of energy surplus or deficit of its portfolio in the free market, marked against the market price of electricity.
Risk of energy shortages:the energy sold by subsidiaries is primarily generated by hydropower plants. A prolonged period of low rainfall could result in a reduction in the volume of water in the power plants’ reservoirs, compromising the recovery of their volume, and resulting in losses due to the increase in the cost of purchasing energy or a reduction in revenue due to the introduction of comprehensive electric energy saving programs or other rationing programs, as in 2001.
Rainfalls below normal levels observed in the period from May to September did not cause energy supply risk in 2018, however, there was a strong thermoelectric dispatch and consequent reduction of hydroelectric generation, which significantly impacted the costs with purchase of energy and charges for the electric sector agents in this period.
Risk of acceleration of debts:the Company has borrowing agreements and debentures with restrictive covenants normally applicable to these types of transactions. These covenants are monitored and do notrestrict the capacity to operate normally, if met at the contractual intervals or if prior agreement is obtained from the creditors for failure to meet.
115
(Free Translation of the original in Portuguese)
Standard Financial Statements – DFP – Date: December 31, 2018 - CPFL Energia S.A.
Regulatory risk: The electric energy supplied tariffs charged to captive consumers by the distribution subsidiaries are set by ANEEL, at intervals established in the concession agreements entered into with the Federal Government and in accordance with the periodic tariff review methodology established for the tariff cycle. Once the methodology has been ratified, ANEEL establishes tariffs to be charged by the distributor to the final consumers. In accordance with Law 8,987/1995, the tariffs set shall ensure the economic and financial equilibrium of the concession agreement at the time of the tariff review, but could result in lower adjustments than expected by the electric energy distributors.
Financial instruments risk management
The Group maintains operating and financial policies and strategies to protect the liquidity, safety and profitability of their assets. Accordingly, control and follow-up procedures are in place as regards the transactions and balances of financial instruments, for the purpose of monitoring the risks and current rates in relation to market conditions.
Risk management controls: In order to manage the risks inherent to the financial instruments and to monitor the procedures established by Management, the Group uses Luna and Bloomberg software systems to calculate the mark to market, stress testing and duration of the instruments, and assess the risks to which the Group is exposed. Historically, the financial instruments contracted by the Group supported by these tools have produced adequate risk mitigation results. It must be stressed that the Company and its subsidiaries routinely contract derivatives, always with the appropriate levels of approval, only in the event of exposure that Management regards as a risk. The Group does not enter into transactions involving speculative derivatives.
( 33 ) FINANCIAL INSTRUMENTS
The main financial instruments, at fair value and/or the carrying amount is significantly different of the respective fair value, classified in accordance with the Group’s accounting practices, are:
Consolidated | |||||||||
December 31, 2018 | |||||||||
Note | Category / Measurement | Level (*) | Carrying amount |
| Fair value | ||||
Assets | |||||||||
Cash and cash equivalent | 5 | (a) | Level 1 | 342,346 | 342,346 | ||||
Cash and cash equivalent | 5 | (a) | Level 2 | 1,549,111 | 1,549,111 | ||||
Derivatives | 33 | (a) | Level 2 | 640,625 | 640,625 | ||||
Derivatives - Zero-cost collar | 33 | (a) | Level 3 | 16,367 | 16,367 | ||||
Concession financial asset - distribution | 10 | (a) | Level 3 | 7,430,149 | 7,430,149 | ||||
Total | 9,978,598 | 9,978,598 | |||||||
Liabilities | |||||||||
Borrowings - principal and interest | 16 | (b) | Level 2 (***) | 5,804,704 | 5,778,656 | ||||
Borrowings - principal and interest (**) | 16 | (a) | Level 2 | 5,631,255 | 5,631,255 | ||||
Debentures - Principal and interest | 17 | (b) | Level 2 (***) | 8,506,478 | 8,551,063 | ||||
Debentures - Principal and interest (**) | 17 | (a) | Level 2 | 434,367 | 434,367 | ||||
Derivatives | 33 | (a) | Level 2 | 31,798 | 31,798 | ||||
Total | 20,408,602 | 20,427,139 | |||||||
(*) Refers to the hierarchy for fair value measurement | |||||||||
(**) As a result of the initial designation of this financial liability, the consolidated balances reported a gain of R$ 37,421 in 2018 (a gain of R$ 21,137 in 2017). | |||||||||
(***) Only for disclosure purposes, in accordance with CPC 40 (R1) / IFRS 7 | |||||||||
Key | |||||||||
Category: | |||||||||
(a) - Measured at fair value through profit or loss | |||||||||
(b) - Measured at amortized cost | |||||||||
The classification of financial instruments in “amortized cost” or “fair value through profit or loss” is based on business model and in the caractheristics of expected cash flow for each instrument.
The financial instruments for which the carrying amounts approximate the fair values, due to their nature, at the end of the reporting year are:
116
(Free Translation of the original in Portuguese)
Standard Financial Statements – DFP – Date: December 31, 2018 - CPFL Energia S.A.
· Financial assets: (i) consumers, concessionaires and licensees, (ii) leases, (iii) intercompany loans between associates, subsidiaries and parent company, (iv) receivables – CDE, (v) pledges, funds and restricted deposits, (vi) services rendered to third parties, (vii) collection agreements and (viii) sector financial asset;
· Financial liabilities: (i) trade payables, (ii) regulatory charges, (iii) use of public asset, (iv) consumers and concessionaires, (v) FNDCT/EPE/PROCEL, (vi) collection agreement, (vii) reversal fund, (viii) payables for business combination, (ix) tariff discounts – CDE and (x) sector financial liability.
In addition, in 2018 there were no transfers between the fair value hierarchy levels.
a) Measurement of financial instruments
As mentioned in note 4, the fair value of a security corresponds to its maturity value (redemption value) adjusted to present value by the discount factor (relating to the maturity date of the security) obtained from the market interest curve, in Brazilian reais.
CPC 40 (R1) and IFRS 7 require the classification into a three-level hierarchy for fair value measurement of financial instruments, based on observable and unobservable inputs related to the measurement of a financial instrument at the measurement date.
CPC 40 (R1) and IFRS 7 also define observable inputs as market data obtained from independent sources and unobservable inputs as those that reflect market assumptions.
The three levels of the fair value hierarchy are:
Level 1: Quoted prices in an active market for identical instruments;
Level 2: Observable inputs other than quoted prices in an active market that are observable for the asset or liability, directly (i.e. as prices) or indirectly (i.e. derived from prices);
Level 3: Instruments whose relevant factors are not observable market inputs.
As the distribution concessionaries classified the respective concession financial assets as fair value through profit or loss, the relevant factors for fair value measurement are not publicly observable. Therefore, the fair value hierarchy classification is level 3. The movements and respective gains (losses) in profit for or loss at the period are R$ 345,015 (R$ 204,443 in 2017) and the main assumptions are described in note 10 and 25.
Additionally, the main assumptions used in the fair value measurement of the zero-cost collar derivative, the fair value hierarchy of which is Level 3, are disclosed in note 33 b.1.
The Company recognizes in “Investments at cost” in the financial statements the 5.94% interest held by the indirect subsidiary Paulista Lajeado Energia S.A. in the total capital of Investco S.A. (“Investco”), in the form of 28,154,140 common shares and 18,593,070 preferred shares. As Investco’sshares are not traded on the stock exchange and the main objective of its operations is to generate electric energy for commercialization by the shareholders holding the concession, the Company opted to recognize the investment at cost, since there are no available reliable information for the fair value calculation.
b) Derivatives
The Group has the policy of using derivatives to hedge against the risks of fluctuations in exchange and interest rates, without any speculative purposes. The Group has currency hedges in a volume compatible with the net exchange exposure, including all assets and liabilities tied to exchange rate changes.
The hedging instruments entered into by the Group are currency or interest rate swaps with no leverage component, margin call requirements or daily or periodic adjustments. Furthermore, in 2015 the subsidiary CPFL Geração contracted a zero-cost collar derivative (see item b.1 below).
As a large part of the derivatives entered into by the subsidiaries have their terms fully aligned with the hedged debts, and in order to obtain more relevant and consistent accounting information through the recognition of income and expenses, these debts were designated for the accounting recognition at fair value (notes 16 and 17). Other debts that have terms different from the derivatives contracted as a hedgecontinue to be recognized at amortized cost. Furthermore, the Group did not adopt hedge accounting for transactions with derivative instruments.
117
(Free Translation of the original in Portuguese)
Standard Financial Statements – DFP – Date: December 31, 2018 - CPFL Energia S.A.
At December 31, 2018, the Group had the following swap transactions, all traded on the over-the-counter market:
Fair values (carrying amounts) | ||||||||||||||||||
Strategy | Assets | Liabilities | Fair value, net | Values at cost, net (1) | Gain (loss) on mark to market | Currency / debt index | Currency /swap index | Maturity range | Notional | |||||||||
Derivatives to hedge debts designated at fair value | ||||||||||||||||||
Exchange rate hedge | ||||||||||||||||||
Bank Loans - Law 4.131 | 592,520 | (10,775) | 581,745 | 633,270 | (51,525) | US$ + (Libor 3 months + 0.8% to 1.55% or 2.3% to 4.32%) | 99.80% to 116% of CDI | October 2018 to March 2022 | 4,186,051 | |||||||||
Bank Loans - Law 4.131 | 2,899 | (21,023) | (18,124) | (3,972) | (14,152) | Euro + 0.42% to 0.96% | 102% to 105.8% of CDI | April 2019 to March 2022 | 879,630 | |||||||||
595,418 | (31,798) | 563,620 | 629,298 | (65,678) | ||||||||||||||
Hedge variation price index | ||||||||||||||||||
Debêntures | 23,081 | - | 23,081 | 2,070 | 21,012 | IPCA + 5.8% to 5.86% | 100.15% to 104.3% of CDI | April 2019 to August 2025 | 416,600 | |||||||||
Derivatives to hedge debts not designated at fair value | ||||||||||||||||||
Price index hedge: | ||||||||||||||||||
Debentures | 22,125 | - | 22,125 | 21,548 | 577 | IPCA + 5.8% to 5.86% | 100.15% to 104.3% of CDI | April 2019 to August 2025 | 70,469 | |||||||||
Other (2): | ||||||||||||||||||
Zero cost collar | 16,367 | - | 16,367 | - | 16,367 | US$ | (note 32 b.1) | July 2018 to September 2020 | 44.083 | |||||||||
Total | 656,992 | (31,798) | 625,194 | 652,916 | (27,722) | |||||||||||||
Current | 309,484 | (8,139) | ||||||||||||||||
Noncurrent | 347,507 | (23,659) | ||||||||||||||||
For further details on terms and information on debts and debentures, see notes 16 and 17
(1)The value at cost are the derivative amount without the respective mark to market, while the notional refers to the balance of the debt and is reduced according to the respective amortization;
(2)Due to the characteristics of this derivative (zero-cost collar), the notional amount is presented in U.S. dollar.
Changes in derivatives are stated below:
Consolidated | ||||||||
At December 31, 2017 | Interest, inflation adjustment, exchange rate and mark to market | Repayment | At December 31, 2018 | |||||
Values at cost, net | ||||||||
To debts designated at fair value | 526,148 | 662,147 | (556,927) | 631,368 | ||||
To debts not designated at fair value | 17,881 | (21,817) | 25,484 | 21,548 | ||||
Other (zero cost collar) | - | 11,984 | (11,984) | - | ||||
Mark to market (*) | 9,095 | (36,817) | - | (27,722) | ||||
553,124 | 615,497 | (543,427) | 625,194 | |||||
(*)The effects on the income and comprehensive income of 2018 related to the fair value adjustments (MTM) of the derivatives are: (i) loss of R$ 14,533 for the debts designated at fair value, (ii) gain of R$ 13,407 for non- designated at fair value and (iii) loss of R$ 35,691 for other derivatives (zero cost collar).
As mentioned above, certain subsidiaries elected to mark to market debts for which they have fully debt-related derivatives instruments (note 16 and 17).
The Group has recognized gains and losses on their derivatives. However, as these derivatives are used as a hedging instrument, these gains and losses minimized the impacts of fluctuations in exchange and interest rates on the hedged debts. For years ended at December 31, 2018 and 2017, the derivatives generated the following impacts on the consolidated profit or loss, recognized in the line item of Finance costs on adjustment for inflation and exchange rate changes and in the consolidated comprehensive income in the credit risk in the market to market, related to debts at fair value.
118
(Free Translation of the original in Portuguese)
Standard Financial Statements – DFP – Date: December 31, 2018 - CPFL Energia S.A.
Gain (Loss) on result |
|
| ||||
Hedged risk / transaction | 2018 | 2017 | 2018 | |||
Interest rate variation | (19,747) | 1,446 | - | |||
Mark to market | 13,135 | 8,960 | 272 | |||
Exchange variation | 672,061 | (169,714) | - | |||
Mark to market | (47,904) | (76,544) | (2,025) | |||
1 | ||||||
617,545 | (235,852) | (1,753) | ||||
b.1) Zero-cost collar derivative transactions entered into by CPFL Geração
In 2015, the subsidiary CPFL Geração entered into a transaction involving put options and call options in US$, both having the same institution as counterpart, and that combined are featured as a transaction usually known as zero-cost collar. Entering into this transaction does not have any speculative purpose, in as much as it is aimed at minimizing any negative impacts on future revenue of the joint venture ENERCAN, which has electric energy sale agreements with annual adjustment of part of the tariff based on the dollar variation. In addition, according to Management’s view, the scenario in 2015 was favorable to enter into this type of financial instrument, considering the high volatility implicit in dollar options and the fact that there is no initial cost for this type of transaction.
The total amount contracted was US$ 111,817, with due dates between October 1, 2015 and September 30, 2020. At December 31, 2018, the total amount contracted was US$ 44,083, considering the options already settled until this date. The strike prices of the dollar options vary from R$ 4.20 to R$ 4.40 for put options and from R$ 5.40 to R$7.50 for call options.
These options were measured at fair value in a recurring manner, as required by IFRS 9 /CPC 48. The fair value of the options that are part of this transaction was calculated based on the following assumptions:
Valuation technique(s) and key information | We used the Black Scholes Option Pricing Model, which aims to obtain the fair price of the options involving the following variables: value of the asset, strike price of the option, interest rate, term and volatility. |
Significant unobservable inputs | Volatility determined based on the average market pricing calculations, future dollar and other variables applicable to this specific transaction, with average variation of 18.61%. |
Relationship between unobservable inputs and fair value (sensitivity) | A slight rise in long-term volatility, analyzed separately, would result in an insignificant increase in fair value. If the volatility were 10% higher and all the other variables remained constant, the net carrying amount (asset) would increase by R$ 587, resulting in a net asset of R$ 16,954. |
The following table reconciles the opening and closing balances of the call and put options for 2018, as required by IFRS 13/CPC 46:
119
(Free Translation of the original in Portuguese)
Standard Financial Statements – DFP – Date: December 31, 2018 - CPFL Energia S.A.
Consolidated | ||||||
Asset | Liability | Net | ||||
At December 31, 2016 | 57,715 | - | 57,715 | |||
Measurement at fair value | 16,715 | - | 16,715 | |||
Net cash, received from settlement of flows | (22,372) | - | (22,372) | |||
At December 31, 2017 | 52,058 | - | 52,058 | |||
Measurement at fair value | (23,707) | - | (23,707) | |||
Net cash, received from settlement of flows | (11,984) | - | (11,984) | |||
At December 31, 2018 | 16,367 | - | 16,367 | |||
The fair value measurement of these financial instruments was recognized as finance income (expense) of the year, and no effects were recognized in other comprehensive income.
c) Concession financial assets - distribution
As the distribution subsidiaries have classified the respective financial assets of the concession as measured at fair value through profit or loss, the relevant factors to measure the fair value are not publicly observable and there is no active market. Therefore, the classification of the fair value hierarchy is level 3.
Considering that all contractual characteristics are reflected in the recorded amounts, the Group believes that the carrying amounts reflect their fair values. The accounting measurement of the indemnity arising from the concession is made by applying contractual and legal regulatory criteria.
d) Market risk
Market risk is the risk that changes in market prices – e.g. foreign exchange rates and interest rates – will affect the Group’s income or the value of its holdings of financial instruments. The objective of market risk management is to manage and control market risk exposures within acceptable parameters, while optimizing the return. The Group uses derivatives to manage market risks.
Sensitivity analysis
In compliance with CVM Instruction No. 475/2008, the Group performed sensitivity analyses of the main risks to which their financial instruments (including derivatives) are exposed, mainly comprising changes in exchange and interest rates.
When the risk exposure is considered asset, the risk to be taken into account is a reduction in the pegged indexes, due to a consequent negative impact on the Group’s profit or loss. Similarly, if the risk exposure is considered liability, the risk is of an increase in the pegged indexes and the consequent negative effect on the profit or loss. The Group therefore quantify the risks in terms of the net exposure of the variables (dollar, euro, CDI, IGP-M, IPCA, TJLP and SELIC), as shown below:
d.1) Changes in exchange rates
Considering that the net exchange rate exposure at December 31, 2018 is maintained, the simulation of the effects by type of financial instrument for three different scenarios would be:
120
(Free Translation of the original in Portuguese)
Standard Financial Statements – DFP – Date: December 31, 2018 - CPFL Energia S.A.
Consolidated | ||||||||||
Income (expense) - R$ thousand | ||||||||||
Instruments | Exposure (a) | Risk | Exchange depreciation (b) | Currency appreciation of 25% (c) | Currency appreciation of 50% (c) | |||||
Financial liability instruments | (4,775,978) | (141,746) | 1,087,685 | 2,317,116 | ||||||
Derivatives - Plain Vanilla Swap | 4,845,349 | 143,805 | (1,103,484) | (2,350,772) | ||||||
69,371 | drop of dollar | 2,059 | (15,799) | (33,656) | ||||||
Financial asset instruments | - | - | - | - | ||||||
Financial liability instruments | (857,429) | (54,219) | 173,693 | 401,605 | ||||||
Derivatives - Plain Vanilla Swap | 871,755 | 55,125 | (176,595) | (408,315) | ||||||
14,326 | drop of euro | 906 | (2,902) | (6,710) | ||||||
Total | 83,697 | 2,965 | (18,701) | (40,366) | ||||||
Effects in the accumulated comprehensive income | 2,187 | (12,704) | (27,594) | |||||||
Effects in theincome of the year | 778 | (5,997) | (12,772) | |||||||
Income (expense) - R$ thousand | ||||||||||
Instruments | Exposure | Risk | Currency depreciation (b) | Currency appreciation of 25% (c) | Currency appreciation of 50% (c) | |||||
Derivatives zero-cost collar | 44,083 | (d) | raise of dollar | (1,770) | (17,126) | (32,482) | ||||
(a) The exchange rate considered at 12/31/2018 was R$ 3.87 per US$ 1.00 and R$ 4.44 per €$ 1.00.
(b) As per the exchange rate curves obtained from information made available by B3 S.A., with the exchange rate being considered at R$ 3.99 and 4.72, and the currency depreciation at 2.97% and 6.32% for US$ and €$, respectively at 12/31/2018.
(c) As required by CVM Instruction No. 475/2008, the percentage increases in the ratios applied refer to the information made available by the B3 S.A..
(d) Owing to the characteristics of this derivative (zero-cost collar), the notional amount is presented in US$.
Except for the zero-cost collar, as the net exchange exposure of the dollar and the euro for the other derivative instruments is an asset, the risk is a drop in the dollar, and the euro, therefore, the exchange rate is appreciated by 25% and 50% in relation to the probable exchange rate.
d.2) Changes in interest rates
Assuming that the scenario of net exposure of the financial instruments indexed to floating interest rates at December 31, 2018 is maintained, the net finance cost for the next 12 months for each ofthe three scenarios defined, would be:
|
| Consolidated | ||||||||||||
Instruments |
| Exposure |
| Risk |
| Rate in the period | Rate likely scenario (a) | Likely scenario | Raising/Drop index by 25% (b) | Raising/Drop index by 50% (b) | ||||
Financial asset instruments |
| 2,180,549 |
|
|
|
|
|
|
| 143,262 |
| 179,078 |
| 214,893 |
Financial liability instruments |
| (7,104,019) |
|
|
|
|
|
|
| (466,734) |
| (583,418) |
| (700,101) |
Derivatives - Plain Vanilla Swap |
| (5,658,788) |
|
|
|
|
|
|
| (371,782) |
| (464,728) |
| (557,674) |
|
| (10,582,258) |
| raise of CDI |
| 6.40% |
| 6.57% |
| (695,254) |
| (869,068) |
| (1,042,882) |
|
|
|
|
|
|
|
|
|
|
|
|
|
|
|
Financial liability instruments |
| (153,424) |
|
|
|
|
|
|
| (4,894) |
| (6,118) |
| (7,341) |
|
| (153,424) |
| raise of IGP-M |
| 7.54% |
| 3.19% |
| (4,894) |
| (6,118) |
| (7,341) |
|
|
|
|
|
|
|
|
|
|
|
|
|
|
|
Financial liability instruments |
| (4,829,388) |
|
|
|
|
|
|
| (339,506) |
| (424,382) |
| (509,259) |
|
| (4,829,388) |
| raise of TJLP and TLP | 6.72% to 7.42% |
| 7.03% |
| (339,506) |
| (424,382) |
| (509,259) | |
|
|
|
|
|
|
|
|
|
|
|
|
|
|
|
Financial liability instruments |
| (1,801,795) |
|
|
|
|
|
|
| (60,180) |
| (45,135) |
| (30,090) |
Derivatives - Plain Vanilla Swap |
| 550,511 |
|
|
|
|
|
|
| 18,387 |
| 13,790 |
| 9,194 |
Concession financial asset |
| 7,430,149 |
|
|
|
|
|
|
| 248,167 |
| 186,125 |
| 124,083 |
|
| 6,178,865 |
| drop of IPCA |
| 3.69% |
| 3.34% |
| 206,374 |
| 154,780 |
| 103,187 |
|
|
|
|
|
|
|
|
|
|
|
|
|
|
|
Setorial financial assets and liabilities |
| 1,508,158 |
|
|
|
|
|
|
| 98,784 |
| 74,088 |
| 49,392 |
Financial liability instruments |
| (114,117) |
|
|
|
|
|
|
| (7,475) |
| (5,606) |
| (3,737) |
|
| 1,394,041 |
| drop of SELIC |
| 6.40% |
| 6.55% |
| 91,309 |
| 68,482 |
| 45,655 |
|
|
|
|
|
|
|
|
|
|
|
|
|
|
|
Total |
| (7,992,164) |
|
|
|
|
|
|
| (741,971) |
| (1,076,306) |
| (1,410,640) |
|
|
|
|
|
|
|
|
|
|
|
|
|
|
|
Effects in the accumulated comprehensive income |
|
|
|
|
|
|
|
|
| 753 |
| 597 |
| 442 |
Effects in the income of the year |
|
|
|
|
|
|
|
|
| (742,724) |
| (1,076,903) |
| (1,411,082) |
(a) The indexes were obtained from information available in the market.
(b) As required by CVM Instruction number 475/2008, the percentages of increase were applied to the indexes in the probable scenario.
121
(Free Translation of the original in Portuguese)
Standard Financial Statements – DFP – Date: December 31, 2018 - CPFL Energia S.A.
Additionally, the debts exposed to pre-fixed indexes would generate an expense of R$ 62,048.
e) Credit risk
Credit risk is the risk of financial loss to the Group if a customer or counterparty to a financial instrument fails to meet its contractual obligations, and arises principally from the Group’s receivables from Consumers, Concessionaires and Licensees and financial instruments.Monthly, the risk is monitored and classified according to the current exposure, considering the limit approved by Management.
Impairment losses on financial assets recognized in profit or loss are presented in note 6 – Consumers, Concessionaires and Licensees.
Consumers, Concessionaries and Licensees
The Group’s exposure to credit risk is influenced mainly by the individual characteristics of each customer. However, Management also considers the factors that may influence the credit risk of its customer base.
The Group uses an allowance matrix to measure the expected credit losses of trade receivables from individual customers, which comprise a very large number of small balances.
Loss rates are based on actual credit loss experience over the past years. These rates reflect differences between economic conditions during the period over which the historical data has been collected, current conditions and the Group’s view of economic conditions over the expected lives of the receivables.
At December 31, 2018, the maximum exposure to credit risk for trade receivables by type of counterparty was represented by the total recorded balance presented in 6 – Consumers, Concessionaires and Licensees.
Cash and cash equivalents
The Group limits its exposure to credit risk by investing only in liquid debt securities and only with counterparties that have a credit rating of at leastAA-.
The Group considers that its cash and cash equivalents have low credit risk based on the external credit ratings of the counterparties.Management did not identify for the years 2017 and 2018 that the securities were impaired, based in the criteria of expected losses.
f) Liquidity analysis
The Company manages liquidity risk by continuously monitoring forecast and actual cash flows, and by matching the maturity profiles of its financial liabilities. The table below sets out details of the contractual maturities of the financial liabilities as at December 31, 2018, taking into account principal and future interest, and is based on the undiscounted cash flow, considering the earliest date on which the Group has to settle their respective obligations.
122
(Free Translation of the original in Portuguese)
Standard Financial Statements – DFP – Date: December 31, 2018 - CPFL Energia S.A.
Consolidated | ||||||||||||||||
December 31, 2018 | Note |
| Less than 1 month | 1-3 months | 3 months to 1 year | 1-3 years | 4-5 years | More than 5 years | Total | |||||||
Trade payables | 15 | 2,368,142 | 29,618 | 325 | 194,898 | - | 138,138 | 2,731,121 | ||||||||
Borrowings - principal and interest | 16 | 204,626 | 686,531 | 2,235,355 | 5,630,763 | 2,762,770 | 2,765,395 | 14,285,440 | ||||||||
Derivatives | 33 | - | 32 | 9,908 | 15,695 | 10,327 | - | 35,962 | ||||||||
Debentures - principal and interest | 17 | 81,852 | 450,576 | 1,009,204 | 5,871,723 | 2,349,058 | 1,196,565 | 10,958,978 | ||||||||
Regulatory charges | 19 | 149,159 | 1,497 | - | - | - | - | 150,656 | ||||||||
Use of public asset | 782 | 4,435 | 15,715 | 36,137 | 48,193 | 147,643 | 252,905 | |||||||||
Others | 22 | 83,372 | 92,414 | 50,208 | 3,054 | 3,054 | 56,050 | 288,150 | ||||||||
Consumers and concessionaires | 43,022 | 42,992 | 7,598 | - | - | 47,831 | 141,443 | |||||||||
EPE / FNDCT / PROCEL | 35 | 4,336 | 33,682 | - | - | - | 38,052 | |||||||||
Collections agreement | 40,188 | 44,831 | - | - | - | - | 85,018 | |||||||||
Reversal fund | 127 | 255 | 1,330 | 3,054 | 3,054 | 8,219 | 16,039 | |||||||||
Business acquisition | - | - | 7,598 | - | - | - | 7,598 | |||||||||
Total | 2,887,933 | 1,265,103 | 3,320,715 | 11,752,270 | 5,173,402 | 4,303,791 | 28,703,212 | |||||||||
( 34 ) NON-CASH TRANSACTIONS
Consolidated | ||||
December 31, 2018 | December 31, 2017 | |||
Transactions resulting from business combinations | ||||
Concession financial asset | - | (12,338) | ||
Intangible asset | - | (22,165) | ||
Property, plant and equipment | - | (4,800) | ||
Acquisition price paid | - | (39,303) | ||
Other transactions | ||||
Interest capitalized in property, plant and equipment | 10,591 | 29,817 | ||
Interest capitalized in concession intangible asset - distribution infraestruture | 18,015 | 20,726 | ||
Intercompany loan payment with dividend of noncontrolling shareholders | 377 | 259 | ||
Provision for environmental costs capitalized in property, plant and equipment | 1,684 | 41,213 | ||
Transfer between fixed assets and other assets | 5,515 | 32,600 | ||
At 2018, on the Holding CPFL Energia there was a payment of advance for future capital of R$ 350,000 (R$ 1,406,520 at 2017).
( 35 ) COMMITMENTS
The Group’s commitments as regards long-term energy purchase agreements and plant construction projects at December 31, 2018, as follows:
Consolidated | ||||||||||||
Commitments at December 31, 2018 | Duration | Less than 1 year | 1-3 years | 4-5 years | More than 5 years | Total | ||||||
Rentals | until 9 years | 8,973 | 13,671 | 13,041 | 10,003 | 45,688 | ||||||
Energy purchase agreements (except Itaipu) | until 26 years | 11,799,846 | 20,935,148 | 21,321,793 | 53,391,392 | 107,448,179 | ||||||
Energy purchase from Itaipu | until 26 years | 2,726,836 | 5,474,503 | 5,740,138 | 18,536,806 | 32,478,283 | ||||||
Electricity network usage charge | until 31 years | 2,461,362 | 6,499,568 | 8,296,273 | 30,353,340 | 47,610,543 | ||||||
GSF renegotiation | until 29 years | 7,580 | 43,696 | 52,356 | 312,498 | 416,130 | ||||||
Power plant construction projects | until 2 years | 39,459 | 2,028 | - | - | 41,487 | ||||||
Trade payables | until 16 years | 125,394 | 280,971 | 316,999 | 1,500,320 | 2,223,684 | ||||||
Other commitments related to the operation of concessions | until 14 years | 13,408 | 28,636 | 31,529 | 186,980 | 260,553 | ||||||
17,182,858 | 33,278,221 | 35,772,129 | 104,291,339 | 190,524,547 | ||||||||
The power plant construction projects include commitments made basically to construction related to the subsidiaries of the renewable energy segment.
123
(Free Translation of the original in Portuguese)
Standard Financial Statements – DFP – Date: December 31, 2018 - CPFL Energia S.A.
INDEPENDENT AUDITORS' REPORT
KPMG Auditores Independentes
Avenida Coronel Silva Telles, nº 977, 10º andar - Dahruj Tower
13024-001 - Campinas/SP - Brasil
Caixa Postal 737 - CEP: 13012-970 - Campinas/SP - Brasil
Telefone +55 (19) 3198-6000, Fax +55 (19) 3198-6001
www.kpmg.com.br
Independent auditors’ report on the individual and consolidated financial statements
To the Directors and Shareholders of
CPFL Energia S.A.
Campinas - SP
Opinion
We have audited the individual and consolidated financial statements of CPFL Energia S.A. (the “Company”), identified as the parent company and consolidated, respectively, which comprise the statement of financial position as of December 31, 2018 and the respective statements of income, comprehensive income, changes in shareholder´s equity and cash flows for the year then ended, and the corresponding notes comprising significant accounting policies and other explanatory information.
In our opinion, the aforementioned financial statements present fairly, in all material aspects, the individual and consolidated financial position of CPFL Energia S.A. as of December 31, 2018, and of its operations and cash flows for the year then ended, in accordance with the accounting practices adopted in Brazil and in accordance with the International Financial Reporting Standards (IFRS), as issued by the International Accounting Standards Board (IASB).
Basis for opinion
We conducted our audit in accordance with Brazilian and International Standards on Auditing. Our responsibilities under those standards are further described in the “Auditors’ responsibilities for the audit of the individual and consolidated financial statements” section of our report. We are independent of the Company and its subsidiaries in accordance with the ethical requirements of Ethics Standards Boards for Accountants and Professional Standard issued by Federal Accounting Council, and we have fulfilled our other ethical responsibilities in accordance with these requirements. We believe that the audit evidence we have obtained is sufficient and appropriate to provide a basis for our opinion.
Key audit matters
Key audit matters are those matters that, in our professional judgment, were of most significance in our audit of the current period. These matters were addressed in the context of our audit of the individual and consolidated financial statements as a whole, and in forming our opinion thereon, and we do not provide a separate opinion on these matters.
124
(Free Translation of the original in Portuguese)
Standard Financial Statements – DFP – Date: December 31, 2018 - CPFL Energia S.A.
(a) Revenue recognition from energy distributed, but not billed
(Notes 3.10 and 25 to the individual and consolidated financial statements)
Not billed revenue recognized by the Company corresponds to the electricity distributed, but not billed to the consumers, and its billing is measured based on the reading cycles that, in some cases, exceed the period of accounting closing. The recognition of the not billed revenue takes into consideration all of the historical data, the systems configuration, as well as Company´s judgments in order to estimate the consumption by consumers. Due to the relevance of the amounts and the judgments involved that can affect the amount of the revenues in the consolidated financial statements and in the amount of the investment recorded under the equity method in the individual financial statements, we considered this matter as significant for our audit.
How this matter has been conducted in our audit
We evaluated the design, implementation, and effectiveness of key internal controls related to the determination of the amount of the revenue recognized from energy distributed, but not billed. We involved our information technology specialists to evaluate the systems and the technology environment used in the determination of the balances recorded. We analyzed the key assumptions used by the Company in the development of such estimates, such as the technical and commercial losses index. In addition, we tested the integrity and accuracy of the data used in the calculation and performed a valuation test, by comparing the amounts recognized by the Company with assumptions resulting from our independent auditing tests. We also assessed whether the disclosures in the consolidated financial statements were in accordance with the applicable standards.
Based on the evidence obtained from the procedures summarized above, we consider acceptable the revenue recognition from energy distributed, but not billed, in the context of the consolidated financial statements taken as a whole, for year ended December 31, 2018.
(b) Impairment of the deferred tax assets
(Notes 3.11 and 9 to the individual and consolidated financial statements)
The individual and consolidated financial statements include tax credits over tax loss carryforwards and temporary differences, for which the realization is supported by estimates of taxable income based on the Company´s judgments and supported in its business plan. Due to the uncertainties that are inherent to the process of determining the future taxable income estimates, which support the recognition of the impairment of the tax credits, and the fact that any change in methodologies and assumptions for the determination of estimates that may have a material impact the value of such assets and, consequently, the individual and consolidated financial statements taken as a whole, we considered this matter as significant for our audit.
How this matter has been conducted in our audit
We evaluated the design, implementation and operational effectiveness of the key internal controls related to the preparation and review of the business plan, budget, technical studies and analyses as to the probability of existence of future taxable income. With the support of our corporate finance specialists, we analyzed the reasonableness and consistency of the data and assumptions and of the methodologies used by the Company for the projection of future taxable income, particularly those related to the projected economic growth, volume, and price of sales of energy, and the discount rates, and we compared with the data obtained from external sources. With the support of our tax specialists, we evaluated the calculation in which the current tax rates are applied. We also assessed whether the disclosures in the individual and consolidated financial statements consider all relevant information.
In the course of our audit work, we identified adjustments that would affect the measurement and disclosure ofthe deferred tax assets, which were not recorded by management, because they were considered immaterial. Based on the evidence obtained from the procedures summarized above, we consider that the net realizable value of deferred tax assets is acceptable in the context of the individual and consolidated financial statements taken as a whole, related to the fiscal year ended on December 31, 2018.
Other matters
Statements of Value Added
125
(Free Translation of the original in Portuguese)
Standard Financial Statements – DFP – Date: December 31, 2018 - CPFL Energia S.A.
The individual and consolidated statements of value added (DVA) for the year ended December 31, 2018, prepared under the responsibility of the Company's management, and presented as supplementary information for IFRS purposes, were submitted for the auditing procedures jointly with audit of the Company's financial statements. For the purposes of forming our opinion, we evaluate whether these statements are reconciled with the financial statements and accounting records, as applicable, and if their form and content are in accordance with the criteria as defined in Technical Pronouncement CPC 09 - Statement of Added Value. In our opinion, this statement of value added have been properly prepared, in all material respects, in accordance with the criteria defined in this Technical Pronouncement and is consistent with the individual and consolidated financial statements taken as a whole.
Other information that accompanies the individual and consolidated financial statements and the auditor’s report
Management is responsible for the other information, which comprises the Management report.
Our opinion on the individual and consolidated financial statements does not cover the Management report and we do not express any form of assurance conclusion thereon.
In connection with our audit of the individual and consolidated financial statements, our responsibility is to read the Management Report and, in doing so, consider whether the other information is materially inconsistent with the financial statements or our knowledge obtained in the audit, or otherwise appears to be materially misstated. If, based on the work we have performed, we conclude that there is a material misstatement of this Management Report, we are required to report that fact. We have nothing to report in this regard.
Responsibilities of management and those charged with governance for the individual and consolidated financial statements
Management is responsible for the preparation and fair presentation of the individual and consolidated financial statements in accordance with the accounting practices adopted in Brazil and in accordance with the International Financial Reporting Standards (IFRS), as issued by the International Accounting Standards Board (IASB), and for such internal control as management determines is necessary to enable the preparation of the financial statements are free from material misstatement, due to fraud or error.
In preparing the individual and consolidated financial statements, management is responsible for assessing the Company’s ability to continue as a going concern, disclosing, as applicable, matters related to going concern and using the going concern basis of accounting unless management either intends to liquidate the Company or to cease operations, or has no realistic alternative but to do so.
Those charged with governance are responsible for overseeing the Company’s financial reporting process.
Auditors’ responsibilities for the audit of the individual and consolidated financial statements
Our objectives are to obtain reasonable assurance about whether the individual and consolidated financial statements as a whole are free from material misstatement, whether due to fraud or error, and to issue an auditors’ report that includes our opinion. Reasonable assurance is a high level of assurance, but is not a guarantee that an audit conducted in accordance with Brazilian and International Standards on Auditing will always detect a material misstatement when it exists. Misstatements can arise from fraud or error and are considered material if, individually or in the aggregate, they could reasonably be expected to influence the economic decisions of users taken on the basis of these individual and consolidated financial statements.
As part of an audit in accordance with Brazilian and International Standards on Auditing, we exercise professional judgment and maintain professional skepticism throughout the audit. We also:
· Identify and assess the risks of material misstatement of the individual and consolidated financial statements, whether due to fraud or error, design and perform audit procedures responsive to those risks, and obtain audit evidence that is sufficient and appropriate to provide a basis for our opinion. The risk of not detecting amaterial misstatement resulting from fraud is higher than for one resulting from error, as fraud may involve collusion, forgery, intentional omissions, misrepresentations, or the override of internal control.
126
(Free Translation of the original in Portuguese)
Standard Financial Statements – DFP – Date: December 31, 2018 - CPFL Energia S.A.
· Obtain an understanding of internal control relevant to the audit in order to design audit procedures that are appropriate in the circumstances, but not for the purpose of expressing an opinion on the effectiveness of the Company’s internal control.
· Evaluate the appropriateness of accounting policies used and the reasonableness of accounting estimates and related disclosures made by management.
· Conclude on the appropriateness of management’s use of the going concern basis of accounting and, based on the audit evidence obtained, whether a material uncertainty exists related to events or conditions that may cast significant doubt on the Company’s ability to continue as a going concern. If we conclude that a material uncertainty exists, we are required to draw attention in our auditors’ report to the related disclosures in the individual and consolidated financial statements or, if such disclosures are inadequate, to modify our opinion. Our conclusions are based on the audit evidence obtained up to the date of our auditors’ report. However, future events or conditions may cause the Company to cease to continue as a going concern.
· Evaluate the overall presentation, structure and content of the financial statements, including the disclosures, and whether the individual and consolidated financial statements represent the underlying transactions and events in a manner that achieves fair presentation.
· Obtain sufficient appropriate audit evidence regarding the financial information of the group entities or business activities within the Company to express an opinion on the individual and consolidated financial statements. We are responsible for the direction, supervision and performance of the group audit, and therefore, responsible for our audit opinion.
We communicate with those charged with governance regarding, among other matters, the planned scope and timing of the audit and significant audit findings, including any significant deficiencies in internal control that we identify during our audit.
We also provide those charged with governance with a statement that we have complied with relevant ethical requirements regarding independence, and communicate with them all relationships and other matters that may reasonably be thought to bear on our independence, and where applicable, related safeguards.
From the matters communicated with those charged with governance, we determine those matters that were of most significance in the audit of the financial statements of the current period and are therefore the key audit matters. We describe these matters in our auditors’ report unless law or regulation precludes public disclosure about the matter, or, when in extremely rare circumstances, we determine that a matter should not be communicated in our report because the adverse consequences of doing so would reasonably be expected to outweigh the public interest benefits of such communication.
Campinas, March 11, 2019.
KPMG Auditores Independentes
CRC (Regional Accounting Council) 2SP027612/O-4
(Original in Portuguese signed by)
Marcio José dos Santos
Accountant CRC 1SP252906/O-0
127
(Free Translation of the original in Portuguese)
Standard Financial Statements – DFP – Date: December 31, 2018 - CPFL Energia S.A.
Management declaration on financial statements
In compliance with the provisions in items V and VI of article 25 of the Brazilian Securities & Exchange Commission (CVM) Instruction No. 480, of December 7, 2009, as amended by CVM Instruction No. 586, of June 8, 2017, the chief executive officers and the officers of CPFL Energia S.A, a publicly traded company, with its registered office at Rodovia Engo Miguel Noel Nascentes Burnier, km 2,5, Parque São Quirino - Campinas - SP - Brasil, enrolled with the National Register of Legal Entities (CNPJ ) under No. 02.429.144/0001-93, hereby stated that:
a) they have reviewed and discussed, and agree with, the opinions expressed in the opinion ofKPMG Auditores Independentes on the financial statements ofCPFL Energiaof December 31, 2018;
b) they have reviewed and discussed, and agree with, the financial statements ofCPFL Energiaof December 31, 2018;
Campinas, March 11, 2019.
__________________________________ GUSTAVO ESTRELLA Chief Executive Officer, holding also the function of Chief Business Development Officer | |
__________________________________ YUMENG ZHAO Deputy Chief Executive Officer
| |
__________________________________ GUSTAVO PINTO GACHINEIRO Chief Institutional Relations Officer
|
__________________________________ YUEHUI PAN Chief Financial and Investor Relations Officer |
__________________________________ WAGNER LUIZ SCHNEIDER DE FREITAS Chief Business Management Officer |
__________________________________ KARIN REGINA LUCHESI Chief Market Operations Officer |
|
|
__________________________________ LUIS HENRIQUE FERREIRA PINTO Chief Regulated Operations Officer | |
128
(Free Translation of the original in Portuguese)
Standard Financial Statements – DFP – Date: December 31, 2018 - CPFL Energia S.A.
Management declaration on independent auditors’ report
In compliance with the provisions in items V and VI of article 25 of the Brazilian Securities & Exchange Commission (CVM) Instruction No. 480, of December 7, 2009, as amended by CVM Instruction No. 586, of June 8, 2017, the chief executive officers and the officers of CPFL Energia S.A, a publicly traded company, with its registered office at Rodovia Engo Miguel Noel Nascentes Burnier, km 2,5, Parque São Quirino - Campinas - SP - Brasil, enrolled with the National Register of Legal Entities (CNPJ ) under No. 02.429.144/0001-93, hereby stated that:
a) they have reviewed and discussed, and agree with, the opinions expressed in the opinion ofKPMG Auditores Independentes on the financial statements ofCPFL Energiaof December 31, 2018;
b) they have reviewed and discussed, and agree with, the financial statements ofCPFL Energiaof December 31, 2018;
Campinas, March 11, 2019.
__________________________________ GUSTAVO ESTRELLA Chief Executive Officer, holding also the function of Chief Business Development Officer | |
__________________________________ YUMENG ZHAO Deputy Chief Executive Officer
| |
__________________________________ GUSTAVO PINTO GACHINEIRO Chief Institutional Relations Officer
|
__________________________________ YUEHUI PAN Chief Financial and Investor Relations Officer |
__________________________________ WAGNER LUIZ SCHNEIDER DE FREITAS Chief Business Management Officer |
__________________________________ KARIN REGINA LUCHESI Chief Market Operations Officer |
|
|
__________________________________ LUIS HENRIQUE FERREIRA PINTO Chief Regulated Operations Officer | |
129
Pursuant to the requirements of the Securities Exchange Act of 1934, the registrant has duly caused this report to be signed on its behalf by the undersigned, thereunto duly authorized.
Date: March 28, 2019
| CPFL ENERGIA S.A. | ||
| By: | /S/ YueHui Pan | |
| Name: Title: | YueHui Pan Chief Financial Officer and Head of Investor Relations | |
FORWARD-LOOKING STATEMENTS
This press release may contain forward-looking statements. These statements are statements that are not historical facts, and are based on management's current view and estimates of future economic circumstances, industry conditions, company performance and financial results. The words "anticipates", "believes", "estimates", "expects", "plans" and similar expressions, as they relate to the company, are intended to identify forward-looking statements. Statements regarding the declaration or payment of dividends, the implementation of principal operating and financing strategies and capital expenditure plans, the direction of future operations and the factors or trends affecting financial condition, liquidity or results of operations are examples of forward-looking statements. Such statements reflect the current views of management and are subject to a number of risks and uncertainties. There is no guarantee that the expected events, trends or results will actually occur. The statements are based on many assumptions and factors, including general economic and market conditions, industry conditions, and operating factors. Any changes in such assumptions or factors could cause actual results to differ materially from current expectations.