UNITED STATES
SECURITIES AND EXCHANGE COMMISSION
SECURITIES AND EXCHANGE COMMISSION
Washington, D.C. 20549
FORM 6-K
REPORT OF FOREIGN PRIVATE ISSUER PURSUANT TO RULE 13A-16 OR 15D-16 UNDER THE
SECURITIES EXCHANGE ACT OF 1934
For the month of March, 2019
Commission File Number 32297
CPFL Energy Incorporated
(Translation of Registrant's name into English)
Rodovia Engenheiro Miguel Noel Nascentes Burnier, km 2,5, parte
CEP 13088-140 - Parque São Quirino, Campinas - SP
Federative Republic of Brazil
CEP 13088-140 - Parque São Quirino, Campinas - SP
Federative Republic of Brazil
(Address of principal executive office)
Indicate by check mark whether the registrant files or will file annual reports under cover Form 20-F or Form 40-F. Form 20-F ___X___ Form 40-F _______
Indicate by check mark if the registrant is submitting the Form 6-K in paper as permitted by Regulation S-T Rule 101(b)(1): [ ]
Indicate by check mark if the registrant is submitting the Form 6-K in paper as permitted by Regulation S-T Rule 101(b)(7): [ ]
If "Yes" is marked, indicate below the file number assigned to the registrant in connection with Rule 12g3-2(b): 82-_________________
Indicate by check mark if the registrant is submitting the Form 6-K in paper as permitted by Regulation S-T Rule 101(b)(1): [ ]
Indicate by check mark if the registrant is submitting the Form 6-K in paper as permitted by Regulation S-T Rule 101(b)(7): [ ]
Indicate by check mark whether the registrant by furnishing the information contained in this Form is also thereby furnishing the information to the Commission pursuant to Rule 12g3-2(b) under the Securities Exchange Act of 1934.
Yes _______ No ___X____If "Yes" is marked, indicate below the file number assigned to the registrant in connection with Rule 12g3-2(b): 82-_________________
.

Campinas, March 28, 2019 – CPFL Energia S.A. (B3: CPFE3 and NYSE: CPL), announces its4Q18/2018 results.The financial and operational information herein, unless otherwise indicated, is presented on a consolidated basis and is in accordance with the applicable legislation. Comparisons are relative to 4Q17/2017, unless otherwise stated.
CPFL ENERGIA ANNOUNCES ITS 2018 RESULTS
Indicators (R$ Million) | 4Q18 | 4Q17 | Var. | 2018 | 2017 | Var. |
Sales within the Concession Area - GWh | 17,026 | 16,827 | 1.2% | 67,213 | 65,576 | 2.5% |
Captive Market | 11,512 | 11,464 | 0.4% | 45,589 | 45,358 | 0.5% |
Free Client | 5,513 | 5,363 | 2.8% | 21,624 | 20,218 | 7.0% |
Gross Operating Revenue | 10,314 | 11,093 | -7.0% | 42,626 | 40,053 | 6.4% |
Net Operating Revenue | 6,686 | 7,460 | -10.4% | 28,137 | 26,745 | 5.2% |
EBITDA(1) | 1,354 | 1,366 | -0.9% | 5,637 | 4,864 | 15.9% |
Net Income | 670 | 498 | 34.7% | 2,166 | 1,243 | 74.2% |
Investments(2) | 693 | 694 | -0.1% | 2,066 | 2,617 | -21.0% |
Notes:
(1) EBITDA is calculated from the sum of net income, taxes, financial result, depreciation/amortization, as CVM Instruction no. 527/12. See the calculation in item 4.6 of this report;
(2) Includes investments related to the transmission segment; according to the requirements of IFRIC 15, it was recorded as “Contractual Asset of Transmission Companies” (in other credits). Does not include special obligations.
2018 HIGHLIGHTS
• Increase of2.5% in sales within the concession area, highlighting the growths of the residential (+2.6%) and industrial (+2.6%) classes;
• Growth of15.9% in EBITDAand of74.2% in Net Income;
• Net debt ofR$ 16.3 billionand leverage of3.05x Net Debt/EBITDA;
• Investments ofR$ 693 millionin4Q18and ofR$ 2,066 millionin2018;
• Tariff Revisions: CPFL Paulista andRGE Sul, in Apr/18, andRGE, in Jun/18;
• Grouping of the concessions of the distribution companiesRGEandRGE Sul;
• CPFL Renováveis: (i) winning projects in the A-6 Auction (Aug-18) -Cherobim SHPP (28.0 MW) andGameleira Wind Complex (69.3 MW); and (ii) anticipation of commercial start-up ofBoa Vista II SHPP (29.9 MW), in Nov-18;
• Transmission Auctions: CPFL Geraçãowon one lot in Jun-18 (CE - Investment estimated by ANEEL: R$ 102 MM) and two lots in Dec-18 (SC - Invest.: R$ 366 MM and RS - Invest.: R$ 349 MM);
• CPFL Renováveis’ Mandatory Tender Offer: auction occurred on Nov 26, 2018; State Grid (directly and indirectly) now holds 99.94% of the shares.


| 4Q18/2018 Results | March 28, 2019 |
INDEX
| 1) MESSAGE FROM THE CEO | 4 |
| 2) ENERGY SALES | 6 |
| 2.1) Sales within the Distributors Concession Area | 6 |
| 2.1.1) Sales by Segment Concession Area | 7 |
| 2.1.2) Sales to the Captive Market | 8 |
| 2.1.3) Free Clients | 8 |
| 2.2) Generation Installed Capacity | 9 |
| 3) INFORMATION ON INTEREST IN COMPANIES AND CRITERIA OF FINANCIAL STATEMENTS | |
| CONSOLIDATION | 10 |
| 3.1) Consolidation of CPFL Renováveis Financial Statements | 12 |
| 3.2) Consolidation of RGE Sul Financial Statements | 12 |
| 3.3) Economic-Financial Performance Presentation | 12 |
| 3.4) Consolidation of Transmission Companies | 12 |
| 4) ECONOMIC-FINANCIAL PERFORMANCE | 13 |
| 4.1) Opening of economic-financial performance by business segment | 13 |
| 4.2) Sectoral Financial Assets and Liabilities | 14 |
| 4.3) Operating Revenue | 14 |
| 4.4) Cost of Electric Energy | 15 |
| 4.5) Operating Costs and Expenses | 17 |
| 4.6) EBITDA | 19 |
| 4.7) Financial Result | 20 |
| 4.8) Net Income | 22 |
| 5) INDEBTEDNESS | 23 |
| 5.1) Debt (IFRS) | 23 |
| 5.1.1) Debt Amortization Schedule in IFRS (Dec-18) | 24 |
| 5.2) Debt in Financial Covenants Criteria | 25 |
| 5.2.1) Indexation and Debt Cost in Financial Covenants Criteria | 25 |
| 5.2.2) Net Debt in Financial Covenants Criteria and Leverage | 26 |
| 6) INVESTMENTS | 26 |
| 6.1) Actual Investments | 26 |
| 6.2) Investments Forecasts | 27 |
| 7) ALLOCATION OF RESULTS | 28 |
| 8) STOCK MARKETS | 28 |
| 8.1) Stock Performance | 28 |
| 8.2) Daily Average Volume | 29 |
| 9) CORPORATE GOVERNANCE | 30 |
| 10) SHAREHOLDERS STRUCTURE | 31 |
| 10.1) CPFL Renováveis Tender Offer | 31 |
| 10.2) Merger of RGE and RGE Sul distribution companies | 31 |
| 11) PERFORMANCE OF THE BUSINESS SEGMENTS | 33 |
| 11.1) Distribution Segment | 33 |
| 11.1.1) Economic-Financial Performance | 33 |
| 11.1.1.1) Sectoral Financial Assets and Liabilities | 33 |
| 11.1.1.2) Operating Revenue | 34 |
| 11.1.1.3) Cost of Electric Energy | 36 |
Page2 de69
| 4Q18/2018 Results | March 28, 2019 |
| 11.1.1.4) Operating Costs and Expenses | 37 |
| 11.1.1.5) EBITDA | 39 |
| 11.1.1.6) Financial Result | 40 |
| 11.1.1.7) Net Income | 42 |
| 11.1.2) Tariff Events | 42 |
| 11.1.3) Operating Performance of Distribution | 44 |
| 11.2) Commercialization and Services Segments | 45 |
| 11.2.1) Commercialization Segment | 45 |
| 11.2.2) Services Segment | 46 |
| 11.3) Conventional Generation Segment | 47 |
| 11.3.1) Economic-Financial Performance | 47 |
| 11.3.1.1) Operating Revenue | 47 |
| 11.3.1.2) Cost of Electric Power | 48 |
| 11.3.1.3) Operating Costs and Expenses | 48 |
| 11.3.1.4) Equity Income | 50 |
| 11.3.1.5) EBITDA | 51 |
| 11.3.1.6) Financial Result | 51 |
| 11.3.1.7) Net Income | 53 |
| 11.4) CPFL Renováveis | 53 |
| 11.4.1) Economic-Financial Performance | 53 |
| 11.4.1.1) Operating Revenue | 53 |
| 11.4.1.2) Cost of Electric Power | 54 |
| 11.4.1.3) Operating Costs and Expenses | 55 |
| 11.4.1.4) EBITDA | 56 |
| 11.4.1.5) Financial Result | 56 |
| 11.4.1.6) Net Income | 57 |
| 11.4.2) Status of Generation Projects 100% Participation | 57 |
| 12) ATTACHMENTS | 59 |
| 12.1) Statement of Assets CPFL Energia | 59 |
| 12.2) Statement of Liabilities CPFL Energia | 60 |
| 12.3) Income Statement CPFL Energia | 61 |
| 12.4) Cash Flow CPFL Energia | 62 |
| 12.5) Income Statement Conventional Generation Segment | 63 |
| 12.6) Income Statement CPFL Renováveis | 64 |
| 12.7) Income Statement Distribution Segment | 65 |
| 12.8) Economic-Financial Performance by Distributor | 66 |
| 12.9) Sales within the Concession Area by Distributor (In GWh) | 67 |
| 12.10) Sales to the Captive Market by Distributor (in GWh) | 68 |
| 12.11) Reconciliation of Net Debt/EBITDA Pro Forma ratio of CPFL Energia for purposes of financial | |
| covenants calculation | 69 |
Page3 de69
| 4Q18/2018 Results | March 28, 2019 |
1) MESSAGE FROM THE CEO
The CPFL group continued to be very active in 2018, promoting improvements in its operations and management, as well as following the unfolding of the political and economic scenarios of Brazil in its markets.
The 2018 results reflected the growth of energy sales in all consumption classes, our discipline in cost and expense management, as well as the drop in interest rates in Brazil.
The distribution segment had an increase in energy sales (+2.5%) in 2018. Residential, industrial and commercial classes registered market variations of 2.6%, 2.8% and 1.2%, respectively, reflecting the slow recovery of economy activity.
CPFL group’s operating cash generation, measured by EBITDA, reached R$ 5,643 million in 2018 (+15.9%), reflecting the positive results of all business segments. We highlight the distribution segment, whose EBITDA reached R$ 3,004 million in 2018 (+34.5%), mainly reflecting the results coming from the conclusion of the tariff revision process (4th cycle) of CPFL Paulista, RGE Sul (both in April 2018) and RGE (in June 2018). In addition, the Company is promoting organizational reviews in order to simplify its processes and structure, aiming at greater efficiency and focus on business.
We continue working on value initiatives and in our investment plan in 2018, with financial discipline, efforts and commitment of our teams. We invested R$ 2,066 million in this period.
Among the value initiatives, it is worth mentioning the participation of CPFL Geração in the following transmission auctions: (i) in June 2018, the company won Lot 9 (Maracanaú II substation), in Ceará, and (ii) in December 2018, the company won Lots 5 (Itá substation), in Santa Catarina, and 11 (Osório 3, Porto Alegre 1 and Vila Maria substations), in Rio Grande do Sul.
We also had the creation of CPFL Soluções, which brings together services and products previously offered under the brands CPFL Brasil, CPFL Serviços and CPFL Eficiência. In this way, we have an integrated platform for interaction with customers seeking solutions for energy trading, energy efficiency, distributed generation, energy infrastructure and consulting services.
It should also be noted that CPFL promoted the merger of the distribution company RGE (“Merged Company”) into RGE Sul (“Mergee Company”). The grouping of the concessions of the two companies was carried out through the merger of the assets held by the Merged Company by the Mergee Company on December 31, 2018.
We also had the startup of the Boa Vista II SHPP (installed capacity of 29.9 MW), in November 2018, and the participation of CPFL Renováveis in the A-6 Auction of August 2018. The company won with the following projects: (i) Cherobim SHPP, with 28.0 MW of installed capacity, located in Paraná state, and (ii) Gameleira Wind Complex, with 69.3 MW of installed capacity, located in Rio Grande do Norte state.
Still in relation to CPFL Renováveis, we had the Mandatory Tender Offer of the company on November 26. As a result of the auction, State Grid acquired 243,771,824 common shares issued by the company, representing 48.39% of the capital stock of the company. The common shares were acquired at the price of R$ 16.85, totaling the amount of R$ 4.1 billion. State Grid and CPFL Geração (indirectly controlled by State Grid) jointly held 503,520,623 common shares issued by the company, equivalent to 99.94% of the total share capital of the company.
CPFL Energia’s capital structure and consolidated leverage remained at adequate levels. The Company’s net debt reached 3.05 times EBITDA at the end of the quarter, under the criteria to measure our financial covenants, lower than in the previous year. It is worth mentioning that the reductions in interest rates benefited the Company.
Page4 de69
| 4Q18/2018 Results | March 28, 2019 |
Finally, CPFL’s management remains optimistic about the advances of the Brazilian electricity sector and remains confident in its business platform, which is increasingly prepared and well positioned to face the challenges and opportunities in the country.
Gustavo Estrella
CEO of CPFL Energia
Page5 de69
| 4Q18/2018 Results | March 28, 2019 |
2) ENERGY SALES
2.1) Sales within the Distributors’ Concession Area
Sales within the Concession Area - GWh | ||||||
| 4Q18 | 4Q17 | Var. | 2018 | 2017 | Var. |
Captive Market | 11,512 | 11,464 | 0.4% | 45,589 | 45,358 | 0.5% |
Free Client | 5,513 | 5,363 | 2.8% | 21,624 | 20,218 | 7.0% |
Total | 17,026 | 16,827 | 1.2% | 67,213 | 65,576 | 2.5% |
In 4Q18, sales within the concession area, achieved by the distribution segment, totaled 17,026 GWh, an increase of 1.2%. Sales to the captive market totaled 11,512 GWh in 4Q18, an increase of 0.4%. The quantity of energy, in GWh, which corresponds to the consumption of free clients in the concession area of group’s distributors, billed through the Tariff for the Usage of the Distribution System (TUSD), reached 5,513 GWh in 4Q18, an increase of 2.8%.
In 2018, sales within the concession area totaled 67,213 GWh, an increase of 2.5%. Sales to the captive market totaled 45,589 GWh in 2018, an increase of 0.5%. The quantity of energy billed through TUSD reached 21,624 GWh in 2018, an increase of 7.0%.
Sales within the Concession Area - GWh | ||||||||
| 4Q18 | 4Q17 | Var. | Part. | 2018 | 2017 | Var. | Part. |
Residential | 4,970 | 4,866 | 2.2% | 29.2% | 19,618 | 19,122 | 2.6% | 29.2% |
Industrial | 6,371 | 6,316 | 0.9% | 37.4% | 25,023 | 24,346 | 2.8% | 37.2% |
Commercial | 2,841 | 2,820 | 0.7% | 16.7% | 11,048 | 10,921 | 1.2% | 16.4% |
Others | 2,844 | 2,826 | 0.6% | 16.7% | 11,524 | 11,187 | 3.0% | 17.1% |
Total | 17,026 | 16,827 | 1.2% | 100.0% | 67,213 | 65,576 | 2.5% | 100.0% |
Note: The tables with sales within the concession area by distributor are attached to this report in item 12.9.
Noteworthy in 4Q18, in the concession area:
· Residential and commercial classes (29.2% and 16.7% of total sales, respectively): increases of 2.2% and 0.7%, respectively. Highlights for RGE (+4.3%) and CPFL Santa Cruz (+2.2%). In New RGE, the effect of the temperature contributed to the growth of consumption.
· Industrial class (37.4% of total sales): increase of 0.9%. Highlight for the growths in CPFL Santa Cruz (+12.5%) and RGE (+3.2%).
Noteworthy in 2018, in the concession area:
· Residential and commercial classes (29.2% and 16.4% of total sales, respectively): increases 2.6% and 1.2%, respectively. One-off effects of temperature increased consumption in some months of the year, contributing to the growth of sales in 2018.
· Industrial class (37.2% of total sales):increase of 2.8%. Highlight for the growths in CPFL Piratininga (+4.0%), RGE (+3.1%) and CPFL Santa Cruz (+7.6%). This positive result come from the performance of the main industrial activities in the concession area of CPFL Energia (chemicals, automotive vehicles, coke and derived petroleum products and metallurgy).
Page6 de69
| 4Q18/2018 Results | March 28, 2019 |
2.1.1) Sales by Segment – Concession Area
Note: in parentheses, the variation in percentage points from 4Q17/2017 to 4Q18/2018.
Page7 de69
| 4Q18/2018 Results | March 28, 2019 |
2.1.2) Sales to the Captive Market
Sales to the Captive Market - GWh | ||||||
| 4Q18 | 4Q17 | Var. | 2018 | 2017 | Var. |
Residential | 4,970 | 4,866 | 2.2% | 19,618 | 19,122 | 2.6% |
Industrial | 1,561 | 1,618 | -3.5% | 6,151 | 6,557 | -6.2% |
Commercial | 2,217 | 2,244 | -1.2% | 8,630 | 8,828 | -2.2% |
Others | 2,763 | 2,736 | 1.0% | 11,190 | 10,852 | 3.1% |
Total | 11,512 | 11,464 | 0.4% | 45,589 | 45,358 | 0.5% |
Note: The tables with captive market sales by distributor are attached to this report in item 12.10.
Sales to the captive market totaled 11,512 GWh in 4Q18, an increase of 0.4% (48 GWh), mainly due to the performance of the residential class (+2.2%); the performance of industrial (-3.5%) and commercial (-1.2%) classes, reflects the migration of customers to the free market.
In 2018, sales to the captive market totaled 45,589 GWh, an increase of 0.5% (231 GWh), mainly due to the performance of the residential class (+2.6%); the performance of industrial (-6.2%) and commercial (-2.2%) classes, also reflects the migration of customers to the free market.
2.1.3) Free Clients
Free Client - GWh | ||||||
| 4Q18 | 4Q17 | Var. | 2018 | 2017 | Var. |
Industrial | 4,809 | 4,698 | 2.4% | 18,872 | 17,789 | 6.1% |
Commercial | 624 | 576 | 8.3% | 2,418 | 2,093 | 15.5% |
Others | 80 | 90 | -10.4% | 334 | 335 | -0.4% |
Total | 5,513 | 5,363 | 2.8% | 21,624 | 20,218 | 7.0% |
Free Client by Distributor - GWh | ||||||
| 4Q18 | 4Q17 | Var. | 2018 | 2017 | Var. |
CPFL Paulista | 2,593 | 2,554 | 1.5% | 10,027 | 9,504 | 5.5% |
CPFL Piratininga | 1,548 | 1,535 | 0.8% | 6,255 | 5,809 | 7.7% |
New RGE | 1,205 | 1,133 | 6.3% | 4,724 | 4,396 | 7.5% |
CPFL Santa Cruz | 168 | 141 | 18.8% | 619 | 509 | 21.5% |
Total | 5,513 | 5,363 | 2.8% | 21,624 | 20,218 | 7.0% |
Page8 de69
| 4Q18/2018 Results | March 28, 2019 |
2.2) Generation Installed Capacity
In 4Q18, the Generation installed capacity of CPFL Energia group, considering the proportional stake in each project, is of 3,272 MW.
Note: Take into account CPFL Energia’s 51.56% stake in CPFL Renováveis.
Page9 de69
| 4Q18/2018 Results | March 28, 2019 |
3) INFORMATION ON INTEREST IN COMPANIES AND CRITERIA OF FINANCIAL STATEMENTS CONSOLIDATION
The interests directly or indirectly held by CPFL Energia in its subsidiaries and jointly-owned entities are described below. Except for: (i) the jointly-owned entities ENERCAN, BAESA, Foz do Chapecó and EPASA, that, as from January 1, 2013 are no longer proportionally consolidated in the Company’s financial statements, being their assets, liabilities and results accounted for using the equity method of accounting, and (ii) the investment in Investco S.A. recorded at cost by the subsidiary Paulista Lajeado, the other units are fully consolidated.
As of December 31, 2018 and 2017, the participation of non-controlling interests stated in the consolidated statements refers to the third-party interests in the subsidiaries CERAN, Paulista Lajeado and CPFL Renováveis.
Since November 1st, 2016 CPFL Energia is considering the full consolidation of RGE Sul.
Energy distribution | Company Type | Equity Interest | Location (State) | Number of municipalities | Approximate number of consumers | Concession term | End of the concession |
Companhia Paulista de Força e Luz ("CPFL Paulista") | Publicly-quoted corporation | Direct | Countryside of São Paulo | 234 | 4,496 | 30 years | November 2027 |
Companhia Piratininga de Força e Luz ("CPFL Piratininga") | Publicly-quoted corporation | Direct | Countryside and seaside of São Paulo | 27 | 1,756 | 30 years | October 2028 |
RGE Sul Distribuidora de Energia S.A. ("RGE") (a) | Publicly-quoted corporation | Direct and Indirect | Countryside of Rio Grande do Sul | 381 | 2,871 | 30 years | November 2027 |
Companhia Jaguari de Energia ("CPFL Santa Cruz") (b) | Private corporation | Direct | Countryside of São Paulo, Paraná and Minas Gerais | 45 | 457 | 30 years | July 2045 |
Energy generation (conventional and renewable sources) | Company Type | Equity Interest | Location (State) | Number of plants / type of energy | Installed capacity | |
Total | CPFL participation | |||||
CPFL Geração de Energia S.A. ("CPFL Geração") | Publicly-quoted corporation | Direct | São Paulo and Goiás | 3 Hydroelectric (c) | 1,295 | 678 |
CERAN - Companhia Energética Rio das Antas ("CERAN") | Private corporation | Indirect | Rio Grande do Sul | 3 Hydroelectric | 360 | 234 |
Foz do Chapecó Energia S.A. ("Foz do Chapecó") | Private corporation | Indirect | Santa Catarina and | 1 Hydroelectric | 855 | 436 |
Campos Novos Energia S.A. ("ENERCAN") | Private corporation | Indirect | Santa Catarina | 1 Hydroelectric | 880 | 429 |
BAESA - Energética Barra Grande S.A. ("BAESA") | Publicly-quoted corporation | Indirect | Santa Catarina and | 1 Hydroelectric | 690 | 173 |
Centrais Elétricas da Paraíba S.A. ("EPASA") | Private corporation | Indirect | Paraíba | 2 Thermoelectric | 342 | 182 |
Paulista Lajeado Energia S.A. ("Paulista Lajeado") | Private corporation | Indirect | Tocantins | 1 Hydroelectric | 903 | 38 |
CPFL Energias Renováveis S.A. ("CPFL Renováveis") | Publicly-quoted corporation | Indirect | See chapter 11.4.2 | See chapter 11.4.2 | See chapter 11.4.2 | See chapter 11.4.2 |
CPFL Centrais Geradoras Ltda. ("CPFL Centrais Geradoras") | Limited company | Direct | São Paulo and Minas Gerais | 6 MHPPs | 4 | 4 |
Transmission | Company Type | Core activity | Equity Interest | |||
CPFL Transmissão Piracicaba S.A. ("CPFL Piracicaba") | Private corporation | Electric energy transmission services | Indirect 100% | |||
CPFL Transmissão Morro Agudo S.A. ("CPFL Morro Agudo") | Private corporation | Electric energy transmission services | Indirect 100% | |||
CPFL Transmissão Maracanaú S.A. ("CPFL Maracanaú") | Privately-held corporation | Electric energy transmission services | Indirect 100% | |||
Notes:
(a) On December 31, 2018, was approved the grouping of the concessions of the distribution companies RGE Sul Distribuidora de Energia S.A. (“RGE Sul”) and Rio Grande Energia S.A. (“RGE”), considering RGE Sul as the Merging Company and RGE as the Merged Company;
(b) On December 31, 2017, was approved the merger of the subsidiaries Companhia Luz e Força Santa Cruz, Companhia Leste Paulista de Energia, Companhia Sul Paulista de Energia and Companhia Luz e Força de Mococa into Companhia Jaguari de Energia, whose fancy name became "CPFL Santa Cruz”;
(c) CPFL Geração holds 51.54% of the assured power and power of the Serra da Mesa HPP, whose concession belongs to Furnas. The Cariobinha HPP and the Carioba TPP projects are deactivated pending the position of the Ministry of Mines and Energy on the anticipated closure of its concession and are not included in the table;
(d) The joint venture Chapecoense fully consolidates the interim financial statements of its direct subsidiary, Foz de Chapecó;
(e) Paulista Lajeado has a 7% participation in the installed power of Investco S.A. (5.94% share of its capital).
Page10 de69
| 4Q18/2018 Results | March 28, 2019 |
Energy commercialization | Company Type | Core activity | Equity Interest |
CPFL Comercialização Brasil S.A. ("CPFL Brasil") | Private corporation | Energy commercialization | Direct |
Clion Assessoria e Comercialização de Energia Elétrica Ltda. ("CPFL Meridional") | Limited company | Commercialization and provision of energy services | Indirect |
CPFL Comercialização Cone Sul S.A. ("CPFL Cone Sul") | Private corporation | Energy commercialization | Indirect |
CPFL Planalto Ltda. ("CPFL Planalto") | Limited company | Energy commercialization | Direct |
CPFL Brasil Varejista S.A. ("CPFL Brasil Varejista") | Private corporation | Energy commercialization | Indirect |
Services | Company Type | Core activity | Equity Interest |
CPFL Serviços, Equipamentos, Industria e Comércio S.A. ("CPFL Serviços") | Private corporation | Manufacturing, commercialization, rental and maintenance of electro-mechanical equipment and service provision | Direct |
NECT Serviços Administrativos Ltda. ("Nect") | Limited company | Provision of administrative services | Direct |
CPFL Atende Centro de Contatos e Atendimento Ltda. ("CPFL Atende") | Limited company | Provision of telephone answering services | Direct |
CPFL Total Serviços Administrativos Ltda. ("CPFL Total") | Limited company | Billing and collection services | Direct |
CPFL Eficiência Energética S.A. ("CPFL Eficiência") | Private corporation | Management in Energy Efficiency | Direct |
TI Nect Serviços de Informática Ltda. ("Authi") | Limited company | IT services | Direct |
CPFL GD S.A. ("CPFL GD") | Private corporation | Electric energy generation services | Indirect |
Others | Company Type | Core activity | Equity Interest |
CPFL Jaguari de Geração de Energia Ltda. ("Jaguari Geração") | Limited company | Venture capital company | Direct |
Chapecoense Geração S.A. ("Chapecoense") | Private corporation | Venture capital company | Indirect |
Sul Geradora Participações S.A. ("Sul Geradora") | Private corporation | Venture capital company | Indirect |
CPFL Telecom S.A. ("CPFL Telecom") | Private corporation | Telecommunication services | Direct |
Page11 de69
| 4Q18/2018 Results | March 28, 2019 |
3.1) Consolidation of CPFL Renováveis Financial Statements
On December 31, 2018, CPFL Energia indirectly held 51.56% of CPFL Renováveis, through its subsidiary CPFL Geração. CPFL Renováveis has been fully consolidated (100%, line by line), in CPFL Energia’s financial statements since August 1, 2011, and the interest held by the non-controlling shareholders has been mentioned bellow the net income line (in the Financial Statements), as “Non-Controlling Shareholders’ Interest”, and in the Shareholders Equity (in the Balance Sheet) in the line with the same name.
3.2) Consolidation of RGE Sul Financial Statements
On December 31, 2018, CPFL Energia held the following stake in the capital stock of RGE Sul: 89,0107%, directly, and 10,9893%, indirectly, through CPFL Brasil. RGE Sul has been fully consolidated (100%, line by line), in CPFL Energia’s financial statements since November 1st, 2016.
3.3) Economic-Financial Performance Presentation
In accordance with U.S. SEC (Securities and Exchange Commission) guidelines and pursuant to items 100(a) and (b) of Regulation G, with the disclosure of 4Q16/2016 results, in order to avoid the disclosure of non-GAAP measures, we no longer disclose the economic-financial performance considering the proportional consolidation of the generation projects and the adjustment of the numbers for non-recurring items, focusing the disclosure in the IFRS criterion. Only in chapter 5, of Indebtedness, we continue presenting the information in the financial covenants criterion, considering that the proper reconciliation with the numbers in the IFRS criterion are presented in item 12.11 of this report.
3.4) Consolidation of Transmission Companies
As of 4Q17, the subsidiaries CPFL Transmissão Piracicaba and CPFL Transmissão Morro Agudo are consolidated in the financial statements of the segment "Conventional Generation".
Page12 de69
| 4Q18/2018 Results | March 28, 2019 |
4) ECONOMIC-FINANCIAL PERFORMANCE
Consolidated Income Statement - CPFL ENERGIA (R$ Million) | ||||||
| 4Q18 | 4Q17 | Var. | 2018 | 2017 | Var. |
Gross Operating Revenue | 10,314 | 11,093 | -7.0% | 42,626 | 40,053 | 6.4% |
Net Operating Revenue | 6,686 | 7,460 | -10.4% | 28,137 | 26,745 | 5.2% |
Cost of Electric Power | (3,885) | (4,696) | -17.3% | (17,838) | (16,902) | 5.5% |
Operating Costs & Expenses | (1,943) | (1,844) | 5.4% | (6,590) | (6,822) | -3.4% |
EBIT | 858 | 920 | -6.7% | 3,708 | 3,022 | 22.7% |
EBITDA1 | 1,354 | 1,366 | -0.9% | 5,637 | 4,864 | 15.9% |
Financial Income (Expense) | (271) | (290) | -6.7% | (1,103) | (1,488) | -25.9% |
Income Before Taxes | 681 | 689 | -1.3% | 2,940 | 1,847 | 59.2% |
Net Income | 670 | 498 | 34.7% | 2,166 | 1,243 | 74.2% |
Note: (1) EBITDA is calculated from the sum of net income, taxes, financial result and depreciation/amortization, according to CVM Instruction no. 527/12. See the calculation in item 4.6 of this report.
4.1) Opening of economic-financial performance by business segment
Income Statement by business segment - CPFL Energia (R$ million) | ||||||||||||||||
|
| Distribution |
| Conventional Generation |
| Renewable Generation |
| Commerciali-zation |
| Services |
| Others |
| Eliminations |
| Total |
4Q18 | ||||||||||||||||
Net operating revenue | 5,160 | 285 | 516 | 963 | 153 | - | (391) | �� 6,686 | ||||||||
Operating costs and expenses |
| (4,434) |
| (66) |
| (218) |
| (948) |
| (137) |
| (13) |
| 391 |
| (5,426) |
Depreciation e amortization | (196) | (29) | (155) | (1) | (6) | (16) | - | (402) | ||||||||
Income from electric energy service |
| 530 |
| 190 |
| 143 |
| 14 |
| 10 |
| (29) |
| - |
| 858 |
Equity accounting | - | 93 | - | - | - | - | - | 93 | ||||||||
EBITDA |
| 726 |
| 312 |
| 298 |
| 14 |
| 16 |
| (13) |
| - |
| 1,354 |
Financial result | (61) | (43) | (129) | 0 | 1 | (38) | - | (271) | ||||||||
Income (loss) before taxes | 469 | 240 | 14 | 14 | 11 | (67) | - | 681 | ||||||||
Income tax and social contribution | 42 | (5) | 93 | (4) | (14) | (122) | - | (10) | ||||||||
Net income (loss) |
| 511 |
| 234 |
| 107 |
| 10 |
| (3) |
| (189) |
| - |
| 670 |
4Q17 | ||||||||||||||||
Net operating revenue | 5,750 | 295 | 591 | 1,044 | 140 | 0 | (360) | 7,460 | ||||||||
Operating costs and expenses |
| (5,082) |
| (80) |
| (237) |
| (991) |
| (113) |
| (11) |
| 360 |
| (6,153) |
Depreciation e amortization | (179) | (30) | (155) | (1) | (5) | (16) | - | (387) | ||||||||
Income from electric energy service |
| 489 |
| 185 |
| 199 |
| 53 |
| 21 |
| (27) |
| - |
| 920 |
Equity accounting | - | 60 | - | - | - | - | - | 60 | ||||||||
EBITDA |
| 668 |
| 275 |
| 354 |
| 53 |
| 27 |
| (11) |
| 0 |
| 1,366 |
Financial result | (88) | (63) | (124) | (8) | 2 | (9) | (0) | (290) | ||||||||
Income (loss) before taxes | 401 | 181 | 75 | 45 | 23 | (36) | - | 689 | ||||||||
Income tax and social contribution | (64) | 4 | (24) | (15) | (6) | (87) | - | (192) | ||||||||
Net income (loss) |
| 337 |
| 185 |
| 51 |
| 29 |
| 17 |
| (123) |
| - |
| 498 |
Variation | ||||||||||||||||
Net operating revenue | -10.2% | -3.4% | -12.7% | -7.8% | 9.7% | -100.0% | 8.6% | -10.4% | ||||||||
Operating costs and expenses |
| -12.7% |
| -16.7% |
| -8.1% |
| -4.3% |
| 21.4% |
| 20.4% |
| 8.6% |
| -11.8% |
Depreciation e amortization | 9.5% | -4.6% | -0.2% | -14.5% | 6.0% | 0.0% | - | 4.0% | ||||||||
Income from electric energy service |
| 8.5% |
| 2.5% |
| -28.0% |
| -73.7% |
| -51.7% |
| 8.4% |
| - |
| -6.7% |
Equity accounting | - | 56.2% | - | - | - | - | - | 56.2% | ||||||||
EBITDA |
| 8.7% |
| 13.4% |
| -15.8% |
| -73.0% |
| -40.0% |
| 20.4% |
| -100.0% |
| -0.9% |
Financial result | -30.5% | -31.7% | 4.7% | - | -73.8% | 312.7% | -100.0% | -6.7% | ||||||||
Income (loss) before taxes | 16.9% | 32.2% | -81.6% | -68.4% | -53.6% | 85.7% | - | -1.3% | ||||||||
Income tax and social contribution | - | - | - | -74.0% | 128.9% | 41.3% | - | -94.5% | ||||||||
Net income (loss) |
| 51.8% |
| 26.4% |
| 108.4% |
| -65.5% |
| - |
| 54.3% |
| - |
| 34.7% |
Note: an analysis of the economic-financial performance by business segment is presented in chapter 11.
Page13 de69
| 4Q18/2018 Results | March 28, 2019 |
Income Statement by business segment - CPFL Energia (R$ million) | ||||||||||||||||
|
| Distribution |
| Conventional Generation |
| Renewable Generation |
| Commerciali-zation |
| Services |
| Others |
| Eliminations |
| Total |
2018 | ||||||||||||||||
Net operating revenue | 22,467 | 1,144 | 1,936 | 3,496 | 533 | - | (1,441) | 28,137 | ||||||||
Operating costs and expenses |
| (19,463) |
| (207) |
| (728) |
| (3,400) |
| (438) |
| (39) |
| 1,441 |
| (22,834) |
Depreciation e amortization | (767) | (116) | (623) | (2) | (23) | (63) | - | (1,594) | ||||||||
Income from electric energy service |
| 2,237 |
| 821 |
| 586 |
| 94 |
| 73 |
| (102) |
| - |
| 3,708 |
Equity accounting | - | 334 | - | - | - | - | - | 334 | ||||||||
EBITDA |
| 3,004 |
| 1,272 |
| 1,209 |
| 96 |
| 95 |
| (39) |
| - |
| 5,637 |
Financial result | (310) | (248) | (504) | (13) | (0) | (27) | - | (1,103) | ||||||||
Income (loss) before taxes | 1,928 | 907 | 82 | 81 | 72 | (129) | - | 2,940 | ||||||||
Income tax and social contribution | (495) | (137) | 37 | (28) | (30) | (122) | - | (774) | ||||||||
Net income (loss) |
| 1,432 |
| 770 |
| 119 |
| 53 |
| 43 |
| (251) |
| - |
| 2,166 |
2017 | ||||||||||||||||
Net operating revenue | 21,077 | 1,190 | 1,959 | 3,414 | 486 | 1 | (1,382) | 26,745 | ||||||||
Operating costs and expenses |
| (18,842) |
| (304) |
| (737) |
| (3,243) |
| (398) |
| (51) |
| 1,382 |
| (22,194) |
Depreciation e amortization | (704) | (121) | (617) | (3) | (20) | (65) | - | (1,529) | ||||||||
Income from electric energy service |
| 1,531 |
| 766 |
| 605 |
| 168 |
| 68 |
| (115) |
| - |
| 3,022 |
Equity accounting | - | 312 | - | - | - | - | - | 312 | ||||||||
EBITDA |
| 2,234 |
| 1,200 |
| 1,222 |
| 171 |
| 87 |
| (50) |
| - |
| 4,864 |
Financial result | (566) | (329) | (511) | (33) | 4 | (53) | - | (1,488) | ||||||||
Income (loss) before taxes | 964 | 750 | 94 | 135 | 72 | (168) | - | 1,847 | ||||||||
Income tax and social contribution | (300) | (96) | (74) | (45) | (17) | (73) | - | (604) | ||||||||
Net income (loss) |
| 665 |
| 654 |
| 20 |
| 90 |
| 55 |
| (241) |
| - |
| 1,243 |
Variation | ||||||||||||||||
Net operating revenue | 6.6% | -3.9% | -1.2% | 2.4% | 9.7% | -100.0% | 4.2% | 5.2% | ||||||||
Operating costs and expenses |
| 3.3% |
| -31.8% |
| -1.3% |
| 4.8% |
| 9.9% |
| -23.1% |
| 4.2% |
| 2.9% |
Depreciation e amortization | 9.0% | -3.5% | 1.0% | -23.2% | 14.0% | -3.3% | - | 4.3% | ||||||||
Income from electric energy service |
| 46.2% |
| 7.2% |
| -3.1% |
| -43.9% |
| 7.4% |
| -11.0% |
| - |
| 22.7% |
Equity accounting | - | 7.0% | - | - | - | - | - | 7.0% | ||||||||
EBITDA |
| 34.5% |
| 6.1% |
| -1.1% |
| -43.5% |
| 8.9% |
| -21.1% |
| - |
| 15.9% |
Financial result | -45.3% | -24.4% | -1.3% | -60.4% | - | -48.6% | - | -25.9% | ||||||||
Income (loss) before taxes | 99.9% | 21.0% | -13.1% | -39.9% | 0.8% | -22.9% | - | 59.2% | ||||||||
Income tax and social contribution | 65.3% | 43.3% | - | -37.2% | 73.8% | 67.0% | - | 28.2% | ||||||||
Net income (loss) |
| 115.5% |
| 17.7% |
| 504.2% |
| -41.2% |
| -21.7% |
| 4.3% |
| - |
| 74.2% |
Note: an analysis of the economic-financial performance by business segment is presented in chapter 11.
4.2) Sectoral Financial Assets and Liabilities
In 4Q18, it was accounted the totalsectoral financial liabilities in the amount of R$ 735 million, compared to the totalsectoral financial assets in the amount of R$ 852 million in 4Q17, a variation of R$ 1,586 million. In 2018, it was accounted the totalsectoral financial assets in the amount of R$ 1,208 million, compared to the totalsectoral financial assets in the amount of R$ 1,901 million in 2017, a reduction of 36.5% (R$ 693 million).
On December 31, 2018, the balance of these sectoral financial assets and liabilities was positive in R$ 1,508 million, compared to a positive balance of R$ 2,207 million on September 30, 2018 and a positive balance of R$ 517 million on December 31, 2017.
As established by the applicable regulation, any sectoral financial assets or liabilities shall be included in the tariffs of the distributors in their respective annual tariff events.
4.3) Operating Revenue
In 4Q18, gross operating revenue reached R$ 10,314 million, representing a reduction of 7.0% (R$ 780 million). Deductions from the gross operating revenue was of R$ 3,627 million in 4Q18, representing a reduction of 0.2% (R$ 7 million). Net operating revenue reached R$ 6,686 million in 4Q18, registering a reduction of 10.4% (R$ 773 million).
The main factors that affected the net operating revenue were:
· Reduction of revenues in the Distribution segment, in the amount of R$ 589 million (for more details, see item 11.1.1.2);
Page14 de69
| 4Q18/2018 Results | March 28, 2019 |
· Reduction of revenues in the Commercialization segment, in the amount of R$ 81 million;
· Reduction of revenues in the Renewable Generation segment, in the amount of R$ 75 million;
· Reduction of R$ 31 million, due to eliminations;
· Reduction of revenues in the Conventional Generation segment, in the amount of R$ 10 million;
Partially offset by:
· Increase of revenues in the Services segment, in the amount of R$ 14 million.
In 2018, gross operating revenue reached R$ 42,626 million, representing an increase of 6.4% (R$ 2,573 million). Deductions from the gross operating revenue was of R$ 14,490 million in 2018, representing an increase of 8.9% (R$ 1,181 million). Net operating revenue reached R$ 28,137 million in 2018, registering an increase of 5.2% (R$ 1,392 million).
The main factors that affected the net operating revenue were:
· Increase of revenues in the Distribution segment, in the amount of R$ 1,391 million (for more details, see item 11.1.1.2);
· Increase of revenues in the Commercialization segment, in the amount of R$ 82 million;
· Increase of revenues in the Services segment, in the amount of R$ 47 million;
Partially offset by:
· Reduction of R$ 59 million, due to eliminations;
· Reduction of revenues in the Conventional Generation segment, in the amount of R$ 46 million;
· Reduction of revenues in the Renewable Generation segment, in the amount of R$ 23 million;
· Reduction of revenues in Others, in the amount of R$ 1 million.
4.4) Cost of Electric Energy
Cost of Electric Energy (R$ Million) | ||||||
| 4Q18 | 4Q17 | Var. | 2018 | 2017 | Var. |
Cost of Electric Power Purchased for Resale | ||||||
Energy from Itaipu Binacional | 643 | 587 | 9.6% | 2,668 | 2,351 | 13.5% |
PROINFA | 81 | 77 | 5.0% | 331 | 293 | 12.8% |
Energy Purchased through Auction in the Regulated Environment, Bilateral Contracts and Energy Purchased in the Spot Market | 2,893 | 4,071 | -28.9% | 13,970 | 14,536 | -3.9% |
PIS and COFINS Tax Credit | (317) | (428) | -26.1% | (1,503) | (1,563) | -3.8% |
Total | 3,300 | 4,306 | -23.4% | 15,466 | 15,617 | -1.0% |
|
|
|
| |||
Charges for the Use of the Transmission and Distribution System |
|
|
|
| ||
Basic Network Charges | 485 | 554 | -12.5% | 2,115 | 1,542 | 37.2% |
Itaipu Transmission Charges | 68 | 63 | 7.5% | 266 | 160 | 66.5% |
Connection Charges | 47 | 32 | 46.7% | 163 | 123 | 32.9% |
Charges for the Use of the Distribution System | 14 | 10 | 43.5% | 49 | 39 | 23.7% |
System Service Usage Charges - ESS | 32 | (229) | - | (106) | (453) | -76.6% |
Reserve Energy Charges - EER | (0) | (0) | -48.6% | 135 | (0) | - |
PIS and COFINS Tax Credit | (60) | (39) | 54.9% | (249) | (126) | 97.6% |
Total | 585 | 390 | 49.9% | 2,372 | 1,284 | 84.7% |
|
|
|
| |||
Cost of Electric Energy | 3,885 | 4,696 | -17.3% | 17,838 | 16,902 | 5.5% |
In 4Q18, the cost of electric energy, comprising the purchase of electricity for resale and charges for the use of the distribution and transmission system, amounted to R$ 3,885 million, registering areduction of 17.3% (R$ 811 million).
Page15 de69
| 4Q18/2018 Results | March 28, 2019 |
The factors that explain these variations follow below:
· The cost of electric power purchased for resale reached R$ 3,300 million in 4Q18, a reduction of 23.4% (R$ 1,006 million), due to the following factors:
(i) Reduction of 28.9% (R$ 1,178 million) in the cost of energy purchased through auction in the regulated environment, bilateral contracts and energy purchased in the spot market, due to the reductions of 28.2% in the average purchase price (R$ 181.72/MWh in 4Q18 vs. R$ 253.02/MWh in 4Q17) and of 1.1% (170 GWh) in the volume of purchased energy;
Partially offset by:
(ii) Reduction of 26.1% (R$ 112 million) in PIS and COFINS tax credits (cost reducer), generated from the energy purchase;
(iii) Increase of 9.6% (R$ 56 million) in the cost of energy from Itaipu, due to the increase of 16.1% in the average purchase price (R$ 229.13/MWh in 4Q18 vs. R$ 197.38/MWh in 4Q17), partially offset by the reduction of 5.6% (167 GWh) in the volume of purchased energy;
(iv) Increase of 5.0% (R$ 4 million) in the amount of PROINFA cost, due to the increase of 6.1% in the average purchase price (R$ 264.09/MWh in 4Q18 vs. R$ 248.90/MWh in 4Q17), partially offset by the reduction of 1.0% (3 GWh) in the volume of purchased energy;
· Charges for the use of the transmission and distribution system reached R$ 585 million in 4Q18, an increase of 49.9% (R$ 195 million), due to the following factors:
(i) Variation of R$ 261 million in the System Service Usage Charges – ESS, from a revenue of R$ 229 million in 4Q17 to an expense of R$ 32 million in 4Q18;
(ii) Increase of 46.7% (R$ 15 million) in charges for connection;
(iii) Increase of 7.5% (R$ 5 million) in Itaipu transmission charges;
(iv) Increase of 43.5% (R$ 4 million) in charges for usage of the distribution system;
Partially offset by:
(v) Reduction of 12.5% (R$ 69 million) in the basic network charges;
(vi) Increase of 54.9% (R$ 21 million) in PIS and COFINS tax credits (cost reducer), generated from the charges.
In 2018, the cost of electric energy, comprising the purchase of electricity for resale and charges for the use of the distribution and transmission system, amounted to R$ 17,838 million, registering an increase of 5.5% (R$ 937 million).
The factors that explain these variations follow below:
· The cost of electric power purchased for resale reached R$ 15,466 million in 2018, a reduction of 1.0% (R$ 151 million), due to the following factors:
(i) Reduction of 3.9% (R$ 566 million) in the cost of energy purchased through auction in the regulated environment, bilateral contracts and energy purchased in the spot market, due to the reduction of 5.5% (3,592 GWh) in the volume of purchased energy, partially offset by the increase of 1.7% in the average purchase price (R$ 227.30/MWh in 2018 vs. R$ 223.45/MWh in 2017);
Page16 de69
| 4Q18/2018 Results | March 28, 2019 |
Partially offset by:
(ii) Increase of 13.5% (R$ 317 million) in the cost of energy from Itaipu, due to the increase of 20.3% in the average purchase price (R$ 240.03/MWh in 2018 vs. R$ 199.58/MWh in 2017), partially offset by the reduction of 5.6% (662 GWh) in the volume of purchased energy;
(iii) Reduction of 3.8% (R$ 60 million) in PIS and COFINS tax credits (cost reducer), generated from the energy purchase;
(iv) Increase of 12.8% (R$ 37 million) in the amount of PROINFA cost, due to the increase of 15.9% in the average purchase price (R$ 297.52/MWh in 2018 vs. R$ 256.69/MWh in 2017), partially offset by the reduction of 2.7% (31 GWh) in the volume of purchased energy.
· Charges for the use of the transmission and distribution system reached R$ 2,372 million in 2018, an increase of 84.7% (R$ 1,088 million), due to the following factors:
(i) Increase of 37.2% (R$ 573 million) in the basic network charges;
(ii) Reduction of 76.6% (R$ 347 million) in the System Service Usage Charges – ESS (cost reducer), from a revenue of R$ 453 million in 2017 to a revenue of R$ 106 million in 2018;
(iii) Expense of R$ 135 million in 2018, related to Reserve Energy Charges – EER;
(iv) Increase of 66.5% (R$ 106 million) in Itaipu transmission charges;
(v) Increase of 32.9% (R$ 40 million) in charges for connection;
(vi) Increase of 23.7% (R$ 9 million) in charges for usage of the distribution system;
Partially offset by:
(vii) Increase of 97.6% (R$ 123 million) in PIS and COFINS tax credits (cost reducer), generated from the charges.
4.5) Operating Costs and Expenses
Operating costs and expenses reached R$ 1,943 million in 4Q18, compared to R$ 1,844 million in 4Q17, an increase of 5.4% (R$ 100 million). In 2018, operating costs and expenses reached R$ 6,590 million, compared to R$ 6,822 million in 2017, a reduction of 3.4% (R$ 232 million).
The factors that explain these variations follow below:
PMSO
Page17 de69
| 4Q18/2018 Results | March 28, 2019 |
Reported PMSO (R$ million) | ||||||||
| 4Q18 | 4Q17 | Variation | 2018 | 2017 | Variação | ||
| R$ MM | % | R$ MM | % | ||||
Reported PMSO |
|
|
|
|
|
|
|
|
Personnel | (380) | (379) | (1) | 0.4% | (1,414) | (1,377) | (37) | 2.7% |
Material | (70) | (68) | (2) | 3.1% | (258) | (250) | (8) | 3.2% |
Outsourced Services | (193) | (179) | (14) | 8.0% | (692) | (727) | 35 | -4.9% |
Other Operating Costs/Expenses | (306) | (210) | (96) | 45.8% | (770) | (753) | (17) | 2.2% |
Allowance for doubtful accounts | (56) | (36) | (19) | 53.3% | (169) | (155) | (14) | 9.1% |
Legal and judicial expenses | (74) | (66) | (8) | 11.6% | (187) | (188) | 2 | -0.9% |
Others | (177) | (107) | (69) | 64.4% | (414) | (409) | (4) | 1.1% |
Total Reported PMSO | (950) | (836) | (114) | 13.6% | (3,134) | (3,107) | (27) | 0.9% |
The PMSO item reached R$ 950 million in 4Q18, compared to R$ 836 million in 4Q17, an increase of 13.6% (R$ 114 million), due to the following factors:
(i) Personnel - increase of 0.4% (R$ 1 million), mainly due to the collective bargaining agreement – wages and benefits;
(ii) Material - increase of 3.1% (R$ 2 million), mainly due to the increase in thereplacement of material to the maintenance of lines and grid;
(iii) Outsourced services - increase of 8.0% (R$ 14 million), mainly due to the increases inmaintenance services in lines, network and substations and in outsourced services;
(iv) Other operational costs/expenses-increase of 45.8% (R$ 96 million), mainly due to:
ü Increase of 278.8% (R$ 91 million) of loss on disposal, retirement and other noncurrent assets;
ü Increase of 53.3% (R$ 19 million) in allowance for doubtful account;
ü Increase of 11.6% (R$ 8 million) in legal and judicial expenses;
Partially offset by:
ü Compensation for non-compliance with technical indicators (R$ 16 million), which from January 2018 onwards was classified under Other Revenues;
ü Other effects (R$ 6 million).
In 2018, the PMSO item reached R$ 3,134 million, compared to R$ 3,107 million in 2017, an increase of 0.9% (R$ 27 million), due to the following factors:
(i) Personnel - increase of 2.7% (R$ 37 million), mainly due to the collective bargaining agreement – wages and benefits;
(ii) Material - increase of 3.2% (R$ 8 million), mainly due to the increase in thereplacement of material to the maintenance of lines and grid;
(iii) Outsourced services - reduction of 4.9% (R$ 35 million), mainly due to the reductionsin other outsourced services and in maintenance in machinery and equipment;
(iv) Other operational costs/expenses - increase of 2.2% (R$ 17 million), mainly due to:
Page18 de69
| 4Q18/2018 Results | March 28, 2019 |
ü Increase of 59.5% (R$ 79 million) of loss on disposal, retirement and other noncurrent assets;
ü Increase of 9.1% (R$ 14 million) in allowance for doubtful account;
Partially offset by:
ü Compensation for non-compliance with technical indicators (R$ 50 million), which from January 2018 onwards was classified under Other Revenues;
ü Provision for impairment (R$ 20 million);
ü Reduction of 0.9% (R$ 2 million) in legal and judicial expenses;
ü Other effects (R$ 4 million).
Other operating costs and expenses
Other operating costs and expenses reached R$ 994 million in 4Q18, compared to R$ 1,008 million in 4Q17, registering a reduction of 1.4% (R$ 14 million), due to the following factors:
· Reduction of 4.0% (R$ 24 million) inCosts of Building the Infrastructure item;
· Reduction of 21.0% (R$ 6 million) inPrivate Pension Fund item, due to the registration of the impacts of the 2018 actuarial report;
Partially offset by:
· Increase of 4.3% (R$ 14 million) inDepreciation and Amortization item;
· Increase of 2.9% (R$ 2 million) inAmortization of Intangible of Concession Asset item.
In 2018, other operating costs and expenses reached R$ 3,456 million, compared to R$ 3,715 million in 2017, registering a reduction of 7.0% (R$ 259 million), due to the following factors:
· Reduction of 14.5% (R$ 300 million) inCosts of Building the Infrastructure item;
· Reduction of 21.1% (R$ 24 million) inPrivate Pension Fund item, due to the registration of the impacts of the 2018 actuarial report;
Partially offset by:
· Increase of 5.2% (R$ 64 million) inDepreciation and Amortization item;
· Increase of 0.2% (R$ 1 million) inAmortization of Intangible of Concession Asset item.
4.6) EBITDA
In 4Q18,EBITDA reached R$ 1,354 million, compared to R$ 1,366 million in 4Q17, registering a reduction of 0.9% (R$ 12 million). In 2018,EBITDA reached R$ 5,637 million, compared to R$ 4,864 million in 2017, registering an increase of 15.9% (R$ 773 million).
EBITDA is calculated according to CVM Instruction no. 527/12 and showed in the table below:
Page19 de69
| 4Q18/2018 Results | March 28, 2019 |
EBITDA and Net Income conciliation (R$ million) | ||||||
| 4Q18 | 4Q17 | Var. | 2018 | 2017 | Var. |
Net Income | 670 | 498 | 34.7% | 2,166 | 1,243 | 74.2% |
De preciation and Amortization | 403 | 387 | 1,595 | 1,530 | ||
Financial Result | 271 | 290 | 1,103 | 1,488 | ||
Income Tax / Social Contribution | 10 | 192 | 774 | 604 | ||
EBITDA | 1,354 | 1,366 | -0.9% | 5,637 | 4,864 | 15.9% |
4.7) Financial Result
| ||||||
| 4Q18 | 4Q17 | Var. | 2018 | 2017 | Var. |
Revenues | ||||||
Income from Financial Investments | 47 | 74 | -35.9% | 223 | 457 | -51.3% |
Additions and Late Payment Fines | 73 | 62 | 18.6% | 276 | 265 | 4.1% |
Fiscal Credits Update | 2 | 5 | -53.0% | 15 | 20 | -24.5% |
Judicial Deposits Update | 9 | 10 | -3.7% | 37 | 50 | -24.6% |
Monetary and Foreign Exchange Updates | 19 | 11 | 78.7% | 70 | 61 | 15.1% |
Discount on Purchase of ICMS Credit | 9 | 7 | 28.9% | 34 | 16 | 106.1% |
Sectoral Financial Assets Update | 36 | - | - | 80 | - | - |
PIS and COFINS - over Other Financial Revenues | (12) | (11) | 5.3% | (46) | (48) | -4.4% |
PIS and COFINS over Interest on Own Capital | (39) | (26) | 50.1% | (39) | (28) | 41.6% |
Others | 39 | 41 | -5.9% | 113 | 87 | 29.0% |
Total | 184 | 171 | 7.1% | 762 | 880 | -13.4% |
|
|
|
| |||
Expenses |
|
|
|
| ||
Debt Charges | (326) | (340) | -4.1% | (1,329) | (1,661) | -20.0% |
Monetary and Foreign Exchange Updates | (69) | (104) | -33.4% | (368) | (540) | -31.8% |
(-) Capitalized Interest | 8 | 8 | -0.1% | 29 | 51 | -43.4% |
Sectoral Financial Liabilities Update | - | (2) | -100.0% | - | (82) | -100.0% |
Use of Public Asset | (4) | (3) | 20.1% | (18) | (8) | 120.7% |
Others | (63) | (21) | 198.6% | (179) | (127) | 41.1% |
Total | (454) | (461) | -1.5% | (1,865) | (2,368) | -21.2% |
|
|
|
| |||
Financial Result | (271) | (290) | -6.7% | (1,103) | (1,488) | -25.9% |
In 4Q18,net financial expense was of R$ 271 million, a reduction of 6.7% (R$ 19 million) compared to the net financial expense of R$ 290 million reported in 4Q17.
The items explaining these variations in Financial Result are as follows:
· Financial Revenues: increase of 7.1% (R$ 12 million), from R$ 171 million in 4Q17 to R$ 184 million in 4Q18, mainly due to the following factors:
(i) Sectoral financial assets update in 4Q18, in the amount of R$ 36 million;
(ii) Increase of 18.6% (R$ 11 million) inadditions and late payment fines;
(iii) Increase of 78.7% (R$ 9 million) in themonetary and foreign exchange updates, due to the increases: (a) of R$ 12 million in revenues from fines, interest and monetary adjustment relating to installment payments made by consumers, and (b) of R$ 4 million in other monetary and foreign exchange updates; partially offset by the reductions (c) of R$ 6 million in the update of the balance of tariff subsidies, as determined by ANEEL,and (d) of R$ 1 million in gains with the zero-cost collar derivative1;
Page20 de69
| 4Q18/2018 Results | March 28, 2019 |
(iv) Increase of 28.9% (R$ 2 million) indiscount on the acquisition of ICMS credit;
Partially offset by:
(v) Reduction of 35.9% (R$ 26 million) in theincome from financial investments, due to the reductions in the CDI interbank rate and in the average balance of investments;
(vi) Increase of 50.1% (R$ 13 million) inPIS and COFINS over Interest on Own Capital (revenue reducer);
(vii) Reduction of 53.0% (R$ 3 million) infiscal credits update;
(viii) Reduction of 5.9% (R$ 2 million) inother financial revenues;
(ix) Increase of 5.3% (R$ 1 million) inPIS and COFINS over Other Financial Revenue (revenue reducer).
· Financial Expenses: reduction of 1.5% (R$ 7 million), from R$ 461 million in 4Q17 to R$ 454 million in 4Q18, mainly due to the following factors:
(i) Reduction of 33.4% (R$ 35 million) in themonetary and foreign exchange updates, due to: (a) the mark-to-market positive effect for financial operations under Law 4,131 – non-cash effect (R$ 21 million), (b) the effect of Itaipu’s exchange variation (R$ 13 million), and (c) the reduction of debt charges in foreign currency, with swap to CDI interbank rate (R$ 1 million);
(ii) Reduction of 4.1% (R$ 14 million) ofdebt charges in local currency, due to the reduction in the CDI interbank rate;
(iii) Sectoral financial liabilities update in 4Q17, in the amount of R$ 2 million (expense reducer);
Partially offset by:
(iv) Increase of 198.6% (R$ 42 million) inother financial expenses;
(v) Increase of 20.1% (R$ 1 million) in thefinancial expenses with the Use of Public Asset (UBP).
In 2018,net financial expense was of R$ 1,103 million, a reduction of 25.9% (R$ 385 million) compared to the net financial expense of R$ 1,488 million reported in 2017.
The items explaining these variations in Financial Result are as follows:
· Financial Revenues: reduction of 13.4% (R$ 118 million), from R$ 880 million in 2017 to R$ 762 million in 2018, mainly due to the following factors:
(i) Reduction of 51.3% (R$ 234 million) in theincome from financial investments, due to the reductions in the CDI interbank rate and in the average balance of investments;
(ii) Reduction of 24.6% (R$ 12 million) injudicial deposits update;
(iii) Increase of 41.6% (R$ 12 million) inPIS and COFINS over Interest on Own Capital (revenue reducer);
Page21 de69
1In 2015, subsidiary CPFL Geração contracted US$ denominated put and call options, involving the same financial institution as counterpart, and which on a combined basis are characterized as an operation usually known as zero-cost collar. The contracting of this operation does not involve any kind of speculation, inasmuch as it is aimed at minimizing any negative impacts on future revenues of the joint venture ENERCAN, which has electric energy sale agreements with annual restatement of part of the tariff based on the variation in the US$. In addition, according to Management’s view, the scenario was favorable for contracting this type of financial instrument, considering the high volatility implicit in dollar options and the fact that there was no initial cost for same.
| 4Q18/2018 Results | March 28, 2019 |
(iv) Reduction of 24.5% (R$ 5 million) infiscal credits update;
Partially offset by:
(v) Sectoral financial assets update in 2018, in the amount of R$ 80 million;
(vi) Increase of 29.0% (R$ 25 million) inother financial revenues;
(vii) Increase of 106.1% (R$ 17 million) indiscount on the acquisition of ICMS credit;
(viii) Increase of 4.1% (R$ 11 million) inadditions and late payment fines;
(ix) Increase of 15.1% (R$ 9 million) in themonetary and foreign exchange updates, due to: (a) the increase of R$ 38 million in revenues from fines, interest and monetary adjustment relating to installment payments made by consumers; partially offset by the reductions (b) of R$ 20 million in the gains with the zero-cost collar derivative, (c) of R$ 5 million in other monetary and foreign exchange updates, and (d) of R$ 4 million in the update of the balance of tariff subsidies, as determined by ANEEL;;
(x) Reduction of 4.4% (R$ 2 million) inPIS and COFINS over Other Financial Revenue (revenue reducer).
· Financial Expenses: reduction of 21.2% (R$ 503 million), from R$ 2,368 million in 2017 to R$ 1,865 million in 2018, mainly due to the following factors:
(i) Reduction of 20.0% (R$ 332 million) ofdebt charges in local currency, due to the reduction in the CDI interbank rate;
(ii) Reduction of 31.8% (R$ 172 million) in themonetary and foreign exchange updates, due to: (a) the reduction of debt charges in foreign currency, with swap to CDI interbank rate (R$ 145 million), (b) the mark-to-market positive effect for financial operations under Law 4,131 – non-cash effect (R$ 19 million), and (c) the effect of Itaipu’s exchange variation (R$ 7 million);
(iii) Sectoral financial liabilities update in 2017, in the amount of R$ 82 million;
Partially offset by:
(iv) Increase of 41.1% (R$ 52 million) inother financial expenses;
(v) Reduction of 43.4% (R$ 22 million) incapitalized interest (expense reducer);
(vi) Increase of 120.7% (R$ 10 million) in thefinancial expenses with the Use of Public Asset (UBP).
4.8) Net Income
Net incomewas of R$ 670 million in 4Q18, registering an increase of 34.7% (R$ 173 million) if compared to the net income of R$ 498 million observed in 4Q17. In 2018,net income was of R$ 2,166 million, registering an increase of 74.2% (R$ 923 million) if compared to the net income of R$ 1,243 million observed in 2017.
Page22 de69
| 4Q18/2018 Results | March 28, 2019 |
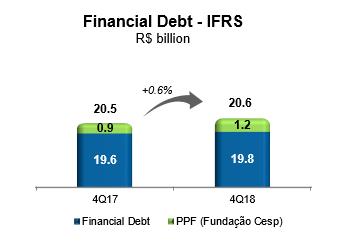
5) INDEBTEDNESS
5.1) Debt (IFRS)
Note includes the mark-to-market (MTM) effect and borrowing costs.
| ||
Indexation after Hedge – 4Q17 vs. 4Q18
4Q17
| ||
4Q18
|
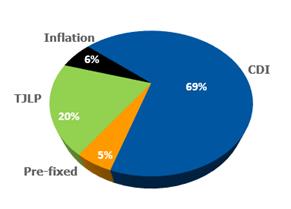

Note: for debt linked to foreign currency (25.6% of total in 4Q18), swap operations are contracted, aiming the protection ofthe foreign exchange and the rate linked to the contract.
Page23 de69
| 4Q18/2018 Results | March 28, 2019 |
Net Debt in IFRS
IFRS | R$ Million | 4Q18 | 4Q17 | Var. % |
Financial Debt (including hedge) | (19,752) | (19,615) | 0.7% |
(+) Available Funds | 1,891 | 3,250 | -41.8% |
(=) Net Debt | (17,860) | (16,366) | 9.1% |
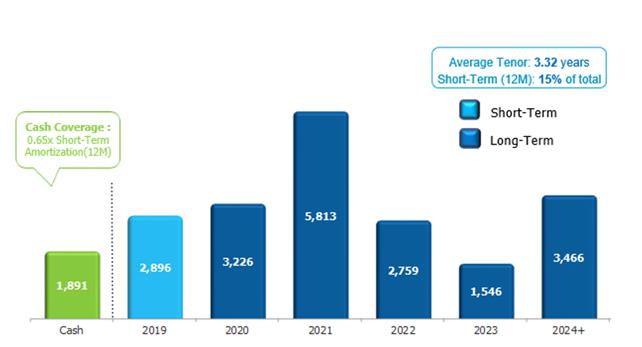
5.1.1) Debt Amortization Schedule in IFRS (Dec-18)
CPFL Energia has a large market access to liquidity sources through diversified funding alternatives, either through local market financing lines such as debenture issues, BNDES and other development banks, or through financing lines in the foreign market. This access to credit for the CPFL group is currently strengthened by the support of its shareholding structure, as State Grid gives greater robustness to CPFL group in financial market.
Notes:
1) Considers only the principal of the debt of R$ 19,706 million. In order to reach the value of debt in IFRS, of R$ 19,752 million, should be included charges and the mark-to-market (MTM) effect and cost with funding;
2) Short-term (January 2019 – December 2019) = R$ 2,896 million.
The cash position at the end of 4Q18 had a coverage ratio of0.65x the amortizations of the next 12 months, enough to honor all amortization commitments until the beginning of 2019. The average amortization term, calculated from this schedule, is of3.32 years.
Page24 de69
| 4Q18/2018 Results | March 28, 2019 |
Gross Debt Cost1 in IFRS criteria
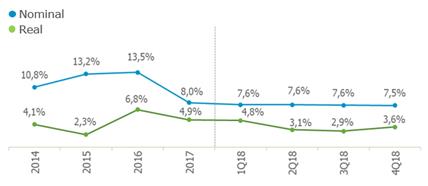
Note: (1) as of 2Q17, CPFL Energia started to calculate its debt average cost considering the end of the period, to better reflect the variations on interest rates.
5.2) Debt in Financial Covenants Criteria
5.2.1) Indexation and Debt Cost in Financial Covenants Criteria
Indexation1 After Hedge2 in Financial Covenants Criteria – 4Q17 vs. 4Q18
4Q17

4Q18
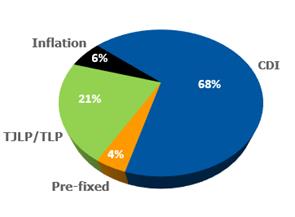
1) Considering proportional consolidation of CPFL Renováveis, CERAN, ENERCAN, Foz do Chapecó and EPASA;
2) For debt linked to foreign currency (28.3% of total), swap operations are contracted, aiming the protection of the foreign exchange and the rate linked to the contract.
Page25 de69
| 4Q18/2018 Results | March 28, 2019 |
5.2.2) Net Debt in Financial Covenants Criteria and Leverage
In 4Q18 Proforma Net Debt totaledR$ 16,274 million, an increase of12.3% compared to net debt position at the end of 4Q17, in the amount ofR$ 14,490 million.
Covenant Criteria (*) - R$ Million | 4Q18 | 4Q17 | Var. |
Financial Debt (including hedge)1 | (17,868) | (17,385) | 2.8% |
(+) Available Funds | 1,593 | 2,895 | -45.0% |
(=) Net Debt | (16,274) | (14,490) | 12.3% |
EBITDA Proforma2 | 5,343 | 4,531 | 17.9% |
Net Debt / EBITDA | 3.05 | 3.20 | -4.75% |
1) Considering proportional consolidation of CPFL Renováveis, CERAN, ENERCAN, Foz do Chapecó and EPASA;
2) Proforma EBITDA in the financial covenants criteria: adjusted according to equivalent participation of CPFL Energia in each of its subsidiaries, with the inclusion of regulatory assets and liabilities and the historical EBITDA of newly acquired projects.
In line with the criteria for calculation of financial covenants of loan agreements with financial institutions, net debt is adjusted according to the equivalent stake of CPFL Energia in each of its subsidiaries. Also, include in the calculation of Proforma EBITDA the effects of historic EBITDA of newly acquired projects. Considering that the Proforma Net Debt totaledR$ 16,274 million and Proforma EBITDA in the last 12 months reachedR$ 5,343 million, the ratio Proforma Net Debt / EBITDA at the end of 4Q18 reached3.05x.
6) INVESTMENTS
6.1) Actual Investments
Investments (R$ Million) | ||||||
Segment | 4Q18 | 4Q17 | Var. | 2018 | 2017 | Var. |
Distribution | 617 | 618 | -0.2% | 1,770 | 1,883 | -6.0% |
Generation - Conventional | 6 | 6 | -0.8% | 12 | 9 | 28.4% |
Generation - Renewable | 51 | 55 | -7.5% | 225 | 621 | -63.7% |
Commercialization | 1 | 1 | -4.5% | 3 | 3 | 0.0% |
Services and Others1 | 18 | 13 | 32.9% | 53 | 55 | -3.2% |
Subtotal | 693 | 694 | -0.1% | 2,062 | 2,570 | -19.8% |
Transmission | 1 | 0 | 87.1% | 3 | 46 | -92.5% |
Total | 693 | 694 | -0.1% | 2,066 | 2,617 | -21.0% |
Note:
1) Others – basically refer to assets and transactions that are not related to the listed segments.
In 4Q18, investments were R$ 693 million, a reduction of 0.1% compared to 4Q17. In 2018, the investments were R$ 2,066 million, a reduction of 21.0%. Investments related to the transmission segment, according to IFRIC 15, are recorded as “Contractual Asset of Transmission Companies” (in other credits).
Page26 de69
| 4Q18/2018 Results | March 28, 2019 |
We highlight investments made by CPFL Energia in each segment:
(i) Distribution:
a. Expansion and strengthening of the electric system;
b. Electricity system maintenance and improvements;
c. Operational infrastructure;
d. Upgrade of management and operational support systems;
e. Customer help services;
f. Research and development programs;
(ii) Generation:
a. Boa Vista II SHPP.
6.2) Investments Forecasts
On November 30, 2018, CPFL Energia’s Board of Directors approved Board of Executive Officers’ proposal for 2019 Annual Budget and 2020/2023 Multiannual Plan for the Company, which was previously discussed by the Budget and Corporate Finance Commission.
Investments Forecasts (R$ million)1
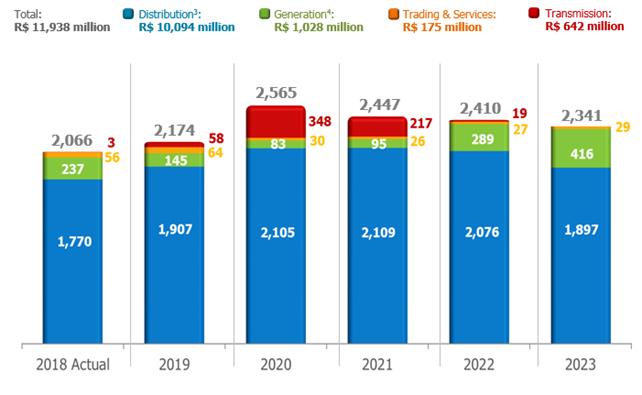
Notes:
1) Constant currency;
2) Investment Plan released in 4Q18/2018 Earnings Release, from March 2019;
3) Disregard investments in Special Obligations (among other items financed by consumers);
4) Conventional + Renewable.
Page27 de69
| 4Q18/2018 Results | March 28, 2019 |
7) ALLOCATION OF RESULTS
The Company’s Bylaws require the distribution of at least 25% of net income adjusted according to law, as dividends to its shareholders. The proposal for allocation of net income from the fiscal year is shown below:
Minimum Mandatory Dividend (25%)
The Board of Directors propose the payment of R$ 489 million in dividends to holders of common shares traded on B3 S.A. – Brasil, Bolsa, Balcão (B3). This proposed amount corresponds to R$ 0.480182232 per share, related to the fiscal year of 2018.
Statutory Reserve – Working Capital Reinforcement
For this fiscal year, considering the current macro scenario with an incipient economic recovery, and also considering the uncertainties regarding hydrology, the Company’s Management is proposing the allocation of R$ 2.235 million to the statutory reserve - working capital reinforcement.
8) STOCK MARKETS
CPFL Energia is listed on both the B3 (Novo Mercado) and the New York Stock Exchange (NYSE) (ADR Level III), segments with the highest levels of corporate governance.
B3 | NYSE | ||||||
Date | CPFE3 (R$) | IEE | IBOV | Date | CPL (US$) | DJBr20 | Dow Jones |
12/31/2018 | R$ 28.85 | 49,266 | 87,887 | 12/31/2018 | $ 14.80 | 22,007 | 23,327 |
09/30/2018 | R$ 23.87 | 39,351 | 79,342 | 09/30/2018 | $ 11.82 | 19,406 | 26,458 |
12/31/2017 | R$ 19.35 | 39,732 | 76,402 | 12/31/2017 | $ 11.50 | 22,690 | 24,719 |
QoQ | 20.9% | 25.2% | 10.8% | QoQ | 25.2% | 13.4% | -11.8% |
YoY | 49.1% | 24.0% | 15.0% | YoY | 28.7% | -3.0% | -5.6% |
On December 31, 2018, CPFL Energia’s shares closed at R$ 28.85 per share on the B3 and US$14.80 per ADR on the NYSE, an appreciation in the quarter of 20.9% and 25.2%, respectively. Considering the variation in the last 12 months, the shares and ADRs presented an appreciation of 49.1% on the B3 and of 28.7% on the NYSE.
Page28 de69
| 4Q18/2018 Results | March 28, 2019 |
8.2) Daily Average Volume
The daily trading volume in 4Q18 averaged R$ 12.1 million, of which R$ 10.9 million on the B3 and R$ 1.2 million on the NYSE, representing a reduction of 77.5% in relation to 4Q17. The number of trades on the B3 decreased by 61.8%.
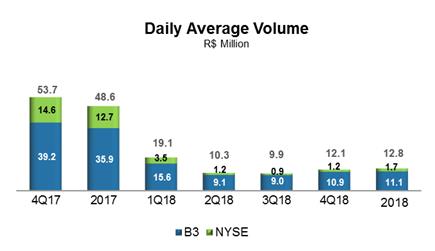
Note: Considers the sum of the average daily volume on the B3 and NYSE.
Page29 de69
| 4Q18/2018 Results | March 28, 2019 |
9) CORPORATE GOVERNANCE
The corporate governance model adopted by CPFL Energia and its subsidiaries is based on the principles of transparency, equity, accountability and corporate responsibility.
In 2018, CPFL marked 14 years since being listed on the B3 and the New York Stock Exchange (“NYSE”). With more than 100 years of history in Brazil, the Company’s shares are listed on theNovo MercadoSpecial Listing Segment of the B3 with Level III ADRs, a special segment for companies that comply with corporate governance best practices. All CPFL shares are common shares, entitling all shareholders the right to vote with 100% Tag Along rights guaranteed in case of sale of shareholding control.
CPFL’s Management is composed of the Board of Directors (“Board”), its decision-making authority, and the Board of Executive Officers, its executive body. The Board is responsible for defining the strategic business direction of the holding company and subsidiaries, and is composed of 7 members (of which 2 independent members), with terms of one year, eligible for reelection.
The Bylaws of the Board establishes the procedures for evaluating the directors, under the leadership of the Chairman, their main duties and rights.
The Board set up three advisory committees (Management Processes, Risks and Sustainability, People Management and Related Parties), which support the Board in its decisions and monitor relevant and strategic themes, such as people and risk management, sustainability, the surveillance of internal audits and analysis of transactions with Parties Related to controlling shareholders and handling of incidents recorded through complaint hotlines and ethical conduct channels.
The Board of Executive Officers is made up of 1 Chief Executive Officer, 1 Deputy Chief of Executive Officer and 7 Vice Presidents, with terms of two years, eligible for reelection, responsible for executing the strategy of CPFL Energia and its subsidiaries as defined by the Board of Directors in line with corporate governance guidelines. To ensure alignment of governance practices, Executive Officers sit on the Boards of Directors of companies that make up the CPFL group and nominate their respective executive officers.
CPFL has a permanent Fiscal Council, made up of 3 members, that also exercises the duties of the Audit Committee, in line with Sarbanes-Oxley law (SOX) rulings applicable to foreign companies listed on U.S. stock exchanges.
The guidelines and documents on corporate governance are available at the Investor Relations website http://www.cpfl.com.br/ir.
Page30 de69
| 4Q18/2018 Results | March 28, 2019 |
10) SHAREHOLDERS STRUCTURE
CPFL Energia is a holding company that owns stake in other companies. State Grid Corporation of China (SGCC) controls CPFL Energia through its subsidiaries State Grid International Development Co., Ltd, State Grid International Development Limited (SGID), International Grid Holdings Limited, State Grid Brazil Power Participações S.A. (SGBP) and ESC Energia S.A.:
Reference date: 12/31/2018
Notes:
(1) RGE Sul is held by CPFL Energia (89.0107%) and CPFL Brasil (10.9893%).
(2) CPFL Soluções = CPFL Brasil + CPFL Serviços + CPFL Eficiência;
(3) 51.54% stake of the availability of power and energy of Serra da Mesa HPP, regarding the Power Purchase Agreement between CPFL Geração and Furnas;
10.1) CPFL Renováveis’ Tender Offer
CPFL Renováveis’ Mandatory Tender Offer occurred on November 26, 2018. According to the Material Fact and the Announcement to the Market released on November 26 and 30, 2018, respectively, as a result of the auction, State Grid acquired 243,771,824 common shares issued by the company, representing 48.39% of the capital stock of the company. The common shares were acquired at the price of R$ 16.85, totaling the amount of R$ 4.1 billion. State Grid and CPFL Geração (indirectly controlled by State Grid) jointly held 503,520,623 common shares issued by the company, equivalent to 99.94% of the total share capital of the company.
10.2) Merger of RGE and RGE Sul distribution companies
In December 2018, CPFL promoted the merger of the distribution company Rio Grande Energia S.A. (“RGE” or “Merged Company”) into RGE Sul Distribuidora de Energia S.A. (“RGE Sul” or“Merging Company”). On December 04, 2018, by means of Authorizing Resolution No. 7,499, the grouping of the concessions of the two companies was approved by the National Electric Energy Regulatory Agency (ANEEL), through the incorporation of the assets held by the Merged Company by the Merging Company on December 31, 2018.
Page31 de69
| 4Q18/2018 Results | March 28, 2019 |
As a result of the grouping, RGE Sul (“New RGE”) became responsible for the electric power supply of 381 municipalities, located in the State of Rio Grande do Sul, meeting the demand of 2.9 million clients.
Page32 de69
| 4Q18/2018 Results | March 28, 2019 |
11) PERFORMANCE OF THE BUSINESS SEGMENTS
11.1) Distribution Segment
11.1.1) Economic-Financial Performance
Consolidated Income Statement - Distribution (R$ Million) | ||||||
| 4Q18 | 4Q17 | Var. | 2018 | 2017 | Var. |
Gross Operating Revenue | 8,613 | 9,197 | -6.4% | 36,310 | 33,768 | 7.5% |
Net Operating Revenue | 5,160 | 5,750 | -10.2% | 22,467 | 21,077 | 6.6% |
Cost of Electric Power | (3,104) | (3,767) | -17.6% | (15,022) | (14,147) | 6.2% |
Operating Costs & Expenses | (1,526) | (1,494) | 2.1% | (5,208) | (5,399) | -3.5% |
EBIT | 530 | 489 | 8.5% | 2,237 | 1,531 | 46.2% |
EBITDA(1) | 726 | 668 | 8.7% | 3,004 | 2,234 | 34.5% |
Financial Income (Expense) | (61) | (87) | -30.4% | (310) | (566) | -45.3% |
Income Before Taxes | 469 | 401 | 16.9% | 1,928 | 964 | 99.9% |
Net Income | 511 | 337 | 51.8% | 1,432 | 665 | 115.4% |
Note:
(1) EBITDA (IFRS) is calculated from the sum of net income, taxes, financial result and depreciation/amortization, as CVM Instruction no. 527/12.
11.1.1.1) Sectoral Financial Assets and Liabilities
In 4Q18, totalsectoral financial liabilities accounted for R$ 735 million, a variation of R$ 1,586 million if compared to 4Q17, whensectoral financial assets amounted to R$ 852 million. In 2018, totalsectoral financial assets accounted for R$ 1,208 million, a reduction of 36.5% (R$ 693 million) if compared to 2017, whensectoral financial assets amounted to R$ 1,901 million.
On December 31, 2018, the balance of sectoral financial assets and liabilities was positive in R$ 1,508 million, compared to a positive balance of R$ 2,207 million on September 30, 2018 and a positive balance of R$ 517 million on December 31, 2017.
As established by the applicable regulation, any sectoral financial assets or liabilities shall be included in the tariffs of the distributors in their respective annual tariff events.
Page33 de69
| 4Q18/2018 Results | March 28, 2019 |
11.1.1.2) Operating Revenue
Operating Revenue (R$ Million) | ||||||
| 4Q18 | 4Q17 | Var. | 2018 | 2017 | Var. |
Gross Operating Revenue | ||||||
Revenue with Energy Sales (Captive + TUSD) | 8,245 | 7,020 | 17.4% | 30,203 | 26,174 | 15.4% |
Short-term Electric Energy | 13 | 193 | -93.3% | 781 | 1,723 | -54.7% |
Revenue from Building the Infrastructure of the Concession | 568 | 592 | -4.0% | 1,771 | 2,026 | -12.6% |
Sectoral Financial Assets and Liabilities | (735) | 852 | - | 1,208 | 1,901 | -36.5% |
CDE Resources - Low-income and Other Tariff Subsidies | 375 | 347 | 7.9% | 1,536 | 1,419 | 8.3% |
Adjustments to the Concession's Financial Asset | 43 | 113 | -62.3% | 345 | 204 | 68.8% |
Other Revenues and Income | 104 | 79 | 31.1% | 467 | 321 | 45.3% |
Total | 8,613 | 9,197 | -6.4% | 36,310 | 33,768 | 7.5% |
|
|
|
| |||
Deductions from the Gross Operating Revenue |
|
|
|
| ||
ICMS Tax | (1,647) | (1,405) | 17.2% | (6,090) | (5,362) | 13.6% |
PIS and COFINS Taxes | (743) | (767) | -3.1% | (3,179) | (2,889) | 10.0% |
CDE Sector Charge | (1,187) | (787) | 50.9% | (4,016) | (3,186) | 26.1% |
R&D and Energy Efficiency Program | (45) | (51) | -10.0% | (203) | (188) | 8.1% |
PROINFA | (40) | (39) | 3.1% | (152) | (167) | -9.0% |
Tariff Flags and Others | 216 | (395) | - | (179) | (878) | -79.7% |
Others | (7) | (5) | 26.6% | (24) | (21) | 15.6% |
Total | (3,452) | (3,447) | 0.1% | (13,843) | (12,692) | 9.1% |
|
|
|
| |||
Net Operating Revenue | 5,160 | 5,750 | -10.2% | 22,467 | 21,077 | 6.6% |
In 4Q18, gross operating revenue amounted to R$ 8,613 million, a reduction of 6.4% (R$ 584 million), due to the following factors:
· Variation of R$ 1,586 million in the Sectoral Financial Assets/Liabilities, from a sectoral financial asset of R$ 852 million in 4Q17 to a sectoral financial liability of R$ 735 million in 4Q18;
· Reduction of 93.3% (R$ 181 million) in Short-term Electric Energy;
· Reduction of 62.3% (R$ 70 million) in the adjustments to the Concession´s Financial Asset;
· Reduction of 4.0% (R$ 24 million) in revenue from building the infrastructure of the concession;
Partially offset by:
· Increase of 17.4% (R$ 1,224 million) in the revenue with energy sales (captive + free clients), due to: (i) the positive average tariff adjustment in the distribution companies for the period between 4Q17 and 4Q18 (highlight for the average increases of 16.90% in CPFL Paulista and 22.47% in RGE Sul, in April 2018, of 20.58% in RGE, in June 2018, and of 19.25% in CPFL Piratininga, in October 2018); and (ii) the increase of 1.2% in the sales volume within the concession area;
· Increase of 7.9% (R$ 28 million) in tariff subsidies (CDE resources);
· Increase of 31.1% (R$ 25 million) in Other Revenues and Income.
Deductions from the gross operating revenue were R$ 3,452 million in 4Q18, representing an increase of 0.1% (R$ 5 million), due to the following factors:
· Increase of 50.9% (R$ 400 million) in the CDE sector charge;
· Increase of 17.2% (R$ 242 million) in ICMS tax;
· Increase of 3.1% (R$ 1 million) in the PROINFA;
· Increase of 26.6% (R$ 1 million) in other deductions from the gross operating revenue;
Partially offset by the following factor:
Page34 de69
| 4Q18/2018 Results | March 28, 2019 |
· Variation of R$ 611 million in tariff flags approved by the CCEE, from an expense of R$ 395 million in 4Q17 to a revenue of R$ 216 million in 4Q18;
· Reduction of 3.1% (R$ 24 million) in PIS and COFINS taxes;
· Reduction of 10.0% (R$ 5 million) in the R&D and Energy Efficiency Program.
Net operating revenue reached R$ 5,160 million in 4Q18, representing a reduction of 10.2% (R$ 589 million).
In 2018, gross operating revenue amounted to R$ 36,310 million, an increase of 7.5% (R$ 2,542 million), due to the following factors:
· Increase of 15.4% (R$ 4,029 million) in the revenue with energy sales (captive + free clients), due to: (i) the positive average tariff adjustment in the distribution companies for the period between 2017 and 2018; and (ii) the increase of 2.5% in the sales volume within the concession area;
· Increase of 45.3% (R$ 146 million) in Other Revenues and Income;
· Increase of 68.8% (R$ 141 million) in the adjustments to the Concession´s Financial Asset;
· Increase of 8.3% (R$ 117 million) in tariff subsidies (CDE resources);
Partially offset by:
· Reduction of 54.7% (R$ 942 million) in Short-term Electric Energy;
· Reduction of 36.5% (R$ 693 million) in the Sectoral Financial Assets/Liabilities;
· Reduction of 12.6% (R$ 256 million) in revenue from building the infrastructure of the concession.
Deductions from the gross operating revenue were R$ 13,843 million in 2018, representing an increase of 9.1% (R$ 1,151 million), due to the following factors:
· Increase of 26.1% (R$ 831 million) in the CDE sector charge;
· Increase of 13.6% (R$ 728 million) in ICMS tax;
· Increase of 10.0% (R$ 289 million) in PIS and COFINS taxes;
· Increase of 8.1% (R$ 15 million) in the R&D and Energy Efficiency Program;
· Increase of 15.6% (R$ 3 million) in other deductions from the gross operating revenue;
Partially offset by the following factors:
· Reduction of 79.7% (R$ 700 million) in tariff flags approved by the CCEE;
· Reduction of 9.0% (R$ 15 million) in the PROINFA.
Net operating revenue reached R$ 22,467 million in 2018, representing an increase of 6.6% (R$ 1,391 million).
Page35 de69
| 4Q18/2018 Results | March 28, 2019 |
11.1.1.3) Cost of Electric Energy
Cost of Electric Energy (R$ Million) | ||||||
| 4Q18 | 4Q17 | Var. | 2018 | 2017 | Var. |
Cost of Electric Power Purchased for Resale | ||||||
Energy from Itaipu Binacional | 643 | 587 | 9.6% | 2,668 | 2,351 | 13.5% |
PROINFA | 81 | 77 | 5.0% | 331 | 293 | 12.8% |
Energy Purchased through Auction in the Regulated Environment, Bilateral Contracts and Energy Purchased in the Spot Market | 2,061 | 3,085 | -33.2% | 10,979 | 11,643 | -5.7% |
PIS and COFINS Tax Credit | (242) | (346) | -30.1% | (1,239) | (1,318) | -5.9% |
Total | 2,542 | 3,403 | -25.3% | 12,738 | 12,970 | -1.8% |
|
|
|
| |||
Charges for the Use of the Transmission and Distribution System |
|
|
|
| ||
Basic Network Charges | 465 | 534 | -12.9% | 2,039 | 1,462 | 39.4% |
Itaipu Transmission Charges | 68 | 63 | 7.5% | 266 | 160 | 66.5% |
Connection Charges | 45 | 29 | 54.5% | 155 | 106 | 46.2% |
Charges for the Use of the Distribution System | 9 | 5 | 67.1% | 30 | 21 | 40.6% |
System Service Usage Charges - ESS | 32 | (229) | - | (106) | (453) | -76.6% |
Reserve Energy Charges - EER | - | - | - | 135 | - | - |
PIS and COFINS Tax Credit | (57) | (39) | 49.1% | (235) | (119) | 96.4% |
Total | 562 | 364 | 54.2% | 2,284 | 1,177 | 94.1% |
|
|
|
| |||
Cost of Electric Energy | 3,104 | 3,767 | -17.6% | 15,022 | 14,147 | 6.2% |
In 4Q18, the cost of electric energy, comprising the purchase of electricity for resale and charges for the use of the distribution and transmission system, amounted to R$ 3,104 million, representing a reduction of 17.6% (R$ 663 million):
· Thecost of electric power purchased for resale was R$ 2,542 million in 4Q18, representing a reduction of 25.3% (R$ 860 million), due to the following factors:
(i) Reduction of 33.2% (R$ 1,024 million) in thecost of energy purchased through auction in the regulated environment, bilateral contracts and energy purchased in the spot market, due to the reduction of 34.6% in the average purchase price (from R$ 303.67/MWh in 4Q17 to R$ 198.72/MWh in 4Q18), partially offset by the increase of 2.1% (212 GWh) in the volume of purchased energy;
Partially offset by:
(ii) Reduction of 30.1% (R$ 104 million) inPIS and Cofins tax credit (cost reducer), generated from the energy purchase;
(iii) Increase of 9.6% (R$ 56 million) in thecost of energy fromItaipu, due to theincrease of 16.1% in the average purchase price (from R$ 197.38/MWh in 4Q17 to R$ 229.13/MWh in 4Q18), partially offset by the reduction of 5.6% (167 GWh) in the volume of purchased energy;
(iv) Increase of 5.0% (R$ 4 million) in thecost of the Proinfa, due to theincrease of 6.0% in the average purchase price (from R$ 249.11/MWh in 4Q17 to R$ 264.09/MWh in 4Q18), partially offset by the reduction of 0.9% (3 GWh) in the volume of purchased energy.
· Charges for the use of the transmission and distribution system reached R$ 562 million in 4Q18, representing an increase of 54.2% (R$ 197 million), due to the following factors:
(i) Variation of R$ 261 million in theSystem Service Usage Charges – ESS, from a revenue of R$ 229 million in 4Q17 to an expense of R$ 32 million in 4Q18;
(ii) Increase of 54.5% (R$ 16 million) inconnection charges;
(iii) Increase of 7.5% (R$ 5 million) in theItaipu transmission charges;
(iv) Increase of 67.1% (R$ 3 million) in theusage of the distribution system charges;
Partially offset by:
Page36 de69
| 4Q18/2018 Results | March 28, 2019 |
(v) Reduction of 12.9% (R$ 69 million) incharges for basic network;
(vi) Increase of 49.1% (R$ 19 million) inPIS and Cofins tax credit (cost reducer), generated from the charges.
In 2018, the cost of electric energy, comprising the purchase of electricity for resale and charges for the use of the distribution and transmission system, amounted to R$ 15,022 million, representing an increase of 6.2% (R$ 876 million):
· Thecost of electric power purchased for resale was R$ 12,738 million in 2018, representing a reduction of 1.8% (R$ 232 million), due to the following factors:
(i) Reduction of 5.7% (R$ 665 million) in thecost of energy purchased through auction in the regulated environment, bilateral contracts and energy purchased in the spot market, due to the reduction of 6.6% (2,934 GWh) in the volume of purchased energy, partially offset by the increase of 0.9% in the average purchase price (from R$ 261.23/MWh in 2017 to R$ 263.67/MWh in 2018);
Partially offset by:
(ii) Increase of 13.5% (R$ 317 million) in thecost of energy from Itaipu, due to the increase of 20.3% in the average purchase price (from R$ 199.58/MWh in 2017 to R$ 240.03/MWh in 2018), partially offset by the reduction of 5.6% (662 GWh) in the volume of purchased energy;
(iii) Reduction of 5.9% (R$ 78 million) inPIS and Cofins tax credit (cost reducer), generated from the energy purchase;
(iv) Increase of 12.8% (R$ 37 million) in thecost of the Proinfa, due to the increase of 15.9% in the average purchase price (from R$ 256.70/MWh in 2017 to R$ 297.52/MWh in 2018), partially offset by the reduction of 2.7% (31 GWh) in the volume of purchased energy.
· Charges for the use of the transmission and distribution system reached R$ 2,284 million in 2018, representing an increase of 94.1% (R$ 1,107 million), due to the following factors:
(i) Increase of 39.4% (R$ 576 million) incharges for basic network;
(ii) Reduction of 76.6% (R$ 347 million) in theSystem Service Usage Charges – ESS (cost reducer), from a revenue of R$ 453 million in 2017 to a revenue of R$ 106 million in 2018;
(iii) Expense of R$ 135 million in 2018, related to theEnergy Reserve Charges – EER;
(iv) Increase of 66.5% (R$ 106 million) in theItaipu transmission charges;
(v) Increase of 46.2% (R$ 49 million) inconnection charges;
(vi) Increase of 40.6% (R$ 9 million) in theusage of the distribution system charges;
Partially offset by:
(vii) Increase of 96.4% (R$ 115 million) inPIS and Cofins tax credit (cost reducer), generated from the charges.
11.1.1.4) Operating Costs and Expenses
Operating costs and expenses reached R$ 1,526 million in 4Q18, compared to R$ 1,494 million in 4Q17, an increase of 2.1% (R$ 32 million). In 2018, operating costs and expenses reached R$ 5,208 million, compared to R$ 5,399 million in 2017, a reduction of 3.5% (R$ 192 million).
Page37 de69
| 4Q18/2018 Results | March 28, 2019 |
The factors that explain these variations follow below:
PMSO
Reported PMSO (R$ million) | ||||||||
| 4Q18 | 4Q17 | Variation | 2018 | 2017 | Variação | ||
| R$ MM | % | R$ MM | % | ||||
Reported PMSO |
|
|
|
|
|
|
|
|
Personnel | (245) | (251) | 6 | -2.4% | (926) | (920) | (5) | 0.6% |
Material | (46) | (46) | (0) | 0.6% | (170) | (170) | (1) | 0.3% |
Outsourced Services | (239) | (235) | (5) | 2.1% | (866) | (853) | (14) | 1.6% |
Other Operating Costs/Expenses | (209) | (163) | (46) | 28.0% | (620) | (615) | (5) | 0.8% |
Allowance for doubtful accounts | (50) | (36) | (14) | 39.9% | (166) | (155) | (11) | 6.9% |
Legal and judicial expenses | (73) | (59) | (14) | 24.2% | (180) | (179) | (0) | 0.1% |
Others | (85) | (68) | (17) | 25.1% | (274) | (280) | 6 | -2.1% |
Total Reported PMSO | (739) | (695) | (45) | 6.4% | (2,582) | (2,557) | (24) | 1.0% |
In 4Q18,PMSO reached R$ 739 million, an increase of 6.4% (R$ 45 million), compared to R$ 695 million in 4Q17.
Personnel– reduction of 2.4% (R$ 6 million);
Material– increase of 0.6% (R$ 0.3 million);
Third party services – increase of 2.1% (R$ 5 million), mainly due to the increases in the following items: maintenance services in lines, network and substations (R$ 8 million), outsourced services (R$ 6 million), delinquency/collection recovery (R$ 2 million), hardware/software maintenance (R$ 2 million), meter reading and use (R$ 2 million), maintenance and conservation of buildings (R$ 2 million); partially offset by the reductions in other outsourced services (R$ 8 million), maintenance in machinery and equipment (R$ 4 million) and maintenance of the electric system – lines and network (R$ 3 million) and cleanliness and conservation (R$ 2 million);
Other operating costs/expenses – increase of 28.0% (R$ 46 million), due to the increases in the following items: (a) compensation for non-compliance with technical indicators (R$ 16 million), which as from January 2018 was classified under Other Revenues, (b) legal and judicial expenses (R$ 14 million), (c) allowance for doubtful accounts (R$ 14 million) and (d) other costs/expenses (R$ 1 million).
In 2018,PMSO reached R$ 2,582 million, an increase of 1.0% (R$ 24 million), compared to R$ 2,557 million in 2017.
Personnel– increase of 0.6% (R$ 5 million), mainly due to the collective bargaining agreement – wages and benefits;
Material– increase of 0.3% (R$ 1 million);
Third party services – increase of 1.6% (R$ 14 million), mainly due to the increases in the following items: maintenance services in lines, network and substations (R$ 21 million), outsourced services (R$ 15 million), meter reading and use (R$ 9 million), tree pruning (R$ 7 million), auditand consulting (R$ 5 million), hardware/software maintenance (R$ 4 million) and maintenance and conservation of buildings (R$ 3 million); partially offset by the reductions in other outsourced services (R$ 32 million), maintenance in machinery and equipment (R$ 13 million) and maintenance of the electric system – lines and network (R$ 4 million);
Page38 de69
| 4Q18/2018 Results | March 28, 2019 |
Other operating costs/expenses – increase of 0.8% (R$ 5 million), due to the increases in the following items: (a) loss on disposal, retirement and other noncurrent assets (R$ 21 million), (b) other costs/expenses (R$ 16 million), (c) allowance for doubtful accounts (R$ 11 million) and (d) collection fees (R$ 7 million); partially offset by the reduction in compensation for non-compliance with technical indicators (R$ 50 million), which as from January 2018 was classified under Other Revenues.
Other operating costs and expenses
In 4Q18, other operating costs and expenses reached R$ 787 million, compared to R$ 800 million in 4Q17, registering a reduction of 1.6% (R$ 13 million), with the variations below:
| (i) | Reduction of 4.0% (R$ 24 million) incost of building the concession´s infrastructure. This item, which reached R$ 568 million in 4Q18, does not affect results, since it has its counterpart in “operating revenue”; | |
| (ii) | Reduction of 21.0% (R$ 6 million) inPrivate Pension Fund item, due to the registration of the impacts of the 2018 actuarial report; | |
| Partially offset by: | ||
| (iii) | Increase of 9.9% (R$ 16 million) inDepreciation and Amortization item; | |
| (iv) | Increase of 4.7% (R$ 1 million) inAmortization of Intangible of Concession Asset item. |
In 2018, other operating costs and expenses reached R$ 2,626 million, compared to R$ 2,842 million in 2017, registering a reduction of 7.6% (R$ 216 million), with the variations below:
| (v) | Reduction of 12.6% (R$ 256 million) incost of building the concession´s infrastructure. This item, which reached R$ 1,771 million in 2018, does not affect results, since it has its counterpart in “operating revenue”; | |
| (vi) | Reduction of 21.0% (R$ 23 million) inPrivate Pension Fund item, due to the registration of the impacts of the 2018 actuarial report; | |
| (vii) | Reduction of 2.9% (R$ 2 million) inAmortization of Intangible of Concession Asset item; | |
| Partially offset by: | ||
| (viii) | Increase of 10.1% (R$ 65 million) inDepreciation and Amortization item. |
11.1.1.5) EBITDA
EBITDAtotaled R$ 726 million in 4Q18, compared to R$ 668 million in 4Q17, an increase of 8.7% (R$ 58 million). In 2018,EBITDAtotaled R$ 3,004 million, compared to R$ 2,234 million in 2017, an increase of 34.5% (R$ 770 million).
Page39 de69
| 4Q18/2018 Results | March 28, 2019 |
Conciliation of Net Income and EBITDA (R$ million) | ||||||
| 4Q18 | 4Q17 | Var. | 2018 | 2017 | Var. |
Net income | 511 | 337 | 51.8% | 1,432 | 665 | 115.4% |
Depreciation and Amortization | 196 | 179 |
| 767 | 704 | |
Financial Results | 61 | 87 |
| 310 | 566 | |
Income Tax /Social Contribution | (42) | 64 |
| 495 | 300 | |
EBITDA | 726 | 668 | 8.7% | 3,004 | 2,234 | 34.5% |
11.1.1.6) Financial Result
Financial Result (R$ Million) | ||||||
| 4Q18 | 4Q17 | Var. | 2018 | 2017 | Var. |
Revenues | ||||||
Income from Financial Investments | 15 | 28 | -46.1% | 74 | 218 | -66.0% |
Additions and Late Payment Fines | 73 | 61 | 18.8% | 273 | 262 | 4.3% |
Fiscal Credits Update | 1 | 1 | -7.4% | 8 | 8 | 4.5% |
Judicial Deposits Update | 9 | 9 | -5.0% | 36 | 49 | -26.6% |
Monetary and Foreign Exchange Updates | 19 | 14 | 38.7% | 69 | 40 | 71.5% |
Discount on Purchase of ICMS Credit | 9 | 7 | 29.0% | 34 | 16 | 106.1% |
Sectoral Financial Assets Update | 36 | - | - | 80 | - | - |
PIS and COFINS - over Other Financial Revenues | (9) | (9) | 9.5% | (36) | (36) | 0.0% |
Others | 9 | 13 | -30.1% | 38 | 41 | -9.5% |
Total | 161 | 125 | 29.0% | 575 | 597 | -3.8% |
|
|
|
| |||
Expenses |
|
|
|
| ||
Debt Charges | (149) | (131) | 13.8% | (582) | (623) | -6.6% |
Monetary and Foreign Exchange Updates | (44) | (69) | -36.2% | (227) | (390) | -41.9% |
(-) Capitalized Interest | 6 | 6 | -7.3% | 18 | 21 | -13.1% |
Sectoral Financial Liabilities Update | - | (2) | -100.0% | - | (82) | -100.0% |
Others | (35) | (18) | 99.2% | (93) | (88) | 5.6% |
Total | (222) | (212) | 4.5% | (885) | (1,164) | -24.0% |
|
|
|
| |||
Financial Result | (61) | (87) | -30.4% | (310) | (566) | -45.3% |
In 4Q18, the net financial result recorded a net financial expense of R$ 61 million, a reduction of 30.4% (R$ 27 million). The items explaining these changes are as follows:
· Financial Revenue: increase of 29.0% (R$ 36 million), from R$ 125 million in 4Q17 to R$ 161 million in 4Q18, mainly due to the following factors:
| (i) | Sectoral financial assets update in 4Q18, in the amount of R$ 36 million; | |
| (ii) | Increase of 18.8% (R$ 12 million) inlate payment interest and fines; | |
| (iii) | Increase of 38.7% (R$ 5 million) inadjustments for inflation and exchange rate changes, due to (a) the increase of R$ 12 million in revenues from fines, interest and monetary adjustment relating to installment payments made by consumers; partially offset by the reductions (b) of R$ 6 million in the adjustment of the balance of tariff subsidies, as determined by Aneel, and (c) of R$ 1 million in other adjustments for inflation and exchange rate changes; | |
| (iv) | Increase of 29.0% (R$ 2 million) in thediscount on purchase of ICMS credit; | |
| Partially offset by: | ||
| (v) | Reduction of 46.1% (R$ 13 million) in theincome from financial investments, due to the lower average balance of investments and the fall of CDI interbank rate; |
Page40 de69
| 4Q18/2018 Results | March 28, 2019 |
| (vi) | Reduction of 30.1% (R$ 4 million) inother financial revenues; | |
| (vii) | Increase of 9.5% (R$ 1 million) inPIS and Cofins on financial revenues (revenue reducer). |
· Financial Expense: increase of 4.5% (R$ 10 million), from R$ 212 million in 4Q17 to R$ 222 million in 4Q18, mainly due to the following factors:
| (i) | Increase of 13.8% (R$ 18 million) in interest on debt in local currency; | |
| (ii) | Increase of 99.2% (R$ 17 million) inother financial expenses; | |
| Partially offset by: | ||
| (iii) | Reduction of 36.2% (R$ 25 million) inadjustments for inflation and exchange rate changes, due to: (a) the mark-to-market positive effect for financial operations under Law 4,131 – non-cash effect (R$ 14 million); and (b) the effect of Itaipu’s exchange variation (R$ 13 million); partially offset by (c) the increase of debt charges in foreign currency, with swap to CDI interbank rate (R$ 2 million); | |
| (iv) | Sectoral financial liabilities update in 4Q17, in the amount of R$ 2 million (expense reducer). |
In 2018, the net financial result recorded a net financial expense of R$ 310 million, a reduction of 45.3% (R$ 257 million). The items explaining these changes are as follows:
· Financial Revenue: reduction of 3.8% (R$ 23 million), from R$ 597 million in 2017 to R$ 575 million in 2018, mainly due to the following factors:
| (i) | Reduction of 66.0% (R$ 144 million) in theincome from financial investments, due to the lower average balance of investments and the fall of CDI interbank rate; | |
| (ii) | Reduction of 26.6% (R$ 13 million) inadjustments for inflation of escrow deposits; | |
| (iii) | Reduction of 9.5% (R$ 4 million) inother financial revenues; | |
| Partially offset by: | ||
| (iv) | Sectoral financial assets update in 2018, in the amount of R$ 80 million; | |
| (v) | Increase of 71.5% (R$ 29 million) inadjustments for inflation and exchange rate changes, due to: (a) the increase of R$ 38 million in revenues from fines, interest and monetary adjustment relating to installment payments made by consumers; partially offset by the reductions (b) of R$ 5 million in other adjustments for inflation and exchange rate changes, and (c) of R$ 4 million in the adjustment of the balance of tariff subsidies, as determined by Aneel; | |
| (vi) | Increase of 106.1% (R$ 17 million) in thediscount on purchase of ICMS credit; | |
| (vii) | Increase of 4.3% (R$ 11 million) inlate payment interest and fines. |
· Financial Expense: reduction of 24.0% (R$ 279 million), from R$ 1,164 million in 2017 to R$ 885 million in 2018, mainly due to the following factors:
| (i) | Reduction of 41.9% (R$ 163 million) inadjustments for inflation and exchange rate changes, due to: (a) the reduction of debt charges in foreign currency, with swap to CDI interbank rate (R$ 103 million); (b) the mark-to-market positive effect for financial operations under Law 4,131 – non-cash effect (R$ 53 million); and (c) the effect of exchange variation in Itaipu invoices (R$ 7 million); | |
| (ii) | Sectoral financial liabilities update in 2017, in the amount of R$ 82 million (expensereducer); |
Page41 de69
| 4Q18/2018 Results | March 28, 2019 |
(iii) Reduction of 6.6% (R$ 41 million) ininterest on debt in local currency;
Partially offset by:
(iv) Increase of 5.6% (R$ 5 million) inother financial expenses;
(v) Reduction of 13.1% (R$ 3 million) incapitalized interest (expense reducer).
11.1.1.7) Net Income
Net Incometotaled R$ 511 million in 4Q18, compared to R$ 337 million in 4Q17, an increase of 51.8% (R$ 174 million). In 2018,Net Incometotaled R$ 1,432 million, compared to R$ 665 million in 2017, an increase of 115.4% (R$ 768 million).
11.1.2) Tariff Events
Reference dates
Tariff Process Dates | |
Distributor | Date |
CPFL Santa Cruz | March 22nd |
CPFL Paulista | April 8th |
New RGE | June 19th |
CPFL Piratininga | October 23rd |
Tariff Revision | |||
Distributor | Periodicity | Next Revision | Cycle |
CPFL Piratininga | Every 4 years | October 2019 | 5thPTRC |
CPFL Santa Cruz | Every 5 years | March 2021 | 5th PTRC |
CPFL Paulista | Every 5 years | April 2023 | 5th PTRC |
New RGE | Every 5 years | June 2023 | 5th PTRC |
Annual tariff adjustments occurred in October 2018 and March 2019
| CPFL Piratininga | CPFL Santa Cruz |
Ratifying Resolution | 2,472 | 2,522 |
Adjustment | 20.01% | 13.31% |
Parcel A | 7.07% | 1.12% |
Parcel B | 1.76% | 0.90% |
Financial Components | 11.18% | 11.29% |
Effect on consumer billings | 19.25% | 13.31% |
Date of entry into force | 10/23/2018 | 03/22/2019 |
Page42 de69
| 4Q18/2018 Results | March 28, 2019 |
Periodic tariff reviews occurred in 2018
| CPFL Paulista | RGE Sul | RGE |
Ratifying Resolution | 2,381 | 2,385 | 2,401 |
Adjustment | 12.68% | 18.44% | 21.27% |
Parcel A | 5.53% | 6.79% | 6.11% |
Parcel B | 3.14% | 4.77% | 9.45% |
Financial Components | 4.01% | 6.88% | 5.71% |
Effect on consumer billings | 16.90% | 22.47% | 20.58% |
Date of entry into force | 04/08/2018 | 04/19/2018 | 06/19/2018 |
4th Periodic Tariff Review Cycle | CPFL Paulista | RGE Sul | RGE |
Date | Apr-18 | Apr-18 | Jun-18 |
Gross Regulatory Asset Base (A) | 9,457 | 3,605 | 4,374 |
Depreciation Rate (B) | 3.72% | 3.87% | 3.74% |
Depreciation Quota (C = A x B) | 352 | 140 | 164 |
Net Regulatory Asset Base (D) | 5,193 | 2,389 | 3,032 |
Pre-tax WACC (E) | 12.26% | 12.26% | 12.26% |
Cost of Capital (F = D x E) | 637 | 290 | 372 |
Special Obligations (G) | 45 | 5 | 8 |
Regulatory EBITDA (H = C + F + G) | 1,033 | 435 | 543 |
OPEX = CAOM + CAIMI (I) | 1,245 | 438 | 523 |
Parcel B (J = H + I) | 2,278 | 872 | 1,066 |
Productivity Index Parcel B ( K ) | 0.96% | 0.98% | 1.07% |
Quality Incentive Mechanism ( L) | -0.17% | -0.71% | 0.05% |
Parcel B with adjusts (M = J * (K - L) | 2,260 | 870 | 1,054 |
Other Revenues (N) | 88 | 19 | 28 |
Adjusted Parcel B (O = M - N) | 2,172 | 851 | 1,026 |
Parcel A (P) | 7,785 | 2,653 | 2,816 |
Required Revenue (Q = O + P) | 9,957 | 3,504 | 3,842 |
On April 3, 2018, ANEEL approved the result of the fourth Periodic Tariff Review of distributor CPFL Paulista. The average effect to be perceived by the consumers is 16.90% and details can be found in the table above.
RGE Sul
On April 17, 2018, ANEEL approved the result of the fourth Periodic Tariff Review of distributor RGE Sul. The average effect to be perceived by the consumers was 22.47% and details can be found in the table above.
Page43 de69
| 4Q18/2018 Results | March 28, 2019 |
RGE
On June 19, 2018, ANEEL approved the result of the fourth Periodic Tariff Review of distributor RGE Sul. The average effect to be perceived by the consumers was 20.58% and details can be found in the table above.
11.1.3) Operating Performance of Distribution
Below we are presenting the results achieved by the distribution companies with regard to the main indicators that measure the quality and reliability of their supply of electric energy. The SAIDI (System Average Interruption Duration Index) measures the average duration, in hours, of interruption per consumer per year. The SAIFI (System Average Interruption Frequency Index) measures the average number of interruptions per consumer per year.
SAIDI and SAIFI Indicators | ||||||||||||||||||
Distributor | SAIDI (hours) | SAIFI (interruptions) | ||||||||||||||||
2014 | 2015 | 2016 | 2017 | 1Q18 | 2Q18 | 3Q18 | 4Q18 | ANEEL1 | 2014 | 2015 | 2016 | 2017 | 1Q18 | 2Q18 | 3Q18 | 4Q18 | ANEEL1 | |
CPFL Paulista | 6.92 | 7.76 | 7.62 | 7.14 | 6.90 | 6.50 | 6.25 | 6.17 | 7.38 | 4.87 | 4.89 | 5.00 | 4.94 | 4.76 | 4.46 | 4.13 | 4.01 | 6.33 |
CPFL Piratininga | 6.98 | 7.24 | 8.44² | 6.97 | 6.37 | 5.93 | 6.01 | 5.92 | 6.74 | 4.19 | 4.31 | 3.97² | 4.45 | 4.13 | 3.61 | 3.71 | 3.88 | 5.82 |
RGE | 18.77 | 15.98 | 14.44 | 14.17 | 13.74 | 13.46 | 13.15 | 13.43 | 11.48 | 9.14 | 8.33 | 7.56 | 7.74 | 7.09 | 6.71 | 6.28 | 6.30 | 8.50 |
RGE Sul | 17.75 | 19.11 | 19.45 | 15.58 | 15.30 | 15.54 | 15.98 | 15.56 | 10.79 | 8.87 | 8.42 | 9.41 | 7.62 | 7.05 | 6.51 | 6.34 | 5.89 | 8.30 |
CPFL Santa Cruz |
|
|
| 6.20 | 5.80 | 5.61 | 5.61 | 6.01 | 8.75 |
|
|
| 5.12 | 5.26 | 4.98 | 4.89 | 5.09 | 7.88 |
1) 2018 Regulatory Agency (ANEEL);
2) In the previous disclosures, we reported a SAIDI of 6.97 and a SAIFI of 3.80 for CPFL Piratininga in 2016. This number excluded the effect of a CTEEP transmission failure during a storm. However, a decision by ANEEL determined that this effect was included in the SAIDI and SAIFI statistics, so that we corrected the values, as shown in the table.
The year of 2018 presented positive historical results, mainly for the distributors of São Paulo and RGE. CPFL Santa Cruz and RGE presented the best historical result of SAIDI. CPFL Paulista and CPFL Piratininga presented the best result of SAIDI since 2010 and 2012, respectively. For the consolidated SAIFI of 2018, it was the best result for all companies in the CPFL group: CPFL Paulista, CPFL Piratininga, CPFL Santa Cruz, RGE e RGE Sul.
As regards RGE Sul specifically, the recovery plan for technical indicators remains Rural, Troncal and Urban pruning, treatment of major primary, secondary and damage recidivism, programming of services for testing and maintenance in substations and transmission lines, carry out termovision and ultrasound inspections in distribution networks, substations and transmission lines. In addition, part of the maintenance plan, improvements and extensions of the existing structure, with the forecast of exchanges of posts, capacity adjustment, modernization of substations, and installation of remote control and control equipment. This plan is part of a continuous improvement that is already under development. In addition to the significant investments being made, the significant reduction of these investments has already been observed.
Since 2019, the RGE and RGE Sul concessions have been unified, becoming a single distributor for the purpose of calculating technical indicators.
Page44 de69
| 4Q18/2018 Results | March 28, 2019 |
Losses
Find below the performance of CPFL distribution companies throughout the last quarters:
12M Accumulated Losses1 | Total Losses | |||||
4Q17 | 1Q18 | 2Q18 | 3Q18 | 4Q18 | ANEEL | |
CPFL Energia | 8.91% | 8.82% | 9.02% | 8.86% | 8.97% | 8.30% |
CPFL Paulista | 8.94% | 8.93% | 9.10% | 8.87% | 9.09% | 8.33% |
CPFL Piratininga | 7.70% | 7.72% | 7.87% | 7.79% | 7.90% | 6.92% |
RGE | 9.01% | 8.79% | 9.05% | 8.98% | 8.95% | 9.28% |
RGE Sul | 10.63% | 10.24% | 10.55% | 10.58% | 10.38% | 8.90% |
CPFL Santa Cruz | 8.59% | 8.65% | 8.84% | 8.09% | 8.50% | 7.59% |
Notes:
1) The figures above were adequate to a better comparison with the regulatory losses trajectory defined by the Regulatory Agency (ANEEL). In CPFL Piratininga, RGE and RGE Sul, high-voltage customers were disregarded;
The consolidated losses index of CPFL Energia was of 8.97% in 4Q18, compared to 8.86% in 3Q18, an increase of 0.11 p.p. Compared to 4Q17 (8.91%), there was an increase of 0.06 p.p.
��
11.2) Commercialization and Services Segments
11.2.1) Commercialization Segment
Consolidated Income Statement - Commercialization (R$ Million) | ||||||
| 4Q18 | 4Q17 | Var. | 2018 | 2017 | Var. |
Net Operating Revenue | 963 | 1,044 | -7.8% | 3,496 | 3,414 | 2.4% |
EBITDA(1) | 14 | 53 | -73.0% | 96 | 171 | -43.5% |
Net Loss | 10 | 29 | -65.5% | 53 | 90 | -41.2% |
Note:
(1) EBITDA is calculated from the sum of net income, taxes, financial result and depreciation/amortization.
Operating Revenue
In 4Q18, net operating revenue reached R$ 963 million, representing a reduction of 7.8% (R$ 81 million).
In 2018, net operating revenue reached R$ 3,496 million, representing an increase of 2.4% (R$ 82 million).
EBITDA
In 4Q18, EBITDA totaled R$ 14 million, compared to R$ 53 million in 4Q17, a reduction of 73.0% (R$ 39 million).
In 2018, EBITDA totaled R$ 96 million, compared to R$ 171 million in 2017, a reduction of 43.5% (R$ 74 million).
Net Income
Page45 de69
| 4Q18/2018 Results | March 28, 2019 |
In 4Q18, net income was R$ 10 million, compared to net income of R$ 29 million in 4Q17, a reduction of 65.5% (R$ 19 million).
In 2018, net income was R$ 53 million, compared to net income of R$ 90 million in 2017, a reduction of 41.2% (R$ 37 million).
11.2.2) Services Segment
Consolidated Income Statement - Services (R$ Million) | ||||||
| 4Q18 | 4Q17 | Var. | 2018 | 2017 | Var. |
Net Operating Revenue | 153 | 140 | 9.7% | 533 | 486 | 9.7% |
EBITDA(1) | 16 | 27 | -40.0% | 95 | 87 | 8.9% |
Net Income | (3) | 17 | - | 43 | 55 | -21.7% |
Note:
(1) EBITDA is calculated from the sum of net income, taxes, financial result and depreciation/amortization.
Operating Revenue
In 4Q18, net operating revenue reached R$ 153 million, representing an increase of 9.7% (R$ 14 million).
In 2018, net operating revenue reached R$ 533 million, representing an increase of 9.7% (R$ 47 million).
EBITDA
In 4Q18, EBITDA totaled R$ 16 million, compared to R$ 27 million in 4Q17, a reduction of 40.0% (R$ 11 million).
In 2018, EBITDA totaled R$ 95 million, compared to R$ 87 million in 2017, an increase of 8.9% (R$ 8 million).
Net Income
In 4Q18, net loss was R$ 3 million, compared to a net income of R$ 17 million in 4Q17.
In 2018, net income was R$ 43 million, compared to R$ 55 million in 2017, a reduction of 21.7% (R$ 12 million).
Page46 de69
| 4Q18/2018 Results | March 28, 2019 |
11.3) Conventional Generation Segment
11.3.1) Economic-Financial Performance
Consolidated Income Statement - Conventional Generation (R$ million) | ||||||
| 4Q18 | 4Q17 | Var. | 2018 | 2017 | Var. |
Gross Operating Revenue | 316 | 324 | -2.5% | 1,276 | 1,303 | -2.1% |
Net Operating Revenue | 285 | 295 | -3.4% | 1,144 | 1,190 | -3.9% |
Cost of Electric Power | (35) | (49) | -28.6% | (102) | (147) | -30.5% |
Operating Costs & Expenses | (60) | (61) | -1.3% | (221) | (277) | -20.2% |
EBIT | 190 | 185 | 2.5% | 821 | 766 | 7.2% |
EBITDA | 312 | 275 | 13.4% | 1,272 | 1,200 | 6.1% |
Financial Income (Expense) | (43) | (63) | -31.7% | (248) | (329) | -24.4% |
Income Before Taxes | 240 | 181 | 32.2% | 907 | 750 | 21.0% |
Net Income | 234 | 185 | 26.4% | 770 | 654 | 17.7% |
Nota:
(1) EBITDA is calculated from the sum of net income, taxes, financial result and depreciation/amortization.
11.3.1.1) Operating Revenue
In the analysis presented in this report we consider the migration of the transmission companies CPFL Piracicaba and CPFL Morro Agudo from “Others” to “Conventional Generation” segment.
In 4Q18,Gross Operating Revenuereached R$ 316 million, a reduction of 2.5% (R$ 8 million).Net Operating Revenue was of R$ 285 million,registering a reduction of 3.4% (R$ 10 million).
The main factors that affected the net operating revenue are:
- Reduction of R$ 11 million in other operating revenues;
- Reduction of 2.1% (R$ 4 million) in the revenue with the power supply to CPFL Paulista and CPFL Piratininga;
Partially offset by:
- Increase of 6.5% (R$ 6 million) in the revenue from the plants of Rio das Antas Complex (CERAN);
- Increase of R$ 2 million in the revenue with the power supply from Jaguari Geração.
In 2018, Gross Operating Revenue reached R$ 1,276 million, a reduction of 2.1% (R$ 27 million).Net Operating Revenue was of R$ 1,144 million, registering a reduction of 3.9% (R$ 46 million).
The main factors that affected the net operating revenue are:
- The effect of the consolidation of the transmission companies, with the reduction of R$ 45 million in the Revenue from Construction of Concession Infrastructure;
- Reduction of R$ 16 million in other operating revenues;
- Reduction of 2.0% (R$ 15 million) in the revenue with the power supply to CPFL Paulista and CPFL Piratininga;
Partially offset by:
- Increase of R$ 34 million in the revenue from the plants of Rio das Antas Complex (CERAN);
· Increase of R$ 15 million in the revenue with the power supply from Jaguari Geração.
Page47 de69
| 4Q18/2018 Results | March 28, 2019 |
11.3.1.2) Cost of Electric Power
In the analysis presented in this report we consider the migration of the transmission companies CPFL Piracicaba and CPFL Morro Agudo from “Others” to “Conventional Generation” segment.
In 4Q18, the cost of electric power reached R$ 35 million, a reduction of 28.6% (R$ 14 million), mainly due to the following factors:
- Reduction of 29.2% (R$ 12 million) in the cost with Electric Energy Purchased for Resale, mainly due to the reduction in the average purchase price of the energy from BAESA, combined with the gain with reimbursement of the GSF agreement.
- Reduction of 25.0% (R$ 2 million) in the cost with Charges for the Use of the Transmission and Distribution System.
In 2018, the cost of electric power reached R$ 102 million, a reduction of 30.5% (R$ 45 million), mainly due to the following factors:
· Reduction of 36.2% (R$ 44 million) in the cost with Electric Energy Purchased for Resale, mainly due to the following factors:
(i) In CPFL Geração, reduction in the cost with the purchase of energy (R$ 50 million), mainly due to the reduction in the average purchase price of the energy from BAESA, combined with the gain with reimbursement of the GSF agreement;
(ii) Reduction of R$ 9 million in the cost of energy of Rio das Antas Complex (CERAN);
(iii) Reduction of R$ 2 million in the cost with energy from CPFL Centrais Geradoras;
Partially offset by:
(iv) Increase of R$ 17 million in the cost with energy from Paulista Lajeado.
· Reduction of 5.0% (R$ 1 million) in the cost with Charges for the Use of the Transmission and Distribution System.
11.3.1.3)Operating Costs and Expenses
In the analysis presented in this report we consider the migration of the transmission companies CPFL Piracicaba and CPFL Morro Agudo from “Others” to “Conventional Generation” segment.
Operating costs and expenses reached R$ 60 million in 4Q18, compared to R$ 61 million in 4Q17, a reduction of 1.3% (R$ 1 million). In 2018, operating costs and expenses reached R$ 221 million, compared to R$ 277 million in 2017, a reduction of 20.2% (R$ 56 million).
The factors that explain these variations follow below:
PMSO
Page48 de69
| 4Q18/2018 Results | March 28, 2019 |
PMSO (R$ million) | ||||||
| 4Q18 | 4Q17 | Variation | 2018 | 2017 | Variation |
| % | % | ||||
PMSO |
|
|
|
|
|
|
Personnel | 9 | 11 | -13.3% | 35 | 39 | -10.5% |
Material | 1 | 1 | 23.5% | 3 | 4 | -31.8% |
Outsourced Services | 8 | 7 | 22.0% | 23 | 26 | -14.0% |
Other Operating Costs/Expenses | 12 | 12 | 5.2% | 41 | 39 | 4.9% |
GSF Risk Premium | (5) | 2 | -400.0% | 4 | 4 | - |
Others | 18 | 10 | 80.0% | 37 | 35 | 5.4% |
Total PMSO | 31 | 30 | 2.7% | 101 | 109 | -6.7% |
PMSO item reached R$ 31 million in 4Q18, registering an increase of 2.7%, due to the following factors:
(i) Increase of 22.0% (R$ 1 million) in expenses with Outsourced Services;
(ii) Increase of 5.2% (R$ 1 million) in Other Operating Costs/Expenses;
(iii) Increase of 23.5% (R$ 0.2 million) in expenses with Material;
Partially offset by:
(iv) Reduction of 13.3% (R$ 1 million) in expenses with Personnel.
In 2018, PMSO item reached R$ 101 million, compared to R$ 109 million in 2017, registering a reduction of 6.7% (R$ 7 million), due to the following factors:
(i) Reduction of 10.5% (R$ 4 million) in expenses with Personnel;
(ii) Reduction of 14.0% (R$ 4 million) in Outsourced Services;
(iii) Reduction of 31.8% (R$ 1 million) in expenses with Material;
Partially offset by:
(iv) Increase of 4.9% (R$ 2 million) in expenses with Other Operating Costs/Expenses.
Other operating costs and expenses
Other operating costs and expenses reached R$ 29 million in 4Q18, compared to R$ 31 million in 4Q17, registering a reduction of 5.2% (R$ 2 million), explained by the variations below:
(i) Reduction of 5.0% (R$ 1 million) in Depreciation and Amortization item.
(ii) Reduction of 28.3% (R$ 0.1 million) in Costs from Construction of Concession Infrastructure (CPFL Piracicaba and CPFL Morro Agudo);
(iii) Reduction of 24.9% (R$ 0.1 million) in Private Pension Fund.
In 2018, other operating costs and expenses reached R$ 120 million, compared to R$ 168 million in 2017, registering a reduction of 28.9% (R$ 49 million), explained by the variations below:
(i) Reduction of 96.5% (R$ 44 million) in Costs from Construction of Concession Infrastructure (CPFL Piracicaba and CPFL Morro Agudo);
(ii) Reduction of 3.8% (R$ 4 million) in Depreciation and Amortization;
(iii) Reduction of 24.9% (R$ 0.5 million) in Private Pension Fund.
Page49 de69
| 4Q18/2018 Results | March 28, 2019 |
11.3.1.4) Equity Income
Equity Income (R$ Million) | ||||||||
| 4Q18 | 4Q17 | Var. R$ | Var. % | 2018 | 2017 | Var. R$ | Var. % |
Projects | ||||||||
Barra Grande HPP | 5 | (0) | 5 | - | 1 | 12 | (11) | -93.3% |
Campos Novos HPP | 31 | (3) | 34 | - | 101 | 86 | 16 | 18.2% |
Foz do Chapecó HPP | 32 | 26 | 6 | 21.5% | 127 | 121 | 7 | 5.5% |
Epasa TPP | 26 | 37 | (11) | -29.6% | 105 | 95 | 11 | 11.3% |
Total | 93 | 60 | 34 | 56.1% | 335 | 313 | 22 | 7.0% |
In 4Q18, Equity Income result reached R$ 93 million, compared to R$ 60 million in 4Q17, an increase of 56.1% (R$ 34 million).
In 2018, Equity Income result reached R$ 335 million, compared to R$ 313 million in 2017, an increase of 7.0% (R$ 22 million).
Equity Income (R$ Million) | ||||||||
EPASA | 4Q18 | 4Q17 | Var. R$ | Var. % | 2018 | 2017 | Var. R$ | Var. % |
Net Revenue | 121 | 138 | (17) | -12.4% | 448 | 421 | 27 | 6.4% |
Operating Costs / Expenses | (83) | (85) | 2 | -2.9% | (300) | (276) | (23) | 8.4% |
Deprec. / Amortization | (4) | (6) | 2 | -26.9% | (18) | (19) | 1 | -3.1% |
Net Financial Result | (2) | (6) | 4 | -71.8% | (7) | (11) | 4 | -38.4% |
Income Tax | (5) | (8) | 3 | -32.6% | (13) | (14) | 1 | -9.1% |
Net Income | 26 | 37 | (11) | -29.6% | 105 | 95 | 11 | 11.3% |
|
|
|
|
| ||||
Equity Income (R$ Million) | ||||||||
FOZ DO CHAPECO | 4Q18 | 4Q17 | Var. R$ | Var. % | 2018 | 2017 | Var. R$ | Var. % |
Net Revenue | 110 | 110 | 1 | 0.5% | 441 | 423 | 18 | 4.1% |
Operating Costs / Expenses | (25) | (33) | 8 | -23.0% | (98) | (95) | (3) | 2.7% |
Deprec. / Amortization | (13) | (16) | 4 | -21.8% | (60) | (65) | 5 | -7.1% |
Net Financial Result | (21) | (47) | 26 | -54.8% | (90) | (81) | (9) | 11.0% |
Income Tax | (17) | (12) | (5) | 43.8% | (45) | (44) | (1) | 1.2% |
Net Income | 32 | 26 | 6 | 21.5% | 127 | 121 | 7 | 5.5% |
|
|
|
|
| ||||
Equity Income (R$ Million) | ||||||||
BAESA | 4Q18 | 4Q17 | Var. R$ | Var. % | 2018 | 2017 | Var. R$ | Var. % |
Net Revenue | 24 | 43 | (18) | -43.0% | 80 | 103 | (23) | -22.1% |
Operating Costs / Expenses | (13) | (38) | 25 | -66.2% | (54) | (67) | 13 | -19.4% |
Deprec. / Amortization | (3) | (3) | (0) | 0.0% | (13) | (13) | 0 | 0.0% |
Net Financial Result | (4) | (4) | 0 | -11.1% | (12) | (6) | (7) | 115.6% |
Income Tax | (0) | 0 | (1) | - | 4 | (3) | 7 | - |
Net Income | 5 | (0) | 5 | - | 1 | 12 | (11) | - |
Page50 de69
| 4Q18/2018 Results | March 28, 2019 |
Equity Income (R$ Million) | ||||||||
ENERCAN | 4Q18 | 4Q17 | Var. R$ | Var. % | 2018 | 2017 | Var. R$ | Var. % |
Net Revenue | 78 | 71 | 7 | 9.8% | 288 | 283 | 6 | 2.0% |
Operating Costs / Expenses | (23) | (68) | 45 | -66.1% | (92) | (133) | 41 | -30.9% |
Deprec. / Amortization | (6) | (6) | 0 | -5.8% | (24) | (26) | 1 | -5.2% |
Net Financial Result | (5) | (7) | 2 | -33.5% | (20) | 1 | (21) | - |
Income Tax | (14) | 3 | (16) | - | (32) | (22) | (10) | 44.2% |
Net Income | 31 | (3) | 34 | - | 101 | 86 | 16 | 18.2% |
11.3.1.5) EBITDA
In 4Q18,EBITDAwas of R$ 312 million, compared to R$ 275 million in 4Q17, an increase of 13.4% (R$ 37 million).
In 2018,EBITDAwas of R$ 1,272 million, compared to R$ 1,200 million in 2017, an increase of 6.1% (R$ 73 million).
Conciliation of Net Income and EBITDA (R$ million) | ||||||
| 4Q18 | 4Q17 | Var. | 2,018 | 2,017 | Var. |
Net Income | 234 | 185 | 26.4% | 770 | 654 | 17.7% |
Depreciation and Amortization | 29 | 30 |
| 117 | 121 |
|
Financial Result | 43 | 63 |
| 248 | 329 |
|
Income Tax /Social Contribution | 5 | (4) |
| 137 | 96 |
|
EBITDA | 312 | 275 | 13.4% | 1,272 | 1,200 | 6.1% |
11.3.1.6) Financial Result
Financial Result (R$ Million) | ||||||
| 4Q18 | 4Q17 | Var. | 2018 | 2017 | Var. |
Revenues | ||||||
Income from Financial Investments | 6 | 12 | -51.6% | 40 | 80 | -50.1% |
Adjustment for inflation of tax credits | 0 | 0 | 248.5% | 2 | 1 | 185.6% |
Adjustment for inflation and exchange rate changes | 0 | (5) | - | 1 | 19 | -93.0% |
Interest on loan agreements | 7 | 0 | - | 18 | 0 | - |
PIS and COFINS on other finance income | (1) | (1) | 16.8% | (3) | (4) | -11.7% |
Others | 9 | 9 | -5.7% | 18 | 12 | 45.6% |
Total | 21 | 16 | 28.4% | 76 | 109 | -30.1% |
|
|
|
| |||
Expenses |
|
|
|
| ||
Interest on debts | (59) | (65) | -9.2% | (249) | (354) | -29.5% |
Adjustment for inflation and exchange rate changes | (0) | (11) | -95.7% | (52) | (71) | -26.8% |
Use of Public Asset | (4) | (3) | 20.1% | (18) | (8) | 120.7% |
Others | (1) | (0) | 140.2% | (5) | (4) | 20.5% |
Total | (64) | (80) | -19.4% | (324) | (437) | -25.8% |
|
|
|
| |||
Financial Result | (43) | (63) | -31.7% | (248) | (328) | -24.4% |
In 4Q18, the financial result was a net expense of R$ 43 million, representing a reduction of 31.7% (R$ 20 million), compared to net financial expenses of R$ 63 million registered in 4Q17.
Page51 de69
| 4Q18/2018 Results | March 28, 2019 |
· Financial Revenues moved from R$ 16 million in 4Q17 to R$ 21 million in 4Q18, an increase of 28.4% (R$ 5 million), due to:
ü Revenue of R$ 7 million in 4Q18, related tointerest on loan agreements;
ü Variation of R$ 5 million inmonetary and foreign exchange updates (zero-cost collar derivative2 effect of R$ 1 million in the period);
Partially offset by:
ü Reduction of 51.6% (R$ 6 million) related toincome from financial investments.
· Financial Expenses moved from R$ 80 million in 4Q17 to R$ 64 million in 4Q18, a reduction of 19.4% (R$ 15 million), due to:
ü Reduction of 95.7% (R$ 11 million) inmonetary and foreign exchange updates;
ü Reduction of 9.2% (R$ 6 million) indebt charges, mainly due to the reduction in the CDI interbank rate;
Partially offset by:
ü Increase of 20.1% (R$ 1 million) in thefinancial expenses with the Use of Public Asset (UBP);
ü Increase of 140.2% (R$ 1 million) inother financial expenses.
In 2018, the financial result was a net expense of R$ 248 million, representing a reduction of 24.4% (R$ 80 million), compared to net financial expenses of R$ 328 million registered in 2017.
· Financial Revenues moved from R$ 109 million in 2017 to R$ 76 million in 2018, a reduction of 30.1% (R$ 33 million), due to:
ü Reduction of 50.1% (R$ 40 million) inincome from financial investments;
ü Reduction of 93.0% (R$ 18 million) inmonetary and foreign exchange updates, mainly due to the effect of the zero-cost collar derivative (R$ 20 million);
Partially offset by:
ü Revenue of R$ 18 million in 2018 related toInterest on loan agreements;
ü Increase of 45.6% (R$ 6 million) inother financial income;
ü Increaseof 185.6% (R$ 1 million) related toFiscal Credit update.
· Financial Expenses moved from R$ 437 million in 2017 to R$ 324 million in 2018, a reduction of 25.8% (R$ 113 million), due to:
ü Reduction of 29.5% (R$ 104 million) indebt charges, mainly due to the reduction in the CDI interbank rate;
ü Reduction of 26.8% (R$ 19 million) inmonetary and foreign exchange updates;
Partially offset by:
ü Increase of 120.7% (R$ 10 million) in thefinancial expenses with the Use of Public Asset (UBP).
Page52 de69
2In 2015, subsidiary CPFL Geração contracted US$ denominated put and call options, involving the same financial institution as counterpart, and which on a combined basis are characterized as an operation usually known as zero-cost collar. The contracting of this operation does not involve any kind of speculation, inasmuch as it is aimed at minimizing any negative impacts on future revenues of the joint venture ENERCAN, which has electric energy sale agreements with annual restatement of part of the tariff based on the variation in the US$. In addition, according to Management’s view, the scenario was favorable for contracting this type of financial instrument, considering the high volatility implicit in dollar options and the fact that there was no initial cost for same.
| 4Q18/2018 Results | March 28, 2019 |
11.3.1.7) Net Income
In 4Q18,net incomewas of R$ 234 million, compared to a net income of R$ 185 million in 4Q17, an increase of 26.4% (R$ 49 million).
In 2018,net incomewas of R$ 770 million, compared to a net income of R$ 654 million in 2017, an increase of 17.7% (R$ 116 million).
11.4) CPFL Renováveis
11.4.1) Economic-Financial Performance
Income Statement - CPFL Renováveis ( R$ Million) | ||||||
| 4Q18 | 4Q17 | Var. % | 2018 | 2017 | Var. % |
Gross Operating Revenue | 545 | 625 | -12.8% | 2,044 | 2,067 | -1.1% |
Net Operating Revenue | 516 | 591 | -12.7% | 1,936 | 1,959 | -1.2% |
Cost of Electric Power | (59) | (124) | -52.8% | (320) | (348) | -8.0% |
Operating Costs & Expenses | (314) | (268) | 17.2% | (1,030) | (1,006) | 2.4% |
EBIT | 143 | 199 | -28.0% | 586 | 605 | -3.1% |
EBITDA(1) | 298 | 354 | -15.8% | 1,209 | 1,222 | -1.1% |
Financial Income (Expense) | (129) | (124) | 4.7% | (504) | (511) | -1.3% |
Income Before Taxes | 14 | 75 | -81.6% | 82 | 94 | -13.1% |
Net Income | 107 | 51 | 108.4% | 119 | 20 | 504.5% |
Note:
(1) EBITDA is calculated from the sum of net income, taxes, financial result and depreciation/amortization.
11.4.1.1) Operating Revenue
In 4Q18,Gross Operating Revenue reached R$ 545 million, representing a reduction of 12.8% (R$ 80 million).Net Operating Revenue reached R$ 516 million, representing a reduction of 12.7% (R$ 75 million). These variations are mainly explained by the following factors:
Wind Source:
· Reduction of R$ 34 million in revenue from wind farms mainly due to the following factors: (i) write-off of R$11 million in PROINFA agreements due to the recognition of the tax benefit, which did not materialize; (ii) positive effect of the annual and quadrennial adjustment of agreements at some wind plants in 4Q17, which did not recur in 4Q18 (R$ 8 million); (iii) reimbursement for the lower generation of plants under PROINFA (R$ 8 million); and (iv) lower generation of wind complexes in Rio Grande do Norte (R$ 7 million). These items were partially offset by the price adjustment in energy sale agreements during the period.
SHPPs Source and Holding Company:
· Reduction of R$ 56 million in revenue of SHPPs and the Holding Company, mainly due to the hedge and swap operations of intercompany of the Pedra Cheirosa wind complex in 4Q17, which increased revenues and had a counterpart in the purchase of energy and which did not recur in 4Q18. This effect was partially offset by the lower GSF in the SHPPs of Proinfa and the price adjustment in energy sale agreements.
Page53 de69
| 4Q18/2018 Results | March 28, 2019 |
Biomass Source:
· Increase of R$ 15 million in revenue from biomass due to the settlement of surplus generation of some plants settled at the spot market price, the strategy of seasonal adjustment of agreements and the price adjustment in energy sale agreements.
In 2018,Gross Operating Revenue reached R$ 2,044 million, representing a reduction of 1.1% (R$ 23 million).Net Operating Revenue was of R$ 1,936 million, representing a reduction of 1.2% (R$ 23 million). These variations are mainly explained by the following factors:
Wind Source:
· Increase of R$ 29 million in revenue from wind farms mainly due to the following factors: (i) the positive effect of R$ 46 million of the new energy auction through Surplus and Deficit Offset Mechanism (MCSD), since the contract price in the free market was higher than the contract price in the regulated market for the eight wind farms that participated in the auction; (ii) the commercial startup of the Pedra Cheirosa wind complex in June 2017 (R$ 29 million); and (iii) inflation adjustment in sales agreement. These effects were partially offset by the following items: (iv) lower generation at the wind complexes in Rio Grande do Norte (R$ 38 million); (v) write-off of R$11 million in PROINFA agreements due to the recognition of the tax benefit, which did not materialize; (vi) the positive effect of the annual and quadrennial adjustment of agreements at some wind plants in 2017, which did not recur in 2018 (R$ 9 million); and (vii) reimbursement for lower generation of plants under PROINFA.
SHPPs Source and Holding Company:
· Reduction of R$ 80 million in revenue from SHPPs and the Holding Company, mainly due to the swap operations of intercompany of the Pedra Cheirosa wind complex in the 4Q17 settled at the spot market price at the Holding Company, with counterpart in the purchase of energy, which was not repeated in 2018. This effect was partially offset by the lower GSF in the SHPPs of Proinfa and price adjustment in energy sale agreements.
Biomass Source:
· Increase of R$ 28 million in revenue from biomass due to the settlement at the spot market price of the surplus generation at some plants and the price adjustment of energy sale agreements.
11.4.1.2) Cost of Electric Power
In 4Q18, cost of electric power totaled R$ 59 million, representing a reduction of 52.8% (R$ 66 million). Energy purchase cost totaled R$ 34 million in 4Q18, down 65.9% compared to 4Q17 (R$ 65 million), influenced by energy purchases to meet the exposure in the spot market, hedge and to rebuild guarantees in 2017 and lower energy purchase to attend GSF. For 2018, the purchases served mostly to cover exposures of wind plants in the free market.Cost of system use fees totaled R$ 25 million in 4Q18, reduction of 1.7% in relation to 4Q17 (R$ 0.4 million).
In 2018, cost of electric power totaled R$ 320 million, representing a reduction of 8.0% (R$ 28 million). Energy purchase cost represented a reduction of 7.0% compared to 2017 (R$ 17 million), also influenced by energy purchases to meet the exposure in the spot market, hedge and to rebuild guarantees in 2017 and lower energy purchase to attend GSF. For 2018, purchases were mostly to cover the exposure of the wind farms in the free market. In 2018, cost of system use feestotaled R$ 89 million, reduction of 10.4% compared to 2017 (R$ 10 million), chiefly due to the positive effect of retroactive recovery of PIS and Cofins credits in 2Q18, partially offset by the price adjustments in connection charges and the distribution and transmission system use and connection tariffs.
Page54 de69
| 4Q18/2018 Results | March 28, 2019 |
11.4.1.3) Operating Costs and Expenses
Operating Costs and Expenses reached R$ 314 million in 4Q18, compared to R$ 268 million in 4Q17, representing an increase of 17.2% (R$ 46 million). In 2018,Operating Costs and Expenses reached R$ 1,030 million, compared to R$ 1,006 million in 2017, an increase of 2.4% (R$ 24 million).
The factors that explain these variations follow:
PMSO
PMSO (R$ million) | ||||||||
| 4Q18 | 4Q17 | Variation | 2018 | 2017 | Variation | ||
| R$ MM | % | R$ MM | % | ||||
Reported PMSO |
|
|
|
|
|
|
|
|
Personnel | (26) | (27) | 0 | -0.7% | (102) | (98) | (4) | 3.9% |
Material | (6) | (8) | 2 | -28.6% | (26) | (25) | (2) | 6.9% |
Outsourced Services | (48) | (44) | (5) | 10.4% | (169) | (170) | 1 | -0.5% |
Other Operating Costs/Expenses | (79) | (35) | (44) | 128.3% | (109) | (96) | (13) | 13.5% |
GSF Risk Premium | (1) | (1) | 1 | -50.0% | (1) | (2) | 1 | -50.0% |
Others | (78) | (33) | (45) | 134.7% | (108) | (94) | (14) | 15.1% |
Total PMSO | (159) | (113) | (46) | 41.2% | (407) | (389) | (18) | 4.6% |
The PMSO item reached R$ 159 million in 4Q18, compared to R$ 113 million in 4Q17, an increase of 41.2% (R$ 46 million), due to the following factors: (i) increase with the higher maintenance costs resulting from O&M services at the wind farms in Ceará, since the maintenance work was conducted by own employees in the second half of 2017; partially offset by the reduction in the purchase of bagasse and wood chips for biomass generation and the use of PIS and Cofins credits in 4Q18; (ii) increase in provisions for losses and write-off of assets in 4Q18 in relation to 4Q17; the write-off and provision for loss of project assets is due to the uncertainty of investments; additionally, balances of accounts receivable were written off due to the petition for voluntary bankruptcy filed by a supplier (Suzlon) and provisions for loss of assets in 2017.
In 2018, the PMSO item totaled R$ 407 million, compared to R$ 389 million in 2017, an increase of 4.6% (R$ 18 million), mainly due to the increase in provisions for losses and write-off of assets in 2018 in relation to 2017; the write-off and provision for loss of project assets is due to the uncertainty of investments; additionally, balances of accounts receivable were written off due to the petition for voluntary bankruptcy filed by a supplier (Suzlon) and provisions for loss of assets in 2017; partially offset by the reduction in third-party services due to lower consulting expenses.
Other operating costs and expenses
Other operating costs and expenses, represented by Depreciation and Amortization accounts, reached R$ 155 million in 4Q18, stable in relation to 4Q17. In 2018, other operating costs and expenses reached R$ 623 million, compared to R$ 617 million in 2017, registering an increase of 1.0% (R$ 6 million), due to the start-up of the Pedra Cheirosa wind farm in June 2017 and the Boa Vista II SHP in November 2018.
Page55 de69
| 4Q18/2018 Results | March 28, 2019 |
11.4.1.4) EBITDA
In 4Q18, EBITDA was of R$ 298 million, compared to R$ 354 million in 4Q17, a reduction of 15.8% (R$ 56 million). This result is mainly due to: (i) lower net revenue from wind farms and hedge operations; (ii) higher volume of provisions and asset write-offs in 4Q18. These items were partially offset by lower costs with energy purchases.
In 2018, EBITDA was of R$ 1,209 million, compared to R$ 1,222 million in 2017, a reduction of 1.1% (R$ 13 million). This result is chiefly due to:(i) the decrease in net revenue; (ii) higher volume of provisions and asset write-offs. These items were partially offset by lower costs with the purchase of energy.
Conciliation of Net Income and EBITDA (R$ million) | ||||||
| 4Q18 | 4Q17 | Var. | 2018 | 2017 | Var. |
Net income | 107 | 51 | 108.4% | 119 | 20 | 504.5% |
Amortization | (155) | (155) |
| (623) | (617) | |
Financial Results | (129) | (124) |
| (504) | (511) | |
Income Tax /Social Contribution | 93 | (24) |
| 37 | (74) | |
EBITDA | 298 | 354 | -15.8% | 1,209 | 1,222 | -1.1% |
11.4.1.5) Financial Result
Financial Result (Adjusted - R$ Million) | ||||||
| 4Q18 | 4Q17 | Var. | 2018 | 2017 | Var. |
Revenues | ||||||
Income from Financial Investments | 22 | 26 | -16.3% | 93 | 126 | -26.2% |
Late payment interest and fines | 0 | 0 | 13.6% | 0 | 1 | -88.7% |
Judicial Deposits Update | 0 | 0 | 99.1% | 1 | 1 | 140.4% |
Monetary and Foreign Exchange Updates | 0 | 2 | -97.2% | 0 | 2 | -85.6% |
PIS and COFINS - over Other Financial Revenues | (1) | (1) | -42.7% | (3) | (5) | -34.3% |
Others | 15 | 4 | 320.4% | 40 | 13 | 204.8% |
Total | 37 | 31 | 20.4% | 132 | 138 | -4.4% |
|
|
|
| |||
Expenses |
|
|
|
| ||
Debt Charges | (108) | (127) | -14.6% | (451) | (559) | -19.4% |
Monetary and Foreign Exchange Updates | (21) | (19) | 11.5% | (70) | (72) | -1.8% |
(-) Capitalized Interest | 3 | 2 | 21.9% | 11 | 30 | -64.5% |
Others | (40) | (11) | 266.3% | (125) | (47) | 163.7% |
Total | (166) | (154) | -7.8% | (636) | (649) | -2.0% |
- | - |
|
| |||
Financial Result | (129) | (124) | -4.7% | (504) | (511) | -1.3% |
Net financial result registered a net financial expense of R$ 129 million in 4Q18, a reduction 4.7% (R$ 6 million). In 2018, net financial result registered a net financial expense of R$ 504 million, a reduction of 1.3% (R$ 7 million).
Financial revenues totaled R$ 37 million in 4Q18, an increase of 20.4% (R$ 6 million) due to higher revenue from inflation adjustment on amounts receivable from settlements in the CCEE (R$ 10.9million), partially offset by the lower average CDI rate in the periods (6.40% in 4Q18 vs. 7.47% in 4Q17). In 2018, financial revenues totaled R$ 132 million, a reduction of 4.4% (R$ 6 million) due tothe reduction in the average CDI rate (6.47% in 2018 vs. 10.07% in 2017), partially offset by higher income from inflation adjustment on receivables at CCEE (R$ 26 million).
Page56 de69
| 4Q18/2018 Results | March 28, 2019 |
Financial expenses totaled R$ 166 million in 4Q18, an increase of 7.8% (R$ 12 million). In 2018, financial expenses totaled R$ 636 million, a reduction of 2.0% (R$ 13 million). These variations are mainly due to the reduction in the average CDI rate and the TJLP rate, partially offset by the increase in expenses with debts related projects, which, after operational startup, cease to be capitalized and affect profit or loss, and inflation adjustment on the provision for GSF.
11.4.1.6) Net Income
In 4Q18, net income was of R$ 107 million, compared to the net income of R$ 51 million in 4Q17, an increase of 108.4% (R$ 56 million). In 2018, the net income was of R$ 119 million, compared to the net income of R$ 20 million in 2017, an increase of 504.5%. This performance mainly reflects the recognition of taxable credits that had a positive impact on income tax and social contribution and the improvement in financial result, partially offset by the reduction in EBITDA.
11.4.2) Status of Generation Projects – 100% Participation
On the date of this report, the portfolio of projects of CPFL Renováveis (100% participation) totaled 2,133 MW of operating installed capacity and 97 MW of capacity under construction. The operational power plants comprises 40 Small Hydroelectric Power Plants – SHPPs (453 MW), 45 wind farms (1,309 MW), 8 biomass thermoelectric power plants (370 MW) and 1 solar power plant (1 MW). Still under construction there are 1 SHPP (28 MW) and 4 wind farms (69 MW).
Additionally, CPFL Renováveis owns wind, solar and SHPP projects under development totaling 2,418 MW.
The table below illustrates the overall portfolio of assets (100% participation) in operation, construction and development, and its installed capacity on this date.
CPFL Renováveis - Portfolio (100% participation) | |||||
In MW | SHPP | Biomass | Wind | Solar | Total |
Operating | 453 | 370 | 1,309 | 1 | 2,133 |
Under construction | 28 | - | 69 | - | 97 |
Under development | 167 | - | 1,911 | 340 | 2,418 |
Total | 648 | 370 | 3,289 | 341 | 4,648 |
Boa Vista II SHPP – Operating
The Boa Vista II SHPP, project located in the State of Minas Gerais, had its start-up in November 2018, with more than 1 year of anticipation. The installed capacity is of 29.9 MW and the physical guarantee is of 15.2 average-MW. Energy was sold through a long-term contract in the 2015 A-5 new energy auction. (price: R$ 240.47/MWh – December 2018).
Lucia Cherobim SHPP
The PCH Lucia Cherobim, project located in the State of Paraná, is scheduled to have its start-up in 2024. The installed capacity is of 28.0 MW and the physical guarantee is of 16.6 average-MW. Energy was sold through a long-term contract in the 2018 A-6 new energy auction (price: R$ 189.95/MWh – December 2018).
Page57 de69
| 4Q18/2018 Results | March 28, 2019 |
Wind Farmsof the Gameleira Complex
The wind farms of the Gameleira Complex (Costa das Dunas, Figueira Branca, Farol de Touros e Gameleira), located in the State of Rio Grande do Norte, is scheduled to have its start-up in 2024. The installed capacity is of 69.3 MW and the phusical guarantee is of 39.4 average-MW. Part of the energy (12.0 average-MW) was sold through a long-term contract it the 2018 A-6 new energy auction (price: R$ 89.89/MWh – December 2018).
Page58 de69
| 4Q18/2018 Results | March 28, 2019 |
12) ATTACHMENTS
12.1) Statement of Assets – CPFL Energia
![]()
Consolidated | ||
ASSETS | 12/31/2018 | 12/31/2017 |
CURRENT | ||
Cash and Cash Equivalents | 1,891,457 | 3,249,642 |
Consumers, Concessionaries and Licensees | 4,547,951 | 4,301,283 |
Dividend and Interest on Equity | 100,182 | 56,145 |
Recoverable Taxes | 411,256 | 395,045 |
Derivatives | 309,484 | 444,029 |
Sectoral Financial Assets | 1,330,981 | 210,834 |
Concession Financial Assets | - | 23,736 |
Other Credits | 811,005 | 900,498 |
TOTAL CURRENT | 9,402,316 | 9,581,212 |
NON-CURRENT | ||
Consumers, Concessionaries and Licensees | 752,795 | 236,539 |
Affiliates, Subsidiaries and Parent Company | - | 8,612 |
Judicial Deposits | 854,374 | 839,990 |
Recoverable Taxes | 253,691 | 233,444 |
Sectoral Financial Assets | 223,880 | 355,003 |
Derivatives | 347,507 | 203,901 |
Deferred Taxes | 956,380 | 943,199 |
Concession Financial Assets | 7,430,149 | 6,545,668 |
Investments at Cost | 116,654 | 116,654 |
Other Credits | 927,440 | 840,192 |
Investments | 980,362 | 1,001,550 |
Property, Plant and Equipment | 9,456,614 | 9,787,125 |
Intangible | 10,509,368 | 10,589,824 |
TOTAL NON-CURRENT | 32,809,214 | 31,701,701 |
TOTAL ASSETS | 42,211,530 | 41,282,912 |
Page59 de69
| 4Q18/2018 Results | March 28, 2019 |
12.2) Statement of Liabilities – CPFL Energia
![]()
| Consolidated | |
LIABILITIES AND SHAREHOLDERS' EQUITY | 12/31/2018 | 12/31/2017 |
CURRENT | ||
Suppliers | 2,398,085 | 3,296,870 |
Loans and Financing | 2,446,113 | 3,589,607 |
Debentures | 917,352 | 1,703,073 |
Employee Pension Plans | 86,623 | 60,801 |
Regulatory Charges | 150,656 | 581,600 |
Taxes, Fees and Contributions | 765,438 | 710,303 |
Dividend and Interest on Equity | 532,608 | 297,744 |
Accrued Liabilities | 119,252 | 116,080 |
Derivatives | 8,139 | 10,230 |
Sectoral Financial Liabilities | - | 40,111 |
Public Utilities | 11,570 | 10,965 |
Other Accounts Payable | 979,296 | 961,306 |
TOTAL CURRENT | 8,415,132 | 11,378,688 |
NON-CURRENT | ||
Suppliers | 333,036 | 128,438 |
Loans and Financing | 8,989,846 | 7,402,450 |
Debentures | 8,023,493 | 7,473,454 |
Employee Pension Plans | 1,156,639 | 880,360 |
Taxes, Fees and Contributions | 9,691 | 18,839 |
Deferred Taxes | 1,136,227 | 1,249,591 |
Reserve for Tax, Civil and Labor Risks | 979,360 | 961,134 |
Derivatives | 23,659 | 84,576 |
Sectoral Financial Liabilities | 46,703 | 8,385 |
Public Utilities | 89,965 | 83,766 |
Other Accounts Payable | 475,396 | 426,889 |
TOTAL NON-CURRENT | 21,264,015 | 18,717,881 |
SHAREHOLDERS' EQUITY | ||
Capital | 5,741,284 | 5,741,284 |
Capital Reserve | 469,257 | 468,014 |
Legal Reserve | 798,090 | 798,090 |
Statutory Reserve - Concession Financial Assets | - | 826,600 |
Statutory Reserve - Strengthening of Working Capital | 3,630,413 | 1,292,046 |
Other Comprehensive Income | (376,294) | (164,506) |
Retained Earnings | - | - |
10,262,749 | 8,961,528 | |
Non-Controlling Shareholders' Interest | 2,269,634 | 2,224,816 |
TOTAL SHAREHOLDERS' EQUITY | 12,532,383 | 11,186,344 |
TOTAL LIABILITIES AND SHAREHOLDERS' EQUITY | 42,211,530 | 41,282,912 |
Page60 de69
| 4Q18/2018 Results | March 28, 2019 |
12.3) Income Statement – CPFL Energia
![]()
Note:
(1) EBITDA is calculated from the sum of net income, taxes, financial result and depreciation/amortization, according to CVM Instruction no. 527/12.
Page61 de69
| 4Q18/2018 Results | March 28, 2019 |
12.4) Cash Flow – CPFL Energia
![]()
Consolidated | ||||
4Q18 | 2018 | |||
Beginning Balance | 3,578,838 | 3,249,642 | ||
Net Income Before Taxes | 680,670 | 2,939,977 | ||
Depreciation and Amortization | 402,411 | 1,594,064 | ||
Interest on Debts and Monetary and Foreign Exchange Restatements | 225,980 | 1,117,742 | ||
Consumers, Concessionaries and Licensees | 57,066 | (1,006,291) | ||
Sectoral Financial Assets | 811,189 | (846,216) | ||
Accounts Receivable - Resources Provided by the CDE/CCEE | 9,220 | 59,196 | ||
Suppliers | (1,404,098) | (848,880) | ||
Sectoral Financial Liabilities | (55,789) | (64,361) | ||
Accounts Payable - CDE | 35,240 | 71,779 | ||
Interest on Debts and Debentures Paid | (288,293) | (1,353,339) | ||
Income Tax and Social Contribution Paid | (313,835) | (816,402) | ||
Others | (262,692) | 9,419 | ||
(783,601) | (2,083,289) | |||
Total Operating Activities | (102,931) | 856,688 | ||
Investment Activities | ||||
Acquisition of Property, Plant and Equipment, and Intangibles | (692,579) | (2,062,423) | ||
Others | 101,734 | 211,735 | ||
Total Investment Activities | (590,845) | (1,850,688) | ||
Financing Activities | ||||
Loans and Debentures | 1,328,256 | 9,610,814 | ||
Principal Amortization of Loans and Debentures, Net of Derivatives | (2,320,994) | (9,660,830) | ||
Dividend and Interest on Equity Paid | (8,831) | (322,163) | ||
Others | 7,964 | 7,994 | ||
Total Financing Activities | (993,605) | (364,185) | ||
Cash Flow Generation | (1,687,381) | (1,358,185) | ||
Ending Balance - 12/31/2018 |
| 1,891,457 |
| 1,891,457 |
Page62 de69
| 4Q18/2018 Results | March 28, 2019 |
12.5) Income Statement – Conventional Generation Segment

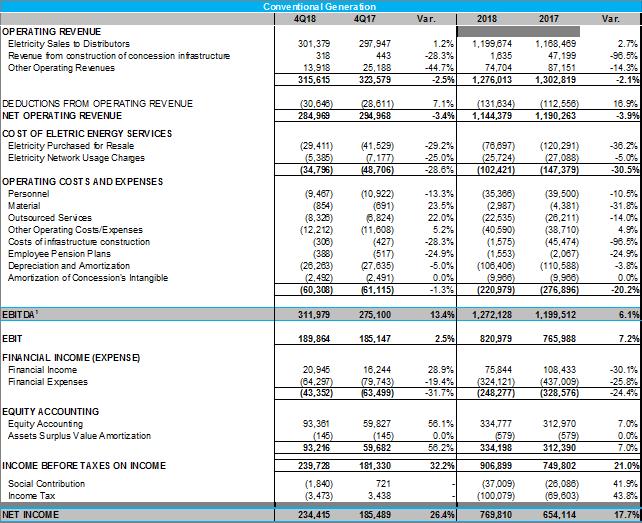
(1) EBITDA (IFRS) is calculated from the sum of net income, taxes, financial result and depreciation/amortization, as CVM Instruction no. 527/12.
Page63 de69
| 4Q18/2018 Results | March 28, 2019 |
12.6) Income Statement – CPFL Renováveis
![]()
Consolidated - 100% Participation | ||||||||
| 4Q18 | 4Q17 | Var. | Var. % | 2018 | 2017 | Var. | Var. % |
OPERATING REVENUES |
|
| ||||||
Eletricity Sales to Final Consumers | 5,175 | 6,111 | (936) | -15.3% | 21,417 | 41,469 | (20,052) | -48.4% |
Eletricity Sales to Distributors | 536,725 | 614,448 | (77,723) | -12.6% | 2,015,036 | 2,016,565 | (1,529) | -0.1% |
Other Operating Revenues | 3,159 | 4,847 | (1,688) | -34.8% | 7,949 | 9,238 | (1,289) | -14.0% |
| 545,058 | 625,406 | (80,348) | -12.8% | 2,044,403 | 2,067,273 | (22,870) | -1.1% |
|
|
| ||||||
DEDUCTIONS FROM OPERATING REVENUES | (28,975) | (34,241) | 5,266 | -15.4% | (108,084) | (108,189) | 104 | -0.1% |
NET OPERATING REVENUES | 516,084 | 591,165 | (75,082) | -12.7% | 1,936,319 | 1,959,084 | (22,765) | -1.2% |
|
|
| ||||||
COST OF ELETRIC ENERGY SERVICES |
|
| ||||||
Eletricity Purchased for Resale | (33,642) | (98,771) | 65,129 | -65.9% | (230,979) | (248,339) | 17,361 | -7.0% |
Eletricity Network Usage Charges | (25,022) | (25,460) | 438 | -1.7% | (89,368) | (99,690) | 10,322 | -10.4% |
| (58,664) | (124,231) | 65,567 | -52.8% | (320,346) | (348,029) | 27,682 | -8.0% |
OPERATING COSTS AND EXPENSES |
|
| ||||||
Personnel | (26,341) | (26,525) | 184 | -0.7% | (102,269) | (98,388) | (3,881) | 3.9% |
Material | (5,579) | (7,809) | 2,230 | -28.6% | (26,215) | (24,524) | (1,691) | 6.9% |
Outsourced Services | (48,300) | (43,737) | (4,563) | 10.4% | (169,295) | (170,095) | 800 | -0.5% |
Other Operating Costs/Expenses | (78,775) | (34,509) | (44,266) | 128.3% | (109,432) | (96,442) | (12,990) | 13.5% |
Depreciation and Amortization | (114,803) | (116,471) | 1,668 | -1.4% | (465,459) | (461,694) | (3,765) | 0.8% |
Amortization of Concession's Intangible | (40,433) | (39,017) | (1,416) | 3.6% | (157,647) | (155,323) | (2,324) | 1.5% |
| (314,231) | (268,068) | (46,163) | 17.2% | (1,030,317) | (1,006,467) | (23,851) | 2.4% |
|
|
|
|
|
|
|
|
|
EBITDA1 | 298,425 | 354,353 | (55,929) | -15.8% | 1,208,761 | 1,221,606 | (12,844) | -1.1% |
|
|
| ||||||
EBIT | 143,189 | 198,866 | (55,677) | -28.0% | 585,655 | 604,589 | (18,934) | -3.1% |
|
|
| ||||||
FINANCIAL INCOME (EXPENSE) |
|
| ||||||
Financial Income | 37,084 | 30,808 | 6,277 | 20.4% | 131,694 | 137,765 | (6,070) | -4.4% |
Financial Expenses | (166,410) | (154,332) | (12,078) | 7.8% | (635,820) | (648,571) | 12,751 | -2.0% |
| (129,326) | (123,524) | (5,802) | 4.7% | (504,125) | (510,806) | 6,681 | -1.3% |
|
|
| ||||||
INCOME BEFORE TAXES ON INCOME | 13,863 | 75,342 | (61,479) | -81.6% | 81,530 | 93,782 | (12,253) | -13.1% |
|
|
| ||||||
Social Contribution | 21,694 | (10,665) | 32,359 | - | 1,647 | (29,055) | 30,702 | - |
Income Tax | 71,263 | (13,421) | 84,684 | - | 35,629 | (45,075) | 80,704 | - |
|
|
|
|
|
|
|
|
|
NET INCOME | 106,820 | 51,257 | 55,563 | 108.4% | 118,805 | 19,653 | 99,153 | 504.5% |
Note:
(1) EBITDA (IFRS) is calculated from the sum of net income, taxes, financial result and depreciation/amortization, as CVM Instruction no. 527/12.
Page64 de69
| 4Q18/2018 Results | March 28, 2019 |
12.7) Income Statement – Distribution Segment

Consolidated | ||||||||
|
| 4Q18 | 4Q17 | Variation |
| 2018 | 2017 | Variation |
OPERATING REVENUE |
| |||||||
Electricity Sales to Final Customers | 7,375,245 | 6,381,135 | 15.6% |
| 27,076,283 | 23,755,821 | 14.0% | |
Electricity Sales to Distributors | 161,915 | 274,833 | -41.1% |
| 1,250,487 | 2,018,813 | -38.1% | |
Revenue from building the infrastructure | 568,451 | 592,281 | -4.0% |
| 1,770,587 | 2,026,224 | -12.6% | |
Adjustments to the concession´s financial asset | 42,517 | 112,730 | -62.3% |
| 345,015 | 204,443 | 68.8% | |
Sectoral financial assets and liabilities | (734,837) | 851,553 | - |
| 1,207,917 | 1,900,837 | -36.5% | |
Other Operating Revenues | 1,199,249 | 984,413 | 21.8% |
| 4,660,027 | 3,862,214 | 20.7% | |
| 8,612,541 | 9,196,944 | -6.4% |
| 36,310,317 | 33,768,351 | 7.5% | |
|
|
|
|
|
| |||
DEDUCTIONS FROM OPERATING REVENUE | (3,452,128) | (3,447,205) | 0.1% |
| (13,842,999) | (12,691,734) | 9.1% | |
NET OPERATING REVENUE | 5,160,413 | 5,749,740 | -10.2% |
| 22,467,318 | 21,076,618 | 6.6% | |
|
| |||||||
COST OF ELECTRIC ENERGY SERVICES |
| |||||||
Electricity Purchased for Resale | (2,542,474) | (3,402,543) | -25.3% |
| (12,738,247) | (12,969,727) | -1.8% | |
Electricity Network Usage Charges | (561,922) | (364,499) | 54.2% |
| (2,284,056) | (1,176,976) | 94.1% | |
| (3,104,396) | (3,767,042) | -17.6% |
| (15,022,304) | (14,146,703) | 6.2% | |
OPERATING COSTS AND EXPENSES |
|
| ||||||
Personnel |
| (245,253) | (251,375) | -2.4% |
| (925,513) | (920,343) | 0.6% |
Material |
| (45,985) | (45,690) | 0.6% |
| (170,223) | (169,670) | 0.3% |
Outsourced Services |
| (239,364) | (234,545) | 2.1% |
| (866,273) | (852,732) | 1.6% |
Other Operating Costs/Expenses |
| (208,546) | (162,914) | 28.0% |
| (619,831) | (614,693) | 0.8% |
Allowance for Doubtful Accounts |
| (50,152) | (35,857) | 39.9% |
| (165,942) | (155,250) | 6.9% |
Legal and Judicial Expenses |
| (73,284) | (59,017) | 24.2% |
| (179,611) | (179,413) | 0.1% |
Others |
| (85,109) | (68,040) | 25.1% |
| (274,278) | (280,030) | -2.1% |
Cost of building the infrastructure |
| (568,451) | (592,280) | -4.0% |
| (1,770,587) | (2,026,223) | -12.6% |
Employee Pension Plans |
| (22,089) | (27,944) | -21.0% |
| (88,356) | (111,820) | -21.0% |
Depreciation and Amortization |
| (182,302) | (165,876) | 9.9% |
| (710,265) | (645,389) | 10.1% |
Amortization of Concession's Intangible |
| (14,133) | (13,502) | 4.7% |
| (56,531) | (58,212) | -2.9% |
| (1,526,123) | (1,494,127) | 2.1% |
| (5,207,579) | (5,399,082) | -3.5% | |
|
| |||||||
EBITDA1 |
| 726,329 | 667,948 | 8.7% |
| 3,004,231 | 2,234,434 | 34.5% |
|
| |||||||
EBIT |
| 529,894 | 488,570 | 8.5% |
| 2,237,434 | 1,530,833 | 46.2% |
|
| |||||||
FINANCIAL INCOME (EXPENSE) |
|
| ||||||
Financial Income |
| 161,151 | 124,905 | 29.0% |
| 574,685 | 597,222 | -3.8% |
Financial Expenses |
| (222,015) | (212,402) | 4.5% |
| (884,583) | (1,163,689) | -24.0% |
Interest on Equity |
|
| ||||||
| (60,865) | (87,496) | -30.4% |
| (309,898) | (566,467) | -45.3% | |
|
| |||||||
INCOME BEFORE TAXES ON INCOME |
| 469,030 | 401,074 | 16.9% |
| 1,927,537 | 964,366 | 99.9% |
|
| |||||||
Social Contribution |
| 11,181 | (17,158) | - |
| (132,166) | (79,876) | 65.5% |
Income Tax |
| 31,080 | (47,012) | - |
| (362,954) | (219,634) | 65.3% |
|
| |||||||
NET INCOME |
| 511,291 | 336,903 | 51.8% |
| 1,432,416 | 664,856 | 115.4% |
Note:
(1) EBITDA (IFRS) is calculated from the sum of net income, taxes, financial result and depreciation/amortization, as CVM Instruction no. 527/12.
Page65 de69
| 4Q18/2018 Results | March 28, 2019 |
12.8) Economic-Financial Performance by Distributor
(R$ thousands)
Summary of Income Statement by Distribution Company (R$ Thousands) | ||||||
CPFL PAULISTA | ||||||
| 4Q18 | 4Q17 | Var. | 2018 | 2017 | Var. |
Gross Operating Revenue | 3,766,229 | 4,120,153 | -8.6% | 15,817,680 | 14,886,770 | 6.3% |
Net Operating Revenue | 2,279,888 | 2,580,722 | -11.7% | 9,892,570 | 9,326,596 | 6.1% |
Cost of Electric Power | (1,424,800) | (1,751,526) | -18.7% | (6,769,557) | (6,453,927) | 4.9% |
Operating Costs & Expenses | (587,291) | (595,440) | -1.4% | (2,094,084) | (2,248,144) | -6.9% |
EBIT | 267,797 | 233,756 | 14.6% | 1,028,929 | 624,525 | 64.8% |
EBITDA(1) | 329,913 | 295,368 | 11.7% | 1,287,003 | 860,323 | 49.6% |
Financial Income (Expense) | (12,986) | (35,758) | -63.7% | (76,911) | (220,475) | -65.1% |
Income Before Taxes | 254,810 | 197,998 | 28.7% | 952,019 | 404,050 | 135.6% |
Net Income | 205,770 | 162,097 | 26.9% | 649,516 | 280,354 | 131.7% |
CPFL PIRATININGA | ||||||
| 4Q18 | 4Q17 | Var. | 2018 | 2017 | Var. |
Gross Operating Revenue | 1,516,438 | 1,764,173 | -14.0% | 6,446,884 | 6,402,060 | 0.7% |
Net Operating Revenue | 870,372 | 1,097,527 | -20.7% | 3,879,542 | 3,997,322 | -2.9% |
Cost of Electric Power | (550,150) | (741,957) | -25.9% | (2,725,556) | (2,828,403) | -3.6% |
Operating Costs & Expenses | (249,635) | (261,778) | -4.6% | (831,908) | (843,472) | -1.4% |
EBIT | 70,587 | 93,792 | -24.7% | 322,078 | 325,447 | -1.0% |
EBITDA(1) | 96,237 | 118,106 | -18.5% | 422,308 | 421,784 | 0.1% |
Financial Income (Expense) | (8,469) | (10,650) | -20.5% | (48,548) | (100,626) | -51.8% |
Income Before Taxes | 62,118 | 83,142 | -25.3% | 273,530 | 224,821 | 21.7% |
Net Income | 50,551 | 64,172 | -21.2% | 182,654 | 152,080 | 20.1% |
RGE | ||||||
| 4Q18 | 4Q17 | Var. | 2018 | 2017 | Var. |
Gross Operating Revenue | 2,931,138 | 2,886,641 | 1.5% | 12,364,980 | 10,905,664 | 13.4% |
Net Operating Revenue | 1,750,031 | 1,794,366 | -2.5% | 7,590,040 | 6,723,754 | 12.9% |
Cost of Electric Power | (979,140) | (1,112,562) | -12.0% | (4,852,886) | (4,272,839) | 13.6% |
Operating Costs & Expenses | (607,024) | (541,132) | 12.2% | (1,979,630) | (1,984,159) | -0.2% |
EBIT | 163,868 | 140,672 | 16.5% | 757,524 | 466,757 | 62.3% |
EBITDA(1) | 260,783 | 223,155 | 16.9% | 1,120,578 | 794,092 | 41.1% |
Financial Income (Expense) | (37,948) | (35,405) | 7.2% | (170,424) | (219,644) | -22.4% |
Income Before Taxes | 125,920 | 105,267 | 19.6% | 587,100 | 247,112 | 137.6% |
Net Income | 231,437 | 99,144 | 133.4% | 519,055 | 170,123 | 205.1% |
CPFL SANTA CRUZ | ||||||
| 4Q18 | 4Q17 | Var. | 2018 | 2017 | Var. |
Gross Operating Revenue | 398,737 | 425,977 | -6.4% | 1,680,773 | 1,573,857 | 6.8% |
Net Operating Revenue | 260,122 | 277,125 | -6.1% | 1,105,165 | 1,028,945 | 7.4% |
Cost of Electric Power | (150,306) | (160,997) | -6.6% | (674,305) | (591,534) | 14.0% |
Operating Costs & Expenses | (82,173) | (95,778) | -14.2% | (301,957) | (323,307) | -6.6% |
EBIT | 27,642 | 20,350 | 35.8% | 128,904 | 114,105 | 13.0% |
EBITDA(1) | 39,395 | 31,320 | 25.8% | 174,341 | 158,235 | 10.2% |
Financial Income (Expense) | (1,461) | (5,683) | -74.3% | (14,015) | (25,722) | -45.5% |
Income Before Taxes | 26,181 | 14,668 | 78.5% | 114,888 | 88,382 | 30.0% |
Net Income | 23,533 | 11,490 | 104.8% | 81,191 | 62,299 | 30.3% |
Note:(1) EBITDA (IFRS) is calculated from the sum of net income, taxes, financial result and depreciation/amortization.
Page66 de69
| 4Q18/2018 Results | March 28, 2019 |
12.9) Sales within the Concession Area by Distributor (In GWh)
Page67 de69
| 4Q18/2018 Results | March 28, 2019 |
12.10) Sales to the Captive Market by Distributor (in GWh)
Page68 de69
| 4Q18/2018 Results | March 28, 2019 |
12.11) Reconciliation of Net Debt/EBITDA Pro Forma ratio of CPFL Energia for purposes of financial covenants calculation
![]()
Note: in accordance with financial covenants calculation in cases of assets acquired by the Company.
Page69 de69
Pursuant to the requirements of the Securities Exchange Act of 1934, the registrant has duly caused this report to be signed on its behalf by the undersigned, thereunto duly authorized.
Date: March 28, 2019
| CPFL ENERGIA S.A. | ||
| By: | /S/ YueHui Pan | |
| Name: Title: | YueHui Pan Chief Financial Officer and Head of Investor Relations | |
FORWARD-LOOKING STATEMENTS
This press release may contain forward-looking statements. These statements are statements that are not historical facts, and are based on management's current view and estimates of future economic circumstances, industry conditions, company performance and financial results. The words "anticipates", "believes", "estimates", "expects", "plans" and similar expressions, as they relate to the company, are intended to identify forward-looking statements. Statements regarding the declaration or payment of dividends, the implementation of principal operating and financing strategies and capital expenditure plans, the direction of future operations and the factors or trends affecting financial condition, liquidity or results of operations are examples of forward-looking statements. Such statements reflect the current views of management and are subject to a number of risks and uncertainties. There is no guarantee that the expected events, trends or results will actually occur. The statements are based on many assumptions and factors, including general economic and market conditions, industry conditions, and operating factors. Any changes in such assumptions or factors could cause actual results to differ materially from current expectations.