UNITED STATES
SECURITIES AND EXCHANGE COMMISSION
Washington, D.C. 20549
FORM 10-Q
(Mark One)
| x | QUARTERLY REPORT PURSUANT TO SECTION 13 OR 15(d) OF THE SECURITIES EXCHANGE ACT OF 1934 |
For the Quarterly Period Ended September 30, 2007
or
| ¨ | TRANSITION REPORT PURSUANT TO SECTION 13 OR 15(d) OF THE SECURITIES EXCHANGE ACT OF 1934 |
For the Transition Period From to
Commission File Number 001-32331
Foundation Coal Holdings, Inc.
(Exact Name of Registrant as Specified in Its Charter)
| | |
| Delaware | | 42-1638663 |
(State or Other Jurisdiction of Incorporation or Organization) | | (I.R.S. Employer Identification No.) |
| | |
999 Corporate Boulevard, Suite 300 Linthicum Heights, Maryland | | 21090 |
| (Address of Principal Executive Offices) | | (Zip Code) |
Registrant’s telephone number, including area code (410) 689-7500
Indicate by check mark whether the Registrant (1) has filed all reports required to be filed by Section 13 or 15(d) of the Securities Exchange Act of 1934 during the preceding 12 months (or for such shorter period that the registrant was required to file such reports), and (2) has been subject to such filing requirements for the past 90 days. Yes x No ¨
Indicate by check mark whether the registrant is large accelerated filer, an accelerated filer, or a non-accelerated filer. See definition of “accelerated filer and large accelerated filer” in Rule 12b-2 of the Exchange Act. (Check one):
Large accelerated filer x Accelerated filer ¨ Non-accelerated filer ¨
Indicate by check mark whether the registrant is a shell company (as defined in Rule 12b-2 of the Exchange Act). Yes ¨ No x
There were 45,207,779 shares of common stock outstanding on October 31, 2007.
TABLE OF CONTENTS
2
PART I – FINANCIAL INFORMATION
Unless the context otherwise indicates, as used in this Form 10-Q the terms “we,” “our,” “us” and similar terms refer to Foundation Coal Holdings, Inc. and its consolidated subsidiaries.
ITEM 1. FINANCIAL STATEMENTS.
Foundation Coal Holdings, Inc. and Subsidiaries
Consolidated Balance Sheets
(Dollars in thousands, except share data)
| | | | | | | | |
| | | September 30, 2007 | | | December 31, 2006 | |
| | | (Unaudited) | | | | |
| ASSETS | | | | | | | | |
Current assets: | | | | | | | | |
Cash and cash equivalents | | $ | 69,472 | | | $ | 33,720 | |
Trade accounts receivable | | | 109,840 | | | | 119,603 | |
Inventories, net | | | 39,283 | | | | 36,771 | |
Deferred income taxes | | | 15,525 | | | | 15,525 | |
Prepaid expenses | | | 31,220 | | | | 30,790 | |
Other current assets | | | 4,906 | | | | 4,238 | |
| | | | | | | | |
Total current assets | | | 270,246 | | | | 240,647 | |
Owned surface lands | | | 35,440 | | | | 30,388 | |
Plant, equipment and mine development costs, net | | | 657,699 | | | | 626,234 | |
Owned and leased mineral rights, net | | | 947,319 | | | | 1,003,804 | |
Coal supply agreements, net | | | 23,418 | | | | 31,343 | |
Other noncurrent assets | | | 15,704 | | | | 17,164 | |
| | | | | | | | |
Total assets | | $ | 1,949,826 | | | $ | 1,949,580 | |
| | | | | | | | |
| LIABILITIES | | | | | | | | |
Current liabilities: | | | | | | | | |
Current portion of long-term debt | | $ | 12,563 | | | $ | - | |
Trade accounts payable | | | 38,117 | | | | 41,584 | |
Accrued expenses and other current liabilities | | | 177,858 | | | | 162,014 | |
| | | | | | | | |
Total current liabilities | | | 228,538 | | | | 203,598 | |
Long-term debt | | | 614,062 | | | | 626,625 | |
Deferred income taxes | | | 1,503 | | | | 8,273 | |
Coal supply agreements, net | | | 12,164 | | | | 24,223 | |
Postretirement benefits | | | 501,312 | | | | 536,628 | |
Other noncurrent liabilities | | | 263,844 | | | | 252,420 | |
| | | | | | | | |
Total liabilities | | | 1,621,423 | | | | 1,651,767 | |
| | | | | | | | |
Commitments and contingencies (Note 17) | | | | | | | | |
| | |
| STOCKHOLDERS’ EQUITY | | | | | | | | |
Common stock, $0.01 par value; 100.0 million shares authorized, 46.2 million shares issued and 45.1 million shares outstanding at September 30, 2007; 45.8 million shares issued and
45.4 million shares outstanding at December 31, 2006 | | | 462 | | | | 458 | |
Additional paid-in capital | | | 289,958 | | | | 279,436 | |
Retained earnings | | | 79,115 | | | | 63,220 | |
Accumulated other comprehensive loss | | | (5,720 | ) | | | (33,412 | ) |
Treasury stock, at cost: 1.1 million shares at September 30, 2007; 0.3 million shares at December 31, 2006 | | | (35,412 | ) | | | (11,889 | ) |
| | | | | | | | |
Total stockholders’ equity | | | 328,403 | | | | 297,813 | |
| | | | | | | | |
Total liabilities and stockholders’ equity | | $ | 1,949,826 | | | $ | 1,949,580 | |
| | | | | | | | |
The accompanying notes are an integral part of these consolidated financial statements.
3
Foundation Coal Holdings, Inc. and Subsidiaries
Consolidated Statements of Operations and Comprehensive Income
(Unaudited, dollars in thousands, except share and per share data)
| | | | | | | | |
| | | Three Months Ended
September 30, | |
| | | 2007 | | | 2006 | |
Revenues: | | | | | | | | |
Coal sales | | $ | 350,762 | | | $ | 347,511 | |
Other revenue | | | 8,296 | | | | 6,609 | |
| | | | | | | | |
Total revenues | | | 359,058 | | | | 354,120 | |
Costs and expenses: | | | | | | | | |
Cost of coal sales (excludes depreciation, depletion and amortization) | | | 283,079 | | | | 277,453 | |
Selling, general and administrative expenses (excludes depreciation, depletion and amortization) | | | 14,263 | | | | 11,347 | |
Accretion on asset retirement obligations | | | 2,635 | | | | 2,219 | |
Depreciation, depletion and amortization | | | 49,585 | | | | 45,170 | |
Amortization of coal supply agreements | | | (844 | ) | | | (2,309 | ) |
Employee and contract termination costs | | | 2,314 | | | | - | |
| | | | | | | | |
Income from operations | | | 8,026 | | | | 20,240 | |
Other income (expense): | | | | | | | | |
Interest expense | | | (13,389 | ) | | | (23,058 | ) |
Mark-to-market loss on interest rate swaps | | | - | | | | (112 | ) |
Interest income | | | 1,056 | | | | 958 | |
| | | | | | | | |
Loss before income tax benefit | | | (4,307 | ) | | | (1,972 | ) |
Income tax benefit | | | 6,212 | | | | 1,963 | |
| | | | | | | | |
Net income (loss) | | | 1,905 | | | | (9 | ) |
Other comprehensive income: | | | | | | | | |
Adjustments to unrecognized gains and losses and amortization of employee benefit plan costs, net of tax expense of $66 in 2007 | | | 96 | | | | - | |
Reclassification of unrealized gain on interest rate swap into interest expense | | | (370 | ) | | | 389 | |
| | | | | | | | |
Comprehensive income | | $ | 1,631 | | | $ | 380 | |
| | | | | | | | |
Basic earnings per common share | | $ | 0.04 | | | $ | - | |
Diluted earnings per common share | | $ | 0.04 | | | $ | - | |
Weighted-average shares-basic | | | 45,221,193 | | | | 45,507,284 | |
Weighted-average shares-diluted | | | 46,412,804 | | | | 46,773,741 | |
Dividends declared per share | | $ | 0.05 | | | $ | 0.05 | |
The accompanying notes are an integral part of these consolidated financial statements.
4
Foundation Coal Holdings, Inc. and Subsidiaries
Consolidated Statements of Operations and Comprehensive Income
(Unaudited, dollars in thousands, except share and per share data)
| | | | | | | | |
| | | Nine Months Ended
September 30, | |
| | | 2007 | | | 2006 | |
Revenues: | | | | | | | | |
Coal sales | | $ | 1,096,787 | | | $ | 1,094,272 | |
Other revenue | | | 25,674 | | | | 22,260 | |
| | | | | | | | |
Total revenues | | | 1,122,461 | | | | 1,116,532 | |
Costs and expenses: | | | | | | | | |
Cost of coal sales (excludes depreciation, depletion and amortization) | | | 855,160 | | | | 835,890 | |
Selling, general and administrative expenses (excludes depreciation, depletion and amortization) | | | 45,053 | | | | 38,025 | |
Accretion on asset retirement obligations | | | 7,492 | | | | 6,327 | |
Depreciation, depletion and amortization | | | 151,412 | | | | 137,678 | |
Amortization of coal supply agreements | | | (3,441 | ) | | | (11,773 | ) |
Employee and contract termination costs | | | 14,297 | | | | - | |
| | | | | | | | |
Income from operations | | | 52,488 | | | | 110,385 | |
Other income (expense): | | | | | | | | |
Interest expense | | | (39,648 | ) | | | (50,706 | ) |
Mark-to-market loss on interest rate swaps | | | - | | | | (112 | ) |
Interest income | | | 2,574 | | | | 2,184 | |
| | | | | | | | |
Income before income tax benefit (expense) | | | 15,414 | | | | 61,751 | |
Income tax benefit (expense) | | | 7,260 | | | | (8,417 | ) |
| | | | | | | | |
Net income | | | 22,674 | | | | 53,334 | |
Other comprehensive income: | | | | | | | | |
Adjustments to unrecognized gains and losses and amortization of employee benefit plan costs, net of tax expense of $19,754 in 2007 | | | 28,806 | | | | - | |
Unrealized gain on interest rate swaps, net of tax expense of $90 in 2006 | | | - | | | | 139 | |
Reclassification of unrealized gain on interest rate swap into interest expense | | | (1,114 | ) | | | 389 | |
| | | | | | | | |
Comprehensive income | | $ | 50,366 | | | $ | 53,862 | |
| | | | | | | | |
Basic earnings per common share | | $ | 0.50 | | | $ | 1.17 | |
Diluted earnings per common share | | $ | 0.49 | | | $ | 1.13 | |
Weighted-average shares-basic | | | 45,193,686 | | | | 45,654,040 | |
Weighted-average shares-diluted | | | 46,459,408 | | | | 47,103,715 | |
Dividends declared per share | | $ | 0.15 | | | $ | 0.15 | |
The accompanying notes are an integral part of these consolidated financial statements.
5
Foundation Coal Holdings, Inc. and Subsidiaries
Consolidated Statements of Cash Flows
(Unaudited, dollars in thousands)
| | | | | | | | |
| | | Nine Months Ended
September 30, | |
| | | 2007 | | | 2006 | |
Operating activities: | | | | | | | | |
Net income | | $ | 22,674 | | | $ | 53,334 | |
Adjustments to reconcile net income to net cash provided by operating activities: | | | | | | | | |
Accretion on asset retirement obligations | | | 7,492 | | | | 6,327 | |
Depreciation, depletion and amortization | | | 147,971 | | | | 125,905 | |
Amortization of deferred financing costs | | | 1,382 | | | | 11,091 | |
Gain on sale of assets | | | (4,468 | ) | | | (899 | ) |
Non-cash stock compensation | | | 4,601 | | | | 2,250 | |
Non-cash mark-to-market adjustment for interest rate swaps | | | - | | | | 112 | |
Deferred income taxes | | | (26,524 | ) | | | (17,815 | ) |
Asset retirement obligations | | | (470 | ) | | | (2,020 | ) |
Other | | | (160 | ) | | | (250 | ) |
Changes in operating assets and liabilities: | | | | | | | | |
Trade accounts receivable | | | 9,788 | | | | (7,349 | ) |
Inventories, net | | | (2,406 | ) | | | 1,988 | |
Prepaid expenses and other current assets | | | (521 | ) | | | (14,467 | ) |
Other noncurrent assets | | | 37 | | | | 508 | |
Trade accounts payable | | | (3,467 | ) | | | 4,707 | |
Accrued expenses and other current liabilities | | | 3,971 | | | | (18,927 | ) |
Noncurrent liabilities | | | 14,762 | | | | 13,508 | |
| | | | | | | | |
Net cash provided by operating activities | | | 174,662 | | | | 158,003 | |
| | | | | | | | |
Investing activities: | | | | | | | | |
Purchases of property, plant and equipment | | | (120,761 | ) | | | (119,713 | ) |
Purchases of mining assets | | | - | | | | (14,630 | ) |
Proceeds from disposition of property, plant and equipment | | | 6,228 | | | | 1,704 | |
| | | | | | | | |
Net cash used in investing activities | | | (114,533 | ) | | | (132,639 | ) |
| | | | | | | | |
Financing activities: | | | | | | | | |
Payment of cash dividends | | | (6,779 | ) | | | (6,817 | ) |
Proceeds from issuance of common stock | | | 3,221 | | | | 7,479 | |
Excess tax benefit from stock-based awards | | | 2,704 | | | | 10,672 | |
Interest rate swap termination | | | - | | | | 2,259 | |
Payment of deferred financing costs | | | - | | | | (4,443 | ) |
Common stock repurchases | | | (23,424 | ) | | | (11,889 | ) |
Other | | | (99 | ) | | | - | |
| | | | | | | | |
Net cash used in financing activities | | | (24,377 | ) | | | (2,739 | ) |
| | | | | | | | |
Net increase in cash and cash equivalents | | | 35,752 | | | | 22,625 | |
Cash and cash equivalents at beginning of period | | | 33,720 | | | | 22,432 | |
| | | | | | | | |
Cash and cash equivalents at end of period | | $ | 69,472 | | | $ | 45,057 | |
| | | | | | | | |
Supplemental cash flow information: | | | | | | | | |
Cash paid for interest | | $ | 40,621 | | | $ | 42,142 | |
Cash paid for income taxes, net of refunds | | $ | 10,838 | | | $ | 17,210 | |
The accompanying notes are an integral part of these consolidated financial statements.
6
Foundation Coal Holdings, Inc. and Subsidiaries
Notes to Consolidated Financial Statements
(Unaudited, dollars in thousands, except share data)
(1) Basis of Presentation of Consolidated Financial Statements
The accompanying interim consolidated financial statements of Foundation Coal Holdings, Inc. and Subsidiaries (the “Company”) are unaudited and prepared in accordance with the rules and regulations of the United States Securities and Exchange Commission for Form 10-Q. Such rules and regulations allow the omission of certain information and footnote disclosures normally included in financial statements prepared in accordance with accounting principles generally accepted in the United States of America as long as the statements are not misleading. In the opinion of management, these interim consolidated financial statements reflect all normal and recurring adjustments necessary for a fair presentation of the results of the periods presented. These interim consolidated financial statements should be read in conjunction with the consolidated financial statements of the Company included in its Annual Report on Form 10-K for the twelve months ended December 31, 2006, filed March 1, 2007.
The Company’s consolidated financial statements have been prepared in accordance with accounting principles generally accepted in the United States of America. The preparation of the Company’s consolidated financial statements requires management to make estimates and assumptions that affect the reported amounts of assets and liabilities at the date of the consolidated financial statements and the reported amounts of revenues and expenses during the reporting period. The more significant areas requiring the use of management estimates and assumptions relate to coal reserves that are the basis for future cash flow estimates and units-of-production depreciation, depletion and amortization calculations; environmental and reclamation obligations; asset impairments; postemployment, postretirement and other employee benefit liabilities; valuation allowances for deferred income taxes; income tax provision calculations; reserves for contingencies and litigation; and the fair value and accounting treatment of certain financial instruments. Management bases its estimates on historical experience and on various other assumptions that are believed to be reasonable under the circumstances. Accordingly, actual results may differ from these estimates. In addition, different assumptions or conditions could reasonably be expected to yield different results. The operating results for the three and nine months ended September 30, 2007 may not necessarily be indicative of the results to be expected in the fourth quarter or for the twelve months ended December 31, 2007.
(2) Recent Accounting Pronouncements
In February 2007, the Financial Accounting Standards Board (“FASB”) issued Statement of Financial Accounting Standards (“SFAS”) No. 159,The Fair Value Option for Financial Assets and Liabilities Including an amendment of FASB Statement No. 115 (“SFAS No. 159”). SFAS No. 159 permits entities to choose to measure many financial instruments and certain other items at fair value that are not currently required to be measured at fair value. SFAS No. 159 also establishes presentation and disclosure requirements designed to facilitate comparisons between entities that choose different measurement attributes for similar types of assets and liabilities. SFAS No. 159 is effective as of the beginning of an entity’s first fiscal year that begins after November 15, 2007. The Company is currently determining whether fair value accounting is preferred for any of its eligible items and has not yet determined the impact, if any, that SFAS No. 159 will have on the consolidated financial statements.
In September 2006, the FASB issued SFAS No. 157,Fair Value Measurements (“SFAS No. 157”). This statement defines fair value, establishes a framework for measuring fair value in generally accepted accounting principles and expands disclosures about fair value measurements. This statement clarifies how to measure fair value as permitted under other accounting pronouncements but does not require any new fair value measurements. However, for some entities, the application of this statement will change current practice. SFAS No. 157 is effective for financial statements issued for fiscal years beginning after November 15, 2007, and interim periods within those fiscal years. The Company expects to adopt SFAS No. 157 on January 1, 2008 and has not yet determined the impact on the consolidated financial statements.
7
Foundation Coal Holdings, Inc. and Subsidiaries
Notes to Consolidated Financial Statements (Continued)
(Unaudited, dollars in thousands, except share data)
In September 2006, the FASB issued SFAS No. 158,Employers’ Accounting for Defined Benefit Pension and Other Postretirement Plans—an amendment of FASB Statements No. 87, 88, 106, and 132(R) (“SFAS No. 158”), which requires an employer to recognize the overfunded or underfunded status of a defined benefit pension and other postretirement plans (other than a multiemployer plan) as an asset or liability in its statement of financial position and to recognize changes in that funded status in the year in which the changes occur through other comprehensive income. SFAS No. 158 requires the Company to initially recognize the funded status of a defined benefit pension and other postretirement plans and to provide the required disclosures as of the end of the fiscal year ending after December 15, 2006. Additionally, for fiscal years ending after December 15, 2008, the Company is required to measure plan assets and benefit obligations as of the date of the Company’s fiscal year-end statement of financial position rather than at an interim period. On December 31, 2006, the Company adopted the recognition and disclosure provisions of SFAS No. 158. The Company expects to early adopt the measurement date provisions on December 31, 2007.
In June 2006, the FASB issued FASB Interpretation No. (“FIN”) 48,Accounting for Uncertainty in Income Taxes, an interpretation of FASB Statement No. 109 (“FIN 48”), which clarifies the accounting for uncertainty in income taxes recognized in a company’s consolidated financial statements in accordance with SFAS No. 109,Accounting for Income Taxes. FIN 48 prescribes a recognition threshold and measurement attribute for the financial statement recognition and measurement of a tax position taken or expected to be taken in a tax return. FIN 48 requires an entity to recognize the financial statement impact of a tax position when it is more-likely-than-not that the position will be sustained upon examination. If the tax position meets the more-likely-than-not recognition threshold, the tax effect is recognized at the largest amount of the benefit that is greater than fifty percent likely of being realized upon ultimate settlement. FIN 48 requires that a liability created for unrecognized tax benefits shall be presented as a liability and not combined with deferred tax liabilities or assets.
At January 1, 2007, the cumulative effect of the adoption of FIN 48 was zero. Our liability at the date of adoption for unrecognized tax benefits was $9,671. If recognized, $3,769 would affect the effective tax rate; however, the Company does not expect that these unrecognized tax benefits will significantly change this year. The Company recognizes interest and penalties accrued related to unrecognized tax benefits as a component of tax expense. The total amount of accrued interest and penalties was $163 and $270 as of January 1, 2007 and September 30, 2007, respectively.
The Company files income tax returns in the U.S. federal jurisdiction and various states. Our United States federal tax obligations have been settled through the year 2003, although certain carry forward tax attributes that were generated prior to 2002 may still be adjusted upon examination by tax authorities if they either have been or will be used in periods subsequent to 2002.
(3) Inventories
Inventories consisted of the following:
| | | | | | | | |
| | | September 30,
2007 | | | December 31,
2006 | |
Saleable coal | | $ | 15,194 | | | $ | 16,052 | |
Raw coal | | | 631 | | | | 2,199 | |
Materials and supplies | | | 28,973 | | | | 23,620 | |
| | | | | | | | |
| | | 44,798 | | | | 41,871 | |
Less materials and supplies reserve for obsolescence | | | (5,515 | ) | | | (5,100 | ) |
| | | | | | | | |
| | $ | 39,283 | | | $ | 36,771 | |
| | | | | | | | |
Saleable coal represents coal stockpiles ready for shipment to a customer. Raw coal represents coal that requires further processing prior to shipment.
8
Foundation Coal Holdings, Inc. and Subsidiaries
Notes to Consolidated Financial Statements (Continued)
(Unaudited, dollars in thousands, except share data)
(4) Prepaid Expenses
Prepaid expenses consisted of the following:
| | | | | | |
| | | September 30,
2007 | | December 31,
2006 |
Prepaid royalties | | $ | 1,140 | | $ | 1,427 |
Prepaid longwall move expenses | | | 10,215 | | | 8,628 |
Prepaid SO2 emission allowances | | | 1,775 | | | 2,052 |
Prepaid taxes | | | 6,550 | | | 6,330 |
Prepaid insurance | | | 10,442 | | | 10,796 |
Other | | | 1,098 | | | 1,557 |
| | | | | | |
| | $ | 31,220 | | $ | 30,790 |
| | | | | | |
(5) Plant, Equipment, Mine Development Costs and Owned and Leased Mineral Rights
Plant, equipment, mine development costs and owned and leased mineral rights consisted of the following:
| | | | | | | | |
| | | September 30,
2007 | | | December 31,
2006 | |
Owned surface lands and mineral rights | | | | | | | | |
Owned surface lands | | $ | 35,440 | | | $ | 30,388 | |
| | | | | | | | |
Owned and leased mineral rights | | $ | 1,255,218 | | | $ | 1,253,127 | |
Less accumulated depletion | | | (307,899 | ) | | | (249,323 | ) |
| | | | | | | | |
| | $ | 947,319 | | | $ | 1,003,804 | |
| | | | | | | | |
Plant, equipment and mine development costs | | | | | | | | |
Plant, equipment and asset retirement costs | | $ | 894,632 | | | $ | 798,159 | |
Mine development costs | | | 43,625 | | | | 27,507 | |
Internal use software | | | 35,760 | | | | 30,726 | |
Coalbed methane equipment and development costs | | | 9,991 | | | | 7,022 | |
| | | | | | | | |
| | | 984,008 | | | | 863,414 | |
| | | | | | | | |
Less accumulated depreciation and amortization: | | | | | | | | |
Plant, equipment and asset retirement costs | | | (308,699 | ) | | | (226,788 | ) |
Mine development costs | | | (6,424 | ) | | | (3,368 | ) |
Internal use software | | | (9,480 | ) | | | (5,911 | ) |
Coalbed methane equipment and development costs | | | (1,706 | ) | | | (1,113 | ) |
| | | | | | | | |
| | | (326,309 | ) | | | (237,180 | ) |
| | | | | | | | |
| | $ | 657,699 | | | $ | 626,234 | |
| | | | | | | | |
9
Foundation Coal Holdings, Inc. and Subsidiaries
Notes to Consolidated Financial Statements (Continued)
(Unaudited, dollars in thousands, except share data)
(6) Other Noncurrent Assets
Other noncurrent assets consisted of the following:
| | | | | | |
| | | September 30,
2007 | | December 31,
2006 |
Receivables from asset dispositions | | $ | 1,839 | | $ | 1,839 |
Unamortized deferred financing costs, net | | | 10,777 | | | 12,159 |
Advance mining royalties | | | 1,527 | | | 1,657 |
Other | | | 1,561 | | | 1,509 |
| | | | | | |
| | $ | 15,704 | | $ | 17,164 |
| | | | | | |
(7) Accrued Expenses and Other Current Liabilities
Accrued expenses and other current liabilities consisted of the following:
| | | | | | |
| | | September 30,
2007 | | December 31,
2006 |
Wages and employee benefits | | $ | 35,667 | | $ | 33,619 |
Employee termination costs | | | 444 | | | - |
Postretirement benefits other than pension | | | 22,340 | | | 21,420 |
Interest | | | 3,625 | | | 9,063 |
Royalties | | | 9,911 | | | 6,271 |
Taxes, other than income taxes | | | 36,065 | | | 35,409 |
Asset retirement obligations | | | 2,523 | | | 2,940 |
Workers’ compensation | | | 8,140 | | | 8,140 |
Deferred equipment purchase commitment | | | 17,348 | | | 4,337 |
Accrued capital expenditures | | | 8,911 | | | 10,495 |
Other | | | 32,884 | | | 30,320 |
| | | | | | |
| | $ | 177,858 | | $ | 162,014 |
| | | | | | |
(8) Other Noncurrent Liabilities
Other noncurrent liabilities consisted of the following:
| | | | | | |
| | | September 30,
2007 | | December 31,
2006 |
Postemployment benefits | | $ | 5,111 | | $ | 4,803 |
Pension benefits | | | 39,116 | | | 45,387 |
Workers’ compensation | | | 24,914 | | | 23,347 |
Minimum royalty obligations | | | 81 | | | 81 |
Black lung reserves | | | 12,446 | | | 11,305 |
Contract settlement accrual | | | 10,228 | | | 13,986 |
Asset retirement obligations | | | 144,199 | | | 122,076 |
Deferred production tax | | | 16,701 | | | 9,642 |
Deferred credits and other | | | 7,402 | | | 6,140 |
Deferred equipment purchase commitment | | | 3,646 | | | 15,653 |
| | | | | | |
| | $ | 263,844 | | $ | 252,420 |
| | | | | | |
10
Foundation Coal Holdings, Inc. and Subsidiaries
Notes to Consolidated Financial Statements (Continued)
(Unaudited, dollars in thousands, except share data)
During 2005, the Company’s Northern Appalachia business unit took delivery of one hundred new longwall shields to remedy a warranty issue associated with shields currently used in its underground mining operations. The Company entered into a purchase commitment for the shields in the amount of $21,685 and in accordance with the payment terms, periodic progress payments to the manufacturer are not scheduled to start until the fourth quarter of 2007, with scheduled completion within one year. The current portion of the deferred equipment purchase commitment liability of $17,348 is recorded inAccrued expenses and other current liabilities. See Note 7. The Company recorded a deferred equipment purchase commitment liability representing the present value of the future payments due in accordance with the terms of the purchase commitment. Interest expense is imputed and recognized in a manner consistent with the established payment terms, over which, the liability will be increased to the full value of $21,685.
(9) Accumulated Other Comprehensive Loss
Accumulated other comprehensive loss consisted of the following:
| | | | | | | | |
| | | September 30, 2007 | | | December 31, 2006 | |
| | |
Unrealized gain on interest rate swaps | | $ | - | | | $ | 1,114 | |
Defined benefit pension, postretirement and other Company sponsored plans | | | (5,720 | ) | | | (34,526 | ) |
| | | | | | | | |
| | $ | (5,720 | ) | | $ | (33,412 | ) |
| | | | | | | | |
(10) Pension, Other Postretirement Benefit Plans and Pneumoconiosis
Actuarial liabilities related to the Company’s defined benefit pension and postretirement benefit plans were re-measured in connection with the April 2007 curtailment event which occurred with respect to the closing of the Wabash mine, as further discussed in Note 18. The curtailment gains of $5,703 were recorded inOther comprehensive income because the curtailment gains did not exceed the unrecognized net losses recorded inAccumulated other comprehensive income related to these plans.
Components of Net Periodic Pension Costs
The components of net periodic benefit costs are as follows:
| | | | | | | | | | | | | | | | |
| | | Three Months Ended September 30, | | | Nine Months Ended September 30, | |
| | | 2007 | | | 2006 | | | 2007 | | | 2006 | |
Service cost | | $ | 1,657 | | | $ | 1,544 | | | $ | 4,898 | | | $ | 4,635 | |
Interest cost | | | 3,102 | | | | 2,766 | | | | 9,169 | | | | 8,299 | |
Expected return on plan assets | | | (3,113 | ) | | | (2,641 | ) | | | (9,203 | ) | | | (7,925 | ) |
Amortization of: | | | | | | | | | | | | | | | | |
Prior service cost | | | 138 | | | | 25 | | | | 407 | | | | 75 | |
Actuarial (gains) losses | | | (2 | ) | | | 100 | | | | (7 | ) | | | 299 | |
| | | | | | | | | | | | | | | | |
Net expense | | $ | 1,782 | | | $ | 1,794 | | | $ | 5,264 | | | $ | 5,383 | |
| | | | | | | | | | | | | | | | |
Components of Net Periodic Other Postretirement Benefit Plans Costs
The components of net periodic benefit costs are as follows:
| | | | | | | | | | | | |
| | | Three Months Ended September 30, | | Nine Months Ended September 30, |
| | | 2007 | | 2006 | | 2007 | | 2006 |
Service cost | | $ | 1,930 | | $ | 2,274 | | $ | 5,850 | | $ | 6,824 |
Interest cost | | | 7,583 | | | 7,525 | | | 22,995 | | | 22,574 |
Amortization of actuarial losses | | | - | | | 25 | | | - | | | 75 |
| | | | | | | | | | | | |
Net expense | | $ | 9,513 | | $ | 9,824 | | $ | 28,845 | | $ | 29,473 |
| | | | | | | | | | | | |
11
Foundation Coal Holdings, Inc. and Subsidiaries
Notes to Consolidated Financial Statements (Continued)
(Unaudited, dollars in thousands, except share data)
The Company’s postretirement medical and life insurance plans are unfunded.
Components of Pneumoconiosis Costs
The components of net periodic benefit costs are as follows:
| | | | | | | | | | | | | | | | |
| | | Three Months Ended September 30, | | | Nine Months Ended September 30, | |
| | | 2007 | | | 2006 | | | 2007 | | | 2006 | |
Service cost | | $ | 174 | | | $ | 176 | | | $ | 522 | | | $ | 529 | |
Interest cost | | | 341 | | | | 329 | | | | 1,021 | | | | 986 | |
Expected return on plan assets | | | (124 | ) | | | (144 | ) | | | (374 | ) | | | (431 | ) |
Amortization of actuarial losses | | | 29 | | | | 50 | | | | 87 | | | | 149 | |
| | | | | | | | | | | | | | | | |
Net expense | | $ | 420 | | | $ | 411 | | | $ | 1,256 | | | $ | 1,233 | |
| | | | | | | | | | | | | | | | |
(11) Stock-Based Compensation
On July 30, 2004, the Company’s Board of Directors adopted the Foundation Coal Holdings, Inc. 2004 Stock Incentive Plan (the “Plan”), which is designed to assist the Company in recruiting and retaining key employees, directors and consultants. The Plan, which was amended and restated December 14, 2006, permits the Company to grant its key employees, directors and consultants nonqualified stock options (“options”), stock appreciation rights, restricted stock or other stock-based awards. The shares under the Plan may be issued at an exercise price of no less than 100% of the fair market value of the Company’s common stock on the date of grant. The Plan is currently authorized for the issuance of awards for up to 5,978,483 shares of common stock. At September 30, 2007, 2,211,314 shares of common stock were available for grant under the Plan.
The Company has three types of stock-based awards: restricted stock units, restricted stock and options. Total compensation expense related to the stock-based awards recognized inSelling, general and administrative expenses for the nine months ended September 30, 2007 was $4,601, consisting of $3,170, $294 and $1,137 for restricted stock units, restricted stock and options, respectively. Compensation expense related to the stock-based awards recognized inSelling, general and administrative expenses for the nine months ended September 30, 2006 was $2,250, consisting of $1,007, $205 and $1,038 for restricted stock units, restricted stock and options, respectively.
(12) Interest Rate Swaps
On September 30, 2004, the Company entered into pay-fixed, receive-variable interest rate swap agreements on a notional amount of $85,000. The term of these swaps was for three years. Under these swaps, the Company received a variable rate of three month US dollar LIBOR and paid a fixed rate of 3.26%. Settlement of interest payments occurred quarterly. The Company was required to enter into these swaps in order to maintain at least 50% of its outstanding debt at a fixed rate as required by the Senior Secured Credit Facility. These swap agreements essentially converted $85,000 of the Company’s variable rate borrowings under the Senior Secured Credit Facility to fixed rate borrowings for a three-year period beginning September 30, 2004. The Company designated these interest rate swaps at inception as cash flow hedges of the variable interest payments due on $85,000 of its variable rate debt through September 2007 under SFAS No. 133,Accounting for Derivative Financial Instruments and Hedging Activities (“SFAS No. 133”).
In connection with the closing of the $835,000 amended and restated Senior Secured Credit Facility agreement on July 7, 2006, the Company terminated the interest rate swaps. On the date the Company made the decision to terminate the interest rate swaps, the interest rate swaps no longer qualified for cash flow hedge accounting treatment and accordingly, any change in the market value of the interest rate swaps affects net income. On July 11, 2006, the Company monetized the $2,371 derivative asset included inOther noncurrent assets on the Consolidated Balance Sheets at June 30, 2006 and recognized a $112 mark-to-market loss on the swaps. The $1,841 unrealized gain at June 30, 2006 from the change in the market value of the interest rate swaps recorded inAccumulated other comprehensive loss was amortized into income on a prorated basis over the remaining term of the original interest rate swap agreement through September 28, 2007, in accordance with SFAS No. 133 and related amendments. At December 31, 2006, the unamortized unrealized gain on the swaps was $1,114. During the three and nine months ended September 30, 2007, the Company amortized $370 and $1,114, respectively, which was recorded as an offset againstInterest expense.
12
Foundation Coal Holdings, Inc. and Subsidiaries
Notes to Consolidated Financial Statements (Continued)
(Unaudited, dollars in thousands, except share data)
(13) Asset Retirement Obligations
The Company’s mining activities are subject to various federal and state laws and regulations governing the protection of the environment. These laws and regulations are continually changing and are generally becoming more restrictive. The Company conducts its operations to protect the public health and environment and believes its operations are in material compliance with all applicable laws and regulations. The Company has made, and expects to make in the future, expenditures to comply with such laws and regulations, but cannot predict the exact amount of such future expenditures. Estimated future reclamation costs are based principally on legal and regulatory requirements.
The following table is a reconciliation of the Company’s asset retirement obligation liability from December 31, 2006 through September 30, 2007:
| | | | |
Asset retirement obligation, December 31, 2006 | | $ | 125,016 | |
Accretion expense | | | 7,492 | |
Revisions in estimated cash flows and liabilities incurred | | | 14,684 | |
Payments | | | (470 | ) |
| | | | |
Asset retirement obligation, September 30, 2007 | | $ | 146,722 | |
| | | | |
The current portions of the asset retirement obligation liabilities of $2,523 and $2,940 at September 30, 2007 and December 31, 2006, respectively, are included inAccrued expenses and other current liabilities. See Note 7. The noncurrent portion of the Company’s asset retirement obligation liabilities of $144,199 and $122,076 at September 30, 2007 and December 31, 2006, respectively, are included inOther noncurrent liabilities. See Note 8. There were no assets that were legally restricted for purposes of settling asset retirement obligations at September 30, 2007 or December 31, 2006. At September 30, 2007, regulatory obligations for asset retirements are secured by surety bonds in the amount of $260,598. These surety bonds are partially collateralized by letters of credit issued by the Company.
(14) Stockholders’ Equity and Earnings Per Share
Stockholders’ Equity
During the nine months ended September 30, 2007, the Company declared and paid cash dividends of $6,779.
During the three and nine months ended September 30, 2007, 70,000 and 420,345 options were exercised, respectively.
Earnings Per Share
The following table provides a reconciliation of weighted-average shares outstanding used in the basic and diluted earnings per share computations for the periods presented:
| | | | | | | | |
| | | Three Months Ended September 30, | | Nine Months Ended September 30, |
| | | 2007 | | 2006 | | 2007 | | 2006 |
Weighted average shares outstanding-basic | | 45,221,193 | | 45,507,284 | | 45,193,686 | | 45,654,040 |
Dilutive impact of stock options | | 1,082,141 | | 1,206,587 | | 1,174,524 | | 1,392,791 |
Dilutive impact of restricted stock plans | | 109,470 | | 59,870 | | 91,198 | | 56,884 |
| | | | | | | | |
Weighted average shares outstanding-diluted | | 46,412,804 | | 46,773,741 | | 46,459,408 | | 47,103,715 |
| | | | | | | | |
Common Share Repurchases
In July 2006, the Board of Directors authorized a stock repurchase program (the “Repurchase Program”), authorizing the Company to repurchase shares of its common stock. The Company may repurchase its common stock from time to time, as determined by authorized officers of the Company, up to an aggregate amount of $100,000. During the nine months ended September 30, 2007, the Company paid $23,424 to repurchase 753,653 shares of its common stock at an average price of $31.08 per share under the Repurchase Program.
13
Foundation Coal Holdings, Inc. and Subsidiaries
Notes to Consolidated Financial Statements (Continued)
(Unaudited, dollars in thousands, except share data)
(15) Segment Information
The Company produces primarily steam coal from surface and deep mines for sale to utility and industrial customers. The Company operates in the United States with mines in three of the major coal basins. The Company has four reportable business segments: Northern Appalachia, consisting of two underground mines in southwestern Pennsylvania; Central Appalachia, consisting of seven underground mines and two surface mines in southern West Virginia; the Powder River Basin, consisting of two surface mines in Wyoming and Other. Other includes an idled underground mine in Illinois, centralized sales functions, corporate overhead, business development activities, expenses for closed mines and the elimination of intercompany transactions. The Company evaluates the performance of its segments based on income from operations.
Operating segment results for the three months ended September 30, 2007 are as follows:
| | | | | | | | | | | | | | | | | | |
| | | Powder River
Basin | | Northern
Appalachia | | Central
Appalachia | | | Other | | | Consolidated | |
Total revenues | | $ | 120,970 | | $ | 117,249 | | $ | 117,528 | | | $ | 3,311 | | | $ | 359,058 | |
Income (loss) from operations | | | 18,838 | | | 9,046 | | | 2,863 | | | | (22,721 | ) | | | 8,026 | |
Depreciation, depletion and amortization | | | 11,451 | | | 18,842 | | | 17,149 | | | | 2,143 | | | | 49,585 | |
Amortization of coal supply agreements | | | 1,128 | | | 24 | | | (2,101 | ) | | | 105 | | | | (844 | ) |
Capital expenditures | | | 14,950 | | | 21,291 | | | 7,389 | | | | 1,052 | | | | 44,682 | |
Total assets at September 30, 2007 | | $ | 506,868 | | $ | 853,535 | | $ | 439,849 | | | $ | 149,574 | | | $ | 1,949,826 | |
Operating segment results for the three months ended September 30, 2006 are as follows:
| | | | | | | | | | | | | | | | | | | |
| | | Powder River
Basin | | Northern
Appalachia | | | Central
Appalachia | | | Other | | | Consolidated | |
Total revenues | | $ | 107,510 | | $ | 128,474 | | | $ | 105,685 | | | $ | 12,451 | | | $ | 354,120 | |
Income (loss) from operations | | | 13,244 | | | 22,000 | | | | 1,750 | | | | (16,754 | ) | | | 20,240 | |
Depreciation, depletion and amortization | | | 10,839 | | | 17,507 | | | | 14,989 | | | | 1,835 | | | | 45,170 | |
Amortization of coal supply agreements | | | 3,912 | | | (1,936 | ) | | | (4,504 | ) | | | 219 | | | | (2,309 | ) |
Capital expenditures | | | 8,681 | | | 15,676 | | | | 6,794 | | | | 13,180 | | | | 44,331 | |
Total assets at December 31, 2006 | | $ | 497,956 | | $ | 863,702 | | | $ | 469,616 | | | $ | 118,306 | | | $ | 1,949,580 | |
Operating segment results for the nine months ended September 30, 2007 are as follows:
| | | | | | | | | | | | | | | | | | |
| | | Powder River
Basin | | Northern
Appalachia | | Central
Appalachia | | | Other | | | Consolidated | |
Total revenues | | $ | 355,588 | | $ | 395,579 | | $ | 347,185 | | | $ | 24,109 | | | $ | 1,122,461 | |
Income (loss) from operations | | | 60,667 | | | 62,995 | | | 3,043 | | | | (74,217 | ) | | | 52,488 | |
Depreciation, depletion and amortization | | | 33,066 | | | 60,387 | | | 51,742 | | | | 6,217 | | | | 151,412 | |
Amortization of coal supply agreements | | | 3,130 | | | 182 | | | (6,806 | ) | | | 53 | | | | (3,441 | ) |
Capital expenditures | | | 26,089 | | | 55,637 | | | 24,343 | | | | 14,692 | | | | 120,761 | |
Total assets at September 30, 2007 | | $ | 506,868 | | $ | 853,535 | | $ | 439,849 | | | $ | 149,574 | | | $ | 1,949,826 | |
Operating segment results for the nine months ended September 30, 2006 are as follows:
| | | | | | | | | | | | | | | | | | | |
| | | Powder River
Basin | | Northern
Appalachia | | | Central
Appalachia | | | Other | | | Consolidated | |
Total revenues | | $ | 315,474 | | $ | 418,683 | | | $ | 342,026 | | | $ | 40,349 | | | $ | 1,116,532 | |
Income (loss) from operations | | | 32,137 | | | 120,425 | | | | 15,445 | | | | (57,622 | ) | | | 110,385 | |
Depreciation, depletion and amortization | | | 31,560 | | | 56,020 | | | | 44,171 | | | | 5,927 | | | | 137,678 | |
Amortization of coal supply agreements | | | 10,659 | | | (7,068 | ) | | | (15,710 | ) | | | 346 | | | | (11,773 | ) |
Capital expenditures | | | 15,821 | | | 35,120 | | | | 40,036 | | | | 28,736 | | | | 119,713 | |
Total assets at December 31, 2006 | | $ | 497,956 | | $ | 863,702 | | | $ | 469,616 | | | $ | 118,306 | | | $ | 1,949,580 | |
14
Foundation Coal Holdings, Inc. and Subsidiaries
Notes to Consolidated Financial Statements (Continued)
(Unaudited, dollars in thousands, except share data)
(16) Other Revenue
Other revenue consisted of the following:
| | | | | | | | | | | | | | |
| | | Three Months Ended September 30, | | Nine Months Ended
September 30, |
| | | 2007 | | | 2006 | | 2007 | | | 2006 |
Royalty income | | $ | 971 | | | $ | 2,389 | | $ | 2,843 | | | $ | 3,888 |
Synfuel fees | | | 1,351 | | | | 391 | | | 4,013 | | | | 5,312 |
Coalbed methane | | | 1,337 | | | | 1,046 | | | 3,590 | | | | 3,015 |
Transloading and plant processing fees | | | 429 | | | | 680 | | | 921 | | | | 2,558 |
Gain on sale of assets | | | 1,867 | (1) | | | 514 | | | 4,468 | (1) | | | 899 |
Combined Benefit Fund refund | | | - | | | | - | | | 1,325 | | | | - |
Dry Systems Technologies equipment and filter sales | | | 888 | | | | 1,155 | | | 2,740 | | | | 3,366 |
Other | | | 1,453 | | | | 434 | | | 5,774 | | | | 3,222 |
| | | | | | | | | | | | | | |
Total other revenue | | $ | 8,296 | | | $ | 6,609 | | $ | 25,674 | | | $ | 22,260 |
| | | | | | | | | | | | | | |
(1) | Gain on sale of assets includes a $2,000 gain on a non-cash exchange of leased reserves with Boone West Development Co., a subsidiary of Massey Energy Company. |
(17) Commitments and Contingencies
General
The Company follows SFAS No. 5,Accounting for Contingencies, in determining its accruals and disclosures with respect to loss contingencies. Accordingly, estimated losses from loss contingencies and legal expenses associated with the contingency are accrued by a charge to income when information available indicates that it is probable that an asset had been impaired or a liability had been incurred and the amount of the loss can be reasonably estimated. If a loss contingency is not probable or reasonably estimable, disclosure of the loss contingency is made in the consolidated financial statements when it is at least reasonably possible that a loss will be incurred and the loss is material. Additionally, see Note 13 regarding Asset Retirement Obligations.
Guarantees
Neweagle Industries, Inc., Neweagle Coal Sales Corp., Laurel Creek Co., Inc. and Rockspring Development, Inc. (“Sellers”) are indirect wholly owned subsidiaries of the Company. The Sellers sell coal to Birchwood Power Partners, L.P. (“Birchwood”) under a Coal Supply Agreement dated July 22, 1993 (“Birchwood Contract”). Laurel Creek Co., Inc. and Rockspring Development, Inc. were parties to the Birchwood Contract since its inception, at which time those entities were not affiliated with Neweagle Industries, Inc., Neweagle Coal Sales Corp. or the Company. Effective January 31, 1994, the Birchwood Contract was assigned to Neweagle Industries, Inc. and Neweagle Coal Sales Corp. by AgipCoal Holding USA, Inc. and AgipCoal Sales USA, Inc., which at the time were affiliates of Arch Coal, Inc. Despite this assignment, Arch Coal, Inc. (“Arch”) and its affiliates have separate contractual obligations to provide coal to Birchwood if Sellers fail to perform. Pursuant to an Agreement & Release dated September 30, 1997, the Company agreed to defend, indemnify and hold harmless Arch and its subsidiaries from and against any claims arising out of any failure of Sellers to perform under the Birchwood Contract. By acknowledgement dated February 16, 2005, the Company and Arch acknowledged the continuing validity and effect of said Agreement & Release.
In the normal course of business, the Company is a party to guarantees and financial instruments with off-balance sheet risk, such as bank letters of credit, performance or surety bonds and other guarantees and indemnities related to the obligations of affiliated entities, which are not reflected in the accompanying Consolidated Balance Sheets. Management does not expect any material losses to result from these guarantees and other off-balance sheet instruments and, therefore, is of the opinion that their fair value is zero.
Contingencies
Extensive regulation of the impacts of mining on the environment and of maintaining workplace safety, and related litigation, has had or may have a significant effect on the Company’s costs of production and results of operations. Further regulations, legislation or litigation in these areas may also cause the Company’s sales or profitability to decline by increasing costs or by hindering the Company’s ability to continue mining at existing operations or to permit new operations.
15
Foundation Coal Holdings, Inc. and Subsidiaries
Notes to Consolidated Financial Statements (Continued)
(Unaudited, dollars in thousands, except share data)
Legal Proceedings
The Company is involved in various claims and other legal actions arising in the ordinary course of business. In the opinion of management, the ultimate disposition of these matters will not have a material adverse effect on the Company’s consolidated financial position, consolidated results of operations or consolidated cash flows.
Letters of Credit
At September 30, 2007, the Company had $171,348 of letters of credit outstanding under its revolving credit facility.
(18) Employee and Contract Termination Costs
Employee Termination Costs
Wage agreements between three affiliates of the Company and the United Mine Workers of America (“UMWA”) expired on or shortly after March 31, 2007. Specifically, the UMWA wage agreement for Wabash Mine Holding Company (“Wabash”) expired at 11:59 p.m. on March 31, 2007 and the UMWA wage agreements with Cumberland Coal Resources, LP (“Cumberland”) and Emerald Coal Resources, LP (“Emerald”) expired at 11:59 p.m. on April 1, 2007. Negotiations between these respective subsidiaries and the UMWA commenced in early January of 2007 but intensified in late March of 2007 and continued through April 3, 2007. Emerald Coal Resources, LP and Cumberland Coal Resources, LP reiterated their willingness to sign the 2007 National Bituminous Coal Operators Association (“BCOA”) UMWA wage agreement. Wabash would not sign the BCOA agreement. The hourly workforce continued to work without a formal agreement of the parties under the terms of the expired wage agreement until 12:01 a.m. on April 4, 2007 at which time, alleging unfair labor practices by Wabash, Emerald and Cumberland, the UMWA represented hourly workforces struck the Wabash, Emerald and Cumberland mines. On the same day, Wabash announced the idling of the mine in southern Illinois. The mining operation had become economically unviable at that time as a result of a combination of factors, including aging infrastructure, softening market conditions and the prospect of a new higher cost labor contract with the UMWA.
On April 10, 2007, negotiations between the UMWA and the three subsidiaries resumed. In the early evening of April 12, 2007, it was announced that the UMWA and the three subsidiaries had reached agreement and that the workforces at Emerald and Cumberland would return to work. The Wabash mine remained closed and the effects of the idling had been negotiated with the UMWA.
During the nine months ended September 30, 2007, as a result of the Wabash mine idling, the Company recognized employee termination costs of $5,967 and $1,405 in accordance with the provisions of SFAS No. 146,Accounting for Costs Associated with Exit or Disposal Activities (“SFAS No. 146”) and the provisions of SFAS No. 112,Employers’ Accounting for Postemployment Benefits (“SFAS No. 112”), respectively. During the three months ended September 30, 2007, employee termination costs associated with one-time benefit arrangements of $617 were recognized in accordance with SFAS No. 146. Termination costs resulting from one-time benefit arrangements include medical insurance continuance costs and one-time retention pay to salaried employees. The Company also reduced its estimate of certain previously recognized employee termination costs associated with on-going benefit arrangements in accordance with SFAS No. 112 by $57. During the three and nine months ended September 30, 2007, the Company also recognized $1,754 of direct and incremental costs related to additional benefit claims for certain severed employees. These employee termination costs are recorded asEmployee and contract termination costs in the Consolidated Statements of Operations and Comprehensive Income for the three and nine months ended September 30, 2007. Wabash is included in the Company’sOther segment.
During the three and nine months ended September 30, 2007, the Company made cash payments related to employee termination costs of $2,436 and $6,928, respectively. At September 30, 2007, the Company’s liability for employee termination costs included inAccrued expenses and other current liabilities in the Consolidated Balance Sheet was $444, comprised of medical and severance benefits. See Note 7. The Company’s liability for other costs associated with severed employees included inOther noncurrent liabilities was $1,754 at September 30, 2007. See Note 8.
16
Foundation Coal Holdings, Inc. and Subsidiaries
Notes to Consolidated Financial Statements (Continued)
(Unaudited, dollars in thousands, except share data)
Contract Termination Costs
Wabash was the seller under two coal supply agreements supplied from the Wabash mine with Duke Energy Indiana, Inc. Wabash continued to ship coal under the coal supply agreements through April 3, 2007, just prior to the mine idling. Each agreement contained force majeure language excusing the seller from supplying coal in the event of a work stoppage. On April 3, 2007, Wabash and Duke Energy Indiana, Inc. executed a Termination Agreement and Mutual Release buying-out, subject to certain conditions, all obligations under their two contracts in exchange for a cash payment of $5,734 which was paid by the Company on April 5, 2007. The Company believes there will be no further obligations of Wabash under these two contracts. During the nine months ended September 30, 2007, the Company recognized $5,171 of net contract termination costs in accordance with the provisions of SFAS No. 146. The contract termination costs were recorded during the second quarter based on the date the Termination Agreement & Mutual Release was agreed-to between the parties. These contract termination costs are recorded asEmployee and contract termination costs in the Consolidated Statement of Operations and Comprehensive Income for the nine months ended September 30, 2007.
17
ITEM 2. MANAGEMENT’S DISCUSSION AND ANALYSIS OF FINANCIAL CONDITION AND RESULTS OF OPERATIONS.
Special Note Regarding Forward-Looking Statements
This Form 10-Q contains forward-looking statements that are not statements of historical fact and may involve a number of risks and uncertainties. These statements relate to analyses and other information that are based on forecasts of future results and estimates of amounts not yet determinable. These statements may also relate to our future prospects, developments and business strategies.
We have used the words “anticipate,” “believe,” “could,” “estimate,” “expect,” “intend,” “may,” “plan,” “predict,” “project” and similar terms and phrases, including references to assumptions, in this Form 10-Q to identify forward-looking statements. These forward-looking statements are made based on expectations and beliefs concerning future events affecting us and are subject to uncertainties and factors relating to our operations and business environment, all of which are difficult to predict and many of which are beyond our control, that could cause our actual results to differ materially from those matters expressed in or implied by these forward-looking statements. The following factors are among those that may cause actual results to differ materially from our forward-looking statements:
| | • | | market demand for coal, electricity and steel; |
| | • | | future economic or capital market conditions; |
| | • | | weather conditions or catastrophic weather-related damage; |
| | • | | our ability to produce coal at existing and planned future operations; |
| | • | | the consummation of financing, acquisition or disposition transactions and the effect thereof on our business; |
| | • | | our plans and objectives for future operations and expansion or consolidation; |
| | • | | our relationships with, and other conditions affecting, our customers; |
| | • | | timing of reductions or increases in customer coal inventories; |
| | • | | long-term coal supply arrangements; |
| | • | | environmental laws, including those directly affecting our coal mining and production, and those affecting our customers’ coal usage; |
| | • | | railroad, barge, trucking and other transportation performance and costs; |
| | • | | our assumptions concerning economically recoverable coal reserve estimates; |
| | • | | employee workforce factors; |
| | • | | regulatory and court decisions; |
| | • | | future legislation and changes in regulations or governmental policies or changes in interpretations thereof; |
| | • | | changes in postretirement benefit and pension obligations; |
| | • | | our liquidity, results of operations and financial condition; |
| | • | | disruptions in delivery or changes in pricing from third party vendors of goods and services which are necessary for our operations, such as fuel, steel products, explosives and tires; |
| | • | | continuation of other revenues from fees received from synthetic fuel (“synfuel”) processors. |
You should keep in mind that any forward-looking statement made by us in this Form 10-Q or elsewhere speaks only as of the date on which we make it. New risks and uncertainties come up from time to time, and it is impossible for us to predict these events or how they may affect us. We have no duty to, and do not intend to, update or revise the forward-looking statements in this Form 10-Q after the date of this Form 10-Q, except as may be required by law. In light of these risks and uncertainties, you should keep in mind that any forward-looking statement made in this Form 10-Q or elsewhere might not occur.
18
Overview
We are the fourth largest coal producer in the United States, operating a diverse group of thirteen coal mines located in Pennsylvania, West Virginia and the Powder River Basin region of Wyoming. Four of our operations are surface mines, two of our operations are underground mines using highly efficient longwall mining technology and the remaining seven operations are underground mines that utilize continuous miners. On April 4, 2007, Wabash Mine Holding Company (“Wabash”) announced the idling of the Wabash mine, an underground, continuous miner operation located in southern Illinois. The mine had become economically unviable at that time as a result of a combination of factors discussed further in “Wage Negotiations with the UMWA and Idling of the Company’s Illinois Basin Mining Operations” below.
For the three months ended September 30, 2007, we sold 18.5 million tons of coal, including 18.0 million tons that were produced and processed at our operations. For the comparable period in 2006, we sold 18.5 million tons of coal, including 18.2 million tons that were produced and processed at our operations. For the nine months ended September 30, 2007, we sold 55.5 million tons of coal, including 54.2 million tons that were produced and processed at our operations. For the comparable period in 2006, we sold 55.6 million tons of coal, including 54.0 million tons produced and processed at our operations. As of December 31, 2006, we had approximately 1.6 billion tons of proven and probable coal reserves. In addition to mining coal, we are also involved in marketing coal produced by others to supplement our own production and, through blending, provide our customers with coal qualities beyond those available from our own production. We purchased and resold approximately 0.5 million and 0.3 million tons of coal in the three months ended September 30, 2007 and 2006, respectively. For the nine months ended September 30, 2007 and 2006, we purchased and resold approximately 1.3 million and 1.6 million tons of coal, respectively.
We are primarily a supplier of steam coal to U.S. utilities for use in generating electricity. We also sell steam coal to industrial plants. Steam coal sales accounted for approximately 97% of our coal sales volume for both the three month periods ended September 30, 2007 and 2006, representing approximately 88% and 90% of our coal sales revenue in the three month periods ended September 30, 2007 and 2006, respectively. For the nine months ended September 30, 2007 and 2006, steam coal sales accounted for approximately 97% of our coal sales volume in both periods, representing approximately 90% and 91% of our coal sales revenue for the nine month periods ended September 30, 2007 and 2006, respectively. We sell metallurgical coal to steel producers where it is used to make coke for steel production. Metallurgical coal accounted for approximately 3% of our coal sales volume in both of the three month periods ended September 30, 2007 and 2006, representing approximately 12% and 10% of our coal sales revenue in the three month periods ended September 30, 2007 and 2006, respectively. Metallurgical coal accounted for approximately 3% of our coal sales volume for both of the nine month periods ended September 30, 2007 and 2006, representing approximately 10% and 9% of our coal sales revenue in both of the nine month periods ended September 30, 2007 and 2006, respectively.
While the majority of our revenues are derived from the sale of coal, we also realize revenues from coal production royalties, override royalty payments from a coal supply agreement now fulfilled by another producer, fees from the processing of our production by a synfuel facility, asset disposals, fees to transload coal through our Rivereagle facility on the Big Sandy River and revenues from the sale of coalbed methane.
Results of Operations
Three Months Ended September 30, 2007 Compared to Three Months Ended September 30, 2006
Coal sales realization per ton sold represents the average revenue realized on each ton of coal sold. It is calculated by dividing coal sales revenues by tons sold.
19
Revenues
| | | | | | | | | | | | |
| | | Three Months Ended
September 30, | | Increase (Decrease) |
| | | 2007 | | 2006 | | Amount | | | Percent |
| | | (Unaudited, in thousands, except per ton data) |
Coal sales | | $ | 350,762 | | $ | 347,511 | | $ | 3,251 | | | 1% |
Other revenue | | | 8,296 | | | 6,609 | | | 1,687 | | | 26% |
| | | | | | | | | | | | |
Total revenues | | $ | 359,058 | | $ | 354,120 | | $ | 4,938 | | | 1% |
| | | | | | | | | | | | |
Tons sold | | | 18,470 | | | 18,495 | | | (25 | ) | | - |
Coal sales realization per ton sold | | $ | 18.99 | | $ | 18.79 | | $ | 0.20 | | | 1% |
Coal sales revenues for the three months ended September 30, 2007 increased by $3.3 million compared to coal sales revenues for the three months ended September 30, 2006 as a result of a 1% increase in average coal sales realization per ton due to a period-over-period increase in base revenue realization. Consolidated weighted-average sales realization per ton for the third quarter of 2007 reflected a higher proportion of lower value Powder River Basin shipments compared to the same period in 2006.
Coal sales revenues in Northern Appalachia for the three months ended September 30, 2007 decreased 10% compared to coal sales revenues for the three months ended September 30, 2006 due primarily to a combination of lower coal sales volumes from lower tons shipped, lower base revenue and lower coal quality premium/penalty revenue. Coal sales revenue realization per ton sold was unchanged period-over-period. Coal sales volumes in Northern Appalachia for the three months ended September 30, 2007 decreased by 0.3 million tons (9%) period-over-period primarily as a result of decreased production and shipments from the Emerald mine due to geological challenges encountered during the quarter which hindered mining activities and slowed production.
Coal sales revenues in Central Appalachia for the three months ended September 30, 2007 increased 8% compared to coal sales revenues for the three months ended September 30, 2006. Coal sales revenue realization per ton sold increased 1% period-over-period due to higher revenues earned from purchased coal and synfuel fees and higher base revenue partially offset by lower coal quality premium/penalty revenue. Coal sales volumes in Central Appalachia increased by 0.1 million tons (7%) period-over-period reflecting increased tons that were purchased and resold and decreased shipments from all West Virginia mining operations except for the Kingston mine and from Laurel Creek’s underground mines. Production in Central Appalachia increased by 1% for the three months ended September 30, 2007 compared to the prior year period.
Coal sales revenues in the Powder River Basin for the three months ended September 30, 2007 increased by 12% compared to coal sales revenues for the three months ended September 30, 2006 as a result of a 3% increase in tons sold and higher base revenue, partially offset by lower premium/penalty revenue, resulting in a 9% increase in average coal sales realization per ton. Base revenue realization per ton increased by 16% period-over-period while coal quality premium/penalty revenue decreased 89% period-over-period. Coal sales realization per ton increased due to shipments under higher priced 2007 contracts than the comparable period in 2006. Coal sales volumes in the Powder River Basin increased by 0.3 million tons (3%) to a record quarterly shipment level of 13.3 million tons primarily due to a 12% increase in both production and shipments from the Belle Ayr mine, offset partially by 6% lower period-over-period production and shipments at the Eagle Butte mine.
Coal sales revenues in the Illinois Basin for the three months ended September 30, 2007 decreased substantially compared to the coal sales revenues for the three months ended September 30, 2006 due to the April 4, 2007 idling of the Wabash mine in southern Illinois.
Other revenues for the three months ended September 30, 2007 increased by $1.7 million (26%) compared to the three months ended September 30, 2006. The increase was due to: (a) increased gains on the sale of assets ($1.4 million); (b) higher coalbed methane sales ($0.3 million); (c) increased miscellaneous revenues ($1.0 million); (d) increased synfuel fees ($1.0 million); partially offset by (e) lower transloading and plant processing fees ($0.3 million); (f) decreased revenues from the sale of equipment and filters by Dry Systems Technologies ($0.3 million); and (g) decreased royalty revenues ($1.4 million).
20
Costs and Expenses
| | | | | | | | | | | | | | |
| | | Three Months Ended
September 30, | | | Increase (Decrease) | |
| | | 2007 | | | 2006 | | | Amount | | Percent | |
| | | (Unaudited, in thousands) | |
Cost of coal sales (excludes depreciation, depletion and amortization) | | $ | 283,079 | | | $ | 277,453 | | | $ | 5,626 | | 2 | % |
Selling, general and administrative expenses (excludes depreciation, depletion and amortization) | | | 14,263 | | | | 11,347 | | | | 2,916 | | 26 | % |
Accretion on asset retirement obligations | | | 2,635 | | | | 2,219 | | | | 416 | | 19 | % |
Depreciation, depletion and amortization | | | 49,585 | | | | 45,170 | | | | 4,415 | | 10 | % |
Amortization of coal supply agreements | | | (844 | ) | | | (2,309 | ) | | | 1,465 | | 63 | % |
Employee and contract termination costs | | | 2,314 | | | | - | | | | 2,314 | | N/A | (1) |
| | | | | | | | | | | | | | |
Total costs and expenses | | $ | 351,032 | | | $ | 333,880 | | | $ | 17,152 | | 5 | % |
| | | | | | | | | | | | | | |
(1) | Amounts are not measurable as no such costs were incurred during the three months ended September 30, 2006. |
Cost of coal sales.Cost of coal sales increased $5.6 million for the three months ended September 30, 2007 compared to the three months ended September 30, 2006, primarily due to: (a) increases in labor and benefit costs as a result of both compensation increases and hiring of additional personnel ($5.4 million); (b) increases in royalties due to mining a higher proportion of coal subject to federal royalty ($2.6 million); (c) higher repair and maintenance, outside services and operating supply costs ($0.1 million); (d) increases in purchased coal costs as a result of higher purchased coal volumes ($7.6 million); (e) increased property, sales and production taxes ($1.5 million); (f) increased miscellaneous expenses ($0.4 million); partially offset by (g) lower longwall move expenses ($0.9 million); (h) decreased transportation and loading costs ($2.0 million); and (i) a period-over-period decrease in inventory charges to expense related to an overall higher ratio of tons produced vs. tons sold in the three months ended September 30, 2007 compared to the prior year period ($9.1 million). Cost of coal sales per ton was $15.33 for the three months ended September 30, 2007 compared to $15.00 per ton for the three months ended September 30, 2006.
Selling, general and administrative expenses.Selling, general and administrative expenses for the three months ended September 30, 2007 were $14.2 million compared to $11.3 million for the three months ended September 30, 2006. Period-over-period increases were due to: (a) higher expenses incurred for employee compensation and benefit related expenses ($2.9 million); (b) higher consulting fees primarily related to implementation activities for our enterprise software that do not qualify as capital expenditures and other miscellaneous administrative activities ($0.2 million); partially offset by (c) lower miscellaneous overhead expenses, including legal and insurance expenses ($0.2 million).
Accretion on asset retirement obligations.Accretion on asset retirement obligations is a component of accounting for asset retirement obligations under Statement of Financial Accounting Standards (“SFAS”) No. 143,Accounting for Asset Retirement Obligations (“SFAS No. 143”). Accretion represents the increase in the asset retirement liability to reflect the change in the liability for the passage of time because the initial liability is recorded at present value. Higher accretion expense in 2007 was due to increased asset retirement obligation estimates at closed mines.
Depreciation, depletion and amortization.Depreciation, depletion and amortization includes depreciation of plant and equipment, cost depletion of amounts assigned to owned and leased mineral rights, amortization of mine development costs, internal use software and leasehold improvements. Depreciation, depletion and amortization expense increased $4.4 million for the three months ended September 30, 2007 compared to the three months ended September 30, 2006, primarily due to higher depreciation and amortization. Depreciation and amortization increased by $4.5 million in the third quarter of 2007 mainly due to capital additions to plant and equipment during the twelve months ended September 30, 2007 and the depreciation of the recently placed in service enterprise resource planning (“ERP”) software, which was placed in service at the beginning of the second quarter of 2007. Cost depletion decreased by $0.1 million.
21
Coal supply agreement amortization.Application of purchase accounting in 2004 resulted in the recognition of a significant liability for below market priced coal supply agreements as well as a significant asset for above market priced coal supply agreements, both in relation to market prices at the date of acquisition of mining assets by the Company in 2004. Coal supply agreement amortization decreased $1.5 million for the three months ended September 30, 2007 compared to the three months ended September 30, 2006. Amortization of the liability for below market priced coal supply agreements during the three months ended September 30, 2007 was $3.5 million of credit to expense compared to $8.0 million of credit to expense in the comparable period of the prior year. Amortization of the asset for above market priced coal supply agreements during the three months ended September 30, 2007 was $2.7 million of expense compared to $5.7 million of expense in the comparable period of the prior year. As shipments on coal supply agreements valued in purchase accounting are completed, the period-over-period impact of the amortization on both the asset and liability balances will continue to diminish until approximately 2010 when shipments associated with these coal supply agreements are estimated to be complete.
Employee and contract termination costs.As discussed below in the section entitled “Wage Negotiations with the UMWA and Idling of the Company’s Illinois Basin Mining Operation,” the UMWA wage agreement for Wabash expired at 11:59 p.m. on March 31, 2007. The Company would not sign a new agreement for Wabash and the hourly workforce continued to work without a formal agreement of the parties under the terms of the expired wage agreement until 12:01 a.m. on April 4, 2007 at which time the UMWA represented hourly workforces struck. On the same day, Wabash announced the idling of the mine in southern Illinois. During the three months ended September 30, 2007, the Company recognized employee termination costs associated with one-time benefit arrangements of $0.6 million in accordance with the provisions of SFAS No. 146,Accounting for Costs Associated with Exit or Disposal Activities (“SFAS No. 146”). The Company also recognized employee termination costs associated with on-going benefit arrangements in accordance with the provisions of SFAS No. 112,Employers’ Accounting for Postemployment Benefits (“SFAS No. 112”) and during the three months ended September 30, 2007, the Company reduced its estimate of employee termination costs associated with such benefit arrangements by $0.1 million. Termination costs resulting from one-time benefit arrangements include medical insurance continuance costs and one-time retention pay to salaried employees. During the three months ended September 30, 2007, the Company also recognized $1.8 million of direct and incremental costs related to additional benefit claims for certain severed employees. These employee termination costs are included inEmployee and contract termination costs in the Consolidated Statement of Operations and Comprehensive Income for the three month period ended September 30, 2007.
22
Segment Analysis
Utilizing data published by Argus Media, the following graph sets forth representative steam coal prices in various U.S. markets summarized for the monthly periods from January through September. The prices are not necessarily representative of the coal prices actually obtained by the Company. Changes in coal prices have an impact over time on the Company’s average sales realization per ton and, ultimately, its consolidated financial results.

23
| | | | | | | | | | | | | |
| | | Three Months Ended
September 30, | | Increase (Decrease) | |
| | | 2007 | | 2006 | | Tons/$ | | | Percent | |
| | | (Unaudited, in thousands, except sales realization per ton) | |
Powder River Basin | | | | | | | | | | | | | |
Tons sold | | | 13,315 | | | 12,971 | | | 344 | | | 3 | % |
Average sales realization per ton | | $ | 9.05 | | $ | 8.27 | | $ | 0.78 | | | 9 | % |
Total revenues | | $ | 120,970 | | $ | 107,510 | | $ | 13,460 | | | 13 | % |
Income from operations | | $ | 18,838 | | $ | 13,244 | | $ | 5,594 | | | 42 | % |
| | | | |
Northern Appalachia | | | | | | | | | | | | | |
Tons sold | | | 2,959 | | | 3,254 | | | (295 | ) | | (9 | )% |
Average sales realization per ton | | $ | 38.86 | | $ | 39.10 | | $ | (0.24 | ) | | (1 | )% |
Total revenues | | $ | 117,249 | | $ | 128,474 | | $ | (11,225 | ) | | (9 | )% |
Income from operations | | $ | 9,046 | | $ | 22,000 | | $ | (12,954 | ) | | (59 | )% |
| | | | |
Central Appalachia | | | | | | | | | | | | | |
Tons sold | | | 2,151 | | | 2,002 | | | 149 | | | 7 | % |
Average sales realization per ton | | $ | 52.69 | | $ | 52.24 | | $ | 0.45 | | | 1 | % |
Total revenues | | $ | 117,528 | | $ | 105,685 | | $ | 11,843 | | | 11 | % |
Income from operations | | $ | 2,863 | | $ | 1,750 | | $ | 1,113 | | | 64 | % |
Powder River Basin—Income from operations increased $5.6 million period-over-period due to increased revenues of $13.5 million, partially offset by increased production costs of $7.9 million. As explained in the revenue section above, the increased revenues resulted from a 3% increase in tons sold period-over-period and a 9% increase in average sales realization per ton period-over-period. Assuming acceptable market conditions exist, we expect future increases in tons sold at the Belle Ayr mine primarily due to the expansion of its annual capacity. Production costs increased $7.9 million for the three months ended September 30, 2007 compared to the three months ended September 30, 2006, reflecting higher period-over-period cost of sales of $9.6 million, higher miscellaneous other costs of $0.5 million, partially offset by lower depreciation, depletion and amortization costs of $2.2 million.
The $9.6 million period-over-period increase in cost of sales referred to above was the result of higher period-over-period cash costs of $9.7 million, partially offset by lower miscellaneous other costs of $0.1 million. The increase in cash costs were primarily in the following areas: (a) excise taxes and coal production taxes, which respond to changes in coal sales revenues ($1.7 million); (b) supply and service costs primarily consisting of repair and maintenance costs, explosives, diesel fuel and outside services ($3.5 million); (c) labor and employee benefits ($1.2 million); (d) royalties expenses from mining a higher proportion of coal subject to federal royalty ($2.3 million); and (e) miscellaneous other costs ($1.0 million). These production cost increases occurred primarily due to a 3% increase in period-over-period tons produced.
Lower total depreciation, depletion and amortization costs of $2.2 million related primarily to a period-over-period $2.8 million reduction in the charge for the amortization of coal supply agreements, as shipments on a number of coal supply agreements valued in purchase accounting were completed, partially offset by higher depreciation and depletion of $0.6 million as a result of increased period-over-period production and higher capital expenditures during the prior twelve months. Also contributing to the higher depreciation expense was the completion of an overland conveyor belt that was placed into service during the three months ended September 30, 2007. Cost of coal sales per ton increased approximately 10% period-over-period.
Northern Appalachia—Income from operations decreased by $13.0 million period-over-period due to decreased revenues of $11.2 million, increased production costs of $1.3 million and increased miscellaneous other costs of $0.5 million. As explained in the revenue section above, the decrease in revenues was due to a 9% period-over-period decrease in tons sold resulting in a 1% decrease in average sales realization per ton. Income from operations and coal sales volumes decreased primarily as a result of decreased production and shipments from the Emerald mine due to geological challenges encountered during the quarter which hindered mining activities and slowed production. Tons sold at the Emerald mine decreased 39% in the three months ended September 30, 2007 compared to the prior year period. Production costs increased $1.3 million period-over-period due to increased depreciation, depletion and amortization costs ($3.3 million) and increased other miscellaneous costs ($0.3 million), partially offset by a decrease in cost of sales ($2.3 million).
24
Cost of sales decreased $2.3 million due to a decrease in inventory charges to expense related to a higher ratio of tons produced vs. tons sold in the three months ended September��30, 2007 compared to the prior year period ($6.1 million) and decreased other miscellaneous costs ($0.4 million), partially offset by increased cash costs ($4.2 million).
The $4.2 million period-over-period increase in the cash costs referred to above were primarily incurred in the following areas: (a) higher labor and employee benefit costs, due to a higher number of employees and period-over-period wage and benefit increases, due primarily to the new UMWA wage agreement ($7.4 million); (b) higher operating costs primarily from usage of roof bolts, miner bits, diesel fuel usage, repairs and maintenance, outside services and facility related expenses ($0.7 million); partially offset by (c) lower miscellaneous other costs ($0.1 million); (d) lower longwall move costs ($0.9 million); (e) reduced tax costs ($0.2 million); and (f) lower transportation and loading costs ($2.7 million).
Higher total depreciation, depletion and amortization costs of $3.3 million related primarily to: (a) a period-over-period reduction in the credit associated with the amortization of coal supply agreements as shipments on a number of coal supply agreements valued in purchase accounting were completed ($2.0 million); (b) increased depreciation primarily related to the batch weigh system, longwall shields, face conveyors and other mining equipment ($1.9 million); and (c) and lower depletion expense ($0.6 million). Cost of coal sales per ton increased 7% period-over-period.
Central Appalachia—Income from operations increased by $1.1 million period-over-period due to a combination of increased revenues of $11.8 million and decreased miscellaneous other costs of $0.5 million, partially offset by increased production costs of $11.2 million. As explained in the revenues section above, the increase in revenues resulted from a 7% period-over-period increase in tons sold resulting in a 1% increase in average sales realization per ton. Additionally, during the three months ended September 30, 2007, a $2.0 million gain was recognized on an exchange of leased coal reserves. Coal sales revenues for the three months ended September 30, 2007 increased 8% period-over-period as a result of higher revenues related to purchased coal, partially offset by lower coal quality premium/penalty revenue. Coal sales volumes in Central Appalachia increased by 0.1 million tons (7%) period-over-period.
Increased production costs of $11.2 million for the three months ended September 30, 2007 compared to the three months ended September 30, 2006 consisted of increased cost of sales ($6.4 million), increased depreciation, depletion and amortization ($4.6 million) and increased miscellaneous other costs ($0.2 million). The increase in cost of sales resulted from an increase in cash costs ($2.4 million), increased purchased coal expense ($7.0 million), partially offset by a $3.0 million period-over-period decrease in inventory charges to expense related to a higher ratio of tons produced vs. tons sold in the three months ended September 30, 2007 compared to the prior year period.
The $2.4 million period-over-period increase in cash costs referred to above were primarily due to increases in the following areas: (a) labor and fringe benefits ($1.5 million); (b) transportation and loading costs ($0.9 million); (c) royalty expenses ($0.4 million); (d) other miscellaneous costs ($0.3 million); partially offset by (e) lower supply and service costs primarily consisting of contract labor expenses, repairs and maintenance costs, operating supplies, utility and fuel costs ($0.7 million). Cost of coal sales per ton was unchanged period-over-period.
The $4.6 million increase in depreciation, depletion and amortization consisted of: (a) higher depreciation of $1.8 million related to increased capital expenditures during the prior twelve months; (b) higher depletion of $0.4 million related to increased production period-over-period; and (c) a reduced credit to expense for amortization of coal supply agreements of $2.4 million as shipments on a number of coal supply agreements valued in purchase accounting were completed.
Other—Includes the Company’s Illinois Basin operation, the idled Wabash mine, which ceased operations in the second quarter of 2007; expenses associated with closed mines; its coal trading operations and selling, general and administrative expenses not charged out to the Powder River Basin, Northern Appalachia or Central Appalachia mines. During the three months ended September 30, 2007, the Other segment reported a loss from operations of $22.7 million compared to a loss from operations of $16.8 million in the three months ended September 30, 2006. The increased period-over-period loss from operations of $5.9 million was primarily due to employee and contract termination costs incurred as a result of the idling of the Wabash mine and higher selling, general and administrative expenses.
25
Interest Expense, Net
| | | | | | | | | | | | | | | |
| | | Three Months Ended
September 30, | | | Increase (Decrease) | |
| | | 2007 | | | 2006 | | | Amount | | | Percent | |
| | | (Unaudited, in thousands) | |
Interest expense-debt related | | $ | (10,798 | ) | | $ | (10,941 | ) | | $ | (143 | ) | | (1 | )% |
Interest expense-amortization of deferred financing costs | | | (464 | ) | | | (9,657 | ) | | | (9,193 | ) | | (95 | )% |
Interest expense-surety bond and letter of credit fees | | | (1,561 | ) | | | (1,872 | ) | | | (311 | ) | | (17 | )% |
Interest expense-other | | | (566 | ) | | | (588 | ) | | | (22 | ) | | (4 | )% |
| | | | | | | | | | | | | | | |
Total interest expense | | | (13,389 | ) | | | (23,058 | ) | | | (9,669 | ) | | (42 | )% |
Interest income | | | 1,056 | | | | 958 | | | | 98 | | | 10 | % |
| | | | | | | | | | | | | | | |
Interest expense, net | | $ | (12,333 | ) | | $ | (22,100 | ) | | $ | (9,767 | ) | | (44 | )% |
| | | | | | | | | | | | | | | |
Interest expense, net for the three months ended September 30, 2007, was lower than the three months ended September 30, 2006 due primarily to lower surety bond and letter of credit fees and decreased amortization of deferred financing costs. The reduction in surety bond and letter of credit fees was primarily attributable to fewer letters of credit outstanding. Interest expense-amortization of deferred financing costs in the three months ended September 30, 2006 includes a $9.2 million write-off of unamortized deferred financing costs recorded as a result of the Company’s amendment to its debt agreement in July 2006. There was no comparable write-off in 2007. The remaining reduction in the amortization of deferred financing cost period-over-period was caused by the lower deferred financing asset balance being amortized due to the write-off.
Income Tax Benefit
| | | | | | | | | | | | |
| | | Three Months Ended September 30, | | Increase | |
| | | 2007 | | 2006 | | Amount | | Percent | |
| | | (Unaudited, in thousands) | |
Income tax benefit | | $ | 6,212 | | $ | 1,963 | | $ | 4,249 | | 216 | % |
For the three months ended September 30, 2007, the $6.2 million income tax benefit represents a quarterly effective tax benefit of 144% that is based on a projected full-year effective tax benefit of 47%. The most significant reason for the increase in the projected tax benefit for 2007 relates to the decrease in the Company’s revised 2007 pretax income forecast due to the decrease in production at the Company’s Emerald mine, which increased the impact of the permanent differences for excess depletion deductions on the effective tax rate. The percentage impact of these permanent differences changes during interim periods as the Company reconsiders its forecast of full-year pretax income based upon its most recent experience.
The third quarter effective tax rate includes a change in estimate, reducing income tax expense from the effective rate recognized in the second quarter. The change in estimate primarily relates to: (a) third quarter revisions to projected full-year pre-tax earnings; (b) third quarter revisions to the estimated percentage impact of permanent differences related to excess depletion deductions (as discussed above); and (c) re-estimation of the valuation allowance needed for projected increases in net deferred tax assets during 2007. These changes in estimates were reflected in the effective tax rate in the period in which the information became available to the Company.
Results of Operations
Nine Months Ended September 30, 2007 Compared to Nine Months Ended September 30, 2006
Coal sales realization per ton sold represents the average revenue realized on each ton of coal sold. It is calculated by dividing coal sales revenues by tons sold.
26
Revenues
| | | | | | | | | | | | | |
| | | Nine Months Ended
September 30, | | Increase (Decrease) | |
| | | 2007 | | 2006 | | Amount | | | Percent | |
| | | (Unaudited, in thousands, except per ton data) | |
Coal sales | | $ | 1,096,787 | | $ | 1,094,272 | | $ | 2,515 | | | | - |
Other revenue | | | 25,674 | | | 22,260 | | | 3,414 | | | 15 | % |
| | | | | | | | | | | | | |
Total revenues | | $ | 1,122,461 | | $ | 1,116,532 | | $ | 5,929 | | | 1 | % |
| | | | | | | | | | | | | |
Tons sold | | | 55,528 | | | 55,603 | | | (75 | ) | | | - |
Coal sales realization per ton sold | | $ | 19.75 | | $ | 19.68 | | $ | 0.07 | | | | - |
Coal sales revenues for the nine months ended September 30, 2007 increased by $2.5 million compared to coal sales revenues for the nine months ended September 30, 2006. Tons sold and average coal sales realization per ton were unchanged period-over-period. The consolidated weighted-average sales realization per ton for the nine months ended September 30, 2007 reflected a higher proportion of lower value Powder River Basin shipments compared to the same period in 2006.
Coal sales revenues in Northern Appalachia for the nine months ended September 30, 2007 decreased 6% compared to coal sales revenues for the nine months ended September 30, 2006 due primarily to a combination of lower coal sales volumes from lower tons shipped, lower base revenue and lower coal quality premium/penalty revenue. Coal sales revenue realization per ton sold in Northern Appalachia increased 2% period-over-period due to 5% higher base revenue realization per ton, offset by lower coal quality premium/penalty revenue. Coal sales volumes in Northern Appalachia decreased by 0.8 million tons (8%) period-over-period primarily as a result of decreased production and shipments from the Cumberland mine due to the nine day strike by the UMWA that began shortly after the wage agreement expired on April 1, 2007 and the scheduled longwall move that took place in the second quarter of 2007, inclusive of receiving an unanticipated regulatory ruling that delayed the restart of longwall production subsequent to the completion of the move. Tons sold at the Cumberland mine decreased 7% in the nine months ended September 30, 2007 compared to the prior year period. Emerald production and shipments were lower in 2007 compared to 2006 due to the nine day strike by the UMWA and geological challenges encountered in the third quarter which hindered mining activities and slowed production. Tons sold at the Emerald mine decreased 9% in the nine months ended September 30, 2007 compared to the prior year period.
Coal sales revenues in Central Appalachia for the nine months ended September 30, 2007 increased 1% compared to coal sales revenues for the nine months ended September 30, 2006 primarily as a result of higher base revenues that were partially offset by lower coal quality premium/penalty revenues. Coal sales revenue realization per ton sold increased 4% period-over-period as a result of higher base revenue and lower coal quality premium/penalty revenue per ton. Coal sales volumes declined by 3% (0.2 million tons) primarily from decreased tons that were purchased and resold. Coal sales volumes in Central Appalachia decreased at all mining operations except for the Pax surface mine and from Laurel Creek’s underground mines. Production in Central Appalachia was adversely impacted by reduced mining activities at the Rockspring mine in June 2007 to address regulatory issues related to new standards established for underground seals.
Coal sales revenues in the Powder River Basin for the nine months ended September 30, 2007 increased by 13% compared to coal sales revenues for the nine months ended September 30, 2006. Coal sales revenue realization per ton sold increased 9% due to a combination of the increase in tons sold and higher base revenue, partially offset by lower coal quality premium/penalty revenue. Coal sales realization per ton increased over the comparable period in 2006 due to increased shipments under higher priced 2007 contracts. Coal sales volumes in the Powder River Basin increased by 1.5 million tons (4%) to a record nine month shipment level of 38.8 million tons primarily due to a 13% increase in both production and shipments from the Belle Ayr mine, offset partially by 4% lower period-over-period production and shipments at the Eagle Butte mine.
Coal sales revenues in the Illinois Basin for the nine months ended September 30, 2007 decreased substantially compared to the coal sales revenues for the nine months ended September 30, 2006 due to the April 4, 2007 idling of the Wabash mine in southern Illinois.
Other revenues for the nine months ended September 30, 2007 increased by $3.4 million (15%) compared to the nine months ended September 30, 2006. The increase was due to: (a) increased gains on the sale of assets ($3.6 million); (b) higher coalbed methane sales ($0.6 million); (c) increased miscellaneous other revenues ($3.7 million); partially offset by (d) lower synfuel fees ($1.3 million); (e) lower transloading and plant processing fees ($1.6 million); (f) decreased royalty revenues ($1.0 million); and (g) decreased revenues from the sale of equipment and filters by Dry Systems Technologies ($0.6 million).
27
Costs and Expenses
| | | | | | | | | | | | | | |
| | | Nine Months Ended
September 30, | | | Increase (Decrease) | |
| | | 2007 | | | 2006 | | | Amount | | Percent | |
| | | (Unaudited, in thousands) | |
Cost of coal sales (excludes depreciation, depletion and amortization) | | $ | 855,160 | | | $ | 835,890 | | | $ | 19,270 | | 2 | % |
Selling, general and administrative expenses (excludes depreciation, depletion and amortization) | | | 45,053 | | | | 38,025 | | | | 7,028 | | 18 | % |
Accretion on asset retirement obligations | | | 7,492 | | | | 6,327 | | | | 1,165 | | 18 | % |
Depreciation, depletion and amortization | | | 151,412 | | | | 137,678 | | | | 13,734 | | 10 | % |
Amortization of coal supply agreements | | | (3,441 | ) | | | (11,773 | ) | | | 8,332 | | 71 | % |
Employee and contract termination costs | | | 14,297 | | | | - | | | | 14,297 | | N/A | (1) |
| | | | | | | | | | | | | | |
Total costs and expenses | | $ | 1,069,973 | | | $ | 1,006,147 | | | $ | 63,826 | | 6 | % |
| | | | | | | | | | | | | | |
(1) | Amounts are not measurable as no such costs were incurred during the nine months ended September 30, 2006. |
Cost of coal sales.Cost of coal sales increased $19.3 million for the nine months ended September 30, 2007 compared to the nine months ended September 30, 2006, primarily due to: (a) increases in labor and benefit costs as a result of both compensation increases and hiring of additional personnel ($16.3 million); (b) increases in property taxes and coal production and severance taxes ($7.5 million); (c) higher repair and maintenance, supplies, outside services and operating supply costs ($14.5 million); (d) higher longwall move expense ($1.5 million); (e) increased other miscellaneous expenses ($0.5 million); partially offset by (f) decreases in purchased coal costs as a result of lower purchased coal volumes ($10.4 million); (g) a period-over-period decrease in inventory charges to expense related to an overall higher ratio of tons produced vs. tons sold in the nine months ended September 30, 2007 compared to the prior year period ($5.3 million); (h) decreased contract mining costs ($2.4 million); and (i) decreased royalty expenses ($2.9 million). Cost of coal sales per ton was $15.40 for the nine months ended September 30, 2007 compared to $15.03 per ton for the nine months ended September 30, 2006.
Selling, general and administrative expenses.Selling, general and administrative expenses for the nine months ended September 30, 2007 were $45.1 million compared to $38.0 million for the nine months ended September 30, 2006. Period-over-period increases were due to: (a) higher expenses incurred for employee compensation and benefit related expenses ($5.7 million); (b) higher consulting fees primarily related to implementation activities for our enterprise software that do not qualify as capital expenditures ($2.9 million); partially offset by (c) lower miscellaneous overhead expenses including legal and insurance expenses ($1.5 million).
Accretion on asset retirement obligations.Accretion on asset retirement obligations is a component of accounting for asset retirement obligations under SFAS No. 143,Accounting for Asset Retirement Obligations. Accretion represents the increase in the asset retirement liability to reflect the change in the liability for the passage of time because the initial liability is recorded at present value. Higher accretion expense in 2007 was due to increased asset retirement obligation estimates at closed mines.
Depreciation, depletion and amortization.Depreciation, depletion and amortization includes depreciation of plant and equipment, cost depletion of amounts assigned to owned and leased mineral rights, amortization of mine development costs, internal use software and leasehold improvements. Depreciation, depletion and amortization expense increased $13.7 million for the nine months ended September 30, 2007 compared to the nine months ended September 30, 2006, primarily due to increased cost depletion and higher depreciation and amortization. Cost depletion increased by $1.0 million due to increased production period-over-period. Depreciation and amortization increased by $12.7 million in the first nine months of 2007 mainly due to capital additions to plant and equipment during the twelve months ended September 30, 2007 and the depreciation of the recently placed in service ERP software, which began depreciation at the beginning of the second quarter of 2007.
Coal supply agreement amortization.Application of purchase accounting in 2004 resulted in the recognition of a significant liability for below market priced coal supply agreements as well as a significant asset for above market priced coal supply agreements, both in relation to market prices at the date of acquisition of mining assets by the Company in 2004. Coal supply agreement amortization decreased $8.3 million for the nine months ended September 30, 2007 compared to the nine months ended September 30, 2006. Amortization of the liability for below market priced coal supply agreements during the nine months ended September 30, 2007 was $11.4 million of credit to expense compared to $27.0 million of credit to expense in the comparable period
28
of the prior year. Amortization of the asset for above market priced coal supply agreements during the nine months ended September 30, 2007 was $7.9 million of expense compared to $15.2 million of expense in the comparable period of the prior year. As shipments on coal supply agreements valued in purchase accounting are completed, the period-over-period impact of the amortization on both the asset and liability balances will continue to diminish until approximately 2010 when shipments associated with these coal supply agreements are estimated to be complete.
Employee and contract termination costs.As discussed below in the section entitled “Wage Negotiations with the UMWA and Idling of the Company’s Illinois Basin Mining Operation,” the UMWA wage agreement for Wabash expired at 11:59 p.m. on March 31, 2007. The Company would not sign a new agreement for Wabash and the hourly workforce continued to work without a formal agreement of the parties under the terms of the expired wage agreement until 12:01 a.m. on April 4, 2007 at which time the UMWA represented hourly workforces struck. On the same day, Wabash announced the idling of the mine in southern Illinois. As a result of the Wabash mine idling, the Company recognized employee termination costs of $5.9 million and $1.4 million in accordance with the provisions of SFAS No. 146 and the provisions of SFAS No. 112, respectively. During the nine months ended September 30, 2007, the Company also recognized $1.8 million of direct and incremental costs related to additional benefit claims for certain severed employees. These employee termination costs are included inEmployee and contract termination costs in the Consolidated Statement of Operations and Comprehensive Income for the nine month period ended September 30, 2007.
Wabash was the seller under two coal supply agreements supplied from the Wabash mine with Duke Energy Indiana, Inc. Wabash continued to ship coal under the coal supply agreements through April 3, 2007, just prior to the mine idling. Each agreement contained force majeure language excusing the seller from supplying coal in the event of a work stoppage. On April 3, 2007, Wabash and Duke Energy Indiana, Inc. executed a Termination Agreement and Mutual Release buying-out, subject to certain conditions, all obligations under their two contracts in exchange for a cash payment of $5.7 million which was paid by the Company on April 5, 2007. The Company believes there will be no further obligations of Wabash under these two contracts. As a result, the Company recognized $5.2 million of net contract termination costs in accordance with the provisions of SFAS No. 146. These costs are included inEmployee and contract termination costs in the Consolidated Statement of Operations and Comprehensive Income for the nine month period ended September 30, 2007.
29
Segment Analysis
Utilizing data published by Argus Media, the following graph sets forth representative steam coal prices in various U.S. markets summarized for the monthly periods from January through September. The prices are not necessarily representative of the coal prices actually obtained by the Company. Changes in coal prices have an impact over time on the Company’s average sales realization per ton and, ultimately, its consolidated financial results.
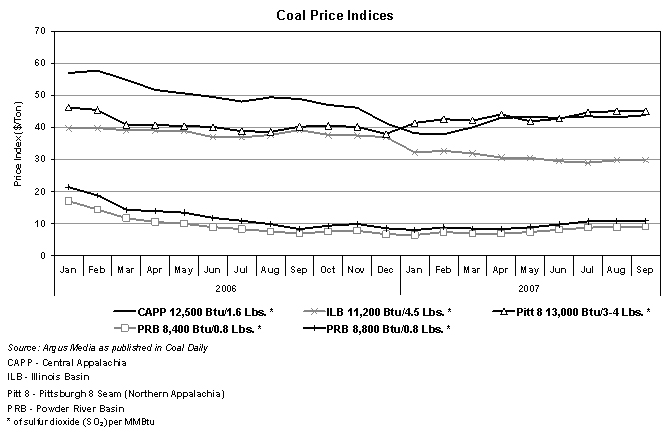
30
| | | | | | | | | | | | | |
| | | Nine Months Ended
September 30, | | Increase (Decrease) | |
| | | 2007 | | 2006 | | Tons/$ | | | Percent | |
| | | (Unaudited, in thousands, except sales
realization per ton) | |
Powder River Basin | | | | | | | | | | | | | |
Tons sold | | | 38,783 | | | 37,318 | | | 1,465 | | | 4 | % |
Average sales realization per ton | | $ | 9.14 | | $ | 8.42 | | $ | 0.72 | | | 9 | % |
Total revenues | | $ | 355,588 | | $ | 315,474 | | $ | 40,114 | | | 13 | % |
Income from operations | | $ | 60,667 | | $ | 32,137 | | $ | 28,530 | | | 89 | % |
| | | | |
Northern Appalachia | | | | | | | | | | | | | |
Tons sold | | | 9,792 | | | 10,613 | | | (821 | ) | | (8 | )% |
Average sales realization per ton | | $ | 39.72 | | $ | 39.05 | | $ | 0.67 | | | 2 | % |
Total revenues | | $ | 395,579 | | $ | 418,683 | | $ | (23,104 | ) | | (6 | )% |
Income from operations | | $ | 62,995 | | $ | 120,425 | | $ | (57,430 | ) | | (48 | )% |
| | | | |
Central Appalachia | | | | | | | | | | | | | |
Tons sold | | | 6,463 | | | 6,663 | | | (200 | ) | | (3 | )% |
Average sales realization per ton | | $ | 52.24 | | $ | 50.00 | | $ | 2.24 | | | 4 | % |
Total revenues | | $ | 347,185 | | $ | 342,026 | | $ | 5,159 | | | 2 | % |
Income from operations | | $ | 3,043 | | $ | 15,445 | | $ | (12,402 | ) | | (80 | )% |
Powder River Basin—Income from operations increased $28.5 million period-over-period due to increased revenues of $40.1 million, partially offset by increased production costs of $11.6. As explained in the revenue section above, the increased revenues resulted from a 4% increase in tons sold from the previous year shipments and a 9% increase in average sales realization per ton. Assuming acceptable market conditions exist, we expect future increases in tons sold at the Belle Ayr mine primarily due to the expansion of its annual capacity. Production costs increased $11.6 million for the nine months ended September 30, 2007 compared to the nine months ended September 30, 2006, reflecting higher period-over-period cost of sales of $16.6 million, an increase in other miscellaneous expenses of $1.0 million, partially offset by lower depreciation, depletion and amortization costs of $6.0 million.
The $16.6 million increase in cost of sales referred to above resulted from an increase in cash costs ($16.5 million) and increased miscellaneous other expenses ($0.1 million). The $16.5 million period-over-period increase in the cash costs were primarily in the following areas: (a) excise taxes and coal production taxes, which respond to changes in coal sales revenues ($8.2 million); (b) supply and service costs primarily consisting of operating supply costs, explosives, diesel fuel and outside services ($7.1 million); (c) labor and employee benefits ($2.7 million); (d) insurance ($0.4 million); (e) rental expense ($1.1 million); and (f) miscellaneous expenses ($0.7 million), partially offset by (g) reduced royalty costs due to mining a higher proportion of coal owned in fee ($3.7 million).
Lower total depreciation, depletion and amortization costs of $6.0 million related primarily to a period-over-period $7.5 million reduction in the charge for the amortization of coal supply agreements, as shipments on a number of coal supply agreements valued in purchase accounting were completed, partially offset by higher depreciation and depletion of $1.5 million as a result of higher capital expenditures during the prior twelve months and increased production period-over-period. Also contributing to the higher depreciation expense was the completion of an overland conveyor belt that was placed into service during the three months ended September 30, 2007. Cost of coal sales per ton increased 3% period-over-period.
Northern Appalachia—Income from operations decreased by $57.4 million period-over-period due to decreased revenues of $23.1 million and increased production costs of $34.3 million. As explained in the revenue section above, the decreased revenues resulted from an 8% period-over-period decrease in tons sold, partially offset by a 2% increase in average sales realization per ton. Income from operations and coal sales volumes decreased primarily as a result of decreased production and shipments from the Cumberland mine due to the nine day strike by the UMWA that began shortly after the wage agreement expired on April 1, 2007 and the scheduled longwall move that took place in the second quarter of 2007 inclusive of receiving an unanticipated regulatory ruling that delayed the restart of longwall production subsequent to the completion of the move. Emerald production and shipments were lower in the 2007 period due to the nine day strike by the UMWA and geological challenges encountered during the third quarter of 2007 which hindered mining activities and slowed production. Tons sold at the Emerald mine decreased 9% in the nine months ended September 30, 2007 compared to the prior year period.
31
Total production costs increased $34.3 million for the nine months ended September 30, 2007 compared to the nine months ended September 30, 2006, reflecting higher period-over-period cost of sales of $22.0 million, higher depreciation, depletion and amortization costs of $11.6 million and higher miscellaneous other costs of $0.7 million.
The $22.0 million period-over-period increase in cost of sales referred to above was the result of increased cash costs $24.9 million, partially offset by lower miscellaneous other costs ($0.8 million) and decreased inventory charges to expense related to a higher ratio of tons produced vs. tons sold in the nine months ended September 30, 2007 compared to the prior year period ($2.1 million). The $24.9 million increase in cash costs were primarily incurred in the following areas: (a) higher labor and employee benefit costs, due to a higher number of employees and period-over-period wage and benefit increases, due primarily to the new UMWA wage agreement ($17.9 million); (b) higher supply and service costs primarily consisting of operating supply costs from increased usage of roof bolts, miner bits and water handling requirements, repairs and maintenance costs due to the timing of rebuilding longwall and other mining equipment and outside services ($6.9 million); (c) higher longwall move expenses ($1.5 million); partially offset by (d) lower transportation and loading costs ($0.9 million); and (e) lower miscellaneous expenses ($0.5 million).
Higher total depreciation, depletion and amortization costs of $11.6 million related primarily to: (a) a period-over-period reduction in the credit associated with the amortization of coal supply agreements as shipments on a number of coal supply agreements valued in purchase accounting were completed ($7.2 million); (b) increased depreciation primarily related to the batch weigh system, longwall shields, face conveyors and other mining equipment ($5.3 million); and (c) lower depletion expense ($0.9 million). Cost of coal sales per ton increased by 18% period-over-period principally reflecting the effect of the UMWA strike and difficult geological conditions described above.
Central Appalachia—Income from operations decreased by $12.4 million period-over-period due to a combination of increased revenues of $5.2 million and increased production costs of $17.6 million. As explained in the revenue section above, the increase in revenues resulted from a 4% increase in average sales realization per ton, partially offset by a 3% period-over-period decrease in tons sold. Total coal sales revenues for the nine months ended September 30, 2007 increased 1% period-over-period from the nine months ended September 30, 2006 as a result of 5% higher base revenue realization per ton partially offset by 11% lower coal quality premium/penalty revenue per ton. Coal sales volumes in Central Appalachia decreased by 0.2 million tons (3%) period-over-period primarily from decreased shipments from all West Virginia mining operations except for the Pax surface mine and from Laurel Creek’s underground mines. Production in Central Appalachia remained consistent period-over-period.
The increase in production costs of $17.6 million for the nine months ended September 30, 2007 compared to the nine months ended September 30, 2006 consisted of increased cost of sales ($0.4 million), higher depreciation, depletion and amortization ($16.5 million) and increased miscellaneous other costs ($0.7 million). The increase in cost of sales was a result of increased cash costs ($13.5 million), partially offset by a reduction in purchased coal expense ($7.7 million), decreased miscellaneous other expenses ($2.1 million) and a period-over-period decrease in inventory charges to expense related to a higher ratio of tons produced vs. tons sold in the nine months ended September 30, 2007 compared to the prior year period ($3.3 million).
The $13.5 million period-over-period increase in cash costs referred to above were primarily due to increases in the following areas: (a) labor and fringe benefits ($5.7 million); (b) supply and service costs primarily consisting of repairs and maintenance costs, operating supplies, utility, explosives, fuel costs and outside services ($5.8 million); (c) higher royalty expense ($1.1 million); (d) higher transportation and loading costs ($1.9 million); (e) higher property taxes ($0.9 million) and (f) higher insurance and other miscellaneous costs ($0.5 million); partially offset by (g) lower contract mining costs ($2.4 million). Cost of coal sales per ton increased approximately 3% period-over-period.
The $16.5 million increase in depreciation, depletion and amortization consisted of: (a) higher depreciation of $6.2 million; (b) higher depletion of $1.4 million; and (c) a reduced credit to expense for amortization of coal supply agreements of $8.9 million as shipments on a number of coal supply agreements valued in purchase accounting were completed.
32
Other—Includes the Company’s Illinois Basin operation, the idled Wabash mine, which ceased operations in the second quarter of 2007; expenses associated with closed mines; its coal trading operations and selling, general and administrative expenses not charged out to the Powder River Basin, Northern Appalachia or Central Appalachia mines. During the nine months ended September 30, 2007, the Other segment reported a loss from operations of $74.2 million compared to a loss from operations of $57.6 million in the nine months ended September 30, 2006. The increased period-over-period loss from operations of $16.6 million was primarily due to employee and contract termination costs incurred as a result of the idling of the Wabash mine and higher selling, general and administrative expenses.
Interest Expense, Net
| | | | | | | | | | | | | | | |
| | | Nine Months Ended
September 30, | | | Increase (Decrease) | |
| | | 2007 | | | 2006 | | | Amount | | | Percent | |
| | | (Unaudited, in thousands) | |
Interest expense-debt related | | $ | (32,363 | ) | | $ | (32,583 | ) | | $ | (220 | ) | | (1 | )% |
Interest expense-amortization of deferred financing costs | | | (1,382 | ) | | | (11,091 | ) | | | (9,709 | ) | | (88 | )% |
Interest expense-surety bond and letter of credit fees | | | (4,338 | ) | | | (5,209 | ) | | | (871 | ) | | (17 | )% |
Interest expense-other | | | (1,565 | ) | | | (1,823 | ) | | | (258 | ) | | (14 | )% |
| | | | | | | | | | | | | | | |
Total interest expense | | | (39,648 | ) | | | (50,706 | ) | | | (11,058 | ) | | (22 | )% |
Interest income | | | 2,574 | | | | 2,184 | | | | 390 | | | 18 | % |
| | | | | | | | | | | | | | | |
Interest expense, net | | $ | (37,074 | ) | | $ | (48,522 | ) | | $ | (11,448 | ) | | (24 | )% |
| | | | | | | | | | | | | | | |
Interest expense, net for the nine months ended September 30, 2007 was lower than the nine months ended September 30, 2006 due primarily to lower surety bond and letter of credit fees and decreased amortization of deferred financing costs. The reduction in surety bond and letter of credit fees was primarily attributable to fewer letters of credit outstanding. Interest expense-amortization of deferred financing costs in the nine months ended September 30, 2006 includes a $9.2 million write-off of unamortized deferred financing costs recorded as a result of the Company’s amendment to its debt agreement in July 2006. There was no comparable write-off in 2007. The remaining reduction in the amortization of deferred financing cost period-over-period was caused by the lower deferred financing asset balance being amortized due to the write-off.
Income Tax Benefit (Expense)
| | | | | | | | | | | | | |
| | | Nine Months Ended
September 30, | | | Income Tax Benefit
Increase (Decrease) | |
| | | 2007 | | 2006 | | | Amount | | Percent | |
| | | (Unaudited, in thousands) | |
Income tax benefit (expense) | | $ | 7,260 | | $ | (8,417 | ) | | $ | 15,677 | | 186 | % |
For the nine months ended September 30, 2007, the $7.3 million income tax benefit represents a projected full-year effective benefit of 47%. The most significant reason for the increase in projected tax benefit for 2007 relates to the decrease in the Company’s revised 2007 pretax income forecast due to the decrease in production at the Company’s Emerald mine, which increased the impact of the permanent differences for excess depletion deductions on the effective tax rate. The percentage impact of these permanent differences changes during interim periods, as the Company reconsiders its forecast of full-year pretax income, based upon its most recent experience.
The effective tax rate includes a change in estimate, reducing income tax expense from the effective rate recognized in the second quarter. The change in estimate primarily relates to: (a) third quarter revisions to projected full-year pre-tax earnings; (b) third quarter revisions to the estimated percentage impact of permanent differences related to excess depletion deductions (as discussed above); and (c) re-estimation of the valuation allowance needed for projected increases in net deferred tax assets during 2007. These changes in estimates were reflected in the effective tax rate in the period in which the information became available to the Company.
Expected Coal Production
As of October 16, 2007, we had sales commitments for 100% of our planned 2007 production. As of October 16, 2007, uncommitted and unpriced tonnage was 7%, 34% and 67% of planned production in 2008, 2009 and 2010, respectively. Eastern coals account for the majority of uncommitted tonnage as 13%, 58% and 90% of the Company’s planned eastern production remains uncommitted and unpriced in 2008, 2009 and 2010, respectively.
33
In 2007 through 2010, Foundation Coal expects coal production within the following ranges (millions of tons):
| | | | | | | | |
| | | 2007 | | 2008 | | 2009 | | 2010 |
East | | 20.2-20.6 | | 19.5-21.5 | | 19.5-21.5 | | 19.5-21.5 |
West | | 51.0-52.0 | | 50.0-53.0 | | 52.0-56.0 | | 52.0-56.0 |
Total Consolidated | | 71.2-72.6 | | 69.5-74.5 | | 71.5-77.5 | | 71.5-77.5 |
Based on its committed and priced planned production as of October 16, 2007, the Company expects its committed and priced production from its Eastern mines, encompassing Northern Appalachia and Central Appalachia, to realize in the range of $44.00 to $45.00 per ton in 2007. The Company also expects its committed and priced production from the Powder River Basin to realize in the range of $9.10 to $9.30 per ton in 2007. These ranges of expected per ton average realizations include forecast sulfur dioxide and btu premiums based on contract terms, projected coal qualities and historical realized premiums.
Liquidity and Capital Resources
Our primary sources of cash have been from sales of our coal production and, to a much lesser extent, purchased coal to customers, cash from sales of non-core assets and miscellaneous revenues.
Our primary uses of cash have been our cash costs of coal production, capital expenditures, interest costs, cash payments for employee benefit obligations such as defined benefit pensions and retiree health care benefits, cash outlays related to post mining asset retirement obligations and support of working capital requirements such as coal inventories and trade accounts payable. Our ability to service debt and acquire new productive assets for use in our operations has been and will be dependent upon our ability to generate cash from our operations. We generally fund all of our capital expenditure requirements with cash generated from operations. Historically, we have engaged in minimal financing of assets such as through operating leases.
The following is a summary of cash provided by or used in each of the indicated categories of activities during the nine months ended September 30, 2007 and 2006, respectively.
| | | | | | | | |
| | | Nine Months Ended
September 30, | |
| | | 2007 | | | 2006 | |
| | | (Unaudited, in thousands) | |
Cash provided by (used in): | | | | | | | | |
Operating activities | | $ | 174,662 | | | $ | 158,003 | |
Investing activities (primarily capital expenditures) | | | (114,533 | ) | | | (132,639 | ) |
Financing activities-stock option exercise proceeds and excess tax benefit from stock-based awards | | | 5,925 | | | | 18,151 | |
Financing activities-proceeds from interest rate swaps termination | | | - | | | | 2,259 | |
Financing activities-dividends on common stock | | | (6,779 | ) | | | (6,817 | ) |
Financing activities-deferred financing costs | | | - | | | | (4,443 | ) |
Financing activities-common stock repurchases | | | (23,424 | ) | | | (11,889 | ) |
Financing activities-other | | | (99 | ) | | | - | |
| | | | | | | | |
Net increase in cash and cash equivalents | | $ | 35,752 | | | $ | 22,625 | |
| | | | | | | | |
Cash provided by operating activities increased $16.7 million for the nine months ended September 30, 2007 compared to the nine months ended September 30, 2006, primarily due to: (a) a $42.2 million increase in cash flow from working capital changes; (b) a $12.4 million increase in cash flow from a net increase in the depreciation, depletion and amortization non-cash add back; partially offset by (c) a $30.7 million decrease in net income period-over-period; and (d) a $8.7 million cash flow decrease from a change in deferred income tax liabilities. Working capital changes consisted primarily of a $17.1 million cash flow increase from a change in trade accounts receivable, a $13.9 million cash flow increase from a change in prepaid expenses, and a $14.7 million cash flow increase from a change in trade payables and accrued liabilities.
34
Cash used in investing activities decreased $18.1 million in the nine months ended September 30, 2007 compared to the nine months ended September 30, 2006, primarily due to: (a) a $13.6 million decrease in capital expenditures and mine asset acquisitions; and (b) a $4.5 million increase in asset sales proceeds. Capital expenditures in the nine months ended September 30, 2007 totaled $120.8 million which included $43.8 million for the following projects: (a) an overland coal conveyor at the Belle Ayr Mine in the Powder River Basin; (b) the acquisition of longwall components and upgrades to the rail loading facility at Emerald; and (c) the acquisition and implementation of company wide ERP software. Capital expenditures and mine asset acquisitions in the nine months ended September 30, 2006 totaled $134.4 million which included a $14.6 million acquisition of mining assets in Central Appalachia and $55.2 million of expenditures related to the following projects: (a) an overland coal conveyor at the Belle Ayr Mine in the Powder River Basin; (b) equipment for and development of the Pax surface mine and related rail loading facility in Central Appalachia; (c) upgrades to the rail loading facility at Emerald; (d) initial phases of construction of a new slope, overland coal conveyor and related coal handling facilities at the Wabash mine in Illinois; and (e) the acquisition and implementation of company wide ERP software.
Cash used in financing activities increased $21.6 million in the nine months ended September 30, 2007 from $2.7 million in the nine month period ended September 30, 2006, primarily due to: (a) an $11.5 million increase related to the repurchase of common shares; (b) an $8.0 million decrease related to the excess income tax benefit from issuance of stock-based awards related to fewer exercises of nonqualified stock options year-over-year; and (c) a $4.3 million decrease in proceeds from issuance of common stock related to fewer exercises of nonqualified stock options year-over-year. Cash used in financing activities of $24.4 million during the nine months ended September 30, 2007 consisted of $23.4 million related to the repurchase of common shares in accordance with the stock repurchase program initiated by the Company during the third quarter of 2006, payment of quarterly cash dividends of $6.8 million ($0.05 per share paid in March, June and September 2007) and $0.1 million paid for the retirement of 2,343 shares of stock that were withheld to satisfy the minimum statutory tax withholding on vested restricted stock units; all partially offset by $3.2 million in cash proceeds from exercise of nonqualified stock options and $2.7 million in excess income tax benefit from issuance of stock-based awards. Cash used in financing activities of $2.7 million during the nine months ended September 30, 2006 consisted of $11.9 million related to the repurchase of common shares in accordance with the stock repurchase program initiated by the Company during the third quarter of 2006; and payment of quarterly cash dividends of $6.8 million ($0.05 per share paid in March, June and September 2006); partially offset by $7.5 million in cash proceeds from exercise of nonqualified stock options and $10.7 million in excess income tax benefit from issuance of stock-based awards.
Our primary source of liquidity will continue to be cash from sales of our coal production and purchased coal to customers. We have borrowing availability under our revolving credit facility, subject to certain conditions.
Based on our current levels of operations, we believe that remaining cash on hand, cash flow from operations and available borrowings under the revolving credit portion of our Senior Secured Credit Facility will enable us to meet our working capital, capital expenditure, debt service and other funding requirements for at least the next twelve months.
As of September 30, 2007, we have outstanding $626.6 million in aggregate indebtedness, with an additional $328.7 million of available borrowings under our revolving credit facility after giving effect to $171.3 million of letters of credit outstanding as of September 30, 2007. Our liquidity requirements will be significant due to debt service requirements and projected capital expenditures.
Interest Rate Swaps
On September 30, 2004, the Company entered into pay-fixed, receive-variable interest rate swap agreements on a notional amount of $85.0 million. These swap agreements essentially converted $85.0 million of the Company’s variable rate borrowings under the then existing facility to fixed rate borrowings for a three year period that began on September 30, 2004. The maturity date on the swap agreements was September 28, 2007. The Company designated these interest rate swaps as cash flow hedges of the variable interest payments and recorded the quarterly changes in the fair value of the instruments inOther noncurrent assets with an offsetting unrealized gain, net of tax expense, inAccumulated other comprehensive loss.
In connection with the July 7, 2006 closing of the amended and restated Senior Secured Credit Facility, the Company terminated the swap agreements. On the date the Company made the decision to terminate the interest rate swaps the interest rate swaps no longer qualified for cash flow hedge accounting treatment and accordingly, any change in the market value of the interest rate swaps affects net income. On July 11, 2006, the Company monetized the $2.4 million derivative asset included inOther noncurrent assets in the Company’s consolidated financial statements at June 30, 2006 and recognized a $0.1 million mark-to-market loss on the swaps. The $1.8 million unrealized gain from the change in the market value of the interest rate swaps recorded inAccumulated other comprehensive loss was being recognized into income on a prorated basis over the remaining term of the original interest rate swap agreement through September 28, 2007, in accordance with SFAS No. 133,Accounting for Derivative Instruments and Hedging
35
Activities, and related amendments. At December 31, 2006, the unamortized unrealized gain was $1.1 million, which was fully offset againstInterest expense during the nine months ended September 30, 2007.
Other
As a regular part of our business, we review opportunities for, and engage in discussions and negotiations concerning, the acquisition of coal mining assets, including Lease by Application (“LBA”) bids, and acquisitions of, or combinations with, coal mining companies. When we believe that these opportunities are consistent with our growth plans and our acquisition criteria, we will make bids or proposals and/or enter into letters of intent and other similar agreements, which may be binding or nonbinding, that are customarily subject to a variety of conditions and usually permit us to terminate the discussions and any related agreements if, among other things, we are not satisfied with the results of our due diligence investigation. Any acquisition opportunities we pursue could materially affect our liquidity and capital resources and may require us to incur indebtedness, seek equity capital or both. There can be no assurance that such additional indebtedness and/or equity capital will be available on terms acceptable to us, if at all.
On July 18, 2006, the Board of Directors authorized a stock repurchase program (the “Repurchase Program”), authorizing the Company to repurchase share of its common stock. The Company may repurchase its common stock from time to time as determined by authorized officers of the Company, up to an aggregate amount of $100.0 million. During the nine months ended September 30, 2007, the Company paid $23.4 million to repurchase 753,653 shares of its common stock at an average price of $31.08 under the Repurchase Program.
Covenant Compliance
Our indirect wholly-owned subsidiary, Foundation Coal Corporation (“FCC”) is required to comply with certain financial covenants which are considered material terms of the Senior Secured Credit Facility and the indenture governing FCC’s outstanding 7.25% Senior Notes. Information about the financial covenants is material to an investor’s understanding of FCC’s financial condition and liquidity. The breach of covenants in the Senior Secured Credit Facility that are tied to ratios based on Adjusted EBITDA, as defined below, could result in a default under the Senior Secured Credit Facility and the lenders could elect to declare all amounts borrowed due and payable. Any such acceleration would also result in a default under our indenture. Additionally, under the Senior Secured Credit Facility and indenture, FCC’s ability to engage in activities such as incurring additional indebtedness, making investments and paying dividends is also tied to ratios based on Adjusted EBITDA.
Covenants and required levels as defined by the Senior Secured Credit Facility and the indenture governing the outstanding 7.25% Senior Notes are:
| | | | | | |
| | | Period Ended December 31, 2007 Covenant Levels | | January 1, 2008 to
December 31, 2008
Covenant Levels | | January 1, 2009
and thereafter Covenant Levels |
Senior Secured Credit Facility(1) | | | | | | |
Minimum Adjusted EBITDA to cash interest ratio | | 2.5x | | 2.5x | | 2.5x |
Maximum total debt less unrestricted cash to Adjusted EBITDA ratio | |
4.0x | |
3.75x | | 3.5x |
Indenture(2) | | | | | | |
Minimum Adjusted EBITDA to fixed charge ratio required to incur additional debt pursuant to ratio provisions | | 2.0x | | 2.0x | | 2.0x |
(1) | The Senior Secured Credit Facility requires FCC to maintain an Adjusted EBITDA to cash interest ratio at a minimum of 2.5x and a total debt less unrestricted cash to Adjusted EBITDA ratio starting at a maximum of 4.25x in each case for the most recent twelve-month period. Failure to satisfy these ratio requirements would constitute a default by FCC under the Senior Secured Credit Facility. If lenders under the Senior Secured Credit Facility fail to waive any such default, repayment obligations under the Senior Secured Credit Facility could be accelerated, which would also constitute a default under the indenture. Covenants reflect the definition and levels required by the Senior Secured Credit Facility. |
(2) | The ability for FCC to incur additional debt and make certain restricted payments under our indenture, subject to specified exceptions, is tied to an Adjusted EBITDA to fixed charge ratio of at least 2.0 to 1. |
36
Adjusted EBITDA is defined as EBITDA further adjusted to exclude non-recurring items, non-cash items and other adjustments permitted in calculating covenant compliance under the indenture and the Senior Secured Credit Facility. EBITDA, a measure used by management to evaluate its ongoing operations for internal planning and forecasting purposes, is defined as net income (loss) from operations less interest expense, net of interest income, income tax expense (benefit), depreciation and amortization and charges for early extinguishment of debt. EBITDA is not a financial measure recognized under United States generally accepted accounting principles and does not purport to be an alternative to net income as a measure of operating performance or to cash flows from operating activities as a measure of liquidity. The amounts shown for EBITDA as presented, may differ from amounts calculated and may not be comparable to other similarly titled measures used by other companies.
As of September 30, 2007, FCC was in compliance with all required financial covenants of the Senior Secured Credit Facility.
Contractual Obligations
The following is a summary of our significant future contractual obligations by year as of September 30, 2007:
| | | | | | | | | | | | | | | |
| | | 2007 | | 2008-2009 | | 2010-2011 | | After 2011 | | Total |
| | | (Unaudited, in thousands) |
Long-term debt | | $ | - | | $ | 41,875 | | $ | 284,750 | | $ | 300,000 | | $ | 626,625 |
Estimated cash interest on long-term debt(1) | | | 10,378 | | | 80,313 | | | 66,887 | | | 56,188 | | | 213,766 |
Estimated cash payments for asset retirement obligations | | | 2,503 | | | 4,569 | | | 7,989 | | | 213,475 | | | 228,536 |
Unconditional purchase commitments | | | 51,383 | | | 35,362 | | | - | | | - | | | 86,745 |
Operating leases | | | 802 | | | 5,256 | | | 2,903 | | | 4,970 | | | 13,931 |
| | | | | | | | | | | | | | | |
Total | | $ | 65,066 | | $ | 167,375 | | $ | 362,529 | | $ | 574,633 | | $ | 1,169,603 |
| | | | | | | | | | | | | | | |
(1) | The variable interest rate on debt is 5.91%, reflecting a LIBOR estimate, based on the five-year swap rate effective September 28, 2007, plus a margin of 1.25%. |
We expect to use cash flows provided by operating activities to invest in the range of $175.0 million to $185.0 million in capital expenditures during calendar year 2007 of which $110.0 million to $115.0 million is to maintain production and replace mining equipment. The additional $65.0 million to $70.0 million is expected to be directed toward improvements in productivity and selective expansions of production. Approximately $27.8 million of the remaining 2007 capital expenditures are included in unconditional purchase commitments shown above. The remaining 2007 unconditional purchase commitments consist of $12.1 million for purchased coal and $11.5 million pertaining to forward contracts to purchase diesel fuel and explosives in normal quantities for use at our surface mines. We expect to contribute approximately $11.3 million to our defined benefit retirement plans and to pay approximately $21.4 million of retiree health care benefits, net of Medicare Part D subsidies, in calendar year 2007. We also expect to incur approximately $6.6 million per year for surety bond premiums and letters of credit fees. We believe that cash balances plus cash generated by operations will be sufficient to meet these obligations plus fund requirements for working capital and capital expenditures without incurring additional borrowings.
Off-Balance Sheet Arrangements
In the normal course of business, we are a party to certain off-balance sheet arrangements. These arrangements include guarantees, indemnifications and financial instruments with off-balance sheet risk, such as bank letters of credit and performance or surety bonds. Liabilities related to these arrangements are not reflected in our Consolidated Balance Sheets. However, the underlying obligations that they secure, such as asset retirement obligations, self-insured workers’ compensation liabilities, royalty obligations and certain retiree medical obligations, are reflected in our Consolidated Balance Sheets.
We are required to provide financial assurance in order to perform the post-mining reclamation required by our mining permits, pay our federal production royalties, pay workers’ compensation claims under self-insured workers’ compensation laws in the various states, pay federal black lung benefits, pay retiree health care benefits to certain retired UMWA employees and perform certain other obligations.
In order to provide the required financial assurance, we generally use surety bonds for post-mining reclamation and royalty payment obligations and bank letters of credit for self-insured workers’ compensation obligations and UMWA retiree health care obligations. Federal black lung benefits are paid from a dedicated trust fund that has sufficient assets to fund these obligations for the next several years. Bank letters of credit are also used to collateralize a portion of the surety bonds.
37
We had outstanding surety bonds with a total face amount of $275.6 million as of September 30, 2007, of which $260.6 million secured reclamation obligations, $6.2 million secured coal lease obligations and $7.1 million secured self-insured workers’ compensation obligations. In addition, we had $171.3 million of letters of credit in place for the following purposes: $36.0 million for workers’ compensation, including collateral for workers’ compensation bonds; $7.9 million for UMWA retiree health care obligations; $112.2 million for collateral for reclamation surety bonds; and $15.2 million for other miscellaneous obligations. In the last few years, the market terms under which surety bonds can be obtained have generally become less favorable to all mining companies. In the event that additional surety bonds become unavailable, we would seek to secure our obligations with letters of credit, cash deposits or other suitable forms of collateral.
Wage Negotiations with the UMWA and Idling of the Company’s Illinois Basin Mining Operation
Wage agreements between three affiliates of the Company and the UMWA expired on or shortly after March 31, 2007. Specifically, the wage agreement for Wabash expired at 11:59 p.m. on March 31, 2007 and the UMWA wage agreements with Cumberland Coal Resources, LP (“Cumberland”) and Emerald Coal Resources, LP (“Emerald”) expired at 11:59 p.m. on April 1, 2007. Negotiations between these respective subsidiaries and the UMWA commenced in early January of 2007 but intensified in late March of 2007 and continued through April 3, 2007. Emerald Coal Resources, LP and Cumberland Coal Resources, LP reiterated their willingness to sign the 2007 National Bituminous Coal Operators Association (“BCOA”) UMWA wage agreement. Wabash would not sign the BCOA agreement. The hourly workforce continued to work without a formal agreement of the parties under the terms of the expired wage agreement until 12:01 a.m. on April 4, 2007 at which time, alleging unfair labor practices by Wabash, Emerald and Cumberland, the UMWA represented hourly workforces struck the Wabash, Emerald and Cumberland mines. Subsequent to the commencement of a UMWA strike on April 4, 2007, Wabash announced the idling of the mine in southern Illinois. The mine had become economically unviable at that time as a result of a combination of factors, including aged infrastructure, softening market conditions and the prospect of a new higher cost labor contract with the UMWA.
On April 10, 2007, negotiations between the UMWA and the three subsidiaries resumed. In the early evening of April 12, 2007, it was announced that the UMWA and the three subsidiaries had reached agreement and that the workforces at Emerald and Cumberland would return to work. Wabash remained closed and the effects of the idling had been negotiated with the UMWA.
During the nine months ended September 30, 2007, as a result of the Wabash mine idling, the Company recognized employee termination costs of $5.9 million and $1.4 million in accordance with the provisions of SFAS No. 146 and the provisions of SFAS No. 112, respectively. During the three months ended September 30, 2007, employee termination costs associated with one-time benefit arrangements of $0.6 million were recognized in accordance with SFAS No. 146. Termination costs resulting from one-time benefit arrangements include medical insurance continuance costs and severance to salaried employees. During the three months ended September 30, 2007, the Company also reduced its estimate of certain previously recognized employee termination costs associated with on-going benefit arrangements in accordance with SFAS No. 112 by $0.1 million. During the three and nine months ended September 30, 2007, the Company also recognized $1.8 million of other direct and incremental costs related to additional benefit claims for certain severed employees. These employee termination costs are recorded asEmployee and contract termination costs in the Consolidated Statements of Operations and Comprehensive Income for the three and nine months ended September 30, 2007.
At March 31, 2007, Wabash was the seller under two coal supply agreements supplied from the mine with Duke Energy Indiana, Inc. Wabash continued to ship coal under the coal supply agreements through April 3, 2007, just prior to the mine idling. Each agreement contained force majeure language excusing the seller from supplying coal in the event of a work stoppage. On April 3, 2007, Wabash and Duke Energy Indiana, Inc. executed a Termination Agreement and Mutual Release buying-out, subject to certain conditions, all obligations under their two contracts in exchange for a cash settlement that the Company paid on April 5, 2007. The Company believes there will be no further obligations of Wabash under these two contracts. During the nine months ended September 30, 2007, the Company recognized $5.2 million of net contract termination costs in accordance with the provisions of SFAS No. 146. These contract termination costs are recorded asEmployee and contract termination costs in the Consolidated Statements of Operations and Comprehensive Income for the nine months ended September 30, 2007.
38
Certain Trends and Uncertainties
Our long-term outlook for the coal markets in the United States remains positive. The Energy Information Administration in its Annual Energy Outlook – 2007 forecasts that coal demand for electrical power generation will increase at an average annual growth rate of 1.4% through 2015. Strong demand for coal and coal-based electricity generation in the U. S. is being driven by the growing economy, expected weather conditions, high prices for and limited supply of alternative fuels for electricity generation, geopolitical risks for global oil and natural gas resources and the relatively abundant steam coal reserves located within the United States.
Approximately 90,000 megawatts of new coal fired electrical generation has been proposed in the United States with the largest percentages of proposed projects located in the Midwest and West. New coal fired generating plants representing capacity of roughly 600 megawatts began operating in 2006 with an additional 870 megawatts scheduled to begin operations in 2007. Another 13,000 megawatts are currently under construction and expected to begin operation by the end of 2010. Of the remaining 76,500 megawatts, proposed plants representing approximately 10,000 megawatts are moving through the permitting stage and appear to be on schedule for start-up within approximately the next five years. Proposed generating plants representing the remaining approximately 66,500 megawatts are either in the very early stages of development or are in the proposal stage.
Proposed coal fired electric generating facilities that do not include technologies to capture and store carbon dioxide are facing increasing opposition from environmental groups as well as state and local governments who are concerned with global climate change and uncertain financial impacts of potential greenhouse gas regulations. Coal fired generating plants incorporating carbon dioxide capture and storage technologies are more expensive to build than conventional pulverized coal generating plants and the technologies are still in the developmental stages. This dynamic may cause power generating companies to cut back on plans to build coal fired plants in favor of alternative forms of baseload electrical generation in the near-term. Nevertheless, the level of interest in new coal fired generating facilities remains strong. In combination with heightened interest in coal gasification and coal liquefaction, this level of interest is a strong indicator of increasing demand for coal in the United States.
Through October 24, 2007, electric power generation in the regions using coal fired power has increased by 3.1% from the same period in 2006. Season-to-date cooling degree days have increased by 1.7% from 2006’s cooling season and by 3.1% from the five-year average.
During the first quarter of 2007, the Union Pacific Railroad lifted its moratorium on shipments from the Powder River Basin to service test burns and other new business. Through September 2007, total rail shipments from the southern Powder River Basin are approximately equal to the comparable period in 2006. The railroads are forecasting to increase deliveries from the southern Powder River Basin by approximately 3% in 2007 compared to 2006. The performance of the eastern railroads tends to be more mine-specific. In particular, we are reliant on Norfolk Southern (“NS”) and CSX at our Central Appalachia operations, and on the MGA joint line between NS and CSX at our Emerald mine in Northern Appalachia.
Based on weekly production reporting through October 13, 2007 from the National Mining Association, Appalachian production trails the comparable period of 2006 by approximately 3.1% partially as a result of capacity idling due to weak market conditions prevailing in the second half of 2006 and early 2007. Coal producers in Northern Appalachia and the Powder River Basin continue to report deferrals of previously announced mine expansion projects. Through October 13, 2007, Western coal production has declined approximately 0.7% from the comparable period of the prior year. Judicial decisions in West Virginia with respect to permits to construct valley fills at surface mines are likely to slow the process of obtaining surface mining permits in West Virginia with resultant uncertainties for producers. In addition, implementation of the Mine Improvement and New Emergency Response Act of 2006 and new state mine safety statutes has placed increased regulatory burdens on the coal industry with resultant cost increases and production constraints. The combination of strong demand for coal fired electric power and production declines and uncertainties, particularly in Central Appalachia, has led to forecasts of declines in stockpiles at coal fired electric generating plants over the next year. Spot market prices for Central Appalachia and the Powder River Basin coals increased modestly during the third quarter of 2007. However, following the end of the third quarter, reported coal prices in all regions have increased more rapidly, mainly due to strong demand for U.S. coals in the metallurgical and steam export markets as well as mine production shortfalls experienced in Central and Northern Appalachia. Long-term, the delicate balance of coal supply and increasing coal demand is expected to result in strong, but volatile, fundamentals for the U. S. coal industry.
39
Our revenues depend on the price at which we are able to sell our coal. The current pricing environment for U. S. steam coal production is strong in relation to historical pricing levels, and has strengthened, notably in the past several weeks, in comparison to pricing levels prevailing in the second half of 2006 and the first three quarters of 2007. Prices for high quality metallurgical coal, used to manufacture coke for steelmaking, have remained strong in response to increased worldwide demand for steel and transportation constraints in exporting metallurgical coal from Australia. As of October 16, 2007, we have committed and priced 100% and 93%, respectively, of the mid-points of our targeted production ranges for 2007 and 2008. In the longer term, decreases in coal prices due to, among other reasons, the supply of domestic and foreign coal, the demand for electricity and the price and availability of alternative fuels for electricity generation could affect our revenues and our ability to generate cash flows. In addition, our results of operations depend on the cost of coal production. We continue to experience increased operating costs for fuel and explosives, steel products, tires, health care, wages, salaries, contract coal haulage services and contract labor. Also, historically low interest rates have had a negative impact on expenses related to our actuarially determined employee-related liabilities.
We may also experience difficult geologic conditions, unforeseen equipment problems and shortages of critical materials such as tires and explosives that may limit our ability to produce at forecasted levels. To the extent upward pressure on costs exceed our ability to realize sales increases, or if we experience unanticipated operating or transportation difficulties, our operating margins would be negatively impacted. See the Special Note Regarding Forward-Looking Statements at the beginning of this ITEM 2 for additional considerations regarding our outlook.
Recent Accounting Pronouncements
See Note 2 to the Consolidated Financial Statements in ITEM I.
40
ITEM 3. QUANTITATIVE AND QUALITATIVE DISCLOSURES ABOUT MARKET RISK.
Price Risk
We manage our price risk for coal sales using long-term coal supply agreements rather than by derivative instruments. As of October 16, 2007, we had sales commitments for 100% of our planned 2007 production. The Company expects to make physical delivery of all coal for which we have sales commitments. As of October 16, 2007, uncommitted and unpriced tonnage was 7%, 34% and 67% of planned production in 2008, 2009 and 2010, respectively. Eastern coals account for the majority of uncommitted tonnage as 13%, 58% and 90% of the Company’s planned eastern production remains uncommitted and unpriced in 2008, 2009 and 2010, respectively.
Some of the products used in our mining activities, such as diesel fuel, explosives, large equipment tires, steel products and electricity, are subject to price volatility. Through our suppliers, we utilize forward purchase contracts to manage the exposure related to this volatility. As of September 30, 2007, the Company has entered into forward purchase commitments for approximately 85% of the diesel fuel that it expects to consume during calendar year 2007 at $2.02 per gallon for our Powder River Basin mines and between $1.97 to $2.19 per gallon for our Central Appalachian mines. The Company has designated these contracts as normal purchase normal sale contracts, and, therefore, they are not deemed to be derivative financial instruments for financial reporting purposes. During the nine months ended September 30, 2007 and 2006, the cost of diesel fuel represented approximately 4% of the Company’s consolidated cost of coal sales.
Credit Risk
Our credit risk is primarily with electric power generators and, to a lesser extent, steel producers. Most electric power generators to whom we sell have investment grade credit ratings. Our policy is to independently evaluate each customer’s creditworthiness prior to entering into transactions and to constantly monitor outstanding accounts receivable against established credit limits. When appropriate (as determined by our credit management function), we have taken steps to reduce our credit exposure to customers that do not meet our credit standards or whose credit has deteriorated. These steps include obtaining letters of credit or cash collateral, requiring prepayments for shipments or establishing customer trust accounts held for our benefit in the event of a failure to pay.
Interest Rate Risk
Our objectives in managing exposure to interest rate changes are to limit the impact of interest rate changes on earnings and cash flows and to lower overall borrowing costs. We have exposure to changes in interest rates through our bank term loan and our revolving credit facility. To achieve risk mitigation objectives, we have in the past managed our interest rate exposure through the use of interest rate swaps.
In connection with the July 7, 2006 closing of the amended and restated Senior Secured Credit Facility, the Company terminated existing swap agreements. On July 11, 2006, the Company monetized a $2.4 million derivative asset included inOther noncurrent assets in the Company’s consolidated financial statements at June 30, 2006 and recognized a resulting $0.1 million mark-to-market loss on the swaps. The $1.8 million unrealized gain from the change in the market value of the interest rate swaps recorded inAccumulated other comprehensive income (loss) is being recognized into income on a prorated basis over the remaining term of the original interest rate swap agreement through September 28, 2007, in accordance with Statement of Financial Accounting Standards No. 133,Accounting for Derivative Instruments and Hedging Activities, and related amendments. At December 31, 2006, the unamortized unrealized gain was $1.1 million. During the three and nine months ended September 30, 2007, $0.4 million and $1.1 million, respectively, was offset againstInterest expense.
As we continue to monitor the interest rate environment in concert with our risk mitigation objectives, consideration is being given to future interest rate risk reduction strategies.
41
ITEM 4. CONTROLS AND PROCEDURES.
Evaluation of Disclosure Controls and Procedures
We maintain disclosure controls and procedures and internal controls designed to ensure that information required to be disclosed in our filings under the Securities Exchange Act of 1934, as amended, is recorded, processed, evaluated, summarized and reported accurately within the time periods specified in the Securities and Exchange Commission’s (SEC) rules and forms. In designing and evaluating the disclosure controls and procedures, our management recognized that any controls and procedures, no matter how well designed and operated, can provide only reasonable assurance of achieving the desired control objectives and management necessarily was required to apply its judgment in evaluating the cost-benefit relationship of possible controls and procedures.
As of the end of the period covered by this report, an evaluation was performed under the supervision and with the participation of management, including the Chief Executive Officer (CEO) and Chief Financial Officer (CFO), of the effectiveness of the design and operation of our disclosure controls and procedures pursuant to Exchange Act Rule 13a-15(e) and 15d-15(e). Based upon that evaluation, the Chief Executive Officer and Chief Financial Officer concluded that the Company’s disclosure controls and procedures are effective and are designed to (a) ensure that information required to be disclosed by us in reports we file or submit under the Act are recorded, processed, summarized and reported within the time periods specified in the Securities and Exchange Commission’s rules and forms; and (b) ensure that information required to be disclosed by us in reports filed or submitted under the Act is accumulated and communicated to our management, including our Chief Executive Officer and Chief Financial Officer, as appropriate to allow timely decisions regarding required disclosure.
Changes in Internal Control Over Financial Reporting
There have not been any changes in our internal control over financial reporting that occurred during the quarter ended September 30, 2007 that have materially affected, or are reasonably likely to affect, our internal control over financial reporting.
ITEM 4T. CONTROLS AND PROCEDURES.
Not Applicable.
42
PART II—OTHER INFORMATION
ITEM 1. LEGAL PROCEEDINGS.
Information required by this Item is contained in Note 17, PART I, ITEM 1 entitled “Commitments and Contingencies” contained in this Report and is incorporated herein by reference.
ITEM 1A. RISK FACTORS.
There were no material changes from risk factors as previously disclosed in the Company’s Annual Report on Form 10-K for the twelve months ended December 31, 2006, as filed March 1, 2007.
ITEM 2. UNREGISTERED SALES OF EQUITY SECURITIES AND USE OF PROCEEDS.
Issuer Purchase of equity securities(1)
| | | | | | | | | | |
| | | Total
Number
of Shares
Purchased | | Average Price
Paid per Share | | Total Number of
Shares
Purchased as
Part of Publicly
Announced
Share
Repurchase
Program | | Approximate
Dollar Value of
Shares
that May Yet Be
Purchased
Under the
Program |
July 1, 2007 through July 31, 2007 | | - | | $ | - | | - | | $ | 74,844 |
August 1, 2007 through August 31, 2007 | | 293,500 | | $ | 31.63 | | 293,500 | | $ | 65,560 |
September 1, 2007 through September 30, 2007 | | 26,500 | | $ | 32.94 | | 26,500 | | $ | 64,687 |
| | | | | | | | | | |
Total | | 320,000 | | $ | 31.74 | | 320,000 | | $ | 64,687 |
| | | | | | | | | | |
(1) | On July 18, 2006, Foundation announced a share repurchase program that authorizes Foundation to repurchase its common stock from time to time, as determined by authorized officers of the Company, up to an aggregate amount of $100,000. |
ITEM 3. DEFAULTS UPON SENIOR SECURITIES.
ITEM 4. SUBMISSION OF MATTERS TO A VOTE OF SECURITY HOLDERS.
No matters were submitted to a vote of security holders during the period covered by this report.
ITEM 5. OTHER INFORMATION.
ITEM 6. EXHIBITS.
The exhibits to this report are listed in the Exhibit Index.
43
SIGNATURES
Pursuant to the requirements of the Securities Exchange Act of 1934, the registrant has duly caused this report to be signed on its behalf by the undersigned thereunto duly authorized.
| | |
Date: November 9, 2007 | | FOUNDATION COAL HOLDINGS, INC. |
| | (Registrant) |
| | | | | | | | | | |
| | | Name | | | | | | Title | | |
/s/ JAMES F. ROBERTS | | President, Chief Executive Officer and Chairman |
| James F. Roberts | | (Principal Executive Officer) |
| |
/s/ FRANK J. WOOD | | Senior Vice President and Chief Financial Officer |
| Frank J. Wood | | (Principal Financial and Accounting Officer) |
44
EXHIBIT INDEX
| | |
| Exhibit No. | | Description of Exhibit |
| 3.1 | | Third Amended and Restated Certificate of Incorporation of the Company, previously filed as an exhibit to the Company’s Form 10-Q on August 9, 2006, and incorporated by reference. |
| |
| 3.2 | | Amended and Restated By-laws of the Company, previously filed as an exhibit to the Company’s Form 8-K on May 22, 2006, and incorporated by reference. |
| |
| 4.1 | | Form of certificate of the Company’s common stock, previously filed as an exhibit to the Company’s Registration Statement on Form S-1 (File No. 333-118427) and incorporated by reference. |
| |
| 4.2 | | Amended and Restated Stockholders Agreement, dated as of October 4, 2004, by and among the Company, Blackstone FCH Capital Partners IV, L.P., Blackstone Family Investment Partnership IV-A L.P., First Reserve Fund IX, L.P., AMCI Acquisition, LLC and the management stockholders parties thereto, previously filed as an exhibit to the Company’s Registration Statement on Form S-1 (File No. 333-118427) and incorporated by reference. |
| |
| 4.2.1 | | Termination Agreement, dated as of February 6, 2006, by and among the Company, Blackstone FCH Capital Partners IV, L.P., Blackstone Family Investment Partnership IV-A L.P., First Reserve Fund IX, L.P., AMCI Acquisition, LLC (nka AMCI Acquisition III, LLC), and the management stockholders parties thereto, terminating the Amended and Restated Stockholders Agreement dated as of October 4, 2004, by and among the same parties, previously filed as an exhibit to the Company’s Form 8-K on February 23, 2006 and incorporated by reference. |
| |
| 4.3 | | Senior Notes Indenture, dated as of July 30, 2004, among Foundation PA Coal Company (nka Foundation PA Coal Company, LLC), the Guarantors named therein and The Bank of New York, as Trustee, previously filed as an exhibit to the Company’s Registration Statement on Form S-1 (File No. 333-118427) and incorporated by reference. |
| |
| 4.3.1 | | Supplemental Indenture dated as of September 6, 2005 among Foundation Mining, LP, a subsidiary of Foundation Coal Corporation, Foundation PA Coal Company, LLC and The Bank of New York, as Trustee, previously filed as an exhibit to the Company’s Form 10-Q on November 14, 2005 and incorporated by reference. |
| |
| 4.3.2* | | Supplemental Indenture dated as of October 5, 2007, among Foundation PA Coal Terminal, LLC, a subsidiary of Foundation Coal Corporation, Foundation PA Coal Company, LLC and The Bank of New York, as Trustee. |
| |
| 10.1* | | Supplement Number 2 dated as of October 5, 2007, to the Guarantee and Collateral Agreement dated as of July 30, 2004, among FC2 Corp., Foundation Coal Corporation, Foundation PA Coal Company, LLC as Borrower, the Subsidiary Parties thereto and Citicorp North America, Inc. as Collateral Agent. |
| |
| 31.1* | | Certification of periodic report by the Company’s Chief Executive Officer pursuant to Rule 13a-14(a) under the Securities Exchange Act of 1934, as amended pursuant to Section 302 of the Sarbanes-Oxley Act of 2002. |
| |
| 31.2* | | Certification of periodic report by the Company’s Chief Financial Officer pursuant to Rule 13a-14(a) under the Securities Exchange Act of 1934, as amended pursuant to Section 302 of the Sarbanes-Oxley Act of 2002. |
| |
| 32.1* | | Certification of periodic report by the Company’s Chief Executive Officer pursuant to 18 U.S.C. Section 1350, adopted pursuant to Section 906 of the Sarbanes-Oxley Act of 2002. |
| |
| 32.2* | | Certification of periodic report by the Company’s Chief Financial Officer pursuant to 18 U.S.C. Section 1350, adopted pursuant to Section 906 of the Sarbanes-Oxley Act of 2002. |
45