May 28, 2014 2014 BMO 23rd Global Metals and Mining Conference Brean Capital 2014 Global Resources & Infrastructure Conference

2 Statements in this presentation which are not statements of historical fact are “forward-looking statements” within the Safe Harbor provision of the Private Securities Litigation Reform Act of 1995. Such statements are not guarantees of future performance. Many factors could cause our actual results, performance or achievements, or industry results, to be materially different from any future results, performance or achievements expressed or implied by such forward looking-statements. These factors are discussed in detail in our Annual Report on Form 10-K, Quarterly Reports on Form 10-Q and in our other filings with the SEC. We make forward-looking statements based on currently available information, and we assume no obligation to update the statements made today or contained in our Annual Report or other filings due to changes in underlying factors, new information, future developments, or otherwise, except as required by law. Third Party Information This presentation, including certain forward-looking statements herein, include information obtained from third party sources that we believe to be reliable. However, we have not independently verified this third party information and cannot assure you of its accuracy or completeness. While we are not aware of any misstatements regarding any third party data contained in this presentation, such data involve risks and uncertainties and are subject to change based on various factors, including those discussed in detail in our Annual Report on Form 10-K, Quarterly Reports on Form 10-Q and in our other filings with the SEC. We assume no obligation to revise or update this third party information to reflect future events or circumstances. Forward-Looking Statements
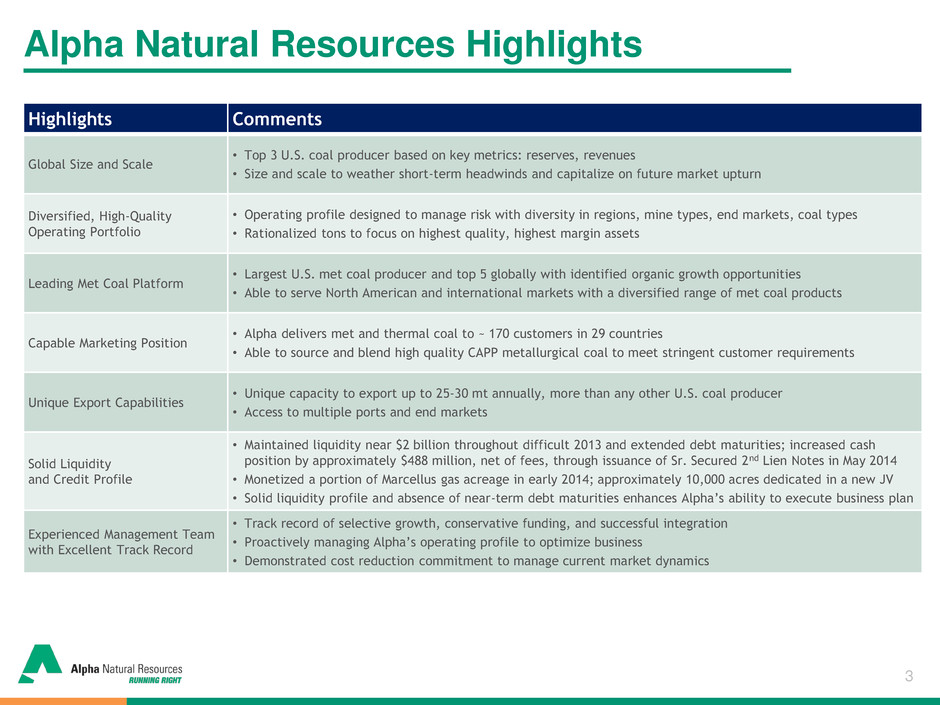
3 Alpha Natural Resources Highlights Highlights Comments Global Size and Scale • Top 3 U.S. coal producer based on key metrics: reserves, revenues • Size and scale to weather short-term headwinds and capitalize on future market upturn Diversified, High-Quality Operating Portfolio • Operating profile designed to manage risk with diversity in regions, mine types, end markets, coal types • Rationalized tons to focus on highest quality, highest margin assets Leading Met Coal Platform • Largest U.S. met coal producer and top 5 globally with identified organic growth opportunities • Able to serve North American and international markets with a diversified range of met coal products Capable Marketing Position • Alpha delivers met and thermal coal to ~ 170 customers in 29 countries • Able to source and blend high quality CAPP metallurgical coal to meet stringent customer requirements Unique Export Capabilities • Unique capacity to export up to 25-30 mt annually, more than any other U.S. coal producer • Access to multiple ports and end markets Solid Liquidity and Credit Profile • Maintained liquidity near $2 billion throughout difficult 2013 and extended debt maturities; increased cash position by approximately $488 million, net of fees, through issuance of Sr. Secured 2nd Lien Notes in May 2014 • Monetized a portion of Marcellus gas acreage in early 2014; approximately 10,000 acres dedicated in a new JV • Solid liquidity profile and absence of near-term debt maturities enhances Alpha’s ability to execute business plan Experienced Management Team with Excellent Track Record • Track record of selective growth, conservative funding, and successful integration • Proactively managing Alpha’s operating profile to optimize business • Demonstrated cost reduction commitment to manage current market dynamics
4 Strategy to Create an Industry Leader Alpha Natural Resources Overview
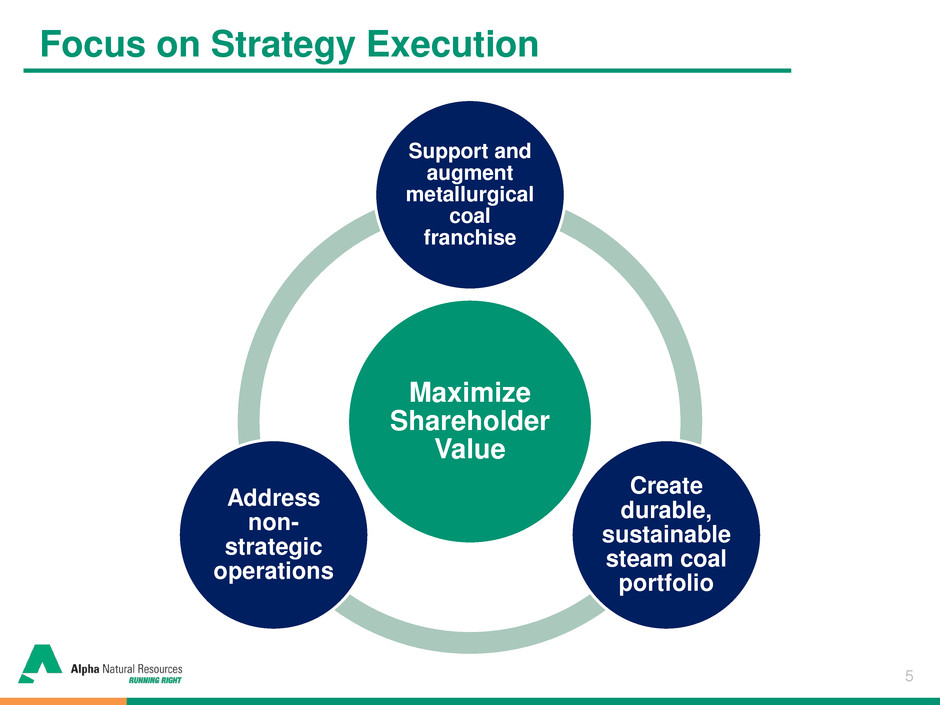
5 Focus on Strategy Execution Maximize Shareholder Value Support and augment metallurgical coal franchise Create durable, sustainable steam coal portfolio Address non- strategic operations

6 $73.77 $71.40 $66.50 $62.00 $64.00 $66.00 $68.00 $70.00 $72.00 $74.00 $76.00 2012 2013 MP 2014* Eastern cost/ton** Proactive Management – Position ANR for Future Aggressive Operating Cost Reductions in 2013 and 2014 to Enhance Cost Structure for Current Market Environment *Reflects midpoint of May 1, 2014 guidance. ** Adjusted cost of coal sales per ton. Adjusted cost of coal sales per ton is a non-GAAP measure. A reconciliation of this non- GAAP measure to the most comparable GAAP measure has been included in the tables accompanying this presentation. Category 2012 2013 MP 2014* Est. Change from 2012 Eastern cost/ton** $73.77 $71.40 $66.50 -$7.27 Western cost/ton** $10.15 $9.91 $10.00 -$0.15 Implemented ~$150mm annual cost reduction initiative in 2012 and further ~200mm reduction in 2013 – Majority of cost reductions reflected in cost of coal sales $10.15 $9.91 $10.00 $9.00 $9.25 $9.50 $9.75 $10.00 $10.25 $10.50 $10.75 $11.00 2012 2013 MP 2014* Western cost/ton**
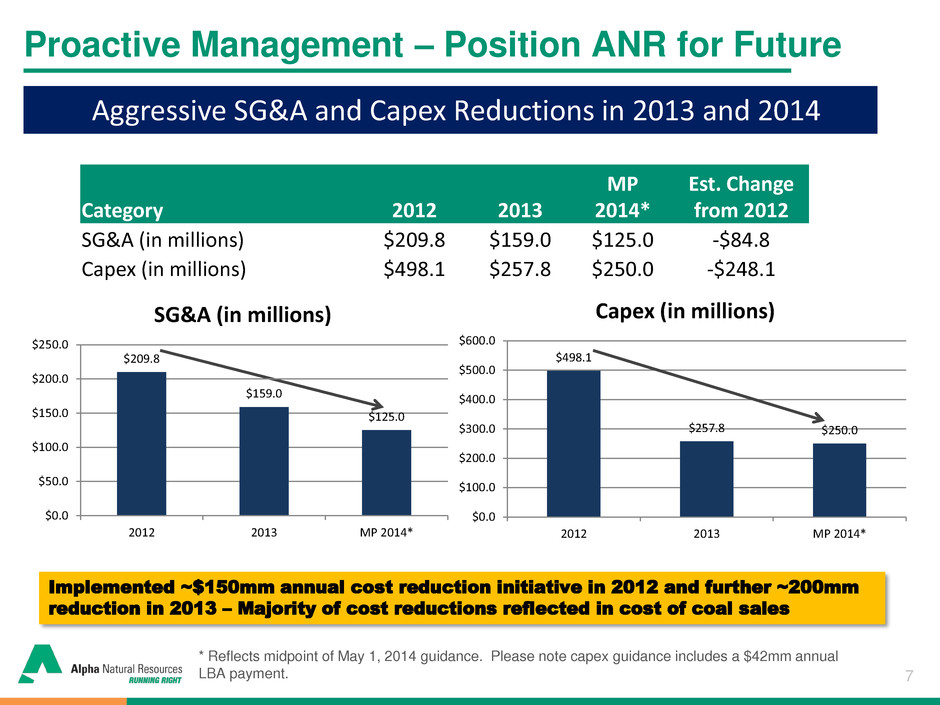
7 $498.1 $257.8 $250.0 $0.0 $100.0 $200.0 $300.0 $400.0 $500.0 $600.0 2012 2013 MP 2014* Capex (in millions) Proactive Management – Position ANR for Future Aggressive SG&A and Capex Reductions in 2013 and 2014 * Reflects midpoint of May 1, 2014 guidance. Please note capex guidance includes a $42mm annual LBA payment. Category 2012 2013 MP 2014* Est. Change from 2012 SG&A (in millions) $209.8 $159.0 $125.0 -$84.8 Capex (in millions) $498.1 $257.8 $250.0 -$248.1 Implemented ~$150mm annual cost reduction initiative in 2012 and further ~200mm reduction in 2013 – Majority of cost reductions reflected in cost of coal sales $209.8 $159.0 $125.0 $0.0 $50.0 $100.0 $150.0 $200.0 $250.0 2012 2013 MP 2014* SG&A (in millions)
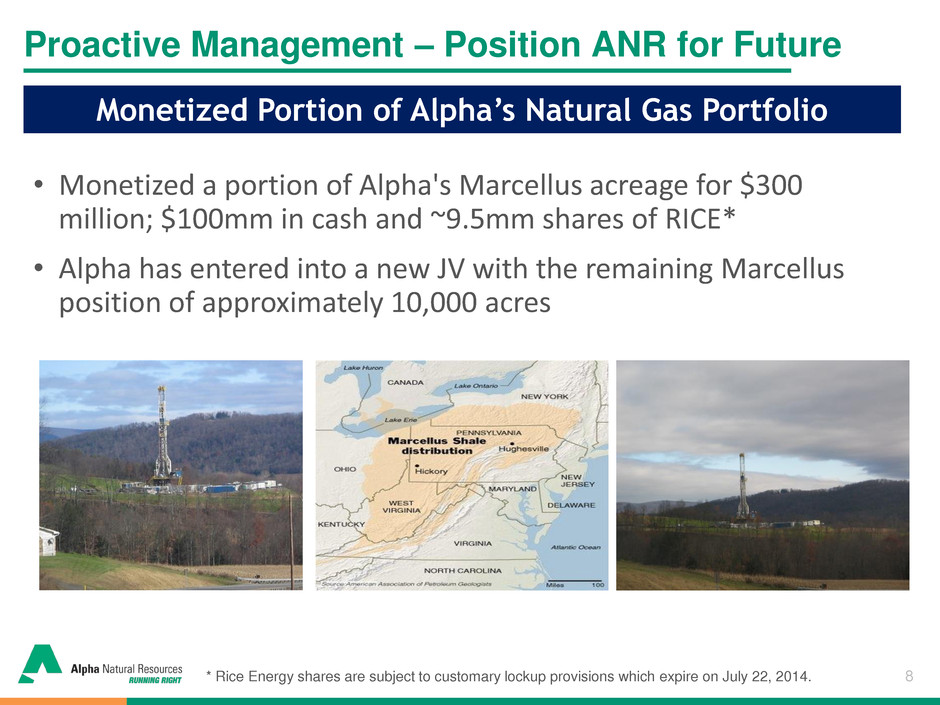
8 Proactive Management – Position ANR for Future • Monetized a portion of Alpha's Marcellus acreage for $300 million; $100mm in cash and ~9.5mm shares of RICE* • Alpha has entered into a new JV with the remaining Marcellus position of approximately 10,000 acres Monetized Portion of Alpha’s Natural Gas Portfolio * Rice Energy shares are subject to customary lockup provisions which expire on July 22, 2014.

9 Proactive Management – Position ANR for Future Enhanced Financial Flexibility 3/31/14 Debt Maturity Profile* ($ in millions) Amended credit agreement: Extended holiday on interest coverage ratio through 2015 Provided incremental senior debt capacity under the accordion Senior secured leverage ratio modified to first lien net secured leverage ratio test No reduction or extension of revolver commitment Sr. Sec. 2nd Lien Notes: Preserves liquidity position Took advantage of strong high yield markets Effectively refinances remaining 2015 maturities Enhances Alpha ‘s position for long-term success *Pro Forma for $500 million May 2014 Senior Secured 2nd Lien Notes $6 $6 $6 $6 $6 $6 $584 $159 $1,100 $345 $500 $800 $500 $345 $700 2014 2015 2016 2017 2018 2019 2020 2021 Senior Secured Term Loan B 2.375% and 3.75% Convertible Sr. Unsec. Notes Sr. Sec. Revolving Credit Facility 3.75% Convertible Sr. Unsec. Notes 9.75% Senior Unsecured Notes 6.00% Senior Unsecured Notes New 7.50% Sr. Sec. 2nd Lien Notes 3.75% Convertible Sr. Unsec. Notes 6.25% Senior Unsecured Notes $165 $1,106 $806 $1,429 $351 $700 $506
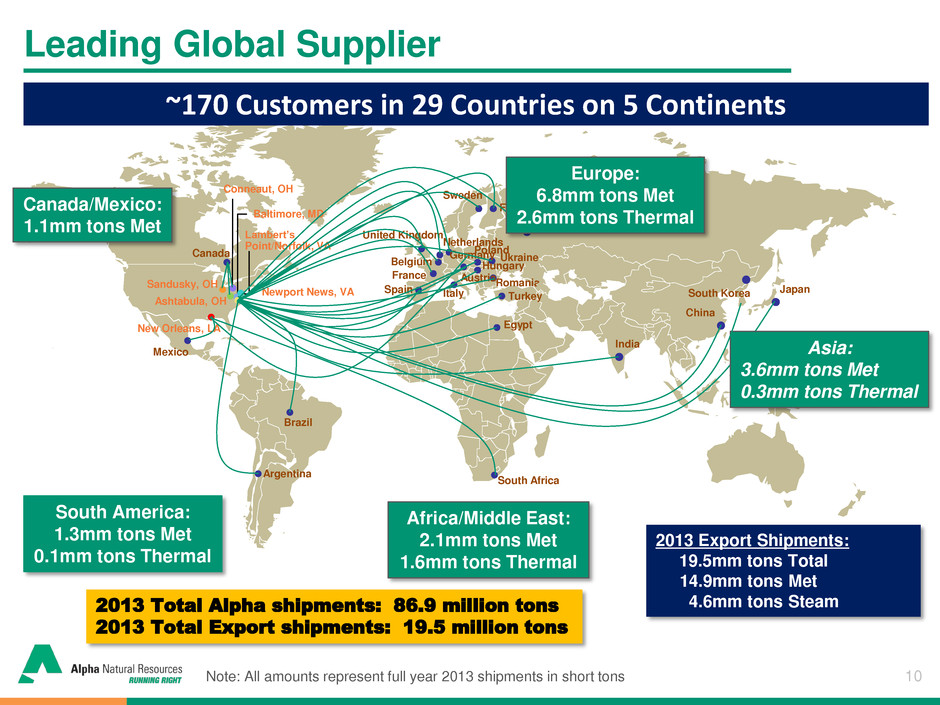
10 Leading Global Supplier Belgium Brazil Romania Canada France Egypt Sweden Netherlands Ukraine Spain Turkey United Kingdom Sandusky, OH Conneaut, OH Newport News, VA Lambert’s Point/Norfolk, VA Baltimore, MD Ashtabula, OH Russia New Orleans, LA Argentina Mexico Finland India Japan South Africa China Austria Italy Poland Hungary Germany Europe: 6.8mm tons Met 2.6mm tons Thermal South America: 1.3mm tons Met 0.1mm tons Thermal Asia: 3.6mm tons Met 0.3mm tons Thermal Africa/Middle East: 2.1mm tons Met 1.6mm tons Thermal South Korea 2013 Total Alpha shipments: 86.9 million tons 2013 Total Export shipments: 19.5 million tons 2013 Export Shipments: 19.5mm tons Total 14.9mm tons Met 4.6mm tons Steam ~170 Customers in 29 Countries on 5 Continents Canada/Mexico: 1.1mm tons Met Note: All amounts represent full year 2013 shipments in short tons

11 Large Port Capacity = Flexibility Alpha Has The Largest Port Capacity Of Any U.S. Coal Producer U.S. East Coast DTA - Virginia Alpha owns 41% share Lamberts Point - Virginia Alpha is the largest shipper Pier IX - Virginia Alpha gained position with Massey acquisition CSX Curtis Bay - Maryland U.S. Gulf U.S. Gulf - both land-based terminals and midstream loading capabilities Great Lakes
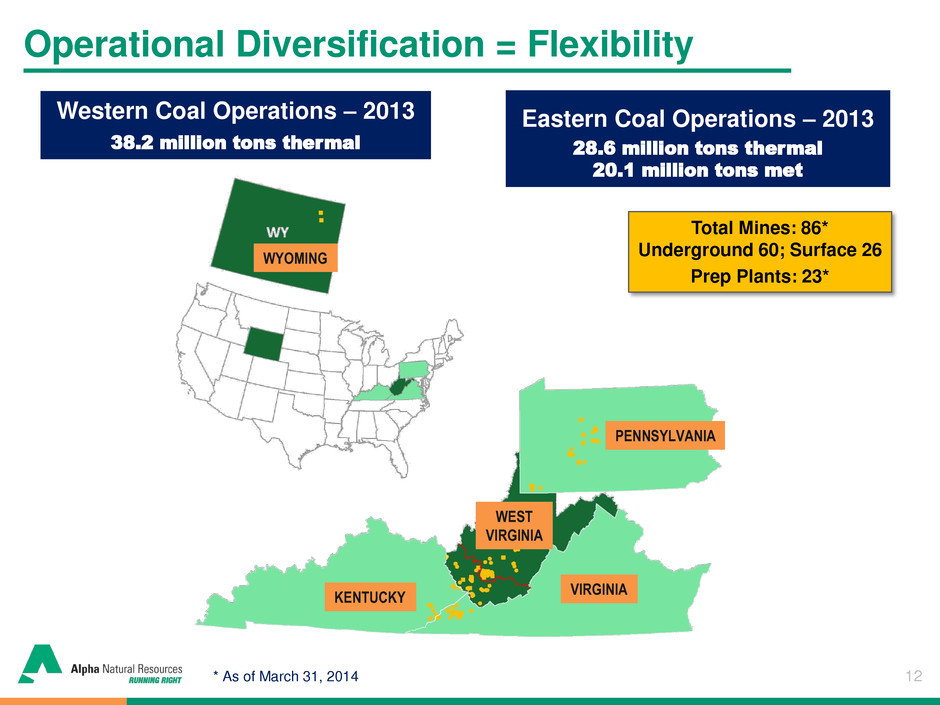
12 Operational Diversification = Flexibility Western Coal Operations – 2013 38.2 million tons thermal Eastern Coal Operations – 2013 28.6 million tons thermal 20.1 million tons met Total Mines: 86* Underground 60; Surface 26 Prep Plants: 23* * As of March 31, 2014 WYOMING PENNSYLVANIA VIRGINIA KENTUCKY WEST VIRGINIA
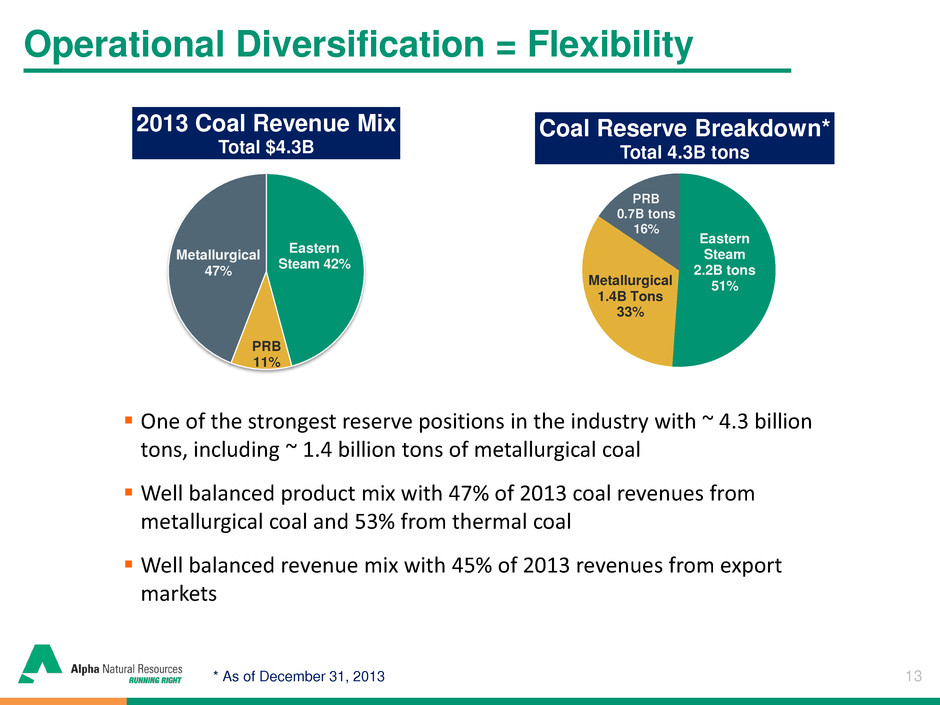
13 Operational Diversification = Flexibility * As of December 31, 2013 Eastern Steam 42% PRB 11% Metallurgical 47% 2013 Coal Revenue Mix Total $4.3B Eastern Steam 2.2B tons 51% Metallurgical 1.4B Tons 33% PRB 0.7B tons 16% Coal Reserve Breakdown* Total 4.3B tons One of the strongest reserve positions in the industry with ~ 4.3 billion tons, including ~ 1.4 billion tons of metallurgical coal Well balanced product mix with 47% of 2013 coal revenues from metallurgical coal and 53% from thermal coal Well balanced revenue mix with 45% of 2013 revenues from export markets * As of December 31, 2013
14 Global Growth More Balanced Market Overview

15 More Balanced Growth Forecast for 2014 Sources: World Steel Association Global Steel Use Growth Rates 2012-2014F Key Alpha end markets projecting solid growth in 2014 -9.5% 4.3% 8.4% 3.1% -1.3% 2.8% 2.0% -3.8% 5.5% 0.2% 2.8% 1.3% 4.6% 3.1% 2.1% 4.6% 3.2% 5.0% 6.3% 3.0% 3.3% -12.0% -10.0% -8.0% -6.0% -4.0% -2.0% 0.0% 2.0% 4.0% 6.0% 8.0% 10.0% European Union (27) Other Europe NAFTA Central & South America Middle East Asia & Oceania World 2012 2013E 2014F
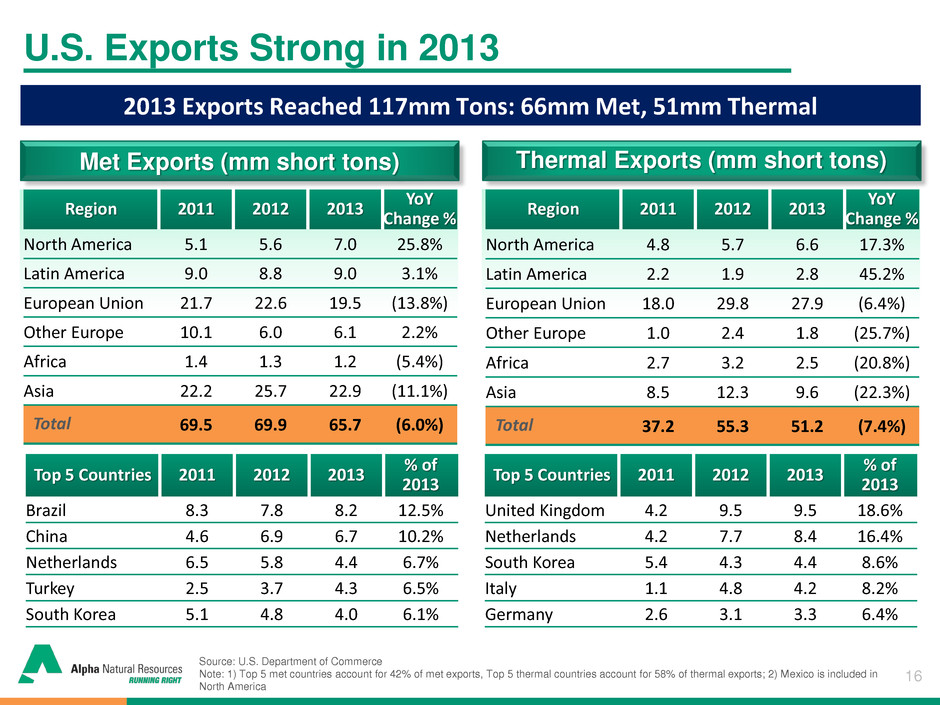
16 U.S. Exports Strong in 2013 Source: U.S. Department of Commerce Note: 1) Top 5 met countries account for 42% of met exports, Top 5 thermal countries account for 58% of thermal exports; 2) Mexico is included in North America 2013 Exports Reached 117mm Tons: 66mm Met, 51mm Thermal Met Exports (mm short tons) Thermal Exports (mm short tons) Top 5 Countries 2011 2012 2013 % of 2013 Brazil 8.3 7.8 8.2 12.5% China 4.6 6.9 6.7 10.2% Netherlands 6.5 5.8 4.4 6.7% Turkey 2.5 3.7 4.3 6.5% South Korea 5.1 4.8 4.0 6.1% Top 5 Countries 2011 2012 2013 % of 2013 United Kingdom 4.2 9.5 9.5 18.6% Netherlands 4.2 7.7 8.4 16.4% South Korea 5.4 4.3 4.4 8.6% Italy 1.1 4.8 4.2 8.2% Germany 2.6 3.1 3.3 6.4% Region 2011 2012 2013 YoY Change % North America 4.8 5.7 6.6 17.3% Latin America 2.2 1.9 2.8 45.2% European Union 18.0 29.8 27.9 (6.4%) Other Europe 1.0 2.4 1.8 (25.7%) Africa 2.7 3.2 2.5 (20.8%) Asia 8.5 12.3 9.6 (22.3%) Total 37.2 55.3 51.2 (7.4%) Region 2011 2012 2013 YoY Change % North America 5.1 5.6 7.0 25.8% Latin America 9.0 8.8 9.0 3.1% European Union 21.7 22.6 19.5 (13.8%) Other Europe 10.1 6.0 6.1 2.2% Africa 1.4 1.3 1.2 (5.4%) Asia 22.2 25.7 22.9 (11.1%) Total 69.5 69.9 65.7 (6.0%)

17 U.S Export Headwinds - Forex Unfavorable Exchange Ratios Lower the Competitiveness of U.S. Coals AUDUSD Exchange The Australian Dollar has depreciated ~12% to the USD since early 2013 It’s not just the Australian Dollar…Most global mining currencies have depreciated Currency in USD May 20, 2013 May 20, 2014 YoY % Change Australian Dollar 0.9808 0.9243 (5.8%) Euro 1.2882 1.3702 6.4% Canadian Dollar 0.9764 0.9168 (6.1%) Chinese Yuan 0.1629 0.1603 (1.6%) Brazilian Real 0.4948 0.4513 (8.8%) *Colombian Peso 0.0543 0.0520 (4.1%) *Indonesia Rupiah 0.1025 0.0870 (15.1%) Indian Rupee 0.0183 0.0171 (6.5%) Japanese Yen 0.0098 0.0099 0.9% *Korean Won 0.0897 0.0975 8.7% South African Rand 0.1059 0.0957 (9.6%) *Mongolian Tugrik 0.6952 0.55 (20.8%) Mozambican New Metical 0.0326 0.0317 (2.8%) Sources: Bloomberg Note: price of 100 Colombia Pesos in USD; price of 1,000 Indonesia Rupiah in USD, price of 100 Korean Won in USD, price of 1,000 MNT in USD
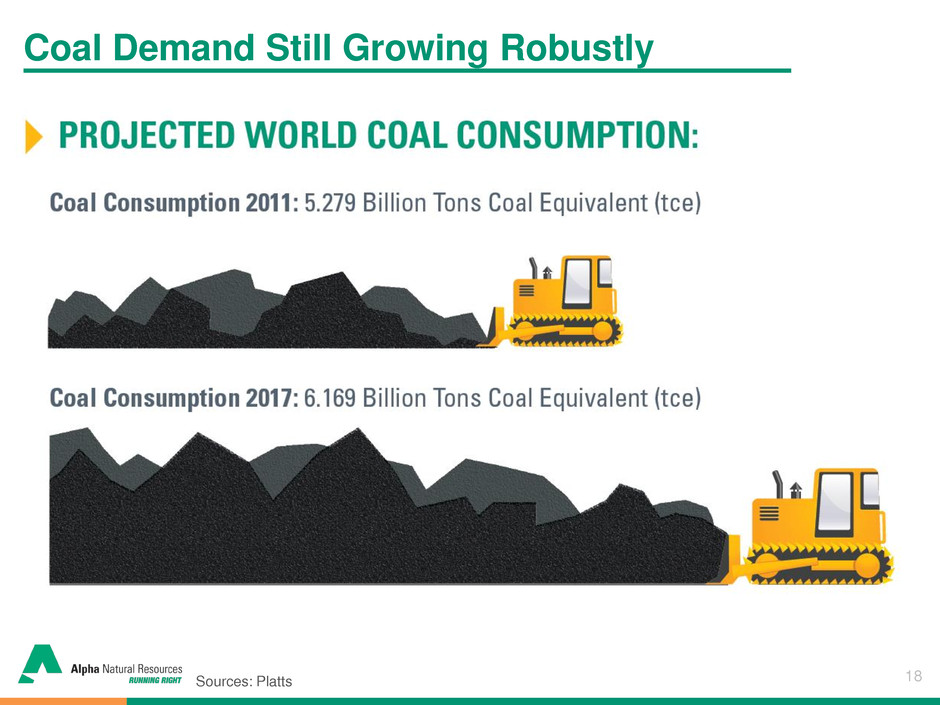
18 Coal Demand Still Growing Robustly Sources: Platts

19 Coal Demand Still Growing Robustly Sources: World Resources Institute
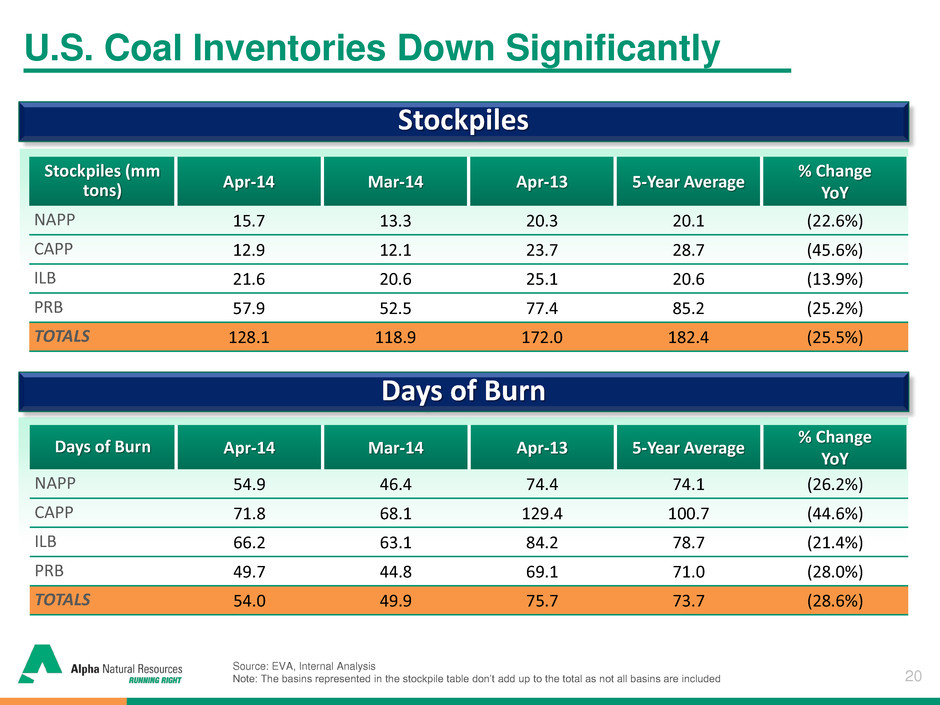
20 U.S. Coal Inventories Down Significantly Source: EVA, Internal Analysis Note: The basins represented in the stockpile table don’t add up to the total as not all basins are included Stockpiles Days of Burn Stockpiles (mm tons) Apr-14 Mar-14 Apr-13 5-Year Average % Change YoY NAPP 15.7 13.3 20.3 20.1 (22.6%) CAPP 12.9 12.1 23.7 28.7 (45.6%) ILB 21.6 20.6 25.1 20.6 (13.9%) PRB 57.9 52.5 77.4 85.2 (25.2%) TOTALS 128.1 118.9 172.0 182.4 (25.5%) Days of Burn Apr-14 Mar-14 Apr-13 5-Year Average % Change YoY NAPP 54.9 46.4 74.4 74.1 (26.2%) CAPP 71.8 68.1 129.4 100.7 (44.6%) ILB 66.2 63.1 84.2 78.7 (21.4%) PRB 49.7 44.8 69.1 71.0 (28.0%) TOTALS 54.0 49.9 75.7 73.7 (28.6%)
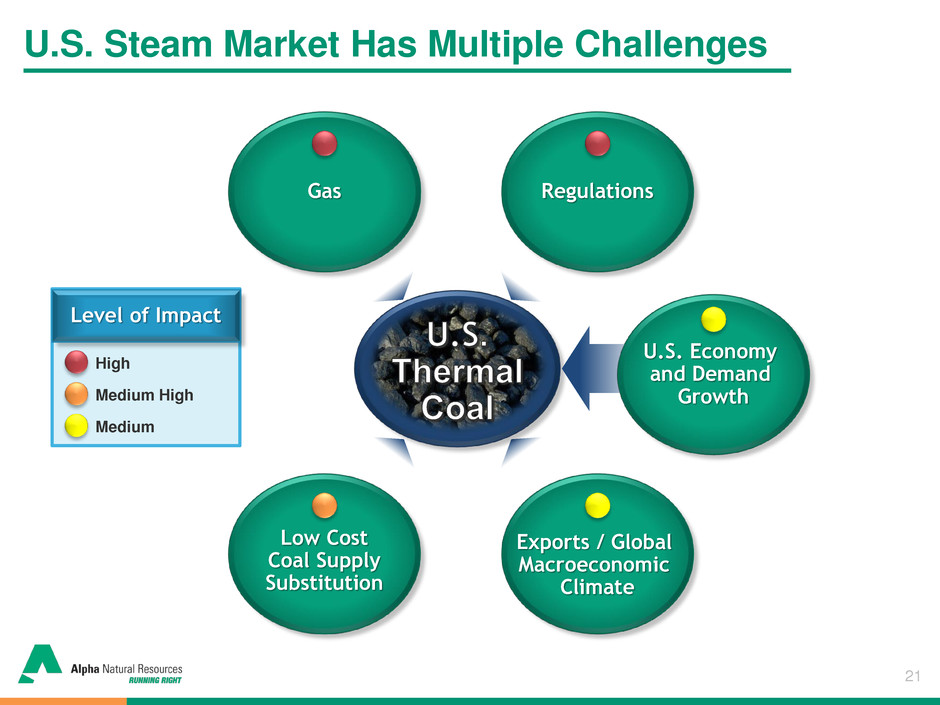
21 U.S. Steam Market Has Multiple Challenges Regulations Gas Low Cost Coal Supply Substitution Exports / Global Macroeconomic Climate U.S. Economy and Demand Growth Level of Impact High Medium High Medium
22 Resources to Enhance Shareholder Value Financial Overview
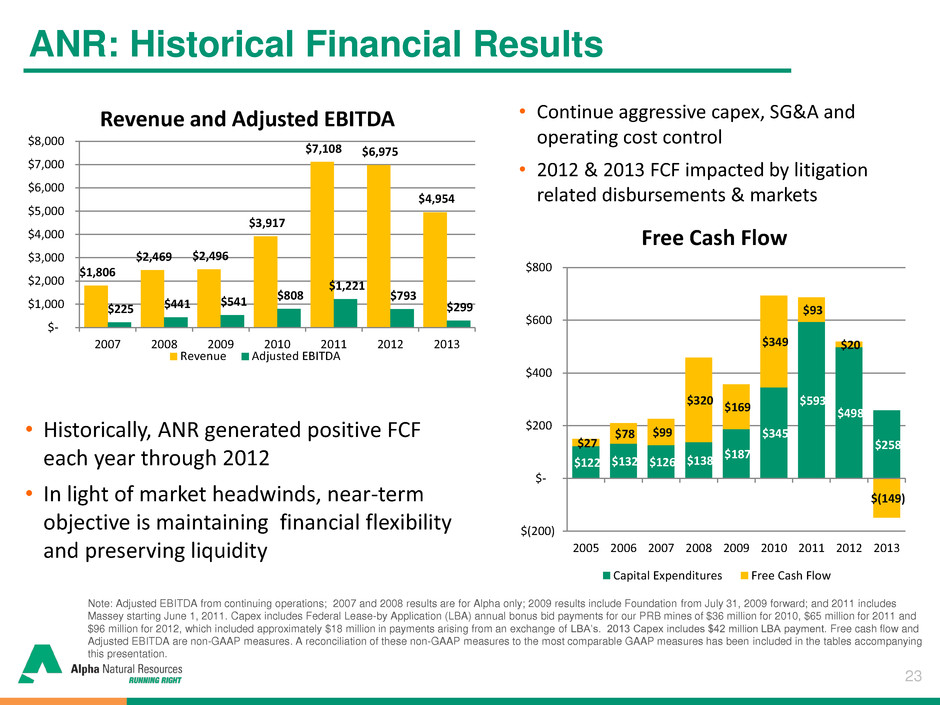
23 Note: Adjusted EBITDA from continuing operations; 2007 and 2008 results are for Alpha only; 2009 results include Foundation from July 31, 2009 forward; and 2011 includes Massey starting June 1, 2011. Capex includes Federal Lease-by Application (LBA) annual bonus bid payments for our PRB mines of $36 million for 2010, $65 million for 2011 and $96 million for 2012, which included approximately $18 million in payments arising from an exchange of LBA’s. 2013 Capex includes $42 million LBA payment. Free cash flow and Adjusted EBITDA are non-GAAP measures. A reconciliation of these non-GAAP measures to the most comparable GAAP measures has been included in the tables accompanying this presentation. ANR: Historical Financial Results • Continue aggressive capex, SG&A and operating cost control • 2012 & 2013 FCF impacted by litigation related disbursements & markets • Historically, ANR generated positive FCF each year through 2012 • In light of market headwinds, near-term objective is maintaining financial flexibility and preserving liquidity $122 $132 $126 $138 $187 $345 $593 $498 $258 $27 $78 $99 $320 $169 $349 $93 $20 $(149) $(200) $- $200 $400 $600 $800 2005 2006 2007 2008 2009 2010 2011 2012 2013 Free Cash Flow Capital Expenditures Free Cash Flow $1,806 $2,469 $2,496 $3,917 $7,108 $6,975 $4,954 $225 $441 $541 $808 $1,221 $793 $299 $- $1,000 $2,000 $3,000 $4,000 $5,000 $6,000 $7,000 $8,000 2007 2008 2009 2010 2011 2012 2013 Revenue and Adjusted EBITDA Revenue Adjusted EBITDA
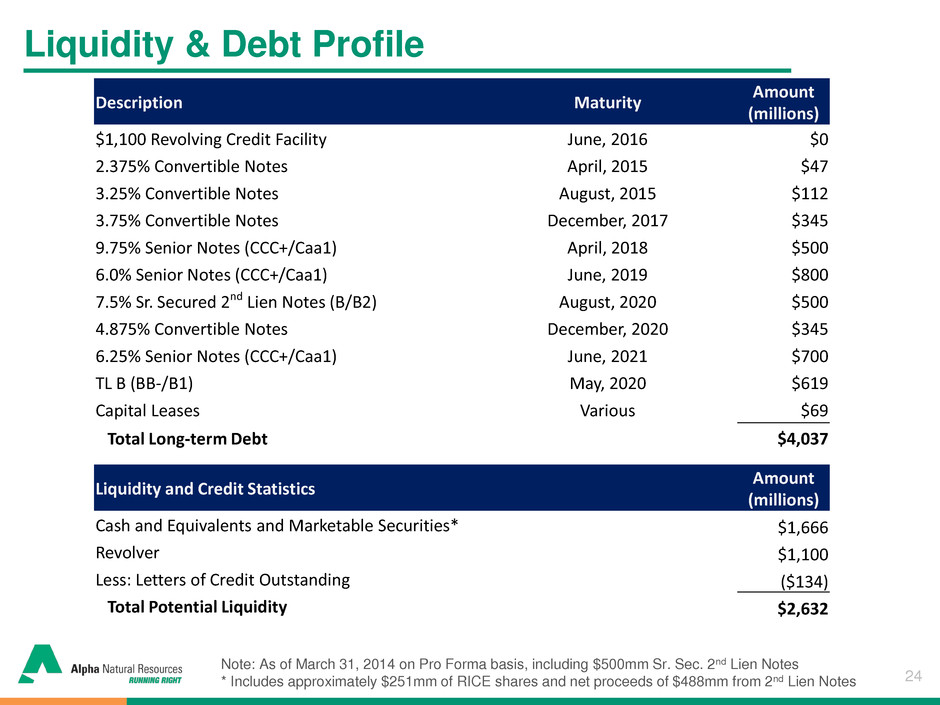
24 Liquidity & Debt Profile Note: As of March 31, 2014 on Pro Forma basis, including $500mm Sr. Sec. 2nd Lien Notes * Includes approximately $251mm of RICE shares and net proceeds of $488mm from 2nd Lien Notes Description Maturity Amount (millions) $1,100 Revolving Credit Facility June, 2016 $0 2.375% Convertible Notes April, 2015 $47 3.25% Convertible Notes August, 2015 $112 3.75% Convertible Notes December, 2017 $345 9.75% Senior Notes (CCC+/Caa1) April, 2018 $500 6.0% Senior Notes (CCC+/Caa1) June, 2019 $800 7.5% Sr. Secured 2nd Lien Notes (B/B2) August, 2020 $500 4.875% Convertible Notes December, 2020 $345 6.25% Senior Notes (CCC+/Caa1) June, 2021 $700 TL B (BB-/B1) May, 2020 $619 Capital Leases Various $69 Total Long-term Debt $4,037 Liquidity and Credit Statistics Amount (millions) Cash and Equivalents and Marketable Securities* $1,666 Revolver $1,100 Less: Letters of Credit Outstanding ($134) Total Potential Liquidity $2,632
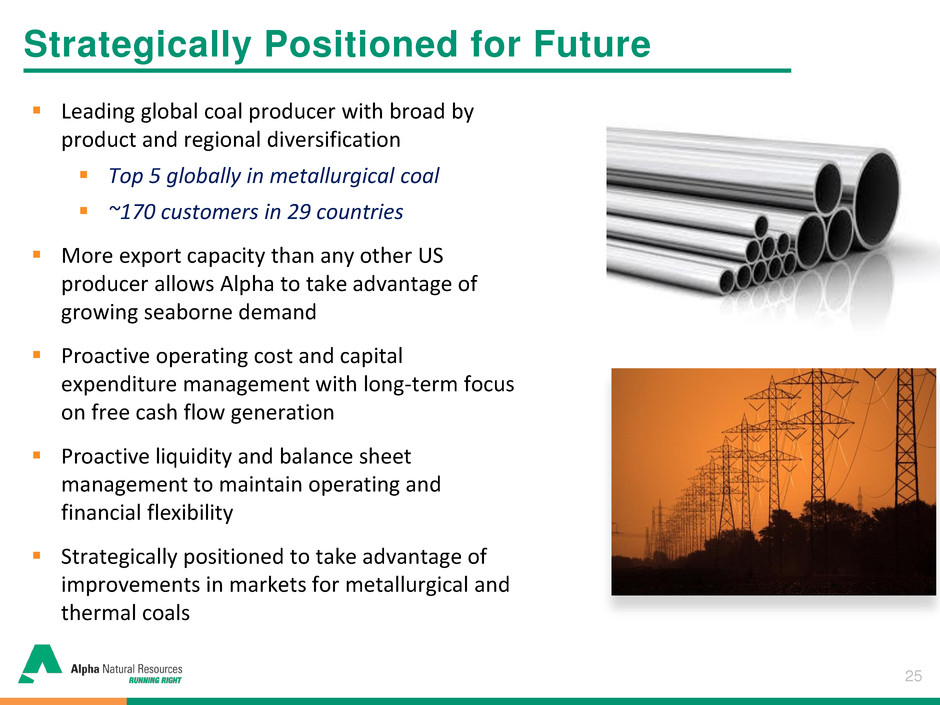
25 Leading global coal producer with broad by product and regional diversification Top 5 globally in metallurgical coal ~170 customers in 29 countries More export capacity than any other US producer allows Alpha to take advantage of growing seaborne demand Proactive operating cost and capital expenditure management with long-term focus on free cash flow generation Proactive liquidity and balance sheet management to maintain operating and financial flexibility Strategically positioned to take advantage of improvements in markets for metallurgical and thermal coals Strategically Positioned for Future
26 www.alphanr.com Appendices
27 Reconciliation Use of Non-GAAP Measures In addition to information prepared in accordance with generally accepted accounting principles in the United States (GAAP) provided throughout this presentation, Alpha has presented the following non-GAAP financial measures, which management uses to gauge operating performance: adjusted EBITDA, adjusted cost of coal sales per ton and free cash flow. These non-GAAP financial measures exclude various items detailed in the attached reconciliation tables. The definition of these non-GAAP measures may be changed periodically by management to adjust for significant items important to an understanding of operating trends. These measures are not intended to replace financial performance measures determined in accordance with GAAP. Rather, they are presented as supplemental measures of the Company’s performance that management believes are useful to securities analysts, investors and others in assessing the Company’s performance over time. Moreover, these measures are not calculated identically by all companies and therefore may not be comparable to similarly titled measures used by other companies. A reconciliation of each of these measures to its most directly comparable GAAP measure is provided in the tables below.
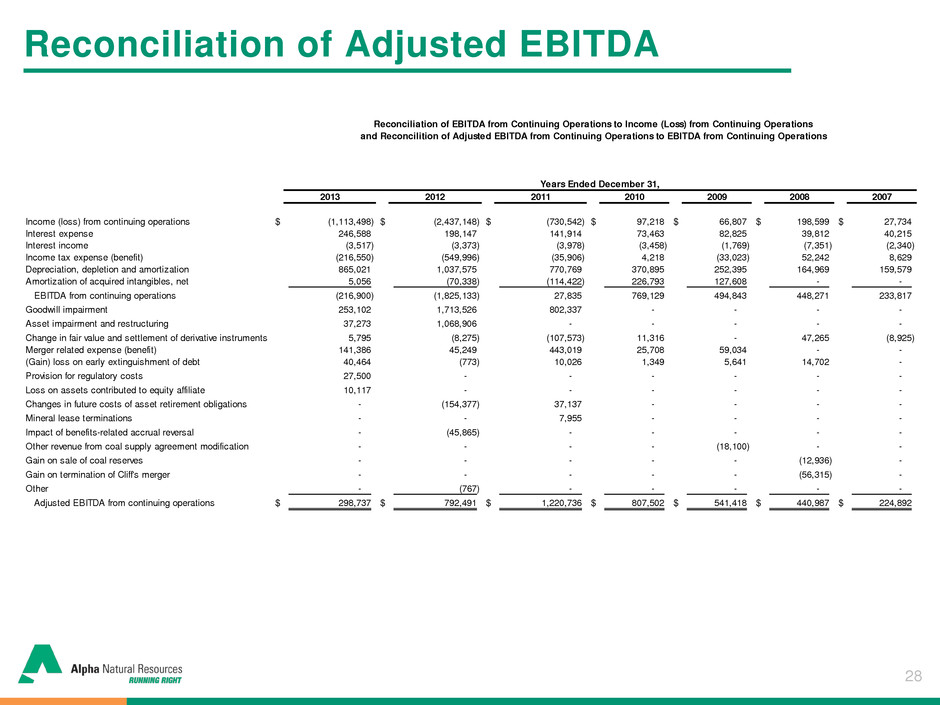
28 Reconciliation of Adjusted EBITDA 2013 2012 2011 2010 2009 2008 2007 Income (loss) from continuing operations $ (1,113,498) $ (2,437,148) $ (730,542) $ 97,218 $ 66,807 $ 198,599 $ 27,734 Interest expense 246,588 198,147 141,914 73,463 82,825 39,812 40,215 Interest income (3,517) (3,373) (3,978) (3,458) (1,769) (7,351) (2,340) Income tax expense (benefit) (216,550) (549,996) (35,906) 4,218 (33,023) 52,242 8,629 Depreciation, depletion and amortization 865,021 1,037,575 770,769 370,895 252,395 164,969 159,579 Amortization of acquired intangibles, net 5,056 (70,338) (114,422) 226,793 127,608 - - EBITDA from continuing operations (216,900) (1,825,133) 27,835 769,129 494,843 448,271 233,817 Goodwill impairment 253,102 1,713,526 802,337 - - - - Asset impairment and restructuring 37,273 1,068,906 - - - - - Change in fair value and settlement of derivative instruments 5,795 (8,275) (107,573) 11,316 - 47,265 (8,925) Merger related expense (benefit) 141,386 45,249 443,019 25,708 59,034 - - (Gain) loss on early extinguishment of debt 40,464 (773) 10,026 1,349 5,641 14,702 - Provision for regulatory costs 27,500 - - - - - - Loss on assets contributed to equity affiliate 10,117 - - - - - - Changes in future costs of asset retirement obligations - (154,377) 37,137 - - - - Mineral lease terminations - - 7,955 - - - - Impact of benefits-related accrual reversal - (45,865) - - - - - Other revenue from coal supply agreement modification - - - - (18,100) - - Gain on sale of coal reserves - - - - - (12,936) - Gain on termination of Cliff's merger - - - - - (56,315) - Other - (767) - - - - - Adjusted EBITDA from continuing operations $ 298,737 $ 792,491 $ 1,220,736 $ 807,502 $ 541,418 $ 440,987 $ 224,892 Years Ended December 31, Reconciliation of EBITDA from Continuing Operations to Income (Loss) from Continuing Operations and Reconcilition of Adjusted EBITDA from Continuing Operations to EBITDA from Continuing Operations

29 Reconciliation of Free Cash Flow 2013 2012 2011 2010 2009 2008 2007 2006 2005 Net cash provided by operating activities $ 109,018 $ 518,419 $ 686,637 $ 693,601 $ 356,220 $ 458,043 $ 225,741 $ 210,081 $ 149,643 Capit l ex enditures (215,661) (402,377) (528,586) (308,864) (187,093) (137,751) (1 6,38 ) (131,943) ( 22,3 2) Acquisition of min ral rights under federal lease (42,130) (95,765) (64,900) (36,108) - - - - - Free cash fl w $ (1 8,773) $ 20,277 $ 93,151 $ 348,629 $ 169,127 $ 320,292 $ 99,360 $ 78,138 $ 27,301 Reconciliation of Free Cash Flow to Net Cash Provided by Operating Activities Years Ended December 31,

30 Reconciliation of Cost of Coal Sales Reconciliation of Adjusted Cost of Coal Sales Per Ton-East to Cost of Coal Sales Per Ton December 31, 2013 December 31, 2012 Cost of coal sales per ton-East $ 72.51 $ 71.76 Impact of provision for regulatory costs (0.53) - Impact of merger-related expenses (0.58) (1.07) Impact of changes in future costs of asset retirement obligations - 2.48 Impact of benefits-related accrual reversal - 0.64 Impact of write-off of weather-related property damage - (0.04) Adjusted cost of coal sales per ton-East $ 71.40 $ 73.77 Reconciliation of Adjusted Cost of Coal Sales Per Ton-West to Cost of Coal Sales Per Ton December 31, 2013 December 31, 2012 Cost of coal sales per ton-West $ 9.91 $ 10.10 Impact of benefits-related accrual reversal - 0.05 Adjusted cost of coal sales per ton-West $ 9.91 $ 10.15 Twelve months ended Twelve months ended


