Exhibit (C)(10) STRICTLY CONFIDENTIAL JUNE 2024 The blacked out information indicates information has been omitted on the basis of a confidential treatment request pursuant to Rule 24b-2 of the Securities Exchange Act of 1934, as amended. This information has been filed separately with the Securities and Exchange Commission. Discussion Materials of Brown Gibbons Lang & Company for the Board of Directors of Manitex, dated June 24, 2024. Project ELEVATE Board of Directors Process Update – June 24, 2024 CHICAGO • CLEVELAND • LOS ANGELES • NEW YORK BGLCO.COM

Table of Contents I. Marketing Process Summary II. Capital Markets and Shareholder Base Update III. Bid Summary IV. Next Steps V. Appendix

Marketing Process Summary

Marketing Update – Buyer Outreach • Early November 2023 BGL launched a broad marketing process including a set of global strategic and private equity buyers • In total, 192 parties were contacted during the marketing process ─ 73 Confidential Information Presentations were distributed to 9 strategic and 64 private equity groups • In Q4 2023 and Q1 2024 five Indications of Interest, or bids, were received, with four management presentations held in April 2024 – Following management presentations submitted refresh bids on May 7, 2024 • Following refresh bids two parties were invited to continue due diligence with the opportunity to tour European operations and further engage with Company management • On June 19 and 21, 2024, Letters of Intent were received from private equity groups , respectively Private Equity Strategics Groups Total Parties % Total Submitted Letter of Intent ( LOI ) 0 2 2 1% Not Invited to Move Forward in Process 0 2 2 1% Submitted Refreshed Bids 0 4 4 2% Not Invited to Management Presentation 0 1 1 1% Submitted Indication of Interest ( IOI ) 0 5 5 3% Passed After Reviewing Confidential Information Presentation 9 56 65 34% Passed After In Person Fireside Chat Discussion 0 3 3 2% Passed After Call and /or Reviewing Teaser 12 58 70 36% Unresponsive Parties After Multiple Attempts 20 29 49 26% Total Parties 41 153 192 100% (1) Verbal Indication 4

Marketing Process Counterparty Feedback Recurrent Buyer Feedback Positive Commentary Rationale for Decline Market Specific Market Specific Size of addressable market Cyclicality of capital equipment demand Positive outlook for key end markets including Exposure to interest rate sensitive end market infrastructure spending Cyclicality and capital intense rental business Company Specific Company Specific Attractive market opportunity for increased Strategic fit of rental business adoption of European products in the U.S. Historical financial performance Identified operational excellence initiatives and progress executing these value creation initiatives Current margin profile Diversity of end-markets Complexity of take-private dynamic Ability to create value through the execution of a Complexity of dual-continent financing “complex” transaction (i.e., Go Private transaction) Current management’s tenure “Platform-ready” management team 5

Marketing Update – Lender Outreach • BGL Debt Capital Markets team reached out to 22 potential debt financing partners to request indicative financing terms • Six parties have provided indicative financing terms Total Parties % Total Submitted Preliminary Terms 6 27% Called and/or Sent Teaser and NDA, No Response 4 18% Passed After Call and /or Reviewing Teaser 1 5% Reviewed Confidential Information Presentation, Elected to Not Provide Guidance 11 50% Total Parties 22 100% Implied Total Leverage 3.5x Median Mid-Point Leverage 4.0x 3.0x 2.0x 6
Summary of Lender Indications Lender: Facility Commitment: Debt Classification: Facility SOFR Spread: Equity Requirement: Covenants: Term Loan Amortization: Other: (1) Verbal indication 7 (2) BGL Debt Capital Markets team estimates market currently at S + 200 – 225bps
Capital Markets and Shareholder Base Update

Comparable Public Company Group • Excluding Konecranes and Cargotec who reported record sales and profitability and individual corporate restructuring initiatives in Q1 2024 collectively, the current median OEM EV/EBITDA multiple declines to 5.3x • Since BGL presented to the Board of Directors on February 26, 2024, median OEM Enterprise Value to TTM EBITDA multiples have declined from 6.2x to 5.5x 3-Year TTM ($ in millions, except per share data) Market Enterprise TTM NTM Revenue EBITDA Debt/ EV/TTM EBITDA Company Cap. Value Revenue EBITDA Revenue EBITDA CAGR Margin EBITDA Current Original Equipment Manufacturers Cargotec Corporation $ 5 ,395 $ 5 ,307 $ 4,960 $ 618 $ 3 ,697 $ 338 13.6% 1 2.5% 0.7x 7 .9x Konecranes Plc 4,561 4,921 4,296 538 4,387 606 8 .5% 1 2.5% 1.9x 8 .5x Manitowoc Company, Inc., The 379 809 2,215 155 2,290 160 14.7% 7 .0% 3.0x 4.7x Palfinger AG 882 1,692 2 ,625 281 2 ,501 288 1 6.3% 1 0.7% 3 .1x 5.5x Terex Corporation 3,601 3,960 5,208 700 5 ,254 762 1 8.8% 13.4% 1.0x 5.3x Mean $ 2,963 $ 3,338 $ 3,861 $ 459 $ 3,626 $ 431 1 4.4% 1 1.2% 1.9x 6.4x Median $ 3,601 $ 3,960 $ 4,296 $ 538 $ 3,697 $ 338 1 4.7% 12.5% 1.9x 5.5x Equipment Rental Alta Equipment Group Inc. $ 289 $ 1 ,496 $ 1,898 $ 191 $ 2 ,017 $ 203 25.4% 10.1% 6.3x 7.8x Ashtead Group plc 29,718 40,459 10,859 4,893 11,423 5 ,230 1 7.8% 45.1% 2 .2x 8 .3x H&E Equipment Services, Inc. 1,571 3,266 1,518 707 1 ,562 705 16.4% 46.6% 2.4x 4 .6x Herc Holdings Inc. 3,807 8,361 3,346 1,456 3,461 1,569 23.0% 43.5% 3.2x 5 .7x United Rentals, Inc. 42,669 5 5,611 14,532 6 ,941 15,400 7 ,268 1 9.8% 47.8% 1 .9x 8 .0x Mean $ 15,611 $ 21,839 $ 6,430 $ 2,838 $ 6,773 $ 2,995 20.5% 38.6% 3.2x 6.9x Median $ 3,807 $ 8,361 $ 3,346 $ 1,456 $ 3,461 $ 1,569 19.8% 45.1% 2.4x 7.8x Public comparable OEM companies are trading at a median Enterprise Value/TTM EBITDA multiple of 5.5x 9 Source: S&P Capital IQ and FactSet as of June 21, 2024

Trading Activity Comparison to Market and Comp Groups – June 21, 2024 • Since October, the S&P 500 is up ~25% • MNTX has experienced a pullback of 44% in share price year-to-date, with current trading value unchanged since initiation of the marketing process 12/27/23: 12/19/23: 5/7/24: st 52-Wk High 10/11/23: 1 Round Indications nd 2 Round Indications $9.02 / share BGL Growth Conference of Interest Due of Interest Due 11/15/23: Meetings with Sponsors Began CIP Distribution MNTX: 6/21/24 MNTX: MNTX: 11/2/23: $6.35 / share $4.58 / share $6.37 / share Teaser Launch; Q3 23 Earnings MNTX: Release +35.4% $4.58 / share +32.5% +26.4% 0.0% 10/1/2023 11/1/2023 12/1/2023 1/1/2024 2/1/2024 3/1/2024 4/1/2024 5/1/2024 6/1/2024 6/21/2024 (1) (2) Source: S&P Capital IQ MNTX Trading Volume MNTX S&P 500 OE Comp Group Rental Comp Group (30 Trading Days Prior to Teaser Launch = 100) Trading Data as of 06/21/2024 Share Price Volume Volume $ 06/21/2024 Close $4.58 50,697 $232,192 7-Day Average $4.70 79,362 $372,845 30-Day Average $5.48 80,283 $439,930 52-Week Low (10/27/2023) $3.86 36,664 $141,523 52-Week High (12/27/2023) $9.02 87,158 $786,165 MNTX share price is unchanged since process launch compared to +26.4% for the S&P 500, +35.4% for the OEM Comparable Group, and +32.5% for the Rental Comparable Group (1) OE Comp Group: Cargotec Corporation, Konecranes, Manitowoc Company, Palfinger AG, Terex Corporation 10 (2) Rental Comp Group: Alta Equipment Group, Ashtead Group, H&E Equipment Services, Herc Holdings, United Rentals -30 -26 -22 -18 -14 -10 -6 -2 +2 +6 +10 +14 +18 +22 +26 +30 +34 +38 +42 +46 +50 +54 +58 +62 +66 +70 +74 +78 +82 +86 +90 +94 +98 +102 +106 +110 +114 +118 +122 +126 +130 +134 +138 +142 +146 +150 +154
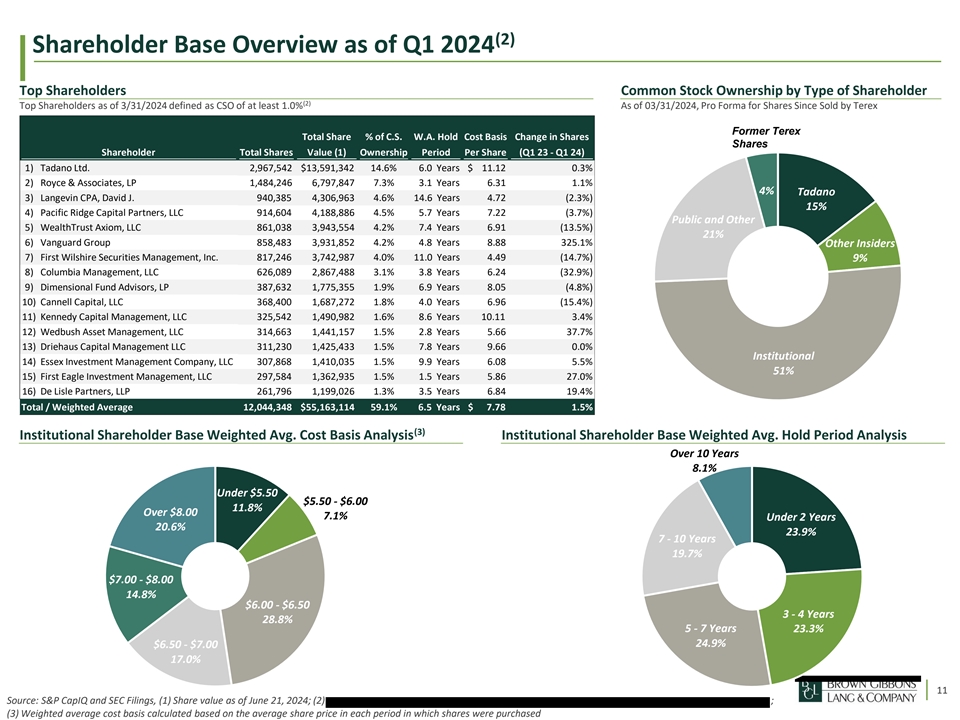
(2) Shareholder Base Overview as of Q1 2024 Top Shareholders Common Stock Ownership by Type of Shareholder (2) Top Shareholders as of 3/31/2024 defined as CSO of at least 1.0% As of 03/31/2024, Pro Forma for Shares Since Sold by Terex • (1) Former Terex Total Share % of C.S. W.A. Hold Cost Basis Change in Shares Shares (1) Shareholder Total Shares Value (1) Ownership Period Per Share (Q1 23 - Q1 24) 1) Tadano Ltd. 2,967,542 $13,591,342 14.6% 6.0 Years $ 11.12 0.3% 2) Royce & Associates, LP 1,484,246 6,797,847 7.3% 3.1 Years 6.31 1.1% 4% Tadano 3) Langevin CPA, David J. 940,385 4,306,963 4.6% 14.6 Years 4.72 (2.3%) 15% 4) Pacific Ridge Capital Partners, LLC 914,604 4,188,886 4.5% 5.7 Years 7.22 (3.7%) Public and Other 5) WealthTrust Axiom, LLC 861,038 3,943,554 4.2% 7.4 Years 6.91 (13.5%) 21% 6) Vanguard Group 858,483 3,931,852 4.2% 4.8 Years 8.88 325.1% Other Insiders 7) First Wilshire Securities Management, Inc. 817,246 3,742,987 4.0% 11.0 Years 4.49 (14.7%) 9% 8) Columbia Management, LLC 626,089 2,867,488 3.1% 3.8 Years 6.24 (32.9%) 9) Dimensional Fund Advisors, LP 387,632 1,775,355 1.9% 6.9 Years 8.05 (4.8%) 10) Cannell Capital, LLC 368,400 1,687,272 1.8% 4.0 Years 6.96 (15.4%) 11) Kennedy Capital Management, LLC 325,542 1,490,982 1.6% 8.6 Years 10.11 3.4% 12) Wedbush Asset Management, LLC 314,663 1,441,157 1.5% 2.8 Years 5.66 37.7% 13) Driehaus Capital Management LLC 311,230 1,425,433 1.5% 7.8 Years 9.66 0.0% Institutional 14) Essex Investment Management Company, LLC 307,868 1,410,035 1.5% 9.9 Years 6.08 5.5% 51% 15) First Eagle Investment Management, LLC 297,584 1,362,935 1.5% 1.5 Years 5.86 27.0% 16) De Lisle Partners, LLP 261,796 1,199,026 1.3% 3.5 Years 6.84 19.4% Total / Weighted Average 12,044,348 $55,163,114 59.1% 6.5 Years $ 7.78 1.5% (3) Institutional Shareholder Base Weighted Avg. Cost Basis Analysis Institutional Shareholder Base Weighted Avg. Hold Period Analysis Over 10 Years 8.1% Under $5.50 $5.50 - $6.00 11.8% Over $8.00 7.1% Under 2 Years 20.6% 23.9% 7 - 10 Years 19.7% $7.00 - $8.00 14.8% $6.00 - $6.50 3 - 4 Years 28.8% 5 - 7 Years 23.3% 24.9% $6.50 - $7.00 17.0% 11 Source: S&P CapIQ and SEC Filings, (1) Share value as of June 21, 2024; (2) ; (3) Weighted average cost basis calculated based on the average share price in each period in which shares were purchased Source: Capital IQ as of May 12, 2021 (1) Based on a weighted average price per share at the time of purchase
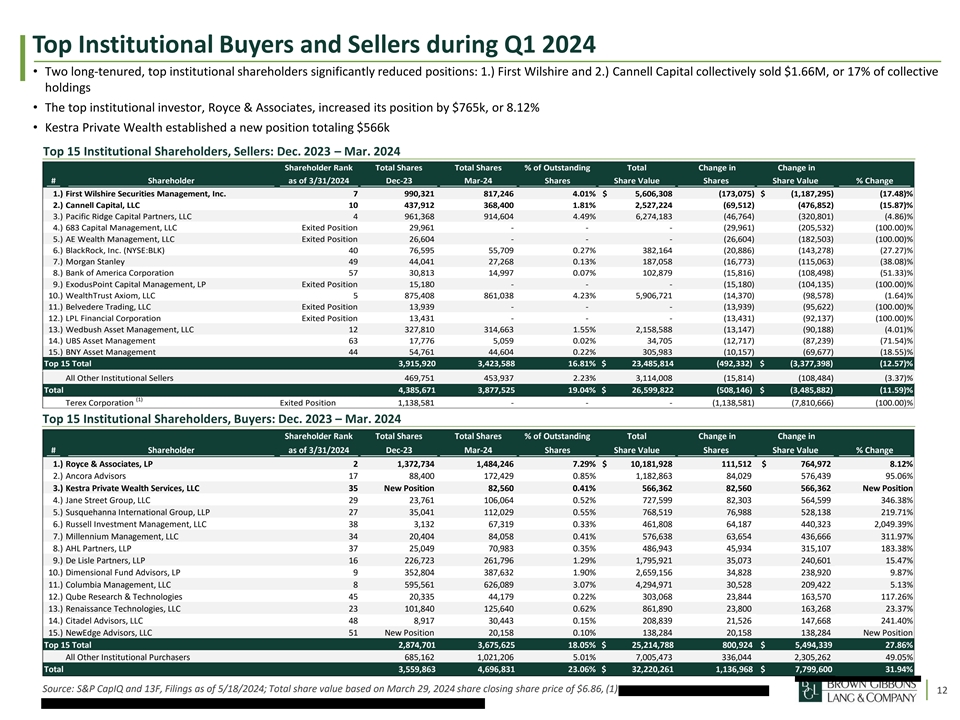
Top Institutional Buyers and Sellers during Q1 2024 • Two long-tenured, top institutional shareholders significantly reduced positions: 1.) First Wilshire and 2.) Cannell Capital collectively sold $1.66M, or 17% of collective holdings• (1) • The top institutional investor, Royce & Associates, increased its position by $765k, or 8.12% • Kestra Private Wealth established a new position totaling $566k Top 15 Institutional Shareholders, Sellers: Dec. 2023 – Mar. 2024 Shareholder Rank Total Shares Total Shares % of Outstanding Total Change in Change in # Shareholder as of 3/31/2024 Dec-23 Mar-24 Shares Share Value Shares Share Value % Change 1.) First Wilshire Securities Management, Inc. 7 990,321 817,246 4.01% $ 5,606,308 (173,075) $ ( 1,187,295) ( 17.48)% 2.) Cannell Capital, LLC 10 437,912 368,400 1.81% 2,527,224 (69,512) (476,852) (15.87)% 3.) Pacific Ridge Capital Partners, LLC 4 961,368 9 14,604 4.49% 6,274,183 (4 6,764) (320,801) (4.86)% 4.) 683 Capital Management, LLC Exited Position 2 9,961 - - - (2 9,961) (2 05,532) (1 00.00)% 5.) AE Wealth Management, LLC Exited Position 2 6,604 - - - (26,604) (182,503) (1 00.00)% 6.) BlackRock, Inc. (NYSE:BLK) 40 7 6,595 5 5,709 0.27% 382,164 (20,886) (143,278) (27.27)% 7.) Morgan Stanley 49 4 4,041 27,268 0.13% 187,058 (16,773) (115,063) (38.08)% 8.) Bank of America Corporation 57 3 0,813 1 4,997 0 .07% 1 02,879 (1 5,816) (108,498) (51.33)% 9.) ExodusPoint Capital Management, LP Exited Position 1 5,180 - - - (1 5,180) (104,135) (100.00)% 10.) WealthTrust Axiom, LLC 5 8 75,408 861,038 4.23% 5,906,721 (1 4,370) (9 8,578) (1 .64)% 11.) Belvedere Trading, LLC Exited Position 1 3,939 - - - (13,939) (9 5,622) (1 00.00)% 12.) LPL Financial Corporation Exited Position 1 3,431 - - - (1 3,431) (92,137) (100.00)% 13.) Wedbush Asset Management, LLC 12 3 27,810 314,663 1.55% 2,158,588 (13,147) (90,188) (4.01)% 14.) UBS Asset Management 63 1 7,776 5,059 0 .02% 34,705 (1 2,717) (87,239) (71.54)% 15.) BNY Asset Management 44 5 4,761 4 4,604 0.22% 3 05,983 (10,157) (6 9,677) (18.55)% Top 15 Total 3,915,920 3,423,588 16.81% $ 23,485,814 (492,332) $ (3,377,398) (12.57)% All Other Institutional Sellers 469,751 453,937 2.23% 3 ,114,008 (1 5,814) (108,484) (3 .37)% Total 4,385,671 3,877,525 19.04% $ 26,599,822 (508,146) $ (3,485,882) (11.59)% (1) Terex Corporation Exited Position 1,138,581 - - - (1,138,581) (7,810,666) (1 00.00)% Top 15 Institutional Shareholders, Buyers: Dec. 2023 – Mar. 2024 Shareholder Rank Total Shares Total Shares % of Outstanding Total Change in Change in # Shareholder as of 3/31/2024 Dec-23 Mar-24 Shares Share Value Shares Share Value % Change 1.) Royce & Associates, LP 2 1 ,372,734 1,484,246 7 .29% $ 1 0,181,928 1 11,512 $ 7 64,972 8 .12% 2.) Ancora Advisors 17 88,400 172,429 0 .85% 1,182,863 84,029 5 76,439 9 5.06% 3.) Kestra Private Wealth Services, LLC 35 New Position 82,560 0.41% 566,362 82,560 566,362 New Position 4.) Jane Street Group, LLC 29 2 3,761 106,064 0.52% 727,599 82,303 5 64,599 346.38% 5.) Susquehanna International Group, LLP 27 3 5,041 112,029 0 .55% 768,519 76,988 528,138 219.71% 6.) Russell Investment Management, LLC 38 3,132 67,319 0.33% 461,808 6 4,187 440,323 2,049.39% 7.) Millennium Management, LLC 34 20,404 8 4,058 0 .41% 5 76,638 63,654 436,666 3 11.97% 8.) AHL Partners, LLP 37 25,049 70,983 0.35% 486,943 4 5,934 3 15,107 183.38% 9.) De Lisle Partners, LLP 16 2 26,723 2 61,796 1 .29% 1 ,795,921 35,073 240,601 1 5.47% 10.) Dimensional Fund Advisors, LP 9 352,804 387,632 1.90% 2 ,659,156 3 4,828 238,920 9.87% 11.) Columbia Management, LLC 8 595,561 6 26,089 3.07% 4 ,294,971 30,528 209,422 5.13% 12.) Qube Research & Technologies 45 20,335 44,179 0.22% 3 03,068 2 3,844 163,570 117.26% 13.) Renaissance Technologies, LLC 23 101,840 125,640 0 .62% 861,890 23,800 163,268 2 3.37% 14.) Citadel Advisors, LLC 48 8,917 30,443 0 .15% 208,839 21,526 147,668 241.40% 15.) NewEdge Advisors, LLC 51 New Position 20,158 0.10% 138,284 2 0,158 138,284 New Position Top 15 Total 2,874,701 3,675,625 18.05% $ 25,214,788 800,924 $ 5,494,339 27.86% All Other Institutional Purchasers 6 85,162 1 ,021,206 5.01% 7,005,473 336,044 2,305,262 49.05% Total 3,559,863 4,696,831 23.06% $ 32,220,261 1,136,968 $ 7,799,600 31.94% Source: S&P CapIQ and 13F, Filings as of 5/18/2024; Total share value based on March 29, 2024 share closing share price of $6.86, (1) 12 Source: Capital IQ as of May 12, 2021 (1) Based on a weighted average price per share at the time of purchase

Bid Summary

Buyer Bid Progression LOI Value, June 2024 $194.7M $199.9M Refreshed Bid Value, May 2024 $195.1M $215.5M IOI Value, Q4 2023 / Q1 2024 $213.5M $193.3M $194.7M $190.0M $220.0M $170.0M $200.0M (1) (1) $160.0M $175.0M $183.0M $217.0M $160.0M $166.5M $200.0M $154.8M $180.6M $140M $160M $180M $200M $220M Enterprise Value 14 (1) Verbal Indication
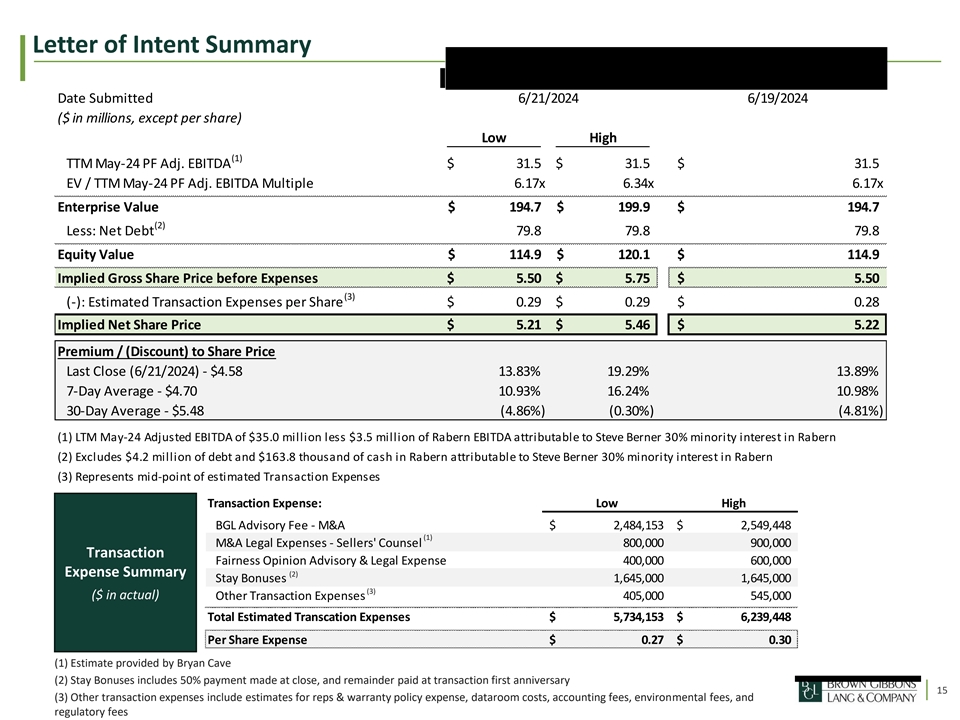
Letter of Intent Summary Date Submitted 6/21/2024 6/19/2024 ($ in millions, except per share) Low High (1) TTM May-24 PF Adj. EBITDA $ 31.5 $ 3 1.5 $ 31.5 EV / TTM May-24 PF Adj. EBITDA Multiple 6.17x 6.34x 6.17x Enterprise Value $ 194.7 $ 199.9 $ 1 94.7 (2) Less: Net Debt 79.8 79.8 7 9.8 Equity Value $ 114.9 $ 120.1 $ 1 14.9 Implied Gross Share Price before Expenses $ 5.50 $ 5.75 $ 5.50 (3) (-): Estimated Transaction Expenses per Share $ 0.29 $ 0 .29 $ 0.28 Implied Net Share Price $ 5 .21 $ 5 .46 $ 5.22 Premium / (Discount) to Share Price Last Close (6/21/2024) - $4.58 13.83% 19.29% 13.89% 7-Day Average - $4.70 10.93% 16.24% 10.98% 30-Day Average - $5.48 ( 4.86%) ( 0.30%) (4.81%) (1) LTM May-24 Adjusted EBITDA of $35.0 million less $3.5 million of Rabern EBITDA attributable to Steve Berner 30% minority interest in Rabern (2) Excludes $4.2 million of debt and $163.8 thousand of cash in Rabern attributable to Steve Berner 30% minority interest in Rabern (3) Represents mid-point of estimated Transaction Expenses Transaction Expense: Low High BGL Advisory Fee - M&A $ 2 ,484,153 $ 2 ,549,448 (1) M&A Legal Expenses - Sellers' Counsel 8 00,000 900,000 Transaction Fairness Opinion Advisory & Legal Expense 400,000 6 00,000 Expense Summary (2) Stay Bonuses 1,645,000 1,645,000 (3) ($ in actual) Other Transaction Expenses 405,000 5 45,000 Total Estimated Transcation Expenses $ 5 ,734,153 $ 6 ,239,448 Per Share Expense $ 0.27 $ 0.30 (1) Estimate provided by Bryan Cave (2) Stay Bonuses includes 50% payment made at close, and remainder paid at transaction first anniversary 15 (3) Other transaction expenses include estimates for reps & warranty policy expense, dataroom costs, accounting fees, environmental fees, and regulatory fees
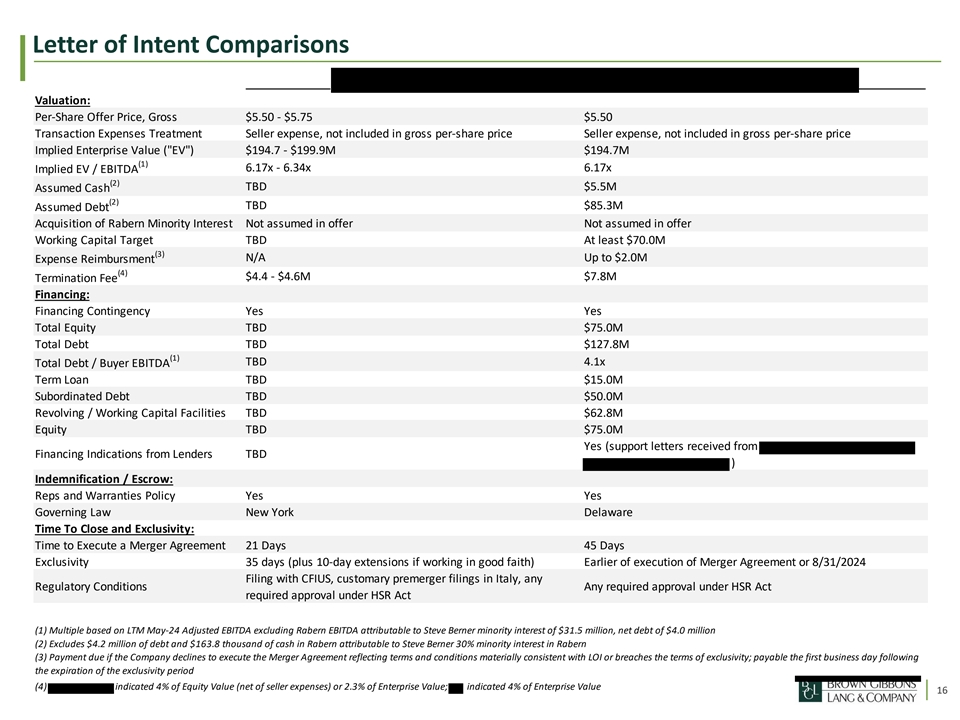
Letter of Intent Comparisons Valuation: Per-Share Offer Price, Gross $5.50 - $5.75 $5.50 Transaction Expenses Treatment Seller expense, not included in gross per-share price Seller expense, not included in gross per-share price Implied Enterprise Value ( EV ) $194.7 - $199.9M $194.7M (1) 6.17x - 6.34x 6.17x Implied EV / EBITDA (2) TBD $5.5M Assumed Cash (2) TBD $85.3M Assumed Debt Acquisition of Rabern Minority Interest Not assumed in offer Not assumed in offer Working Capital Target TBD At least $70.0M (3) N/A Up to $2.0M Expense Reimbursment (4) $4.4 - $4.6M $7.8M Termination Fee Financing: Financing Contingency Yes Yes Total Equity TBD $75.0M Total Debt TBD $127.8M (1) TBD 4.1x Total Debt / Buyer EBITDA Term Loan TBD $15.0M Subordinated Debt TBD $50.0M Revolving / Working Capital Facilities TBD $62.8M Equity TBD $75.0M Yes (support letters received from Financing Indications from Lenders TBD ) Indemnification / Escrow: Reps and Warranties Policy Yes Yes Governing Law New York Delaware Time To Close and Exclusivity: Time to Execute a Merger Agreement 21 Days 45 Days Exclusivity 35 days (plus 10-day extensions if working in good faith) Earlier of execution of Merger Agreement or 8/31/2024 Filing with CFIUS, customary premerger filings in Italy, any Regulatory Conditions Any required approval under HSR Act required approval under HSR Act (1) Multiple based on LTM May-24 Adjusted EBITDA excluding Rabern EBITDA attributable to Steve Berner minority interest of $31.5 million, net debt of $4.0 million (2) Excludes $4.2 million of debt and $163.8 thousand of cash in Rabern attributable to Steve Berner 30% minority interest in Rabern (3) Payment due if the Company declines to execute the Merger Agreement reflecting terms and conditions materially consistent with LOI or breaches the terms of exclusivity; payable the first business day following the expiration of the exclusivity period (4) indicated 4% of Equity Value (net of seller expenses) or 2.3% of Enterprise Value; indicated 4% of Enterprise Value 16
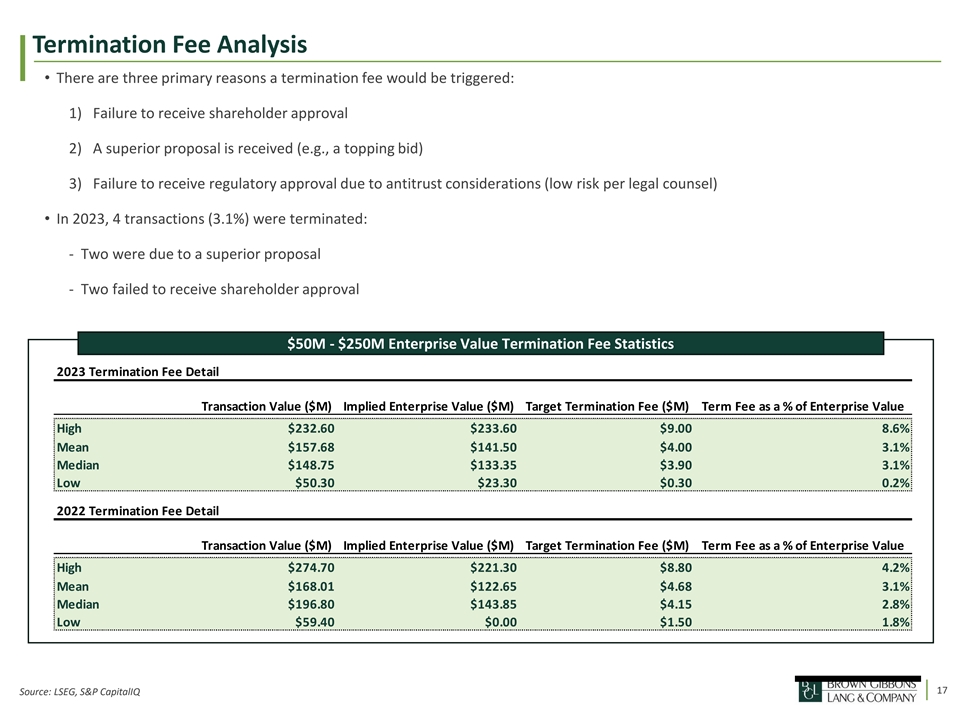
Termination Fee Analysis • There are three primary reasons a termination fee would be triggered: 1) Failure to receive shareholder approval 2) A superior proposal is received (e.g., a topping bid) 3) Failure to receive regulatory approval due to antitrust considerations (low risk per legal counsel) • In 2023, 4 transactions (3.1%) were terminated: - Two were due to a superior proposal - Two failed to receive shareholder approval $50M - $250M Enterprise Value Termination Fee Statistics 2023 Termination Fee Detail Transaction Value ($M) Implied Enterprise Value ($M) Target Termination Fee ($M) Term Fee as a % of Enterprise Value High $232.60 $233.60 $9.00 8.6% Mean $157.68 $141.50 $4.00 3.1% Median $148.75 $133.35 $3.90 3.1% Low $50.30 $23.30 $0.30 0.2% 2022 Termination Fee Detail Transaction Value ($M) Implied Enterprise Value ($M) Target Termination Fee ($M) Term Fee as a % of Enterprise Value High $274.70 $221.30 $8.80 4.2% Mean $168.01 $122.65 $4.68 3.1% Median $196.80 $143.85 $4.15 2.8% Low $59.40 $0.00 $1.50 1.8% 17 Source: LSEG, S&P CapitalIQ

Investor Profiles 18
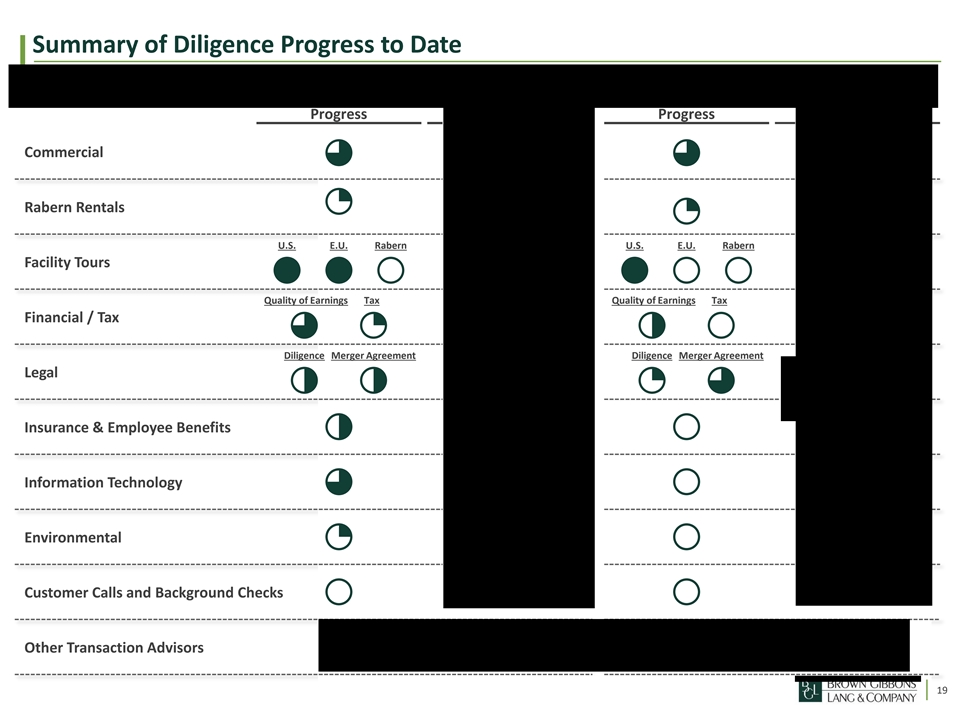
Summary of Diligence Progress to Date Progress Progress Commercial ◕◕ Rabern Rentals ◔ ◔ U.S. E.U. Rabern U.S. E.U. Rabern Facility Tours ●●○●○○ Quality of Earnings Tax Quality of Earnings Tax Financial / Tax ◕◔◑○ Diligence Merger Agreement Diligence Merger Agreement Legal ◑◑◔◕ Insurance & Employee Benefits ◑○ Information Technology ◕○ Environmental ◔○ Customer Calls and Background Checks ○○ Other Transaction Advisors 19
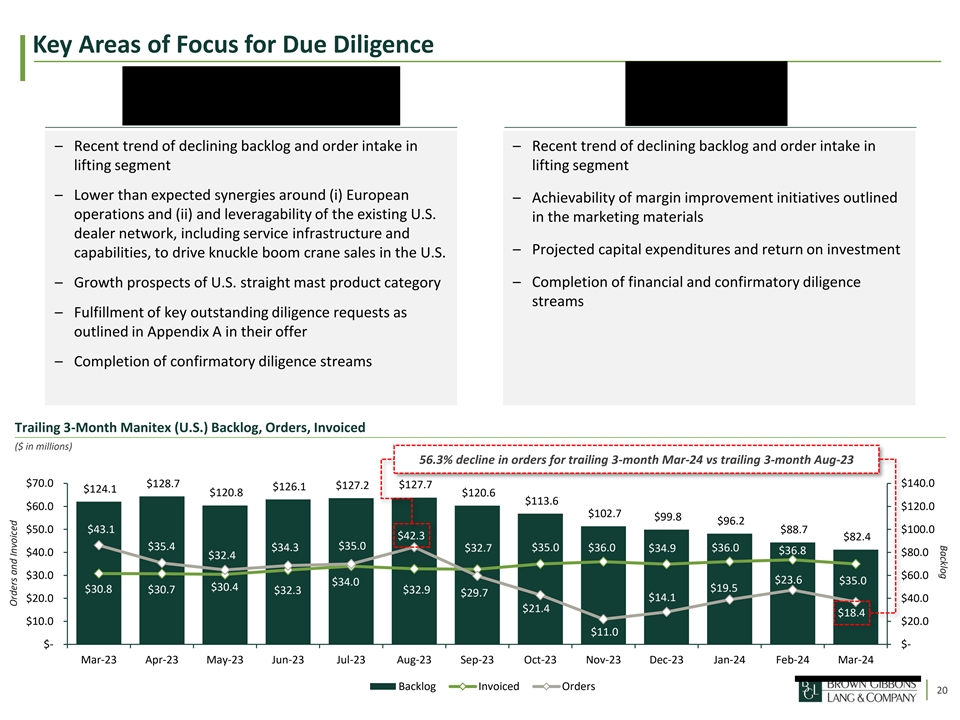
Backlog Key Areas of Focus for Due Diligence – Recent trend of declining backlog and order intake in – Recent trend of declining backlog and order intake in lifting segment lifting segment – Lower than expected synergies around (i) European – Achievability of margin improvement initiatives outlined operations and (ii) and leveragability of the existing U.S. in the marketing materials dealer network, including service infrastructure and – Projected capital expenditures and return on investment capabilities, to drive knuckle boom crane sales in the U.S. – Completion of financial and confirmatory diligence – Growth prospects of U.S. straight mast product category streams – Fulfillment of key outstanding diligence requests as outlined in Appendix A in their offer – Completion of confirmatory diligence streams Trailing 3-Month Manitex (U.S.) Backlog, Orders, Invoiced ($ in millions) 56.3% decline in orders for trailing 3-month Mar-24 vs trailing 3-month Aug-23 $70.0 $140.0 $128.7 $127.2 $127.7 $126.1 $124.1 $120.8 $120.6 $113.6 $60.0 $120.0 $102.7 $99.8 $96.2 $50.0 $43.1 $88.7 $100.0 $42.3 $82.4 $35.0 $35.4 $34.3 $32.7 $35.0 $36.0 $34.9 $36.0 $36.8 $40.0 $80.0 $32.4 $30.0 $60.0 $23.6 $34.0 $35.0 $30.4 $19.5 $30.8 $30.7 $32.9 $32.3 $29.7 $14.1 $20.0 $40.0 $21.4 $18.4 $10.0 $20.0 $11.0 $- $- Mar-23 Apr-23 May-23 Jun-23 Jul-23 Aug-23 Sep-23 Oct-23 Nov-23 Dec-23 Jan-24 Feb-24 Mar-24 Backlog Invoiced Orders 20 Orders and Invoiced

Process Timeline File Proxy with SEC for Comments (Statutory 10-Day Comment 1-Week to Negotiate LOIs and Receive “Best and Final” Offer; Assumed July A E Waiting Period); Initiate Shareholder Campaign and Proxy 1 Execution of LOI Solicitation Process Once Waiting Period Concludes (T+10) 21-Day Stated Period to Finalize Diligence / Negotiate Merger Agreement; B Extended to 45-Days based on Management estimates to fulfill diligence Begin Antitrust Filing Once Merger Agreement is Signed; Not F Required in EU or Individual European Countries (€500M Italy Begin Proxy Filing Preparation and Fairness Opinion Analysis Shortly After Threshold); 30-Day HSR Waiting Period C LOI Execution to Allow Ample Time to Complete Shareholder Vote / Close Transaction; 30-Day Minimum Approval Board Approval, Sign Merger Agreement / Submit Fairness Opinion; Once D G Process with Potential for Rolling Period (T+40) Signed, Joint Public Announcement of Transaction and Filing of 8-K (“T”) Week 1 Week 2 Week 3 Week 4 Week 5 Week 6 Week 7 Week 8 Week 9 Week 10 Week 11 Week 12 7/1/2024 7/7/2024 7/14/2024 7/21/2024 7/28/2024 8/4/2024 8/11/2024 8/18/2024 8/25/2024 9/1/2024 9/8/2024 9/15/2024 8/7 10-Q Filing Execute LOI A Buyer Final Diligence / Negotiate ~21-Day Stated Diligence (1) ~24-Day Extension B Merger Agreement Period Begin Proxy Filing Preparation C C Kickoff Fairness Opinion Analysis Board Approval; Sign Merger D Agreement / Submit Fairness Opinion Waiting Period File Proxy with SEC for Comments E (10-Days) F Antitrust Filing / Clearance Shareholder Vote / Close G Transaction 21 Timeline (in Weeks) (1) Based on initial management feedback

Next Steps

Recommended Next Steps Final Negotiation • Board of Directors to authorize BGL to negotiate LOIs with both parties, pushing to receive “best and final” offers and clarifying key terms and diligence points ─ Negotiation and clarification • ─ Requirements to eliminate valuation range and arrive at single price per share ─ Ability to improve offer value ─ Status of financing parties, anticipated debt partners and capital structure ─ Execution details and explanation of proposed diligence “Clean Team” ─ Evaluate willingness to advance without exclusivity (i.e., backup party with expense reimbursement) • ─ Ability to improve offer value ─ Potential to reduce or restructure expense reimbursement and breakup fee ─ Proposed diligence execution plan details ─ Evaluate willingness to advance without exclusivity (i.e., backup party with expense reimbursement) • Evaluate additional buyer feedback with the Board of Directors (“BoD”); Communicate BoD decision to both parties • Following negotiations, evaluate dual path strategy in which lead party is not granted exclusivity, and backup bidder is granted expense reimbursement Kickoff Final Due Diligence • Expected timeline of at least 45 days to complete remaining diligence • Initiate proxy preparation • Initiate Fairness Opinion process • Assess Vallum Advisors’ ability to successfully execute proxy campaign • Negotiate and prepare to execute Definitive Merger Agreement Merger Agreement Execution • File and receive Proxy documents • Clear antitrust approval • Initiate proxy campaign • Receive Shareholder approval 23
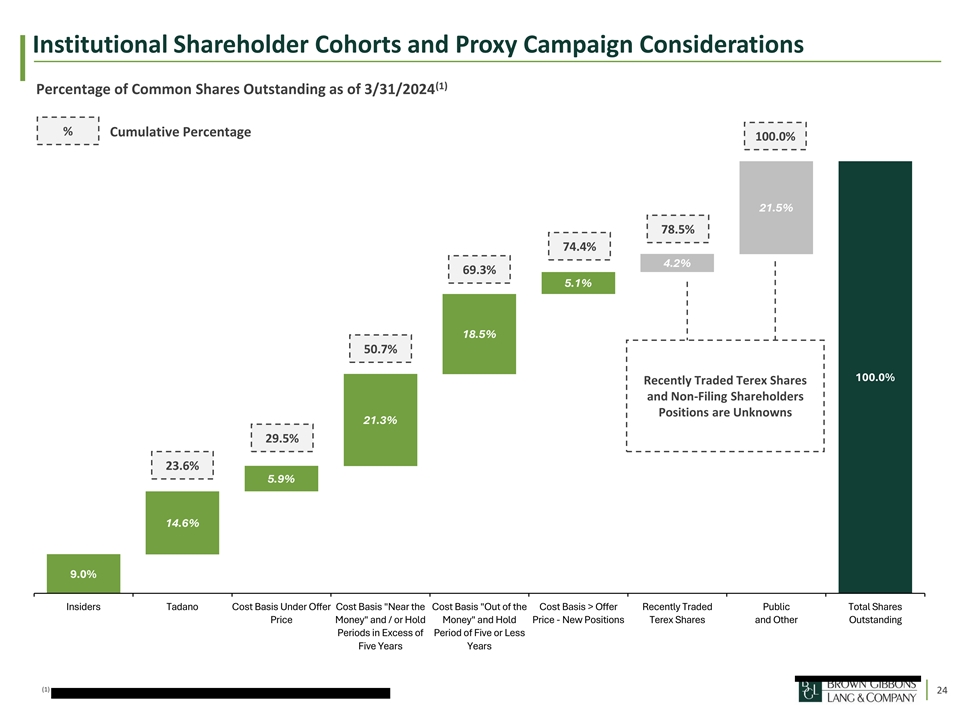
Institutional Shareholder Cohorts and Proxy Campaign Considerations (1) Percentage of Common Shares Outstanding as of 3/31/2024 % Cumulative Percentage 100.0% 21.5% 78.5% 74.4% 4.2% 69.3% 5.1% 18.5% 50.7% 100.0% Recently Traded Terex Shares and Non-Filing Shareholders Positions are Unknowns 21.3% 29.5% 23.6% 5.9% 14.6% 9.0% Insiders Tadano Cost Basis Under Offer Cost Basis Near the Cost Basis Out of the Cost Basis > Offer Recently Traded Public Total Shares Price Money and / or Hold Money and Hold Price - New Positions Terex Shares and Other Outstanding Periods in Excess of Period of Five or Less Five Years Years (1) 24
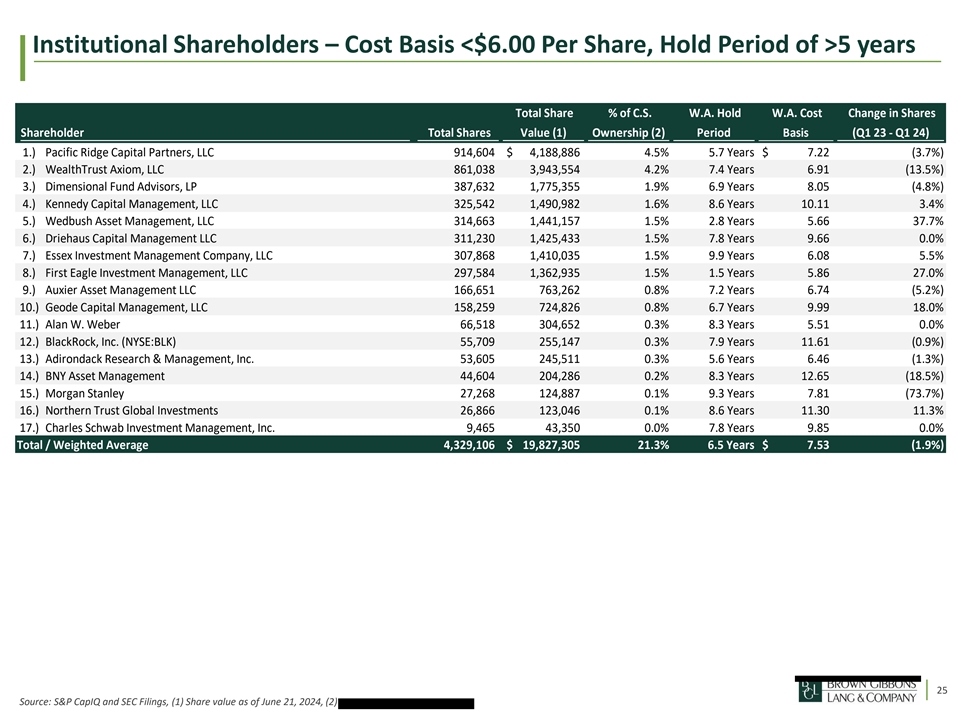
Institutional Shareholders – Cost Basis <$6.00 Per Share, Hold Period of >5 years Total Share % of C.S. W.A. Hold W.A. Cost Change in Shares Shareholder Total Shares Value (1) Ownership (2) Period Basis (Q1 23 - Q1 24) 1.) Pacific Ridge Capital Partners, LLC 914,604 $ 4,188,886 4.5% 5.7 Years $ 7.22 (3.7%) 2.) WealthTrust Axiom, LLC 861,038 3,943,554 4.2% 7.4 Years 6.91 (13.5%) 3.) Dimensional Fund Advisors, LP 387,632 1,775,355 1.9% 6.9 Years 8.05 (4.8%) (1) (2) 4.) Kennedy Capital Management, LLC 325,542 1,490,982 1.6% 8.6 Years 10.11 3.4% 5.) Wedbush Asset Management, LLC 314,663 1,441,157 1.5% 2.8 Years 5.66 37.7% 6.) Driehaus Capital Management LLC 311,230 1,425,433 1.5% 7.8 Years 9.66 0.0% 7.) Essex Investment Management Company, LLC 307,868 1,410,035 1.5% 9.9 Years 6.08 5.5% 8.) First Eagle Investment Management, LLC 297,584 1,362,935 1.5% 1.5 Years 5.86 27.0% 9.) Auxier Asset Management LLC 166,651 763,262 0.8% 7.2 Years 6.74 (5.2%) 10.) Geode Capital Management, LLC 158,259 724,826 0.8% 6.7 Years 9.99 18.0% 11.) Alan W. Weber 66,518 304,652 0.3% 8.3 Years 5.51 0.0% 12.) BlackRock, Inc. (NYSE:BLK) 55,709 255,147 0.3% 7.9 Years 11.61 (0.9%) 13.) Adirondack Research & Management, Inc. 53,605 245,511 0.3% 5.6 Years 6.46 (1.3%) 14.) BNY Asset Management 44,604 204,286 0.2% 8.3 Years 12.65 (18.5%) 15.) Morgan Stanley 27,268 124,887 0.1% 9.3 Years 7.81 (73.7%) 16.) Northern Trust Global Investments 26,866 123,046 0.1% 8.6 Years 11.30 11.3% 17.) Charles Schwab Investment Management, Inc. 9,465 43,350 0.0% 7.8 Years 9.85 0.0% Total / Weighted Average 4,329,106 $ 19,827,305 21.3% 6.5 Years $ 7.53 (1.9%) 25 Source: S&P CapIQ and SEC Filings, (1) Share value as of June 21, 2024, (2)

Institutional Shareholders – Cost Basis >$6.00 Per Share, Hold Period of <5 years • Evaluate each buyer individually to evaluate likelihood of approving transaction Total Share % of C.S. W.A. Hold W.A. Cost Change in Shares Shareholder Total Shares Value (1) Ownership (2) Period Basis (Q1 23 - Q1 24) 1.) Royce & Associates, LP 1,484,246 $ 6,797,847 7.3% 3.1 Years $ 6.31 1.1% 2.) Vanguard Group 858,483 3,931,852 4.2% 4.8 Years 8.88 325.1% (1) (2) 3.) Columbia Management, LLC 626,089 2,867,488 3.1% 3.8 Years 6.24 (32.9%) 4.) Cannell Capital, LLC 368,400 1,687,272 1.8% 4.0 Years 6.96 (15.4%) 5.) De Lisle Partners, LLP 261,796 1,199,026 1.3% 3.5 Years 6.84 19.4% 6.) Renaissance Technologies, LLC 125,640 575,431 0.6% 3.6 Years 6.07 26.2% 7.) Citadel Advisors, LLC 30,443 139,429 0.1% 4.3 Years 7.11 (20.3%) 8.) Janney Montgomery Scott, LLC 15,000 68,700 0.1% 6.3 Years 7.08 0.0% 9.) Lord, Abbett & Company, LLC 2,382 10,910 0.0% 5.7 Years 8.79 4.0% 10.) Wells Fargo & Company 112 513 0.0% 5.4 Years 7.92 17.9% Total / Weighted Average 3,772,591 $ 17,278,467 18.5% 3.8 Years $ 6.99 10.6% 26 Source: S&P CapIQ and SEC Filings, (1) Share value as of June 21, 2024, (2)

Institutional Shareholders – New Positions Total Share % of C.S. W.A. Hold W.A. Cost Shareholder Total Shares Value (1) Ownership (2) Period Basis 1.) Ancora Advisors, LLC 172,429 $ 789,725 0.8% 1.4 Years $ 7.48 2.) Susquehanna International Group, LLP 112,029 513,093 0.6% 0.1 Years 7.45 3.) Jane Street Group, LLC 106,064 485,773 0.5% 0.1 Years 7.28 4.) Millennium Management, LLC 84,058 384,986 0.4% 0.1 Years 7.32 (1) (2) 5.) Kestra Private Wealth Services, LLC 82,560 378,125 0.4% 0.0 Years 6.86 6.) AHL Partners, LLP 70,983 325,102 0.3% 0.1 Years 7.52 7.) Russell Investment Management, LLC 67,319 308,321 0.3% 0.0 Years 6.95 8.) State Street Global Advisors, Inc. 52,982 242,658 0.3% 2.0 Years 7.27 9.) Qube Research & Technologies 44,179 202,340 0.2% 0.1 Years 7.73 10.) O'Shaughnessy Asset Management, LLC 34,620 158,560 0.2% 0.2 Years 8.42 11.) JPMorgan Chase & Co. 34,499 158,005 0.2% 0.2 Years 8.38 12.) NewEdge Advisors, LLC 20,158 92,324 0.1% 0.0 Years 6.86 13.) Cutter & Company, Inc. 18,719 85,733 0.1% 0.0 Years 6.86 14.) Wyoming State Treasurer 17,791 81,483 0.1% 0.8 Years 7.33 15.) XTX Holdings Limited 16,245 74,402 0.1% 0.0 Years 6.86 16.) Y-Intercept Limited 15,890 72,776 0.1% 0.0 Years 6.86 17.) Bank of America Corporation 14,997 68,686 0.1% 0.3 Years 8.74 18.) Ritholtz Wealth Management 14,718 67,408 0.1% 0.2 Years 8.48 19.) Jump Trading, LLC 11,888 54,447 0.1% 0.0 Years 6.86 20.) RBC Global Asset Management 10,000 45,800 0.0% 0.3 Years 8.74 21.) My Personal CFO, LLC 10,000 45,800 0.0% 0.3 Years 8.74 22.) UBS Asset Management 5,059 23,170 0.0% 0.2 Years 7.66 23.) Simplex Trading, LLC 3,535 16,190 0.0% 2.3 Years 9.31 24.) Leap Investments, LP 3,500 16,030 0.0% 0.0 Years 6.86 25.) Acadian Asset Management, LLC 3,126 14,317 0.0% 0.0 Years 6.86 26.) Victory Capital Management Inc. 1,860 8,519 0.0% 0.0 Years 6.86 27.) Citigroup Inc. 952 4,360 0.0% 0.6 Years 8.69 28.) First Command Advisory Services 275 1,260 0.0% 1.8 Years 6.49 29.) Vision2020 Wealth Management Corp. 133 609 0.0% 1.8 Years 6.58 30.) Strategic Advisers, LLC 52 238 0.0% 0.0 Years 6.86 Total / Weighted Average 1,030,620 $ 4,720,240 5.1% 0.4 Years $ 7.43 27 Source: S&P CapIQ and SEC Filings, (1) Share value as of June 21, 2024, (2)
Appendix
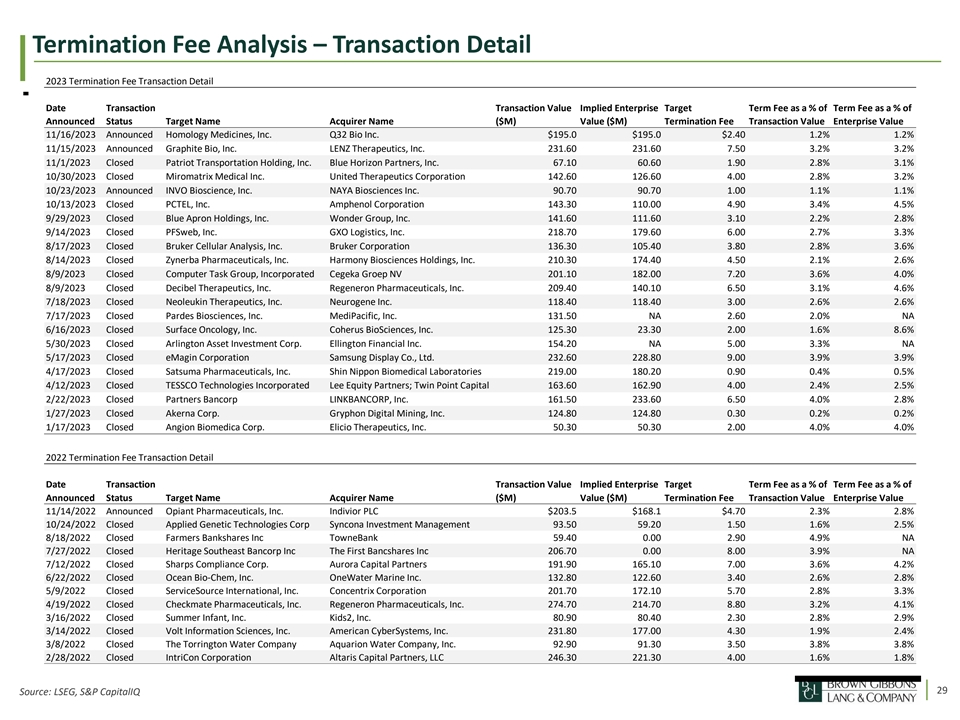
Termination Fee Analysis – Transaction Detail 2023 Termination Fee Transaction Detail Date Transaction Transaction Value Implied Enterprise Target Term Fee as a % of Term Fee as a % of Announced Status Target Name Acquirer Name ($M) Value ($M) Termination Fee Transaction Value Enterprise Value 11/16/2023 Announced Homology Medicines, Inc. Q32 Bio Inc. $195.0 $195.0 $2.40 1.2% 1.2% 11/15/2023 Announced Graphite Bio, Inc. LENZ Therapeutics, Inc. 231.60 231.60 7.50 3.2% 3.2% 11/1/2023 Closed Patriot Transportation Holding, Inc. Blue Horizon Partners, Inc. 67.10 60.60 1.90 2.8% 3.1% 10/30/2023 Closed Miromatrix Medical Inc. United Therapeutics Corporation 142.60 126.60 4.00 2.8% 3.2% 10/23/2023 Announced INVO Bioscience, Inc. NAYA Biosciences Inc. 90.70 90.70 1.00 1.1% 1.1% 10/13/2023 Closed PCTEL, Inc. Amphenol Corporation 143.30 110.00 4.90 3.4% 4.5% 9/29/2023 Closed Blue Apron Holdings, Inc. Wonder Group, Inc. 141.60 111.60 3.10 2.2% 2.8% 9/14/2023 Closed PFSweb, Inc. GXO Logistics, Inc. 218.70 179.60 6.00 2.7% 3.3% 8/17/2023 Closed Bruker Cellular Analysis, Inc. Bruker Corporation 136.30 105.40 3.80 2.8% 3.6% 8/14/2023 Closed Zynerba Pharmaceuticals, Inc. Harmony Biosciences Holdings, Inc. 210.30 174.40 4.50 2.1% 2.6% 8/9/2023 Closed Computer Task Group, Incorporated Cegeka Groep NV 201.10 182.00 7.20 3.6% 4.0% 8/9/2023 Closed Decibel Therapeutics, Inc. Regeneron Pharmaceuticals, Inc. 209.40 140.10 6.50 3.1% 4.6% 7/18/2023 Closed Neoleukin Therapeutics, Inc. Neurogene Inc. 118.40 118.40 3.00 2.6% 2.6% 7/17/2023 Closed Pardes Biosciences, Inc. MediPacific, Inc. 131.50 NA 2.60 2.0% NA 6/16/2023 Closed Surface Oncology, Inc. Coherus BioSciences, Inc. 125.30 23.30 2.00 1.6% 8.6% 5/30/2023 Closed Arlington Asset Investment Corp. Ellington Financial Inc. 154.20 NA 5.00 3.3% NA 5/17/2023 Closed eMagin Corporation Samsung Display Co., Ltd. 232.60 228.80 9.00 3.9% 3.9% 4/17/2023 Closed Satsuma Pharmaceuticals, Inc. Shin Nippon Biomedical Laboratories 219.00 180.20 0.90 0.4% 0.5% 4/12/2023 Closed TESSCO Technologies Incorporated Lee Equity Partners; Twin Point Capital 163.60 162.90 4.00 2.4% 2.5% 2/22/2023 Closed Partners Bancorp LINKBANCORP, Inc. 161.50 233.60 6.50 4.0% 2.8% 1/27/2023 Closed Akerna Corp. Gryphon Digital Mining, Inc. 124.80 124.80 0.30 0.2% 0.2% 1/17/2023 Closed Angion Biomedica Corp. Elicio Therapeutics, Inc. 50.30 50.30 2.00 4.0% 4.0% 2022 Termination Fee Transaction Detail Date Transaction Transaction Value Implied Enterprise Target Term Fee as a % of Term Fee as a % of Announced Status Target Name Acquirer Name ($M) Value ($M) Termination Fee Transaction Value Enterprise Value 11/14/2022 Announced Opiant Pharmaceuticals, Inc. Indivior PLC $203.5 $168.1 $4.70 2.3% 2.8% 10/24/2022 Closed Applied Genetic Technologies Corp Syncona Investment Management 93.50 59.20 1.50 1.6% 2.5% 8/18/2022 Closed Farmers Bankshares Inc TowneBank 59.40 0.00 2.90 4.9% NA 7/27/2022 Closed Heritage Southeast Bancorp Inc The First Bancshares Inc 206.70 0.00 8.00 3.9% NA 7/12/2022 Closed Sharps Compliance Corp. Aurora Capital Partners 191.90 165.10 7.00 3.6% 4.2% 6/22/2022 Closed Ocean Bio-Chem, Inc. OneWater Marine Inc. 132.80 122.60 3.40 2.6% 2.8% 5/9/2022 Closed ServiceSource International, Inc. Concentrix Corporation 201.70 172.10 5.70 2.8% 3.3% 4/19/2022 Closed Checkmate Pharmaceuticals, Inc. Regeneron Pharmaceuticals, Inc. 274.70 214.70 8.80 3.2% 4.1% 3/16/2022 Closed Summer Infant, Inc. Kids2, Inc. 80.90 80.40 2.30 2.8% 2.9% 3/14/2022 Closed Volt Information Sciences, Inc. American CyberSystems, Inc. 231.80 177.00 4.30 1.9% 2.4% 3/8/2022 Closed The Torrington Water Company Aquarion Water Company, Inc. 92.90 91.30 3.50 3.8% 3.8% 2/28/2022 Closed IntriCon Corporation Altaris Capital Partners, LLC 246.30 221.30 4.00 1.6% 1.8% 29 Source: LSEG, S&P CapitalIQ
Marketing Update – Buyer Outreach 30

Marketing Update – Buyer Outreach Cont’d 31
Marketing Update – Buyer Outreach Cont’d 32
Marketing Update – Buyer Outreach Cont’d 33

Marketing Update – Buyer Outreach Cont’d 34