Exhibit (C)(7) STRICTLY CONFIDENTIAL FEBRUARY 2024 The blacked out information indicates information has been omitted on the basis of a confidential treatment request pursuant to Rule 24b-2 of the Securities Exchange Act of 1934, as amended. This information has been filed separately with the Securities and Exchange Commission. Discussion Materials of Brown Gibbons Lang & Company for the Board of Directors of Manitex, dated February 26, 2024. Project ELEVATE Board of Directors Meeting Discussion Materials February 26, 2024 • • • CH CH CH CHI I I ICA CA CA CAG G G GO O O O • • • • C C C CL L L LE E E EV V V VE E E EL L L LAN AN AN AND D D D • • • • P P P PHI HI HI HIL L L LA A A AD D D DE E E EL L L LP P P PHI HI HI HIA A A A • • • • SAN SAN SAN SAN AN AN AN ANT T T TO O O ON N N NI I I IO O O O B B B BG G G GLCO. LCO. LCO. LCO.COM COM COM COM
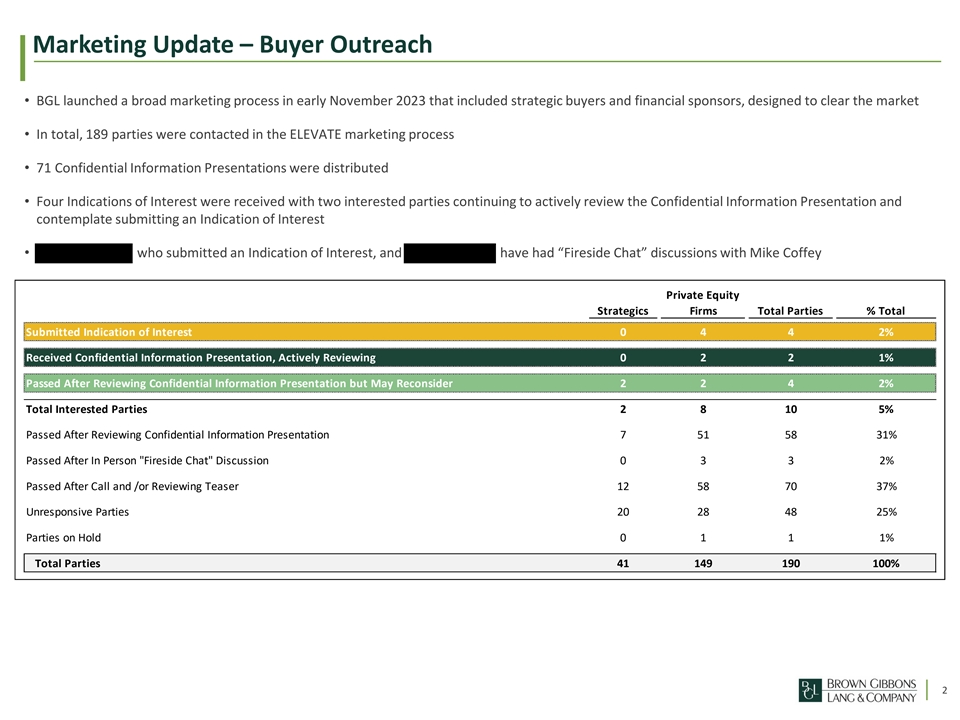
Marketing Update – Buyer Outreach • BGL launched a broad marketing process in early November 2023 that included strategic buyers and financial sponsors, designed to clear the market • In total, 189 parties were contacted in the ELEVATE marketing process • 71 Confidential Information Presentations were distributed • Four Indications of Interest were received with two interested parties continuing to actively review the Confidential Information Presentation and contemplate submitting an Indication of Interest • who submitted an Indication of Interest, and have had “Fireside Chat” discussions with Mike Coffey Private Equity Strategics Firms Total Parties % Total Submitted Indication of Interest 0 4 4 2% Received Confidential Information Presentation, Actively Reviewing 0 2 2 1% Passed After Reviewing Confidential Information Presentation but May Reconsider 2 2 4 2% Total Interested Parties 2 8 10 5% Passed After Reviewing Confidential Information Presentation 7 51 58 31% Passed After In Person Fireside Chat Discussion 0 3 3 2% Passed After Call and /or Reviewing Teaser 12 58 70 37% Unresponsive Parties 20 28 48 25% Parties on Hold 0 1 1 1% Total Parties 41 149 190 100% 2
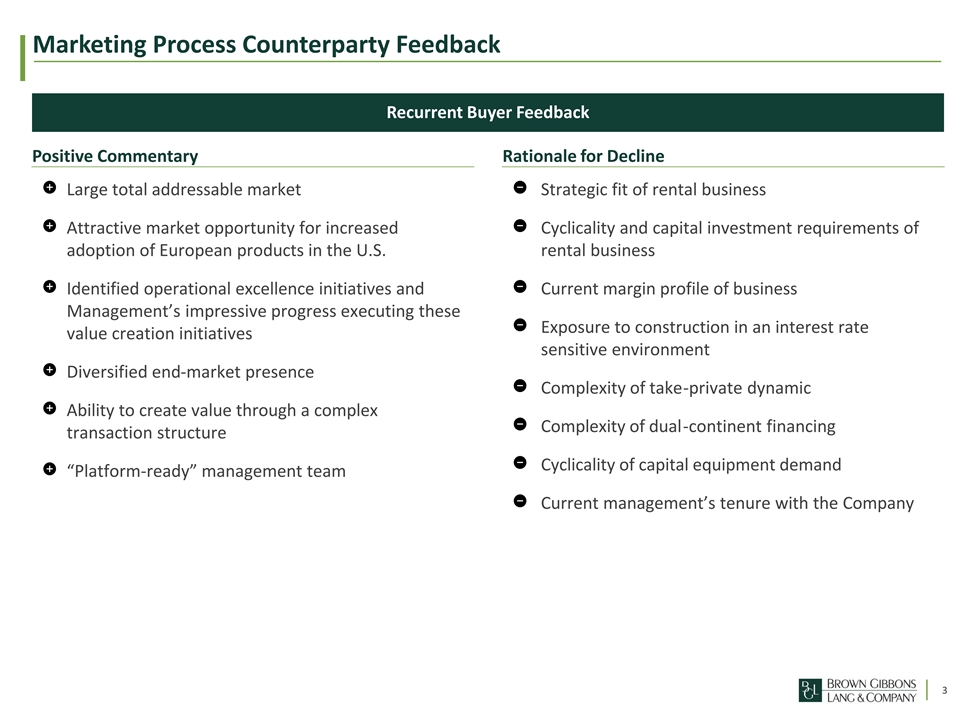
Marketing Process Counterparty Feedback Recurrent Buyer Feedback Positive Commentary Rationale for Decline Large total addressable market Strategic fit of rental business Attractive market opportunity for increased Cyclicality and capital investment requirements of adoption of European products in the U.S. rental business Identified operational excellence initiatives and Current margin profile of business Management’s impressive progress executing these Exposure to construction in an interest rate value creation initiatives sensitive environment Diversified end-market presence Complexity of take-private dynamic Ability to create value through a complex Complexity of dual-continent financing transaction structure Cyclicality of capital equipment demand “Platform-ready” management team Current management’s tenure with the Company 3
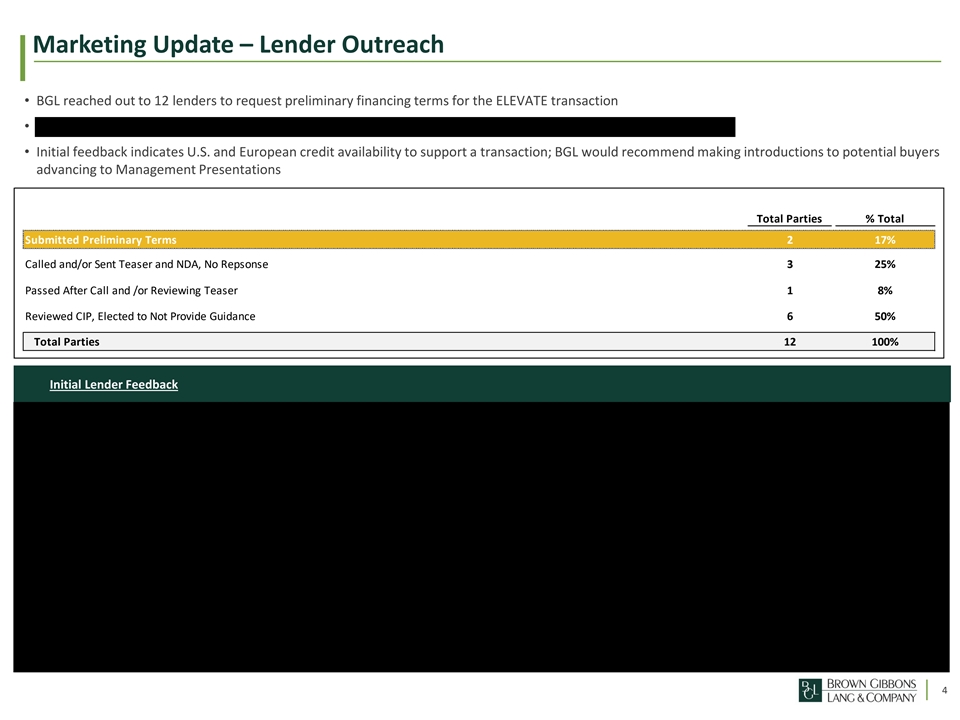
Marketing Update – Lender Outreach • BGL reached out to 12 lenders to request preliminary financing terms for the ELEVATE transaction • • Initial feedback indicates U.S. and European credit availability to support a transaction; BGL would recommend making introductions to potential buyers advancing to Management Presentations Total Parties % Total Submitted Preliminary Terms 2 17% Called and/or Sent Teaser and NDA, No Repsonse 3 25% Passed After Call and /or Reviewing Teaser 1 8% Reviewed CIP, Elected to Not Provide Guidance 6 50% Total Parties 12 100% Initial Lender Feedback 4

Outstanding Parties Actively Reviewing or Indicated Desire to Review # Buyer Commentary Actively Reviewing CIP Other Parties Interested and Contemplating Executing NDA Passed After Reviewing Confidential Information Presentation but May Reconsider 5


Indications of Interest Valuation Summary as of February 26, 2024 FY2023 PF Adj. EBITDA $ 33.3 3-Year Avg. PF Adj. EBITDA 25. 2 5-Year Avg. PF Adj. EBITDA 22. 2 Date Submitted 12/21/2023 12/22/2023 12/21/2023 1/25/2024 (in millions) Low High Low High Low High Low High FY2023 PF Adj. EBITDA $ 33. 3 $ 33. 3 $ 33.3 $ 33.3 $ 33. 3 $ 33.3 $ 33. 3 $ 33. 3 EV / FY2023 PF Adj. EBITDA Multiple 4.6x 5.4x 5.0x 6.0x 5.1x 6.0x 5.5x 6.5x Enterprise Value $ 154.8 $ 180.6 $ 166.5 $ 200.0 $ 170.0 $ 200.0 $ 183.0 $ 217.0 Multiple on 3-Year Average PF Adj. EBITDA 6.2x 7.2x 6.6x 8.0x 6.8x 8.0x 7.3x 8.6x Multiple on 5-Year Average PF Adj. EBITDA 7.0x 8.2x 7.5x 9.0x 7.7x 9.0x 8.3x 9.8x (4) Implied Gross Share Price $ 3.42 $ 4. 70 $ 4. 00 $ 5. 65 $ 4.17 $ 5.65 $ 4. 81 $ 6.49 Indications of Interest Valuations Summary Historical Pro Forma Adjusted EBITDA: 2019 – 2023 ($ in millions) ($ in millions) $183 $217 5-Year Avg: $33.3 $22.2 ($4.81) ($6.49) 3-Year Avg: $24.9 $170 $200 $25.2 por $21.2 ($4.17) ($5.65) $17.3 $167 $200 $14.1 P ($4.00) ($5.65) $155 $181 apl ($3.42) ($4.70) $100.0 $125.0 $150.0 $175.0 $200.0 $225.0 $250.0 2019 2020 2021 2022 2023 Enterprise Value ($ in millions) IOI Multiple Ranges on PF Adj. 2023 EBITDA: 4.6x – 6.5x, 3-Year Avg.: 6.2x – 8.6x, 5-Year Avg.: 7.0x – 9.8x (1) Enterprise value based on 6.0x to 7.0x multiple of EBITDA less normalized capital expenditures of $7.5 million (2) 7 (3) Held “Fireside Chat” discussion with BGL and Mike Coffey on 10/11 (4) Implied Gross Share Price includes reduction of Net Debt as of 12/31/2023 from Enterprise Value, excludes deal expenses and redemption of Rabern minority interest
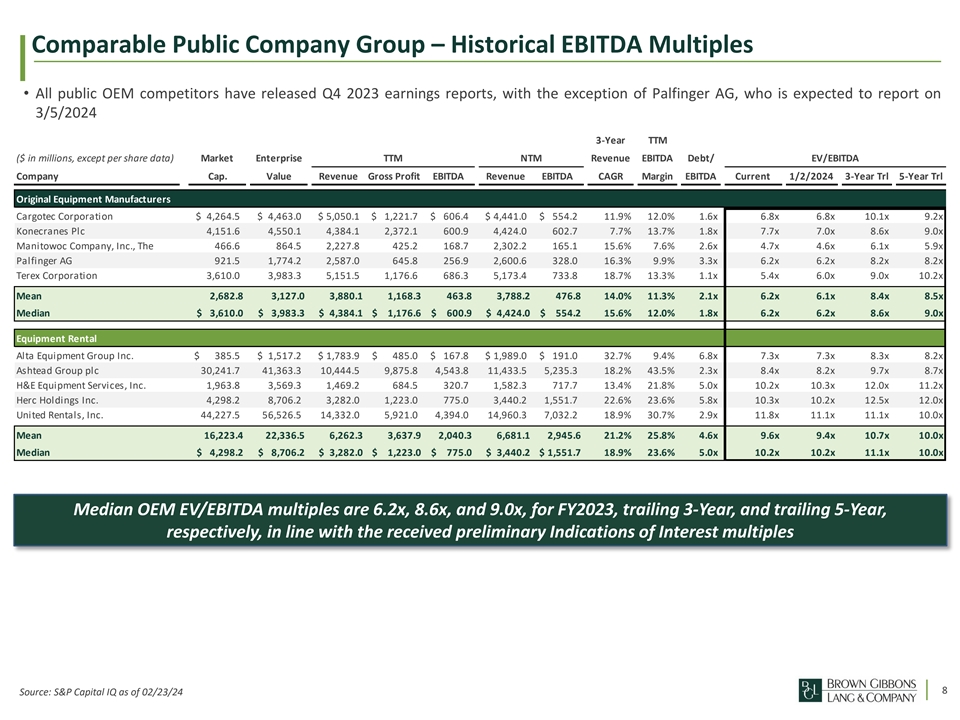
Comparable Public Company Group – Historical EBITDA Multiples • All public OEM competitors have released Q4 2023 earnings reports, with the exception of Palfinger AG, who is expected to report on 3/5/2024 3-Year TTM ($ in millions, except per share data) Market Enterprise TTM NTM Revenue EBITDA Debt/ EV/EBITDA Company Cap. Value Revenue Gross Profit EBITDA Revenue EBITDA CAGR Margin EBITDA Current 1/2/2024 3-Year Trl 5-Year Trl Original Equipment Manufacturers Cargotec Corporation $ 4 ,264.5 $ 4 ,463.0 $ 5 ,050.1 $ 1 ,221.7 $ 6 06.4 $ 4 ,441.0 $ 5 54.2 1 1.9% 1 2.0% 1 .6x 6 .8x 6 .8x 1 0.1x 9 .2x Konecranes Plc 4 ,151.6 4 ,550.1 4 ,384.1 2 ,372.1 6 00.9 4 ,424.0 6 02.7 7 .7% 1 3.7% 1 .8x 7 .7x 7 .0x 8 .6x 9 .0x Manitowoc Company, Inc., The 4 66.6 8 64.5 2 ,227.8 4 25.2 1 68.7 2 ,302.2 1 65.1 1 5.6% 7 .6% 2 .6x 4 .7x 4 .6x 6 .1x 5 .9x Palfinger AG 9 21.5 1 ,774.2 2 ,587.0 6 45.8 2 56.9 2 ,600.6 3 28.0 1 6.3% 9 .9% 3 .3x 6 .2x 6 .2x 8 .2x 8 .2x Terex Corporation 3 ,610.0 3 ,983.3 5 ,151.5 1 ,176.6 6 86.3 5 ,173.4 7 33.8 1 8.7% 13.3% 1 .1x 5 .4x 6 .0x 9 .0x 1 0.2x Mean 2,682.8 3,127.0 3,880.1 1,168.3 463.8 3,788.2 476.8 1 4.0% 1 1.3% 2.1x 6.2x 6.1x 8.4x 8.5x Median $ 3,610.0 $ 3,983.3 $ 4,384.1 $ 1,176.6 $ 600.9 $ 4,424.0 $ 554.2 1 5.6% 1 2.0% 1.8x 6.2x 6.2x 8.6x 9.0x Equipment Rental Alta Equipment Group Inc. $ 3 85.5 $ 1 ,517.2 $ 1,783.9 $ 4 85.0 $ 1 67.8 $ 1 ,989.0 $ 1 91.0 3 2.7% 9 .4% 6 .8x 7 .3x 7 .3x 8 .3x 8 .2x Ashtead Group plc 3 0,241.7 41,363.3 10,444.5 9 ,875.8 4 ,543.8 1 1,433.5 5,235.3 1 8.2% 43.5% 2 .3x 8 ..4x 8 .2x 9 .7x 8 .7x H&E Equipment Services, Inc. 1 ,963.8 3 ,569.3 1 ,469.2 6 84.5 3 20.7 1 ,582.3 7 17.7 1 3.4% 2 1.8% 5 .0x 1 0.2x 1 0.3x 1 2.0x 1 1.2x Herc Holdings Inc. 4 ,298.2 8 ,706.2 3 ,282.0 1 ,223.0 7 75.0 3 ,440.2 1,551.7 2 2.6% 23.6% 5 .8x 1 0.3x 1 0.2x 1 2.5x 1 2.0x United Rentals, Inc. 44,227.5 56,526.5 14,332.0 5 ,921.0 4,394.0 14,960.3 7,032.2 1 8.9% 3 0.7% 2 .9x 1 1.8x 1 1.1x 1 1.1x 1 0.0x Mean 16,223.4 22,336.5 6,262.3 3,637.9 2,040.3 6,681.1 2,945.6 2 1.2% 25.8% 4.6x 9.6x 9.4x 10.7x 10.0x Median $ 4,298.2 $ 8,706.2 $ 3,282.0 $ 1,223.0 $ 775.0 $ 3,440.2 $ 1,551.7 1 8.9% 23.6% 5.0x 10.2x 10.2x 11.1x 10.0x Median OEM EV/EBITDA multiples are 6.2x, 8.6x, and 9.0x, for FY2023, trailing 3-Year, and trailing 5-Year, respectively, in line with the received preliminary Indications of Interest multiples 8 Source: S&P Capital IQ as of 02/23/24
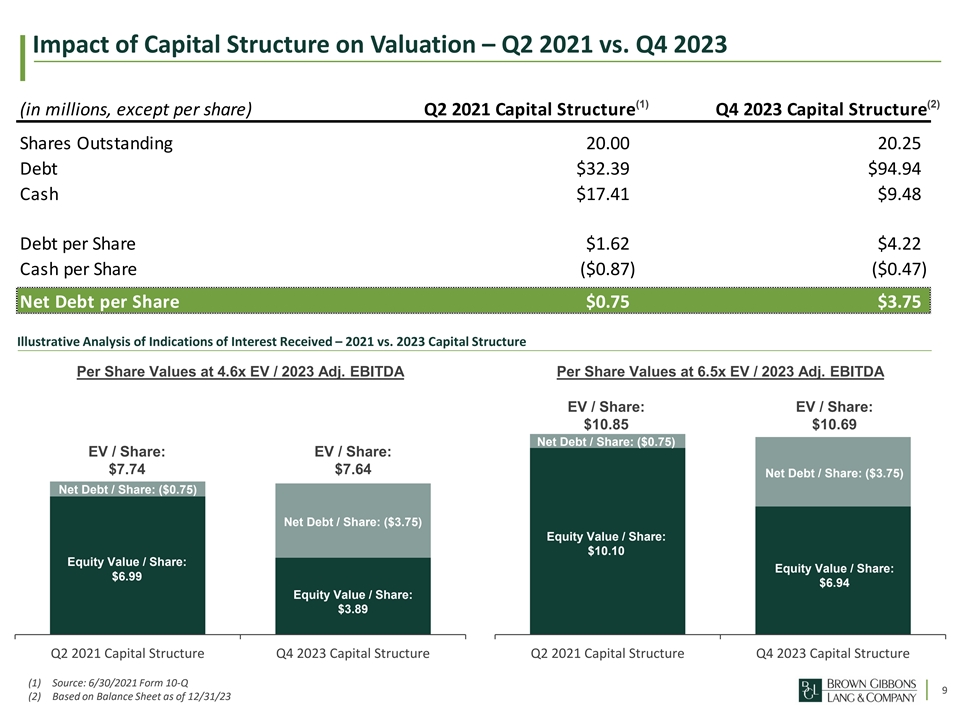
Impact of Capital Structure on Valuation – Q2 2021 vs. Q4 2023 (1) (2) (in millions, except per share) Q2 2021 Capital Structure Q4 2023 Capital Structure Shares Outstanding 20.00 20.25 Debt $32.39 $94.94 Cash $17.41 $9.48 Debt per Share $1.62 $4.22 Cash per Share ($0.87) ($0.47) Net Debt per Share $0.75 $3.75 Illustrative Analysis of Indications of Interest Received – 2021 vs. 2023 Capital Structure Per Share Values at 4.6x EV / 2023 Adj. EBITDA Per Share Values at 6.5x EV / 2023 Adj. EBITDA EV / Share: EV / Share: $10.85 $10.69 Net Debt / Share: ($0.75) EV / Share: EV / Share: $7.74 $7.64 Net Debt / Share: ($3.75) Net Debt / Share: ($0.75) Net Debt / Share: ($3.75) Equity Value / Share: $10.10 Equity Value / Share: Equity Value / Share: $6.99 $6.94 Equity Value / Share: $3.89 Q2 2021 Capital Structure Q4 2023 Capital Structure Q2 2021 Capital Structure Q4 2023 Capital Structure (1) Source: 6/30/2021 Form 10-Q 9 (2) Based on Balance Sheet as of 12/31/23
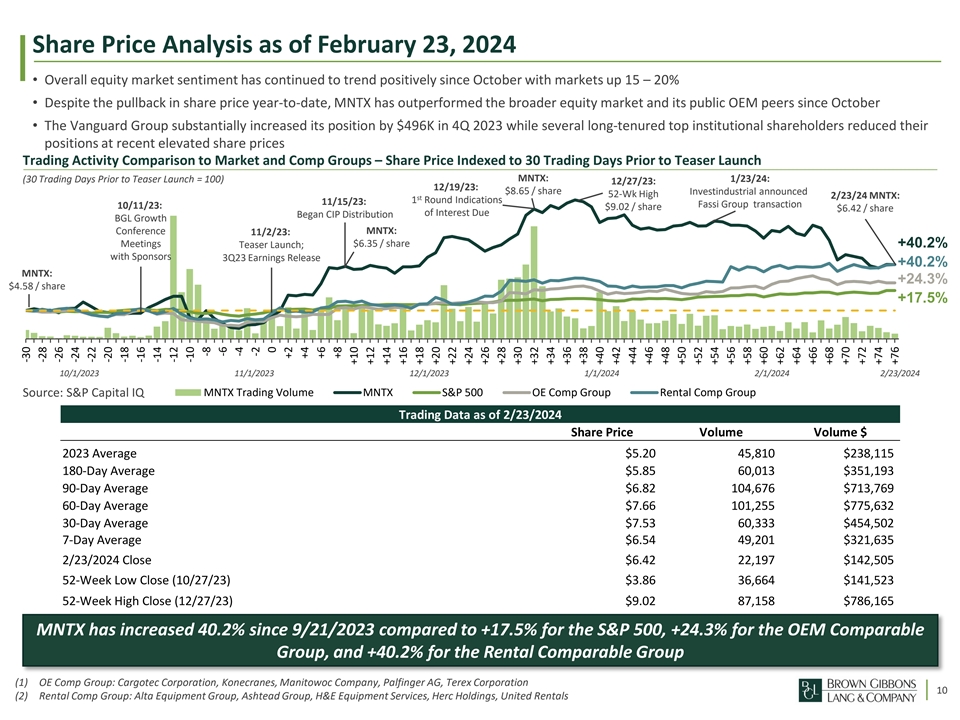
Share Price Analysis as of February 23, 2024 • Overall equity market sentiment has continued to trend positively since October with markets up 15 – 20% • Despite the pullback in share price year-to-date, MNTX has outperformed the broader equity market and its public OEM peers since October • The Vanguard Group substantially increased its position by $496K in 4Q 2023 while several long-tenured top institutional shareholders reduced their positions at recent elevated share prices Trading Activity Comparison to Market and Comp Groups – Share Price Indexed to 30 Trading Days Prior to Teaser Launch MNTX: (30 Trading Days Prior to Teaser Launch = 100) 1/23/24: 12/27/23: 12/19/23: $8.65 / share Investindustrial announced 52-Wk High 2/23/24 MNTX: st 1 Round Indications 11/15/23: Fassi Group transaction 10/11/23: $9.02 / share $6.42 / share of Interest Due Began CIP Distribution BGL Growth Conference MNTX: 11/2/23: $6.35 / share Meetings Teaser Launch; +40.2% with Sponsors 3Q23 Earnings Release +40.2% MNTX: +24.3% $4.58 / share +17.5% 10/1/2023 11/1/2023 12/1/2023 1/1/2024 2/1/2024 2/23/2024 MNTX Trading Volume MNTX S&P 500 OE Comp Group Rental Comp Group Source: S&P Capital IQ Trading Data as of 2/23/2024 Share Price Volume Volume $ 2023 Average $5.20 45,810 $238,115 180-Day Average $5.85 60,013 $351,193 90-Day Average $6.82 104,676 $713,769 60-Day Average $7.66 101,255 $775,632 30-Day Average $7.53 60,333 $454,502 7-Day Average $6.54 49,201 $321,635 2/23/2024 Close $6.42 22,197 $142,505 52-Week Low Close (10/27/23) $3.86 36,664 $141,523 52-Week High Close (12/27/23) $9.02 87,158 $786,165 MNTX has increased 40.2% since 9/21/2023 compared to +17.5% for the S&P 500, +24.3% for the OEM Comparable Group, and +40.2% for the Rental Comparable Group (1) OE Comp Group: Cargotec Corporation, Konecranes, Manitowoc Company, Palfinger AG, Terex Corporation 10 (2) Rental Comp Group: Alta Equipment Group, Ashtead Group, H&E Equipment Services, Herc Holdings, United Rentals -30 -28 -26 -24 -22 -20 -18 -16 -14 -12 -10 -8 -6 -4 -2 0 +2 +4 +6 +8 +10 +12 +14 +16 +18 +20 +22 +24 +26 +28 +30 +32 +34 +36 +38 +40 +42 +44 +46 +48 +50 +52 +54 +56 +58 +60 +62 +64 +66 +68 +70 +72 +74 +76

Institutional Buyers and Sellers • Several long-tenured, top institutional shareholders reduced their positions at recent elevated trading price – Columbia, WealthTrust Axiom, Royce & Associates, • (1) Wedbush, First Wilshire, Adirondack, and Morgan Stanley collectively sold off $6,133K, or 14% of their position in Q4 2023 • One institutional investor, The Vanguard Group, has significantly increased their position by $5,738K, or 325% in Q4 2023 • An activist investor, Ancora Advisors, has significantly increased their position by $496K, or 179% in Q4 2023 (1) Top 15 Institutional Shareholders, Sellers: Sep. 2023 – Dec. 2023 Total Shares Total Shares % of Outstanding Total Change in Change in Sep-23 Dec-23 Shares Share Value Shares Share Value # Shareholder % Change 1.) Columbia Management Investment Advisers 897,523 595,561 2. 94% $ 5, 205,203 (301,962) $ ( 2,639,148) (33.64)% 2.) WealthTrust Axiom, LLC 988, 930 875, 408 4.32% 7, 651,066 ( 113,522) (992,182) (11.48)% 3.) Royce & Associates, LP 1, 470,134 1, 372,734 6. 78% 11, 997,695 ( 97,400) ( 851,276) (6.63)% 4.) Wedbush Asset Management, LLC 415, 938 327, 810 1. 62% 2,865,059 (88,128) (770,239) ( 21.19)% 5.) First Wilshire Securities Management, Inc. 1,035,466 990,321 4. 89% 8, 655,406 ( 45,145) ( 394,567) (4.36)% 6.) Adirondack Research & Management, Inc. 85, 452 53, 605 0. 27% 468, 508 ( 31,847) ( 278,343) (37.27)% 7.) Morgan Stanley Brokerage Investments 67, 745 44,041 0. 22% 384, 918 (23,704) ( 207,173) (34.99)% 8.) Essex Investment Management Company, LLC 324, 610 303, 202 1. 50% 2, 649,985 (21,408) ( 187,106) ( 6.59)% 9.) Cutter & Company, Inc., Asset Management Arm 13, 495 - - - (13,495) ( 117,946) ( 100.00)% 10.) Pacific Ridge Capital Partners, LLC 973,569 961,368 4.75% 8, 402,356 (12,201) ( 106,637) (1.25)% 11.) Tower Research Capital LLC 11,200 - - - (11,200) (97,888) ( 100.00)% 12.) Citadel Advisors LLC 17,620 8,917 0.04% 77,935 ( 8,703) ( 76,064) (49.39)% 13.) First Eagle Investment Management, LLC 301, 084 297, 584 1. 47% 2,600,884 (3,500) (30,590) (1.16)% 14.) Victory Capital Management Inc. 1,498 - - - ( 1,498) (13,093) ( 100.00)% 15.) Comerica Bank, Banking Investments 480 80 - 699 (400) (3,496) ( 83.33)% Top 15 Total 6,604,744 5,830,631 28.79% $ 50,959,715 (774,113) $ (6,765,748) (11.72)% All Other Sellers 90,185 89,973 0.44% 786,364 (212) (1,853) (0.24)% Total 6,694,929 5,920,604 29.23% $ 51,746,079 (774,325) $ (6,767,601) (11.57)% (1) Top 15 Institutional Shareholders, Buyers: Sep. 2023 – Dec. 2023 Total Shares Total Shares % of Outstanding Total Change in Change in Sep-23 Dec-23 Shares Share Value Shares Share Value # Shareholder % Change 1.) Vanguard Group, Inc., The 201, 968 858, 483 4. 24% $ 7,503,141 656, 515 $ 5, 737,941 325. 06% 2.) Ancora Advisors LLC 31,640 88, 400 0. 44% 772, 616 56, 760 496,082 179. 39% 3.) Susquehanna International Group New Position 35, 041 0. 17% 306,258 35, 041 306, 258 New Position 4.) Bank of America Corporation, Asset Management New Position 30, 813 0.15% 269, 306 30, 813 269, 306 New Position 5.) 683 Capital Management, LLC New Position 29, 961 0. 15% 261,859 29, 961 261, 859 New Position 6.) O'Shaughnessy Asset Management, LLC New Position 28, 767 0. 14% 251, 424 28,767 251, 424 New Position 7.) AE Wealth Management, LLC New Position 26, 604 0. 13% 232,519 26, 604 232, 519 New Position 8.) Millennium Management LLC New Position 20, 404 0.10% 178,331 20,404 178,331 New Position 9.) Qube Research & Technologies Ltd 2 20,335 0. 10% 177, 728 20,333 177,710 nm 10.) BlackRock, Inc. 56, 647 76,595 0. 38% 669,440 19,948 174, 346 35. 21% 11.) Geode Capital Management, LLC 132, 209 150, 055 0.74% 1,311,481 17,846 155,974 13.50% 12.) UBS Asset Management AG New Position 17,776 0.09% 155,362 17, 776 155,362 New Position 13.) ExodusPoint Capital Management, LP New Position 15,180 0.08% 132,673 15, 180 132,673 New Position 14.) Belvedere Trading, LLC, Asset Management New Position 13,939 0. 07% 121, 827 13, 939 121, 827 New Position 15.) LPL Financial Corporation, Asset Management New Position 13,431 0.07% 117,387 13,431 117,387 New Position Top 15 Total 422,466 1,425,784 7.04% $ 12,461,352 1,003,318 $ 8,768,999 237.49% All Other Purchasers 2, 183,483 2,335,658 11.53% 20,413,651 152,175 1,330,010 6.97% Total 2,605,949 3,761,442 18.57% $ 32,875,003 1,155,493 $ 10,099,009 44.34% Source: S&P CapIQ and SEC Filings; Total share value based on December 29, 2023 share closing share price of $8.74; (1) Net percentage change in shares owned as of 11 September 30, 2023 vs. December 31, 2023 Source: Capital IQ as of May 12, 2021 (1) Based on a weighted average price per share at the time of purchase

Institutional Investor Overview Top Institutional Shareholders Top Institutional Shareholders defined as CSO of at least 1.0% Total Shares Total Shares Total Share % of C.S. W.A. Hold Period W.A. Hold Period Sep-23 Cost Basis Dec-23 Cost Basis Cost Basis Shareholder Sep-23 Dec-23 Value Ownership Sep-2023 Dec-2023 Per Share Per Share Change 1) Royce & Associates, LP 1,470,134 1,372,734 $11,997,695 6.78% 3.06 Years 3.06 Years $ 6.27 $ 6.27 - 2) First Wilshire Securities Management, Inc. 1,035,466 990,321 8,655,406 4.89% 10.79 Years 10.79 Years 4.49 4.49 - 3) Pacific Ridge Capital Partners, LLC 973,569 961,368 8,402,356 4.75% 5.47 Years 5.47 Years 7.22 7.22 - 4) WealthTrust Axiom, LLC 988,930 875,408 7,651,066 4.32% 7.12 Years 7.12 Years 6.91 6.91 - 5) Vanguard Group, Inc., The 201,968 858,483 7,503,141 4.24% 7.06 Years 4.56 Years 8.96 8.88 (0.86)% 6) Columbia Management Investment Advisers LLC 897,523 595,561 5,205,203 2.94% 3.70 Years 3.70 Years 6.26 6.26 - 7) Cannell Capital LLC 437,912 437,912 3,827,351 2.16% 3.79 Years 3.79 Years 6.96 6.96 - 8) Dimensional Fund Advisors LP 344,463 352,804 3,083,507 1.74% 7.22 Years 7.11 Years 8.12 8.13 0.11% 9) Wedbush Asset Management, LLC 415,938 327,810 2,865,059 1.62% 2.51 Years 2.51 Years 5.66 5.66 - 10) Kennedy Capital Management LLC 315,641 325,128 2,841,619 1.61% 8.65 Years 8.52 Years 9.97 9.95 (0.19)% 11) Driehaus Capital Management LLC 311,230 311,230 2,720,150 1.54% 8.44 Years 8.44 Years 9.66 9.66 - 12) Essex Investment Management Company, LLC 324,610 303,202 2,649,985 1.50% 9.71 Years 9.71 Years 6.08 6.08 - 13) First Eagle Investment Management, LLC 301,084 297,584 2,600,884 1.47% 1.21 Years 1.21 Years 5.86 5.86 - Total / Weighted Average 8,018,468 8,009,545 $70,003,423 39.55% 5.84 Years 5.76 Years $ 6.42 $ 6.65 3.55% All Other Institutional Shareholders 1,282,430 1,672,521 $14,617,834 8.26% 6.35 Years 5.30 Years $ 7.23 $ 7.57 4.71% Total 9,300,898 9,682,066 $84,621,257 47.81% 5.91 Years 5.69 Years $ 6.72 $ 6.99 4.00% Top Buyer Top Seller Common Stock Ownership of Top Institutional Shareholders by Tenure Tenure defined as Weighted Average Hold Period ending December 2023 10+ Years 8% <3 Years 15% 3 to 5 Years 31% 5 to 10 Years 46% 12 Source: S&P CapIQ and SEC Filings Source: Capital IQ as of May 12, 2021 (1) Based on a weighted average price per share at the time of purchase

Investor Profiles 13

Investor Profiles 14

Recommended Next Steps & Timing February March April S M T W T F S S M T W T F S S M T W T F S 1 2 3 1 2 1 2 3 4 5 6 4 5 6 7 8 9 10 3 4 5 6 7 8 9 7 8 9 10 11 12 13 11 12 13 14 15 16 17 10 11 12 13 14 15 16 14 15 16 17 18 19 20 18 19 20 21 22 23 24 17 18 19 20 21 22 23 21 22 23 24 25 26 27 26 27 28 29 24 25 26 27 28 29 30 28 29 30 31 Management Unavailable Recommended Next Steps: February 29: Begin Scheduling Management Presentations; Open Virtual Data Room to Buyers February 29: Q4 Earnings Release March 4 – 29: Potential Management Presentation Meeting Dates — Location to be determined (BGL present) April 11: Letters of Intent Due April 12 – 18: Evaluate Letters of Intent and Select Preferred Buyer(s) April 19: Begin Public Company Final Diligence Process The Board Should Evaluate Initiating Management Presentations in March or April 15
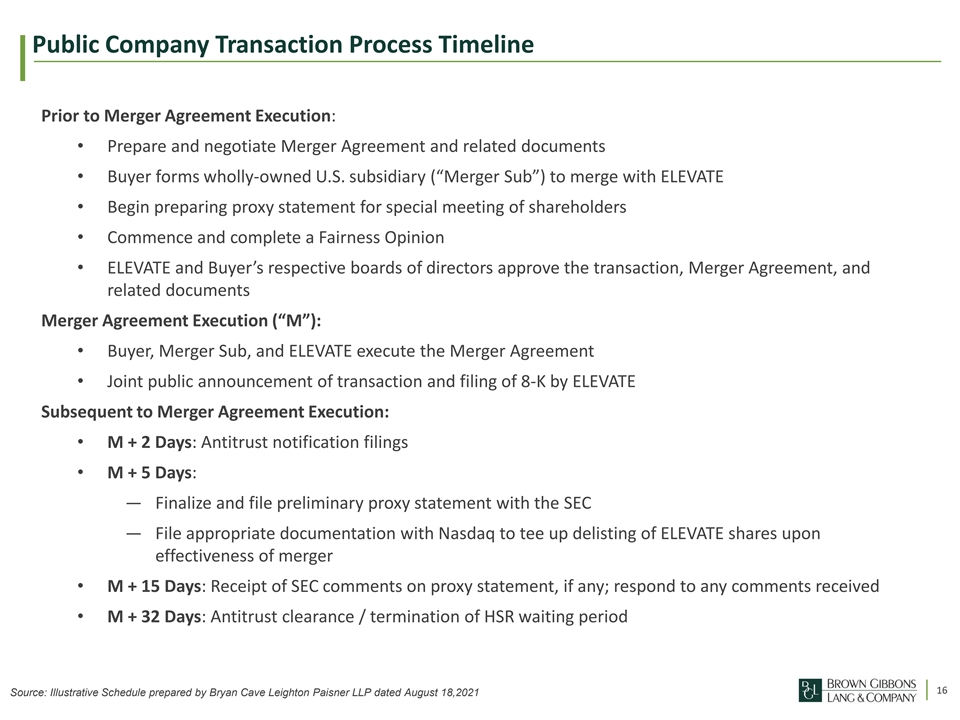
Public Company Transaction Process Timeline Prior to Merger Agreement Execution: • Prepare and negotiate Merger Agreement and related documents • Buyer forms wholly-owned U.S. subsidiary (“Merger Sub”) to merge with ELEVATE • Begin preparing proxy statement for special meeting of shareholders • Commence and complete a Fairness Opinion • ELEVATE and Buyer’s respective boards of directors approve the transaction, Merger Agreement, and related documents Merger Agreement Execution (“M”): • Buyer, Merger Sub, and ELEVATE execute the Merger Agreement • Joint public announcement of transaction and filing of 8-K by ELEVATE Subsequent to Merger Agreement Execution: • M + 2 Days: Antitrust notification filings • M + 5 Days: — Finalize and file preliminary proxy statement with the SEC — File appropriate documentation with Nasdaq to tee up delisting of ELEVATE shares upon effectiveness of merger • M + 15 Days: Receipt of SEC comments on proxy statement, if any; respond to any comments received • M + 32 Days: Antitrust clearance / termination of HSR waiting period 16 Source: Illustrative Schedule prepared by Bryan Cave Leighton Paisner LLP dated August 18,2021

Appendix

Marketing Update – Buyer Outreach 18

Marketing Update – Buyer Outreach Cont’d 19
Marketing Update – Buyer Outreach Cont’d 20

Marketing Update – Buyer Outreach Cont’d 21

Marketing Update – Buyer Outreach Cont’d 22
Indications of Interest

Following Pages Redacted: 24-37.