| SECURITIES AND EXCHANGE COMMISSION |
x QUARTERLY REPORT UNDER SECTION 13 OR 15(d) OF THE SECURITIES EXCHANGE ACT OF 1934 |
| For the quarterly period ended March 31, 2011 |
o TRANSITION REPORT UNDER SECTION 13 OR 15(d) OF THE EXCHANGE ACT |
| For the transition period from ________________ to _______________ |
| CHINA HOUSING & LAND DEVELOPMENT, INC. |
| (Exact name of registrant as specified in its charter) |
| Nevada | 20-1334845 |
(State or other jurisdiction of incorporation or organization) | (IRS Employer Identification No.) |
| 6 Youyi Dong Lu, Han Yuan 4 Lou |
| (Address of principal executive offices) |
| (Issuer's telephone number) |
| (Former name, former address and former fiscal year, if changed since last report) |
| Indicate by check mark whether the registrant (1) has filed all reports required to be filed by Section 13 or 15(d) of the Securities Exchange Act of 1934 during the preceding 12 months (or for such shorter period that the registrant was required to file such reports), and (2) has been subject to such filing requirements for the past 90 days. |
Indicate by check mark whether the registrant has submitted electronically and posted on its corporate Web site, if any, every Interactive Data File required to be submitted and posted pursuant to Rule 405 of Regulation S-T (§232.405 of this chapter) during the preceding 12 months (or for such shorter period that the registrant was required to submit and post such files). Yes o No o |
| Indicate by check mark whether the registrant is a large accelerated filer, an accelerated filer, a non-accelerated filer, or a smaller reporting company. See the definitions of “large accelerated filer,” “accelerated filer” and “smaller reporting company” in Rule 12b-2 of the Exchange Act. |
Large accelerated filer o | Accelerated filer o | Non-accelerated filer o (Do not check if a smaller reporting company) | Smaller reporting company x |
Indicate by check mark whether the registrant is a shell company (as defined in Rule 12b-2 of the Exchange Act). Yes o No x |
| The number of shares of Common Stock outstanding on May 15, 2011 was 35,078,639 shares. |
Except as otherwise indicated by the context, references in this Form 10-Q to:
“CHLN,” the “Company,” “we,” “our,” or “us” are references to China Housing & Land Development, Inc.
“U.S. Dollar,” “$” and “US$” mean the legal currency of the United States of America.
“RMB” means Renminbi, the legal currency of China.
“China” or the “PRC” are references to the People’s Republic of China.
“U.S.” is a reference to the United States of America.
“SEC” is a reference to the Securities & Exchange Commission of the United States of America.
“GFA” means gross floor area.
| CHINA HOUSING & LAND DEVELOPMENT, INC. |
| . | | | | Page Number |
| | | | | |
| PART I | | FINANCIAL INFORMATION | | 1 |
| | | | | |
| Item 1. | | Financial Statements | | 1 |
| | | | | |
| | | Interim Condensed Consolidated Balance Sheets as of March 31, 2011 (unaudited) and December 31, 2010 | | 1 |
| | | Interim Condensed Consolidated Statements of Income for the three months ended March 31, 2011 and 2010 (unaudited) | | 2 |
| | | Interim Condensed Consolidated Statements of Comprehensive Income for the three months ended March 31, 2011 and 2010 (unaudited) | | 3 |
| | | Interim Condensed Consolidated Statements of Cash Flows for the three months ended March 31, 2011 and 2010 (unaudited) | | 4 |
| | | Interim Condensed Consolidated Statements of Shareholders’ Equity As at March 31, 2011 (unaudited) and December 31, 2010 | | 5 |
| | | | | |
| | | Notes to Interim Condensed Consolidated Financial Statements (unaudited) | | 6 |
| | | | | |
| Item 2. | | Management's Discussion and Analysis of Financial Condition and Results of Operations | | 16 |
| | | | | |
| Item 3. | | Quantitative and Qualitative Disclosures About Market Risk | | 34 |
| | | | | |
| Item 4. | | Controls and Procedures | | 34 |
| | | | | |
| PART II. | | OTHER INFORMATION | | 35 |
| | | | | |
| Item 1. | | Legal Proceedings | | 35 |
| | | | | |
| Item 1A. | | Risk Factors | | 35 |
| | | | | |
| Item 2. | | Unregistered Sales of Equity Securities and Use of Proceeds | | 35 |
| | | | | |
| Item 3. | | Defaults Upon Senior Securities | | 35 |
| | | | | |
| Item 4. | | (Removed and reserved) | | 35 |
| | | | | |
| Item 5. | | Other Information | | 35 |
| | | | | |
| Item 6. | | Exhibits | | 35 |
| | | | | |
| SIGNATURES | | |
| | | | | |
| EX-31.1 | | (Certifications required under Section 302 of the Sarbanes-Oxley Act of 2002) | | |
| | | | | |
| EX-31.2 | | (Certifications required under Section 302 of the Sarbanes-Oxley Act of 2002) | | |
| | | | | |
| EX-32.1 | | (Certifications required under Section 906 of the Sarbanes-Oxley Act of 2002) | | |
| | | | | |
| EX-32.2 | | (Certifications required under Section 906 of the Sarbanes-Oxley Act of 2002) | | |
PART I. FINANCIAL INFORMATION
Item 1. Financial Statements
CHINA HOUSING & LAND DEVELOPMENT, INC. AND SUBSIDIARIES
Interim Condensed Consolidated Balance Sheets
As of March 31, 2011 (Unaudited) and December 31, 2010
| | | March 31, | | | December 31, | |
| | | 2011 | | | 2010 | |
| ASSETS | | | | | | |
| Cash and cash equivalents | | $ | 81,642,228 | | | $ | 46,904,161 | |
| Cash - restricted | | | 39,642,680 | | | | 34,756,450 | |
Accounts receivable, net of allowance for doubtful accounts of $268,597 and $266,493, respectively | | | 9,292,362 | | | | 9,297,505 | |
| Other receivables, prepaid expenses and other assets, net | | | 5,621,241 | | | | 7,653,925 | |
| Real estate held for development or sale | | | 121,698,776 | | | | 104,586,550 | |
| Property and equipment, net | | | 30,139,315 | | | | 29,735,836 | |
| Advance to suppliers | | | 1,398,778 | | | | 1,223,366 | |
| Deposits on land use rights | | | 68,652,286 | | | | 74,938,729 | |
| Intangible assets, net | | | 52,203,130 | | | | 51,846,410 | |
| Goodwill | | | 1,821,170 | | | | 1,806,905 | |
| Deferred financing costs | | | 364,370 | | | | 401,703 | |
| Total assets | | $ | 412,476,336 | | | $ | 363,151,540 | |
| | | | | | | | | |
| LIABILITIES | | | | | | | | |
| Accounts payable | | $ | 22,355,291 | | | $ | 22,542,083 | |
| Advances from customers | | | 65,773,679 | | | | 52,229,189 | |
| Accrued expenses | | | 2,474,094 | | | | 2,507,638 | |
| Payables for acquisition of businesses | | | 91,374 | | | | 2,363,385 | |
| Income and other taxes payable | | | 16,325,122 | | | | 15,429,752 | |
| Other payables | | | 7,234,976 | | | | 5,663,222 | |
| Loans from employees | | | 8,796,176 | | | | 8,787,879 | |
| Loans payable | | | 112,862,458 | | | | 82,971,074 | |
| Deferred tax liability | | | 14,420,790 | | | | 14,344,712 | |
| Warrants liability | | | 291,572 | | | | 2,766,382 | |
| Fair value of embedded derivatives | | | 974,972 | | | | 2,027,726 | |
| Convertible debt | | | 8,515,319 | | | | 16,251,840 | |
| Mandatorily redeemable noncontrolling interests in Subsidiaries | | | 37,100,199 | | | | 33,535,969 | |
| Total liabilities | | | 297,216,022 | | | | 261,420,851 | |
| | | | | | | | | |
| SHAREHOLDERS' EQUITY | | | | | | | | |
| Common stock: $.001 par value, authorized 100,000,000 shares | | | | | | | | |
| issued and outstanding 35,078,639 and 32,685,331, respectively | | | 35,079 | | | | 32,685 | |
| Additional paid in capital | | | 48,750,961 | | | | 38,996,078 | |
| Common stock subscribed | | | - | | | | 59,606 | |
| Statutory reserves | | | 6,654,715 | | | | 6,654,715 | |
| Retained earnings | | | 43,997,990 | | | | 41,528,907 | |
| Accumulated other comprehensive income | | | 15,821,569 | | | | 14,458,698 | |
| Total shareholders’ equity | | | 115,260,314 | | | | 101,730,689 | |
| | | | | | | | | |
| Total liabilities and shareholders' equity | | $ | 412,476,336 | | | $ | 363,151,540 | |
The accompanying notes are an integral part of these interim condensed consolidated financial statements.
CHINA HOUSING & LAND DEVELOPMENT, INC. AND SUBSIDIARIES
Interim Condensed Consolidated Statements of Income
For The Three Months Ended March 31, 2011 and 2010
(Unaudited)
| | | 3 Months | | | 3 Months | |
| | | March 31, 2011 | | | March 31, 2010 | |
| REVENUES | | | | | | |
| Real Estate sales | | $ | 19,656,817 | | | $ | 32,391,061 | |
| Other revenue | | | 2,900,879 | | | | 1,181,853 | |
| | | | | | | | | |
| Total revenues | | | 22,557,696 | | | | 33,572,914 | |
| | | | | | | | | |
| COST OF REVENUES | | | | | | | | |
| Cost of real estate sales | | | 14,638,574 | | | | 26,561,887 | |
| Cost of other revenue | | | 2,196,569 | | | | 536,773 | |
| Total cost of revenues | | | 16,835,143 | | | | 27,098,660 | |
| | | | | | | | | |
| Gross margin | | | 5,722,553 | | | | 6,474,254 | |
| | | | | | | | | |
| OPERATING EXPENSES | | | | | | | | |
| Selling, general, and administrative expenses | | | 3,432,716 | | | | 2,537,884 | |
| Other expenses | | | 41,577 | | | | 122,651 | |
| Interest expense | | | 597,148 | | | | 507,025 | |
| Accretion expense on convertible debt | | | 336,991 | | | | 329,182 | |
| Total operating expenses | | | 4,408,432 | | | | 3,496,742 | |
| | | | | | | | | |
| NET INCOME FROM BUSINESS OPERATIONS | | | 1,314,121 | | | | 2,977,512 | |
| | | | | | | | | |
| CHANGE IN FAIR VALUE OF DERIVATIVES | | | | | | | | |
| Change in fair value of embedded derivatives | | | (1,052,754) | | | | (566,206) | |
| Change in fair value of warrants | | | (850,651) | | | | (554,601) | |
| Total change in fair value of derivatives | | | (1,903,405) | | | | (1,120,807) | |
| | | | | | | | | |
| Income before provision for income taxes and noncontrolling interest | | | 3,217,526 | | | | 4,098,319 | |
| | | | | | | | | |
| Provision for income taxes | | | 786,489 | | | | 1,009,531 | |
| Recovery of deferred income taxes | | | (38,046) | | | | (29,146) | |
| NET INCOME | | | 2,469,083 | | | | 3,117,934 | |
| | | | | | | | | |
| Charge to noncontrolling interest | | | - | | | | (14,229,043) | |
| Net income (loss) attributable to China Housing & Land Development, Inc. | | $ | 2,469,083 | | | $ | (11,111,109) | |
| | | | | | | | | |
| WEIGHTED AVERAGE SHARES OUTSTANDING | | | | | | | | |
| Basic | | | 33,886,568 | | | | 32,580,769 | |
| | | | | | | | | |
| Diluted | | | 35,502,277 | | | | 32,580,769 | |
| | | | | | | | | |
| NET INCOME (LOSS) PER SHARE | | | | | | | | |
| Basic | | | 0.07 | | | | (0.34) | |
| | | | | | | | | |
| Diluted | | | 0.05 | | | | (0.34) | |
The accompanying notes are an integral part of these interim condensed consolidated financial statements.
CHINA HOUSING & LAND DEVELOPMENT, INC. AND SUBSIDIARIES
Interim Condensed Consolidated Statements of Comprehensive Income (Loss)
For The Three Months Ended March 31, 2011 and 2010
(Unaudited)
| | | 3 Months | | | 3 Months | |
| | | March 31, | | | March 31, | |
| | | 2011 | | | 2010 | |
| | | | | | | |
| NET INCOME | | $ | 2,469,083 | | | $ | 3,117,934 | |
| | | | | | | | | |
| OTHER COMPREHENSIVE INCOME (LOSS) | | | | | | | | |
| Gain (loss) in foreign exchange | | | 1,362,871 | | | | (27,684 | ) |
| | | | | | | | | |
| COMPREHENSIVE INCOME | | | 3,831,954 | | | | 3,090,250 | |
| | | | | | | | | |
| Less: Comprehensive charge (loss) attributable to noncontrolling interest | | | - | | | | (14,229,043 | ) |
| | | | | | | | | |
| Comprehensive income (loss) attributable to China Housing & Land Development, Inc. | | $ | 3,831,954 | | | $ | (11,138,793 | ) |
The accompanying notes are an integral part of these interim condensed consolidated financial statements.
CHINA HOUSING & LAND DEVELOPMENT INC. AND SUBSIDIARIES
Interim Condensed Consolidated Statements of Cash Flows
For The Three Months Ended March 31, 2011 and 2010
(Unaudited)
| | | March 31, | | | March 31, | |
| | | 2011 | | | 2010 | |
| CASH FLOWS FROM OPERATING ACTIVITIES: | | | | | | |
| Net income | | $ | 2,469,083 | | | $ | 3,117,934 | |
| Adjustments to reconcile net income to cash provided by (used in) operating activities: | | | | | | | | |
| Bad debt recovery | | | (39,010) | | | | - | |
| Depreciation | | | 482,584 | | | | 293,134 | |
| Gain on disposal of fixed assets | | | (8,152) | | | | - | |
| Amortization of deferred financing costs | | | 38,482 | | | | 38,482 | |
| Amortization of intangible assets | | | 52,372 | | | | - | |
| Recovery of future income taxes | | | (38,046) | | | | (29,146) | |
| Change in fair value of embedded derivatives | | | (1,052,754) | | | | (566,206) | |
| Change in fair value of warrants | | | (850,651) | | | | (554,601) | |
| Accretion expense on convertible debt | | | 336,991 | | | | 329,182 | |
| (Increase) decrease in assets: | | | | | | | | |
| Accounts receivable | | | 78,182 | | | | (3,177,943) | |
| Other receivable and prepaid expense | | | 1,681,598 | | | | (2,211,864) | |
| Real estate held for development or sale | | | (16,210,498) | | | | 7,485,899 | |
| Advances to suppliers | | | (165,241) | | | | 9,492,722 | |
| Deposit (Refund) on land use rights | | | 6,846,002 | | | | (22,849,777) | |
| Increase (decrease) in liabilities: | | | | | | | | |
| Accounts payable | | | (363,064) | | | | (2,578,136) | |
| Advance from customers | | | 13,070,852 | | | | 9,149,087 | |
| Accrued expense | | | 3,235,978 | | | | 858,829 | |
| Other payables | | | 1,519,947 | | | | 82,578 | |
| Income and other taxes payable | | | 1,209,682 | | | | 1,283,577 | |
| Net cash provided by operating activities | | $ | 12,294,337 | | | $ | 163,751 | |
| | | | | | | | | |
| CASH FLOWS FROM INVESTING ACTIVITIES: | | | | | | | | |
| Change in restricted cash | | | (4,590,301) | | | | (231) | |
| Purchase of property and equipment | | | (660,593) | | | | (701,004) | |
| Cash acquired from acquisition | | | - | | | | 2,179 | |
| Proceed from sale of property and equipment | | | 18,240 | | | | - | |
| Net cash used in investing activities | | $ | (5,232,654) | | | $ | (699,056) | |
| | | | | | | | | |
| CASH FLOWS FROM FINANCING ACTIVITIES: | | | | | | | | |
| Loans from banks | | | 30,399,757 | | | | 31,491,680 | |
| Payments of loans payable | | | (1,063,991) | | | | (3,222,404) | |
| Loans from or repayment to employees, net | | | (60,800) | | | | 1,850,685 | |
| Repayments of payables for acquisition of businesses | | | (2,279,982) | | | | (117,334) | |
| Net cash provided by financing activities | | $ | 26,994,984 | | | $ | 30,002,627 | |
| | | | | | | | | |
| INCREASE IN CASH AND CASH EQUIVALENTS | | | 34,056,667 | | | | 29,467,322 | |
| | | | | | | | | |
| Effects of foreign currency exchange | | | 681,400 | | | | (7,138) | |
| | | | | | | | | |
| CASH AND CASH EQUIVALENTS, beginning of period | | | 46,904,161 | | | | 36,863,216 | |
| | | | | | | | | |
| CASH AND CASH EQUIVALENTS, end of period | | $ | 81,642,228 | | | $ | 66,323,400 | |
The accompanying notes are an integral part of these interim condensed consolidated financial statements.
CHINA HOUSING & LAND DEVELOPMENT, INC. AND SUBSIDIARIES
Interim Condensed Consolidated Statements of Shareholders’ Equity
As of March 31, 2011 (Unaudited) and December 31, 2010
| | | Common Stock | | | Common stock | | | Additional paid | | | Statutory | | | Retained | | | Accumulated Comprehensive | | | | |
| | | Shares | | | Par Value | | | subscribed | | | in capital | | | reserves | | | earnings | | | income | | | Totals | |
| | | | | | | | | | | | | | | | | | | | | | | | | |
| BALANCE, December 31, 2010 | | | 32,685,331 | | | $ | 32,685 | | | $ | 59,606 | | | $ | 38,996,078 | | | $ | 6,654,715 | | | $ | 41,528,907 | | | $ | 14,458,698 | | | $ | 101,730,689 | |
| Common stock issued for stock based compensation | | | 20,625 | | | | 21 | | | | (59,606) | | | | 59,585 | | | | - | | | | - | | | | - | | | | - | |
| Common stock issued for warrant exercise | | | 619,905 | | | | 620 | | | | - | | | | 1,623,539 | | | | - | | | | - | | | | - | | | | 1,624,159 | |
| Common stock issued for conversion of convertible debt | | | 1,752,778 | | | | 1,753 | | | | - | | | | 8,071,759 | | | | - | | | | - | | | | - | | | | 8,073,512 | |
| Net income | | | - | | | | - | | | | - | | | | - | | | | - | | | | 2,469,083 | | | | - | | | | 2,469,083 | |
| Foreign currency translation | | | - | | | | - | | | | - | | | | - | | | | - | | | | - | | | | 1,362,871 | | | | 1,362,871 | |
| BALANCE, March 31, 2011 | | | 35,078,639 | | | $ | 35,079 | | | $ | - | | | $ | 48,750,961 | | | $ | 6,654,715 | | | $ | 43,997,990 | | | $ | 15,821,569 | | | $ | 115,260,314 | |
The accompanying notes are an integral part of these interim condensed consolidated financial statements.
CHINA HOUSING & LAND DEVELOPMENT, INC. AND SUBSIDIARIES
Notes To Interim Condensed Consolidated Financial Statements
(Unaudited)
Note 1 – Organization and Basis of Presentation
China Housing & Land Development, Inc., (the “Company”) is a Nevada corporation, incorporated on July 6, 2004 under the name Pacific Northwest Productions Inc., (“Pacific”). On May 5, 2006, the Company changed its name to China Housing & Land Development, Inc. The Company, through its subsidiaries, is engaged in acquisition, development, management, and sale of commercial and residential real estate properties located primarily in Xi’an, Shaanxi Province, People’s Republic of China (PRC or China).
The accompanying unaudited interim condensed consolidated financial statements include the accounts of the Company and its subsidiaries, Xi’an Tsining Housing Development Company Inc. (“Tsining”), Xi’an New Land Development Co. (“New Land”), Manstate Assets Management Limited (“Manstate”), Success Hill Investments Limited (“Success Hill”), Puhua (Xi’an) Real Estate Development Co., Ltd. (“Puhua”), Xi’an Xinxing Property Management Co., Ltd. (“Xinxing Property”), Suodi Co., Ltd. (“Suodi”), Shaanxi Xinxing Construction Co., Ltd. (“Xinxing Construction”), Xinxing FangZhou Housing Development Co., Ltd. (“FangZhou”), Wayfast Holdings Limited (“Wayfast”), Clever Advance Limited (“Clever Advance”), Gracemind Holdings Limited (“Gracemind”) and Treasure Asia Holdings Limited (“Treasure Asia”) (collectively, the “Subsidiaries”). Wayfast with its 100% subsidiary - Clever Advance and Gracemind with its 100% subsidiary - Treasure Asia were incorporated as holding companies in March 2009 and they were inactive during the three months ending March 31, 2011.
In the opinion of management, the unaudited interim condensed consolidated financial statements reflect all adjustments necessary for a fair statement of the Company’s consolidated financial position as at March 31, 2011 and results of operations and cash flows for the periods ended March 31, 2011 and 2010. These adjustments consist of normal recurring items. The results of operations for any interim period are not necessarily indicative of results for the full year.
The unaudited interim condensed consolidated financial statements are based on accounting principles that are consistent in all material respects with those applied in the Company’s Annual Report on Form 10-K for the year ended December 31, 2010 (“2010 Annual Report”); except as disclosed below. They do not include certain footnote disclosures and financial information normally included in annual consolidated financial statements prepared in accordance with GAAP and, therefore, should be read in conjunction with the audited consolidated financial statements and notes included in the Company’s 2010 Annual Report.
Accounting Principles Recently Adopted
In April 2010, the FASB issued FASB Accounting Standard Update (“ASU”) No. 2010-13 “Compensation—Stock Compensation (Topic 718): Effect of Denominating the Exercise Price of a Share-Based Payment Award in the Currency of the Market in Which the Underlying Equity Security Trades”. ASU 2010-13 updates ASC 718 to codify the consensus reached in EITF Issue No. 09-J, “Effect of Denominating the Exercise Price of a Share-Based Payment Award in the Currency of the Market in Which the Underlying Equity Security Trades”. ASU 2010-13 clarifies that share-based payment awards with an exercise price denominated in the currency of a market in which a substantial portion of the underlying equity security trades should not be considered to meet the criteria requiring classification as a liability. ASU No. 2010-13 became effective for the Company on January 1, 2011. The adoption of this ASU did not have a material impact on the Company’s consolidated financial statements.
In July 2010, the FASB issued ASU 2010-20 “Disclosures about the Credit Quality of Financing Receivables and the Allowance for Credit Losses” which expands the disclosure requirements concerning the credit quality of an entity’s financing receivables and its allowance for credit losses. ASU No. 2010-20 became effective for the Company on January 1, 2011. The adoption of this ASU did not have a material impact on the Company’s consolidated financial statements.
In December 2010, the FASB issued ASU 2010-28 “when to perform step 2 of the goodwill impairment test for reporting units with zero or negative carrying amounts”. The FASB amended the existing guidance to modify Step 1 of the goodwill impairment test for a reporting unit with a zero or negative carrying amount. Upon adoption of the amendment, an entity with a reporting unit that has a carrying amount that is zero or negative is required to assess whether it is more likely than not that the reporting unit’s goodwill is impaired. If the entity determines that it is more likely than not that the goodwill of the reporting unit is impaired, the entity should perform Step 2 of the goodwill impairment test for the reporting unit. Any resulting goodwill impairment should be recorded as a cumulative-effect adjustment to beginning retained earnings in the period of adoption. Any goodwill impairments occurring after the initial adoption of the amendment should be included in earnings. ASU No. 2010-28 became effective for the Company on January 1, 2011. The adoption of this ASU did not have a material impact on the Company’s consolidated financial statements.
Note 1 – Organization and Basis of Presentation - continued
Accounting Principles Recently Adopted - continued
In December 2010, the FASB issued ASU 2010-29 “Disclosure of supplementary pro forma information for business combinations”. The FASB amended the existing guidance to require a public entity, which presents comparative financial statements, to disclose revenue and earnings of the combined entity as though the business combination that occurred during the current year had occurred as of the beginning of the comparable prior annual reporting period only. The amendment also expanded the required supplemental pro forma disclosures to include a description of the nature and amount of material, nonrecurring pro forma adjustments directly attributable to the business combination, which are included in the reported pro forma revenue and earnings. ASU No. 2010-29 became effective for the Company on January 1, 2011. The adoption of this ASU did not have a material impact on the Company’s consolidated financial statements.
Foreign exchange rates used:
| | | March 31, 2011 | | | December 31, 2010 | | | March 31, 2010 | |
| Period end RMB/U.S. Dollar exchange rate | | 6.5483 | | | 6.6000 | | | 6.8258 | |
| Average RMB/U.S. Dollar exchange rate | | 6.5790 | | | 6.7690 | | | 6.8272 | |
Note 2 – Mandatorily Redeemable Preferred Stock and Noncontrolling Interest
The Company recorded accretion cost on the mandatorily redeemable noncontrolling interest using the effective interest method based on effective interest rate of 45%. The related accretion cost incurred for the three months ended March 31, 2011 were $3,279,369 (2010 - $4,151,382) and was capitalized in real estate construction in progress.
| | | Mandatory Redeemable Noncontrolling Interests in Subsidiaries | |
| Mandatory redeemable noncontrolling interests in subsidiaries at December 31, 2010 | | $ | 33,535,969 | |
| Capitalized accretion cost on mandatorily redeemable noncontrolling interests in subsidiaries | | | 3,279,369 | |
| Difference in foreign exchange translation | | | 284,861 | |
| Mandatorily redeemable noncontrolling interests in subsidiaries at March 31, 2011 | | | 37,100,199 | |
The mandatory redemption schedules are as follow:
| Date | | | |
| December 31, 2011 | | | 30,542,278 | |
| December 25, 2012 | | | 26,877,205 | |
| Total | | $ | 57,419,483 | |
Note 3 – Supplemental Disclosure of Cash Flow Information
Income taxes paid amounted to $172,215 and $Nil for three months ended March 31, 2011 and 2010, respectively. Interest paid for the three months ended March 31, 2011 and 2010 amounted to $4,278,064 and $4,277,046, respectively.
The following non-cash investing and financing activities are included in the consolidated financial statements:
| (1) | The Company issued 619,905 of common stock for warrants exercised. The warrants were valued at $1,624,159 at the time of exercise. |
| (2) | The Company issued 1,752,778 of common stock for conversion of convertible debt. The convertible debt was valued at $8,073,512 at the time of conversion. |
Note 4 – Other Receivables, Prepaid Expenses and Deposits
Other receivables and prepaid expenses consisted of the following at March 31, 2011 and December 31, 2010:
| | | March 31, 2011 | | | December 31, 2010 | |
| | | | | | | |
| Other receivable | | $ | 1,662,409 | | | $ | 3,223,089 | |
| Allowance for bad debts | | | (139,600) | | | | (177,392) | |
| Prepaid expenses | | | 388,604 | | | | 194,389 | |
| Prepaid other tax expenses | | | 3,709,828 | | | | 4,413,839 | |
| Other receivables and prepaid expenses | | $ | 5,621,241 | | | $ | 7,653,925 | |
Note 5 – Real Estate Held for Development or Sale
The following summarizes the components of real estate inventories as at March 31, 2011 and December 31, 2010:
| | March 31, 2011 | | | December 31, 2010 | |
| Real estate projects completed and held for sale | | | | | | |
| Junjing I project | | $ | 4,041,309 | | | $ | 4,012,179 | |
| JunJing II project phase one | | | 2,085,968 | | | | 3,389,501 | |
| Tsining 24G project | | | 43,165 | | | | 621,238 | |
| Gangwan project | | | 60,628 | | | | 96,245 | |
| Tsining Home IN project | | | 57,981 | | | | 57,527 | |
| Real estate completed and held for sale | | $ | 6,289,051 | | | $ | 8,176,690 | |
| | | | | | | | | |
| Real estate projects held for development | | | | | | | | |
| Puhua project | | | 87,838,964 | | | | 85,107,643 | |
| Tangdu project | | | 4,527,730 | | | | 4,495,490 | |
| Junjing III project | | | 15,148,220 | | | | 2,569,084 | |
| Park Plaza project | | | 2,401,462 | | | | 2,013,116 | |
| JunJing II project phase two | | | 323,852 | | | | 847,697 | |
| Golden Bay project | | | 4,481,285 | | | | 826,948 | |
| Other projects | | | 390,595 | | | | 415,152 | |
| Construction materials | | | 297,617 | | | | 134,730 | |
| Real estate held for development | | | 115,409,725 | | | | 96,409,860 | |
| | | | | | | | | |
| Total real estate held for development or sale | | $ | 121,698,776 | | | $ | 104,586,550 | |
Interest on debt and accretion costs on mandatorily redeemable noncontrolling interest in subsidiaries incurred by the Company for the three months ended March 31, 2011 was $7,952,174 (2010 - $5,996,787). The Company capitalized $7,370,774 in construction in progress during the three months ended March 31, 2011 (2010 -$5,528,289).
Note 6 – Property and Equipment
Property and equipment consisted of the following at March 31, 2011 and December 31, 2010:
| | | March 31, 2011 | | | December 31, 2010 | |
| Income producing properties and improvements | | $ | 28,417,648 | | | $ | 28,000,452 | |
| Buildings and improvements | | | 5,422,397 | | | | 4,945,393 | |
| Electronic equipment | | | 460,798 | | | | 445,578 | |
| Vehicles | | | 469,845 | | | | 466,165 | |
| Computer software | | | 180,734 | | | | 179,318 | |
| Office furniture | | | 144,270 | | | | 141,655 | |
| Total | | | 35,095,692 | | | | 34,178,561 | |
| Accumulated depreciation | | | (4,956,377) | | | | (4,442,725) | |
| Property and equipment, net | | $ | 30,139,315 | | | $ | 29,735,836 | |
Depreciation expense for the three months ended March 31, 2011 and 2010 amounted to $482,584 and $293,134, respectively. The depreciation expense was included in the selling, general and administrative expenses.
Note 7 – Intangible Asset
The intangible asset consists of the following at March 31, 2011 and December 31, 2010:
| | | March 31, 2011 | | | December 31, 2010 | |
| Development right acquired (a) | | $ | 49,316,395 | | | $ | 48,930,082 | |
| Land use right acquired (b) | | | 8,208,290 | | | | 8,143,992 | |
| Construction license acquired (c) | | | 1,149,637 | | | | 1,140,632 | |
| | | | 58,674,322 | | | | 58,214,706 | |
| Accumulated amortization | | | (6,471,192) | | | | (6,368,296) | |
| Intangible assets, net | | $ | 52,203,130 | | | $ | 51,846,410 | |
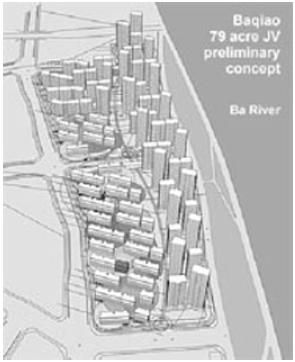
| (a) | The development right for 487 acres of land in Baqiao Park was obtained from the acquisition of New Land in fiscal 2007. The intangible asset has a finite life. The development right was originally to expire on June 30, 2011. The Company was able to extend the right to June 30, 2016 on November 25, 2010. |
| (b) | The land use right was acquired through acquisition of Suodi. The land use right certificate will expire in November, 2048. The Company amortizes the land use right over 39 years. |
| (c) | The construction license was acquired through acquisition of Xinxing Construction. The construction license, which is subject to be renewed every 5 years, is not amortized and has an indefinite estimated useful life because management believes the Company is able to continuously renew the license in the future. The license was subject to renewal on March 10, 2011. The Company has already submitted the application for renewal and management believes the Company can successfully renew the license. In the event that the Company cannot renew the license, management will reassess the recoverability of intangible asset. |
For the three months ended March 31, 2011, the Company has recorded $52,372 of amortization expense on the land use right (2010 - $Nil). The amortization was included in selling, general and administrative expenses. There was no amortization of the development right during the three months ended March 31, 2011 and 2010.
Note 8 – Accrued Expenses
| | | March 31, 2011 | | | December 31, 2010 | |
| Accrued expenses | | $ | 1,559,570 | | | $ | 2,265,650 | |
| Accrued interest on loans | | | 914,524 | | | | 241,988 | |
| Total | | $ | 2,474,094 | | | $ | 2,507,638 | |
Note 9 – Payable for Acquisition of Businesses
| | | March 31, 2011 | | | December 31, 2010 | |
| Payable to original shareholders of Xinxing Construction (i) | | $ | - | | | $ | 2,272,727 | |
| Payable to original shareholders of Suodi (ii) | | | 91,374 | | | | 90,658 | |
| Total | | $ | 91,374 | | | $ | 2,363,385 | |
| (i) | The Company has fully repaid the purchase price of Xinxing Construction during the current period. |
| (ii) | The payable to original shareholders of Suodi represents the remaining balance due to the original shareholders of Suodi assumed by the Company when acquiring Suodi. |
Note 10 – Loans from Employees
The Company has borrowed monies from certain employees to fund the Company’s construction projects. These unsecured loans bear interest at 20% per annum and are available to all employees.
Included in these loans are loans from the Company’s executives and an immediate family member:
| | | March 31, 2011 | | | December 31, 2010 | |
| Chairman | | $ | 763,556 | | | $ | 757,576 | |
| Chief executive officer | | | 305,423 | | | | 303,030 | |
| Chief financial officer | | | 229,067 | | | | 227,273 | |
| | | $ | 1,298,046 | | | $ | 1,287,879 | |
Note 11 – Loans Payable
Bank loans represent amounts due to various banks. These loans generally can be renewed with the banks when they expire. Bank loans as of March 31, 2011 and December 31, 2010 consisted of the following:
| | | March 31, 2011 | | | December 31, 2010 | |
| | | | | | | | | |
Xi’an Rural Credit Union Zao Yuan Rd. Branch | | | | | | | | |
Due July 2, 2011, annual interest is at 8.496 percent, secured by the Company’s Jun Jing Yuan I, Han Yuan and XinXing Tower projects | | | 2,748,805 | | | | 2,727,273 | |
| | | | | | | | | |
| Xinhua Trust Investments Ltd. | | | | | | | | |
| Due February 10, 2012, annual interest is at 10 percent, secured by the 24G project | | | 22,906,709 | | | | 22,727,273 | |
| | | | | | | | | |
| Commercial Bank Weilai Branch | | | | | | | | |
Annual interest is at 7.29 percent, secured by the Company’s Jun Jing Yuan I and XinXing Tower projects and guaranteed by Tsining. $1,527,114 is payable on June 20, 2011 and $1,527,113 is payable on August 29, 2011 | | | 3,054,227 | | | | 4,090,909 | |
| | | | | | | | | |
Bank of Beijing, Xi’an Branch | | | | | | | | |
Due December 10, 2012, annual interest is at the prime rate of People’s Bank of China (5.85%) secured by the PuHua project with a minimum repayment of $7.6 million required by December 31, 2011. | | | 22,906,709 | | | | 22,727,273 | |
| | | | | | | | | |
| | | | | | | | |
Due June 11, 2011, annual interest is at 9.18 percent, secured by the Company’s Junjing Yuan I properties | | | 687,201 | | | | 681,817 | |
| | | | | | | | | |
| JP Morgan International Bank Limited Brussels Branch | | | | | | | | |
Due December 14, 2011, annual interest is at 1.2 percent, secured by a $34,207,352 restricted cash | | | 30,016,529 | | | | 30,016,529 | |
| | | | | | | | | |
| Tianjin Cube Equity Investment Fund Partnership | | | | | | | | |
Due December 10, 2012, annual interest is 9.6 percent, secured by JunJing Yuan II Commercial Units | | | 30,542,278 | | | | - | |
| | | | | | | | | |
| Total | | $ | 112,862,458 | | | $ | 82,971,074 | |
All loans are used to finance construction projects. All interest paid was capitalized and allocated to various real estate construction projects.
The loans payable balances were secured by certain of the Company’s real estate held for development or sale with a carrying value of $92,399,616 at March 31, 2011 (December 31, 2010 - $89,538,930) and certain buildings and income producing properties and improvements with a carrying value of $4,453,124 at March 31, 2011 (December 31, 2010 - $4,458,389). The weighted average interest rate on loans payable as at March 31, 2011 was 6.5% (December 31, 2010 – 5.5%).
The loans payable were also secured by certain real estate units sold to customers. The Company obtained consent from these customers that the Company does not have to remove the mortgage on such apartments or to register the transfer of the ownership of such apartments by the Company to the customers for the time being.
Note 12 – Fair Value of Financial Instruments
The following table summarizes the financial assets and liabilities measured at fair value on a recurring basis as of the measurement date, March 31, 2011, and the basis for that measurement, by level within the fair value hierarchy:
| Fair Value Measurements Using | | Assets/Liabilities | |
| | | Level 1 | | | Level 2 | | | Level 3 | | | At Fair Value | |
| Warrants liability | | $ | - | | | $ | 291,572 | | | $ | - | | | $ | 291,572 | |
| Fair value of embedded derivatives | | | - | | | | 974,972 | | | | - | | | | 974,972 | |
| Total | | $ | - | | | $ | 1,266,544 | | | $ | - | | | $ | 1,266,544 | |
The following table summarizes the financial assets and liabilities measured at fair value on a recurring basis as of the measurement date, December 31, 2010, and the basis for that measurement, by level within the fair value hierarchy:
| Fair Value Measurements Using | | Assets/Liabilities | |
| | | Level 1 | | | Level 2 | | | Level 3 | | | At Fair Value | |
| Warrants liability | | $ | - | | | $ | 2,766,382 | | | $ | - | | | $ | 2,766,382 | |
| Fair value of embedded derivatives | | | - | | | | 2,027,726 | | | | - | | | | 2,027,726 | |
| Total | | $ | - | | | $ | 4,794,108 | | | | - | | | $ | 4,794,108 | |
Note 13 – Convertible Debt
On January 28, 2008, the Company issued Senior Secured Convertible Debt due in 2013 (the “Convertible Debt”) and warrants to subscribe for common shares for an aggregate purchase price of $20 million. Both the warrant and embedded conversion option associated with the Convertible Debt meet the definition of a derivative instrument according to the standard “Accounting for Derivative Instruments and Hedging Activities”. Because the warrant and the convertible debt are denominated in U.S. dollars but the Company’s functional currency is the Chinese RMB, the exemption from derivative instrument accounting provided by the standard is not available and therefore the warrant and embedded conversion option are recorded as a derivative instrument liability and periodically marked-to-market.
On June 10, 2010, the Company and the Investors entered into an amendment (the “Amendment”), which grants investors the right to convert the $11 million non-convertible portion of the Convertible Debt. The right expires 5 business days after the effective date that a registration statement is filed by the Company registering the shares to be issued on the conversion. The warrants issued in 2008 were amended as well to permit the investors to exercise the warrants on a cashless basis and receive one common share for every two warrants held if the investor converts at least 55% of face amount of Convertible Debt held.
On January 25, 2011, certain investors requested and the Company’s board approved the certain Investors to convert $9,763,000 of convertible debt into 1,752,783 common shares with related warrants exercised on a two to one cashless basis. The conversion was effective on February 16, 2011. Since the Company’s registration statement became effective during the period, the rights to convert the $11 million non-convertible portion of the Convertible Debt and to exercise the warrants on a cashless basis and receive one common share for every two warrants were expired.
The fair values of the warrants and embedded conversion option at March 31, 2011 were determined to be $53,500 and $974,972, respectively (December 31, 2010 - $1,920,097 and $2,027,726), using both Alternative Model and CRR Model with the following assumptions:
| | | March 31, 2011 | | | December 31, 2010 | |
| Expected life | | 1.83 – 1.92 years | | | 0.16 - 2.16 years | |
| Expected volatility | | | 80% - 85 | % | | | 95% - 100 | % |
| Risk-free interest rate | | | 0.72% - 0.76 | % | | | 0.11 - 0.68 | % |
| Dividend yield | | | 0 | % | | | 0 | % |
For the three months ended March 31, 2011, the Company recorded a decrease in fair value for the warrants and embedded derivatives of $242,537 and $1,052,754 respectively (March 31, 2010 – decrease of $507,932 and $566,206), in the consolidated statement of income (loss).
The carrying value of the Convertible Debt is accreted to its stated amount on maturity using the effective interest method. The effective interest rate was determined to be 15.42%. The carrying value of Convertible Debt on March 31, 2011 was $8,515,319 (December 31, 2010 - $16,251,840). Related interest and accretion costs for the three months ended March 31, 2011 were $190,338 and $336,991, respectively (2010 - $263,428 and $329,182).
Note 14 – Shareholders’ Equity
Common stock
| 1. | As at December 31, 2010, the Company has accrued $59,606 of stock-based compensation to the independent directors as common stock subscribed. A total of 20,625 common stock was issued during the period. |
| 2. | The Company issued 619,905 of common stock for warrants exercised. The warrants were valued at $1,624,159 at the time of exercise. |
| 3. | The Company issued 1,752,778 of common stock for conversion of convertible debt. The convertible debt was valued at $8,073,512 at the time of exercise. |
Warrants
Pursuant to accounting guidance, “Accounting for Derivative Financial Instruments Indexed to, and Potentially Settle in a Company’s Own Stock”, the warrants issued contain a provision permitting the holder to demand payment based on a valuation in certain circumstances. Therefore, the Company recorded the warrants issued through private placements in 2007 as a liability at their fair value on the date of grant and then revalued them to $238,072 at March 31, 2011 (December 31, 2010 - $846,285) using the CRR Binomial Lattice Model with the following assumptions:
| | | March 31, 2011 | | | December 31, 2009 | |
| Expected life | | 1.11 years | | | 1.36 years | |
| Expected volatility | | | 65 | % | | | 70 | % |
| Risk-free interest rate | | | 0.35 | % | | | 0.40 | % |
| Dividend yield | | | 0 | % | | | 0 | % |
The gain from the change in fair value of warrants for the three months ended March 31, 2011 was $608,114 (2010 – gain of $46,669).
Including the fair value of warrants associated with the convertible debt (note 13), the total warrant liability as at March 31, 2011 was $291,572 (December 31, 2010 - $2,766,382). The total gain from the change in fair value of warrants for the three months ended March 31, 2011 was $850,651 (2010 – gain of $554,601).
The following is a summary of the warrant activity:
| | | Number of Warrants Outstanding | | | Weighted Average Exercise Price | |
| | | | | | | |
| December 31, 2010 | | | 3,940,947 | | | $ | 5.06 | |
| Exercised | | | (1,239,816) | | | | 6.07 | |
| Expired | | | - | | | | - | |
| March 31, 2011 | | | 2,701,131 | | | $ | 4.59 | |
The following summarizes the weighted-average information about the outstanding warrants as at March 31, 2011:
| | | Outstanding Warrants |
Exercise Price | | Number | | Average Remaining Contractual Life |
| | | | | |
| $ | 4.50 | | 2,539,416 | | 1.11 years |
| $ | 6.07 | | 161,715 | | 1.92 years |
| $ | 5.06 | | 2,701,131 | | 1.16 years |
Note 15 – Other Revenue
| | | For the three months ended | |
| | | March 31, 2011 | | | March 31, 2010 | |
| Interest income | | $ | 38,826 | | | $ | 116,546 | |
| Rental income, net | | | 587,276 | | | | 310,910 | |
| Income from property management services | | | 831,201 | | | | 754,407 | |
| Miscellaneous construction contracts | | | 1,435,424 | | | | - | |
| Gain on disposal of fixed assets and inventory | | | 8,152 | | | | - | |
| Total | | $ | 2,900,879 | | | $ | 1,181,853 | |
Note 16 – Earnings (Loss) per Share
Earnings per share for the three months ended March 31, 2011, and 2010 were determined by dividing net income (loss) attributable to China Housing & Land Development, Inc. for the periods by the weighted average number of both basic and diluted shares of common stock and common stock equivalents outstanding.
| | | March 31, | | | March 31, | |
| | | 2011 | | | 2010 | |
| Numerator | | | | | | |
| Net (loss) income attributable to China Housing & Land Development, Inc. – basic | | $ | 2,469,083 | | | $ | (11,111,109 | ) |
| Effect of dilutive securities | | | | | | | | |
| Convertible Debt | | | 828,048 | | | | - | |
| Income attributable to China Housing & Land Development, Inc. – diluted | | $ | 1,641,035 | | | $ | (11,111,109 | ) |
| Denominator | | | | | | | | |
| Weighted average shares outstanding – basic | | | 33,886,568 | | | | 32,580,769 | |
| Effect of dilutive securities | | | | | | | | |
| Convertible Debt | | | 1,615,709 | | | | - | |
| Weighted average shares outstanding – diluted | | | 35,502,277 | | | | 32,580,769 | |
| Earnings per share | | | | | | | | |
| Basic earnings per share | | $ | 0.07 | | | $ | (0.34 | ) |
| Diluted earnings per share | | $ | 0.05 | | | $ | (0.34 | ) |
All outstanding warrants have an anti-dilutive effect on the earnings per share and are therefore excluded from the determination of the first quarter of fiscal 2011 diluted earnings per share calculation.
Note 17 – Commitments and Contingencies
The Company leases part of its office and land for self use under various operating lease agreements with expiry dates between the years 2010 and 2041.
The Company is also committed to acquire Shaanxi Bihu Property Development Co., Limited (“Bihu”). The remaining related purchase price to be paid within one year is approximately $9.4 million.
The Company also had various commitments related to land use right acquisition with unpaid balances of approximately $22.0 million. The balances are not due until the vendor removes the existing building on the land and changes the zoning status of the land use right certificate. Based on the current condition, the Company estimates that the balances will be paid in two years.
All future payments required under the various agreements are summarized below.
| | Payment due by period | |
| Commitments and Contingencies | Total | | Less than 1 year | | 1-2 years | | | 2-3 years | | | 3-4 years | | | 4-5 years | | | After 5 years | |
| | | | | | | | | | | | | | | | | | | |
| Operating leases | | $ | 3,057,801 | | | $ | 211,113 | | | $ | 141,834 | | | $ | 141,834 | | | $ | 144,934 | | | $ | 144,934 | | | $ | 2,273,152 | |
| Acquisition (note 19) | | | 9,422,293 | | | | 9,422,293 | | | | - | | | | - | | | | - | | | | - | | | | - | |
| Land use rights | | | 21,966,592 | | | | 21,966,592 | | | | - | | | | - | | | | - | | | | - | | | | - | |
| Total | | $ | 34,446,686 | | | $ | 31,599,998 | | | $ | 141,834 | | | $ | 141,834 | | | $ | 144,934 | | | $ | 144,934 | | | $ | 2,273,152 | |
Note 18 – Related Party Transactions
One of the Company’s executive officers’ spouse owned 37.83% of common stock of Xi’an Xinxing Days Hotel & Suites (“Days Hotel”). During the three months ended March 31, 2011, the Company has incurred $32,428 (2010 - $Nil) fees to Days Hotel and sold 14 apartments amounting to $695,439 to Days Hotel. As at March 31, 2011, the Company has $118.088 (December 31, 2010 - $38,281) payable to Days Hotel.
Note 19 – Subsequent Events
The Company signed an Equity Transfer Agreement on February 28, 2011 with the shareholders of Bihu to acquire all outstanding common shares of Bihu. Bihu is located in Hu County, which is a satellite city located approximately 35 kilometers from Xi’an. The total purchase price is approximately $15.2 million (RMB 100 million). The Company has transferred a $4.54 million (RMB 30 million) into a restricted cash account for the acquisition on March 2, 2011. The remaining balance is to be paid within five business days after all the equity registrations are finalized with PRC government. However, because the sellers have been slow to fulfill their obligations, and the remaining balance has not yet been paid as planned. The registrations have not been finalized as at March 31, 2011.
Item 2. Management’s Discussion and Analysis of Financial Condition and Results of Operations
FORWARD-LOOKING STATEMENTS
Some of the statements contained in this Form 10-Q are not historical facts and are forward-looking statements, which can be identified by the use of terminology such as estimates, projects, plans, believes, expects, anticipates, intends, or the negative or other variations, or by discussions of strategy that involve risks and uncertainties. We urge you to be cautious of the forward-looking statements, that such statements, which are contained in this Form 10-Q reflect our current beliefs with respect to future events and involve known and unknown risks, uncertainties, and other factors affecting our operations, market growth, services, products, and licenses. No assurances can be given regarding the achievement of future results, as actual results may differ materially as a result of the risks we face, and actual events and conditions that may differ from the assumptions underlying the statements that have been made regarding anticipated events. Factors that may cause actual results, our performance or achievements, or industry results, to differ materially from those contemplated by such forward-looking statements include without limitation: our ability to attract and retain management to integrate and maintain technical information and management information systems; our ability to raise capital when needed and on acceptable terms and conditions; the intensity of competition; and general economic conditions.
All written and oral forward-looking statements made in connection with this Form 10-Q that are attributable to us or persons acting on our behalf are expressly qualified in their entirety by these cautionary statements. Given the uncertainties that surround such statements, you are cautioned not to place undue reliance on such forward-looking statements.
Critical Accounting Policies and Estimates
We prepare our interim condensed consolidated financial statements in accordance with U.S. GAAP, which requires us to make judgments, estimates and assumptions that affect (i) the reported amounts of our assets and liabilities, (ii) the disclosure of our contingent assets and liabilities at the end of each reporting period and (iii) the reported amounts of revenues and expenses during each reporting period. We continually evaluate these estimates based on our own experience, knowledge and assessment of current business and other conditions, our expectations regarding the future based on available information and reasonable assumptions, which together form our basis for making judgments about matters that are inherently uncertain. Since the use of estimates is an integral component of the financial reporting process, our actual results could differ from those estimates. Some of our accounting policies require a higher degree of judgment than others in their application.
When reading our interim condensed consolidated financial statements, you should consider (i) our selection of critical accounting policies, (ii) the judgment and other uncertainties affecting the application of such policies and (iii) the sensitivity of reported results to changes in conditions and assumptions. We believe the following accounting policies involve the most significant judgments and estimates used in the preparation of our financial statements.
The unaudited interim condensed consolidated financial statements are based on accounting principles that are consistent in all material respects with those applied in the Company’s Annual Report on Form 10-K for the year ended December 31, 2010 (“2010 Annual Report”); except as disclosed below. They do not include certain footnote disclosures and financial information normally included in annual consolidated financial statements prepared in accordance with GAAP and, therefore, should be read in conjunction with the audited consolidated financial statements and notes included in the Company's 2010 Annual Report.
Warrants and derivative liability
As of March 31, 2011, the Company has approximately $0.29 million of warrants liability and $0.97 million of fair value of embedded derivatives on the balance sheet, representing approximately 0.1% and 0.3% of the total liabilities, respectively.
We utilize the Cox-Rubinstein-Ross (“CRR”) Binomial Lattice Model to estimate the fair values of warrants liability and embedded derivatives. The CRR model depends on the following assumptions: the Company’s common stock price underlying the warrants; strike price; conversion price; expected life; expected volatility; risk free interest rate; and dividend rate. We used the CRR Binomial Lattice Model for the past 3 years and we do not expect any significant changes to assumptions except for the common share price and the expected volatility.
We estimate the fair value of warrants liability and embedded derivatives every quarter and recognize the change of fair value as gain or loss on our current quarter consolidated statement of income. The fair values of warrants liability and embedded derivatives have changed during the past few years according to the valuation models and the fair values are positively related to the market share price movement and the volatility.
Prior to June 10, 2010, the date of Amendment of Convertible Debt, the Company used the CRR Binomial Lattice Model to assess the fair value of warrants and embedded derivatives at each reporting period. After the Amendment, since the investor could exercise the warrants on a cashless basis and receive one common share for every two warrants held, if the investor converts at least 55% of face amount of Convertible Debt held, in addition to the CRR Binomial Lattice Model, the Company also uses an alternative valuation method (the “Alternative Model”) to assess the fair value of the warrants. The Alternative Model is based on the share price of the Company at valuation date and the number of common shares that could result from the two for one cashless exercise. The Company records the warrant liability based on the higher valuation resulted from either CRR Binomial Lattice Model or Alternative Model at the valuation date.
Several investors converted total $9,763,000 face value convertible debt and exercised the related warrants with the 2-to-1 cashless exercise feature added as part of the Amendment. Subsequently, the Company was able to charge $8,073,512 convertible debt carrying and the fair value of the conversion features into shareholders’ equity. The fair value of $1,624,159 of the warrants on the day of exercise was also charged to shareholders’ equity.
After the conversion of the convertible debt and exercise of warrants as described above and 5 days after the effectiveness of the registration statement, the 2-to-1 cashless warrants conversion feature has expired for those investors who has not exercised their warrants. Therefore, the Alternative Model has been terminated.
During the three months ended March 31, 2011, our common stock price experienced fluctuations with the price decreasing from $2.79 on January 3, 2011 to $1.96 on March 31, 2011. The decrease in stock price caused a decrease in fair value for warrants liability and embedded derivatives. As a result, we recognized a change in fair value of warrants of approximately $0.85 million and a change in fair value of embedded derivatives of approximately $1.1 million, which are both non-cash gains.
The following table summarizes the fair value of warrant liability and embedded derivative as of March 31, 2011 and December 31, 2010.
| | | March 31, 2011 | | | December 31, 2010 | |
| | | | | | | |
| Fair value of warrants liability | | $ | 291,572 | | | $ | 2,766,382 | |
| Fair value of embedded derivatives | | $ | 974,972 | | | $ | 2,027,726 | |
The following tables summarize all the warrants and conversion option outstanding and the assumptions used for their valuations as of March 31, 2011 and December 31, 2010.
| Investor Warrants: | | 3/31/2011 | | | 12/31/2010 | |
| Strike price | | | 6.07 | | | | 6.07 | |
| Market price | | | 1.96 | | | | 2.74 | |
| Valuation date | | 3/31/2011 | | | 12/31/2010 | |
| Expiry date | | 2/28/2013 | | | 2/28/2013 | |
| Volatility | | | 85.00 | % | | | 100.00 | % |
| Risk free rate | | | 0.76 | % | | | 0.68 | % |
| Option value | | | 0.33083 | | | | 0.97788 | |
| | | | | | | | | |
| # of warrants | | | 161,715 | | | | 1,401,531 | |
| | | | | | | | | |
| CRR Binomial Lattice Model Value | | | 53,500 | | | | 1,370,529 | |
| | | | | | | | | |
| Alternative Model | | | | | | | | |
| # of shares if warrants converted two for one | | | N/A | | | | 700,765 | |
| Alternative value | | | N/A | | | | 1,920,097 | |
| | | | | | | | | |
| Warrants Value | | | 53,500 | | | | 1,920,097 | |
| Investor Warrants: 5-7-2007 | | 3/31/2011 | | | 12/31/2010 | |
| Strike price | | | 4.50 | | | | 4.50 | |
| Market price | | | 1.96 | | | | 2.74 | |
| Valuation date | | 3/31/2011 | | | 12/31/2010 | |
| Expiry date | | 5/9/2012 | | | 5/9/2012 | |
| Volatility | | | 65.00 | % | | | 70.00 | % |
| Risk free rate | | | 0.35 | % | | | 0.40 | % |
| | | | | | | | | |
| Option value | | | 0.09375 | | | | 0.33322 | |
| | | | | | | | | |
| # of warrants | | | 2,539,416 | | | | 2,539,416 | |
| | | | | | | | | |
| Value | | | 238,072 | | | | 846,285 | |
| Conversion Option Valuation: | | 3/31/2011 | | | 12/31/2010 | |
| Strike price | | | 5.57 | | | | 5.57 | |
| Market price | | | 1.96 | | | | 2.74 | |
| Valuation date | | 3/31/2011 | | | 12/31/2010 | |
| Expiry date | | 1/28/2013 | | | 2/28/2011-1/28/2013 | |
| Volatility | | | 80.00 | % | | | 95.00 | % |
| Risk free rate | | | 0.72 | % | | | 0.11 | % |
| Option value | | | 0.60343 | | | | 0.92349-0.01800 | |
| | | | | | | | | |
| Host Value – principal | | | 8,999,500 | | | | 20,000,000 | |
| Host Value – interest | | | 0 | | | | 0 | |
| | | | | | | | | |
| Shares issuable on conversion | | | 1,615,709 | | | | 3,590,664 | |
| | | | | | | | | |
| Option value – principal | | | 974,972 | | | | 2,027,726 | |
Real estate held for development or sale, intangible asset and deposits on land use rights
We evaluate the recoverability of our real estate developments taking into account several factors including, but not limited to, our plans for future operations, prevailing market prices for similar properties and projected cash flows.
We review real estate projects, whenever events or changes in circumstances indicate that the carrying amount of an asset may no longer be recoverable. When these events occur, we measure impairment by comparing the carrying value to the estimated undiscounted future cash flows expected resulting from the use of the assets and their eventual disposition. If the total of the expected undiscounted cash flow is less than the carrying amount of the assets, we recognize an impairment loss based on the fair value of the assets.
Our significant judgments and estimates related to impairment include our determination if an event has occurred to warrant an impairment test. If a test is required, other significant judgments and estimates will include our expectations of future cash flows and the calculation of the fair value of the impaired assets.
When real estate costs are determined to be impaired, they are written down to their estimated net realizable value. The Company evaluates the carrying value for impairment based on the undiscounted future cash flows of the assets. Write-downs of real estate costs deemed impaired are recorded as adjustments to the cost basis. There has been no impairment on real estate inventories and no impairment loss has been recorded for the three months ended March 31, 2011 and 2010.
The following summarizes the components of real estate inventories as of March 31, 2011 and December 31, 2010:
| | March 31, 2011 | | | December 31, 2010 | |
| Real estate projects completed and held for sale | | | | | | |
| Junjing I project | | $ | 4,041,309 | | | $ | 4,012,179 | |
| JunJing II project phase one | | | 2,085,968 | | | | 3,389,501 | |
| Tsining 24G project | | | 43,165 | | | | 621,238 | |
| Gangwan project | | | 60,628 | | | | 96,245 | |
| Tsining Home IN project | | | 57,981 | | | | 57,527 | |
| Real estate completed and held for sale | | $ | 6,289,051 | | | $ | 8,176,690 | |
| | | | | | | | | |
| Real estate projects held for development | | | | | | | | |
| Puhua project | | | 87,838,964 | | | | 85,107,643 | |
| Tangdu project | | | 4,527,730 | | | | 4,495,490 | |
| Junjing III project | | | 15,148,220 | | | | 2,569,084 | |
| Park Plaza project | | | 2,401,462 | | | | 2,013,116 | |
| JunJing II project phase two | | | 323,852 | | | | 847,697 | |
| Golden Bay project | | | 4,481,285 | | | | 826,948 | |
| Other projects | | | 390,595 | | | | 415,152 | |
| Construction materials | | | 297,617 | | | | 134,730 | |
| Real estate held for development | | | 115,409,725 | | | | 96,409,860 | |
| | | | | | | | | |
| Total real estate held for development or sale | | $ | 121,698,776 | | | $ | 104,586,550 | |
Intangible asset
As of March 31, 2011 and December 31, 2010, intangible asset consists of the following:
| | | March 31, 2011 | | | December 31, 2010 | |
| Development right acquired | | $ | 49,316,395 | | | $ | 48,930,082 | |
| Land use right acquired | | | 8,208,290 | | | | 8,143,992 | |
| Construction license acquired | | | 1,149,637 | | | | 1,140,632 | |
| | | | 58,674,322 | | | | 58,214,706 | |
| Accumulated amortization | | | (6,471,192) | | | | (6,368,296) | |
| Intangible assets, net | | $ | 52,203,130 | | | $ | 51,846,410 | |
The development right acquired is related to the exclusive rights to develop 487 acres of land in the Baqiao area acquired in 2007. This intangible asset has a finite life. The development right originally was supposed to expire on June 30, 2011. The Company was able to extend the right to June 30, 2016 on November 25, 2010.
According to the agreement with the Baqiao District Government, at the beginning of each year, the Company will prepare the annual work plan and have it approved by the Baqiao District Government. The annual work plan includes detailed description of the projects that will be started during that year and the Baqiao District Government is responsible for granting the land clearance for those projects.
The Company amortized the intangible asset based on the percentage of the profit margin realized over the total expected profit margin to be realized from the 487 acres of land in the Baqiao project. This method is intended to match the pattern of amortization with the income-generating capacity of the intangible asset. Amortization expense for the development right for the three months ended March 31, 2011 and 2010 amounted to $0 because no land use right in Baqiao project was acquired during the first quarter of fiscal 2011.
The land use right was acquired through acquisition of Suodi. The land use right certificate will expire in November of 2048. The Company will amortize this land use right over 39 years.
The Company evaluates its finite life intangible assets for impairment whenever events or changes in circumstances indicate the carrying value may not be recoverable. Based on estimated future cash flows, the Company records a write-down for impairments, if appropriate. For the three months ended March 31, 2011 and 2010, the Company has recorded $0 of impairment on this intangible asset.
The construction license was acquired through acquisition of Xinxing Construction. The construction license, which is subject to be renewed every 5 years, is not amortized and has an indefinite estimated useful life because management believes the Company will be able to continuously renew the license in the future. The license was subject to renewal on March 10, 2011. The Company has already submitted the application for renewal and management believes the Company can successfully renew the license. In the event that the Company cannot renew the license, management will reassess the recoverability of this intangible asset.
For the three months ended March 31, 2011, the Company has recorded $52,372 of amortization expense on the land use right (2010 - $Nil). The amortization was included in selling, general and administrative expenses.
Deposits on land use rights
| | | March 31, 2010 | | | December 31, 2010 | |
| | | | | | | |
| Deposits on land use rights | | | 68,652,286 | | | | 74,938,729 | |
The decrease in deposits on land use rights was mainly due to reclassification of the deposits on land use rights of JunJing III project to real estate held for development or sale, as the Company completed a transaction to purchase the land use rights for the JunJing III project during the first quarter of 2011.
The Company conducts regular reviews of the deposits on land use rights. After review and assessment, the Company concluded that there was no significant decrease in the market price and therefore no impairment write-down was required. According to E-House (China) Real Estate Research Institute the average residential sale price in Xi’an city was stable in the fiscal quarter ended March 31, 2011. The average sale price increased to 7,220 RMB per square meter (approximately US$ 1,097 per square meter) from 6,706 RMB (approximately US$ 1,019 per square meter) in the fourth quarter 2010, representing in increase of about 7.7% quarter-over-quarter.
Material trends and uncertainties that may impact continuing operations
Changes in national and regional economic conditions, as well as in areas where we conduct our operations and where prospective purchasers of our homes live, may result in more caution on the part of homebuyers resulting in fewer home purchases. According to data from the Xi’an Bureau of Statistics, Xi’an city’s real estate transaction volume (in terms of sq. meter signed) increased about 25.8% in the first quarter of 2011 compared to the same period of 2010. All of our projects are currently in Xi’an city. During the first quarter of 2011, our sales of properties decreased approximately 39.3% over same period of 2010, which was mainly due to the fact that JunJing II project was substantially sold and new projects such as JunJing III and Park Plaza have not met all the revenue recognition criteria.
Virtually all purchasers of our homes finance their acquisitions through lenders providing mortgage financing. A substantial increase in mortgage interest rates or unavailability of mortgage financing would adversely affect the ability of prospective homebuyers to obtain the financing they need in order to purchase our homes, as well as the ability of prospective move-up homebuyers to sell their current homes. For example, if mortgage financing became less available, demand for our homes could decline. A reduction in demand could also have an adverse effect on the pricing of our homes because we (and our competitors) may reduce prices in an effort to compete for home buyers. A reduction in pricing could result in a decline in revenues and margins. Additional government policies were implemented by the local government in February 2011 to curb speculation in the real estate market. These new policies included capping year-over-year housing unit ASP increases to 15%, restricting third-time home purchases for local residents and second-time home purchases for non-local residents. These new policies could result in buying hesitation among potential new customers, which could impact our revenues.
The real estate development industry is capital intensive, requiring significant up-front expenditures to acquire land and begin development. Accordingly, we incur substantial indebtedness to finance our homebuilding and land development activities. Although we believe that internally generated funds and current borrowing capacity will be sufficient to fund our capital and other expenditures (including land acquisition, development and construction activities), the amounts available from such sources may not be adequate to meet our needs. If such sources are not sufficient, we would seek additional capital in the form of debt or equity financing from a variety of potential sources, including bank financing and/or securities offerings. The availability of borrowed funds, to be utilized for land acquisition, development and construction, may be greatly reduced, and the lending community may require larger amounts of equity to be invested by borrowers in a project in connection with new loans. Failure to obtain sufficient capital to fund planned capital and other expenditures could have a material adverse effect on our business.
In addition, regulatory requirements could force us to incur significant liabilities and operating expenses and could restrict our business activities. We are subject to statutes and rules regulating, among other things, certain developmental matters, building and site design, and matters concerning the protection of health and the environment. Our operating expenses may be increased by governmental regulations such as building permit allocation ordinances and impact and other fees and taxes, which may be imposed to defray the cost of providing certain governmental services and improvements. Any delay or refusal from government agencies to grant the necessary licenses, permits and approvals could have an adverse effect on our operations.
As of March 31, 2011, we had $81,642,228 of cash and cash equivalents compared to $46,904,161 as of December 31, 2010, an increase of $34,738,067.
The Company believes that the combination of present capital resources, internally generated funds, and unused financing sources are more than adequate to meet cash requirements for the year 2011. We intend to meet our liquidity requirements, including capital expenditures related to the purchase of land for the development of future projects, through cash provided by operations and additional funds raised by future financings. Upon acquiring land for future development, we intend to raise funds to develop our projects by obtaining mortgage financing mainly from local banking institutions with which we have done business in the past. We believe that our relationships with these banks are in good standing and that our real estate will secure the loans needed. We believe that adequate cash will be available to fund our operations.
BUSINESS
Our Company
We are a leading residential developer with a focus on fast growing Tier II and Tier III cities in Western China. We are dedicated to providing quality and affordable housing to middle class families. The majority of our customers are first time home buyers and first time up-graders, who, we believe, will benefit from China’s rapid gross domestic product (“GDP”) growth and the middle classes’ corresponding increase in purchasing power.
We commenced our operations in Xi’an in 1999 and have been considered as one of the industry leaders and one of the largest private residential developers in the region. We have experienced significant growth in the past 12 years and have completed over 1.3 million square meters of residential projects. Through the utilization of modern design and technology, as well as a strict cost control system, we are able to offer our customers high quality, cost-effective products. Most of our projects are designed by world-class architecture firms from the United States, Canada and Europe who have introduced advanced “eco” and “green” technologies into our projects.
As we are focusing primarily on the demand from first time home buyers and first time up-graders in Western China, the majority of our apartments have sizes in the range of 70 square meters to 120 square meters; with such sizes considered to be a stable market section of the residential real estate market in Western China. Our typical residential project is approximately 100,000 square meters in size and consists of multiple high-rise, middle-rise and low-rise buildings as well as a community center, commercial units, educational facilities such as kindergartens and other auxiliary facilities. In addition, we provide property management services to our developments and have exclusive membership systems for our customers. We typically generate a large portion of our sales through the recommendations of our existing customers.
We acquire our land reserves and development sites through primary land development with the local government, open-market auctions and acquisition of old factories from the government and distressed assets from commercial banks. We do not depend on a single land acquisition method and this facilitates our acquisition of the land at a reasonable cost, which in turn results in our typically receiving higher returns on our investments from our developments. We intend to continue our expansion into other strategically selected cities in Western China by leveraging our brand name and scalable business model.
Our Strategies
We are primarily focused on the development, construction, and sale and management of residential real estate properties to capitalize on the rising demand for real estate from China’s emerging middle class. We strive to become the market leader in Western China and plan to implement the following specific strategies to achieve our goal:
Consolidate through Acquisition and Partnership. Currently, the residential real estate market in Western China is fragmented with many small players. We believe that this market fragmentation will provide us with opportunities for acquisitions or partnerships. We believe acquisitions will provide us better leverage in negotiations and better economies of scale.
Expand into Other Tier II and Tier III Cities. We believe our proven business model and expertise can be replicated in other Tier II and Tier III cities, especially in Western China. As such, we have identified certain cities that possess attractive replication dynamics.
Continue to Focus on the Middle Market. Since the middle class has growing purchasing power and, as a result of prevailing Chinese culture and values, a strong desire to own homes, we believe the demands for residential real estate from the emerging middle class will offer attractive opportunities for growth of our Company. Thus, we plan to leverage our brand name, experience and design capabilities to meet these demands from the middle class.
Our Competitive Strengths
We believe we have the following competitive strengths which will enable us to compete effectively and to capitalize on the growth opportunities in our market:
Leading position in our market and industry
We are one of the largest private residential real estate developers in western China. We believe that we have strong design and sales capabilities as well as a well-regarded brand name in the region. Due to strong local project experience and long term relationships with the central and local governments, we have been able to acquire significant land assets at reasonable costs, thereby providing a strong pipeline of potential future business and revenues over the next three to five years.
Attractive market opportunity
The real estate market in western China has grown slower than that of eastern China. We believe the region is well positioned to grow at a faster rate for the next few years due to social, economic, regulatory and government stimulus-related factors. Our real estate sales have recovered from the 2008 economic downturn with growth from US$24,306,062 in 2008 to US$78,511,269 in 2009 to US$131,472,461 in 2010. Our business model has proven to be efficient and we plan to expand into other Tier II and Tier III cities in western China. Our growth strategy is focused on western China, and we believe we will significantly benefit from the Chinese government’s “Go West” policy, which encourages economic development and population movement to western China.
Unique and proven business model
Due to strong local project experience and long term working relationships with the central and local governments, we have been able to acquire land assets at more reasonable costs than our competitors. We are primarily focused on capitalizing on rising demand for properties from China’s emerging middle class, which has significant purchasing power and a strong demand for residential housing. In order to leverage our brand to appeal to the middle class, we use various advertising media to market our property developments and to reach our target demographic, including newspapers, magazines, television, radio, e-marketing and outdoor billboards. We believe that our brand is widely recognized in our market and known for high quality products at cost-effective prices.
Our Property Projects
We provide three fundamental types of real estate development products:
| · | High-rise apartment buildings, typically 19 to 33 stories, usually constructed of steel-reinforced concrete, that are completed within approximately 24 months of securing all required permits. |
| · | Mid-rise apartment buildings, typically 7 to 18 stories, usually constructed of steel-reinforced concrete, that are completed within 12 to 18 months of securing all required permits. |
| · | Low-rise apartment buildings and villas, typically 2 to 6 stories, often constructed of steel-reinforced concrete, that are completed within approximately 12 months of securing all required permits. |
Our projects can be classified into one of four stages of development:
| · | Projects in planning, which include projects for which we have purchased the development and or land use rights for parcels of land as part of our project development pipeline. The completion of projects on these sites is subject to adequate financing, approval of permits, receipt of licenses and certain market conditions; |
| · | Projects in process, which include developments where we have typically secured the development and land use rights, and where the site planning, architecture, engineering and infrastructure work is in progress; |
| · | Projects under construction, where the building construction has started but has not yet been completed; and |
| · | Completed projects with units available for sale, where the construction has been finished and most of the units in the buildings have been sold or leased. |
Projects under construction
Project Name | | Type of Projects | | Actual or Estimated Construction Period | | Actual or Estimated Pre-sale Commencement Date | | Total Site Area (m2) | | Total Gross Floor Area (m2) | | Sold GFA by March 31, 2011 (m2) |
| JunJing II phase two | | Multi-Family residential & Commercial | | Q2/ 2009 - Q2/2011 | | Q3/2009 | | 29,800 | | 121,953 | | 121,366 |
| | | | | | | | | | | | | |
| Puhua Phase One | | Multi-Family residential & Commercial | | Q2/2009 - Q3/2011 | | Q4/2009 | | 47,600 | | 139,103 | | 93,198 |
| | | | | | | | | | | | | |
| Puhua Phase Two | | Multi-Family residential & Commercial | | Q2/2010 - Q3/2012 | | Q2/2010 | | 47,300 | | 262,519 | | 49,126 |
Project name | | Total Number of Units | | Number of Units sold by March 31, 2011 | | Estimated Revenue ($million) | | Contracted Revenue by March 31, 2011 ($million) | | Recognized Revenue by March 31, 2011 ($million) |
| JunJing II phase two | | 1,015 | | 1,012 | | 97.6 | | 97.0 | | 92.2 |
| | | | | | | | | | | |
| Puhua Phase One | | 840 | | 684 | | 124.1 | | 76.2 | | 47.5 |
| | | | | | | | | | | |
| Puhua Phase Two | | 1,284 | | 412 | | 252.1 | | 39.8 | | 15.8 |
JunJing II: JunJing II is located at 38 East Hujiamiao, Xi’an, with total GFA of about 248,568 square meters. It is the first Canadian style residential community with “green and energy-saving” characteristics.” The project is divided into 2 phases, namely JunJing II Phase One and JunJing II Phase Two.
We started the construction of JunJing II Phase One in the third quarter of 2007 and started the presale campaign in the second quarter of 2007. Phase One was completed in the fourth quarter of fiscal 2009.
The construction of Phase Two commenced in the second quarter of 2009 and pre-sales started within the same quarter. As of March 31, 2011, the contract revenue for Phase Two is $ 97.0 million, of which we have recognized $92.2 million in revenues. Phase Two is expected to be completed in the second quarter of fiscal 2011. Revenues will continue to be recognized as the construction progresses and the remaining units are sold.
Puhua: The Puhua project, the Company’s 79 acre joint venture located in the Baqiao New Development Zone, has a total land area of 192,582 square meters and an expected GFA of approximately 640,000 square meters.
The construction of the Puhua project began in June 2009. The whole project, which consists of four phases, is expected to be completed in the third quarter of 2014, with estimated revenues of $700 million. The Company began accepting pre-sale contracts for units in the Puhua Phase One project on October 24, 2009. As of March 31, 2011, the contract revenue for Puhua project is $116.0 million.
Projects under planning and in process
| Project Name | | Type of Projects | | Estimated Construction Period | | Estimated Pre-sale Commencement | | Total Site Area (m2) | | Total GFA (m2) | | Total Number of Units |
| Baqiao New Development Zone | | Land | | 2009- | | N/A | | N/A | | N/A | | N/A |
| Development | 2020 |
| JunJing III | | Multi-Family residential & Commercial | | Q4/2010 | | Q2/2011 | | 8,094 | | 49,636 | | 570 |
| - Q1/2012 |
| Park Plaza | | Multi-Family residential & Commercial | | Q2/2011 | | Q3/2011 | | 44,250 | | 141,822 | | 2,000 |
| - Q4/2014 |
| Golden Bay | | Multi-Family residential & Commercial | | Q2/2011 | | Q3/2011 | | 146,099 | | 252,540 | | N/A |
| - Q4/2014 |
| Textile City | | Multi-Family residential & Commercial | | Q3/2012 | | Q3/2012 | | 433,014 | | 630,000 | | N/A |
| - O3/2018 |
Baqiao New Development Zone: On March 9, 2007, we entered into a Shares Transfer Agreement with the shareholders of Xi’an New Land Development Co., Ltd. (“NewLand”), under which the Company acquired 32,000,000 shares of NewLand, constituting 100% equity ownership of NewLand. This acquisition gave the Company the exclusive right to develop and sell 487 acres of land in a newly designated satellite city of Xi’an.
Xi’an has designated the Baqiao District as a major resettlement zone where the city expects 900,000 middle to upper income inhabitants to settle. The Xi’an local government intends to generate a success similar to that created in Pudong, Shanghai, which has resulted in new economic opportunities and provided housing for Shanghai’s growing population.
The Xi’an municipal government plans investments of 50 billion RMB (over $6 billion) in infrastructure in the Baqiao New Development Zone. The construction of a large-scale public wetland park is well underway; it will embellish the natural environment adjacent to China Housing’s Baqiao project.
Through our New Land subsidiary, we sold 18.4 acres to another developer in 2007 and generated about $24.41 million in revenue. In 2008, we established a joint venture with Prax Capital Real Estate Holdings Limited (“Prax Capital”) to develop 79 acres within the Baqiao project, which will be the first phase of the Baqiao project’s development. Prax Capital invested $29.3 million cash in the joint venture. The project is further described in the Puhua section below.
In December 2010, we signed a preliminary contract with the local government with the intention to acquire a 107 acre tract of land for development of a new real estate housing project. The new project is expected to begin in the third quarter of 2011, with an estimated total GFA of 630,000 square meters.
After selling 18.4 acres, placing 79 acres in the joint venture, setting aside approximately 42 acres for the Golden Bay Project, about 348 acres remains available for the Company to develop in the Baqiao project. JunJing III: JunJing III is located near our JunJing II project and the city expressway. It has an expected total GFA of about 49,636 square meters. The project will consist of 3 high rise buildings, each 28 to 30 stories high. The project is targeting middle to high income customers who require a high quality living environment and convenient transportation to the city center. We started construction during the fourth quarter of 2010 and expect to begin recognizing revenue during the second quarter of 2011. The total estimated revenue from this project is about $46 million. | | |
Park Plaza: In July 2009, the Company entered into a Letter of Intent to acquire 44,250 square meters of land in the center of Xi’an for the Park Plaza project. The Company intends to develop a large mid to upper income residential and commercial development project on this site, with an estimated GFA of 141,822 square meters. The four-year construction of Park Plaza was expected to begin in the second quarter 2011. We anticipated accepting pre-sale purchase agreements in the third quarter of 2011, and revenues from pre-sale agreements will begin to be recognized when all revenue recognition criteria have been met. The total revenue from Park Plaza is estimated to be $154 million.
Golden Bay: The Golden Bay project is located within the Baqiao project, with a total GFA of 252,540 square meters. The Golden Bay project will consist of residential buildings as well as a commercial area. Construction was anticipated to begin in the second quarter of 2011, and we expect to begin accepting presale purchase agreements in the third quarter of 2011.
Textile City: The Textile City project is located within the Baqiao New Development Zone. The project consists of residential buildings and a commercial area. Construction is expected to start in the third quarter of 2012, and the entire project will take 5 years.
Completed Projects with units available for sale
| Project name | | Type of Projects | | Completion Date | | Total Site Area (m2) | | Total GFA (m2) | | Total Number of Units | | Number of Units sold by March 31, 2011 |
| JunJing II Phase One | | Multi-Family residential & Commercial | | Q4/2009 | | 39,524 | | 134,070 | | 1,191 | | 1,186 |
| JunJing I | | Multi-Family residential & Commercial | | Q3/2006 | | 55,588 | | 167,931 | | 1,671 | | 1,655 |
JunJing II Phase One: We started the construction of JunJing II phase one in the third quarter of 2007 and started the pre-sale campaign in the second quarter of 2007. The project was completed in December 2009 and generated total revenue of $90.3 million.
Tsining JunJing Garden I: 369 North Jinhua Road, Xi’an. It is the first German style residential & commercial community in Xi’an, designed by the world-famous WSP architectural design house. Its target Customers were local middle income families. The project has 15 residential apartment buildings consisting of 1,671 one to five bedroom apartments. The project features secured parking, cable TV, hot water, heating systems, and access to natural gas. Total GFA available was 167,931 square meters. JunJing Garden I was also a commercial venture that houses small businesses serving the needs of JunJing Garden I residents and surrounding residential communities. The project was completed in September 2006.
CONSOLIDATED OPERATING RESULTS
Three Months Ended March 31, 2011 Compared With Three Months Ended March 31, 2010
Revenues
Our revenues are mainly derived from the sale of residential and commercial units and buildings, infrastructure work we perform for the local government and land development projects in the Baqiao area.
In the first quarter of 2011, most of our revenues came from Puhua Phase I and Phase II and Tsining Jun Jing II Phase Two.
Effective January 1, 2008, the Company adopted the percentage of completion method of accounting for revenue recognition for all building construction projects in progress, including the Tsining JunJing II and PuHua Projects. Before that time, the full accrual method was used for all of our residential, commercial and infrastructure projects. Infrastructure projects continue to be accounted for using the full accrual method of accounting.
| | | Three months | | | Three months | |
| | | ended | | | ended | |
| Revenues by project: | | March 31, 2011 | | | March 31, 2010 | |
| US dollars | | | | | | |
| Project Under Construction | | | | | | |
| Tsining JunJing II Phase Two | | $ | 4,174,516 | | | $ | 15,161,722 | |
| Puhua Phase One | | | 5,219,729 | | | | 11,454,564 | |
| Puhua Phase Two | | | 8,428,480 | | | | - | |
| | | | | | | | | |
| Projects Completed | | | | | | | | |
| Tsining JunJing II Phase One | | | 1,080,635 | | | | 4,095,525 | |
| Tsining JunJing I | | | - | | | | 1,296,725 | |
| Tsining-24G | | | 695,439 | | | | 15,684 | |
| Tsining Gang Wan | | | 58,018 | | | | - | |
| Tsining In Home | | | - | | | | 366,841 | |
| Revenues from the sale of properties | | $ | 19,656,817 | | | $ | 32,391,061 | |
The following table summarizes details of our most significant projects:
| | | 3 Months Ended | | | 3 Months Ended | |
| Revenues by project: | | 31-Mar-11 | | | 31-Mar-10 | |
| US$ | | | | | | |
| Project Under Construction | | | | | | | |
| Puhua Phase One contract sales | | $ | 5,150,567 | | | $ | 17,880,123 | |
| Revenue | | | 5,219,729 | | | | 11,454,564 | |
| Total gross floor area (GFA) available for sale | | | 139,103 | | | | 640,000 | |
| GFA sold during the period | | | 3,665 | | | | 25,741 | |
| Remaining GFA available for sale | | | 27,219 | | | | 590,130 | |
| Percentage of completion | | | 59.21 | % | | | 31.1 | % |
| Percentage GFA sold during the period | | | 2.6 | % | | | 4.0 | % |
| Percentage GFA sold to date | | | 80.4 | % | | | 7.8 | % |
| Average sales price per GFA | | $ | 1,405 | | | $ | 695 | |
| | | | | | | | | |
| Puhua Phase Two contract sales | | | 18,767,261 | | | | - | |
| Revenue | | $ | 8,428,480 | | | $ | - | |
| Total gross floor area (GFA) available for sale | | | 262,519 | | | | - | |
| GFA sold during the period | | | 21,984 | | | | - | |
| Remaining GFA available for sale | | | 213,393 | | | | - | |
| Percentage of completion | | | 33.87 | % | | | - | |
| Percentage GFA sold during the period | | | 8.4 | % | | | - | |
| Percentage GFA sold to date | | | 18.7 | % | | | - | |
| Average sales price per GFA | | $ | 854 | | | $ | - | |
| | | | | | | | | |
| Tsining JunJing II Phase Two contract sales | | $ | 680,484 | | | $ | 20,003.787 | |
| Revenue | | | 4,174,516 | | | | 15,161,722 | |
| Total gross floor area (GFA) available for sale | | | 121,953 | | | | 122,136 | |
| GFA sold during the period | | | 697 | | | | 26,415 | |
| Remaining GFA available for sale | | | 391 | | | | 30,808 | |
| Percentage of completion | | | 99.2% | | | | 66.2 | % |
| Percentage GFA sold during the period | | | 0.6% | | | | 23.5 | % |
| Percentage GFA sold to date | | | 99.7% | | | | 72.6 | % |
| Average sales price per GFA | | $ | 976 | | | $ | 757 | |
Revenues from projects under construction
Tsining JunJing II Phase Two
Tsining JunJing II Phase Two consists of 12 middle-rise and high-rise buildings with total expected revenues of approximately $97.6 million. During the first quarter of 2011, we were able to secure $ 0.7 million in contract sales for 7 units, and we recognized approximately $4.2 million.
Puhua Phase One
Puhua Phase One consists of 7 garden houses, 2 mid-rise and 4 high-rise buildings with total expected revenues of approximately $124.1 million. During the first quarter of 2011, we were able to secure $ 5.2 million in contract sales of which we recognized approximately $5.2 million.
Puhua Phase Two
Puhua Phase One consists of 7 mid-rise and high-rise buildings with total expected revenues of approximately $252.1 million. During the first quarter of 2011, we were able to secure $18.8 million in contract sales of which we recognized approximately $8.4 million.
Please note that the method of percentage of completion was utilized to recognize revenue from January 1, 2008. Only revenue recognition of Tsining JunJing II and PuHua Phase One and Phase Two is under this method. The percentages of completion of the construction for each building as of March 31, 2011 are shown below:
| Tsining JunJing II Phase two Buildings | | Percentage of Completion | |
| 10# | | 100 | % |
| 11# | | 100 | % |
| 12# | | 100 | % |
| 13# | | 100 | % |
| 16# | | 100 | % |
| 17# | | 100 | % |
| 18# | | 100 | % |
| 19# | | 100 | % |
| 22# | | 100 | % |
| 23# | | 100 | % |
| 24# | | 100 | % |
| 25# | | 96.24 | % |
| Puhua Phase one | | Percentage of Completion | |
| 1# | | 75.34 | % |
| 2# | | 90.19 | % |
| 3# | | 37.35 | % |
| 4# | | 81.55 | % |
| 5# | | 41.49 | % |
| 6# | | 74.52 | % |
| 7# | | 39.35 | % |
| 8# | | 69.48 | % |
| 9# | | 68.11 | % |
| 10# | | 65.38 | % |
| 11# | | 37.39 | % |
| 12# | | 58.30 | % |
| 13# | | 59.56 | % |
| Puhua Phase Two | | Percentage of Completion | |
| 14# | | 34.29 | % |
| 15# | | 31.97 | % |
| 16# | | 45.81 | % |
| 17# | | 55.00 | % |
| 18# | | 30.27 | % |
| 19# | | 33.88 | % |
| 20# | | 36.70 | % |
| 21# | | 32.58 | % |
| 22# | | 27.58 | % |
| 23# | | 36.53 | % |
| 24# | | 26.49 | % |
The above are all the buildings under sale in JunJing II Phase Two and Puhua Phase One and Phase Two.
Revenues from projects completed
The revenue from completed projects totaled $1,834,092 in the three months ended March 31, 2011 compared to $5,774,775 during same period of 2010. The decrease was mainly due to the fact that most completed projects are sold and not many units were left for sale.
Other income
Other income includes property management fees, construction income, rental income, revenues from the disposal of fixed assets and construction fees for third party customers. We recognized $2,900,879 in other income for the three months ended March 31, 2011 compared with $1,181,853 in the same period of 2010. The 145.5% increase is mainly attributed to income from Xinxing Construction. The following table summarizes the breakdown of the other income and their changes during the three months ended March 31, 2011 and 2010:
| | | For the three months ended | |
| | | March 31, | | | March 31, | |
| | | 2011 | | | 2010 | |
| Interest income | | $ | 38,826 | | | $ | 116,546 | |
| Rental income, net | | | 587,276 | | | | 310,910 | |
| Income from property management services | | | 831,201 | | | | 754,407 | |
| Miscellaneous construction contracts | | | 1,435,424 | | | | - | |
| Gain on disposal of fixed assets and inventory | | | 8,152 | | | | - | |
| Total | | $ | 2,900,879 | | | $ | 1,181,853 | |
Cost of sale properties
The cost of sales of properties in the three months ended March 31, 2011 decreased 44.9% to $14,638,574 compared with $26,561,887 in the same period of 2010. The decrease was primarily due to the reduced sales volume during the first quarter of 2011.
Gross profit and profit margin
Gross profit for the three months ended March 31, 2011 was $5,722,553, representing a decrease of 11.6% from $6,474,254 in the same period of 2010. The gross profit margin for the three months ended March 31, 2011 was 25.4% compared with 19.3% in the same period of 2010. The change was due to decreased sales during the first quarter of 2011 compared with the same period in 2010, which resulted in reduced gross profit. However, improved market conditions resulted in an increase in average selling price for all of our projects, which led to an improved gross profit margin. The margin was lower during the first quarter of 2010, because the Company sold many parking lots of Jun Jing I and II projects which only had 3% to 5% margins, thereby significantly reducing the overall gross margin of the first quarter of 2010. The gross margin in the current period is consistent with the expected margin.
Selling, general and administrative expenses
Selling, general and administrative expenses (“SG&A”) for the three months ended March 31, 2011 increased 35.3% to $3,432,716 from $2,537,884 in the same period of 2010. The increase in SG&A is primarily due to the increased expenses associated with new projects to be constructed in the near future, and increased audit expense associated with SOX compliance. Employee salary increases also contributed to the increased administrative expenses. SG&A accounted for 15.2% of total revenue in the first quarter of 2011 compared to 7.6% for the same period in 2010.
Other expenses
Other expenses consist mainly of late delivery settlements and maintenance costs. Other expenses in the three months ended March 31, 2011 decreased 66.1% to $41,577 compared with $122,651 in the same period of 2010.
Operating profit and operating profit margin
Operating profit is defined as gross profit minus operating expenses but before change in fair value of derivatives and income taxes. Operating profit in the three months ended March 31, 2011 was $1,314,121 compared with $2,977,512 operating profit in the same period of 2010. The change was primarily due to decreased revenues from our existing project. The operating profit margin was 5.8% for the first quarter of 2011 compared with 8.9% for the same period of 2010 which was primarily due to the increased SG&A during the first quarter of 2011.
Interest expense
Interest expense in the three months ended March 31, 2011 increased 17.8% to $597,148 from $507,025 in the same period of 2010. This is primarily due to the increase of employee loan interest. The Company expects to pay off the entire employee loan in the second quarter of 2011.
Change in fair value of embedded derivative
The embedded derivative is related to the Company’s $20 million Convertible Debt offering completed in January 2008. The change in the fair value of embedded derivatives is a periodic adjustment to the estimated cost to the Company, which was provided by the Cox-Ross-Rubinstein Binomial Lattice valuation model.
The CRR model depends on the following assumptions: the Company’s common stock price underlying the warrants; strike price; conversion price; expected life; expected volatility; risk free interest rate; and dividend rate. During the first quarter of 2011, our common stock price experienced large fluctuations with the price decreasing from $2.74 on December 31, 2010 to $1.96 on March 31, 2011. The decrease in stock price and expected volatility caused a decrease in fair value of the warrants and the change of fair value was booked as a reverse of non-cash expense.
The company recorded $(1,052,754) in the change in fair value of embedded derivatives in the three months ended March 31, 2011 compared with $(566,206) in the same period of 2010.
Change in fair value of warrants
In 2006, 2007 and 2008, the Company issued warrants in conjunction with the issuance of common shares or Convertible Debt. The warrants permit the investors to buy additional common shares at the prices specified in the warrant agreements.
An investor typically only exercises a warrant to buy common shares when the stock price is higher than the warrant exercise price. The investor pays the exercise price and the Company covers the difference between the warrant exercise price and the share price at the time of conversion.
In addition, the Company was required to estimate the fair value of its remaining warrants outstanding and adjust the value as appropriate, and it chose to use the Cox-Ross-Rubinstein Binomial Lattice valuation model to estimate their fair value.
The change in fair value of warrants was $(850,651) in the three months ended March 31, 2011, compared to $(554,601) during the same period of 2010, which consisted of the periodic adjustment to the estimated cost to the company to provide the common shares, assuming that all of the warrants will be exercised sometime in the future. The basis for estimating the cost to provide the common shares was provided by the valuation model. The CRR model depends on the following assumptions: the Company’s common stock price underlying the warrants; strike price; expected life; expected volatility; risk free interest rate; and dividend rate. During the first quarter of 2010, our common stock price experienced large fluctuations with the price decreasing from $2.74 on December 31, 2010 to $1.96 on March 31, 2011. The decrease in stock price and expected volatility caused a decrease in fair value for warrants and the change of fair value was booked as a reverse of non-cash expense.
Recovery of deferred income taxes
We recorded the recovery of deferred income taxes of $38,046 during the first quarter of 2011, and we had $29,146 during the first quarter of 2010. This is because the intangible allocated as cost of Puhua is now being expensed as cost of sales and future tax is recovered.
Net income
Net income for the three months ended March 31, 2011 decreased 20.8% to $2,469,083 compared to $3,117,934 in the same period of 2010. The decrease in net income was mainly due to reduced total revenue, and increased SG&A expense; however, the decrease was partly offset by increased gross margin.
The periodic revaluation of derivatives and warrants also contributed approximately $1.9 million during the quarter mainly due to the decrease of our common stock price.
Charge to noncontrolling interest
On November 5, 2008, the Company and Prax Capital (“Prax”) entered into a joint venture agreement to develop 79 acres within China Housing’s Baqiao project located in Xi’an. Prax invested $29.3 million for a 25% interest in Puhua through obtaining 1,000 Class A shares of Success Hill (“Class A Shares”) with various distribution rights. Prax’s initial investments were recorded as non-controlling interests in the consolidated financial statements. During the first quarter of 2010, the Company proposed to redeem Prax’s 1000 Class A shares in Success Hill in order to fix the maximum return on Prax’s initial investment. Both parties then entered into an Amended and Restated Shareholders’ Agreement on May 10, 2010, under the terms of which, effectively January 1, 2010, the Company will redeem all Prax’s Class A Shares within three years for consideration of the USD equivalent of $84.39 million (RMB 576 million).
As Prax’s interest in the consolidated subsidiaries meets the definition of a mandatorily redeemable financial instrument, it is reported within liabilities as mandatorily redeemable non-controlling interests in subsidiaries on the Company’s consolidated balance sheet and initially measured at the fair value of cash that would be due and payable to Prax under the Amended and Restated Shareholder agreement.
As of January 1, 2010, the Company recorded a liability of $42,600,511 reflecting the fair value of the redemption amount of Prax’s interest under the Amended and Restated Shareholder Agreement and eliminated the original non-controlling interest in the equity on the consolidated balance sheet. The difference of $14,229,043 between the carrying value of the original non-controlling interest and the fair value of redemption amount has been reflected as a charge to non-controlling interest.
The Company had no such cost during the first quarter of 2011.
Basic and diluted earnings per share
Basic earnings per share was $0.07 in the three months ended March 31, 2011, compared to $(0.34) in the same period of 2010. Diluted earnings per share was $0.05 in the three months ended March 31, 2011, compared to $(0.34) in the same period of 2010. By the end of March 31, 2011, the weighted average number of shares used for earnings per share calculation increased by approximately 1.4 million compared with the same period in 2010, mainly due to the stock conversion associated with convertible debt. Earnings available to distribute was about $2.5 million in first quarter of 2011, while there was a loss of $11.1 million in the first quarter of 2010 due to recording a one-time loss of $14,229,043 in connection with the Prax restructuring.
Common shares used to calculate basic and diluted EPS
The weighted average shares outstanding used to calculate basic earnings per share was 33,886,568 shares in the three months ended March 31, 2011 and 32,580,769 shares in the same period of 2010. The weighted average shares outstanding used to calculate the diluted earnings per share was 35,502,277 shares in the three months ended March 31, 2011 and 32,580,769 shares in the same period of 2010.
Foreign exchange
The company operates in China and the functional currency is Chinese Ren min bi (RMB) but the reporting currency is U.S. dollars.. The fluctuation of exchange rates during the three months ended March 31, 2011 and the same period of 2010, when translating the operating results and financial positions at different exchange rates, created the accrued gain (loss) on foreign exchange. The gain on foreign exchange in the three months ended March 31, 2011 was $1,362,871, compared with a loss of $27,684 in the same period of 2010.
Cash flow discussion
There was net cash inflow of $34,056,667 during the three months ended March 31, 2011 compared with $29,467,322 net cash outflow during the same period of 2010.
The operating activity cash inflow was $12,294,337 in the three months ended March 31, 2011 compared with a cash inflow of $163,751 during the same period of 2010. The change was due primarily to the sales of the property.
A cash outflow of $5,232,654 for investing activities was recorded for the three months ended March 31, 2011, compared with a cash outflow of $699,056 for the same period of 2010. The change was primarily due to changes in restricted cash.
There was a cash inflow of $26,994,984 for financing activities in the three months ended March 31, 2011 compared with $30,002,627 of cash inflow in the same period of 2010. The change was primarily due to additional bank loan draws.
Debt leverage
Total debt consists of Payables for acquisition of businesses, Loans from employees, Loans payable, Convertible Debt and mandatorily redeemable non-controlling interests in Subsidiaries.
Total debt outstanding as of March 31, 2011 was $167.4 million compared with $143.9 million on December 31, 2010. Net debt outstanding (total debt less cash and restricted cash) as of March 31, 2011 was $46.1 million compared with $62.3 million on December 31, 2010. The company’s net debt as a percentage of total capital (net debt plus shareholders’ equity) was 28.6% on March 31, 2011 and 38.0% on December 31, 2010, which decreased due to the improved cash position.
Liquidity and capital resources
Our principal liquidity demands are based on the development of new properties, property acquisitions, and general corporate purposes. As of March 31, 2011, we had $81,642,228 of cash and cash equivalents, compared to $46,904,161 as of December 31, 2010, an increase of $34,738,067. Along with progress in projects, we can use the internal generated cash flow to fund our daily operation.
The Company leases part of its office and land for self use under various operating lease agreements with expiry dates between the years 2010 and 2041.
The Company is also committed to acquire Shaanxi Bihu Property Development Co., Limited (“Bihu”). The remaining related purchase price to be paid within one year is approximately $9.4 million.
The Company also had various commitments related to land use right acquisition with unpaid balances of approximately $22.0 million. The balances are not due until the vendor removes the existing building on the land and changes the zoning status of the land use right certificate. Based on the current condition, the Company estimates that the balances will be paid in two years.
All future payments required under the various agreements are summarized below.
| | Payment due by period | |
| Commitments and Contingencies | Total | | Less than 1 year | | 1-2 years | | | 2-3 years | | | 3-4 years | | | 4-5 years | | | After 5 years | |
| | | | | | | | | | | | | | | | | | | |
| Operating leases | | $ | 3,057,801 | | | $ | 211,113 | | | $ | 141,834 | | | $ | 141,834 | | | $ | 144,934 | | | $ | 144,934 | | | $ | 2,273,152 | |
| Acquisition | | | 9,422,293 | | | | 9,422,293 | | | | - | | | | - | | | | - | | | | - | | | | - | |
| Land use rights | | | 21,966,592 | | | | 21,966,592 | | | | - | | | | - | | | | - | | | | - | | | | - | |
| Total | | $ | 34,446,686 | | | $ | 31,599,998 | | | $ | 141,834 | | | $ | 141,834 | | | $ | 144,934 | | | $ | 144,934 | | | $ | 2,273,152 | |
Financial obligations
As of March 31, 2011 we had total bank loans of $112,862,458 with a weighted average interest rate of 6.5%. Mortgage debt (total bank loans) is secured by the assets of the company.
Loans payable
Loans payable represent amounts due to various banks and are due on demand or normally due within one or two years. These loans generally can be renewed with the banks when the loans mature.
Most of the obligations of the Company are tied to specific projects. The terms of the loans typically are 1 to 3 years. Loan extensions are determined by mutual agreement when the current term expires and both parties will consider the remaining time needed to complete the project. Most of these loans are payable when the project has been completed and the residents or businesses take possession.
Bank loans as of March 31, 2011 and December 31, 2010 consisted of the following:
| | | March 31, 2011 | | | December 31, 2010 | |
| | | | | | | | | |
| Xi' an Rural Credit Union Zao Yuan Rd. Branch | | | | | | | | |
Due July 2, 2011, annual interest is at 8.496%, secured by the Company’s Jun Jing Yuan I, Han Yuan and Xin Xing Tower projects | | | 2,748,805 | | | | 2,727,273 | |
| | | | | | | | | |
| Xinhua Trust Investments Ltd. | | | | | | | | |
| Due February 10, 2012, annual interest is at 10%, secured by the 24G project | | | 22,906,709 | | | | 22,727,273 | |
| | | | | | | | | |
| Commercial Bank Weilai Branch | | | | | | | | |
| Annual interest is at 7.29 percent, secured by the Company's JunJing I and XinXing Tower projects and guaranteed by Tsining. $1,221,690 is payable on June 20, 2011 and $1,832,537 is payable on August 29, 2011 | | | 3,054,227 | | | | 4,090,909 | |
| | | | | | | | | |
Bank of Beijing, Xi’an Branch | | | | | | | | |
Due December 10, 2012, annual interest is at theprime rate of People’s Bank of China (5.85%) secured by the PuHua project with a minimum repayment of $7.6 millionrequired by December 31, 2011. | | | 22,906,709 | | | | 22,727,273 | |
| | | | | | | | | |
| Xi’an Duqu Trust Bank | | | | | | | | |
Due June 11, 2011, annual interest is at 9.18%, secured by the Company’s Junjing I properties | | | 687,201 | | | | 681,817 | |
| | | | | | | | | |
| JP Morgan International Bank Limited Brussels Branch | | | | | | | | |
| Due December 14, 2011, annual interest is at 1.2%, secured by a $34,207,352 restricted cash | | | 30,016,529 | | | | 30,016,529 | |
| | | | | | | | | |
| Tianjin Cube Equity Investment Fund Partnership | | | | | | | | |
| Due December 10, 2012, annual interest is 9.6%, secured by JunJing Yuan II Commercial Units | | | 30,542,278 | | | | - | |
| | | | | | | | | |
| Total | | $ | 112,862,458 | | | $ | 82,971,074 | |
All loans are used to finance construction projects. All interest paid was capitalized and allocated to various real estate construction projects.
The loans payable balances were secured by certain of the Company’s real estate held for development or sale with a carrying value of $92,399,616 at March 31, 2011 (December 31, 2010 - $89,538,930) and certain buildings and income producing properties and improvements with a carrying value of $4,453,124 at March 31, 2011 (December 31, 2010 - $4,458,389). The weighted average interest rate on loans payable as of December 31, 2011 was 6.5% (December 31, 2010 – 5.5%).
The loans payable were also secured by certain real estate units sold to customers. The Company obtained consent from these customers that the Company does not have to remove the mortgage on such apartments or to register the transfer of the ownership of such apartments by the Company to the customers for the time being.
Liquidity expectation
The Company believes that the combination of present capital resources, internally generated funds, and unused financing sources are more than adequate to meet cash requirements for the year 2011.
We intend to meet our liquidity requirements, including capital expenditures related to the purchase of land for the development of our future projects, through cash flow provided by operations and additional funds raised by future financings. Upon acquiring land for future developments, we intend to raise funds to develop our projects by obtaining mortgage financing primarily from local banking institutions with which we have done business in the past. We believe that our relationships with these banks are in good standing and that our real estate will secure the loans needed. We believe that adequate cash flow will be available to fund our operations.
The majority of the Company’s revenues and expenses were denominated primarily in renminbi (RMB), the currency of the People’s Republic of China. There is no assurance that exchange rates between the RMB and the U.S. dollar will remain stable. The Company does not engage in currency hedging. Inflation has not had a material impact on the Company’s business.
Item 3. Quantitative and Qualitative Disclosures About Market Risk
The Company is subject to the following market risks, including but not limited to:
General Real Estate Risk
There is a risk that the Company’s property values could go down due to general economic conditions, a weak market for real estate generally, or changing supply and demand. The Company’s property held for sale value, approximately $121.7 million at the end of March 31, 2011, may change due to market fluctuations. Currently, it is valued at our cost which is significantly below the market value.
Risk Relating to Property Sales
The Company may not be able to sell a property at a particular time for its full value, particularly in a poor market.
Foreign Currency Exchange Rate Risk
The Company conducts all of its business in the People’s Republic of China. All revenue and profit are denominated in RMB. When the RMB depreciates, it may adversely affect the Company’s financial performance.
Item 4. Controls and Procedures
(a) Evaluation of Disclosure Controls and Procedures.
Under the supervision and with the participation of our management, including our Chief Executive Officer and Chief Financial Officer, we evaluated the effectiveness of the design and operation of our disclosure controls and procedures (as such term is defined in Rules 13a-15(e) and 15d-15(e) under the Securities Exchange Act of 1934 (the Exchange Act)). Disclosure controls and procedures are controls and procedures that are designed to ensure that information required to be disclosed in our reports filed or submitted under the Securities Exchange Act is recorded, processed, summarized and reported, within the time periods specified in the Securities and Exchange Commission’s rules and forms. Disclosure controls and procedures include, without limitation, controls and procedures designed to ensure that information required to be disclosed in our reports filed under the Exchange Act is accumulated and communicated to management, including our principal executive officer and our principal financial officer, as appropriate, to allow timely decisions regarding required disclosure. Based on this evaluation, our Chief Executive Officer and our Chief Financial Officer concluded that our disclosure controls and procedures as of the end of the period covered by this report are effective.
(b) Changes in Internal Control over Financial Reporting.
During the quarter ended March 31, 2011, there was no change in our internal control over financial reporting (as such term is defined in Rule 13a-15(f) under the Exchange Act) that has materially affected, or is reasonably likely to materially affect, our internal control over financial reporting.
Part II. OTHER INFORMATION
Item 1. Legal Proceedings
None.
Item 1A. Risk Factors.
We have no material changes to the risk factors previously disclosed in our Form 10-K, as amended, for the year ended December 31, 2010.
Item 2. Unregistered Sales of Equity Securities and Use of Proceeds
None.
Item 3. Defaults Upon Senior Securities
None.
Item 4. (Removed and Reserved)
Item 5. Other Information
None.
Item 6. Exhibits
(a) Exhibits
| Exhibit | | | |
| Number | | Description of Exhibit | |
| | | | |
| 10.1 | Equity Pledge Agreement, dated January 31, 2011 (incorporated by reference to Exhibit 10.1 of the Company’s Current Report on Form 8-K filed on February 4, 2011). |
| | |
| 10.2 | Guarantee Agreement, dated January 31, 2011 (incorporated by reference to Exhibit 10.2 of the Company’s Current Report on Form 8-K filed on February 4, 2011). |
| | |
| 10.3 | Share Charge Deed, dated January 31, 2011 (incorporated by reference to Exhibit 10.3 of the Company’s Current Report on Form 8-K filed on February 4, 2011). |
| | |
| 10.4 | Financial Consultant Agreement, dated January 31, 2011 (incorporated by reference to Exhibit 10.4 of the Company’s Current Report on Form 8-K filed on February 4, 2011). |
| | |
| 10.5 | Entrustment Loan Agreement, dated January 31, 2011 (incorporated by reference to Exhibit 10.5 of the Company’s Current Report on Form 8-K filed on February 4, 2011). |
| | |
| 10.6 | Entrustment Loan Agreement, dated January 31, 2011 (incorporated by reference to Exhibit 10.6 of the Company’s Current Report on Form 8-K filed on February 4, 2011). |
| | |
| 10.7 | Entrustment Loan Agreement, dated January 31, 2011 (incorporated by reference to Exhibit 10.7 of the Company’s Current Report on Form 8-K filed on February 4, 2011). |
| | |
| 10.8 | Entrustment Loan Agreement, dated January 31, 2011 (incorporated by reference to Exhibit 10.8 of the Company’s Current Report on Form 8-K filed on February 4, 2011). |
| | |
| 10.9 | Project Financing Agreement, dated January 31, 2011 (incorporated by reference to Exhibit 10.9 of the Company’s Current Report on Form 8-K filed on February 4, 2011). |
| | | |
| 31.1 | Certification of Principal Executive Officer pursuant to Rule 13a-14 and Rule 15d-14(a), promulgated under the Securities and Exchange Act of 1934, as amended | |
| | | |
| 31.2 | Certification of Principal Financial Officer pursuant to Rule 13a-14 and Rule 15d 14(a), promulgated under the Securities and Exchange Act of 1934, as amended | |
| | | |
| 32.1 | Certification pursuant to 18 U.S.C. Section 1350, as adopted pursuant to Section 906 of the Sarbanes-Oxley Act of 2002 (Chief Executive Officer) | |
| | | |
| 32.2 | Certification pursuant to 18 U.S.C. Section 1350, as adopted pursuant to Section 906 of the Sarbanes-Oxley Act of 2002 (Chief Financial Officer) | |
SIGNATURES
Pursuant to the requirements of the Securities Exchange Act of 1934, the registrant caused this report to be signed on its behalf by the undersigned thereunto duly authorized.
| | China Housing & Land Development, Inc. | |
| | | | |
| By: | /s/ Xiaohong Feng | |
| | | Xiaohong Feng | |
| | | Chief Executive Officer | |
| | | (Principal Executive Officer) | |
| | | | |
| | | | |
| May 16, 2011 | By: | /s/ Cangsang Huang | |
| | | Cangsang Huang | |
| | | Chief Financial Officer | |
| | | (Principal Financial and Accounting Officer) | |