UNITED STATES
SECURITIES AND EXCHANGE COMMISSION
Washington, D.C. 20549
FORM N-CSR
CERTIFIED SHAREHOLDER REPORT OF REGISTERED
MANAGEMENT INVESTMENT COMPANIES
Investment Company Act file number 811-21667
Fidelity Central Investment Portfolios LLC
(Exact name of registrant as specified in charter)
245 Summer St., Boston, Massachusetts 02210
(Address of principal executive offices) (Zip code)
Nicole Macarchuk, Secretary
245 Summer St.
Boston, Massachusetts 02210
(Name and address of agent for service)
Registrant's telephone number, including area code:
617-563-7000
| |
Date of fiscal year end: | September 30 |
|
|
Date of reporting period: | September 30, 2024 |
Item 1.
Reports to Stockholders
| |
| | ANNUAL SHAREHOLDER REPORT | AS OF SEPTEMBER 30, 2024 | This report describes changes to the Fund that occurred during the reporting period. |
| | Fidelity® Emerging Markets Equity Central Fund Fidelity® Emerging Markets Equity Central Fund true |
| | | |
This annual shareholder report contains information about Fidelity® Emerging Markets Equity Central Fund for the period October 1, 2023 to September 30, 2024. You can find additional information about the Fund at fundresearch.fidelity.com/prospectus/sec. You can also request this information by contacting us at 1-800-544-8544.
What were your Fund costs for the last year?(based on hypothetical $10,000 investment)
FUND COST (PREVIOUS YEAR)
| | Costs of a $10,000 investment | Costs paid as a percentage of a $10,000 investment | |
| Fidelity® Emerging Markets Equity Central Fund | $ 3 | 0.02% | |
What affected the Fund's performance this period?
•International stocks achieved a strong gain for the 12 months ending September 30, 2024. Resilient economic growth and a slowing in the pace of inflation in certain regions, as well as a shift to global monetary easing, contributed to a favorable backdrop, despite persistent geopolitical risk.
•Against this backdrop, stock picks in Latin America, primarily in Brazil, detracted from the fund's performance versus the Fidelity Emerging Markets Equity Central Fund Linked IndexSM for the fiscal year.
•By sector, the biggest detractor from performance versus the index was stock picking in financials. Picks and an underweight in information technology, primarily within the technology hardware & equipment industry, also hampered the fund's result, as did choices in health care.
•The largest individual relative detractor was an overweight in XP (-20%), followed by an underweight in MediaTek (+69%). We established the position in MediaTek this period. Underexposure to Hon Hai Precision Industry (+88%) also hurt. This period we meaningfully added to the position.
•In contrast, from a regional standpoint, picks and an underweight in Emerging Asia and stock selection in Emerging Europe contributed to the fund's relative result.
•By sector, the biggest contributors to performance versus the index were stock picking in communication services, consumer discretionary and materials.
•The fund's non-index stake in Sea gained 114% and was the top individual relative contributor. The stock was among the fund's largest holdings. Overweight positions in Zomato (+164%) and Capitec Bank Holdings (+98%) also contributed.
•Notable changes in positioning include increased exposure to Taiwan and a lower allocation to South Korea. By sector, meaningful changes in positioning include decreased exposure to materials and a higher allocation to information technology.
How did the Fund perform over the past 10 years?
CUMULATIVE PERFORMANCE
September 30, 2014 through September 30, 2024.
Initial investment of $10,000.
Fidelity® Emerging Markets Equity Central Fund | $10,000 | $8,288 | $9,905 | $12,337 | $11,819 | $12,436 | $14,390 | $17,151 | $11,498 | $13,235 | $16,648 |
Fidelity Emerging Markets Equity Central Fund Linked Index℠ | $10,000 | $8,076 | $9,434 | $11,558 | $11,458 | $11,259 | $12,317 | $14,488 | $10,416 | $11,639 | $14,673 |
MSCI Emerging Markets Index | $10,000 | $8,076 | $9,434 | $11,558 | $11,468 | $11,240 | $12,427 | $14,691 | $10,563 | $11,802 | $14,879 |
| | 2014 | 2015 | 2016 | 2017 | 2018 | 2019 | 2020 | 2021 | 2022 | 2023 | 2024 |
AVERAGE ANNUAL TOTAL RETURNS: | | 1 Year | 5 Year | 10 Year |
| Fidelity® Emerging Markets Equity Central Fund | 25.79% | 6.01% | 5.23% |
| Fidelity Emerging Markets Equity Central Fund Linked Index℠ | 26.06% | 5.44% | 3.91% |
| MSCI Emerging Markets Index | 26.06% | 5.77% | 4.05% |
Visit www.fidelity.com for more recent performance information. |
The Fund's past performance is not a good predictor of the Fund's future performance. The graph and table do not reflect the deduction of taxes that a shareholder would pay on fund distributions or redemption of fund shares. |
Key Fund Statistics (as of September 30, 2024)
KEY FACTS | | |
| Fund Size | $2,505,309,202 | |
| Number of Holdings | 262 | |
| Total Advisory Fee | $0 | |
| Portfolio Turnover | 42% | |
What did the Fund invest in?
(as of September 30, 2024)
MARKET SECTORS (% of Fund's net assets) | | |
| Information Technology | 23.0 | |
| Financials | 21.0 | |
| Consumer Discretionary | 16.2 | |
| Communication Services | 9.2 | |
| Materials | 6.8 | |
| Industrials | 5.7 | |
| Consumer Staples | 5.7 | |
| Energy | 4.5 | |
| Health Care | 3.1 | |
| Utilities | 3.1 | |
| Real Estate | 1.2 | |
| |
| Common Stocks | 98.7 |
| Preferred Stocks | 0.8 |
| Bonds | 0.1 |
| Short-Term Investments and Net Other Assets (Liabilities) | 0.4 |
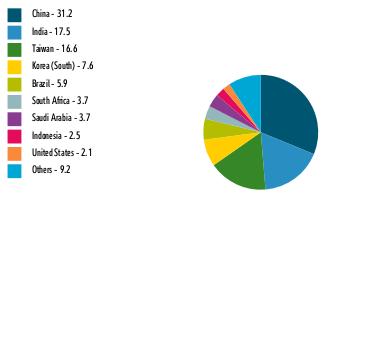
ASSET ALLOCATION (% of Fund's net assets) |
|
|
| China | 31.2 |
| India | 17.5 |
| Taiwan | 16.6 |
| Korea (South) | 7.6 |
| Brazil | 5.9 |
| South Africa | 3.7 |
| Saudi Arabia | 3.7 |
| Indonesia | 2.5 |
| United States | 2.1 |
| Others | 9.2 |
GEOGRAPHIC DIVERSIFICATION (% of Fund's net assets) |
|
| |
|
TOP HOLDINGS (% of Fund's net assets) | | |
| Taiwan Semiconductor Manufacturing Co Ltd | 10.9 | |
| Tencent Holdings Ltd | 5.0 | |
| Alibaba Group Holding Ltd | 2.7 | |
| Samsung Electronics Co Ltd | 2.6 | |
| HDFC Bank Ltd | 2.4 | |
| SK Hynix Inc | 2.2 | |
| PDD Holdings Inc Class A ADR | 2.0 | |
| Meituan B Shares | 1.7 | |
| Reliance Industries Ltd | 1.7 | |
| Sea Ltd Class A ADR | 1.6 | |
| | 32.8 | |
How has the Fund changed?
This is a summary of certain changes to the Fund since October 1, 2023. For more complete information, you may review the Fund's next prospectus, which we expect to be available by November 29, 2024 at fundresearch.fidelity.com/prospectus/sec or upon request at 1-800-544-8544 .
Effective March 1, 2024, the fund's management contract was amended to remove the fee the investment adviser received from investing funds. | The fund's sub-advisory agreement with FIL Investments (Japan) Limited was not renewed.
|
| Fidelity, the Fidelity Investments Logo and all other Fidelity trademarks or service marks used herein are trademarks or service marks of FMR LLC. Any third-party marks that are used herein are trademarks or service marks of their respective owners. © 2024 FMR LLC. All rights reserved. |
| | For additional information about the Fund; including its prospectus, financial information, holdings and proxy information, scan the QR code or visit fundresearch.fidelity.com/prospectus/sec 1.9913779.100 2113-TSRA-1124 |
| |
| | ANNUAL SHAREHOLDER REPORT | AS OF SEPTEMBER 30, 2024 | This report describes changes to the Fund that occurred during the reporting period. |
| | Fidelity® Floating Rate Central Fund Fidelity® Floating Rate Central Fund true |
| | | |
This annual shareholder report contains information about Fidelity® Floating Rate Central Fund for the period October 1, 2023 to September 30, 2024. You can find additional information about the Fund at fundresearch.fidelity.com/prospectus/sec. You can also request this information by contacting us at 1-800-544-8544.
What were your Fund costs for the last year?(based on hypothetical $10,000 investment)
FUND COST (PREVIOUS YEAR)
| | Costs of a $10,000 investment | Costs paid as a percentage of a $10,000 investment | |
| Fidelity® Floating Rate Central Fund | $ 0 A | 0.00%B | |
A Amount represents less than $.50
B Amount represents less than 0.005%
What affected the Fund's performance this period?
•Amid resilient corporate profits, a realization that the U.S. economy was performing better than forecast and expectations that the U.S. Federal Reserve would keep interest rates higher for longer than originally anticipated, leveraged loans posted a solid gain for the 12 months ending September 30, 2024. Loan performance weakened and yields declined in the final three months of the period, falling in anticipation of the Fed's September 18 rate cut of 50 basis points.
•Against this backdrop, the fund's core investment in floating-rate leveraged loans gained 9.56% and detracted from performance versus the benchmark Morningstar LSTA US Performing Loans Index for the fiscal year.
•By industry, the biggest contributor to performance versus the benchmark was security selection in retailers (except food & drug). Security selection in electronics/electrical and insurance also boosted the fund's relative result.
•The top individual relative contributor was timely ownership of Jo Ann Stores (-69%). The second-largest relative contributor was an overweight in Asurion (+17%). The company was among the fund's largest holdings. Not owning Magenta Buyer, a benchmark component that returned -41%, was another notable relative contributor.
•In contrast, the primary detractors from performance versus the benchmark were security selection in food products and all telecom, as well as security selection and an underweight in health care.
•The largest individual relative detractors were overweights in Securus Technologies (-20%) and Del Monte (-24%). Securus was not held at period end. Not owning Air Medical, a benchmark component that gained roughly 53%, was another notable relative detractor.
•By quality, positioning in unrated bonds contributed most, whereas those rated CCC hurt most.
•Notable changes in positioning include increased exposure to financial intermediaries and chemicals & plastics.
How did the Fund perform over the past 10 years?
CUMULATIVE PERFORMANCE
September 30, 2014 through September 30, 2024.
Initial investment of $10,000.
Fidelity® Floating Rate Central Fund | $10,000 | $9,997 | $10,592 | $11,204 | $11,837 | $12,334 | $12,385 | $13,499 | $13,231 | $15,037 | $16,520 |
Morningstar® LSTA® US Performing Loans | $10,000 | $10,188 | $10,769 | $11,353 | $11,975 | $12,334 | $12,501 | $13,604 | $13,250 | $15,023 | $16,506 |
Bloomberg U.S. Universal Bond Index | $10,000 | $10,233 | $10,859 | $10,963 | $10,853 | $11,946 | $12,745 | $12,771 | $10,865 | $11,040 | $12,373 |
| | 2014 | 2015 | 2016 | 2017 | 2018 | 2019 | 2020 | 2021 | 2022 | 2023 | 2024 |
AVERAGE ANNUAL TOTAL RETURNS: | | 1 Year | 5 Year | 10 Year |
| Fidelity® Floating Rate Central Fund | 9.87% | 6.02% | 5.15% |
| Morningstar® LSTA® US Performing Loans | 9.87% | 6.00% | 5.14% |
| Bloomberg U.S. Universal Bond Index | 12.08% | 0.70% | 2.15% |
Visit www.fidelity.com for more recent performance information. |
The Fund's past performance is not a good predictor of the Fund's future performance. The graph and table do not reflect the deduction of taxes that a shareholder would pay on fund distributions or redemption of fund shares. |
Key Fund Statistics (as of September 30, 2024)
KEY FACTS | | |
| Fund Size | $1,427,548,068 | |
| Number of Holdings | 521 | |
| Total Advisory Fee | $0 | |
| Portfolio Turnover | 50% | |
What did the Fund invest in?
(as of September 30, 2024)
| BBB | 1.2 |
| BB | 21.3 |
| B | 58.6 |
| CCC,CC,C | 5.8 |
| Not Rated | 5.8 |
| Equities | 3.8 |
| Short-Term Investments and Net Other Assets (Liabilities) | 3.5 |
QUALITY DIVERSIFICATION (% of Fund's net assets) |
|
| |
| We have used ratings from Moody's Investors Service, Inc. Where Moody's® ratings are not available, we have used S&P® ratings. All ratings are as of the date indicated and do not reflect subsequent changes. |
| Bank Loan Obligations | 86.9 |
| Corporate Bonds | 5.5 |
| Common Stocks | 2.4 |
| Alternative Funds | 1.4 |
| Preferred Securities | 0.2 |
| Asset-Backed Securities | 0.1 |
| Short-Term Investments and Net Other Assets (Liabilities) | 3.5 |
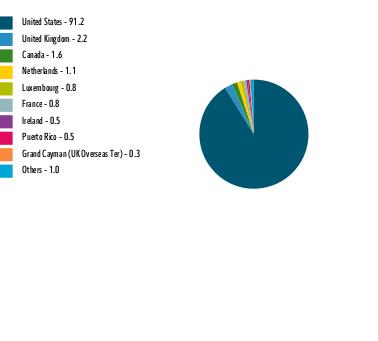
ASSET ALLOCATION (% of Fund's net assets) |
|
|
| United States | 91.2 |
| United Kingdom | 2.2 |
| Canada | 1.6 |
| Netherlands | 1.1 |
| Luxembourg | 0.8 |
| France | 0.8 |
| Ireland | 0.5 |
| Puerto Rico | 0.5 |
| Grand Cayman (UK Overseas Ter) | 0.3 |
| Others | 1.0 |
GEOGRAPHIC DIVERSIFICATION (% of Fund's net assets) |
|
| |
|
TOP HOLDINGS (% of Fund's net assets) | | |
| Great Outdoors Group LLC | 2.6 | |
| Asurion LLC | 2.3 | |
| Fidelity Private Credit Company LLC | 1.4 | |
| Caesars Entertainment Inc | 1.2 | |
| Acrisure LLC | 1.2 | |
| Polaris Newco LLC | 1.1 | |
| UKG Inc | 1.1 | |
| Medline Borrower LP | 1.0 | |
| MH Sub I LLC | 0.9 | |
| Cloud Software Group Inc | 0.9 | |
| | 13.7 | |
How has the Fund changed?
This is a summary of certain changes to the Fund since October 1, 2023. For more complete information, you may review the Fund's next prospectus, which we expect to be available by November 29, 2024 at fundresearch.fidelity.com/prospectus/sec or upon request at 1-800-544-8544 .
Effective March 1, 2024, the fund's management contract was amended to remove the fee the investment adviser received from investing funds. The fund added a contractual management fee waiver during the reporting period. | |
| Fidelity, the Fidelity Investments Logo and all other Fidelity trademarks or service marks used herein are trademarks or service marks of FMR LLC. Any third-party marks that are used herein are trademarks or service marks of their respective owners. © 2024 FMR LLC. All rights reserved. |
| | For additional information about the Fund; including its prospectus, financial information, holdings and proxy information, scan the QR code or visit fundresearch.fidelity.com/prospectus/sec 1.9913752.100 1408-TSRA-1124 |
| |
| | ANNUAL SHAREHOLDER REPORT | AS OF SEPTEMBER 30, 2024 | This report describes changes to the Fund that occurred during the reporting period. |
| | Fidelity® International Equity Central Fund Fidelity® International Equity Central Fund true |
| | | |
This annual shareholder report contains information about Fidelity® International Equity Central Fund for the period October 1, 2023 to September 30, 2024. You can find additional information about the Fund at fundresearch.fidelity.com/prospectus/sec. You can also request this information by contacting us at 1-800-544-8544.
What were your Fund costs for the last year?(based on hypothetical $10,000 investment)
FUND COST (PREVIOUS YEAR)
| | Costs of a $10,000 investment | Costs paid as a percentage of a $10,000 investment | |
| Fidelity® International Equity Central Fund | $ 1 | 0.01% | |
What affected the Fund's performance this period?
•International stocks achieved a strong gain for the 12 months ending September 30, 2024. Resilient economic growth and a slowing in the pace of inflation in certain regions, as well as a shift to global monetary easing, contributed to a favorable backdrop, despite persistent geopolitical risk.
•Against this backdrop, stock picks in Japan and the U.K. contributed to the fund's performance versus the MSCI World ex USA (Linked 10/1/2015) Index for the fiscal year.
•By sector, the biggest contributor to performance versus the index was stock picking in industrials, primarily within the capital goods industry. An underweight in energy also boosted relative performance, as did security selection in health care.
•The top individual relative contributor was an overweight in Hitachi (+115%). The company was among our biggest holdings. The second-largest relative contributor was an overweight in Mitsubishi Heavy Industries (+161%), which we established this period. Another notable relative contributor was an overweight in UniCredit (+90%).
•In contrast, from a regional standpoint, picks in the United States and stock picks and an underweight in Canada detracted from the fund's relative result.
•By sector, the biggest detractor from performance versus the index was stock picking in consumer staples. Stock selection in financials, primarily within the insurance industry, also hampered the fund's result. Lastly, the fund's position in cash detracted.
•The biggest individual relative detractors were stakes in DSV (-19%) and Diageo (-3%). This period we decreased our investments in both stocks. Our stake in Rentokil Initial (-30%) also hurt. The stock was not held at period end.
•Notable changes in positioning include decreased exposure to Denmark and a higher allocation to the United States. By sector, meaningful changes in positioning include lower allocations to the energy and consumer staples sectors.
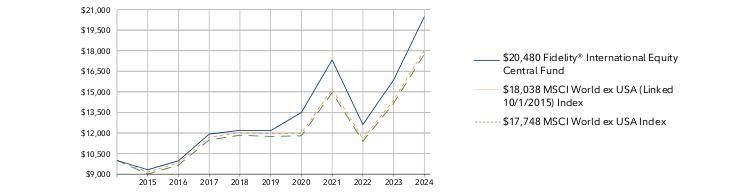
How did the Fund perform over the past 10 years?
CUMULATIVE PERFORMANCE
September 30, 2014 through September 30, 2024.
Initial investment of $10,000.
Fidelity® International Equity Central Fund | $10,000 | $9,322 | $9,970 | $11,918 | $12,193 | $12,167 | $13,495 | $17,330 | $12,615 | $15,867 | $20,480 |
MSCI World ex USA (Linked 10/1/2015) Index | $10,000 | $9,147 | $9,824 | $11,688 | $12,027 | $11,941 | $11,985 | $15,192 | $11,585 | $14,398 | $18,038 |
MSCI World ex USA Index | $10,000 | $9,001 | $9,666 | $11,500 | $11,834 | $11,750 | $11,793 | $14,948 | $11,399 | $14,167 | $17,748 |
| | 2014 | 2015 | 2016 | 2017 | 2018 | 2019 | 2020 | 2021 | 2022 | 2023 | 2024 |
AVERAGE ANNUAL TOTAL RETURNS: | | 1 Year | 5 Year | 10 Year |
| Fidelity® International Equity Central Fund | 29.07% | 10.98% | 7.43% |
| MSCI World ex USA (Linked 10/1/2015) Index | 25.28% | 8.60% | 6.08% |
| MSCI World ex USA Index | 25.28% | 8.60% | 5.90% |
Visit www.fidelity.com for more recent performance information. |
The Fund's past performance is not a good predictor of the Fund's future performance. The graph and table do not reflect the deduction of taxes that a shareholder would pay on fund distributions or redemption of fund shares. |
Key Fund Statistics (as of September 30, 2024)
KEY FACTS | | |
| Fund Size | $5,747,730,868 | |
| Number of Holdings | 275 | |
| Total Advisory Fee | $0 | |
| Portfolio Turnover | 35% | |
What did the Fund invest in?
(as of September 30, 2024)
MARKET SECTORS (% of Fund's net assets) | | |
| Financials | 22.2 | |
| Industrials | 20.2 | |
| Health Care | 13.1 | |
| Information Technology | 12.6 | |
| Consumer Discretionary | 9.3 | |
| Materials | 8.1 | |
| Consumer Staples | 5.2 | |
| Energy | 2.8 | |
| Communication Services | 2.2 | |
| Utilities | 1.3 | |
| Real Estate | 0.9 | |
| |
| Common Stocks | 97.9 |
| Preferred Stocks | 0.0 |
| Short-Term Investments and Net Other Assets (Liabilities) | 2.1 |
ASSET ALLOCATION (% of Fund's net assets) |
|
|
| Japan | 18.1 |
| United Kingdom | 16.0 |
| United States | 13.4 |
| France | 9.5 |
| Germany | 9.0 |
| Canada | 6.5 |
| Netherlands | 4.5 |
| Italy | 3.8 |
| Switzerland | 3.1 |
| Others | 16.1 |
GEOGRAPHIC DIVERSIFICATION (% of Fund's net assets) |
|
| |
|
TOP HOLDINGS (% of Fund's net assets) | | |
| ASML Holding NV | 2.7 | |
| Novo Nordisk A/S Series B | 2.5 | |
| Hitachi Ltd | 2.2 | |
| SAP SE | 2.0 | |
| Astrazeneca PLC | 2.0 | |
| LVMH Moet Hennessy Louis Vuitton SE | 1.8 | |
| RELX PLC | 1.7 | |
| Shin-Etsu Chemical Co Ltd | 1.4 | |
| Air Liquide SA | 1.4 | |
| Compass Group PLC | 1.4 | |
| | 19.1 | |
How has the Fund changed?
This is a summary of certain changes to the Fund since October 1, 2023. For more complete information, you may review the Fund's next prospectus, which we expect to be available by November 29, 2024 at fundresearch.fidelity.com/prospectus/sec or upon request at 1-800-544-8544 .
Effective March 1, 2024, the fund's management contract was amended to remove the fee the investment adviser received from investing funds. | The fund's sub-advisory agreement with FIL Investments (Japan) Limited was not renewed.
|
| Fidelity, the Fidelity Investments Logo and all other Fidelity trademarks or service marks used herein are trademarks or service marks of FMR LLC. Any third-party marks that are used herein are trademarks or service marks of their respective owners. © 2024 FMR LLC. All rights reserved. |
| | For additional information about the Fund; including its prospectus, financial information, holdings and proxy information, scan the QR code or visit fundresearch.fidelity.com/prospectus/sec 1.9913778.100 2018-TSRA-1124 |
| |
| | ANNUAL SHAREHOLDER REPORT | AS OF SEPTEMBER 30, 2024 | This report describes changes to the Fund that occurred during the reporting period. |
| | Fidelity® Real Estate Equity Central Fund Fidelity® Real Estate Equity Central Fund true |
| | | |
This annual shareholder report contains information about Fidelity® Real Estate Equity Central Fund for the period October 1, 2023 to September 30, 2024. You can find additional information about the Fund at fundresearch.fidelity.com/prospectus/sec. You can also request this information by contacting us at 1-800-544-8544.
What were your Fund costs for the last year?(based on hypothetical $10,000 investment)
FUND COST (PREVIOUS YEAR)
| | Costs of a $10,000 investment | Costs paid as a percentage of a $10,000 investment | |
| Fidelity® Real Estate Equity Central Fund | $ 0 A | 0.00%B | |
A Amount represents less than $.50
B Amount represents less than 0.005%
What affected the Fund's performance this period?
•U.S. equities achieved a strong gain for the 12 months ending September 30, 2024, driven by a resilient economy, the promise of generative artificial intelligence and the Federal Reserve's long-anticipated pivot, on September 18, to cutting interest rates. Growth stocks led the way, with the information technology and communication services sectors enabling transformative change and semiconductor-related stocks a particular standout.
•Against this backdrop, market selection was the primary detractor from the fund's performance versus the FTSE NAREIT Equity REITS Index Link for the fiscal year, especially an underweight in regional malls and an overweight in industrial. Stock picking and an underweight in specialty also hampered the fund's result, as did an underweight in office.
•Not owning Iron Mountain, an index component that gained 106%, was the largest individual relative detractor. Not owning Simon Property Group, an index component that gained 65%, was the second-largest relative detractor. An overweight in Americold Realty Trust (-4%) also hurt.
•In contrast, the biggest contributor to performance versus the real estate index was stock selection in health care. Stock picks in diversified and lodging resorts also boosted the fund's relative performance, along with an underweight in gaming.
•The top individual relative contributor was an overweight in Ventas (+56%). The stock was one of the fund's largest holdings. A non-index stake in CBRE gained 67% and was a second notable relative contributor. An overweight in CubeSmart (+46%) also contributed. The stock was among our biggest holdings.
•Notable changes in positioning include higher allocations to the self-storage and shopping centers industries, as well as lower exposure to industrial.
How did the Fund perform over the life of Fund?
CUMULATIVE PERFORMANCE
November 3, 2014 through September 30, 2024.
Initial investment of $10,000.
Fidelity® Real Estate Equity Central Fund | $10,000 | $9,819 | $11,889 | $12,121 | $12,574 | $14,960 | $13,391 | $17,862 | $14,389 | $14,950 | $19,989 |
FTSE® NAREIT® Equity REITs Index | $10,000 | $9,916 | $11,885 | $11,964 | $12,419 | $14,706 | $12,035 | $16,535 | $13,822 | $14,234 | $19,179 |
S&P 500® Index | $10,000 | $9,703 | $11,200 | $13,284 | $15,663 | $16,330 | $18,803 | $24,445 | $20,663 | $25,130 | $34,265 |
| | 2014 | 2015 | 2016 | 2017 | 2018 | 2019 | 2020 | 2021 | 2022 | 2023 | 2024 |
AVERAGE ANNUAL TOTAL RETURNS: | | 1 Year | 5 Year | Life of Fund A |
| Fidelity® Real Estate Equity Central Fund | 33.70% | 5.97% | 7.23% |
| FTSE® NAREIT® Equity REITs Index | 34.74% | 5.46% | 6.79% |
| S&P 500® Index | 36.35% | 15.98% | 13.23% |
A From November 3, 2014
Visit www.fidelity.com for more recent performance information. |
The Fund's past performance is not a good predictor of the Fund's future performance. The graph and table do not reflect the deduction of taxes that a shareholder would pay on fund distributions or redemption of fund shares. |
Key Fund Statistics (as of September 30, 2024)
KEY FACTS | | |
| Fund Size | $1,042,922,079 | |
| Number of Holdings | 32 | |
| Total Advisory Fee | $0 | |
| Portfolio Turnover | 39% | |
What did the Fund invest in?
(as of September 30, 2024)
TOP INDUSTRIES (% of Fund's net assets) |
| Specialized REITs | 30.6 | |
| Residential REITs | 17.9 | |
| Industrial REITs | 16.7 | |
| Retail REITs | 14.8 | |
| Health Care REITs | 12.7 | |
| Hotel & Resort REITs | 2.9 | |
| Real Estate Management & Development | 1.6 | |
| Office REITs | 1.6 | |
| |
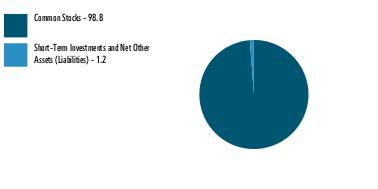
| Common Stocks | 98.8 |
| Short-Term Investments and Net Other Assets (Liabilities) | 1.2 |
ASSET ALLOCATION (% of Fund's net assets) |
|
|
GEOGRAPHIC DIVERSIFICATION (% of Fund's net assets) |
|
| |
|
TOP HOLDINGS (% of Fund's net assets) | | |
| Prologis Inc | 10.0 | |
| Equinix Inc | 9.9 | |
| Ventas Inc | 6.7 | |
| Public Storage Operating Co | 5.9 | |
| CubeSmart | 5.0 | |
| Welltower Inc | 4.8 | |
| Essex Property Trust Inc | 3.8 | |
| Mid-America Apartment Communities Inc | 3.7 | |
| Invitation Homes Inc | 3.5 | |
| Four Corners Property Trust Inc | 3.4 | |
| | 56.7 | |
How has the Fund changed?
This is a summary of certain changes to the Fund since October 1, 2023. For more complete information, you may review the Fund's next prospectus, which we expect to be available by November 29, 2024 at fundresearch.fidelity.com/prospectus/sec or upon request at 1-800-544-8544 .
Effective March 1, 2024, the fund's management contract was amended to remove the fee the investment adviser received from investing funds. | |
| Fidelity, the Fidelity Investments Logo and all other Fidelity trademarks or service marks used herein are trademarks or service marks of FMR LLC. Any third-party marks that are used herein are trademarks or service marks of their respective owners. © 2024 FMR LLC. All rights reserved. |
| | For additional information about the Fund; including its prospectus, financial information, holdings and proxy information, scan the QR code or visit fundresearch.fidelity.com/prospectus/sec 1.9913782.100 2724-TSRA-1124 |
Item 2.
Code of Ethics
As of the end of the period, September 30, 2024, Fidelity Central Investment Portfolios LLC (the trust) has adopted a code of ethics, as defined in Item 2 of Form N-CSR, that applies to its President and Treasurer and its Chief Financial Officer. A copy of the code of ethics is filed as an exhibit to this Form N-CSR.
Item 3.
Audit Committee Financial Expert
The Board of Trustees of the trust has determined that Donald F. Donahue is an audit committee financial expert, as defined in Item 3 of Form N-CSR. Mr. Donahue is independent for purposes of Item 3 of Form N-CSR.
Item 4.
Principal Accountant Fees and Services
Fees and Services
The following table presents fees billed by Deloitte & Touche LLP, the member firms of Deloitte Touche Tohmatsu, and their respective affiliates (collectively, “Deloitte Entities”) in each of the last two fiscal years for services rendered to Fidelity Emerging Markets Equity Central Fund, Fidelity Floating Rate Central Fund, Fidelity International Equity Central Fund, and Fidelity Real Estate Equity Central Fund (the “Fund(s)”):
Services Billed by Deloitte Entities
September 30, 2024 FeesA
| | | | |
| Audit Fees | Audit-Related Fees | Tax Fees | All Other Fees |
Fidelity Emerging Markets Equity Central Fund | $40,600 | $- | $10,800 | $1,000 |
Fidelity Floating Rate Central Fund | $75,900 | $- | $9,700 | $1,800 |
Fidelity International Equity Central Fund | $45,800 | $- | $10,800 | $1,200 |
Fidelity Real Estate Equity Central Fund | $38,200 | $- | $8,900 | $1,000 |
| | | | |
| Audit Fees | Audit-Related Fees | Tax Fees | All Other Fees |
Fidelity Emerging Markets Equity Central Fund | $40,800 | $- | $10,800 | $1,100 |
Fidelity Floating Rate Central Fund | $76,300 | $- | $9,700 | $1,800 |
Fidelity International Equity Central Fund | $46,000 | $- | $11,000 | $1,200 |
Fidelity Real Estate Equity Central Fund | $38,400 | $- | $8,900 | $1,000 |
A Amounts may reflect rounding.
The following table(s) present(s) fees billed by Deloitte Entities that were required to be approved by the Audit Committee for services that relate directly to the operations and financial reporting of the Fund(s) and that are rendered on behalf of Fidelity Management & Research Company LLC ("FMR") and entities controlling, controlled by, or under common control with FMR (not including any sub-adviser whose role is primarily portfolio management and is subcontracted with or overseen by another investment adviser) that provide ongoing services to the Fund(s) (“Fund Service Providers”):
Services Billed by Deloitte Entities
| | |
| September 30, 2024A | September 30, 2023A |
Audit-Related Fees | $125,000 | $75,000 |
Tax Fees | $- | $- |
All Other Fees | $2,929,500 | $- |
A Amounts may reflect rounding.
“Audit-Related Fees” represent fees billed for assurance and related services that are reasonably related to the performance of the fund audit or the review of the fund's financial statements and that are not reported under Audit Fees.
“Tax Fees” represent fees billed for tax compliance, tax advice or tax planning that relate directly to the operations and financial reporting of the fund.
“All Other Fees” represent fees billed for services provided to the fund or Fund Service Provider, a significant portion of which are assurance related, that relate directly to the operations and financial reporting of the fund, excluding those services that are reported under Audit Fees, Audit-Related Fees or Tax Fees.
Assurance services must be performed by an independent public accountant.
* * *
The aggregate non-audit fees billed by Deloitte Entities for services rendered to the Fund(s), FMR (not including any sub-adviser whose role is primarily portfolio management and is subcontracted with or overseen by another investment adviser), and any Fund Service Provider for each of the last two fiscal years of the Fund(s) are as follows:
| | |
Billed By | September 30, 2024A | September 30, 2023A |
Deloitte Entities | $5,230,200 | $4,027,000 |
A Amounts may reflect rounding.
The trust's Audit Committee has considered non-audit services that were not pre-approved that were provided by Deloitte Entities to Fund Service Providers to be compatible with maintaining the independence of Deloitte Entities in its(their) audit of the Fund(s), taking into account representations from Deloitte Entities, in accordance with Public Company Accounting Oversight Board rules, regarding its independence from the Fund(s) and its(their) related entities and FMR’s review of the appropriateness and permissibility under applicable law of such non-audit services prior to their provision to the Fund(s) Service Providers.
Audit Committee Pre-Approval Policies and Procedures
The trust’s Audit Committee must pre-approve all audit and non-audit services provided by a fund’s independent registered public accounting firm relating to the operations or financial reporting of the fund. Prior to the commencement of any audit or non-audit services to a fund, the Audit Committee reviews the services to determine whether they are appropriate and permissible under applicable law.
The Audit Committee has adopted policies and procedures to, among other purposes, provide a framework for the Committee’s consideration of non-audit services by the audit firms that audit the Fidelity funds. The policies and procedures require that any non-audit service provided by a fund audit firm to a Fidelity fund and any non-audit service provided by a fund auditor to a Fund Service Provider that relates directly to the operations and financial reporting of a Fidelity fund (“Covered Service”) are subject to approval by the Audit Committee before such service is provided.
All Covered Services must be approved in advance of provision of the service either: (i) by formal resolution of the Audit Committee, or (ii) by oral or written approval of the service by the Chair of the Audit Committee (or if the Chair is unavailable, such other member of the Audit Committee as may be designated by the Chair to act in the Chair’s absence). The approval contemplated by (ii) above is permitted where the Treasurer determines that action on such an engagement is necessary before the next meeting of the Audit Committee.
Non-audit services provided by a fund audit firm to a Fund Service Provider that do not relate directly to the operations and financial reporting of a Fidelity fund are reported to the Audit Committee periodically.
Non-Audit Services Approved Pursuant to Rule 2-01(c)(7)(i)(C) and (ii) of Regulation S-X (“De Minimis Exception”)
There were no non-audit services approved or required to be approved by the Audit Committee pursuant to the De Minimis Exception during the Fund’s(s’) last two fiscal years relating to services provided to (i) the Fund(s) or (ii) any Fund Service Provider that relate directly to the operations and financial reporting of the Fund(s).
The Registrant has not retained, for the preparation of the audit report on the financial statements included in the Form N-CSR, a registered public accounting firm that has a branch or office that is located in a foreign jurisdiction and that the Public Company Accounting Oversight Board (the “PCAOB”) has determined that the PCAOB is unable to inspect or investigate completely because of a position taken by an authority in the foreign jurisdiction.
The Registrant is not a “foreign issuer,” as defined in 17 CFR 240.3b-4.
Item 5.
Audit Committee of Listed Registrants
Not applicable.
Item 6.
Investments
(a)
Not applicable.
(b)
Not applicable.
Item 7.
Financial Statements and Financial Highlights for Open-End Management Investment Companies
Fidelity® International Equity Central Fund
Annual Report
September 30, 2024
Contents
To view a fund's proxy voting guidelines and proxy voting record for the 12-month period ended June 30, visit http://www.fidelity.com/proxyvotingresults or visit the Securities and Exchange Commission's (SEC) web site at http://www.sec.gov.
You may also call 1-800-544-8544 to request a free copy of the proxy voting guidelines.
Standard & Poor's, S&P and S&P 500 are registered service marks of The McGraw-Hill Companies, Inc. and have been licensed for use by Fidelity Distributors Corporation.
Other third-party marks appearing herein are the property of their respective owners.
All other marks appearing herein are registered or unregistered trademarks or service marks of FMR LLC or an affiliated company. © 2024 FMR LLC. All rights reserved.
A fund files its complete schedule of portfolio holdings with the SEC for the first and third quarters of each fiscal year on Form N-PORT. Forms N-PORT are available on the SEC's web site at http://www.sec.gov. A fund's Forms N-PORT may be reviewed and copied at the SEC's Public Reference Room in Washington, DC. Information regarding the operation of the SEC's Public Reference Room may be obtained by calling 1-800-SEC-0330.
Item 7: Financial Statements and Financial Highlights for Open-End Management Investment Companies (Annual Report)
Fidelity® International Equity Central Fund
Schedule of Investments September 30, 2024
Showing Percentage of Net Assets
| Common Stocks - 97.9% |
| | | Shares | Value ($) |
| Australia - 1.8% | | | |
| Arena (REIT) unit | | 1,216,190 | 3,497,782 |
| Commonwealth Bank of Australia | | 103,412 | 9,679,557 |
| Goodman Group unit | | 121,998 | 3,119,859 |
| Macquarie Group Ltd. | | 111,969 | 17,987,708 |
| National Storage REIT unit | | 1,831,785 | 3,229,332 |
| QBE Insurance Group Ltd. | | 1,060,942 | 12,131,796 |
| Rio Tinto PLC | | 425,500 | 30,205,235 |
| Treasury Wine Estates Ltd. | | 480,706 | 3,988,033 |
| Westpac Banking Corp. | | 931,556 | 20,428,671 |
TOTAL AUSTRALIA | | | 104,267,973 |
| Belgium - 1.1% | | | |
| Azelis Group NV | | 301,649 | 6,611,520 |
| KBC Group NV | | 410,262 | 32,616,310 |
| Nyxoah SA (a) | | 335,700 | 3,205,935 |
| UCB SA | | 124,900 | 22,523,255 |
| Warehouses de Pauw | | 18,393 | 490,152 |
TOTAL BELGIUM | | | 65,447,172 |
| Brazil - 0.2% | | | |
| Wheaton Precious Metals Corp. | | 196,500 | 12,001,109 |
| Canada - 6.5% | | | |
| Africa Oil Corp. | | 3,028,219 | 3,918,358 |
| Agnico Eagle Mines Ltd. (Canada) | | 103,800 | 8,361,869 |
| Alimentation Couche-Tard, Inc. (multi-vtg.) | | 603,100 | 33,342,295 |
| Athabasca Oil Corp. (a) | | 1,469,419 | 5,215,136 |
| Boardwalk (REIT) | | 17,700 | 1,121,063 |
| Canadian Pacific Kansas City Ltd. | | 319,100 | 27,291,432 |
| Chemtrade Logistics Income Fund (b) | | 1,859,500 | 15,151,532 |
| Constellation Software, Inc. | | 20,600 | 67,019,113 |
| Constellation Software, Inc. warrants 3/31/40 (a)(c) | | 24,200 | 2 |
| Fairfax Financial Holdings Ltd. (sub. vtg.) | | 4,100 | 5,176,862 |
| Franco-Nevada Corp. | | 47,500 | 5,899,701 |
| Imperial Oil Ltd. | | 275,724 | 19,398,232 |
| Intact Financial Corp. | | 108,400 | 20,815,172 |
| Ivanhoe Mines Ltd. (a) | | 1,013,300 | 15,074,565 |
| Lumine Group, Inc. (a) | | 198,516 | 4,638,327 |
| MEG Energy Corp. | | 425,402 | 7,992,506 |
| Onex Corp. (sub. vtg.) | | 108,000 | 7,564,672 |
| Pembina Pipeline Corp. | | 155,000 | 6,389,330 |
| Quebecor, Inc. Class B (sub. vtg.) | | 133,200 | 3,477,609 |
| Royal Bank of Canada | | 340,300 | 42,473,023 |
| Shopify, Inc. Class A (a) | | 182,610 | 14,634,365 |
| South Bow Corp. | | 99,300 | 2,147,603 |
| Stella-Jones, Inc. | | 153,900 | 10,103,724 |
| TC Energy Corp. (b) | | 207,200 | 9,849,450 |
| Teck Resources Ltd. Class B (sub. vtg.) | | 193,800 | 10,122,394 |
| TMX Group Ltd. | | 806,100 | 25,265,687 |
TOTAL CANADA | | | 372,444,022 |
| Chile - 0.1% | | | |
| Antofagasta PLC | | 292,200 | 7,863,921 |
| China - 0.1% | | | |
| ESR Group Ltd. (d) | | 1,737,800 | 2,771,950 |
| NXP Semiconductors NV | | 10,300 | 2,472,103 |
TOTAL CHINA | | | 5,244,053 |
| Denmark - 2.7% | | | |
| DSV A/S | | 10,500 | 2,167,721 |
| Novo Nordisk A/S Series B | | 1,169,400 | 138,704,312 |
| Novonesis (NOVOZYMES) B Series B | | 97,600 | 7,027,905 |
| Pandora A/S | | 42,400 | 6,980,609 |
TOTAL DENMARK | | | 154,880,547 |
| Finland - 0.5% | | | |
| Elisa Corp. (A Shares) | | 66,780 | 3,539,888 |
| Nordea Bank Abp | | 435,800 | 5,132,183 |
| Sampo Oyj (A Shares) | | 423,900 | 19,771,114 |
TOTAL FINLAND | | | 28,443,185 |
| France - 9.5% | | | |
| Accor SA | | 574,400 | 24,936,341 |
| Air Liquide SA | | 403,036 | 77,830,376 |
| Airbus Group NV | | 217,600 | 31,847,138 |
| Alten SA | | 164,500 | 18,329,629 |
| ARGAN SA | | 33,833 | 2,775,631 |
| BNP Paribas SA | | 189,500 | 13,003,814 |
| Capgemini SA | | 230,800 | 49,829,864 |
| Danone SA | | 221,000 | 16,097,529 |
| Dassault Systemes SA | | 667,000 | 26,493,769 |
| EssilorLuxottica SA | | 152,231 | 36,026,333 |
| Hermes International SCA | | 6,600 | 16,207,019 |
| Interparfums SA (b) | | 60,650 | 3,061,694 |
| L'Oreal SA | | 116,400 | 52,209,694 |
| LVMH Moet Hennessy Louis Vuitton SE | | 129,555 | 99,352,635 |
| Safran SA | | 252,700 | 59,466,124 |
| TotalEnergies SE | | 255,524 | 16,592,541 |
| Veolia Environnement SA | | 138,270 | 4,552,303 |
TOTAL FRANCE | | | 548,612,434 |
| Germany - 9.0% | | | |
| adidas AG | | 44,600 | 11,818,405 |
| Allianz SE | | 139,200 | 45,785,549 |
| CTS Eventim AG | | 34,370 | 3,571,474 |
| Deutsche Borse AG | | 181,100 | 42,516,616 |
| Deutsche Post AG ADR | | 532,331 | 23,745,524 |
| Deutsche Telekom AG | | 653,900 | 19,204,556 |
| E.ON SE | | 502,290 | 7,467,103 |
| Fresenius SE & Co. KGaA (a) | | 646,500 | 24,633,670 |
| Hannover Reuck SE | | 157,800 | 44,985,264 |
| LEG Immobilien AG (b) | | 53,007 | 5,533,465 |
| Mercedes-Benz Group AG (Germany) | | 203,000 | 13,154,234 |
| Merck KGaA | | 207,043 | 36,414,247 |
| MTU Aero Engines AG | | 47,900 | 14,929,568 |
| Rheinmetall AG | | 37,828 | 20,481,447 |
| RWE AG | | 91,430 | 3,326,017 |
| SAP SE | | 513,159 | 117,376,203 |
| Siemens AG | | 221,050 | 44,720,174 |
| Siemens Healthineers AG (d) | | 654,300 | 39,228,072 |
TOTAL GERMANY | | | 518,891,588 |
| Hong Kong - 1.2% | | | |
| AIA Group Ltd. | | 2,708,800 | 23,655,565 |
| CK Asset Holdings Ltd. | | 1,287,088 | 5,662,369 |
| HKT Trust/HKT Ltd. unit | | 3,405,200 | 4,358,425 |
| Hong Kong Exchanges and Clearing Ltd. | | 479,300 | 19,579,580 |
| Prudential PLC | | 1,575,360 | 14,615,000 |
| Prudential PLC rights (a)(e) | | 1,575,360 | 109,395 |
TOTAL HONG KONG | | | 67,980,334 |
| Hungary - 0.3% | | | |
| Richter Gedeon PLC | | 460,200 | 14,170,311 |
| India - 0.4% | | | |
| HDFC Bank Ltd. | | 1,210,612 | 24,937,317 |
| Indonesia - 0.5% | | | |
| PT Bank Central Asia Tbk | | 39,500,200 | 26,937,884 |
| Ireland - 1.3% | | | |
| AIB Group PLC | | 4,646,200 | 26,609,516 |
| Bank of Ireland Group PLC | | 1,241,100 | 13,856,751 |
| Kerry Group PLC Class A | | 73,700 | 7,641,947 |
| Kingspan Group PLC (Ireland) | | 311,300 | 29,229,265 |
TOTAL IRELAND | | | 77,337,479 |
| Israel - 0.1% | | | |
| Wix.com Ltd. (a) | | 28,300 | 4,730,911 |
| Italy - 3.8% | | | |
| Coca-Cola HBC AG | | 194,000 | 6,909,572 |
| Davide Campari Milano NV | | 1,010,400 | 8,547,923 |
| Enel SpA | | 835,946 | 6,677,373 |
| Ferrari NV (Italy) | | 28,300 | 13,221,450 |
| FinecoBank SpA | | 1,306,000 | 22,351,774 |
| GVS SpA (a)(d) | | 115,000 | 924,248 |
| Industrie de Nora SpA (b) | | 116,500 | 1,218,362 |
| Prada SpA | | 1,124,200 | 8,676,782 |
| Prysmian SpA | | 443,000 | 32,151,780 |
| Recordati SpA | | 831,400 | 47,014,024 |
| UniCredit SpA | | 1,618,900 | 71,072,350 |
TOTAL ITALY | | | 218,765,638 |
| Japan - 18.0% | | | |
| Advance Residence Investment Corp. | | 1,950 | 4,565,490 |
| Advantest Corp. | | 109,900 | 5,168,736 |
| Ajinomoto Co., Inc. | | 937,600 | 36,286,916 |
| Asics Corp. | | 395,900 | 8,317,123 |
| BayCurrent Consulting, Inc. | | 279,100 | 10,299,853 |
| Canon, Inc. | | 67,300 | 2,216,545 |
| Capcom Co. Ltd. | | 1,063,510 | 24,625,926 |
| Daiichi Sankyo Co. Ltd. | | 671,800 | 22,191,138 |
| DENSO Corp. | | 1,608,800 | 24,182,514 |
| Disco Corp. | | 15,400 | 4,056,787 |
| Ebara Corp. | | 1,588,100 | 26,030,353 |
| Fast Retailing Co. Ltd. | | 57,700 | 19,144,699 |
| Fuji Electric Co. Ltd. | | 184,600 | 11,185,510 |
| FUJIFILM Holdings Corp. | | 1,481,300 | 38,346,309 |
| Fujitsu Ltd. | | 443,500 | 9,118,105 |
| Hitachi Ltd. | | 4,745,700 | 125,843,335 |
| Hoya Corp. | | 317,300 | 43,947,176 |
| Itochu Corp. | | 546,000 | 29,426,721 |
| JEOL Ltd. | | 19,200 | 742,618 |
| JTOWER, Inc. (a) | | 119,300 | 2,979,906 |
| Kansai Electric Power Co., Inc. | | 230,820 | 3,825,350 |
| Katitas Co. Ltd. | | 120,900 | 1,674,809 |
| Keyence Corp. | | 24,800 | 11,885,702 |
| Komatsu Ltd. | | 848,700 | 23,759,126 |
| LY Corp. | | 1,529,370 | 4,457,803 |
| Mitsubishi Electric Corp. | | 1,669,000 | 27,072,760 |
| Mitsubishi Heavy Industries Ltd. | | 3,786,200 | 56,580,962 |
| Mitsui Fudosan Logistics Park, Inc. | | 433 | 1,278,890 |
| Mizuho Financial Group, Inc. | | 1,130,000 | 23,358,044 |
| NEC Corp. | | 35,300 | 3,408,793 |
| Nintendo Co. Ltd. | | 161,970 | 8,657,524 |
| Nomura Real Estate Holdings, Inc. | | 85,900 | 2,289,671 |
| NSD Co. Ltd. | | 101,100 | 2,226,345 |
| ORIX Corp. | | 487,700 | 11,411,621 |
| Pan Pacific International Holdings Ltd. | | 375,000 | 9,640,807 |
| Renesas Electronics Corp. | | 2,396,529 | 34,780,031 |
| Rohto Pharmaceutical Co. Ltd. | | 380,500 | 9,456,573 |
| Shin-Etsu Chemical Co. Ltd. | | 1,911,400 | 79,878,167 |
| SoftBank Group Corp. | | 192,426 | 11,413,985 |
| Sompo Holdings, Inc. | | 478,600 | 10,788,029 |
| Sony Group Corp. | | 1,225,000 | 23,798,803 |
| Sumitomo Mitsui Financial Group, Inc. | | 1,282,500 | 27,402,696 |
| Suzuki Motor Corp. | | 2,030,400 | 22,862,082 |
| TDK Corp. | | 190,500 | 2,433,511 |
| Terumo Corp. | | 959,400 | 18,175,342 |
| TIS, Inc. | | 314,900 | 7,999,304 |
| Tokio Marine Holdings, Inc. | | 1,735,800 | 64,006,664 |
| Tokyo Electron Ltd. | | 293,100 | 52,270,199 |
| Tosei Corp. | | 124,000 | 1,984,345 |
| Toyota Motor Corp. | | 1,427,200 | 25,652,511 |
TOTAL JAPAN | | | 1,033,106,209 |
| Luxembourg - 0.0% | | | |
| CVC Capital Partners PLC (d) | | 21,900 | 489,266 |
| Netherlands - 4.5% | | | |
| ASML Holding NV (Netherlands) | | 183,508 | 152,653,071 |
| BE Semiconductor Industries NV | | 18,900 | 2,388,926 |
| Heineken NV (Bearer) | | 107,300 | 9,525,044 |
| IMCD NV | | 171,300 | 29,727,417 |
| Topicus.Com, Inc. | | 26,781 | 2,527,111 |
| Universal Music Group NV | | 245,240 | 6,415,778 |
| Wolters Kluwer NV | | 336,273 | 56,634,963 |
TOTAL NETHERLANDS | | | 259,872,310 |
| Norway - 0.2% | | | |
| Equinor ASA | | 176,410 | 4,462,940 |
| Norsk Hydro ASA | | 816,700 | 5,275,889 |
TOTAL NORWAY | | | 9,738,829 |
| Portugal - 0.2% | | | |
| Galp Energia SGPS SA | | 625,189 | 11,691,610 |
| Singapore - 0.5% | | | |
| Parkway Life REIT | | 1,157,548 | 3,782,689 |
| Sea Ltd. ADR Class A (a) | | 111,320 | 10,495,250 |
| Singapore Telecommunications Ltd. | | 809,360 | 2,040,324 |
| United Overseas Bank Ltd. | | 405,205 | 10,142,342 |
| Wing Tai Holdings Ltd. | | 1,287,600 | 1,352,468 |
TOTAL SINGAPORE | | | 27,813,073 |
| South Africa - 0.2% | | | |
| Anglo American PLC (United Kingdom) | | 270,800 | 8,802,547 |
| Spain - 2.6% | | | |
| Banco Santander SA (Spain) | | 5,664,900 | 29,026,199 |
| Bankinter SA | | 185,200 | 1,634,400 |
| CaixaBank SA | | 10,258,200 | 61,220,388 |
| Cellnex Telecom SA (d) | | 295,196 | 11,968,074 |
| EDP Renovaveis SA | | 72,010 | 1,259,281 |
| Iberdrola SA | | 982,821 | 15,196,038 |
| Industria de Diseno Textil SA | | 287,000 | 16,998,001 |
| Neinor Homes SLU (d) | | 202,100 | 3,379,014 |
| Puig Brands SA Class B | | 255,600 | 5,863,981 |
TOTAL SPAIN | | | 146,545,376 |
| Sweden - 1.6% | | | |
| AddTech AB (B Shares) | | 191,956 | 5,749,693 |
| Atlas Copco AB (A Shares) | | 1,746,100 | 33,840,136 |
| Autoliv, Inc. | | 67,300 | 6,283,801 |
| Evolution AB (d) | | 53,300 | 5,237,710 |
| Haypp Group AB (a) | | 353,000 | 2,850,180 |
| Hemnet Group AB | | 99,480 | 3,661,498 |
| Indutrade AB | | 1,082,743 | 33,646,981 |
| Kry International AB (a)(c)(f) | | 527 | 30,974 |
TOTAL SWEDEN | | | 91,300,973 |
| Switzerland - 3.1% | | | |
| Compagnie Financiere Richemont SA Series A | | 168,460 | 26,752,171 |
| Galderma Group AG | | 354,930 | 32,962,129 |
| Partners Group Holding AG | | 28,190 | 42,300,821 |
| Sika AG | | 142,244 | 47,075,730 |
| UBS Group AG | | 958,640 | 29,517,526 |
TOTAL SWITZERLAND | | | 178,608,377 |
| Taiwan - 0.6% | | | |
| Taiwan Semiconductor Manufacturing Co. Ltd. | | 1,154,000 | 34,670,262 |
| Tanzania - 0.0% | | | |
| Helios Towers PLC (a) | | 825,040 | 1,264,081 |
| United Kingdom - 15.9% | | | |
| 3i Group PLC | | 1,685,564 | 74,667,959 |
| AstraZeneca PLC (United Kingdom) | | 732,800 | 114,160,303 |
| B&M European Value Retail SA | | 957,276 | 5,313,855 |
| BAE Systems PLC | | 2,134,100 | 35,430,486 |
| Baltic Classifieds Group PLC | | 590,620 | 2,392,577 |
| Big Yellow Group PLC | | 225,977 | 3,830,881 |
| Compass Group PLC | | 2,424,034 | 77,713,759 |
| ConvaTec Group PLC (d) | | 3,317,700 | 10,068,810 |
| Cranswick PLC | | 95,218 | 6,390,546 |
| Deliveroo PLC Class A (a)(d) | | 4,013,400 | 8,290,030 |
| Diageo PLC | | 543,471 | 18,983,391 |
| Diploma PLC | | 183,468 | 10,876,050 |
| Games Workshop Group PLC | | 27,397 | 3,937,555 |
| Grainger Trust PLC | | 500,576 | 1,642,997 |
| Halma PLC | | 624,600 | 21,778,338 |
| Hiscox Ltd. | | 620,600 | 9,508,490 |
| Informa PLC | | 543,170 | 5,956,220 |
| InterContinental Hotel Group PLC | | 329,430 | 35,874,986 |
| JD Sports Fashion PLC | | 3,513,000 | 7,235,275 |
| Jet2 PLC | | 1,072,500 | 20,074,304 |
| John Wood Group PLC (a) | | 5,496,900 | 9,311,285 |
| Lancashire Holdings Ltd. | | 1,794,400 | 16,481,289 |
| Lloyds Banking Group PLC | | 67,929,000 | 53,412,088 |
| London Stock Exchange Group PLC | | 551,970 | 75,570,793 |
| National Grid PLC | | 1,037,656 | 14,343,527 |
| Premier Foods PLC | | 1,919,500 | 4,706,549 |
| Raspberry Pi Ltd. (b) | | 640,300 | 3,309,486 |
| RELX PLC (London Stock Exchange) | | 2,006,098 | 94,720,571 |
| Rolls-Royce Holdings PLC (a) | | 8,824,400 | 62,454,626 |
| RS GROUP PLC | | 2,344,377 | 25,387,950 |
| Sage Group PLC | | 1,670,200 | 22,876,817 |
| SSE PLC | | 246,800 | 6,213,133 |
| Supreme PLC | | 947,300 | 1,982,061 |
| Tesco PLC | | 3,727,100 | 17,894,959 |
| Unilever PLC (Netherlands) | | 366,861 | 23,775,379 |
| Zegona Communications PLC (a) | | 932,400 | 4,537,523 |
TOTAL UNITED KINGDOM | | | 911,104,848 |
| United States of America - 11.3% | | | |
| Airbnb, Inc. Class A (a) | | 10,000 | 1,268,100 |
| Alcon, Inc. (Switzerland) | | 633,020 | 63,066,399 |
| Brookfield Renewable Corp. | | 52,890 | 1,726,957 |
| CDW Corp. | | 82,700 | 18,715,010 |
| Cheniere Energy, Inc. | | 16,500 | 2,967,360 |
| CRH PLC | | 261,100 | 24,214,414 |
| Entergy Corp. | | 10,600 | 1,395,066 |
| Experian PLC | | 793,200 | 41,687,026 |
| Ferguson Enterprises, Inc. | | 172,900 | 33,980,322 |
| GE Vernova LLC | | 5,350 | 1,364,143 |
| GFL Environmental, Inc. | | 97,200 | 3,877,363 |
| GSK PLC | | 948,600 | 19,314,462 |
| Hecla Mining Co. | | 429,300 | 2,863,431 |
| Holcim AG | | 338,570 | 33,157,132 |
| ICON PLC (a) | | 79,200 | 22,754,952 |
| Linde PLC | | 128,612 | 61,329,918 |
| Marsh & McLennan Companies, Inc. | | 214,900 | 47,942,041 |
| Nestle SA (Reg. S) | | 321,268 | 32,285,004 |
| NextEra Energy, Inc. | | 25,370 | 2,144,526 |
| Philip Morris International, Inc. | | 73,700 | 8,947,180 |
| Quanta Services, Inc. | | 1,040 | 310,076 |
| Roche Holding AG (participation certificate) | | 38,820 | 12,423,070 |
| S&P Global, Inc. | | 86,066 | 44,463,417 |
| Sanofi SA | | 33,955 | 3,909,556 |
| Schneider Electric SA | | 197,850 | 52,154,829 |
| Sempra | | 33,600 | 2,809,968 |
| Shell PLC (London) | | 1,630,962 | 52,911,242 |
| Thermo Fisher Scientific, Inc. | | 39,100 | 24,186,087 |
| Visa, Inc. Class A | | 104,400 | 28,704,780 |
| Waste Connections, Inc. (United States) | | 19,550 | 3,495,931 |
TOTAL UNITED STATES OF AMERICA | | | 650,369,762 |
| Zambia - 0.1% | | | |
| First Quantum Minerals Ltd. | | 579,600 | 7,902,565 |
| TOTAL COMMON STOCKS (Cost $3,890,154,192) | | | 5,626,235,966 |
| | | | |
| Convertible Preferred Stocks - 0.0% |
| | | Shares | Value ($) |
| Sweden - 0.0% | | | |
Kry International AB Series E (a)(c)(f) (Cost $1,391,178) | | 3,043 | 245,445 |
| | | | |
| Government Obligations - 0.1% |
| | | Principal Amount (g) | Value ($) |
| United States of America - 0.1% | | | |
U.S. Treasury Bills, yield at date of purchase 5.28% 10/10/24 (h) (Cost $3,075,984) | | 3,080,000 | 3,076,423 |
| | | | |
| Money Market Funds - 1.8% |
| | | Shares | Value ($) |
| Fidelity Cash Central Fund 4.89% (i) | | 89,415,848 | 89,433,731 |
| Fidelity Securities Lending Cash Central Fund 4.89% (i)(j) | | 15,651,092 | 15,652,657 |
| TOTAL MONEY MARKET FUNDS (Cost $105,086,387) | | | 105,086,388 |
| | | | |
| TOTAL INVESTMENT IN SECURITIES - 99.8% (Cost $3,999,707,741) | 5,734,644,222 |
NET OTHER ASSETS (LIABILITIES) - 0.2% | 13,086,646 |
| NET ASSETS - 100.0% | 5,747,730,868 |
| | |
| Futures Contracts |
| | Number of contracts | Expiration Date | Notional Amount ($) | Value ($) | Unrealized Appreciation/ (Depreciation) ($) |
| Purchased | | | | | |
| | | | | | |
| Equity Index Contracts | | | | | |
| ICE E-mini MSCI Emerging Markets Index Contracts (United States) | 260 | Dec 2024 | 15,245,100 | 976,590 | 976,590 |
| TME S&P/TSX 60 Index Contracts (Canada) | 10 | Dec 2024 | 2,135,975 | 32,926 | 32,926 |
| | | | | | |
| TOTAL FUTURES CONTRACTS | | | | | 1,009,516 |
| The notional amount of futures purchased as a percentage of Net Assets is 0.3% |
Legend
| (b) | Security or a portion of the security is on loan at period end. |
| (d) | Security exempt from registration under Rule 144A of the Securities Act of 1933. These securities may be resold in transactions exempt from registration, normally to qualified institutional buyers. At the end of the period, the value of these securities amounted to $82,357,174 or 1.4% of net assets. |
| (e) | Security or a portion of the security purchased on a delayed delivery or when-issued basis. |
| (f) | Restricted securities (including private placements) - Investment in securities not registered under the Securities Act of 1933 (excluding 144A issues). At the end of the period, the value of restricted securities (excluding 144A issues) amounted to $276,419 or 0.0% of net assets. |
| (g) | Amount is stated in United States dollars unless otherwise noted. |
| (h) | Security or a portion of the security was pledged to cover margin requirements for futures contracts. At period end, the value of securities pledged amounted to $668,223. |
| (i) | Affiliated fund that is generally available only to investment companies and other accounts managed by Fidelity Investments. The rate quoted is the annualized seven-day yield of the fund at period end. A complete unaudited listing of the fund's holdings as of its most recent quarter end is available upon request. In addition, each Fidelity Central Fund's financial statements, which are not covered by the Fund's Report of Independent Registered Public Accounting Firm, are available on the SEC's website or upon request. |
| (j) | Investment made with cash collateral received from securities on loan. |
| Additional information on each restricted holding is as follows: |
| Security | Acquisition Date | Acquisition Cost ($) |
| Kry International AB | 5/14/21 | 228,879 |
| | | |
| Kry International AB Series E | 5/14/21 | 1,391,178 |
| | | |
Affiliated Central Funds
Fiscal year to date information regarding the Fund's investments in Fidelity Central Funds, including the ownership percentage, is presented below.
| Affiliate | Value, beginning of period ($) | Purchases ($) | Sales Proceeds ($) | Dividend Income ($) | Realized Gain (loss) ($) | Change in Unrealized appreciation (depreciation) ($) | Value, end of period ($) | % ownership, end of period |
| Fidelity Cash Central Fund 4.89% | 111,771,368 | 1,179,724,047 | 1,202,061,628 | 4,226,858 | (55) | (1) | 89,433,731 | 0.2% |
| Fidelity Securities Lending Cash Central Fund 4.89% | 58,825,168 | 370,500,819 | 413,673,330 | 196,386 | - | - | 15,652,657 | 0.1% |
| Total | 170,596,536 | 1,550,224,866 | 1,615,734,958 | 4,423,244 | (55) | (1) | 105,086,388 | |
| | | | | | | | | |
Amounts in the dividend income column in the above table include any capital gain distributions from underlying funds, which are presented in the corresponding line item in the Statement of Operations, if applicable.
Amounts in the dividend income column for Fidelity Securities Lending Cash Central Fund represents the income earned on investing cash collateral, less rebates paid to borrowers and any lending agent fees associated with the loan, plus any premium payments received for lending certain types of securities.
Amounts included in the purchases and sales proceeds columns may include in-kind transactions, if applicable.
Investment Valuation
The following is a summary of the inputs used, as of September 30, 2024, involving the Fund's assets and liabilities carried at fair value. The inputs or methodology used for valuing securities may not be an indication of the risk associated with investing in those securities. For more information on valuation inputs, and their aggregation into the levels used below, please refer to the Investment Valuation section in the accompanying Notes to Financial Statements.
| Valuation Inputs at Reporting Date: |
| Description | Total ($) | Level 1 ($) | Level 2 ($) | Level 3 ($) |
Investments in Securities: | | | | |
|
| Equities: | | | | |
Communication Services | 135,018,421 | 72,900,701 | 62,117,720 | - |
Consumer Discretionary | 531,062,512 | 125,440,589 | 405,621,923 | - |
Consumer Staples | 305,914,209 | 122,631,672 | 183,282,537 | - |
Energy | 152,847,593 | 78,880,870 | 73,966,723 | - |
Financials | 1,271,107,983 | 585,077,711 | 686,030,272 | - |
Health Care | 749,079,583 | 376,254,224 | 372,825,359 | - |
Industrials | 1,150,395,790 | 412,117,415 | 738,278,375 | - |
Information Technology | 739,372,711 | 194,388,403 | 544,707,887 | 276,421 |
Materials | 470,142,124 | 234,992,778 | 235,149,346 | - |
Real Estate | 50,603,843 | 50,603,843 | - | - |
Utilities | 70,936,642 | 41,538,089 | 29,398,553 | - |
|
| Government Obligations | 3,076,423 | - | 3,076,423 | - |
|
| Money Market Funds | 105,086,388 | 105,086,388 | - | - |
| Total Investments in Securities: | 5,734,644,222 | 2,399,912,683 | 3,334,455,118 | 276,421 |
Derivative Instruments: Assets | | | | |
Futures Contracts | 1,009,516 | 1,009,516 | - | - |
| Total Assets | 1,009,516 | 1,009,516 | - | - |
| Total Derivative Instruments: | 1,009,516 | 1,009,516 | - | - |
Value of Derivative Instruments
The following table is a summary of the Fund's value of derivative instruments by primary risk exposure as of September 30, 2024. For additional information on derivative instruments, please refer to the Derivative Instruments section in the accompanying Notes to Financial Statements.
Primary Risk Exposure / Derivative Type | Value |
| Asset ($) | Liability ($) |
| Equity Risk | | |
Futures Contracts (a) | 1,009,516 | 0 |
| Total Equity Risk | 1,009,516 | 0 |
| Total Value of Derivatives | 1,009,516 | 0 |
(a)Reflects gross cumulative appreciation (depreciation) on futures contracts as presented in the Schedule of Investments. In the Statement of Assets and Liabilities, the period end daily variation margin is included in receivable or payable for daily variation margin on futures contracts, and the net cumulative appreciation (depreciation) is included in Total accumulated earnings (loss).
Financial Statements
| Statement of Assets and Liabilities |
As of September 30, 2024 |
| Assets | | | | |
| Investment in securities, at value (including securities loaned of $14,976,129) - See accompanying schedule: | | | | |
Unaffiliated issuers (cost $3,894,621,354) | $ | 5,629,557,834 | | |
Fidelity Central Funds (cost $105,086,387) | | 105,086,388 | | |
| | | | | |
| | | | | |
| Total Investment in Securities (cost $3,999,707,741) | | | $ | 5,734,644,222 |
| Foreign currency held at value (cost $437,700) | | | | 437,486 |
| Receivable for investments sold | | | | 15,760,038 |
| Receivable for fund shares sold | | | | 29,255 |
| Dividends receivable | | | | 9,933,304 |
| Reclaims receivable | | | | 17,022,070 |
| Distributions receivable from Fidelity Central Funds | | | | 341,506 |
| Other receivables | | | | 33,463 |
Total assets | | | | 5,778,201,344 |
| Liabilities | | | | |
| Payable to custodian bank | $ | 93,602 | | |
| Payable for investments purchased | | | | |
Regular delivery | | 11,196,306 | | |
Delayed delivery | | 109,574 | | |
| Payable for fund shares redeemed | | 2,573,656 | | |
| Payable for daily variation margin on futures contracts | | 258,786 | | |
| Other payables and accrued expenses | | 585,895 | | |
| Collateral on securities loaned | | 15,652,657 | | |
| Total liabilities | | | | 30,470,476 |
| Net Assets | | | $ | 5,747,730,868 |
| Net Assets consist of: | | | | |
| Paid in capital | | | $ | 4,050,296,059 |
| Total accumulated earnings (loss) | | | | 1,697,434,809 |
| Net Assets | | | $ | 5,747,730,868 |
Net Asset Value, offering price and redemption price per share ($5,747,730,868 ÷ 51,552,738 shares) | | | $ | 111.49 |
| Statement of Operations |
| Year ended September 30, 2024 |
| Investment Income | | | | |
| Dividends | | | $ | 121,441,814 |
| Interest | | | | 39,032 |
| Income from Fidelity Central Funds (including $196,386 from security lending) | | | | 4,423,244 |
| Income before foreign taxes withheld | | | $ | 125,904,090 |
| Less foreign taxes withheld | | | | (9,696,444) |
| Total income | | | | 116,207,646 |
| Expenses | | | | |
| Custodian fees and expenses | $ | 285,374 | | |
| Independent trustees' fees and expenses | | 24,579 | | |
| Miscellaneous | | 4 | | |
| Total expenses | | | | 309,957 |
| Net Investment income (loss) | | | | 115,897,689 |
| Realized and Unrealized Gain (Loss) | | | | |
| Net realized gain (loss) on: | | | | |
| Investment Securities: | | | | |
| Unaffiliated issuers (net of foreign taxes of $891,280) | | 98,402,130 | | |
| Fidelity Central Funds | | (55) | | |
| Foreign currency transactions | | 217,771 | | |
| Futures contracts | | (2,047,861) | | |
| Total net realized gain (loss) | | | | 96,571,985 |
| Change in net unrealized appreciation (depreciation) on: | | | | |
| Investment Securities: | | | | |
| Unaffiliated issuers (net of decrease in deferred foreign taxes of $173,377) | | 1,110,360,993 | | |
| Fidelity Central Funds | | (1) | | |
| Assets and liabilities in foreign currencies | | 997,193 | | |
| Futures contracts | | 1,009,516 | | |
| Total change in net unrealized appreciation (depreciation) | | | | 1,112,367,701 |
| Net gain (loss) | | | | 1,208,939,686 |
| Net increase (decrease) in net assets resulting from operations | | | $ | 1,324,837,375 |
| Statement of Changes in Net Assets |
| |
| | Year ended September 30, 2024 | | Year ended September 30, 2023 |
| Increase (Decrease) in Net Assets | | | | |
| Operations | | | | |
| Net investment income (loss) | $ | 115,897,689 | $ | 109,072,588 |
| Net realized gain (loss) | | 96,571,985 | | (7,662,446) |
| Change in net unrealized appreciation (depreciation) | | 1,112,367,701 | | 774,348,356 |
| Net increase (decrease) in net assets resulting from operations | | 1,324,837,375 | | 875,758,498 |
| Distributions to shareholders | | (124,139,814) | | (103,851,743) |
| | | | | |
| Affiliated share transactions | | | | |
| Proceeds from sales of shares | | 363,926,772 | | 1,101,921,798 |
| Reinvestment of distributions | | 124,139,814 | | 103,851,743 |
| Cost of shares redeemed | | (633,150,196) | | (583,628,102) |
| | | | | |
Net increase (decrease) in net assets resulting from share transactions | | (145,083,610) | | 622,145,439 |
| Total increase (decrease) in net assets | | 1,055,613,951 | | 1,394,052,194 |
| | | | | |
| Net Assets | | | | |
| Beginning of period | | 4,692,116,917 | | 3,298,064,723 |
| End of period | $ | 5,747,730,868 | $ | 4,692,116,917 |
| | | | | |
| Other Information | | | | |
| Shares | | | | |
| Sold | | 3,531,547 | | 12,617,963 |
| Issued in reinvestment of distributions | | 1,206,726 | | 1,145,589 |
| Redeemed | | (6,252,999) | | (6,599,034) |
| Net increase (decrease) | | (1,514,726) | | 7,164,518 |
| | | | | |
Financial Highlights
Fidelity® International Equity Central Fund |
| |
| Years ended September 30, | | 2024 | | 2023 | | 2022 | | 2021 | | 2020 |
Selected Per-Share Data | | | | | | | | | | |
| Net asset value, beginning of period | $ | 88.42 | $ | 71.85 | $ | 106.88 | $ | 84.62 | $ | 77.92 |
| Income from Investment Operations | | | | | | | | | | |
Net investment income (loss) A,B | | 2.23 | | 2.13 | | 2.07 | | 1.80 | | 1.40 |
| Net realized and unrealized gain (loss) | | 23.26 | | 16.42 | | (28.91) | | 22.17 | | 6.94 |
| Total from investment operations | | 25.49 | | 18.55 | | (26.84) | | 23.97 | | 8.34 |
| Distributions from net investment income | | (2.42) | | (1.98) | | (2.25) | | (1.71) | | (1.39) |
| Distributions from net realized gain | | - | | - | | (5.94) | | - | | (.25) |
| Total distributions | | (2.42) | | (1.98) | | (8.19) | | (1.71) | | (1.64) |
| Net asset value, end of period | $ | 111.49 | $ | 88.42 | $ | 71.85 | $ | 106.88 | $ | 84.62 |
Total Return C | | | | 25.78% | | (27.21)% | | 28.42% | | 10.91% |
Ratios to Average Net Assets B,D,E | | | | | | | | | | |
| Expenses before reductions | | .01% | | .01% | | .01% | | .01% | | .01% |
| Expenses net of fee waivers, if any | | | | .01% | | .01% | | .01% | | .01% |
| Expenses net of all reductions | | .01% | | .01% | | .01% | | .01% | | .01% |
| Net investment income (loss) | | 2.21% | | 2.39% | | 2.25% | | 1.79% | | 1.77% |
| Supplemental Data | | | | | | | | | | |
| Net assets, end of period (000 omitted) | $ | 5,747,731 | $ | 4,692,117 | $ | 3,298,065 | $ | 3,789,958 | $ | 3,020,929 |
Portfolio turnover rate F | | | | 40% | | 38% | | 52% | | 81% |
ACalculated based on average shares outstanding during the period.
BNet investment income (loss) is affected by the timing of the declaration of dividends by any underlying mutual funds or exchange-traded funds (ETFs). Net investment income (loss) of any mutual funds or ETFs is not included in the Fund's net investment income (loss) ratio.
CTotal returns would have been lower if certain expenses had not been reduced during the applicable periods shown.
DFees and expenses of any underlying mutual funds or exchange-traded funds (ETFs) are not included in the Fund's expense ratio. The Fund indirectly bears its proportionate share of these expenses. For additional expense information related to investments in Fidelity Central Funds, please refer to the "Investments in Fidelity Central Funds" note found in the Notes to Financial Statements section of the most recent Annual or Semi-Annual report.
EExpense ratios reflect operating expenses of the class. Expenses before reductions do not reflect amounts reimbursed, waived, or reduced through arrangements with the investment adviser, brokerage services, or other offset arrangements, if applicable, and do not represent the amount paid by the class during periods when reimbursements, waivers or reductions occur.
FAmount does not include the portfolio activity of any underlying mutual funds or exchange-traded funds (ETFs).
Notes to Financial Statements
For the period ended September 30, 2024
1. Organization.
Fidelity International Equity Central Fund (the Fund) is a fund of Fidelity Central Investment Portfolios LLC (the LLC) and is authorized to issue an unlimited number of shares. Shares of the Fund are only offered to other investment companies and accounts managed by Fidelity Management & Research Company LLC (FMR), or its affiliates (the Investing Funds). The LLC is registered under the Investment Company Act of 1940, as amended (the 1940 Act), as an open-end management investment company organized as a Delaware Limited Liability Company.
2. Investments in Fidelity Central Funds.
Funds may invest in Fidelity Central Funds, which are open-end investment companies generally available only to other investment companies and accounts managed by the investment adviser and its affiliates. The Schedule of Investments lists any Fidelity Central Funds held as an investment as of period end, but does not include the underlying holdings of each Fidelity Central Fund. An investing fund indirectly bears its proportionate share of the expenses of the underlying Fidelity Central Funds.
Based on its investment objective, each Fidelity Central Fund may invest or participate in various investment vehicles or strategies that are similar to those of the investing fund. These strategies are consistent with the investment objectives of the investing fund and may involve certain economic risks which may cause a decline in value of each of the Fidelity Central Funds and thus a decline in the value of the investing fund.
| Fidelity Central Fund | Investment Manager | Investment Objective | Investment Practices | Expense RatioA |
| Fidelity Money Market Central Funds | Fidelity Management & Research Company LLC (FMR) | Each fund seeks to obtain a high level of current income consistent with the preservation of capital and liquidity. | Short-term Investments | Less than .005% |
A Expenses expressed as a percentage of average net assets and are as of each underlying Central Fund's most recent annual or semi-annual shareholder report.
A complete unaudited list of holdings for each Fidelity Central Fund is available upon request or at the Securities and Exchange Commission website at www.sec.gov. In addition, the financial statements of the Fidelity Central Funds which contain the significant accounting policies (including investment valuation policies) of those funds, and are not covered by the Report of Independent Registered Public Accounting Firm, are available on the Securities and Exchange Commission website or upon request.
3. Significant Accounting Policies.
The Fund is an investment company and applies the accounting and reporting guidance of the Financial Accounting Standards Board (FASB) Accounting Standards Codification Topic 946 Financial Services - Investment Companies. The financial statements have been prepared in conformity with accounting principles generally accepted in the United States of America (GAAP), which require management to make certain estimates and assumptions at the date of the financial statements. Actual results could differ from those estimates. Subsequent events, if any, through the date that the financial statements were issued have been evaluated in the preparation of the financial statements. The Fund's Schedule of Investments lists any underlying mutual funds or exchange-traded funds (ETFs) but does not include the underlying holdings of these funds. The following summarizes the significant accounting policies of the Fund:
Investment Valuation. Investments are valued as of 4:00 p.m. Eastern time on the last calendar day of the period. The Board of Directors (the Board) has designated the Fund's investment adviser as the valuation designee responsible for the fair valuation function and performing fair value determinations as needed. The investment adviser has established a Fair Value Committee (the Committee) to carry out the day-to-day fair valuation responsibilities and has adopted policies and procedures to govern the fair valuation process and the activities of the Committee. In accordance with these fair valuation policies and procedures, which have been approved by the Board, the Fund attempts to obtain prices from one or more third party pricing services or brokers to value its investments. When current market prices, quotations or currency exchange rates are not readily available or reliable, investments will be fair valued in good faith by the Committee, in accordance with the policies and procedures. Factors used in determining fair value vary by investment type and may include market or investment specific events, transaction data, estimated cash flows, and market observations of comparable investments. The frequency that the fair valuation procedures are used cannot be predicted and they may be utilized to a significant extent. The Committee manages the Fund's fair valuation practices and maintains the fair valuation policies and procedures. The Fund's investment adviser reports to the Board information regarding the fair valuation process and related material matters.
The Fund categorizes the inputs to valuation techniques used to value its investments into a disclosure hierarchy consisting of three levels as shown below:
Level 1 - unadjusted quoted prices in active markets for identical investments
Level 2 - other significant observable inputs (including quoted prices for similar investments, interest rates, prepayment speeds, etc.)
Level 3 - unobservable inputs (including the Fund's own assumptions based on the best information available)
Valuation techniques used to value the Fund's investments by major category are as follows:
Equity securities, including restricted securities, for which market quotations are readily available, are valued at the last reported sale price or official closing price as reported by a third party pricing service on the primary market or exchange on which they are traded and are categorized as Level 1 in the hierarchy. In the event there were no sales during the day or closing prices are not available, securities are valued at the last quoted bid price or may be valued using the last available price and are generally categorized as Level 2 in the hierarchy. For foreign equity securities, when market or security specific events arise, comparisons to the valuation of American Depositary Receipts (ADRs), futures contracts, Exchange-Traded Funds (ETFs) and certain indexes as well as quoted prices for similar securities may be used and would be categorized as Level 2 in the hierarchy. For equity securities, including restricted securities, where observable inputs are limited, assumptions about market activity and risk are used and these securities may be categorized as Level 3 in the hierarchy.
Debt securities, including restricted securities, are valued based on evaluated prices received from third party pricing services or from brokers who make markets in such securities. U.S. government and government agency obligations are valued by pricing services who utilize matrix pricing which considers yield or price of bonds of comparable quality, coupon, maturity and type or by broker-supplied prices. When independent prices are unavailable or unreliable, debt securities may be valued utilizing pricing methodologies which consider similar factors that would be used by third party pricing services. Debt securities are generally categorized as Level 2 in the hierarchy but may be Level 3 depending on the circumstances.
Futures contracts are valued at the settlement price established each day by the board of trade or exchange on which they are traded and are categorized as Level 1 in the hierarchy. Investments in open-end mutual funds, including the Fidelity Central Funds, are valued at their closing net asset value (NAV) each business day and are categorized as Level 1 in the hierarchy.
Changes in valuation techniques may result in transfers in or out of an assigned level within the disclosure hierarchy. The aggregate value of investments by input level as of September 30, 2024 is included at the end of the Fund's Schedule of Investments.
Foreign Currency. Certain Funds may use foreign currency contracts to facilitate transactions in foreign-denominated securities. Gains and losses from these transactions may arise from changes in the value of the foreign currency or if the counterparties do not perform under the contracts' terms.
Foreign-denominated assets, including investment securities, and liabilities are translated into U.S. dollars at the exchange rates at period end. Purchases and sales of investment securities, income and dividends received, and expenses denominated in foreign currencies are translated into U.S. dollars at the exchange rate in effect on the transaction date.
The effects of exchange rate fluctuations on investments are included with the net realized and unrealized gain (loss) on investment securities. Other foreign currency transactions resulting in realized and unrealized gain (loss) are disclosed separately.
Investment Transactions and Income. For financial reporting purposes, the Fund's investment holdings and NAV include trades executed through the end of the last business day of the period. The NAV per share for processing shareholder transactions is calculated as of the close of business of the New York Stock Exchange (NYSE), normally 4:00 p.m. Eastern time and includes trades executed through the end of the prior business day. Gains and losses on securities sold are determined on the basis of identified cost and include proceeds received from litigation. Commissions paid to certain brokers with whom the investment adviser, or its affiliates, places trades on behalf of a fund include an amount in addition to trade execution, which may be rebated back to a fund. Any such rebates are included in net realized gain (loss) on investments in the Statement of Operations. Dividend income is recorded on the ex-dividend date, except for certain dividends from foreign securities where the ex-dividend date may have passed, which are recorded as soon as the Fund is informed of the ex-dividend date. Non-cash dividends included in dividend income, if any, are recorded at the fair market value of the securities received. Income and capital gain distributions from Fidelity Central Funds, if any, are recorded on the ex-dividend date. Certain distributions received by the Fund represent a return of capital or capital gain. The Fund determines the components of these distributions subsequent to the ex-dividend date, based upon receipt of tax filings or other correspondence relating to the underlying investment. These distributions are recorded as a reduction of cost of investments and/or as a realized gain. Interest income is accrued as earned and includes coupon interest and amortization of premium and accretion of discount on debt securities as applicable. Investment income is recorded net of foreign taxes withheld where recovery of such taxes is uncertain. Funds may file withholding tax reclaims in certain jurisdictions to recover a portion of amounts previously withheld. Any withholding tax reclaims income is included in the Statement of Operations in foreign taxes withheld. Any receivables for withholding tax reclaims are included in the Statement of Assets and Liabilities in reclaims receivable.
Expenses. Expenses directly attributable to a fund are charged to that fund. Expenses attributable to more than one fund are allocated among the respective funds on the basis of relative net assets or other appropriate methods. Expenses included in the accompanying financial statements reflect the expenses of that fund and do not include any expenses associated with any underlying mutual funds or exchange-traded funds. Although not included in a fund's expenses, a fund indirectly bears its proportionate share of these expenses through the net asset value of each underlying mutual fund or exchange-traded fund. Expense estimates are accrued in the period to which they relate and adjustments are made when actual amounts are known.
Income Tax Information and Distributions to Shareholders. Each year, the Fund intends to qualify as a regulated investment company under Subchapter M of the Internal Revenue Code, including distributing substantially all of its taxable income and realized gains. As a result, no provision for U.S. Federal income taxes is required. As of September 30, 2024, the Fund did not have any unrecognized tax benefits in the financial statements; nor is the Fund aware of any tax positions for which it is reasonably possible that the total amounts of unrecognized tax benefits will significantly change in the next twelve months. The Fund files a U.S. federal tax return, in addition to state and local tax returns as required. The Fund's federal income tax returns are subject to examination by the Internal Revenue Service (IRS) for a period of three fiscal years after they are filed. State and local tax returns may be subject to examination for an additional fiscal year depending on the jurisdiction. Foreign taxes are provided for based on the Fund's understanding of the tax rules and rates that exist in the foreign markets in which it invests. The Fund is subject to a tax imposed on capital gains by certain countries in which it invests. An estimated deferred tax liability for net unrealized appreciation on the applicable securities is included in Other payables and accrued expenses on the Statement of Assets and Liabilities.
Distributions are declared and recorded on the ex-dividend date. Income and capital gain distributions are determined in accordance with income tax regulations, which may differ from GAAP.
Capital accounts within the financial statements are adjusted for permanent book-tax differences. These adjustments have no impact on net assets or the results of operations. Capital accounts are not adjusted for temporary book-tax differences which will reverse in a subsequent period.
Book-tax differences are primarily due to futures contracts, foreign currency transactions, certain foreign taxes, passive foreign investment companies (PFIC), capital loss carryforwards and losses deferred due to wash sales.
As of period end, the cost and unrealized appreciation (depreciation) in securities, and derivatives if applicable, for federal income tax purposes were as follows:
| Gross unrealized appreciation | $1,726,456,938 |
| Gross unrealized depreciation | (49,156,363) |
| Net unrealized appreciation (depreciation) | $1,677,300,575 |
| Tax Cost | $4,057,376,573 |
The tax-based components of distributable earnings as of period end were as follows:
| Undistributed ordinary income | $53,958,720 |
| Capital loss carryforward | $(33,774,131) |
| Net unrealized appreciation (depreciation) on securities and other investments | $1,677,749,110 |
Capital loss carryforwards are only available to offset future capital gains of the Fund to the extent provided by regulations and may be limited. The capital loss carryforward information presented below, including any applicable limitation, is estimated as of fiscal period end and is subject to adjustment.
The tax character of distributions paid was as follows:
| | September 30, 2024 | September 30, 2023 |
| Ordinary Income | $124,139,814 | $103,851,743 |
Delayed Delivery Transactions and When-Issued Securities. During the period, certain Funds transacted in securities on a delayed delivery or when-issued basis. Payment and delivery may take place after the customary settlement period for that security. The price of the underlying securities and the date when the securities will be delivered and paid for are fixed at the time the transaction is negotiated. Securities purchased on a delayed delivery or when-issued basis are identified as such in the Schedule of Investments. Compensation for interest forgone in the purchase of a delayed delivery or when-issued debt security may be received. With respect to purchase commitments, each applicable Fund identifies securities as segregated in its records with a value at least equal to the amount of the commitment. Payables and receivables associated with the purchases and sales of delayed delivery securities having the same coupon, settlement date and broker are offset. Delayed delivery or when-issued securities that have been purchased from and sold to different brokers are reflected as both payables and receivables in the Statement of Assets and Liabilities under the caption "Delayed delivery", as applicable. Losses may arise due to changes in the value of the underlying securities or if the counterparty does not perform under the contract's terms, or if the issuer does not issue the securities due to political, economic, or other factors.
Restricted Securities (including Private Placements). Funds may invest in securities that are subject to legal or contractual restrictions on resale. These securities generally may be resold in transactions exempt from registration or to the public if the securities are registered. Disposal of these securities may involve time-consuming negotiations and expense, and prompt sale at an acceptable price may be difficult. Information regarding restricted securities held at period end is included at the end of the Schedule of Investments, if applicable.
4. Derivative Instruments.
Risk Exposures and the Use of Derivative Instruments. The Fund's investment objectives allow for various types of derivative instruments, including futures contracts. Derivatives are investments whose value is primarily derived from underlying assets, indices or reference rates and may be transacted on an exchange or over-the-counter (OTC). Derivatives may involve a future commitment to buy or sell a specified asset based on specified terms, to exchange future cash flows at periodic intervals based on a notional principal amount, or for one party to make one or more payments upon the occurrence of specified events in exchange for periodic payments from the other party.
Derivatives were used to increase returns and to manage exposure to certain risks as defined below. The success of any strategy involving derivatives depends on analysis of numerous economic factors, and if the strategies for investment do not work as intended, the objectives may not be achieved.
Derivatives were used to increase or decrease exposure to the following risk(s):
| | |
| Equity Risk | Equity risk relates to the fluctuations in the value of financial instruments as a result of changes in market prices (other than those arising from interest rate risk or foreign exchange risk), whether caused by factors specific to an individual investment, its issuer, or all factors affecting all instruments traded in a market or market segment. |
Funds are also exposed to additional risks from investing in derivatives, such as liquidity risk and counterparty credit risk. Liquidity risk is the risk that a fund will be unable to close out the derivative in the open market in a timely manner. Counterparty credit risk is the risk that the counterparty will not be able to fulfill its obligation to a fund. Counterparty credit risk related to exchange-traded contracts may be mitigated by the protection provided by the exchange on which they trade.
Investing in derivatives may involve greater risks than investing in the underlying assets directly and, to varying degrees, may involve risk of loss in excess of any initial investment and collateral received and amounts recognized in the Statement of Assets and Liabilities. In addition, there may be the risk that the change in value of the derivative contract does not correspond to the change in value of the underlying instrument.
Futures Contracts. A futures contract is an agreement between two parties to buy or sell a specified underlying instrument for a fixed price at a specified future date. Futures contracts were used to manage exposure to the stock market.
Upon entering into a futures contract, a fund is required to deposit either cash or securities (initial margin) with a clearing broker in an amount equal to a certain percentage of the face value of the contract. Futures contracts are marked-to-market daily and subsequent daily payments are made or received by a fund depending on the daily fluctuations in the value of the futures contracts and are recorded as unrealized appreciation or (depreciation). This receivable and/or payable, if any, is included in daily variation margin on futures contracts in the Statement of Assets and Liabilities. Realized gain or (loss) is recorded upon the expiration or closing of a futures contract. The net realized gain (loss) and change in net unrealized appreciation (depreciation) on futures contracts during the period is presented in the Statement of Operations.
Any open futures contracts at period end are presented in the Schedule of Investments under the caption "Futures Contracts". The notional amount at value reflects each contract's exposure to the underlying instrument or index at period end, and is representative of volume of activity during the period unless an average notional amount is presented. Any securities deposited to meet initial margin requirements are identified in the Schedule of Investments. Any cash deposited to meet initial margin requirements is presented as segregated cash with brokers for derivative instruments in the Statement of Assets and Liabilities.
5. Purchases and Sales of Investments.
Purchases and sales of securities, other than short-term securities, U.S. government securities and in-kind transactions, as applicable, are noted in the table below.
| | Purchases ($) | Sales ($) |
| Fidelity International Equity Central Fund | 1,794,000,911 | 1,962,920,452 |
6. Fees and Other Transactions with Affiliates.
Management Fee and Expense Contract. Fidelity Management & Research Company LLC (the investment adviser) provides the Fund with investment management services. The Fund does not pay any fees for these services. Pursuant to the Fund's expense contract, the investment adviser also pays all other expenses of the Fund, excluding custody fees, the compensation of the independent Directors, and certain miscellaneous expenses such as proxy and shareholder meeting expenses.
Brokerage Commissions. A portion of portfolio transactions were placed with brokerage firms which are affiliates of the investment adviser. Brokerage commissions are included in net realized gain (loss) and change in net unrealized appreciation (depreciation) in the Statement of Operations. The commissions paid to these affiliated firms were as follows:
| | Amount ($) |
| Fidelity International Equity Central Fund | 2,097 |
Interfund Trades. Funds may purchase from or sell securities to other Fidelity Funds under procedures adopted by the Board. The procedures have been designed to ensure these interfund trades are executed in accordance with Rule 17a-7 of the 1940 Act. Any interfund trades are included within the respective purchases and sales amounts shown in the Purchases and Sales of Investments note. Interfund trades during the period are noted in the table below.
| | Purchases ($) | Sales ($) | Realized Gain (Loss) ($) |
| Fidelity International Equity Central Fund | 26,704,044 | 111,555,632 | 12,466,417 |
Sub-Advisory Arrangements. Effective March 1, 2024, the Fund's sub-advisory agreements with FMR Investment Management (UK) Limited, Fidelity Management & Research (Hong Kong) Limited, and Fidelity Management & Research (Japan) Limited were amended to provide that the investment adviser pays each sub-adviser monthly fees equal to 110% of the sub-adviser's costs for providing sub-advisory services.
7. Security Lending.
Funds lend portfolio securities from time to time in order to earn additional income. Lending agents are used, including National Financial Services (NFS), an affiliate of the investment adviser. Pursuant to a securities lending agreement, NFS will receive a fee, which is capped at 9.9% of a fund's daily lending revenue, for its services as lending agent. A fund may lend securities to certain qualified borrowers, including NFS. On the settlement date of the loan, a fund receives collateral (in the form of U.S. Treasury obligations, letters of credit and/or cash) against the loaned securities and maintains collateral in an amount not less than 100% of the market value of the loaned securities during the period of the loan. The market value of the loaned securities is determined at the close of business of a fund and any additional required collateral is delivered to a fund on the next business day. A fund or borrower may terminate the loan at any time, and if the borrower defaults on its obligation to return the securities loaned because of insolvency or other reasons, a fund may apply collateral received from the borrower against the obligation. A fund may experience delays and costs in recovering the securities loaned. Any cash collateral received is invested in the Fidelity Securities Lending Cash Central Fund. Any loaned securities are identified as such in the Schedule of Investments, and the value of loaned securities and cash collateral at period end, as applicable, are presented in the Statement of Assets and Liabilities. Security lending income represents the income earned on investing cash collateral, less rebates paid to borrowers and any lending agent fees associated with the loan, plus any premium payments received for lending certain types of securities. Security lending income is presented in the Statement of Operations as a component of income from Fidelity Central Funds. Affiliated security lending activity, if any, was as follows:
| | Total Security Lending Fees Paid to NFS ($) | Security Lending Income From Securities Loaned to NFS ($) | Value of Securities Loaned to NFS at Period End ($) |
| Fidelity International Equity Central Fund | 20,891 | - | - |
8. Other.
A fund's organizational documents provide former and current directors and officers with a limited indemnification against liabilities arising in connection with the performance of their duties to the fund. In the normal course of business, a fund may also enter into contracts that provide general indemnifications. A fund's maximum exposure under these arrangements is unknown as this would be dependent on future claims that may be made against a fund. The risk of material loss from such claims is considered remote.
At the end of the period, mutual funds managed by the investment adviser or its affiliates were the owners of record of all of the outstanding shares of the Fund.
9. Risk and Uncertainties.
Many factors affect a fund's performance. Developments that disrupt global economies and financial markets, such as pandemics, epidemics, outbreaks of infectious diseases, war, terrorism, and environmental disasters, may significantly affect a fund's investment performance. The effects of these developments to a fund will be impacted by the types of securities in which a fund invests, the financial condition, industry, economic sector, and geographic location of an issuer, and a fund's level of investment in the securities of that issuer. Significant concentrations in security types, issuers, industries, sectors, and geographic locations may magnify the factors that affect a fund's performance.
Report of Independent Registered Public Accounting Firm
To the Board of Trustees of Fidelity Central Investment Portfolios LLC and the Shareholders of Fidelity International Equity Central Fund:
Opinion on the Financial Statements and Financial Highlights
We have audited the accompanying statement of assets and liabilities of Fidelity International Equity Central Fund (the "Fund"), a fund of Fidelity Central Investment Portfolios LLC, including the schedule of investments, as of September 30, 2024, the related statement of operations for the year then ended, the statement of changes in net assets for each of the two years in the period then ended, the financial highlights for each of the five years in the period then ended, and the related notes. In our opinion, the financial statements and financial highlights present fairly, in all material respects, the financial position of the Fund as of September 30, 2024, and the results of its operations for the year then ended, the changes in its net assets for each of the two years in the period then ended, and the financial highlights for each of the five years in the period then ended in conformity with accounting principles generally accepted in the United States of America.
Basis for Opinion
These financial statements and financial highlights are the responsibility of the Fund's management. Our responsibility is to express an opinion on the Fund's financial statements and financial highlights based on our audits. We are a public accounting firm registered with the Public Company Accounting Oversight Board (United States) (PCAOB) and are required to be independent with respect to the Fund in accordance with the U.S. federal securities laws and the applicable rules and regulations of the Securities and Exchange Commission and the PCAOB.
We conducted our audits in accordance with the standards of the PCAOB. Those standards require that we plan and perform the audit to obtain reasonable assurance about whether the financial statements and financial highlights are free of material misstatement, whether due to error or fraud. The Fund is not required to have, nor were we engaged to perform, an audit of its internal control over financial reporting. As part of our audits, we are required to obtain an understanding of internal control over financial reporting but not for the purpose of expressing an opinion on the effectiveness of the Fund's internal control over financial reporting. Accordingly, we express no such opinion.
Our audits included performing procedures to assess the risks of material misstatement of the financial statements and financial highlights, whether due to error or fraud, and performing procedures that respond to those risks. Such procedures included examining, on a test basis, evidence regarding the amounts and disclosures in the financial statements and financial highlights. Our audits also included evaluating the accounting principles used and significant estimates made by management, as well as evaluating the overall presentation of the financial statements and financial highlights. Our procedures included confirmation of securities owned as of September 30, 2024, by correspondence with the custodian and brokers; when replies were not received from brokers, we performed other auditing procedures. We believe that our audits provide a reasonable basis for our opinion.
/s/ Deloitte & Touche LLP
Boston, Massachusetts
November 13, 2024
We have served as the auditor of one or more of the Fidelity investment companies since 1999.
Distributions
(Unaudited)
The dividend and capital gains distributions for the fund(s) are available on Fidelity.com or Institutional.Fidelity.com.
The fund designates $4,333,329 of distributions paid during the fiscal year ended 2024 as qualifying to be taxed as section 163(j) interest dividends.
The fund designates 1%, 2%, 2%, and 2% of the dividends distributed in December, March, June, and September, respectively during the fiscal year as qualifying for the dividends-received deduction for corporate shareholders.
The fund designates 35.14%, 100%, 100%, and 100% of the dividends distributed in December, March, June and September, respectively during the fiscal year as amounts which may be taken into account as a dividend for the purposes of the maximum rate under section 1(h)(11) of the Internal Revenue Code.
The amounts per share which represent income derived from sources within, and taxes paid to, foreign countries or possessions of the United States are $0.6941 and $0.1747 for the dividend paid December 11, 2023.
The fund will notify shareholders in January 2025 of amounts for use in preparing 2024 income tax returns.
Item 8: Changes in and Disagreements with Accountants for Open-End Management Investment Companies
(Unaudited)
Note: This is not applicable for any fund included in this document.
Item 9: Proxy Disclosures for Open-End Management Investment Companies
(Unaudited)
| A special meeting of shareholders was held on July 16, 2024. The results of votes taken among shareholders on the proposal before them are reported below. Each vote reported represents one dollar of net asset value held on the record date for the meeting. |
| Proposal 1 |
| To elect a Board of Trustees. |
| | # of Votes | % of Votes |
| Bettina Doulton |
| Affirmative | 31,231,071,082.58 | 100.00 |
| Withheld | 0.00 | 0.00 |
| TOTAL | 31,231,071,082.58 | 100.00 |
| Robert A. Lawrence |
| Affirmative | 31,231,071,082.58 | 100.00 |
| Withheld | 0.00 | 0.00 |
| TOTAL | 31,231,071,082.58 | 100.00 |
| Vijay C. Advani |
| Affirmative | 31,231,071,082.58 | 100.00 |
| Withheld | 0.00 | 0.00 |
| TOTAL | 31,231,071,082.58 | 100.00 |
| Thomas P. Bostick |
| Affirmative | 31,231,071,082.58 | 100.00 |
| Withheld | 0.00 | 0.00 |
| TOTAL | 31,231,071,082.58 | 100.00 |
| Donald F. Donahue |
| Affirmative | 31,231,071,082.58 | 100.00 |
| Withheld | 0.00 | 0.00 |
| TOTAL | 31,231,071,082.58 | 100.00 |
| Vicki L. Fuller |
| Affirmative | 31,231,071,082.58 | 100.00 |
| Withheld | 0.00 | 0.00 |
| TOTAL | 31,231,071,082.58 | 100.00 |
| Patricia L. Kampling |
| Affirmative | 31,231,071,082.58 | 100.00 |
| Withheld | 0.00 | 0.00 |
| TOTAL | 31,231,071,082.58 | 100.00 |
| Thomas A. Kennedy |
| Affirmative | 31,231,071,082.58 | 100.00 |
| Withheld | 0.00 | 0.00 |
| TOTAL | 31,231,071,082.58 | 100.00 |
| Oscar Munoz |
| Affirmative | 31,231,071,082.58 | 100.00 |
| Withheld | 0.00 | 0.00 |
| TOTAL | 31,231,071,082.58 | 100.00 |
| Karen B. Peetz |
| Affirmative | 31,231,071,082.58 | 100.00 |
| Withheld | 0.00 | 0.00 |
| TOTAL | 31,231,071,082.58 | 100.00 |
| David M. Thomas |
| Affirmative | 31,231,071,082.58 | 100.00 |
| Withheld | 0.00 | 0.00 |
| TOTAL | 31,231,071,082.58 | 100.00 |
| Susan Tomasky |
| Affirmative | 31,231,071,082.58 | 100.00 |
| Withheld | 0.00 | 0.00 |
| TOTAL | 31,231,071,082.58 | 100.00 |
| Michael E. Wiley |
| Affirmative | 31,231,071,082.58 | 100.00 |
| Withheld | 0.00 | 0.00 |
| TOTAL | 31,231,071,082.58 | 100.00 |
| | | |
| Proposal 1 reflects trust-wide proposal and voting results. |
Item 10: Remuneration Paid to Directors, Officers, and others of Open-End Management Investment Companies
(Unaudited)
Note: This information is disclosed as part of the financial statements for each Fund as part of Item 7: Financial Statements and Financial Highlights for Open-End Management Investment companies.
Item 11: Statement Regarding Basis for Approval of Investment Advisory Contract
(Unaudited)
Board Approval of Investment Advisory Contracts and Management Fees
Fidelity International Equity Central Fund
Each year, the Board of Directors, including the Independent Directors (together, the Board), considers the renewal of the fund's management contract with Fidelity Management & Research Company LLC (FMR) and the sub-advisory agreements (together, the Advisory Contracts) for the fund. FMR and the sub-advisers are referred to herein as the Investment Advisers. The Board, assisted by the advice of fund counsel and Independent Directors' counsel, requests and considers a broad range of information relevant to the renewal of the Advisory Contracts throughout the year.
The Board meets regularly and, at each of its meetings, covers an extensive agenda of topics and materials and considers factors that are relevant to its annual consideration of the renewal of the fund's Advisory Contracts, including the services and support provided to the fund and its shareholders. The Board, acting directly and through its Committees (each of which is composed of and chaired by Independent Directors), requests and receives information concerning the annual consideration of the renewal of the fund's Advisory Contracts. The Board also meets as needed to review matters specifically related to the Board's annual consideration of the renewal of the Advisory Contracts. Members of the Board may also meet with trustees of other Fidelity funds through joint ad hoc committees to discuss certain matters relevant to all of the Fidelity funds.
At its May 2024 meeting, the Board unanimously determined to renew the fund's Advisory Contracts. In reaching its determination, the Board considered all factors it believed relevant and reached a determination, with the assistance of fund counsel and Independent Directors' counsel and through the exercise of its business judgment, that the renewal of the Advisory Contracts was in the best interests of the fund and its shareholders and the fact that no fee is payable under the management contract was fair and reasonable in light of all of the surrounding circumstances.
Nature, Extent, and Quality of Services Provided. The Board considered staffing as it relates to the fund, including the backgrounds and experience of investment personnel of the Investment Advisers, and also considered the Investment Advisers' implementation of the fund's investment program. The Independent Directors also had discussions with senior management of Fidelity's investment operations and investment groups. The Board considered the structure of the investment personnel compensation program and whether this structure provides appropriate incentives to act in the best interests of the fund.
Resources Dedicated to Investment Management and Support Services. The Board and the Fund Oversight and Research Committees reviewed the general qualifications and capabilities of Fidelity's investment staff, including its size, education, experience, and resources, as well as Fidelity's approach to recruiting, training, managing, and compensating investment personnel. The Board noted the resources devoted to expansion of Fidelity's global investment organization, and that Fidelity's analysts have extensive resources, tools, and capabilities that allow them to conduct sophisticated quantitative and fundamental analysis, as well as credit analysis of issuers, counterparties, and guarantors. Further, the Board considered that Fidelity's investment professionals have sufficient access to global information and data so as to provide competitive investment results over time, and that those professionals also have access to sophisticated tools that permit them to assess portfolio construction and risk and performance attribution characteristics continuously, as well as to transmit new information and research conclusions rapidly around the world. Additionally, in its deliberations, the Board considered Fidelity's trading, risk management, compliance, and technology and operations capabilities and resources, which are integral parts of the investment management process.
Administrative Services. The Board considered (i) the nature, extent, quality, and cost of advisory and administrative services performed by the Investment Advisers and their affiliates under the Advisory Contracts and under separate agreements covering transfer agency and pricing and bookkeeping services for the fund; (ii) the nature and extent of Fidelity's supervision of third party service providers, principally custodians, subcustodians, and pricing vendors; and (iii) the resources devoted by Fidelity to, and the record of compliance with, the fund's compliance policies and procedures. The Board also reviewed the allocation of fund brokerage, including allocations to brokers affiliated with the Investment Advisers, and the use of "soft" commission dollars to pay for research services. The Board also considered the fund's securities lending activities and any payments made to Fidelity relating to securities lending under a separate agreement.
Investment Performance. The Board reviewed the fund's absolute investment performance, as well as the fund's relative investment performance. The board noted that the fund is not publicly offered as a stand-alone investment product. In this regard, the Board noted that the fund is designed to offer a liquid investment option for other investment companies managed by Fidelity and ultimately to enhance the performance of those investment companies.
Based on its review, the Board concluded that the nature, extent, and quality of services provided to the fund under the Advisory Contracts should continue to benefit the shareholders of the fund.
Competitiveness of Management Fee and Total Expense Ratio. The Board considered that while the fund does not pay a management fee, FMR receives fees for providing services to funds that invest in the fund. The Board also noted that FMR bears all expenses of the fund with certain limited exceptions (i.e., custody fees, interest, taxes, fees and expenses of the Independent Directors, proxy and shareholder meeting expenses, and extraordinary expenses). The Board further noted that the fund pays its non-operating expenses, including brokerage commissions and fees and expenses associated with the fund's securities lending program, if applicable. Based on its review, the Board concluded that the management fee received for providing services to the fund and the fund's total expense ratio were reasonable in light of the services that the fund and its shareholders receive and the other factors considered.
Costs of the Services and Profitability. The Board considered the level of Fidelity's profits in respect of all the Fidelity funds, as well as the profitability of the funds that invest in the fund.
A public accounting firm has been engaged annually by the Board as part of the Board's assessment of Fidelity's profitability analysis. The engagement includes the review and assessment of the methodologies used by Fidelity in determining the revenues and expenses attributable to Fidelity's fund business, and completion of agreed-upon procedures in respect of the mathematical accuracy of certain fund profitability information and its conformity to established allocation methodologies. After considering the reports issued under the engagement and information provided by Fidelity, the Board concluded that while other allocation methods may also be reasonable, Fidelity's profitability methodologies are reasonable in all material respects.
The Board also reviewed Fidelity's non-fund businesses and potential indirect benefits such businesses may have received as a result of their association with Fidelity's fund business (i.e., fall-out benefits) as well as cases where Fidelity's affiliates may benefit from the funds' business. The Board considered areas where potential indirect benefits to the Fidelity funds from their relationships with Fidelity may exist. The Board's consideration of these matters was informed by the findings of a joint ad hoc committee created by it and the boards of other Fidelity funds to evaluate potential fall-out benefits.
The Board concluded that the costs of the services provided by and the profits realized by Fidelity in connection with the operation of the fund were not relevant to the renewal of the Advisory Contracts because the fund pays no advisory fees and FMR bears all expenses of the fund with certain exceptions.
Economies of Scale. The Board concluded that because the fund pays no advisory fees and FMR bears all expenses of the fund with certain exceptions, the realization of economies of scale was not a material factor in the Board's decision to renew the fund's Advisory Contract.
Additional Information Requested by the Board. In order to develop fully the factual basis for consideration of the Fidelity funds' advisory contracts, the Board requested and received additional information on certain topics, including but not limited to: (i) fund flow and performance trends, in particular the underperformance of certain funds and strategies, and Fidelity's long-term strategies for certain funds; (ii) the operation of performance fees and the rationale for implementing performance fees on certain categories of funds but not others; (iii) Fidelity's pricing philosophy compared to competitors; (iv) fund profitability methodology and data; (v) evaluation of competitive fund data and peer group classifications and fee and expense comparisons; (vi) the management fee and expense structures for different funds and classes and information about the differences between various fee and expense structures; (vii) the variable management fee implemented for certain funds effective March 1, 2024; and (viii) information regarding other accounts managed by Fidelity and the funds' sub-advisory arrangements.
Conclusion. Based on its evaluation of all of the conclusions noted above, and after considering all factors it believed relevant, the Board, including the Independent Directors, concluded that the advisory and sub-advisory fee arrangements are fair and reasonable in light of all of the surrounding circumstances and that the fund's Advisory Contracts should be renewed through May 31, 2025.
1.859208.116
INTCEN-ANN-1124
Fidelity® Real Estate Equity Central Fund
Annual Report
September 30, 2024
Contents
To view a fund's proxy voting guidelines and proxy voting record for the 12-month period ended June 30, visit http://www.fidelity.com/proxyvotingresults or visit the Securities and Exchange Commission's (SEC) web site at http://www.sec.gov.
You may also call 1-800-544-8544 to request a free copy of the proxy voting guidelines.
Standard & Poor's, S&P and S&P 500 are registered service marks of The McGraw-Hill Companies, Inc. and have been licensed for use by Fidelity Distributors Corporation.
Other third-party marks appearing herein are the property of their respective owners.
All other marks appearing herein are registered or unregistered trademarks or service marks of FMR LLC or an affiliated company. © 2024 FMR LLC. All rights reserved.
A fund files its complete schedule of portfolio holdings with the SEC for the first and third quarters of each fiscal year on Form N-PORT. Forms N-PORT are available on the SEC's web site at http://www.sec.gov. A fund's Forms N-PORT may be reviewed and copied at the SEC's Public Reference Room in Washington, DC. Information regarding the operation of the SEC's Public Reference Room may be obtained by calling 1-800-SEC-0330.
Item 7: Financial Statements and Financial Highlights for Open-End Management Investment Companies (Annual Report)
Fidelity® Real Estate Equity Central Fund
Schedule of Investments September 30, 2024
Showing Percentage of Net Assets
| Common Stocks - 98.8% |
| | | Shares | Value ($) |
| Equity Real Estate Investment Trusts (REITs) - 97.1% | | | |
| REITs - Apartments - 13.9% | | | |
| Essex Property Trust, Inc. | | 133,419 | 39,414,641 |
| Invitation Homes, Inc. | | 1,026,840 | 36,206,378 |
| Mid-America Apartment Communities, Inc. | | 242,600 | 38,549,140 |
| UDR, Inc. | | 673,782 | 30,549,276 |
| | | | 144,719,435 |
| REITs - Diversified - 15.0% | | | |
| Digital Realty Trust, Inc. | | 216,400 | 35,020,012 |
| Equinix, Inc. | | 115,438 | 102,466,232 |
| Lamar Advertising Co. Class A | | 143,759 | 19,206,202 |
| | | | 156,692,446 |
| REITs - Health Care - 11.5% | | | |
| Ventas, Inc. | | 1,088,294 | 69,792,294 |
| Welltower, Inc. | | 391,766 | 50,157,801 |
| | | | 119,950,095 |
| REITs - Health Care Facilities - 1.2% | | | |
| Omega Healthcare Investors, Inc. | | 313,500 | 12,759,450 |
| REITs - Hotels - 2.9% | | | |
| Ryman Hospitality Properties, Inc. | | 281,900 | 30,230,956 |
| REITs - Management/Investment - 3.9% | | | |
| American Tower Corp. | | 53,900 | 12,534,984 |
| NNN (REIT), Inc. | | 585,800 | 28,405,442 |
| | | | 40,940,426 |
| REITs - Manufactured Homes - 4.0% | | | |
| Equity Lifestyle Properties, Inc. | | 465,100 | 33,180,234 |
| Sun Communities, Inc. | | 63,400 | 8,568,510 |
| | | | 41,748,744 |
| REITs - Office Property - 1.6% | | | |
| Douglas Emmett, Inc. (a) | | 922,400 | 16,206,568 |
| REITs - Regional Malls - 3.5% | | | |
| Tanger, Inc. | | 875,400 | 29,045,772 |
| The Macerich Co. | | 391,563 | 7,142,109 |
| | | | 36,187,881 |
| REITs - Shopping Centers - 7.1% | | | |
| Federal Realty Investment Trust (SBI) | | 160,000 | 18,395,200 |
| SITE Centers Corp. | | 499,650 | 30,228,825 |
| Urban Edge Properties | | 1,201,500 | 25,700,085 |
| | | | 74,324,110 |
| REITs - Single Tenant - 4.9% | | | |
| Agree Realty Corp. | | 204,500 | 15,404,985 |
| Four Corners Property Trust, Inc. | | 1,221,800 | 35,810,958 |
| | | | 51,215,943 |
| REITs - Storage - 10.9% | | | |
| CubeSmart | | 972,919 | 52,372,230 |
| Public Storage Operating Co. | | 168,500 | 61,312,095 |
| | | | 113,684,325 |
| REITs - Warehouse/Industrial - 16.7% | | | |
| Americold Realty Trust | | 759,600 | 21,473,892 |
| EastGroup Properties, Inc. | | 136,900 | 25,575,658 |
| Prologis, Inc. | | 822,037 | 103,806,833 |
| Terreno Realty Corp. | | 346,516 | 23,157,664 |
| | | | 174,014,047 |
TOTAL EQUITY REAL ESTATE INVESTMENT TRUSTS (REITS) | | | 1,012,674,426 |
| Real Estate Management & Development - 1.7% | | | |
| Real Estate Services - 1.7% | | | |
| CBRE Group, Inc. (b) | | 137,900 | 17,165,792 |
| TOTAL COMMON STOCKS (Cost $767,743,492) | | | 1,029,840,218 |
| | | | |
| Money Market Funds - 1.0% |
| | | Shares | Value ($) |
| Fidelity Cash Central Fund 4.89% (c) | | 10,787,700 | 10,789,858 |
| Fidelity Securities Lending Cash Central Fund 4.89% (c)(d) | | 7,199 | 7,200 |
| TOTAL MONEY MARKET FUNDS (Cost $10,797,058) | | | 10,797,058 |
| | | | |
| TOTAL INVESTMENT IN SECURITIES - 99.8% (Cost $778,540,550) | 1,040,637,276 |
NET OTHER ASSETS (LIABILITIES) - 0.2% | 2,284,803 |
| NET ASSETS - 100.0% | 1,042,922,079 |
| | |
Legend
| (a) | Security or a portion of the security is on loan at period end. |
| (c) | Affiliated fund that is generally available only to investment companies and other accounts managed by Fidelity Investments. The rate quoted is the annualized seven-day yield of the fund at period end. A complete unaudited listing of the fund's holdings as of its most recent quarter end is available upon request. In addition, each Fidelity Central Fund's financial statements, which are not covered by the Fund's Report of Independent Registered Public Accounting Firm, are available on the SEC's website or upon request. |
| (d) | Investment made with cash collateral received from securities on loan. |
Affiliated Central Funds
Fiscal year to date information regarding the Fund's investments in Fidelity Central Funds, including the ownership percentage, is presented below.
| Affiliate | Value, beginning of period ($) | Purchases ($) | Sales Proceeds ($) | Dividend Income ($) | Realized Gain (loss) ($) | Change in Unrealized appreciation (depreciation) ($) | Value, end of period ($) | % ownership, end of period |
| Fidelity Cash Central Fund 4.89% | 5,033,543 | 262,452,970 | 256,696,752 | 339,677 | 97 | - | 10,789,858 | 0.0% |
| Fidelity Securities Lending Cash Central Fund 4.89% | 37,321,650 | 87,473,445 | 124,787,895 | 30,704 | - | - | 7,200 | 0.0% |
| Total | 42,355,193 | 349,926,415 | 381,484,647 | 370,381 | 97 | - | 10,797,058 | |
| | | | | | | | | |
Amounts in the dividend income column in the above table include any capital gain distributions from underlying funds, which are presented in the corresponding line item in the Statement of Operations, if applicable.
Amounts in the dividend income column for Fidelity Securities Lending Cash Central Fund represents the income earned on investing cash collateral, less rebates paid to borrowers and any lending agent fees associated with the loan, plus any premium payments received for lending certain types of securities.
Amounts included in the purchases and sales proceeds columns may include in-kind transactions, if applicable.
Investment Valuation
The following is a summary of the inputs used, as of September 30, 2024, involving the Fund's assets and liabilities carried at fair value. The inputs or methodology used for valuing securities may not be an indication of the risk associated with investing in those securities. For more information on valuation inputs, and their aggregation into the levels used below, please refer to the Investment Valuation section in the accompanying Notes to Financial Statements.
| Valuation Inputs at Reporting Date: |
| Description | Total ($) | Level 1 ($) | Level 2 ($) | Level 3 ($) |
Investments in Securities: | | | | |
|
| Common Stocks | 1,029,840,218 | 1,029,840,218 | - | - |
|
| Money Market Funds | 10,797,058 | 10,797,058 | - | - |
| Total Investments in Securities: | 1,040,637,276 | 1,040,637,276 | - | - |
Financial Statements
| Statement of Assets and Liabilities |
As of September 30, 2024 |
| Assets | | | | |
| Investment in securities, at value (including securities loaned of $7,028) - See accompanying schedule: | | | | |
Unaffiliated issuers (cost $767,743,492) | $ | 1,029,840,218 | | |
Fidelity Central Funds (cost $10,797,058) | | 10,797,058 | | |
| | | | | |
| | | | | |
| Total Investment in Securities (cost $778,540,550) | | | $ | 1,040,637,276 |
| Receivable for fund shares sold | | | | 811 |
| Dividends receivable | | | | 2,382,630 |
| Distributions receivable from Fidelity Central Funds | | | | 32,527 |
Total assets | | | | 1,043,053,244 |
| Liabilities | | | | |
| Payable for investments purchased | $ | 32,694 | | |
| Payable for fund shares redeemed | | 84,115 | | |
| Custody fee payable | | 7,150 | | |
| Other payables and accrued expenses | | 6 | | |
| Collateral on securities loaned | | 7,200 | | |
| Total liabilities | | | | 131,165 |
| Net Assets | | | $ | 1,042,922,079 |
| Net Assets consist of: | | | | |
| Paid in capital | | | $ | 861,461,348 |
| Total accumulated earnings (loss) | | | | 181,460,731 |
| Net Assets | | | $ | 1,042,922,079 |
Net Asset Value, offering price and redemption price per share ($1,042,922,079 ÷ 7,182,517 shares) | | | $ | 145.20 |
| Statement of Operations |
| Year ended September 30, 2024 |
| Investment Income | | | | |
| Dividends | | | $ | 29,907,529 |
| Income from Fidelity Central Funds (including $30,704 from security lending) | | | | 370,381 |
| Total income | | | | 30,277,910 |
| Expenses | | | | |
| Custodian fees and expenses | $ | 20,288 | | |
| Independent trustees' fees and expenses | | 4,569 | | |
| Interest | | 6,367 | | |
| Miscellaneous | | 5 | | |
| Total expenses | | | | 31,229 |
| Net Investment income (loss) | | | | 30,246,681 |
| Realized and Unrealized Gain (Loss) | | | | |
| Net realized gain (loss) on: | | | | |
| Investment Securities: | | | | |
| Unaffiliated issuers | | 17,261,986 | | |
| Fidelity Central Funds | | 97 | | |
| Total net realized gain (loss) | | | | 17,262,083 |
| Change in net unrealized appreciation (depreciation) on investment securities | | | | 238,634,165 |
| Net gain (loss) | | | | 255,896,248 |
| Net increase (decrease) in net assets resulting from operations | | | $ | 286,142,929 |
| Statement of Changes in Net Assets |
| |
| | Year ended September 30, 2024 | | Year ended September 30, 2023 |
| Increase (Decrease) in Net Assets | | | | |
| Operations | | | | |
| Net investment income (loss) | $ | 30,246,681 | $ | 34,206,052 |
| Net realized gain (loss) | | 17,262,083 | | (49,876,734) |
| Change in net unrealized appreciation (depreciation) | | 238,634,165 | | 60,896,493 |
| Net increase (decrease) in net assets resulting from operations | | 286,142,929 | | 45,225,811 |
| Distributions to shareholders | | (30,442,419) | | (29,797,466) |
| | | | | |
| Affiliated share transactions | | | | |
| Proceeds from sales of shares | | 82,643,139 | | 145,385,181 |
| Reinvestment of distributions | | 30,442,419 | | 29,797,466 |
| Cost of shares redeemed | | (251,765,739) | | (238,163,802) |
| | | | | |
Net increase (decrease) in net assets resulting from share transactions | | (138,680,181) | | (62,981,155) |
| Total increase (decrease) in net assets | | 117,020,329 | | (47,552,810) |
| | | | | |
| Net Assets | | | | |
| Beginning of period | | 925,901,750 | | 973,454,560 |
| End of period | $ | 1,042,922,079 | $ | 925,901,750 |
| | | | | |
| Other Information | | | | |
| Shares | | | | |
| Sold | | 676,561 | | 1,212,524 |
| Issued in reinvestment of distributions | | 240,793 | | 250,288 |
| Redeemed | | (1,998,384) | | (1,957,115) |
| Net increase (decrease) | | (1,081,030) | | (494,303) |
| | | | | |
Financial Highlights
Fidelity® Real Estate Equity Central Fund |
| |
| Years ended September 30, | | 2024 | | 2023 | | 2022 | | 2021 | | 2020 |
Selected Per-Share Data | | | | | | | | | | |
| Net asset value, beginning of period | $ | 112.05 | $ | 111.15 | $ | 141.00 | $ | 108.09 | $ | 124.43 |
| Income from Investment Operations | | | | | | | | | | |
Net investment income (loss) A,B | | 3.93 | | 4.22 | | 3.36 | | 3.33 | | 3.43 |
| Net realized and unrealized gain (loss) | | 33.21 | | .29 | | (30.20) | | 32.42 | | (16.47) |
| Total from investment operations | | 37.14 | | 4.51 | | (26.84) | | 35.75 | | (13.04) |
| Distributions from net investment income | | (3.99) | | (3.61) | | (3.01) | | (2.84) | | (3.30) |
| Total distributions | | (3.99) | | (3.61) | | (3.01) | | (2.84) | | (3.30) |
| Net asset value, end of period | $ | 145.20 | $ | 112.05 | $ | 111.15 | $ | 141.00 | $ | 108.09 |
Total Return C | | | | 3.90% | | (19.44)% | | 33.38% | | (10.48)% |
Ratios to Average Net Assets B,D,E | | | | | | | | | | |
Expenses before reductions F | | -% | | -% | | -% | | -% | | -% |
Expenses net of fee waivers, if any F | | | | -% | | -% | | -% | | -% |
Expenses net of all reductions F | | -% | | -% | | -% | | -% | | -% |
| Net investment income (loss) | | 3.13% | | 3.53% | | 2.36% | | 2.54% | | 3.05% |
| Supplemental Data | | | | | | | | | | |
| Net assets, end of period (000 omitted) | $ | 1,042,922 | $ | 925,902 | $ | 973,455 | $ | 1,632,601 | $ | 700,071 |
Portfolio turnover rate G | | | | 44% | | 56% | | 28% | | 84% H |
ACalculated based on average shares outstanding during the period.
BNet investment income (loss) is affected by the timing of the declaration of dividends by any underlying mutual funds or exchange-traded funds (ETFs). Net investment income (loss) of any mutual funds or ETFs is not included in the Fund's net investment income (loss) ratio.
CTotal returns would have been lower if certain expenses had not been reduced during the applicable periods shown.
DFees and expenses of any underlying mutual funds or exchange-traded funds (ETFs) are not included in the Fund's expense ratio. The Fund indirectly bears its proportionate share of these expenses. For additional expense information related to investments in Fidelity Central Funds, please refer to the "Investments in Fidelity Central Funds" note found in the Notes to Financial Statements section of the most recent Annual or Semi-Annual report.
EExpense ratios reflect operating expenses of the class. Expenses before reductions do not reflect amounts reimbursed, waived, or reduced through arrangements with the investment adviser, brokerage services, or other offset arrangements, if applicable, and do not represent the amount paid by the class during periods when reimbursements, waivers or reductions occur.
FAmount represents less than .005%.
GAmount does not include the portfolio activity of any underlying mutual funds or exchange-traded funds (ETFs).
HPortfolio turnover rate excludes securities received or delivered in-kind.
Notes to Financial Statements
For the period ended September 30, 2024
1. Organization.
Fidelity Real Estate Equity Central Fund (the Fund) is a non-diversified fund of Fidelity Central Investment Portfolios LLC (the LLC) and is authorized to issue an unlimited number of shares. Shares of the Fund are only offered to other investment companies and accounts managed by Fidelity Management & Research Company LLC (FMR), or its affiliates (the Investing Funds). The LLC is registered under the Investment Company Act of 1940, as amended (the 1940 Act), as an open-end management investment company organized as a Delaware Limited Liability Company.
2. Investments in Fidelity Central Funds.
Funds may invest in Fidelity Central Funds, which are open-end investment companies generally available only to other investment companies and accounts managed by the investment adviser and its affiliates. The Schedule of Investments lists any Fidelity Central Funds held as an investment as of period end, but does not include the underlying holdings of each Fidelity Central Fund. An investing fund indirectly bears its proportionate share of the expenses of the underlying Fidelity Central Funds.
Based on its investment objective, each Fidelity Central Fund may invest or participate in various investment vehicles or strategies that are similar to those of the investing fund. These strategies are consistent with the investment objectives of the investing fund and may involve certain economic risks which may cause a decline in value of each of the Fidelity Central Funds and thus a decline in the value of the investing fund.
| Fidelity Central Fund | Investment Manager | Investment Objective | Investment Practices | Expense RatioA |
| Fidelity Money Market Central Funds | Fidelity Management & Research Company LLC (FMR) | Each fund seeks to obtain a high level of current income consistent with the preservation of capital and liquidity. | Short-term Investments | Less than .005% |
A Expenses expressed as a percentage of average net assets and are as of each underlying Central Fund's most recent annual or semi-annual shareholder report.
A complete unaudited list of holdings for each Fidelity Central Fund is available upon request or at the Securities and Exchange Commission website at www.sec.gov. In addition, the financial statements of the Fidelity Central Funds which contain the significant accounting policies (including investment valuation policies) of those funds, and are not covered by the Report of Independent Registered Public Accounting Firm, are available on the Securities and Exchange Commission website or upon request.
3. Significant Accounting Policies.
The Fund is an investment company and applies the accounting and reporting guidance of the Financial Accounting Standards Board (FASB) Accounting Standards Codification Topic 946 Financial Services - Investment Companies. The financial statements have been prepared in conformity with accounting principles generally accepted in the United States of America (GAAP), which require management to make certain estimates and assumptions at the date of the financial statements. Actual results could differ from those estimates. Subsequent events, if any, through the date that the financial statements were issued have been evaluated in the preparation of the financial statements. The Fund's Schedule of Investments lists any underlying mutual funds or exchange-traded funds (ETFs) but does not include the underlying holdings of these funds. The following summarizes the significant accounting policies of the Fund:
Investment Valuation. Investments are valued as of 4:00 p.m. Eastern time on the last calendar day of the period. The Board of Directors (the Board) has designated the Fund's investment adviser as the valuation designee responsible for the fair valuation function and performing fair value determinations as needed. The investment adviser has established a Fair Value Committee (the Committee) to carry out the day-to-day fair valuation responsibilities and has adopted policies and procedures to govern the fair valuation process and the activities of the Committee. In accordance with these fair valuation policies and procedures, which have been approved by the Board, the Fund attempts to obtain prices from one or more third party pricing services or brokers to value its investments. When current market prices, quotations or currency exchange rates are not readily available or reliable, investments will be fair valued in good faith by the Committee, in accordance with the policies and procedures. Factors used in determining fair value vary by investment type and may include market or investment specific events, transaction data, estimated cash flows, and market observations of comparable investments. The frequency that the fair valuation procedures are used cannot be predicted and they may be utilized to a significant extent. The Committee manages the Fund's fair valuation practices and maintains the fair valuation policies and procedures. The Fund's investment adviser reports to the Board information regarding the fair valuation process and related material matters.
The Fund categorizes the inputs to valuation techniques used to value its investments into a disclosure hierarchy consisting of three levels as shown below:
Level 1 - unadjusted quoted prices in active markets for identical investments
Level 2 - other significant observable inputs (including quoted prices for similar investments, interest rates, prepayment speeds, etc.)
Level 3 - unobservable inputs (including the Fund's own assumptions based on the best information available)
Valuation techniques used to value the Fund's investments by major category are as follows:
Equity securities, including restricted securities, for which market quotations are readily available, are valued at the last reported sale price or official closing price as reported by a third party pricing service on the primary market or exchange on which they are traded and are categorized as Level 1 in the hierarchy. In the event there were no sales during the day or closing prices are not available, securities are valued at the last quoted bid price or may be valued using the last available price and are generally categorized as Level 2 in the hierarchy. For foreign equity securities, when market or security specific events arise, comparisons to the valuation of American Depositary Receipts (ADRs), futures contracts, Exchange-Traded Funds (ETFs) and certain indexes as well as quoted prices for similar securities may be used and would be categorized as Level 2 in the hierarchy. For equity securities, including restricted securities, where observable inputs are limited, assumptions about market activity and risk are used and these securities may be categorized as Level 3 in the hierarchy.
Investments in open-end mutual funds, including the Fidelity Central Funds, are valued at their closing net asset value (NAV) each business day and are categorized as Level 1 in the hierarchy.
Changes in valuation techniques may result in transfers in or out of an assigned level within the disclosure hierarchy. The aggregate value of investments by input level as of September 30, 2024 is included at the end of the Fund's Schedule of Investments.
Investment Transactions and Income. For financial reporting purposes, the Fund's investment holdings and NAV include trades executed through the end of the last business day of the period. The NAV per share for processing shareholder transactions is calculated as of the close of business of the New York Stock Exchange (NYSE), normally 4:00 p.m. Eastern time and includes trades executed through the end of the prior business day. Gains and losses on securities sold are determined on the basis of identified cost. Commissions paid to certain brokers with whom the investment adviser, or its affiliates, places trades on behalf of a fund include an amount in addition to trade execution, which may be rebated back to a fund. Any such rebates are included in net realized gain (loss) on investments in the Statement of Operations. Dividend income is recorded on the ex-dividend date, except for certain dividends from foreign securities where the ex-dividend date may have passed, which are recorded as soon as the Fund is informed of the ex-dividend date. Non-cash dividends included in dividend income, if any, are recorded at the fair market value of the securities received. Income and capital gain distributions from Fidelity Central Funds, if any, are recorded on the ex-dividend date. Certain distributions received by the Fund represent a return of capital or capital gain. The Fund determines the components of these distributions subsequent to the ex-dividend date, based upon receipt of tax filings or other correspondence relating to the underlying investment. These distributions are recorded as a reduction of cost of investments and/or as a realized gain.
Expenses. Expenses directly attributable to a fund are charged to that fund. Expenses attributable to more than one fund are allocated among the respective funds on the basis of relative net assets or other appropriate methods. Expenses included in the accompanying financial statements reflect the expenses of that fund and do not include any expenses associated with any underlying mutual funds or exchange-traded funds. Although not included in a fund's expenses, a fund indirectly bears its proportionate share of these expenses through the net asset value of each underlying mutual fund or exchange-traded fund. Expense estimates are accrued in the period to which they relate and adjustments are made when actual amounts are known.
Income Tax Information and Distributions to Shareholders. Each year, the Fund intends to qualify as a regulated investment company under Subchapter M of the Internal Revenue Code, including distributing substantially all of its taxable income and realized gains. As a result, no provision for U.S. Federal income taxes is required. As of September 30, 2024, the Fund did not have any unrecognized tax benefits in the financial statements; nor is the Fund aware of any tax positions for which it is reasonably possible that the total amounts of unrecognized tax benefits will significantly change in the next twelve months. The Fund files a U.S. federal tax return, in addition to state and local tax returns as required. The Fund's federal income tax returns are subject to examination by the Internal Revenue Service (IRS) for a period of three fiscal years after they are filed. State and local tax returns may be subject to examination for an additional fiscal year depending on the jurisdiction.
Distributions are declared and recorded on the ex-dividend date. Income and capital gain distributions are determined in accordance with income tax regulations, which may differ from GAAP.
Capital accounts within the financial statements are adjusted for permanent book-tax differences. These adjustments have no impact on net assets or the results of operations. Capital accounts are not adjusted for temporary book-tax differences which will reverse in a subsequent period.
Book-tax differences are primarily due to capital loss carryforwards and losses deferred due to wash sales.
As of period end, the cost and unrealized appreciation (depreciation) in securities, and derivatives if applicable, for federal income tax purposes were as follows:
| Gross unrealized appreciation | $262,594,219 |
| Gross unrealized depreciation | (3,258,806) |
| Net unrealized appreciation (depreciation) | $259,335,413 |
| Tax Cost | $781,301,863 |
The tax-based components of distributable earnings as of period end were as follows:
| Undistributed ordinary income | $3,794,143 |
| Capital loss carryforward | $(81,668,825) |
| Net unrealized appreciation (depreciation) on securities and other investments | $259,335,413 |
Capital loss carryforwards are only available to offset future capital gains of the Fund to the extent provided by regulations and may be limited. The capital loss carryforward information presented below, including any applicable limitation, is estimated as of fiscal period end and is subject to adjustment.
| Short-term | $(65,576,953) |
| Long-term | (16,091,872) |
| Total capital loss carryforward | $(81,668,825) |
The tax character of distributions paid was as follows:
| | September 30, 2024 | September 30, 2023 |
| Ordinary Income | $30,442,419 | $ 29,797,466 |
4. Purchases and Sales of Investments.
Purchases and sales of securities, other than short-term securities and in-kind transactions, as applicable, are noted in the table below.
| | Purchases ($) | Sales ($) |
| Fidelity Real Estate Equity Central Fund | 370,306,170 | 509,157,056 |
5. Fees and Other Transactions with Affiliates.
Management Fee and Expense Contract. Fidelity Management & Research Company LLC (the investment adviser) provides the Fund with investment management services. The Fund does not pay any fees for these services. Pursuant to the Fund's expense contract, the investment adviser also pays all other expenses of the Fund, excluding custody fees, the compensation of the independent Directors, and certain miscellaneous expenses such as proxy and shareholder meeting expenses.
Brokerage Commissions. A portion of portfolio transactions were placed with brokerage firms which are affiliates of the investment adviser. Brokerage commissions are included in net realized gain (loss) and change in net unrealized appreciation (depreciation) in the Statement of Operations. The commissions paid to these affiliated firms were as follows:
| | Amount ($) |
| Fidelity Real Estate Equity Central Fund | 6,560 |
Interfund Lending Program. Pursuant to an Exemptive Order issued by the Securities and Exchange Commission (the SEC), the Fund, along with other registered investment companies having management contracts with FMR, or other affiliated entities of FMR, may participate in an interfund lending program. This program provides an alternative credit facility allowing the Fund to borrow from, or lend money to, other participating affiliated funds. At period end, there were no interfund loans outstanding. Activity in this program during the period for which loans were outstanding was as follows:
| | Borrower or Lender | Average Loan Balance ($) | Weighted Average Interest Rate | Interest Expense ($) |
| Fidelity Real Estate Equity Central Fund | Borrower | 8,225,000 | 5.57% | 6,367 |
Interfund Trades. Funds may purchase from or sell securities to other Fidelity Funds under procedures adopted by the Board. The procedures have been designed to ensure these interfund trades are executed in accordance with Rule 17a-7 of the 1940 Act. Any interfund trades are included within the respective purchases and sales amounts shown in the Purchases and Sales of Investments note. Interfund trades during the period are noted in the table below.
| | Purchases ($) | Sales ($) | Realized Gain (Loss)($) |
| Fidelity Real Estate Equity Central Fund | 37,750,470 | 35,707,605 | 2,673,351 |
Sub-Advisory Arrangements. Effective March 1, 2024, the Fund's sub-advisory agreements with FMR Investment Management (UK) Limited, Fidelity Management & Research (Hong Kong) Limited, and Fidelity Management & Research (Japan) Limited were amended to provide that the investment adviser pays each sub-adviser monthly fees equal to 110% of the sub-adviser's costs for providing sub-advisory services.
6. Security Lending.
Funds lend portfolio securities from time to time in order to earn additional income. Lending agents are used, including National Financial Services (NFS), an affiliate of the investment adviser. Pursuant to a securities lending agreement, NFS will receive a fee, which is capped at 9.9% of a fund's daily lending revenue, for its services as lending agent. A fund may lend securities to certain qualified borrowers, including NFS. On the settlement date of the loan, a fund receives collateral (in the form of U.S. Treasury obligations, letters of credit and/or cash) against the loaned securities and maintains collateral in an amount not less than 100% of the market value of the loaned securities during the period of the loan. The market value of the loaned securities is determined at the close of business of a fund and any additional required collateral is delivered to a fund on the next business day. A fund or borrower may terminate the loan at any time, and if the borrower defaults on its obligation to return the securities loaned because of insolvency or other reasons, a fund may apply collateral received from the borrower against the obligation. A fund may experience delays and costs in recovering the securities loaned. Any cash collateral received is invested in the Fidelity Securities Lending Cash Central Fund. Any loaned securities are identified as such in the Schedule of Investments, and the value of loaned securities and cash collateral at period end, as applicable, are presented in the Statement of Assets and Liabilities. Security lending income represents the income earned on investing cash collateral, less rebates paid to borrowers and any lending agent fees associated with the loan, plus any premium payments received for lending certain types of securities. Security lending income is presented in the Statement of Operations as a component of income from Fidelity Central Funds. Affiliated security lending activity, if any, was as follows:
| | Total Security Lending Fees Paid to NFS ($) | Security Lending Income From Securities Loaned to NFS ($) | Value of Securities Loaned to NFS at Period End ($) |
| Fidelity Real Estate Equity Central Fund | 3,310 | 1 | - |
7. Other.
A fund's organizational documents provide former and current directors and officers with a limited indemnification against liabilities arising in connection with the performance of their duties to the fund. In the normal course of business, a fund may also enter into contracts that provide general indemnifications. A fund's maximum exposure under these arrangements is unknown as this would be dependent on future claims that may be made against a fund. The risk of material loss from such claims is considered remote.
At the end of the period, mutual funds managed by the investment adviser or its affiliates were the owners of record of all of the outstanding shares of the Fund.
8. Risk and Uncertainties.
Many factors affect a fund's performance. Developments that disrupt global economies and financial markets, such as pandemics, epidemics, outbreaks of infectious diseases, war, terrorism, and environmental disasters, may significantly affect a fund's investment performance. The effects of these developments to a fund will be impacted by the types of securities in which a fund invests, the financial condition, industry, economic sector, and geographic location of an issuer, and a fund's level of investment in the securities of that issuer. Significant concentrations in security types, issuers, industries, sectors, and geographic locations may magnify the factors that affect a fund's performance.
Report of Independent Registered Public Accounting Firm
To the Board of Trustees of Fidelity Central Investment Portfolios LLC and the Shareholders of Fidelity Real Estate Equity Central Fund:
Opinion on the Financial Statements and Financial Highlights
We have audited the accompanying statement of assets and liabilities of Fidelity Real Estate Equity Central Fund (the "Fund"), a fund of Fidelity Central Investment Portfolios LLC, including the schedule of investments, as of September 30, 2024, the related statement of operations for the year then ended, the statement of changes in net assets for each of the two years in the period then ended, the financial highlights for each of the five years in the period then ended, and the related notes. In our opinion, the financial statements and financial highlights present fairly, in all material respects, the financial position of the Fund as of September 30, 2024, and the results of its operations for the year then ended, the changes in its net assets for each of the two years in the period then ended, and the financial highlights for each of the five years in the period then ended in conformity with accounting principles generally accepted in the United States of America.
Basis for Opinion
These financial statements and financial highlights are the responsibility of the Fund's management. Our responsibility is to express an opinion on the Fund's financial statements and financial highlights based on our audits. We are a public accounting firm registered with the Public Company Accounting Oversight Board (United States) (PCAOB) and are required to be independent with respect to the Fund in accordance with the U.S. federal securities laws and the applicable rules and regulations of the Securities and Exchange Commission and the PCAOB.
We conducted our audits in accordance with the standards of the PCAOB. Those standards require that we plan and perform the audit to obtain reasonable assurance about whether the financial statements and financial highlights are free of material misstatement, whether due to error or fraud. The Fund is not required to have, nor were we engaged to perform, an audit of its internal control over financial reporting. As part of our audits, we are required to obtain an understanding of internal control over financial reporting but not for the purpose of expressing an opinion on the effectiveness of the Fund's internal control over financial reporting. Accordingly, we express no such opinion.
Our audits included performing procedures to assess the risks of material misstatement of the financial statements and financial highlights, whether due to error or fraud, and performing procedures that respond to those risks. Such procedures included examining, on a test basis, evidence regarding the amounts and disclosures in the financial statements and financial highlights. Our audits also included evaluating the accounting principles used and significant estimates made by management, as well as evaluating the overall presentation of the financial statements and financial highlights. Our procedures included confirmation of securities owned as of September 30, 2024, by correspondence with the custodian and brokers; when replies were not received from brokers, we performed other auditing procedures. We believe that our audits provide a reasonable basis for our opinion.
/s/ Deloitte & Touche LLP
Boston, Massachusetts
November 13, 2024
We have served as the auditor of one or more of the Fidelity investment companies since 1999.
Distributions
(Unaudited)
The dividend and capital gains distributions for the fund(s) are available on Fidelity.com or Institutional.Fidelity.com.
The fund designates $345,675 of distributions paid during the fiscal year ended 2024 as qualifying to be taxed as section 163(j) interest dividends.
The fund designates 92.10%, 100%, and 100%, of the dividends distributed in December, June, and September, respectively during the fiscal year as a section 199A dividend.
The fund will notify shareholders in January 2025 of amounts for use in preparing 2024 income tax returns.
Item 8: Changes in and Disagreements with Accountants for Open-End Management Investment Companies
(Unaudited)
Note: This is not applicable for any fund included in this document.
Item 9: Proxy Disclosures for Open-End Management Investment Companies
(Unaudited)
| A special meeting of shareholders was held on July 16, 2024. The results of votes taken among shareholders on the proposal before them are reported below. Each vote reported represents one dollar of net asset value held on the record date for the meeting. |
| Proposal 1 |
| To elect a Board of Trustees. |
| | # of Votes | % of Votes |
| Bettina Doulton |
| Affirmative | 31,231,071,082.58 | 100.00 |
| Withheld | 0.00 | 0.00 |
| TOTAL | 31,231,071,082.58 | 100.00 |
| Robert A. Lawrence |
| Affirmative | 31,231,071,082.58 | 100.00 |
| Withheld | 0.00 | 0.00 |
| TOTAL | 31,231,071,082.58 | 100.00 |
| Vijay C. Advani |
| Affirmative | 31,231,071,082.58 | 100.00 |
| Withheld | 0.00 | 0.00 |
| TOTAL | 31,231,071,082.58 | 100.00 |
| Thomas P. Bostick |
| Affirmative | 31,231,071,082.58 | 100.00 |
| Withheld | 0.00 | 0.00 |
| TOTAL | 31,231,071,082.58 | 100.00 |
| Donald F. Donahue |
| Affirmative | 31,231,071,082.58 | 100.00 |
| Withheld | 0.00 | 0.00 |
| TOTAL | 31,231,071,082.58 | 100.00 |
| Vicki L. Fuller |
| Affirmative | 31,231,071,082.58 | 100.00 |
| Withheld | 0.00 | 0.00 |
| TOTAL | 31,231,071,082.58 | 100.00 |
| Patricia L. Kampling |
| Affirmative | 31,231,071,082.58 | 100.00 |
| Withheld | 0.00 | 0.00 |
| TOTAL | 31,231,071,082.58 | 100.00 |
| Thomas A. Kennedy |
| Affirmative | 31,231,071,082.58 | 100.00 |
| Withheld | 0.00 | 0.00 |
| TOTAL | 31,231,071,082.58 | 100.00 |
| Oscar Munoz |
| Affirmative | 31,231,071,082.58 | 100.00 |
| Withheld | 0.00 | 0.00 |
| TOTAL | 31,231,071,082.58 | 100.00 |
| Karen B. Peetz |
| Affirmative | 31,231,071,082.58 | 100.00 |
| Withheld | 0.00 | 0.00 |
| TOTAL | 31,231,071,082.58 | 100.00 |
| David M. Thomas |
| Affirmative | 31,231,071,082.58 | 100.00 |
| Withheld | 0.00 | 0.00 |
| TOTAL | 31,231,071,082.58 | 100.00 |
| Susan Tomasky |
| Affirmative | 31,231,071,082.58 | 100.00 |
| Withheld | 0.00 | 0.00 |
| TOTAL | 31,231,071,082.58 | 100.00 |
| Michael E. Wiley |
| Affirmative | 31,231,071,082.58 | 100.00 |
| Withheld | 0.00 | 0.00 |
| TOTAL | 31,231,071,082.58 | 100.00 |
| | | |
| Proposal 1 reflects trust-wide proposal and voting results. |
Item 10: Remuneration Paid to Directors, Officers, and others of Open-End Management Investment Companies
(Unaudited)
Note: This information is disclosed as part of the financial statements for each Fund as part of Item 7: Financial Statements and Financial Highlights for Open-End Management Investment companies.
Item 11: Statement Regarding Basis for Approval of Investment Advisory Contract
(Unaudited)
Board Approval of Investment Advisory Contracts and Management Fees
Fidelity Real Estate Equity Central Fund
Each year, the Board of Directors, including the Independent Directors (together, the Board), considers the renewal of the fund's management contract with Fidelity Management & Research Company LLC (FMR) and the sub-advisory agreements (together, the Advisory Contracts) for the fund. FMR and the sub-advisers are referred to herein as the Investment Advisers. The Board, assisted by the advice of fund counsel and Independent Directors' counsel, requests and considers a broad range of information relevant to the renewal of the Advisory Contracts throughout the year.
The Board meets regularly and, at each of its meetings, covers an extensive agenda of topics and materials and considers factors that are relevant to its annual consideration of the renewal of the fund's Advisory Contracts, including the services and support provided to the fund and its shareholders. The Board, acting directly and through its Committees (each of which is composed of and chaired by Independent Directors), requests and receives information concerning the annual consideration of the renewal of the fund's Advisory Contracts. The Board also meets as needed to review matters specifically related to the Board's annual consideration of the renewal of the Advisory Contracts. Members of the Board may also meet with trustees of other Fidelity funds through joint ad hoc committees to discuss certain matters relevant to all of the Fidelity funds.
At its May 2024 meeting, the Board unanimously determined to renew the fund's Advisory Contracts. In reaching its determination, the Board considered all factors it believed relevant and reached a determination, with the assistance of fund counsel and Independent Directors' counsel and through the exercise of its business judgment, that the renewal of the Advisory Contracts was in the best interests of the fund and its shareholders and the fact that no fee is payable under the management contract was fair and reasonable in light of all of the surrounding circumstances.
Nature, Extent, and Quality of Services Provided. The Board considered staffing as it relates to the fund, including the backgrounds and experience of investment personnel of the Investment Advisers, and also considered the Investment Advisers' implementation of the fund's investment program. The Independent Directors also had discussions with senior management of Fidelity's investment operations and investment groups. The Board considered the structure of the investment personnel compensation program and whether this structure provides appropriate incentives to act in the best interests of the fund.
Resources Dedicated to Investment Management and Support Services. The Board and the Fund Oversight and Research Committees reviewed the general qualifications and capabilities of Fidelity's investment staff, including its size, education, experience, and resources, as well as Fidelity's approach to recruiting, training, managing, and compensating investment personnel. The Board noted the resources devoted to expansion of Fidelity's global investment organization, and that Fidelity's analysts have extensive resources, tools, and capabilities that allow them to conduct sophisticated quantitative and fundamental analysis, as well as credit analysis of issuers, counterparties, and guarantors. Further, the Board considered that Fidelity's investment professionals have sufficient access to global information and data so as to provide competitive investment results over time, and that those professionals also have access to sophisticated tools that permit them to assess portfolio construction and risk and performance attribution characteristics continuously, as well as to transmit new information and research conclusions rapidly around the world. Additionally, in its deliberations, the Board considered Fidelity's trading, risk management, compliance, and technology and operations capabilities and resources, which are integral parts of the investment management process.
Administrative Services. The Board considered (i) the nature, extent, quality, and cost of advisory and administrative services performed by the Investment Advisers and their affiliates under the Advisory Contracts and under separate agreements covering transfer agency and pricing and bookkeeping services for the fund; (ii) the nature and extent of Fidelity's supervision of third party service providers, principally custodians, subcustodians, and pricing vendors; and (iii) the resources devoted by Fidelity to, and the record of compliance with, the fund's compliance policies and procedures. The Board also reviewed the allocation of fund brokerage, including allocations to brokers affiliated with the Investment Advisers, and the use of "soft" commission dollars to pay for research services. The Board also considered the fund's securities lending activities and any payments made to Fidelity relating to securities lending under a separate agreement.
Investment Performance. The Board reviewed the fund's absolute investment performance, as well as the fund's relative investment performance. The Board noted that the fund is not publicly offered as a stand-alone investment product. In this regard, the Board noted that the fund is designed to offer a liquid investment option for other investment companies managed by Fidelity and ultimately to enhance the performance of those investment companies.
Based on its review, the Board concluded that the nature, extent, and quality of services provided to the fund under the Advisory Contracts should continue to benefit the shareholders of the fund.
Competitiveness of Management Fee and Total Expense Ratio. The Board considered that while the fund does not pay a management fee, FMR receives fees for providing services to funds that invest in the fund. The Board also noted that FMR bears all expenses of the fund with certain limited exceptions (i.e., custody fees, interest, taxes, fees and expenses of the Independent Directors, proxy and shareholder meeting expenses, and extraordinary expenses). The Board further noted that the fund pays its non-operating expenses, including brokerage commissions and fees and expenses associated with the fund's securities lending program, if applicable. Based on its review, the Board concluded that the management fee received for providing services to the fund and the fund's total expense ratio were reasonable in light of the services that the fund and its shareholders receive and the other factors considered.
Costs of the Services and Profitability. The Board considered the level of Fidelity's profits in respect of all the Fidelity funds, as well as the profitability of the funds that invest in the fund.
A public accounting firm has been engaged annually by the Board as part of the Board's assessment of Fidelity's profitability analysis. The engagement includes the review and assessment of the methodologies used by Fidelity in determining the revenues and expenses attributable to Fidelity's fund business, and completion of agreed-upon procedures in respect of the mathematical accuracy of certain fund profitability information and its conformity to established allocation methodologies. After considering the reports issued under the engagement and information provided by Fidelity, the Board concluded that while other allocation methods may also be reasonable, Fidelity's profitability methodologies are reasonable in all material respects.
The Board also reviewed Fidelity's non-fund businesses and potential indirect benefits such businesses may have received as a result of their association with Fidelity's fund business (i.e., fall-out benefits) as well as cases where Fidelity's affiliates may benefit from the funds' business. The Board considered areas where potential indirect benefits to the Fidelity funds from their relationships with Fidelity may exist. The Board's consideration of these matters was informed by the findings of a joint ad hoc committee created by it and the boards of other Fidelity funds to evaluate potential fall-out benefits.
The Board concluded that the costs of the services provided by and the profits realized by Fidelity in connection with the operation of the fund were not relevant to the renewal of the Advisory Contracts because the fund pays no advisory fees and FMR bears all expenses of the fund with certain exceptions.
Economies of Scale. The Board concluded that because the fund pays no advisory fees and FMR bears all expenses of the fund with certain exceptions, the realization of economies of scale was not a material factor in the Board's decision to renew the fund's Advisory Contract.
Additional Information Requested by the Board. In order to develop fully the factual basis for consideration of the Fidelity funds' advisory contracts, the Board requested and received additional information on certain topics, including but not limited to: (i) fund flow and performance trends, in particular the underperformance of certain funds and strategies, and Fidelity's long-term strategies for certain funds; (ii) the operation of performance fees and the rationale for implementing performance fees on certain categories of funds but not others; (iii) Fidelity's pricing philosophy compared to competitors; (iv) fund profitability methodology and data; (v) evaluation of competitive fund data and peer group classifications and fee and expense comparisons; (vi) the management fee and expense structures for different funds and classes and information about the differences between various fee and expense structures; (vii) the variable management fee implemented for certain funds effective March 1, 2024; and (viii) information regarding other accounts managed by Fidelity and the funds' sub-advisory arrangements.
Conclusion. Based on its evaluation of all of the conclusions noted above, and after considering all factors it believed relevant, the Board, including the Independent Directors, concluded that the advisory and sub-advisory fee arrangements are fair and reasonable in light of all of the surrounding circumstances and that the fund's Advisory Contracts should be renewed through May 31, 2025.
1.831584.118
ESCIP-ANN-1124
Fidelity® Floating Rate Central Fund
Annual Report
September 30, 2024
Contents
To view a fund's proxy voting guidelines and proxy voting record for the 12-month period ended June 30, visit http://www.fidelity.com/proxyvotingresults or visit the Securities and Exchange Commission's (SEC) web site at http://www.sec.gov.
You may also call 1-800-544-8544 to request a free copy of the proxy voting guidelines.
Standard & Poor's, S&P and S&P 500 are registered service marks of The McGraw-Hill Companies, Inc. and have been licensed for use by Fidelity Distributors Corporation.
Other third-party marks appearing herein are the property of their respective owners.
All other marks appearing herein are registered or unregistered trademarks or service marks of FMR LLC or an affiliated company. © 2024 FMR LLC. All rights reserved.
A fund files its complete schedule of portfolio holdings with the SEC for the first and third quarters of each fiscal year on Form N-PORT. Forms N-PORT are available on the SEC's web site at http://www.sec.gov. A fund's Forms N-PORT may be reviewed and copied at the SEC's Public Reference Room in Washington, DC. Information regarding the operation of the SEC's Public Reference Room may be obtained by calling 1-800-SEC-0330.
Item 7: Financial Statements and Financial Highlights for Open-End Management Investment Companies (Annual Report)
Fidelity® Floating Rate Central Fund
Schedule of Investments September 30, 2024
Showing Percentage of Net Assets
| Bank Loan Obligations - 86.8% |
| | | Principal Amount (a) | Value ($) |
| Aerospace - 0.8% | | | |
| Bleriot U.S. Bidco, Inc. Tranche B 1LN, term loan CME Term SOFR 3 Month Index + 4.250% 7.8537% 10/31/30 (b)(c)(d) | | 663,338 | 663,477 |
| Gemini HDPE LLC Tranche B 1LN, term loan CME Term SOFR 3 Month Index + 3.000% 8.5137% 12/31/27 (b)(c)(d) | | 1,141,027 | 1,143,880 |
| Ovation Parent, Inc. Tranche B 1LN, term loan CME Term SOFR 3 Month Index + 3.500% 8.1037% 4/21/31 (b)(c)(d) | | 1,415,000 | 1,419,132 |
| TransDigm, Inc.: | | | |
| Tranche I 1LN, term loan CME Term SOFR 3 Month Index + 2.750% 7.3537% 8/24/28 (b)(c)(d) | | 6,379,653 | 6,375,379 |
| Tranche K 1LN, term loan CME Term SOFR 3 Month Index + 2.750% 7.3537% 3/22/30 (b)(c)(d) | | 363,287 | 363,175 |
| Tranche L 1LN, term loan CME Term SOFR 1 Month Index + 2.500% 7.3196% 1/19/32 (b)(c)(d) | | 2,205,000 | 2,195,805 |
TOTAL AEROSPACE | | | 12,160,848 |
| Air Transportation - 1.4% | | | |
| AAdvantage Loyalty IP Ltd. Tranche B 1LN, term loan CME Term SOFR 3 Month Index + 4.750% 10.2936% 4/20/28 (b)(c)(d) | | 2,731,250 | 2,805,212 |
| Air Canada Tranche B 1LN, term loan CME Term SOFR 3 Month Index + 2.500% 7.2533% 3/21/31 (b)(c)(d) | | 1,208,925 | 1,210,436 |
| Echo Global Logistics, Inc.: | | | |
| 1LN, term loan: | | | |
CME Term SOFR 1 Month Index + 3.500% 8.6954% 11/23/28 (b)(c)(d) | | 477,738 | 471,317 |
CME Term SOFR 3 Month Index + 4.750% 9.6954% 11/23/28 (b)(c)(d)(e) | | 4,704,000 | 4,704,000 |
| 2LN, term loan: | | | |
CME Term SOFR 3 Month Index + 7.000% 11.9454% 11/23/29 (b)(c)(d)(e) | | 2,095,000 | 2,095,000 |
CME Term SOFR 3 Month Index + 8.000% 12.9454% 11/23/29 (b)(c)(d)(e) | | 900,000 | 900,000 |
| Rand Parent LLC Tranche B 1LN, term loan CME Term SOFR 3 Month Index + 4.250% 8.3537% 3/18/30 (b)(c)(d) | | 2,251,607 | 2,252,868 |
| SkyMiles IP Ltd. Tranche B 1LN, term loan CME Term SOFR 3 Month Index + 3.750% 9.032% 10/20/27 (b)(c)(d) | | 1,192,470 | 1,213,637 |
| STG Logistics, Inc. 1LN, term loan CME Term SOFR 3 Month Index + 6.000% 10.7537% 3/24/28 (b)(c)(d)(e) | | 1,462,500 | 715,163 |
| United Airlines, Inc. Tranche 1LN, term loan CME Term SOFR 3 Month Index + 2.750% 8.0334% 2/24/31 (b)(c)(d) | | 3,184,000 | 3,184,987 |
TOTAL AIR TRANSPORTATION | | | 19,552,620 |
| Automotive & Auto Parts - 1.4% | | | |
| American Trailer World Corp. Tranche B 1LN, term loan CME Term SOFR 1 Month Index + 3.750% 8.6954% 3/5/28 (b)(c)(d) | | 2,220,000 | 2,000,775 |
| Belron Finance U.S. LLC Tranche B 1LN, term loan CME Term SOFR 3 Month Index + 2.250% 7.6292% 4/13/29 (b)(c)(d) | | 834,438 | 834,087 |
| Clarios Global LP Tranche B 1LN, term loan CME Term SOFR 1 Month Index + 2.500% 7.3454% 5/6/30 (b)(c)(d) | | 2,588,513 | 2,585,820 |
| CWGS Group LLC Tranche B 1LN, term loan CME Term SOFR 1 Month Index + 2.500% 7.4684% 6/3/28 (b)(c)(d) | | 4,668,811 | 4,460,162 |
| LS Group OpCo Acquistion LLC Tranche B 1LN, term loan CME Term SOFR 1 Month Index + 3.000% 7.8454% 4/16/31 (b)(c)(d) | | 1,197,000 | 1,196,258 |
| Power Stop LLC 1LN, term loan CME Term SOFR 3 Month Index + 4.750% 9.9072% 1/26/29 (b)(c)(d) | | 1,777,409 | 1,706,313 |
| RVR Dealership Holdings LLC Tranche B 1LN, term loan 1 month U.S. LIBOR + 4.000% 8.5037% 2/8/28 (b)(c)(d) | | 2,498,707 | 2,215,828 |
| Tnt Crane & Rigging, Inc. 2LN, term loan CME Term SOFR 1 Month Index + 8.750% 14.3432% 12/3/26 (b)(c)(d)(e) | | 2,112,680 | 1,959,510 |
| Wand NewCo 3, Inc. Tranche B 1LN, term loan CME Term SOFR 1 Month Index + 3.250% 8.0065% 1/30/31 (b)(c)(d) | | 2,693,250 | 2,688,671 |
TOTAL AUTOMOTIVE & AUTO PARTS | | | 19,647,424 |
| Banks & Thrifts - 1.5% | | | |
| Citadel Securities LP Tranche B 1LN, term loan CME Term SOFR 1 Month Index + 2.250% 7.0954% 7/29/30 (b)(c)(d) | | 6,531,007 | 6,525,063 |
| Cpi Holdco B LLC Tranche B 1LN, term loan CME Term SOFR 1 Month Index + 2.000% 6.8454% 5/19/31 (b)(c)(d) | | 2,355,000 | 2,342,801 |
| CQP Holdco LP Tranche B 1LN, term loan CME Term SOFR 1 Month Index + 2.250% 6.8537% 12/31/30 (b)(c)(d) | | 6,081,248 | 6,070,484 |
| GTCR Everest Borrower, LLC 1LN, term loan CME Term SOFR 1 Month Index + 3.000% 7.6037% 9/5/31 (b)(c)(d) | | 3,170,000 | 3,131,358 |
| Ngp Xi Midstream Holdings LLC Tranche B 1LN, term loan CME Term SOFR 3 Month Index + 4.000% 8.6037% 7/25/31 (b)(c)(d) | | 1,080,000 | 1,078,650 |
| Novae LLC 1LN, term loan CME Term SOFR 3 Month Index + 5.000% 9.9572% 12/22/28 (b)(c)(d) | | 1,578,106 | 1,534,708 |
| Superannuation & Investments U.S. LLC 1LN, term loan CME Term SOFR 1 Month Index + 3.750% 8.7099% 12/1/28 (b)(c)(d) | | 1,266,770 | 1,266,453 |
TOTAL BANKS & THRIFTS | | | 21,949,517 |
| Broadcasting - 1.6% | | | |
| AppLovin Corp. Tranche B 1LN, term loan: | | | |
| CME Term SOFR 1 Month Index + 2.500% 7.3454% 10/25/28 (b)(c)(d) | | 1,353,394 | 1,352,433 |
| CME Term SOFR 1 Month Index + 2.500% 7.3454% 8/19/30 (b)(c)(d) | | 3,434,528 | 3,430,234 |
| Diamond Sports Group LLC: | | | |
| 1LN, term loan CME Term SOFR 1 Month Index + 8.000% 15.3006% 5/25/26 (b)(c)(d) | | 1,047,276 | 912,439 |
| 2LN, term loan CME Term SOFR 1 Month Index + 3.250% 0% (c)(d)(f) | | 19,325,070 | 195,183 |
| Tranche DIP term loan 10% 8/2/27 (d) | | 1,304,418 | 1,554,710 |
| Dotdash Meredith, Inc. Tranche B 1LN, term loan CME Term SOFR 1 Month Index + 4.000% 9.3006% 12/1/28 (b)(c)(d) | | 5,304,219 | 5,297,588 |
| Nexstar Media, Inc. Tranche B, term loan CME Term SOFR 1 Month Index + 2.500% 7.4599% 9/19/26 (b)(c)(d) | | 2,530,550 | 2,528,172 |
| Univision Communications, Inc.: | | | |
| 1LN, term loan CME Term SOFR 3 Month Index + 4.250% 8.8537% 6/24/29 (b)(c)(d) | | 1,526,097 | 1,500,352 |
| Tranche B 1LN, term loan: | | | |
CME Term SOFR 1 Month Index + 3.250% 8.2099% 3/24/26 (b)(c)(d) | | 1,678,668 | 1,676,889 |
CME Term SOFR 1 Month Index + 3.250% 8.2099% 1/31/29 (b)(c)(d) | | 3,254,897 | 3,166,397 |
CME Term SOFR 1 Month Index + 3.500% 8.4599% 1/31/29 (b)(c)(d) | | 1,241,888 | 1,212,914 |
TOTAL BROADCASTING | | | 22,827,311 |
| Building Materials - 2.3% | | | |
| Acproducts Holdings, Inc. Tranche B 1LN, term loan CME Term SOFR 3 Month Index + 4.250% 9.1153% 5/17/28 (b)(c)(d) | | 5,656,971 | 4,715,482 |
| APi Group DE, Inc. Tranche B 1LN, term loan CME Term SOFR 1 Month Index + 2.000% 6.8454% 1/3/29 (b)(c)(d) | | 3,366,525 | 3,362,856 |
| Asplundh Tree Expert LLC Tranche B 1LN, term loan CME Term SOFR 1 Month Index + 1.750% 6.5954% 5/23/31 (b)(c)(d) | | 1,943,175 | 1,943,991 |
| Chariot Buyer LLC Tranche B 1LN, term loan: | | | |
| CME Term SOFR 1 Month Index + 3.500% 8.1954% 10/22/28 (b)(c)(d) | | 287,781 | 286,054 |
| CME Term SOFR 1 Month Index + 3.750% 8.3454% 11/3/28 (b)(c)(d) | | 1,218,875 | 1,215,389 |
| Copeland LP Tranche B 1LN, term loan CME Term SOFR 1 Month Index + 2.500% 7.5572% 8/2/31 (b)(c)(d) | | 1,215,000 | 1,211,744 |
| Hunter Douglas, Inc. Tranche B 1LN, term loan CME Term SOFR 3 Month Index + 3.500% 8.5713% 2/25/29 (b)(c)(d) | | 11,485,367 | 11,370,513 |
| Janus International Group LLC Tranche B 1LN, term loan CME Term SOFR 1 Month Index + 2.500% 7.3454% 8/5/30 (b)(c)(d) | | 526,680 | 525,695 |
| Oscar AcquisitionCo LLC 1LN, term loan CME Term SOFR 3 Month Index + 4.500% 8.8537% 4/29/29 (b)(c)(d) | | 3,443,310 | 3,397,893 |
| Smyrna Ready Mix Concrete LLC Tranche B 1LN, term loan CME Term SOFR 1 Month Index + 3.500% 8.3545% 4/2/29 (b)(c)(d) | | 1,242,055 | 1,248,266 |
| Standard Industries, Inc./New Jersey Tranche B 1LN, term loan CME Term SOFR 1 Month Index + 2.250% 6.9199% 9/22/28 (b)(c)(d) | | 1,025,335 | 1,027,047 |
| Traverse Midstream Partners Ll Tranche B, term loan CME Term SOFR 3 Month Index + 3.500% 8.7521% 2/16/28 (b)(c)(d) | | 1,021,388 | 1,021,704 |
| White Capital Buyer LLC Tranche B 1LN, term loan CME Term SOFR 1 Month Index + 3.250% 8.0954% 10/19/29 (b)(c)(d) | | 997,984 | 990,249 |
TOTAL BUILDING MATERIALS | | | 32,316,883 |
| Cable/Satellite TV - 1.3% | | | |
| Charter Communication Operating LLC: | | | |
| Tranche B2 1LN, term loan CME Term SOFR 3 Month Index + 1.750% 7.0816% 2/1/27 (b)(c)(d) | | 2,125,367 | 2,122,817 |
| Tranche B4 1LN, term loan CME Term SOFR 3 Month Index + 2.000% 7.3316% 12/9/30 (b)(c)(d) | | 2,858,400 | 2,832,589 |
| Coral-U.S. Co.-Borrower LLC: | | | |
| Tranche B, term loan CME Term SOFR 1 Month Index + 2.250% 7.461% 1/31/28 (b)(c)(d) | | 3,235,000 | 3,194,110 |
| Tranche B6 1LN, term loan CME Term SOFR 1 Month Index + 3.000% 8.211% 10/15/29 (b)(c)(d) | | 1,940,000 | 1,926,536 |
| CSC Holdings LLC: | | | |
| Tranche B 5LN, term loan CME Term SOFR 1 Month Index + 2.500% 7.1735% 4/15/27 (b)(c)(d) | | 870,513 | 794,657 |
| Tranche B6 LN, term loan CME Term SOFR 1 Month Index + 4.500% 9.5965% 1/18/28 (b)(c)(d) | | 1,629,178 | 1,580,596 |
| LCPR Loan Financing LLC 1LN, term loan CME Term SOFR 1 Month Index + 3.750% 8.961% 10/16/28 (b)(c)(d) | | 420,000 | 385,035 |
| Numericable LLC Tranche B 13LN, term loan CME Term SOFR 1 Month Index + 4.000% 9.3797% 8/14/26 (b)(c)(d) | | 452,702 | 369,237 |
| Virgin Media Bristol LLC: | | | |
| Tranche N, term loan CME Term SOFR 1 Month Index + 2.500% 7.711% 1/31/28 (b)(c)(d) | | 1,623,792 | 1,552,069 |
| Tranche Y 1LN, term loan CME Term SOFR 6 Month Index + 3.250% 8.6562% 3/6/31 (b)(c)(d) | | 3,820,000 | 3,643,860 |
TOTAL CABLE/SATELLITE TV | | | 18,401,506 |
| Capital Goods - 0.6% | | | |
| Ali Group North America Corp. Tranche B 1LN, term loan CME Term SOFR 1 Month Index + 2.000% 6.9599% 7/22/29 (b)(c)(d) | | 1,282,107 | 1,285,518 |
| Chart Industries, Inc. Tranche B 1LN, term loan CME Term SOFR 3 Month Index + 2.500% 7.8246% 3/18/30 (b)(c)(d) | | 2,014,255 | 2,009,219 |
| CPM Holdings, Inc. 1LN, term loan CME Term SOFR 1 Month Index + 4.500% 9.7006% 9/28/28 (b)(c)(d) | | 1,220,474 | 1,155,740 |
| Griffon Corp. Tranche B 1LN, term loan CME Term SOFR 3 Month Index + 2.000% 6.8545% 1/24/29 (b)(c)(d) | | 1,675,360 | 1,676,416 |
| Resideo Funding, Inc.: | | | |
| 1LN, term loan CME Term SOFR 1 Month Index + 2.000% 6.8553% 2/14/28 (b)(c)(d) | | 143,705 | 144,065 |
| Tranche B 1LN, term loan CME Term SOFR 3 Month Index + 2.000% 7.3014% 5/14/31 (b)(c)(d) | | 1,027,425 | 1,027,425 |
| TK Elevator U.S. Newco, Inc. Tranche B 1LN, term loan CME Term SOFR 6 Month Index + 3.500% 8.5877% 4/30/30 (b)(c)(d) | | 1,558,437 | 1,561,040 |
TOTAL CAPITAL GOODS | | | 8,859,423 |
| Chemicals - 4.8% | | | |
| A-Gas Finco, Inc. Tranche B 1LN, term loan CME Term SOFR 3 Month Index + 5.250% 9.8537% 12/14/29 (b)(c)(d) | | 2,219,411 | 2,088,466 |
| Advancion Holdings LLC: | | | |
| 2LN, term loan CME Term SOFR 1 Month Index + 7.750% 12.6954% 11/24/28 (b)(c)(d) | | 1,575,000 | 1,490,344 |
| Tranche B 1LN, term loan CME Term SOFR 1 Month Index + 4.000% 8.9454% 11/24/27 (b)(c)(d) | | 3,410,530 | 3,386,861 |
| ARC Falcon I, Inc.: | | | |
| Tranche B 1LN, term loan CME Term SOFR 1 Month Index + 3.750% 8.4454% 9/30/28 (b)(c)(d) | | 5,235,817 | 5,227,963 |
| Tranche B 2LN, term loan CME Term SOFR 1 Month Index + 7.000% 11.9454% 10/1/29 (b)(c)(d) | | 930,000 | 863,738 |
| Avient Corp. Tranche B8 1LN, term loan CME Term SOFR 3 Month Index + 2.000% 7.3069% 8/29/29 (b)(c)(d) | | 844,144 | 845,351 |
| Bakelite U.S. Holding Ltd. 1LN, term loan CME Term SOFR 3 Month Index + 3.500% 8.1037% 5/29/29 (b)(c)(d) | | 2,170,032 | 2,173,418 |
| Consolidated Energy Finance SA Tranche B 1LN, term loan CME Term SOFR 1 Month Index + 4.500% 9.5572% 11/15/30 (b)(c)(d) | | 3,716,325 | 3,477,402 |
| Derby Buyer LLC 1LN, term loan CME Term SOFR 1 Month Index + 3.500% 8.7006% 11/1/30 (b)(c)(d) | | 2,149,200 | 2,149,737 |
| Discovery Purchaser Corp. 1LN, term loan CME Term SOFR 3 Month Index + 4.370% 9.6932% 10/4/29 (b)(c)(d) | | 6,295,978 | 6,262,735 |
| Groupe Solmax, Inc. Tranche B 1LN, term loan CME Term SOFR 3 Month Index + 4.750% 9.659% 5/27/28 (b)(c)(d) | | 2,801,446 | 2,578,843 |
| Herens U.S. Holdco Corp. Tranche B 1LN, term loan CME Term SOFR 3 Month Index + 3.920% 8.6287% 7/3/28 (b)(c)(d) | | 2,704,896 | 2,524,479 |
| Hexion Holdings Corp. 1LN, term loan CME Term SOFR 3 Month Index + 4.500% 9.7711% 3/15/29 (b)(c)(d) | | 5,013,515 | 4,970,550 |
| Hexion, Inc. 2LN, term loan CME Term SOFR 1 Month Index + 7.430% 12.3829% 3/15/30 (b)(c)(d) | | 2,105,000 | 1,882,228 |
| INEOS U.S. Petrochem LLC: | | | |
| 1LN, term loan CME Term SOFR 1 Month Index + 3.750% 8.6954% 3/1/30 (b)(c)(d) | | 1,092,175 | 1,090,133 |
| Tranche B 1LN, term loan CME Term SOFR 1 Month Index + 4.250% 9.1954% 4/2/29 (b)(c)(d) | | 2,581,265 | 2,579,664 |
| Koppers, Inc. Tranche B 1LN, term loan CME Term SOFR 1 Month Index + 3.000% 8.1% 4/10/30 (b)(c)(d) | | 393,025 | 394,008 |
| M2S Group Intermediate Holding Tranche B 1LN, term loan CME Term SOFR 1 Month Index + 4.750% 9.8518% 8/22/31 (b)(c)(d) | | 2,365,000 | 2,258,575 |
| Manchester Acquisition Sub LLC Tranche B 1LN, term loan CME Term SOFR 3 Month Index + 5.750% 10.9157% 12/1/26 (b)(c)(d) | | 1,771,953 | 1,647,916 |
| Nouryon U.S.A. LLC Tranche B 1LN, term loan: | | | |
| CME Term SOFR 3 Month Index + 3.500% 8.6284% 4/3/28 (b)(c)(d) | | 2,094,347 | 2,094,347 |
| CME Term SOFR 3 Month Index + 3.500% 8.8209% 4/3/28 (b)(c)(d) | | 1,623,631 | 1,624,978 |
| Olympus Water U.S. Holding Corp. Tranche B 1LN, term loan CME Term SOFR 3 Month Index + 3.500% 8.1037% 6/23/31 (b)(c)(d) | | 4,945,117 | 4,941,409 |
| SCIH Salt Holdings, Inc. Tranche B 1LN, term loan CME Term SOFR 3 Month Index + 3.500% 8.7554% 3/16/27 (b)(c)(d) | | 1,207,377 | 1,206,278 |
| The Chemours Co. LLC Tranche B2 1LN, term loan CME Term SOFR 1 Month Index + 3.500% 8.3454% 8/18/28 (b)(c)(d) | | 5,208,166 | 5,203,270 |
| Touchdown Acquirer, Inc. Tranche B 1LN, term loan CME Term SOFR 1 Month Index + 3.250% 8.5602% 2/21/31 (b)(c)(d) | | 2,555,000 | 2,549,405 |
| Usalco LLC: | | | |
| Tranche B 1LN, term loan CME Term SOFR 1 Month Index + 4.000% 9/17/31 (c)(d)(g) | | 1,251,099 | 1,254,227 |
| Tranche DD 1LN, term loan CME Term SOFR 1 Month Index + 4.000% 9/17/31 (c)(d)(g) | | 128,901 | 129,223 |
| W.R. Grace Holding LLC Tranche B 1LN, term loan CME Term SOFR 3 Month Index + 3.750% 7.8537% 9/22/28 (b)(c)(d) | | 1,200,823 | 1,202,624 |
TOTAL CHEMICALS | | | 68,098,172 |
| Consumer Products - 2.7% | | | |
| 19Th Holdings Golf LLC Tranche B 1LN, term loan CME Term SOFR 1 Month Index + 3.250% 8.5125% 2/7/29 (b)(c)(d) | | 3,008,922 | 2,948,744 |
| Aip Rd Buyer Corp. Tranche B 1LN, term loan CME Term SOFR 1 Month Index + 5.000% 9.3454% 12/26/28 (b)(c)(d) | | 2,485,357 | 2,483,294 |
| BCPE Empire Holdings, Inc. 1LN, term loan CME Term SOFR 1 Month Index + 4.000% 8.8454% 12/25/28 (b)(c)(d) | | 4,061,788 | 4,061,301 |
| Bombardier Recreational Products, Inc.: | | | |
| Tranche B3 1LN, term loan CME Term SOFR 1 Month Index + 2.750% 7.5954% 12/13/29 (b)(c)(d) | | 2,800,339 | 2,792,834 |
| Tranche B4 1LN, term loan CME Term SOFR 1 Month Index + 2.750% 7.5954% 1/22/31 (b)(c)(d) | | 291,303 | 290,574 |
| CNT Holdings I Corp. Tranche B 1LN, term loan CME Term SOFR 1 Month Index + 3.500% 8.7521% 11/8/27 (b)(c)(d) | | 2,823,198 | 2,827,517 |
| Conair Holdings LLC Tranche B 1LN, term loan CME Term SOFR 1 Month Index + 3.750% 8.7099% 5/17/28 (b)(c)(d) | | 1,393,627 | 1,272,438 |
| Foundation Building Materials, Inc. Tranche B2 1LN, term loan CME Term SOFR 3 Month Index + 4.000% 9.2521% 1/29/31 (b)(c)(d) | | 4,803,818 | 4,670,608 |
| Gloves Buyer, Inc. Tranche B 1LN, term loan CME Term SOFR 1 Month Index + 4.000% 8.9599% 1/6/28 (b)(c)(d) | | 630,362 | 627,607 |
| Kodiak BP LLC Tranche B2 1LN, term loan CME Term SOFR 3 Month Index + 3.750% 8.5954% 3/13/28 (b)(c)(d) | | 701,475 | 702,352 |
| Kronos Acquisition Holdings, Inc. Tranche B 1LN, term loan CME Term SOFR 1 Month Index + 4.000% 9.3143% 6/27/31 (b)(c)(d) | | 910,000 | 850,850 |
| Mattress Firm, Inc. Tranche B 1LN, term loan CME Term SOFR 3 Month Index + 4.250% 8.9235% 9/24/28 (b)(c)(d) | | 2,323,791 | 2,321,723 |
| Runner Buyer, Inc. Tranche B 1LN, term loan CME Term SOFR 3 Month Index + 5.500% 10.6717% 10/21/28 (b)(c)(d) | | 1,450,257 | 709,016 |
| Sweetwater Borrower LLC Tranche B 1LN, term loan CME Term SOFR 1 Month Index + 4.250% 9.2099% 8/5/28 (b)(c)(d) | | 3,068,598 | 3,064,762 |
| TripAdvisor, Inc. Tranche B 1LN, term loan CME Term SOFR 1 Month Index + 2.750% 7.5954% 7/8/31 (b)(c)(d) | | 950,000 | 946,732 |
| Varsity Brands LLC Tranche B 1LN, term loan CME Term SOFR 1 Month Index + 3.750% 8.8213% 8/26/31 (b)(c)(d) | | 3,925,000 | 3,896,387 |
| Windsor Holdings III, LLC Tranche B 1LN, term loan CME Term SOFR 1 Month Index + 3.500% 8.4609% 8/1/30 (b)(c)(d) | | 2,550,546 | 2,558,300 |
| Woof Holdings LLC Tranche B 1LN, term loan CME Term SOFR 3 Month Index + 3.750% 8.6153% 12/21/27 (b)(c)(d) | | 1,680,479 | 1,118,913 |
TOTAL CONSUMER PRODUCTS | | | 38,143,952 |
| Containers - 1.6% | | | |
| AOT Packaging Products AcquisitionCo LLC 1LN, term loan CME Term SOFR 1 Month Index + 3.250% 8.2099% 3/3/28 (b)(c)(d) | | 2,817,112 | 2,759,727 |
| Berlin Packaging, LLC Tranche B7 1LN, term loan CME Term SOFR 1 Month Index + 3.750% 8.8915% 6/7/31 (b)(c)(d) | | 4,883,156 | 4,877,931 |
| Berry Global, Inc. Tranche AA 1LN, term loan CME Term SOFR 3 Month Index + 1.750% 7.3162% 7/1/29 (b)(c)(d) | | 2,478,847 | 2,484,845 |
| Charter Next Generation, Inc. Tranche B 1LN, term loan CME Term SOFR 1 Month Index + 3.250% 8.0954% 12/1/27 (b)(c)(d) | | 3,053,010 | 3,052,705 |
| Graham Packaging Co., Inc. Tranche B 1LN, term loan CME Term SOFR 1 Month Index + 2.500% 7.3454% 8/4/27 (b)(c)(d) | | 1,234,978 | 1,233,224 |
| Kloeckner Pentaplast of America, Inc. Tranche B 1LN, term loan CME Term SOFR 6 Month Index + 4.750% 9.7229% 2/9/26 (b)(c)(d) | | 2,262,739 | 2,116,611 |
| Pactiv Evergreen Group Holdings, Inc. Tranche B4 1LN, term loan CME Term SOFR 1 Month Index + 2.500% 7.3454% 9/25/28 (b)(c)(d) | | 1,966,676 | 1,964,827 |
| Pregis TopCo Corp. 1LN, term loan: | | | |
| CME Term SOFR 1 Month Index + 3.750% 8.8454% 8/3/26 (b)(c)(d) | | 808,633 | 809,352 |
| CME Term SOFR 1 Month Index + 3.750% 8.9599% 8/1/26 (b)(c)(d) | | 485,000 | 485,000 |
| Reynolds Consumer Products LLC Tranche B 1LN, term loan CME Term SOFR 1 Month Index + 1.750% 6.6954% 1/30/27 (b)(c)(d) | | 2,460,398 | 2,463,252 |
| SupplyOne, Inc. Tranche B 1LN, term loan CME Term SOFR 1 Month Index + 4.250% 9.0954% 4/21/31 (b)(c)(d) | | 701,475 | 702,646 |
TOTAL CONTAINERS | | | 22,950,120 |
| Diversified Financial Services - 4.5% | | | |
| AlixPartners LLP Tranche B 1LN, term loan CME Term SOFR 1 Month Index + 2.750% 7.4599% 2/4/28 (b)(c)(d) | | 1,912,413 | 1,913,370 |
| Aretec Group, Inc. 1LN, term loan CME Term SOFR 1 Month Index + 4.000% 8.8454% 8/9/30 (b)(c)(d) | | 4,186,544 | 4,096,407 |
| BCP Renaissance Parent LLC Tranche B 1LN, term loan CME Term SOFR 3 Month Index + 3.250% 7.8537% 10/31/28 (b)(c)(d) | | 713,825 | 713,568 |
| Boost Newco Borrower LLC Tranche B 1LN, term loan CME Term SOFR 3 Month Index + 2.500% 7.1037% 1/31/31 (b)(c)(d) | | 9,060,000 | 9,056,195 |
| Broadstreet Partners, Inc. Tranche B4 1LN, term loan CME Term SOFR 1 Month Index + 3.250% 8.0954% 6/14/31 (b)(c)(d) | | 3,788,211 | 3,771,657 |
| Clue Opco LLC Tranche B 1LN, term loan CME Term SOFR 3 Month Index + 4.500% 9.7521% 12/19/30 (b)(c)(d) | | 3,255,756 | 3,228,342 |
| Dragon Buyer, Inc. 1LN, term loan CME Term SOFR 1 Month Index + 3.250% 9/24/31 (c)(d)(g) | | 1,545,000 | 1,537,661 |
| FinCo I LLC Tranche B 1LN, term loan CME Term SOFR 3 Month Index + 3.000% 8.2554% 6/27/29 (b)(c)(d) | | 555,498 | 556,076 |
| Fleet U.S. Bidco, Inc. Tranche B 1LN, term loan CME Term SOFR 1 Month Index + 2.750% 7.5777% 2/10/31 (b)(c)(d) | | 1,458,096 | 1,454,451 |
| Focus Financial Partners LLC: | | | |
| Tranche B8 1LN, term loan CME Term SOFR 1 Month Index + 3.250% 9/10/31 (c)(d)(g) | | 2,709,042 | 2,700,075 |
| Tranche DD 1LN, term loan CME Term SOFR 1 Month Index + 3.250% 9/10/31 (c)(d)(g) | | 290,958 | 289,995 |
| Fugue Finance LLC Tranche B 1LN, term loan: | | | |
| CME Term SOFR 3 Month Index + 3.750% 8.8072% 2/26/31 (b)(c)(d) | | 588,525 | 591,320 |
| CME Term SOFR 3 Month Index + 4.000% 9.0572% 1/26/28 (b)(c)(d) | | 718,389 | 721,593 |
| Heubach Holding U.S.A. LLC Tranche CME, term loan CME Term SOFR 1 Month Index + 10.000% 0% 12/31/49 (c)(d)(e)(f) | | 303,780 | 121,512 |
| Hightower Holding LLC Tranche B 1LN, term loan CME Term SOFR 1 Month Index + 3.500% 8.7477% 4/21/28 (b)(c)(d) | | 2,478,640 | 2,477,104 |
| Jane Street Group LLC Tranche B 1LN, term loan CME Term SOFR 1 Month Index + 2.500% 7.4599% 1/26/28 (b)(c)(d) | | 1,830,515 | 1,828,429 |
| Johnstone Supply LLC Tranche B 1LN, term loan CME Term SOFR 1 Month Index + 3.000% 8.174% 6/7/31 (b)(c)(d) | | 1,895,000 | 1,888,917 |
| LSF11 Trinity Bidco, Inc. Tranche B 1LN, term loan CME Term SOFR 1 Month Index + 3.500% 8.4199% 6/17/30 (b)(c)(d) | | 642,432 | 642,432 |
| Needle Holdings LLC Tranche EXIT 1LN, term loan CME Term SOFR 1 Month Index + 9.500% 14.3454% 4/28/28 (b)(c)(d)(e) | | 2,228,963 | 1,783,171 |
| Neon Maple U.S. Debt Mergersub I Tranche B 1LN, term loan CME Term SOFR 1 Month Index + 3.000% 7/21/31 (c)(d)(g) | | 4,665,000 | 4,612,519 |
| Nexus Buyer LLC: | | | |
| 2LN, term loan CME Term SOFR 1 Month Index + 6.250% 11.1954% 11/1/29 (b)(c)(d) | | 2,500,000 | 2,487,500 |
| Tranche B 1LN, term loan CME Term SOFR 1 Month Index + 4.000% 8.8454% 7/18/31 (b)(c)(d) | | 4,360,097 | 4,319,896 |
| Priority Holdings LLC Tranche B 1LN, term loan CME Term SOFR 1 Month Index + 4.750% 9.8072% 5/16/31 (b)(c)(d) | | 723,188 | 720,700 |
| Recess Holdings, Inc. Tranche B 1LN, term loan CME Term SOFR 3 Month Index + 4.500% 9.7521% 2/14/30 (b)(c)(d) | | 1,736,275 | 1,741,050 |
| Sk Neptune Husky Finance Sarl Tranche B 1LN, term loan CME Term SOFR 3 Month Index + 5.000% 10.4338% 1/3/29 (b)(c)(d)(f) | | 1,226,144 | 15,327 |
| TransUnion LLC: | | | |
| Tranche B 1LN, term loan CME Term SOFR 1 Month Index + 2.000% 6.8454% 12/1/28 (b)(c)(d) | | 1,404,982 | 1,403,451 |
| Tranche B8 1LN, term loan CME Term SOFR 1 Month Index + 1.750% 6.5954% 6/6/31 (b)(c)(d) | | 2,164,904 | 2,159,990 |
| UFC Holdings LLC Tranche B 1LN, term loan CME Term SOFR 3 Month Index + 2.750% 8.2908% 4/29/26 (b)(c)(d) | | 1,250,477 | 1,250,927 |
| WH Borrower LLC Tranche B 1LN, term loan: | | | |
| CME Term SOFR 3 Month Index + 5.500% 10.7858% 2/9/27 (b)(c)(d) | | 3,265,374 | 3,250,418 |
| CME Term SOFR 3 Month Index + 5.500% 10.7858% 2/15/27 (b)(c)(d) | | 2,729,786 | 2,722,962 |
TOTAL DIVERSIFIED FINANCIAL SERVICES | | | 64,057,015 |
| Diversified Media - 0.7% | | | |
| Advantage Sales & Marketing, Inc. Tranche B 1LN, term loan CME Term SOFR 3 Month Index + 4.250% 9.8325% 10/28/27 (b)(c)(d) | | 2,261,339 | 2,192,798 |
| Allen Media LLC Tranche B 1LN, term loan CME Term SOFR 3 Month Index + 5.500% 10.2537% 2/10/27 (b)(c)(d) | | 4,559,171 | 2,949,237 |
| CMG Media Corp. Tranche B 1LN, term loan CME Term SOFR 3 Month Index + 3.500% 8.2037% 12/17/26 (b)(c)(d) | | 6,193,552 | 5,437,629 |
TOTAL DIVERSIFIED MEDIA | | | 10,579,664 |
| Energy - 3.3% | | | |
| Apro LLC Tranche B 1LN, term loan CME Term SOFR 1 Month Index + 3.750% 8.868% 7/9/31 (b)(c)(d) | | 2,340,000 | 2,345,850 |
| Array Technologies, Inc. Tranche B 1LN, term loan CME Term SOFR 1 Month Index + 3.250% 8.2844% 10/14/27 (b)(c)(d) | | 2,963,304 | 2,956,814 |
| BW Gas & Convenience Holdings LLC Tranche B 1LN, term loan CME Term SOFR 1 Month Index + 3.500% 8.4599% 3/17/28 (b)(c)(d) | | 615,296 | 614,145 |
| Calpine Construction Finance Co. LP Tranche B 1LN, term loan CME Term SOFR 1 Month Index + 2.000% 6.8454% 7/31/30 (b)(c)(d) | | 1,200,000 | 1,191,672 |
| Delek U.S. Holdings, Inc. Tranche B 1LN, term loan CME Term SOFR 1 Month Index + 3.500% 8.4454% 11/19/29 (b)(c)(d) | | 3,630,338 | 3,617,740 |
| Eastern Power LLC Tranche B, term loan CME Term SOFR 1 Month Index + 5.250% 10.0954% 4/3/28 (b)(c)(d) | | 688,622 | 688,622 |
| EG America LLC Tranche BC 1LN, term loan CME Term SOFR 1 Month Index + 5.500% 10.4445% 2/7/28 (b)(c)(d) | | 7,434,022 | 7,418,559 |
| Enstall Group BV Tranche B 1LN, term loan CME Term SOFR 3 Month Index + 4.750% 9.8653% 8/27/28 (b)(c)(d) | | 2,205,693 | 2,073,352 |
| Epic Y-Grade Services,LP Tranche B 1LN, term loan CME Term SOFR 3 Month Index + 5.500% 11.0682% 6/29/29 (b)(c)(d) | | 3,000,000 | 2,988,000 |
| GIP II Blue Holding LP Tranche B 1LN, term loan CME Term SOFR 1 Month Index + 3.750% 8.5954% 9/29/28 (b)(c)(d) | | 4,718,156 | 4,729,102 |
| GIP III Stetson I LP Tranche B 1LN, term loan CME Term SOFR 1 Month Index + 4.250% 8.3454% 10/31/28 (b)(c)(d) | | 2,375,875 | 2,372,905 |
| Hamilton Projs. Acquiror LLC Tranche B 1LN, term loan CME Term SOFR 1 Month Index + 3.750% 8.5954% 5/22/31 (b)(c)(d) | | 947,625 | 953,311 |
| New Fortress Energy, Inc. Tranche B 1LN, term loan CME Term SOFR 3 Month Index + 5.000% 10.2521% 10/30/28 (b)(c)(d) | | 6,059,213 | 5,464,137 |
| Par Petroleum LLC Tranche B 1LN, term loan CME Term SOFR 3 Month Index + 3.750% 9.0643% 2/28/30 (b)(c)(d) | | 1,231,250 | 1,231,509 |
| Prairie ECI Acquiror LP Tranche 1LN, term loan CME Term SOFR 1 Month Index + 4.750% 9.5954% 8/1/29 (b)(c)(d) | | 1,054,700 | 1,052,063 |
| Rockpoint Gas Storage Partners 1LN, term loan CME Term SOFR 1 Month Index + 3.500% 9/15/31 (c)(d)(g) | | 2,585,000 | 2,572,075 |
| Waterbridge Midstream Operatin Tranche B 1LN, term loan CME Term SOFR 3 Month Index + 4.750% 9.3932% 6/22/29 (b)(c)(d) | | 1,895,000 | 1,827,993 |
| Waterbridge Ndb Operating LLC Tranche B 1LN, term loan CME Term SOFR 3 Month Index + 4.500% 9.6028% 5/10/29 (b)(c)(d) | | 1,120,000 | 1,116,853 |
| Win Waste Innovations Holdings Tranche B 1LN, term loan CME Term SOFR 1 Month Index + 2.750% 7.7099% 3/25/28 (b)(c)(d) | | 1,353,663 | 1,286,291 |
TOTAL ENERGY | | | 46,500,993 |
| Entertainment/Film - 0.3% | | | |
| AP Core Holdings II LLC: | | | |
| Tranche B1 1LN, term loan CME Term SOFR 1 Month Index + 5.500% 10.4599% 9/1/27 (b)(c)(d) | | 1,384,003 | 1,263,193 |
| Tranche B2 1LN, term loan CME Term SOFR 1 Month Index + 5.500% 10.4599% 9/1/27 (b)(c)(d) | | 3,205,000 | 2,919,979 |
TOTAL ENTERTAINMENT/FILM | | | 4,183,172 |
| Environmental - 0.5% | | | |
| Madison IAQ LLC Tranche B 1LN, term loan CME Term SOFR 1 Month Index + 3.250% 7.8892% 6/21/28 (b)(c)(d) | | 4,574,494 | 4,568,319 |
| Reworld Holding Corp.: | | | |
| Tranche B 1LN, term loan: | | | |
CME Term SOFR 1 Month Index + 2.500% 7.3501% 11/30/28 (b)(c)(d) | | 1,577,311 | 1,577,563 |
CME Term SOFR 1 Month Index + 2.750% 7.8465% 11/30/28 (b)(c)(d) | | 726,585 | 726,738 |
| Tranche C 1LN, term loan: | | | |
CME Term SOFR 1 Month Index + 2.750% 7.8465% 11/30/28 (b)(c)(d) | | 39,803 | 39,812 |
CME Term SOFR 6 Month Index + 2.500% 7.5877% 11/30/28 (b)(c)(d) | | 121,180 | 121,200 |
TOTAL ENVIRONMENTAL | | | 7,033,632 |
| Food & Drug Retail - 0.8% | | | |
| Cardenas Merger Sub, LLC 1LN, term loan CME Term SOFR 3 Month Index + 6.750% 11.4537% 8/1/29 (b)(c)(d) | | 2,637,948 | 2,598,379 |
| Froneri U.S., Inc. Tranche B 1LN, term loan CME Term SOFR 1 Month Index + 2.250% 7.1954% 2/1/27 (b)(c)(d) | | 1,441,596 | 1,437,632 |
| JP Intermediate B LLC term loan CME Term SOFR 3 Month Index + 5.500% 11.0137% 11/20/27 (b)(c)(d) | | 4,853,376 | 339,736 |
| Northeast Grocery, Inc. Tranche B 1LN, term loan CME Term SOFR 3 Month Index + 7.500% 12.5955% 12/13/28 (b)(c)(d) | | 1,309,969 | 1,309,969 |
| Primary Products Finance LLC Tranche B 1LN, term loan CME Term SOFR 3 Month Index + 3.500% 8.9709% 4/2/29 (b)(c)(d) | | 3,372,560 | 3,372,020 |
| Upfield U.S.A. Corp. Tranche B7 1LN, term loan CME Term SOFR 1 Month Index + 4.250% 9.76% 1/3/28 (b)(c)(d)(h) | | 2,927,315 | 2,913,205 |
TOTAL FOOD & DRUG RETAIL | | | 11,970,941 |
| Food/Beverage/Tobacco - 1.5% | | | |
| Aspire Bakeries Holdings LLC Tranche B 1LN, term loan CME Term SOFR 1 Month Index + 4.250% 9.1045% 12/23/30 (b)(c)(d) | | 741,275 | 742,513 |
| Chobani LLC Tranche B 1LN, term loan: | | | |
| CME Term SOFR 1 Month Index + 3.500% 8.2099% 10/23/27 (b)(c)(d) | | 2,709,747 | 2,714,489 |
| CME Term SOFR 1 Month Index + 3.750% 8.5954% 10/25/27 (b)(c)(d) | | 724,525 | 726,155 |
| Del Monte Foods Corp. Ii, Inc.: | | | |
| 1LN, term loan CME Term SOFR 1 Month Index + 8.000% 13.1657% 8/2/28 (b)(c)(d) | | 2,601,372 | 2,440,946 |
| 2LN, term loan CME Term SOFR 1 Month Index + 4.250% 9.406% 8/2/28 (b)(c)(d) | | 4,877,551 | 2,609,490 |
| Fiesta Purchaser, Inc. Tranche B 1LN, term loan CME Term SOFR 1 Month Index + 4.000% 8.8454% 2/12/31 (b)(c)(d) | | 2,583,525 | 2,582,931 |
| Naked Juice LLC: | | | |
| 1LN, term loan CME Term SOFR 3 Month Index + 3.250% 7.9537% 1/24/29 (b)(c)(d) | | 2,704,889 | 2,207,027 |
| 2LN, term loan CME Term SOFR 3 Month Index + 6.000% 10.7037% 1/24/30 (b)(c)(d) | | 2,185,000 | 1,325,399 |
| Triton Water Holdings, Inc. Tranche B 1LN, term loan CME Term SOFR 3 Month Index + 3.250% 8.1153% 3/31/28 (b)(c)(d) | | 6,419,895 | 6,406,156 |
TOTAL FOOD/BEVERAGE/TOBACCO | | | 21,755,106 |
| Gaming - 3.5% | | | |
| Caesars Entertainment, Inc.: | | | |
| Tranche B 1LN, term loan CME Term SOFR 1 Month Index + 2.750% 7.5954% 1/26/30 (b)(c)(d) | | 11,689,650 | 11,678,662 |
| Tranche B1 1LN, term loan CME Term SOFR 3 Month Index + 2.750% 7.5954% 2/6/31 (b)(c)(d) | | 4,159,100 | 4,153,901 |
| Entain Holdings Gibraltar Ltd. Tranche B4 1LN, term loan CME Term SOFR 6 Month Index + 2.250% 7.864% 3/16/27 (b)(c)(d) | | 1,405,742 | 1,409,692 |
| Entain PLC Tranche B 1LN, term loan CME Term SOFR 6 Month Index + 2.750% 8.014% 10/31/29 (b)(c)(d) | | 3,114,524 | 3,113,216 |
| Fertitta Entertainment LLC NV Tranche B 1LN, term loan CME Term SOFR 1 Month Index + 4.000% 8.8465% 1/27/29 (b)(c)(d) | | 10,560,419 | 10,525,992 |
| Flutter Financing B.V. Tranche B 1LN, term loan CME Term SOFR 3 Month Index + 2.000% 6.6037% 11/25/30 (b)(c)(d) | | 5,656,258 | 5,654,221 |
| Golden Entertainment, Inc. Tranche B 1LN, term loan CME Term SOFR 1 Month Index + 2.250% 6.8537% 5/26/30 (b)(c)(d) | | 2,587,150 | 2,582,312 |
| Light & Wonder International, Inc. Tranche B 1LN, term loan CME Term SOFR 1 Month Index + 2.250% 7.3327% 4/16/29 (b)(c)(d) | | 3,034,754 | 3,029,322 |
| Ontario Gaming GTA LP Tranche B 1LN, term loan CME Term SOFR 3 Month Index + 4.250% 8.8932% 8/1/30 (b)(c)(d) | | 2,193,425 | 2,189,762 |
| PCI Gaming Authority 1LN, term loan CME Term SOFR 1 Month Index + 2.000% 6.8454% 7/18/31 (b)(c)(d) | | 958,314 | 951,989 |
| Station Casinos LLC Tranche B 1LN, term loan CME Term SOFR 1 Month Index + 2.250% 7.0954% 3/14/31 (b)(c)(d) | | 4,820,775 | 4,797,539 |
TOTAL GAMING | | | 50,086,608 |
| Healthcare - 5.5% | | | |
| Accelerated Health Systems LLC Tranche B1 LN, term loan CME Term SOFR 3 Month Index + 4.250% 9.0037% 2/15/29 (b)(c)(d) | | 1,890,331 | 1,444,761 |
| Avantor Funding, Inc. Tranche B6 1LN, term loan CME Term SOFR 1 Month Index + 2.000% 6.9454% 11/8/27 (b)(c)(d) | | 1,263,517 | 1,269,480 |
| Charlotte Buyer, Inc. Tranche B 1LN, term loan CME Term SOFR 1 Month Index + 4.750% 9.8539% 2/11/28 (b)(c)(d) | | 1,632,353 | 1,644,596 |
| DaVita, Inc. Tranche B1 1LN, term loan CME Term SOFR 1 Month Index + 2.000% 6.8454% 5/9/31 (b)(c)(d) | | 2,685,000 | 2,682,422 |
| Elanco Animal Health, Inc. Tranche B 1LN, term loan CME Term SOFR 1 Month Index + 1.750% 7.0506% 8/1/27 (b)(c)(d) | | 2,200,914 | 2,195,258 |
| Embecta Corp. Tranche B 1LN, term loan CME Term SOFR 1 Month Index + 3.000% 7.8454% 3/31/29 (b)(c)(d) | | 3,089,249 | 3,006,858 |
| Endo Finance Holdings, Inc. Tranche B-EXIT 1LN, term loan CME Term SOFR 3 Month Index + 4.500% 9.783% 4/23/31 (b)(c)(d) | | 2,395,000 | 2,391,503 |
| Gainwell Acquisition Corp. Tranche B 1LN, term loan CME Term SOFR 3 Month Index + 4.000% 8.7037% 10/1/27 (b)(c)(d) | | 10,506,246 | 9,976,521 |
| HAH Group Holding Co. LLC 1LN, term loan CME Term SOFR 1 Month Index + 5.000% 9/24/31 (c)(d)(g) | | 3,705,000 | 3,651,759 |
| Insulet Corp. Tranche B 1LN, term loan CME Term SOFR 1 Month Index + 2.500% 7.3454% 8/1/31 (b)(c)(d) | | 3,989,691 | 4,003,415 |
| IVC Acquisition Ltd. Tranche B 1LN, term loan CME Term SOFR 3 Month Index + 4.750% 9.3932% 12/6/28 (b)(c)(d) | | 3,166,115 | 3,167,445 |
| Jazz Financing Lux SARL Tranche B 1LN, term loan CME Term SOFR 1 Month Index + 2.250% 7.0954% 5/5/28 (b)(c)(d) | | 5,918,010 | 5,910,080 |
| MED ParentCo LP Tranche B 1LN, term loan CME Term SOFR 1 Month Index + 4.000% 8.8454% 4/7/31 (b)(c)(d) | | 1,842,444 | 1,843,328 |
| Medline Borrower LP: | | | |
| 1LN, term loan CME Term SOFR 1 Month Index + 2.250% 7.0954% 10/21/28 (b)(c)(d) | | 3,550,000 | 3,544,924 |
| Tranche B 1LN, term loan CME Term SOFR 1 Month Index + 2.750% 7.5954% 10/23/28 (b)(c)(d) | | 10,874,286 | 10,873,198 |
| Organon & Co. Tranche B 1LN, term loan CME Term SOFR 1 Month Index + 2.500% 7.4648% 5/17/31 (b)(c)(d) | | 3,065,097 | 3,053,603 |
| Packaging Coordinators Midco, Inc. 1LN, term loan CME Term SOFR 3 Month Index + 3.250% 8.0954% 11/30/27 (b)(c)(d) | | 3,360,815 | 3,357,656 |
| Phoenix Guarantor, Inc. term loan CME Term SOFR 1 Month Index + 3.250% 8.0954% 2/21/31 (b)(c)(d) | | 1,965,125 | 1,958,876 |
| Phoenix Newco, Inc. Tranche B 1LN, term loan CME Term SOFR 1 Month Index + 3.000% 7.8454% 11/15/28 (b)(c)(d) | | 6,841,606 | 6,840,307 |
| RadNet Management, Inc. Tranche B 1LN, term loan CME Term SOFR 3 Month Index + 2.500% 7.7792% 4/10/31 (b)(c)(d) | | 937,650 | 938,044 |
| Soliant Lower Intermediate LLC 1LN, term loan CME Term SOFR 1 Month Index + 3.750% 8.5954% 7/18/31 (b)(c)(d) | | 1,520,000 | 1,520,000 |
| Sotera Health Holdings LLC Tranche B 1LN, term loan CME Term SOFR 1 Month Index + 3.250% 8.0954% 5/30/31 (b)(c)(d) | | 1,625,000 | 1,618,906 |
| Surgery Center Holdings, Inc. 1LN, term loan CME Term SOFR 1 Month Index + 3.000% 7.6699% 12/19/30 (b)(c)(d) | | 483,435 | 483,503 |
| U.S. Anesthesia Partners, Inc. 2LN, term loan CME Term SOFR 1 Month Index + 7.500% 12.815% 10/1/29 (b)(c)(d)(e) | | 775,000 | 643,250 |
| U.S. Radiology Specialists, Inc. 1LN, term loan CME Term SOFR 1 Month Index + 4.750% 9.3537% 12/15/27 (b)(c)(d) | | 634,689 | 634,689 |
TOTAL HEALTHCARE | | | 78,654,382 |
| Homebuilders/Real Estate - 0.4% | | | |
| Chromalloy Corp. Tranche B 1LN, term loan CME Term SOFR 3 Month Index + 3.750% 9.0816% 3/21/31 (b)(c)(d) | | 1,291,763 | 1,225,327 |
| Cushman & Wakefield U.S. Borrower LLC Tranche B 1LN, term loan CME Term SOFR 1 Month Index + 2.750% 7.7099% 8/21/25 (b)(c)(d) | | 11,330 | 11,323 |
| Fluidra Finco SL Tranche B 1LN, term loan CME Term SOFR 1 Month Index + 2.000% 6.8704% 1/27/29 (b)(c)(d) | | 491,802 | 491,497 |
| Greystar Real Estate Partners 1LN, term loan CME Term SOFR 1 Month Index + 2.750% 7.6699% 8/21/30 (b)(c)(d) | | 1,762,591 | 1,758,184 |
| Ryan Specialty Group LLC Tranche B 1LN, term loan CME Term SOFR 1 Month Index + 2.250% 7.0954% 9/11/31 (b)(c)(d) | | 1,735,794 | 1,731,992 |
TOTAL HOMEBUILDERS/REAL ESTATE | | | 5,218,323 |
| Hotels - 1.3% | | | |
| BRE/Everbright M6 Borrower LLC Tranche B 1LN, term loan CME Term SOFR 1 Month Index + 5.000% 10.0648% 9/9/26 (b)(c)(d) | | 955,381 | 955,534 |
| Four Seasons Hotels Ltd. Tranche B 1LN, term loan CME Term SOFR 1 Month Index + 1.750% 6.6053% 11/30/29 (b)(c)(d) | | 3,626,992 | 3,624,417 |
| Hilton Grand Vacations Borrower LLC Tranche B 1LN, term loan: | | | |
| CME Term SOFR 1 Month Index + 2.750% 7.0954% 1/17/31 (b)(c)(d) | | 2,004,925 | 1,987,382 |
| CME Term SOFR 1 Month Index + 3.000% 7.3454% 8/2/28 (b)(c)(d) | | 7,366,421 | 7,315,814 |
| Hilton Worldwide Finance LLC Tranche B 1LN, term loan CME Term SOFR 1 Month Index + 1.750% 6.6048% 11/8/30 (b)(c)(d) | | 1,292,849 | 1,292,112 |
| Marriott Ownership Resorts, Inc. Tranche B 1LN, term loan CME Term SOFR 1 Month Index + 2.250% 7.0954% 4/1/31 (b)(c)(d) | | 1,446,375 | 1,441,862 |
| Travelport Finance Luxembourg SARL 1LN, term loan CME Term SOFR 3 Month Index + 7.000% 13.5932% 9/29/28 (b)(c)(d) | | 2,235,800 | 1,926,701 |
TOTAL HOTELS | | | 18,543,822 |
| Insurance - 5.9% | | | |
| Acrisure LLC Tranche B6 1LN, term loan CME Term SOFR 3 Month Index + 3.250% 8.2109% 11/6/30 (b)(c)(d) | | 17,136,162 | 16,954,176 |
| AmWINS Group, Inc. Tranche B 1LN, term loan CME Term SOFR 1 Month Index + 2.250% 7.2099% 2/19/28 (b)(c)(d) | | 4,173,622 | 4,165,316 |
| Amynta Agency Borrower, Inc. Tranche B 1LN, term loan CME Term SOFR 1 Month Index + 3.750% 9.0021% 2/28/28 (b)(c)(d) | | 1,837,389 | 1,836,250 |
| AssuredPartners, Inc. Tranche B5 1LN, term loan CME Term SOFR 1 Month Index + 3.500% 8.3454% 2/14/31 (b)(c)(d) | | 5,937,703 | 5,930,697 |
| Asurion LLC: | | | |
| 1LN, term loan CME Term SOFR 1 Month Index + 4.000% 8.9454% 8/19/28 (b)(c)(d) | | 1,521,445 | 1,495,094 |
| Tranche B11 1LN, term loan CME Term SOFR 1 Month Index + 4.250% 9.1954% 8/19/28 (b)(c)(d) | | 2,143,879 | 2,109,813 |
| Tranche B12 1LN, term loan CME Term SOFR 1 Month Index + 4.250% 9.0954% 9/12/30 (b)(c)(d) | | 214,316 | 210,298 |
| Tranche B3 2LN, term loan CME Term SOFR 1 Month Index + 5.250% 10.2099% 1/31/28 (b)(c)(d) | | 10,485,000 | 9,801,588 |
| Tranche B4 2LN, term loan CME Term SOFR 1 Month Index + 5.250% 10.2099% 1/20/29 (b)(c)(d) | | 20,000,000 | 18,443,800 |
| Tranche B9 1LN, term loan CME Term SOFR 1 Month Index + 3.250% 8.2099% 7/31/27 (b)(c)(d) | | 931,471 | 917,629 |
| HUB International Ltd. Tranche B 1LN, term loan CME Term SOFR 3 Month Index + 3.000% 8.2554% 6/20/30 (b)(c)(d) | | 9,652,464 | 9,637,020 |
| Truist Insurance Holdings LLC: | | | |
| 2L, term loan CME Term SOFR 3 Month Index + 4.750% 9.3537% 3/8/32 (b)(c)(d) | | 4,735,000 | 4,806,025 |
| Tranche B 1LN, term loan CME Term SOFR 3 Month Index + 3.250% 7.8537% 5/6/31 (b)(c)(d) | | 5,550,000 | 5,536,125 |
| USI, Inc. Tranche B 1LN, term loan CME Term SOFR 3 Month Index + 2.750% 7.3537% 9/27/30 (b)(c)(d) | | 2,316,659 | 2,308,597 |
TOTAL INSURANCE | | | 84,152,428 |
| Leisure - 2.5% | | | |
| Alterra Mountain Co. Tranche B 1LN, term loan CME Term SOFR 1 Month Index + 3.250% 8.0954% 8/17/28 (b)(c)(d) | | 2,789,727 | 2,792,042 |
| America Sports Co. Tranche B 1LN, term loan CME Term SOFR 3 Month Index + 3.250% 7.8455% 2/17/31 (b)(c)(d) | | 1,122,188 | 1,123,590 |
| Arcis Golf LLC Tranche B 1LN, term loan CME Term SOFR 1 Month Index + 3.750% 8.7099% 11/24/28 (b)(c)(d) | | 848,023 | 849,787 |
| Bulldog Purchaser, Inc. Tranche B 1LN, term loan CME Term SOFR 3 Month Index + 4.250% 8.8537% 6/30/31 (b)(c)(d) | | 1,095,000 | 1,099,106 |
| Carnival Corp. Tranche B 1LN, term loan CME Term SOFR 1 Month Index + 2.750% 7.5954% 10/18/28 (b)(c)(d) | | 4,493,306 | 4,496,137 |
| City Football Group Ltd. Tranche B 1LN, term loan CME Term SOFR 1 Month Index + 3.500% 7.969% 7/21/30 (b)(c)(d) | | 6,390,827 | 6,348,200 |
| ClubCorp Holdings, Inc. Tranche B 1LN, term loan CME Term SOFR 3 Month Index + 5.000% 9.8653% 9/18/26 (b)(c)(d) | | 2,481,451 | 2,482,791 |
| Crown Finance U.S., Inc. 1LN, term loan CME Term SOFR 1 Month Index + 8.500% 13.4599% 7/31/28 (b)(c)(d) | | 2,577,301 | 2,607,172 |
| Fitness International LLC Tranche B 1LN, term loan CME Term SOFR 3 Month Index + 5.250% 10.5054% 2/12/29 (b)(c)(d) | | 1,353,200 | 1,348,126 |
| Herschend Entertainment Co. LLC Tranche B 1LN, term loan CME Term SOFR 1 Month Index + 3.750% 7.8454% 8/27/28 (b)(c)(d) | | 795,178 | 795,178 |
| Lids Holdings, Inc. 1LN, term loan CME Term SOFR 3 Month Index + 5.500% 10.6143% 12/14/26 (b)(c)(d) | | 1,543,653 | 1,528,217 |
| Tait LLC 1LN, term loan CME Term SOFR 1 Month Index + 4.500% 8/14/31 (c)(d)(g) | | 940,000 | 941,175 |
| Topgolf Callaway Brands Corp. Tranche B 1LN, term loan CME Term SOFR 1 Month Index + 3.000% 7.8454% 3/18/30 (b)(c)(d) | | 3,973,550 | 3,911,483 |
| United PF Holdings LLC: | | | |
| 1LN, term loan CME Term SOFR 3 Month Index + 4.000% 9.5137% 12/30/26 (b)(c)(d) | | 4,282,766 | 3,899,115 |
| 2LN, term loan 3 month U.S. LIBOR + 8.500% 14.0137% 12/30/27 (b)(c)(d) | | 750,000 | 542,498 |
| Tranche B 1LN, term loan CME Term SOFR 3 Month Index + 8.500% 14.0137% 12/30/26 (b)(c)(d) | | 924,000 | 868,560 |
TOTAL LEISURE | | | 35,633,177 |
| Metals/Mining - 0.1% | | | |
| Arsenal AIC Parent LLC Tranche B 1LN, term loan CME Term SOFR 1 Month Index + 3.250% 8.0954% 8/19/30 (b)(c)(d) | | 2,079,066 | 2,074,907 |
| Paper - 0.9% | | | |
| Ahlstrom-Munksjo OYJ 1LN, term loan CME Term SOFR 3 Month Index + 4.000% 8.6153% 2/4/28 (b)(c)(d) | | 922,489 | 920,183 |
| Clydesdale Acquisition Holdings, Inc. 1LN, term loan CME Term SOFR 1 Month Index + 3.670% 8.0204% 4/13/29 (b)(c)(d) | | 12,116,678 | 12,047,976 |
TOTAL PAPER | | | 12,968,159 |
| Publishing/Printing - 0.5% | | | |
| Century DE Buyer LLC 1LN, term loan CME Term SOFR 3 Month Index + 4.000% 9.2554% 10/30/30 (b)(c)(d) | | 2,174,075 | 2,167,727 |
| Learning Care Group (U.S.) No 2, Inc. Tranche B 1LN, term loan CME Term SOFR 3 Month Index + 4.000% 9.214% 8/11/28 (b)(c)(d) | | 1,608,791 | 1,615,837 |
| RLG Holdings LLC: | | | |
| 2LN, term loan CME Term SOFR 1 Month Index + 7.500% 12.4599% 7/2/29 (b)(c)(d) | | 590,000 | 529,159 |
| Tranche B 1LN, term loan CME Term SOFR 1 Month Index + 4.250% 9.2099% 7/8/28 (b)(c)(d) | | 825,234 | 802,540 |
| Vericast Corp. 1LN, term loan CME Term SOFR 1 Month Index + 7.750% 12.3537% 6/15/30 (b)(c)(d) | | 1,628,440 | 1,579,587 |
TOTAL PUBLISHING/PRINTING | | | 6,694,850 |
| Railroad - 0.4% | | | |
| AIT Worldwide Logistics Holdings, Inc. 1LN, term loan CME Term SOFR 1 Month Index + 4.750% 9.9681% 4/6/28 (b)(c)(d) | | 2,001,269 | 2,001,269 |
| Genesee & Wyoming, Inc. Tranche B 1LN, term loan CME Term SOFR 3 Month Index + 2.000% 6.6037% 4/10/31 (b)(c)(d) | | 2,595,000 | 2,588,513 |
| Wwex Unified Topco Holdings LLC 1LN, term loan CME Term SOFR 3 Month Index + 4.250% 8.8653% 7/26/28 (b)(c)(d) | | 1,589,681 | 1,596,135 |
TOTAL RAILROAD | | | 6,185,917 |
| Restaurants - 1.2% | | | |
| 1011778 BC ULC Tranche B5 1LN, term loan CME Term SOFR 1 Month Index + 1.750% 6.5954% 9/23/30 (b)(c)(d) | | 3,384,659 | 3,347,191 |
| Dave & Buster's, Inc. Tranche B 1LN, term loan: | | | |
| CME Term SOFR 1 Month Index + 3.250% 9/26/31 (c)(d)(g) | | 1,845,000 | 1,826,550 |
| CME Term SOFR 1 Month Index + 3.250% 7.875% 6/29/29 (b)(c)(d) | | 807,651 | 803,952 |
| Flynn Restaurant Group LP Tranche B 1LN, term loan CME Term SOFR 1 Month Index + 4.250% 9.2099% 12/1/28 (b)(c)(d) | | 697,634 | 699,434 |
| KFC Holding Co. Tranche B 1LN, term loan CME Term SOFR 1 Month Index + 1.750% 6.8788% 3/15/28 (b)(c)(d) | | 651,222 | 652,850 |
| Pacific Bells LLC Tranche B 1LN, term loan CME Term SOFR 3 Month Index + 4.500% 9.3653% 11/10/28 (b)(c)(d) | | 555,517 | 555,517 |
| PFC Acquisition Corp. Tranche B 1LN, term loan CME Term SOFR 3 Month Index + 6.250% 11.6521% 3/1/26 (b)(c)(d) | | 1,951,619 | 1,894,691 |
| Raising Cane's Restaurants LLC Tranche B 1LN, term loan CME Term SOFR 1 Month Index + 2.000% 7.0143% 9/10/31 (b)(c)(d) | | 470,000 | 469,709 |
| Restaurant Technologies, Inc. Tranche B 1LN, term loan CME Term SOFR 3 Month Index + 4.250% 8.9706% 4/1/29 (b)(c)(d) | | 2,390,186 | 2,261,283 |
| Whatabrands LLC Tranche B 1LN, term loan CME Term SOFR 1 Month Index + 2.750% 7.5954% 8/3/28 (b)(c)(d) | | 5,442,013 | 5,431,565 |
TOTAL RESTAURANTS | | | 17,942,742 |
| Services - 10.1% | | | |
| ABG Intermediate Holdings 2 LLC Tranche B1 1LN, term loan CME Term SOFR 1 Month Index + 2.750% 7.5954% 12/21/28 (b)(c)(d) | | 8,619,979 | 8,623,599 |
| AEA International Holdings Luxembourg SARL Tranche B 1LN, term loan CME Term SOFR 1 Month Index + 2.750% 7.3537% 9/7/28 (b)(c)(d) | | 1,084,427 | 1,083,071 |
| AI Aqua Merger Sub, Inc. Tranche B 1LN, term loan 1 month U.S. LIBOR + 4.000% 8.7006% 7/30/28 (b)(c)(d) | | 7,012,663 | 7,002,074 |
| Allied Universal Holdco LLC Tranche B 1LN, term loan CME Term SOFR 1 Month Index + 3.750% 8.6954% 5/14/28 (b)(c)(d) | | 9,933,240 | 9,831,821 |
| Anticimex Global AB: | | | |
| Tranche B 1LN, term loan CME Term SOFR 1 Month Index + 3.500% 8.75% 11/16/28 (b)(c)(d) | | 954,145 | 952,953 |
| Tranche B1 1LN, term loan CME Term SOFR 3 Month Index + 3.500% 8.48% 11/16/28 (b)(c)(d) | | 3,396,953 | 3,391,280 |
| APX Group, Inc. Tranche B 1LN, term loan CME Term SOFR 1 Month Index + 2.750% 8.0353% 7/9/28 (b)(c)(d) | | 2,546,356 | 2,544,370 |
| Aramark Services, Inc. Tranche B8 1LN, term loan CME Term SOFR 1 Month Index + 2.000% 6.8454% 6/24/30 (b)(c)(d) | | 3,074,851 | 3,079,464 |
| Archkey Holdings, Inc. Tranche B 1LN, term loan CME Term SOFR 1 Month Index + 5.250% 10.2099% 6/30/28 (b)(c)(d) | | 1,801,700 | 1,803,574 |
| Artera Services LLC Tranche B 1LN, term loan CME Term SOFR 3 Month Index + 4.500% 9.1037% 2/10/31 (b)(c)(d) | | 2,532,275 | 2,462,232 |
| Ascend Learning LLC: | | | |
| 2LN, term loan CME Term SOFR 1 Month Index + 5.750% 10.6954% 12/10/29 (b)(c)(d) | | 2,705,000 | 2,613,706 |
| Tranche B 1LN, term loan CME Term SOFR 1 Month Index + 3.500% 8.4454% 12/10/28 (b)(c)(d) | | 5,709,412 | 5,680,466 |
| Avis Budget Car Rental LLC Tranche C 1LN, term loan CME Term SOFR 1 Month Index + 3.000% 7.9454% 3/16/29 (b)(c)(d) | | 837,711 | 837,192 |
| Bifm California Buyer, Inc. Tranche 1LN, term loan CME Term SOFR 1 Month Index + 4.250% 9.0954% 5/31/28 (b)(c)(d) | | 1,756,175 | 1,761,672 |
| Brand Industrial Services, Inc. Tranche B 1LN, term loan CME Term SOFR 3 Month Index + 4.500% 9.7477% 8/1/30 (b)(c)(d) | | 6,771,039 | 6,574,273 |
| Brock Holdings Iii LLC Tranche B 1LN, term loan CME Term SOFR 3 Month Index + 6.000% 10.6037% 5/2/30 (b)(c)(d) | | 940,000 | 945,875 |
| Cast & Crew Payroll LLC Tranche B 1LN, term loan CME Term SOFR 1 Month Index + 3.750% 8.5954% 12/30/28 (b)(c)(d) | | 3,987,231 | 3,992,454 |
| CHG Healthcare Services, Inc.: | | | |
| 1LN, term loan CME Term SOFR 1 Month Index + 3.500% 8.4599% 9/30/28 (b)(c)(d) | | 949,411 | 949,164 |
| Tranche B 2LN, term loan CME Term SOFR 1 Month Index + 3.500% 8.4599% 9/29/28 (b)(c)(d) | | 1,117,186 | 1,118,270 |
| CoreLogic, Inc. Tranche B 1LN, term loan CME Term SOFR 1 Month Index + 3.500% 8.4599% 6/2/28 (b)(c)(d) | | 7,027,121 | 6,946,801 |
| Ensemble RCM LLC Tranche B 1LN, term loan CME Term SOFR 3 Month Index + 3.000% 8.2521% 8/1/29 (b)(c)(d) | | 3,747,606 | 3,750,455 |
| Filtration Group Corp. Tranche B 1LN, term loan CME Term SOFR 1 Month Index + 3.500% 8.4599% 10/21/28 (b)(c)(d) | | 2,111,217 | 2,110,625 |
| Flexera Software LLC Tranche B 1LN, term loan CME Term SOFR 1 Month Index + 3.500% 8.4609% 3/3/28 (b)(c)(d) | | 2,945,426 | 2,944,926 |
| Galaxy U.S. Opco, Inc. 1LN, term loan CME Term SOFR 3 Month Index + 4.750% 10.0021% 4/29/29 (b)(c)(d) | | 2,118,187 | 1,770,677 |
| Genesys Cloud Services Holdings II LLC Tranche B 1LN, term loan CME Term SOFR 1 Month Index + 3.500% 8.3454% 12/1/27 (b)(c)(d) | | 1,866,945 | 1,868,961 |
| HomeServe U.S.A. Corp. Tranche B 1LN, term loan CME Term SOFR 1 Month Index + 2.500% 7.2109% 10/21/30 (b)(c)(d) | | 1,625,326 | 1,621,263 |
| Ion Trading Finance Ltd. 1LN, term loan CME Term SOFR 3 Month Index + 4.000% 9.0157% 4/3/28 (b)(c)(d) | | 1,532,149 | 1,531,582 |
| KUEHG Corp. Tranche B 1LN, term loan CME Term SOFR 3 Month Index + 4.500% 9.1037% 6/12/30 (b)(c)(d) | | 7,425,188 | 7,441,671 |
| Neptune BidCo U.S., Inc. Tranche B 1LN, term loan CME Term SOFR 3 Month Index + 5.000% 10.404% 4/11/29 (b)(c)(d) | | 7,936,875 | 7,435,185 |
| Omnia Partners LLC Tranche B 1LN, term loan CME Term SOFR 1 Month Index + 3.750% 8.5292% 7/25/30 (b)(c)(d) | | 3,636,053 | 3,643,179 |
| Optiv Security, Inc. Tranche B 1LN, term loan CME Term SOFR 3 Month Index + 5.250% 10.5292% 7/31/26 (b)(c)(d) | | 2,642,626 | 2,379,473 |
| PG Polaris BidCo Sarl Tranche B 1LN, term loan CME Term SOFR 3 Month Index + 3.500% 8.1037% 3/24/31 (b)(c)(d) | | 3,147,113 | 3,150,071 |
| Planet U.S. Buyer LLC Tranche B 1LN, term loan CME Term SOFR 3 Month Index + 3.500% 8.6042% 2/10/31 (b)(c)(d) | | 2,119,688 | 2,121,807 |
| Sabert Corp. Tranche B 1LN, term loan CME Term SOFR 1 Month Index + 3.000% 8.0344% 12/10/26 (b)(c)(d) | | 1,010,680 | 1,013,843 |
| Sedgwick Claims Management Services, Inc. Tranche B 1LN, term loan CME Term SOFR 3 Month Index + 3.000% 8.2521% 7/31/31 (b)(c)(d) | | 2,339,154 | 2,333,891 |
| Sotheby's Tranche B 1LN, term loan CME Term SOFR 3 Month Index + 4.500% 10.063% 1/15/27 (b)(c)(d) | | 1,440,153 | 1,420,581 |
| Spin Holdco, Inc. Tranche B 1LN, term loan CME Term SOFR 3 Month Index + 4.000% 9.256% 3/4/28 (b)(c)(d) | | 10,576,431 | 9,219,157 |
| Staples, Inc. Tranche B 1LN, term loan CME Term SOFR 3 Month Index + 5.750% 10.6886% 9/10/29 (b)(c)(d) | | 6,445,000 | 5,847,677 |
| STS Operating, Inc. 1LN, term loan CME Term SOFR 1 Month Index + 4.000% 8.9454% 3/25/31 (b)(c)(d) | | 3,586,975 | 3,560,073 |
| The GEO Group, Inc. Tranche B 1LN, term loan CME Term SOFR 1 Month Index + 5.250% 10.0954% 4/14/29 (b)(c)(d) | | 1,582,208 | 1,605,941 |
| United Rentals North America, Inc. Tranche B 1LN, term loan CME Term SOFR 1 Month Index + 1.750% 6.5954% 2/14/31 (b)(c)(d) | | 1,572,100 | 1,581,533 |
| Vestis Corp. Tranche B 1LN, term loan CME Term SOFR 3 Month Index + 2.250% 7.3711% 2/24/31 (b)(c)(d) | | 1,936,813 | 1,922,286 |
| Wellful, Inc. Tranche B 1LN, term loan CME Term SOFR 1 Month Index + 6.250% 11.2099% 4/21/27 (b)(c)(d) | | 1,998,730 | 1,219,225 |
| WMB Holdings, Inc. Tranche B 1LN, term loan CME Term SOFR 1 Month Index + 3.250% 7.3454% 11/3/29 (b)(c)(d) | | 716,422 | 716,422 |
TOTAL SERVICES | | | 144,404,815 |
| Super Retail - 3.0% | | | |
| Academy Ltd. Tranche B 1LN, term loan CME Term SOFR 1 Month Index + 3.750% 9.065% 11/6/27 (b)(c)(d) | | 829,306 | 827,232 |
| At Home Group, Inc. Tranche B 1LN, term loan CME Term SOFR 1 Month Index + 4.250% 9.565% 7/24/28 (b)(c)(d) | | 1,624,564 | 701,942 |
| Empire Today LLC Tranche B 1LN, term loan CME Term SOFR 3 Month Index + 5.000% 10.5137% 4/1/28 (b)(c)(d) | | 1,850,631 | 1,114,080 |
| Great Outdoors Group LLC Tranche B 1LN, term loan CME Term SOFR 1 Month Index + 3.750% 8.7099% 3/5/28 (b)(c)(d) | | 37,237,581 | 37,198,844 |
| Harbor Freight Tools U.S.A., Inc. Tranche B 1LN, term loan CME Term SOFR 1 Month Index + 2.500% 7.3331% 6/5/31 (b)(c)(d) | | 715,000 | 703,496 |
| LBM Acquisition LLC Tranche B 1LN, term loan CME Term SOFR 1 Month Index + 3.750% 8.968% 6/6/31 (b)(c)(d) | | 2,075,404 | 2,032,610 |
TOTAL SUPER RETAIL | | | 42,578,204 |
| Technology - 15.5% | | | |
| Acuris Finance U.S., Inc. term loan CME Term SOFR 1 Month Index + 3.750% 8.418% 2/16/28 (b)(c)(d) | | 702,764 | 701,450 |
| Ahead DB Holdings LLC Tranche B3 1LN, term loan CME Term SOFR 1 Month Index + 3.500% 8.1037% 2/3/31 (b)(c)(d) | | 1,490,415 | 1,491,264 |
| Amentum Holdings, Inc. 1LN, term loan CME Term SOFR 1 Month Index + 2.250% 7/30/31 (c)(d)(g) | | 6,870,000 | 6,844,238 |
| Anastasia Parent LLC Tranche B, term loan CME Term SOFR 3 Month Index + 3.750% 8.6153% 8/10/25 (b)(c)(d) | | 4,493,687 | 3,209,886 |
| Applied Systems, Inc. Tranche B 1LN, term loan CME Term SOFR 3 Month Index + 3.500% 7.6037% 2/24/31 (b)(c)(d) | | 1,461,338 | 1,461,527 |
| Athenahealth Group, Inc. Tranche B 1LN, term loan CME Term SOFR 1 Month Index + 3.250% 8.0954% 2/15/29 (b)(c)(d) | | 9,243,335 | 9,175,951 |
| BYJU's Alpha, Inc.: | | | |
| term loan: | | | |
CME Term SOFR 3 Month Index + 8.000% 12.8454% 4/9/26 (b)(c)(d)(e) | | 52,472 | 52,472 |
CME Term SOFR 3 Month Index + 8.000% 12.8454% 4/9/26 (b)(c)(d)(e) | | 15,372 | 15,372 |
| Tranche B 1LN, term loan 3 month U.S. LIBOR + 8.000% 15.5% 11/24/26 (b)(c)(d)(f) | | 3,023,738 | 650,104 |
| Tranche DD 2 term loan CME Term SOFR 1 Month Index + 8.000% 6.4861% 4/9/26 (b)(c)(d)(e)(h) | | 52,250 | 52,250 |
| Camelot U.S. Acquisition LLC Tranche B 1LN, term loan CME Term SOFR 1 Month Index + 2.750% 7.5954% 1/31/31 (b)(c)(d) | | 4,255,770 | 4,247,259 |
| Cloud Software Group, Inc. Tranche B 1LN, term loan: | | | |
| CME Term SOFR 3 Month Index + 4.000% 8.6037% 3/29/29 (b)(c)(d) | | 8,675,879 | 8,633,368 |
| CME Term SOFR 3 Month Index + 4.500% 9.1037% 3/24/31 (b)(c)(d) | | 1,105,000 | 1,107,298 |
| Coherent Corp. Tranche B 1LN, term loan CME Term SOFR 1 Month Index + 2.500% 7.3454% 7/2/29 (b)(c)(d) | | 3,888,280 | 3,884,625 |
| ConnectWise LLC Tranche B 1LN, term loan CME Term SOFR 3 Month Index + 3.500% 8.3653% 9/30/28 (b)(c)(d) | | 3,972,091 | 3,962,161 |
| Constant Contact, Inc. Tranche B 1LN, term loan CME Term SOFR 3 Month Index + 4.000% 9.5657% 2/10/28 (b)(c)(d) | | 2,510,265 | 2,423,460 |
| Cotiviti, Inc.: | | | |
| Tranche 1LN, term loan 7.625% 5/1/31 (d) | | 965,000 | 968,619 |
| Tranche B 1LN, term loan CME Term SOFR 1 Month Index + 3.250% 8.4506% 5/1/31 (b)(c)(d) | | 5,741,150 | 5,733,974 |
| Dayforce, Inc. Tranche B 1LN, term loan CME Term SOFR 1 Month Index + 2.500% 7.3454% 3/3/31 (b)(c)(d) | | 1,311,713 | 1,308,433 |
| DCert Buyer, Inc.: | | | |
| 1LN, term loan CME Term SOFR 1 Month Index + 4.000% 8.8454% 10/16/26 (b)(c)(d) | | 4,766,982 | 4,618,776 |
| Tranche B 2LN, term loan CME Term SOFR 1 Month Index + 7.000% 11.8454% 2/19/29 (b)(c)(d) | | 4,508,409 | 3,845,042 |
| DG Investment Intermediate Holdings, Inc.: | | | |
| 2LN, term loan CME Term SOFR 1 Month Index + 6.750% 11.7099% 3/31/29 (b)(c)(d) | | 630,000 | 587,670 |
| Tranche B 1LN, term loan CME Term SOFR 1 Month Index + 3.750% 8.7099% 3/31/28 (b)(c)(d) | | 2,712,314 | 2,700,461 |
| Tranche DD 1LN, term loan CME Term SOFR 1 Month Index + 3.750% 3/31/28 (c)(d)(g) | | 120,164 | 119,639 |
| ECL Entertainment LLC Tranche B 1LN, term loan CME Term SOFR 1 Month Index + 4.000% 8.8454% 8/30/30 (b)(c)(d) | | 1,162,112 | 1,164,657 |
| Ellucian, Inc. Tranche B 1LN, term loan CME Term SOFR 1 Month Index + 3.500% 8.4454% 10/7/29 (b)(c)(d) | | 3,671,432 | 3,678,885 |
| Epicor Software Corp.: | | | |
| 1LN, term loan CME Term SOFR 1 Month Index + 3.250% 8.0954% 5/23/31 (b)(c)(d) | | 2,882,857 | 2,883,837 |
| Tranche DD 1LN, term loan CME Term SOFR 3 Month Index + 3.250% 5/23/31 (c)(d)(h) | | 338,241 | 338,356 |
| Gen Digital, Inc. Tranche B 1LN, term loan CME Term SOFR 1 Month Index + 1.750% 6.5954% 9/12/29 (b)(c)(d) | | 4,817,162 | 4,800,976 |
| Go Daddy Operating Co. LLC: | | | |
| Tranche B5 1LN, term loan CME Term SOFR 1 Month Index + 2.000% 6.8454% 11/12/29 (b)(c)(d) | | 1,391,782 | 1,389,750 |
| Tranche B7 1LN, term loan CME Term SOFR 1 Month Index + 1.750% 6.5954% 6/2/31 (b)(c)(d) | | 1,750,613 | 1,745,501 |
| Icon Luxembourg Sarl Tranche B 1LN, term loan: | | | |
| CME Term SOFR 3 Month Index + 2.000% 6.6037% 7/3/28 (b)(c)(d) | | 1,412,324 | 1,418,751 |
| CME Term SOFR 3 Month Index + 2.000% 6.6037% 7/3/28 (b)(c)(d) | | 351,881 | 353,483 |
| Leia Finco U.S. LLC: | | | |
| 1LN, term loan CME Term SOFR 1 Month Index + 3.250% 7/2/31 (c)(d)(g) | | 3,605,000 | 3,545,409 |
| 2LN, term loan CME Term SOFR 1 Month Index + 5.250% 7/2/32 (c)(d)(g) | | 1,050,000 | 1,023,099 |
| Lightning Power LLC Tranche B 1LN, term loan CME Term SOFR 1 Month Index + 3.250% 8.3455% 8/18/31 (b)(c)(d) | | 3,415,000 | 3,420,225 |
| Madison Safety & Flow LLC Tranche B 1LN, term loan CME Term SOFR 1 Month Index + 3.250% 9/19/31 (c)(d)(g) | | 665,000 | 664,169 |
| McAfee Corp. Tranche B 1LN, term loan CME Term SOFR 1 Month Index + 3.250% 8.4506% 3/1/29 (b)(c)(d) | | 7,772,695 | 7,736,241 |
| MH Sub I LLC: | | | |
| Tranche B 1LN, term loan CME Term SOFR 1 Month Index + 4.250% 9.0954% 5/3/28 (b)(c)(d) | | 12,510,483 | 12,422,659 |
| Tranche B 2LN, term loan CME Term SOFR 3 Month Index + 6.250% 11.5021% 2/23/29 (b)(c)(d) | | 1,030,000 | 1,009,585 |
| Mitchell International, Inc. Tranche B 1LN, term loan CME Term SOFR 1 Month Index + 3.250% 8.0954% 6/17/31 (b)(c)(d) | | 3,710,000 | 3,652,198 |
| MKS Instruments, Inc. Tranche B 1LN, term loan CME Term SOFR 1 Month Index + 2.250% 7.1699% 8/17/29 (b)(c)(d) | | 3,028,974 | 3,025,945 |
| Modena Buyer LLC 1LN, term loan CME Term SOFR 3 Month Index + 4.500% 9.1037% 7/1/31 (b)(c)(d) | | 7,255,000 | 6,930,049 |
| NCR Atleos Corp. Tranche B 1LN, term loan CME Term SOFR 3 Month Index + 4.750% 10.1021% 3/27/29 (b)(c)(d) | | 1,873,075 | 1,889,464 |
| Open Text Corp. Tranche B 1LN, term loan CME Term SOFR 1 Month Index + 2.750% 7.0954% 1/31/30 (b)(c)(d) | | 3,753,671 | 3,765,833 |
| Peraton Corp. Tranche B 1LN, term loan CME Term SOFR 1 Month Index + 3.750% 8.6954% 2/1/28 (b)(c)(d) | | 10,174,214 | 9,769,382 |
| Pitney Bowes, Inc. Tranche B 1LN, term loan CME Term SOFR 1 Month Index + 4.000% 8.9599% 3/19/28 (b)(c)(d) | | 1,115,539 | 1,116,007 |
| Plano Holdco, Inc. Tranche B 1LN, term loan CME Term SOFR 1 Month Index + 3.500% 8/4/31 (c)(d)(g) | | 1,175,000 | 1,175,000 |
| Polaris Newco LLC Tranche B 1LN, term loan CME Term SOFR 3 Month Index + 4.000% 9.5137% 6/2/28 (b)(c)(d) | | 14,642,690 | 14,384,978 |
| Project Alpha Intermediate Holding, Inc. Tranche B 1LN, term loan CME Term SOFR 3 Month Index + 3.750% 9.0021% 10/28/30 (b)(c)(d) | | 4,014,825 | 4,021,209 |
| Project Boost Purchaser LLC: | | | |
| Tranche B 1LN, term loan CME Term SOFR 1 Month Index + 3.500% 8.7861% 7/2/31 (b)(c)(d) | | 1,365,000 | 1,363,840 |
| Tranche B 2LN, term loan CME Term SOFR 3 Month Index + 5.250% 10.5361% 7/17/32 (b)(c)(d) | | 655,000 | 655,544 |
| Proofpoint, Inc. Tranche B 1LN, term loan CME Term SOFR 1 Month Index + 3.000% 7.8454% 8/31/28 (b)(c)(d) | | 4,295,066 | 4,291,888 |
| Rackspace Finance LLC Tranche B 1LN, term loan: | | | |
| CME Term SOFR 1 Month Index + 2.750% 7.9825% 5/15/28 (b)(c)(d) | | 6,174,110 | 3,391,932 |
| CME Term SOFR 1 Month Index + 6.250% 11.4825% 5/15/28 (b)(c)(d) | | 1,438,095 | 1,454,575 |
| RealPage, Inc. Tranche B 1LN, term loan CME Term SOFR 1 Month Index + 3.000% 7.9599% 4/22/28 (b)(c)(d) | | 4,638,024 | 4,498,883 |
| Red Planet Borrower LLC Tranche B 1LN, term loan CME Term SOFR 1 Month Index + 3.750% 8.4454% 9/30/28 (b)(c)(d) | | 2,621,806 | 2,544,803 |
| Renaissance Holdings Corp. Tranche 1LN, term loan CME Term SOFR 3 Month Index + 4.250% 9.0954% 4/8/30 (b)(c)(d) | | 4,381,447 | 4,376,978 |
| Roper Industrial Products Investment Co. 1LN, term loan CME Term SOFR 3 Month Index + 3.250% 7.8537% 11/23/29 (b)(c)(d) | | 1,354,478 | 1,356,415 |
| Sovos Compliance LLC Tranche B 1LN, term loan CME Term SOFR 1 Month Index + 4.500% 9.4599% 8/11/28 (b)(c)(d) | | 1,891,227 | 1,888,655 |
| SS&C Technologies, Inc. Tranche B8 1LN, term loan CME Term SOFR 1 Month Index + 2.000% 6.8454% 5/9/31 (b)(c)(d) | | 4,538,653 | 4,537,882 |
| TTM Technologies, Inc. Tranche B 1LN, term loan CME Term SOFR 1 Month Index + 2.250% 7.4506% 5/30/30 (b)(c)(d) | | 1,568,543 | 1,568,543 |
| UKG, Inc. Tranche B 1LN, term loan CME Term SOFR 3 Month Index + 3.500% 8.5546% 2/10/31 (b)(c)(d) | | 13,941,442 | 13,941,442 |
| VFH Parent LLC Tranche B 1LN, term loan CME Term SOFR 1 Month Index + 2.750% 7.5954% 6/23/31 (b)(c)(d) | | 2,990,000 | 2,990,000 |
| VM Consolidated, Inc. Tranche B2 1LN, term loan CME Term SOFR 1 Month Index + 2.750% 7.5954% 3/27/28 (b)(c)(d) | | 2,232,933 | 2,234,787 |
| VS Buyer LLC Tranche B 1LN, term loan CME Term SOFR 1 Month Index + 3.250% 8.3465% 4/14/31 (b)(c)(d) | | 2,251,643 | 2,250,698 |
| Weber-Stephen Products LLC Tranche B 1LN, term loan: | | | |
| CME Term SOFR 1 Month Index + 3.250% 8.2099% 10/30/27 (b)(c)(d) | | 633,270 | 595,451 |
| CME Term SOFR 1 Month Index + 4.250% 9.1954% 10/30/27 (b)(c)(d) | | 1,413,750 | 1,329,519 |
| Webpros Investments Sarl Tranche B 1LN, term loan CME Term SOFR 1 Month Index + 4.000% 8.8454% 3/19/31 (b)(c)(d) | | 347,377 | 347,811 |
TOTAL TECHNOLOGY | | | 220,740,593 |
| Telecommunications - 2.8% | | | |
| Altice France SA Tranche B14 1LN, term loan CME Term SOFR 3 Month Index + 5.500% 10.8014% 8/15/28 (b)(c)(d) | | 6,649,298 | 4,967,557 |
| Aventiv Technologies LLC: | | | |
| 1LN, term loan: | | | |
CME Term SOFR 3 Month Index + 5.090% 9.9553% 7/31/25 (b)(c)(d) | | 8,763,182 | 7,470,612 |
CME Term SOFR 3 Month Index + 7.500% 12.3653% 7/31/25 (b)(c)(d) | | 226,936 | 227,504 |
| Tranche 2LN, term loan CME Term SOFR 3 Month Index + 8.650% 13.9153% 11/1/25 (b)(c)(d) | | 7,644,449 | 1,949,334 |
| Ciena Corp. Tranche B 1LN, term loan CME Term SOFR 1 Month Index + 2.000% 6.9609% 10/24/30 (b)(c)(d) | | 714,727 | 715,085 |
| Connect U.S. Finco LLC Tranche B 1LN, term loan CME Term SOFR 1 Month Index + 4.500% 9.3454% 9/13/29 (b)(c)(d) | | 1,582,820 | 1,481,123 |
| Crown Subsea Communications Holding, Inc. Tranche B 1LN, term loan CME Term SOFR 3 Month Index + 4.000% 9.2521% 1/30/31 (b)(c)(d) | | 4,797,975 | 4,820,765 |
| Frontier Communications Holdings LLC Tranche B 1LN, term loan CME Term SOFR 6 Month Index + 3.500% 8.763% 7/1/31 (b)(c)(d) | | 4,625,000 | 4,648,125 |
| GTT Communications, Inc. 1LN, term loan CME Term SOFR 3 Month Index + 9.000% 13.9454% 6/30/28 (b)(c)(d) | | 1,717,084 | 1,253,471 |
| Lorca Co.-Borrower LLC Tranche B 1LN, term loan CME Term SOFR 1 Month Index + 3.500% 8.1037% 4/17/31 (b)(c)(d) | | 950,225 | 951,014 |
| Patagonia Holdco LLC Tranche B 1LN, term loan CME Term SOFR 3 Month Index + 5.750% 10.8542% 8/1/29 (b)(c)(d) | | 1,606,087 | 1,488,441 |
| SBA Senior Finance II, LLC Tranche B 1LN, term loan CME Term SOFR 1 Month Index + 2.000% 6.85% 1/27/31 (b)(c)(d) | | 430,537 | 430,636 |
| Windstream Services LLC Tranche B 1LN, term loan CME Term SOFR 1 Month Index + 6.250% 11.1954% 9/21/27 (b)(c)(d) | | 658,563 | 657,463 |
| Zayo Group Holdings, Inc. 1LN, term loan CME Term SOFR 1 Month Index + 3.000% 7.9599% 3/9/27 (b)(c)(d) | | 10,088,135 | 9,199,168 |
TOTAL TELECOMMUNICATIONS | | | 40,260,298 |
| Textiles/Apparel - 0.4% | | | |
| Crocs, Inc. Tranche B 1LN, term loan CME Term SOFR 1 Month Index + 2.250% 6.9273% 2/20/29 (b)(c)(d) | | 2,103,036 | 2,109,619 |
| Fanatics Commerce Intermediate Holdco LLC Tranche B 1LN, term loan CME Term SOFR 1 Month Index + 3.250% 8.2099% 11/23/28 (b)(c)(d) | | 378,428 | 375,904 |
| Tory Burch LLC Tranche B 1LN, term loan CME Term SOFR 1 Month Index + 3.500% 8.2099% 4/16/28 (b)(c)(d) | | 2,854,125 | 2,855,666 |
TOTAL TEXTILES/APPAREL | | | 5,341,189 |
| Transportation Ex Air/Rail - 0.1% | | | |
| ASP LS Acquisition Corp. 2LN, term loan CME Term SOFR 3 Month Index + 7.500% 12.3653% 5/7/29 (b)(c)(d) | | 2,500,000 | 1,005,000 |
| Utilities - 1.1% | | | |
| Osmose Utilities Services, Inc. Tranche B 1LN, term loan CME Term SOFR 1 Month Index + 3.250% 8.2099% 6/23/28 (b)(c)(d) | | 534,326 | 528,982 |
| Pike Corp. Tranche B 1LN, term loan CME Term SOFR 1 Month Index + 3.000% 7.9599% 1/21/28 (b)(c)(d) | | 1,123,630 | 1,127,731 |
| Vertiv Group Corp. Tranche B 1LN, term loan CME Term SOFR 1 Month Index + 2.000% 7.2006% 3/2/27 (b)(c)(d) | | 4,695,316 | 4,697,288 |
| Vistra Operations Co. LLC Tranche B 3LN, term loan CME Term SOFR 1 Month Index + 2.000% 6.8454% 12/20/30 (b)(c)(d) | | 2,700,299 | 2,699,840 |
| WEC U.S. Holdings Ltd. Tranche B 1LN, term loan CME Term SOFR 1 Month Index + 2.750% 7.5954% 1/20/31 (b)(c)(d) | | 6,478,756 | 6,474,933 |
TOTAL UTILITIES | | | 15,528,774 |
| TOTAL BANK LOAN OBLIGATIONS (Cost $1,292,039,755) | | | 1,239,002,487 |
| | | | |
| Nonconvertible Bonds - 5.4% |
| | | Principal Amount (a) | Value ($) |
| Air Transportation - 0.1% | | | |
| American Airlines, Inc. / AAdvantage Loyalty IP Ltd. 5.5% 4/20/26 (i) | | 644,583 | 642,745 |
| Delta Air Lines, Inc. / SkyMiles IP Ltd. 4.5% 10/20/25 (i) | | 340,625 | 338,552 |
TOTAL AIR TRANSPORTATION | | | 981,297 |
| Automotive & Auto Parts - 0.8% | | | |
| Clarios Global LP / Clarios U.S. Finance Co. 6.75% 5/15/28 (i) | | 1,205,000 | 1,242,059 |
| Ford Motor Credit Co. LLC U.S. Secured Overnight Fin. Rate (SOFR) Index + 2.950% 8.1218% 3/6/26 (b)(c) | | 1,650,000 | 1,691,958 |
| Rivian Holdco & Rivian LLC & Rivian Automotive LLC CME Term SOFR 6 Month Index + 6.050% 11.3595% 10/15/26 (b)(c)(i) | | 8,895,000 | 8,961,713 |
TOTAL AUTOMOTIVE & AUTO PARTS | | | 11,895,730 |
| Broadcasting - 0.4% | | | |
| DISH Network Corp. 11.75% 11/15/27 (i) | | 3,570,000 | 3,746,823 |
| Univision Communications, Inc.: | | | |
| 6.625% 6/1/27 (i) | | 1,205,000 | 1,206,475 |
| 8% 8/15/28 (i) | | 840,000 | 858,871 |
TOTAL BROADCASTING | | | 5,812,169 |
| Building Materials - 0.1% | | | |
| Smyrna Ready Mix Concrete LLC 8.875% 11/15/31 (i) | | 1,365,000 | 1,472,417 |
| Cable/Satellite TV - 0.2% | | | |
| CCO Holdings LLC/CCO Holdings Capital Corp. 5.375% 6/1/29 (i) | | 3,160,000 | 3,045,270 |
| Capital Goods - 0.0% | | | |
| Chart Industries, Inc. 7.5% 1/1/30 (i) | | 330,000 | 347,796 |
| Chemicals - 0.1% | | | |
| Olympus Water U.S. Holding Corp. 9.75% 11/15/28 (i) | | 1,220,000 | 1,302,056 |
| Consumer Products - 0.0% | | | |
| Wayfair LLC 7.25% 10/31/29 (i)(j) | | 140,000 | 143,424 |
| Energy - 0.4% | | | |
| Citgo Petroleum Corp.: | | | |
| 6.375% 6/15/26 (i) | | 1,000,000 | 1,000,313 |
| 7% 6/15/25 (i) | | 1,050,000 | 1,049,335 |
| New Fortress Energy, Inc. 6.5% 9/30/26 (i) | | 3,160,000 | 2,655,403 |
| Transocean Poseidon Ltd. 6.875% 2/1/27 (i) | | 684,000 | 682,870 |
TOTAL ENERGY | | | 5,387,921 |
| Gaming - 0.9% | | | |
| Caesars Entertainment, Inc. 7% 2/15/30 (i) | | 1,465,000 | 1,530,480 |
| Fertitta Entertainment LLC / Fertitta Entertainment Finance Co., Inc. 4.625% 1/15/29 (i) | | 10,240,000 | 9,777,441 |
| Ontario Gaming GTA LP / OTG Co. issuer, Inc. 8% 8/1/30 (i) | | 80,000 | 83,138 |
| VICI Properties LP / VICI Note Co.: | | | |
| 3.5% 2/15/25 (i) | | 240,000 | 237,983 |
| 4.25% 12/1/26 (i) | | 345,000 | 341,645 |
| 4.625% 12/1/29 (i) | | 200,000 | 196,198 |
TOTAL GAMING | | | 12,166,885 |
| Healthcare - 0.0% | | | |
| Medline Borrower LP / Medline Co. 6.25% 4/1/29 (i) | | 495,000 | 510,014 |
| Homebuilders/Real Estate - 0.3% | | | |
| MPT Operating Partnership LP/MPT Finance Corp. 5% 10/15/27 | | 2,400,000 | 2,152,987 |
| Uniti Group LP/Uniti Group Finance, Inc./CSL Capital LLC 10.5% 2/15/28 (i) | | 2,545,000 | 2,716,548 |
TOTAL HOMEBUILDERS/REAL ESTATE | | | 4,869,535 |
| Insurance - 0.2% | | | |
| Acrisure LLC / Acrisure Finance, Inc. 7.5% 11/6/30 (i) | | 2,235,000 | 2,300,027 |
| Leisure - 0.0% | | | |
| Carnival Corp. 7.625% 3/1/26 (i) | | 620,000 | 625,738 |
| Metals/Mining - 0.0% | | | |
| Arsenal AIC Parent LLC 8% 10/1/30 (i) | | 90,000 | 96,577 |
| Paper - 0.1% | | | |
| Ardagh Metal Packaging Finance U.S.A. LLC/Ardagh Metal Packaging Finance PLC 3.25% 9/1/28 (i) | | 895,000 | 819,264 |
| Services - 0.1% | | | |
| Brand Industrial Services, Inc. 10.375% 8/1/30 (i) | | 600,000 | 642,511 |
| The GEO Group, Inc. 8.625% 4/15/29 | | 310,000 | 322,271 |
TOTAL SERVICES | | | 964,782 |
| Super Retail - 0.2% | | | |
| Carvana Co. 5.625% 10/1/25 (i) | | 859,000 | 842,597 |
| EG Global Finance PLC 12% 11/30/28 (i) | | 2,380,000 | 2,656,225 |
TOTAL SUPER RETAIL | | | 3,498,822 |
| Technology - 0.4% | | | |
| Acuris Finance U.S. 9% 8/1/29 (i) | | 955,000 | 959,775 |
| Cloud Software Group, Inc.: | | | |
| 8.25% 6/30/32 (i) | | 1,734,000 | 1,812,548 |
| 9% 9/30/29 (i) | | 1,370,000 | 1,394,126 |
| Helios Software Holdings, Inc. / ION Corporate Solutions Finance Sarl 8.75% 5/1/29 (i) | | 1,135,000 | 1,159,985 |
TOTAL TECHNOLOGY | | | 5,326,434 |
| Telecommunications - 1.1% | | | |
| Altice Financing SA 5.75% 8/15/29 (i) | | 2,585,000 | 2,077,407 |
| Altice France SA: | | | |
| 5.125% 1/15/29 (i) | | 855,000 | 600,812 |
| 5.125% 7/15/29 (i) | | 5,450,000 | 3,832,538 |
| 5.5% 10/15/29 (i) | | 1,945,000 | 1,362,160 |
| Frontier Communications Holdings LLC 5% 5/1/28 (i) | | 1,160,000 | 1,149,537 |
| Intelsat Jackson Holdings SA 6.5% 3/15/30 (i) | | 1,405,000 | 1,344,267 |
| LCPR Senior Secured Financing DAC: | | | |
| 5.125% 7/15/29 (i) | | 205,000 | 167,638 |
| 6.75% 10/15/27 (i) | | 1,455,000 | 1,331,031 |
| Windstream Escrow LLC 7.75% 8/15/28 (i) | | 4,100,000 | 4,103,854 |
TOTAL TELECOMMUNICATIONS | | | 15,969,244 |
| TOTAL NONCONVERTIBLE BONDS (Cost $78,486,792) | | | 77,535,402 |
| | | | |
| Asset-Backed Securities - 0.2% |
| | | Principal Amount (a) | Value ($) |
| Birch Grove Clo 4 Ltd. Series 2024-4A Class ER, CME Term SOFR 3 Month Index + 6.500% 11.8014% 7/15/37 (b)(c)(i) | | 347,000 | 348,518 |
| Goldentree Loan Management U.S. CLO 18, Ltd. Series 2024-21A Class DJ, CME Term SOFR 3 Month Index + 4.250% 9.5751% 7/20/37 (b)(c)(i) | | 293,000 | 293,330 |
| Goldentree Loan Management U.S. CLO 21, Ltd. Series 2024-21A Class E, CME Term SOFR 3 Month Index + 5.700% 11.0251% 7/20/37 (b)(c)(i) | | 440,000 | 441,027 |
| Magnetite Xxix Ltd. Series 2024-29A Class ER, CME Term SOFR 3 Month Index + 6.000% 11.2416% 7/15/37 (b)(c)(i) | | 103,000 | 103,765 |
| Midocean Credit Clo Xvi Series 2024-16A Class E, CME Term SOFR 3 Month Index + 6.250% 6.25% 10/20/37 (b)(c)(i)(j) | | 125,000 | 125,000 |
| Ocp Clo 2017-14 Ltd. Series 2024-14A Class ER, CME Term SOFR 3 Month Index + 6.550% 11.2908% 7/20/37 (b)(c)(i) | | 200,000 | 202,130 |
| Palmer Square Ln Funding 2024-3 Series 2024-3A Class D, CME Term SOFR 3 Month Index + 5.400% 10.7366% 8/8/32 (b)(c)(i) | | 605,000 | 605,431 |
| TOTAL ASSET-BACKED SECURITIES (Cost $2,113,000) | | | 2,119,201 |
| | | | |
| Common Stocks - 2.4% |
| | | Shares | Value ($) |
| Capital Goods - 0.0% | | | |
| TNT Crane & Rigging LLC (e)(k) | | 188,360 | 433,228 |
| TNT Crane & Rigging LLC warrants 10/31/25 (e)(k) | | 9,492 | 0 |
TOTAL CAPITAL GOODS | | | 433,228 |
| Consumer Products - 0.3% | | | |
| JOANN, Inc. (e) | | 1,482,415 | 3,365,082 |
| Diversified Financial Services - 0.4% | | | |
| ACNR Holdings, Inc. (e) | | 69,613 | 5,921,978 |
| Carnelian Point Holdings LP warrants (e)(k) | | 5,132 | 14,985 |
| Limetree Bay Cayman Ltd. (e)(k) | | 776 | 51,239 |
TOTAL DIVERSIFIED FINANCIAL SERVICES | | | 5,988,202 |
| Energy - 1.3% | | | |
| California Resources Corp. | | 91,210 | 4,785,789 |
| Chesapeake Energy Corp. | | 109,641 | 9,017,972 |
| Chesapeake Energy Corp. (l) | | 928 | 76,328 |
| EP Energy Corp. (e)(k) | | 15,785 | 22,257 |
| Exxon Mobil Corp. | | 40,902 | 4,794,532 |
TOTAL ENERGY | | | 18,696,878 |
| Entertainment/Film - 0.2% | | | |
| New Cineworld Ltd. (e)(k) | | 191,905 | 3,222,085 |
| Restaurants - 0.1% | | | |
| Old Claimco LLC (e)(k) | | 105,486 | 1,189,882 |
| Telecommunications - 0.1% | | | |
| GTT Communications, Inc. (e)(k) | | 35,300 | 1,575,439 |
| TOTAL COMMON STOCKS (Cost $23,191,956) | | | 34,470,796 |
| | | | |
| Preferred Securities - 0.2% |
| | | Principal Amount (a) | Value ($) |
| Banks & Thrifts - 0.2% | | | |
| Citigroup, Inc. 4.7% (b)(m) | | 1,445,000 | 1,448,946 |
| JPMorgan Chase & Co. 6.1% (b)(m) | | 1,130,000 | 1,164,465 |
TOTAL BANKS & THRIFTS | | | 2,613,411 |
| Diversified Financial Services - 0.0% | | | |
| Aircastle Ltd. 5.25% (b)(i)(m) | | 895,000 | 890,227 |
| TOTAL PREFERRED SECURITIES (Cost $3,438,596) | | | 3,503,638 |
| | | | |
| Other - 1.4% |
| | | Shares | Value ($) |
| Other - 1.4% | | | |
Fidelity Private Credit Co. LLC (l)(n) (Cost $20,392,257) | | 2,051,205 | 20,327,439 |
| | | | |
| Money Market Funds - 3.7% |
| | | Shares | Value ($) |
Fidelity Cash Central Fund 4.89% (o) (Cost $52,055,340) | | 52,048,049 | 52,058,458 |
| | | | |
| TOTAL INVESTMENT IN SECURITIES - 100.1% (Cost $1,471,717,696) | 1,429,017,421 |
NET OTHER ASSETS (LIABILITIES) - (0.1)% | (1,469,353) |
| NET ASSETS - 100.0% | 1,427,548,068 |
| | |
Legend
| (a) | Amount is stated in United States dollars unless otherwise noted. |
| (b) | Coupon rates for floating and adjustable rate securities reflect the rates in effect at period end. |
| (c) | Coupon is indexed to a floating interest rate which may be multiplied by a specified factor and/or subject to caps or floors. |
| (d) | Remaining maturities of bank loan obligations may be less than the stated maturities shown as a result of contractual or optional prepayments by the borrower. Such prepayments cannot be predicted with certainty. |
| (f) | Non-income producing - Security is in default. |
| (g) | A coupon rate of 0% signifies an unsettled loan. The coupon rate will be determined upon settlement of the loan after period end. |
| (h) | Position or a portion of the position represents an unfunded loan commitment. At period end, the total principal amount and market value of unfunded commitments totaled $364,108 and $364,223, respectively. |
| (i) | Security exempt from registration under Rule 144A of the Securities Act of 1933. These securities may be resold in transactions exempt from registration, normally to qualified institutional buyers. At the end of the period, the value of these securities amounted to $76,377,614 or 5.4% of net assets. |
| (j) | Security or a portion of the security purchased on a delayed delivery or when-issued basis. |
| (l) | Restricted securities (including private placements) - Investment in securities not registered under the Securities Act of 1933 (excluding 144A issues). At the end of the period, the value of restricted securities (excluding 144A issues) amounted to $20,403,767 or 1.4% of net assets. |
| (m) | Security is perpetual in nature with no stated maturity date. |
| (o) | Affiliated fund that is generally available only to investment companies and other accounts managed by Fidelity Investments. The rate quoted is the annualized seven-day yield of the fund at period end. A complete unaudited listing of the fund's holdings as of its most recent quarter end is available upon request. In addition, each Fidelity Central Fund's financial statements, which are not covered by the Fund's Report of Independent Registered Public Accounting Firm, are available on the SEC's website or upon request. |
| Additional information on each restricted holding is as follows: |
| Security | Acquisition Date | Acquisition Cost ($) |
| Chesapeake Energy Corp. | 2/10/21 | 8,788 |
| | | |
| Fidelity Private Credit Co. LLC | 6/06/22 - 9/11/24 | 20,392,257 |
| | | |
Affiliated Central Funds
Fiscal year to date information regarding the Fund's investments in Fidelity Central Funds, including the ownership percentage, is presented below.
| Affiliate | Value, beginning of period ($) | Purchases ($) | Sales Proceeds ($) | Dividend Income ($) | Realized Gain (loss) ($) | Change in Unrealized appreciation (depreciation) ($) | Value, end of period ($) | % ownership, end of period |
| Fidelity Cash Central Fund 4.89% | 52,234,136 | 480,162,645 | 480,335,045 | 3,819,639 | (2,863) | (415) | 52,058,458 | 0.1% |
| Fidelity Securities Lending Cash Central Fund 4.89% | 9,398,700 | 20,802,910 | 30,201,610 | 10,078 | - | - | - | 0.0% |
| Total | 61,632,836 | 500,965,555 | 510,536,655 | 3,829,717 | (2,863) | (415) | 52,058,458 | |
| | | | | | | | | |
Amounts in the dividend income column in the above table include any capital gain distributions from underlying funds, which are presented in the corresponding line item in the Statement of Operations, if applicable.
Amounts in the dividend income column for Fidelity Securities Lending Cash Central Fund represents the income earned on investing cash collateral, less rebates paid to borrowers and any lending agent fees associated with the loan, plus any premium payments received for lending certain types of securities.
Amounts included in the purchases and sales proceeds columns may include in-kind transactions, if applicable.
Affiliated Underlying Funds
Fiscal year to date information regarding the Fund's investments in affiliated Underlying Funds is presented below. Exchanges between classes of the same affiliated Underlying Funds may occur. If an Underlying Funds changes its name, the name presented below is the name in effect at period end.
| Affiliate | Value, beginning of period ($) | Purchases ($) | Sales Proceeds ($) | Dividend Income ($) | Realized Gain (loss) ($) | Change in Unrealized appreciation (depreciation) ($) | Value, end of period ($) |
| Fidelity Private Credit Co. LLC | 25,093,125 | 4,945,638 | 8,956,554 | 3,796,636 | (92,571) | (662,199) | 20,327,439 |
| | 25,093,125 | 4,945,638 | 8,956,554 | 3,796,636 | (92,571) | (662,199) | 20,327,439 |
Amounts in the dividend income column in the above table include any capital gain distributions from underlying funds, which are presented in the corresponding line item in the Statement of Operations, if applicable.
Amounts included in the purchases and sales proceeds columns may include in-kind transactions, if applicable.
Investment Valuation
The following is a summary of the inputs used, as of September 30, 2024, involving the Fund's assets and liabilities carried at fair value. The inputs or methodology used for valuing securities may not be an indication of the risk associated with investing in those securities. For more information on valuation inputs, and their aggregation into the levels used below, please refer to the Investment Valuation section in the accompanying Notes to Financial Statements.
| Valuation Inputs at Reporting Date: |
| Description | Total ($) | Level 1 ($) | Level 2 ($) | Level 3 ($) |
Investments in Securities: | | | | |
|
| Equities: | | | | |
Communication Services | 3,222,085 | - | - | 3,222,085 |
Consumer Discretionary | 4,554,964 | - | - | 4,554,964 |
Energy | 18,696,878 | 18,674,621 | - | 22,257 |
Financials | 5,988,202 | - | - | 5,988,202 |
Industrials | 433,228 | - | - | 433,228 |
Information Technology | 1,575,439 | - | - | 1,575,439 |
|
| Bank Loan Obligations | 1,239,002,487 | - | 1,225,960,787 | 13,041,700 |
|
| Corporate Bonds | 77,535,402 | - | 77,535,402 | - |
|
| Asset-Backed Securities | 2,119,201 | - | 2,119,201 | - |
|
| Preferred Securities | 3,503,638 | - | 3,503,638 | - |
|
| Other | 20,327,439 | - | 20,327,439 | - |
|
| Money Market Funds | 52,058,458 | 52,058,458 | - | - |
| Total Investments in Securities: | 1,429,017,421 | 70,733,079 | 1,329,446,467 | 28,837,875 |
| | | | | |
|
| Net Unrealized Appreciation on Unfunded Commitments | 334,956 | - | - | 334,956 |
| Total | 334,956 | - | - | 334,956 |
The following is a reconciliation of Investments in Securities for which Level 3 inputs were used in determining value:
| |
| Investments in Securities: | |
| Bank Loan Obligations | | | |
| Beginning Balance | $ | 19,973,448 | |
| Net Realized Gain (Loss) on Investment Securities | | 158,972 | |
| Net Unrealized Gain (Loss) on Investment Securities | | (1,326,318) | |
| Cost of Purchases | | 2,938,940 | |
| Proceeds of Sales | | (5,622,239) | |
| Amortization/Accretion | | 130,198 | |
| Transfers into Level 3 | | - | |
| Transfers out of Level 3 | | (3,211,301) | |
| Ending Balance | $ | 13,041,700 | |
| The change in unrealized gain (loss) for the period attributable to Level 3 securities held at September 30, 2024 | $ | (1,322,243) | |
| Other Investments in Securities | | | |
| Beginning Balance | $ | 17,599,452 | |
| Net Realized Gain (Loss) on Investment Securities | | 801,378 | |
| Net Unrealized Gain (Loss) on Investment Securities | | 860,672 | |
| Cost of Purchases | | 681,918 | |
| Proceeds of Sales | | (4,147,245) | |
| Amortization/Accretion | | - | |
| Transfers into Level 3 | | - | |
| Transfers out of Level 3 | | - | |
| Ending Balance | $ | 15,796,175 | |
| The change in unrealized gain (loss) for the period attributable to Level 3 securities held at September 30, 2024 | $ | 6,715,056 | |
| The information used in the above reconciliation represents fiscal year to date activity for any Investments in Securities identified as using Level 3 inputs at either the beginning or the end of the current fiscal period. Cost of purchases and proceeds of sales may include securities received and/or delivered through in-kind transactions, corporate actions or exchanges. Transfers into Level 3 were attributable to a lack of observable market data resulting from decreases in market activity, decreases in liquidity, security restructurings or corporate actions. Transfers out of Level 3 were attributable to observable market data becoming available for those securities. Transfers in or out of Level 3 represent the beginning value of any Security or Instrument where a change in the pricing level occurred from the beginning to the end of the period. Realized and unrealized gains (losses) disclosed in the reconciliation are included in Net Gain (Loss) on the Fund's Statement of Operations. | |
Financial Statements
| Statement of Assets and Liabilities |
As of September 30, 2024 |
| Assets | | | | |
| Investment in securities, at value - See accompanying schedule: | | | | |
Unaffiliated issuers (cost $1,399,270,099) | $ | 1,356,631,524 | | |
Fidelity Central Funds (cost $52,055,340) | | 52,058,458 | | |
Other affiliated issuers (cost $20,392,257) | | 20,327,439 | | |
| | | | | |
| | | | | |
| Total Investment in Securities (cost $1,471,717,696) | | | $ | 1,429,017,421 |
| Cash | | | | 3,599,388 |
| Receivable for investments sold | | | | 20,563,090 |
| Unrealized appreciation on unfunded commitments | | | | 334,956 |
| Receivable for fund shares sold | | | | 1,243,909 |
| Dividends receivable | | | | 7,257 |
| Interest receivable | | | | 13,797,903 |
| Distributions receivable from Fidelity Central Funds | | | | 155,880 |
| Receivable from investment adviser for expense reductions | | | | 17,875 |
Total assets | | | | 1,468,737,679 |
| Liabilities | | | | |
| Payable for investments purchased | | | | |
Regular delivery | $ | 40,803,721 | | |
Delayed delivery | | 265,000 | | |
| Payable for fund shares redeemed | | 119,710 | | |
| Other payables and accrued expenses | | 1,180 | | |
| Total liabilities | | | | 41,189,611 |
| Commitments and contingent liabilities (see Significant Accounting Policies note) | | | | |
| Net Assets | | | $ | 1,427,548,068 |
| Net Assets consist of: | | | | |
| Paid in capital | | | $ | 1,594,136,191 |
| Total accumulated earnings (loss) | | | | (166,588,123) |
| Net Assets | | | $ | 1,427,548,068 |
Net Asset Value, offering price and redemption price per share ($1,427,548,068 ÷ 14,589,814 shares) | | | $ | 97.85 |
| Statement of Operations |
| Year ended September 30, 2024 |
| Investment Income | | | | |
| Dividends: | | | | |
| Unaffiliated issuers | | | $ | 1,730,329 |
| Affiliated issuers | | | | 3,771,150 |
| Interest | | | | 131,941,077 |
| Income from Fidelity Central Funds (including $10,078 from security lending) | | | | 3,829,717 |
| Payment from investment adviser | | | | 180,979 |
| Total income | | | | 141,453,252 |
| Expenses | | | | |
| Custodian fees and expenses | $ | 3,477 | | |
| Independent trustees' fees and expenses | | 7,082 | | |
| Legal | | 52,811 | | |
| Miscellaneous | | 6 | | |
| Total expenses before reductions | | 63,376 | | |
| Expense reductions | | (4,031) | | |
| Total expenses after reductions | | | | 59,345 |
| Net Investment income (loss) | | | | 141,393,907 |
| Realized and Unrealized Gain (Loss) | | | | |
| Net realized gain (loss) on: | | | | |
| Investment Securities: | | | | |
| Unaffiliated issuers | | (9,563,096) | | |
| Fidelity Central Funds | | (2,863) | | |
| Other affiliated issuers | | (92,571) | | |
| Capital gain distributions from underlying funds: | | | | |
| Affiliated issuers | | 25,486 | | |
| Total net realized gain (loss) | | | | (9,633,044) |
| Change in net unrealized appreciation (depreciation) on: | | | | |
| Investment Securities: | | | | |
| Unaffiliated issuers | | 7,056,286 | | |
| Fidelity Central Funds | | (415) | | |
| Other affiliated issuers | | (662,199) | | |
| Unfunded commitments | | 307,528 | | |
| Total change in net unrealized appreciation (depreciation) | | | | 6,701,200 |
| Net gain (loss) | | | | (2,931,844) |
| Net increase (decrease) in net assets resulting from operations | | | $ | 138,462,063 |
| Statement of Changes in Net Assets |
| |
| | Year ended September 30, 2024 | | Year ended September 30, 2023 |
| Increase (Decrease) in Net Assets | | | | |
| Operations | | | | |
| Net investment income (loss) | $ | 141,393,907 | $ | 170,888,035 |
| Net realized gain (loss) | | (9,633,044) | | (32,199,617) |
| Change in net unrealized appreciation (depreciation) | | 6,701,200 | | 116,237,037 |
| Net increase (decrease) in net assets resulting from operations | | 138,462,063 | | 254,925,455 |
| Distributions to shareholders | | (141,566,172) | | (171,040,104) |
| | | | | |
| Affiliated share transactions | | | | |
| Proceeds from sales of shares | | 114,623,072 | | 66,769,136 |
| Reinvestment of distributions | | 141,539,557 | | 171,038,902 |
| Cost of shares redeemed | | (299,654,064) | | (1,390,873,549) |
| | | | | |
Net increase (decrease) in net assets resulting from share transactions | | (43,491,435) | | (1,153,065,511) |
| Total increase (decrease) in net assets | | (46,595,544) | | (1,069,180,160) |
| | | | | |
| Net Assets | | | | |
| Beginning of period | | 1,474,143,612 | | 2,543,323,772 |
| End of period | $ | 1,427,548,068 | $ | 1,474,143,612 |
| | | | | |
| Other Information | | | | |
| Shares | | | | |
| Sold | | 1,165,382 | | 695,160 |
| Issued in reinvestment of distributions | | 1,442,544 | | 1,773,731 |
| Redeemed | | (3,058,509) | | (14,420,965) |
| Net increase (decrease) | | (450,583) | | (11,952,074) |
| | | | | |
Financial Highlights
Fidelity® Floating Rate Central Fund |
| |
| Years ended September 30, | | 2024 | | 2023 | | 2022 | | 2021 | | 2020 |
Selected Per-Share Data | | | | | | | | | | |
| Net asset value, beginning of period | $ | 98.01 | $ | 94.22 | $ | 100.91 | $ | 96.50 | $ | 101.38 |
| Income from Investment Operations | | | | | | | | | | |
Net investment income (loss) A,B | | 9.418 | | 8.494 | | 4.767 | | 4.112 | | 4.985 |
| Net realized and unrealized gain (loss) | | (.147) | | 3.878 | | (6.696) | | 4.431 | | (4.687) |
| Total from investment operations | | 9.271 | | 12.372 | | (1.929) | | 8.543 | | .298 |
| Distributions from net investment income | | (9.431) | | (8.582) | | (4.761) | | (4.133) | | (5.178) |
| Total distributions | | (9.431) | | (8.582) | | (4.761) | | (4.133) | | (5.178) |
| Net asset value, end of period | $ | 97.85 | $ | 98.01 | $ | 94.22 | $ | 100.91 | $ | 96.50 |
Total Return C | | | | 13.65% | | (1.98)% | | 8.99% | | .42% |
Ratios to Average Net Assets B,D,E | | | | | | | | | | |
Expenses before reductions F | | -% | | -% | | -% | | -% | | -% |
Expenses net of fee waivers, if any F | | | | -% | | -% | | -% | | -% |
Expenses net of all reductions F | | -% | | -% | | -% | | -% | | -% |
| Net investment income (loss) | | 9.60% | | 8.78% | | 4.83% | | 4.14% | | 5.16% |
| Supplemental Data | | | | | | | | | | |
| Net assets, end of period (000 omitted) | $ | 1,427,548 | $ | 1,474,144 | $ | 2,543,324 | $ | 2,773,908 | $ | 1,906,015 |
Portfolio turnover rate G | | | | 24% | | 39% | | 41% | | 40% |
ACalculated based on average shares outstanding during the period.
BNet investment income (loss) is affected by the timing of the declaration of dividends by any underlying mutual funds or exchange-traded funds (ETFs). Net investment income (loss) of any mutual funds or ETFs is not included in the Fund's net investment income (loss) ratio.
CTotal returns would have been lower if certain expenses had not been reduced during the applicable periods shown.
DFees and expenses of any underlying mutual funds or exchange-traded funds (ETFs) are not included in the Fund's expense ratio. The Fund indirectly bears its proportionate share of these expenses. For additional expense information related to investments in Fidelity Central Funds, please refer to the "Investments in Fidelity Central Funds" note found in the Notes to Financial Statements section of the most recent Annual or Semi-Annual report. For additional expense information related to investments in Fidelity Private Credit Company LLC, please refer to the Investment in Fidelity Private Credit Company LLC note found in the Notes to Financial Statements section of the most recent Annual or Semi-Annual report.
EExpense ratios reflect operating expenses of the class. Expenses before reductions do not reflect amounts reimbursed, waived, or reduced through arrangements with the investment adviser, brokerage services, or other offset arrangements, if applicable, and do not represent the amount paid by the class during periods when reimbursements, waivers or reductions occur.
FAmount represents less than .005%.
GAmount does not include the portfolio activity of any underlying mutual funds or exchange-traded funds (ETFs).
Notes to Financial Statements
For the period ended September 30, 2024
1. Organization.
Fidelity Floating Rate Central Fund (the Fund) is a fund of Fidelity Central Investment Portfolios LLC (the LLC) and is authorized to issue an unlimited number of shares. Shares of the Fund are only offered to other investment companies and accounts managed by Fidelity Management & Research Company LLC (FMR), or its affiliates (the Investing Funds). The LLC is registered under the Investment Company Act of 1940, as amended (the 1940 Act), as an open-end management investment company organized as a Delaware Limited Liability Company.
2. Investments in Fidelity Central Funds.
Funds may invest in Fidelity Central Funds, which are open-end investment companies generally available only to other investment companies and accounts managed by the investment adviser and its affiliates. The Schedule of Investments lists any Fidelity Central Funds held as an investment as of period end, but does not include the underlying holdings of each Fidelity Central Fund. An investing fund indirectly bears its proportionate share of the expenses of the underlying Fidelity Central Funds.
Based on its investment objective, each Fidelity Central Fund may invest or participate in various investment vehicles or strategies that are similar to those of the investing fund. These strategies are consistent with the investment objectives of the investing fund and may involve certain economic risks which may cause a decline in value of each of the Fidelity Central Funds and thus a decline in the value of the investing fund.
| Fidelity Central Fund | Investment Manager | Investment Objective | Investment Practices | Expense RatioA |
| Fidelity Money Market Central Funds | Fidelity Management & Research Company LLC (FMR) | Each fund seeks to obtain a high level of current income consistent with the preservation of capital and liquidity. | Short-term Investments | Less than .005% |
A Expenses expressed as a percentage of average net assets and are as of each underlying Central Fund's most recent annual or semi-annual shareholder report.
A complete unaudited list of holdings for each Fidelity Central Fund is available upon request or at the Securities and Exchange Commission website at www.sec.gov. In addition, the financial statements of the Fidelity Central Funds which contain the significant accounting policies (including investment valuation policies) of those funds, and are not covered by the Report of Independent Registered Public Accounting Firm, are available on the Securities and Exchange Commission website or upon request.
3. Investment in Fidelity Private Credit Company LLC.
The Fund invests in Fidelity Private Credit Company LLC, which is a limited liability company. Fidelity Private Credit Company LLC's units are not registered under the Securities Act of 1933 and are subject to substantial restrictions on transfer. The Fund has no redemption rights under Fidelity Private Credit Company LLC's limited liability company agreement. There will be no trading market for the units.
Based on its investment objective, Fidelity Private Credit Company LLC may invest or participate in various investments or strategies that are similar to those in which the Fund may invest or participate. These strategies are consistent with the investment objectives of the Fund and may involve certain economic risks which may cause a decline in value of Fidelity Private Credit Company LLC and thus a decline in the value of the Fund. Fidelity Private Credit Company LLC intends to invest primarily in directly originated loans to private companies but also with liquid credit investments, like broadly syndicated loans, and other select private credit investments.
The Schedule of Investments lists Fidelity Private Credit Company LLC as an investment as of period end, but does not include the underlying holdings of Fidelity Private Credit Company LLC. Fidelity Private Credit Company LLC represented less than 5% of the Fund's net assets at period end. The Fund indirectly bears its proportionate share of the expenses of Fidelity Private Credit Company LLC. The annualized expense ratio for Fidelity Private Credit Company LLC for the nine month period ended September 30, 2024 was 11.38%.
4. Significant Accounting Policies.
The Fund is an investment company and applies the accounting and reporting guidance of the Financial Accounting Standards Board (FASB) Accounting Standards Codification Topic 946 Financial Services - Investment Companies. The financial statements have been prepared in conformity with accounting principles generally accepted in the United States of America (GAAP), which require management to make certain estimates and assumptions at the date of the financial statements. Actual results could differ from those estimates. Subsequent events, if any, through the date that the financial statements were issued have been evaluated in the preparation of the financial statements. The Fund's Schedule of Investments lists any underlying mutual funds or exchange-traded funds (ETFs) but does not include the underlying holdings of these funds. The following summarizes the significant accounting policies of the Fund:
Investment Valuation. Investments are valued as of 4:00 p.m. Eastern time on the last calendar day of the period. The Board of Directors (the Board) has designated the Fund's investment adviser as the valuation designee responsible for the fair valuation function and performing fair value determinations as needed. The investment adviser has established a Fair Value Committee (the Committee) to carry out the day-to-day fair valuation responsibilities and has adopted policies and procedures to govern the fair valuation process and the activities of the Committee. In accordance with these fair valuation policies and procedures, which have been approved by the Board, the Fund attempts to obtain prices from one or more third party pricing services or brokers to value its investments. When current market prices, quotations or currency exchange rates are not readily available or reliable, investments will be fair valued in good faith by the Committee, in accordance with the policies and procedures. Factors used in determining fair value vary by investment type and may include market or investment specific events, transaction data, estimated cash flows, and market observations of comparable investments. The frequency that the fair valuation procedures are used cannot be predicted and they may be utilized to a significant extent. The Committee manages the Fund's fair valuation practices and maintains the fair valuation policies and procedures. The Fund's investment adviser reports to the Board information regarding the fair valuation process and related material matters.
The Fund categorizes the inputs to valuation techniques used to value its investments into a disclosure hierarchy consisting of three levels as shown below:
Level 1 - unadjusted quoted prices in active markets for identical investments
Level 2 - other significant observable inputs (including quoted prices for similar investments, interest rates, prepayment speeds, etc.)
Level 3 - unobservable inputs (including the Fund's own assumptions based on the best information available)
Valuation techniques used to value the Fund's investments by major category are as follows:
Debt securities, including restricted securities, are valued based on evaluated prices received from third party pricing services or from brokers who make markets in such securities. Corporate bonds, bank loan obligations and preferred securities are valued by pricing services who utilize matrix pricing which considers yield or price of bonds of comparable quality, coupon, maturity and type or by broker-supplied prices. Asset backed securities are valued by pricing services who utilize matrix pricing which considers prepayment speed assumptions, attributes of the collateral, yield or price of bonds of comparable quality, coupon, maturity and type or by broker-supplied prices. When independent prices are unavailable or unreliable, debt securities may be valued utilizing pricing methodologies which consider similar factors that would be used by third party pricing services. Debt securities are generally categorized as Level 2 in the hierarchy but may be Level 3 depending on the circumstances. The Fund invests a significant portion of its assets in below investment grade securities. The value of these securities can be more volatile due to changes in the credit quality of the issuer and is sensitive to changes in economic, market and regulatory conditions.
Equity securities, including restricted securities, for which market quotations are readily available, are valued at the last reported sale price or official closing price as reported by a third party pricing service on the primary market or exchange on which they are traded and are categorized as Level 1 in the hierarchy. In the event there were no sales during the day or closing prices are not available, securities are valued at the last quoted bid price or may be valued using the last available price and are generally categorized as Level 2 in the hierarchy. For foreign equity securities, when market or security specific events arise, comparisons to the valuation of American Depositary Receipts (ADRs), futures contracts, Exchange-Traded Funds (ETFs) and certain indexes as well as quoted prices for similar securities may be used and would be categorized as Level 2 in the hierarchy. For equity securities, including restricted securities, where observable inputs are limited, assumptions about market activity and risk are used and these securities may be categorized as Level 3 in the hierarchy. Securities, including private placements or other restricted securities, for which observable inputs are not available are valued using alternate valuation approaches, including the market approach, the income approach and cost approach, and are categorized as Level 3 in the hierarchy. The market approach considers factors including the price of recent investments in the same or a similar security or financial metrics of comparable securities. The income approach considers factors including expected future cash flows, security specific risks and corresponding discount rates. The cost approach considers factors including the value of the security's underlying assets and liabilities.
Investments in open-end mutual funds, including the Fidelity Central Funds, are valued at their closing net asset value (NAV) each business day and are categorized as Level 1 in the hierarchy.
Fidelity Private Credit Company LLC is valued at its net asset value (NAV) each month end and is categorized as Level 2 in the hierarchy.
The following provides information on Level 3 securities held by the Fund that were valued at period end based on unobservable inputs. These amounts exclude valuations provided by a broker and valuations using NAV as a practical expedient.
| Asset Type | Fair Value | Valuation Technique(s) | Unobservable Input | Amount or Range/Weighted Average | Impact to Valuation from an Increase in InputA |
| Equities | $15,796,175 | Market approach | Transaction price | $2.92 | Increase |
| | | Market comparable | Enterprise value/EBITDA multiple (EV/EBITDA) | 1.8 - 10.5 / 4.8 | Increase |
| | | Discounted cash flow | Discount rate | 11.9% | Decrease |
| | | Black scholes | Discount rate | 3.9% | Increase |
| | | | Volatility | 22.5% - 47.5% / 22.5% | Increase |
| | | | Term | 1.0 | Increase |
| Bank Loan Obligations | $13,041,700 | Market approach | Transaction price | $100.00 | Increase |
| | | Market comparable | Enterprise value/EBITDA multiple (EV/EBITDA) | 9.0 | Increase |
| | | Discounted cash flow | Yield | 7.2% - 16.1% / 10.0% | Decrease |
| | | Indicative market price | Evaluated bid | $40.00 - $100.00 / $79.27 | Increase |
A Represents the directional change in the fair value of the Level 3 investments that could have resulted from an increase in the corresponding input as of period end. A decrease to the unobservable input would have had the opposite effect. Significant changes in these inputs may have resulted in a significantly higher or lower fair value measurement at period end.
Changes in valuation techniques may result in transfers in or out of an assigned level within the disclosure hierarchy. The aggregate value of investments by input level as of September 30, 2024, as well as a roll forward of Level 3 investments, is included at the end of the Fund's Schedule of Investments.
Investment Transactions and Income. For financial reporting purposes, the Fund's investment holdings and NAV include trades executed through the end of the last business day of the period. The NAV per share for processing shareholder transactions is calculated as of the close of business of the New York Stock Exchange (NYSE), normally 4:00 p.m. Eastern time and includes trades executed through the end of the prior business day. Gains and losses on securities sold are determined on the basis of identified cost and include proceeds received from litigation. Dividend income is recorded on the ex-dividend date, except for certain dividends from foreign securities where the ex-dividend date may have passed, which are recorded as soon as the Fund is informed of the ex-dividend date. Non-cash dividends included in dividend income, if any, are recorded at the fair market value of the securities received. Income and capital gain distributions from Fidelity Central Funds, if any, are recorded on the ex-dividend date. Certain distributions received by the Fund represent a return of capital or capital gain. The Fund determines the components of these distributions subsequent to the ex-dividend date, based upon receipt of tax filings or other correspondence relating to the underlying investment. These distributions are recorded as a reduction of cost of investments and/or as a realized gain. Interest income is accrued as earned and includes coupon interest and amortization of premium and accretion of discount on debt securities as applicable. Debt obligations may be placed on non-accrual status and related interest income may be reduced by ceasing current accruals and writing off interest receivables when the collection of all or a portion of interest has become doubtful based on consistently applied procedures. A debt obligation is removed from non-accrual status when the issuer resumes interest payments or when collectability of interest is reasonably assured. The Fund earns certain fees in connection with its floating rate loan purchasing activities. These fees are in addition to interest payments earned and may include amendment fees, consent fees and prepayment fees. These fees are recorded as Interest in the accompanying financial statements. The investment adviser has contractually agreed to reimburse the Fund with respect to the portion of the Fund's assets invested in Fidelity Private Credit Central Fund LLC until January 31, 2026 as presented in the Statement of Operations in payment from investment adviser.
Expenses. Expenses directly attributable to a fund are charged to that fund. Expenses attributable to more than one fund are allocated among the respective funds on the basis of relative net assets or other appropriate methods. Expenses included in the accompanying financial statements reflect the expenses of that fund and do not include any expenses associated with any underlying mutual funds or exchange-traded funds. Although not included in a fund's expenses, a fund indirectly bears its proportionate share of these expenses through the net asset value of each underlying mutual fund or exchange-traded fund. Expense estimates are accrued in the period to which they relate and adjustments are made when actual amounts are known.
Income Tax Information and Distributions to Shareholders. Each year, the Fund intends to qualify as a regulated investment company under Subchapter M of the Internal Revenue Code, including distributing substantially all of its taxable income and realized gains. As a result, no provision for U.S. Federal income taxes is required. As of September 30, 2024, the Fund did not have any unrecognized tax benefits in the financial statements; nor is the Fund aware of any tax positions for which it is reasonably possible that the total amounts of unrecognized tax benefits will significantly change in the next twelve months. The Fund files a U.S. federal tax return, in addition to state and local tax returns as required. The Fund's federal income tax returns are subject to examination by the Internal Revenue Service (IRS) for a period of three fiscal years after they are filed. State and local tax returns may be subject to examination for an additional fiscal year depending on the jurisdiction.
Distributions are declared and recorded daily and paid monthly from net investment income. Distributions from realized gains, if any, are declared and recorded on the ex-dividend date. Income and capital gain distributions are determined in accordance with income tax regulations, which may differ from GAAP.
Capital accounts within the financial statements are adjusted for permanent book-tax differences. These adjustments have no impact on net assets or the results of operations. Capital accounts are not adjusted for temporary book-tax differences which will reverse in a subsequent period.
Book-tax differences are primarily due to short-term gain distributions from the underlying funds, passive foreign investment companies (PFIC), partnerships, capital loss carryforwards and losses deferred due to wash sales.
As of period end, the cost and unrealized appreciation (depreciation) in securities, and derivatives if applicable, for federal income tax purposes were as follows:
| Gross unrealized appreciation | $35,847,429 |
| Gross unrealized depreciation | (78,534,531) |
| Net unrealized appreciation (depreciation) | $(42,687,102) |
| Tax Cost | $1,472,039,479 |
The tax-based components of distributable earnings as of period end were as follows:
| Capital loss carryforward | $(122,201,450) |
| Net unrealized appreciation (depreciation) on securities and other investments | $(42,687,102) |
Capital loss carryforwards are only available to offset future capital gains of the Fund to the extent provided by regulations and may be limited. The capital loss carryforward information presented below, including any applicable limitation, is estimated as of fiscal period end and is subject to adjustment.
Short-term | $(7,814,768) |
Long-term | (114,386,682) |
| Total capital loss carryforward | $(122,201,450) |
The tax character of distributions paid was as follows:
| | September 30, 2024 | September 30, 2023 |
| Ordinary Income | $141,566,172 | $171,040,104 |
Delayed Delivery Transactions and When-Issued Securities. During the period, certain Funds transacted in securities on a delayed delivery or when-issued basis. Payment and delivery may take place after the customary settlement period for that security. The price of the underlying securities and the date when the securities will be delivered and paid for are fixed at the time the transaction is negotiated. Securities purchased on a delayed delivery or when-issued basis are identified as such in the Schedule of Investments. Compensation for interest forgone in the purchase of a delayed delivery or when-issued debt security may be received. With respect to purchase commitments, each applicable Fund identifies securities as segregated in its records with a value at least equal to the amount of the commitment. Payables and receivables associated with the purchases and sales of delayed delivery securities having the same coupon, settlement date and broker are offset. Delayed delivery or when-issued securities that have been purchased from and sold to different brokers are reflected as both payables and receivables in the Statement of Assets and Liabilities under the caption "Delayed delivery", as applicable. Losses may arise due to changes in the value of the underlying securities or if the counterparty does not perform under the contract's terms, or if the issuer does not issue the securities due to political, economic, or other factors.
Restricted Securities (including Private Placements). Funds may invest in securities that are subject to legal or contractual restrictions on resale. These securities generally may be resold in transactions exempt from registration or to the public if the securities are registered. Disposal of these securities may involve time-consuming negotiations and expense, and prompt sale at an acceptable price may be difficult. Information regarding restricted securities held at period end is included at the end of the Schedule of Investments, if applicable.
Loans and Other Direct Debt Instruments. Direct debt instruments are interests in amounts owed to lenders by corporate or other borrowers. These instruments may be in the form of loans, trade claims or other receivables and may include standby financing commitments such as revolving credit facilities that obligate a fund to supply additional cash to the borrower on demand. Loans may be acquired through assignment, participation, or may be made directly to a borrower. Such instruments are presented in the Bank Loan Obligations section in the Schedule of Investments. Certain funds may also invest in unfunded loan commitments, which are contractual obligations for future funding. Information regarding unfunded commitments is included at the end of the Schedule of Investments, if applicable.
Commitments. A commitment is an agreement to acquire an investment at a future date (subject to conditions) in connection with a potential public or non-public offering. Commitments outstanding at period end are presented in the table below. Unrealized appreciation (depreciation) on any commitments outstanding at period end is separately presented in the Statement of Assets and Liabilities as Unrealized appreciation (depreciation) on unfunded commitments, and any change in unrealized appreciation (depreciation) on unfunded commitments during the period is separately presented in the Statement of Operations, as applicable based on contractual conditions of each commitment.
| | Investment to be Acquired | Commitment Amount ($) | Unrealized Appreciation (Depreciation)($) |
| Fidelity Floating Rate Central Fund | EchoStar Corp. 10.75% 9/27/29 | 5,070,923 | 334,956 |
| Fidelity Floating Rate Central Fund | Fidelity Private Credit Company LLC | 4,377,014 | - |
5. Purchases and Sales of Investments.
Purchases and sales of securities, other than short-term securities and in-kind transactions, as applicable, are noted in the table below.
| | Purchases ($) | Sales ($) |
| Fidelity Floating Rate Central Fund | 711,750,461 | 777,749,537 |
6. Fees and Other Transactions with Affiliates.
Management Fee and Expense Contract. Fidelity Management & Research Company LLC (the investment adviser) provides the Fund with investment management services. The Fund does not pay any fees for these services. Pursuant to the Fund's expense contract, the investment adviser also pays all other expenses of the Fund, excluding custody fees, the compensation of the independent Directors, and certain miscellaneous expenses such as proxy and shareholder meeting expenses.
Brokerage Commissions. A portion of portfolio transactions were placed with brokerage firms which are affiliates of the investment adviser. Brokerage commissions are included in net realized gain (loss) and change in net unrealized appreciation (depreciation) in the Statement of Operations. The commissions paid to these affiliated firms were as follows:
| | Amount ($) |
| Fidelity Floating Rate Central Fund | 1 |
Interfund Trades. Funds may purchase from or sell securities to other Fidelity Funds under procedures adopted by the Board. The procedures have been designed to ensure these interfund trades are executed in accordance with Rule 17a-7 of the 1940 Act. Any interfund trades are included within the respective purchases and sales amounts shown in the Purchases and Sales of Investments note. During the period, there were no interfund trades.
Sub-Advisory Arrangements. Effective March 1, 2024, the Fund's sub-advisory agreements with FMR Investment Management (UK) Limited, Fidelity Management & Research (Hong Kong) Limited, and Fidelity Management & Research (Japan) Limited were amended to provide that the investment adviser pays each sub-adviser monthly fees equal to 110% of the sub-adviser's costs for providing sub-advisory services.
7. Security Lending.
Funds lend portfolio securities from time to time in order to earn additional income. Lending agents are used, including National Financial Services (NFS), an affiliate of the investment adviser. Pursuant to a securities lending agreement, NFS will receive a fee, which is capped at 9.9% of a fund's daily lending revenue, for its services as lending agent. A fund may lend securities to certain qualified borrowers, including NFS. On the settlement date of the loan, a fund receives collateral (in the form of U.S. Treasury obligations, letters of credit and/or cash) against the loaned securities and maintains collateral in an amount not less than 100% of the market value of the loaned securities during the period of the loan. The market value of the loaned securities is determined at the close of business of a fund and any additional required collateral is delivered to a fund on the next business day. A fund or borrower may terminate the loan at any time, and if the borrower defaults on its obligation to return the securities loaned because of insolvency or other reasons, a fund may apply collateral received from the borrower against the obligation. A fund may experience delays and costs in recovering the securities loaned. Any cash collateral received is invested in the Fidelity Securities Lending Cash Central Fund. Any loaned securities are identified as such in the Schedule of Investments, and the value of loaned securities and cash collateral at period end, as applicable, are presented in the Statement of Assets and Liabilities. Security lending income represents the income earned on investing cash collateral, less rebates paid to borrowers and any lending agent fees associated with the loan, plus any premium payments received for lending certain types of securities. Security lending income is presented in the Statement of Operations as a component of income from Fidelity Central Funds. Affiliated security lending activity, if any, was as follows:
| | Total Security Lending Fees Paid to NFS ($) | Security Lending Income From Securities Loaned to NFS ($) | Value of Securities Loaned to NFS at Period End ($) |
| Fidelity Floating Rate Central Fund | 1,049 | - | - |
8. Expense Reductions.
Through arrangements with the Fund's custodian, credits realized as a result of certain uninvested cash balances were used to reduce the Fund's expenses by $4,031.
9. Other.
A fund's organizational documents provide former and current directors and officers with a limited indemnification against liabilities arising in connection with the performance of their duties to the fund. In the normal course of business, a fund may also enter into contracts that provide general indemnifications. A fund's maximum exposure under these arrangements is unknown as this would be dependent on future claims that may be made against a fund. The risk of material loss from such claims is considered remote.
At the end of the period, mutual funds managed by the investment adviser or its affiliates were the owners of record of all of the outstanding shares of the Fund.
10. Risk and Uncertainties.
Many factors affect a fund's performance. Developments that disrupt global economies and financial markets, such as pandemics, epidemics, outbreaks of infectious diseases, war, terrorism, and environmental disasters, may significantly affect a fund's investment performance. The effects of these developments to a fund will be impacted by the types of securities in which a fund invests, the financial condition, industry, economic sector, and geographic location of an issuer, and a fund's level of investment in the securities of that issuer. Significant concentrations in security types, issuers, industries, sectors, and geographic locations may magnify the factors that affect a fund's performance.
Report of Independent Registered Public Accounting Firm
To the Board of Trustees of Fidelity Central Investment Portfolios LLC and the Shareholders of Fidelity Floating Rate Central Fund:
Opinion on the Financial Statements and Financial Highlights
We have audited the accompanying statement of assets and liabilities of Fidelity Floating Rate Central Fund (the "Fund"), a fund of Fidelity Central Investment Portfolios LLC, including the schedule of investments, as of September 30, 2024, the related statement of operations for the year then ended, the statement of changes in net assets for each of the two years in the period then ended, the financial highlights for each of the five years in the period then ended, and the related notes. In our opinion, the financial statements and financial highlights present fairly, in all material respects, the financial position of the Fund as of September 30, 2024, and the results of its operations for the year then ended, the changes in its net assets for each of the two years in the period then ended, and the financial highlights for each of the five years in the period then ended in conformity with accounting principles generally accepted in the United States of America.
Basis for Opinion
These financial statements and financial highlights are the responsibility of the Fund's management. Our responsibility is to express an opinion on the Fund's financial statements and financial highlights based on our audits. We are a public accounting firm registered with the Public Company Accounting Oversight Board (United States) (PCAOB) and are required to be independent with respect to the Fund in accordance with the U.S. federal securities laws and the applicable rules and regulations of the Securities and Exchange Commission and the PCAOB.
We conducted our audits in accordance with the standards of the PCAOB. Those standards require that we plan and perform the audit to obtain reasonable assurance about whether the financial statements and financial highlights are free of material misstatement, whether due to error or fraud. The Fund is not required to have, nor were we engaged to perform, an audit of its internal control over financial reporting. As part of our audits, we are required to obtain an understanding of internal control over financial reporting but not for the purpose of expressing an opinion on the effectiveness of the Fund's internal control over financial reporting. Accordingly, we express no such opinion.
Our audits included performing procedures to assess the risks of material misstatement of the financial statements and financial highlights, whether due to error or fraud, and performing procedures that respond to those risks. Such procedures included examining, on a test basis, evidence regarding the amounts and disclosures in the financial statements and financial highlights. Our audits also included evaluating the accounting principles used and significant estimates made by management, as well as evaluating the overall presentation of the financial statements and financial highlights. Our procedures included confirmation of securities owned as of September 30, 2024, by correspondence with the custodian, brokers, and agent banks; when replies were not received from brokers or agent banks, we performed other auditing procedures. We believe that our audits provide a reasonable basis for our opinion.
/s/ Deloitte & Touche LLP
Boston, Massachusetts
November 13, 2024
We have served as the auditor of one or more of the Fidelity investment companies since 1999.
Distributions
(Unaudited)
The dividend and capital gains distributions for the fund(s) are available on Fidelity.com or Institutional.Fidelity.com.
A total of 0.57% of the dividends distributed during the fiscal year was derived from interest on U.S. Government securities which is generally exempt from state income tax.
The fund designates $136,229,339 of distributions paid in the calendar year 2023 as qualifying to be taxed as interest-related dividends for nonresident alien shareholders.
The fund designates $141,310,919 of distributions paid during the fiscal year ended 2024 as qualifying to be taxed as section 163(j) interest dividends.
The fund will notify shareholders in January 2025 of amounts for use in preparing 2024 income tax returns.
Item 8: Changes in and Disagreements with Accountants for Open-End Management Investment Companies
(Unaudited)
Note: This is not applicable for any fund included in this document.
Item 9: Proxy Disclosures for Open-End Management Investment Companies
(Unaudited)
| A special meeting of shareholders was held on July 16, 2024. The results of votes taken among shareholders on the proposal before them are reported below. Each vote reported represents one dollar of net asset value held on the record date for the meeting. |
| Proposal 1 |
| To elect a Board of Trustees. |
| | # of Votes | % of Votes |
| Bettina Doulton |
| Affirmative | 31,231,071,082.58 | 100.00 |
| Withheld | 0.00 | 0.00 |
| TOTAL | 31,231,071,082.58 | 100.00 |
| Robert A. Lawrence |
| Affirmative | 31,231,071,082.58 | 100.00 |
| Withheld | 0.00 | 0.00 |
| TOTAL | 31,231,071,082.58 | 100.00 |
| Vijay C. Advani |
| Affirmative | 31,231,071,082.58 | 100.00 |
| Withheld | 0.00 | 0.00 |
| TOTAL | 31,231,071,082.58 | 100.00 |
| Thomas P. Bostick |
| Affirmative | 31,231,071,082.58 | 100.00 |
| Withheld | 0.00 | 0.00 |
| TOTAL | 31,231,071,082.58 | 100.00 |
| Donald F. Donahue |
| Affirmative | 31,231,071,082.58 | 100.00 |
| Withheld | 0.00 | 0.00 |
| TOTAL | 31,231,071,082.58 | 100.00 |
| Vicki L. Fuller |
| Affirmative | 31,231,071,082.58 | 100.00 |
| Withheld | 0.00 | 0.00 |
| TOTAL | 31,231,071,082.58 | 100.00 |
| Patricia L. Kampling |
| Affirmative | 31,231,071,082.58 | 100.00 |
| Withheld | 0.00 | 0.00 |
| TOTAL | 31,231,071,082.58 | 100.00 |
| Thomas A. Kennedy |
| Affirmative | 31,231,071,082.58 | 100.00 |
| Withheld | 0.00 | 0.00 |
| TOTAL | 31,231,071,082.58 | 100.00 |
| Oscar Munoz |
| Affirmative | 31,231,071,082.58 | 100.00 |
| Withheld | 0.00 | 0.00 |
| TOTAL | 31,231,071,082.58 | 100.00 |
| Karen B. Peetz |
| Affirmative | 31,231,071,082.58 | 100.00 |
| Withheld | 0.00 | 0.00 |
| TOTAL | 31,231,071,082.58 | 100.00 |
| David M. Thomas |
| Affirmative | 31,231,071,082.58 | 100.00 |
| Withheld | 0.00 | 0.00 |
| TOTAL | 31,231,071,082.58 | 100.00 |
| Susan Tomasky |
| Affirmative | 31,231,071,082.58 | 100.00 |
| Withheld | 0.00 | 0.00 |
| TOTAL | 31,231,071,082.58 | 100.00 |
| Michael E. Wiley |
| Affirmative | 31,231,071,082.58 | 100.00 |
| Withheld | 0.00 | 0.00 |
| TOTAL | 31,231,071,082.58 | 100.00 |
| | | |
| Proposal 1 reflects trust-wide proposal and voting results. |
Item 10: Remuneration Paid to Directors, Officers, and others of Open-End Management Investment Companies
(Unaudited)
Note: This information is disclosed as part of the financial statements for each Fund as part of Item 7: Financial Statements and Financial Highlights for Open-End Management Investment companies.
Item 11: Statement Regarding Basis for Approval of Investment Advisory Contract
(Unaudited)
Board Approval of Investment Advisory Contracts and Management Fees
Fidelity Floating Rate Central Fund
Each year, the Board of Directors, including the Independent Directors (together, the Board), considers the renewal of the fund's management contract with Fidelity Management & Research Company LLC (FMR) and the sub-advisory agreements (together, the Advisory Contracts) for the fund. FMR and the sub-advisers are referred to herein as the Investment Advisers. The Board, assisted by the advice of fund counsel and Independent Directors' counsel, requests and considers a broad range of information relevant to the renewal of the Advisory Contracts throughout the year.
The Board meets regularly and, at each of its meetings, covers an extensive agenda of topics and materials and considers factors that are relevant to its annual consideration of the renewal of the fund's Advisory Contracts, including the services and support provided to the fund and its shareholders. The Board, acting directly and through its Committees (each of which is composed of and chaired by Independent Directors), requests and receives information concerning the annual consideration of the renewal of the fund's Advisory Contracts. The Board also meets as needed to review matters specifically related to the Board's annual consideration of the renewal of the Advisory Contracts. Members of the Board may also meet with trustees of other Fidelity funds through joint ad hoc committees to discuss certain matters relevant to all of the Fidelity funds.
At its May 2024 meeting, the Board unanimously determined to renew the fund's Advisory Contracts. In reaching its determination, the Board considered all factors it believed relevant and reached a determination, with the assistance of fund counsel and Independent Directors' counsel and through the exercise of its business judgment, that the renewal of the Advisory Contracts was in the best interests of the fund and its shareholders and the fact that no fee is payable under the management contract was fair and reasonable in light of all of the surrounding circumstances.
Nature, Extent, and Quality of Services Provided. The Board considered staffing as it relates to the fund, including the backgrounds and experience of investment personnel of the Investment Advisers, and also considered the Investment Advisers' implementation of the fund's investment program. The Independent Directors also had discussions with senior management of Fidelity's investment operations and investment groups. The Board considered the structure of the investment personnel compensation program and whether this structure provides appropriate incentives to act in the best interests of the fund.
Resources Dedicated to Investment Management and Support Services. The Board and the Fund Oversight and Research Committees reviewed the general qualifications and capabilities of Fidelity's investment staff, including its size, education, experience, and resources, as well as Fidelity's approach to recruiting, training, managing, and compensating investment personnel. The Board noted the resources devoted to expansion of Fidelity's global investment organization, and that Fidelity's analysts have extensive resources, tools, and capabilities that allow them to conduct sophisticated quantitative and fundamental analysis, as well as credit analysis of issuers, counterparties, and guarantors. Further, the Board considered that Fidelity's investment professionals have sufficient access to global information and data so as to provide competitive investment results over time, and that those professionals also have access to sophisticated tools that permit them to assess portfolio construction and risk and performance attribution characteristics continuously, as well as to transmit new information and research conclusions rapidly around the world. Additionally, in its deliberations, the Board considered Fidelity's trading, risk management, compliance, and technology and operations capabilities and resources, which are integral parts of the investment management process.
Administrative Services. The Board considered (i) the nature, extent, quality, and cost of advisory and administrative services performed by the Investment Advisers and their affiliates under the Advisory Contracts and under separate agreements covering transfer agency and pricing and bookkeeping services for the fund; (ii) the nature and extent of Fidelity's supervision of third party service providers, principally custodians, subcustodians, and pricing vendors; and (iii) the resources devoted by Fidelity to, and the record of compliance with, the fund's compliance policies and procedures. The Board also reviewed the allocation of fund brokerage, including allocations to brokers affiliated with the Investment Advisers, and the use of "soft" commission dollars to pay for research services. The Board also considered the fund's securities lending activities and any payments made to Fidelity relating to securities lending under a separate agreement.
Investment Performance. The Board reviewed the fund's absolute investment performance, as well as the fund's relative investment performance. The Board noted that the fund is not publicly offered as a stand-alone investment product. In this regard, the Board noted that the fund is designed to offer a liquid investment option for other investment companies managed by Fidelity and ultimately to enhance the performance of those investment companies.
Based on its review, the Board concluded that the nature, extent, and quality of services provided to the fund under the Advisory Contracts should continue to benefit the shareholders of the fund.
Competitiveness of Management Fee and Total Expense Ratio. The Board considered that while the fund does not pay a management fee, FMR receives fees for providing services to funds that invest in the fund. The Board also noted that FMR bears all expenses of the fund with certain limited exceptions (i.e., custody fees, interest, taxes, fees and expenses of the Independent Directors, proxy and shareholder meeting expenses, and extraordinary expenses). The Board further noted that the fund pays its non-operating expenses, including brokerage commissions and fees and expenses associated with the fund's securities lending program, if applicable. Based on its review, the Board concluded that the management fee received for providing services to the fund and the fund's total expense ratio were reasonable in light of the services that the fund and its shareholders receive and the other factors considered.
Costs of the Services and Profitability. The Board considered the level of Fidelity's profits in respect of all the Fidelity funds, as well as the profitability of the funds that invest in the fund.
A public accounting firm has been engaged annually by the Board as part of the Board's assessment of Fidelity's profitability analysis. The engagement includes the review and assessment of the methodologies used by Fidelity in determining the revenues and expenses attributable to Fidelity's fund business, and completion of agreed-upon procedures in respect of the mathematical accuracy of certain fund profitability information and its conformity to established allocation methodologies. After considering the reports issued under the engagement and information provided by Fidelity, the Board concluded that while other allocation methods may also be reasonable, Fidelity's profitability methodologies are reasonable in all material respects.
The Board also reviewed Fidelity's non-fund businesses and potential indirect benefits such businesses may have received as a result of their association with Fidelity's fund business (i.e., fall-out benefits) as well as cases where Fidelity's affiliates may benefit from the funds' business. The Board considered areas where potential indirect benefits to the Fidelity funds from their relationships with Fidelity may exist. The Board's consideration of these matters was informed by the findings of a joint ad hoc committee created by it and the boards of other Fidelity funds to evaluate potential fall-out benefits.
The Board concluded that the costs of the services provided by and the profits realized by Fidelity in connection with the operation of the fund were not relevant to the renewal of the Advisory Contracts because the fund pays no advisory fees and FMR bears all expenses of the fund with certain exceptions.
Economies of Scale. The Board concluded that because the fund pays no advisory fees and FMR bears all expenses of the fund with certain exceptions, the realization of economies of scale was not a material factor in the Board's decision to renew the fund's Advisory Contract.
Additional Information Requested by the Board. In order to develop fully the factual basis for consideration of the Fidelity funds' advisory contracts, the Board requested and received additional information on certain topics, including but not limited to: (i) fund flow and performance trends, in particular the underperformance of certain funds and strategies, and Fidelity's long-term strategies for certain funds; (ii) the operation of performance fees and the rationale for implementing performance fees on certain categories of funds but not others; (iii) Fidelity's pricing philosophy compared to competitors; (iv) fund profitability methodology and data; (v) evaluation of competitive fund data and peer group classifications and fee and expense comparisons; (vi) the management fee and expense structures for different funds and classes and information about the differences between various fee and expense structures; (vii) the variable management fee implemented for certain funds effective March 1, 2024; and (viii) information regarding other accounts managed by Fidelity and the funds' sub-advisory arrangements.
Conclusion. Based on its evaluation of all of the conclusions noted above, and after considering all factors it believed relevant, the Board, including the Independent Directors, concluded that the advisory and sub-advisory fee arrangements are fair and reasonable in light of all of the surrounding circumstances and that the fund's Advisory Contracts should be renewed through May 31, 2025.
1.814672.119
FR1-ANN-1124
Fidelity® Emerging Markets Equity Central Fund
Annual Report
September 30, 2024
Contents
To view a fund's proxy voting guidelines and proxy voting record for the 12-month period ended June 30, visit http://www.fidelity.com/proxyvotingresults or visit the Securities and Exchange Commission's (SEC) web site at http://www.sec.gov.
You may also call 1-800-544-8544 to request a free copy of the proxy voting guidelines.
Standard & Poor's, S&P and S&P 500 are registered service marks of The McGraw-Hill Companies, Inc. and have been licensed for use by Fidelity Distributors Corporation.
Other third-party marks appearing herein are the property of their respective owners.
All other marks appearing herein are registered or unregistered trademarks or service marks of FMR LLC or an affiliated company. © 2024 FMR LLC. All rights reserved.
A fund files its complete schedule of portfolio holdings with the SEC for the first and third quarters of each fiscal year on Form N-PORT. Forms N-PORT are available on the SEC's web site at http://www.sec.gov. A fund's Forms N-PORT may be reviewed and copied at the SEC's Public Reference Room in Washington, DC. Information regarding the operation of the SEC's Public Reference Room may be obtained by calling 1-800-SEC-0330.
Item 7: Financial Statements and Financial Highlights for Open-End Management Investment Companies (Annual Report)
Fidelity® Emerging Markets Equity Central Fund
Schedule of Investments September 30, 2024
Showing Percentage of Net Assets
| Common Stocks - 98.7% |
| | | Shares | Value ($) |
| Australia - 0.0% | | | |
| Paladin Energy Ltd. (Australia) (a) | | 101,305 | 808,930 |
| Brazil - 5.8% | | | |
| Companhia de Saneamento Basico do Estado de Sao Paulo (SABESP) | | 107,700 | 1,787,191 |
| Companhia de Transmissao de Energia Eletrica Paulista (PN) | | 661,000 | 2,948,455 |
| Cury Construtora e Incorporado SA | | 278,700 | 1,143,920 |
| Cyrela Brazil Realty SA | | 89,900 | 338,629 |
| Dexco SA (a) | | 2,623,228 | 4,117,077 |
| ENGIE Brasil Energia SA | | 506,400 | 3,946,010 |
| Equatorial Energia SA | | 1,300,539 | 7,758,782 |
| Equatorial Energia SA rights 12/31/99 (a) | | 85,919 | 513,208 |
| Hapvida Participacoes e Investimentos SA (a)(b) | | 3,934,314 | 2,888,789 |
| Hypera SA | | 243,988 | 1,174,772 |
| Itau Unibanco Holding SA sponsored ADR | | 1,610,768 | 10,711,607 |
| Localiza Rent a Car SA | | 1,327,575 | 9,991,478 |
| LOG Commercial Properties e Participacoes SA | | 141,400 | 586,604 |
| MercadoLibre, Inc. (a) | | 2,496 | 5,121,692 |
| Metalurgica Gerdau SA (PN) | | 4,773,300 | 9,568,155 |
| PagSeguro Digital Ltd. (a) | | 809,527 | 6,970,027 |
| Petroleo Brasileiro SA - Petrobras: | | | |
| (PN) sponsored ADR ADR (non-vtg.) | | 600,900 | 7,925,871 |
| sponsored ADR | | 501,600 | 7,228,056 |
| PRIO SA | | 929,000 | 7,389,094 |
| Raia Drogasil SA | | 2,396,300 | 11,212,381 |
| Rumo SA | | 2,240,600 | 8,225,857 |
| Transmissora Alianca de Energia Eletrica SA | | 496,900 | 3,123,126 |
| Vale SA sponsored ADR | | 1,661,315 | 19,404,159 |
| XP, Inc. Class A | | 667,783 | 11,980,027 |
TOTAL BRAZIL | | | 146,054,967 |
| Canada - 0.7% | | | |
| Barrick Gold Corp. | | 850,300 | 16,912,467 |
| Chile - 0.8% | | | |
| Antofagasta PLC | | 525,250 | 14,135,950 |
| Banco de Chile | | 54,775,300 | 6,986,241 |
TOTAL CHILE | | | 21,122,191 |
| China - 30.8% | | | |
| Advanced Micro-Fabrication Equipment, Inc., China (A Shares) | | 342,400 | 8,000,798 |
| Aier Eye Hospital Group Co. Ltd. (A Shares) | | 376,080 | 852,523 |
| Airtac International Group | | 223,000 | 6,409,942 |
| Akeso, Inc. (a)(b) | | 295,500 | 2,607,627 |
| Alibaba Group Holding Ltd. | | 4,840,834 | 64,328,798 |
| Angelalign Technology, Inc. (b)(c) | | 74,200 | 720,634 |
| Baidu, Inc. Class A (a) | | 141,717 | 1,863,240 |
| Bank of Ningbo Co. Ltd. (A Shares) | | 861,667 | 3,155,210 |
| BeiGene Ltd. ADR (a) | | 16,405 | 3,683,087 |
| Beijing Enlight Media Co. Ltd. (A Shares) | | 1,056,499 | 1,339,722 |
| Beijing Roborock Technology Co. Ltd. (A Shares) | | 101,800 | 4,031,097 |
| Bethel Automotive Safety Systems Co. Ltd. (A Shares) | | 56,300 | 392,419 |
| Bilibili, Inc. ADR (a) | | 95,842 | 2,240,786 |
| BYD Co. Ltd.: | | | |
| (A Shares) | | 41,600 | 1,821,486 |
| (H Shares) | | 449,774 | 16,047,022 |
| C&S Paper Co. Ltd. (A Shares) | | 2,212,800 | 2,506,484 |
| China Communications Services Corp. Ltd. (H Shares) | | 7,642,000 | 4,138,595 |
| China Construction Bank Corp. (H Shares) | | 51,789,000 | 39,172,266 |
| China Gas Holdings Ltd. | | 3,770,400 | 3,506,627 |
| China Jushi Co. Ltd. (A Shares) | | 5,546,004 | 9,292,727 |
| China Life Insurance Co. Ltd. (H Shares) | | 9,809,000 | 19,709,228 |
| China Merchants Bank Co. Ltd. (H Shares) | | 1,345,000 | 6,669,765 |
| China Overseas Land and Investment Ltd. | | 746,960 | 1,529,693 |
| China Petroleum & Chemical Corp. (H Shares) | | 16,978,000 | 10,570,505 |
| China Resources Beer Holdings Co. Ltd. | | 1,344,166 | 5,755,398 |
| China Resources Land Ltd. | | 1,257,200 | 4,633,326 |
| China Tower Corp. Ltd. (H Shares) (b) | | 8,448,833 | 1,119,432 |
| ENN Energy Holdings Ltd. | | 904,000 | 6,983,052 |
| ESR Group Ltd. (b) | | 727,400 | 1,160,269 |
| Eyebright Medical Technology Beijing Co. Ltd. (A Shares) | | 34,200 | 484,360 |
| Flat Glass Group Co. Ltd. (A Shares) | | 1,094,700 | 3,153,784 |
| Foxconn Industrial Internet Co. Ltd. (A Shares) | | 2,792,535 | 10,022,648 |
| Fuyao Glass Industries Group Co. Ltd. (A Shares) | | 637,800 | 5,288,874 |
| Glodon Co. Ltd. (A Shares) | | 381,900 | 735,668 |
| Guangdong Investment Ltd. | | 4,818,000 | 3,241,398 |
| Haier Smart Home Co. Ltd. | | 3,988,387 | 15,622,763 |
| Haier Smart Home Co. Ltd. (A Shares) | | 1,363,400 | 6,245,396 |
| Haitian International Holdings Ltd. | | 1,734,000 | 5,576,388 |
| Hansoh Pharmaceutical Group Co. Ltd. (b) | | 986,010 | 2,657,230 |
| Innovent Biologics, Inc. (a)(b) | | 577,993 | 3,501,929 |
| JA Solar Technology Co. Ltd. (A Shares) | | 586,200 | 1,131,725 |
| JD.com, Inc.: | | | |
| Class A | | 752,789 | 15,099,343 |
| sponsored ADR | | 223,407 | 8,936,280 |
| Kanzhun Ltd. ADR | | 89,309 | 1,550,404 |
| KE Holdings, Inc. ADR | | 239,800 | 4,774,418 |
| Kuaishou Technology Class B (a)(b) | | 518,783 | 3,660,380 |
| Kunlun Energy Co. Ltd. | | 5,880,000 | 6,066,183 |
| Kweichow Moutai Co. Ltd. (A Shares) | | 50,900 | 12,676,954 |
| Lenovo Group Ltd. | | 4,898,026 | 6,678,682 |
| Li Auto, Inc.: | | | |
| ADR (a)(c) | | 184,430 | 4,730,630 |
| Class A (a) | | 306,166 | 3,936,970 |
| Li Ning Co. Ltd. | | 2,420,139 | 6,132,964 |
| Longfor Properties Co. Ltd. (b) | | 319,500 | 618,134 |
| Medlive Technology Co. Ltd. (b) | | 840,245 | 998,715 |
| Meituan Class B (a)(b) | | 2,042,485 | 43,372,964 |
| Midea Group Co. Ltd. (H Shares) | | 377,000 | 3,600,822 |
| Montage Technology Co. Ltd. (A Shares) | | 667,000 | 6,355,911 |
| NAURA Technology Group Co. Ltd. | | 153,742 | 8,016,884 |
| NetEase, Inc. ADR | | 53,216 | 4,976,228 |
| New Oriental Education & Technology Group, Inc. sponsored ADR | | 65,079 | 4,935,591 |
| NIO, Inc. sponsored ADR (a) | | 323,313 | 2,159,731 |
| PDD Holdings, Inc. ADR (a) | | 377,853 | 50,938,363 |
| Ping An Insurance Group Co. of China Ltd. (H Shares) | | 5,473,500 | 34,371,008 |
| Proya Cosmetics Co. Ltd. (A Shares) | | 656,888 | 10,303,740 |
| Shenzhen Inovance Technology Co. Ltd. (A Shares) | | 1,220,900 | 10,863,462 |
| Shenzhen Mindray Bio-Medical Electronics Co. Ltd. (A Shares) | | 113,753 | 4,748,825 |
| Shenzhou International Group Holdings Ltd. | | 114,600 | 1,040,029 |
| Sichuan Kelun-Biotech Biopharmaceutical Co. Ltd. (H Shares) (a)(c) | | 36,190 | 856,119 |
| Sinopec Engineering Group Co. Ltd. (H Shares) | | 5,067,500 | 3,507,033 |
| Sinopharm Group Co. Ltd. (H Shares) | | 844,109 | 2,258,529 |
| Sinotruk Hong Kong Ltd. | | 1,661,500 | 4,990,581 |
| Tencent Holdings Ltd. | | 2,241,021 | 124,611,729 |
| Tongdao Liepin Group (a) | | 490,658 | 187,456 |
| TravelSky Technology Ltd. (H Shares) | | 2,303,000 | 3,424,645 |
| Trip.com Group Ltd. (a) | | 13,319 | 801,385 |
| Trip.com Group Ltd. ADR (a) | | 270,987 | 16,104,757 |
| Tsingtao Brewery Co. Ltd. (H Shares) | | 1,155,800 | 9,039,619 |
| Uni-President China Holdings Ltd. | | 3,662,400 | 3,434,450 |
| Xiaomi Corp. Class B (a)(b) | | 5,094,800 | 14,350,493 |
| Xinyi Solar Holdings Ltd. | | 5,028,000 | 2,729,428 |
| Yifeng Pharmacy Chain Co. Ltd. | | 482,890 | 1,755,839 |
| Zai Lab Ltd. (a) | | 782,220 | 1,887,068 |
| Zhejiang Shuanghuan Driveline Co. Ltd. | | 80,300 | 315,319 |
| Zhongji Innolight Co. Ltd. (A Shares) | | 672,328 | 14,834,611 |
| ZTO Express, Inc. sponsored ADR Class A | | 547,766 | 13,568,164 |
TOTAL CHINA | | | 772,104,761 |
| Greece - 0.7% | | | |
| Alpha Services and Holdings SA | | 5,704,401 | 9,893,073 |
| Piraeus Financial Holdings SA | | 1,643,683 | 7,000,301 |
TOTAL GREECE | | | 16,893,374 |
| Hong Kong - 0.8% | | | |
| ASMPT Ltd. | | 497,060 | 6,074,300 |
| Huanxi Media Group Ltd. (a) | | 9,169,702 | 672,348 |
| Kerry Properties Ltd. | | 545,000 | 1,160,969 |
| Prudential PLC | | 1,352,748 | 12,549,774 |
| Prudential PLC rights (a)(d) | | 1,352,748 | 93,936 |
TOTAL HONG KONG | | | 20,551,327 |
| Hungary - 0.1% | | | |
| Richter Gedeon PLC | | 59,678 | 1,837,583 |
| India - 17.4% | | | |
| Akums Drugs & Pharmaceutical Ltd. | | 35,886 | 358,014 |
| Apollo Hospitals Enterprise Ltd. | | 48,526 | 4,169,677 |
| Bajaj Auto Ltd. | | 76,998 | 11,346,205 |
| Bajaj Finance Ltd. | | 243,448 | 22,382,716 |
| Bharat Electronics Ltd. | | 3,771,500 | 12,833,881 |
| Bharti Airtel Ltd. | | 1,119,953 | 22,852,214 |
| Coal India Ltd. | | 1,945,500 | 11,846,111 |
| Divi's Laboratories Ltd. | | 71,467 | 4,643,212 |
| Embassy Office Parks (REIT) | | 381,252 | 1,774,284 |
| Godrej Properties Ltd. (a) | | 33,300 | 1,256,344 |
| HDFC Bank Ltd. | | 2,827,782 | 58,249,295 |
| HDFC Standard Life Insurance Co. Ltd. (b) | | 2,091,628 | 17,924,852 |
| Hero Motocorp Ltd. | | 95,521 | 6,512,746 |
| Hindustan Aeronautics Ltd. | | 266,400 | 14,056,171 |
| ICICI Bank Ltd. | | 1,931,630 | 29,320,119 |
| Indraprastha Gas Ltd. | | 837,620 | 5,584,133 |
| ITC Ltd. | | 2,126,487 | 13,151,186 |
| JK Cement Ltd. | | 248,698 | 13,783,062 |
| Kalyan Jewellers India Ltd. | | 196,300 | 1,710,955 |
| Larsen & Toubro Ltd. | | 406,651 | 17,839,836 |
| Mahanagar Gas Ltd. | | 290,601 | 6,730,310 |
| Mahindra & Mahindra Ltd. | | 279,377 | 10,320,101 |
| MakeMyTrip Ltd. (a) | | 66,902 | 6,218,541 |
| Mankind Pharma Ltd. (a) | | 58,352 | 1,755,592 |
| Max Healthcare Institute Ltd. | | 64,200 | 755,350 |
| NTPC Ltd. | | 2,447,011 | 12,944,413 |
| Ola Electric Mobility Ltd. | | 382,785 | 455,143 |
| Petronet LNG Ltd. | | 934,868 | 3,811,108 |
| Power Grid Corp. of India Ltd. | | 2,896,841 | 12,200,046 |
| Reliance Industries Ltd. | | 1,212,197 | 42,727,295 |
| Shree Cement Ltd. | | 19,327 | 6,068,954 |
| Sona Blw Precision Forgings Ltd. (b) | | 437,609 | 3,882,894 |
| Star Health & Allied Insurance Co. Ltd. (a) | | 114,524 | 829,857 |
| Sun Pharmaceutical Industries Ltd. | | 363,620 | 8,361,969 |
| Sunteck Realty Ltd. | | 66,194 | 458,714 |
| Tata Steel Ltd. | | 6,384,800 | 12,844,664 |
| Torrent Pharmaceuticals Ltd. | | 96,172 | 3,898,821 |
| Trent Ltd. | | 7,300 | 659,982 |
| Zomato Ltd. (a) | | 8,701,971 | 28,385,984 |
TOTAL INDIA | | | 434,904,751 |
| Indonesia - 2.5% | | | |
| First Resources Ltd. | | 5,355,200 | 6,124,990 |
| PT Bank Central Asia Tbk | | 36,610,824 | 24,967,421 |
| PT Bank Rakyat Indonesia (Persero) Tbk | | 65,486,455 | 21,418,156 |
| PT Sumber Alfaria Trijaya Tbk | | 37,628,100 | 7,853,685 |
| PT Telkom Indonesia Persero Tbk | | 7,361,100 | 1,457,601 |
TOTAL INDONESIA | | | 61,821,853 |
| Korea (South) - 7.3% | | | |
| AMOREPACIFIC Corp. | | 114,650 | 12,838,561 |
| Celltrion, Inc. | | 37,508 | 5,556,614 |
| Coway Co. Ltd. | | 108,480 | 5,485,766 |
| Delivery Hero AG (a)(b) | | 59,440 | 2,405,508 |
| HLB, Inc. (a) | | 14,660 | 952,525 |
| Hyundai Motor Co. Ltd. | | 17,969 | 3,324,111 |
| Kakao Corp. | | 81,504 | 2,233,824 |
| Kakao Pay Corp. (a) | | 31,849 | 589,179 |
| LG Corp. | | 104,022 | 6,238,260 |
| LS Electric Co. Ltd. | | 39,040 | 4,833,456 |
| NAVER Corp. | | 84,106 | 10,801,950 |
| Samsung Biologics Co. Ltd. (a)(b) | | 10,236 | 7,582,050 |
| Samsung Electronics Co. Ltd. | | 1,333,528 | 62,178,329 |
| SK Hynix, Inc. | | 424,346 | 56,172,809 |
| Webtoon Entertainment, Inc. | | 104,354 | 1,193,810 |
TOTAL KOREA (SOUTH) | | | 182,386,752 |
| Mauritius - 0.0% | | | |
| Jumo World Holding Ltd. (a)(e)(f) | | 161,297 | 295,174 |
| Jumo World Ltd. (a)(f) | | 161 | 0 |
TOTAL MAURITIUS | | | 295,174 |
| Mexico - 1.6% | | | |
| CEMEX S.A.B. de CV sponsored ADR | | 1,014,400 | 6,187,840 |
| Corporacion Inmobiliaria Vesta S.A.B. de CV | | 769,600 | 2,077,412 |
| Fibra Uno Administracion SA de CV | | 1,305,300 | 1,519,425 |
| Grupo Financiero Banorte S.A.B. de CV | | 2,970,532 | 21,045,669 |
| Wal-Mart de Mexico SA de CV Series V | | 3,546,800 | 10,658,413 |
TOTAL MEXICO | | | 41,488,759 |
| Netherlands - 0.1% | | | |
| CTP BV (b) | | 78,985 | 1,441,923 |
| CTP BV rights (a)(d) | | 69,585 | 22,463 |
TOTAL NETHERLANDS | | | 1,464,386 |
| Panama - 0.3% | | | |
| Copa Holdings SA Class A | | 71,298 | 6,690,604 |
| Peru - 0.5% | | | |
| Credicorp Ltd. (United States) | | 76,909 | 13,918,222 |
| Philippines - 0.4% | | | |
| Ayala Land, Inc. | | 4,301,700 | 2,811,970 |
| SM Investments Corp. | | 239,000 | 4,080,800 |
| SM Prime Holdings, Inc. | | 3,547,200 | 2,046,340 |
TOTAL PHILIPPINES | | | 8,939,110 |
| Poland - 0.5% | | | |
| Allegro.eu SA (a)(b) | | 467,223 | 4,225,522 |
| CD Projekt SA (c) | | 81,300 | 3,678,461 |
| Dino Polska SA (a)(b) | | 44,100 | 4,018,153 |
TOTAL POLAND | | | 11,922,136 |
| Puerto Rico - 0.1% | | | |
| Liberty Latin America Ltd. Class C (a) | | 160,904 | 1,526,979 |
| Romania - 0.0% | | | |
| Societatea de Producere A Energiei Electrice in Hidrocentrale Hidroelectrica SA | | 49,700 | 1,389,868 |
| Russia - 0.0% | | | |
| Gazprom OAO sponsored ADR (Reg. S) (a)(f) | | 782,800 | 219,184 |
| LSR Group OJSC (a)(f) | | 6,300 | 6,341 |
| Sberbank of Russia (a)(f) | | 794,750 | 4,889 |
| Sberbank of Russia sponsored ADR (a)(f) | | 1,468,992 | 26,148 |
| Severstal PAO GDR (Reg. S) (a)(f) | | 433,400 | 10,233 |
TOTAL RUSSIA | | | 266,795 |
| Saudi Arabia - 3.7% | | | |
| Al Rajhi Bank | | 914,415 | 21,255,262 |
| Alinma Bank | | 1,818,375 | 13,814,493 |
| Bupa Arabia for Cooperative Insurance Co. | | 186,450 | 10,298,139 |
| Dr Sulaiman Al Habib Medical Services Group Co. | | 32,322 | 2,555,501 |
| Sabic Agriculture-Nutrients Co. | | 211,600 | 6,700,986 |
| Saudi Arabian Oil Co. (b) | | 2,023,100 | 14,614,813 |
| The Saudi National Bank | | 2,515,993 | 23,004,361 |
TOTAL SAUDI ARABIA | | | 92,243,555 |
| Singapore - 1.6% | | | |
| Sea Ltd. ADR Class A (a) | | 420,184 | 39,614,948 |
| South Africa - 3.7% | | | |
| Bidvest Group Ltd./The | | 38,017 | 644,248 |
| Capitec Bank Holdings Ltd. | | 181,099 | 31,911,892 |
| Discovery Ltd. | | 764,242 | 7,599,292 |
| Impala Platinum Holdings Ltd. | | 1,869,600 | 10,470,409 |
| Naspers Ltd. Class N | | 94,633 | 22,976,471 |
| Pick 'n Pay Stores Ltd. (a)(c) | | 3,701,602 | 5,533,924 |
| Shoprite Holdings Ltd. (c) | | 778,841 | 13,333,271 |
TOTAL SOUTH AFRICA | | | 92,469,507 |
| Taiwan - 16.6% | | | |
| Accton Technology Corp. | | 280,000 | 4,689,733 |
| Alchip Technologies Ltd. | | 100,582 | 6,254,115 |
| ASE Technology Holding Co. Ltd. | | 554,380 | 2,619,507 |
| Asia Vital Components Co. Ltd. | | 424,401 | 7,883,279 |
| AURAS Technology Co. Ltd. | | 265,000 | 5,606,523 |
| BizLink Holding, Inc. | | 498,390 | 7,233,504 |
| Cathay Financial Holding Co. Ltd. | | 1,509,000 | 3,159,289 |
| Chailease Holding Co. Ltd. | | 1,853,012 | 9,538,377 |
| CTBC Financial Holding Co. Ltd. | | 3,508,000 | 3,799,238 |
| Delta Electronics, Inc. | | 563,000 | 6,744,372 |
| E Ink Holdings, Inc. | | 294,000 | 2,712,023 |
| eMemory Technology, Inc. | | 85,643 | 7,091,304 |
| Formosa Plastics Corp. | | 2,298,000 | 3,870,636 |
| Hon Hai Precision Industry Co. Ltd. (Foxconn) | | 4,948,000 | 29,208,513 |
| King Yuan Electronics Co. Ltd. | | 1,282,107 | 4,541,040 |
| MediaTek, Inc. | | 317,324 | 11,738,680 |
| PharmaEssentia Corp. (a) | | 121,260 | 2,428,025 |
| Quanta Computer, Inc. | | 353,152 | 2,935,243 |
| Taiwan Semiconductor Manufacturing Co. Ltd. | | 9,057,203 | 272,110,574 |
| Uni-President Enterprises Corp. | | 3,596,000 | 9,872,216 |
| Unimicron Technology Corp. | | 822,261 | 3,727,783 |
| Wiwynn Corp. | | 101,700 | 5,491,153 |
| Yageo Corp. | | 87,000 | 1,706,419 |
TOTAL TAIWAN | | | 414,961,546 |
| Tanzania - 0.0% | | | |
| Helios Towers PLC (a) | | 445,700 | 682,877 |
| Thailand - 0.4% | | | |
| PTT Global Chemical PCL (For. Reg.) | | 10,005,300 | 9,323,735 |
| Supalai PCL (For. Reg.) | | 1,758,200 | 1,125,056 |
TOTAL THAILAND | | | 10,448,791 |
| United Arab Emirates - 0.3% | | | |
| Aldar Properties PJSC | | 664,100 | 1,359,642 |
| Emaar Properties PJSC | | 2,247,478 | 5,335,622 |
TOTAL UNITED ARAB EMIRATES | | | 6,695,264 |
| United Kingdom - 0.3% | | | |
| AngloGold Ashanti PLC | | 284,900 | 7,568,586 |
| United States of America - 1.7% | | | |
| FirstCash Holdings, Inc. | | 126,472 | 14,518,986 |
| Legend Biotech Corp. ADR (a) | | 102,763 | 5,007,641 |
| Tenaris SA sponsored ADR | | 219,600 | 6,981,084 |
| Titan Cement International Trading SA | | 425,630 | 16,772,167 |
TOTAL UNITED STATES OF AMERICA | | | 43,279,878 |
| TOTAL COMMON STOCKS (Cost $1,835,710,524) | | | 2,471,265,941 |
| | | | |
| Preferred Stocks - 0.8% |
| | | Shares | Value ($) |
| Convertible Preferred Stocks - 0.5% | | | |
| China - 0.3% | | | |
| ByteDance Ltd. Series E1 (a)(e)(f) | | 30,246 | 7,536,396 |
| dMed Biopharmaceutical Co. Ltd. Series C (a)(e)(f) | | 52,588 | 263,992 |
| | | | 7,800,388 |
| India - 0.2% | | | |
| Meesho: | | | |
| Series D2 (e)(f) | | 14,381 | 804,042 |
| Series E (e)(f) | | 2,396 | 133,960 |
| Series E1 (e)(f) | | 2,520 | 140,893 |
| Series F (a)(e)(f) | | 36,087 | 2,052,629 |
| | | | 3,131,524 |
| United States of America - 0.0% | | | |
| Gupshup, Inc. (a)(e)(f) | | 44,950 | 386,570 |
TOTAL CONVERTIBLE PREFERRED STOCKS | | | 11,318,482 |
| Nonconvertible Preferred Stocks - 0.3% | | | |
| Korea (South) - 0.3% | | | |
| Hyundai Motor Co. Ltd. Series 2 | | 65,895 | 8,762,819 |
| TOTAL PREFERRED STOCKS (Cost $13,242,555) | | | 20,081,301 |
| | | | |
| Convertible Bonds - 0.1% |
| | | Principal Amount (g) | Value ($) |
| Brazil - 0.1% | | | |
Creditas Financial Solutions Ltd. 5% 7/28/27 (e)(f) (Cost $2,066,600) | | 2,066,600 | 1,939,297 |
| | | | |
| Money Market Funds - 1.5% |
| | | Shares | Value ($) |
| Fidelity Cash Central Fund 4.89% (h) | | 25,743,457 | 25,748,606 |
| Fidelity Securities Lending Cash Central Fund 4.89% (h)(i) | | 12,630,106 | 12,631,369 |
| TOTAL MONEY MARKET FUNDS (Cost $38,379,590) | | | 38,379,975 |
| | | | |
| TOTAL INVESTMENT IN SECURITIES - 101.1% (Cost $1,889,399,269) | 2,531,666,514 |
NET OTHER ASSETS (LIABILITIES) - (1.1)% | (26,357,312) |
| NET ASSETS - 100.0% | 2,505,309,202 |
| | |
Legend
| (b) | Security exempt from registration under Rule 144A of the Securities Act of 1933. These securities may be resold in transactions exempt from registration, normally to qualified institutional buyers. At the end of the period, the value of these securities amounted to $133,752,311 or 5.3% of net assets. |
| (c) | Security or a portion of the security is on loan at period end. |
| (d) | Security or a portion of the security purchased on a delayed delivery or when-issued basis. |
| (e) | Restricted securities (including private placements) - Investment in securities not registered under the Securities Act of 1933 (excluding 144A issues). At the end of the period, the value of restricted securities (excluding 144A issues) amounted to $13,552,953 or 0.5% of net assets. |
| (g) | Amount is stated in United States dollars unless otherwise noted. |
| (h) | Affiliated fund that is generally available only to investment companies and other accounts managed by Fidelity Investments. The rate quoted is the annualized seven-day yield of the fund at period end. A complete unaudited listing of the fund's holdings as of its most recent quarter end is available upon request. In addition, each Fidelity Central Fund's financial statements, which are not covered by the Fund's Report of Independent Registered Public Accounting Firm, are available on the SEC's website or upon request. |
| (i) | Investment made with cash collateral received from securities on loan. |
| Additional information on each restricted holding is as follows: |
| Security | Acquisition Date | Acquisition Cost ($) |
| ByteDance Ltd. Series E1 | 11/18/20 | 3,314,181 |
| | | |
| Creditas Financial Solutions Ltd. 5% 7/28/27 | 1/28/22 - 7/28/23 | 2,066,600 |
| | | |
| dMed Biopharmaceutical Co. Ltd. Series C | 12/01/20 | 746,915 |
| | | |
| Gupshup, Inc. | 6/08/21 | 1,027,791 |
| | | |
| Jumo World Holding Ltd. | 9/06/23 | 161,297 |
| | | |
| Meesho Series D2 | 7/15/24 | 805,336 |
| | | |
| Meesho Series E | 7/15/24 | 134,176 |
| | | |
| Meesho Series E1 | 4/18/24 | 141,120 |
| | | |
| Meesho Series F | 9/21/21 - 7/15/24 | 2,720,899 |
| | | |
Affiliated Central Funds
Fiscal year to date information regarding the Fund's investments in Fidelity Central Funds, including the ownership percentage, is presented below.
| Affiliate | Value, beginning of period ($) | Purchases ($) | Sales Proceeds ($) | Dividend Income ($) | Realized Gain (loss) ($) | Change in Unrealized appreciation (depreciation) ($) | Value, end of period ($) | % ownership, end of period |
| Fidelity Cash Central Fund 4.89% | 22,507,677 | 638,928,420 | 635,687,578 | 1,816,746 | 85 | 2 | 25,748,606 | 0.1% |
| Fidelity Securities Lending Cash Central Fund 4.89% | 10,701,650 | 238,516,177 | 236,586,458 | 161,682 | - | - | 12,631,369 | 0.0% |
| Total | 33,209,327 | 877,444,597 | 872,274,036 | 1,978,428 | 85 | 2 | 38,379,975 | |
| | | | | | | | | |
Amounts in the dividend income column in the above table include any capital gain distributions from underlying funds, which are presented in the corresponding line item in the Statement of Operations, if applicable.
Amounts in the dividend income column for Fidelity Securities Lending Cash Central Fund represents the income earned on investing cash collateral, less rebates paid to borrowers and any lending agent fees associated with the loan, plus any premium payments received for lending certain types of securities.
Amounts included in the purchases and sales proceeds columns may include in-kind transactions, if applicable.
Investment Valuation
The following is a summary of the inputs used, as of September 30, 2024, involving the Fund's assets and liabilities carried at fair value. The inputs or methodology used for valuing securities may not be an indication of the risk associated with investing in those securities. For more information on valuation inputs, and their aggregation into the levels used below, please refer to the Investment Valuation section in the accompanying Notes to Financial Statements.
| Valuation Inputs at Reporting Date: |
| Description | Total ($) | Level 1 ($) | Level 2 ($) | Level 3 ($) |
Investments in Securities: | | | | |
|
| Equities: | | | | |
Communication Services | 233,800,785 | 98,331,819 | 127,932,570 | 7,536,396 |
Consumer Discretionary | 405,716,161 | 240,969,884 | 161,614,753 | 3,131,524 |
Consumer Staples | 140,069,264 | 134,313,866 | 5,755,398 | - |
Energy | 114,122,051 | 113,902,867 | - | 219,184 |
Financials | 519,133,489 | 362,898,926 | 155,908,352 | 326,211 |
Health Care | 79,446,773 | 77,295,713 | 1,887,068 | 263,992 |
Industrials | 141,722,260 | 141,722,260 | - | - |
Information Technology | 575,882,901 | 286,415,757 | 289,080,574 | 386,570 |
Materials | 167,031,807 | 167,021,574 | - | 10,233 |
Real Estate | 35,698,949 | 35,692,608 | - | 6,341 |
Utilities | 78,722,802 | 78,722,802 | - | - |
|
| Corporate Bonds | 1,939,297 | - | - | 1,939,297 |
|
| Money Market Funds | 38,379,975 | 38,379,975 | - | - |
| Total Investments in Securities: | 2,531,666,514 | 1,775,668,051 | 742,178,715 | 13,819,748 |
The following is a reconciliation of Investments in Securities for which Level 3 inputs were used in determining value:
| |
| Investments in Securities: | |
| Beginning Balance | $ | 29,304,694 | |
| Net Realized Gain (Loss) on Investment Securities | | (32,434,026) | |
| Net Unrealized Gain (Loss) on Investment Securities | | 45,294,796 | |
| Cost of Purchases | | 1,205,176 | |
| Proceeds of Sales | | (29,550,892) | |
| Amortization/Accretion | | - | |
| Transfers into Level 3 | | - | |
| Transfers out of Level 3 | | - | |
| Ending Balance | $ | 13,819,748 | |
| The change in unrealized gain (loss) for the period attributable to Level 3 securities held at September 30, 2024 | $ | (653,054) | |
| The information used in the above reconciliation represents fiscal year to date activity for any Investments in Securities identified as using Level 3 inputs at either the beginning or the end of the current fiscal period. Cost of purchases and proceeds of sales may include securities received and/or delivered through in-kind transactions, corporate actions or exchanges. Transfers into Level 3 were attributable to a lack of observable market data resulting from decreases in market activity, decreases in liquidity, security restructurings or corporate actions. Transfers out of Level 3 were attributable to observable market data becoming available for those securities. Transfers in or out of Level 3 represent the beginning value of any Security or Instrument where a change in the pricing level occurred from the beginning to the end of the period. Realized and unrealized gains (losses) disclosed in the reconciliation are included in Net Gain (Loss) on the Fund's Statement of Operations. | |
Financial Statements
| Statement of Assets and Liabilities |
As of September 30, 2024 |
| Assets | | | | |
| Investment in securities, at value (including securities loaned of $11,976,780) - See accompanying schedule: | | | | |
Unaffiliated issuers (cost $1,851,019,679) | $ | 2,493,286,539 | | |
Fidelity Central Funds (cost $38,379,590) | | 38,379,975 | | |
| | | | | |
| | | | | |
| Total Investment in Securities (cost $1,889,399,269) | | | $ | 2,531,666,514 |
| Foreign currency held at value (cost $24,359,375) | | | | 24,339,717 |
| Receivable for investments sold | | | | 67,349,407 |
| Receivable for fund shares sold | | | | 12,169 |
| Dividends receivable | | | | 4,594,409 |
| Interest receivable | | | | 121,852 |
| Distributions receivable from Fidelity Central Funds | | | | 194,958 |
| Other receivables | | | | 1,098,161 |
Total assets | | | | 2,629,377,187 |
| Liabilities | | | | |
| Payable to custodian bank | $ | 249,695 | | |
| Payable for investments purchased | | | | |
Regular delivery | | 84,685,630 | | |
Delayed delivery | | 116,553 | | |
| Payable for fund shares redeemed | | 1,030,275 | | |
| Deferred taxes | | 24,622,275 | | |
| Other payables and accrued expenses | | 732,189 | | |
| Collateral on securities loaned | | 12,631,368 | | |
| Total liabilities | | | | 124,067,985 |
| Net Assets | | | $ | 2,505,309,202 |
| Net Assets consist of: | | | | |
| Paid in capital | | | $ | 2,147,716,442 |
| Total accumulated earnings (loss) | | | | 357,592,760 |
| Net Assets | | | $ | 2,505,309,202 |
Net Asset Value, offering price and redemption price per share ($2,505,309,202 ÷ 10,856,127 shares) | | | $ | 230.77 |
| Statement of Operations |
| Year ended September 30, 2024 |
| Investment Income | | | | |
| Dividends | | | $ | 60,423,716 |
| Interest | | | | 129,933 |
| Income from Fidelity Central Funds (including $161,682 from security lending) | | | | 1,978,428 |
| Income before foreign taxes withheld | | | $ | 62,532,077 |
| Less foreign taxes withheld | | | | (6,517,526) |
| Total income | | | | 56,014,551 |
| Expenses | | | | |
| Custodian fees and expenses | $ | 509,217 | | |
| Independent trustees' fees and expenses | | 10,957 | | |
| Miscellaneous | | 4 | | |
| Total expenses | | | | 520,178 |
| Net Investment income (loss) | | | | 55,494,373 |
| Realized and Unrealized Gain (Loss) | | | | |
| Net realized gain (loss) on: | | | | |
| Investment Securities: | | | | |
| Unaffiliated issuers (net of foreign taxes of $7,776,324) | | (62,469,582) | | |
| Fidelity Central Funds | | 85 | | |
| Foreign currency transactions | | (6,148,332) | | |
| Futures contracts | | 186,777 | | |
| Total net realized gain (loss) | | | | (68,431,052) |
| Change in net unrealized appreciation (depreciation) on: | | | | |
| Investment Securities: | | | | |
| Unaffiliated issuers (net of increase in deferred foreign taxes of $15,559,601) | | 540,967,893 | | |
| Fidelity Central Funds | | 2 | | |
| Assets and liabilities in foreign currencies | | 3,854,867 | | |
| Total change in net unrealized appreciation (depreciation) | | | | 544,822,762 |
| Net gain (loss) | | | | 476,391,710 |
| Net increase (decrease) in net assets resulting from operations | | | $ | 531,886,083 |
| Statement of Changes in Net Assets |
| |
| | Year ended September 30, 2024 | | Year ended September 30, 2023 |
| Increase (Decrease) in Net Assets | | | | |
| Operations | | | | |
| Net investment income (loss) | $ | 55,494,373 | $ | 60,922,816 |
| Net realized gain (loss) | | (68,431,052) | | (104,922,878) |
| Change in net unrealized appreciation (depreciation) | | 544,822,762 | | 299,723,645 |
| Net increase (decrease) in net assets resulting from operations | | 531,886,083 | | 255,723,583 |
| Distributions to shareholders | | (53,105,685) | | (66,650,856) |
| | | | | |
| Affiliated share transactions | | | | |
| Proceeds from sales of shares | | 88,746,296 | | 527,724,240 |
| Reinvestment of distributions | | 53,105,685 | | 66,650,856 |
| Cost of shares redeemed | | (270,865,212) | | (399,969,764) |
| | | | | |
Net increase (decrease) in net assets resulting from share transactions | | (129,013,231) | | 194,405,332 |
| Total increase (decrease) in net assets | | 349,767,167 | | 383,478,059 |
| | | | | |
| Net Assets | | | | |
| Beginning of period | | 2,155,542,035 | | 1,772,063,976 |
| End of period | $ | 2,505,309,202 | $ | 2,155,542,035 |
| | | | | |
| Other Information | | | | |
| Shares | | | | |
| Sold | | 427,021 | | 2,759,066 |
| Issued in reinvestment of distributions | | 261,492 | | 350,181 |
| Redeemed | | (1,309,993) | | (2,152,238) |
| Net increase (decrease) | | (621,480) | | 957,009 |
| | | | | |
Financial Highlights
Fidelity® Emerging Markets Equity Central Fund |
| |
| Years ended September 30, | | 2024 | | 2023 | | 2022 | | 2021 | | 2020 |
Selected Per-Share Data | | | | | | | | | | |
| Net asset value, beginning of period | $ | 187.80 | $ | 168.44 | $ | 277.72 | $ | 237.14 | $ | 210.61 |
| Income from Investment Operations | | | | | | | | | | |
Net investment income (loss) A,B | | 4.94 | | 5.48 | | 5.84 | | 5.06 | | 3.85 |
| Net realized and unrealized gain (loss) | | 42.80 | | 19.98 | | (90.17) | | 40.55 | | 28.57 |
| Total from investment operations | | 47.74 | | 25.46 | | (84.33) | | 45.61 | | 32.42 |
| Distributions from net investment income | | (4.77) | | (6.10) | | (6.45) | | (5.03) | | (5.52) |
| Distributions from net realized gain | | - | | - | | (18.50) | | - | | (.37) |
| Total distributions | | (4.77) | | (6.10) | | (24.95) | | (5.03) | | (5.89) |
| Net asset value, end of period | $ | 230.77 | $ | 187.80 | $ | 168.44 | $ | 277.72 | $ | 237.14 |
Total Return C | | | | 15.11% | | (32.96)% | | 19.17% | | 15.71% |
Ratios to Average Net Assets B,D,E | | | | | | | | | | |
| Expenses before reductions | | .02% | | .02% | | .02% | | .03% | | .05% |
| Expenses net of fee waivers, if any | | | | .02% | | .02% | | .03% | | .05% |
| Expenses net of all reductions | | .02% | | .02% | | .02% | | .03% | | .05% |
| Net investment income (loss) | | 2.39% | | 2.88% | | 2.68% | | 1.74% | | 1.76% |
| Supplemental Data | | | | | | | | | | |
| Net assets, end of period (000 omitted) | $ | 2,505,309 | $ | 2,155,542 | $ | 1,772,064 | $ | 1,902,714 | $ | 1,986,807 |
Portfolio turnover rate F | | | | 50% | | 58% | | 68% | | 50% |
ACalculated based on average shares outstanding during the period.
BNet investment income (loss) is affected by the timing of the declaration of dividends by any underlying mutual funds or exchange-traded funds (ETFs). Net investment income (loss) of any mutual funds or ETFs is not included in the Fund's net investment income (loss) ratio.
CTotal returns would have been lower if certain expenses had not been reduced during the applicable periods shown.
DFees and expenses of any underlying mutual funds or exchange-traded funds (ETFs) are not included in the Fund's expense ratio. The Fund indirectly bears its proportionate share of these expenses. For additional expense information related to investments in Fidelity Central Funds, please refer to the "Investments in Fidelity Central Funds" note found in the Notes to Financial Statements section of the most recent Annual or Semi-Annual report.
EExpense ratios reflect operating expenses of the class. Expenses before reductions do not reflect amounts reimbursed, waived, or reduced through arrangements with the investment adviser, brokerage services, or other offset arrangements, if applicable, and do not represent the amount paid by the class during periods when reimbursements, waivers or reductions occur.
FAmount does not include the portfolio activity of any underlying mutual funds or exchange-traded funds (ETFs).
Notes to Financial Statements
For the period ended September 30, 2024
1. Organization.
Fidelity Emerging Markets Equity Central Fund (the Fund) is a fund of Fidelity Central Investment Portfolios LLC (the LLC) and is authorized to issue an unlimited number of shares. Shares of the Fund are only offered to other investment companies and accounts managed by Fidelity Management & Research Company LLC (FMR), or its affiliates (the Investing Funds). The LLC is registered under the Investment Company Act of 1940, as amended (the 1940 Act), as an open-end management investment company organized as a Delaware Limited Liability Company. The Fund's investments in emerging markets can be subject to social, economic, regulatory, and political uncertainties and can be extremely volatile.
2. Investments in Fidelity Central Funds.
Funds may invest in Fidelity Central Funds, which are open-end investment companies generally available only to other investment companies and accounts managed by the investment adviser and its affiliates. The Schedule of Investments lists any Fidelity Central Funds held as an investment as of period end, but does not include the underlying holdings of each Fidelity Central Fund. An investing fund indirectly bears its proportionate share of the expenses of the underlying Fidelity Central Funds.
Based on its investment objective, each Fidelity Central Fund may invest or participate in various investment vehicles or strategies that are similar to those of the investing fund. These strategies are consistent with the investment objectives of the investing fund and may involve certain economic risks which may cause a decline in value of each of the Fidelity Central Funds and thus a decline in the value of the investing fund.
| Fidelity Central Fund | Investment Manager | Investment Objective | Investment Practices | Expense RatioA |
| Fidelity Money Market Central Funds | Fidelity Management & Research Company LLC (FMR) | Each fund seeks to obtain a high level of current income consistent with the preservation of capital and liquidity. | Short-term Investments | Less than .005% |
A Expenses expressed as a percentage of average net assets and are as of each underlying Central Fund's most recent annual or semi-annual shareholder report.
A complete unaudited list of holdings for each Fidelity Central Fund is available upon request or at the Securities and Exchange Commission website at www.sec.gov. In addition, the financial statements of the Fidelity Central Funds which contain the significant accounting policies (including investment valuation policies) of those funds, and are not covered by the Report of Independent Registered Public Accounting Firm, are available on the Securities and Exchange Commission website or upon request.
3. Significant Accounting Policies.
The Fund is an investment company and applies the accounting and reporting guidance of the Financial Accounting Standards Board (FASB) Accounting Standards Codification Topic 946 Financial Services - Investment Companies. The financial statements have been prepared in conformity with accounting principles generally accepted in the United States of America (GAAP), which require management to make certain estimates and assumptions at the date of the financial statements. Actual results could differ from those estimates. Subsequent events, if any, through the date that the financial statements were issued have been evaluated in the preparation of the financial statements. The Fund's Schedule of Investments lists any underlying mutual funds or exchange-traded funds (ETFs) but does not include the underlying holdings of these funds. The following summarizes the significant accounting policies of the Fund:
Investment Valuation. Investments are valued as of 4:00 p.m. Eastern time on the last calendar day of the period. The Board of Directors (the Board) has designated the Fund's investment adviser as the valuation designee responsible for the fair valuation function and performing fair value determinations as needed. The investment adviser has established a Fair Value Committee (the Committee) to carry out the day-to-day fair valuation responsibilities and has adopted policies and procedures to govern the fair valuation process and the activities of the Committee. In accordance with these fair valuation policies and procedures, which have been approved by the Board, the Fund attempts to obtain prices from one or more third party pricing services or brokers to value its investments. When current market prices, quotations or currency exchange rates are not readily available or reliable, investments will be fair valued in good faith by the Committee, in accordance with the policies and procedures. Factors used in determining fair value vary by investment type and may include market or investment specific events, transaction data, estimated cash flows, and market observations of comparable investments. The frequency that the fair valuation procedures are used cannot be predicted and they may be utilized to a significant extent. The Committee manages the Fund's fair valuation practices and maintains the fair valuation policies and procedures. The Fund's investment adviser reports to the Board information regarding the fair valuation process and related material matters.
The Fund categorizes the inputs to valuation techniques used to value its investments into a disclosure hierarchy consisting of three levels as shown below:
Level 1 - unadjusted quoted prices in active markets for identical investments
Level 2 - other significant observable inputs (including quoted prices for similar investments, interest rates, prepayment speeds, etc.)
Level 3 - unobservable inputs (including the Fund's own assumptions based on the best information available)
Valuation techniques used to value the Fund's investments by major category are as follows:
Equity securities, including restricted securities, for which market quotations are readily available, are valued at the last reported sale price or official closing price as reported by a third party pricing service on the primary market or exchange on which they are traded and are categorized as Level 1 in the hierarchy. In the event there were no sales during the day or closing prices are not available, securities are valued at the last quoted bid price or may be valued using the last available price and are generally categorized as Level 2 in the hierarchy. For foreign equity securities, when market or security specific events arise, comparisons to the valuation of American Depositary Receipts (ADRs), futures contracts, Exchange-Traded Funds (ETFs) and certain indexes as well as quoted prices for similar securities may be used and would be categorized as Level 2 in the hierarchy. For equity securities, including restricted securities, where observable inputs are limited, assumptions about market activity and risk are used and these securities may be categorized as Level 3 in the hierarchy.
Debt securities, including restricted securities, are valued based on evaluated prices received from third party pricing services or from brokers who make markets in such securities. Corporate bonds are valued by pricing services who utilize matrix pricing which considers prepayment speed assumptions, attributes of the collateral, yield or price of bonds of comparable quality, coupon, maturity and type or by broker-supplied prices. When independent prices are unavailable or unreliable, debt securities may be valued utilizing pricing methodologies which consider similar factors that would be used by third party pricing services. Debt securities are generally categorized as Level 2 in the hierarchy but may be Level 3 depending on the circumstances.
Investments in open-end mutual funds ,including the Fidelity Central Funds, are valued at their closing net asset value (NAV) each business day and are categorized as Level 1 in the hierarchy.
Changes in valuation techniques may result in transfers in or out of an assigned level within the disclosure hierarchy. The aggregate value of investments by input level as of September 30, 2024, as well as a roll forward of Level 3 investments, is included at the end of the Fund's Schedule of Investments.
Foreign Currency. Certain Funds may use foreign currency contracts to facilitate transactions in foreign-denominated securities. Gains and losses from these transactions may arise from changes in the value of the foreign currency or if the counterparties do not perform under the contracts' terms.
Foreign-denominated assets, including investment securities, and liabilities are translated into U.S. dollars at the exchange rates at period end. Purchases and sales of investment securities, income and dividends received, and expenses denominated in foreign currencies are translated into U.S. dollars at the exchange rate in effect on the transaction date.
The effects of exchange rate fluctuations on investments are included with the net realized and unrealized gain (loss) on investment securities. Other foreign currency transactions resulting in realized and unrealized gain (loss) are disclosed separately.
Investment Transactions and Income. For financial reporting purposes, the Fund's investment holdings and NAV include trades executed through the end of the last business day of the period. The NAV per share for processing shareholder transactions is calculated as of the close of business of the New York Stock Exchange (NYSE), normally 4:00 p.m. Eastern time and includes trades executed through the end of the prior business day. Gains and losses on securities sold are determined on the basis of identified cost and include proceeds received from litigation. Commissions paid to certain brokers with whom the investment adviser, or its affiliates, places trades on behalf of a fund include an amount in addition to trade execution, which may be rebated back to a fund. Any such rebates are included in net realized gain (loss) on investments in the Statement of Operations. Dividend income is recorded on the ex-dividend date, except for certain dividends from foreign securities where the ex-dividend date may have passed, which are recorded as soon as the Fund is informed of the ex-dividend date. Non-cash dividends included in dividend income, if any, are recorded at the fair market value of the securities received. Income and capital gain distributions from Fidelity Central Funds, if any, are recorded on the ex-dividend date. Interest income is accrued as earned and includes coupon interest and amortization of premium and accretion of discount on debt securities as applicable. Investment income is recorded net of foreign taxes withheld where recovery of such taxes is uncertain. Funds may file withholding tax reclaims in certain jurisdictions to recover a portion of amounts previously withheld. Any withholding tax reclaims income is included in the Statement of Operations in foreign taxes withheld. Any receivables for withholding tax reclaims are included in the Statement of Assets and Liabilities in dividends receivable.
Expenses. Expenses directly attributable to a fund are charged to that fund. Expenses attributable to more than one fund are allocated among the respective funds on the basis of relative net assets or other appropriate methods. Expenses included in the accompanying financial statements reflect the expenses of that fund and do not include any expenses associated with any underlying mutual funds or exchange-traded funds. Although not included in a fund's expenses, a fund indirectly bears its proportionate share of these expenses through the net asset value of each underlying mutual fund or exchange-traded fund. Expense estimates are accrued in the period to which they relate and adjustments are made when actual amounts are known.
Income Tax Information and Distributions to Shareholders. Each year, the Fund intends to qualify as a regulated investment company under Subchapter M of the Internal Revenue Code, including distributing substantially all of its taxable income and realized gains. As a result, no provision for U.S. Federal income taxes is required. As of September 30, 2024, the Fund did not have any unrecognized tax benefits in the financial statements; nor is the Fund aware of any tax positions for which it is reasonably possible that the total amounts of unrecognized tax benefits will significantly change in the next twelve months. The Fund files a U.S. federal tax return, in addition to state and local tax returns as required. The Fund's federal income tax returns are subject to examination by the Internal Revenue Service (IRS) for a period of three fiscal years after they are filed. State and local tax returns may be subject to examination for an additional fiscal year depending on the jurisdiction. Foreign taxes are provided for based on the Fund's understanding of the tax rules and rates that exist in the foreign markets in which it invests. The Fund is subject to a tax imposed on capital gains by certain countries in which it invests. An estimated deferred tax liability for net unrealized appreciation on the applicable securities is included in Deferred taxes on the Statement of Assets and Liabilities.
Distributions are declared and recorded on the ex-dividend date. Income and capital gain distributions are determined in accordance with income tax regulations, which may differ from GAAP.
Capital accounts within the financial statements are adjusted for permanent book-tax differences. These adjustments have no impact on net assets or the results of operations. Capital accounts are not adjusted for temporary book-tax differences which will reverse in a subsequent period.
Book-tax differences are primarily due to futures contracts, foreign currency transactions, certain foreign taxes, passive foreign investment companies (PFIC), capital loss carryforwards and losses deferred due to wash sales.
As of period end, the cost and unrealized appreciation (depreciation) in securities, and derivatives if applicable, for federal income tax purposes were as follows:
| Gross unrealized appreciation | $758,168,747 |
| Gross unrealized depreciation | (147,177,827) |
| Net unrealized appreciation (depreciation) | $610,990,920 |
| Tax Cost | $1,920,675,594 |
The tax-based components of distributable earnings as of period end were as follows:
| Undistributed ordinary income | $7,581,166 |
| Capital loss carryforward | $(236,343,024) |
| Net unrealized appreciation (depreciation) on securities and other investments | $610,976,893 |
Capital loss carryforwards are only available to offset future capital gains of the Fund to the extent provided by regulations and may be limited. The capital loss carryforward information presented below, including any applicable limitation, is estimated as of fiscal period end and is subject to adjustment.
Short-term | $(132,974,899) |
Long-term | (103,368,125) |
| Total capital loss carryforward | $(236,343,024) |
The tax character of distributions paid was as follows:
| | September 30, 2024 | September 30, 2023 |
| Ordinary Income | $53,105,685 | $66,650,856 |
Delayed Delivery Transactions and When-Issued Securities. During the period, certain Funds transacted in securities on a delayed delivery or when-issued basis. Payment and delivery may take place after the customary settlement period for that security. The price of the underlying securities and the date when the securities will be delivered and paid for are fixed at the time the transaction is negotiated. Securities purchased on a delayed delivery or when-issued basis are identified as such in the Schedule of Investments. Compensation for interest forgone in the purchase of a delayed delivery or when-issued debt security may be received. With respect to purchase commitments, each applicable Fund identifies securities as segregated in its records with a value at least equal to the amount of the commitment. Payables and receivables associated with the purchases and sales of delayed delivery securities having the same coupon, settlement date and broker are offset. Delayed delivery or when-issued securities that have been purchased from and sold to different brokers are reflected as both payables and receivables in the Statement of Assets and Liabilities under the caption "Delayed delivery", as applicable. Losses may arise due to changes in the value of the underlying securities or if the counterparty does not perform under the contract's terms, or if the issuer does not issue the securities due to political, economic, or other factors.
Restricted Securities (including Private Placements). Funds may invest in securities that are subject to legal or contractual restrictions on resale. These securities generally may be resold in transactions exempt from registration or to the public if the securities are registered. Disposal of these securities may involve time-consuming negotiations and expense, and prompt sale at an acceptable price may be difficult. Information regarding restricted securities held at period end is included at the end of the Schedule of Investments, if applicable.
4. Derivative Instruments.
Risk Exposures and the Use of Derivative Instruments. The Fund's investment objectives allow for various types of derivative instruments, including futures contracts. Derivatives are investments whose value is primarily derived from underlying assets, indices or reference rates and may be transacted on an exchange or over-the-counter (OTC). Derivatives may involve a future commitment to buy or sell a specified asset based on specified terms, to exchange future cash flows at periodic intervals based on a notional principal amount, or for one party to make one or more payments upon the occurrence of specified events in exchange for periodic payments from the other party.
Derivatives were used to increase returns and to manage exposure to certain risks as defined below. The success of any strategy involving derivatives depends on analysis of numerous economic factors, and if the strategies for investment do not work as intended, the objectives may not be achieved.
Derivatives were used to increase or decrease exposure to the following risk(s):
| | |
| Equity Risk | Equity risk relates to the fluctuations in the value of financial instruments as a result of changes in market prices (other than those arising from interest rate risk or foreign exchange risk), whether caused by factors specific to an individual investment, its issuer, or all factors affecting all instruments traded in a market or market segment. |
Funds are also exposed to additional risks from investing in derivatives, such as liquidity risk and counterparty credit risk. Liquidity risk is the risk that a fund will be unable to close out the derivative in the open market in a timely manner. Counterparty credit risk is the risk that the counterparty will not be able to fulfill its obligation to a fund. Counterparty credit risk related to exchange-traded contracts may be mitigated by the protection provided by the exchange on which they trade.
Investing in derivatives may involve greater risks than investing in the underlying assets directly and, to varying degrees, may involve risk of loss in excess of any initial investment and collateral received and amounts recognized in the Statement of Assets and Liabilities. In addition, there may be the risk that the change in value of the derivative contract does not correspond to the change in value of the underlying instrument.
Futures Contracts. A futures contract is an agreement between two parties to buy or sell a specified underlying instrument for a fixed price at a specified future date. Futures contracts were used to manage exposure to the stock market.
Upon entering into a futures contract, a fund is required to deposit either cash or securities (initial margin) with a clearing broker in an amount equal to a certain percentage of the face value of the contract. Futures contracts are marked-to-market daily and subsequent daily payments are made or received by a fund depending on the daily fluctuations in the value of the futures contracts and are recorded as unrealized appreciation or (depreciation). This receivable and/or payable, if any, is included in daily variation margin on futures contracts in the Statement of Assets and Liabilities. Realized gain or (loss) is recorded upon the expiration or closing of a futures contract. The net realized gain (loss) and change in net unrealized appreciation (depreciation) on futures contracts during the period is presented in the Statement of Operations.
Any open futures contracts at period end are presented in the Schedule of Investments under the caption "Futures Contracts". The notional amount at value reflects each contract's exposure to the underlying instrument or index at period end, and is representative of volume of activity during the period unless an average notional amount is presented. Any securities deposited to meet initial margin requirements are identified in the Schedule of Investments. Any cash deposited to meet initial margin requirements is presented as segregated cash with brokers for derivative instruments in the Statement of Assets and Liabilities.
5. Purchases and Sales of Investments.
Purchases and sales of securities, other than short-term securities and in-kind transactions, as applicable, are noted in the table below.
| | Purchases ($) | Sales ($) |
| Fidelity Emerging Markets Equity Central Fund | 971,996,568 | 1,104,316,205 |
6. Fees and Other Transactions with Affiliates.
Management Fee and Expense Contract. Fidelity Management & Research Company LLC (the investment adviser) provides the Fund with investment management services. The Fund does not pay any fees for these services. Pursuant to the Fund's expense contract, the investment adviser also pays all other expenses of the Fund, excluding custody fees, the compensation of the independent Directors, and certain miscellaneous expenses such as proxy and shareholder meeting expenses.
Brokerage Commissions. A portion of portfolio transactions were placed with brokerage firms which are affiliates of the investment adviser. Brokerage commissions are included in net realized gain (loss) and change in net unrealized appreciation (depreciation) in the Statement of Operations. The commissions paid to these affiliated firms were as follows:
| | Amount ($) |
| Fidelity Emerging Markets Equity Central Fund | 3,028 |
Interfund Trades. Funds may purchase from or sell securities to other Fidelity Funds under procedures adopted by the Board. The procedures have been designed to ensure these interfund trades are executed in accordance with Rule 17a-7 of the 1940 Act. Any interfund trades are included within the respective purchases and sales amounts shown in the Purchases and Sales of Investments note. Interfund trades during the period are noted in the table below.
| | Purchases ($) | Sales ($) | Realized Gain (Loss)($) |
| Fidelity Emerging Markets Equity Central Fund | 4,029,398 | 9,209,603 | (19,904) |
| | | | |
Other. During the period, the investment adviser reimbursed the Fund for certain losses as follows:
| | Amount ($) |
| Fidelity Emerging Markets Equity Central Fund | 1,732 |
Sub-Advisory Arrangements. Effective March 1, 2024, the Fund's sub-advisory agreements with FMR Investment Management (UK) Limited, Fidelity Management & Research (Hong Kong) Limited, and Fidelity Management & Research (Japan) Limited were amended to provide that the investment adviser pays each sub-adviser monthly fees equal to 110% of the sub-adviser's costs for providing sub-advisory services.
7. Security Lending.
Funds lend portfolio securities from time to time in order to earn additional income. Lending agents are used, including National Financial Services (NFS), an affiliate of the investment adviser. Pursuant to a securities lending agreement, NFS will receive a fee, which is capped at 9.9% of a fund's daily lending revenue, for its services as lending agent. A fund may lend securities to certain qualified borrowers, including NFS. On the settlement date of the loan, a fund receives collateral (in the form of U.S. Treasury obligations, letters of credit and/or cash) against the loaned securities and maintains collateral in an amount not less than 100% of the market value of the loaned securities during the period of the loan. The market value of the loaned securities is determined at the close of business of a fund and any additional required collateral is delivered to a fund on the next business day. A fund or borrower may terminate the loan at any time, and if the borrower defaults on its obligation to return the securities loaned because of insolvency or other reasons, a fund may apply collateral received from the borrower against the obligation. A fund may experience delays and costs in recovering the securities loaned. Any cash collateral received is invested in the Fidelity Securities Lending Cash Central Fund. Any loaned securities are identified as such in the Schedule of Investments, and the value of loaned securities and cash collateral at period end, as applicable, are presented in the Statement of Assets and Liabilities. Security lending income represents the income earned on investing cash collateral, less rebates paid to borrowers and any lending agent fees associated with the loan, plus any premium payments received for lending certain types of securities. Security lending income is presented in the Statement of Operations as a component of income from Fidelity Central Funds. Affiliated security lending activity, if any, was as follows:
| | Total Security Lending Fees Paid to NFS ($) | Security Lending Income From Securities Loaned to NFS ($) | Value of Securities Loaned to NFS at Period End ($) |
| Fidelity Emerging Markets Equity Central Fund | 17,105 | - | - |
8. Other.
A fund's organizational documents provide former and current directors and officers with a limited indemnification against liabilities arising in connection with the performance of their duties to the fund. In the normal course of business, a fund may also enter into contracts that provide general indemnifications. A fund's maximum exposure under these arrangements is unknown as this would be dependent on future claims that may be made against a fund. The risk of material loss from such claims is considered remote.
At the end of the period, mutual funds managed by the investment adviser or its affiliates were the owners of record of all of the outstanding shares of the Fund.
9. Risk and Uncertainties.
Many factors affect a fund's performance. Developments that disrupt global economies and financial markets, such as pandemics, epidemics, outbreaks of infectious diseases, war, terrorism, and environmental disasters, may significantly affect a fund's investment performance. The effects of these developments to a fund will be impacted by the types of securities in which a fund invests, the financial condition, industry, economic sector, and geographic location of an issuer, and a fund's level of investment in the securities of that issuer. Significant concentrations in security types, issuers, industries, sectors, and geographic locations may magnify the factors that affect a fund's performance.
Report of Independent Registered Public Accounting Firm
To the Board of Trustees of Fidelity Central Investment Portfolios LLC and the Shareholders of Fidelity Emerging Markets Equity Central Fund:
Opinion on the Financial Statements and Financial Highlights
We have audited the accompanying statement of assets and liabilities of Fidelity Emerging Markets Equity Central Fund (the "Fund"), a fund of Fidelity Central Investment Portfolios LLC, including the schedule of investments, as of September 30, 2024, the related statement of operations for the year then ended, the statement of changes in net assets for each of the two years in the period then ended, the financial highlights for each of the five years in the period then ended, and the related notes. In our opinion, the financial statements and financial highlights present fairly, in all material respects, the financial position of the Fund as of September 30, 2024, and the results of its operations for the year then ended, the changes in its net assets for each of the two years in the period then ended, and the financial highlights for each of the five years in the period then ended in conformity with accounting principles generally accepted in the United States of America.
Basis for Opinion
These financial statements and financial highlights are the responsibility of the Fund's management. Our responsibility is to express an opinion on the Fund's financial statements and financial highlights based on our audits. We are a public accounting firm registered with the Public Company Accounting Oversight Board (United States) (PCAOB) and are required to be independent with respect to the Fund in accordance with the U.S. federal securities laws and the applicable rules and regulations of the Securities and Exchange Commission and the PCAOB.
We conducted our audits in accordance with the standards of the PCAOB. Those standards require that we plan and perform the audit to obtain reasonable assurance about whether the financial statements and financial highlights are free of material misstatement, whether due to error or fraud. The Fund is not required to have, nor were we engaged to perform, an audit of its internal control over financial reporting. As part of our audits, we are required to obtain an understanding of internal control over financial reporting but not for the purpose of expressing an opinion on the effectiveness of the Fund's internal control over financial reporting. Accordingly, we express no such opinion.
Our audits included performing procedures to assess the risks of material misstatement of the financial statements and financial highlights, whether due to error or fraud, and performing procedures that respond to those risks. Such procedures included examining, on a test basis, evidence regarding the amounts and disclosures in the financial statements and financial highlights. Our audits also included evaluating the accounting principles used and significant estimates made by management, as well as evaluating the overall presentation of the financial statements and financial highlights. Our procedures included confirmation of securities owned as of September 30, 2024, by correspondence with the custodian and brokers; when replies were not received from brokers, we performed other auditing procedures. We believe that our audits provide a reasonable basis for our opinion.
/s/ Deloitte & Touche LLP
Boston, Massachusetts
November 13, 2024
We have served as the auditor of one or more of the Fidelity investment companies since 1999.
Distributions
(Unaudited)
The dividend and capital gains distributions for the fund(s) are available on Fidelity.com or Institutional.Fidelity.com.
The fund designates $1,656,635 of distributions paid during the fiscal year ended 2024 as qualifying to be taxed as section 163(j) interest dividends.
The fund designates 26.44%, 85.59%, and 85.59% of the dividends distributed in December, June, and September, respectively during the fiscal year as amounts which may be taken into account as a dividend for the purposes of the maximum rate under section 1(h)(11) of the Internal Revenue Code.
The amounts per share which represent income derived from sources within, and taxes paid to, foreign countries or possessions of the United States are $2.5404 and $0.7979 for the dividend paid December 11, 2023.
The fund will notify shareholders in January 2025 of amounts for use in preparing 2024 income tax returns.
Item 8: Changes in and Disagreements with Accountants for Open-End Management Investment Companies
(Unaudited)
Note: This is not applicable for any fund included in this document.
Item 9: Proxy Disclosures for Open-End Management Investment Companies
(Unaudited)
| A special meeting of shareholders was held on July 16, 2024. The results of votes taken among shareholders on the proposal before them are reported below. Each vote reported represents one dollar of net asset value held on the record date for the meeting. |
| Proposal 1 |
| To elect a Board of Trustees. |
| | # of Votes | % of Votes |
| Bettina Doulton |
| Affirmative | 31,231,071,082.58 | 100.00 |
| Withheld | 0.00 | 0.00 |
| TOTAL | 31,231,071,082.58 | 100.00 |
| Robert A. Lawrence |
| Affirmative | 31,231,071,082.58 | 100.00 |
| Withheld | 0.00 | 0.00 |
| TOTAL | 31,231,071,082.58 | 100.00 |
| Vijay C. Advani |
| Affirmative | 31,231,071,082.58 | 100.00 |
| Withheld | 0.00 | 0.00 |
| TOTAL | 31,231,071,082.58 | 100.00 |
| Thomas P. Bostick |
| Affirmative | 31,231,071,082.58 | 100.00 |
| Withheld | 0.00 | 0.00 |
| TOTAL | 31,231,071,082.58 | 100.00 |
| Donald F. Donahue |
| Affirmative | 31,231,071,082.58 | 100.00 |
| Withheld | 0.00 | 0.00 |
| TOTAL | 31,231,071,082.58 | 100.00 |
| Vicki L. Fuller |
| Affirmative | 31,231,071,082.58 | 100.00 |
| Withheld | 0.00 | 0.00 |
| TOTAL | 31,231,071,082.58 | 100.00 |
| Patricia L. Kampling |
| Affirmative | 31,231,071,082.58 | 100.00 |
| Withheld | 0.00 | 0.00 |
| TOTAL | 31,231,071,082.58 | 100.00 |
| Thomas A. Kennedy |
| Affirmative | 31,231,071,082.58 | 100.00 |
| Withheld | 0.00 | 0.00 |
| TOTAL | 31,231,071,082.58 | 100.00 |
| Oscar Munoz |
| Affirmative | 31,231,071,082.58 | 100.00 |
| Withheld | 0.00 | 0.00 |
| TOTAL | 31,231,071,082.58 | 100.00 |
| Karen B. Peetz |
| Affirmative | 31,231,071,082.58 | 100.00 |
| Withheld | 0.00 | 0.00 |
| TOTAL | 31,231,071,082.58 | 100.00 |
| David M. Thomas |
| Affirmative | 31,231,071,082.58 | 100.00 |
| Withheld | 0.00 | 0.00 |
| TOTAL | 31,231,071,082.58 | 100.00 |
| Susan Tomasky |
| Affirmative | 31,231,071,082.58 | 100.00 |
| Withheld | 0.00 | 0.00 |
| TOTAL | 31,231,071,082.58 | 100.00 |
| Michael E. Wiley |
| Affirmative | 31,231,071,082.58 | 100.00 |
| Withheld | 0.00 | 0.00 |
| TOTAL | 31,231,071,082.58 | 100.00 |
| | | |
| Proposal 1 reflects trust-wide proposal and voting results. |
Item 10: Remuneration Paid to Directors, Officers, and others of Open-End Management Investment Companies
(Unaudited)
Note: This information is disclosed as part of the financial statements for each Fund as part of Item 7: Financial Statements and Financial Highlights for Open-End Management Investment companies.
Item 11: Statement Regarding Basis for Approval of Investment Advisory Contract
(Unaudited)
Board Approval of Investment Advisory Contracts and Management Fees
Fidelity Emerging Markets Equity Central Fund
Each year, the Board of Directors, including the Independent Directors (together, the Board), considers the renewal of the fund's management contract with Fidelity Management & Research Company LLC (FMR) and the sub-advisory agreements (together, the Advisory Contracts) for the fund. FMR and the sub-advisers are referred to herein as the Investment Advisers. The Board, assisted by the advice of fund counsel and Independent Directors' counsel, requests and considers a broad range of information relevant to the renewal of the Advisory Contracts throughout the year.
The Board meets regularly and, at each of its meetings, covers an extensive agenda of topics and materials and considers factors that are relevant to its annual consideration of the renewal of the fund's Advisory Contracts, including the services and support provided to the fund and its shareholders. The Board, acting directly and through its Committees (each of which is composed of and chaired by Independent Directors), requests and receives information concerning the annual consideration of the renewal of the fund's Advisory Contracts. The Board also meets as needed to review matters specifically related to the Board's annual consideration of the renewal of the Advisory Contracts. Members of the Board may also meet with trustees of other Fidelity funds through joint ad hoc committees to discuss certain matters relevant to all of the Fidelity funds.
At its May 2024 meeting, the Board unanimously determined to renew the fund's Advisory Contracts. In reaching its determination, the Board considered all factors it believed relevant and reached a determination, with the assistance of fund counsel and Independent Directors' counsel and through the exercise of its business judgment, that the renewal of the Advisory Contracts was in the best interests of the fund and its shareholders and the fact that no fee is payable under the management contract was fair and reasonable in light of all of the surrounding circumstances.
Nature, Extent, and Quality of Services Provided. The Board considered staffing as it relates to the fund, including the backgrounds and experience of investment personnel of the Investment Advisers, and also considered the Investment Advisers' implementation of the fund's investment program. The Independent Directors also had discussions with senior management of Fidelity's investment operations and investment groups. The Board considered the structure of the investment personnel compensation program and whether this structure provides appropriate incentives to act in the best interests of the fund.
Resources Dedicated to Investment Management and Support Services. The Board and the Fund Oversight and Research Committees reviewed the general qualifications and capabilities of Fidelity's investment staff, including its size, education, experience, and resources, as well as Fidelity's approach to recruiting, training, managing, and compensating investment personnel. The Board noted the resources devoted to expansion of Fidelity's global investment organization, and that Fidelity's analysts have extensive resources, tools, and capabilities that allow them to conduct sophisticated quantitative and fundamental analysis, as well as credit analysis of issuers, counterparties, and guarantors. Further, the Board considered that Fidelity's investment professionals have sufficient access to global information and data so as to provide competitive investment results over time, and that those professionals also have access to sophisticated tools that permit them to assess portfolio construction and risk and performance attribution characteristics continuously, as well as to transmit new information and research conclusions rapidly around the world. Additionally, in its deliberations, the Board considered Fidelity's trading, risk management, compliance, and technology and operations capabilities and resources, which are integral parts of the investment management process.
Administrative Services. The Board considered (i) the nature, extent, quality, and cost of advisory and administrative services performed by the Investment Advisers and their affiliates under the Advisory Contracts and under separate agreements covering transfer agency and pricing and bookkeeping services for the fund; (ii) the nature and extent of Fidelity's supervision of third party service providers, principally custodians, subcustodians, and pricing vendors; and (iii) the resources devoted by Fidelity to, and the record of compliance with, the fund's compliance policies and procedures. The Board also reviewed the allocation of fund brokerage, including allocations to brokers affiliated with the Investment Advisers, and the use of "soft" commission dollars to pay for research services. The Board also considered the fund's securities lending activities and any payments made to Fidelity relating to securities lending under a separate agreement.
Investment Performance. The Board reviewed the fund's absolute investment performance, as well as the fund's relative investment performance. The Board noted that the fund is not publicly offered as a stand-alone investment product. In this regard, the Board noted that the fund is designed to offer a liquid investment option for other investment companies managed by Fidelity and ultimately to enhance the performance of those investment companies.
Based on its review, the Board concluded that the nature, extent, and quality of services provided to the fund under the Advisory Contracts should continue to benefit the shareholders of the fund.
Competitiveness of Management Fee and Total Expense Ratio. The Board considered that while the fund does not pay a management fee, FMR receives fees for providing services to funds that invest in the fund. The Board also noted that FMR bears all expenses of the fund with certain limited exceptions (i.e., custody fees, interest, taxes, fees and expenses of the Independent Directors, proxy and shareholder meeting expenses, and extraordinary expenses). The Board further noted that the fund pays its non-operating expenses, including brokerage commissions and fees and expenses associated with the fund's securities lending program, if applicable. Based on its review, the Board concluded that the management fee received for providing services to the fund and the fund's total expense ratio were reasonable in light of the services that the fund and its shareholders receive and the other factors considered.
Costs of the Services and Profitability. The Board considered the level of Fidelity's profits in respect of all the Fidelity funds, as well as the profitability of the funds that invest in the fund.
A public accounting firm has been engaged annually by the Board as part of the Board's assessment of Fidelity's profitability analysis. The engagement includes the review and assessment of the methodologies used by Fidelity in determining the revenues and expenses attributable to Fidelity's fund business, and completion of agreed-upon procedures in respect of the mathematical accuracy of certain fund profitability information and its conformity to established allocation methodologies. After considering the reports issued under the engagement and information provided by Fidelity, the Board concluded that while other allocation methods may also be reasonable, Fidelity's profitability methodologies are reasonable in all material respects.
The Board also reviewed Fidelity's non-fund businesses and potential indirect benefits such businesses may have received as a result of their association with Fidelity's fund business (i.e., fall-out benefits) as well as cases where Fidelity's affiliates may benefit from the funds' business. The Board considered areas where potential indirect benefits to the Fidelity funds from their relationships with Fidelity may exist. The Board's consideration of these matters was informed by the findings of a joint ad hoc committee created by it and the boards of other Fidelity funds to evaluate potential fall-out benefits.
The Board concluded that the costs of the services provided by and the profits realized by Fidelity in connection with the operation of the fund were not relevant to the renewal of the Advisory Contracts because the fund pays no advisory fees and FMR bears all expenses of the fund with certain exceptions.
Economies of Scale. The Board concluded that because the fund pays no advisory fees and FMR bears all expenses of the fund with certain exceptions, the realization of economies of scale was not a material factor in the Board's decision to renew the fund's Advisory Contract.
Additional Information Requested by the Board. In order to develop fully the factual basis for consideration of the Fidelity funds' advisory contracts, the Board requested and received additional information on certain topics, including but not limited to: (i) fund flow and performance trends, in particular the underperformance of certain funds and strategies, and Fidelity's long-term strategies for certain funds; (ii) the operation of performance fees and the rationale for implementing performance fees on certain categories of funds but not others; (iii) Fidelity's pricing philosophy compared to competitors; (iv) fund profitability methodology and data; (v) evaluation of competitive fund data and peer group classifications and fee and expense comparisons; (vi) the management fee and expense structures for different funds and classes and information about the differences between various fee and expense structures; (vii) the variable management fee implemented for certain funds effective March 1, 2024; and (viii) information regarding other accounts managed by Fidelity and the funds' sub-advisory arrangements.
Conclusion. Based on its evaluation of all of the conclusions noted above, and after considering all factors it believed relevant, the Board, including the Independent Directors, concluded that the advisory and sub-advisory fee arrangements are fair and reasonable in light of all of the surrounding circumstances and that the fund's Advisory Contracts should be renewed through May 31, 2025.
1.876933.115
EMQ-ANN-1124
Item 8.
Changes in and Disagreements with Accountants for Open-End Management Investment Companies
See Item 7.
Item 9.
Proxy Disclosures for Open-End Management Investment Companies
See Item 7.
Item 10.
Remuneration Paid to Directors, Officers, and Others of Open-End Management Investment Companies
See Item 7.
Item 11.
Statement Regarding Basis for Approval of Investment Advisory Contract
See Item 7.
Item 12.
Disclosure of Proxy Voting Policies and Procedures for Closed-End Management Investment Companies
Not applicable.
Item 13.
Portfolio Managers of Closed-End Management Investment Companies
Not applicable.
Item 14.
Purchase of Equity Securities by Closed-End Management Investment Company and Affiliated Purchasers
Not applicable.
Item 15.
Submission of Matters to a Vote of Security Holders
There were no material changes to the procedures by which shareholders may recommend nominees to the trust’s Board of Trustees.
Item 16.
Controls and Procedures
(a)(i) The President and Treasurer and the Chief Financial Officer have concluded that the trust’s disclosure controls and procedures (as defined in Rule 30a-3(c) under the Investment Company Act) provide reasonable assurances that material information relating to the trust is made known to them by the appropriate persons, based on their evaluation of these controls and procedures as of a date within 90 days of the filing date of this report.
(a)(ii) There was no change in the trust’s internal control over financial reporting (as defined in Rule 30a-3(d) under the Investment Company Act) that occurred during the period covered by this report that has materially affected, or is reasonably likely to materially affect, the trust’s internal control over financial reporting.
Item 17.
Disclosure of Securities Lending Activities for Closed-End Management Investment Companies
Not applicable.
Item 18.
Recovery of Erroneously Awarded Compensation
(a)
Not applicable.
(b)
Not applicable.
Item 19.
Exhibits
SIGNATURES
Pursuant to the requirements of the Securities Exchange Act of 1934 and the Investment Company Act of 1940, the registrant has duly caused this report to be signed on its behalf by the undersigned, thereunto duly authorized.
Fidelity Central Investment Portfolios LLC
|
By: | /s/Stacie M. Smith |
| Stacie M. Smith |
| President and Treasurer (Principal Executive Officer) |
|
|
Date: | November 21, 2024 |
Pursuant to the requirements of the Securities Exchange Act of 1934 and the Investment Company Act of 1940, this report has been signed below by the following persons on behalf of the registrant and in the capacities and on the dates indicated.
|
By: | /s/Stacie M. Smith |
| Stacie M. Smith |
| President and Treasurer (Principal Executive Officer) |
|
|
Date: | November 21, 2024 |
|
By: | /s/Stephanie Caron |
| Stephanie Caron |
| Chief Financial Officer (Principal Financial Officer) |
|
|
Date: | November 21, 2024 |