UNITED STATES
SECURITIES AND EXCHANGE COMMISSION
Washington, D.C. 20549
FORM N-CSR
CERTIFIED SHAREHOLDER REPORT OF REGISTERED
MANAGEMENT INVESTMENT COMPANIES
Investment Company Act file number 811-21667
Fidelity Central Investment Portfolios LLC
(Exact name of registrant as specified in charter)
245 Summer St., Boston, Massachusetts 02210
(Address of principal executive offices) (Zip code)
Cynthia Lo Bessette, Secretary
245 Summer St.
Boston, Massachusetts 02210
(Name and address of agent for service)
Registrant's telephone number, including area code:
617-563-7000
Date of fiscal year end: | September 30 |
Date of reporting period: | September 30, 2019 |
Item 1.
Reports to Stockholders
Fidelity® Emerging Markets Equity Central Fund
Annual Report
September 30, 2019

Beginning on January 1, 2021, as permitted by regulations adopted by the Securities and Exchange Commission, paper copies of a fund’s shareholder reports will no longer be sent by mail, unless you specifically request paper copies of the reports from the fund or from your financial intermediary, such as a financial advisor, broker-dealer or bank. Instead, the reports will be made available on a website, and you will be notified by mail each time a report is posted and provided with a website link to access the report.
If you already elected to receive shareholder reports electronically, you will not be affected by this change and you need not take any action. You may elect to receive shareholder reports and other communications from a fund electronically, by contacting your financial intermediary. For Fidelity customers, visit Fidelity's web site or call Fidelity using the contact information listed below.
You may elect to receive all future reports in paper free of charge. If you wish to continue receiving paper copies of your shareholder reports, you may contact your financial intermediary or, if you are a Fidelity customer, visit Fidelity’s website, or call Fidelity at the applicable toll-free number listed below. Your election to receive reports in paper will apply to all funds held with the fund complex/your financial intermediary.
| Account Type | Website | Phone Number |
| Brokerage, Mutual Fund, or Annuity Contracts: | fidelity.com/mailpreferences | 1-800-343-3548 |
| Employer Provided Retirement Accounts: | netbenefits.fidelity.com/preferences (choose 'no' under Required Disclosures to continue to print) | 1-800-343-0860 |
| Advisor Sold Accounts Serviced Through Your Financial Intermediary: | Contact Your Financial Intermediary | Your Financial Intermediary's phone number |
| Advisor Sold Accounts Serviced by Fidelity: | institutional.fidelity.com | 1-877-208-0098 |
Contents
To view a fund's proxy voting guidelines and proxy voting record for the 12-month period ended June 30, visit http://www.fidelity.com/proxyvotingresults or visit the Securities and Exchange Commission's (SEC) web site at http://www.sec.gov.
You may also call 1-800-544-8544 to request a free copy of the proxy voting guidelines.
Standard & Poor's, S&P and S&P 500 are registered service marks of The McGraw-Hill Companies, Inc. and have been licensed for use by Fidelity Distributors Corporation.
Other third-party marks appearing herein are the property of their respective owners.
All other marks appearing herein are registered or unregistered trademarks or service marks of FMR LLC or an affiliated company. © 2019 FMR LLC. All rights reserved.
A fund files its complete schedule of portfolio holdings with the SEC for the first and third quarters of each fiscal year on Form N-PORT. Forms N-PORT are available on the SEC’s web site at http://www.sec.gov. A fund's Forms N-PORT may be reviewed and copied at the SEC’s Public Reference Room in Washington, DC. Information regarding the operation of the SEC's Public Reference Room may be obtained by calling 1-800-SEC-0330.
Performance: The Bottom Line
Average annual total return reflects the change in the value of an investment, assuming reinvestment of distributions from dividend income and capital gains (the profits earned upon the sale of securities that have grown in value, if any) and assuming a constant rate of performance each year. The hypothetical investment and the average annual total returns do not reflect the deduction of taxes that a shareholder would pay on fund distributions or the redemption of fund shares. During periods of reimbursement by Fidelity, a fund’s total return will be greater than it would be had the reimbursement not occurred. How a fund did yesterday is no guarantee of how it will do tomorrow.
Average Annual Total Returns
| For the periods ended September 30, 2019 | Past 1 year | Past 5 years | Past 10 years |
| Fidelity® Emerging Markets Equity Central Fund | 5.22% | 4.46% | 5.53% |
$10,000 Over 10 Years
Let's say hypothetically that $10,000 was invested in Fidelity® Emerging Markets Equity Central Fund on September 30, 2009.
The chart shows how the value of your investment would have changed, and also shows how the MSCI Emerging Markets Index performed over the same period.
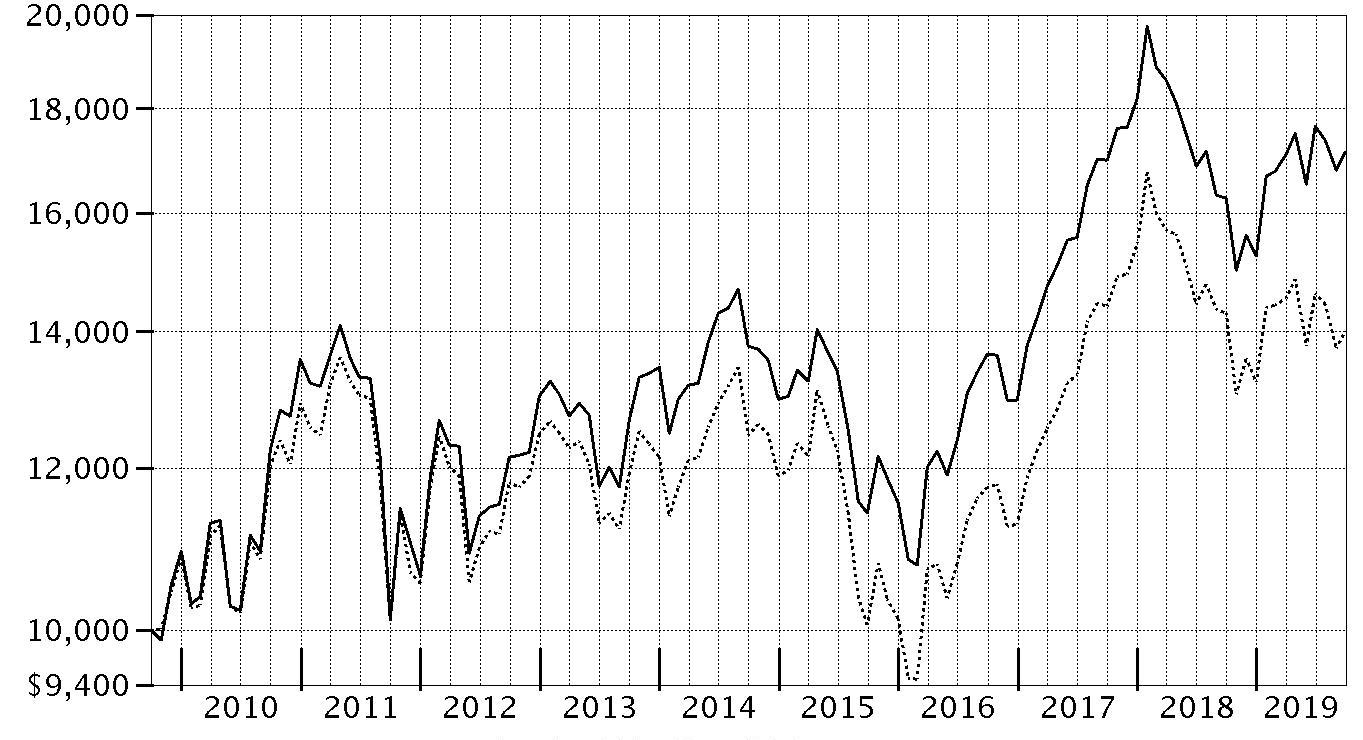
| Period Ending Values | ||
| $17,125 | Fidelity® Emerging Markets Equity Central Fund | |
| $14,003 | MSCI Emerging Markets Index | |
Management's Discussion of Fund Performance
Market Recap: The MSCI ACWI (All Country World Index) ex USA Index returned -1.05% for the 12 months ending September 30, 2019, as international stocks reflected a confluence of negative factors, including escalating trade tension, lackluster global economic growth, uncertainty about the U.K.’s planned “Brexit” from the European Union and reports of slowing in China’s economy. In late December, the U.S. Federal Reserve shifted from raising interest rates to a more dovish policy in 2019, joining many foreign central banks that had been cutting rates. Sentiment ebbed and flowed in 2019, primarily due to geopolitical factors, including elections and trade disputes, resulting in increased volatility. In June, international stocks rose 6.03%, as policy stimulus in China stabilized that country’s economic growth trajectory. In July, the Fed cut its policy rate for the first time since 2007. However, the index returned -1.21% for the month, followed by a -3.08% result in August, before rebounding with a 2.59% advance in September. For the full 12 months, six sectors lost ground, with energy (-9%), materials (-7%) and communication services (-4%) faring worst. Conversely, utilities (+13%), consumer staples (+7%) and real estate (+5%) led the way. By region, Japan (-4%) and the U.K. (-3%) fell the hardest, followed by emerging markets (-2%). Meanwhile, Canada (+4%), Asia Pacific ex Japan (+3%) and Europe ex U.K (+1%) turned in the best results.Comments from Co-Portfolio Manager Sam Polyak: For the fiscal year, the fund gained 5.22%, well ahead of the -1.74% result of the Fidelity Emerging Markets Equity Central Fund (EMCF) Linked Index and the -1.99% return of the MSCI Emerging Markets Index. Versus the EMCF index, the fund benefited from strong stock selection across almost all sectors, and particularly in the materials, consumer discretionary, financials, communication services, health care and industrials segments. Geographically, choices in China, India and Brazil were the most helpful. Among individual stocks, an overweighting in Meituan Dianping (+32% stock return), the operator of a leading food-delivery service in China, helped more than any other active decision. Shares of Meituan Dianping jumped notably in May after the firm reported a 70% year-over-year rise in first-quarter revenue. The company also announced a lower-than-expected adjusted net loss, aided by expense controls and higher gross margins. Meituan Dianping’s management team reported that active users of its food-delivery service grew 26.4% over the trailing 12 months. Avoiding index component Baidu (-55% stock return) also helped. Shares of the China-based internet search engine declining sharply in mid-May after management reported its first quarterly net loss since the company’s debut on publicly traded markets in 2005. Conversely, an out-of-index stake in Samsonite International (-41% stock return) hurt the most. The Hong Kong-based luggage retailer was hurt by the weaker macro environment, geopolitical tensions and softness in key markets, among other factors. Samsonite was not held by the fund at period end. Not owning index component and Russian state-owned oil company Gazprom also detracted because the stock gained 49%.The views expressed above reflect those of the portfolio manager(s) only through the end of the period as stated on the cover of this report and do not necessarily represent the views of Fidelity or any other person in the Fidelity organization. Any such views are subject to change at any time based upon market or other conditions and Fidelity disclaims any responsibility to update such views. These views may not be relied on as investment advice and, because investment decisions for a Fidelity fund are based on numerous factors, may not be relied on as an indication of trading intent on behalf of any Fidelity fund.
Note to shareholders: On December 1, 2018, Xiaoting Zhao assumed portfolio management responsibilities for the fund's telecommunications services sleeve, succeeding James Hayes.Investment Summary (Unaudited)
Geographic Diversification (% of fund's net assets)
| As of September 30, 2019 | ||
| Cayman Islands | 20.7% | |
| Korea (South) | 12.7% | |
| China | 9.5% | |
| Brazil | 9.0% | |
| India | 8.7% | |
| Taiwan | 5.8% | |
| Russia | 5.1% | |
| South Africa | 4.4% | |
| United States of America* | 4.1% | |
| Other | 20.0% | |

* Includes Short-Term investments and Net Other Assets (Liabilities).
Percentages are based on country or territory of incorporation and are adjusted for the effect of futures contracts, if applicable.
Asset Allocation as of September 30, 2019
| % of fund's net assets | |
| Stocks and Equity Futures | 98.2 |
| Short-Term Investments and Net Other Assets (Liabilities) | 1.8 |
Top Ten Stocks as of September 30, 2019
| % of fund's net assets | |
| Tencent Holdings Ltd. (Cayman Islands, Interactive Media & Services) | 5.2 |
| Taiwan Semiconductor Manufacturing Co. Ltd. (Taiwan, Semiconductors & Semiconductor Equipment) | 4.4 |
| Samsung Electronics Co. Ltd. (Korea (South), Technology Hardware, Storage & Peripherals) | 4.2 |
| Alibaba Group Holding Ltd. sponsored ADR (Cayman Islands, Internet & Direct Marketing Retail) | 3.6 |
| Meituan Dianping Class B (Cayman Islands, Internet & Direct Marketing Retail) | 2.4 |
| Sberbank of Russia (Russia, Banks) | 2.1 |
| Industrial & Commercial Bank of China Ltd. (H Shares) (China, Banks) | 1.8 |
| ICICI Bank Ltd. sponsored ADR (India, Banks) | 1.7 |
| Hyundai Mobis (Korea (South), Auto Components) | 1.6 |
| Naspers Ltd. Class N (South Africa, Internet & Direct Marketing Retail) | 1.4 |
| 28.4 |
Top Market Sectors as of September 30, 2019
| % of fund's net assets | |
| Financials | 23.5 |
| Consumer Discretionary | 16.8 |
| Information Technology | 13.3 |
| Communication Services | 9.1 |
| Materials | 7.8 |
| Consumer Staples | 6.7 |
| Energy | 6.7 |
| Industrials | 5.2 |
| Real Estate | 3.2 |
| Utilities | 2.7 |
Schedule of Investments September 30, 2019
Showing Percentage of Net Assets
| Common Stocks - 92.7% | |||
| Shares | Value | ||
| Argentina - 0.2% | |||
| BBVA Banco Frances SA sponsored ADR | 109,680 | $474,914 | |
| Bolsas y Mercados Argentinos SA | 89,990 | 348,393 | |
| Grupo Financiero Galicia SA sponsored ADR | 58,456 | 759,928 | |
| Inversiones y Representaciones SA ADR (a) | 50,965 | 268,076 | |
| Loma Negra Compania Industrial Argentina SA ADR (a) | 56,223 | 323,282 | |
| Pampa Holding SA sponsored ADR (a)(b) | 43,831 | 760,906 | |
| TOTAL ARGENTINA | 2,935,499 | ||
| Australia - 0.0% | |||
| Frontier Digital Ventures Ltd. (a) | 274,400 | 136,590 | |
| Bahrain - 0.1% | |||
| Ahli United Bank | 1,834,740 | 1,615,874 | |
| Bangladesh - 0.1% | |||
| BRAC Bank Ltd. | 1,163,667 | 846,979 | |
| Olympic Industries Ltd. | 178,416 | 431,602 | |
| Square Pharmaceuticals Ltd. | 394,875 | 1,103,379 | |
| TOTAL BANGLADESH | 2,381,960 | ||
| Belgium - 0.3% | |||
| Titan Cement International Trading SA (a) | 231,400 | 4,792,074 | |
| Bermuda - 1.5% | |||
| AGTech Holdings Ltd. (a) | 5,664,000 | 267,385 | |
| Central European Media Enterprises Ltd. Class A (a) | 91,771 | 412,511 | |
| China Gas Holdings Ltd. | 1,086,800 | 4,201,493 | |
| Credicorp Ltd. (United States) | 54,029 | 11,261,805 | |
| GP Investments Ltd. Class A (depositary receipt) (a) | 88,607 | 126,248 | |
| Kunlun Energy Co. Ltd. | 1,096,000 | 943,899 | |
| Marvell Technology Group Ltd. | 50,200 | 1,253,494 | |
| Pacific Basin Shipping Ltd. | 8,798,000 | 1,796,037 | |
| Shangri-La Asia Ltd. | 6,588,000 | 6,724,422 | |
| TOTAL BERMUDA | 26,987,294 | ||
| Brazil - 5.6% | |||
| Atacadao Distribuicao Comercio e Industria Ltda | 1,208,700 | 6,123,572 | |
| Azul SA sponsored ADR (a) | 128,100 | 4,588,542 | |
| Banco do Brasil SA | 1,718,040 | 18,809,767 | |
| BTG Pactual Participations Ltd. unit | 398,100 | 5,609,876 | |
| Centrais Eletricas Brasileiras SA (Electrobras) (a) | 273,000 | 2,638,046 | |
| Companhia de Saneamento de Minas Gerais | 293,130 | 4,796,666 | |
| Direcional Engenharia SA | 1,052,700 | 3,129,002 | |
| Localiza Rent A Car SA | 504,820 | 5,523,320 | |
| Natura Cosmeticos SA | 1,987,400 | 16,195,950 | |
| Notre Dame Intermedica Participacoes SA | 481,420 | 6,285,764 | |
| Petrobras Distribuidora SA | 719,900 | 4,769,936 | |
| Rumo SA (a) | 1,042,400 | 6,146,596 | |
| Suzano Papel e Celulose SA | 615,400 | 4,983,985 | |
| Totvs SA | 109,700 | 1,524,466 | |
| Vale SA sponsored ADR | 679,115 | 7,809,823 | |
| TOTAL BRAZIL | 98,935,311 | ||
| British Virgin Islands - 0.1% | |||
| Mail.Ru Group Ltd. GDR (Reg. S) (a) | 101,540 | 2,128,278 | |
| Canada - 0.2% | |||
| Gildan Activewear, Inc. | 11,100 | 393,948 | |
| OceanaGold Corp. | 155,800 | 406,890 | |
| Pan American Silver Corp. | 122,200 | 1,916,096 | |
| SEMAFO, Inc. (a) | 110,000 | 352,870 | |
| TOTAL CANADA | 3,069,804 | ||
| Cayman Islands - 20.7% | |||
| 51job, Inc. sponsored ADR (a) | 30,780 | 2,277,720 | |
| Airtac International Group | 419,000 | 4,986,810 | |
| Alibaba Group Holding Ltd. sponsored ADR (a) | 382,422 | 63,952,431 | |
| Ant International Co. Ltd. Class C (a)(c)(d) | 296,486 | 2,113,945 | |
| Bilibili, Inc. ADR (a) | 29,000 | 409,480 | |
| Chailease Holding Co. Ltd. | 806,450 | 3,246,996 | |
| China Biologic Products Holdings, Inc. (a)(b) | 10,576 | 1,210,635 | |
| China Resources Land Ltd. | 1,575,000 | 6,601,267 | |
| China State Construction International Holdings Ltd. | 3,544,000 | 3,332,518 | |
| CStone Pharmaceuticals Co. Ltd. (a)(e) | 1,491,830 | 2,398,288 | |
| ENN Energy Holdings Ltd. | 55,990 | 579,352 | |
| Eurocharm Holdings Co. Ltd. | 125,000 | 509,325 | |
| Haitian International Holdings Ltd. | 1,511,000 | 3,096,146 | |
| Hansoh Pharmaceutical Group Co. Ltd. (e) | 1,368,550 | 4,190,668 | |
| Hutchison China Meditech Ltd. sponsored ADR (a) | 98,100 | 1,750,104 | |
| HUYA, Inc. ADR (a)(b) | 177,080 | 4,186,171 | |
| iQIYI, Inc. ADR (a)(b) | 121,200 | 1,954,956 | |
| JD.com, Inc. sponsored ADR (a) | 522,200 | 14,731,262 | |
| Kingdee International Software Group Co. Ltd. | 1,630,000 | 1,717,825 | |
| Kingsoft Corp. Ltd. (a) | 6,191,000 | 13,143,938 | |
| Koolearn Technology Holding Ltd. (a)(e) | 1,249,500 | 2,002,337 | |
| LexinFintech Holdings Ltd. ADR (a) | 73,200 | 734,196 | |
| Meituan Dianping Class B | 4,155,880 | 42,472,407 | |
| Momo, Inc. ADR | 195,400 | 6,053,492 | |
| NetEase, Inc. ADR | 28,700 | 7,639,366 | |
| New Oriental Education & Technology Group, Inc. sponsored ADR (a) | 94,000 | 10,411,440 | |
| PagSeguro Digital Ltd. (a) | 46,300 | 2,144,153 | |
| Pinduoduo, Inc. ADR (a)(b) | 553,300 | 17,827,326 | |
| PPDAI Group, Inc. ADR | 130,800 | 379,320 | |
| Qutoutiao, Inc. ADR (b) | 286,700 | 1,060,790 | |
| Shenzhou International Group Holdings Ltd. | 1,486,200 | 19,417,288 | |
| Shimao Property Holdings Ltd. | 1,274,720 | 3,724,446 | |
| SITC International Holdings Co. Ltd. | 456,000 | 470,097 | |
| Sunny Optical Technology Group Co. Ltd. | 376,700 | 5,536,808 | |
| Tencent Holdings Ltd. | 2,204,000 | 92,188,729 | |
| Tencent Music Entertainment Group ADR (a)(b) | 75,100 | 959,027 | |
| Uni-President China Holdings Ltd. | 7,830,400 | 8,452,120 | |
| Weibo Corp. sponsored ADR (a)(b) | 26,300 | 1,176,925 | |
| Weidai Ltd. ADR | 36,100 | 220,210 | |
| Wise Talent Information Technology Co. Ltd. (a) | 709,141 | 1,670,228 | |
| Wuxi Biologics (Cayman), Inc. (a)(e) | 412,020 | 4,205,519 | |
| Xinyi Solar Holdings Ltd. | 480,000 | 287,840 | |
| YY, Inc. ADR (a) | 28,200 | 1,585,686 | |
| Zai Lab Ltd. ADR (a) | 30,700 | 993,145 | |
| TOTAL CAYMAN ISLANDS | 368,002,732 | ||
| Chile - 0.2% | |||
| Vina Concha y Toro SA | 1,431,604 | 2,844,949 | |
| China - 9.5% | |||
| BBMG Corp. (H Shares) | 11,179,500 | 3,209,344 | |
| Beijing Sinnet Technology Co. Ltd. (A Shares) | 339,300 | 881,909 | |
| China Communications Construction Co. Ltd. (H Shares) | 2,625,000 | 2,053,058 | |
| China Life Insurance Co. Ltd. (H Shares) | 7,957,900 | 18,337,767 | |
| China Longyuan Power Grid Corp. Ltd. (H Shares) | 8,578,650 | 4,815,961 | |
| China Pacific Insurance (Group) Co. Ltd. (H Shares) | 1,289,100 | 4,736,859 | |
| China Petroleum & Chemical Corp. (H Shares) | 18,142,000 | 10,735,379 | |
| China Tower Corp. Ltd. (H Shares) (e) | 13,080,000 | 2,970,565 | |
| Contemporary Amperex Technology Co. Ltd. | 145,900 | 1,459,337 | |
| Daqin Railway Co. Ltd. (A Shares) | 4,114,800 | 4,369,027 | |
| Glodon Co. Ltd. (A Shares) | 240,000 | 1,191,548 | |
| Haier Smart Home Co. Ltd. (A Shares) | 8,268,867 | 17,698,303 | |
| Hangzhou Tigermed Consulting Co. Ltd. (A Shares) | 410,650 | 3,564,575 | |
| Industrial & Commercial Bank of China Ltd. (H Shares) | 48,087,400 | 32,215,453 | |
| PICC Property & Casualty Co. Ltd. (H Shares) | 4,598,900 | 5,368,914 | |
| Ping An Bank Co. Ltd. (A Shares) | 3,356,900 | 7,321,140 | |
| Ping An Insurance Group Co. of China Ltd. (H Shares) | 2,121,000 | 24,378,172 | |
| Shanghai International Airport Co. Ltd. (A Shares) | 394,598 | 4,403,957 | |
| Shenzhen Mindray Bio-Medical Electronics Co. Ltd. (A Shares) | 157,833 | 4,072,811 | |
| Sinopec Engineering Group Co. Ltd. (H Shares) | 2,520,500 | 1,582,207 | |
| Tonghua Dongbao Pharmaceutical Co. Ltd. (A Shares) | 1,504,580 | 3,683,388 | |
| Tsingtao Brewery Co. Ltd. (H Shares) | 1,272,000 | 7,676,436 | |
| WuXi AppTec Co. Ltd. (H Shares) (e) | 264,254 | 2,889,441 | |
| TOTAL CHINA | 169,615,551 | ||
| Colombia - 0.4% | |||
| Bancolombia SA sponsored ADR | 90,787 | 4,489,417 | |
| Ecopetrol SA | 2,291,274 | 1,942,316 | |
| Interconexion Electrica SA ESP | 259,500 | 1,360,138 | |
| TOTAL COLOMBIA | 7,791,871 | ||
| Egypt - 0.2% | |||
| Commercial International Bank SAE | 441,000 | 2,112,899 | |
| EFG-Hermes Holding SAE | 724,300 | 858,660 | |
| Six of October Development & Investment Co. | 937,202 | 892,299 | |
| TOTAL EGYPT | 3,863,858 | ||
| Finland - 0.0% | |||
| Olvi PLC (A Shares) | 2,500 | 103,954 | |
| Hong Kong - 3.1% | |||
| AIA Group Ltd. | 190,400 | 1,795,672 | |
| China Everbright International Ltd. | 2,662,000 | 2,051,428 | |
| China Overseas Land and Investment Ltd. | 3,434,460 | 10,801,567 | |
| China Resources Beer Holdings Co. Ltd. | 2,458,666 | 13,034,126 | |
| China Resources Power Holdings Co. Ltd. | 879,523 | 1,067,183 | |
| China Unicom Ltd. | 3,461,720 | 3,664,839 | |
| China Unicom Ltd. sponsored ADR | 44,500 | 466,805 | |
| CNOOC Ltd. | 9,239,000 | 14,146,111 | |
| CSPC Pharmaceutical Group Ltd. | 2,639,720 | 5,301,197 | |
| Far East Horizon Ltd. | 3,340,074 | 3,102,407 | |
| TOTAL HONG KONG | 55,431,335 | ||
| Hungary - 0.4% | |||
| OTP Bank PLC | 160,067 | 6,664,200 | |
| Iceland - 0.0% | |||
| Festi hf (a) | 50,000 | 47,800 | |
| India - 8.7% | |||
| Adani Ports & Special Economic Zone Ltd. (a) | 957,408 | 5,610,008 | |
| Axis Bank Ltd. | 1,398,443 | 13,559,820 | |
| Axis Bank Ltd. GDR (Reg. S) | 10,640 | 518,168 | |
| Federal Bank Ltd. (a) | 3,146,967 | 4,026,977 | |
| ICICI Bank Ltd. | 513,338 | 3,138,177 | |
| ICICI Bank Ltd. sponsored ADR | 2,192,480 | 26,704,406 | |
| IndoStar Capital Finance Ltd. (e) | 214,410 | 657,237 | |
| Indraprastha Gas Ltd. (a) | 1,067,320 | 5,283,344 | |
| ITC Ltd. | 1,628,487 | 5,989,983 | |
| JK Cement Ltd. | 320,198 | 4,760,705 | |
| JM Financial Ltd. | 1,078,960 | 1,210,384 | |
| Larsen & Toubro Ltd. | 378,478 | 7,898,240 | |
| LIC Housing Finance Ltd. | 775,681 | 4,135,611 | |
| Manappuram General Finance & Leasing Ltd. | 2,562,248 | 5,121,232 | |
| NTPC Ltd. | 2,230,280 | 3,709,504 | |
| Oberoi Realty Ltd. (a) | 428,463 | 3,078,602 | |
| Petronet LNG Ltd. | 928,568 | 3,416,163 | |
| Phoenix Mills Ltd. | 317,743 | 3,136,950 | |
| Power Grid Corp. of India Ltd. | 1,481,436 | 4,174,108 | |
| Reliance Industries Ltd. | 1,254,397 | 23,655,891 | |
| Shree Cement Ltd. | 21,900 | 5,855,340 | |
| Shriram Transport Finance Co. Ltd. | 404,400 | 6,130,829 | |
| SREI Infrastructure Finance Ltd. | 310,395 | 40,642 | |
| State Bank of India (a) | 3,637,963 | 13,945,224 | |
| TOTAL INDIA | 155,757,545 | ||
| Indonesia - 1.2% | |||
| PT Bank Mandiri (Persero) Tbk | 18,983,900 | 9,328,123 | |
| PT Bank Rakyat Indonesia Tbk | 39,880,800 | 11,575,125 | |
| TOTAL INDONESIA | 20,903,248 | ||
| Japan - 0.5% | |||
| Keyence Corp. | 3,400 | 2,116,351 | |
| Murata Manufacturing Co. Ltd. | 24,600 | 1,192,301 | |
| Nintendo Co. Ltd. | 8,100 | 3,017,221 | |
| Renesas Electronics Corp. (a) | 244,000 | 1,598,984 | |
| Square Enix Holdings Co. Ltd. | 39,000 | 1,895,934 | |
| TOTAL JAPAN | 9,820,791 | ||
| Kazakhstan - 0.0% | |||
| JSC Halyk Bank of Kazakhstan GDR unit | 29,500 | 358,425 | |
| Kenya - 0.2% | |||
| Safaricom Ltd. | 10,292,633 | 2,725,541 | |
| Korea (South) - 11.3% | |||
| AMOREPACIFIC Group, Inc. | 123,609 | 6,741,634 | |
| BS Financial Group, Inc. | 420,047 | 2,518,629 | |
| Daou Technology, Inc. | 198,000 | 3,285,910 | |
| Hyundai Fire & Marine Insurance Co. Ltd. | 193,998 | 4,271,088 | |
| Hyundai Mobis | 138,153 | 29,033,421 | |
| Kakao Corp. | 32,340 | 3,654,405 | |
| KB Financial Group, Inc. | 379,646 | 13,516,566 | |
| Korea Electric Power Corp. (a) | 109,199 | 2,356,623 | |
| Korea Electric Power Corp. sponsored ADR (a) | 27,600 | 299,184 | |
| LG Chemical Ltd. | 18,420 | 4,600,699 | |
| LG Corp. | 93,655 | 5,467,218 | |
| NAVER Corp. | 21,194 | 2,774,917 | |
| NCSOFT Corp. | 11,106 | 4,825,394 | |
| Netmarble Corp. (a)(e) | 13,870 | 1,093,064 | |
| POSCO | 53,191 | 10,069,348 | |
| S-Oil Corp. | 57,940 | 4,802,885 | |
| Samsung Electronics Co. Ltd. | 1,605,383 | 65,668,187 | |
| Samsung SDI Co. Ltd. | 32,682 | 6,077,862 | |
| Shinhan Financial Group Co. Ltd. | 251,230 | 8,756,986 | |
| SK Hynix, Inc. | 304,935 | 20,903,377 | |
| TOTAL KOREA (SOUTH) | 200,717,397 | ||
| Kuwait - 0.4% | |||
| Boubyan Bank KSC | 84,781 | 154,350 | |
| Mobile Telecommunication Co. | 1,313,800 | 2,322,788 | |
| National Bank of Kuwait | 1,458,715 | 4,539,609 | |
| TOTAL KUWAIT | 7,016,747 | ||
| Luxembourg - 0.0% | |||
| Corp. America Airports SA (a) | 114,610 | 519,183 | |
| Malaysia - 0.4% | |||
| Bermaz Auto Bhd | 460,000 | 250,490 | |
| British American Tobacco (Malaysia) Bhd | 424,600 | 1,920,689 | |
| IHH Healthcare Bhd | 2,324,600 | 3,153,506 | |
| Tenaga Nasional Bhd | 766,700 | 2,497,680 | |
| TOTAL MALAYSIA | 7,822,365 | ||
| Mexico - 2.0% | |||
| America Movil S.A.B. de CV Series L sponsored ADR | 270,900 | 4,025,574 | |
| Fibra Uno Administracion SA de CV | 2,882,800 | 4,213,031 | |
| Grupo Aeroportuario del Pacifico S.A.B. de CV Series B | 370,896 | 3,569,127 | |
| Grupo Financiero Banorte S.A.B. de CV Series O | 1,403,532 | 7,543,967 | |
| Macquarie Mexican (REIT) (e) | 3,783,726 | 4,756,980 | |
| Wal-Mart de Mexico SA de CV Series V | 3,688,700 | 10,931,143 | |
| TOTAL MEXICO | 35,039,822 | ||
| Morocco - 0.1% | |||
| Attijariwafa Bank | 28,551 | 1,405,104 | |
| Multi-National - 0.2% | |||
| HKT Trust/HKT Ltd. unit | 2,295,000 | 3,642,625 | |
| Netherlands - 0.3% | |||
| ASML Holding NV (Netherlands) | 6,700 | 1,661,690 | |
| NXP Semiconductors NV | 19,500 | 2,127,840 | |
| Yandex NV Series A (a) | 60,214 | 2,108,092 | |
| TOTAL NETHERLANDS | 5,897,622 | ||
| Nigeria - 0.6% | |||
| Dangote Cement PLC | 2,247,210 | 938,092 | |
| Guaranty Trust Bank PLC | 49,059,820 | 3,947,280 | |
| Guaranty Trust Bank PLC GDR (Reg. S) | 187,574 | 664,012 | |
| Nigerian Breweries PLC | 4,907,931 | 709,981 | |
| Transnational Corp. of Nigeria PLC | 1,421,618 | 3,996 | |
| Zenith Bank PLC | 81,910,409 | 4,220,557 | |
| TOTAL NIGERIA | 10,483,918 | ||
| Pakistan - 0.2% | |||
| Habib Bank Ltd. | 2,293,300 | 1,733,563 | |
| Indus Motor Co. Ltd. | 21,577 | 133,386 | |
| Maple Leaf Cement Factory Ltd. | 728,817 | 68,441 | |
| Searle Co. Ltd. | 617,300 | 545,807 | |
| United Bank Ltd. | 646,400 | 571,578 | |
| TOTAL PAKISTAN | 3,052,775 | ||
| Panama - 0.3% | |||
| Copa Holdings SA Class A | 49,700 | 4,907,875 | |
| Peru - 0.8% | |||
| Alicorp SA Class C | 202,659 | 559,217 | |
| Compania de Minas Buenaventura SA sponsored ADR | 938,616 | 14,248,191 | |
| Ferreycorp SAA | 102,123 | 63,935 | |
| TOTAL PERU | 14,871,343 | ||
| Philippines - 1.5% | |||
| Altus San Nicolas Corp. (d) | 143,993 | 14,397 | |
| Ayala Corp. | 210,675 | 3,595,948 | |
| Ayala Land, Inc. | 2,686,500 | 2,563,632 | |
| BDO Unibank, Inc. | 971,033 | 2,679,616 | |
| International Container Terminal Services, Inc. | 581,617 | 1,351,345 | |
| Jollibee Food Corp. | 137,863 | 590,613 | |
| Metropolitan Bank & Trust Co. | 5,226,062 | 6,898,160 | |
| PUREGOLD Price Club, Inc. | 852,487 | 642,409 | |
| Robinsons Land Corp. | 6,613,870 | 3,126,974 | |
| SM Investments Corp. | 187,425 | 3,511,958 | |
| Universal Robina Corp. | 371,143 | 1,117,297 | |
| TOTAL PHILIPPINES | 26,092,349 | ||
| Poland - 0.2% | |||
| Dino Polska SA (a)(e) | 100,300 | 3,926,860 | |
| Globe Trade Centre SA | 197,493 | 467,865 | |
| TOTAL POLAND | 4,394,725 | ||
| Romania - 0.2% | |||
| Banca Transilvania SA | 3,172,921 | 1,749,391 | |
| BRD-Groupe Societe Generale | 347,726 | 1,143,922 | |
| TOTAL ROMANIA | 2,893,313 | ||
| Russia - 5.1% | |||
| Lukoil PJSC sponsored ADR | 222,400 | 18,401,376 | |
| MMC Norilsk Nickel PJSC sponsored ADR | 519,200 | 13,291,520 | |
| NOVATEK OAO | 25,300 | 511,646 | |
| NOVATEK OAO GDR (Reg. S) | 56,200 | 11,397,360 | |
| Sberbank of Russia | 4,762,250 | 16,683,076 | |
| Sberbank of Russia sponsored ADR | 1,558,092 | 22,085,954 | |
| Tatneft PAO | 576,000 | 6,101,600 | |
| Unipro PJSC | 77,840,800 | 3,181,903 | |
| TOTAL RUSSIA | 91,654,435 | ||
| Saudi Arabia - 0.2% | |||
| Abdullah Al Othaim Markets Co. | 23,300 | 513,057 | |
| Al Rajhi Bank | 30,138 | 508,567 | |
| Bupa Arabia for Cooperative Insurance Co. | 25,020 | 709,674 | |
| Mouwasat Medical Services Co. | 22,200 | 519,610 | |
| SABIC | 8,500 | 208,467 | |
| United International Transportation Co. | 62,000 | 581,787 | |
| TOTAL SAUDI ARABIA | 3,041,162 | ||
| Singapore - 0.2% | |||
| First Resources Ltd. | 3,862,900 | 4,471,758 | |
| South Africa - 4.4% | |||
| Anglo American Platinum Ltd. | 6,000 | 361,715 | |
| AngloGold Ashanti Ltd. | 508,100 | 9,395,409 | |
| Barclays Africa Group Ltd. | 1,214,741 | 12,261,305 | |
| Bidvest Group Ltd. | 292,262 | 3,682,173 | |
| Distell Group Holdings Ltd. | 31,000 | 278,355 | |
| DRDGOLD Ltd. | 1,467,645 | 660,901 | |
| Impala Platinum Holdings Ltd. (a) | 2,269,100 | 14,275,328 | |
| Imperial Holdings Ltd. | 166,267 | 572,740 | |
| Motus Holdings Ltd. | 317,100 | 1,440,926 | |
| Mr Price Group Ltd. | 481,100 | 5,027,011 | |
| Nampak Ltd. (a) | 740,310 | 463,885 | |
| Naspers Ltd. Class N | 162,200 | 24,558,575 | |
| Pick 'n Pay Stores Ltd. | 1,099,108 | 4,320,957 | |
| Pretoria Portland Cement Co. Ltd. (a) | 1,336,234 | 353,800 | |
| Sanlam Ltd. | 82,900 | 408,233 | |
| Shoprite Holdings Ltd. | 48,016 | 388,820 | |
| TOTAL SOUTH AFRICA | 78,450,133 | ||
| Taiwan - 5.8% | |||
| Formosa Plastics Corp. | 1,931,000 | 5,877,714 | |
| Largan Precision Co. Ltd. | 17,000 | 2,436,707 | |
| MediaTek, Inc. | 385,000 | 4,575,952 | |
| Taiwan Semiconductor Manufacturing Co. Ltd. | 8,741,869 | 77,587,443 | |
| Unified-President Enterprises Corp. | 5,009,000 | 12,068,324 | |
| TOTAL TAIWAN | 102,546,140 | ||
| Thailand - 1.5% | |||
| Kasikornbank PCL (For. Reg.) | 1,649,900 | 8,467,941 | |
| Mega Lifesciences PCL | 50,000 | 51,079 | |
| PTT Global Chemical PCL (For. Reg.) | 3,522,800 | 6,189,948 | |
| Siam Cement PCL (For. Reg.) | 815,600 | 10,878,222 | |
| Thai Beverage PCL | 988,133 | 632,708 | |
| TOA Paint Thailand PCL | 174,300 | 230,767 | |
| TOTAL THAILAND | 26,450,665 | ||
| Turkey - 0.7% | |||
| Aselsan A/S | 1,329,700 | 4,737,660 | |
| Enerjisa Enerji A/S (e) | 764,700 | 842,294 | |
| Tupras Turkiye Petrol Rafinerileri A/S | 283,358 | 7,200,615 | |
| TOTAL TURKEY | 12,780,569 | ||
| United Arab Emirates - 0.6% | |||
| Dubai Financial Market PJSC (a) | 1,669,494 | 388,609 | |
| Emaar Properties PJSC | 4,073,433 | 5,112,377 | |
| National Bank of Abu Dhabi PJSC | 1,072,152 | 4,390,010 | |
| TOTAL UNITED ARAB EMIRATES | 9,890,996 | ||
| United Kingdom - 0.2% | |||
| ASA International (e) | 39,800 | 171,276 | |
| Georgia Capital PLC (a) | 34,000 | 426,408 | |
| Mondi PLC | 140,642 | 2,697,225 | |
| Tonghua Dongbao Pharmaceutical Co. Ltd. ELS (UBS AG London Bank Warrant Program) A warrants 4/8/20 (a)(e) | 186,190 | 455,815 | |
| TOTAL UNITED KINGDOM | 3,750,724 | ||
| United States of America - 1.6% | |||
| Activision Blizzard, Inc. | 77,000 | 4,074,840 | |
| DouYu International Holdings Ltd. ADR | 927,900 | 7,599,501 | |
| MercadoLibre, Inc. (a) | 23,300 | 12,843,659 | |
| Micron Technology, Inc. (a) | 85,700 | 3,672,245 | |
| TOTAL UNITED STATES OF AMERICA | 28,190,245 | ||
| Vietnam - 0.7% | |||
| Bank For Foreign Trade JSC | 348,080 | 1,231,730 | |
| Ho Chi Minh City Securities Co. | 602,982 | 631,544 | |
| Petrolimex | 312,200 | 814,107 | |
| PetroVietnam Gas JSC | 80,000 | 366,536 | |
| PetroVietnam Technical Services Corp. | 462,093 | 388,380 | |
| Sai Gon Cargo Service Corp. | 15,000 | 104,866 | |
| Ssi Securities Corp. | 528,590 | 524,011 | |
| Vietjet Aviation JSC | 189,816 | 1,126,575 | |
| Vietnam Dairy Products Corp. | 520,356 | 2,908,934 | |
| Vietnam Engine & Agricultural Machinery Corp. | 235,600 | 557,495 | |
| Vietnam Technological & Commercial Joint Stock Bank (a) | 722,700 | 727,341 | |
| Viglacera Corp. JSC | 60,000 | 49,912 | |
| Vincom Retail JSC | 1,206,200 | 1,720,840 | |
| Vingroup JSC (a) | 320,200 | 1,653,375 | |
| TOTAL VIETNAM | 12,805,646 | ||
| TOTAL COMMON STOCKS | |||
| (Cost $1,561,899,443) | 1,649,704,120 | ||
| Nonconvertible Preferred Stocks - 4.8% | |||
| Brazil - 3.4% | |||
| Ambev SA sponsored ADR | 1,714,400 | 7,920,528 | |
| Banco do Estado Rio Grande do Sul SA | 383,560 | 2,081,680 | |
| Companhia Paranaense de Energia-Copel: | |||
| (PN-B) | 9,460 | 112,952 | |
| (PN-B) sponsored ADR | 418,707 | 5,028,671 | |
| Itau Unibanco Holding SA sponsored ADR | 2,532,179 | 21,295,625 | |
| Metalurgica Gerdau SA (PN) | 3,022,200 | 4,546,084 | |
| Petroleo Brasileiro SA - Petrobras (PN) sponsored ADR (non-vtg.) | 1,188,600 | 15,618,204 | |
| Telefonica Brasil SA | 220,480 | 2,915,359 | |
| TOTAL BRAZIL | 59,519,103 | ||
| Korea (South) - 1.4% | |||
| Hyundai Motor Co. Series 2 | 234,985 | 16,637,390 | |
| Samsung Electronics Co. Ltd. | 269,613 | 8,881,274 | |
| TOTAL KOREA (SOUTH) | 25,518,664 | ||
| TOTAL NONCONVERTIBLE PREFERRED STOCKS | |||
| (Cost $77,805,760) | 85,037,767 | ||
| Principal Amount | Value | ||
| Government Obligations - 0.0% | |||
| United States of America - 0.0% | |||
| U.S. Treasury Bills, yield at date of purchase 1.91% 12/12/19(f) | |||
| (Cost $836,800) | 840,000 | 837,008 | |
| Shares | Value | ||
| Money Market Funds - 2.9% | |||
| Fidelity Cash Central Fund 1.96% (g) | 41,734,726 | 41,743,073 | |
| Fidelity Securities Lending Cash Central Fund 1.96% (g)(h) | 9,480,187 | 9,481,135 | |
| TOTAL MONEY MARKET FUNDS | |||
| (Cost $51,223,173) | 51,224,208 | ||
| TOTAL INVESTMENT IN SECURITIES - 100.4% | |||
| (Cost $1,691,765,176) | 1,786,803,103 | ||
| NET OTHER ASSETS (LIABILITIES) - (0.4)% | (6,938,140) | ||
| NET ASSETS - 100% | $1,779,864,963 |
| Futures Contracts | |||||
| Number of contracts | Expiration Date | Notional Amount | Value | Unrealized Appreciation/(Depreciation) | |
| Purchased | |||||
| Equity Index Contracts | |||||
| ICE E-mini MSCI Emerging Markets Index Contracts (United States) | 233 | Dec. 2019 | $11,672,135 | $(396,273) | $(396,273) |
The notional amount of futures purchased as a percentage of Net Assets is 0.7%
For the period, the average monthly notional amount at value for futures contracts in the aggregate was $3,850,573.
Security Type Abbreviations
ELS – Equity-Linked Security
Categorizations in the Schedule of Investments are based on country or territory of incorporation.
Legend
(a) Non-income producing
(b) Security or a portion of the security is on loan at period end.
(c) Restricted securities - Investment in securities not registered under the Securities Act of 1933 (excluding 144A issues). At the end of the period, the value of restricted securities (excluding 144A issues) amounted to $2,113,945 or 0.1% of net assets.
(d) Level 3 security
(e) Security exempt from registration under Rule 144A of the Securities Act of 1933. These securities may be resold in transactions exempt from registration, normally to qualified institutional buyers. At the end of the period, the value of these securities amounted to $30,560,344 or 1.7% of net assets.
(f) Security or a portion of the security was pledged to cover margin requirements for futures contracts. At period end, the value of securities pledged amounted to $837,008.
(g) Affiliated fund that is generally available only to investment companies and other accounts managed by Fidelity Investments. The rate quoted is the annualized seven-day yield of the fund at period end. A complete unaudited listing of the fund's holdings as of its most recent quarter end is available upon request. In addition, each Fidelity Central Fund's financial statements, which are not covered by the Fund's Report of Independent Registered Public Accounting Firm, are available on the SEC's website or upon request.
(h) Investment made with cash collateral received from securities on loan.
Additional information on each restricted holding is as follows:
| Security | Acquisition Date | Acquisition Cost |
| Ant International Co. Ltd. Class C | 5/16/18 | $1,663,286 |
Affiliated Central Funds
Information regarding fiscal year to date income earned by the Fund from investments in Fidelity Central Funds is as follows:
| Fund | Income earned |
| Fidelity Cash Central Fund | $762,897 |
| Fidelity Securities Lending Cash Central Fund | 112,146 |
| Total | $875,043 |
Amounts in the income column in the above table include any capital gain distributions from underlying funds, which are presented in the corresponding line-item in the Statement of Operations, if applicable. Amount for Fidelity Securities Lending Cash Central Fund represents the income earned on investing cash collateral, less rebates paid to borrowers and any lending agent fees associated with the loan, plus any premium payments received for lending certain types of securities.
Investment Valuation
The following is a summary of the inputs used, as of September 30, 2019, involving the Fund's assets and liabilities carried at fair value. The inputs or methodology used for valuing securities may not be an indication of the risk associated with investing in those securities. For more information on valuation inputs, and their aggregation into the levels used below, please refer to the Investment Valuation section in the accompanying Notes to Financial Statements.
| Valuation Inputs at Reporting Date: | ||||
| Description | Total | Level 1 | Level 2 | Level 3 |
| Investments in Securities: | ||||
| Equities: | ||||
| Communication Services | $160,898,822 | $60,132,099 | $100,766,723 | $-- |
| Consumer Discretionary | 299,121,809 | 274,563,234 | 24,558,575 | -- |
| Consumer Staples | 120,905,363 | 120,905,363 | -- | -- |
| Energy | 119,132,033 | 87,637,297 | 31,494,736 | -- |
| Financials | 419,315,533 | 300,037,849 | 119,277,684 | -- |
| Health Care | 45,918,916 | 45,918,916 | -- | -- |
| Industrials | 94,585,508 | 94,585,508 | -- | -- |
| Information Technology | 237,830,676 | 153,673,907 | 84,156,769 | -- |
| Materials | 133,766,165 | 124,370,756 | 9,395,409 | -- |
| Real Estate | 54,246,623 | 52,118,281 | -- | 2,128,342 |
| Utilities | 49,020,439 | 43,481,913 | 5,538,526 | -- |
| Government Obligations | 837,008 | -- | 837,008 | -- |
| Money Market Funds | 51,224,208 | 51,224,208 | -- | -- |
| Total Investments in Securities: | $1,786,803,103 | $1,408,649,331 | $376,025,430 | $2,128,342 |
| Derivative Instruments: | ||||
| Liabilities | ||||
| Futures Contracts | $(396,273) | $(396,273) | $-- | $-- |
| Total Liabilities | $(396,273) | $(396,273) | $-- | $-- |
| Total Derivative Instruments: | $(396,273) | $(396,273) | $-- | $-- |
Value of Derivative Instruments
The following table is a summary of the Fund's value of derivative instruments by primary risk exposure as of September 30, 2019. For additional information on derivative instruments, please refer to the Derivative Instruments section in the accompanying Notes to Financial Statements.
| Primary Risk Exposure / Derivative Type | Value | |
| Asset | Liability | |
| Equity Risk | ||
| Futures Contracts(a) | $0 | $(396,273) |
| Total Equity Risk | 0 | (396,273) |
| Total Value of Derivatives | $0 | $(396,273) |
(a) Reflects gross cumulative appreciation (depreciation) on futures contracts as presented in the Schedule of Investments. In the Statement of Assets and Liabilities, the period end daily variation margin is included in receivable or payable for daily variation margin on futures contracts, and the net cumulative appreciation (depreciation) is included in Total accumulated earnings (loss).
See accompanying notes which are an integral part of the financial statements.
Financial Statements
Statement of Assets and Liabilities
| September 30, 2019 | ||
| Assets | ||
| Investment in securities, at value (including securities loaned of $9,305,542) — See accompanying schedule: Unaffiliated issuers (cost $1,640,542,003) | $1,735,578,895 | |
| Fidelity Central Funds (cost $51,223,173) | 51,224,208 | |
| Total Investment in Securities (cost $1,691,765,176) | $1,786,803,103 | |
| Cash | 943,198 | |
| Foreign currency held at value (cost $1,197,392) | 1,197,699 | |
| Receivable for investments sold | 8,707,346 | |
| Receivable for fund shares sold | 422,206 | |
| Dividends receivable | 3,202,175 | |
| Distributions receivable from Fidelity Central Funds | 94,389 | |
| Receivable for daily variation margin on futures contracts | 70,926 | |
| Other receivables | 317,494 | |
| Total assets | 1,801,758,536 | |
| Liabilities | ||
| Payable for investments purchased | $10,571,454 | |
| Payable for fund shares redeemed | 1,419,760 | |
| Other payables and accrued expenses | 421,409 | |
| Collateral on securities loaned | 9,480,950 | |
| Total liabilities | 21,893,573 | |
| Net Assets | $1,779,864,963 | |
| Net Assets consist of: | ||
| Paid in capital | $1,717,383,658 | |
| Total accumulated earnings (loss) | 62,481,305 | |
| Net Assets, for 8,451,157 shares outstanding | $1,779,864,963 | |
| Net Asset Value, offering price and redemption price per share ($1,779,864,963 ÷ 8,451,157 shares) | $210.61 |
See accompanying notes which are an integral part of the financial statements.
Statement of Operations
| Year ended September 30, 2019 | ||
| Investment Income | ||
| Dividends | $27,514,089 | |
| Non-Cash dividends | 14,021,520 | |
| Interest | 44,865 | |
| Income from Fidelity Central Funds (including $112,146 from security lending) | 875,043 | |
| Income before foreign taxes withheld | 42,455,517 | |
| Less foreign taxes withheld | (3,021,441) | |
| Total income | 39,434,076 | |
| Expenses | ||
| Custodian fees and expenses | $572,275 | |
| Independent directors' fees and expenses | 5,111 | |
| Miscellaneous | 7 | |
| Total expenses | 577,393 | |
| Net investment income (loss) | 38,856,683 | |
| Realized and Unrealized Gain (Loss) | ||
| Net realized gain (loss) on: | ||
| Investment securities: | ||
| Unaffiliated issuers | (39,609,821) | |
| Fidelity Central Funds | (428) | |
| Foreign currency transactions | (757,811) | |
| Futures contracts | (2,648,787) | |
| Total net realized gain (loss) | (43,016,847) | |
| Change in net unrealized appreciation (depreciation) on: | ||
| Investment securities: | ||
| Unaffiliated issuers | 21,065,423 | |
| Fidelity Central Funds | 566 | |
| Assets and liabilities in foreign currencies | 6,495 | |
| Futures contracts | (428,217) | |
| Total change in net unrealized appreciation (depreciation) | 20,644,267 | |
| Net gain (loss) | (22,372,580) | |
| Net increase (decrease) in net assets resulting from operations | $16,484,103 |
See accompanying notes which are an integral part of the financial statements.
Statement of Changes in Net Assets
| Year ended September 30, 2019 | Year ended September 30, 2018 | |
| Increase (Decrease) in Net Assets | ||
| Operations | ||
| Net investment income (loss) | $38,856,683 | $15,716,138 |
| Net realized gain (loss) | (43,016,847) | 52,654,122 |
| Change in net unrealized appreciation (depreciation) | 20,644,267 | (84,579,697) |
| Net increase (decrease) in net assets resulting from operations | 16,484,103 | (16,209,437) |
| Distributions to shareholders | (65,500,810) | – |
| Distributions to shareholders from net investment income | – | (15,018,134) |
| Distributions to shareholders from net realized gain | – | (37,772,093) |
| Total distributions | (65,500,810) | (52,790,227) |
| Affiliated share transactions | ||
| Proceeds from sales of shares | 1,234,849,860 | 131,696,787 |
| Reinvestment of distributions | 65,500,810 | 52,167,267 |
| Cost of shares redeemed | (135,282,360) | (214,237,322) |
| Net increase (decrease) in net assets resulting from share transactions | 1,165,068,310 | (30,373,268) |
| Total increase (decrease) in net assets | 1,116,051,603 | (99,372,932) |
| Net Assets | ||
| Beginning of period | 663,813,360 | 763,186,292 |
| End of period | $1,779,864,963 | $663,813,360 |
| Other Information | ||
| Undistributed net investment income end of period | $1,675,537 | |
| Shares | ||
| Sold | 5,753,763 | 525,396 |
| Issued in reinvestment of distributions | 336,509 | 214,429 |
| Redeemed | (648,106) | (829,971) |
| Net increase (decrease) | 5,442,166 | (90,146) |
See accompanying notes which are an integral part of the financial statements.
Financial Highlights
Fidelity Emerging Markets Equity Central Fund
| Years ended September 30, | 2019 | 2018 | 2017 | 2016 | 2015 |
| Selected Per–Share Data | |||||
| Net asset value, beginning of period | $220.61 | $246.26 | $202.55 | $172.95 | $212.25 |
| Income from Investment Operations | |||||
| Net investment income (loss)A | 7.79B | 5.11 | 4.65 | 4.05 | 3.47 |
| Net realized and unrealized gain (loss) | 1.52C | (14.13) | 44.19 | 29.35 | (39.58) |
| Total from investment operations | 9.31 | (9.02) | 48.84 | 33.40 | (36.11) |
| Distributions from net investment income | (4.54) | (4.95) | (4.06) | (3.80) | (3.19) |
| Distributions from net realized gain | (14.76) | (11.68) | (1.07) | – | – |
| Total distributions | (19.31)D | (16.63) | (5.13) | (3.80) | (3.19) |
| Net asset value, end of period | $210.61 | $220.61 | $246.26 | $202.55 | $172.95 |
| Total ReturnE | 5.22% | (4.20)% | 24.55% | 19.51% | (17.12)% |
| Ratios to Average Net AssetsF,G | |||||
| Expenses before reductions | .06% | .07% | .07% | .09% | .15% |
| Expenses net of fee waivers, if any | .06% | .07% | .07% | .09% | .15% |
| Expenses net of all reductions | .06% | .07% | .07% | .09% | .15% |
| Net investment income (loss) | 3.73%B | 2.07% | 2.12% | 2.23% | 1.71% |
| Supplemental Data | |||||
| Net assets, end of period (000 omitted) | $1,779,865 | $663,813 | $763,186 | $414,821 | $237,056 |
| Portfolio turnover rateH | 60% | 65% | 59% | 52% | 141% |
A Calculated based on average shares outstanding during the period.
B Net investment income per share reflects a large, non-recurring dividend which amounted to $2.72 per share. Excluding this non-recurring dividend, the ratio of net investment income (loss) to average net assets would have been 2.43%.
C The amount shown for a share outstanding does not correspond with the aggregate net gain (loss) on investments for the period due to the timing of sales and repurchases of shares in relation to fluctuating market values of the investments of the Fund.
D Total distributions of $19.31 per share is comprised of distributions from net investment income of $4.544 and distributions from net realized gain of $14.762 per share.
E Total returns would have been lower if certain expenses had not been reduced during the applicable periods shown.
F Fees and expenses of any underlying Fidelity Central Funds are not included in the Fund's expense ratio. The Fund indirectly bears its proportionate share of the expenses of any underlying Fidelity Central Funds.
G Expense ratios reflect operating expenses of the Fund. Expenses before reductions do not reflect amounts reimbursed by the investment adviser or reductions from expense offset arrangements and do not represent the amount paid by the Fund during periods when reimbursements or reductions occur. Expenses net of fee waivers reflect expenses after reimbursement by the investment adviser but prior to reductions from expense offset arrangements. Expenses net of all reductions represent the net expenses paid by the Fund.
H Amount does not include the portfolio activity of any underlying Fidelity Central Funds.
See accompanying notes which are an integral part of the financial statements.
Notes to Financial Statements
For the period ended September 30, 2019
1. Organization.
Fidelity Emerging Markets Equity Central Fund (the Fund) is a fund of Fidelity Central Investment Portfolios LLC (the LLC) and is authorized to issue an unlimited number of shares. Shares of the Fund are only offered to other investment companies and accounts managed by Fidelity Management & Research Company (FMR), or its affiliates (the Investing Funds). The LLC is registered under the Investment Company Act of 1940, as amended (the 1940 Act), as an open-end management investment company organized as a Delaware Limited Liability Company. The Fund's investments in emerging markets can be subject to social, economic, regulatory, and political uncertainties and can be extremely volatile.
2. Investments in Fidelity Central Funds.
The Fund invests in Fidelity Central Funds, which are open-end investment companies generally available only to other investment companies and accounts managed by the investment adviser and its affiliates. The Fund's Schedule of Investments lists each of the Fidelity Central Funds held as of period end, if any, as an investment of the Fund, but does not include the underlying holdings of each Fidelity Central Fund. As an Investing Fund, the Fund indirectly bears its proportionate share of the expenses of the underlying Fidelity Central Funds.
The Money Market Central Funds seek preservation of capital and current income and are managed by Fidelity Investments Money Management, Inc. (FIMM), an affiliate of the investment adviser. Annualized expenses of the Money Market Central Funds as of their most recent shareholder report date ranged from less than .005% to .01%.
A complete unaudited list of holdings for each Fidelity Central Fund is available upon request or at the Securities and Exchange Commission (the SEC) website at www.sec.gov. In addition, the financial statements of the Fidelity Central Funds, which are not covered by the Fund's Report of Independent Registered Public Accounting Firm, are available on the SEC website or upon request.
3. Significant Accounting Policies.
The Fund is an investment company and applies the accounting and reporting guidance of the Financial Accounting Standards Board (FASB) Accounting Standards Codification Topic 946 Financial Services – Investments Companies. The financial statements have been prepared in conformity with accounting principles generally accepted in the United States of America (GAAP), which require management to make certain estimates and assumptions at the date of the financial statements. Actual results could differ from those estimates. Subsequent events, if any, through the date that the financial statements were issued have been evaluated in the preparation of the financial statements. The following summarizes the significant accounting policies of the Fund:
Investment Valuation. Investments are valued as of 4:00 p.m. Eastern time on the last calendar day of the period. The Board of Directors (the Board) has delegated the day to day responsibility for the valuation of the Fund's investments to the Fair Value Committee (the Committee) established by the Fund's investment adviser. In accordance with valuation policies and procedures approved by the Board, the Fund attempts to obtain prices from one or more third party pricing vendors or brokers to value its investments. When current market prices, quotations or currency exchange rates are not readily available or reliable, investments will be fair valued in good faith by the Committee, in accordance with procedures adopted by the Board. Factors used in determining fair value vary by investment type and may include market or investment specific events, changes in interest rates and credit quality. The frequency with which these procedures are used cannot be predicted and they may be utilized to a significant extent. The Committee oversees the Fund's valuation policies and procedures and reports to the Board on the Committee's activities and fair value determinations. The Board monitors the appropriateness of the procedures used in valuing the Fund's investments and ratifies the fair value determinations of the Committee.
The Fund categorizes the inputs to valuation techniques used to value its investments into a disclosure hierarchy consisting of three levels as shown below:
- Level 1 – quoted prices in active markets for identical investments
- Level 2 – other significant observable inputs (including quoted prices for similar investments, interest rates, prepayment speeds, etc.)
- Level 3 – unobservable inputs (including the Fund's own assumptions based on the best information available)
Valuation techniques used to value the Fund's investments by major category are as follows:
Equity securities, including restricted securities, for which market quotations are readily available, are valued at the last reported sale price or official closing price as reported by a third party pricing vendor on the primary market or exchange on which they are traded and are categorized as Level 1 in the hierarchy. In the event there were no sales during the day or closing prices are not available, securities are valued at the last quoted bid price or may be valued using the last available price and are generally categorized as Level 2 in the hierarchy. For foreign equity securities, when market or security specific events arise, comparisons to the valuation of American Depositary Receipts (ADRs), futures contracts, Exchange-Traded Funds (ETFs) and certain indexes as well as quoted prices for similar securities may be used and would be categorized as Level 2 in the hierarchy. For equity securities, including restricted securities, where observable inputs are limited, assumptions about market activity and risk are used and these securities may be categorized as Level 3 in the hierarchy.
Debt securities, including restricted securities, are valued based on evaluated prices received from third party pricing vendors or from brokers who make markets in such securities. U.S. government and government agency obligations are valued by pricing vendors who utilize matrix pricing which considers yield or price of bonds of comparable quality, coupon, maturity and type or by broker-supplied prices. When independent prices are unavailable or unreliable, debt securities may be valued utilizing pricing methodologies which consider similar factors that would be used by third party pricing vendors. Debt securities are generally categorized as Level 2 in the hierarchy but may be Level 3 depending on the circumstances.
Futures contracts are valued at the settlement price established each day by the board of trade or exchange on which they are traded and are categorized as Level 1 in the hierarchy. Investments in open-end mutual funds, including the Fidelity Central Funds, are valued at their closing net asset value (NAV) each business day and are categorized as Level 1 in the hierarchy.
Changes in valuation techniques may result in transfers in or out of an assigned level within the disclosure hierarchy. The aggregate value of investments by input level as of September 30, 2019 is included at the end of the Fund's Schedule of Investments.
Foreign Currency. The Fund may use foreign currency contracts to facilitate transactions in foreign-denominated securities. Gains and losses from these transactions may arise from changes in the value of the foreign currency or if the counterparties do not perform under the contracts' terms.
Foreign-denominated assets, including investment securities, and liabilities are translated into U.S. dollars at the exchange rates at period end. Purchases and sales of investment securities, income and dividends received and expenses denominated in foreign currencies are translated into U.S. dollars at the exchange rate in effect on the transaction date.
The effects of exchange rate fluctuations on investments are included with the net realized and unrealized gain (loss) on investment securities. Other foreign currency transactions resulting in realized and unrealized gain (loss) are disclosed separately.
Investment Transactions and Income. For financial reporting purposes, the Fund's investment holdings and NAV include trades executed through the end of the last business day of the period. The NAV per share for processing shareholder transactions is calculated as of the close of business of the New York Stock Exchange (NYSE), normally 4:00 p.m. Eastern time and includes trades executed through the end of the prior business day. Gains and losses on securities sold are determined on the basis of identified cost and include proceeds received from litigation. Dividend income is recorded on the ex-dividend date, except for certain dividends from foreign securities where the ex-dividend date may have passed, which are recorded as soon as the Fund is informed of the ex-dividend date. Non-cash dividends included in dividend income, if any, are recorded at the fair market value of the securities received. Income and capital gain distributions from Fidelity Central Funds, if any, are recorded on the ex-dividend date. Certain distributions received by the Fund represent a return of capital or capital gain. The Fund determines the components of these distributions subsequent to the ex-dividend date, based upon receipt of tax filings or other correspondence relating to the underlying investment. These distributions are recorded as a reduction of cost of investments and/or as a realized gain. Large, non-recurring dividends recognized by the Fund are presented separately on the Statement of Operations as "Non-cash dividends" and the impact of these dividends is presented in the Financial Highlights. Interest income is accrued as earned and includes coupon interest and amortization of premium and accretion of discount on debt securities as applicable. Investment income is recorded net of foreign taxes withheld where recovery of such taxes is uncertain.
Expenses. Expenses directly attributable to a fund are charged to that fund. Expenses attributable to more than one fund are allocated among the respective funds on the basis of relative net assets or other appropriate methods. Expense estimates are accrued in the period to which they relate and adjustments are made when actual amounts are known.
Income Tax Information and Distributions to Shareholders. Each year, the Fund intends to qualify as a regulated investment company under Subchapter M of the Internal Revenue Code, including distributing substantially all of its taxable income and realized gains. As a result, no provision for U.S. Federal income taxes is required. As of September 30, 2019, the Fund did not have any unrecognized tax benefits in the financial statements; nor is the Fund aware of any tax positions for which it is reasonably possible that the total amounts of unrecognized tax benefits will significantly change in the next twelve months. The Fund files a U.S. federal tax return, in addition to state and local tax returns as required. The Fund's federal income tax returns are subject to examination by the Internal Revenue Service (IRS) for a period of three fiscal years after they are filed. State and local tax returns may be subject to examination for an additional fiscal year depending on the jurisdiction. Foreign taxes are provided for based on the Fund's understanding of the tax rules and rates that exist in the foreign markets in which it invests.
Distributions are declared and recorded on the ex-dividend date. Income and capital gain distributions are determined in accordance with income tax regulations, which may differ from GAAP. In addition, the Fund claimed a portion of the payment made to redeeming shareholders as a distribution for income tax purposes.
Capital accounts within the financial statements are adjusted for permanent book-tax differences. These adjustments have no impact on net assets or the results of operations. Capital accounts are not adjusted for temporary book-tax differences which will reverse in a subsequent period.
Book-tax differences are primarily due to futures contracts, foreign currency transactions, capital loss carryforwards, passive foreign investment companies (PFIC), losses deferred due to wash sales and excise tax regulations.
As of period end, the cost and unrealized appreciation (depreciation) in securities, and derivatives if applicable, for federal income tax purposes were as follows:
| Gross unrealized appreciation | $195,688,891 |
| Gross unrealized depreciation | (116,725,303) |
| Net unrealized appreciation (depreciation) | $78,963,588 |
| Tax Cost | $1,707,839,515 |
The tax-based components of distributable earnings as of period end were as follows:
| Undistributed ordinary income | $21,866,363 |
| Capital loss carryforward | $(38,225,360) |
| Net unrealized appreciation (depreciation) on securities and other investments | $78,840,306 |
Capital loss carryforwards are only available to offset future capital gains of the Fund to the extent provided by regulations and may be limited. Under the Regulated Investment Company Modernization Act of 2010 (the Act), the Fund is permitted to carry forward capital losses incurred in taxable years beginning after December 22, 2010 for an unlimited period and such capital losses are required to be used prior to any losses that expire. The capital loss carryforward information presented below, including any applicable limitation, is estimated as of fiscal period end and is subject to adjustment.
| No expiration | |
| Short-term | $(23,317,083) |
| Long-term | (14,908,277) |
| Total capital loss carryforward | $(38,225,360) |
The tax character of distributions paid was as follows:
| September 30, 2019 | September 30, 2018 | |
| Ordinary Income | $21,821,182 | $ 33,187,685 |
| Long-term Capital Gains | 43,679,628 | 19,602,542 |
| Total | $65,500,810 | $ 52,790,227 |
Restricted Securities. The Fund may invest in securities that are subject to legal or contractual restrictions on resale. These securities generally may be resold in transactions exempt from registration or to the public if the securities are registered. Disposal of these securities may involve time-consuming negotiations and expense, and prompt sale at an acceptable price may be difficult. Information regarding restricted securities is included at the end of the Fund's Schedule of Investments.
New Rule Issuance. During August 2018, the U.S. Securities and Exchange Commission issued Final Rule Release No. 33-10532, Disclosure Update and Simplification. This Final Rule includes amendments specific to registered investment companies that are intended to eliminate overlap in disclosure requirements between Regulation S-X and GAAP. In accordance with these amendments, certain line-items in the Fund's financial statements have been combined or removed for the current period as outlined in the table below.
| Financial Statement | Current Line-Item Presentation (As Applicable) | Prior Line-Item Presentation (As Applicable) |
| Statement of Assets and Liabilities | Total distributable earnings (loss) | Undistributed/Distributions in excess of/Accumulated net investment income (loss) Accumulated/Undistributed net realized gain (loss) Net unrealized appreciation (depreciation) |
| Statement of Changes in Net Assets | N/A - removed | Undistributed/Distributions in excess of/Accumulated net investment income (loss) end of period |
| Statement of Changes in Net Assets | Distributions to shareholders | Distributions to shareholders from net investment income Distributions to shareholders from net realized gain |
4. Derivative Instruments.
Risk Exposures and the Use of Derivative Instruments. The Fund's investment objective allows the Fund to enter into various types of derivative contracts, including futures contracts. Derivatives are investments whose value is primarily derived from underlying assets, indices or reference rates and may be transacted on an exchange or over-the-counter (OTC). Derivatives may involve a future commitment to buy or sell a specified asset based on specified terms, to exchange future cash flows at periodic intervals based on a notional principal amount, or for one party to make one or more payments upon the occurrence of specified events in exchange for periodic payments from the other party.
The Fund used derivatives to increase returns and to manage exposure to certain risks as defined below. The success of any strategy involving derivatives depends on analysis of numerous economic factors, and if the strategies for investment do not work as intended, the Fund may not achieve its objectives.
The Fund's use of derivatives increased or decreased its exposure to the following risk:
| Equity Risk | Equity risk relates to the fluctuations in the value of financial instruments as a result of changes in market prices (other than those arising from interest rate risk or foreign exchange risk), whether caused by factors specific to an individual investment, its issuer, or all factors affecting all instruments traded in a market or market segment. |
The Fund is also exposed to additional risks from investing in derivatives, such as liquidity risk and counterparty credit risk. Liquidity risk is the risk that the Fund will be unable to close out the derivative in the open market in a timely manner. Counterparty credit risk is the risk that the counterparty will not be able to fulfill its obligation to the Fund. Counterparty credit risk related to exchange-traded futures contracts may be mitigated by the protection provided by the exchange on which they trade.
Investing in derivatives may involve greater risks than investing in the underlying assets directly and, to varying degrees, may involve risk of loss in excess of any initial investment and collateral received and amounts recognized in the Statement of Assets and Liabilities. In addition, there may be the risk that the change in value of the derivative contract does not correspond to the change in value of the underlying instrument.
Futures Contracts. A futures contract is an agreement between two parties to buy or sell a specified underlying instrument for a fixed price at a specified future date. The Fund used futures contracts to manage its exposure to the stock market.
Upon entering into a futures contract, a fund is required to deposit either cash or securities (initial margin) with a clearing broker in an amount equal to a certain percentage of the face value of the contract. Futures contracts are marked-to-market daily and subsequent daily payments (variation margin) are made or received by a fund depending on the daily fluctuations in the value of the futures contracts and are recorded as unrealized appreciation or (depreciation). This receivable and/or payable, if any, is included in daily variation margin on futures contracts in the Statement of Assets and Liabilities. Realized gain or (loss) is recorded upon the expiration or closing of a futures contract. The net realized gain (loss) and change in net unrealized appreciation (depreciation) on futures contracts during the period is presented in the Statement of Operations.
Any open futures contracts at period end are presented in the Schedule of Investments under the caption "Futures Contracts". The notional amount at value reflects each contract's exposure to the underlying instrument or index at period end. Securities deposited to meet initial margin requirements are identified in the Schedule of Investments.
5. Purchases and Sales of Investments.
Purchases and sales of securities, other than short-term securities, aggregated $1,724,695,084 and $608,891,347, respectively.
6. Fees and Other Transactions with Affiliates.
Management Fee and Expense Contract. FMR Co., Inc. (the investment adviser), an affiliate of FMR, provides the Fund with investment management services. The Fund does not pay any fees for these services. Pursuant to the Fund's management contract with the investment adviser, FMR pays the investment adviser a portion of the management fees it receives from the Investing Funds. In addition, under an expense contract, FMR also pays all other expenses of the Fund, excluding custody fees, the compensation of the independent Directors, and certain miscellaneous expenses such as proxy and shareholder meeting expenses.
Brokerage Commissions. The Fund placed a portion of its portfolio transactions with brokerage firms which are affiliates of the investment adviser. Brokerage commissions are included in net realized gain (loss) and change in net unrealized appreciation (depreciation) in the Statement of Operations. The commissions paid to these affiliated firms were $9,517 for the period.
Interfund Trades. The Fund may purchase from or sell securities to other Fidelity Funds under procedures adopted by the Board. The procedures have been designed to ensure these interfund trades are executed in accordance with Rule 17a-7 of the 1940 Act. Interfund trades are included within the respective purchases and sales amounts shown in the Purchases and Sales of Investments note.
Other. During the period, the investment adviser reimbursed the Fund for certain losses in the amount of $13,918.
7. Security Lending.
The Fund lends portfolio securities from time to time in order to earn additional income. For equity securities, lending agents are used, including National Financial Services (NFS), an affiliate of the Fund. Pursuant to a securities lending agreement, NFS will receive a fee, which is capped at 9.9% of daily lending revenue, for its services as lending agent The Fund may lend securities to certain qualified borrowers, including NFS. On the settlement date of the loan, the Fund receives collateral (in the form of U.S. Treasury obligations, letters of credit and/or cash) against the loaned securities and maintains collateral in an amount not less than 100% of the market value of the loaned securities during the period of the loan. The market value of the loaned securities is determined at the close of business of the Fund and any additional required collateral is delivered to the Fund on the next business day. The Fund or borrower may terminate the loan at any time, and if the borrower defaults on its obligation to return the securities loaned because of insolvency or other reasons, the Fund may apply collateral received from the borrower against the obligation. The Fund may experience delays and costs in recovering the securities loaned. Any cash collateral received is invested in the Fidelity Securities Lending Cash Central Fund. The value of loaned securities and cash collateral at period end are disclosed on the Fund's Statement of Assets and Liabilities. At period end, there were no security loans outstanding with NFS, as affiliated borrower. Total fees paid by the Fund to NFS, as lending agent, amounted to $4,605. Security lending income represents the income earned on investing cash collateral, less rebates paid to borrowers and any lending agent fees associated with the loan, plus any premium payments received for lending certain types of securities. Security lending income is presented in the Statement of Operations as a component of income from Fidelity Central Funds, and includes $132 from securities loaned to NFS, as affiliated borrower.
8. Other.
The Fund's organizational documents provide former and current directors and officers with a limited indemnification against liabilities arising in connection with the performance of their duties to the Fund. In the normal course of business, the Fund may also enter into contracts that provide general indemnifications. The Fund's maximum exposure under these arrangements is unknown as this would be dependent on future claims that may be made against the Fund. The risk of material loss from such claims is considered remote.
At the end of the period, mutual funds managed by FMR or its affiliates were the owners of record of all of the outstanding shares of the Fund.
Report of Independent Registered Public Accounting Firm
To the Trustees of Fidelity Central Investment Portfolios LLC and the Shareholders of Fidelity Emerging Markets Equity Central Fund:
Opinion on the Financial Statements and Financial Highlights
We have audited the accompanying statement of assets and liabilities of Fidelity Emerging Markets Equity Central Fund (the "Fund"), a fund of Fidelity Central Investment Portfolios LLC, including the schedule of investments, as of September 30, 2019, the related statement of operations for the year then ended, the statement of changes in net assets for each of the two years in the period then ended, the financial highlights for each of the five years in the period then ended, and the related notes. In our opinion, the financial statements and financial highlights present fairly, in all material respects, the financial position of the Fund as of September 30, 2019, the results of its operations for the year then ended, the changes in its net assets for each of the two years in the period then ended, and the financial highlights for each of the five years in the period then ended in conformity with accounting principles generally accepted in the United States of America.
Basis for Opinion
These financial statements and financial highlights are the responsibility of the Fund's management. Our responsibility is to express an opinion on the Fund's financial statements and financial highlights based on our audits. We are a public accounting firm registered with the Public Company Accounting Oversight Board (United States) (PCAOB) and are required to be independent with respect to the Fund in accordance with the U.S. federal securities laws and the applicable rules and regulations of the Securities and Exchange Commission and the PCAOB.
We conducted our audits in accordance with the standards of the PCAOB. Those standards require that we plan and perform the audit to obtain reasonable assurance about whether the financial statements and financial highlights are free of material misstatement, whether due to error or fraud. The Fund is not required to have, nor were we engaged to perform, an audit of its internal control over financial reporting. As part of our audits we are required to obtain an understanding of internal control over financial reporting but not for the purpose of expressing an opinion on the effectiveness of the Fund’s internal control over financial reporting. Accordingly, we express no such opinion.
Our audits included performing procedures to assess the risks of material misstatement of the financial statements and financial highlights, whether due to error or fraud, and performing procedures that respond to those risks. Such procedures included examining, on a test basis, evidence regarding the amounts and disclosures in the financial statements and financial highlights. Our audits also included evaluating the accounting principles used and significant estimates made by management, as well as evaluating the overall presentation of the financial statements and financial highlights. Our procedures included confirmation of securities owned as of September 30, 2019, by correspondence with the custodians and brokers; when replies were not received from brokers, we performed other auditing procedures. We believe that our audits provide a reasonable basis for our opinion.
/s/ Deloitte & Touche LLP
Boston, Massachusetts
November 12, 2019
We have served as the auditor of one or more of the Fidelity investment companies since 1999.
Directors and Officers (Trustees and Officers)
The Trustees, Members of the Advisory Board (if any), and officers of the Fidelity Central Investment Portfolios LLC and fund, as applicable, are listed below. The Board of Trustees governs the fund and is responsible for protecting the interests of shareholders. The Trustees are experienced executives who meet periodically throughout the year to oversee the fund's activities, review contractual arrangements with companies that provide services to the fund, oversee management of the risks associated with such activities and contractual arrangements, and review the fund's performance. Except for Michael E. Wiley, each of the Trustees oversees 298 funds. Mr. Wiley oversees 197 funds.
The Trustees hold office without limit in time except that (a) any Trustee may resign; (b) any Trustee may be removed by written instrument, signed by at least two-thirds of the number of Trustees prior to such removal; (c) any Trustee who requests to be retired or who has become incapacitated by illness or injury may be retired by written instrument signed by a majority of the other Trustees; and (d) any Trustee may be removed at any special meeting of shareholders by a two-thirds vote of the outstanding voting securities of the trust. Each Trustee who is not an interested person (as defined in the 1940 Act) of the trust and the fund is referred to herein as an Independent Trustee. Each Independent Trustee shall retire not later than the last day of the calendar year in which his or her 75th birthday occurs. The Independent Trustees may waive this mandatory retirement age policy with respect to individual Trustees. Officers and Advisory Board Members hold office without limit in time, except that any officer or Advisory Board Member may resign or may be removed by a vote of a majority of the Trustees at any regular meeting or any special meeting of the Trustees. Except as indicated, each individual has held the office shown or other offices in the same company for the past five years.
The fund’s Statement of Additional Information (SAI) includes more information about the Trustees. To request a free copy, call Fidelity at 1-800-544-8544.
Experience, Skills, Attributes, and Qualifications of the Trustees. The Governance and Nominating Committee has adopted a statement of policy that describes the experience, qualifications, attributes, and skills that are necessary and desirable for potential Independent Trustee candidates (Statement of Policy). The Board believes that each Trustee satisfied at the time he or she was initially elected or appointed a Trustee, and continues to satisfy, the standards contemplated by the Statement of Policy. The Governance and Nominating Committee also engages professional search firms to help identify potential Independent Trustee candidates who have the experience, qualifications, attributes, and skills consistent with the Statement of Policy. From time to time, additional criteria based on the composition and skills of the current Independent Trustees, as well as experience or skills that may be appropriate in light of future changes to board composition, business conditions, and regulatory or other developments, have also been considered by the professional search firms and the Governance and Nominating Committee. In addition, the Board takes into account the Trustees' commitment and participation in Board and committee meetings, as well as their leadership of standing and ad hoc committees throughout their tenure.
In determining that a particular Trustee was and continues to be qualified to serve as a Trustee, the Board has considered a variety of criteria, none of which, in isolation, was controlling. The Board believes that, collectively, the Trustees have balanced and diverse experience, qualifications, attributes, and skills, which allow the Board to operate effectively in governing the fund and protecting the interests of shareholders. Information about the specific experience, skills, attributes, and qualifications of each Trustee, which in each case led to the Board's conclusion that the Trustee should serve (or continue to serve) as a trustee of the fund, is provided below.
Board Structure and Oversight Function. James C. Curvey is an interested person and currently serves as Chairman. The Trustees have determined that an interested Chairman is appropriate and benefits shareholders because an interested Chairman has a personal and professional stake in the quality and continuity of services provided to the fund. Independent Trustees exercise their informed business judgment to appoint an individual of their choosing to serve as Chairman, regardless of whether the Trustee happens to be independent or a member of management. The Independent Trustees have determined that they can act independently and effectively without having an Independent Trustee serve as Chairman and that a key structural component for assuring that they are in a position to do so is for the Independent Trustees to constitute a substantial majority for the Board. The Independent Trustees also regularly meet in executive session. Ned C. Lautenbach serves as Chairman of the Independent Trustees and as such (i) acts as a liaison between the Independent Trustees and management with respect to matters important to the Independent Trustees and (ii) with management prepares agendas for Board meetings.
Fidelity® funds are overseen by different Boards of Trustees. The fund's Board oversees Fidelity's high income and certain equity funds, and other Boards oversee Fidelity's investment-grade bond, money market, asset allocation, and other equity funds. The asset allocation funds may invest in Fidelity® funds overseen by the fund's Board. The use of separate Boards, each with its own committee structure, allows the Trustees of each group of Fidelity® funds to focus on the unique issues of the funds they oversee, including common research, investment, and operational issues. On occasion, the separate Boards establish joint committees to address issues of overlapping consequences for the Fidelity® funds overseen by each Board.
The Trustees operate using a system of committees to facilitate the timely and efficient consideration of all matters of importance to the Trustees, the fund, and fund shareholders and to facilitate compliance with legal and regulatory requirements and oversight of the fund's activities and associated risks. The Board, acting through its committees, has charged FMR and its affiliates with (i) identifying events or circumstances the occurrence of which could have demonstrably adverse effects on the fund's business and/or reputation; (ii) implementing processes and controls to lessen the possibility that such events or circumstances occur or to mitigate the effects of such events or circumstances if they do occur; and (iii) creating and maintaining a system designed to evaluate continuously business and market conditions in order to facilitate the identification and implementation processes described in (i) and (ii) above. Because the day-to-day operations and activities of the fund are carried out by or through FMR, its affiliates, and other service providers, the fund's exposure to risks is mitigated but not eliminated by the processes overseen by the Trustees. While each of the Board's committees has responsibility for overseeing different aspects of the fund's activities, oversight is exercised primarily through the Operations, Audit, and Compliance Committees. Appropriate personnel, including but not limited to the fund's Chief Compliance Officer (CCO), FMR's internal auditor, the independent accountants, the fund's Treasurer and portfolio management personnel, make periodic reports to the Board's committees, as appropriate, including an annual review of Fidelity's risk management program for the Fidelity® funds. The responsibilities of each standing committee, including their oversight responsibilities, are described further under "Standing Committees of the Trustees."
Interested Trustees*:
Correspondence intended for a Trustee who is an interested person may be sent to Fidelity Investments, 245 Summer Street, Boston, Massachusetts 02210.
Name, Year of Birth; Principal Occupations and Other Relevant Experience+
James C. Curvey (1935)
Year of Election or Appointment: 2007
Trustee
Chairman of the Board of Trustees
Mr. Curvey also serves as Trustee of other Fidelity® funds. Mr. Curvey is Vice Chairman (2007-present) and Director of FMR LLC (diversified financial services company). In addition, Mr. Curvey is an Overseer Emeritus for the Boston Symphony Orchestra, a Director of Artis-Naples, and a Trustee of Brewster Academy in Wolfeboro, New Hampshire. Previously, Mr. Curvey served as a Director of Fidelity Research & Analysis Co. (investment adviser firm, 2009-2018), Director of Fidelity Investments Money Management, Inc. (investment adviser firm, 2009-2014) and a Director of FMR and FMR Co., Inc. (investment adviser firms, 2007-2014).
* Determined to be an “Interested Trustee” by virtue of, among other things, his or her affiliation with the Fidelity Central Investment Portfolios LLC or various entities under common control with FMR.
+ The information includes the Trustee's principal occupation during the last five years and other information relating to the experience, attributes, and skills relevant to the Trustee's qualifications to serve as a Trustee, which led to the conclusion that the Trustee should serve as a Trustee for the fund.
Independent Trustees:
Correspondence intended for an Independent Trustee may be sent to Fidelity Investments, P.O. Box 55235, Boston, Massachusetts 02205-5235.
Name, Year of Birth; Principal Occupations and Other Relevant Experience+
Dennis J. Dirks (1948)
Year of Election or Appointment: 2005
Trustee
Mr. Dirks also serves as Trustee of other Fidelity® funds. Prior to his retirement in May 2003, Mr. Dirks was Chief Operating Officer and a member of the Board of The Depository Trust & Clearing Corporation (DTCC). He also served as President, Chief Operating Officer, and Board member of The Depository Trust Company (DTC) and President and Board member of the National Securities Clearing Corporation (NSCC). In addition, Mr. Dirks served as Chief Executive Officer and Board member of the Government Securities Clearing Corporation, Chief Executive Officer and Board member of the Mortgage-Backed Securities Clearing Corporation, as a Trustee and a member of the Finance Committee of Manhattan College (2005-2008), as a Trustee and a member of the Finance Committee of AHRC of Nassau County (2006-2008), as a member of the Independent Directors Council (IDC) Governing Council (2010-2015), and as a member of the Board of Directors for The Brookville Center for Children’s Services, Inc. (2009-2017). Mr. Dirks is a member of the Finance Committee (2016-present) and Board of Directors (2017-present) and is Treasurer (2018-present) of the Asolo Repertory Theatre.
Donald F. Donahue (1950)
Year of Election or Appointment: 2018
Trustee
Mr. Donahue also serves as a Trustee of other Fidelity® funds. Mr. Donahue is President and Chief Executive Officer of Miranda Partners, LLC (risk consulting for the financial services industry, 2012-present). Previously, Mr. Donahue served as a Member of the Advisory Board of certain Fidelity® funds (2015-2018) and Chief Executive Officer (2006-2012), Chief Operating Officer (2003-2006), and Managing Director, Customer Marketing and Development (1999-2003) of The Depository Trust & Clearing Corporation (financial markets infrastructure). Mr. Donahue serves as a Member (2007-present) and Co-Chairman (2016-present) of the Board of Directors of United Way of New York, Member of the Board of Directors of NYC Leadership Academy (2012-present) and Member of the Board of Advisors of Ripple Labs, Inc. (financial services, 2015-present). He also served as Chairman (2010-2012) and Member of the Board of Directors (2012-2013) of Omgeo, LLC (financial services), Treasurer of United Way of New York (2012-2016), and Member of the Board of Directors of XBRL US (financial services non-profit, 2009-2012) and the International Securities Services Association (2009-2012).
Alan J. Lacy (1953)
Year of Election or Appointment: 2008
Trustee
Mr. Lacy also serves as Trustee of other Fidelity® funds. Mr. Lacy serves as a Director of Bristol-Myers Squibb Company (global pharmaceuticals, 2008-present). He is a Trustee of the California Chapter of The Nature Conservancy (2015-present) and a Director of the Center for Advanced Study in the Behavioral Sciences at Stanford University (2015-present). In addition, Mr. Lacy served as Senior Adviser (2007-2014) of Oak Hill Capital Partners, L.P. (private equity) and also served as Chief Executive Officer (2005) and Vice Chairman (2005-2006) of Sears Holdings Corporation (retail) and Chief Executive Officer and Chairman of the Board of Sears, Roebuck and Co. (retail, 2000-2005). Previously, Mr. Lacy served as Chairman (2014-2017) and a member (2010-2017) of the Board of Directors of Dave & Buster’s Entertainment, Inc. (restaurant and entertainment complexes), as Chairman (2008-2011) and a member (2006-2015) of the Board of Trustees of the National Parks Conservation Association, and as a member of the Board of Directors for The Hillman Companies, Inc. (hardware wholesalers, 2010-2014), Earth Fare, Inc. (retail grocery, 2010-2014), and The Western Union Company (global money transfer, 2006-2011).
Ned C. Lautenbach (1944)
Year of Election or Appointment: 2004
Trustee
Chairman of the Independent Trustees
Mr. Lautenbach also serves as Trustee of other Fidelity® funds. Mr. Lautenbach currently serves as Chair (2018-present) and Member (2013-present) of the Board of Governors, State University System of Florida and is a member of the Council on Foreign Relations (1994-present). He is also a member and has most recently served as Chairman of the Board of Directors of Artis-Naples (2012-present). Previously, Mr. Lautenbach served as a member and then Lead Director of the Board of Directors of Eaton Corporation (diversified industrial, 1997-2016). He was also a Partner and Advisory Partner at Clayton, Dubilier & Rice, LLC (private equity investment, 1998-2010), as well as a Director of Sony Corporation (2006-2007). In addition, Mr. Lautenbach also had a 30-year career with IBM (technology company) during which time he served as Senior Vice President and a member of the Corporate Executive Committee (1968-1998).
Joseph Mauriello (1944)
Year of Election or Appointment: 2008
Trustee
Mr. Mauriello also serves as Trustee of other Fidelity® funds. Prior to his retirement in January 2006, Mr. Mauriello served in numerous senior management positions including Deputy Chairman and Chief Operating Officer (2004-2005), and Vice Chairman of Financial Services (2002-2004) of KPMG LLP US (professional services, 1965-2005). Mr. Mauriello currently serves as a member of the Independent Directors Council (IDC) Governing Council (2015-present). Previously, Mr. Mauriello served as a member of the Board of Directors of XL Group plc. (global insurance and re-insurance, 2006-2018).
Cornelia M. Small (1944)
Year of Election or Appointment: 2005
Trustee
Ms. Small also serves as Trustee of other Fidelity® funds. Ms. Small is a member of the Board of Directors (2009-present) and Chair of the Investment Committee (2010-present) of the Teagle Foundation. Ms. Small also serves on the Investment Committee of the Berkshire Taconic Community Foundation (2008-present). Previously, Ms. Small served as Chairperson (2002-2008) and a member of the Investment Committee and Chairperson (2008-2012) and a member of the Board of Trustees of Smith College. In addition, Ms. Small served as Chief Investment Officer, Director of Global Equity Investments, and a member of the Board of Directors of Scudder, Stevens & Clark and Scudder Kemper Investments.
Garnett A. Smith (1947)
Year of Election or Appointment: 2018
Trustee
Mr. Smith also serves as Trustee of other Fidelity® funds. Prior to Mr. Smith's retirement, he served as Chairman and Chief Executive Officer of Inbrand Corp. (manufacturer of personal absorbent products, 1990-1997). He also served as President (1986-1990) of Inbrand Corp. Prior to his employment with Inbrand Corp., he was employed by a retail fabric chain and North Carolina National Bank. In addition, Mr. Smith served as a Member of the Advisory Board of certain Fidelity® funds (2012-2013) and as a board member of the Jackson Hole Land Trust (2009-2012).
David M. Thomas (1949)
Year of Election or Appointment: 2008
Trustee
Mr. Thomas also serves as Trustee of other Fidelity® funds. Mr. Thomas serves as Non-Executive Chairman of the Board of Directors of Fortune Brands Home and Security (home and security products, 2011-present) and as a member of the Board of Directors (2004-present) and Presiding Director (2013-present) of Interpublic Group of Companies, Inc. (marketing communication). Previously, Mr. Thomas served as Executive Chairman (2005-2006) and Chairman and Chief Executive Officer (2000-2005) of IMS Health, Inc. (pharmaceutical and healthcare information solutions), a Director of Fortune Brands, Inc. (consumer products, 2000-2011), and a member of the Board of Trustees of the University of Florida (2013-2018).
Michael E. Wiley (1950)
Year of Election or Appointment: 2018
Trustee
Mr. Wiley also serves as Trustee or Member of the Advisory Board of other Fidelity® funds. Mr. Wiley serves as a Director of High Point Resources (exploration and production, 2005-present). Previously, Mr. Wiley served as a Director of Andeavor Corporation (independent oil refiner and marketer, 2005-2018), a Director of Andeavor Logistics LP (natural resources logistics, 2015-2018), a Director of Post Oak Bank (privately-held bank, 2004-2018), a Director of Asia Pacific Exploration Consolidated (international oil and gas exploration and production, 2008-2013), a member of the Board of Trustees of the University of Tulsa (2000-2006; 2007-2010), a Senior Energy Advisor of Katzenbach Partners, LLC (consulting, 2006-2007), an Advisory Director of Riverstone Holdings (private investment), a Director of Spinnaker Exploration Company (exploration and production, 2001-2005) and Chairman, President, and CEO of Baker Hughes, Inc. (oilfield services, 2000-2004).
+ The information includes the Trustee's principal occupation during the last five years and other information relating to the experience, attributes, and skills relevant to the Trustee's qualifications to serve as a Trustee, which led to the conclusion that the Trustee should serve as a Trustee for the fund.
Advisory Board Members and Officers:
Correspondence intended for a Member of the Advisory Board (if any) may be sent to Fidelity Investments, P.O. Box 55235, Boston, Massachusetts 02205-5235. Correspondence intended for an officer or Peter S. Lynch may be sent to Fidelity Investments, 245 Summer Street, Boston, Massachusetts 02210. Officers appear below in alphabetical order.
Name, Year of Birth; Principal Occupation
Vicki L. Fuller (1957)
Year of Election or Appointment: 2018
Member of the Advisory Board
Ms. Fuller also serves as Member of the Advisory Board of other Fidelity® funds. Ms. Fuller serves as a member of the Board of Directors, Audit Committee, and Nominating and Governance Committee of The Williams Companies, Inc. (natural gas infrastructure, 2018-present). Previously, Ms. Fuller served as the Chief Investment Officer of the New York State Common Retirement Fund (2012-2018) and held a variety of positions at AllianceBernstein L.P. (global asset management, 1985-2012), including Managing Director (2006-2012) and Senior Vice President and Senior Portfolio Manager (2001-2006).
Peter S. Lynch (1944)
Year of Election or Appointment: 2004
Member of the Advisory Board
Mr. Lynch also serves as Member of the Advisory Board of other Fidelity® funds. Mr. Lynch is Vice Chairman and a Director of FMR (investment adviser firm) and FMR Co., Inc. (investment adviser firm). In addition, Mr. Lynch serves as a Trustee of Boston College and as the Chairman of the Inner-City Scholarship Fund. Previously, Mr. Lynch served on the Special Olympics International Board of Directors (1997-2006).
Elizabeth Paige Baumann (1968)
Year of Election or Appointment: 2017
Anti-Money Laundering (AML) Officer
Ms. Baumann also serves as AML Officer of other funds. She is Chief AML Officer (2012-present) and Senior Vice President (2014-present) of FMR LLC (diversified financial services company) and is an employee of Fidelity Investments. Previously, Ms. Baumann served as AML Officer of the funds (2012-2016), and Vice President (2007-2014) and Deputy Anti-Money Laundering Officer (2007-2012) of FMR LLC.
Craig S. Brown (1977)
Year of Election or Appointment: 2019
Assistant Treasurer
Mr. Brown also serves as Assistant Treasurer of other funds. Mr. Brown is an employee of Fidelity Investments (2013-present).
John J. Burke III (1964)
Year of Election or Appointment: 2018
Chief Financial Officer
Mr. Burke also serves as Chief Financial Officer of other funds. Mr. Burke serves as Head of Investment Operations for Fidelity Fund and Investment Operations (2018-present) and is an employee of Fidelity Investments (1998-present). Previously Mr. Burke served as head of Asset Management Investment Operations (2012-2018).
William C. Coffey (1969)
Year of Election or Appointment: 2019
Assistant Secretary
Mr. Coffey also serves as Assistant Secretary of other funds. He is Senior Vice President and Deputy General Counsel of FMR LLC (diversified financial services company, 2010-present), and is an employee of Fidelity Investments. Previously, Mr. Coffey served as Secretary and CLO of certain funds (2018-2019); CLO, Secretary, and Senior Vice President of Fidelity Management & Research Company and FMR Co., Inc. (investment adviser firms, 2018-2019); Secretary of Fidelity SelectCo, LLC and Fidelity Investments Money Management, Inc. (investment adviser firms, 2018-2019); CLO of Fidelity Management & Research (Hong Kong) Limited, FMR Investment Management (UK) Limited, and Fidelity Management & Research (Japan) Limited (investment adviser firms, 2018-2019); and Assistant Secretary of certain funds (2009-2018).
Timothy M. Cohen (1969)
Year of Election or Appointment: 2018
Vice President
Mr. Cohen also serves as Vice President of other funds. Mr. Cohen serves as Executive Vice President of Fidelity SelectCo, LLC (2019-present), Co-Head of Equity (2018-present), a Director of Fidelity Management & Research (Japan) Limited (investment adviser firm, 2016-present), and is an employee of Fidelity Investments. Previously, Mr. Cohen served as Head of Global Equity Research (2016-2018), Chief Investment Officer - Equity and a Director of Fidelity Management & Research (U.K.) Inc. (investment adviser firm, 2013-2015) and as a Director of Fidelity Management & Research (Hong Kong) Limited (investment adviser firm, 2017).
Jonathan Davis (1968)
Year of Election or Appointment: 2010
Assistant Treasurer
Mr. Davis also serves as Assistant Treasurer of other funds. Mr. Davis serves as Assistant Treasurer of FMR Capital, Inc. (2017-present) and is an employee of Fidelity Investments. Previously, Mr. Davis served as Vice President and Associate General Counsel of FMR LLC (diversified financial services company, 2003-2010).
Adrien E. Deberghes (1967)
Year of Election or Appointment: 2016
Assistant Treasurer
Mr. Deberghes also serves as an officer of other funds. He serves as Assistant Treasurer of FMR Capital, Inc. (2017-present), Executive Vice President of Fidelity Investments Money Management, Inc. (FIMM) (investment adviser firm, 2016-present), and is an employee of Fidelity Investments (2008-present). Previously, Mr. Deberghes served as President and Treasurer of certain Fidelity® funds (2013-2018). Prior to joining Fidelity Investments, Mr. Deberghes was Senior Vice President of Mutual Fund Administration at State Street Corporation (2007-2008), Senior Director of Mutual Fund Administration at Investors Bank & Trust (2005-2007), and Director of Finance for Dunkin' Brands (2000-2005). Previously, Mr. Deberghes served in other fund officer roles.
Laura M. Del Prato (1964)
Year of Election or Appointment: 2018
Assistant Treasurer
Ms. Del Prato also serves as an officer of other funds. Ms. Del Prato is an employee of Fidelity Investments (2017-present). Prior to joining Fidelity Investments, Ms. Del Prato served as a Managing Director and Treasurer of the JPMorgan Mutual Funds (2014-2017). Prior to JPMorgan, Ms. Del Prato served as a partner at Cohen Fund Audit Services (accounting firm, 2012-2013) and KPMG LLP (accounting firm, 2004-2012).
Colm A. Hogan (1973)
Year of Election or Appointment: 2016
Deputy Treasurer
Mr. Hogan also serves as an officer of other funds. Mr. Hogan serves as Assistant Treasurer of FMR Capital, Inc. (2017-present) and is an employee of Fidelity Investments (2005-present). Previously, Mr. Hogan served as Assistant Treasurer of certain Fidelity® funds (2016-2018).
Pamela R. Holding (1964)
Year of Election or Appointment: 2018
Vice President
Ms. Holding also serves as Vice President of other funds. Ms. Holding serves as Executive Vice President of Fidelity SelectCo, LLC (2019-present), Co-Head of Equity (2018-present) and is an employee of Fidelity Investments (2013-present). Previously, Ms. Holding served as Chief Investment Officer of Fidelity Institutional Asset Management (2013-2018).
Cynthia Lo Bessette (1969)
Year of Election or Appointment: 2019
Secretary and Chief Legal Officer (CLO)
Ms. Lo Bessette also serves as Secretary and CLO of other funds. Ms. Lo Bessette serves as CLO, Secretary, and Senior Vice President of Fidelity Management & Research Company and FMR Co., Inc. (investment adviser firms, 2019-present); Secretary of Fidelity SelectCo, LLC and Fidelity Investments Money Management, Inc. (investment adviser firms, 2019-present); and CLO of Fidelity Management & Research (Hong Kong) Limited, FMR Investment Management (UK) Limited, and Fidelity Management & Research (Japan) Limited (investment adviser firms, 2019-present). She is a Senior Vice President and Deputy General Counsel of FMR LLC (diversified financial services company, 2019-present), and is an employee of Fidelity Investments. Previously, Ms. Lo Bessette served as Executive Vice President, General Counsel (2016-2019) and Senior Vice President, Deputy General Counsel (2015-2016) of OppenheimerFunds (investment management company) and Deputy Chief Legal Officer (2013-2015) of Jennison Associates LLC (investment adviser firm).
Chris Maher (1972)
Year of Election or Appointment: 2013
Assistant Treasurer
Mr. Maher serves as Assistant Treasurer of other funds. Mr. Maher is Vice President of Valuation Oversight, serves as Assistant Treasurer of FMR Capital, Inc. (2017-present), and is an employee of Fidelity Investments. Previously, Mr. Maher served as Vice President of Asset Management Compliance (2013), Vice President of the Program Management Group of FMR (investment adviser firm, 2010-2013), and Vice President of Valuation Oversight (2008-2010).
Kenneth B. Robins (1969)
Year of Election or Appointment: 2016
Chief Compliance Officer
Mr. Robins also serves as an officer of other funds. Mr. Robins serves as Compliance Officer of Fidelity Management & Research Company and FMR Co., Inc. (investment adviser firms, 2016-present) and is an employee of Fidelity Investments (2004-present). Previously, Mr. Robins served as Executive Vice President of Fidelity Investments Money Management, Inc. (investment adviser firm, 2013-2016) and served in other fund officer roles.
Stacie M. Smith (1974)
Year of Election or Appointment: 2016
President and Treasurer
Ms. Smith also serves as an officer of other funds. Ms. Smith serves as Assistant Treasurer of FMR Capital, Inc. (2017-present), is an employee of Fidelity Investments (2009-present), and has served in other fund officer roles. Prior to joining Fidelity Investments, Ms. Smith served as Senior Audit Manager of Ernst & Young LLP (accounting firm, 1996-2009). Previously, Ms. Smith served as Assistant Treasurer (2013-2018) and Deputy Treasurer (2013-2016) of certain Fidelity® funds.
Marc L. Spector (1972)
Year of Election or Appointment: 2016
Assistant Treasurer
Mr. Spector also serves as an officer of other funds. Mr. Spector serves as Assistant Treasurer of FMR Capital, Inc. (2017-present) and is an employee of Fidelity Investments (2016-present). Prior to joining Fidelity Investments, Mr. Spector served as Director at the Siegfried Group (accounting firm, 2013-2016), and prior to Siegfried Group as audit senior manager at Deloitte & Touche (accounting firm, 2005-2013).
Jim Wegmann (1979)
Year of Election or Appointment: 2019
Assistant Treasurer
Mr. Wegmann also serves as Assistant Treasurer of other funds. Mr. Wegmann is an employee of Fidelity Investments (2011-present).
Shareholder Expense Example
As a shareholder of the Fund, you incur two types of costs: (1) transaction costs and (2) ongoing costs, including other Fund expenses. This Example is intended to help you understand your ongoing costs (in dollars) of investing in the Fund and to compare these costs with the ongoing costs of investing in other mutual funds.
The Example is based on an investment of $1,000 invested at the beginning of the period and held for the entire period (April 1, 2019 to September 30, 2019).
Actual Expenses
The first line of the accompanying table provides information about actual account values and actual expenses. You may use the information in this line, together with the amount you invested, to estimate the expenses that you paid over the period. Simply divide your account value by $1,000.00 (for example, an $8,600 account value divided by $1,000.00 = 8.6), then multiply the result by the number in the first line under the heading entitled "Expenses Paid During Period" to estimate the expenses you paid on your account during this period. In addition, the Fund, as a shareholder in the underlying Fidelity Central Funds, will indirectly bear its pro-rata share of the fees and expenses incurred by the underlying Fidelity Central Funds. These fees and expenses are not included in the Fund's annualized expense ratio used to calculate the expense estimate in the table below.
Hypothetical Example for Comparison Purposes
The second line of the accompanying table provides information about hypothetical account values and hypothetical expenses based on the Fund's actual expense ratio and an assumed rate of return of 5% per year before expenses, which is not the Fund's actual return. The hypothetical account values and expenses may not be used to estimate the actual ending account balance or expenses you paid for the period. You may use this information to compare the ongoing costs of investing in the Fund and other funds. To do so, compare this 5% hypothetical example with the 5% hypothetical examples that appear in the shareholder reports of the other funds. In addition, the Fund, as a shareholder in the underlying Fidelity Central Funds, will indirectly bear its pro-rata share of the fees and expenses incurred by the underlying Fidelity Central Funds. These fees and expenses are not included in the Fund's annualized expense ratio used to calculate the expense estimate in the table below.
Please note that the expenses shown in the table are meant to highlight your ongoing costs only and do not reflect any transaction costs. Therefore, the second line of the table is useful in comparing ongoing costs only, and will not help you determine the relative total costs of owning different funds.
| Annualized Expense Ratio-A | Beginning Account Value April 1, 2019 | Ending Account Value September 30, 2019 | Expenses Paid During Period-B April 1, 2019 to September 30, 2019 | |
| Actual | .0479% | $1,000.00 | $1,001.40 | $.24 |
| Hypothetical-C | $1,000.00 | $1,024.83 | $.24 |
A Annualized expense ratio reflects expenses net of applicable fee waivers.
B Expenses are equal to the Fund's annualized expense ratio, multiplied by the average account value over the period, multiplied by 183/365 (to reflect the one-half year period).
C 5% return per year before expenses
Distributions (Unaudited)
A percentage of the dividends distributed during the fiscal year for the fund may be taken into account as a dividend for purposes of the maximum rate under section 1(h)(11) of the Internal Revenue Code:
| October 2018 | 0% |
| November 2018 | 19% |
| December 2018 | 64% |
| February 2019 | 100% |
| March 2019 | 100% |
| April 2019 | 100% |
| May 2019 | 100% |
| June 2019 | 100% |
| July 2019 | 100% |
| August 2019 | 100% |
| September 2019 | 100% |
The amounts per share which represent income derived from sources within, and taxes paid to, foreign countries or possessions of the United States are $1.222 and $0.606 for the dividend paid December 20, 2018.
The fund will notify shareholders in January 2020 of amounts for use in preparing 2019 income tax returns.
![]()
EMQ-ANN-1119
1.876933.110
Fidelity® Equity Sector Central Funds
Annual Report
September 30, 2019
Beginning on January 1, 2021, as permitted by regulations adopted by the Securities and Exchange Commission, paper copies of a fund’s shareholder reports will no longer be sent by mail, unless you specifically request paper copies of the reports from the fund or from your financial intermediary, such as a financial advisor, broker-dealer or bank. Instead, the reports will be made available on a website, and you will be notified by mail each time a report is posted and provided with a website link to access the report.
If you already elected to receive shareholder reports electronically, you will not be affected by this change and you need not take any action. You may elect to receive shareholder reports and other communications from a fund electronically, by contacting your financial intermediary. For Fidelity customers, visit Fidelity's web site or call Fidelity using the contact information listed below.
You may elect to receive all future reports in paper free of charge. If you wish to continue receiving paper copies of your shareholder reports, you may contact your financial intermediary or, if you are a Fidelity customer, visit Fidelity’s website, or call Fidelity at the applicable toll-free number listed below. Your election to receive reports in paper will apply to all funds held with the fund complex/your financial intermediary.
| Account Type | Website | Phone Number |
| Brokerage, Mutual Fund, or Annuity Contracts: | fidelity.com/mailpreferences | 1-800-343-3548 |
| Employer Provided Retirement Accounts: | netbenefits.fidelity.com/preferences (choose 'no' under Required Disclosures to continue to print) | 1-800-343-0860 |
| Advisor Sold Accounts Serviced Through Your Financial Intermediary: | Contact Your Financial Intermediary | Your Financial Intermediary's phone number |
| Advisor Sold Accounts Serviced by Fidelity: | institutional.fidelity.com | 1-877-208-0098 |
Contents
To view a fund's proxy voting guidelines and proxy voting record for the 12-month period ended June 30, visit http://www.fidelity.com/proxyvotingresults or visit the Securities and Exchange Commission's (SEC) web site at http://www.sec.gov.
You may also call 1-800-544-8544 to request a free copy of the proxy voting guidelines.
Standard & Poor's, S&P and S&P 500 are registered service marks of The McGraw-Hill Companies, Inc. and have been licensed for use by Fidelity Distributors Corporation.
Other third-party marks appearing herein are the property of their respective owners.
All other marks appearing herein are registered or unregistered trademarks or service marks of FMR LLC or an affiliated company. © 2019 FMR LLC. All rights reserved.
A fund files its complete schedule of portfolio holdings with the SEC for the first and third quarters of each fiscal year on Form N-PORT. Forms N-PORT are available on the SEC’s web site at http://www.sec.gov. A fund's Forms N-PORT may be reviewed and copied at the SEC’s Public Reference Room in Washington, DC. Information regarding the operation of the SEC's Public Reference Room may be obtained by calling 1-800-SEC-0330.
Notes to Shareholders - Fidelity® Financials Central Fund:
On June 1, 2019, Pierre Sorel assumed co-management responsibilities for the fund, joining Christopher Lee and Sam Wald.
On October 1, 2019, Fidelity Financials Central Fund and its underlying financials (ex-real estate) subportfolio will begin using new, capped supplemental benchmarks as more-relevant comparisons, given fund investment objectives/practices.
On October 1, 2019, Chris Lee came off the fund, leaving Sam Wald and Pierre Sorel as Co-Managers of the fund.
Fidelity® Communication Services Central Fund
Performance: The Bottom Line
Average annual total return reflects the change in the value of an investment, assuming reinvestment of distributions from dividend income and capital gains (the profits earned upon the sale of securities that have grown in value, if any) and assuming a constant rate of performance each year. The hypothetical investment and the average annual total returns do not reflect the deduction of taxes that a shareholder would pay on fund distributions or the redemption of fund shares. During periods of reimbursement by Fidelity, a fund’s total return will be greater than it would be had the reimbursement not occurred. How a fund did yesterday is no guarantee of how it will do tomorrow.
Average Annual Total Returns
| For the periods ended September 30, 2019 | Past 1 year | Past 5 years | Past 10 years |
| Fidelity® Communication Services Central Fund | 10.40% | 9.20% | 11.63% |
$10,000 Over 10 Years
Let's say hypothetically that $10,000 was invested in Fidelity® Communication Services Central Fund on September 30, 2009.
The chart shows how the value of your investment would have changed, and also shows how the S&P 500® Index performed over the same period.

| Period Ending Values | ||
| $30,050 | Fidelity® Communication Services Central Fund | |
| $34,674 | S&P 500® Index | |
Fidelity® Communication Services Central Fund
Management's Discussion of Fund Performance
Market Recap: The S&P 500® index gained 4.25% for the 12 months ending September 30, 2019, a choppy period in which stocks seesawed due to trade tension, interest rates, economic data and an inverted yield curve, among other factors. Equities began the new year on a high note after enduring a historically volatile final quarter of 2018. Upbeat company earnings and outlooks, along with signs the Federal Reserve may pause on rates, boosted stocks to an all-time high on April 30. In May, however, volatility spiked and the index sunk as trade negotiations between the U.S. and China broke down and tit-for-tat tariff fighting ensued. The bull market roared back in June and recorded a series of highs in July, when the Fed, affirming a dovish shift in policy, cut interest rates for the first time since 2008. Volatility intensified in August, however, as the U.S. Treasury yield curve inverted for the first time since 2007, which some investors viewed as a sign the world's biggest economy could be heading for recession. For the full 12 months, three defensive sectors led the way: utilities (+27%), real estate (+25%) and consumer staples (+17%). Information technology rose about 9%, boosted by software & services (+14%), the market’s largest industry. Communication services stocks gained roughly 6%. In contrast, energy (-19%) was by far the weakest sector – slipping on lower oil prices – followed by health care (-4%) and industrials (+1%). Other laggards included consumer discretionary (+2%), materials (+3%) and financials (+4%).Comments from Portfolio Manager Matthew Drukker: For the fiscal year, the fund gained 10.40%, notably outpacing the 6.64% result of the sector benchmark, the MSCI U.S. IMI Communication Services 25/50 Index, and the S&P® 500 index. Despite concerns about a slowing global economy, slower corporate earnings growth and increased trade friction, communication services stocks proved resilient this period. Generally speaking, these stocks had less exposure to rising global trade tension, which made communication services stocks attractive to a variety of investors, given the sector's combination of global growth and domestic subscription-based services. Versus the MSCI index, favorable stock selection in wireless telecommunication services and integrated telecommunication services added the most value. Largely avoiding two integrated telecommunication services companies - Frontier Communications, which we sold at the beginning of the period, and Windstream Holdings, both sector benchmark components - contributed most, as each continued to face challenges due to exposure to legacy voice services and the ongoing need for network upgrades. Conversely, choices in interactive home entertainment detracted on a relative basis, mainly due to the fund's notable overweighting in video-game developer Activision Blizzard, which suffered from disappointing sales earlier in 2019.The views expressed above reflect those of the portfolio manager(s) only through the end of the period as stated on the cover of this report and do not necessarily represent the views of Fidelity or any other person in the Fidelity organization. Any such views are subject to change at any time based upon market or other conditions and Fidelity disclaims any responsibility to update such views. These views may not be relied on as investment advice and, because investment decisions for a Fidelity fund are based on numerous factors, may not be relied on as an indication of trading intent on behalf of any Fidelity fund.
Note to Shareholders: Aligned with changes to the Global Industry Classification Standard (GICS) structure, on December 1, 2018, the fund's name changed to Fidelity Communication Services Central Fund and its sector benchmark changed from the MSCI US IM Telecommunication Services 25/50 Index to the MSCI US IM Communication Services 25/50 Index.Fidelity® Communication Services Central Fund
Investment Summary (Unaudited)
Top Ten Stocks as of September 30, 2019
| % of fund's net assets | |
| Alphabet, Inc. Class A | 24.2 |
| Facebook, Inc. Class A | 15.6 |
| The Walt Disney Co. | 5.8 |
| Comcast Corp. Class A | 4.9 |
| Verizon Communications, Inc. | 4.8 |
| Activision Blizzard, Inc. | 4.7 |
| Netflix, Inc. | 4.1 |
| T-Mobile U.S., Inc. | 2.7 |
| Electronic Arts, Inc. | 2.4 |
| AT&T, Inc. | 2.3 |
| 71.5 |
Top Industries (% of fund's net assets)
| As of September 30, 2019 | ||
| Interactive Media & Services | 44.3% | |
| Entertainment | 21.6% | |
| Media | 17.6% | |
| Diversified Telecommunication Services | 12.0% | |
| Wireless Telecommunication Services | 2.8% | |
| All Others* | 1.7% | |

* Includes short-term investments and net other assets (liabilities).
Fidelity® Communication Services Central Fund
Schedule of Investments September 30, 2019
Showing Percentage of Net Assets
| Common Stocks - 99.7% | |||
| Shares | Value | ||
| Diversified Telecommunication Services - 12.0% | |||
| Alternative Carriers - 3.9% | |||
| CenturyLink, Inc. | 789,280 | $9,850,214 | |
| Cogent Communications Group, Inc. | 157,612 | 8,684,421 | |
| GCI Liberty, Inc. (a) | 363,496 | 22,562,197 | |
| Iliad SA | 50,360 | 4,732,606 | |
| Iridium Communications, Inc. (a) | 495,735 | 10,549,241 | |
| Vonage Holdings Corp. (a) | 761,028 | 8,599,616 | |
| 64,978,295 | |||
| Integrated Telecommunication Services - 8.1% | |||
| AT&T, Inc. | 1,002,625 | 37,939,330 | |
| Atn International, Inc. | 59,185 | 3,454,628 | |
| Cincinnati Bell, Inc. (a) | 388,659 | 1,970,501 | |
| Masmovil Ibercom SA (a) | 510,419 | 10,370,013 | |
| Verizon Communications, Inc. | 1,310,920 | 79,127,131 | |
| 132,861,603 | |||
| TOTAL DIVERSIFIED TELECOMMUNICATION SERVICES | 197,839,898 | ||
| Entertainment - 21.6% | |||
| Interactive Home Entertainment - 9.3% | |||
| Activision Blizzard, Inc. | 1,467,625 | 77,666,715 | |
| Electronic Arts, Inc. (a) | 406,209 | 39,735,364 | |
| Take-Two Interactive Software, Inc. (a) | 230,460 | 28,885,856 | |
| Zynga, Inc. (a) | 1,105,088 | 6,431,612 | |
| 152,719,547 | |||
| Movies & Entertainment - 12.3% | |||
| Lions Gate Entertainment Corp. Class B | 673,526 | 5,886,617 | |
| Live Nation Entertainment, Inc. (a) | 68,858 | 4,568,040 | |
| Netflix, Inc. (a) | 251,105 | 67,200,720 | |
| The Walt Disney Co. | 731,820 | 95,370,782 | |
| World Wrestling Entertainment, Inc. Class A (b) | 425,624 | 30,283,148 | |
| 203,309,307 | |||
| TOTAL ENTERTAINMENT | 356,028,854 | ||
| Interactive Media & Services - 44.3% | |||
| Interactive Media & Services - 44.3% | |||
| Alphabet, Inc. Class A (a) | 326,694 | 398,939,111 | |
| ANGI Homeservices, Inc. Class A (a)(b) | 830,902 | 5,886,941 | |
| Facebook, Inc. Class A (a) | 1,442,725 | 256,920,468 | |
| Match Group, Inc. (b) | 87,176 | 6,227,853 | |
| Tencent Holdings Ltd. | 530,654 | 22,196,155 | |
| TripAdvisor, Inc. (a) | 120,070 | 4,644,308 | |
| Twitter, Inc. (a) | 769,208 | 31,691,370 | |
| Zillow Group, Inc. Class A (a)(b) | 138,004 | 4,077,328 | |
| 730,583,534 | |||
| Internet & Direct Marketing Retail - 1.0% | |||
| Internet & Direct Marketing Retail - 1.0% | |||
| Alibaba Group Holding Ltd. sponsored ADR (a) | 98,550 | 16,480,517 | |
| Media - 17.6% | |||
| Broadcasting - 6.1% | |||
| CBS Corp. Class B | 602,143 | 24,308,513 | |
| Discovery Communications, Inc. Class C (non-vtg.) (a) | 631,793 | 15,554,744 | |
| Fox Corp. Class B | 178,235 | 5,621,532 | |
| Liberty Media Corp.: | |||
| Liberty Media Class A (a) | 648,471 | 25,672,967 | |
| Liberty SiriusXM Series A (a) | 298,530 | 12,409,892 | |
| Sinclair Broadcast Group, Inc. Class A | 408,688 | 17,467,325 | |
| 101,034,973 | |||
| Cable & Satellite - 11.0% | |||
| Charter Communications, Inc. Class A (a) | 45,230 | 18,640,188 | |
| Comcast Corp. Class A | 1,773,482 | 79,948,569 | |
| DISH Network Corp. Class A (a) | 257,403 | 8,769,720 | |
| Grupo Televisa SA de CV (CPO) sponsored ADR | 906,474 | 8,865,316 | |
| Liberty Broadband Corp. Class A (a) | 333,363 | 34,843,101 | |
| Liberty Global PLC Class C (a) | 935,855 | 22,263,990 | |
| Liberty Latin America Ltd. Class C (a) | 331,725 | 5,670,839 | |
| Sirius XM Holdings, Inc. (b) | 259,766 | 1,624,836 | |
| 180,626,559 | |||
| Publishing - 0.5% | |||
| The New York Times Co. Class A | 286,749 | 8,166,612 | |
| TOTAL MEDIA | 289,828,144 | ||
| Software - 0.4% | |||
| Application Software - 0.4% | |||
| Sciplay Corp. (A Shares) | 656,839 | 7,028,177 | |
| Wireless Telecommunication Services - 2.8% | |||
| Wireless Telecommunication Services - 2.8% | |||
| Boingo Wireless, Inc. (a) | 207,461 | 2,302,817 | |
| T-Mobile U.S., Inc. (a) | 561,086 | 44,196,744 | |
| 46,499,561 | |||
| TOTAL COMMON STOCKS | |||
| (Cost $1,478,979,318) | 1,644,288,685 | ||
| Money Market Funds - 2.5% | |||
| Fidelity Cash Central Fund 1.96% (c) | 8,005,375 | 8,006,976 | |
| Fidelity Securities Lending Cash Central Fund 1.96% (c)(d) | 33,706,796 | 33,710,167 | |
| TOTAL MONEY MARKET FUNDS | |||
| (Cost $41,717,143) | 41,717,143 | ||
| TOTAL INVESTMENT IN SECURITIES - 102.2% | |||
| (Cost $1,520,696,461) | 1,686,005,828 | ||
| NET OTHER ASSETS (LIABILITIES) - (2.2)% | (37,052,981) | ||
| NET ASSETS - 100% | $1,648,952,847 |
Legend
(a) Non-income producing
(b) Security or a portion of the security is on loan at period end.
(c) Affiliated fund that is generally available only to investment companies and other accounts managed by Fidelity Investments. The rate quoted is the annualized seven-day yield of the fund at period end. A complete unaudited listing of the fund's holdings as of its most recent quarter end is available upon request. In addition, each Fidelity Central Fund's financial statements, which are not covered by the Fund's Report of Independent Registered Public Accounting Firm, are available on the SEC's website or upon request.
(d) Investment made with cash collateral received from securities on loan.
Affiliated Central Funds
Information regarding fiscal year to date income earned by the Fund from investments in Fidelity Central Funds is as follows:
| Fund | Income earned |
| Fidelity Cash Central Fund | $178,910 |
| Fidelity Securities Lending Cash Central Fund | 108,403 |
| Total | $287,313 |
Amounts in the income column in the above table include any capital gain distributions from underlying funds, which are presented in the corresponding line-item in the Statement of Operations, if applicable. Amount for Fidelity Securities Lending Cash Central Fund represents the income earned on investing cash collateral, less rebates paid to borrowers and any lending agent fees associated with the loan, plus any premium payments received for lending certain types of securities.
Investment Valuation
The following is a summary of the inputs used, as of September 30, 2019, involving the Fund's assets and liabilities carried at fair value. The inputs or methodology used for valuing securities may not be an indication of the risk associated with investing in those securities. For more information on valuation inputs, and their aggregation into the levels used below, please refer to the Investment Valuation section in the accompanying Notes to Financial Statements.
| Valuation Inputs at Reporting Date: | ||||
| Description | Total | Level 1 | Level 2 | Level 3 |
| Investments in Securities: | ||||
| Common Stocks | $1,644,288,685 | $1,622,092,530 | $22,196,155 | $-- |
| Money Market Funds | 41,717,143 | 41,717,143 | -- | -- |
| Total Investments in Securities: | $1,686,005,828 | $1,663,809,673 | $22,196,155 | $-- |
See accompanying notes which are an integral part of the financial statements.
Fidelity® Communication Services Central Fund
Financial Statements
Statement of Assets and Liabilities
| September 30, 2019 | ||
| Assets | ||
| Investment in securities, at value (including securities loaned of $32,877,487) — See accompanying schedule: Unaffiliated issuers (cost $1,478,979,318) | $1,644,288,685 | |
| Fidelity Central Funds (cost $41,717,143) | 41,717,143 | |
| Total Investment in Securities (cost $1,520,696,461) | $1,686,005,828 | |
| Receivable for investments sold | 33,692,877 | |
| Receivable for fund shares sold | 222,675 | |
| Dividends receivable | 57,039 | |
| Distributions receivable from Fidelity Central Funds | 29,338 | |
| Other receivables | 360 | |
| Total assets | 1,720,008,117 | |
| Liabilities | ||
| Payable for investments purchased | $36,361,657 | |
| Payable for fund shares redeemed | 966,821 | |
| Other payables and accrued expenses | 17,033 | |
| Collateral on securities loaned | 33,709,759 | |
| Total liabilities | 71,055,270 | |
| Net Assets | $1,648,952,847 | |
| Net Assets consist of: | ||
| Paid in capital | $1,434,472,920 | |
| Total accumulated earnings (loss) | 214,479,927 | |
| Net Assets, for 8,014,060 shares outstanding | $1,648,952,847 | |
| Net Asset Value, offering price and redemption price per share ($1,648,952,847 ÷ 8,014,060 shares) | $205.76 |
See accompanying notes which are an integral part of the financial statements.
Statement of Operations
| Year ended September 30, 2019 | ||
| Investment Income | ||
| Dividends | $11,195,903 | |
| Income from Fidelity Central Funds (including $108,403 from security lending) | 287,313 | |
| Total income | 11,483,216 | |
| Expenses | ||
| Custodian fees and expenses | $23,579 | |
| Independent directors' fees and expenses | 7,027 | |
| Interest | 12,603 | |
| Miscellaneous | 17 | |
| Total expenses before reductions | 43,226 | |
| Expense reductions | (4,095) | |
| Total expenses after reductions | 39,131 | |
| Net investment income (loss) | 11,444,085 | |
| Realized and Unrealized Gain (Loss) | ||
| Net realized gain (loss) on: | ||
| Investment securities: | ||
| Unaffiliated issuers | 58,625,308 | |
| Redemptions in-kind with affiliated entities | 13,357,266 | |
| Fidelity Central Funds | 1,624 | |
| Foreign currency transactions | (95,327) | |
| Total net realized gain (loss) | 71,888,871 | |
| Change in net unrealized appreciation (depreciation) on: | ||
| Investment securities: | ||
| Unaffiliated issuers | 110,009,559 | |
| Fidelity Central Funds | (702) | |
| Assets and liabilities in foreign currencies | 176 | |
| Total change in net unrealized appreciation (depreciation) | 110,009,033 | |
| Net gain (loss) | 181,897,904 | |
| Net increase (decrease) in net assets resulting from operations | $193,341,989 |
See accompanying notes which are an integral part of the financial statements.
Statement of Changes in Net Assets
| Year ended September 30, 2019 | Year ended September 30, 2018 | |
| Increase (Decrease) in Net Assets | ||
| Operations | ||
| Net investment income (loss) | $11,444,085 | $10,697,283 |
| Net realized gain (loss) | 71,888,871 | 35,399,047 |
| Change in net unrealized appreciation (depreciation) | 110,009,033 | (18,539,736) |
| Net increase (decrease) in net assets resulting from operations | 193,341,989 | 27,556,594 |
| Distributions to shareholders | (11,352,901) | – |
| Distributions to shareholders from net investment income | – | (12,286,003) |
| Distributions to shareholders from net realized gain | – | (31,019,369) |
| Total distributions | (11,352,901) | (43,305,372) |
| Affiliated share transactions | ||
| Proceeds from sales of shares | 1,304,532,014 | 136,943,118 |
| Reinvestment of distributions | 11,352,901 | 43,305,372 |
| Cost of shares redeemed | (256,316,554) | (136,671,112) |
| Net increase (decrease) in net assets resulting from share transactions | 1,059,568,361 | 43,577,378 |
| Total increase (decrease) in net assets | 1,241,557,449 | 27,828,600 |
| Net Assets | ||
| Beginning of period | 407,395,398 | 379,566,798 |
| End of period | $1,648,952,847 | $407,395,398 |
| Other Information | ||
| Shares | ||
| Sold | 7,085,633 | 777,149 |
| Issued in reinvestment of distributions | 59,668 | 239,963 |
| Redeemed | (1,292,631) | (763,009) |
| Net increase (decrease) | 5,852,670 | 254,103 |
See accompanying notes which are an integral part of the financial statements.
Financial Highlights
Fidelity Communication Services Central Fund
| Years ended September 30, | 2019 | 2018 | 2017 | 2016 | 2015 |
| Selected Per–Share Data | |||||
| Net asset value, beginning of period | $188.49 | $199.01 | $191.47 | $155.23 | $163.86 |
| Income from Investment Operations | |||||
| Net investment income (loss)A | 1.56 | 5.12B | 4.88 | 4.49 | 3.75 |
| Net realized and unrealized gain (loss) | 17.82 | 7.10 | 9.03 | 36.05 | (8.58) |
| Total from investment operations | 19.38 | 12.22 | 13.91 | 40.54 | (4.83) |
| Distributions from net investment income | (2.05) | (5.99) | (4.62) | (4.30) | (3.80) |
| Distributions from net realized gain | (.07) | (16.75) | (1.76) | – | – |
| Total distributions | (2.11)C | (22.74) | (6.37)D | (4.30) | (3.80) |
| Net asset value, end of period | $205.76 | $188.49 | $199.01 | $191.47 | $155.23 |
| Total ReturnE | 10.40% | 6.95% | 7.41% | 26.33% | (3.10)% |
| Ratios to Average Net AssetsF,G | |||||
| Expenses before reductions | - %H | - %H | .01% | .01% | - %H |
| Expenses net of fee waivers, if any | - %H | - %H | .01% | .01% | - %H |
| Expenses net of all reductions | - %H | - %H | .01% | .01% | - %H |
| Net investment income (loss) | .80% | 2.84%B | 2.48% | 2.51% | 2.24% |
| Supplemental Data | |||||
| Net assets, end of period (000 omitted) | $1,648,953 | $407,395 | $379,567 | $384,097 | $277,097 |
| Portfolio turnover rateI | 99%J | 75%J | 75%J | 68% | 58% |
A Calculated based on average shares outstanding during the period.
B Net investment income per share reflects a large, non-recurring dividend which amounted to $1.20 per share. Excluding this non-recurring dividend, the ratio of net investment income (loss) to average net assets would have been 2.18%.
C Total distributions of $2.11 per share is comprised of distributions from net investment income of $2.045 and distributions from net realized gain of $.068 per share.
D Total distributions of $6.37 per share is comprised of distributions from net investment income of $4.618 and distributions from net realized gain of $1.755 per share.
E Total returns would have been lower if certain expenses had not been reduced during the applicable periods shown.
F Fees and expenses of any underlying Fidelity Central Funds are not included in the Fund's expense ratio. The Fund indirectly bears its proportionate share of the expenses of any underlying Fidelity Central Funds.
G Expense ratios reflect operating expenses of the Fund. Expenses before reductions do not reflect amounts reimbursed by the investment adviser or reductions from expense offset arrangements and do not represent the amount paid by the Fund during periods when reimbursements or reductions occur. Expenses net of fee waivers reflect expenses after reimbursement by the investment adviser but prior to reductions from expense offset arrangements. Expenses net of all reductions represent the net expenses paid by the Fund.
H Amount represents less than .005%.
I Amount does not include the portfolio activity of any underlying Fidelity Central Funds.
J Portfolio turnover rate excludes securities received or delivered in-kind.
See accompanying notes which are an integral part of the financial statements.
Fidelity® Consumer Discretionary Central Fund
Performance: The Bottom Line
Average annual total return reflects the change in the value of an investment, assuming reinvestment of distributions from dividend income and capital gains (the profits earned upon the sale of securities that have grown in value, if any) and assuming a constant rate of performance each year. The hypothetical investment and the average annual total returns do not reflect the deduction of taxes that a shareholder would pay on fund distributions or the redemption of fund shares. During periods of reimbursement by Fidelity, a fund’s total return will be greater than it would be had the reimbursement not occurred. How a fund did yesterday is no guarantee of how it will do tomorrow.
Average Annual Total Returns
| For the periods ended September 30, 2019 | Past 1 year | Past 5 years | Past 10 years |
| Fidelity® Consumer Discretionary Central Fund | 2.72% | 13.26% | 16.45% |
$10,000 Over 10 Years
Let's say hypothetically that $10,000 was invested in Fidelity® Consumer Discretionary Central Fund on September 30, 2009.
The chart shows how the value of your investment would have changed, and also shows how the S&P 500® Index performed over the same period.
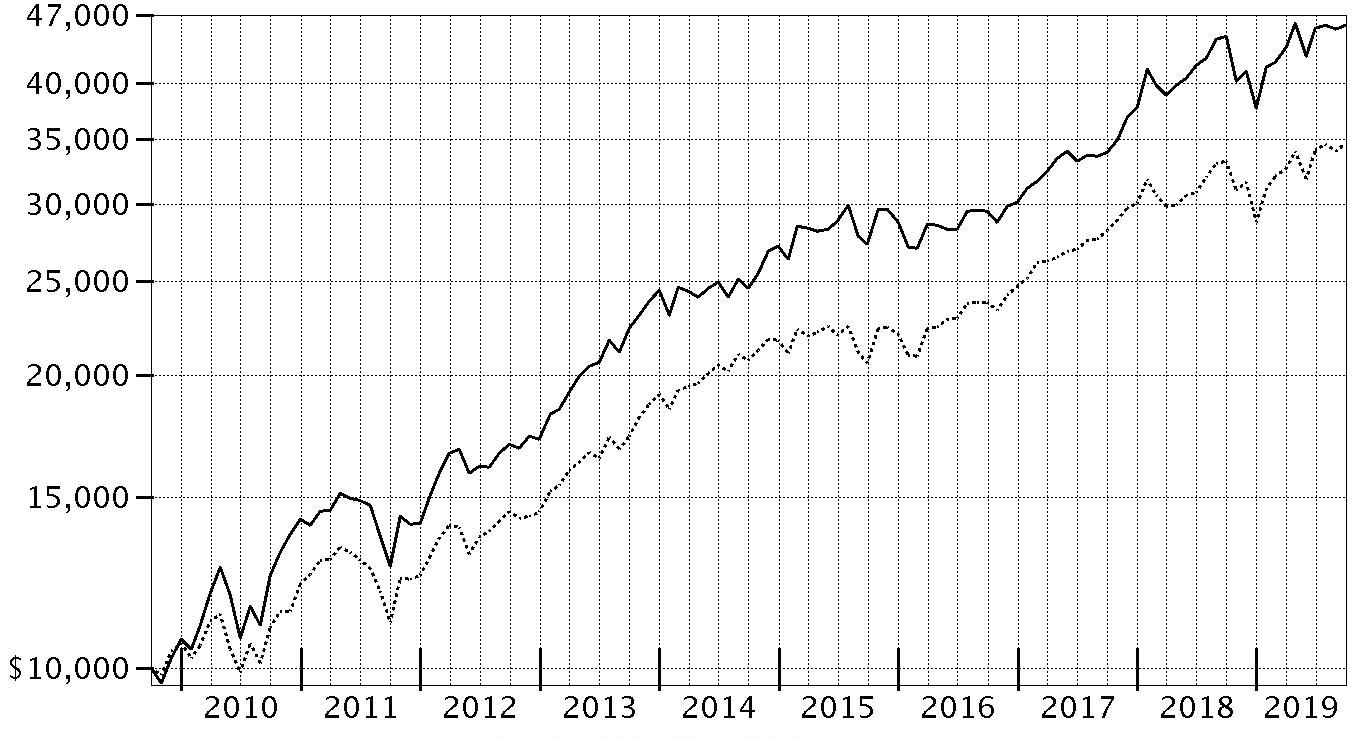
| Period Ending Values | ||
| $45,868 | Fidelity® Consumer Discretionary Central Fund | |
| $34,674 | S&P 500® Index | |
Fidelity® Consumer Discretionary Central Fund
Management's Discussion of Fund Performance
Market Recap: The S&P 500® index gained 4.25% for the 12 months ending September 30, 2019, a choppy period in which stocks seesawed due to trade tension, interest rates, economic data and an inverted yield curve, among other factors. Equities began the new year on a high note after enduring a historically volatile final quarter of 2018. Upbeat company earnings and outlooks, along with signs the Federal Reserve may pause on rates, boosted stocks to an all-time high on April 30. In May, however, volatility spiked and the index sunk as trade negotiations between the U.S. and China broke down and tit-for-tat tariff fighting ensued. The bull market roared back in June and recorded a series of highs in July, when the Fed, affirming a dovish shift in policy, cut interest rates for the first time since 2008. Volatility intensified in August, however, as the U.S. Treasury yield curve inverted for the first time since 2007, which some investors viewed as a sign the world's biggest economy could be heading for recession. For the full 12 months, three defensive sectors led the way: utilities (+27%), real estate (+25%) and consumer staples (+17%). Information technology rose about 9%, boosted by software & services (+14%), the market’s largest industry. Communication services stocks gained roughly 6%. In contrast, energy (-19%) was by far the weakest sector – slipping on lower oil prices – followed by health care (-4%) and industrials (+1%). Other laggards included consumer discretionary (+2%), materials (+3%) and financials (+4%).Comments from Portfolio Manager Katherine Shaw: For the fiscal year, the fund gained 2.72%, finishing modestly ahead of the 2.15% advance of the MSCI U.S. IMI Consumer Discretionary 25/50 Index, but behind the broad-market S&P 500. The sector underperformed the broader market, held back by volatility that bookended the 12-month period, as well as late-cycle concerns, typically a weak point for consumer discretionary stocks given that they tend to outperform earlier in the earlier stages of the business cycle. Still, consumer confidence remained solid, supported by lower interest rates, near-historically low unemployment and slightly rising wages. Versus the MSCI sector index, Burlington Stores, a sizable fund holding that gained 22% in the portfolio, was the leading contributor during the period. The stock it an all-time-high in August after its second-quarter financial results easily exceeded investors’ expectations due to strong same-store sales. Our large positions in discount retailers Dollar Tree (+40%) and Dollar General (+47%) also helped the fund’s relative result, as both companies achieved strong results, bolstered by positive consumer trends. In contrast, an underweighting in coffee retail giant Starbucks (+59%), hurt performance more than any other individual stock the past 12 months. Here, new initiatives drove more customers to the firm’s retail stores while growth in China also accelerated. Lastly, the portfolio’s overweighting in PVH (-39%), owner of well-known brands Calvin Klein and Tommy Hilfiger, and lack of meaningful exposure to retail giant Target (+25%), also hampered the fund’s relative return.The views expressed above reflect those of the portfolio manager(s) only through the end of the period as stated on the cover of this report and do not necessarily represent the views of Fidelity or any other person in the Fidelity organization. Any such views are subject to change at any time based upon market or other conditions and Fidelity disclaims any responsibility to update such views. These views may not be relied on as investment advice and, because investment decisions for a Fidelity fund are based on numerous factors, may not be relied on as an indication of trading intent on behalf of any Fidelity fund.
Fidelity® Consumer Discretionary Central Fund
Investment Summary (Unaudited)
Top Ten Stocks as of September 30, 2019
| % of fund's net assets | |
| Amazon.com, Inc. | 21.4 |
| The Home Depot, Inc. | 9.6 |
| McDonald's Corp. | 5.3 |
| Lowe's Companies, Inc. | 4.7 |
| Burlington Stores, Inc. | 4.3 |
| Dollar Tree, Inc. | 4.3 |
| TJX Companies, Inc. | 4.1 |
| The Booking Holdings, Inc. | 3.6 |
| Ross Stores, Inc. | 3.2 |
| Royal Caribbean Cruises Ltd. | 3.2 |
| 63.7 |
Top Industries (% of fund's net assets)
| As of September 30, 2019 | ||
| Specialty Retail | 32.0% | |
| Internet & Direct Marketing Retail | 25.2% | |
| Hotels, Restaurants & Leisure | 20.7% | |
| Multiline Retail | 7.9% | |
| Textiles, Apparel & Luxury Goods | 6.2% | |
| All Others* | 8.0% | |

* Includes short-term investments and net other assets (liabilities).
Fidelity® Consumer Discretionary Central Fund
Schedule of Investments September 30, 2019
Showing Percentage of Net Assets
| Common Stocks - 100.1% | |||
| Shares | Value | ||
| Automobiles - 0.3% | |||
| Automobile Manufacturers - 0.3% | |||
| Ferrari NV | 37,405 | $5,763,736 | |
| Commercial Services & Supplies - 0.2% | |||
| Diversified Support Services - 0.2% | |||
| Copart, Inc. (a) | 57,702 | 4,635,202 | |
| Diversified Consumer Services - 1.2% | |||
| Education Services - 1.2% | |||
| Grand Canyon Education, Inc. (a) | 190,811 | 18,737,640 | |
| New Oriental Education & Technology Group, Inc. sponsored ADR (a) | 34,044 | 3,770,713 | |
| 22,508,353 | |||
| Entertainment - 0.2% | |||
| Movies & Entertainment - 0.2% | |||
| Live Nation Entertainment, Inc. (a) | 30,005 | 1,990,532 | |
| World Wrestling Entertainment, Inc. Class A | 12,228 | 870,022 | |
| 2,860,554 | |||
| Food & Staples Retailing - 2.0% | |||
| Food Distributors - 1.1% | |||
| Performance Food Group Co. (a) | 178,660 | 8,220,147 | |
| U.S. Foods Holding Corp. (a) | 283,125 | 11,636,438 | |
| 19,856,585 | |||
| Hypermarkets & Super Centers - 0.9% | |||
| BJ's Wholesale Club Holdings, Inc. (a) | 447,864 | 11,586,242 | |
| Walmart, Inc. | 51,066 | 6,060,513 | |
| 17,646,755 | |||
| TOTAL FOOD & STAPLES RETAILING | 37,503,340 | ||
| Hotels, Restaurants & Leisure - 20.7% | |||
| Casinos & Gaming - 1.2% | |||
| Churchill Downs, Inc. | 83,851 | 10,351,825 | |
| Eldorado Resorts, Inc. (a)(b) | 302,416 | 12,057,326 | |
| 22,409,151 | |||
| Hotels, Resorts & Cruise Lines - 6.5% | |||
| Hilton Grand Vacations, Inc. (a) | 243,599 | 7,795,168 | |
| Hilton Worldwide Holdings, Inc. | 322,266 | 30,006,187 | |
| Marriott Vacations Worldwide Corp. (b) | 153,442 | 15,898,126 | |
| Royal Caribbean Cruises Ltd. | 544,061 | 58,938,128 | |
| Wyndham Destinations, Inc. | 140,053 | 6,445,239 | |
| Wyndham Hotels & Resorts, Inc. | 48,085 | 2,487,918 | |
| 121,570,766 | |||
| Leisure Facilities - 1.7% | |||
| Drive Shack, Inc. (a) | 554,310 | 2,389,076 | |
| Planet Fitness, Inc. (a) | 276,442 | 15,997,699 | |
| Vail Resorts, Inc. | 55,179 | 12,556,533 | |
| 30,943,308 | |||
| Restaurants - 11.3% | |||
| Chipotle Mexican Grill, Inc. (a) | 24,427 | 20,530,161 | |
| Dunkin' Brands Group, Inc. | 1,150 | 91,264 | |
| McDonald's Corp. | 463,088 | 99,429,624 | |
| Restaurant Brands International, Inc. | 145,505 | 10,345,753 | |
| Starbucks Corp. | 642,137 | 56,777,754 | |
| Yum! Brands, Inc. | 222,468 | 25,234,545 | |
| 212,409,101 | |||
| TOTAL HOTELS, RESTAURANTS & LEISURE | 387,332,326 | ||
| Household Durables - 3.6% | |||
| Home Furnishings - 0.1% | |||
| Mohawk Industries, Inc. (a) | 5,193 | 644,296 | |
| Homebuilding - 3.5% | |||
| D.R. Horton, Inc. | 531,629 | 28,022,165 | |
| Lennar Corp. Class A | 323,276 | 18,054,965 | |
| NVR, Inc. (a) | 5,328 | 19,806,041 | |
| 65,883,171 | |||
| TOTAL HOUSEHOLD DURABLES | 66,527,467 | ||
| Interactive Media & Services - 0.2% | |||
| Interactive Media & Services - 0.2% | |||
| Alphabet, Inc. Class A (a) | 3,270 | 3,993,128 | |
| Internet & Direct Marketing Retail - 25.2% | |||
| Internet & Direct Marketing Retail - 25.2% | |||
| Amazon.com, Inc. (a) | 230,642 | 400,373,750 | |
| The Booking Holdings, Inc. (a) | 34,580 | 67,867,054 | |
| The RealReal, Inc. (b) | 116,558 | 2,606,237 | |
| Wayfair LLC Class A (a) | 19,715 | 2,210,446 | |
| 473,057,487 | |||
| IT Services - 0.3% | |||
| Data Processing & Outsourced Services - 0.3% | |||
| PayPal Holdings, Inc. (a) | 46,739 | 4,841,693 | |
| Leisure Products - 0.1% | |||
| Leisure Products - 0.1% | |||
| OneSpaWorld Holdings Ltd. (a)(b) | 172,374 | 2,676,968 | |
| Multiline Retail - 7.9% | |||
| General Merchandise Stores - 7.9% | |||
| B&M European Value Retail SA | 642,554 | 2,997,458 | |
| Dollar General Corp. | 344,261 | 54,716,843 | |
| Dollar Tree, Inc. (a) | 697,188 | 79,590,982 | |
| Ollie's Bargain Outlet Holdings, Inc. (a) | 167,559 | 9,825,660 | |
| 147,130,943 | |||
| Specialty Retail - 32.0% | |||
| Apparel Retail - 12.3% | |||
| Burlington Stores, Inc. (a) | 403,741 | 80,675,527 | |
| Ross Stores, Inc. | 545,043 | 59,872,974 | |
| The Children's Place Retail Stores, Inc. (b) | 160,293 | 12,340,958 | |
| TJX Companies, Inc. | 1,379,246 | 76,879,172 | |
| 229,768,631 | |||
| Automotive Retail - 2.9% | |||
| AutoZone, Inc. (a) | 19,016 | 20,625,134 | |
| Monro, Inc. | 82,706 | 6,534,601 | |
| O'Reilly Automotive, Inc. (a) | 68,827 | 27,428,248 | |
| 54,587,983 | |||
| Computer & Electronics Retail - 0.8% | |||
| Best Buy Co., Inc. | 230,231 | 15,883,637 | |
| Home Improvement Retail - 14.6% | |||
| Floor & Decor Holdings, Inc. Class A (a) | 123,592 | 6,321,731 | |
| Lowe's Companies, Inc. | 793,230 | 87,223,571 | |
| The Home Depot, Inc. | 774,113 | 179,609,698 | |
| 273,155,000 | |||
| Specialty Stores - 1.4% | |||
| Five Below, Inc. (a) | 71,935 | 9,071,004 | |
| National Vision Holdings, Inc. (a) | 70,339 | 1,693,060 | |
| Ulta Beauty, Inc. (a) | 63,953 | 16,029,819 | |
| 26,793,883 | |||
| TOTAL SPECIALTY RETAIL | 600,189,134 | ||
| Textiles, Apparel & Luxury Goods - 6.2% | |||
| Apparel, Accessories & Luxury Goods - 3.9% | |||
| adidas AG | 25,909 | 8,066,617 | |
| Capri Holdings Ltd. (a) | 402,464 | 13,345,706 | |
| Carter's, Inc. | 55,490 | 5,061,243 | |
| G-III Apparel Group Ltd. (a) | 97,530 | 2,513,348 | |
| lululemon athletica, Inc. (a) | 11,733 | 2,258,954 | |
| LVMH Moet Hennessy Louis Vuitton SE | 24,991 | 9,915,425 | |
| PVH Corp. | 188,750 | 16,653,413 | |
| Tapestry, Inc. | 600,510 | 15,643,286 | |
| 73,457,992 | |||
| Footwear - 2.3% | |||
| Deckers Outdoor Corp. (a) | 40,403 | 5,953,786 | |
| NIKE, Inc. Class B | 396,887 | 37,275,627 | |
| 43,229,413 | |||
| TOTAL TEXTILES, APPAREL & LUXURY GOODS | 116,687,405 | ||
| TOTAL COMMON STOCKS | |||
| (Cost $1,315,653,018) | 1,875,707,736 | ||
| Money Market Funds - 1.1% | |||
| Fidelity Cash Central Fund 1.96% (c) | 2,552,674 | 2,553,185 | |
| Fidelity Securities Lending Cash Central Fund 1.96% (c)(d) | 18,296,428 | 18,298,258 | |
| TOTAL MONEY MARKET FUNDS | |||
| (Cost $20,851,443) | 20,851,443 | ||
| TOTAL INVESTMENT IN SECURITIES - 101.2% | |||
| (Cost $1,336,504,461) | 1,896,559,179 | ||
| NET OTHER ASSETS (LIABILITIES) - (1.2)% | (22,186,338) | ||
| NET ASSETS - 100% | $1,874,372,841 |
Legend
(a) Non-income producing
(b) Security or a portion of the security is on loan at period end.
(c) Affiliated fund that is generally available only to investment companies and other accounts managed by Fidelity Investments. The rate quoted is the annualized seven-day yield of the fund at period end. A complete unaudited listing of the fund's holdings as of its most recent quarter end is available upon request. In addition, each Fidelity Central Fund's financial statements, which are not covered by the Fund's Report of Independent Registered Public Accounting Firm, are available on the SEC's website or upon request.
(d) Investment made with cash collateral received from securities on loan.
Affiliated Central Funds
Information regarding fiscal year to date income earned by the Fund from investments in Fidelity Central Funds is as follows:
| Fund | Income earned |
| Fidelity Cash Central Fund | $120,598 |
| Fidelity Securities Lending Cash Central Fund | 83,826 |
| Total | $204,424 |
Amounts in the income column in the above table include any capital gain distributions from underlying funds, which are presented in the corresponding line-item in the Statement of Operations, if applicable. Amount for Fidelity Securities Lending Cash Central Fund represents the income earned on investing cash collateral, less rebates paid to borrowers and any lending agent fees associated with the loan, plus any premium payments received for lending certain types of securities.
Investment Valuation
The following is a summary of the inputs used, as of September 30, 2019, involving the Fund's assets and liabilities carried at fair value. The inputs or methodology used for valuing securities may not be an indication of the risk associated with investing in those securities. For more information on valuation inputs, and their aggregation into the levels used below, please refer to the Investment Valuation section in the accompanying Notes to Financial Statements.
| Valuation Inputs at Reporting Date: | ||||
| Description | Total | Level 1 | Level 2 | Level 3 |
| Investments in Securities: | ||||
| Common Stocks | $1,875,707,736 | $1,865,792,311 | $9,915,425 | $-- |
| Money Market Funds | 20,851,443 | 20,851,443 | -- | -- |
| Total Investments in Securities: | $1,896,559,179 | $1,886,643,754 | $9,915,425 | $-- |
See accompanying notes which are an integral part of the financial statements.
Fidelity® Consumer Discretionary Central Fund
Financial Statements
Statement of Assets and Liabilities
| September 30, 2019 | ||
| Assets | ||
| Investment in securities, at value (including securities loaned of $18,556,929) — See accompanying schedule: Unaffiliated issuers (cost $1,315,653,018) | $1,875,707,736 | |
| Fidelity Central Funds (cost $20,851,443) | 20,851,443 | |
| Total Investment in Securities (cost $1,336,504,461) | $1,896,559,179 | |
| Foreign currency held at value (cost $2,374) | 2,336 | |
| Receivable for investments sold | 3,187,001 | |
| Receivable for fund shares sold | 262,412 | |
| Dividends receivable | 803,456 | |
| Distributions receivable from Fidelity Central Funds | 25,920 | |
| Total assets | 1,900,840,304 | |
| Liabilities | ||
| Payable for investments purchased | $7,014,998 | |
| Payable for fund shares redeemed | 1,136,608 | |
| Other payables and accrued expenses | 20,450 | |
| Collateral on securities loaned | 18,295,407 | |
| Total liabilities | 26,467,463 | |
| Net Assets | $1,874,372,841 | |
| Net Assets consist of: | ||
| Paid in capital | $1,268,406,079 | |
| Total accumulated earnings (loss) | 605,966,762 | |
| Net Assets, for 5,447,509 shares outstanding | $1,874,372,841 | |
| Net Asset Value, offering price and redemption price per share ($1,874,372,841 ÷ 5,447,509 shares) | $344.08 |
See accompanying notes which are an integral part of the financial statements.
Statement of Operations
| Year ended September 30, 2019 | ||
| Investment Income | ||
| Dividends | $19,711,390 | |
| Income from Fidelity Central Funds (including $83,826 from security lending) | 204,424 | |
| Total income | 19,915,814 | |
| Expenses | ||
| Custodian fees and expenses | $35,192 | |
| Independent directors' fees and expenses | 11,445 | |
| Interest | 17,162 | |
| Miscellaneous | 22 | |
| Total expenses | 63,821 | |
| Net investment income (loss) | 19,851,993 | |
| Realized and Unrealized Gain (Loss) | ||
| Net realized gain (loss) on: | ||
| Investment securities: | ||
| Unaffiliated issuers | 48,601,329 | |
| Redemptions in-kind with affiliated entities | 143,005,357 | |
| Fidelity Central Funds | 359 | |
| Foreign currency transactions | 23,387 | |
| Total net realized gain (loss) | 191,630,432 | |
| Change in net unrealized appreciation (depreciation) on: | ||
| Investment securities: | ||
| Unaffiliated issuers | (192,985,237) | |
| Assets and liabilities in foreign currencies | (2,321) | |
| Total change in net unrealized appreciation (depreciation) | (192,987,558) | |
| Net gain (loss) | (1,357,126) | |
| Net increase (decrease) in net assets resulting from operations | $18,494,867 |
See accompanying notes which are an integral part of the financial statements.
Statement of Changes in Net Assets
| Year ended September 30, 2019 | Year ended September 30, 2018 | |
| Increase (Decrease) in Net Assets | ||
| Operations | ||
| Net investment income (loss) | $19,851,993 | $20,991,740 |
| Net realized gain (loss) | 191,630,432 | 253,197,582 |
| Change in net unrealized appreciation (depreciation) | (192,987,558) | 282,666,572 |
| Net increase (decrease) in net assets resulting from operations | 18,494,867 | 556,855,894 |
| Distributions to shareholders | (79,897,874) | – |
| Distributions to shareholders from net investment income | – | (19,605,261) |
| Distributions to shareholders from net realized gain | – | (92,369,304) |
| Total distributions | (79,897,874) | (111,974,565) |
| Affiliated share transactions | ||
| Proceeds from sales of shares | 117,444,420 | 836,759,194 |
| Reinvestment of distributions | 79,897,874 | 111,974,565 |
| Cost of shares redeemed | (676,484,183) | (560,440,844) |
| Net increase (decrease) in net assets resulting from share transactions | (479,141,889) | 388,292,915 |
| Total increase (decrease) in net assets | (540,544,896) | 833,174,244 |
| Net Assets | ||
| Beginning of period | 2,414,917,737 | 1,581,743,493 |
| End of period | $1,874,372,841 | $2,414,917,737 |
| Other Information | ||
| Undistributed net investment income end of period | $3,152,954 | |
| Shares | ||
| Sold | 365,094 | 2,718,976 |
| Issued in reinvestment of distributions | 274,393 | 373,136 |
| Redeemed | (2,080,066) | (1,778,344) |
| Net increase (decrease) | (1,440,579) | 1,313,768 |
See accompanying notes which are an integral part of the financial statements.
Financial Highlights
Fidelity Consumer Discretionary Central Fund
| Years ended September 30, | 2019 | 2018 | 2017 | 2016 | 2015 |
| Selected Per–Share Data | |||||
| Net asset value, beginning of period | $350.59 | $283.76 | $248.76 | $234.10 | $213.75 |
| Income from Investment Operations | |||||
| Net investment income (loss)A | 3.28 | 3.24 | 3.14 | 3.75 | 3.36 |
| Net realized and unrealized gain (loss) | 3.69B | 82.54 | 34.62 | 14.67 | 20.24 |
| Total from investment operations | 6.97 | 85.78 | 37.76 | 18.42 | 23.60 |
| Distributions from net investment income | (3.25) | (3.08)C | (2.76) | (3.76) | (3.25) |
| Distributions from net realized gain | (10.23) | (15.86)C | – | – | – |
| Total distributions | (13.48) | (18.95)D | (2.76) | (3.76) | (3.25) |
| Net asset value, end of period | $344.08 | $350.59 | $283.76 | $248.76 | $234.10 |
| Total ReturnE | 2.72% | 31.42% | 15.25% | 7.91% | 11.01% |
| Ratios to Average Net AssetsF,G | |||||
| Expenses before reductionsH | -% | -% | -% | -% | -% |
| Expenses net of fee waivers, if anyH | -% | -% | -% | -% | -% |
| Expenses net of all reductionsH | -% | -% | -% | -% | -% |
| Net investment income (loss) | 1.00% | 1.02% | 1.17% | 1.54% | 1.41% |
| Supplemental Data | |||||
| Net assets, end of period (000 omitted) | $1,874,373 | $2,414,918 | $1,581,743 | $1,579,033 | $1,487,901 |
| Portfolio turnover rateI | 45%J | 26%J | 40%J | 27% | 68% |
A Calculated based on average shares outstanding during the period.
B The amount shown for a share outstanding does not correspond with the aggregate net gain (loss) on investments for the period due to the timing of sales and repurchases of shares in relation to fluctuating market values of the investments of the Fund.
C The amounts shown reflect certain reclassifications related to book to tax differences that were made in the year shown.
D Total distributions of $18.95 per share is comprised of distributions from net investment income of $3.081 and distributions from net realized gain of $15.864 per share.
E Total returns would have been lower if certain expenses had not been reduced during the applicable periods shown.
F Fees and expenses of any underlying Fidelity Central Funds are not included in the Fund's expense ratio. The Fund indirectly bears its proportionate share of the expenses of any underlying Fidelity Central Funds.
G Expense ratios reflect operating expenses of the Fund. Expenses before reductions do not reflect amounts reimbursed by the investment adviser or reductions from expense offset arrangements and do not represent the amount paid by the Fund during periods when reimbursements or reductions occur. Expenses net of fee waivers reflect expenses after reimbursement by the investment adviser but prior to reductions from expense offset arrangements. Expenses net of all reductions represent the net expenses paid by the Fund.
H Amount represents less than .005%.
I Amount does not include the portfolio activity of any underlying Fidelity Central Funds.
J Portfolio turnover rate excludes securities received or delivered in-kind.
See accompanying notes which are an integral part of the financial statements.
Fidelity® Consumer Staples Central Fund
Performance: The Bottom Line
Average annual total return reflects the change in the value of an investment, assuming reinvestment of distributions from dividend income and capital gains (the profits earned upon the sale of securities that have grown in value, if any) and assuming a constant rate of performance each year. The hypothetical investment and the average annual total returns do not reflect the deduction of taxes that a shareholder would pay on fund distributions or the redemption of fund shares. During periods of reimbursement by Fidelity, a fund’s total return will be greater than it would be had the reimbursement not occurred. How a fund did yesterday is no guarantee of how it will do tomorrow.
Average Annual Total Returns
| For the periods ended September 30, 2019 | Past 1 year | Past 5 years | Past 10 years |
| Fidelity® Consumer Staples Central Fund | 12.63% | 6.49% | 10.90% |
$10,000 Over 10 Years
Let's say hypothetically that $10,000 was invested in Fidelity® Consumer Staples Central Fund on September 30, 2009.
The chart shows how the value of your investment would have changed, and also shows how the S&P 500® Index performed over the same period.
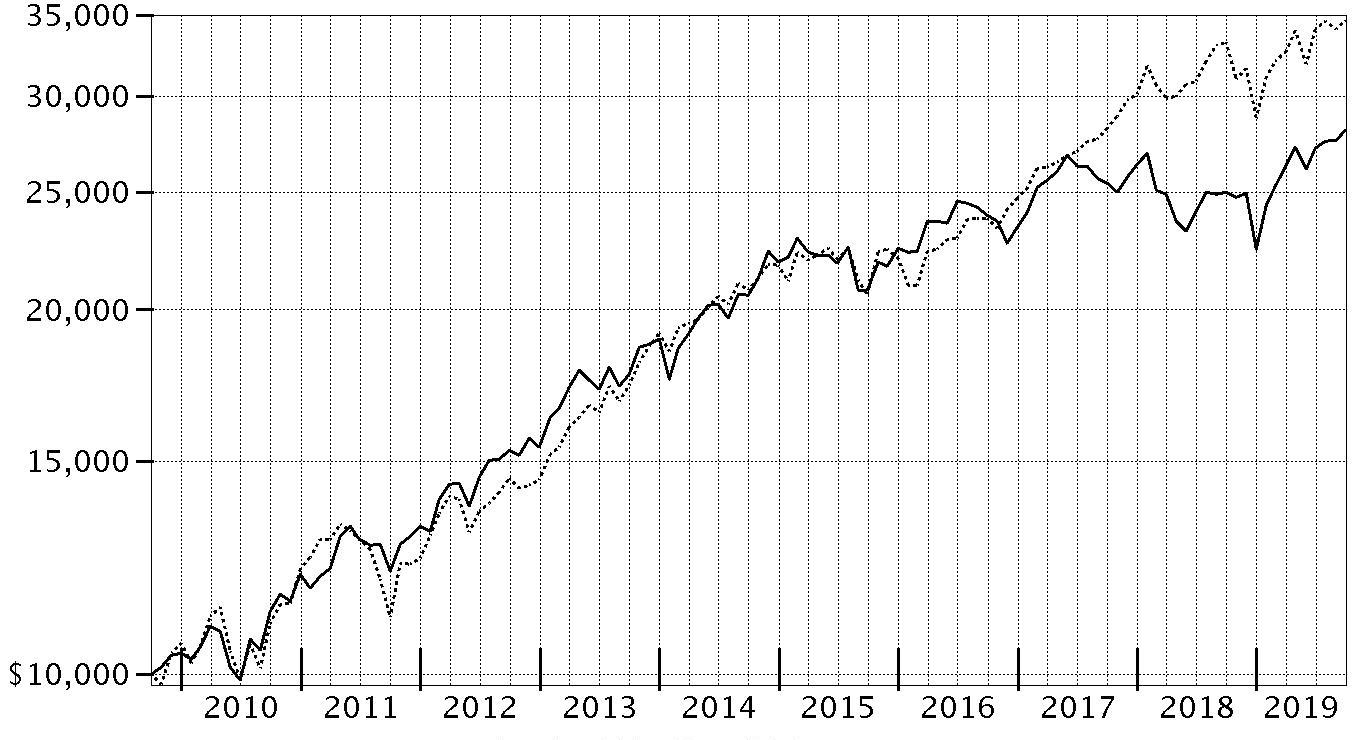
| Period Ending Values | ||
| $28,132 | Fidelity® Consumer Staples Central Fund | |
| $34,674 | S&P 500® Index | |
Fidelity® Consumer Staples Central Fund
Management's Discussion of Fund Performance
Market Recap: The S&P 500® index gained 4.25% for the 12 months ending September 30, 2019, a choppy period in which stocks seesawed due to trade tension, interest rates, economic data and an inverted yield curve, among other factors. Equities began the new year on a high note after enduring a historically volatile final quarter of 2018. Upbeat company earnings and outlooks, along with signs the Federal Reserve may pause on rates, boosted stocks to an all-time high on April 30. In May, however, volatility spiked and the index sunk as trade negotiations between the U.S. and China broke down and tit-for-tat tariff fighting ensued. The bull market roared back in June and recorded a series of highs in July, when the Fed, affirming a dovish shift in policy, cut interest rates for the first time since 2008. Volatility intensified in August, however, as the U.S. Treasury yield curve inverted for the first time since 2007, which some investors viewed as a sign the world's biggest economy could be heading for recession. For the full 12 months, three defensive sectors led the way: utilities (+27%), real estate (+25%) and consumer staples (+17%). Information technology rose about 9%, boosted by software & services (+14%), the market’s largest industry. Communication services stocks gained roughly 6%. In contrast, energy (-19%) was by far the weakest sector – slipping on lower oil prices – followed by health care (-4%) and industrials (+1%). Other laggards included consumer discretionary (+2%), materials (+3%) and financials (+4%).Comments from Portfolio Manager James McElligott: For the fiscal year, the fund gained 12.63%, trailing the 14.80% advance of the MSCI IMI Consumer Staples 25/50 Index but well ahead of the S&P 500®. Among the more sizable components of the sector index, household products, hypermarkets & super centers, soft drinks and packaged foods & meats stocks led the way, whereas tobacco was a notable laggard. In terms of the fund’s performance specifically, stock picks and an underweighting in household products detracted the most this period. A meaningful underweighting in hypermarkets & super centers, along with an overweighting in tobacco, also hurt the fund’s relative result. The biggest individual detractor was household products company Spectrum Brands Holdings (-27%), which saw its stock decline as investors awaited the results of a restructuring under a new CEO. Elsewhere, shares of beauty products company Coty (-13%) fell after management unveiled a four-year strategic plan that disappointed market participants. Both Coty and Spectrum were overweightings and top-10 holdings at period end. Conversely, security selection in the packaged foods & meats segment, as well as the decision to underweight drug retail stocks, aided the portfolio’s relative performance the past 12 months. Also, the fund’s foreign holdings contributed overall despite the drag from currency fluctuations. As it relates to individual standouts, a non-benchmark stake in Brazil-based protein producer JBS (+244%) led the way, benefiting from a disruption in global pork supply and the possibility of a U.S. stock listing.The views expressed above reflect those of the portfolio manager(s) only through the end of the period as stated on the cover of this report and do not necessarily represent the views of Fidelity or any other person in the Fidelity organization. Any such views are subject to change at any time based upon market or other conditions and Fidelity disclaims any responsibility to update such views. These views may not be relied on as investment advice and, because investment decisions for a Fidelity fund are based on numerous factors, may not be relied on as an indication of trading intent on behalf of any Fidelity fund.
Note to Shareholders: On November 1, 2019, Nicola Stafford became sole Portfolio Manager of the fund, succeeding James McElligott.Fidelity® Consumer Staples Central Fund
Investment Summary (Unaudited)
Top Ten Stocks as of September 30, 2019
| % of fund's net assets | |
| Procter & Gamble Co. | 10.3 |
| The Coca-Cola Co. | 9.9 |
| Philip Morris International, Inc. | 5.7 |
| Altria Group, Inc. | 5.0 |
| Monster Beverage Corp. | 4.7 |
| Coty, Inc. Class A | 4.6 |
| PepsiCo, Inc. | 4.6 |
| Spectrum Brands Holdings, Inc. | 3.9 |
| Mondelez International, Inc. | 3.2 |
| Costco Wholesale Corp. | 2.8 |
| 54.7 |
Top Industries (% of fund's net assets)
| As of September 30, 2019 | ||
| Beverages | 25.4% | |
| Food Products | 19.2% | |
| Household Products | 18.8% | |
| Personal Products | 12.0% | |
| Tobacco | 11.5% | |
| All Others* | 13.1% | |

* Includes short-term investments and net other assets (liabilities).
Fidelity® Consumer Staples Central Fund
Schedule of Investments September 30, 2019
Showing Percentage of Net Assets
| Common Stocks - 99.7% | |||
| Shares | Value | ||
| Beverages - 25.4% | |||
| Brewers - 1.7% | |||
| Anheuser-Busch InBev SA NV | 121,300 | $11,545,278 | |
| Beijing Yanjing Brewery Co. Ltd. (A Shares) | 5,311,006 | 4,316,653 | |
| Boston Beer Co., Inc. Class A (a) | 6,700 | 2,439,336 | |
| Budweiser Brewing Co. APAC Ltd. (a)(b) | 916,300 | 3,296,842 | |
| 21,598,109 | |||
| Distillers & Vintners - 2.3% | |||
| Constellation Brands, Inc. Class A (sub. vtg.) | 134,766 | 27,934,296 | |
| Kweichow Moutai Co. Ltd. (A Shares) | 10,418 | 1,676,009 | |
| 29,610,305 | |||
| Soft Drinks - 21.4% | |||
| Coca-Cola European Partners PLC | 153,358 | 8,503,701 | |
| Coca-Cola FEMSA S.A.B. de CV sponsored ADR | 59,300 | 3,594,766 | |
| Coca-Cola West Co. Ltd. | 36,400 | 818,494 | |
| Fever-Tree Drinks PLC | 1,744 | 51,957 | |
| Keurig Dr. Pepper, Inc. (c) | 526,300 | 14,378,516 | |
| Monster Beverage Corp. (a) | 1,031,178 | 59,870,195 | |
| PepsiCo, Inc. | 423,500 | 58,061,850 | |
| The Coca-Cola Co. | 2,289,661 | 124,649,145 | |
| 269,928,624 | |||
| TOTAL BEVERAGES | 321,137,038 | ||
| Food & Staples Retailing - 11.1% | |||
| Drug Retail - 1.4% | |||
| Walgreens Boots Alliance, Inc. | 313,780 | 17,355,172 | |
| Food Distributors - 3.1% | |||
| Performance Food Group Co. (a) | 121,300 | 5,581,013 | |
| Sysco Corp. | 266,500 | 21,160,100 | |
| U.S. Foods Holding Corp. (a) | 307,008 | 12,618,029 | |
| 39,359,142 | |||
| Food Retail - 2.2% | |||
| Kroger Co. | 966,623 | 24,919,541 | |
| Sprouts Farmers Market LLC (a) | 150,900 | 2,918,406 | |
| 27,837,947 | |||
| Hypermarkets & Super Centers - 4.4% | |||
| BJ's Wholesale Club Holdings, Inc. (a) | 16,100 | 416,507 | |
| Costco Wholesale Corp. | 123,300 | 35,523,963 | |
| Walmart, Inc. | 169,100 | 20,068,788 | |
| 56,009,258 | |||
| TOTAL FOOD & STAPLES RETAILING | 140,561,519 | ||
| Food Products - 19.2% | |||
| Agricultural Products - 1.0% | |||
| Bunge Ltd. | 110,169 | 6,237,769 | |
| Darling International, Inc. (a) | 326,500 | 6,245,945 | |
| 12,483,714 | |||
| Packaged Foods & Meats - 18.2% | |||
| B&G Foods, Inc. Class A (c) | 96,100 | 1,817,251 | |
| Conagra Brands, Inc. | 510,000 | 15,646,800 | |
| Danone SA | 268,012 | 23,606,957 | |
| Freshpet, Inc. (a) | 267,530 | 13,314,968 | |
| General Mills, Inc. | 306,200 | 16,877,744 | |
| JBS SA | 2,110,300 | 16,654,048 | |
| Kellogg Co. | 92,200 | 5,933,070 | |
| Lamb Weston Holdings, Inc. | 38,400 | 2,792,448 | |
| Mondelez International, Inc. | 737,512 | 40,799,164 | |
| Muyuan Foodstuff Co. Ltd. (A Shares) | 365,616 | 3,605,857 | |
| Post Holdings, Inc. (a) | 49,900 | 5,281,416 | |
| SunOpta, Inc. (a) | 165,200 | 297,360 | |
| The Hain Celestial Group, Inc. (a)(c) | 109,289 | 2,346,981 | |
| The J.M. Smucker Co. | 166,800 | 18,351,336 | |
| The Kraft Heinz Co. | 892,500 | 24,931,988 | |
| TreeHouse Foods, Inc. (a) | 271,473 | 15,053,178 | |
| Tyson Foods, Inc. Class A | 235,400 | 20,277,356 | |
| Wens Foodstuffs Group Co. Ltd. (A Shares) | 614,700 | 3,197,178 | |
| 230,785,100 | |||
| TOTAL FOOD PRODUCTS | 243,268,814 | ||
| Household Products - 18.8% | |||
| Household Products - 18.8% | |||
| C&S Paper Co. Ltd. (A Shares) | 3,559,156 | 6,198,842 | |
| Colgate-Palmolive Co. | 301,020 | 22,127,980 | |
| Energizer Holdings, Inc. | 119,300 | 5,199,094 | |
| Essity AB Class B | 762,300 | 22,247,834 | |
| Procter & Gamble Co. | 1,048,093 | 130,361,810 | |
| Reckitt Benckiser Group PLC | 29,720 | 2,320,520 | |
| Spectrum Brands Holdings, Inc. (c) | 945,688 | 49,856,671 | |
| 238,312,751 | |||
| Internet & Direct Marketing Retail - 0.6% | |||
| Internet & Direct Marketing Retail - 0.6% | |||
| Ocado Group PLC (a) | 289,500 | 4,707,501 | |
| The Honest Co., Inc. (a)(d)(e) | 171,220 | 2,499,812 | |
| 7,207,313 | |||
| Multiline Retail - 1.1% | |||
| General Merchandise Stores - 1.1% | |||
| Dollar General Corp. | 27,300 | 4,339,062 | |
| Dollar Tree, Inc. (a) | 80,800 | 9,224,128 | |
| 13,563,190 | |||
| Personal Products - 12.0% | |||
| Personal Products - 12.0% | |||
| Avon Products, Inc. (a) | 3,388,313 | 14,908,577 | |
| Coty, Inc. Class A | 5,532,497 | 58,146,543 | |
| Edgewell Personal Care Co. (a) | 811,500 | 26,365,635 | |
| Estee Lauder Companies, Inc. Class A | 35,967 | 7,155,635 | |
| Ontex Group NV | 744,700 | 13,400,932 | |
| Unilever NV | 530,554 | 31,858,390 | |
| 151,835,712 | |||
| Tobacco - 11.5% | |||
| Tobacco - 11.5% | |||
| Altria Group, Inc. | 1,552,767 | 63,508,170 | |
| British American Tobacco PLC sponsored ADR | 250,146 | 9,230,387 | |
| Philip Morris International, Inc. | 950,253 | 72,152,710 | |
| 144,891,267 | |||
| TOTAL COMMON STOCKS | |||
| (Cost $1,127,705,871) | 1,260,777,604 | ||
| Money Market Funds - 1.7% | |||
| Fidelity Cash Central Fund 1.96% (f) | 3,273,076 | 3,273,731 | |
| Fidelity Securities Lending Cash Central Fund 1.96% (f)(g) | 17,916,479 | 17,918,270 | |
| TOTAL MONEY MARKET FUNDS | |||
| (Cost $21,192,001) | 21,192,001 | ||
| TOTAL INVESTMENT IN SECURITIES - 101.4% | |||
| (Cost $1,148,897,872) | 1,281,969,605 | ||
| NET OTHER ASSETS (LIABILITIES) - (1.4)% | (17,507,518) | ||
| NET ASSETS - 100% | $1,264,462,087 |
Legend
(a) Non-income producing
(b) Security exempt from registration under Rule 144A of the Securities Act of 1933. These securities may be resold in transactions exempt from registration, normally to qualified institutional buyers. At the end of the period, the value of these securities amounted to $3,296,842 or 0.3% of net assets.
(c) Security or a portion of the security is on loan at period end.
(d) Restricted securities - Investment in securities not registered under the Securities Act of 1933 (excluding 144A issues). At the end of the period, the value of restricted securities (excluding 144A issues) amounted to $2,499,812 or 0.2% of net assets.
(e) Level 3 security
(f) Affiliated fund that is generally available only to investment companies and other accounts managed by Fidelity Investments. The rate quoted is the annualized seven-day yield of the fund at period end. A complete unaudited listing of the fund's holdings as of its most recent quarter end is available upon request. In addition, each Fidelity Central Fund's financial statements, which are not covered by the Fund's Report of Independent Registered Public Accounting Firm, are available on the SEC's website or upon request.
(g) Investment made with cash collateral received from securities on loan.
Additional information on each restricted holding is as follows:
| Security | Acquisition Date | Acquisition Cost |
| The Honest Co., Inc. | 8/28/18 | $1,921,088 |
Affiliated Central Funds
Information regarding fiscal year to date income earned by the Fund from investments in Fidelity Central Funds is as follows:
| Fund | Income earned |
| Fidelity Cash Central Fund | $134,733 |
| Fidelity Securities Lending Cash Central Fund | 627,441 |
| Total | $762,174 |
Amounts in the income column in the above table include any capital gain distributions from underlying funds, which are presented in the corresponding line-item in the Statement of Operations, if applicable. Amount for Fidelity Securities Lending Cash Central Fund represents the income earned on investing cash collateral, less rebates paid to borrowers and any lending agent fees associated with the loan, plus any premium payments received for lending certain types of securities.
Investment Valuation
The following is a summary of the inputs used, as of September 30, 2019, involving the Fund's assets and liabilities carried at fair value. The inputs or methodology used for valuing securities may not be an indication of the risk associated with investing in those securities. For more information on valuation inputs, and their aggregation into the levels used below, please refer to the Investment Valuation section in the accompanying Notes to Financial Statements.
| Valuation Inputs at Reporting Date: | ||||
| Description | Total | Level 1 | Level 2 | Level 3 |
| Investments in Securities: | ||||
| Common Stocks | $1,260,777,604 | $1,188,128,153 | $70,149,639 | $2,499,812 |
| Money Market Funds | 21,192,001 | 21,192,001 | -- | -- |
| Total Investments in Securities: | $1,281,969,605 | $1,209,320,154 | $70,149,639 | $2,499,812 |
Other Information
Distribution of investments by country or territory of incorporation, as a percentage of Total Net Assets, is as follows (Unaudited):
| United States of America | 85.8% |
| Netherlands | 2.5% |
| United Kingdom | 2.1% |
| Belgium | 1.9% |
| France | 1.9% |
| Sweden | 1.8% |
| China | 1.5% |
| Brazil | 1.3% |
| Others (Individually Less Than 1%) | 1.2% |
| 100.0% |
See accompanying notes which are an integral part of the financial statements.
Fidelity® Consumer Staples Central Fund
Financial Statements
Statement of Assets and Liabilities
| September 30, 2019 | ||
| Assets | ||
| Investment in securities, at value (including securities loaned of $17,588,230) — See accompanying schedule: Unaffiliated issuers (cost $1,127,705,871) | $1,260,777,604 | |
| Fidelity Central Funds (cost $21,192,001) | 21,192,001 | |
| Total Investment in Securities (cost $1,148,897,872) | $1,281,969,605 | |
| Cash | 363,716 | |
| Receivable for fund shares sold | 166,012 | |
| Dividends receivable | 4,195,783 | |
| Distributions receivable from Fidelity Central Funds | 10,622 | |
| Total assets | 1,286,705,738 | |
| Liabilities | ||
| Payable for investments purchased | $3,582,765 | |
| Payable for fund shares redeemed | 722,097 | |
| Other payables and accrued expenses | 21,184 | |
| Collateral on securities loaned | 17,917,605 | |
| Total liabilities | 22,243,651 | |
| Net Assets | $1,264,462,087 | |
| Net Assets consist of: | ||
| Paid in capital | $1,157,169,365 | |
| Total accumulated earnings (loss) | 107,292,722 | |
| Net Assets, for 6,159,933 shares outstanding | $1,264,462,087 | |
| Net Asset Value, offering price and redemption price per share ($1,264,462,087 ÷ 6,159,933 shares) | $205.27 |
See accompanying notes which are an integral part of the financial statements.
Statement of Operations
| Year ended September 30, 2019 | ||
| Investment Income | ||
| Dividends | $35,578,318 | |
| Income from Fidelity Central Funds (including $627,441 from security lending) | 762,174 | |
| Total income | 36,340,492 | |
| Expenses | ||
| Custodian fees and expenses | $29,701 | |
| Independent directors' fees and expenses | 7,179 | |
| Interest | 6,859 | |
| Miscellaneous | 14 | |
| Total expenses before reductions | 43,753 | |
| Expense reductions | (640) | |
| Total expenses after reductions | 43,113 | |
| Net investment income (loss) | 36,297,379 | |
| Realized and Unrealized Gain (Loss) | ||
| Net realized gain (loss) on: | ||
| Investment securities: | ||
| Unaffiliated issuers | 3,644,400 | |
| Redemptions in-kind with affiliated entities | 17,531,133 | |
| Fidelity Central Funds | 665 | |
| Foreign currency transactions | 1,426 | |
| Total net realized gain (loss) | 21,177,624 | |
| Change in net unrealized appreciation (depreciation) on: | ||
| Investment securities: | ||
| Unaffiliated issuers | 93,503,981 | |
| Assets and liabilities in foreign currencies | (19,540) | |
| Total change in net unrealized appreciation (depreciation) | 93,484,441 | |
| Net gain (loss) | 114,662,065 | |
| Net increase (decrease) in net assets resulting from operations | $150,959,444 |
See accompanying notes which are an integral part of the financial statements.
Statement of Changes in Net Assets
| Year ended September 30, 2019 | Year ended September 30, 2018 | |
| Increase (Decrease) in Net Assets | ||
| Operations | ||
| Net investment income (loss) | $36,297,379 | $43,585,742 |
| Net realized gain (loss) | 21,177,624 | 150,161,220 |
| Change in net unrealized appreciation (depreciation) | 93,484,441 | (225,399,488) |
| Net increase (decrease) in net assets resulting from operations | 150,959,444 | (31,652,526) |
| Distributions to shareholders | (132,323,878) | – |
| Distributions to shareholders from net investment income | – | (41,880,818) |
| Distributions to shareholders from net realized gain | – | (97,894,284) |
| Total distributions | (132,323,878) | (139,775,102) |
| Affiliated share transactions | ||
| Proceeds from sales of shares | 73,603,356 | 510,816,792 |
| Reinvestment of distributions | 132,323,878 | 139,775,102 |
| Cost of shares redeemed | (265,528,310) | (356,818,908) |
| Net increase (decrease) in net assets resulting from share transactions | (59,601,076) | 293,772,986 |
| Total increase (decrease) in net assets | (40,965,510) | 122,345,358 |
| Net Assets | ||
| Beginning of period | 1,305,427,597 | 1,183,082,239 |
| End of period | $1,264,462,087 | $1,305,427,597 |
| Other Information | ||
| Undistributed net investment income end of period | $4,542,963 | |
| Shares | ||
| Sold | 380,280 | 2,421,167 |
| Issued in reinvestment of distributions | 755,163 | 643,591 |
| Redeemed | (1,354,820) | (1,761,742) |
| Net increase (decrease) | (219,377) | 1,303,016 |
See accompanying notes which are an integral part of the financial statements.
Financial Highlights
Fidelity Consumer Staples Central Fund
| Years ended September 30, | 2019 | 2018 | 2017 | 2016 | 2015 |
| Selected Per–Share Data | |||||
| Net asset value, beginning of period | $204.63 | $233.06 | $228.00 | $202.36 | $205.11 |
| Income from Investment Operations | |||||
| Net investment income (loss)A | 5.55 | 7.25B | 6.10 | 5.30 | 5.31 |
| Net realized and unrealized gain (loss) | 16.16 | (10.43) | 7.65 | 25.50 | (2.84) |
| Total from investment operations | 21.71 | (3.18) | 13.75 | 30.80 | 2.47 |
| Distributions from net investment income | (5.56) | (6.98) | (5.62) | (5.16) | (5.22) |
| Distributions from net realized gain | (15.51) | (18.26) | (3.07) | – | – |
| Total distributions | (21.07) | (25.25)C | (8.69) | (5.16) | (5.22) |
| Net asset value, end of period | $205.27 | $204.63 | $233.06 | $228.00 | $202.36 |
| Total ReturnD | 12.63% | (1.76)% | 6.23% | 15.29% | 1.07% |
| Ratios to Average Net AssetsE,F | |||||
| Expenses before reductionsG | -% | -% | -% | -% | -% |
| Expenses net of fee waivers, if anyG | -% | -% | -% | -% | -% |
| Expenses net of all reductionsG | -% | -% | -% | -% | -% |
| Net investment income (loss) | 2.85% | 3.42%B | 2.62% | 2.38% | 2.45% |
| Supplemental Data | |||||
| Net assets, end of period (000 omitted) | $1,264,462 | $1,305,428 | $1,183,082 | $1,284,774 | $1,097,772 |
| Portfolio turnover rateH | 36%I | 79%I | 54%I | 50% | 65% |
A Calculated based on average shares outstanding during the period.
B Net investment income per share reflects a large, non-recurring dividend which amounted to $1.86 per share. Excluding this non-recurring dividend, the ratio of net investment income (loss) to average net assets would have been 2.55%.
C Total distributions of $25.25 per share is comprised of distributions from net investment income of $6.982 and distributions from net realized gain of $18.264 per share.
D Total returns would have been lower if certain expenses had not been reduced during the applicable periods shown.
E Fees and expenses of any underlying Fidelity Central Funds are not included in the Fund's expense ratio. The Fund indirectly bears its proportionate share of the expenses of any underlying Fidelity Central Funds.
F Expense ratios reflect operating expenses of the Fund. Expenses before reductions do not reflect amounts reimbursed by the investment adviser or reductions from expense offset arrangements and do not represent the amount paid by the Fund during periods when reimbursements or reductions occur. Expenses net of fee waivers reflect expenses after reimbursement by the investment adviser but prior to reductions from expense offset arrangements. Expenses net of all reductions represent the net expenses paid by the Fund.
G Amount represents less than .005%.
H Amount does not include the portfolio activity of any underlying Fidelity Central Funds.
I Portfolio turnover rate excludes securities received or delivered in-kind.
See accompanying notes which are an integral part of the financial statements.
Fidelity® Energy Central Fund
Performance: The Bottom Line
Average annual total return reflects the change in the value of an investment, assuming reinvestment of distributions from dividend income and capital gains (the profits earned upon the sale of securities that have grown in value, if any) and assuming a constant rate of performance each year. The hypothetical investment and the average annual total returns do not reflect the deduction of taxes that a shareholder would pay on fund distributions or the redemption of fund shares. During periods of reimbursement by Fidelity, a fund’s total return will be greater than it would be had the reimbursement not occurred. How a fund did yesterday is no guarantee of how it will do tomorrow.
Average Annual Total Returns
| For the periods ended September 30, 2019 | Past 1 year | Past 5 years | Past 10 years |
| Fidelity® Energy Central Fund | (27.41)% | (6.94)% | 1.64% |
$10,000 Over 10 Years
Let's say hypothetically that $10,000 was invested in Fidelity® Energy Central Fund on September 30, 2009.
The chart shows how the value of your investment would have changed, and also shows how the S&P 500® Index performed over the same period.
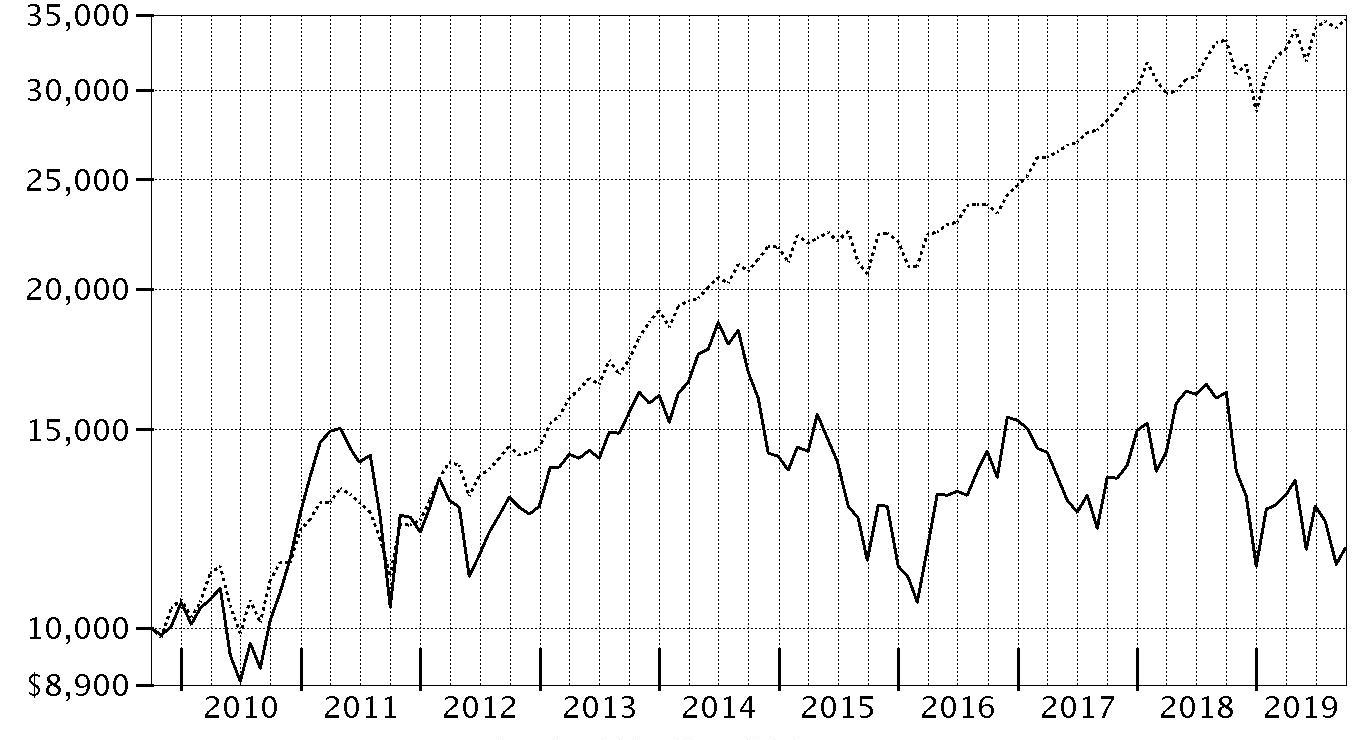
| Period Ending Values | ||
| $11,762 | Fidelity® Energy Central Fund | |
| $34,674 | S&P 500® Index | |
Fidelity® Energy Central Fund
Management's Discussion of Fund Performance
Market Recap: The S&P 500® index gained 4.25% for the 12 months ending September 30, 2019, a choppy period in which stocks seesawed due to trade tension, interest rates, economic data and an inverted yield curve, among other factors. Equities began the new year on a high note after enduring a historically volatile final quarter of 2018. Upbeat company earnings and outlooks, along with signs the Federal Reserve may pause on rates, boosted stocks to an all-time high on April 30. In May, however, volatility spiked and the index sunk as trade negotiations between the U.S. and China broke down and tit-for-tat tariff fighting ensued. The bull market roared back in June and recorded a series of highs in July, when the Fed, affirming a dovish shift in policy, cut interest rates for the first time since 2008. Volatility intensified in August, however, as the U.S. Treasury yield curve inverted for the first time since 2007, which some investors viewed as a sign the world's biggest economy could be heading for recession. For the full 12 months, three defensive sectors led the way: utilities (+27%), real estate (+25%) and consumer staples (+17%). Information technology rose about 9%, boosted by software & services (+14%), the market’s largest industry. Communication services stocks gained roughly 6%. In contrast, energy (-19%) was by far the weakest sector – slipping on lower oil prices – followed by health care (-4%) and industrials (+1%). Other laggards included consumer discretionary (+2%), materials (+3%) and financials (+4%).Comments from Co-Portfolio Manager John Dowd: For the fiscal year, the fund returned -27.41%, trailing the -23.31% result of the MSCI U.S. IMI Energy 25/50 Index, as well as the S&P 500. The backdrop for energy stocks was challenging the past 12 months. A number of factors, including shifting monetary policy from the U.S. Federal Reserve, concerns about slowing global economic growth and ongoing trade disputes, fueled considerable crude-oil price volatility – a key driver of energy stock performance. Versus the MSCI sector index, unfavorable industry positioning was the major detractor. Specifically, my longstanding strategy of overweighting oil & gas exploration & production (E&P) hurt most, as this industry returned -37%. Overweighting integrated oil & gas also detracted, as it returned -11%. Positioning in oil & gas storage & transportation also hampered our relative result. Conversely, stock selection added value, led by my picks in oil & gas refining & marketing, while an overweighting here also helped. Underweighting oil & gas equipment & services was another notable contributor. A significantly smaller-than-index stake in integrated energy producer Exxon Mobil (-13%) was the fund’s biggest individual relative detractor, followed by a non-index stake in E&P company Encana (-66%). Conversely, underweighting energy services company Schlumberger (-41%) was the fund’s top individual contributor versus the index. Lastly, overweighting oil & gas refining and distribution company Valero Energy was helpful, as its shares returned -22%.The views expressed above reflect those of the portfolio manager(s) only through the end of the period as stated on the cover of this report and do not necessarily represent the views of Fidelity or any other person in the Fidelity organization. Any such views are subject to change at any time based upon market or other conditions and Fidelity disclaims any responsibility to update such views. These views may not be relied on as investment advice and, because investment decisions for a Fidelity fund are based on numerous factors, may not be relied on as an indication of trading intent on behalf of any Fidelity fund.
Fidelity® Energy Central Fund
Investment Summary (Unaudited)
Top Ten Stocks as of September 30, 2019
| % of fund's net assets | |
| Chevron Corp. | 16.4 |
| Valero Energy Corp. | 7.5 |
| EOG Resources, Inc. | 6.4 |
| Exxon Mobil Corp. | 5.3 |
| Pioneer Natural Resources Co. | 4.8 |
| Phillips 66 Co. | 4.8 |
| ConocoPhillips Co. | 4.7 |
| Marathon Petroleum Corp. | 3.9 |
| Occidental Petroleum Corp. | 3.8 |
| Diamondback Energy, Inc. | 3.7 |
| 61.3 |
Top Industries (% of fund's net assets)
| As of September 30, 2019 | ||
| Oil, Gas & Consumable Fuels | 91.8% | |
| Energy Equipment & Services | 6.0% | |
| Electrical Equipment | 0.6% | |
| Chemicals | 0.1% | |
| Machinery | 0.1% | |
| All Others* | 1.4% | |

* Includes short-term investments and net other assets (liabilities).
Fidelity® Energy Central Fund
Schedule of Investments September 30, 2019
Showing Percentage of Net Assets
| Common Stocks - 98.6% | |||
| Shares | Value | ||
| Chemicals - 0.1% | |||
| Commodity Chemicals - 0.1% | |||
| LG Chemical Ltd. | 3,873 | $967,346 | |
| Electrical Equipment - 0.6% | |||
| Electrical Components & Equipment - 0.6% | |||
| Sunrun, Inc. (a)(b) | 255,336 | 4,265,388 | |
| Energy Equipment & Services - 6.0% | |||
| Oil & Gas Drilling - 0.7% | |||
| AKITA Drilling Ltd. Class A (non-vtg.) | 182,714 | 150,325 | |
| Odfjell Drilling Ltd. (a) | 547,937 | 1,720,123 | |
| Patterson-UTI Energy, Inc. | 146,578 | 1,253,242 | |
| Shelf Drilling Ltd. (a)(c) | 825,222 | 2,022,770 | |
| 5,146,460 | |||
| Oil & Gas Equipment & Services - 5.3% | |||
| Baker Hughes, A GE Co. Class A | 638,854 | 14,821,413 | |
| Dmc Global, Inc. (b) | 20,254 | 890,771 | |
| Forum Energy Technologies, Inc. (a) | 502,416 | 778,745 | |
| Halliburton Co. | 182,687 | 3,443,650 | |
| RigNet, Inc. (a) | 287,501 | 2,228,133 | |
| Schlumberger Ltd. | 352,336 | 12,039,321 | |
| Solaris Oilfield Infrastructure, Inc. Class A (b) | 405,849 | 5,446,494 | |
| Tenaris SA sponsored ADR (b) | 103,862 | 2,199,797 | |
| 41,848,324 | |||
| TOTAL ENERGY EQUIPMENT & SERVICES | 46,994,784 | ||
| Machinery - 0.1% | |||
| Industrial Machinery - 0.1% | |||
| ProPetro Holding Corp. (a) | 110,847 | 1,007,599 | |
| Oil, Gas & Consumable Fuels - 91.8% | |||
| Integrated Oil & Gas - 26.6% | |||
| Chevron Corp. | 1,087,542 | 128,982,482 | |
| Exxon Mobil Corp. | 584,838 | 41,295,411 | |
| Occidental Petroleum Corp. | 680,671 | 30,269,439 | |
| Suncor Energy, Inc. | 273,094 | 8,614,257 | |
| 209,161,589 | |||
| Oil & Gas Exploration & Production - 42.2% | |||
| Berry Petroleum Corp. | 342,303 | 3,203,956 | |
| Black Stone Minerals LP | 65,370 | 930,869 | |
| Brigham Minerals, Inc. Class A (b) | 98,871 | 1,967,533 | |
| Cabot Oil & Gas Corp. | 618,181 | 10,861,440 | |
| Canadian Natural Resources Ltd. | 94,359 | 2,510,590 | |
| Carrizo Oil & Gas, Inc. (a) | 44,732 | 384,024 | |
| Cimarex Energy Co. | 216,939 | 10,400,056 | |
| Concho Resources, Inc. | 39,985 | 2,714,982 | |
| ConocoPhillips Co. | 648,266 | 36,938,197 | |
| Continental Resources, Inc. | 317,076 | 9,762,770 | |
| Devon Energy Corp. | 753,318 | 18,124,831 | |
| Diamondback Energy, Inc. | 324,143 | 29,143,697 | |
| Encana Corp. (Toronto) | 1,279,134 | 5,860,545 | |
| EOG Resources, Inc. | 673,281 | 49,970,916 | |
| EQT Corp. | 46,940 | 499,442 | |
| Hess Corp. | 316,640 | 19,150,387 | |
| Kosmos Energy Ltd. | 1,177,231 | 7,345,921 | |
| Lundin Petroleum AB | 199,181 | 5,974,995 | |
| Magnolia Oil & Gas Corp. Class A (a)(b) | 879,372 | 9,761,029 | |
| Murphy Oil Corp. | 85,432 | 1,888,902 | |
| National Energy Services Reunited Corp. (a) | 10,751 | 71,817 | |
| Noble Energy, Inc. | 964,804 | 21,669,498 | |
| Northern Oil & Gas, Inc. (a)(b) | 2,442,967 | 4,788,215 | |
| Parex Resources, Inc. (a) | 719,931 | 11,031,135 | |
| Parsley Energy, Inc. Class A | 561,481 | 9,432,881 | |
| PDC Energy, Inc. (a) | 219,416 | 6,088,794 | |
| Pioneer Natural Resources Co. | 298,429 | 37,533,415 | |
| Texas Pacific Land Trust (b) | 768 | 498,870 | |
| Viper Energy Partners LP | 487,729 | 13,495,461 | |
| 332,005,168 | |||
| Oil & Gas Refining & Marketing - 18.9% | |||
| Delek U.S. Holdings, Inc. | 235,248 | 8,539,502 | |
| Marathon Petroleum Corp. | 507,597 | 30,836,518 | |
| Par Pacific Holdings, Inc. (a) | 328,385 | 7,506,881 | |
| Phillips 66 Co. | 365,711 | 37,448,806 | |
| Reliance Industries Ltd. | 246,298 | 4,644,780 | |
| Valero Energy Corp. | 692,286 | 59,010,459 | |
| World Fuel Services Corp. | 10,367 | 414,058 | |
| 148,401,004 | |||
| Oil & Gas Storage & Transport - 4.1% | |||
| Cheniere Energy, Inc. (a) | 283,077 | 17,850,836 | |
| Enterprise Products Partners LP | 287,493 | 8,216,550 | |
| Golar LNG Ltd. | 91,383 | 1,187,065 | |
| Noble Midstream Partners LP (d) | 45,454 | 1,096,350 | |
| Scorpio Tankers, Inc. | 56,059 | 1,668,316 | |
| Teekay LNG Partners LP | 48,379 | 660,373 | |
| The Williams Companies, Inc. | 58,921 | 1,417,639 | |
| 32,097,129 | |||
| TOTAL OIL, GAS & CONSUMABLE FUELS | 721,664,890 | ||
| TOTAL COMMON STOCKS | |||
| (Cost $819,456,450) | 774,900,007 | ||
| Money Market Funds - 3.4% | |||
| Fidelity Cash Central Fund 1.96% (e) | 10,641,260 | 10,643,388 | |
| Fidelity Securities Lending Cash Central Fund 1.96% (e)(f) | 15,937,470 | 15,939,063 | |
| TOTAL MONEY MARKET FUNDS | |||
| (Cost $26,582,451) | 26,582,451 | ||
| TOTAL INVESTMENT IN SECURITIES - 102.0% | |||
| (Cost $846,038,901) | 801,482,458 | ||
| NET OTHER ASSETS (LIABILITIES) - (2.0)% | (15,564,058) | ||
| NET ASSETS - 100% | $785,918,400 |
Legend
(a) Non-income producing
(b) Security or a portion of the security is on loan at period end.
(c) Security exempt from registration under Rule 144A of the Securities Act of 1933. These securities may be resold in transactions exempt from registration, normally to qualified institutional buyers. At the end of the period, the value of these securities amounted to $2,022,770 or 0.3% of net assets.
(d) Restricted securities - Investment in securities not registered under the Securities Act of 1933 (excluding 144A issues). At the end of the period, the value of restricted securities (excluding 144A issues) amounted to $1,096,350 or 0.1% of net assets.
(e) Affiliated fund that is generally available only to investment companies and other accounts managed by Fidelity Investments. The rate quoted is the annualized seven-day yield of the fund at period end. A complete unaudited listing of the fund's holdings as of its most recent quarter end is available upon request. In addition, each Fidelity Central Fund's financial statements, which are not covered by the Fund's Report of Independent Registered Public Accounting Firm, are available on the SEC's website or upon request.
(f) Investment made with cash collateral received from securities on loan.
Additional information on each restricted holding is as follows:
| Security | Acquisition Date | Acquisition Cost |
| Noble Midstream Partners LP | 6/21/17 | $1,838,614 |
Affiliated Central Funds
Information regarding fiscal year to date income earned by the Fund from investments in Fidelity Central Funds is as follows:
| Fund | Income earned |
| Fidelity Cash Central Fund | $182,389 |
| Fidelity Securities Lending Cash Central Fund | 54,641 |
| Total | $237,030 |
Amounts in the income column in the above table include any capital gain distributions from underlying funds, which are presented in the corresponding line-item in the Statement of Operations, if applicable. Amount for Fidelity Securities Lending Cash Central Fund represents the income earned on investing cash collateral, less rebates paid to borrowers and any lending agent fees associated with the loan, plus any premium payments received for lending certain types of securities.
Investment Valuation
All investments are categorized as Level 1 under the Fair Value Hierarchy. The inputs or methodology used for valuing securities may not be an indication of the risk associated with investing in those securities. For more information on valuation inputs please refer to the Investment Valuation section in the accompanying Notes to Financial Statements.
See accompanying notes which are an integral part of the financial statements.
Fidelity® Energy Central Fund
Financial Statements
Statement of Assets and Liabilities
| September 30, 2019 | ||
| Assets | ||
| Investment in securities, at value (including securities loaned of $15,351,622) — See accompanying schedule: Unaffiliated issuers (cost $819,456,450) | $774,900,007 | |
| Fidelity Central Funds (cost $26,582,451) | 26,582,451 | |
| Total Investment in Securities (cost $846,038,901) | $801,482,458 | |
| Receivable for fund shares sold | 105,225 | |
| Dividends receivable | 778,705 | |
| Distributions receivable from Fidelity Central Funds | 21,466 | |
| Other receivables | 10,925 | |
| Total assets | 802,398,779 | |
| Liabilities | ||
| Payable for fund shares redeemed | $457,221 | |
| Other payables and accrued expenses | 89,283 | |
| Collateral on securities loaned | 15,933,875 | |
| Total liabilities | 16,480,379 | |
| Net Assets | $785,918,400 | |
| Net Assets consist of: | ||
| Paid in capital | $966,087,831 | |
| Total accumulated earnings (loss) | (180,169,431) | |
| Net Assets, for 8,101,920 shares outstanding | $785,918,400 | |
| Net Asset Value, offering price and redemption price per share ($785,918,400 ÷ 8,101,920 shares) | $97.00 |
See accompanying notes which are an integral part of the financial statements.
Statement of Operations
| Year ended September 30, 2019 | ||
| Investment Income | ||
| Dividends | $21,905,447 | |
| Income from Fidelity Central Funds (including $54,641 from security lending) | 237,030 | |
| Total income | 22,142,477 | |
| Expenses | ||
| Custodian fees and expenses | $23,541 | |
| Independent directors' fees and expenses | 5,529 | |
| Miscellaneous | 11 | |
| Total expenses before reductions | 29,081 | |
| Expense reductions | (921) | |
| Total expenses after reductions | 28,160 | |
| Net investment income (loss) | 22,114,317 | |
| Realized and Unrealized Gain (Loss) | ||
| Net realized gain (loss) on: | ||
| Investment securities: | ||
| Unaffiliated issuers | (116,351,633) | |
| Redemptions in-kind with affiliated entities | 4,903,607 | |
| Fidelity Central Funds | 2,140 | |
| Foreign currency transactions | (19,965) | |
| Total net realized gain (loss) | (111,465,851) | |
| Change in net unrealized appreciation (depreciation) on: | ||
| Investment securities: | ||
| Unaffiliated issuers (net of increase in deferred foreign taxes of $69,796) | (241,608,723) | |
| Assets and liabilities in foreign currencies | (3,638) | |
| Total change in net unrealized appreciation (depreciation) | (241,612,361) | |
| Net gain (loss) | (353,078,212) | |
| Net increase (decrease) in net assets resulting from operations | $(330,963,895) |
See accompanying notes which are an integral part of the financial statements.
Statement of Changes in Net Assets
| Year ended September 30, 2019 | Year ended September 30, 2018 | |
| Increase (Decrease) in Net Assets | ||
| Operations | ||
| Net investment income (loss) | $22,114,317 | $17,489,395 |
| Net realized gain (loss) | (111,465,851) | 61,227,627 |
| Change in net unrealized appreciation (depreciation) | (241,612,361) | 121,497,647 |
| Net increase (decrease) in net assets resulting from operations | (330,963,895) | 200,214,669 |
| Distributions to shareholders | (21,448,701) | – |
| Distributions to shareholders from net investment income | – | (20,361,801) |
| Distributions to shareholders from net realized gain | – | (10,516,702) |
| Total distributions | (21,448,701) | (30,878,503) |
| Affiliated share transactions | ||
| Proceeds from sales of shares | 52,526,205 | 428,772,992 |
| Reinvestment of distributions | 21,448,701 | 30,878,503 |
| Cost of shares redeemed | (176,194,350) | (328,763,579) |
| Net increase (decrease) in net assets resulting from share transactions | (102,219,444) | 130,887,916 |
| Total increase (decrease) in net assets | (454,632,040) | 300,224,082 |
| Net Assets | ||
| Beginning of period | 1,240,550,440 | 940,326,358 |
| End of period | $785,918,400 | $1,240,550,440 |
| Other Information | ||
| Distributions in excess of net investment income end of period | $(2,405,832) | |
| Shares | ||
| Sold | 496,108 | 3,357,137 |
| Issued in reinvestment of distributions | 208,321 | 245,845 |
| Redeemed | (1,664,520) | (2,493,997) |
| Net increase (decrease) | (960,091) | 1,108,985 |
See accompanying notes which are an integral part of the financial statements.
Financial Highlights
Fidelity Energy Central Fund
| Years ended September 30, | 2019 | 2018 | 2017 | 2016 | 2015 |
| Selected Per–Share Data | |||||
| Net asset value, beginning of period | $136.90 | $118.24 | $127.46 | $103.49 | $154.78 |
| Income from Investment Operations | |||||
| Net investment income (loss)A | 2.55 | 2.00 | 2.84B | 1.72 | 2.32 |
| Net realized and unrealized gain (loss) | (39.96) | 20.29 | (9.52) | 23.93 | (51.31) |
| Total from investment operations | (37.41) | 22.29 | (6.68) | 25.65 | (48.99) |
| Distributions from net investment income | (2.30)C | (2.36)C | (2.44) | (1.68) | (2.30) |
| Distributions from net realized gain | (.19)C | (1.27)C | (.10) | – | – |
| Total distributions | (2.49) | (3.63) | (2.54) | (1.68) | (2.30) |
| Net asset value, end of period | $97.00 | $136.90 | $118.24 | $127.46 | $103.49 |
| Total ReturnD | (27.41)% | 19.16% | (5.20)% | 25.02% | (31.92)% |
| Ratios to Average Net AssetsE,F | |||||
| Expenses before reductionsG | -% | -% | -% | -% | -% |
| Expenses net of fee waivers, if anyG | -% | -% | -% | -% | -% |
| Expenses net of all reductionsG | -% | -% | -% | -% | -% |
| Net investment income (loss) | 2.38% | 1.55% | 2.32%B | 1.55% | 1.80% |
| Supplemental Data | |||||
| Net assets, end of period (000 omitted) | $785,918 | $1,240,550 | $940,326 | $1,004,987 | $803,804 |
| Portfolio turnover rateH | 54%I | 52%I | 82%I | 105% | 70% |
A Calculated based on average shares outstanding during the period.
B Net investment income per share reflects a large, non-recurring dividend which amounted to $1.32 per share. Excluding this non-recurring dividend, the ratio of net investment income (loss) to average net assets would have been 1.25%.
C The amounts shown reflect certain reclassifications related to book to tax differences that were made in the year shown.
D Total returns would have been lower if certain expenses had not been reduced during the applicable periods shown.
E Fees and expenses of any underlying Fidelity Central Funds are not included in the Fund's expense ratio. The Fund indirectly bears its proportionate share of the expenses of any underlying Fidelity Central Funds.
F Expense ratios reflect operating expenses of the Fund. Expenses before reductions do not reflect amounts reimbursed by the investment adviser or reductions from expense offset arrangements and do not represent the amount paid by the Fund during periods when reimbursements or reductions occur. Expenses net of fee waivers reflect expenses after reimbursement by the investment adviser but prior to reductions from expense offset arrangements. Expenses net of all reductions represent the net expenses paid by the Fund.
G Amount represents less than .005%.
H Amount does not include the portfolio activity of any underlying Fidelity Central Funds.
I Portfolio turnover rate excludes securities received or delivered in-kind.
See accompanying notes which are an integral part of the financial statements.
Fidelity® Financials Central Fund
Performance: The Bottom Line
Average annual total return reflects the change in the value of an investment, assuming reinvestment of distributions from dividend income and capital gains (the profits earned upon the sale of securities that have grown in value, if any) and assuming a constant rate of performance each year. The hypothetical investment and the average annual total returns do not reflect the deduction of taxes that a shareholder would pay on fund distributions or the redemption of fund shares. During periods of reimbursement by Fidelity, a fund’s total return will be greater than it would be had the reimbursement not occurred. How a fund did yesterday is no guarantee of how it will do tomorrow.
Average Annual Total Returns
| For the periods ended September 30, 2019 | Past 1 year | Past 5 years | Past 10 years |
| Fidelity® Financials Central Fund | 6.10% | 8.62% | 8.90% |
$10,000 Over 10 Years
Let's say hypothetically that $10,000 was invested in Fidelity® Financials Central Fund on September 30, 2009.
The chart shows how the value of your investment would have changed, and also shows how the S&P 500® Index performed over the same period.
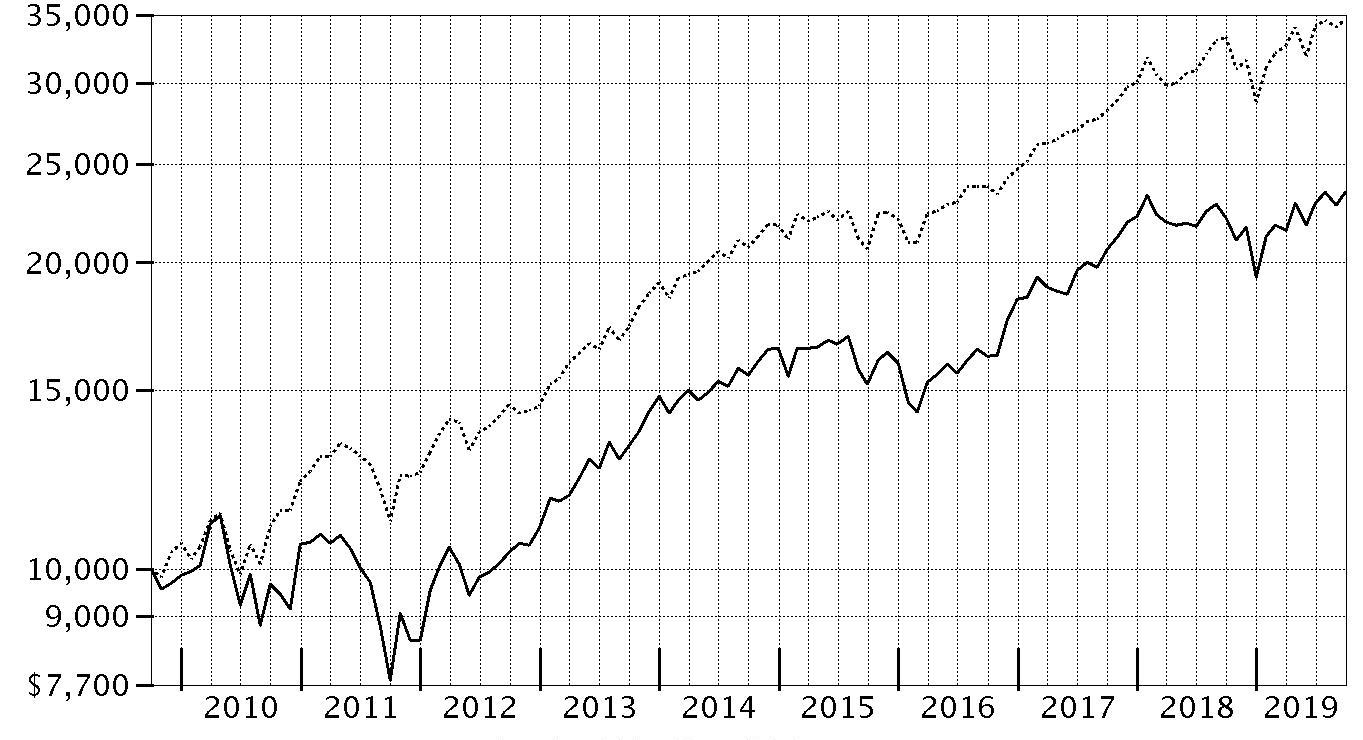
| Period Ending Values | ||
| $23,456 | Fidelity® Financials Central Fund | |
| $34,674 | S&P 500® Index | |
Fidelity® Financials Central Fund
Management's Discussion of Fund Performance
Market Recap: The S&P 500® index gained 4.25% for the 12 months ending September 30, 2019, a choppy period in which stocks seesawed due to trade tension, interest rates, economic data and an inverted yield curve, among other factors. Equities began the new year on a high note after enduring a historically volatile final quarter of 2018. Upbeat company earnings and outlooks, along with signs the Federal Reserve may pause on rates, boosted stocks to an all-time high on April 30. In May, however, volatility spiked and the index sunk as trade negotiations between the U.S. and China broke down and tit-for-tat tariff fighting ensued. The bull market roared back in June and recorded a series of highs in July, when the Fed, affirming a dovish shift in policy, cut interest rates for the first time since 2008. Volatility intensified in August, however, as the U.S. Treasury yield curve inverted for the first time since 2007, which some investors viewed as a sign the world's biggest economy could be heading for recession. For the full 12 months, three defensive sectors led the way: utilities (+27%), real estate (+25%) and consumer staples (+17%). Information technology rose about 9%, boosted by software & services (+14%), the market’s largest industry. Communication services stocks gained roughly 6%. In contrast, energy (-19%) was by far the weakest sector – slipping on lower oil prices – followed by health care (-4%) and industrials (+1%). Other laggards included consumer discretionary (+2%), materials (+3%) and financials (+4%).Comments from Co-Portfolio Managers Christopher Lee, Samuel Wald and Pierre Sorel: For the fiscal year, the fund returned 6.10%, trailing the 7.02% advance of the MSCI USA IMI Financials and Real Estate Linked Index but beating the S&P 500. After a steep decline in late 2018, financials stocks rallied in 2019, buoyed by lower corporate tax rates and continued U.S. economic growth. Global trade tensions and lower interest rates, however, tempered returns. Versus the MSCI sector index, security selection and an overweighting in consumer finance, positioning in the financial exchanges & data group and stock picks among diversified banks hurt the fund’s result. Individual disappointments included online broker E*TRADE Financial (-15%), which fell due to low interest rates and pricing pressures, and student lender SLM (-20%), which was hurt by increased competition, an upcoming accounting change, and pre-election rhetoric around loan forgiveness. Conversely, stock picks in regional banks and positioning in the asset management & custody banks group aided relative performance. Multi-line insurer Hartford Financial Services Group (+25%) was a top individual contributor, as it benefited from better pricing trends in property & casualty insurance and prospects related to a recent acquisition.The views expressed above reflect those of the portfolio manager(s) only through the end of the period as stated on the cover of this report and do not necessarily represent the views of Fidelity or any other person in the Fidelity organization. Any such views are subject to change at any time based upon market or other conditions and Fidelity disclaims any responsibility to update such views. These views may not be relied on as investment advice and, because investment decisions for a Fidelity fund are based on numerous factors, may not be relied on as an indication of trading intent on behalf of any Fidelity fund.
Fidelity® Financials Central Fund
Investment Summary (Unaudited)
Top Ten Stocks as of September 30, 2019
| % of fund's net assets | |
| Capital One Financial Corp. | 5.8 |
| Citigroup, Inc. | 5.3 |
| Bank of America Corp. | 5.1 |
| The Travelers Companies, Inc. | 4.2 |
| Hartford Financial Services Group, Inc. | 4.2 |
| JPMorgan Chase & Co. | 3.6 |
| Marsh & McLennan Companies, Inc. | 3.6 |
| Cboe Global Markets, Inc. | 3.0 |
| Wells Fargo & Co. | 3.0 |
| Huntington Bancshares, Inc. | 2.9 |
| 40.7 |
Top Industries (% of fund's net assets)
| As of September 30, 2019 | ||
| Banks | 28.7% | |
| Insurance | 19.8% | |
| Equity Real Estate Investment Trusts (Reits) | 19.7% | |
| Consumer Finance | 12.5% | |
| Capital Markets | 11.9% | |
| All Others* | 7.4% | |

* Includes short-term investments and net other assets (liabilities).
Fidelity® Financials Central Fund
Schedule of Investments September 30, 2019
Showing Percentage of Net Assets
| Common Stocks - 99.5% | |||
| Shares | Value | ||
| Banks - 28.7% | |||
| Diversified Banks - 18.3% | |||
| Bank of America Corp. | 5,763,078 | $168,108,985 | |
| Citigroup, Inc. | 2,551,185 | 176,235,860 | |
| JPMorgan Chase & Co. | 1,020,570 | 120,110,883 | |
| Piraeus Bank SA (a) | 1,386,304 | 4,653,886 | |
| Societe Generale Series A | 480,200 | 13,153,691 | |
| State Bank of India (a) | 2,674,400 | 10,251,646 | |
| TCS Group Holding PLC: | |||
| GDR (b) | 269,559 | 4,717,283 | |
| GDR (Reg. S) | 457,288 | 8,002,540 | |
| Wells Fargo & Co. | 1,944,677 | 98,089,508 | |
| 603,324,282 | |||
| Regional Banks - 10.4% | |||
| Banco Inter SA unit | 31,300 | 427,508 | |
| First Horizon National Corp. | 1,864,098 | 30,198,388 | |
| Huntington Bancshares, Inc. | 6,627,497 | 94,574,382 | |
| KeyCorp | 2,951,095 | 52,647,535 | |
| M&T Bank Corp. | 247,128 | 39,038,810 | |
| PNC Financial Services Group, Inc. | 376,998 | 52,840,040 | |
| Signature Bank | 262,146 | 31,253,046 | |
| SunTrust Banks, Inc. | 618,735 | 42,568,968 | |
| 343,548,677 | |||
| TOTAL BANKS | 946,872,959 | ||
| Capital Markets - 11.9% | |||
| Asset Management & Custody Banks - 2.6% | |||
| Affiliated Managers Group, Inc. | 212,470 | 17,709,375 | |
| BlackRock, Inc. Class A | 102,914 | 45,862,595 | |
| State Street Corp. | 385,084 | 22,793,122 | |
| 86,365,092 | |||
| Financial Exchanges & Data - 3.0% | |||
| Cboe Global Markets, Inc. | 857,872 | 98,578,072 | |
| Investment Banking & Brokerage - 6.3% | |||
| E*TRADE Financial Corp. | 1,209,935 | 52,862,060 | |
| Hamilton Lane, Inc. Class A | 211,796 | 12,063,900 | |
| Lazard Ltd. Class A | 749,086 | 26,218,010 | |
| Morgan Stanley | 2,014,184 | 85,945,231 | |
| Tradeweb Markets, Inc. Class A | 77,113 | 2,851,639 | |
| Virtu Financial, Inc. Class A (c) | 1,651,531 | 27,019,047 | |
| 206,959,887 | |||
| TOTAL CAPITAL MARKETS | 391,903,051 | ||
| Consumer Finance - 12.5% | |||
| Consumer Finance - 12.5% | |||
| Ally Financial, Inc. | 677,845 | 22,477,340 | |
| American Express Co. | 686,317 | 81,177,575 | |
| Capital One Financial Corp. | 2,125,874 | 193,412,019 | |
| OneMain Holdings, Inc. | 1,260,911 | 46,250,215 | |
| SLM Corp. | 2,639,465 | 23,293,279 | |
| Synchrony Financial | 1,376,292 | 46,917,794 | |
| 413,528,222 | |||
| Diversified Financial Services - 2.0% | |||
| Multi-Sector Holdings - 1.6% | |||
| Berkshire Hathaway, Inc. Class B (a) | 257,236 | 53,510,233 | |
| Other Diversified Financial Services - 0.4% | |||
| StepStone Group Holdings LLC (d)(e)(f) | 9,063 | 7,250,000 | |
| StepStone Group LP Class A (d)(e)(f) | 9,063 | 7,250,000 | |
| 14,500,000 | |||
| TOTAL DIVERSIFIED FINANCIAL SERVICES | 68,010,233 | ||
| Equity Real Estate Investment Trusts (REITs) - 19.7% | |||
| Diversified REITs - 0.3% | |||
| VEREIT, Inc. | 1,069,937 | 10,463,984 | |
| Health Care REITs - 2.0% | |||
| CareTrust (REIT), Inc. | 294,925 | 6,932,212 | |
| Healthcare Realty Trust, Inc. | 481,722 | 16,137,687 | |
| Ventas, Inc. | 392,904 | 28,693,779 | |
| Welltower, Inc. | 151,871 | 13,767,106 | |
| 65,530,784 | |||
| Hotel & Resort REITs - 0.3% | |||
| RLJ Lodging Trust | 550,654 | 9,355,611 | |
| Industrial REITs - 2.3% | |||
| Americold Realty Trust | 299,114 | 11,088,156 | |
| Prologis, Inc. | 611,391 | 52,102,741 | |
| Terreno Realty Corp. | 262,904 | 13,431,765 | |
| 76,622,662 | |||
| Office REITs - 1.8% | |||
| Alexandria Real Estate Equities, Inc. | 179,121 | 27,591,799 | |
| Boston Properties, Inc. | 145,213 | 18,828,318 | |
| Highwoods Properties, Inc. (SBI) | 179,820 | 8,081,111 | |
| Mack-Cali Realty Corp. | 167,950 | 3,637,797 | |
| 58,139,025 | |||
| Residential REITs - 3.4% | |||
| AvalonBay Communities, Inc. | 125,379 | 26,997,860 | |
| Clipper Realty, Inc. | 316,737 | 3,227,550 | |
| Equity Lifestyle Properties, Inc. | 117,627 | 15,714,967 | |
| Equity Residential (SBI) | 178,471 | 15,394,908 | |
| Essex Property Trust, Inc. | 58,959 | 19,258,957 | |
| Invitation Homes, Inc. | 455,651 | 13,491,826 | |
| UDR, Inc. | 408,898 | 19,823,375 | |
| 113,909,443 | |||
| Retail REITs - 1.9% | |||
| Acadia Realty Trust (SBI) | 650,616 | 18,594,605 | |
| National Retail Properties, Inc. | 336,226 | 18,963,146 | |
| Simon Property Group, Inc. | 39,432 | 6,137,591 | |
| Spirit Realty Capital, Inc. | 192,642 | 9,219,846 | |
| Taubman Centers, Inc. | 227,397 | 9,284,620 | |
| 62,199,808 | |||
| Specialized REITs - 7.7% | |||
| American Tower Corp. | 260,004 | 57,494,685 | |
| Crown Castle International Corp. | 365,658 | 50,830,119 | |
| CubeSmart | 510,015 | 17,799,524 | |
| Digital Realty Trust, Inc. | 102,672 | 13,327,852 | |
| Equinix, Inc. | 75,817 | 43,731,246 | |
| Extra Space Storage, Inc. | 155,431 | 18,157,449 | |
| Four Corners Property Trust, Inc. | 377,503 | 10,675,785 | |
| Outfront Media, Inc. | 188,105 | 5,225,557 | |
| VICI Properties, Inc. | 632,896 | 14,335,094 | |
| Weyerhaeuser Co. | 816,942 | 22,629,293 | |
| 254,206,604 | |||
| TOTAL EQUITY REAL ESTATE INVESTMENT TRUSTS (REITS) | 650,427,921 | ||
| Hotels, Restaurants & Leisure - 0.3% | |||
| Hotels, Resorts & Cruise Lines - 0.3% | |||
| Hilton Grand Vacations, Inc. (a) | 107,088 | 3,426,816 | |
| Marriott International, Inc. Class A | 57,877 | 7,198,162 | |
| 10,624,978 | |||
| Insurance - 19.8% | |||
| Insurance Brokers - 5.7% | |||
| Marsh & McLennan Companies, Inc. | 1,196,650 | 119,724,833 | |
| Willis Group Holdings PLC | 360,728 | 69,609,682 | |
| 189,334,515 | |||
| Multi-Line Insurance - 7.0% | |||
| American International Group, Inc. | 1,668,860 | 92,955,502 | |
| Hartford Financial Services Group, Inc. | 2,285,669 | 138,534,398 | |
| 231,489,900 | |||
| Property & Casualty Insurance - 5.9% | |||
| Beazley PLC | 3,292,761 | 25,182,381 | |
| FNF Group | 641,840 | 28,504,114 | |
| The Travelers Companies, Inc. | 937,199 | 139,352,119 | |
| 193,038,614 | |||
| Reinsurance - 1.2% | |||
| Reinsurance Group of America, Inc. | 252,712 | 40,403,595 | |
| TOTAL INSURANCE | 654,266,624 | ||
| IT Services - 2.4% | |||
| Data Processing & Outsourced Services - 2.4% | |||
| GreenSky, Inc. Class A (a)(c) | 1,126,372 | 7,710,016 | |
| Visa, Inc. Class A | 418,202 | 71,934,926 | |
| 79,644,942 | |||
| Real Estate Management & Development - 0.9% | |||
| Real Estate Development - 0.2% | |||
| Howard Hughes Corp. (a) | 35,897 | 4,652,251 | |
| Real Estate Operating Company - 0.1% | |||
| The RMR Group, Inc. | 79,738 | 3,626,484 | |
| Real Estate Services - 0.6% | |||
| Jones Lang LaSalle, Inc. | 151,387 | 21,051,876 | |
| TOTAL REAL ESTATE MANAGEMENT & DEVELOPMENT | 29,330,611 | ||
| Thrifts & Mortgage Finance - 1.3% | |||
| Thrifts & Mortgage Finance - 1.3% | |||
| Essent Group Ltd. | 624,581 | 29,773,776 | |
| MGIC Investment Corp. | 951,919 | 11,975,141 | |
| 41,748,917 | |||
| TOTAL COMMON STOCKS | |||
| (Cost $2,709,685,500) | 3,286,358,458 | ||
| Money Market Funds - 1.2% | |||
| Fidelity Cash Central Fund 1.96% (g) | 6,466,238 | 6,467,531 | |
| Fidelity Securities Lending Cash Central Fund 1.96% (g)(h) | 31,900,798 | 31,903,988 | |
| TOTAL MONEY MARKET FUNDS | |||
| (Cost $38,371,519) | 38,371,519 | ||
| TOTAL INVESTMENT IN SECURITIES - 100.7% | |||
| (Cost $2,748,057,019) | 3,324,729,977 | ||
| NET OTHER ASSETS (LIABILITIES) - (0.7)% | (22,612,762) | ||
| NET ASSETS - 100% | $3,302,117,215 |
Legend
(a) Non-income producing
(b) Security exempt from registration under Rule 144A of the Securities Act of 1933. These securities may be resold in transactions exempt from registration, normally to qualified institutional buyers. At the end of the period, the value of these securities amounted to $4,717,283 or 0.1% of net assets.
(c) Security or a portion of the security is on loan at period end.
(d) Level 3 security
(e) Investment is owned by a wholly-owned subsidiary (Subsidiary) that is treated as a corporation for U.S. tax purposes.
(f) Restricted securities - Investment in securities not registered under the Securities Act of 1933 (excluding 144A issues). At the end of the period, the value of restricted securities (excluding 144A issues) amounted to $14,500,000 or 0.4% of net assets.
(g) Affiliated fund that is generally available only to investment companies and other accounts managed by Fidelity Investments. The rate quoted is the annualized seven-day yield of the fund at period end. A complete unaudited listing of the fund's holdings as of its most recent quarter end is available upon request. In addition, each Fidelity Central Fund's financial statements, which are not covered by the Fund's Report of Independent Registered Public Accounting Firm, are available on the SEC's website or upon request.
(h) Investment made with cash collateral received from securities on loan.
Additional information on each restricted holding is as follows:
| Security | Acquisition Date | Acquisition Cost |
| StepStone Group Holdings LLC | 8/19/19 | $7,250,000 |
| StepStone Group LP Class A | 8/19/19 | $7,250,000 |
Affiliated Central Funds
Information regarding fiscal year to date income earned by the Fund from investments in Fidelity Central Funds is as follows:
| Fund | Income earned |
| Fidelity Cash Central Fund | $1,271,890 |
| Fidelity Securities Lending Cash Central Fund | 71,516 |
| Total | $1,343,406 |
Amounts in the income column in the above table include any capital gain distributions from underlying funds, which are presented in the corresponding line-item in the Statement of Operations, if applicable. Amount for Fidelity Securities Lending Cash Central Fund represents the income earned on investing cash collateral, less rebates paid to borrowers and any lending agent fees associated with the loan, plus any premium payments received for lending certain types of securities.
Investment Valuation
The following is a summary of the inputs used, as of September 30, 2019, involving the Fund's assets and liabilities carried at fair value. The inputs or methodology used for valuing securities may not be an indication of the risk associated with investing in those securities. For more information on valuation inputs, and their aggregation into the levels used below, please refer to the Investment Valuation section in the accompanying Notes to Financial Statements.
| Valuation Inputs at Reporting Date: | ||||
| Description | Total | Level 1 | Level 2 | Level 3 |
| Investments in Securities: | ||||
| Common Stocks | $3,286,358,458 | $3,258,704,767 | $13,153,691 | $14,500,000 |
| Money Market Funds | 38,371,519 | 38,371,519 | -- | -- |
| Total Investments in Securities: | $3,324,729,977 | $3,297,076,286 | $13,153,691 | $14,500,000 |
See accompanying notes which are an integral part of the financial statements.
Fidelity® Financials Central Fund
Financial Statements
Statement of Assets and Liabilities
| September 30, 2019 | ||
| Assets | ||
| Investment in securities, at value (including securities loaned of $30,753,609) — See accompanying schedule: Unaffiliated issuers (cost $2,709,685,500) | $3,286,358,458 | |
| Fidelity Central Funds (cost $38,371,519) | 38,371,519 | |
| Total Investment in Securities (cost $2,748,057,019) | $3,324,729,977 | |
| Cash | 694 | |
| Restricted cash | 8,274 | |
| Foreign currency held at value (cost $8) | 8 | |
| Receivable for investments sold | 7,029,051 | |
| Receivable for fund shares sold | 450,791 | |
| Dividends receivable | 5,158,273 | |
| Distributions receivable from Fidelity Central Funds | 76,743 | |
| Other receivables | 3,000 | |
| Total assets | 3,337,456,811 | |
| Liabilities | ||
| Payable for investments purchased | $1,457,088 | |
| Payable for fund shares redeemed | 1,948,633 | |
| Other payables and accrued expenses | 29,627 | |
| Collateral on securities loaned | 31,904,248 | |
| Total liabilities | 35,339,596 | |
| Net Assets | $3,302,117,215 | |
| Net Assets consist of: | ||
| Paid in capital | $2,697,251,497 | |
| Total accumulated earnings (loss) | 604,865,718 | |
| Net Assets, for 31,827,847 shares outstanding | $3,302,117,215 | |
| Net Asset Value, offering price and redemption price per share ($3,302,117,215 ÷ 31,827,847 shares) | $103.75 |
See accompanying notes which are an integral part of the financial statements.
Statement of Operations
| Year ended September 30, 2019 | ||
| Investment Income | ||
| Dividends | $85,617,322 | |
| Income from Fidelity Central Funds (including $71,516 from security lending) | 1,343,406 | |
| Total income | 86,960,728 | |
| Expenses | ||
| Custodian fees and expenses | $45,971 | |
| Independent directors' fees and expenses | 19,287 | |
| Interest | 2,918 | |
| Miscellaneous | 38 | |
| Total expenses | 68,214 | |
| Net investment income (loss) | 86,892,514 | |
| Realized and Unrealized Gain (Loss) | ||
| Net realized gain (loss) on: | ||
| Investment securities: | ||
| Unaffiliated issuers | 39,590,497 | |
| Redemptions in-kind with affiliated entities | 36,580,772 | |
| Fidelity Central Funds | (260) | |
| Foreign currency transactions | (24,995) | |
| Total net realized gain (loss) | 76,146,014 | |
| Change in net unrealized appreciation (depreciation) on: | ||
| Investment securities: | ||
| Unaffiliated issuers | 30,725,079 | |
| Assets and liabilities in foreign currencies | (4,842) | |
| Total change in net unrealized appreciation (depreciation) | 30,720,237 | |
| Net gain (loss) | 106,866,251 | |
| Net increase (decrease) in net assets resulting from operations | $193,758,765 |
See accompanying notes which are an integral part of the financial statements.
Statement of Changes in Net Assets
| Year ended September 30, 2019 | Year ended September 30, 2018 | |
| Increase (Decrease) in Net Assets | ||
| Operations | ||
| Net investment income (loss) | $86,892,514 | $71,164,090 |
| Net realized gain (loss) | 76,146,014 | 360,758,594 |
| Change in net unrealized appreciation (depreciation) | 30,720,237 | (204,279,200) |
| Net increase (decrease) in net assets resulting from operations | 193,758,765 | 227,643,484 |
| Distributions to shareholders | (231,213,891) | – |
| Distributions to shareholders from net investment income | – | (61,092,879) |
| Distributions to shareholders from net realized gain | – | (190,098,519) |
| Total distributions | (231,213,891) | (251,191,398) |
| Affiliated share transactions | ||
| Proceeds from sales of shares | 178,203,434 | 1,316,467,001 |
| Reinvestment of distributions | 231,213,891 | 251,191,398 |
| Cost of shares redeemed | (707,065,802) | (936,975,564) |
| Net increase (decrease) in net assets resulting from share transactions | (297,648,477) | 630,682,835 |
| Total increase (decrease) in net assets | (335,103,603) | 607,134,921 |
| Net Assets | ||
| Beginning of period | 3,637,220,818 | 3,030,085,897 |
| End of period | $3,302,117,215 | $3,637,220,818 |
| Other Information | ||
| Undistributed net investment income end of period | $13,892,579 | |
| Shares | ||
| Sold | 1,817,306 | 12,423,667 |
| Issued in reinvestment of distributions | 2,567,597 | 2,355,378 |
| Redeemed | (7,068,140) | (8,820,676) |
| Net increase (decrease) | (2,683,237) | 5,958,369 |
See accompanying notes which are an integral part of the financial statements.
Financial Highlights
Fidelity Financials Central Fund
| Years ended September 30, | 2019 | 2018 | 2017 | 2016 | 2015 |
| Selected Per–Share Data | |||||
| Net asset value, beginning of period | $105.39 | $106.12 | $84.74 | $80.86 | $83.90 |
| Income from Investment Operations | |||||
| Net investment income (loss)A | 2.55 | 2.18 | 1.70 | 1.59 | 1.57 |
| Net realized and unrealized gain (loss) | 2.69 | 5.49 | 21.29 | 3.79 | (3.30) |
| Total from investment operations | 5.24 | 7.67 | 22.99 | 5.38 | (1.73) |
| Distributions from net investment income | (2.56)B | (1.90) | (1.50) | (1.50) | (1.31) |
| Distributions from net realized gain | (4.33)B | (6.50) | (.12) | – | – |
| Total distributions | (6.88)C | (8.40) | (1.61)D | (1.50) | (1.31) |
| Net asset value, end of period | $103.75 | $105.39 | $106.12 | $84.74 | $80.86 |
| Total ReturnE | 6.10% | 7.23% | 27.34% | 6.68% | (2.18)% |
| Ratios to Average Net AssetsF,G | |||||
| Expenses before reductionsH | -% | -% | -% | -% | -% |
| Expenses net of fee waivers, if anyH | -% | -% | -% | -% | -% |
| Expenses net of all reductionsH | -% | -% | -% | -% | -% |
| Net investment income (loss) | 2.57% | 2.02% | 1.75% | 1.94% | 1.80% |
| Supplemental Data | |||||
| Net assets, end of period (000 omitted) | $3,302,117 | $3,637,221 | $3,030,086 | $2,544,051 | $2,301,182 |
| Portfolio turnover rateI | 63%J | 48%J | 52%J | 57% | 40% |
A Calculated based on average shares outstanding during the period.
B The amounts shown reflect certain reclassifications related to book to tax differences that were made in the year shown.
C Total distributions of $6.88 per share is comprised of distributions from net investment income of $2.558 and distributions from net realized gain of $4.325 per share.
D Total distributions of $1.61 per share is comprised of distributions from net investment income of $1.495 and distributions from net realized gain of $.119 per share.
E Total returns would have been lower if certain expenses had not been reduced during the applicable periods shown.
F Fees and expenses of any underlying Fidelity Central Funds are not included in the Fund's expense ratio. The Fund indirectly bears its proportionate share of the expenses of any underlying Fidelity Central Funds.
G Expense ratios reflect operating expenses of the Fund. Expenses before reductions do not reflect amounts reimbursed by the investment adviser or reductions from expense offset arrangements and do not represent the amount paid by the Fund during periods when reimbursements or reductions occur. Expenses net of fee waivers reflect expenses after reimbursement by the investment adviser but prior to reductions from expense offset arrangements. Expenses net of all reductions represent the net expenses paid by the Fund.
H Amount represents less than .005%.
I Amount does not include the portfolio activity of any underlying Fidelity Central Funds.
J Portfolio turnover rate excludes securities received or delivered in-kind.
See accompanying notes which are an integral part of the financial statements.
Fidelity® Health Care Central Fund
Performance: The Bottom Line
Average annual total return reflects the change in the value of an investment, assuming reinvestment of distributions from dividend income and capital gains (the profits earned upon the sale of securities that have grown in value, if any) and assuming a constant rate of performance each year. The hypothetical investment and the average annual total returns do not reflect the deduction of taxes that a shareholder would pay on fund distributions or the redemption of fund shares. During periods of reimbursement by Fidelity, a fund’s total return will be greater than it would be had the reimbursement not occurred. How a fund did yesterday is no guarantee of how it will do tomorrow.
Average Annual Total Returns
| For the periods ended September 30, 2019 | Past 1 year | Past 5 years | Past 10 years |
| Fidelity® Health Care Central Fund | (9.51)% | 8.46% | 16.96% |
$10,000 Over 10 Years
Let's say hypothetically that $10,000 was invested in Fidelity® Health Care Central Fund on September 30, 2009.
The chart shows how the value of your investment would have changed, and also shows how the S&P 500® Index performed over the same period.
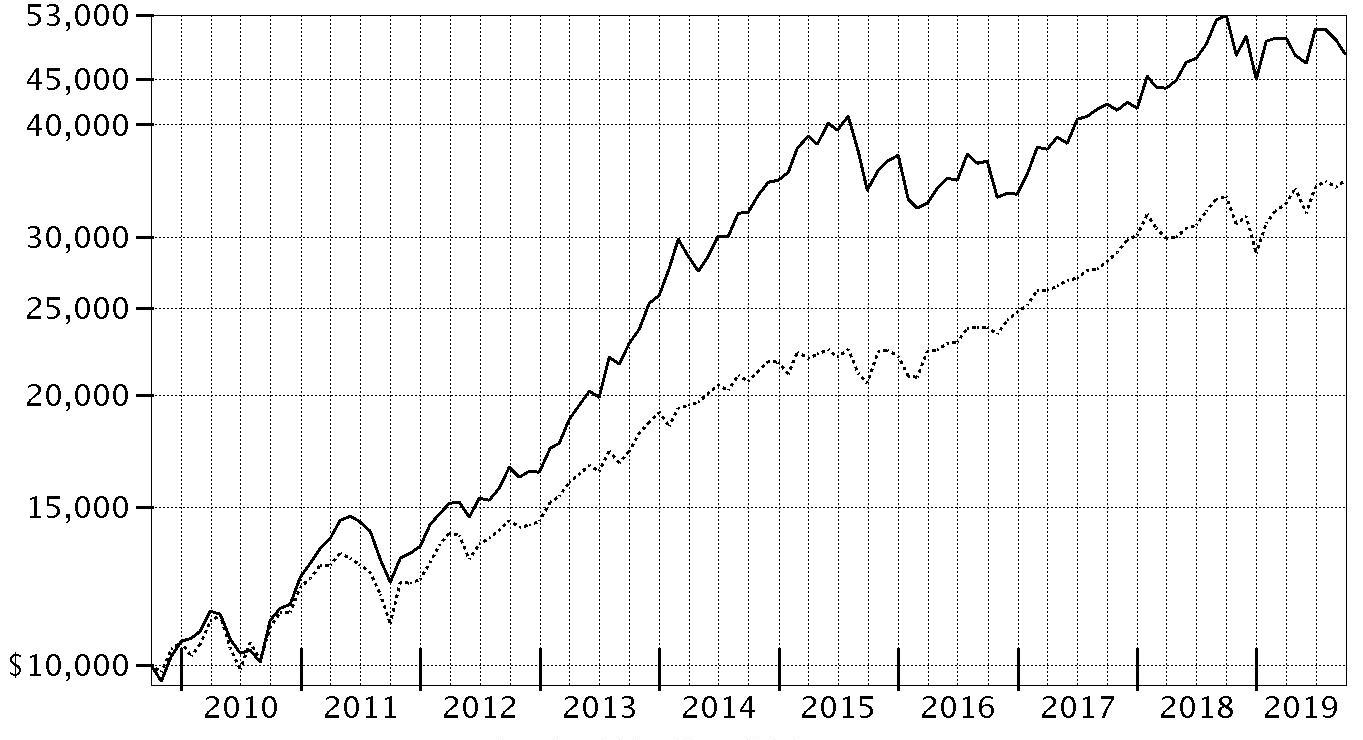
| Period Ending Values | ||
| $47,902 | Fidelity® Health Care Central Fund | |
| $34,674 | S&P 500® Index | |
Fidelity® Health Care Central Fund
Management's Discussion of Fund Performance
Market Recap: The S&P 500® index gained 4.25% for the 12 months ending September 30, 2019, a choppy period in which stocks seesawed due to trade tension, interest rates, economic data and an inverted yield curve, among other factors. Equities began the new year on a high note after enduring a historically volatile final quarter of 2018. Upbeat company earnings and outlooks, along with signs the Federal Reserve may pause on rates, boosted stocks to an all-time high on April 30. In May, however, volatility spiked and the index sunk as trade negotiations between the U.S. and China broke down and tit-for-tat tariff fighting ensued. The bull market roared back in June and recorded a series of highs in July, when the Fed, affirming a dovish shift in policy, cut interest rates for the first time since 2008. Volatility intensified in August, however, as the U.S. Treasury yield curve inverted for the first time since 2007, which some investors viewed as a sign the world's biggest economy could be heading for recession. For the full 12 months, three defensive sectors led the way: utilities (+27%), real estate (+25%) and consumer staples (+17%). Information technology rose about 9%, boosted by software & services (+14%), the market’s largest industry. Communication services stocks gained roughly 6%. In contrast, energy (-19%) was by far the weakest sector – slipping on lower oil prices – followed by health care (-4%) and industrials (+1%). Other laggards included consumer discretionary (+2%), materials (+3%) and financials (+4%).Comments from Portfolio Manager Eddie Yoon: For the fiscal year ending September 30, 2019, the fund returned -9.51%, behind the -5.09% result of the MSCI U.S. IMI Health Care 25/50 Index. Health care stocks underperformed the broad market S&P 500® index this period amid a resurgence of legal and political rhetoric around the Affordable Care Act (ACA) and the potential for a “Medicare-for-all” scenario. Versus the MSCI sector index, stock selection choices in health care equipment, an overweighting in managed care and positioning in biotechnology were notable pain points. On an individual basis, avoiding index component and large-cap pharma giant Merck hurt more than any other stock decision, as its shares gained roughly 22% on strong sales of its key cancer drug Keytruda®. A slight overweighting in Sarepta Pharmaceuticals (-54%) also hurt, as the stock plunged in August following a negative report by the U.S. Food and Drug Administration on the firm’s drug for Duchenne Muscular Dystrophy (DMD). Conversely, choices in pharmaceuticals helped, including a non-index stake in AstraZeneca (+18%), which was boosted by strong sales of its cancer treatments. An overweighting in Array BioPharma (+216%) was another large relative contributor. Array was acquired by Pfizer in July. The fund did not hold Array at period end.The views expressed above reflect those of the portfolio manager(s) only through the end of the period as stated on the cover of this report and do not necessarily represent the views of Fidelity or any other person in the Fidelity organization. Any such views are subject to change at any time based upon market or other conditions and Fidelity disclaims any responsibility to update such views. These views may not be relied on as investment advice and, because investment decisions for a Fidelity fund are based on numerous factors, may not be relied on as an indication of trading intent on behalf of any Fidelity fund.
Fidelity® Health Care Central Fund
Investment Summary (Unaudited)
Top Ten Stocks as of September 30, 2019
| % of fund's net assets | |
| UnitedHealth Group, Inc. | 7.8 |
| Boston Scientific Corp. | 7.1 |
| Roche Holding AG (participation certificate) | 6.0 |
| AstraZeneca PLC (United Kingdom) | 5.4 |
| Becton, Dickinson & Co. | 5.3 |
| Vertex Pharmaceuticals, Inc. | 5.1 |
| Stryker Corp. | 4.0 |
| Intuitive Surgical, Inc. | 3.7 |
| Cigna Corp. | 3.6 |
| Eli Lilly & Co. | 3.5 |
| 51.5 |
Top Industries (% of fund's net assets)
| As of September 30, 2019 | ||
| Health Care Equipment & Supplies | 30.6% | |
| Biotechnology | 23.7% | |
| Health Care Providers & Services | 22.9% | |
| Pharmaceuticals | 18.6% | |
| Life Sciences Tools & Services | 2.2% | |
| All Others* | 2.0% | |

* Includes short-term investments and net other assets (liabilities).
Fidelity® Health Care Central Fund
Schedule of Investments September 30, 2019
Showing Percentage of Net Assets
| Common Stocks - 97.9% | |||
| Shares | Value | ||
| Biotechnology - 23.4% | |||
| Biotechnology - 23.4% | |||
| AbbVie, Inc. | 400,000 | $30,288,000 | |
| Acceleron Pharma, Inc. (a) | 248,384 | 9,813,652 | |
| Acorda Therapeutics, Inc. (a) | 384,129 | 1,102,450 | |
| Alexion Pharmaceuticals, Inc. (a) | 520,000 | 50,928,800 | |
| Allakos, Inc. (a)(b) | 150,000 | 11,794,500 | |
| Allogene Therapeutics, Inc. (b) | 130,000 | 3,543,150 | |
| Alnylam Pharmaceuticals, Inc. (a) | 249,984 | 20,103,713 | |
| Amgen, Inc. | 250,000 | 48,377,500 | |
| AnaptysBio, Inc. (a)(b) | 226,224 | 7,915,578 | |
| Argenx SE ADR (a) | 230,678 | 26,288,065 | |
| Ascendis Pharma A/S sponsored ADR (a) | 294,304 | 28,347,361 | |
| BeiGene Ltd. ADR (a)(b) | 150,000 | 18,369,000 | |
| BELLUS Health, Inc. (a) | 384,785 | 2,458,776 | |
| bluebird bio, Inc. (a)(b) | 150,000 | 13,773,000 | |
| Blueprint Medicines Corp. (a) | 338,697 | 24,884,069 | |
| Cellectis SA sponsored ADR (a) | 200,000 | 2,080,000 | |
| FibroGen, Inc. (a) | 380,000 | 14,052,400 | |
| Gritstone Oncology, Inc. | 172,858 | 1,492,629 | |
| Immunomedics, Inc. (a)(b) | 380,000 | 5,038,800 | |
| Insmed, Inc. (a) | 500,000 | 8,820,000 | |
| Intercept Pharmaceuticals, Inc. (a) | 135,245 | 8,974,858 | |
| Kura Oncology, Inc. (a) | 440,000 | 6,674,800 | |
| Morphosys AG (a) | 90,000 | 9,917,455 | |
| Neurocrine Biosciences, Inc. (a) | 228,000 | 20,545,080 | |
| Principia Biopharma, Inc. | 230,807 | 6,517,990 | |
| Sage Therapeutics, Inc. (a) | 25,626 | 3,595,072 | |
| Sarepta Therapeutics, Inc. (a)(b) | 424,000 | 31,935,680 | |
| Scholar Rock Holding Corp. (a) | 32,406 | 290,034 | |
| The Medicines Company (a)(b) | 280,000 | 14,000,000 | |
| uniQure B.V. (a) | 150,000 | 5,904,000 | |
| Vertex Pharmaceuticals, Inc. (a) | 760,000 | 128,759,200 | |
| Viking Therapeutics, Inc. (a)(b) | 500,000 | 3,440,000 | |
| Xencor, Inc. (a) | 441,957 | 14,907,210 | |
| Zymeworks, Inc. (a) | 304,477 | 7,551,030 | |
| 592,483,852 | |||
| Diversified Consumer Services - 0.2% | |||
| Specialized Consumer Services - 0.2% | |||
| Carriage Services, Inc. | 230,000 | 4,701,200 | |
| Health Care Equipment & Supplies - 30.6% | |||
| Health Care Equipment - 30.2% | |||
| Atricure, Inc. (a) | 580,000 | 14,465,200 | |
| Becton, Dickinson & Co. | 528,000 | 133,562,880 | |
| Boston Scientific Corp. (a) | 4,400,000 | 179,036,000 | |
| Danaher Corp. | 316,000 | 45,639,880 | |
| Hologic, Inc. (a) | 690,000 | 34,838,100 | |
| Insulet Corp. (a) | 380,000 | 62,673,400 | |
| Intuitive Surgical, Inc. (a) | 175,000 | 94,487,750 | |
| Masimo Corp. (a) | 240,000 | 35,709,600 | |
| Penumbra, Inc. (a)(b) | 277,965 | 37,383,513 | |
| Shockwave Medical, Inc. (a) | 93,361 | 2,794,295 | |
| Stryker Corp. | 470,000 | 101,661,000 | |
| Wright Medical Group NV (a) | 1,000,000 | 20,630,000 | |
| 762,881,618 | |||
| Health Care Supplies - 0.4% | |||
| Hoya Corp. | 124,842 | 10,224,925 | |
| TOTAL HEALTH CARE EQUIPMENT & SUPPLIES | 773,106,543 | ||
| Health Care Providers & Services - 22.6% | |||
| Health Care Distributors & Services - 0.7% | |||
| Covetrus, Inc. (a)(b) | 198,647 | 2,361,913 | |
| EBOS Group Ltd. | 960,324 | 15,033,872 | |
| 17,395,785 | |||
| Health Care Facilities - 2.3% | |||
| HCA Holdings, Inc. | 480,000 | 57,801,600 | |
| Health Care Services - 4.2% | |||
| Cigna Corp. | 600,000 | 91,074,000 | |
| G1 Therapeutics, Inc. (a) | 356,520 | 8,121,526 | |
| Premier, Inc. (a) | 230,000 | 6,651,600 | |
| 105,847,126 | |||
| Managed Health Care - 15.4% | |||
| Centene Corp. (a) | 1,200,000 | 51,912,000 | |
| HealthEquity, Inc. (a) | 240,000 | 13,714,800 | |
| Humana, Inc. | 334,000 | 85,393,780 | |
| Molina Healthcare, Inc. (a) | 218,000 | 23,918,960 | |
| Notre Dame Intermedica Participacoes SA | 1,280,000 | 16,712,596 | |
| UnitedHealth Group, Inc. | 912,000 | 198,195,836 | |
| 389,847,972 | |||
| TOTAL HEALTH CARE PROVIDERS & SERVICES | 570,892,483 | ||
| Health Care Technology - 0.2% | |||
| Health Care Technology - 0.2% | |||
| Castlight Health, Inc. (a) | 689,200 | 971,772 | |
| Castlight Health, Inc. Class B (a) | 768,259 | 1,083,245 | |
| Health Catalyst, Inc. (b) | 60,000 | 1,898,400 | |
| 3,953,417 | |||
| Life Sciences Tools & Services - 2.2% | |||
| Life Sciences Tools & Services - 2.2% | |||
| 10X Genomics, Inc. (a) | 23,247 | 1,171,649 | |
| Avantor, Inc. | 1,080,000 | 15,876,000 | |
| Bruker Corp. | 364,396 | 16,007,916 | |
| Lonza Group AG | 66,262 | 22,400,480 | |
| 55,456,045 | |||
| Pharmaceuticals - 18.2% | |||
| Pharmaceuticals - 18.2% | |||
| AstraZeneca PLC (United Kingdom) | 1,530,000 | 136,612,347 | |
| Bristol-Myers Squibb Co. | 220,000 | 11,156,200 | |
| Dechra Pharmaceuticals PLC | 570,000 | 19,399,348 | |
| Eli Lilly & Co. | 780,000 | 87,227,400 | |
| MyoKardia, Inc. (a) | 212,100 | 11,061,015 | |
| Recordati SpA | 260,000 | 11,154,112 | |
| Roche Holding AG (participation certificate) | 522,000 | 151,987,979 | |
| RPI International Holdings LP (c)(d) | 41,845 | 6,527,192 | |
| Theravance Biopharma, Inc. (a)(b) | 480,162 | 9,353,556 | |
| Turning Point Therapeutics, Inc. | 17,574 | 660,782 | |
| Zogenix, Inc. (a) | 366,423 | 14,671,577 | |
| 459,811,508 | |||
| Software - 0.5% | |||
| Application Software - 0.5% | |||
| Benefitfocus, Inc. (a)(b) | 550,000 | 13,095,500 | |
| TOTAL COMMON STOCKS | |||
| (Cost $2,051,748,636) | 2,473,500,548 | ||
| Convertible Preferred Stocks - 1.1% | |||
| Biotechnology - 0.3% | |||
| Biotechnology - 0.3% | |||
| BioNTech AG: | |||
| Series A (a)(d) | 458,586 | 6,093,498 | |
| Series A | 122,166 | 1,623,291 | |
| Generation Bio Series B (a)(c)(d) | 49,800 | 452,682 | |
| 8,169,471 | |||
| Health Care Providers & Services - 0.3% | |||
| Health Care Services - 0.3% | |||
| 1Life Healthcare, Inc. Series G (a)(c)(d) | 438,101 | 5,971,317 | |
| Pharmaceuticals - 0.4% | |||
| Pharmaceuticals - 0.4% | |||
| Harmony Biosciences II, Inc.: | |||
| Series A (a)(c)(d) | 3,606,378 | 7,068,501 | |
| Series C (c)(d) | 1,486,194 | 2,912,940 | |
| 9,981,441 | |||
| Software - 0.1% | |||
| Application Software - 0.1% | |||
| Outset Medical, Inc.: | |||
| Series C (a)(c)(d) | 997,101 | 1,615,304 | |
| Series D (a)(c)(d) | 482,315 | 824,759 | |
| 2,440,063 | |||
| TOTAL CONVERTIBLE PREFERRED STOCKS | |||
| (Cost $21,475,187) | 26,562,292 | ||
| Money Market Funds - 3.5% | |||
| Fidelity Cash Central Fund 1.96% (e) | 38,047,675 | 38,055,285 | |
| Fidelity Securities Lending Cash Central Fund 1.96% (e)(f) | 50,408,520 | 50,413,561 | |
| TOTAL MONEY MARKET FUNDS | |||
| (Cost $88,468,846) | 88,468,846 | ||
| TOTAL INVESTMENT IN SECURITIES - 102.5% | |||
| (Cost $2,161,692,669) | 2,588,531,686 | ||
| NET OTHER ASSETS (LIABILITIES) - (2.5)% | (62,561,466) | ||
| NET ASSETS - 100% | $2,525,970,220 |
Legend
(a) Non-income producing
(b) Security or a portion of the security is on loan at period end.
(c) Level 3 security
(d) Restricted securities - Investment in securities not registered under the Securities Act of 1933 (excluding 144A issues). At the end of the period, the value of restricted securities (excluding 144A issues) amounted to $31,466,193 or 1.2% of net assets.
(e) Affiliated fund that is generally available only to investment companies and other accounts managed by Fidelity Investments. The rate quoted is the annualized seven-day yield of the fund at period end. A complete unaudited listing of the fund's holdings as of its most recent quarter end is available upon request. In addition, each Fidelity Central Fund's financial statements, which are not covered by the Fund's Report of Independent Registered Public Accounting Firm, are available on the SEC's website or upon request.
(f) Investment made with cash collateral received from securities on loan.
Additional information on each restricted holding is as follows:
| Security | Acquisition Date | Acquisition Cost |
| 1Life Healthcare, Inc. Series G | 4/10/14 | $2,885,246 |
| BioNTech AG Series A | 12/29/17 | $5,579,683 |
| Generation Bio Series B | 2/21/18 | $455,456 |
| Harmony Biosciences II, Inc. Series A | 9/22/17 | $3,606,378 |
| Harmony Biosciences II, Inc. Series C | 8/9/19 | $2,912,940 |
| Outset Medical, Inc. Series C | 4/19/17 | $2,583,987 |
| Outset Medical, Inc. Series D | 8/20/18 | $1,500,000 |
| RPI International Holdings LP | 5/21/15 - 3/23/16 | $5,567,439 |
Affiliated Central Funds
Information regarding fiscal year to date income earned by the Fund from investments in Fidelity Central Funds is as follows:
| Fund | Income earned |
| Fidelity Cash Central Fund | $786,350 |
| Fidelity Securities Lending Cash Central Fund | 389,730 |
| Total | $1,176,080 |
Amounts in the income column in the above table include any capital gain distributions from underlying funds, which are presented in the corresponding line-item in the Statement of Operations, if applicable. Amount for Fidelity Securities Lending Cash Central Fund represents the income earned on investing cash collateral, less rebates paid to borrowers and any lending agent fees associated with the loan, plus any premium payments received for lending certain types of securities.
Investment Valuation
The following is a summary of the inputs used, as of September 30, 2019, involving the Fund's assets and liabilities carried at fair value. The inputs or methodology used for valuing securities may not be an indication of the risk associated with investing in those securities. For more information on valuation inputs, and their aggregation into the levels used below, please refer to the Investment Valuation section in the accompanying Notes to Financial Statements.
| Valuation Inputs at Reporting Date: | ||||
| Description | Total | Level 1 | Level 2 | Level 3 |
| Investments in Securities: | ||||
| Common Stocks | $2,473,500,548 | $2,168,148,105 | $298,825,251 | $6,527,192 |
| Convertible Preferred Stocks | 26,562,292 | -- | 7,716,789 | 18,845,503 |
| Money Market Funds | 88,468,846 | 88,468,846 | -- | -- |
| Total Investments in Securities: | $2,588,531,686 | $2,256,616,951 | $306,542,040 | $25,372,695 |
The following is a reconciliation of Investments in Securities for which Level 3 inputs were used in determining value:
| Investments in Securities: | |
| Beginning Balance | $27,792,677 |
| Total Realized Gain (Loss) | -- |
| Total Unrealized Gain (Loss) | 2,176,275 |
| Cost of Purchases | 2,912,940 |
| Proceeds of Sales | -- |
| Amortization/Accretion | -- |
| Transfers in to Level 3 | -- |
| Transfers out of Level 3 | (7,509,197) |
| Ending Balance | $25,372,695 |
| The change in unrealized gain (loss) for the period attributable to Level 3 securities held at September 30, 2019 | $2,176,275 |
The information used in the above reconciliation represents fiscal year to date activity for any Investments in Securities identified as using Level 3 inputs at either the beginning or the end of the current fiscal period. Transfers in or out of Level 3 represent the beginning value of any Security or Instrument where a change in the pricing level occurred from the beginning to the end of the period. The cost of purchases and the proceeds of sales may include securities received or delivered through corporate actions or exchanges. Realized and unrealized gains (losses) disclosed in the reconciliations are included in Net Gain (Loss) on the Fund's Statement of Operations.
Other Information
Distribution of investments by country or territory of incorporation, as a percentage of Total Net Assets, is as follows (Unaudited):
| United States of America | 79.1% |
| Switzerland | 6.9% |
| United Kingdom | 6.2% |
| Netherlands | 2.0% |
| Cayman Islands | 1.4% |
| Denmark | 1.1% |
| Others (Individually Less Than 1%) | 3.3% |
| 100.0% |
See accompanying notes which are an integral part of the financial statements.
Fidelity® Health Care Central Fund
Financial Statements
Statement of Assets and Liabilities
| September 30, 2019 | ||
| Assets | ||
| Investment in securities, at value (including securities loaned of $49,059,319) — See accompanying schedule: Unaffiliated issuers (cost $2,073,223,823) | $2,500,062,840 | |
| Fidelity Central Funds (cost $88,468,846) | 88,468,846 | |
| Total Investment in Securities (cost $2,161,692,669) | $2,588,531,686 | |
| Receivable for investments sold | 12,951,456 | |
| Receivable for fund shares sold | 340,126 | |
| Dividends receivable | 2,046,942 | |
| Distributions receivable from Fidelity Central Funds | 63,720 | |
| Total assets | 2,603,933,930 | |
| Liabilities | ||
| Payable to custodian bank | $4,393,009 | |
| Payable for investments purchased | 21,631,474 | |
| Payable for fund shares redeemed | 1,474,979 | |
| Other payables and accrued expenses | 51,844 | |
| Collateral on securities loaned | 50,412,404 | |
| Total liabilities | 77,963,710 | |
| Net Assets | $2,525,970,220 | |
| Net Assets consist of: | ||
| Paid in capital | $2,082,314,016 | |
| Total accumulated earnings (loss) | 443,656,204 | |
| Net Assets, for 6,174,584 shares outstanding | $2,525,970,220 | |
| Net Asset Value, offering price and redemption price per share ($2,525,970,220 ÷ 6,174,584 shares) | $409.09 |
See accompanying notes which are an integral part of the financial statements.
Statement of Operations
| Year ended September 30, 2019 | ||
| Investment Income | ||
| Dividends | $23,058,245 | |
| Income from Fidelity Central Funds (including $389,730 from security lending) | 1,176,080 | |
| Total income | 24,234,325 | |
| Expenses | ||
| Custodian fees and expenses | $79,632 | |
| Independent directors' fees and expenses | 16,465 | |
| Interest | 1,774 | |
| Miscellaneous | 34 | |
| Total expenses before reductions | 97,905 | |
| Expense reductions | (1,570) | |
| Total expenses after reductions | 96,335 | |
| Net investment income (loss) | 24,137,990 | |
| Realized and Unrealized Gain (Loss) | ||
| Net realized gain (loss) on: | ||
| Investment securities: | ||
| Unaffiliated issuers | 54,264,842 | |
| Redemptions in-kind with affiliated entities | 39,178,961 | |
| Fidelity Central Funds | (4,748) | |
| Foreign currency transactions | 41,905 | |
| Total net realized gain (loss) | 93,480,960 | |
| Change in net unrealized appreciation (depreciation) on: | ||
| Investment securities: | ||
| Unaffiliated issuers | (422,328,018) | |
| Assets and liabilities in foreign currencies | (20,580) | |
| Total change in net unrealized appreciation (depreciation) | (422,348,598) | |
| Net gain (loss) | (328,867,638) | |
| Net increase (decrease) in net assets resulting from operations | $(304,729,648) |
See accompanying notes which are an integral part of the financial statements.
Statement of Changes in Net Assets
| Year ended September 30, 2019 | Year ended September 30, 2018 | |
| Increase (Decrease) in Net Assets | ||
| Operations | ||
| Net investment income (loss) | $24,137,990 | $24,430,356 |
| Net realized gain (loss) | 93,480,960 | 358,697,839 |
| Change in net unrealized appreciation (depreciation) | (422,348,598) | 303,099,055 |
| Net increase (decrease) in net assets resulting from operations | (304,729,648) | 686,227,250 |
| Distributions to shareholders | (175,905,413) | – |
| Distributions to shareholders from net investment income | – | (23,298,937) |
| Distributions to shareholders from net realized gain | – | (75,390,756) |
| Total distributions | (175,905,413) | (98,689,693) |
| Affiliated share transactions | ||
| Proceeds from sales of shares | 148,789,485 | 1,130,407,533 |
| Reinvestment of distributions | 175,905,413 | 98,689,693 |
| Cost of shares redeemed | (664,673,502) | (805,149,604) |
| Net increase (decrease) in net assets resulting from share transactions | (339,978,604) | 423,947,622 |
| Total increase (decrease) in net assets | (820,613,665) | 1,011,485,179 |
| Net Assets | ||
| Beginning of period | 3,346,583,885 | 2,335,098,706 |
| End of period | $2,525,970,220 | $3,346,583,885 |
| Other Information | ||
| Undistributed net investment income end of period | $3,486,333 | |
| Shares | ||
| Sold | 352,957 | 2,775,832 |
| Issued in reinvestment of distributions | 453,318 | 253,161 |
| Redeemed | (1,556,589) | (1,940,103) |
| Net increase (decrease) | (750,314) | 1,088,890 |
See accompanying notes which are an integral part of the financial statements.
Financial Highlights
Fidelity Health Care Central Fund
| Years ended September 30, | 2019 | 2018 | 2017 | 2016 | 2015 |
| Selected Per–Share Data | |||||
| Net asset value, beginning of period | $483.27 | $400.12 | $348.64 | $326.12 | $309.84 |
| Income from Investment Operations | |||||
| Net investment income (loss)A | 3.60 | 3.66 | 3.39 | 2.85 | 2.36 |
| Net realized and unrealized gain (loss) | (51.19) | 95.26 | 51.07 | 22.25 | 15.99 |
| Total from investment operations | (47.59) | 98.92 | 54.46 | 25.10 | 18.35 |
| Distributions from net investment income | (3.76) | (3.54) | (2.98) | (2.58) | (2.07) |
| Distributions from net realized gain | (22.83) | (12.23) | – | – | – |
| Total distributions | (26.59) | (15.77) | (2.98) | (2.58) | (2.07) |
| Net asset value, end of period | $409.09 | $483.27 | $400.12 | $348.64 | $326.12 |
| Total ReturnB | (9.51)% | 25.71% | 15.72% | 7.73% | 5.85% |
| Ratios to Average Net AssetsC,D | |||||
| Expenses before reductionsE | -% | -% | -% | -% | -% |
| Expenses net of fee waivers, if anyE | -% | -% | -% | -% | -% |
| Expenses net of all reductionsE | -% | -% | -% | -% | -% |
| Net investment income (loss) | .85% | .87% | .95% | .85% | .66% |
| Supplemental Data | |||||
| Net assets, end of period (000 omitted) | $2,525,970 | $3,346,584 | $2,335,099 | $1,958,248 | $1,749,910 |
| Portfolio turnover rateF | 45%G | 75%G | 79%G | 68% | 97% |
A Calculated based on average shares outstanding during the period.
B Total returns would have been lower if certain expenses had not been reduced during the applicable periods shown.
C Fees and expenses of any underlying Fidelity Central Funds are not included in the Fund's expense ratio. The Fund indirectly bears its proportionate share of the expenses of any underlying Fidelity Central Funds.
D Expense ratios reflect operating expenses of the Fund. Expenses before reductions do not reflect amounts reimbursed by the investment adviser or reductions from expense offset arrangements and do not represent the amount paid by the Fund during periods when reimbursements or reductions occur. Expenses net of fee waivers reflect expenses after reimbursement by the investment adviser but prior to reductions from expense offset arrangements. Expenses net of all reductions represent the net expenses paid by the Fund.
E Amount represents less than .005%.
F Amount does not include the portfolio activity of any underlying Fidelity Central Funds.
G Portfolio turnover rate excludes securities received or delivered in-kind.
See accompanying notes which are an integral part of the financial statements.
Fidelity® Industrials Central Fund
Performance: The Bottom Line
Average annual total return reflects the change in the value of an investment, assuming reinvestment of distributions from dividend income and capital gains (the profits earned upon the sale of securities that have grown in value, if any) and assuming a constant rate of performance each year. The hypothetical investment and the average annual total returns do not reflect the deduction of taxes that a shareholder would pay on fund distributions or the redemption of fund shares. During periods of reimbursement by Fidelity, a fund’s total return will be greater than it would be had the reimbursement not occurred. How a fund did yesterday is no guarantee of how it will do tomorrow.
Average Annual Total Returns
| For the periods ended September 30, 2019 | Past 1 year | Past 5 years | Past 10 years |
| Fidelity® Industrials Central Fund | (1.59)% | 9.44% | 13.76% |
$10,000 Over 10 Years
Let's say hypothetically that $10,000 was invested in Fidelity® Industrials Central Fund on September 30, 2009.
The chart shows how the value of your investment would have changed, and also shows how the S&P 500® Index performed over the same period.

| Period Ending Values | ||
| $36,283 | Fidelity® Industrials Central Fund | |
| $34,674 | S&P 500® Index | |
Fidelity® Industrials Central Fund
Management's Discussion of Fund Performance
Market Recap: The S&P 500® index gained 4.25% for the 12 months ending September 30, 2019, a choppy period in which stocks seesawed due to trade tension, interest rates, economic data and an inverted yield curve, among other factors. Equities began the new year on a high note after enduring a historically volatile final quarter of 2018. Upbeat company earnings and outlooks, along with signs the Federal Reserve may pause on rates, boosted stocks to an all-time high on April 30. In May, however, volatility spiked and the index sunk as trade negotiations between the U.S. and China broke down and tit-for-tat tariff fighting ensued. The bull market roared back in June and recorded a series of highs in July, when the Fed, affirming a dovish shift in policy, cut interest rates for the first time since 2008. Volatility intensified in August, however, as the U.S. Treasury yield curve inverted for the first time since 2007, which some investors viewed as a sign the world's biggest economy could be heading for recession. For the full 12 months, three defensive sectors led the way: utilities (+27%), real estate (+25%) and consumer staples (+17%). Information technology rose about 9%, boosted by software & services (+14%), the market’s largest industry. Communication services stocks gained roughly 6%. In contrast, energy (-19%) was by far the weakest sector – slipping on lower oil prices – followed by health care (-4%) and industrials (+1%). Other laggards included consumer discretionary (+2%), materials (+3%) and financials (+4%).Comments from Portfolio Manager Chad Colman: For the fiscal year, the fund returned -1.59%, trailing both the 0.88% result of the MSCI U.S. IMI Industrials 25/50 Linked Index and the S&P 500®. Among the 11 S&P 500® sectors, industrials finished with the ninth-best total return, as trade tensions and slowing global economic growth kept a lid on stocks in the group. Versus the MSCI sector index, stock selection in air freight & logistics notably weighed on the fund’s performance, along with positioning in aerospace & defense, construction & engineering, and railroads. At the stock level, a sizable overweighting in Fortive made this stock our largest relative detractor. The provider of professional instrumentation equipment, fuel-management systems and automotive-diagnostic equipment saw its share price return about -18% the past year amid uncertainty about trade with China and a revenue shortfall for the second quarter. An out-of-index position in Canada-based aircraft/train manufacturer Bombardier (-57%), which was not held at period end, also hurt; the company surprised the market with disappointing guidance on its train business. Conversely, stock choices and an underweighting in industrial conglomerates notably lifted relative performance. A sizable overweighting in Ingersoll Rand, a leader in creating comfortable, sustainable and efficient environments, made this stock our top relative contributor. The company reported an upbeat quarter in July, and the market also applauded the company’s merger with Gardner Denver Holdings, announced this spring.The views expressed above reflect those of the portfolio manager(s) only through the end of the period as stated on the cover of this report and do not necessarily represent the views of Fidelity or any other person in the Fidelity organization. Any such views are subject to change at any time based upon market or other conditions and Fidelity disclaims any responsibility to update such views. These views may not be relied on as investment advice and, because investment decisions for a Fidelity fund are based on numerous factors, may not be relied on as an indication of trading intent on behalf of any Fidelity fund.
Note to Shareholders: On December 1, 2018, Chad Colman assumed co-management responsibilities for the fund, joining Tobias Welo. On December 31, 2018, former Lead Manager Tobias Welo retired, leaving Chad Colman sole Portfolio Manager of the fund.Fidelity® Industrials Central Fund
Investment Summary (Unaudited)
Top Ten Stocks as of September 30, 2019
| % of fund's net assets | |
| The Boeing Co. | 9.1 |
| Lockheed Martin Corp. | 7.0 |
| Ingersoll-Rand PLC | 6.1 |
| Union Pacific Corp. | 5.4 |
| Honeywell International, Inc. | 5.1 |
| Emerson Electric Co. | 5.1 |
| CSX Corp. | 4.7 |
| AMETEK, Inc. | 4.7 |
| Fortive Corp. | 4.5 |
| Caterpillar, Inc. | 4.2 |
| 55.9 |
Top Industries (% of fund's net assets)
| As of September 30, 2019 | ||
| Aerospace & Defense | 22.6% | |
| Machinery | 17.5% | |
| Road & Rail | 14.5% | |
| Electrical Equipment | 14.3% | |
| Industrial Conglomerates | 9.6% | |
| All Others* | 21.5% | |

* Includes short-term investments and net other assets (liabilities).
Fidelity® Industrials Central Fund
Schedule of Investments September 30, 2019
Showing Percentage of Net Assets
| Common Stocks - 98.6% | |||
| Shares | Value | ||
| Aerospace & Defense - 22.6% | |||
| Aerospace & Defense - 22.6% | |||
| Curtiss-Wright Corp. | 78,154 | $10,110,783 | |
| Harris Corp. | 269,610 | 56,251,430 | |
| HEICO Corp. Class A | 124,161 | 12,082,107 | |
| Lockheed Martin Corp. | 313,674 | 122,351,680 | |
| The Boeing Co. | 418,681 | 159,295,560 | |
| United Technologies Corp. | 258,798 | 35,331,103 | |
| 395,422,663 | |||
| Air Freight & Logistics - 1.4% | |||
| Air Freight & Logistics - 1.4% | |||
| C.H. Robinson Worldwide, Inc. | 287,302 | 24,357,464 | |
| Airlines - 4.9% | |||
| Airlines - 4.9% | |||
| Alaska Air Group, Inc. | 356,505 | 23,140,740 | |
| Delta Air Lines, Inc. | 973,458 | 56,071,181 | |
| Spirit Airlines, Inc. (a) | 184,123 | 6,683,665 | |
| 85,895,586 | |||
| Building Products - 2.0% | |||
| Building Products - 2.0% | |||
| Fortune Brands Home & Security, Inc. | 644,576 | 35,258,307 | |
| Commercial Services & Supplies - 5.3% | |||
| Diversified Support Services - 3.0% | |||
| Cintas Corp. | 181,428 | 48,640,847 | |
| Healthcare Services Group, Inc. (b) | 194,518 | 4,724,842 | |
| 53,365,689 | |||
| Environmental & Facility Services - 2.3% | |||
| Waste Connection, Inc. (United States) | 430,472 | 39,603,424 | |
| TOTAL COMMERCIAL SERVICES & SUPPLIES | 92,969,113 | ||
| Electrical Equipment - 14.3% | |||
| Electrical Components & Equipment - 14.3% | |||
| AMETEK, Inc. | 895,032 | 82,181,838 | |
| Emerson Electric Co. | 1,334,582 | 89,230,153 | |
| Fortive Corp. | 1,145,494 | 78,535,069 | |
| 249,947,060 | |||
| Industrial Conglomerates - 9.6% | |||
| Industrial Conglomerates - 9.6% | |||
| Carlisle Companies, Inc. | 223,778 | 32,568,650 | |
| General Electric Co. | 5,106,370 | 45,650,948 | |
| Honeywell International, Inc. | 533,613 | 90,287,320 | |
| 168,506,918 | |||
| Machinery - 17.5% | |||
| Construction Machinery & Heavy Trucks - 4.2% | |||
| Caterpillar, Inc. | 579,483 | 73,194,498 | |
| Industrial Machinery - 13.3% | |||
| Flowserve Corp. | 883,658 | 41,275,665 | |
| Gardner Denver Holdings, Inc. (a) | 1,205,802 | 34,112,139 | |
| IDEX Corp. | 308,771 | 50,601,391 | |
| Ingersoll-Rand PLC | 868,510 | 107,009,117 | |
| 232,998,312 | |||
| TOTAL MACHINERY | 306,192,810 | ||
| Professional Services - 4.2% | |||
| Research & Consulting Services - 4.2% | |||
| IHS Markit Ltd. (a) | 475,554 | 31,805,052 | |
| TransUnion Holding Co., Inc. | 526,095 | 42,671,565 | |
| 74,476,617 | |||
| Road & Rail - 14.5% | |||
| Railroads - 10.1% | |||
| CSX Corp. | 1,194,926 | 82,772,524 | |
| Union Pacific Corp. | 579,416 | 93,853,804 | |
| 176,626,328 | |||
| Trucking - 4.4% | |||
| Landstar System, Inc. | 246,685 | 27,771,797 | |
| Old Dominion Freight Lines, Inc. | 290,189 | 49,323,424 | |
| 77,095,221 | |||
| TOTAL ROAD & RAIL | 253,721,549 | ||
| Trading Companies & Distributors - 2.3% | |||
| Trading Companies & Distributors - 2.3% | |||
| HD Supply Holdings, Inc. (a) | 1,048,339 | 41,068,680 | |
| TOTAL COMMON STOCKS | |||
| (Cost $1,381,147,728) | 1,727,816,767 | ||
| Money Market Funds - 1.7% | |||
| Fidelity Cash Central Fund 1.96% (c) | 24,302,675 | 24,307,536 | |
| Fidelity Securities Lending Cash Central Fund 1.96% (c)(d) | 4,666,090 | 4,666,556 | |
| TOTAL MONEY MARKET FUNDS | |||
| (Cost $28,973,992) | 28,974,092 | ||
| TOTAL INVESTMENT IN SECURITIES - 100.3% | |||
| (Cost $1,410,121,720) | 1,756,790,859 | ||
| NET OTHER ASSETS (LIABILITIES) - (0.3)% | (5,216,938) | ||
| NET ASSETS - 100% | $1,751,573,921 |
Legend
(a) Non-income producing
(b) Security or a portion of the security is on loan at period end.
(c) Affiliated fund that is generally available only to investment companies and other accounts managed by Fidelity Investments. The rate quoted is the annualized seven-day yield of the fund at period end. A complete unaudited listing of the fund's holdings as of its most recent quarter end is available upon request. In addition, each Fidelity Central Fund's financial statements, which are not covered by the Fund's Report of Independent Registered Public Accounting Firm, are available on the SEC's website or upon request.
(d) Investment made with cash collateral received from securities on loan.
Affiliated Central Funds
Information regarding fiscal year to date income earned by the Fund from investments in Fidelity Central Funds is as follows:
| Fund | Income earned |
| Fidelity Cash Central Fund | $519,256 |
| Fidelity Securities Lending Cash Central Fund | 127,483 |
| Total | $646,739 |
Amounts in the income column in the above table include any capital gain distributions from underlying funds, which are presented in the corresponding line-item in the Statement of Operations, if applicable. Amount for Fidelity Securities Lending Cash Central Fund represents the income earned on investing cash collateral, less rebates paid to borrowers and any lending agent fees associated with the loan, plus any premium payments received for lending certain types of securities.
Investment Valuation
All investments are categorized as Level 1 under the Fair Value Hierarchy. The inputs or methodology used for valuing securities may not be an indication of the risk associated with investing in those securities. For more information on valuation inputs please refer to the Investment Valuation section in the accompanying Notes to Financial Statements.
Other Information
Distribution of investments by country or territory of incorporation, as a percentage of Total Net Assets, is as follows (Unaudited):
| United States of America | 89.8% |
| Ireland | 6.1% |
| Canada | 2.3% |
| Bermuda | 1.8% |
| 100.0% |
See accompanying notes which are an integral part of the financial statements.
Fidelity® Industrials Central Fund
Financial Statements
Statement of Assets and Liabilities
| September 30, 2019 | ||
| Assets | ||
| Investment in securities, at value (including securities loaned of $4,722,923) — See accompanying schedule: Unaffiliated issuers (cost $1,381,147,728) | $1,727,816,767 | |
| Fidelity Central Funds (cost $28,973,992) | 28,974,092 | |
| Total Investment in Securities (cost $1,410,121,720) | $1,756,790,859 | |
| Receivable for fund shares sold | 244,517 | |
| Dividends receivable | 232,058 | |
| Distributions receivable from Fidelity Central Funds | 45,603 | |
| Total assets | 1,757,313,037 | |
| Liabilities | ||
| Payable for fund shares redeemed | $1,057,815 | |
| Other payables and accrued expenses | 14,765 | |
| Collateral on securities loaned | 4,666,536 | |
| Total liabilities | 5,739,116 | |
| Net Assets | $1,751,573,921 | |
| Net Assets consist of: | ||
| Paid in capital | $1,463,993,821 | |
| Total accumulated earnings (loss) | 287,580,100 | |
| Net Assets, for 6,149,754 shares outstanding | $1,751,573,921 | |
| Net Asset Value, offering price and redemption price per share ($1,751,573,921 ÷ 6,149,754 shares) | $284.82 |
See accompanying notes which are an integral part of the financial statements.
Statement of Operations
| Year ended September 30, 2019 | ||
| Investment Income | ||
| Dividends | $28,017,260 | |
| Non-Cash dividends | 2,076,341 | |
| Income from Fidelity Central Funds (including $127,483 from security lending) | 646,739 | |
| Total income | 30,740,340 | |
| Expenses | ||
| Custodian fees and expenses | $21,889 | |
| Independent directors' fees and expenses | 10,475 | |
| Interest | 2,666 | |
| Miscellaneous | 20 | |
| Total expenses before reductions | 35,050 | |
| Expense reductions | (2,403) | |
| Total expenses after reductions | 32,647 | |
| Net investment income (loss) | 30,707,693 | |
| Realized and Unrealized Gain (Loss) | ||
| Net realized gain (loss) on: | ||
| Investment securities: | ||
| Unaffiliated issuers | (58,183,261) | |
| Redemptions in-kind with affiliated entities | 22,479,230 | |
| Fidelity Central Funds | 20 | |
| Foreign currency transactions | (60,009) | |
| Total net realized gain (loss) | (35,764,020) | |
| Change in net unrealized appreciation (depreciation) on: | ||
| Investment securities: | ||
| Unaffiliated issuers | (45,300,558) | |
| Fidelity Central Funds | 100 | |
| Assets and liabilities in foreign currencies | (2,472) | |
| Total change in net unrealized appreciation (depreciation) | (45,302,930) | |
| Net gain (loss) | (81,066,950) | |
| Net increase (decrease) in net assets resulting from operations | $(50,359,257) |
See accompanying notes which are an integral part of the financial statements.
Statement of Changes in Net Assets
| Year ended September 30, 2019 | Year ended September 30, 2018 | |
| Increase (Decrease) in Net Assets | ||
| Operations | ||
| Net investment income (loss) | $30,707,693 | $27,306,734 |
| Net realized gain (loss) | (35,764,020) | 215,387,204 |
| Change in net unrealized appreciation (depreciation) | (45,302,930) | 19,744,350 |
| Net increase (decrease) in net assets resulting from operations | (50,359,257) | 262,438,288 |
| Distributions to shareholders | (109,717,666) | – |
| Distributions to shareholders from net investment income | – | (25,966,468) |
| Distributions to shareholders from net realized gain | – | (84,959,878) |
| Total distributions | (109,717,666) | (110,926,346) |
| Affiliated share transactions | ||
| Proceeds from sales of shares | 81,238,751 | 805,879,787 |
| Reinvestment of distributions | 109,717,666 | 110,926,346 |
| Cost of shares redeemed | (433,372,277) | (522,860,800) |
| Net increase (decrease) in net assets resulting from share transactions | (242,415,860) | 393,945,333 |
| Total increase (decrease) in net assets | (402,492,783) | 545,457,275 |
| Net Assets | ||
| Beginning of period | 2,154,066,704 | 1,608,609,429 |
| End of period | $1,751,573,921 | $2,154,066,704 |
| Other Information | ||
| Undistributed net investment income end of period | $3,059,442 | |
| Shares | ||
| Sold | 302,752 | 2,758,582 |
| Issued in reinvestment of distributions | 453,644 | 378,216 |
| Redeemed | (1,560,568) | (1,774,639) |
| Net increase (decrease) | (804,172) | 1,362,159 |
See accompanying notes which are an integral part of the financial statements.
Financial Highlights
Fidelity Industrials Central Fund
| Years ended September 30, | 2019 | 2018 | 2017 | 2016 | 2015 |
| Selected Per–Share Data | |||||
| Net asset value, beginning of period | $309.76 | $287.67 | $242.21 | $209.67 | $216.95 |
| Income from Investment Operations | |||||
| Net investment income (loss)A | 4.63 | 4.24 | 4.16 | 3.47 | 3.40 |
| Net realized and unrealized gain (loss) | (12.78) | 36.93 | 46.01 | 32.56 | (7.35) |
| Total from investment operations | (8.15) | 41.17 | 50.17 | 36.03 | (3.95) |
| Distributions from net investment income | (4.64) | (4.06) | (3.85) | (3.49) | (3.33) |
| Distributions from net realized gain | (12.15) | (15.02) | (.86) | – | – |
| Total distributions | (16.79) | (19.08) | (4.71) | (3.49) | (3.33) |
| Net asset value, end of period | $284.82 | $309.76 | $287.67 | $242.21 | $209.67 |
| Total ReturnB | (1.59)% | 14.76% | 20.91% | 17.24% | (1.95)% |
| Ratios to Average Net AssetsC,D | |||||
| Expenses before reductionsE | -% | -% | -% | -% | -% |
| Expenses net of fee waivers, if anyE | -% | -% | -% | -% | -% |
| Expenses net of all reductionsE | -% | -% | -% | -% | -% |
| Net investment income (loss) | 1.69% | 1.43% | 1.56% | 1.50% | 1.48% |
| Supplemental Data | |||||
| Net assets, end of period (000 omitted) | $1,751,574 | $2,154,067 | $1,608,609 | $1,376,236 | $1,173,665 |
| Portfolio turnover rateF | 71%G | 65%G | 65%G | 60% | 83% |
A Calculated based on average shares outstanding during the period.
B Total returns would have been lower if certain expenses had not been reduced during the applicable periods shown.
C Fees and expenses of any underlying Fidelity Central Funds are not included in the Fund's expense ratio. The Fund indirectly bears its proportionate share of the expenses of any underlying Fidelity Central Funds.
D Expense ratios reflect operating expenses of the Fund. Expenses before reductions do not reflect amounts reimbursed by the investment adviser or reductions from expense offset arrangements and do not represent the amount paid by the Fund during periods when reimbursements or reductions occur. Expenses net of fee waivers reflect expenses after reimbursement by the investment adviser but prior to reductions from expense offset arrangements. Expenses net of all reductions represent the net expenses paid by the Fund.
E Amount represents less than .005%.
F Amount does not include the portfolio activity of any underlying Fidelity Central Funds.
G Portfolio turnover rate excludes securities received or delivered in-kind.
See accompanying notes which are an integral part of the financial statements.
Fidelity® Information Technology Central Fund
Performance: The Bottom Line
Average annual total return reflects the change in the value of an investment, assuming reinvestment of distributions from dividend income and capital gains (the profits earned upon the sale of securities that have grown in value, if any) and assuming a constant rate of performance each year. The hypothetical investment and the average annual total returns do not reflect the deduction of taxes that a shareholder would pay on fund distributions or the redemption of fund shares. During periods of reimbursement by Fidelity, a fund’s total return will be greater than it would be had the reimbursement not occurred. How a fund did yesterday is no guarantee of how it will do tomorrow.
Average Annual Total Returns
| For the periods ended September 30, 2019 | Past 1 year | Past 5 years | Past 10 years |
| Fidelity® Information Technology Central Fund | 1.67% | 18.05% | 17.58% |
$10,000 Over 10 Years
Let's say hypothetically that $10,000 was invested in Fidelity® Information Technology Central Fund on September 30, 2009.
The chart shows how the value of your investment would have changed, and also shows how the S&P 500® Index performed over the same period.

| Period Ending Values | ||
| $50,486 | Fidelity® Information Technology Central Fund | |
| $34,674 | S&P 500® Index | |
Fidelity® Information Technology Central Fund
Management's Discussion of Fund Performance
Market Recap: The S&P 500® index gained 4.25% for the 12 months ending September 30, 2019, a choppy period in which stocks seesawed due to trade tension, interest rates, economic data and an inverted yield curve, among other factors. Equities began the new year on a high note after enduring a historically volatile final quarter of 2018. Upbeat company earnings and outlooks, along with signs the Federal Reserve may pause on rates, boosted stocks to an all-time high on April 30. In May, however, volatility spiked and the index sunk as trade negotiations between the U.S. and China broke down and tit-for-tat tariff fighting ensued. The bull market roared back in June and recorded a series of highs in July, when the Fed, affirming a dovish shift in policy, cut interest rates for the first time since 2008. Volatility intensified in August, however, as the U.S. Treasury yield curve inverted for the first time since 2007, which some investors viewed as a sign the world's biggest economy could be heading for recession. For the full 12 months, three defensive sectors led the way: utilities (+27%), real estate (+25%) and consumer staples (+17%). Information technology rose about 9%, boosted by software & services (+14%), the market’s largest industry. Communication services stocks gained roughly 6%. In contrast, energy (-19%) was by far the weakest sector – slipping on lower oil prices – followed by health care (-4%) and industrials (+1%). Other laggards included consumer discretionary (+2%), materials (+3%) and financials (+4%).Comments from Portfolio Manager Ali Khan: For the fiscal year, the fund gained 1.67%, lagging the 7.32% advance of the MSCI U.S. IMI Information Technology 25/50 Index, as well as the S&P 500® index. Despite concerns about a slowing global economy, lower corporate earnings growth and increased trade friction, information technology stocks proved resilient the past 12 months, especially the software & services industry. Versus the MSCI sector index, stock selection detracted most by far, especially my choices in semiconductors and interactive home entertainment. The fund's biggest individual detractor was chip designer Nvidia (-37%). The company announced a major acquisition in March, but approval by regulators in China is pending amid the country's tense trade relations with the United States. Shares of video-game developer Activision Blizzard returned -40%, hampered by disappointing sales in early 2019. Conversely, favorable positioning in technology hardware, storage & peripherals was the largest relative contributor. Shares of Microsoft gained about 24% the past 12 months, and our overweighting here made it the fund's top contributor. Microsoft was the fund's largest holding.The views expressed above reflect those of the portfolio manager(s) only through the end of the period as stated on the cover of this report and do not necessarily represent the views of Fidelity or any other person in the Fidelity organization. Any such views are subject to change at any time based upon market or other conditions and Fidelity disclaims any responsibility to update such views. These views may not be relied on as investment advice and, because investment decisions for a Fidelity fund are based on numerous factors, may not be relied on as an indication of trading intent on behalf of any Fidelity fund.
Note to shareholders: On December 1, 2018, Ali Khan assumed co-management responsibilities for the fund, joining Lead Manager Charlie Chai. On December 31, 2018, Charlie Chai retired, leaving Ali Khan as sole portfolio manager of the fund.Fidelity® Information Technology Central Fund
Investment Summary (Unaudited)
Top Ten Stocks as of September 30, 2019
| % of fund's net assets | |
| Microsoft Corp. | 20.8 |
| Apple, Inc. | 19.5 |
| Adobe, Inc. | 4.9 |
| Analog Devices, Inc. | 3.5 |
| Salesforce.com, Inc. | 3.5 |
| NVIDIA Corp. | 3.2 |
| PayPal Holdings, Inc. | 2.7 |
| Citrix Systems, Inc. | 1.9 |
| Cognizant Technology Solutions Corp. Class A | 1.8 |
| Electronic Arts, Inc. | 1.7 |
| 63.5 |
Top Industries (% of fund's net assets)
| As of September 30, 2019 | ||
| Software | 39.9% | |
| Technology Hardware, Storage & Peripherals | 21.1% | |
| Semiconductors & Semiconductor Equipment | 14.7% | |
| IT Services | 12.5% | |
| Electronic Equipment & Components | 4.6% | |
| All Others* | 7.2% | |
* Includes short-term investments and net other assets (liabilities).
Fidelity® Information Technology Central Fund
Schedule of Investments September 30, 2019
Showing Percentage of Net Assets
| Common Stocks - 97.3% | |||
| Shares | Value | ||
| Electronic Equipment & Components - 4.6% | |||
| Electronic Components - 1.1% | |||
| Corning, Inc. | 1,603,677 | $45,736,868 | |
| Electronic Equipment & Instruments - 1.7% | |||
| Cognex Corp. | 551,940 | 27,116,812 | |
| Trimble, Inc. (a) | 1,138,753 | 44,195,004 | |
| 71,311,816 | |||
| Electronic Manufacturing Services - 1.8% | |||
| Jabil, Inc. | 274,315 | 9,812,248 | |
| TE Connectivity Ltd. | 744,441 | 69,367,012 | |
| 79,179,260 | |||
| TOTAL ELECTRONIC EQUIPMENT & COMPONENTS | 196,227,944 | ||
| Entertainment - 1.7% | |||
| Interactive Home Entertainment - 1.7% | |||
| Electronic Arts, Inc. (a) | 744,596 | 72,836,381 | |
| Equity Real Estate Investment Trusts (REITs) - 0.6% | |||
| Diversified REITs - 0.6% | |||
| Ant International Co. Ltd. Class C (a)(b)(c) | 3,805,376 | 27,132,331 | |
| Interactive Media& Services - 1.6% | |||
| Interactive Media & Services - 1.6% | |||
| Alphabet, Inc. Class A (a) | 56,756 | 69,307,022 | |
| IT Services - 12.5% | |||
| Data Processing & Outsourced Services - 6.8% | |||
| Alliance Data Systems Corp. | 141,244 | 18,097,594 | |
| ExlService Holdings, Inc. (a) | 169,266 | 11,334,051 | |
| FleetCor Technologies, Inc. (a) | 91,357 | 26,199,360 | |
| Global Payments, Inc. | 223,012 | 35,458,908 | |
| MasterCard, Inc. Class A | 46,879 | 12,730,930 | |
| PayPal Holdings, Inc. (a) | 1,112,852 | 115,280,339 | |
| Visa, Inc. Class A | 415,575 | 71,483,056 | |
| 290,584,238 | |||
| Internet Services & Infrastructure - 1.2% | |||
| Akamai Technologies, Inc. (a) | 564,967 | 51,626,684 | |
| IT Consulting & Other Services - 4.5% | |||
| Accenture PLC Class A | 52,547 | 10,107,415 | |
| Capgemini SA | 543,917 | 64,086,256 | |
| Cognizant Technology Solutions Corp. Class A | 1,295,077 | 78,047,815 | |
| DXC Technology Co. | 337,283 | 9,949,849 | |
| Gartner, Inc. (a) | 226,635 | 32,406,539 | |
| 194,597,874 | |||
| TOTAL IT SERVICES | 536,808,796 | ||
| Life Sciences Tools & Services - 0.0% | |||
| Life Sciences Tools & Services - 0.0% | |||
| JHL Biotech, Inc. (a)(b) | 1,008,062 | 998,451 | |
| Road & Rail - 0.6% | |||
| Trucking - 0.6% | |||
| Lyft, Inc. (d) | 268,856 | 10,980,079 | |
| Uber Technologies, Inc. | 489,912 | 14,181,238 | |
| 25,161,317 | |||
| Semiconductors & Semiconductor Equipment - 14.7% | |||
| Semiconductor Equipment - 3.0% | |||
| Applied Materials, Inc. | 1,386,029 | 69,162,847 | |
| Lam Research Corp. | 253,290 | 58,537,852 | |
| SunEdison, Inc. (a)(b) | 1,200 | 0 | |
| 127,700,699 | |||
| Semiconductors - 11.7% | |||
| Analog Devices, Inc. | 1,340,561 | 149,780,881 | |
| Broadcom, Inc. | 61,001 | 16,840,546 | |
| Marvell Technology Group Ltd. | 1,258,044 | 31,413,359 | |
| Microchip Technology, Inc. (d) | 600,152 | 55,760,122 | |
| Micron Technology, Inc. (a) | 1,481,411 | 63,478,461 | |
| NVIDIA Corp. | 801,034 | 139,435,988 | |
| Skyworks Solutions, Inc. | 588,563 | 46,643,618 | |
| 503,352,975 | |||
| TOTAL SEMICONDUCTORS & SEMICONDUCTOR EQUIPMENT | 631,053,674 | ||
| Software - 39.9% | |||
| Application Software - 16.6% | |||
| Adobe, Inc. (a) | 763,149 | 210,819,911 | |
| Autodesk, Inc. (a) | 398,632 | 58,877,946 | |
| BlackLine, Inc. (a) | 230,238 | 11,007,679 | |
| Box, Inc. Class A (a) | 678,218 | 11,231,290 | |
| Citrix Systems, Inc. | 840,619 | 81,136,546 | |
| Constellation Software, Inc. | 25,390 | 25,357,420 | |
| HubSpot, Inc. (a) | 27,204 | 4,124,398 | |
| Instructure, Inc. (a) | 343,120 | 13,292,469 | |
| Intuit, Inc. | 95,584 | 25,419,609 | |
| Micro Focus International PLC | 1,053,722 | 14,807,109 | |
| Parametric Technology Corp. (a) | 481,057 | 32,798,466 | |
| Pivotal Software, Inc. (a) | 2,082,967 | 31,077,868 | |
| Salesforce.com, Inc. (a) | 1,005,331 | 149,231,334 | |
| Slack Technologies, Inc. Class A (a)(d) | 402,463 | 9,550,447 | |
| Talend SA ADR (a)(d) | 250,536 | 8,513,213 | |
| Workday, Inc. Class A (a) | 137,689 | 23,401,622 | |
| Zendesk, Inc. (a) | 47,300 | 3,447,224 | |
| 714,094,551 | |||
| Systems Software - 23.3% | |||
| Microsoft Corp. | 6,433,359 | 894,429,902 | |
| Palo Alto Networks, Inc. (a) | 164,530 | 33,536,150 | |
| Pluralsight, Inc. (a)(d) | 1,394,136 | 23,414,514 | |
| Symantec Corp. | 2,217,310 | 52,395,035 | |
| 1,003,775,601 | |||
| TOTAL SOFTWARE | 1,717,870,152 | ||
| Technology Hardware, Storage & Peripherals - 21.1% | |||
| Technology Hardware, Storage & Peripherals - 21.1% | |||
| Apple, Inc. | 3,750,333 | 839,962,082 | |
| Pure Storage, Inc. Class A (a) | 361,971 | 6,131,789 | |
| Seagate Technology LLC | 451,701 | 24,296,997 | |
| Western Digital Corp. | 616,614 | 36,774,859 | |
| 907,165,727 | |||
| TOTAL COMMON STOCKS | |||
| (Cost $3,318,844,461) | 4,184,561,795 | ||
| Money Market Funds - 4.8% | |||
| Fidelity Cash Central Fund 1.96% (e) | 129,548,519 | 129,574,429 | |
| Fidelity Securities Lending Cash Central Fund 1.96% (e)(f) | 74,198,701 | 74,206,121 | |
| TOTAL MONEY MARKET FUNDS | |||
| (Cost $203,780,550) | 203,780,550 | ||
| TOTAL INVESTMENT IN SECURITIES - 102.1% | |||
| (Cost $3,522,625,011) | 4,388,342,345 | ||
| NET OTHER ASSETS (LIABILITIES) - (2.1)% | (88,878,895) | ||
| NET ASSETS - 100% | $4,299,463,450 |
Legend
(a) Non-income producing
(b) Level 3 security
(c) Restricted securities - Investment in securities not registered under the Securities Act of 1933 (excluding 144A issues). At the end of the period, the value of restricted securities (excluding 144A issues) amounted to $27,132,331 or 0.6% of net assets.
(d) Security or a portion of the security is on loan at period end.
(e) Affiliated fund that is generally available only to investment companies and other accounts managed by Fidelity Investments. The rate quoted is the annualized seven-day yield of the fund at period end. A complete unaudited listing of the fund's holdings as of its most recent quarter end is available upon request. In addition, each Fidelity Central Fund's financial statements, which are not covered by the Fund's Report of Independent Registered Public Accounting Firm, are available on the SEC's website or upon request.
(f) Investment made with cash collateral received from securities on loan.
Additional information on each restricted holding is as follows:
| Security | Acquisition Date | Acquisition Cost |
| Ant International Co. Ltd. Class C | 5/16/18 | $21,348,159 |
Affiliated Central Funds
Information regarding fiscal year to date income earned by the Fund from investments in Fidelity Central Funds is as follows:
| Fund | Income earned |
| Fidelity Cash Central Fund | $3,544,931 |
| Fidelity Securities Lending Cash Central Fund | 286,697 |
| Total | $3,831,628 |
Amounts in the income column in the above table include any capital gain distributions from underlying funds, which are presented in the corresponding line-item in the Statement of Operations, if applicable. Amount for Fidelity Securities Lending Cash Central Fund represents the income earned on investing cash collateral, less rebates paid to borrowers and any lending agent fees associated with the loan, plus any premium payments received for lending certain types of securities.
Investment Valuation
The following is a summary of the inputs used, as of September 30, 2019, involving the Fund's assets and liabilities carried at fair value. The inputs or methodology used for valuing securities may not be an indication of the risk associated with investing in those securities. For more information on valuation inputs, and their aggregation into the levels used below, please refer to the Investment Valuation section in the accompanying Notes to Financial Statements.
| Valuation Inputs at Reporting Date: | ||||
| Description | Total | Level 1 | Level 2 | Level 3 |
| Investments in Securities: | ||||
| Common Stocks | $4,184,561,795 | $4,127,442,666 | $28,988,347 | $28,130,782 |
| Money Market Funds | 203,780,550 | 203,780,550 | -- | -- |
| Total Investments in Securities: | $4,388,342,345 | $4,331,223,216 | $28,988,347 | $28,130,782 |
The following is a reconciliation of Investments in Securities for which Level 3 inputs were used in determining value:
| Investments in Securities: | |
| Beginning Balance | $61,229,798 |
| Total Realized Gain (Loss) | -- |
| Total Unrealized Gain (Loss) | (11,137,969) |
| Cost of Purchases | -- |
| Proceeds of Sales | (21,961,047) |
| Amortization/Accretion | -- |
| Transfers in to Level 3 | -- |
| Transfers out of Level 3 | -- |
| Ending Balance | $28,130,782 |
| The change in unrealized gain (loss) for the period attributable to Level 3 securities held at September 30, 2019 | $5,155,009 |
The information used in the above reconciliation represents fiscal year to date activity for any Investments in Securities identified as using Level 3 inputs at either the beginning or the end of the current fiscal period. Transfers in or out of Level 3 represent the beginning value of any Security or Instrument where a change in the pricing level occurred from the beginning to the end of the period. The cost of purchases and the proceeds of sales may include securities received or delivered through corporate actions or exchanges. Realized and unrealized gains (losses) disclosed in the reconciliations are included in Net Gain (Loss) on the Fund's Statement of Operations.
See accompanying notes which are an integral part of the financial statements.
Fidelity® Information Technology Central Fund
Financial Statements
Statement of Assets and Liabilities
| September 30, 2019 | ||
| Assets | ||
| Investment in securities, at value (including securities loaned of $73,974,831) — See accompanying schedule: Unaffiliated issuers (cost $3,318,844,461) | $4,184,561,795 | |
| Fidelity Central Funds (cost $203,780,550) | 203,780,550 | |
| Total Investment in Securities (cost $3,522,625,011) | $4,388,342,345 | |
| Foreign currency held at value (cost $128,096) | 123,259 | |
| Receivable for investments sold | 8,392,234 | |
| Receivable for fund shares sold | 565,560 | |
| Dividends receivable | 1,290,053 | |
| Distributions receivable from Fidelity Central Funds | 251,083 | |
| Other receivables | 23,270 | |
| Total assets | 4,398,987,804 | |
| Liabilities | ||
| Payable for investments purchased | $22,826,412 | |
| Payable for fund shares redeemed | 2,452,089 | |
| Other payables and accrued expenses | 40,144 | |
| Collateral on securities loaned | 74,205,709 | |
| Total liabilities | 99,524,354 | |
| Net Assets | $4,299,463,450 | |
| Net Assets consist of: | ||
| Paid in capital | $3,354,319,677 | |
| Total accumulated earnings (loss) | 945,143,773 | |
| Net Assets, for 10,637,172 shares outstanding | $4,299,463,450 | |
| Net Asset Value, offering price and redemption price per share ($4,299,463,450 ÷ 10,637,172 shares) | $404.19 |
See accompanying notes which are an integral part of the financial statements.
Statement of Operations
| Year ended September 30, 2019 | ||
| Investment Income | ||
| Dividends | $44,121,749 | |
| Income from Fidelity Central Funds (including $286,697 from security lending) | 3,831,628 | |
| Total income | 47,953,377 | |
| Expenses | ||
| Custodian fees and expenses | $67,674 | |
| Independent directors' fees and expenses | 25,790 | |
| Interest | 3,231 | |
| Miscellaneous | 46 | |
| Total expenses before reductions | 96,741 | |
| Expense reductions | (2,052) | |
| Total expenses after reductions | 94,689 | |
| Net investment income (loss) | 47,858,688 | |
| Realized and Unrealized Gain (Loss) | ||
| Net realized gain (loss) on: | ||
| Investment securities: | ||
| Unaffiliated issuers | 82,940,127 | |
| Redemptions in-kind with affiliated entities | 104,489,006 | |
| Fidelity Central Funds | 2,628 | |
| Foreign currency transactions | (482,214) | |
| Total net realized gain (loss) | 186,949,547 | |
| Change in net unrealized appreciation (depreciation) on: | ||
| Investment securities: | ||
| Unaffiliated issuers | (351,518,435) | |
| Assets and liabilities in foreign currencies | (15,575) | |
| Total change in net unrealized appreciation (depreciation) | (351,534,010) | |
| Net gain (loss) | (164,584,463) | |
| Net increase (decrease) in net assets resulting from operations | $(116,725,775) |
See accompanying notes which are an integral part of the financial statements.
Statement of Changes in Net Assets
| Year ended September 30, 2019 | Year ended September 30, 2018 | |
| Increase (Decrease) in Net Assets | ||
| Operations | ||
| Net investment income (loss) | $47,858,688 | $39,535,366 |
| Net realized gain (loss) | 186,949,547 | 1,412,260,746 |
| Change in net unrealized appreciation (depreciation) | (351,534,010) | (303,948,832) |
| Net increase (decrease) in net assets resulting from operations | (116,725,775) | 1,147,847,280 |
| Distributions to shareholders | (777,091,120) | – |
| Distributions to shareholders from net investment income | – | (36,464,862) |
| Distributions to shareholders from net realized gain | – | (557,750,410) |
| Total distributions | (777,091,120) | (594,215,272) |
| Affiliated share transactions | ||
| Proceeds from sales of shares | 360,133,349 | 2,068,499,891 |
| Reinvestment of distributions | 777,091,120 | 594,215,272 |
| Cost of shares redeemed | (1,733,610,068) | (1,430,604,144) |
| Net increase (decrease) in net assets resulting from share transactions | (596,385,599) | 1,232,111,019 |
| Total increase (decrease) in net assets | (1,490,202,494) | 1,785,743,027 |
| Net Assets | ||
| Beginning of period | 5,789,665,944 | 4,003,922,917 |
| End of period | $4,299,463,450 | $5,789,665,944 |
| Other Information | ||
| Undistributed net investment income end of period | $3,504,985 | |
| Shares | ||
| Sold | 889,424 | 4,514,165 |
| Issued in reinvestment of distributions | 2,460,987 | 1,380,579 |
| Redeemed | (4,297,390) | (3,113,820) |
| Net increase (decrease) | (946,979) | 2,780,924 |
See accompanying notes which are an integral part of the financial statements.
Financial Highlights
Fidelity Information Technology Central Fund
| Years ended September 30, | 2019 | 2018 | 2017 | 2016 | 2015 |
| Selected Per–Share Data | |||||
| Net asset value, beginning of period | $499.79 | $454.82 | $330.24 | $260.71 | $262.98 |
| Income from Investment Operations | |||||
| Net investment income (loss)A | 4.20 | 3.67 | 2.78 | 2.48 | 2.24B |
| Net realized and unrealized gain (loss) | (19.37) | 106.41 | 126.52 | 69.42 | (2.37) |
| Total from investment operations | (15.17) | 110.08 | 129.30 | 71.90 | (.13) |
| Distributions from net investment income | (4.33) | (3.34) | (2.67) | (2.37) | (2.14) |
| Distributions from net realized gain | (76.10) | (61.77) | (2.05) | – | – |
| Total distributions | (80.43) | (65.11) | (4.72) | (2.37) | (2.14) |
| Net asset value, end of period | $404.19 | $499.79 | $454.82 | $330.24 | $260.71 |
| Total ReturnC | 1.67% | 26.62% | 39.59% | 27.68% | (.11)% |
| Ratios to Average Net AssetsD,E | |||||
| Expenses before reductions | - %F | .01% | .01% | .01% | .01% |
| Expenses net of fee waivers, if any | - %F | .01% | .01% | .01% | .01% |
| Expenses net of all reductions | - %F | .01% | .01% | .01% | .01% |
| Net investment income (loss) | 1.09% | .78% | .73% | .86% | .81%B |
| Supplemental Data | |||||
| Net assets, end of period (000 omitted) | $4,299,463 | $5,789,666 | $4,003,923 | $3,219,282 | $2,532,510 |
| Portfolio turnover rateG | 51%H | 99%H | 70%H | 99% | 138% |
A Calculated based on average shares outstanding during the period.
B Net investment income per share reflects a large, non-recurring dividend which amounted to $.43 per share. Excluding this non-recurring dividend, the ratio of net investment income (loss) to average net assets would have been .65%.
C Total returns would have been lower if certain expenses had not been reduced during the applicable periods shown.
D Fees and expenses of any underlying Fidelity Central Funds are not included in the Fund's expense ratio. The Fund indirectly bears its proportionate share of the expenses of any underlying Fidelity Central Funds.
E Expense ratios reflect operating expenses of the Fund. Expenses before reductions do not reflect amounts reimbursed by the investment adviser or reductions from expense offset arrangements and do not represent the amount paid by the Fund during periods when reimbursements or reductions occur. Expenses net of fee waivers reflect expenses after reimbursement by the investment adviser but prior to reductions from expense offset arrangements. Expenses net of all reductions represent the net expenses paid by the Fund.
F Amount represents less than .005%.
G Amount does not include the portfolio activity of any underlying Fidelity Central Funds.
H Portfolio turnover rate excludes securities received or delivered in-kind.
See accompanying notes which are an integral part of the financial statements.
Fidelity® Materials Central Fund
Performance: The Bottom Line
Average annual total return reflects the change in the value of an investment, assuming reinvestment of distributions from dividend income and capital gains (the profits earned upon the sale of securities that have grown in value, if any) and assuming a constant rate of performance each year. The hypothetical investment and the average annual total returns do not reflect the deduction of taxes that a shareholder would pay on fund distributions or the redemption of fund shares. During periods of reimbursement by Fidelity, a fund’s total return will be greater than it would be had the reimbursement not occurred. How a fund did yesterday is no guarantee of how it will do tomorrow.
Average Annual Total Returns
| For the periods ended September 30, 2019 | Past 1 year | Past 5 years | Past 10 years |
| Fidelity® Materials Central Fund | (9.04)% | 1.40% | 8.03% |
$10,000 Over 10 Years
Let's say hypothetically that $10,000 was invested in Fidelity® Materials Central Fund on September 30, 2009.
The chart shows how the value of your investment would have changed, and also shows how the S&P 500® Index performed over the same period.

| Period Ending Values | ||
| $21,640 | Fidelity® Materials Central Fund | |
| $34,674 | S&P 500® Index | |
Fidelity® Materials Central Fund
Management's Discussion of Fund Performance
Market Recap: The S&P 500® index gained 4.25% for the 12 months ending September 30, 2019, a choppy period in which stocks seesawed due to trade tension, interest rates, economic data and an inverted yield curve, among other factors. Equities began the new year on a high note after enduring a historically volatile final quarter of 2018. Upbeat company earnings and outlooks, along with signs the Federal Reserve may pause on rates, boosted stocks to an all-time high on April 30. In May, however, volatility spiked and the index sunk as trade negotiations between the U.S. and China broke down and tit-for-tat tariff fighting ensued. The bull market roared back in June and recorded a series of highs in July, when the Fed, affirming a dovish shift in policy, cut interest rates for the first time since 2008. Volatility intensified in August, however, as the U.S. Treasury yield curve inverted for the first time since 2007, which some investors viewed as a sign the world's biggest economy could be heading for recession. For the full 12 months, three defensive sectors led the way: utilities (+27%), real estate (+25%) and consumer staples (+17%). Information technology rose about 9%, boosted by software & services (+14%), the market’s largest industry. Communication services stocks gained roughly 6%. In contrast, energy (-19%) was by far the weakest sector – slipping on lower oil prices – followed by health care (-4%) and industrials (+1%). Other laggards included consumer discretionary (+2%), materials (+3%) and financials (+4%).Comments from Portfolio Manager Richard Malnight: For the fiscal year, the fund returned -9.04%, considerably trailing the -1.47% result of the MSCI U.S. IMI Materials 25/50 Index, as well as the S&P 500®. Among the 11 sectors in the S&P 500, materials finished with the seventh-best total return the past 12 months, as trade tension and slowing global economic growth kept a lid on stocks in the group. Versus the MSCI sector index, stock selection in specialty chemicals and diversified chemicals, as well as a sizable overweighting in commodity chemicals, all meaningfully detracted. The largest individual relative detractor by a wide margin was a sizable stake in Chemours (-60%). The stock tumbled sharply in May, after the company reported a roughly 31% earnings decline for the first quarter amid lower demand for its titanium dioxide (TiO2) pigment and its fluorochemical refrigerant products. Untimely ownership of Ecolab (+28%) also weighed on the fund’s relative result. Ecolab has a relatively stable business model, providing cleaning supplies to the food service industry and water treatment services to industrial customers. During the period, I established a meaningful, but nonetheless underweighted, stake in Ecolab as part of my effort to reduce risk in the portfolio. Conversely, positioning in construction materials and an underweighting in steel aided relative performance. Among individual holdings, a non-index position in Germany-based industrial gases stock Linde (+8%) was our top contributor.The views expressed above reflect those of the portfolio manager(s) only through the end of the period as stated on the cover of this report and do not necessarily represent the views of Fidelity or any other person in the Fidelity organization. Any such views are subject to change at any time based upon market or other conditions and Fidelity disclaims any responsibility to update such views. These views may not be relied on as investment advice and, because investment decisions for a Fidelity fund are based on numerous factors, may not be relied on as an indication of trading intent on behalf of any Fidelity fund.
Note to Shareholders: On November 8, 2019, Jody Simes assumed portfolio management responsibilities for the fund, succeeding Richard Malnight.Fidelity® Materials Central Fund
Investment Summary (Unaudited)
Top Ten Stocks as of September 30, 2019
| % of fund's net assets | |
| Linde PLC | 14.5 |
| DowDuPont, Inc. | 10.6 |
| Air Products & Chemicals, Inc. | 6.6 |
| Olin Corp. | 5.7 |
| The Chemours Co. LLC | 5.5 |
| Sherwin-Williams Co. | 5.4 |
| Corteva, Inc. | 4.7 |
| Ecolab, Inc. | 4.5 |
| Vulcan Materials Co. | 4.2 |
| Martin Marietta Materials, Inc. | 4.0 |
| 65.7 |
Top Industries (% of fund's net assets)
| As of September 30, 2019 | ||
| Chemicals | 66.0% | |
| Containers & Packaging | 12.8% | |
| Construction Materials | 8.5% | |
| Pharmaceuticals | 4.7% | |
| Metals & Mining | 4.6% | |
| All Others* | 3.4% | |

* Includes short-term investments and net other assets (liabilities).
Fidelity® Materials Central Fund
Schedule of Investments September 30, 2019
Showing Percentage of Net Assets
| Common Stocks - 99.4% | |||
| Shares | Value | ||
| Chemicals - 66.0% | |||
| Commodity Chemicals - 7.7% | |||
| Cabot Corp. | 33,659 | $1,525,426 | |
| Olin Corp. | 1,337,541 | 25,038,768 | |
| Orion Engineered Carbons SA | 342,898 | 5,729,826 | |
| Westlake Chemical Corp. | 21,101 | 1,382,538 | |
| 33,676,558 | |||
| Diversified Chemicals - 18.1% | |||
| DowDuPont, Inc. | 652,464 | 46,527,208 | |
| Huntsman Corp. | 178,771 | 4,158,213 | |
| Ingevity Corp. (a) | 58,564 | 4,968,570 | |
| The Chemours Co. LLC | 1,623,917 | 24,261,320 | |
| 79,915,311 | |||
| Fertilizers & Agricultural Chemicals - 1.4% | |||
| CF Industries Holdings, Inc. | 120,975 | 5,951,970 | |
| Industrial Gases - 21.1% | |||
| Air Products & Chemicals, Inc. | 132,323 | 29,357,181 | |
| Linde PLC | 329,048 | 63,743,178 | |
| 93,100,359 | |||
| Specialty Chemicals - 17.7% | |||
| Ecolab, Inc. | 99,146 | 19,634,874 | |
| Element Solutions, Inc. (a) | 117,033 | 1,191,396 | |
| International Flavors & Fragrances, Inc. (b) | 90,830 | 11,143,933 | |
| PolyOne Corp. | 41,062 | 1,340,674 | |
| Sherwin-Williams Co. | 43,274 | 23,795,074 | |
| Symrise AG | 45,967 | 4,467,070 | |
| Tronox Holdings PLC | 1,023,099 | 8,491,722 | |
| W.R. Grace & Co. | 119,244 | 7,960,729 | |
| 78,025,472 | |||
| TOTAL CHEMICALS | 290,669,670 | ||
| Commercial Services & Supplies - 1.3% | |||
| Environmental & Facility Services - 1.3% | |||
| Waste Connection, Inc. (United States) | 60,776 | 5,591,392 | |
| Construction Materials - 8.5% | |||
| Construction Materials - 8.5% | |||
| Martin Marietta Materials, Inc. | 64,719 | 17,739,478 | |
| Summit Materials, Inc. (a) | 59,911 | 1,330,024 | |
| Vulcan Materials Co. | 121,360 | 18,354,486 | |
| 37,423,988 | |||
| Containers & Packaging - 12.8% | |||
| Metal & Glass Containers - 9.7% | |||
| Aptargroup, Inc. | 92,703 | 10,980,670 | |
| Ball Corp. | 200,408 | 14,591,706 | |
| Crown Holdings, Inc. (a) | 263,551 | 17,410,179 | |
| 42,982,555 | |||
| Paper Packaging - 3.1% | |||
| Avery Dennison Corp. | 118,764 | 13,488,027 | |
| TOTAL CONTAINERS & PACKAGING | 56,470,582 | ||
| Metals & Mining - 4.6% | |||
| Gold - 4.6% | |||
| Newmont Goldcorp Corp. | 429,280 | 16,278,298 | |
| Royal Gold, Inc. | 34,427 | 4,241,751 | |
| 20,520,049 | |||
| Pharmaceuticals - 4.7% | |||
| Pharmaceuticals - 4.7% | |||
| Corteva, Inc. | 743,436 | 20,816,208 | |
| Trading Companies & Distributors - 1.5% | |||
| Trading Companies & Distributors - 1.5% | |||
| Univar, Inc. (a) | 324,162 | 6,729,603 | |
| TOTAL COMMON STOCKS | |||
| (Cost $441,952,231) | 438,221,492 | ||
| Money Market Funds - 3.1% | |||
| Fidelity Cash Central Fund 1.96% (c) | 2,281,816 | 2,282,273 | |
| Fidelity Securities Lending Cash Central Fund 1.96% (c)(d) | 11,193,824 | 11,194,943 | |
| TOTAL MONEY MARKET FUNDS | |||
| (Cost $13,477,216) | 13,477,216 | ||
| TOTAL INVESTMENT IN SECURITIES - 102.5% | |||
| (Cost $455,429,447) | 451,698,708 | ||
| NET OTHER ASSETS (LIABILITIES) - (2.5)% | (11,073,142) | ||
| NET ASSETS - 100% | $440,625,566 |
Legend
(a) Non-income producing
(b) Security or a portion of the security is on loan at period end.
(c) Affiliated fund that is generally available only to investment companies and other accounts managed by Fidelity Investments. The rate quoted is the annualized seven-day yield of the fund at period end. A complete unaudited listing of the fund's holdings as of its most recent quarter end is available upon request. In addition, each Fidelity Central Fund's financial statements, which are not covered by the Fund's Report of Independent Registered Public Accounting Firm, are available on the SEC's website or upon request.
(d) Investment made with cash collateral received from securities on loan.
Affiliated Central Funds
Information regarding fiscal year to date income earned by the Fund from investments in Fidelity Central Funds is as follows:
| Fund | Income earned |
| Fidelity Cash Central Fund | $82,059 |
| Fidelity Securities Lending Cash Central Fund | 54,710 |
| Total | $136,769 |
Amounts in the income column in the above table include any capital gain distributions from underlying funds, which are presented in the corresponding line-item in the Statement of Operations, if applicable. Amount for Fidelity Securities Lending Cash Central Fund represents the income earned on investing cash collateral, less rebates paid to borrowers and any lending agent fees associated with the loan, plus any premium payments received for lending certain types of securities.
Investment Valuation
All investments are categorized as Level 1 under the Fair Value Hierarchy. The inputs or methodology used for valuing securities may not be an indication of the risk associated with investing in those securities. For more information on valuation inputs please refer to the Investment Valuation section in the accompanying Notes to Financial Statements.
Other Information
Distribution of investments by country or territory of incorporation, as a percentage of Total Net Assets, is as follows (Unaudited):
| United States of America | 80.0% |
| Ireland | 14.5% |
| United Kingdom | 1.9% |
| Luxembourg | 1.3% |
| Canada | 1.3% |
| Germany | 1.0% |
| 100.0% |
See accompanying notes which are an integral part of the financial statements.
Fidelity® Materials Central Fund
Financial Statements
Statement of Assets and Liabilities
| September 30, 2019 | ||
| Assets | ||
| Investment in securities, at value (including securities loaned of $11,143,933) — See accompanying schedule: Unaffiliated issuers (cost $441,952,231) | $438,221,492 | |
| Fidelity Central Funds (cost $13,477,216) | 13,477,216 | |
| Total Investment in Securities (cost $455,429,447) | $451,698,708 | |
| Foreign currency held at value (cost $3) | 3 | |
| Receivable for fund shares sold | 72,138 | |
| Dividends receivable | 380,846 | |
| Distributions receivable from Fidelity Central Funds | 4,864 | |
| Total assets | 452,156,559 | |
| Liabilities | ||
| Payable to custodian bank | $10,697 | |
| Payable for fund shares redeemed | 312,560 | |
| Other payables and accrued expenses | 12,938 | |
| Collateral on securities loaned | 11,194,798 | |
| Total liabilities | 11,530,993 | |
| Net Assets | $440,625,566 | |
| Net Assets consist of: | ||
| Paid in capital | $486,452,879 | |
| Total accumulated earnings (loss) | (45,827,313) | |
| Net Assets, for 2,270,904 shares outstanding | $440,625,566 | |
| Net Asset Value, offering price and redemption price per share ($440,625,566 ÷ 2,270,904 shares) | $194.03 |
See accompanying notes which are an integral part of the financial statements.
Statement of Operations
| Year ended September 30, 2019 | ||
| Investment Income | ||
| Dividends | $10,011,909 | |
| Income from Fidelity Central Funds (including $54,710 from security lending) | 136,769 | |
| Total income | 10,148,678 | |
| Expenses | ||
| Custodian fees and expenses | $17,784 | |
| Independent directors' fees and expenses | 2,776 | |
| Miscellaneous | 5 | |
| Total expenses | 20,565 | |
| Net investment income (loss) | 10,128,113 | |
| Realized and Unrealized Gain (Loss) | ||
| Net realized gain (loss) on: | ||
| Investment securities: | ||
| Unaffiliated issuers | (35,697,866) | |
| Redemptions in-kind with affiliated entities | 2,891,939 | |
| Fidelity Central Funds | 146 | |
| Foreign currency transactions | 32,345 | |
| Total net realized gain (loss) | (32,773,436) | |
| Change in net unrealized appreciation (depreciation) on: | ||
| Investment securities: | ||
| Unaffiliated issuers | (27,839,253) | |
| Assets and liabilities in foreign currencies | (6,693) | |
| Total change in net unrealized appreciation (depreciation) | (27,845,946) | |
| Net gain (loss) | (60,619,382) | |
| Net increase (decrease) in net assets resulting from operations | $(50,491,269) |
See accompanying notes which are an integral part of the financial statements.
Statement of Changes in Net Assets
| Year ended September 30, 2019 | Year ended September 30, 2018 | |
| Increase (Decrease) in Net Assets | ||
| Operations | ||
| Net investment income (loss) | $10,128,113 | $10,599,756 |
| Net realized gain (loss) | (32,773,436) | 71,373,247 |
| Change in net unrealized appreciation (depreciation) | (27,845,946) | (93,940,563) |
| Net increase (decrease) in net assets resulting from operations | (50,491,269) | (11,967,560) |
| Distributions to shareholders | (46,771,503) | – |
| Distributions to shareholders from net investment income | – | (9,590,869) |
| Distributions to shareholders from net realized gain | – | (27,989,724) |
| Total distributions | (46,771,503) | (37,580,593) |
| Affiliated share transactions | ||
| Proceeds from sales of shares | 27,873,938 | 242,088,015 |
| Reinvestment of distributions | 46,771,503 | 37,580,593 |
| Cost of shares redeemed | (95,167,903) | (145,554,862) |
| Net increase (decrease) in net assets resulting from share transactions | (20,522,462) | 134,113,746 |
| Total increase (decrease) in net assets | (117,785,234) | 84,565,593 |
| Net Assets | ||
| Beginning of period | 558,410,800 | 473,845,207 |
| End of period | $440,625,566 | $558,410,800 |
| Other Information | ||
| Undistributed net investment income end of period | $1,692,230 | |
| Shares | ||
| Sold | 140,622 | 952,669 |
| Issued in reinvestment of distributions | 258,092 | 145,744 |
| Redeemed | (476,014) | (569,787) |
| Net increase (decrease) | (77,300) | 528,626 |
See accompanying notes which are an integral part of the financial statements.
Financial Highlights
Fidelity Materials Central Fund
| Years ended September 30, | 2019 | 2018 | 2017 | 2016 | 2015 |
| Selected Per–Share Data | |||||
| Net asset value, beginning of period | $237.80 | $260.41 | $213.34 | $188.48 | $229.95 |
| Income from Investment Operations | |||||
| Net investment income (loss)A | 4.25 | 4.94 | 4.24 | 4.48 | 4.34 |
| Net realized and unrealized gain (loss) | (27.55) | (7.93) | 46.66 | 24.73 | (41.59) |
| Total from investment operations | (23.30) | (2.99) | 50.90 | 29.21 | (37.25) |
| Distributions from net investment income | (4.64) | (4.54) | (3.83) | (4.35) | (4.22) |
| Distributions from net realized gain | (15.83) | (15.08) | – | – | – |
| Total distributions | (20.47) | (19.62) | (3.83) | (4.35) | (4.22) |
| Net asset value, end of period | $194.03 | $237.80 | $260.41 | $213.34 | $188.48 |
| Total ReturnB | (9.04)% | (1.66)% | 24.05% | 15.62% | (16.46)% |
| Ratios to Average Net AssetsC,D | |||||
| Expenses before reductions | - %E | - %E | .01% | - %E | - %E |
| Expenses net of fee waivers, if any | - %E | - %E | .01% | - %E | - %E |
| Expenses net of all reductions | - %E | - %E | .01% | - %E | - %E |
| Net investment income (loss) | 2.13% | 1.92% | 1.80% | 2.21% | 1.95% |
| Supplemental Data | |||||
| Net assets, end of period (000 omitted) | $440,626 | $558,411 | $473,845 | $400,862 | $358,642 |
| Portfolio turnover rateF | 74%G | 78%G | 54%G | 56% | 72% |
A Calculated based on average shares outstanding during the period.
B Total returns would have been lower if certain expenses had not been reduced during the applicable periods shown.
C Fees and expenses of any underlying Fidelity Central Funds are not included in the Fund's expense ratio. The Fund indirectly bears its proportionate share of the expenses of any underlying Fidelity Central Funds.
D Expense ratios reflect operating expenses of the Fund. Expenses before reductions do not reflect amounts reimbursed by the investment adviser or reductions from expense offset arrangements and do not represent the amount paid by the Fund during periods when reimbursements or reductions occur. Expenses net of fee waivers reflect expenses after reimbursement by the investment adviser but prior to reductions from expense offset arrangements. Expenses net of all reductions represent the net expenses paid by the Fund.
E Amount represents less than .005%.
F Amount does not include the portfolio activity of any underlying Fidelity Central Funds.
G Portfolio turnover rate excludes securities received or delivered in-kind.
See accompanying notes which are an integral part of the financial statements.
Fidelity® Real Estate Equity Central Fund
Performance: The Bottom Line
Average annual total return reflects the change in the value of an investment, assuming reinvestment of distributions from dividend income and capital gains (the profits earned upon the sale of securities that have grown in value, if any) and assuming a constant rate of performance each year. The hypothetical investment and the average annual total returns do not reflect the deduction of taxes that a shareholder would pay on fund distributions or the redemption of fund shares. During periods of reimbursement by Fidelity, a fund’s total return will be greater than it would be had the reimbursement not occurred. How a fund did yesterday is no guarantee of how it will do tomorrow.
Average Annual Total Returns
| For the periods ended September 30, 2019 | Past 1 year | Life of fundA |
| Fidelity® Real Estate Equity Central Fund | 18.98% | 8.55% |
A From November 3, 2014
$10,000 Over Life of Fund
Let's say hypothetically that $10,000 was invested in Fidelity® Real Estate Equity Central Fund on November 3, 2014, when the fund started.
The chart shows how the value of your investment would have changed, and also shows how the S&P 500® Index performed over the same period.

| Period Ending Values | ||
| $14,960 | Fidelity® Real Estate Equity Central Fund | |
| $16,330 | S&P 500® Index | |
Fidelity® Real Estate Equity Central Fund
Management's Discussion of Fund Performance
Market Recap: The S&P 500® index gained 4.25% for the 12 months ending September 30, 2019, a choppy period in which stocks seesawed due to trade tension, interest rates, economic data and an inverted yield curve, among other factors. Equities began the new year on a high note after enduring a historically volatile final quarter of 2018. Upbeat company earnings and outlooks, along with signs the Federal Reserve may pause on rates, boosted stocks to an all-time high on April 30. In May, however, volatility spiked and the index sunk as trade negotiations between the U.S. and China broke down and tit-for-tat tariff fighting ensued. The bull market roared back in June and recorded a series of highs in July, when the Fed, affirming a dovish shift in policy, cut interest rates for the first time since 2008. Volatility intensified in August, however, as the U.S. Treasury yield curve inverted for the first time since 2007, which some investors viewed as a sign the world's biggest economy could be heading for recession. For the full 12 months, three defensive sectors led the way: utilities (+27%), real estate (+25%) and consumer staples (+17%). Information technology rose about 9%, boosted by software & services (+14%), the market’s largest industry. Communication services stocks gained roughly 6%. In contrast, energy (-19%) was by far the weakest sector – slipping on lower oil prices – followed by health care (-4%) and industrials (+1%). Other laggards included consumer discretionary (+2%), materials (+3%) and financials (+4%).Comments from Portfolio Manager Samuel Wald: For the fiscal year, the fund gained 18.98%, modestly outpacing the 18.42% advance of the FTSE NAREIT Equity REITs Index, while significantly topping the S&P 500®. Versus the FTSE NAREIT index, security selection in the retail and industrial/office categories contributed most, followed by an underweighting in the weak hotels segment. Conversely, the biggest detractors were our picks in diversified, hotels and real-estate related. Individually, the biggest relative contributor was Simon Property Group (-7%). I chose to significantly underweight this large mall real estate investment trust (REIT) primarily because of the challenging market backdrop for retail property owners. The fund also benefited from avoiding another mall owner, benchmark component Macerich (-38%). It helped to overweight Taubman Centers (-28%) and Urban Edge Properties (-6%). Also contributing was our underweight in and eventual sale of Host Hotels & Resorts (-16%) and lacking exposure to benchmark component Park Hotels & Resorts (-17%). Owners of hotel properties often struggled on concern about moderating economic growth and growing supply in certain markets. That positive impact, however, was partly mitigated by an overweighting in hotel REIT RLJ Lodging Trust (-14%). Elsewhere, overweighting Equinix (+36%), one of our largest holdings on September 30, contributed to returns.The views expressed above reflect those of the portfolio manager(s) only through the end of the period as stated on the cover of this report and do not necessarily represent the views of Fidelity or any other person in the Fidelity organization. Any such views are subject to change at any time based upon market or other conditions and Fidelity disclaims any responsibility to update such views. These views may not be relied on as investment advice and, because investment decisions for a Fidelity fund are based on numerous factors, may not be relied on as an indication of trading intent on behalf of any Fidelity fund.
Fidelity® Real Estate Equity Central Fund
Investment Summary (Unaudited)
Top Ten Stocks as of September 30, 2019
| % of fund's net assets | |
| Prologis, Inc. | 7.6 |
| Equinix, Inc. | 7.3 |
| Ventas, Inc. | 5.0 |
| AvalonBay Communities, Inc. | 4.8 |
| Alexandria Real Estate Equities, Inc. | 4.1 |
| Essex Property Trust, Inc. | 3.5 |
| UDR, Inc. | 3.4 |
| Welltower, Inc. | 3.2 |
| Equity Residential (SBI) | 3.0 |
| National Retail Properties, Inc. | 3.0 |
| 44.9 |
Top Five REIT Sectors as of September 30, 2019
| % of fund's net assets | |
| REITs - Apartments | 16.9 |
| REITs - Diversified | 16.0 |
| REITs - Health Care | 12.2 |
| REITs - Office Property | 12.2 |
| REITs - Warehouse/Industrial | 11.0 |
Asset Allocation (% of fund's net assets)
| As of September 30, 2019 | ||
| Stocks | 98.3% | |
| Short-Term Investments and Net Other Assets (Liabilities) | 1.7% | |

Fidelity® Real Estate Equity Central Fund
Schedule of Investments September 30, 2019
Showing Percentage of Net Assets
| Common Stocks - 98.3% | |||
| Shares | Value | ||
| Equity Real Estate Investment Trusts (REITs) - 96.3% | |||
| REITs - Apartments - 16.9% | |||
| AvalonBay Communities, Inc. | 101,150 | $21,780,630 | |
| Equity Residential (SBI) | 159,700 | 13,775,722 | |
| Essex Property Trust, Inc. | 48,200 | 15,744,530 | |
| Invitation Homes, Inc. | 347,100 | 10,277,631 | |
| UDR, Inc. | 315,300 | 15,285,744 | |
| 76,864,257 | |||
| REITs - Diversified - 16.0% | |||
| Clipper Realty, Inc. | 64,200 | 654,198 | |
| Crown Castle International Corp. | 34,200 | 4,754,142 | |
| Digital Realty Trust, Inc. | 70,000 | 9,086,700 | |
| Duke Realty Corp. | 316,400 | 10,748,108 | |
| Equinix, Inc. | 57,500 | 33,166,000 | |
| Outfront Media, Inc. | 142,000 | 3,944,760 | |
| VICI Properties, Inc. | 462,000 | 10,464,300 | |
| 72,818,208 | |||
| REITs - Health Care - 12.2% | |||
| CareTrust (REIT), Inc. | 227,900 | 5,356,790 | |
| Healthcare Realty Trust, Inc. | 374,100 | 12,532,350 | |
| Ventas, Inc. | 313,100 | 22,865,693 | |
| Welltower, Inc. | 161,950 | 14,680,768 | |
| 55,435,601 | |||
| REITs - Hotels - 2.5% | |||
| RLJ Lodging Trust | 394,600 | 6,704,254 | |
| Sunstone Hotel Investors, Inc. | 328,300 | 4,510,842 | |
| 11,215,096 | |||
| REITs - Management/Investment - 4.9% | |||
| CoreSite Realty Corp. | 30,800 | 3,752,980 | |
| National Retail Properties, Inc. | 241,100 | 13,598,040 | |
| Weyerhaeuser Co. | 173,300 | 4,800,410 | |
| 22,151,430 | |||
| REITs - Manufactured Homes - 2.8% | |||
| Equity Lifestyle Properties, Inc. | 93,276 | 12,461,674 | |
| REITs - Office Property - 12.2% | |||
| Alexandria Real Estate Equities, Inc. | 120,900 | 18,623,436 | |
| Boston Properties, Inc. | 97,500 | 12,641,850 | |
| Douglas Emmett, Inc. | 169,300 | 7,251,119 | |
| Highwoods Properties, Inc. (SBI) | 135,200 | 6,075,888 | |
| Mack-Cali Realty Corp. | 107,200 | 2,321,952 | |
| VEREIT, Inc. | 863,600 | 8,446,008 | |
| 55,360,253 | |||
| REITs - Regional Malls - 3.4% | |||
| Simon Property Group, Inc. | 59,150 | 9,206,698 | |
| Taubman Centers, Inc. | 146,500 | 5,981,595 | |
| 15,188,293 | |||
| REITs - Shopping Centers - 4.0% | |||
| Acadia Realty Trust (SBI) | 205,838 | 5,882,850 | |
| DDR Corp. | 445,850 | 6,736,794 | |
| Urban Edge Properties | 283,150 | 5,603,539 | |
| 18,223,183 | |||
| REITs - Single Tenant - 4.1% | |||
| Agree Realty Corp. | 47,900 | 3,503,885 | |
| Four Corners Property Trust, Inc. | 293,600 | 8,303,008 | |
| Spirit Realty Capital, Inc. | 142,260 | 6,808,564 | |
| 18,615,457 | |||
| REITs - Storage - 6.3% | |||
| CubeSmart | 363,000 | 12,668,700 | |
| Extra Space Storage, Inc. | 102,700 | 11,997,414 | |
| Public Storage | 16,000 | 3,924,320 | |
| 28,590,434 | |||
| REITs - Warehouse/Industrial - 11.0% | |||
| Americold Realty Trust | 221,900 | 8,225,833 | |
| Prologis, Inc. | 407,881 | 34,759,615 | |
| Terreno Realty Corp. | 139,663 | 7,135,383 | |
| 50,120,831 | |||
| TOTAL EQUITY REAL ESTATE INVESTMENT TRUSTS (REITS) | 437,044,717 | ||
| Hotels, Restaurants & Leisure - 1.4% | |||
| Hotels, Resorts & Cruise Lines - 1.4% | |||
| Hilton Grand Vacations, Inc. (a) | 69,900 | 2,236,800 | |
| Marriott International, Inc. Class A | 35,200 | 4,377,824 | |
| 6,614,624 | |||
| Media - 0.1% | |||
| Advertising - 0.1% | |||
| Clear Channel Outdoor Holdings, Inc. (a) | 209,500 | 527,940 | |
| Real Estate Management & Development - 0.5% | |||
| Real Estate Services - 0.5% | |||
| Jones Lang LaSalle, Inc. | 15,800 | 2,197,148 | |
| TOTAL COMMON STOCKS | |||
| (Cost $403,801,401) | 446,384,429 | ||
| Money Market Funds - 1.4% | |||
| Fidelity Cash Central Fund 1.96% (b) | |||
| (Cost $6,157,420) | 6,156,293 | 6,157,524 | |
| TOTAL INVESTMENT IN SECURITIES - 99.7% | |||
| (Cost $409,958,821) | 452,541,953 | ||
| NET OTHER ASSETS (LIABILITIES) - 0.3% | 1,360,394 | ||
| NET ASSETS - 100% | $453,902,347 |
Legend
(a) Non-income producing
(b) Affiliated fund that is generally available only to investment companies and other accounts managed by Fidelity Investments. The rate quoted is the annualized seven-day yield of the fund at period end. A complete unaudited listing of the fund's holdings as of its most recent quarter end is available upon request. In addition, each Fidelity Central Fund's financial statements, which are not covered by the Fund's Report of Independent Registered Public Accounting Firm, are available on the SEC's website or upon request.
Affiliated Central Funds
Information regarding fiscal year to date income earned by the Fund from investments in Fidelity Central Funds is as follows:
| Fund | Income earned |
| Fidelity Cash Central Fund | $79,053 |
| Fidelity Securities Lending Cash Central Fund | 1,817 |
| Total | $80,870 |
Amounts in the income column in the above table include any capital gain distributions from underlying funds, which are presented in the corresponding line-item in the Statement of Operations, if applicable. Amount for Fidelity Securities Lending Cash Central Fund represents the income earned on investing cash collateral, less rebates paid to borrowers and any lending agent fees associated with the loan, plus any premium payments received for lending certain types of securities.
Investment Valuation
All investments are categorized as Level 1 under the Fair Value Hierarchy. The inputs or methodology used for valuing securities may not be an indication of the risk associated with investing in those securities. For more information on valuation inputs please refer to the Investment Valuation section in the accompanying Notes to Financial Statements.
See accompanying notes which are an integral part of the financial statements.
Fidelity® Real Estate Equity Central Fund
Financial Statements
Statement of Assets and Liabilities
| September 30, 2019 | ||
| Assets | ||
| Investment in securities, at value — See accompanying schedule: Unaffiliated issuers (cost $403,801,401) | $446,384,429 | |
| Fidelity Central Funds (cost $6,157,420) | 6,157,524 | |
| Total Investment in Securities (cost $409,958,821) | $452,541,953 | |
| Receivable for investments sold | 1,139,742 | |
| Receivable for fund shares sold | 146,777 | |
| Dividends receivable | 1,898,656 | |
| Distributions receivable from Fidelity Central Funds | 16,497 | |
| Total assets | 455,743,625 | |
| Liabilities | ||
| Payable for investments purchased | $1,533,846 | |
| Payable for fund shares redeemed | 300,176 | |
| Other payables and accrued expenses | 7,256 | |
| Total liabilities | 1,841,278 | |
| Net Assets | $453,902,347 | |
| Net Assets consist of: | ||
| Paid in capital | $410,903,992 | |
| Total accumulated earnings (loss) | 42,998,355 | |
| Net Assets, for 3,647,888 shares outstanding | $453,902,347 | |
| Net Asset Value, offering price and redemption price per share ($453,902,347 ÷ 3,647,888 shares) | $124.43 |
See accompanying notes which are an integral part of the financial statements.
Statement of Operations
| Year ended September 30, 2019 | ||
| Investment Income | ||
| Dividends | $6,504,870 | |
| Income from Fidelity Central Funds (including $1,817 from security lending) | 80,870 | |
| Total income | 6,585,740 | |
| Expenses | ||
| Custodian fees and expenses | $10,909 | |
| Independent directors' fees and expenses | 899 | |
| Miscellaneous | 1 | |
| Total expenses before reductions | 11,809 | |
| Expense reductions | (181) | |
| Total expenses after reductions | 11,628 | |
| Net investment income (loss) | 6,574,112 | |
| Realized and Unrealized Gain (Loss) | ||
| Net realized gain (loss) on: | ||
| Investment securities: | ||
| Unaffiliated issuers | (652,310) | |
| Fidelity Central Funds | (102) | |
| Foreign currency transactions | (22) | |
| Total net realized gain (loss) | (652,434) | |
| Change in net unrealized appreciation (depreciation) on: | ||
| Investment securities: | ||
| Unaffiliated issuers | 30,902,864 | |
| Fidelity Central Funds | 104 | |
| Total change in net unrealized appreciation (depreciation) | 30,902,968 | |
| Net gain (loss) | 30,250,534 | |
| Net increase (decrease) in net assets resulting from operations | $36,824,646 |
See accompanying notes which are an integral part of the financial statements.
Statement of Changes in Net Assets
| Year ended September 30, 2019 | Year ended September 30, 2018 | |
| Increase (Decrease) in Net Assets | ||
| Operations | ||
| Net investment income (loss) | $6,574,112 | $4,401,769 |
| Net realized gain (loss) | (652,434) | 1,135,082 |
| Change in net unrealized appreciation (depreciation) | 30,902,968 | (1,174,470) |
| Net increase (decrease) in net assets resulting from operations | 36,824,646 | 4,362,381 |
| Distributions to shareholders | (7,127,321) | – |
| Distributions to shareholders from net investment income | – | (3,610,543) |
| Distributions to shareholders from net realized gain | – | (4,488,742) |
| Total distributions | (7,127,321) | (8,099,285) |
| Affiliated share transactions | ||
| Proceeds from sales of shares | 302,970,039 | 14,225,887 |
| Reinvestment of distributions | 7,127,321 | 8,099,285 |
| Cost of shares redeemed | (12,596,003) | (19,031,721) |
| Net increase (decrease) in net assets resulting from share transactions | 297,501,357 | 3,293,451 |
| Total increase (decrease) in net assets | 327,198,682 | (443,453) |
| Net Assets | ||
| Beginning of period | 126,703,665 | 127,147,118 |
| End of period | $453,902,347 | $126,703,665 |
| Other Information | ||
| Undistributed net investment income end of period | $1,214,307 | |
| Shares | ||
| Sold | 2,536,940 | 134,471 |
| Issued in reinvestment of distributions | 66,669 | 75,088 |
| Redeemed | (110,408) | (181,813) |
| Net increase (decrease) | 2,493,201 | 27,746 |
See accompanying notes which are an integral part of the financial statements.
Financial Highlights
Fidelity Real Estate Equity Central Fund
| Years ended September 30, | 2019 | 2018 | 2017 | 2016 | 2015 A |
| Selected Per–Share Data | |||||
| Net asset value, beginning of period | $109.73 | $112.82 | $113.15 | $95.92 | $100.00 |
| Income from Investment Operations | |||||
| Net investment income (loss)B | 3.92 | 3.84 | 3.00 | 3.03 | 2.53 |
| Net realized and unrealized gain (loss) | 15.85 | .13 | (.91) | 17.03 | (4.24) |
| Total from investment operations | 19.77 | 3.97 | 2.09 | 20.06 | (1.71) |
| Distributions from net investment income | (3.16) | (3.16)C | (2.29) | (2.83) | (2.37) |
| Distributions from net realized gain | (1.91) | (3.90)C | (.12) | – | – |
| Total distributions | (5.07) | (7.06) | (2.42)D | (2.83) | (2.37) |
| Net asset value, end of period | $124.43 | $109.73 | $112.82 | $113.15 | $95.92 |
| Total ReturnE,F | 18.98% | 3.73% | 1.95% | 21.08% | (1.81)% |
| Ratios to Average Net AssetsG,H | |||||
| Expenses before reductions | .01% | .01% | .01% | .01% | .01%I |
| Expenses net of fee waivers, if any | .01% | .01% | .01% | .01% | .01%I |
| Expenses net of all reductions | .01% | .01% | .01% | .01% | .01%I |
| Net investment income (loss) | 3.44% | 3.59% | 2.72% | 2.86% | 2.71%I |
| Supplemental Data | |||||
| Net assets, end of period (000 omitted) | $453,902 | $126,704 | $127,147 | $173,787 | $251,215 |
| Portfolio turnover rateJ | 37% | 47% | 64% | 69% | 62%I |
A For the period November 3, 2014 (commencement of operations) to September 30, 2015.
B Calculated based on average shares outstanding during the period.
C The amounts shown reflect certain reclassifications related to book to tax differences that were made in the year shown.
D Total distributions of $2.42 per share is comprised of distributions from net investment income of $2.294 and distributions from net realized gain of $.124 per share.
E Total returns for periods of less than one year are not annualized.
F Total returns would have been lower if certain expenses had not been reduced during the applicable periods shown.
G Fees and expenses of any underlying Fidelity Central Funds are not included in the Fund's expense ratio. The Fund indirectly bears its proportionate share of the expenses of any underlying Fidelity Central Funds.
H Expense ratios reflect operating expenses of the Fund. Expenses before reductions do not reflect amounts reimbursed by the investment adviser or reductions from expense offset arrangements and do not represent the amount paid by the Fund during periods when reimbursements or reductions occur. Expense ratios before reductions for start-up periods may not be representative of longer term operating periods. Expenses net of fee waivers reflect expenses after reimbursement by the investment adviser but prior to reductions from expense offset arrangements. Expenses net of all reductions represent the net expenses paid by the Fund.
I Annualized
J Amount does not include the portfolio activity of any underlying Fidelity Central Funds.
See accompanying notes which are an integral part of the financial statements.
Fidelity® Utilities Central Fund
Performance: The Bottom Line
Average annual total return reflects the change in the value of an investment, assuming reinvestment of distributions from dividend income and capital gains (the profits earned upon the sale of securities that have grown in value, if any) and assuming a constant rate of performance each year. The hypothetical investment and the average annual total returns do not reflect the deduction of taxes that a shareholder would pay on fund distributions or the redemption of fund shares. During periods of reimbursement by Fidelity, a fund’s total return will be greater than it would be had the reimbursement not occurred. How a fund did yesterday is no guarantee of how it will do tomorrow.
Average Annual Total Returns
| For the periods ended September 30, 2019 | Past 1 year | Past 5 years | Past 10 years |
| Fidelity® Utilities Central Fund | 20.12% | 11.80% | 13.59% |
$10,000 Over 10 Years
Let's say hypothetically that $10,000 was invested in Fidelity® Utilities Central Fund on September 30, 2009.
The chart shows how the value of your investment would have changed, and also shows how the S&P 500® Index performed over the same period.

| Period Ending Values | ||
| $35,764 | Fidelity® Utilities Central Fund | |
| $34,674 | S&P 500® Index | |
Fidelity® Utilities Central Fund
Management's Discussion of Fund Performance
Market Recap: The S&P 500® index gained 4.25% for the 12 months ending September 30, 2019, a choppy period in which stocks seesawed due to trade tension, interest rates, economic data and an inverted yield curve, among other factors. Equities began the new year on a high note after enduring a historically volatile final quarter of 2018. Upbeat company earnings and outlooks, along with signs the Federal Reserve may pause on rates, boosted stocks to an all-time high on April 30. In May, however, volatility spiked and the index sunk as trade negotiations between the U.S. and China broke down and tit-for-tat tariff fighting ensued. The bull market roared back in June and recorded a series of highs in July, when the Fed, affirming a dovish shift in policy, cut interest rates for the first time since 2008. Volatility intensified in August, however, as the U.S. Treasury yield curve inverted for the first time since 2007, which some investors viewed as a sign the world's biggest economy could be heading for recession. For the full 12 months, three defensive sectors led the way: utilities (+27%), real estate (+25%) and consumer staples (+17%). Information technology rose about 9%, boosted by software & services (+14%), the market’s largest industry. Communication services stocks gained roughly 6%. In contrast, energy (-19%) was by far the weakest sector – slipping on lower oil prices – followed by health care (-4%) and industrials (+1%). Other laggards included consumer discretionary (+2%), materials (+3%) and financials (+4%).Comments from Portfolio Manager Douglas Simmons: For the fiscal year, the fund gained 20.12%, notably lagging the 25.61% advance of the sector benchmark, the MSCI U.S. IMI Utilities 25/50 Index, but handily outpacing the S&P® 500 index. After finishing 2018 on a high note as the best-performing sector within the S&P 500, utilities stocks posted steady gains the past 12 months. As volatility increased in 2019, stoked by trade tensions and slowing global economic growth, utilities delivered strong results compared to other segments of the market during the period. Versus the MSCI index, security selection among electric utilities detracted the most by far, followed by oil & gas storage & transportation stocks to a much lesser degree. The fund's biggest individual detractor was California-based electric utility PG&E (-86%), hampered by an estimated $30 billion in liabilities resulting from the state's catastrophic wildfires in 2017 and 2018. Ultimately, I sold this position within the portfolio prior to period end. Also detracting was an out-of-benchmark position in the shares of liquefied natural gas exporter Cheniere Energy (-10%) where weak energy prices weighed heavily on the stock. The fund's stake in unregulated nuclear power producer Exelon (-14%) also hindered relative performance the past 12 months due to milder weather that resulted in lower power prices for much of the reporting period. Conversely, favorable stock selection, coupled with an underweighting in the gas utilities segment, added value. Here, the fund's holding in SCANA (+24%), was the top contributor. The firm was acquired in January by Dominion Energy, another fund holding and its largest position at period end, on both an absolute and relative basis.The views expressed above reflect those of the portfolio manager(s) only through the end of the period as stated on the cover of this report and do not necessarily represent the views of Fidelity or any other person in the Fidelity organization. Any such views are subject to change at any time based upon market or other conditions and Fidelity disclaims any responsibility to update such views. These views may not be relied on as investment advice and, because investment decisions for a Fidelity fund are based on numerous factors, may not be relied on as an indication of trading intent on behalf of any Fidelity fund.
Fidelity® Utilities Central Fund
Investment Summary (Unaudited)
Top Ten Stocks as of September 30, 2019
| % of fund's net assets | |
| Dominion Energy, Inc. | 11.0 |
| Exelon Corp. | 9.1 |
| Southern Co. | 8.5 |
| Sempra Energy | 7.8 |
| Edison International | 6.9 |
| Entergy Corp. | 4.9 |
| FirstEnergy Corp. | 4.9 |
| CenterPoint Energy, Inc. | 4.8 |
| Public Service Enterprise Group, Inc. | 4.7 |
| NextEra Energy, Inc. | 4.7 |
| 67.3 |
Top Industries (% of fund's net assets)
| As of September 30, 2019 | ||
| Electric Utilities | 54.3% | |
| Multi-Utilities | 30.3% | |
| Independent Power and Renewable Electricity Producers | 8.3% | |
| Gas Utilities | 5.0% | |
| Oil, Gas & Consumable Fuels | 1.0% | |
| All Others* | 1.1% | |

* Includes short-term investments and net other assets (liabilities).
Fidelity® Utilities Central Fund
Schedule of Investments September 30, 2019
Showing Percentage of Net Assets
| Common Stocks - 99.7% | |||
| Shares | Value | ||
| Electric Utilities - 54.3% | |||
| Electric Utilities - 54.3% | |||
| American Electric Power Co., Inc. | 36,826 | $3,450,228 | |
| Duke Energy Corp. | 300,843 | 28,838,810 | |
| Edison International | 589,144 | 44,433,240 | |
| Entergy Corp. | 269,727 | 31,655,161 | |
| Evergy, Inc. | 317,486 | 21,131,868 | |
| Exelon Corp. | 1,212,364 | 58,569,305 | |
| FirstEnergy Corp. | 648,907 | 31,296,785 | |
| NextEra Energy, Inc. | 129,439 | 30,157,993 | |
| PPL Corp. | 557,142 | 17,544,402 | |
| Southern Co. | 876,855 | 54,163,333 | |
| Vistra Energy Corp. | 1,019,139 | 27,241,585 | |
| 348,482,710 | |||
| Gas Utilities - 5.0% | |||
| Gas Utilities - 5.0% | |||
| Atmos Energy Corp. | 139,691 | 15,909,408 | |
| South Jersey Industries, Inc. | 152,175 | 5,008,079 | |
| Southwest Gas Holdings, Inc. | 23,777 | 2,164,658 | |
| UGI Corp. | 181,712 | 9,134,662 | |
| 32,216,807 | |||
| Independent Power and Renewable Electricity Producers - 8.3% | |||
| Independent Power Producers & Energy Traders - 4.9% | |||
| NRG Energy, Inc. | 411,203 | 16,283,639 | |
| NRG Yield, Inc. Class C | 182,235 | 3,325,789 | |
| The AES Corp. | 723,139 | 11,816,091 | |
| 31,425,519 | |||
| Renewable Electricity - 3.4% | |||
| Atlantica Yield PLC | 382,991 | 9,226,253 | |
| NextEra Energy Partners LP (a) | 233,375 | 12,331,535 | |
| 21,557,788 | |||
| TOTAL INDEPENDENT POWER AND RENEWABLE ELECTRICITY PRODUCERS | 52,983,307 | ||
| Multi-Utilities - 30.3% | |||
| Multi-Utilities - 30.3% | |||
| Avangrid, Inc. | 103,319 | 5,398,418 | |
| CenterPoint Energy, Inc. | 1,026,928 | 30,992,687 | |
| CMS Energy Corp. | 78,935 | 5,047,893 | |
| Dominion Energy, Inc. | 873,804 | 70,813,076 | |
| Public Service Enterprise Group, Inc. | 486,799 | 30,220,482 | |
| Sempra Energy | 337,615 | 49,835,350 | |
| WEC Energy Group, Inc. | 23,777 | 2,261,193 | |
| 194,569,099 | |||
| Oil, Gas & Consumable Fuels - 1.0% | |||
| Oil & Gas Storage & Transport - 1.0% | |||
| Cheniere Energy, Inc. (b) | 101,101 | 6,375,429 | |
| Water Utilities - 0.8% | |||
| Water Utilities - 0.8% | |||
| American Water Works Co., Inc. | 10,300 | 1,279,569 | |
| SJW Corp. | 52,485 | 3,584,201 | |
| 4,863,770 | |||
| TOTAL COMMON STOCKS | |||
| (Cost $484,788,945) | 639,491,122 | ||
| Money Market Funds - 1.0% | |||
| Fidelity Securities Lending Cash Central Fund 1.96% (c)(d) | |||
| (Cost $6,494,900) | 6,494,251 | 6,494,900 | |
| TOTAL INVESTMENT IN SECURITIES - 100.7% | |||
| (Cost $491,283,845) | 645,986,022 | ||
| NET OTHER ASSETS (LIABILITIES) - (0.7)% | (4,727,142) | ||
| NET ASSETS - 100% | $641,258,880 |
Legend
(a) Security or a portion of the security is on loan at period end.
(b) Non-income producing
(c) Investment made with cash collateral received from securities on loan.
(d) Affiliated fund that is generally available only to investment companies and other accounts managed by Fidelity Investments. The rate quoted is the annualized seven-day yield of the fund at period end. A complete unaudited listing of the fund's holdings as of its most recent quarter end is available upon request. In addition, each Fidelity Central Fund's financial statements, which are not covered by the Fund's Report of Independent Registered Public Accounting Firm, are available on the SEC's website or upon request.
Affiliated Central Funds
Information regarding fiscal year to date income earned by the Fund from investments in Fidelity Central Funds is as follows:
| Fund | Income earned |
| Fidelity Cash Central Fund | $95,420 |
| Fidelity Securities Lending Cash Central Fund | 10,011 |
| Total | $105,431 |
Amounts in the income column in the above table include any capital gain distributions from underlying funds, which are presented in the corresponding line-item in the Statement of Operations, if applicable. Amount for Fidelity Securities Lending Cash Central Fund represents the income earned on investing cash collateral, less rebates paid to borrowers and any lending agent fees associated with the loan, plus any premium payments received for lending certain types of securities.
Investment Valuation
All investments are categorized as Level 1 under the Fair Value Hierarchy. The inputs or methodology used for valuing securities may not be an indication of the risk associated with investing in those securities. For more information on valuation inputs please refer to the Investment Valuation section in the accompanying Notes to Financial Statements.
See accompanying notes which are an integral part of the financial statements.
Fidelity® Utilities Central Fund
Financial Statements
Statement of Assets and Liabilities
| September 30, 2019 | ||
| Assets | ||
| Investment in securities, at value (including securities loaned of $6,414,776) — See accompanying schedule: Unaffiliated issuers (cost $484,788,945) | $639,491,122 | |
| Fidelity Central Funds (cost $6,494,900) | 6,494,900 | |
| Total Investment in Securities (cost $491,283,845) | $645,986,022 | |
| Receivable for investments sold | 4,365,820 | |
| Receivable for fund shares sold | 82,653 | |
| Dividends receivable | 1,132,576 | |
| Distributions receivable from Fidelity Central Funds | 3,668 | |
| Other receivables | 707 | |
| Total assets | 651,571,446 | |
| Liabilities | ||
| Payable to custodian bank | $3,453,612 | |
| Payable for fund shares redeemed | 358,095 | |
| Other payables and accrued expenses | 5,959 | |
| Collateral on securities loaned | 6,494,900 | |
| Total liabilities | 10,312,566 | |
| Net Assets | $641,258,880 | |
| Net Assets consist of: | ||
| Paid in capital | $472,918,529 | |
| Total accumulated earnings (loss) | 168,340,351 | |
| Net Assets, for 3,133,118 shares outstanding | $641,258,880 | |
| Net Asset Value, offering price and redemption price per share ($641,258,880 ÷ 3,133,118 shares) | $204.67 |
See accompanying notes which are an integral part of the financial statements.
Statement of Operations
| Year ended September 30, 2019 | ||
| Investment Income | ||
| Dividends | $20,296,635 | |
| Income from Fidelity Central Funds (including $10,011 from security lending) | 105,431 | |
| Total income | 20,402,066 | |
| Expenses | ||
| Custodian fees and expenses | $11,375 | |
| Independent directors' fees and expenses | 3,486 | |
| Interest | 2,428 | |
| Miscellaneous | 7 | |
| Total expenses | 17,296 | |
| Net investment income (loss) | 20,384,770 | |
| Realized and Unrealized Gain (Loss) | ||
| Net realized gain (loss) on: | ||
| Investment securities: | ||
| Unaffiliated issuers | 21,903,769 | |
| Redemptions in-kind with affiliated entities | 8,391,239 | |
| Fidelity Central Funds | 191 | |
| Foreign currency transactions | (922) | |
| Total net realized gain (loss) | 30,294,277 | |
| Change in net unrealized appreciation (depreciation) on: | ||
| Investment securities: | ||
| Unaffiliated issuers | 64,379,748 | |
| Assets and liabilities in foreign currencies | (259) | |
| Total change in net unrealized appreciation (depreciation) | 64,379,489 | |
| Net gain (loss) | 94,673,766 | |
| Net increase (decrease) in net assets resulting from operations | $115,058,536 |
See accompanying notes which are an integral part of the financial statements.
Statement of Changes in Net Assets
| Year ended September 30, 2019 | Year ended September 30, 2018 | |
| Increase (Decrease) in Net Assets | ||
| Operations | ||
| Net investment income (loss) | $20,384,770 | $16,627,429 |
| Net realized gain (loss) | 30,294,277 | 71,733,141 |
| Change in net unrealized appreciation (depreciation) | 64,379,489 | (17,662,873) |
| Net increase (decrease) in net assets resulting from operations | 115,058,536 | 70,697,697 |
| Distributions to shareholders | (64,825,667) | – |
| Distributions to shareholders from net investment income | – | (15,349,761) |
| Distributions to shareholders from net realized gain | – | (31,029,277) |
| Total distributions | (64,825,667) | (46,379,038) |
| Affiliated share transactions | ||
| Proceeds from sales of shares | 33,515,922 | 207,343,028 |
| Reinvestment of distributions | 64,825,667 | 46,379,038 |
| Cost of shares redeemed | (132,752,802) | (153,927,139) |
| Net increase (decrease) in net assets resulting from share transactions | (34,411,213) | 99,794,927 |
| Total increase (decrease) in net assets | 15,821,656 | 124,113,586 |
| Net Assets | ||
| Beginning of period | 625,437,224 | 501,323,638 |
| End of period | $641,258,880 | $625,437,224 |
| Other Information | ||
| Undistributed net investment income end of period | $2,669,884 | |
| Shares | ||
| Sold | 180,024 | 1,181,944 |
| Issued in reinvestment of distributions | 366,089 | 263,771 |
| Redeemed | (698,878) | (866,220) |
| Net increase (decrease) | (152,765) | 579,495 |
See accompanying notes which are an integral part of the financial statements.
Financial Highlights
Fidelity Utilities Central Fund
| Years ended September 30, | 2019 | 2018 | 2017 | 2016 | 2015 |
| Selected Per–Share Data | |||||
| Net asset value, beginning of period | $190.34 | $185.24 | $162.92 | $144.05 | $155.14 |
| Income from Investment Operations | |||||
| Net investment income (loss)A | 6.15 | 5.36 | 5.08 | 4.73 | 4.36 |
| Net realized and unrealized gain (loss) | 28.46 | 16.04 | 21.62 | 18.44 | (11.35) |
| Total from investment operations | 34.61 | 21.40 | 26.70 | 23.17 | (6.99) |
| Distributions from net investment income | (6.20) | (5.04) | (4.38) | (4.30) | (4.10) |
| Distributions from net realized gain | (14.08) | (11.25) | – | – | – |
| Total distributions | (20.28) | (16.30)B | (4.38) | (4.30) | (4.10) |
| Net asset value, end of period | $204.67 | $190.34 | $185.24 | $162.92 | $144.05 |
| Total ReturnC | 20.12% | 12.46% | 16.66% | 16.23% | (4.66)% |
| Ratios to Average Net AssetsD,E | |||||
| Expenses before reductionsF | -% | -% | -% | -% | -% |
| Expenses net of fee waivers, if anyF | -% | -% | -% | -% | -% |
| Expenses net of all reductionsF | -% | -% | -% | -% | -% |
| Net investment income (loss) | 3.28% | 2.95% | 2.96% | 3.03% | 2.78% |
| Supplemental Data | |||||
| Net assets, end of period (000 omitted) | $641,259 | $625,437 | $501,324 | $463,043 | $406,258 |
| Portfolio turnover rateG | 75%H | 112%H | 47%H | 76% | 110% |
A Calculated based on average shares outstanding during the period.
B Total distributions of $16.30 per share is comprised of distributions from net investment income of $5.043 and distributions from net realized gain of $11.253 per share.
C Total returns would have been lower if certain expenses had not been reduced during the applicable periods shown.
D Fees and expenses of any underlying Fidelity Central Funds are not included in the Fund's expense ratio. The Fund indirectly bears its proportionate share of the expenses of any underlying Fidelity Central Funds.
E Expense ratios reflect operating expenses of the Fund. Expenses before reductions do not reflect amounts reimbursed by the investment adviser or reductions from expense offset arrangements and do not represent the amount paid by the Fund during periods when reimbursements or reductions occur. Expenses net of fee waivers reflect expenses after reimbursement by the investment adviser but prior to reductions from expense offset arrangements. Expenses net of all reductions represent the net expenses paid by the Fund.
F Amount represents less than .005%.
G Amount does not include the portfolio activity of any underlying Fidelity Central Funds.
H Portfolio turnover rate excludes securities received or delivered in-kind.
See accompanying notes which are an integral part of the financial statements.
Notes to Financial Statements
For the period ended September 30, 2019
1. Organization.
Fidelity Communication Services Central Fund (Communication Services)(formerly Fidelity Telecom Services Central Fund), Fidelity Consumer Discretionary Central Fund (Consumer Discretionary), Fidelity Consumer Staples Central Fund (Consumer Staples), Fidelity Energy Central Fund (Energy), Fidelity Financials Central Fund (Financials), Fidelity Health Care Central Fund (Health Care), Fidelity Industrials Central Fund (Industrials), Fidelity Information Technology Central Fund (Information Technology), Fidelity Materials Central Fund (Materials), Fidelity Real Estate Equity Central Fund (Real Estate Equity), and Fidelity Utilities Central Fund (Utilities), collectively referred to as the Funds, are funds of Fidelity Central Investment Portfolios LLC (the LLC) and are authorized to issue an unlimited number of shares. The LLC is registered under the Investment Company Act of 1940, as amended (the 1940 Act), as an open-end management investment company organized as a Delaware Limited Liability Company. Shares of each Fund are only offered to other investment companies and accounts managed by Fidelity Management & Research Company (FMR), or its affiliates (the Investing Funds). All of the Funds are non-diversified, with the exception of Financials and Health Care. The Funds invest primarily in securities of companies whose principal business activities fall within specific industries. The Funds are referred to as Fidelity Central Funds and may also invest in other Fidelity Central Funds available only to investment companies and other accounts managed by FMR and its affiliates.
2. Investments in Fidelity Central Funds.
The Funds invest in Fidelity Central Funds, which are open-end investment companies generally available only to other investment companies and accounts managed by the investment adviser and its affiliates. The Funds' Schedules of Investments list each of the Fidelity Central Funds held as of period end, if any, as an investment of each Fund, but do not include the underlying holdings of each Fidelity Central Fund. As an Investing Fund, each Fund indirectly bears its proportionate share of the expenses of the underlying Fidelity Central Funds.
The Money Market Central Funds seek preservation of capital and current income and are managed by Fidelity Investments Money Management, Inc. (FIMM), an affiliate of the investment adviser. Annualized expenses of the Money Market Central Funds as of their most recent shareholder report date ranged from less than .005% to .01%.
A complete unaudited list of holdings for each Fidelity Central Fund is available upon request or at the Securities and Exchange Commission (the SEC) website at www.sec.gov. In addition, the financial statements of the Fidelity Central Funds, which are not covered by the Funds' Report of Independent Registered Public Accounting Firm, are available on the SEC website or upon request.
3. Significant Accounting Policies.
Each Fund is an investment company and applies the accounting and reporting guidance of the Financial Accounting Standards Board (FASB) Accounting Standards Codification Topic 946 Financial Services – Investments Companies. The financial statements have been prepared in conformity with accounting principles generally accepted in the United States of America (GAAP), which require management to make certain estimates and assumptions at the date of the financial statements. Actual results could differ from those estimates. Subsequent events, if any, through the date that the financial statements were issued have been evaluated in the preparation of the financial statements. The following summarizes the significant accounting policies of the Funds:
Investment Valuation. Investments are valued as of 4:00 p.m. Eastern time on the last calendar day of the period. The Board of Directors (the Board) has delegated the day to day responsibility for the valuation of each Fund's investments to the Fair Value Committee (the Committee) established by each Fund's investment adviser. In accordance with valuation policies and procedures approved by the Board, each Fund attempts to obtain prices from one or more third party pricing vendors or brokers to value its investments. When current market prices, quotations or currency exchange rates are not readily available or reliable, investments will be fair valued in good faith by the Committee, in accordance with procedures adopted by the Board. Factors used in determining fair value vary by investment type and may include market or investment specific events. The frequency with which these procedures are used cannot be predicted and they may be utilized to a significant extent. The Committee oversees each Fund's valuation policies and procedures and reports to the Board on the Committee's activities and fair value determinations. The Board monitors the appropriateness of the procedures used in valuing each Fund's investments and ratifies the fair value determinations of the Committee.
Each Fund categorizes the inputs to valuation techniques used to value its investments into a disclosure hierarchy consisting of three levels as shown below:
- Level 1 – quoted prices in active markets for identical investments
- Level 2 – other significant observable inputs (including quoted prices for similar investments, interest rates, prepayment speeds, etc.)
- Level 3 – unobservable inputs (including the Fund's own assumptions based on the best information available)
Valuation techniques used to value each Fund's investments by major category are as follows:
Equity securities, including restricted securities, for which market quotations are readily available, are valued at the last reported sale price or official closing price as reported by a third party pricing vendor on the primary market or exchange on which they are traded and are categorized as Level 1 in the hierarchy. In the event there were no sales during the day or closing prices are not available, securities are valued at the last quoted bid price or may be valued using the last available price and are generally categorized as Level 2 in the hierarchy. For foreign equity securities, when market or security specific events arise, comparisons to the valuation of American Depositary Receipts (ADRs), futures contracts, Exchange-Traded Funds (ETFs) and certain indexes as well as quoted prices for similar securities may be used and would be categorized as Level 2 in the hierarchy. For equity securities, including restricted securities, where observable inputs are limited, assumptions about market activity and risk are used and these securities may be categorized as Level 3 in the hierarchy. Equity securities, including restricted securities, for which observable inputs are not available are valued using alternate valuation approaches, including the market approach and the income approach and are categorized as Level 3 in the hierarchy. The market approach generally consists of using comparable market transactions while the income approach generally consists of using the net present value of estimated future cash flows, adjusted as appropriate for liquidity, credit, market and/or other risk factors.
Investments in open-end mutual funds, including the Fidelity Central Funds, are valued at their closing net asset value (NAV) each business day and are categorized as Level 1 in the hierarchy.
Changes in valuation techniques may result in transfers in or out of an assigned level within the disclosure hierarchy. The aggregate value of investments by input level as of September 30, 2019, as well as a roll forward of Level 3 investments, is included at the end of each applicable Fund's Schedule of Investments.
Foreign Currency. The Funds may use foreign currency contracts to facilitate transactions in foreign-denominated securities. Gains and losses from these transactions may arise from changes in the value of the foreign currency or if the counterparties do not perform under the contracts' terms.
Foreign-denominated assets, including investment securities, and liabilities are translated into U.S. dollars at the exchange rates at period end. Purchases and sales of investment securities, income and dividends received and expenses denominated in foreign currencies are translated into U.S. dollars at the exchange rate in effect on the transaction date.
The effects of exchange rate fluctuations on investments are included with the net realized and unrealized gain (loss) on investment securities. Other foreign currency transactions resulting in realized and unrealized gain (loss) are disclosed separately.
Investment Transactions and Income. For financial reporting purposes, the Funds' investment holdings and NAV include trades executed through the end of the last business day of the period. The NAV per share for processing shareholder transactions is calculated as of the close of business of the New York Stock Exchange (NYSE), normally 4:00 p.m. Eastern time and includes trades executed through the end of the prior business day. Gains and losses on securities sold are determined on the basis of identified cost and for certain Funds include proceeds received from litigation. Dividend income is recorded on the ex-dividend date, except for certain dividends from foreign securities where the ex-dividend date may have passed, which are recorded as soon as the Funds are informed of the ex-dividend date. Non-cash dividends included in dividend income, if any, are recorded at the fair market value of the securities received. Income and capital gain distributions from Fidelity Central Funds, if any, are recorded on the ex-dividend date. Certain distributions received by the Funds represent a return of capital or capital gain. The Funds determine the components of these distributions subsequent to the ex-dividend date, based upon receipt of tax filings or other correspondence relating to the underlying investment. These distributions are recorded as a reduction of cost of investments and/or as a realized gain. Investment income is recorded net of foreign taxes withheld where recovery of such taxes is uncertain.
Expenses. Expenses directly attributable to a fund are charged to that fund. Expenses attributable to more than one fund are allocated among the respective funds on the basis of relative net assets or other appropriate methods. Expense estimates are accrued in the period to which they relate and adjustments are made when actual amounts are known.
Income Tax Information and Distributions to Shareholders. Each year, each Fund intends to qualify as a regulated investment company under Subchapter M of the Internal Revenue Code, including distributing substantially all of its taxable income and realized gains. As a result, no provision for U.S. Federal income taxes is required. As of September 30, 2019, each Fund did not have any unrecognized tax benefits in the financial statements; nor is each Fund aware of any tax positions for which it is reasonably possible that the total amounts of unrecognized tax benefits will significantly change in the next twelve months. Each Fund files a U.S. federal tax return, in addition to state and local tax returns as required. Each Fund's federal income tax returns are subject to examination by the Internal Revenue Service (IRS) for a period of three fiscal years after they are filed. State and local tax returns may be subject to examination for an additional fiscal year depending on the jurisdiction. Foreign taxes are provided for based on each Fund's understanding of the tax rules and rates that exist in the foreign markets in which it invests. Energy is subject to a tax imposed on capital gains by certain countries in which it invests. An estimated deferred tax liability for net unrealized appreciation on the applicable securities is included in Other payables and accrued expenses on each applicable Fund's Statement of Assets & Liabilities.
Distributions are declared and recorded on the ex-dividend date. Income and capital gain distributions are determined in accordance with income tax regulations, which may differ from GAAP. These differences resulted in distribution reclassifications for certain funds. In addition, certain funds claimed a portion of the payment made to redeeming shareholders as a distribution for income tax purposes.
Capital accounts within the financial statements are adjusted for permanent book-tax differences. These adjustments have no impact on net assets or the results of operations. Capital accounts are not adjusted for temporary book-tax differences which will reverse in a subsequent period.
Book-tax differences are primarily due to the short-term gain distributions from the Underlying Funds, foreign currency transactions, certain foreign taxes, passive foreign investment companies (PFIC), redemptions in kind, partnerships, capital loss carryforwards, losses deferred due to wash sales and excise tax regulations.
As of period end, the cost and unrealized appreciation (depreciation) in securities, and derivatives if applicable, for federal income tax purposes were as follows for each Fund:
| Tax cost | Gross unrealized appreciation | Gross unrealized depreciation | Net unrealized appreciation (depreciation) | |
| Communication Services | $1,524,938,075 | $212,392,774 | $(51,325,021) | $161,067,753 |
| Consumer Discretionary | 1,338,946,262 | 593,117,270 | (35,504,353) | 557,612,917 |
| Consumer Staples | 1,158,544,777 | 243,346,661 | (119,921,833) | 123,424,828 |
| Energy | 856,191,901 | 45,183,911 | (99,893,354) | (54,709,443) |
| Financials | 2,761,151,498 | 612,558,963 | (48,980,484) | 563,578,479 |
| Health Care | 2,171,140,600 | 547,821,760 | (130,430,674) | 417,391,086 |
| Industrials | 1,465,012,777 | 358,798,316 | (67,020,234) | 291,778,082 |
| Information Technology | 3,533,330,255 | 945,015,114 | (90,003,024) | 855,012,090 |
| Materials | 459,297,835 | 51,589,127 | (59,188,254) | (7,599,127) |
| Real Estate Equity | 411,380,539 | 46,079,043 | (4,917,629) | 41,161,414 |
| Utilities | 491,838,401 | 154,679,435 | (531,814) | 154,147,621 |
The tax-based components of distributable earnings as of period end were as follows for each Fund:
| Undistributed ordinary income | Undistributed long-term capital gain | Capital loss carryforward | Net unrealized appreciation (depreciation) on securities and other investments | |
| Communication Services | $47,052,802 | $6,359,254 | $– | $161,067,872 |
| Consumer Discretionary | 3,163,337 | 45,192,732 | – | 557,610,695 |
| Consumer Staples | 5,192,242 | – | (21,311,796) | 123,412,276 |
| Energy | 1,870,033 | – | (123,838,755) | (58,127,468) |
| Financials | 10,737,432 | 30,553,230 | – | 563,575,055 |
| Health Care | 6,451,736 | 19,831,733 | – | 417,372,735 |
| Industrials | 3,127,185 | – | (7,324,188) | 291,777,104 |
| Information Technology | 4,050,508 | 86,093,648 | – | 854,999,618 |
| Materials | 933,605 | – | (39,152,901) | (7,608,016) |
| Real Estate Equity | 2,265,913 | – | (428,971) | 41,161,414 |
| Utilities | 2,854,554 | 18,648,072 | – | 154,146,929 |
Capital loss carryforwards are only available to offset future capital gains of the Funds to the extent provided by regulations and may be limited. Under the Regulated Investment Company Modernization Act of 2010 (the Act), the Funds are permitted to carry forward capital losses incurred in taxable years beginning after December 22, 2010 for an unlimited period and such capital losses are required to be used prior to any losses that expire. The capital loss carryforward information presented below, including any applicable limitation, is estimated as of fiscal period end and is subject to adjustment.
| No expiration | |||
| Short-term | Long-term | Total capital loss carryfoward | |
| Consumer Staples | (21,311,796) | (–) | (21,311,796) |
| Energy | (51,456,723) | (72,382,032) | (123,838,755) |
| Industrials | (7,324,188) | (–) | (7,324,188) |
| Materials | (35,834,711) | (3,318,190) | (39,152,901) |
| Real Estate Equity | (428,971) | (–) | (428,971) |
Certain of the Funds intend to elect to defer to the next fiscal year capital losses recognized during the period November 1, 2018 to September 30, 2019. Loss deferrals were as follows:
| Capital losses | |
| Utilities | $(7,309,203) |
The tax character of distributions paid was as follows:
| September 30, 2019 | |||
| Ordinary Income | Long-term Capital Gains | Total | |
| Communication Services | $10,784,201 | $568,700 | $11,352,901 |
| Consumer Discretionary | 22,285,267 | 57,612,607 | 79,897,874 |
| Consumer Staples | 35,855,341 | 96,468,537 | 132,323,878 |
| Energy | 21,448,701 | – | 21,448,701 |
| Financials | 86,430,398 | 144,783,493 | 231,213,891 |
| Health Care | 37,322,872 | 138,582,541 | 175,905,413 |
| Industrials | 30,597,109 | 79,120,557 | 109,717,666 |
| Information Technology | 47,346,297 | 729,744,823 | 777,091,120 |
| Materials | 10,891,184 | 35,880,319 | 46,771,503 |
| Real Estate Equity | 4,921,589 | 2,205,732 | 7,127,321 |
| Utilities | 29,087,601 | 35,738,066 | 64,825,667 |
| September 30, 2018 | |||
| Ordinary Income | Long-term Capital Gains | Total | |
| Communication Services | $18,751,073 | $24,554,299 | $43,305,372 |
| Consumer Discretionary | 23,569,557 | 88,405,008 | 111,974,565 |
| Consumer Staples | 42,170,256 | 97,604,846 | 139,775,102 |
| Energy | 26,596,631 | 4,281,872 | 30,878,503 |
| Financials | 64,370,440 | 186,820,958 | 251,191,398 |
| Health Care | 29,803,987 | 68,885,706 | 98,689,693 |
| Industrials | 35,231,733 | 75,694,613 | 110,926,346 |
| Information Technology | 276,897,718 | 317,317,554 | 594,215,272 |
| Materials | 14,575,645 | 23,004,948 | 37,580,593 |
| Real Estate Equity | 3,701,515 | 4,397,770 | 8,099,285 |
| Utilities | 19,858,147 | 26,520,891 | 46,379,038 |
Restricted Securities. The Funds may invest in securities that are subject to legal or contractual restrictions on resale. These securities generally may be resold in transactions exempt from registration or to the public if the securities are registered. Disposal of these securities may involve time-consuming negotiations and expense, and prompt sale at an acceptable price may be difficult. Information regarding restricted securities is included at the end of each applicable Fund's Schedule of Investments.
Consolidated Subsidiary. Financials invests in certain investments through a wholly-owned subsidiary ("Subsidiary"), which may be subject to federal and state taxes upon disposition.
As of period end, Financials held an investment of $14,508,274 in this Subsidiary, representing .44% of Financials net assets. The financial statements have been consolidated and include accounts of Financials and the Subsidiary. Accordingly, all inter-company transactions and balances have been eliminated.
Any cash held by the Subsidiary is restricted as to its use and is presented as Restricted cash in the Statement of Assets and Liabilities.
New Rule Issuance. During August 2018, the U.S. Securities and Exchange Commission issued Final Rule Release No. 33-10532, Disclosure Update and Simplification. This Final Rule includes amendments specific to registered investment companies that are intended to eliminate overlap in disclosure requirements between Regulation S-X and GAAP. In accordance with these amendments, certain line-items in the Funds' financial statements have been combined or removed for the current period as outlined in the table below.
| Financial Statement | Current Line-Item Presentation (As Applicable) | Prior Line-Item Presentation (As Applicable) |
| Statement of Assets and Liabilities | Total distributable earnings (loss) | Undistributed/Distributions in excess of/Accumulated net investment income (loss) Accumulated/Undistributed net realized gain (loss) Net unrealized appreciation (depreciation) |
| Statement of Changes in Net Assets | N/A - removed | Undistributed/Distributions in excess of/Accumulated net investment income (loss) end of period |
| Statement of Changes in Net Assets | Distributions to shareholders | Distributions to shareholders from net investment income Distributions to shareholders from net realized gain |
4. Purchases and Sales of Investments.
Purchases and sales of securities, other than short-term securities and in-kind transactions, are noted in the table below.
| Purchases ($) | Sales ($) | |
| Communication Services | 1,473,467,481 | 1,342,049,075 |
| Consumer Discretionary | 884,054,818 | 1,076,307,377 |
| Consumer Staples | 453,119,961 | 552,317,009 |
| Energy | 495,403,884 | 554,933,770 |
| Financials | 2,079,084,937 | 2,309,021,685 |
| Health Care | 1,269,206,072 | 1,640,508,937 |
| Industrials | 1,288,937,923 | 1,549,748,859 |
| Information Technology | 2,170,181,461 | 2,505,225,038 |
| Materials | 349,609,775 | 379,885,767 |
| Real Estate Equity | 364,706,534 | 71,021,386 |
| Utilities | 459,651,996 | 513,945,861 |
5. Fees and Other Transactions with Affiliates.
Management Fee and Expense Contract. FMR Co., Inc. (the investment adviser), an affiliate of FMR, provides each Fund with investment management services. The Funds do not pay any fees for these services. Pursuant to each Fund's management contract with the investment adviser, FMR pays the investment adviser a portion of the management fees it receives from the Investing Funds. In addition, under an expense contract FMR pays all other expenses of each Fund, excluding custody fees, the compensation of the independent Directors, and certain miscellaneous expenses such as proxy and shareholder meeting expenses.
Brokerage Commissions. Certain Funds placed a portion of their portfolio transactions with brokerage firms which are affiliates of the investment adviser. Brokerage commissions are included in net realized gain (loss) and change in net unrealized appreciation (depreciation) in the Statement of Operations. The commissions paid to these affiliated firms were as follows:
| Amount | |
| Communication Services | $53,001 |
| Consumer Discretionary | 13,758 |
| Consumer Staples | 19,298 |
| Energy | 18,490 |
| Financials | 51,746 |
| Health Care | 31,796 |
| Industrials | 39,081 |
| Information Technology | 76,478 |
| Materials | 13,592 |
| Real Estate Equity | 1,872 |
| Utilities | 17,570 |
Interfund Lending Program. Pursuant to an Exemptive Order issued by the SEC, the Funds, along with other registered investment companies having management contracts with FMR or other affiliated entities of FMR, may participate in an interfund lending program. This program provides an alternative credit facility allowing the funds to borrow from, or lend money to, other participating affiliated funds. At period end, there were no interfund loans outstanding. Each applicable fund's activity in this program during the period for which loans were outstanding was as follows:
| Borrower or Lender | Average Loan Balance | Weighted Average Interest Rate | Interest Expense | |
| Communication Services | Borrower | $9,945,118 | 2.54% | $11,933 |
| Consumer Discretionary | Borrower | $8,782,926 | 2.61% | $17,162 |
| Consumer Staples | Borrower | $11,749,857 | 2.59% | $5,921 |
| Financials | Borrower | $18,065,000 | 2.65% | $1,330 |
| Health Care | Borrower | $6,796,000 | 2.45% | $1,386 |
| Industrials | Borrower | $6,444,167 | 2.48% | $2,666 |
| Information Technology | Borrower | $23,282,000 | 2.50% | $3,231 |
| Utilities | Borrower | $4,637,833 | 2.50% | $1,936 |
Interfund Trades. The Funds may purchase from or sell securities to other Fidelity Funds under procedures adopted by the Board. The procedures have been designed to ensure these interfund trades are executed in accordance with Rule 17a-7 of the 1940 Act. Interfund trades are included within the respective purchases and sales amounts shown in the Purchases and Sales of Investments note.
Affiliated Redemptions In-Kind. During the period, shares of each Fund in the table below were redeemed in-kind for investments and cash. The net realized gain on investments delivered through in-kind redemptions is included in the accompanying Statement of Operations. The amount of in-kind redemptions is included in share transactions in the accompanying Statement of Changes in Net Assets. Each Fund recognized no gain or loss for federal income tax purposes.
Details of the transactions are presented in the accompanying table:
| Fund | Value of Investments and Cash Delivered | Redeemed Number of Shares | Net Realized Gain |
| Communication Services Central Fund | $70,198,797 | 342,717 | $13,357,266 |
| Consumer Discretionary Central Fund | 361,880,289 | 1,110,111 | 143,005,357 |
| Consumer Staples Central Fund | 52,538,829 | 257,228 | 17,531,133 |
| Energy Central Fund | 32,728,185 | 335,536 | 4,903,607 |
| Financials Central Fund | 127,094,635 | 1,223,358 | 36,580,772 |
| Health Care Central Fund | 101,791,214 | 249,342 | 39,178,961 |
| Industrials Central Fund | 68,226,198 | 239,895 | 22,479,230 |
| Information Technology Central Fund | 896,151,855 | 2,128,116 | 104,489,006 |
| Materials Central Fund | 17,439,103 | 90,621 | 2,891,939 |
| Utilities Central Fund | 24,964,816 | 122,143 | 8,391,239 |
Affiliated Exchanges In-Kind. During the period, Communication Services Central Fund received investments valued at $993,861,507 in exchange for 5,410,831 shares of the Fund. The amount of in-kind exchanges is included in the share transactions in the accompanying Statement of Changes in Net Assets.
In addition, during the period, Consumer Discretionary Central Fund received investments valued at $17,340,708 in exchange for 53,818 shares of the Fund. The amount of the in-kind exchanges is included in the share transactions in the accompanying Statement of Changes in Net Assets.
Prior Fiscal Year Affiliated Redemptions In-Kind. During the prior period, Strategic Advisers Fidelity U.S. Total Stock Fund (the Investing Fund) completed redemption in-kind transactions with each Fund in the table below. The Funds delivered investments and cash, as presented in the accompanying table. The Funds had net realized gains on investments delivered through the in-kind redemptions. The amount of the in-kind redemptions is included in share transactions in the accompanying Statement of Changes in Net Assets. Each Fund recognized no gain or loss for federal income tax purposes.
Details of the transactions are presented in the accompanying table:
| Fund | Value of Investments and Cash Delivered | Redeemed Number of Shares | Net Realized Gain |
| Communication Services Central Fund | $76,741,721 | 436,231 | $29,760,814 |
| Consumer Discretionary Central Fund | 378,555,786 | 1,210,681 | 155,553,360 |
| Consumer Staples Central Fund | 252,919,327 | 1,264,850 | 65,011,527 |
| Energy Central Fund | 236,019,145 | 1,770,852 | 75,772,210 |
| Financials Central Fund | 648,125,061 | 6,136,967 | 211,708,985 |
| Health Care Central Fund | 540,969,646 | 1,316,740 | 219,905,327 |
| Industrials Central Fund | 351,576,852 | 1,193,404 | 111,073,545 |
| Information Technology Central Fund | 990,210,766 | 2,179,737 | 407,599,634 |
| Materials Central Fund | 95,285,035 | 374,592 | 31,881,334 |
| Utilities Central Fund | 105,225,234 | 598,211 | 23,415,877 |
Prior Fiscal Year Affiliated Exchanges In-Kind. During the prior period, VIP FundsManager 20%, VIP FundsManager 50%, VIP FundsManager 60%, VIP FundsManager 70%, and VIP FundsManager 85% (the Investing Funds) completed exchange in-kind transactions with each Fund in the table below. The Funds received investments and cash, as presented in the accompanying table. The amount of the in-kind exchanges is included in share transactions in the accompanying Statement of Changes in Net Assets.
Details of the transactions are presented in the accompanying table:
| Fund | Value of Investments and Cash Delivered | Redeemed Number of Shares |
| Communication Services Central Fund | $67,398,250 | 388,507 |
| Consumer Discretionary Central Fund | 420,009,534 | 1,369,492 |
| Consumer Staples Central Fund | 278,330,010 | 1,338,189 |
| Energy Central Fund | 239,961,028 | 1,866,239 |
| Financials Central Fund | 575,771,740 | 5,505,563 |
| Health Care Central Fund | 541,001,090 | 1,323,939 |
| Industrials Central Fund | 278,038,031 | 959,678 |
| Information Technology Central Fund | 1,186,541,219 | 2,614,448 |
| Materials Central Fund | 126,544,324 | 506,522 |
| Utilities Central Fund | 117,288,521 | 673,607 |
Other. During the period, the investment advisor reimbursed the Funds for certain losses as follows:
| Amount | |
| Consumer Discretionary | $13,227 |
| Consumer Staples | 2,779 |
| Energy | 12,366 |
| Information Technology | 100,685 |
| Materials | 5,641 |
6. Security Lending.
Certain Funds lend portfolio securities from time to time in order to earn additional income. For equity securities, lending agents are used, including National Financial Services (NFS), an affiliate of the Funds. Pursuant to a securities lending agreement, NFS will receive a fee, which is capped at 9.9% of a Fund's daily lending revenue, for its services as lending agent. The Funds may lend securities to certain qualified borrowers, including NFS. On the settlement date of the loan, each applicable Fund receives collateral (in the form of U.S. Treasury obligations, letters of credit and/or cash) against the loaned securities and maintains collateral in an amount not less than 100% of the market value of the loaned securities during the period of the loan. The market value of the loaned securities is determined at the close of business of the Funds and any additional required collateral is delivered to the Funds on the next business day. The Funds or borrower may terminate the loan at any time, and if the borrower defaults on its obligation to return the securities loaned because of insolvency or other reasons, the Funds may apply collateral received from the borrower against the obligation. The Funds may experience delays and costs in recovering the securities loaned. Any cash collateral received is invested in the Fidelity Securities Lending Cash Central Fund. The value of loaned securities and cash collateral at period end are disclosed on each applicable Fund's Statement of Assets and Liabilities. Security lending income represents the income earned on investing cash collateral, less rebates paid to borrowers and any lending agent fees associated with the loan, plus any premium payments received for lending certain types of securities. Security lending income is presented on each applicable Fund's Statement of Operations as a component of income from Fidelity Central Funds. Affiliated security lending activity was as follows:
| Total Security Lending Income Fees Paid to NFS | Security Lending Income From Securities Loaned to NFS | Value of Securities Loaned to NFS at Period End | |
| Communication Services | $3,677 | $– | $– |
| Consumer Discretionary | $2,607 | $3,201 | $1,639,887 |
| Consumer Staples | $766 | $– | $– |
| Energy | $491 | $616 | $– |
| Financials | $6,995 | $5,518 | $255,216 |
| Health Care | $5,482 | $7,299 | $– |
| Industrials | $128 | $– | $– |
| Information Technology | $1,987 | $359 | $– |
| Materials | $298 | $15,726 | $– |
| Real Estate Equity | $22 | $– | $– |
| Utilities | $461 | $22 | $– |
7. Bank Borrowings.
Each Fund is permitted to have bank borrowings for temporary or emergency purposes to fund shareholder redemptions or for other short-term liquidity requirements. Each Fund has established borrowing arrangements with certain banks. The interest rate on the borrowings is the bank's base rate, as revised from time to time. At period end, there were no bank borrowings outstanding. Each applicable Fund's activity in this program during the period for which loans were outstanding was as follows:
| Average Loan Balance | Weighted Average Interest Rate | Interest Expense | |
| Communication Services | $8,777,000 | 2.75% | $670 |
| Consumer Staples | $12,283,000 | 2.75% | $938 |
| Financials | $20,794,000 | 2.75% | $1,588 |
| Health Care | $5,084,000 | 2.75% | $388 |
| Utilities | $6,439,000 | 2.75% | $492 |
8. Expense Reductions.
Through arrangements with each applicable Fund's custodian, credits realized as a result of certain uninvested cash balances were used to reduce each applicable Fund's expenses. All of the applicable expense reductions are noted in the table below.
| Custodian credits | |
| Communication Services | $4,095 |
| Consumer Staples | 640 |
| Energy | 921 |
| Health Care | 1,570 |
| Industrials | 2,403 |
| Information Technology | 2,052 |
| Real Estate Equity | 181 |
9. Other.
The Funds' organizational documents provide former and current directors and officers with a limited indemnification against liabilities arising in connection with the performance of their duties to the Funds. In the normal course of business, the Funds may also enter into contracts that provide general indemnifications. The Funds' maximum exposure under these arrangements is unknown as this would be dependent on future claims that may be made against the Funds. The risk of material loss from such claims is considered remote.
At the end of the period, mutual funds managed by FMR or its affiliates were the owners of record of all of the outstanding shares of the Funds.
Report of Independent Registered Public Accounting Firm
To the Trustees of Fidelity Central Investment Portfolios LLC and Shareholders of Fidelity Communication Services Central Fund (formerly, Fidelity Telecom Services Central Fund), Fidelity Consumer Discretionary Central Fund, Fidelity Consumer Staples Central Fund, Fidelity Energy Central Fund, Fidelity Financials Central Fund, Fidelity Health Care Central Fund, Fidelity Industrials Central Fund, Fidelity Information Technology Central Fund, Fidelity Materials Central Fund, Fidelity Real Estate Equity Central Fund, and Fidelity Utilities Central Fund:
Opinion on the Financial Statements and Financial Highlights
We have audited the accompanying statements of assets and liabilities of Fidelity Communication Services Central Fund (formerly, Fidelity Telecom Services Central Fund), Fidelity Consumer Discretionary Central Fund, Fidelity Consumer Staples Central Fund, Fidelity Energy Central Fund, Fidelity Financials Central Fund, Fidelity Health Care Central Fund, Fidelity Industrials Central Fund, Fidelity Information Technology Central Fund, Fidelity Materials Central Fund, Fidelity Real Estate Equity Central Fund, and Fidelity Utilities Central Fund (the "Funds"), each a fund of Fidelity Central Investment Portfolios LLC, including the schedules of investments, as of September 30, 2019, the related statements of operations for the year then ended, the statements of changes in net assets for each of the two years in the period then ended, the financial highlights for each of the five years in the period then ended, except for Fidelity Real Estate Equity Central Fund; the related statement of operations for the year then ended, the statement of changes in net assets for each of the two years in the period then ended, and the financial highlights for each of the four years in the period then ended and for the period from November 3, 2014 to September 30, 2015 for the Fidelity Real Estate Equity Central Fund; and the related notes. In our opinion, the financial statements and financial highlights present fairly, in all material respects, the financial positions of the Funds as of September 30, 2019, and the results of their operations for the year then ended, the changes in their net assets for each of the two years in the period then ended, and the financial highlights for each of the five years in the period then ended, except for Fidelity Real Estate Equity Central Fund; the related statement of operations for the year then ended, the statement of changes in net assets for each of the two years in the period then ended, and the financial highlights for each of the four years in the period then ended and for the period from November 3, 2014 to September 30, 2015 for the Fidelity Real Estate Equity Central Fund, in conformity with accounting principles generally accepted in the United States of America.
Basis for Opinion
These financial statements and financial highlights are the responsibility of the Funds’ management. Our responsibility is to express an opinion on the Funds’ financial statements and financial highlights based on our audits. We are a public accounting firm registered with the Public Company Accounting Oversight Board (United States) (PCAOB) and are required to be independent with respect to the Funds in accordance with the U.S. federal securities laws and the applicable rules and regulations of the Securities and Exchange Commission and the PCAOB.
We conducted our audits in accordance with the standards of the PCAOB. Those standards require that we plan and perform the audits to obtain reasonable assurance about whether the financial statements and financial highlights are free of material misstatement, whether due to error or fraud. The Funds are not required to have, nor were we engaged to perform, an audit of their internal control over financial reporting. As part of our audits we are required to obtain an understanding of internal control over financial reporting but not for the purpose of expressing an opinion on the effectiveness of the Funds’ internal control over financial reporting. Accordingly, we express no such opinion.
Our audits included performing procedures to assess the risks of material misstatement of the financial statements and financial highlights, whether due to error or fraud, and performing procedures that respond to those risks. Such procedures included examining, on a test basis, evidence regarding the amounts and disclosures in the financial statements and financial highlights. Our audits also included evaluating the accounting principles used and significant estimates made by management, as well as evaluating the overall presentation of the financial statements and financial highlights. Our procedures included confirmation of securities owned as of September 30, 2019, by correspondence with the custodian and brokers; when replies were not received from brokers, we performed other auditing procedures. We believe that our audits provide a reasonable basis for our opinion.
/s/ Deloitte & Touche LLP
Boston, Massachusetts
November 12, 2019
We have served as the auditor of one or more of the Fidelity investment companies since 1999.
Directors and Officers (Trustees and Officers)
The Trustees, Members of the Advisory Board (if any), and officers of the Fidelity Central Investment Portfolios LLC and funds, as applicable, are listed below. The Board of Trustees governs each fund and is responsible for protecting the interests of shareholders. The Trustees are experienced executives who meet periodically throughout the year to oversee each fund's activities, review contractual arrangements with companies that provide services to each fund, oversee management of the risks associated with such activities and contractual arrangements, and review each fund's performance. Except for Michael E. Wiley, each of the Trustees oversees 298 funds. Mr. Wiley oversees 197 funds.
The Trustees hold office without limit in time except that (a) any Trustee may resign; (b) any Trustee may be removed by written instrument, signed by at least two-thirds of the number of Trustees prior to such removal; (c) any Trustee who requests to be retired or who has become incapacitated by illness or injury may be retired by written instrument signed by a majority of the other Trustees; and (d) any Trustee may be removed at any special meeting of shareholders by a two-thirds vote of the outstanding voting securities of the trust. Each Trustee who is not an interested person (as defined in the 1940 Act) of the trust and the funds is referred to herein as an Independent Trustee. Each Independent Trustee shall retire not later than the last day of the calendar year in which his or her 75th birthday occurs. The Independent Trustees may waive this mandatory retirement age policy with respect to individual Trustees. Officers and Advisory Board Members hold office without limit in time, except that any officer or Advisory Board Member may resign or may be removed by a vote of a majority of the Trustees at any regular meeting or any special meeting of the Trustees. Except as indicated, each individual has held the office shown or other offices in the same company for the past five years.
Each fund’s Statement of Additional Information (SAI) includes more information about the Trustees. To request a free copy, call Fidelity at 1-800-544-8544.
Experience, Skills, Attributes, and Qualifications of the Trustees. The Governance and Nominating Committee has adopted a statement of policy that describes the experience, qualifications, attributes, and skills that are necessary and desirable for potential Independent Trustee candidates (Statement of Policy). The Board believes that each Trustee satisfied at the time he or she was initially elected or appointed a Trustee, and continues to satisfy, the standards contemplated by the Statement of Policy. The Governance and Nominating Committee also engages professional search firms to help identify potential Independent Trustee candidates who have the experience, qualifications, attributes, and skills consistent with the Statement of Policy. From time to time, additional criteria based on the composition and skills of the current Independent Trustees, as well as experience or skills that may be appropriate in light of future changes to board composition, business conditions, and regulatory or other developments, have also been considered by the professional search firms and the Governance and Nominating Committee. In addition, the Board takes into account the Trustees' commitment and participation in Board and committee meetings, as well as their leadership of standing and ad hoc committees throughout their tenure.
In determining that a particular Trustee was and continues to be qualified to serve as a Trustee, the Board has considered a variety of criteria, none of which, in isolation, was controlling. The Board believes that, collectively, the Trustees have balanced and diverse experience, qualifications, attributes, and skills, which allow the Board to operate effectively in governing each fund and protecting the interests of shareholders. Information about the specific experience, skills, attributes, and qualifications of each Trustee, which in each case led to the Board's conclusion that the Trustee should serve (or continue to serve) as a trustee of the funds, is provided below.
Board Structure and Oversight Function. James C. Curvey is an interested person and currently serves as Chairman. The Trustees have determined that an interested Chairman is appropriate and benefits shareholders because an interested Chairman has a personal and professional stake in the quality and continuity of services provided to the funds. Independent Trustees exercise their informed business judgment to appoint an individual of their choosing to serve as Chairman, regardless of whether the Trustee happens to be independent or a member of management. The Independent Trustees have determined that they can act independently and effectively without having an Independent Trustee serve as Chairman and that a key structural component for assuring that they are in a position to do so is for the Independent Trustees to constitute a substantial majority for the Board. The Independent Trustees also regularly meet in executive session. Ned C. Lautenbach serves as Chairman of the Independent Trustees and as such (i) acts as a liaison between the Independent Trustees and management with respect to matters important to the Independent Trustees and (ii) with management prepares agendas for Board meetings.
Fidelity® funds are overseen by different Boards of Trustees. The funds' Board oversees Fidelity's high income and certain equity funds, and other Boards oversee Fidelity's investment-grade bond, money market, asset allocation, and other equity funds. The asset allocation funds may invest in Fidelity® funds overseen by the funds' Board. The use of separate Boards, each with its own committee structure, allows the Trustees of each group of Fidelity® funds to focus on the unique issues of the funds they oversee, including common research, investment, and operational issues. On occasion, the separate Boards establish joint committees to address issues of overlapping consequences for the Fidelity® funds overseen by each Board.
The Trustees operate using a system of committees to facilitate the timely and efficient consideration of all matters of importance to the Trustees, each fund, and fund shareholders and to facilitate compliance with legal and regulatory requirements and oversight of the funds' activities and associated risks. The Board, acting through its committees, has charged FMR and its affiliates with (i) identifying events or circumstances the occurrence of which could have demonstrably adverse effects on the funds' business and/or reputation; (ii) implementing processes and controls to lessen the possibility that such events or circumstances occur or to mitigate the effects of such events or circumstances if they do occur; and (iii) creating and maintaining a system designed to evaluate continuously business and market conditions in order to facilitate the identification and implementation processes described in (i) and (ii) above. Because the day-to-day operations and activities of the funds are carried out by or through FMR, its affiliates, and other service providers, the funds' exposure to risks is mitigated but not eliminated by the processes overseen by the Trustees. While each of the Board's committees has responsibility for overseeing different aspects of the funds' activities, oversight is exercised primarily through the Operations, Audit, and Compliance Committees. Appropriate personnel, including but not limited to the funds' Chief Compliance Officer (CCO), FMR's internal auditor, the independent accountants, the funds' Treasurer and portfolio management personnel, make periodic reports to the Board's committees, as appropriate, including an annual review of Fidelity's risk management program for the Fidelity® funds. The responsibilities of each standing committee, including their oversight responsibilities, are described further under "Standing Committees of the Trustees."
Interested Trustees*:
Correspondence intended for a Trustee who is an interested person may be sent to Fidelity Investments, 245 Summer Street, Boston, Massachusetts 02210.
Name, Year of Birth; Principal Occupations and Other Relevant Experience+
James C. Curvey (1935)
Year of Election or Appointment: 2007
Trustee
Chairman of the Board of Trustees
Mr. Curvey also serves as Trustee of other Fidelity® funds. Mr. Curvey is Vice Chairman (2007-present) and Director of FMR LLC (diversified financial services company). In addition, Mr. Curvey is an Overseer Emeritus for the Boston Symphony Orchestra, a Director of Artis-Naples, and a Trustee of Brewster Academy in Wolfeboro, New Hampshire. Previously, Mr. Curvey served as a Director of Fidelity Research & Analysis Co. (investment adviser firm, 2009-2018), Director of Fidelity Investments Money Management, Inc. (investment adviser firm, 2009-2014) and a Director of FMR and FMR Co., Inc. (investment adviser firms, 2007-2014).
* Determined to be an “Interested Trustee” by virtue of, among other things, his or her affiliation with the Fidelity Central Investment Portfolios LLC or various entities under common control with FMR.
+ The information includes the Trustee's principal occupation during the last five years and other information relating to the experience, attributes, and skills relevant to the Trustee's qualifications to serve as a Trustee, which led to the conclusion that the Trustee should serve as a Trustee for each fund.
Independent Trustees:
Correspondence intended for an Independent Trustee may be sent to Fidelity Investments, P.O. Box 55235, Boston, Massachusetts 02205-5235.
Name, Year of Birth; Principal Occupations and Other Relevant Experience+
Dennis J. Dirks (1948)
Year of Election or Appointment: 2005
Trustee
Mr. Dirks also serves as Trustee of other Fidelity® funds. Prior to his retirement in May 2003, Mr. Dirks was Chief Operating Officer and a member of the Board of The Depository Trust & Clearing Corporation (DTCC). He also served as President, Chief Operating Officer, and Board member of The Depository Trust Company (DTC) and President and Board member of the National Securities Clearing Corporation (NSCC). In addition, Mr. Dirks served as Chief Executive Officer and Board member of the Government Securities Clearing Corporation, Chief Executive Officer and Board member of the Mortgage-Backed Securities Clearing Corporation, as a Trustee and a member of the Finance Committee of Manhattan College (2005-2008), as a Trustee and a member of the Finance Committee of AHRC of Nassau County (2006-2008), as a member of the Independent Directors Council (IDC) Governing Council (2010-2015), and as a member of the Board of Directors for The Brookville Center for Children’s Services, Inc. (2009-2017). Mr. Dirks is a member of the Finance Committee (2016-present) and Board of Directors (2017-present) and is Treasurer (2018-present) of the Asolo Repertory Theatre.
Donald F. Donahue (1950)
Year of Election or Appointment: 2018
Trustee
Mr. Donahue also serves as a Trustee of other Fidelity® funds. Mr. Donahue is President and Chief Executive Officer of Miranda Partners, LLC (risk consulting for the financial services industry, 2012-present). Previously, Mr. Donahue served as a Member of the Advisory Board of certain Fidelity® funds (2015-2018) and Chief Executive Officer (2006-2012), Chief Operating Officer (2003-2006), and Managing Director, Customer Marketing and Development (1999-2003) of The Depository Trust & Clearing Corporation (financial markets infrastructure). Mr. Donahue serves as a Member (2007-present) and Co-Chairman (2016-present) of the Board of Directors of United Way of New York, Member of the Board of Directors of NYC Leadership Academy (2012-present) and Member of the Board of Advisors of Ripple Labs, Inc. (financial services, 2015-present). He also served as Chairman (2010-2012) and Member of the Board of Directors (2012-2013) of Omgeo, LLC (financial services), Treasurer of United Way of New York (2012-2016), and Member of the Board of Directors of XBRL US (financial services non-profit, 2009-2012) and the International Securities Services Association (2009-2012).
Alan J. Lacy (1953)
Year of Election or Appointment: 2008
Trustee
Mr. Lacy also serves as Trustee of other Fidelity® funds. Mr. Lacy serves as a Director of Bristol-Myers Squibb Company (global pharmaceuticals, 2008-present). He is a Trustee of the California Chapter of The Nature Conservancy (2015-present) and a Director of the Center for Advanced Study in the Behavioral Sciences at Stanford University (2015-present). In addition, Mr. Lacy served as Senior Adviser (2007-2014) of Oak Hill Capital Partners, L.P. (private equity) and also served as Chief Executive Officer (2005) and Vice Chairman (2005-2006) of Sears Holdings Corporation (retail) and Chief Executive Officer and Chairman of the Board of Sears, Roebuck and Co. (retail, 2000-2005). Previously, Mr. Lacy served as Chairman (2014-2017) and a member (2010-2017) of the Board of Directors of Dave & Buster’s Entertainment, Inc. (restaurant and entertainment complexes), as Chairman (2008-2011) and a member (2006-2015) of the Board of Trustees of the National Parks Conservation Association, and as a member of the Board of Directors for The Hillman Companies, Inc. (hardware wholesalers, 2010-2014), Earth Fare, Inc. (retail grocery, 2010-2014), and The Western Union Company (global money transfer, 2006-2011).
Ned C. Lautenbach (1944)
Year of Election or Appointment: 2004
Trustee
Chairman of the Independent Trustees
Mr. Lautenbach also serves as Trustee of other Fidelity® funds. Mr. Lautenbach currently serves as Chair (2018-present) and Member (2013-present) of the Board of Governors, State University System of Florida and is a member of the Council on Foreign Relations (1994-present). He is also a member and has most recently served as Chairman of the Board of Directors of Artis-Naples (2012-present). Previously, Mr. Lautenbach served as a member and then Lead Director of the Board of Directors of Eaton Corporation (diversified industrial, 1997-2016). He was also a Partner and Advisory Partner at Clayton, Dubilier & Rice, LLC (private equity investment, 1998-2010), as well as a Director of Sony Corporation (2006-2007). In addition, Mr. Lautenbach also had a 30-year career with IBM (technology company) during which time he served as Senior Vice President and a member of the Corporate Executive Committee (1968-1998).
Joseph Mauriello (1944)
Year of Election or Appointment: 2008
Trustee
Mr. Mauriello also serves as Trustee of other Fidelity® funds. Prior to his retirement in January 2006, Mr. Mauriello served in numerous senior management positions including Deputy Chairman and Chief Operating Officer (2004-2005), and Vice Chairman of Financial Services (2002-2004) of KPMG LLP US (professional services, 1965-2005). Mr. Mauriello currently serves as a member of the Independent Directors Council (IDC) Governing Council (2015-present). Previously, Mr. Mauriello served as a member of the Board of Directors of XL Group plc. (global insurance and re-insurance, 2006-2018).
Cornelia M. Small (1944)
Year of Election or Appointment: 2005
Trustee
Ms. Small also serves as Trustee of other Fidelity® funds. Ms. Small is a member of the Board of Directors (2009-present) and Chair of the Investment Committee (2010-present) of the Teagle Foundation. Ms. Small also serves on the Investment Committee of the Berkshire Taconic Community Foundation (2008-present). Previously, Ms. Small served as Chairperson (2002-2008) and a member of the Investment Committee and Chairperson (2008-2012) and a member of the Board of Trustees of Smith College. In addition, Ms. Small served as Chief Investment Officer, Director of Global Equity Investments, and a member of the Board of Directors of Scudder, Stevens & Clark and Scudder Kemper Investments.
Garnett A. Smith (1947)
Year of Election or Appointment: 2018
Trustee
Mr. Smith also serves as Trustee of other Fidelity® funds. Prior to Mr. Smith's retirement, he served as Chairman and Chief Executive Officer of Inbrand Corp. (manufacturer of personal absorbent products, 1990-1997). He also served as President (1986-1990) of Inbrand Corp. Prior to his employment with Inbrand Corp., he was employed by a retail fabric chain and North Carolina National Bank. In addition, Mr. Smith served as a Member of the Advisory Board of certain Fidelity® funds (2012-2013) and as a board member of the Jackson Hole Land Trust (2009-2012).
David M. Thomas (1949)
Year of Election or Appointment: 2008
Trustee
Mr. Thomas also serves as Trustee of other Fidelity® funds. Mr. Thomas serves as Non-Executive Chairman of the Board of Directors of Fortune Brands Home and Security (home and security products, 2011-present) and as a member of the Board of Directors (2004-present) and Presiding Director (2013-present) of Interpublic Group of Companies, Inc. (marketing communication). Previously, Mr. Thomas served as Executive Chairman (2005-2006) and Chairman and Chief Executive Officer (2000-2005) of IMS Health, Inc. (pharmaceutical and healthcare information solutions), a Director of Fortune Brands, Inc. (consumer products, 2000-2011), and a member of the Board of Trustees of the University of Florida (2013-2018).
Michael E. Wiley (1950)
Year of Election or Appointment: 2018
Trustee
Mr. Wiley also serves as Trustee or Member of the Advisory Board of other Fidelity® funds. Mr. Wiley serves as a Director of High Point Resources (exploration and production, 2005-present). Previously, Mr. Wiley served as a Director of Andeavor Corporation (independent oil refiner and marketer, 2005-2018), a Director of Andeavor Logistics LP (natural resources logistics, 2015-2018), a Director of Post Oak Bank (privately-held bank, 2004-2018), a Director of Asia Pacific Exploration Consolidated (international oil and gas exploration and production, 2008-2013), a member of the Board of Trustees of the University of Tulsa (2000-2006; 2007-2010), a Senior Energy Advisor of Katzenbach Partners, LLC (consulting, 2006-2007), an Advisory Director of Riverstone Holdings (private investment), a Director of Spinnaker Exploration Company (exploration and production, 2001-2005) and Chairman, President, and CEO of Baker Hughes, Inc. (oilfield services, 2000-2004).
+ The information includes the Trustee's principal occupation during the last five years and other information relating to the experience, attributes, and skills relevant to the Trustee's qualifications to serve as a Trustee, which led to the conclusion that the Trustee should serve as a Trustee for each fund.
Advisory Board Members and Officers:
Correspondence intended for a Member of the Advisory Board (if any) may be sent to Fidelity Investments, P.O. Box 55235, Boston, Massachusetts 02205-5235. Correspondence intended for an officer or Peter S. Lynch may be sent to Fidelity Investments, 245 Summer Street, Boston, Massachusetts 02210. Officers appear below in alphabetical order.
Name, Year of Birth; Principal Occupation
Vicki L. Fuller (1957)
Year of Election or Appointment: 2018
Member of the Advisory Board
Ms. Fuller also serves as Member of the Advisory Board of other Fidelity® funds. Ms. Fuller serves as a member of the Board of Directors, Audit Committee, and Nominating and Governance Committee of The Williams Companies, Inc. (natural gas infrastructure, 2018-present). Previously, Ms. Fuller served as the Chief Investment Officer of the New York State Common Retirement Fund (2012-2018) and held a variety of positions at AllianceBernstein L.P. (global asset management, 1985-2012), including Managing Director (2006-2012) and Senior Vice President and Senior Portfolio Manager (2001-2006).
Peter S. Lynch (1944)
Year of Election or Appointment: 2004
Member of the Advisory Board
Mr. Lynch also serves as Member of the Advisory Board of other Fidelity® funds. Mr. Lynch is Vice Chairman and a Director of FMR (investment adviser firm) and FMR Co., Inc. (investment adviser firm). In addition, Mr. Lynch serves as a Trustee of Boston College and as the Chairman of the Inner-City Scholarship Fund. Previously, Mr. Lynch served on the Special Olympics International Board of Directors (1997-2006).
Elizabeth Paige Baumann (1968)
Year of Election or Appointment: 2017
Anti-Money Laundering (AML) Officer
Ms. Baumann also serves as AML Officer of other funds. She is Chief AML Officer (2012-present) and Senior Vice President (2014-present) of FMR LLC (diversified financial services company) and is an employee of Fidelity Investments. Previously, Ms. Baumann served as AML Officer of the funds (2012-2016), and Vice President (2007-2014) and Deputy Anti-Money Laundering Officer (2007-2012) of FMR LLC.
Craig S. Brown (1977)
Year of Election or Appointment: 2019
Assistant Treasurer
Mr. Brown also serves as Assistant Treasurer of other funds. Mr. Brown is an employee of Fidelity Investments (2013-present).
John J. Burke III (1964)
Year of Election or Appointment: 2018
Chief Financial Officer
Mr. Burke also serves as Chief Financial Officer of other funds. Mr. Burke serves as Head of Investment Operations for Fidelity Fund and Investment Operations (2018-present) and is an employee of Fidelity Investments (1998-present). Previously Mr. Burke served as head of Asset Management Investment Operations (2012-2018).
William C. Coffey (1969)
Year of Election or Appointment: 2019
Assistant Secretary
Mr. Coffey also serves as Assistant Secretary of other funds. He is Senior Vice President and Deputy General Counsel of FMR LLC (diversified financial services company, 2010-present), and is an employee of Fidelity Investments. Previously, Mr. Coffey served as Secretary and CLO of certain funds (2018-2019); CLO, Secretary, and Senior Vice President of Fidelity Management & Research Company and FMR Co., Inc. (investment adviser firms, 2018-2019); Secretary of Fidelity SelectCo, LLC and Fidelity Investments Money Management, Inc. (investment adviser firms, 2018-2019); CLO of Fidelity Management & Research (Hong Kong) Limited, FMR Investment Management (UK) Limited, and Fidelity Management & Research (Japan) Limited (investment adviser firms, 2018-2019); and Assistant Secretary of certain funds (2009-2018).
Timothy M. Cohen (1969)
Year of Election or Appointment: 2017
Vice President
Mr. Cohen also serves as Vice President of other funds. Mr. Cohen serves as Executive Vice President of Fidelity SelectCo, LLC (2019-present), Co-Head of Equity (2018-present), a Director of Fidelity Management & Research (Japan) Limited (investment adviser firm, 2016-present), and is an employee of Fidelity Investments. Previously, Mr. Cohen served as Head of Global Equity Research (2016-2018), Chief Investment Officer - Equity and a Director of Fidelity Management & Research (U.K.) Inc. (investment adviser firm, 2013-2015) and as a Director of Fidelity Management & Research (Hong Kong) Limited (investment adviser firm, 2017).
Jonathan Davis (1968)
Year of Election or Appointment: 2010
Assistant Treasurer
Mr. Davis also serves as Assistant Treasurer of other funds. Mr. Davis serves as Assistant Treasurer of FMR Capital, Inc. (2017-present) and is an employee of Fidelity Investments. Previously, Mr. Davis served as Vice President and Associate General Counsel of FMR LLC (diversified financial services company, 2003-2010).
Adrien E. Deberghes (1967)
Year of Election or Appointment: 2016
Assistant Treasurer
Mr. Deberghes also serves as an officer of other funds. He serves as Assistant Treasurer of FMR Capital, Inc. (2017-present), Executive Vice President of Fidelity Investments Money Management, Inc. (FIMM) (investment adviser firm, 2016-present), and is an employee of Fidelity Investments (2008-present). Previously, Mr. Deberghes served as President and Treasurer of certain Fidelity® funds (2013-2018). Prior to joining Fidelity Investments, Mr. Deberghes was Senior Vice President of Mutual Fund Administration at State Street Corporation (2007-2008), Senior Director of Mutual Fund Administration at Investors Bank & Trust (2005-2007), and Director of Finance for Dunkin' Brands (2000-2005). Previously, Mr. Deberghes served in other fund officer roles.
Laura M. Del Prato (1964)
Year of Election or Appointment: 2018
Assistant Treasurer
Ms. Del Prato also serves as an officer of other funds. Ms. Del Prato is an employee of Fidelity Investments (2017-present). Prior to joining Fidelity Investments, Ms. Del Prato served as a Managing Director and Treasurer of the JPMorgan Mutual Funds (2014-2017). Prior to JPMorgan, Ms. Del Prato served as a partner at Cohen Fund Audit Services (accounting firm, 2012-2013) and KPMG LLP (accounting firm, 2004-2012).
Colm A. Hogan (1973)
Year of Election or Appointment: 2016
Deputy Treasurer
Mr. Hogan also serves as an officer of other funds. Mr. Hogan serves as Assistant Treasurer of FMR Capital, Inc. (2017-present) and is an employee of Fidelity Investments (2005-present). Previously, Mr. Hogan served as Assistant Treasurer of certain Fidelity® funds (2016-2018).
Pamela R. Holding (1964)
Year of Election or Appointment: 2018
Vice President
Ms. Holding also serves as Vice President of other funds. Ms. Holding serves as Executive Vice President of Fidelity SelectCo, LLC (2019-present), Co-Head of Equity (2018-present) and is an employee of Fidelity Investments (2013-present). Previously, Ms. Holding served as Chief Investment Officer of Fidelity Institutional Asset Management (2013-2018).
Cynthia Lo Bessette (1969)
Year of Election or Appointment: 2019
Secretary and Chief Legal Officer (CLO)
Ms. Lo Bessette also serves as Secretary and CLO of other funds. Ms. Lo Bessette serves as CLO, Secretary, and Senior Vice President of Fidelity Management & Research Company and FMR Co., Inc. (investment adviser firms, 2019-present); Secretary of Fidelity SelectCo, LLC and Fidelity Investments Money Management, Inc. (investment adviser firms, 2019-present); and CLO of Fidelity Management & Research (Hong Kong) Limited, FMR Investment Management (UK) Limited, and Fidelity Management & Research (Japan) Limited (investment adviser firms, 2019-present). She is a Senior Vice President and Deputy General Counsel of FMR LLC (diversified financial services company, 2019-present), and is an employee of Fidelity Investments. Previously, Ms. Lo Bessette served as Executive Vice President, General Counsel (2016-2019) and Senior Vice President, Deputy General Counsel (2015-2016) of OppenheimerFunds (investment management company) and Deputy Chief Legal Officer (2013-2015) of Jennison Associates LLC (investment adviser firm).
Chris Maher (1972)
Year of Election or Appointment: 2013
Assistant Treasurer
Mr. Maher serves as Assistant Treasurer of other funds. Mr. Maher is Vice President of Valuation Oversight, serves as Assistant Treasurer of FMR Capital, Inc. (2017-present), and is an employee of Fidelity Investments. Previously, Mr. Maher served as Vice President of Asset Management Compliance (2013), Vice President of the Program Management Group of FMR (investment adviser firm, 2010-2013), and Vice President of Valuation Oversight (2008-2010).
Kenneth B. Robins (1969)
Year of Election or Appointment: 2016
Chief Compliance Officer
Mr. Robins also serves as an officer of other funds. Mr. Robins serves as Compliance Officer of Fidelity Management & Research Company and FMR Co., Inc. (investment adviser firms, 2016-present) and is an employee of Fidelity Investments (2004-present). Previously, Mr. Robins served as Executive Vice President of Fidelity Investments Money Management, Inc. (investment adviser firm, 2013-2016) and served in other fund officer roles.
Stacie M. Smith (1974)
Year of Election or Appointment: 2016
President and Treasurer
Ms. Smith also serves as an officer of other funds. Ms. Smith serves as Assistant Treasurer of FMR Capital, Inc. (2017-present), is an employee of Fidelity Investments (2009-present), and has served in other fund officer roles. Prior to joining Fidelity Investments, Ms. Smith served as Senior Audit Manager of Ernst & Young LLP (accounting firm, 1996-2009). Previously, Ms. Smith served as Assistant Treasurer (2013-2018) and Deputy Treasurer (2013-2016) of certain Fidelity® funds.
Marc L. Spector (1972)
Year of Election or Appointment: 2016
Assistant Treasurer
Mr. Spector also serves as an officer of other funds. Mr. Spector serves as Assistant Treasurer of FMR Capital, Inc. (2017-present) and is an employee of Fidelity Investments (2016-present). Prior to joining Fidelity Investments, Mr. Spector served as Director at the Siegfried Group (accounting firm, 2013-2016), and prior to Siegfried Group as audit senior manager at Deloitte & Touche (accounting firm, 2005-2013).
Jim Wegmann (1979)
Year of Election or Appointment: 2019
Assistant Treasurer
Mr. Wegmann also serves as Assistant Treasurer of other funds. Mr. Wegmann is an employee of Fidelity Investments (2011-present).
Shareholder Expense Example
As a shareholder of a Fund, you incur two types of costs: (1) transaction costs and (2) ongoing costs, including other Fund expenses. This Example is intended to help you understand your ongoing costs (in dollars) of investing in the Funds and to compare these costs with the ongoing costs of investing in other mutual funds.
The Example is based on an investment of $1,000 invested at the beginning of the period and held for the entire period (April 1, 2019 to September 30, 2019).
Actual Expenses
The first line of the accompanying table for each fund provides information about actual account values and actual expenses. You may use the information in this line, together with the amount you invested, to estimate the expenses that you paid over the period. Simply divide your account value by $1,000.00 (for example, an $8,600 account value divided by $1,000.00 = 8.6), then multiply the result by the number in the first line for a fund under the heading entitled "Expenses Paid During Period" to estimate the expenses you paid on your account during this period. In addition, each Fund, as a shareholder in the underlying Fidelity Central Funds, will indirectly bear its pro-rata share of the fees and expenses incurred by the underlying Fidelity Central Funds. These fees and expenses are not included in the Fund's annualized expense ratio used to calculate the expense estimate in the table below.
Hypothetical Example for Comparison Purposes
The second line of the accompanying table for each fund provides information about hypothetical account values and hypothetical expenses based on a fund's actual expense ratio and an assumed rate of return of 5% per year before expenses, which is not the Fund's actual return. The hypothetical account values and expenses may not be used to estimate the actual ending account balance or expenses you paid for the period. You may use this information to compare the ongoing costs of investing in the Fund and other funds. To do so, compare this 5% hypothetical example with the 5% hypothetical examples that appear in the shareholder reports of the other funds. In addition, each Fund, as a shareholder in the underlying Fidelity Central Funds, will indirectly bear its pro-rata share of the fees and expenses incurred by the underlying Fidelity Central Funds. These fees and expenses are not included in the Fund's annualized expense ratio used to calculate the expense estimate in the table below.
Please note that the expenses shown in the table are meant to highlight your ongoing costs only and do not reflect any transaction costs. Therefore, the second line of the table is useful in comparing ongoing costs only, and will not help you determine the relative total costs of owning different funds.
| Annualized Expense Ratio-A | Beginning Account Value April 1, 2019 | Ending Account Value September 30, 2019 | Expenses Paid During Period-B April 1, 2019 to September 30, 2019 | |
| Communication Services | .0024% | |||
| Actual | $1,000.00 | $1,056.80 | $.01 | |
| Hypothetical-C | $1,000.00 | $1,025.06 | $.01 | |
| Consumer Discretionary | .0022% | |||
| Actual | $1,000.00 | $1,054.30 | $.01 | |
| Hypothetical-C | $1,000.00 | $1,025.06 | $.01 | |
| Consumer Staples | .0033% | |||
| Actual | $1,000.00 | $1,069.80 | $.02 | |
| Hypothetical-C | $1,000.00 | $1,025.05 | $.02 | |
| Energy | .0031% | |||
| Actual | $1,000.00 | $895.00 | $.01 | |
| Hypothetical-C | $1,000.00 | $1,025.05 | $.02 | |
| Financials | .0019% | |||
| Actual | $1,000.00 | $1,089.60 | $.01 | |
| Hypothetical-C | $1,000.00 | $1,025.06 | $.01 | |
| Health Care | .0033% | |||
| Actual | $1,000.00 | $959.50 | $.02 | |
| Hypothetical-C | $1,000.00 | $1,025.05 | $.02 | |
| Industrials | .0013% | |||
| Actual | $1,000.00 | $1,053.30 | $.01 | |
| Hypothetical-C | $1,000.00 | $1,025.06 | $.01 | |
| Information Technology | .0012% | |||
| Actual | $1,000.00 | $1,088.80 | $.01 | |
| Hypothetical-C | $1,000.00 | $1,025.06 | $.01 | |
| Materials | .0049% | |||
| Actual | $1,000.00 | $978.50 | $.02 | |
| Hypothetical-C | $1,000.00 | $1,025.04 | $.02 | |
| Real Estate Equity | .0036% | |||
| Actual | $1,000.00 | $1,101.70 | $.02 | |
| Hypothetical-C | $1,000.00 | $1,025.05 | $.02 | |
| Utilities | .0024% | |||
| Actual | $1,000.00 | $1,114.90 | $.01 | |
| Hypothetical-C | $1,000.00 | $1,025.06 | $.01 |
A Annualized expense ratio reflects expenses net of applicable fee waivers.
B Expenses are equal to each Fund's annualized expense ratio, multiplied by the average account value over the period, multiplied by 183/ 365 (to reflect the one-half year period). The fees and expenses of the underlying Money Market Central Funds in which each Fund invests are not included in each Fund's annualized expense ratio.
C 5% return per year before expenses
Distributions (Unaudited)
The funds hereby designate as capital gain dividend the amounts noted below for the taxable year ended September 30, 2019, or, if subsequently determined to be different, the net capital gain of such year.
| Fidelity Communication Services Central Fund | 6,364,088 |
| Fidelity Consumer Discretionary Central Fund | 50,388,654 |
| Fidelity Financials Central Fund | 38,393,910 |
| Fidelity Health Care Central Fund | 37,516,504 |
| Fidelity Information Technology Central Fund | 87,387,669 |
| Fidelity Utilities Central Fund | 25,760,485 |
A percentage of the dividends distributed during the fiscal year for the following funds qualify for the dividends–received deduction for corporate shareholders:
| Fidelity Communication Services Central Fund | |
| October 2018 | - |
| November 2018 | 89% |
| December 2018 | 89% |
| February 2019 | 100% |
| March 2019 | - |
| April 2019 | 100% |
| May 2019 | 100% |
| June 2019 | 100% |
| July 2019 | 100% |
| August 2019 | 100% |
| September 2019 | 100% |
| Fidelity Consumer Discretionary Central Fund | |
| October 2018 | 17% |
| November 2018 | 17% |
| December 2018 | 68% |
| February 2019 | 100% |
| March 2019 | 100% |
| April 2019 | 100% |
| May 2019 | 100% |
| June 2019 | 100% |
| July 2019 | 100% |
| August 2019 | 100% |
| September 2019 | 100% |
| Fidelity Consumer Staples Central Fund | |
| October 2018 | 21% |
| November 2018 | 55% |
| December 2018 | 86% |
| February 2019 | 100% |
| March 2019 | - |
| April 2019 | 100% |
| May 2019 | 100% |
| June 2019 | 100% |
| July 2019 | 100% |
| August 2019 | 100% |
| September 2019 | 100% |
| Fidelity Energy Central Fund | |
| October 2018 | 72% |
| November 2018 | - |
| December 2018 | 73% |
| February 2019 | 93% |
| March 2019 | 93% |
| April 2019 | 93% |
| May 2019 | - |
| June 2019 | 93% |
| July 2019 | 93% |
| August 2019 | 93% |
| September 2019 | 93% |
| Fidelity Financials Central Fund | |
| October 2018 | 0% |
| November 2018 | 15% |
| December 2018 | 61% |
| February 2019 | - |
| March 2019 | 91% |
| April 2019 | 91% |
| May 2019 | 91% |
| June 2019 | 91% |
| July 2019 | 91% |
| August 2019 | 91% |
| September 2019 | 91% |
| Fidelity Health Care Central Fund | |
| October 2018 | 0% |
| November 2018 | 0% |
| December 2018 | 21% |
| February 2019 | 54% |
| March 2019 | 54% |
| April 2019 | 54% |
| May 2019 | 54% |
| June 2019 | 54% |
| July 2019 | 54% |
| August 2019 | 54% |
| September 2019 | 54% |
| Fidelity Industrials Central Fund | |
| October 2018 | 19% |
| November 2018 | 64% |
| December 2018 | 80% |
| February 2019 | 100% |
| March 2019 | 100% |
| April 2019 | 100% |
| May 2019 | 100% |
| June 2019 | 100% |
| July 2019 | 100% |
| August 2019 | 100% |
| September 2019 | 100% |
| Fidelity Information Technology Central Fund | |
| October 2018 | 0% |
| November 2018 | 34% |
| December 2018 | 76% |
| February 2019 | - |
| March 2019 | 91% |
| April 2019 | 91% |
| May 2019 | 91% |
| June 2019 | 91% |
| July 2019 | 91% |
| August 2019 | 91% |
| September 2019 | 91% |
| Fidelity Materials Central Fund | |
| October 2018 | 0% |
| November 2018 | 15% |
| December 2018 | 73% |
| February 2019 | 86% |
| March 2019 | 86% |
| April 2019 | 86% |
| May 2019 | 86% |
| June 2019 | 86% |
| July 2019 | 86% |
| August 2019 | 86% |
| September 2019 | 86% |
| Fidelity Real Estate Equity Central Fund | |
| October 2018 | 0% |
| November 2018 | 0% |
| December 2018 | 0% |
| February 2019 | - |
| March 2019 | - |
| April 2019 | - |
| May 2019 | 0% |
| June 2019 | 0% |
| July 2019 | 0% |
| August 2019 | 0% |
| September 2019 | 0% |
| Fidelity Utilities Central Fund | |
| October 2018 | 22% |
| November 2018 | 22% |
| December 2018 | 45% |
| February 2019 | – |
| March 2019 | 100% |
| April 2019 | 100% |
| May 2019 | 100% |
| June 2019 | 100% |
| July 2019 | 100% |
| August 2019 | 100% |
| September 2019 | 100% |
A percentage of the dividends distributed during the fiscal year for the following funds may be taken into account as a dividend for purposes of the maximum rate under section 1(h)(11) of the Internal Revenue Code:
| Fidelity Communication Services Central Fund | |
| October 2018 | - |
| November 2018 | 87% |
| December 2018 | 87% |
| February 2019 | 100% |
| March 2019 | - |
| April 2019 | 100% |
| May 2019 | 100% |
| June 2019 | 100% |
| July 2019 | 100% |
| August 2019 | 100% |
| September 2019 | 100% |
| Fidelity Consumer Discretionary Central Fund | |
| October 2018 | 47% |
| November 2018 | 47% |
| December 2018 | 84% |
| February 2019 | 100% |
| March 2019 | 100% |
| April 2019 | 100% |
| May 2019 | 100% |
| June 2019 | 100% |
| July 2019 | 100% |
| August 2019 | 100% |
| September 2019 | 100% |
| Fidelity Consumer Staples Central Fund | |
| October 2018 | 83% |
| November 2018 | 92% |
| December 2018 | 100% |
| February 2019 | 100% |
| March 2019 | - |
| April 2019 | 100% |
| May 2019 | 100% |
| June 2019 | 100% |
| July 2019 | 100% |
| August 2019 | 100% |
| September 2019 | 100% |
| Fidelity Energy Central Fund | |
| October 2018 | 78% |
| November 2018 | - |
| December 2018 | 80% |
| February 2019 | 100% |
| March 2019 | 100% |
| April 2019 | 100% |
| May 2019 | - |
| June 2019 | 100% |
| July 2019 | 100% |
| August 2019 | 100% |
| September 2019 | 100% |
| Fidelity Financials Central Fund | |
| October 2018 | 0% |
| November 2018 | 16% |
| December 2018 | 63% |
| February 2019 | - |
| March 2019 | 93% |
| April 2019 | 93% |
| May 2019 | 93% |
| June 2019 | 93% |
| July 2019 | 93% |
| August 2019 | 93% |
| September 2019 | 93% |
| Fidelity Health Care Central Fund | |
| October 2018 | 41% |
| November 2018 | 41% |
| December 2018 | 24% |
| February 2019 | 100% |
| March 2019 | 100% |
| April 2019 | 100% |
| May 2019 | 100% |
| June 2019 | 100% |
| July 2019 | 100% |
| August 2019 | 100% |
| September 2019 | 100% |
| Fidelity Industrials Central Fund | |
| October 2018 | 85% |
| November 2018 | 90% |
| December 2018 | 92% |
| February 2019 | 100% |
| March 2019 | 100% |
| April 2019 | 100% |
| May 2019 | 100% |
| June 2019 | 100% |
| July 2019 | 100% |
| August 2019 | 100% |
| September 2019 | 100% |
| Fidelity Information Technology Central Fund | |
| October 2018 | 0% |
| November 2018 | 37% |
| December 2018 | 82% |
| February 2019 | - |
| March 2019 | 100% |
| April 2019 | 100% |
| May 2019 | 100% |
| June 2019 | 100% |
| July 2019 | 100% |
| August 2019 | 100% |
| September 2019 | 100% |
| Fidelity Materials Central Fund | |
| October 2018 | 63% |
| November 2018 | 70% |
| December 2018 | 96% |
| February 2019 | 100% |
| March 2019 | 100% |
| April 2019 | 100% |
| May 2019 | 100% |
| June 2019 | 100% |
| July 2019 | 100% |
| August 2019 | 100% |
| September 2019 | 100% |
| Fidelity Real Estate Equity Central Fund | |
| November 2018 | 0% |
| December 2018 | 0% |
| February 2019 | 0% |
| March 2019 | - |
| April 2019 | - |
| May 2019 | - |
| June 2019 | 0% |
| July 2019 | 0% |
| August 2019 | 0% |
| September 2019 | 0% |
| Fidelity Utilities Central Fund | |
| October 2018 | 18% |
| November 2018 | 18% |
| December 2018 | 43% |
| February 2019 | – |
| March 2019 | 100% |
| April 2019 | 100% |
| May 2019 | 100% |
| June 2019 | 100% |
| July 2019 | 100% |
| August 2019 | 100% |
| September 2019 | 100% |
The funds will notify shareholders in January 2020 of amounts for use in preparing 2019 income tax returns.
![]()
ESCIP-ANN-1119
1.831584.113
Fidelity® Floating Rate Central Fund
Annual Report
September 30, 2019
Beginning on January 1, 2021, as permitted by regulations adopted by the Securities and Exchange Commission, paper copies of a fund’s shareholder reports will no longer be sent by mail, unless you specifically request paper copies of the reports from the fund or from your financial intermediary, such as a financial advisor, broker-dealer or bank. Instead, the reports will be made available on a website, and you will be notified by mail each time a report is posted and provided with a website link to access the report.
If you already elected to receive shareholder reports electronically, you will not be affected by this change and you need not take any action. You may elect to receive shareholder reports and other communications from a fund electronically, by contacting your financial intermediary. For Fidelity customers, visit Fidelity's web site or call Fidelity using the contact information listed below.
You may elect to receive all future reports in paper free of charge. If you wish to continue receiving paper copies of your shareholder reports, you may contact your financial intermediary or, if you are a Fidelity customer, visit Fidelity’s website, or call Fidelity at the applicable toll-free number listed below. Your election to receive reports in paper will apply to all funds held with the fund complex/your financial intermediary.
| Account Type | Website | Phone Number |
| Brokerage, Mutual Fund, or Annuity Contracts: | fidelity.com/mailpreferences | 1-800-343-3548 |
| Employer Provided Retirement Accounts: | netbenefits.fidelity.com/preferences (choose 'no' under Required Disclosures to continue to print) | 1-800-343-0860 |
| Advisor Sold Accounts Serviced Through Your Financial Intermediary: | Contact Your Financial Intermediary | Your Financial Intermediary's phone number |
| Advisor Sold Accounts Serviced by Fidelity: | institutional.fidelity.com | 1-877-208-0098 |
Contents
To view a fund's proxy voting guidelines and proxy voting record for the 12-month period ended June 30, visit http://www.fidelity.com/proxyvotingresults or visit the Securities and Exchange Commission's (SEC) web site at http://www.sec.gov.
You may also call 1-800-544-8544 to request a free copy of the proxy voting guidelines.
Standard & Poor's, S&P and S&P 500 are registered service marks of The McGraw-Hill Companies, Inc. and have been licensed for use by Fidelity Distributors Corporation.
Other third-party marks appearing herein are the property of their respective owners.
All other marks appearing herein are registered or unregistered trademarks or service marks of FMR LLC or an affiliated company. © 2019 FMR LLC. All rights reserved.
A fund files its complete schedule of portfolio holdings with the SEC for the first and third quarters of each fiscal year on Form N-PORT. Forms N-PORT are available on the SEC’s web site at http://www.sec.gov. A fund's Forms N-PORT may be reviewed and copied at the SEC’s Public Reference Room in Washington, DC. Information regarding the operation of the SEC's Public Reference Room may be obtained by calling 1-800-SEC-0330.
Performance: The Bottom Line
Average annual total return reflects the change in the value of an investment, assuming reinvestment of distributions from dividend income and capital gains (the profits earned upon the sale of securities that have grown in value, if any) and assuming a constant rate of performance each year. The hypothetical investment and the average annual total returns do not reflect the deduction of taxes that a shareholder would pay on fund distributions or the redemption of fund shares. During periods of reimbursement by Fidelity, a fund’s total return will be greater than it would be had the reimbursement not occurred. How a fund did yesterday is no guarantee of how it will do tomorrow.
Average Annual Total Returns
| For the periods ended September 30, 2019 | Past 1 year | Past 5 years | Past 10 years |
| Fidelity® Floating Rate Central Fund | 4.20% | 4.28% | 6.33% |
$10,000 Over 10 Years
Let's say hypothetically that $10,000 was invested in Fidelity® Floating Rate Central Fund on September 30, 2009.
The chart shows how the value of your investment would have changed, and also shows how the S&P®/LSTA Leveraged Performing Loan Index performed over the same period.
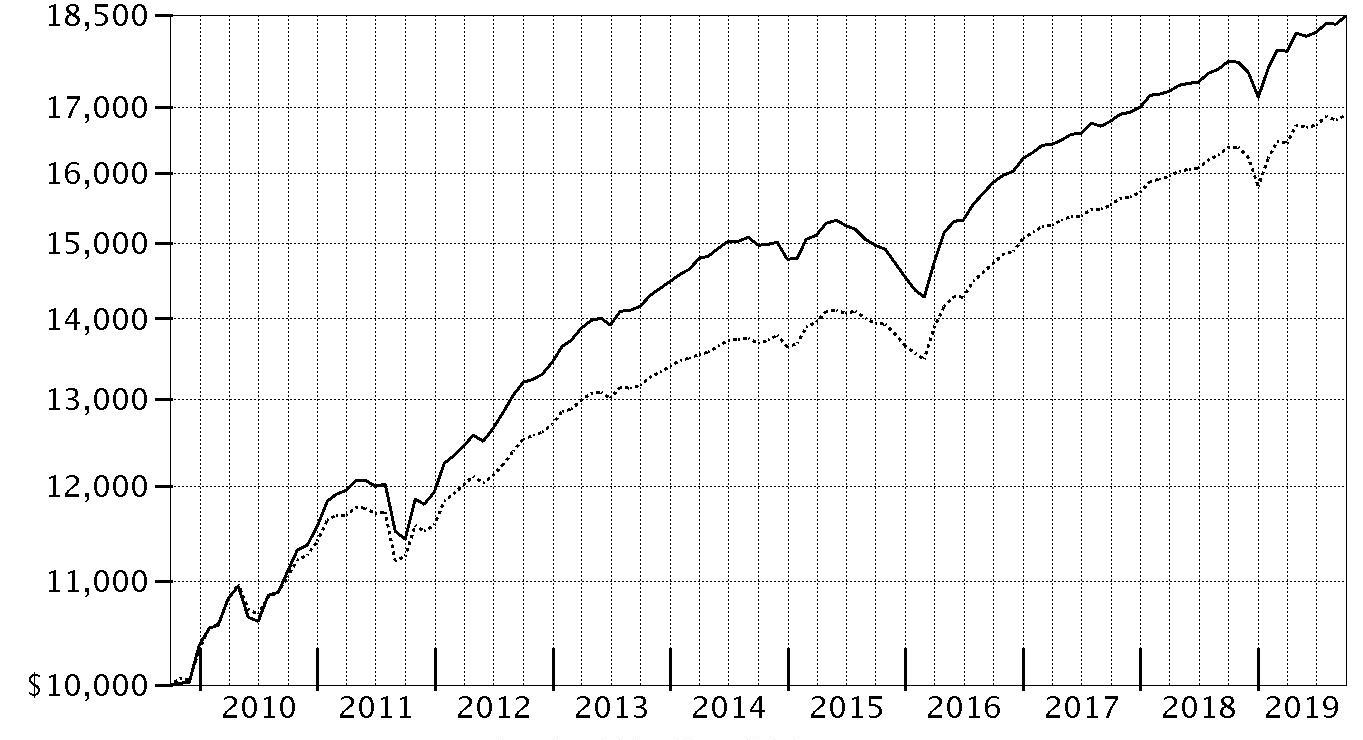
| Period Ending Values | ||
| $18,472 | Fidelity® Floating Rate Central Fund | |
| $16,875 | S&P®/LSTA Leveraged Performing Loan Index | |
Management's Discussion of Fund Performance
Market Recap: High-yield, floating-rate bank loans gained 3.00% for the 12 months ending September 30, 2019, as measured by the S&P/LSTA® Leveraged Performing Loan Index. Following a steep downturn in the fourth quarter of 2018, the loan market rebounded briskly to begin the new year, as risk sentiment improved markedly after U.S. Federal Reserve Chairman Jerome Powell commented that mild inflation would give the central bank greater flexibility to set policy in 2019. Loan prices then seesawed from March through June, amid a mix of factors. Investors recalibrated interest rate expectations in light of the Fed’s dovish shift, ultimately concluding that the central bank was likely to cut its target rate in the near future, hampering demand for loans. Better-than-expected corporate earnings aided the asset class, while ongoing uncertainty about the outcome of U.S.–China trade negotiations gave investors pause, as did the Fed’s decision to ease rates at the end of July. Within the index, all but a few industries posted a gain. Leading the way among larger index groups were radio & television, cable & satellite television, insurance, lodging & casinos, and building & development, which each returned roughly 5% to 6%. Conversely, notable laggards included nonferrous metals/minerals (-11%), oil & gas (-6%), and drugs (0%). From a credit-quality perspective, loans rated BB (+4%) and B (+3%) comfortably outdistanced the -2% result of the market’s lower-quality CCC tier. By comparison, bank loans lagged taxable investment-grade bonds (+10%) and high-yield debt (+6%) the past 12 months.Comments from Co-Portfolio Managers Eric Mollenhauer and Kevin Nielsen: For the fiscal year, the fund gained 4.20%, topping the 3.00% advance of the benchmark S&P/LSTA® Leveraged Performing Loan Index. Security selection drove the fund's outperformance of the benchmark the past 12 months, led by our picks in six industries: drugs, business equipment & services, health care, all telecom, retailers (except food & drug), and electronics/electrical. Overweighting lodging & casinos also contributed to relative performance. Conversely, notable detractors versus the benchmark included an overweighting in oil & gas, an industry group that returned about -6% this period, and stock picking in nonferrous metals/minerals. An outsized stake in generic-drug maker Lannett gained 22% for the fund, making it the top individual contributor. Anticipating the expiration of a key supply contract in March, Lannett’s management team did a nice job boosting sales of other drugs to help offset this loss. Elsewhere, it helped to overweight Frontier Communications, an old-line telephone services company, as our stake gained 10% the past 12 months, despite Frontier being hit hard by the cord-cutting that is reshaping the telecom industry. Frontier is among the fund’s largest holdings. Turning to relative detractors, three companies in the oil & gas industry hurt most: Gavilan Resources (-34%), California Resources (-9%) and Expro Holdings (-29%), the latter of which was an out-of-benchmark equity position, which the fund received when the firm restructured.The views expressed above reflect those of the portfolio manager(s) only through the end of the period as stated on the cover of this report and do not necessarily represent the views of Fidelity or any other person in the Fidelity organization. Any such views are subject to change at any time based upon market or other conditions and Fidelity disclaims any responsibility to update such views. These views may not be relied on as investment advice and, because investment decisions for a Fidelity fund are based on numerous factors, may not be relied on as an indication of trading intent on behalf of any Fidelity fund.
Investment Summary (Unaudited)
Top Five Holdings as of September 30, 2019
| (by issuer, excluding cash equivalents) | % of fund's net assets |
| Bass Pro Shops LLC. | 2.6 |
| Intelsat Jackson Holdings SA | 2.0 |
| Asurion LLC | 1.9 |
| Frontier Communications Corp. | 1.4 |
| TransDigm, Inc. | 1.4 |
| 9.3 |
Top Five Market Sectors as of September 30, 2019
| % of fund's net assets | |
| Technology | 15.2 |
| Telecommunications | 7.9 |
| Energy | 6.3 |
| Gaming | 6.2 |
| Services | 5.6 |
Quality Diversification (% of fund's net assets)
| As of September 30, 2019 * | ||
| BBB | 3.1% | |
| BB | 30.8% | |
| B | 55.0% | |
| CCC,CC,C | 5.5% | |
| Not Rated | 1.3% | |
| Equities | 0.5% | |
| Short-Term Investments and Net Other Assets | 3.8% | |

We have used ratings from Moody's Investors Service, Inc. Where Moody's® ratings are not available, we have used S&P® ratings. All ratings are as of the date indicated and do not reflect subsequent changes.
Asset Allocation (% of fund's net assets)
| As of September 30, 2019* | ||
| Bank Loan Obligations | 91.8% | |
| Nonconvertible Bonds | 3.9% | |
| Common Stocks | 0.5% | |
| Short-Term Investments and Net Other Assets (Liabilities) | 3.8% | |

* Foreign investments - 11.5%
Schedule of Investments September 30, 2019
Showing Percentage of Net Assets
| Bank Loan Obligations - 91.8%(a) | |||
| Principal Amount | Value | ||
| Aerospace - 1.7% | |||
| Jazz Acquisition, Inc. 1LN, term loan 3 month U.S. LIBOR + 4.250% 6.35% 6/19/26 (b)(c) | $875,000 | $875,000 | |
| TransDigm, Inc.: | |||
| Tranche E, term loan 3 month U.S. LIBOR + 2.500% 4.5435% 5/30/25 (b)(c) | 2,955,000 | 2,940,550 | |
| Tranche F, term loan 3 month U.S. LIBOR + 2.500% 4.5435% 6/9/23 (b)(c) | 13,547,721 | 13,503,014 | |
| Tranche G, term loan 3 month U.S. LIBOR + 2.500% 4.5435% 8/22/24 (b)(c) | 6,129,556 | 6,096,702 | |
| Wesco Aircraft Hardware Corp.: | |||
| Tranche A, term loan 3 month U.S. LIBOR + 3.000% 5.05% 11/30/20 (b)(c) | 453,333 | 453,193 | |
| Tranche B, term loan 3 month U.S. LIBOR + 2.500% 4.55% 2/28/21 (b)(c) | 3,145,000 | 3,146,321 | |
| WP CPP Holdings LLC: | |||
| Tranche B 1LN, term loan 3 month U.S. LIBOR + 3.750% 6.0096% 4/30/25 (b)(c) | 5,005,485 | 5,008,638 | |
| Tranche B 2LN, term loan 3 month U.S. LIBOR + 7.750% 10.01% 4/30/26 (b)(c) | 1,000,000 | 990,830 | |
| TOTAL AEROSPACE | 33,014,248 | ||
| Air Transportation - 0.7% | |||
| Dynasty Acquisition Co., Inc.: | |||
| Tranche B 1LN, term loan 3 month U.S. LIBOR + 4.000% 6.1044% 4/4/26 (b)(c) | 3,957,378 | 3,973,445 | |
| Tranche B 2LN, term loan 3 month U.S. LIBOR + 4.000% 6.1044% 4/4/26 (b)(c) | 2,127,622 | 2,136,261 | |
| Kestrel Bidco, Inc. 1LN, term loan 3 month U.S. LIBOR + 2.750% 8/7/26 (b)(c)(d) | 4,605,000 | 4,636,682 | |
| Transplace Holding, Inc. Tranche B 1LN, term loan 3 month U.S. LIBOR + 3.750% 5.8036% 10/5/24 (b)(c) | 3,438,881 | 3,350,777 | |
| TOTAL AIR TRANSPORTATION | 14,097,165 | ||
| Automotive & Auto Parts - 0.9% | |||
| Hertz Corp. Tranche B 1LN, term loan 3 month U.S. LIBOR + 2.750% 4.8% 6/30/23 (b)(c) | 4,980,183 | 4,980,183 | |
| IAA Spinco, Inc. Tranche B 1LN, term loan 3 month U.S. LIBOR + 2.250% 4.3125% 6/29/26 (b)(c) | 2,462,500 | 2,471,734 | |
| North American Lifting Holdings, Inc.: | |||
| Tranche 1LN, term loan 3 month U.S. LIBOR + 4.500% 6.6044% 11/27/20 (b)(c) | 6,375,822 | 5,791,350 | |
| Tranche 2LN, term loan 3 month U.S. LIBOR + 9.000% 11.1044% 11/27/21 (b)(c) | 2,641,000 | 1,833,858 | |
| The Gates Corp. Tranche B 1LN, term loan 3 month U.S. LIBOR + 2.750% 4.7935% 3/31/24 (b)(c) | 188,853 | 185,699 | |
| UOS LLC Tranche B 1LN, term loan 3 month U.S. LIBOR + 5.500% 7.5435% 4/18/23 (b)(c) | 3,089,189 | 3,120,081 | |
| TOTAL AUTOMOTIVE & AUTO PARTS | 18,382,905 | ||
| Banks & Thrifts - 0.7% | |||
| Blackstone CQP Holdco LP Tranche B, term loan 3 month U.S. LIBOR + 3.500% 5.6559% 9/30/24 (b)(c) | 6,733,125 | 6,758,374 | |
| Citadel Securities LP Tranche B, term loan 3 month U.S. LIBOR + 3.500% 5.5435% 2/27/26 (b)(c) | 4,477,500 | 4,488,694 | |
| Victory Capital Holdings, Inc. Tranche B 1LN, term loan 3 month U.S. LIBOR + 3.250% 5.5689% 7/1/26 (b)(c) | 2,950,736 | 2,961,064 | |
| TOTAL BANKS & THRIFTS | 14,208,132 | ||
| Broadcasting - 2.3% | |||
| AppLovin Corp. Tranche B, term loan 3 month U.S. LIBOR + 3.750% 5.7935% 8/15/25 (b)(c) | 6,570,649 | 6,565,195 | |
| CBS Radio, Inc. Tranche B 1LN, term loan 3 month U.S. LIBOR + 2.750% 4.8036% 11/18/24 (b)(c) | 3,907,463 | 3,908,440 | |
| Cumulus Media New Holdings, Inc. Tranche B 1LN, term loan 3 month U.S. LIBOR + 3.750% 5.7959% 3/31/26 (b)(c) | 875,000 | 876,094 | |
| Diamond Sports Group LLC Tranche B 1LN, term loan 3 month U.S. LIBOR + 3.250% 5.3% 8/24/26 (b)(c) | 12,685,000 | 12,748,425 | |
| iHeartMedia Capital I LLC 1LN, term loan 3 month U.S. LIBOR + 4.000% 6.1002% 5/1/26 (b)(c) | 2,478,364 | 2,493,011 | |
| ION Media Networks, Inc. Tranche B 1LN, term loan 3 month U.S. LIBOR + 3.000% 5.0625% 12/18/24 (b)(c) | 3,889,898 | 3,880,173 | |
| NEP/NCP Holdco, Inc.: | |||
| Tranche B 1LN, term loan 3 month U.S. LIBOR + 3.250% 5.2935% 10/19/25 (b)(c) | 1,339,875 | 1,312,796 | |
| Tranche B 2LN, term loan 3 month U.S. LIBOR + 7.000% 9.0435% 10/19/26 (b)(c) | 1,500,000 | 1,465,005 | |
| Nexstar Broadcasting, Inc. Tranche B, term loan 3 month U.S. LIBOR + 2.750% 4.807% 6/19/26 (b)(c) | 7,310,000 | 7,339,679 | |
| Sinclair Television Group, Inc. Tranche B 1LN, term loan 3 month U.S. LIBOR + 2.500% 4.54% 9/30/26 (b)(c) | 3,550,000 | 3,560,366 | |
| TOTAL BROADCASTING | 44,149,184 | ||
| Building Materials - 1.1% | |||
| ACProducts, Inc. Tranche B 1LN, term loan 3 month U.S. LIBOR + 5.500% 7.5435% 2/15/24 (b)(c)(e) | 2,098,438 | 2,014,500 | |
| APi Group DE, Inc. Tranche B 1LN, term loan 3 month U.S. LIBOR + 2.500% 10/1/26 (b)(c)(d) | 5,000,000 | 5,012,500 | |
| GYP Holdings III Corp. Tranche B 1LN, term loan 3 month U.S. LIBOR + 2.750% 4.7935% 6/1/25 (b)(c) | 2,737,073 | 2,722,019 | |
| Hamilton Holdco LLC Tranche B 1LN, term loan 3 month U.S. LIBOR + 2.000% 4.11% 7/2/25 (b)(c) | 2,961,263 | 2,968,666 | |
| HD Supply, Inc. Tranche B 5LN, term loan 3 month U.S. LIBOR + 1.750% 3.7935% 10/17/23 (b)(c) | 1,485,000 | 1,489,336 | |
| Traverse Midstream Partners Ll Tranche B, term loan 3 month U.S. LIBOR + 4.000% 6.05% 9/27/24 (b)(c) | 3,242,250 | 2,845,074 | |
| Ventia Deco LLC Tranche B, term loan 3 month U.S. LIBOR + 3.500% 5.6044% 5/21/26 (b)(c) | 4,430,959 | 4,430,959 | |
| TOTAL BUILDING MATERIALS | 21,483,054 | ||
| Cable/Satellite TV - 3.5% | |||
| Cable One, Inc. Tranche B, term loan 3 month U.S. LIBOR + 1.750% 3.8% 5/1/24 (b)(c) | 1,241,425 | 1,240,655 | |
| Charter Communication Operating LLC Tranche B, term loan 3 month U.S. LIBOR + 2.000% 4.05% 4/30/25 (b)(c) | 23,995,605 | 24,127,581 | |
| CSC Holdings LLC: | |||
| Tranche B 5LN, term loan 3 month U.S. LIBOR + 2.500% 4/15/27 (b)(c)(d) | 9,625,000 | 9,637,031 | |
| Tranche B, term loan 3 month U.S. LIBOR + 2.500% 4.5275% 1/25/26 (b)(c) | 5,791,688 | 5,791,688 | |
| Tranche B3 1LN, term loan 3 month U.S. LIBOR + 2.250% 4.2775% 1/15/26 (b)(c) | 1,990,000 | 1,987,015 | |
| Tranche B4 1LN, term loan 3 month U.S. LIBOR + 3.000% 5.0275% 4/15/27 (b)(c) | 1,995,000 | 1,995,000 | |
| MCC Iowa LLC Tranche M, term loan 3 month U.S. LIBOR + 2.000% 3.93% 1/15/25 (b)(c) | 1,063,300 | 1,069,286 | |
| Neptune Finco Corp. Tranche B, term loan 3 month U.S. LIBOR + 2.250% 4.2775% 7/17/25 (b)(c) | 4,839,905 | 4,832,113 | |
| Virgin Media Bristol LLC Tranche B, term loan 3 month U.S. LIBOR + 2.500% 4.5275% 1/15/26 (b)(c) | 5,500,000 | 5,500,000 | |
| WideOpenWest Finance LLC Tranche B, term loan 3 month U.S. LIBOR + 3.250% 5.2935% 8/19/23 (b)(c) | 11,772,281 | 11,345,536 | |
| TOTAL CABLE/SATELLITE TV | 67,525,905 | ||
| Capital Goods - 0.6% | |||
| AECOM Tranche B, term loan 3 month U.S. LIBOR + 1.750% 3.8036% 3/13/25 (b)(c) | 1,771,582 | 1,775,462 | |
| Altra Industrial Motion Corp. Tranche B 1LN, term loan 3 month U.S. LIBOR + 2.000% 4.0435% 10/1/25 (b)(c) | 3,299,888 | 3,291,638 | |
| CPM Holdings, Inc.: | |||
| 2LN, term loan 3 month U.S. LIBOR + 8.250% 10.2935% 11/15/26 (b)(c) | 645,000 | 636,402 | |
| Tranche B 1LN, term loan 3 month U.S. LIBOR + 3.750% 5.7935% 11/15/25 (b)(c) | 2,118,988 | 2,086,546 | |
| Sundyne U.S. Purchaser, Inc. Tranche B, term loan 3 month U.S. LIBOR + 4.000% 6.0435% 5/15/26 (b)(c) | 1,416,667 | 1,414,896 | |
| Titan Sub LLC Tranche B 1LN, term loan 3 month U.S. LIBOR + 5.000% 7.0435% 9/19/26 (b)(c) | 1,750,000 | 1,745,625 | |
| TOTAL CAPITAL GOODS | 10,950,569 | ||
| Chemicals - 2.1% | |||
| ASP Chromaflo Dutch I BV Tranche B-2 1LN, term loan 3 month U.S. LIBOR + 3.500% 5.5435% 11/18/23 (b)(c) | 605,909 | 587,356 | |
| ASP Chromaflo Intermediate Holdings, Inc. Tranche B 1LN, term loan 3 month U.S. LIBOR + 3.500% 5.5435% 11/18/23 (b)(c) | 465,969 | 451,701 | |
| Hexion, Inc. Tranche B 1LN, term loan 3 month U.S. LIBOR + 3.500% 5.82% 7/1/26 (b)(c) | 1,895,250 | 1,888,143 | |
| MacDermid, Inc. Tranche B, term loan 3 month U.S. LIBOR + 2.250% 4.2935% 1/31/26 (b)(c) | 2,803,813 | 2,811,691 | |
| Messer Industries U.S.A., Inc. Tranche B 1LN, term loan 3 month U.S. LIBOR + 2.500% 4.6044% 3/1/26 (b)(c) | 6,467,500 | 6,450,555 | |
| OCI Partners LP Tranche B, term loan 3 month U.S. LIBOR + 4.000% 6.1044% 3/13/25 (b)(c) | 3,916,389 | 3,911,493 | |
| Oxea Corp. Tranche B2, term loan 3 month U.S. LIBOR + 3.500% 5.625% 10/11/24 (b)(c) | 5,376,014 | 5,349,134 | |
| Starfruit U.S. Holdco LLC Tranche B, term loan 3 month U.S. LIBOR + 3.250% 5.2921% 10/1/25 (b)(c) | 9,616,052 | 9,404,498 | |
| The Chemours Co. LLC Tranche B 1LN, term loan 3 month U.S. LIBOR + 1.750% 3.8% 4/3/25 (b)(c) | 2,499,289 | 2,406,191 | |
| Trinseo Materials Operating SCA/Trinseo Materials Finance, Inc. term loan 3 month U.S. LIBOR + 2.000% 4.0435% 9/6/24 (b)(c) | 1,960,000 | 1,947,260 | |
| Tronox Finance LLC Tranche B, term loan 3 month U.S. LIBOR + 2.750% 4.8173% 9/22/24 (b)(c) | 2,898,946 | 2,896,366 | |
| W. R. Grace & Co.-Conn.: | |||
| Tranche B 1LN, term loan 3 month U.S. LIBOR + 1.750% 3.8544% 4/3/25 (b)(c) | 753,172 | 754,347 | |
| Tranche B 2LN, term loan 3 month U.S. LIBOR + 1.750% 3.8544% 4/3/25 (b)(c) | 1,291,153 | 1,293,167 | |
| TOTAL CHEMICALS | 40,151,902 | ||
| Consumer Products - 1.2% | |||
| BCPE Empire Holdings, Inc.: | |||
| 1LN, term loan 3 month U.S. LIBOR + 4.000% 6.0435% 6/11/26 (b)(c) | 1,462,025 | 1,441,016 | |
| Tranche DD 1LN, term loan 3 month U.S. LIBOR + 4.000% 6/11/26 (b)(c)(f) | 287,975 | 283,836 | |
| Coty, Inc. Tranche B 1LN, term loan 3 month U.S. LIBOR + 2.250% 4.2921% 4/5/25 (b)(c) | 2,697,682 | 2,608,658 | |
| CSM Bakery Supplies Tranche B 1LN, term loan 3 month U.S. LIBOR + 4.000% 6.29% 7/3/20 (b)(c) | 2,166,183 | 2,014,550 | |
| Edgewell Personal Care Co. Tranche B, term loan 3 month U.S. LIBOR + 3.000% 11/8/26 (b)(c)(d) | 3,375,000 | 3,377,126 | |
| Owens & Minor Distribution, Inc. Tranche B, term loan 3 month U.S. LIBOR + 4.500% 6.6003% 4/30/25 (b)(c) | 4,455,000 | 3,895,363 | |
| Rodan & Fields LLC Tranche B, term loan 3 month U.S. LIBOR + 4.000% 6.0275% 6/15/25 (b)(c) | 1,817,000 | 1,544,450 | |
| Weight Watchers International, Inc. Tranche B, term loan 3 month U.S. LIBOR + 4.750% 6.86% 11/29/24 (b)(c) | 7,735,604 | 7,742,875 | |
| TOTAL CONSUMER PRODUCTS | 22,907,874 | ||
| Containers - 2.0% | |||
| Berlin Packaging, LLC Tranche B 1LN, term loan 3 month U.S. LIBOR + 3.000% 5.1007% 11/7/25 (b)(c) | 7,218,513 | 7,080,495 | |
| Berry Global, Inc.: | |||
| Tranche Q, term loan 3 month U.S. LIBOR + 2.250% 4.299% 10/1/22 (b)(c) | 5,099,973 | 5,121,036 | |
| Tranche U, term loan 3 month U.S. LIBOR + 2.500% 4.549% 7/1/26 (b)(c) | 7,356,563 | 7,388,784 | |
| BWAY Holding Co. Tranche B, term loan 3 month U.S. LIBOR + 3.250% 5.5895% 4/3/24 (b)(c) | 1,466,250 | 1,434,080 | |
| Charter Nex U.S., Inc.: | |||
| 1LN, term loan 3 month U.S. LIBOR + 3.500% 5.5435% 5/16/24 (b)(c) | 1,187,025 | 1,185,292 | |
| Tranche B 1LN, term loan 3 month U.S. LIBOR + 3.000% 5.0435% 5/16/24 (b)(c) | 1,324,513 | 1,310,446 | |
| Consolidated Container Co. Tranche B 1LN, term loan 3 month U.S. LIBOR + 2.750% 4.7935% 5/22/24 (b)(c) | 1,964,948 | 1,952,667 | |
| Hostess Brands LLC Tranche B, term loan 3 month U.S. LIBOR + 2.250% 4.4269% 8/3/22 (b)(c) | 364,251 | 363,993 | |
| Pregis TopCo Corp. 1LN, term loan 3 month U.S. LIBOR + 4.000% 6.2531% 7/31/26 (b)(c) | 1,750,000 | 1,743,438 | |
| Reynolds Group Holdings, Inc. Tranche B, term loan 3 month U.S. LIBOR + 2.750% 4.7935% 2/5/23 (b)(c) | 9,096,858 | 9,108,229 | |
| Tank Holding Corp. Tranche B 1LN, term loan 3 month U.S. LIBOR + 4.000% 6.5164% 3/26/26 (b)(c) | 1,600,000 | 1,598,672 | |
| TOTAL CONTAINERS | 38,287,132 | ||
| Diversified Financial Services - 3.6% | |||
| AlixPartners LLP Tranche B, term loan 3 month U.S. LIBOR + 2.750% 4.7935% 4/4/24 (b)(c) | 2,897,654 | 2,898,060 | |
| Alpine Finance Merger Sub LLC Tranche B, term loan 3 month U.S. LIBOR + 3.000% 5.0435% 7/12/24 (b)(c) | 997,455 | 992,777 | |
| AssuredPartners, Inc. Tranche B, term loan 3 month U.S. LIBOR + 3.500% 5.5435% 10/22/24 (b)(c) | 997,115 | 991,661 | |
| Avolon TLB Borrower 1 (U.S.) LLC Tranche B3 1LN, term loan 3 month U.S. LIBOR + 1.750% 3.7942% 1/15/25 (b)(c) | 4,838,706 | 4,853,609 | |
| AVSC Holding Corp. Tranche B 1LN, term loan 3 month U.S. LIBOR + 4.500% 9/26/26 (b)(c)(d) | 3,000,000 | 2,940,000 | |
| BCP Renaissance Parent LLC Tranche B, term loan 3 month U.S. LIBOR + 3.500% 5.7555% 10/31/24 (b)(c) | 3,469,825 | 3,307,194 | |
| Cypress Intermediate Holdings, Inc. Tranche B 1LN, term loan 3 month U.S. LIBOR + 2.750% 4.8% 4/27/24 (b)(c) | 1,688,861 | 1,680,113 | |
| Delos Finance SARL Tranche B, term loan 3 month U.S. LIBOR + 1.750% 3.8544% 10/6/23 (b)(c) | 3,068,333 | 3,076,556 | |
| Financial & Risk U.S. Holdings, Inc. Tranche B, term loan 3 month U.S. LIBOR + 3.750% 5.7935% 10/1/25 (b)(c) | 14,520,598 | 14,593,201 | |
| Finco I LLC Tranche B, term loan 3 month U.S. LIBOR + 2.000% 4.0435% 12/27/22 (b)(c) | 1,925,579 | 1,928,949 | |
| Fly Funding II SARL Tranche B, term loan 3 month U.S. LIBOR + 2.000% 4.18% 2/9/23 (b)(c) | 5,428,643 | 5,433,148 | |
| Flying Fortress Holdings, Inc. Tranche B, term loan 3 month U.S. LIBOR + 1.750% 3.8544% 10/30/22 (b)(c) | 2,200,000 | 2,204,884 | |
| Focus Financial Partners LLC Tranche B 1LN, term loan 3 month U.S. LIBOR + 2.500% 4.5435% 7/3/24 (b)(c) | 1,626,137 | 1,631,357 | |
| Greensky Holdings LLC Tranche B, term loan 3 month U.S. LIBOR + 3.250% 5.3125% 3/29/25 (b)(c) | 1,103,101 | 1,097,585 | |
| HarbourVest Partners LLC Tranche B 1LN, term loan 3 month U.S. LIBOR + 2.250% 4.2775% 3/1/25 (b)(c) | 5,150,941 | 5,159,543 | |
| Kingpin Intermediate Holdings LLC Tranche B 1LN, term loan 3 month U.S. LIBOR + 3.500% 5.54% 7/3/24 (b)(c) | 970,150 | 969,345 | |
| NAB Holdings LLC Tranche B, term loan 3 month U.S. LIBOR + 3.000% 5.1044% 6/30/24 (b)(c) | 1,881,744 | 1,874,687 | |
| Ocwen Loan Servicing LLC Tranche B, term loan 3 month U.S. LIBOR + 5.000% 7.0447% 12/5/20 (b)(c) | 2,636,415 | 2,590,277 | |
| Recess Holdings, Inc. Tranche B, term loan 3 month U.S. LIBOR + 3.750% 5.7935% 9/29/24 (b)(c) | 849,820 | 834,948 | |
| TransUnion LLC: | |||
| Tranche B 4LN, term loan 3 month U.S. LIBOR + 2.000% 4.0435% 6/19/25 (b)(c) | 3,456,250 | 3,464,891 | |
| Tranche B, term loan 3 month U.S. LIBOR + 2.000% 4.0435% 4/9/23 (b)(c) | 5,605,565 | 5,621,149 | |
| UFC Holdings LLC Tranche B 1LN, term loan 3 month U.S. LIBOR + 3.250% 5.3% 4/29/26 (b)(c) | 1,630,797 | 1,633,749 | |
| TOTAL DIVERSIFIED FINANCIAL SERVICES | 69,777,683 | ||
| Diversified Media - 0.1% | |||
| Lamar Media Corp. Tranche B, term loan 3 month U.S. LIBOR + 1.750% 3.8125% 3/16/25 (b)(c) | 2,701,350 | 2,709,805 | |
| Energy - 5.5% | |||
| BCP Raptor II LLC Tranche B, term loan 3 month U.S. LIBOR + 4.750% 6.7935% 11/3/25 (b)(c) | 4,987,500 | 4,467,952 | |
| BCP Raptor LLC Tranche B, term loan 3 month U.S. LIBOR + 4.250% 6.2935% 6/22/24 (b)(c) | 7,106,564 | 6,513,166 | |
| Brazos Delaware II LLC Tranche B, term loan 3 month U.S. LIBOR + 4.000% 6.0459% 5/21/25 (b)(c) | 2,750,188 | 2,533,610 | |
| California Resources Corp.: | |||
| Tranche 1LN, term loan 3 month U.S. LIBOR + 10.375% 12.4185% 12/31/21 (b)(c) | 12,435,000 | 10,795,197 | |
| Tranche B, term loan 3 month U.S. LIBOR + 4.750% 6.7935% 12/31/22 (b)(c) | 12,520,000 | 11,090,592 | |
| Citgo Holding, Inc. Tranche B 1LN, term loan 3 month U.S. LIBOR + 7.000% 9.0435% 8/1/23 (b)(c) | 2,285,000 | 2,324,988 | |
| Citgo Petroleum Corp.: | |||
| Tranche B 1LN, term loan 3 month U.S. LIBOR + 5.000% 7.1044% 3/28/24 (b)(c) | 8,706,250 | 8,728,016 | |
| Tranche B, term loan 3 month U.S. LIBOR + 4.500% 6.6044% 7/29/21 (b)(c) | 7,977,004 | 7,992,000 | |
| Consolidated Energy Finance SA Tranche B, term loan 3 month U.S. LIBOR + 2.500% 4.5472% 5/7/25 (b)(c) | 7,900,000 | 7,643,250 | |
| Delek U.S. Holdings, Inc. Tranche B 1LN, term loan 3 month U.S. LIBOR + 2.250% 4.2935% 3/31/25 (b)(c) | 2,129,490 | 2,122,569 | |
| EG America LLC: | |||
| 2LN, term loan 3 month U.S. LIBOR + 8.000% 10.1044% 3/23/26 (b)(c) | 739,117 | 727,106 | |
| Tranche B 1LN, term loan 3 month U.S. LIBOR + 4.000% 6.1044% 2/6/25 (b)(c) | 692,969 | 684,134 | |
| Epic Crude Services LP Tranche B 1LN, term loan 3 month U.S. LIBOR + 5.000% 7.04% 3/1/26 (b)(c) | 5,000,000 | 4,731,250 | |
| Equitrans Midstream Corp. Tranche B, term loan 3 month U.S. LIBOR + 4.500% 6.55% 1/31/24 (b)(c) | 2,625,163 | 2,621,881 | |
| Gavilan Resources LLC Tranche 2LN, term loan 3 month U.S. LIBOR + 6.000% 8.0435% 3/1/24 (b)(c) | 8,225,000 | 3,550,486 | |
| GIP III Stetson I LP Tranche B, term loan 3 month U.S. LIBOR + 4.250% 6.2909% 7/18/25 (b)(c) | 10,259,983 | 9,994,968 | |
| Gulf Finance LLC Tranche B 1LN, term loan 3 month U.S. LIBOR + 5.250% 7.36% 8/25/23 (b)(c) | 3,967,537 | 2,997,990 | |
| Lower Cadence Holdings LLC Tranche B 1LN, term loan 3 month U.S. LIBOR + 4.000% 6.0536% 5/22/26 (b)(c) | 4,738,125 | 4,610,812 | |
| Matador Bidco SARL Tranche B 1LN, term loan 3 month U.S. LIBOR + 4.750% 6/13/26 (b)(c)(d) | 625,000 | 626,044 | |
| Medallion Midland Acquisition Tranche B, term loan 3 month U.S. LIBOR + 3.250% 5.2935% 10/30/24 (b)(c) | 3,629,365 | 3,517,472 | |
| Natgasoline LLC Tranche B, term loan 3 month U.S. LIBOR + 3.500% 5.8125% 11/14/25 (b)(c) | 4,143,688 | 4,133,328 | |
| Terra-Gen Finance Co. LLC Tranche B, term loan 3 month U.S. LIBOR + 4.250% 6.3% 12/9/21 (b)(c) | 3,524,131 | 3,312,683 | |
| TerraForm Power Operating LLC Tranche B, term loan 3 month U.S. LIBOR + 2.000% 4.0435% 11/8/22 (b)(c) | 1,041,450 | 1,042,752 | |
| TOTAL ENERGY | 106,762,246 | ||
| Entertainment/Film - 0.6% | |||
| AMC Entertainment Holdings, Inc. Tranche B 1LN, term loan 3 month U.S. LIBOR + 3.000% 5.23% 4/22/26 (b)(c) | 3,980,000 | 3,993,253 | |
| CDS U.S. Intermediate Holdings, Inc.: | |||
| Tranche B 1LN, term loan 3 month U.S. LIBOR + 3.750% 5.8544% 7/8/22 (b)(c) | 4,574,017 | 4,326,746 | |
| Tranche B 2LN, term loan 3 month U.S. LIBOR + 8.250% 10.3544% 7/8/23 (b)(c) | 760,000 | 690,080 | |
| SMG U.S. Midco 2, Inc. Tranche B 1LN, term loan 3 month U.S. LIBOR + 3.000% 5.0435% 1/23/25 (b)(c) | 2,434,144 | 2,414,379 | |
| TOTAL ENTERTAINMENT/FILM | 11,424,458 | ||
| Environmental - 0.2% | |||
| Environmental Resources Management I Tranche B 1LN, term loan 3 month U.S. LIBOR + 3.750% 5.8544% 7/10/26 (b)(c) | 997,500 | 1,001,241 | |
| Tunnel Hill Partners LP Tranche B 1LN, term loan 3 month U.S. LIBOR + 3.500% 5.5435% 2/8/26 (b)(c) | 1,308,425 | 1,299,436 | |
| WTG Holdings III Corp. Tranche B 1LN, term loan 3 month U.S. LIBOR + 3.000% 5.0435% 12/20/24 (b)(c) | 1,236,103 | 1,239,972 | |
| TOTAL ENVIRONMENTAL | 3,540,649 | ||
| Food & Drug Retail - 2.3% | |||
| Agro Merchants Intermediate Ho Tranche B, term loan 3 month U.S. LIBOR + 3.750% 5.8544% 12/6/24 (b)(c) | 2,870,319 | 2,877,495 | |
| Albertson's LLC Tranche B7 1LN, term loan 3 month U.S. LIBOR + 2.750% 4.7935% 11/17/25 (b)(c) | 894,361 | 899,432 | |
| BI-LO LLC Tranche B, term loan 3 month U.S. LIBOR + 8.000% 10.2179% 5/31/24 (b)(c) | 13,860,000 | 13,193,057 | |
| GOBP Holdings, Inc. Tranche B 1LN, term loan 3 month U.S. LIBOR + 3.250% 5.7594% 10/22/25 (b)(c) | 2,356,275 | 2,367,326 | |
| JBS U.S.A. Lux SA Tranche B 1LN, term loan 3 month U.S. LIBOR + 2.500% 4.5435% 5/1/26 (b)(c) | 8,955,000 | 8,992,342 | |
| JP Intermediate B LLC Tranche B, term loan 3 month U.S. LIBOR + 5.500% 7.7555% 11/20/25 (b)(c) | 1,751,750 | 1,475,849 | |
| Lannett Co., Inc.: | |||
| Tranche B, term loan 3 month U.S. LIBOR + 5.000% 7.0435% 11/25/20 (b)(c) | 119,024 | 117,932 | |
| Tranche B, term loan 3 month U.S. LIBOR + 5.375% 7.4185% 11/25/22 (b)(c) | 13,321,456 | 12,981,759 | |
| RPI Finance Trust Tranche B 6LN, term loan 3 month U.S. LIBOR + 2.000% 4.0435% 3/27/23 (b)(c) | 2,700,297 | 2,713,799 | |
| TOTAL FOOD & DRUG RETAIL | 45,618,991 | ||
| Food/Beverage/Tobacco - 2.0% | |||
| 8th Avenue Food & Provisions, Inc.: | |||
| 2LN, term loan 3 month U.S. LIBOR + 7.750% 9.7921% 10/1/26 (b)(c) | 410,000 | 404,875 | |
| Tranche B 1LN, term loan 3 month U.S. LIBOR + 3.750% 5.7921% 10/1/25 (b)(c) | 1,191,000 | 1,192,989 | |
| Chobani LLC Tranche B, term loan 3 month U.S. LIBOR + 3.500% 5.5435% 10/7/23 (b)(c) | 8,168,562 | 8,092,023 | |
| Eg Finco Ltd. Tranche B, term loan 3 month U.S. LIBOR + 4.000% 6.1044% 2/6/25 (b)(c) | 1,423,325 | 1,405,178 | |
| Post Holdings, Inc. Tranche B, term loan 3 month U.S. LIBOR + 2.000% 4.04% 5/24/24 (b)(c) | 5,618,981 | 5,631,624 | |
| Saffron Borrowco LLC Tranche B 1LN, term loan 3 month U.S. LIBOR + 6.750% 8.7935% 6/20/25 (b)(c) | 1,246,875 | 1,129,457 | |
| Sage Borrowco LLC Tranche B 1LN, term loan 3 month U.S. LIBOR + 4.750% 6.7935% 6/20/26 (b)(c) | 4,239,375 | 4,252,644 | |
| Shearer's Foods, Inc.: | |||
| Tranche 2LN, term loan 3 month U.S. LIBOR + 6.750% 8.7935% 6/30/22 (b)(c) | 4,441,187 | 4,407,878 | |
| Tranche B 1LN, term loan 3 month U.S. LIBOR + 4.250% 6.2935% 6/30/21 (b)(c) | 3,342,393 | 3,330,895 | |
| U.S. Foods, Inc.: | |||
| 1LN, term loan 3 month U.S. LIBOR + 2.000% 4.05% 8/15/26 (b)(c) | 4,625,000 | 4,639,476 | |
| Tranche B, term loan 3 month U.S. LIBOR + 2.000% 4.0435% 6/27/23 (b)(c) | 2,875,141 | 2,884,428 | |
| U.S. Salt LLC Tranche B 1LN, term loan 3 month U.S. LIBOR + 4.750% 6.7935% 1/16/26 (b)(c)(e) | 1,333,300 | 1,338,300 | |
| TOTAL FOOD/BEVERAGE/TOBACCO | 38,709,767 | ||
| Gaming - 5.8% | |||
| Affinity Gaming LLC Tranche B, term loan 3 month U.S. LIBOR + 3.250% 5.2935% 7/1/23 (b)(c) | 1,860,549 | 1,799,151 | |
| AP Gaming I LLC Tranche B, term loan 3 month U.S. LIBOR + 3.500% 5.5435% 2/15/24 (b)(c) | 2,241,951 | 2,225,831 | |
| Aristocrat Technologies, Inc. Tranche B 3LN, term loan 3 month U.S. LIBOR + 1.750% 4.0276% 10/19/24 (b)(c) | 5,217,678 | 5,231,922 | |
| Boyd Gaming Corp. Tranche B 1LN, term loan 3 month U.S. LIBOR + 2.250% 4.1661% 9/15/23 (b)(c) | 2,510,547 | 2,516,547 | |
| Caesars Resort Collection LLC Tranche B 1LN, term loan 3 month U.S. LIBOR + 2.750% 4.7935% 12/22/24 (b)(c) | 23,712,102 | 23,546,117 | |
| CityCenter Holdings LLC Tranche B, term loan 3 month U.S. LIBOR + 2.250% 4.2935% 4/18/24 (b)(c) | 5,393,740 | 5,402,154 | |
| Eldorado Resorts, Inc. Tranche B, term loan 3 month U.S. LIBOR + 2.000% 4.3125% 4/17/24 (b)(c) | 3,128,087 | 3,121,581 | |
| Gaming VC Holdings SA Tranche B2 1LN, term loan 3 month U.S. LIBOR + 2.250% 4.4462% 3/15/24 (b)(c) | 4,021,250 | 4,022,497 | |
| Gateway Casinos & Entertainment Ltd. Tranche B 1LN, term loan 3 month U.S. LIBOR + 3.000% 5.1044% 3/13/25 (b)(c) | 2,896,994 | 2,855,364 | |
| Golden Entertainment, Inc. Tranche B, term loan 3 month U.S. LIBOR + 3.000% 5.06% 10/20/24 (b)(c) | 8,663,123 | 8,684,781 | |
| Golden Nugget, Inc. Tranche B 1LN, term loan 3 month U.S. LIBOR + 2.750% 4.7995% 10/4/23 (b)(c) | 13,994,392 | 13,969,622 | |
| Mohegan Tribal Gaming Authority Tranche B, term loan 3 month U.S. LIBOR + 4.000% 6.0435% 10/14/23 (b)(c) | 2,368,046 | 2,188,146 | |
| PCI Gaming Authority 1LN, term loan 3 month U.S. LIBOR + 3.000% 5.0435% 5/29/26 (b)(c) | 2,882,775 | 2,897,189 | |
| Penn National Gaming, Inc. Tranche B, term loan 3 month U.S. LIBOR + 2.250% 4.2935% 10/15/25 (b)(c) | 3,623,373 | 3,638,591 | |
| Scientific Games Corp. Tranche B 5LN, term loan 3 month U.S. LIBOR + 2.750% 4.8758% 8/14/24 (b)(c) | 9,194,413 | 9,108,261 | |
| Stars Group Holdings BV Tranche B, term loan 3 month U.S. LIBOR + 3.500% 5.6044% 7/10/25 (b)(c) | 12,449,911 | 12,496,599 | |
| Station Casinos LLC Tranche B, term loan 3 month U.S. LIBOR + 2.500% 4.55% 6/8/23 (b)(c) | 9,127,639 | 9,157,486 | |
| TOTAL GAMING | 112,861,839 | ||
| Healthcare - 4.4% | |||
| Aldevron LLC 1LN, term loan 3 month U.S. LIBOR + 4.250% 9/20/26 (b)(c)(d) | 5,555,000 | 5,568,888 | |
| American Renal Holdings, Inc. Tranche B, term loan 3 month U.S. LIBOR + 5.500% 7.0435% 6/22/24 (b)(c) | 4,210,954 | 4,092,542 | |
| Catalent Pharma Solutions Tranche B, term loan 3 month U.S. LIBOR + 2.250% 4.2935% 5/9/26 (b)(c) | 1,990,000 | 1,994,358 | |
| HCA Holdings, Inc.: | |||
| Tranche B 10LN, term loan 3 month U.S. LIBOR + 2.000% 4.0435% 3/13/25 (b)(c) | 10,835,000 | 10,860,787 | |
| Tranche B 11LN, term loan 3 month U.S. LIBOR + 1.750% 3.7935% 3/18/23 (b)(c) | 2,780,707 | 2,787,325 | |
| Innoviva, Inc. Tranche B, term loan 3 month U.S. LIBOR + 4.500% 6.6515% 8/18/22 (b)(c)(e) | 154,275 | 151,190 | |
| MED ParentCo LP: | |||
| 1LN, term loan 3 month U.S. LIBOR + 4.250% 6.2935% 8/31/26 (b)(c) | 1,676,397 | 1,660,052 | |
| 2LN, term loan 3 month U.S. LIBOR + 8.250% 8/30/27 (b)(c)(d) | 1,310,000 | 1,308,363 | |
| Tranche DD 1LN, term loan 3 month U.S. LIBOR + 4.250% 8/31/26 (b)(c)(d)(f) | 418,603 | 414,522 | |
| MPH Acquisition Holdings LLC Tranche B, term loan 3 month U.S. LIBOR + 2.750% 4.8544% 6/7/23 (b)(c) | 628,916 | 598,124 | |
| Ortho-Clinical Diagnostics, Inc. Tranche B 1LN, term loan 3 month U.S. LIBOR + 3.250% 5.563% 6/30/25 (b)(c) | 4,465,423 | 4,312,482 | |
| PAREXEL International Corp. Tranche B, term loan 3 month U.S. LIBOR + 2.750% 4.7935% 9/27/24 (b)(c) | 3,114,481 | 2,952,653 | |
| RegionalCare Hospital Partners Holdings, Inc. Tranche B, term loan 3 month U.S. LIBOR + 4.500% 6.5536% 11/16/25 (b)(c) | 6,945,013 | 6,946,124 | |
| Surgery Center Holdings, Inc. Tranche B, term loan 3 month U.S. LIBOR + 3.250% 5.3% 8/31/24 (b)(c) | 1,122,137 | 1,094,926 | |
| Tivity Health, Inc. Tranche B 1LN, term loan 3 month U.S. LIBOR + 5.250% 7.2935% 3/8/26 (b)(c) | 1,861,423 | 1,846,681 | |
| U.S. Anesthesia Partners, Inc. Tranche B, term loan 3 month U.S. LIBOR + 3.000% 5.0435% 6/23/24 (b)(c) | 3,095,866 | 3,006,860 | |
| U.S. Renal Care, Inc. Tranche B 1LN, term loan 3 month U.S. LIBOR + 5.000% 7.0625% 6/13/26 (b)(c) | 7,500,000 | 7,068,750 | |
| Valeant Pharmaceuticals International, Inc.: | |||
| Tranche B 2LN, term loan 3 month U.S. LIBOR + 2.750% 4.7886% 11/27/25 (b)(c) | 4,375,000 | 4,381,563 | |
| Tranche B, term loan 3 month U.S. LIBOR + 3.000% 5.0386% 6/1/25 (b)(c) | 5,348,010 | 5,367,531 | |
| Vizient, Inc. Tranche B 1LN, term loan 3 month U.S. LIBOR + 2.500% 4.5435% 5/6/26 (b)(c) | 964,140 | 967,756 | |
| VVC Holding Corp. Tranche B 1LN, term loan 3 month U.S. LIBOR + 4.500% 6.681% 2/11/26 (b)(c) | 13,930,000 | 13,877,763 | |
| Wink Holdco, Inc. Tranche B, term loan 3 month U.S. LIBOR + 3.000% 5.0435% 12/1/24 (b)(c) | 3,676,951 | 3,610,324 | |
| TOTAL HEALTHCARE | 84,869,564 | ||
| Homebuilders/Real Estate - 1.7% | |||
| DTZ U.S. Borrower LLC Tranche B, term loan 3 month U.S. LIBOR + 3.250% 5.2935% 8/21/25 (b)(c) | 9,405,000 | 9,409,703 | |
| Forest City Enterprises LP Tranche B, term loan 3 month U.S. LIBOR + 4.000% 6.0435% 12/7/25 (b)(c) | 1,714,538 | 1,725,253 | |
| Lightstone Holdco LLC: | |||
| Tranche B 1LN, term loan 3 month U.S. LIBOR + 3.750% 5.7935% 1/30/24 (b)(c) | 4,512,428 | 4,319,927 | |
| Tranche C 1LN, term loan 3 month U.S. LIBOR + 3.750% 5.7935% 1/30/24 (b)(c) | 254,508 | 243,651 | |
| MGM Growth Properties Operating Partner LP Tranche B, term loan 3 month U.S. LIBOR + 2.000% 4.0435% 3/23/25 (b)(c) | 4,205,873 | 4,212,308 | |
| Realogy Group LLC Tranche B, term loan 3 month U.S. LIBOR + 2.250% 4.2959% 2/8/25 (b)(c) | 784,722 | 745,980 | |
| VICI Properties, LLC Tranche B 1LN, term loan 3 month U.S. LIBOR + 2.000% 4.0459% 12/22/24 (b)(c) | 12,500,682 | 12,526,683 | |
| TOTAL HOMEBUILDERS/REAL ESTATE | 33,183,505 | ||
| Hotels - 1.5% | |||
| Aimbridge Acquisition Co., Inc. Tranche B 1LN, term loan 3 month U.S. LIBOR + 3.750% 5.8169% 2/1/26 (b)(c) | 1,999,950 | 1,994,950 | |
| ESH Hospitality, Inc. 1LN, term loan 3 month U.S. LIBOR + 2.000% 4.0434% 9/18/26 (b)(c) | 1,510,699 | 1,516,606 | |
| Four Seasons Holdings, Inc. Tranche B, term loan 3 month U.S. LIBOR + 2.000% 4.0435% 11/30/23 (b)(c) | 7,020,869 | 7,051,129 | |
| Hilton Worldwide Finance LLC Tranche B 1LN, term loan 3 month U.S. LIBOR + 1.750% 3.7684% 6/21/26 (b)(c) | 2,792,849 | 2,808,685 | |
| Marriott Ownership Resorts, Inc. Tranche B, term loan 3 month U.S. LIBOR + 2.250% 4.2935% 8/31/25 (b)(c) | 3,850,900 | 3,866,958 | |
| Travelport Finance Luxembourg SARL: | |||
| 1LN, term loan 3 month U.S. LIBOR + 5.000% 7.1044% 5/29/26 (b)(c) | 5,535,000 | 4,989,415 | |
| Tranche B 2LN, term loan 3 month U.S. LIBOR + 9.000% 11.1044% 5/28/27 (b)(c) | 2,250,000 | 1,935,000 | |
| Wyndham Hotels & Resorts, Inc. Tranche B, term loan 3 month U.S. LIBOR + 1.750% 3.7935% 5/30/25 (b)(c) | 5,954,850 | 5,980,515 | |
| TOTAL HOTELS | 30,143,258 | ||
| Insurance - 3.9% | |||
| Acrisure LLC Tranche B, term loan 3 month U.S. LIBOR + 4.250% 6.3544% 11/22/23 (b)(c) | 3,951,613 | 3,926,916 | |
| Alliant Holdings Intermediate LLC: | |||
| Tranche B, term loan 3 month U.S. LIBOR + 3.000% 5.0536% 5/10/25 (b)(c) | 7,771,476 | 7,634,076 | |
| Tranche B-2 1LN, term loan 3 month U.S. LIBOR + 3.250% 5.2886% 5/9/25 (b)(c) | 997,500 | 988,353 | |
| AmWINS Group, Inc. Tranche B 1LN, term loan 3 month U.S. LIBOR + 2.750% 4.7962% 1/25/24 (b)(c) | 4,786,036 | 4,784,552 | |
| Asurion LLC: | |||
| Tranche B 6LN, term loan 3 month U.S. LIBOR + 3.000% 5.0435% 11/3/23 (b)(c) | 6,135,345 | 6,157,371 | |
| Tranche B 7LN, term loan 3 month U.S. LIBOR + 3.000% 5.0435% 11/3/24 (b)(c) | 6,912,500 | 6,933,652 | |
| Tranche B, term loan: | |||
| 3 month U.S. LIBOR + 3.000% 5.0435% 8/4/22 (b)(c) | 10,039,491 | 10,075,332 | |
| 3 month U.S. LIBOR + 6.500% 8.5435% 8/4/25 (b)(c) | 14,390,000 | 14,613,045 | |
| HUB International Ltd. Tranche B, term loan 3 month U.S. LIBOR + 3.000% 5.2663% 4/25/25 (b)(c) | 11,862,238 | 11,715,621 | |
| USI, Inc. Tranche B, term loan 3 month U.S. LIBOR + 3.000% 5.1044% 5/16/24 (b)(c) | 9,968,599 | 9,796,242 | |
| TOTAL INSURANCE | 76,625,160 | ||
| Leisure - 3.2% | |||
| Alterra Mountain Co. Tranche B 1LN, term loan 3 month U.S. LIBOR + 3.000% 5.0435% 7/31/24 (b)(c) | 3,897,902 | 3,902,774 | |
| Callaway Golf Co. Tranche B, term loan 3 month U.S. LIBOR + 3.500% 6.5421% 1/4/26 (b)(c) | 2,774,188 | 2,806,562 | |
| Crown Finance U.S., Inc. Tranche B 1LN, term loan: | |||
| 3 month U.S. LIBOR + 2.250% 4.2935% 2/28/25 (b)(c) | 7,524,547 | 7,470,972 | |
| 3 month U.S. LIBOR + 2.500% 9/20/26 (b)(c)(d) | 2,375,000 | 2,368,065 | |
| Delta 2 SARL Tranche B, term loan 3 month U.S. LIBOR + 2.500% 4.5435% 2/1/24 (b)(c) | 16,554,747 | 16,318,842 | |
| Equinox Holdings, Inc.: | |||
| Tranche 2LN, term loan 3 month U.S. LIBOR + 7.000% 9.0435% 9/8/24 (b)(c) | 1,000,000 | 1,002,500 | |
| Tranche B-1, term loan 3 month U.S. LIBOR + 3.000% 5.0435% 3/8/24 (b)(c) | 3,417,724 | 3,416,289 | |
| LTF Merger Sub, Inc. Tranche B, term loan 3 month U.S. LIBOR + 2.750% 4.8741% 6/10/22 (b)(c) | 5,805,961 | 5,802,013 | |
| NASCAR Holdings, Inc. 1LN, term loan 3 month U.S. LIBOR + 2.750% 7/26/26 (b)(c)(d) | 3,500,000 | 3,521,315 | |
| SeaWorld Parks & Entertainment, Inc. Tranche B 5LN, term loan 3 month U.S. LIBOR + 3.000% 5.0435% 3/31/24 (b)(c) | 1,712,436 | 1,706,939 | |
| Seminole Tribe of Florida Tranche B, term loan 3 month U.S. LIBOR + 1.750% 3.7935% 7/6/24 (b)(c) | 3,821,536 | 3,837,472 | |
| SP PF Buyer LLC Tranche B 1LN, term loan 3 month U.S. LIBOR + 4.500% 6.5435% 12/21/25 (b)(c) | 2,985,000 | 2,631,785 | |
| United PF Holdings LLC: | |||
| 1LN, term loan 3 month U.S. LIBOR + 4.500% 6.5435% 6/10/26 (b)(c) | 2,013,703 | 2,003,635 | |
| 2LN, term loan 3 month U.S. LIBOR + 8.500% 10.5435% 6/10/27 (b)(c) | 450,000 | 447,750 | |
| Tranche DD 1LN, term loan 3 month U.S. LIBOR + 4.500% 6.5435% 6/10/26 (b)(c)(f) | 276,250 | 274,869 | |
| Varsity Brands Holding Co., Inc. Tranche B 1LN, term loan 3 month U.S. LIBOR + 3.500% 5.5435% 12/15/24 (b)(c) | 4,172,593 | 4,032,811 | |
| TOTAL LEISURE | 61,544,593 | ||
| Metals/Mining - 0.3% | |||
| American Rock Salt Co. LLC Tranche B, term loan 3 month U.S. LIBOR + 3.750% 5.7935% 3/21/25 (b)(c) | 3,250,990 | 3,244,910 | |
| Murray Energy Corp. Tranche B 2LN, term loan 3 month U.S. LIBOR + 7.250% 9.3544% 10/17/22 (b)(c) | 9,297,978 | 3,491,391 | |
| TOTAL METALS/MINING | 6,736,301 | ||
| Paper - 0.6% | |||
| Clearwater Paper Corp. Tranche B 1LN, term loan 3 month U.S. LIBOR + 3.250% 5.3125% 7/26/26 (b)(c) | 1,250,000 | 1,253,125 | |
| Flex Acquisition Co., Inc.: | |||
| Tranche B 1LN, term loan 3 month U.S. LIBOR + 3.000% 5.3189% 12/29/23 (b)(c) | 5,071,912 | 4,877,911 | |
| Tranche B 1LN, term loan 3 month U.S. LIBOR + 3.250% 5.5689% 6/29/25 (b)(c) | 5,381,851 | 5,174,972 | |
| TOTAL PAPER | 11,306,008 | ||
| Publishing/Printing - 1.2% | |||
| Cengage Learning, Inc. Tranche B, term loan 3 month U.S. LIBOR + 4.250% 6.2935% 6/7/23 (b)(c) | 6,590,123 | 6,222,196 | |
| Getty Images, Inc. Tranche B 1LN, term loan 3 month U.S. LIBOR + 4.500% 6.5625% 2/19/26 (b)(c) | 1,985,000 | 1,975,909 | |
| Harland Clarke Holdings Corp. Tranche B 7LN, term loan 3 month U.S. LIBOR + 4.750% 6.8544% 11/3/23 (b)(c) | 4,293,026 | 3,337,828 | |
| Learning Care Group (U.S.) No 2 Tranche B 1LN, term loan 3 month U.S. LIBOR + 3.250% 5.4584% 3/13/25 (b)(c) | 3,334,225 | 3,318,587 | |
| Proquest LLC Tranche B, term loan 3 month U.S. LIBOR + 3.250% 5.2935% 10/24/21 (b)(c) | 3,288,355 | 3,286,316 | |
| Springer Science+Business Media Deutschland GmbH Tranche B 13LN, term loan 3 month U.S. LIBOR + 3.500% 5.5435% 8/24/22 (b)(c) | 5,329,233 | 5,331,258 | |
| TOTAL PUBLISHING/PRINTING | 23,472,094 | ||
| Restaurants - 1.5% | |||
| Burger King Worldwide, Inc. Tranche B, term loan 3 month U.S. LIBOR + 2.250% 4.2935% 2/17/24 (b)(c) | 11,383,389 | 11,417,539 | |
| CEC Entertainment, Inc. Tranche B 1LN, term loan 3 month U.S. LIBOR + 6.500% 8.5435% 8/30/26 (b)(c) | 2,625,000 | 2,565,938 | |
| Del Frisco's Restaurant Group, Inc. Tranche B 1LN, term loan 3 month U.S. LIBOR + 5.500% 7.6062% 12/31/19 (b)(c) | 3,215,000 | 3,215,000 | |
| KFC Holding Co. Tranche B, term loan 3 month U.S. LIBOR + 1.750% 3.7909% 4/3/25 (b)(c) | 2,183,117 | 2,184,929 | |
| PFC Acquisition Corp. Tranche B 1LN, term loan 3 month U.S. LIBOR + 6.500% 8.6998% 3/1/26 (b)(c) | 3,606,875 | 3,047,809 | |
| Red Lobster Hospitality LLC Tranche B, term loan 3 month U.S. LIBOR + 5.250% 7.2935% 7/28/21 (b)(c) | 3,425,766 | 3,391,509 | |
| Whatabrands LLC Tranche B 1LN, term loan 3 month U.S. LIBOR + 3.250% 5.5156% 8/2/26 (b)(c) | 4,010,000 | 4,025,559 | |
| TOTAL RESTAURANTS | 29,848,283 | ||
| Services - 5.5% | |||
| Acosta, Inc. Tranche B, term loan 3 month U.S. LIBOR + 3.250% 7.25% 9/26/21 (b)(c) | 1,268,413 | 382,503 | |
| Almonde, Inc.: | |||
| Tranche 2LN, term loan 3 month U.S. LIBOR + 7.250% 9.4463% 6/13/25 (b)(c) | 7,010,000 | 6,681,441 | |
| Tranche B 1LN, term loan 3 month U.S. LIBOR + 3.500% 5.6963% 6/13/24 (b)(c) | 10,776,010 | 10,474,497 | |
| Ancestry.Com Operations, Inc. Tranche B 1LN, term loan 3 month U.S. LIBOR + 3.750% 5.8% 10/19/23 (b)(c) | 4,096,224 | 4,041,621 | |
| Aramark Services, Inc. Tranche B 3LN, term loan 3 month U.S. LIBOR + 1.750% 3.7935% 3/11/25 (b)(c) | 6,711,300 | 6,714,119 | |
| BidFair MergeRight, Inc. 1LN, term loan 3 month U.S. LIBOR + 5.500% 1/23/27 (b)(c)(d) | 3,000,000 | 2,964,390 | |
| Brand Energy & Infrastructure Services, Inc. Tranche B, term loan 3 month U.S. LIBOR + 4.250% 6.5142% 6/21/24 (b)(c) | 5,851,240 | 5,704,959 | |
| Bright Horizons Family Solutions Tranche B, term loan 3 month U.S. LIBOR + 1.750% 3.7935% 11/7/23 (b)(c) | 1,710,910 | 1,710,910 | |
| Cast & Crew Payroll LLC Tranche B 1LN, term loan 3 month U.S. LIBOR + 4.000% 6.05% 2/7/26 (b)(c) | 2,114,375 | 2,128,245 | |
| Ensemble RCM LLC 1LN, term loan 3 month U.S. LIBOR + 3.750% 6.0031% 8/1/26 (b)(c) | 2,750,000 | 2,747,718 | |
| Filtration Group Corp. Tranche B, term loan 3 month U.S. LIBOR + 3.000% 5.0435% 3/29/25 (b)(c) | 2,274,714 | 2,279,173 | |
| Fleet U.S. Bidco, Inc. Tranche B 1LN, term loan 3 month U.S. LIBOR + 3.250% 9/24/26 (b)(c)(d) | 1,500,000 | 1,505,625 | |
| GEMS MENASA Cayman Ltd. Tranche B 1LN, term loan 3 month U.S. LIBOR + 5.000% 7.0435% 7/30/26 (b)(c) | 4,366,563 | 4,339,271 | |
| Ion Trading Finance Ltd. Tranche B 1LN, term loan 3 month U.S. LIBOR + 4.000% 6.0644% 11/21/24 (b)(c) | 6,877,500 | 6,533,625 | |
| KAR Auction Services, Inc. Tranche B 1LN, term loan 3 month U.S. LIBOR + 2.250% 4.3125% 9/13/26 (b)(c) | 3,105,000 | 3,116,644 | |
| KUEHG Corp.: | |||
| Tranche B 2LN, term loan 3 month U.S. LIBOR + 8.250% 10.3544% 8/22/25 (b)(c) | 1,000,000 | 993,130 | |
| Tranche B, term loan 3 month U.S. LIBOR + 3.750% 5.8544% 2/21/25 (b)(c) | 6,982,624 | 6,968,100 | |
| Lineage Logistics Holdings, LLC. Tranche B, term loan 3 month U.S. LIBOR + 3.000% 5.0435% 2/27/25 (b)(c) | 14,838,993 | 14,838,993 | |
| Spin Holdco, Inc. Tranche B, term loan 3 month U.S. LIBOR + 3.250% 5.5723% 11/14/22 (b)(c) | 7,854,957 | 7,717,496 | |
| SuperMoose Borrower LLC Tranche B 1LN, term loan 3 month U.S. LIBOR + 3.750% 5.7935% 8/29/25 (b)(c) | 3,622,625 | 3,372,048 | |
| The GEO Group, Inc. Tranche B 1LN, term loan 3 month U.S. LIBOR + 2.000% 4.05% 3/23/24 (b)(c) | 867,397 | 773,432 | |
| Thomson Reuters IP&S Tranche B, term loan 3 month U.S. LIBOR + 3.250% 5.2935% 10/3/23 (b)(c) | 1,273,337 | 1,280,238 | |
| TMK Hawk Parent Corp. Tranche B, term loan 3 month U.S. LIBOR + 3.500% 5.5692% 9/26/24 (b)(c) | 1,504,464 | 1,249,337 | |
| WASH Multifamily Acquisition, Inc.: | |||
| 2LN, term loan 3 month U.S. LIBOR + 7.000% 9.0435% 5/15/23 (b)(c) | 96,132 | 93,409 | |
| Tranche B 1LN, term loan: | |||
| 3 month U.S. LIBOR + 3.250% 5.2935% 5/14/22 (b)(c) | 5,196,527 | 5,112,083 | |
| 3 month U.S. LIBOR + 3.250% 5.2935% 5/14/22 (b)(c) | 893,169 | 878,655 | |
| Tranche B 2LN, term loan 3 month U.S. LIBOR + 7.000% 9.0435% 5/14/23 (b)(c) | 548,868 | 533,318 | |
| WaterBridge Operating LLC Tranche B 1LN, term loan 3 month U.S. LIBOR + 5.750% 7.834% 6/21/26 (b)(c) | 3,000,000 | 2,891,250 | |
| TOTAL SERVICES | 108,026,230 | ||
| Steel - 0.2% | |||
| Advanced Drainage Systems, Inc. Tranche B 1LN, term loan 3 month U.S. LIBOR + 2.250% 7/31/26 (b)(c)(d) | 1,750,000 | 1,756,563 | |
| JMC Steel Group, Inc. Tranche B, term loan 3 month U.S. LIBOR + 2.250% 4.3036% 6/14/21 (b)(c) | 2,183,551 | 2,181,739 | |
| TOTAL STEEL | 3,938,302 | ||
| Super Retail - 4.7% | |||
| Academy Ltd. Tranche B, term loan 3 month U.S. LIBOR + 4.000% 6.1003% 7/2/22 (b)(c) | 5,351,363 | 3,726,850 | |
| Bass Pro Shops LLC. Tranche B, term loan 3 month U.S. LIBOR + 5.000% 7.0435% 9/25/24 (b)(c) | 52,450,154 | 50,430,812 | |
| BJ's Wholesale Club, Inc. Tranche B 1LN, term loan 3 month U.S. LIBOR + 2.750% 4.7859% 2/3/24 (b)(c) | 11,611,513 | 11,641,703 | |
| Burlington Coat Factory Warehouse Corp. Tranche B, term loan 3 month U.S. LIBOR + 2.000% 4.03% 11/17/24 (b)(c) | 3,280,575 | 3,287,957 | |
| David's Bridal, Inc. term loan: | |||
| 3 month U.S. LIBOR + 7.500% 9.61% 7/18/23 (b)(c) | 115,457 | 98,139 | |
| 3 month U.S. LIBOR + 8.000% 10.11% 1/18/24 (b)(c) | 461,829 | 254,006 | |
| Harbor Freight Tools U.S.A., Inc. Tranche B, term loan 3 month U.S. LIBOR + 2.500% 4.5435% 8/19/23 (b)(c) | 3,668,502 | 3,556,465 | |
| Party City Holdings, Inc. term loan 3 month U.S. LIBOR + 2.500% 4.55% 8/19/22 (b)(c) | 3,628,019 | 3,593,263 | |
| PETCO Animal Supplies, Inc. Tranche B 1LN, term loan 3 month U.S. LIBOR + 3.250% 5.5055% 1/26/23 (b)(c) | 3,486,664 | 2,631,177 | |
| Red Ventures LLC Tranche B, term loan 3 month U.S. LIBOR + 3.000% 5.0435% 11/8/24 (b)(c) | 2,214,408 | 2,220,874 | |
| Sports Authority, Inc. Tranche B, term loan 3 month U.S. LIBOR + 6.000% 0% 11/16/17 (b)(c)(e)(g) | 3,002,818 | 0 | |
| Staples, Inc.: | |||
| Tranche B 1LN, term loan 3 month U.S. LIBOR + 5.000% 7.1228% 4/16/26 (b)(c) | 4,987,500 | 4,913,735 | |
| Tranche B 2LN, term loan 3 month U.S. LIBOR + 4.500% 6.6228% 9/12/24 (b)(c) | 997,500 | 984,203 | |
| The Hillman Group, Inc. Tranche B, term loan 3 month U.S. LIBOR + 4.000% 6.0435% 5/31/25 (b)(c) | 4,281,642 | 4,148,525 | |
| TOTAL SUPER RETAIL | 91,487,709 | ||
| Technology - 14.9% | |||
| Anastasia Parent LLC Tranche B, term loan 3 month U.S. LIBOR + 3.750% 5.7935% 8/10/25 (b)(c) | 5,771,700 | 4,631,789 | |
| Aptean, Inc. 1LN, term loan 3 month U.S. LIBOR + 4.250% 6.3544% 4/23/26 (b)(c) | 1,990,000 | 1,976,329 | |
| ATS Consolidated, Inc. Tranche B 1LN, term loan 3 month U.S. LIBOR + 3.750% 5.7935% 2/28/25 (b)(c) | 2,383,700 | 2,391,638 | |
| Boxer Parent Co., Inc. Tranche B, term loan 3 month U.S. LIBOR + 4.250% 6.2935% 10/2/25 (b)(c) | 6,098,048 | 5,861,993 | |
| Bracket Intermediate Holding Corp. 1LN, term loan 3 month U.S. LIBOR + 4.250% 6.2921% 9/5/25 (b)(c) | 1,975,025 | 1,967,619 | |
| Brave Parent Holdings, Inc. Tranche B 1LN, term loan 3 month U.S. LIBOR + 4.000% 6.2555% 4/19/25 (b)(c) | 1,777,005 | 1,701,482 | |
| Cabot Microelectronics Corp. Tranche B, term loan 3 month U.S. LIBOR + 2.250% 4.3125% 11/15/25 (b)(c) | 4,043,715 | 4,053,824 | |
| Ceridian HCM Holding, Inc. Tranche B, term loan 3 month U.S. LIBOR + 3.000% 5.0536% 4/30/25 (b)(c) | 4,942,519 | 4,951,168 | |
| CommScope, Inc. Tranche B 1LN, term loan 3 month U.S. LIBOR + 3.250% 5.2935% 4/4/26 (b)(c) | 10,660,000 | 10,612,456 | |
| Compuware Corp. 1LN, term loan 3 month U.S. LIBOR + 4.000% 6.0435% 8/23/25 (b)(c) | 3,025,903 | 3,034,739 | |
| Cvent, Inc. Tranche B, term loan 3 month U.S. LIBOR + 3.750% 5.7935% 11/29/24 (b)(c) | 2,952,525 | 2,911,928 | |
| Datto, Inc. 1LN, term loan 3 month U.S. LIBOR + 4.250% 6.2935% 4/2/26 (b)(c) | 1,995,000 | 2,009,963 | |
| DCert Buyer, Inc. 1LN, term loan 3 month U.S. LIBOR + 4.250% 8/8/26 (b)(c)(d) | 7,000,000 | 6,973,750 | |
| Dell International LLC Tranche B 1LN, term loan 3 month U.S. LIBOR + 2.000% 4.05% 9/19/25 (b)(c) | 4,375,000 | 4,394,163 | |
| DG Investment Intermediate Holdings, Inc.: | |||
| Tranche B 1LN, term loan 3 month U.S. LIBOR + 3.000% 5.0435% 2/1/25 (b)(c) | 1,556,950 | 1,525,811 | |
| Tranche B 2LN, term loan 3 month U.S. LIBOR + 6.750% 8.7935% 2/1/26 (b)(c)(e) | 600,000 | 576,000 | |
| Digicert Holdings, Inc. Tranche B, term loan 3 month U.S. LIBOR + 4.000% 6.0435% 10/31/24 (b)(c) | 7,344,574 | 7,326,213 | |
| Dynatrace LLC Tranche B 1LN, term loan 3 month U.S. LIBOR + 2.750% 4.8945% 8/23/25 (b)(c) | 2,108,778 | 2,115,801 | |
| EagleView Technology Corp. Tranche B 1LN, term loan 3 month U.S. LIBOR + 3.500% 5.5435% 8/14/25 (b)(c) | 828,451 | 799,456 | |
| EIG Investors Corp. Tranche B, term loan 3 month U.S. LIBOR + 3.750% 5.8822% 2/9/23 (b)(c) | 4,243,959 | 4,149,955 | |
| Emerald TopCo, Inc. 1LN, term loan 3 month U.S. LIBOR + 3.500% 5.5435% 7/22/26 (b)(c) | 2,500,000 | 2,491,675 | |
| Epicor Software Corp. Tranche B, term loan 3 month U.S. LIBOR + 3.250% 5.3% 6/1/22 (b)(c) | 5,108,927 | 5,108,109 | |
| EPV Merger Sub, Inc.: | |||
| Tranche 2LN, term loan 3 month U.S. LIBOR + 7.250% 9.2935% 3/8/26 (b)(c) | 545,000 | 525,925 | |
| Tranche B 1LN, term loan 3 month U.S. LIBOR + 3.250% 5.2935% 3/8/25 (b)(c) | 3,476,000 | 3,380,410 | |
| EXC Holdings III Corp. Tranche B, term loan: | |||
| 3 month U.S. LIBOR + 3.500% 5.6044% 12/2/24 (b)(c) | 1,554,775 | 1,553,811 | |
| 3 month U.S. LIBOR + 7.500% 9.8319% 12/1/25 (b)(c) | 1,000,000 | 999,060 | |
| Go Daddy Operating Co. LLC Tranche B, term loan 3 month U.S. LIBOR + 2.000% 4.0435% 2/15/24 (b)(c) | 4,622,769 | 4,627,993 | |
| Hyland Software, Inc.: | |||
| Tranche 2LN, term loan 3 month U.S. LIBOR + 7.000% 9.0435% 7/7/25 (b)(c) | 685,000 | 686,288 | |
| Tranche B 1LN, term loan 3 month U.S. LIBOR + 3.250% 5.2935% 7/1/24 (b)(c) | 2,773,265 | 2,770,492 | |
| II-VI, Inc. Tranche B 1LN, term loan 3 month U.S. LIBOR + 3.500% 5.5365% 9/4/26 (b)(c) | 855,000 | 855,000 | |
| Infor U.S., Inc. Tranche B 6LN, term loan 3 month U.S. LIBOR + 2.750% 4.8544% 2/1/22 (b)(c) | 1,914,656 | 1,916,149 | |
| Kronos, Inc.: | |||
| 2LN, term loan 3 month U.S. LIBOR + 8.250% 10.5031% 11/1/24 (b)(c) | 8,490,000 | 8,606,738 | |
| Tranche B 1LN, term loan 3 month U.S. LIBOR + 3.000% 5.2531% 11/1/23 (b)(c) | 6,791,493 | 6,802,291 | |
| Landesk Group, Inc. term loan: | |||
| 3 month U.S. LIBOR + 4.250% 6.3% 1/20/24 (b)(c) | 7,191,336 | 7,159,910 | |
| 3 month U.S. LIBOR + 9.000% 11.05% 1/20/25 (b)(c) | 2,270,000 | 2,233,113 | |
| MA FinanceCo. LLC: | |||
| Tranche B 2LN, term loan 3 month U.S. LIBOR + 2.250% 4.2935% 11/20/21 (b)(c) | 2,544,549 | 2,539,256 | |
| Tranche B 3LN, term loan: | |||
| 3 month U.S. LIBOR + 2.500% 4.5435% 6/21/24 (b)(c) | 16,066,080 | 15,838,424 | |
| 3 month U.S. LIBOR + 2.500% 4.5435% 6/21/24 (b)(c) | 2,563,256 | 2,526,934 | |
| McAfee LLC Tranche B, term loan: | |||
| 3 month U.S. LIBOR + 3.750% 5.7935% 9/29/24 (b)(c) | 9,336,635 | 9,353,628 | |
| 3 month U.S. LIBOR + 8.500% 10.5435% 9/29/25 (b)(c) | 3,022,727 | 3,047,302 | |
| MH Sub I LLC Tranche B, term loan 3 month U.S. LIBOR + 3.750% 5.7935% 9/15/24 (b)(c) | 1,197,778 | 1,188,231 | |
| NAVEX TopCo, Inc.: | |||
| 2LN, term loan 3 month U.S. LIBOR + 7.000% 9.13% 9/4/26 (b)(c) | 415,000 | 408,775 | |
| Tranche B 1LN, term loan 3 month U.S. LIBOR + 3.250% 5.38% 9/4/25 (b)(c) | 1,618,733 | 1,600,523 | |
| ON Semiconductor Corp. Tranche B 1LN, term loan 3 month U.S. LIBOR + 2.000% 9/19/26 (b)(c)(d) | 2,625,000 | 2,635,841 | |
| Project Alpha Intermediate Holding, Inc. Tranche B 1LN, term loan 3 month U.S. LIBOR + 4.250% 6.56% 4/26/24 (b)(c) | 1,496,250 | 1,494,380 | |
| Project Boost Purchaser LLC 1LN, term loan 3 month U.S. LIBOR + 3.500% 5.5435% 5/30/26 (b)(c) | 2,870,000 | 2,848,475 | |
| Renaissance Holding Corp.: | |||
| Tranche B 1LN, term loan 3 month U.S. LIBOR + 3.250% 5.2935% 5/31/25 (b)(c) | 3,723,907 | 3,648,089 | |
| Tranche B 2LN, term loan 3 month U.S. LIBOR + 7.000% 9.0435% 5/31/26 (b)(c) | 1,820,000 | 1,748,347 | |
| Severin Acquisition LLC Tranche B 1LN, term loan 3 month U.S. LIBOR + 3.250% 5.459% 8/1/25 (b)(c) | 3,468,788 | 3,403,748 | |
| Solera LLC Tranche B, term loan 3 month U.S. LIBOR + 2.750% 4.7935% 3/3/23 (b)(c) | 5,299,094 | 5,270,691 | |
| Sophia L.P. term loan 3 month U.S. LIBOR + 3.250% 5.3544% 9/30/22 (b)(c) | 5,607,946 | 5,606,768 | |
| SS&C Technologies, Inc.: | |||
| Tranche B 3LN, term loan 3 month U.S. LIBOR + 2.250% 4.2935% 4/16/25 (b)(c) | 5,952,538 | 5,967,420 | |
| Tranche B 4LN, term loan 3 month U.S. LIBOR + 2.250% 4.2935% 4/16/25 (b)(c) | 3,931,790 | 3,941,619 | |
| Tranche B 5LN, term loan 3 month U.S. LIBOR + 2.250% 4.2935% 4/16/25 (b)(c) | 8,230,883 | 8,260,020 | |
| Sybil Software LLC. Tranche B, term loan 3 month U.S. LIBOR + 2.250% 4.3544% 9/30/23 (b)(c) | 1,613,019 | 1,621,084 | |
| Syniverse Holdings, Inc. Tranche B, term loan 3 month U.S. LIBOR + 5.000% 7.0275% 3/9/23 (b)(c) | 5,658,158 | 5,316,009 | |
| Tempo Acquisition LLC Tranche B, term loan 3 month U.S. LIBOR + 3.000% 5.0435% 5/1/24 (b)(c) | 7,797,616 | 7,820,385 | |
| TIBCO Software, Inc. Tranche B 1LN, term loan 3 month U.S. LIBOR + 4.000% 6.07% 6/30/26 (b)(c) | 3,001,951 | 3,003,212 | |
| TTM Technologies, Inc. Tranche B, term loan 3 month U.S. LIBOR + 2.500% 4.6003% 9/28/24 (b)(c) | 7,271,671 | 7,267,163 | |
| Uber Technologies, Inc. Tranche B, term loan 3 month U.S. LIBOR + 4.000% 6.0275% 4/4/25 (b)(c) | 7,005,778 | 6,954,706 | |
| Ultimate Software Group, Inc. 1LN, term loan 3 month U.S. LIBOR + 3.750% 5.7935% 5/4/26 (b)(c) | 6,360,000 | 6,391,800 | |
| Veritas U.S., Inc. Tranche B, term loan 3 month U.S. LIBOR + 4.500% 6.5535% 1/27/23 (b)(c) | 3,337,714 | 3,146,830 | |
| Verscend Holding Corp. Tranche B, term loan 3 month U.S. LIBOR + 4.500% 6.5435% 8/27/25 (b)(c) | 8,103,150 | 8,123,408 | |
| Vertafore, Inc.: | |||
| Tranche B 1LN, term loan 3 month U.S. LIBOR + 3.250% 5.2935% 7/2/25 (b)(c) | 9,925,000 | 9,631,022 | |
| Tranche B 2LN, term loan 3 month U.S. LIBOR + 7.250% 9.2935% 7/2/26 (b)(c) | 3,500,000 | 3,432,905 | |
| VFH Parent LLC Tranche B 1LN, term loan 3 month U.S. LIBOR + 3.500% 6.0438% 3/1/26 (b)(c) | 8,606,667 | 8,617,425 | |
| Web.com Group, Inc.: | |||
| 2LN, term loan 3 month U.S. LIBOR + 7.750% 9.7775% 10/11/26 (b)(c) | 1,829,523 | 1,774,638 | |
| Tranche B 1LN, term loan 3 month U.S. LIBOR + 3.750% 5.7775% 10/11/25 (b)(c) | 4,511,461 | 4,432,917 | |
| WEX, Inc. Tranche B, term loan 3 month U.S. LIBOR + 2.250% 4.2935% 5/17/26 (b)(c) | 3,647,041 | 3,663,964 | |
| Zelis Payments Buyer, Inc. Tranche B 1LN, term loan 3 month U.S. LIBOR + 4.750% 6.7935% 9/26/26 (b)(c) | 3,000,000 | 2,973,750 | |
| TOTAL TECHNOLOGY | 289,182,730 | ||
| Telecommunications - 7.2% | |||
| Altice Financing SA Tranche B, term loan: | |||
| 3 month U.S. LIBOR + 2.750% 4.7775% 7/15/25 (b)(c) | 5,394,698 | 5,248,610 | |
| 3 month U.S. LIBOR + 2.750% 4.807% 1/31/26 (b)(c) | 3,438,750 | 3,344,184 | |
| Evo Payments International LLC Tranche B, term loan 3 month U.S. LIBOR + 3.250% 5.31% 12/22/23 (b)(c) | 2,925,450 | 2,933,992 | |
| Frontier Communications Corp. Tranche B 1LN, term loan 3 month U.S. LIBOR + 3.750% 5.8% 6/15/24 (b)(c) | 22,088,452 | 22,017,548 | |
| GTT Communications, Inc. Tranche B, term loan 3 month U.S. LIBOR + 2.750% 4.79% 5/31/25 (b)(c) | 4,443,750 | 3,563,665 | |
| Intelsat Jackson Holdings SA: | |||
| Tranche B, term loan 3 month U.S. LIBOR + 3.750% 5.8036% 11/27/23 (b)(c) | 28,495,000 | 28,557,404 | |
| Tranche B-4, term loan 3 month U.S. LIBOR + 4.500% 6.5536% 1/2/24 (b)(c) | 4,000,000 | 4,043,320 | |
| Tranche B-5, term loan 6.625% 1/2/24 | 6,205,000 | 6,331,024 | |
| Level 3 Financing, Inc. Tranche B, term loan 3 month U.S. LIBOR + 2.250% 4.2935% 2/22/24 (b)(c) | 6,090,000 | 6,098,891 | |
| Onvoy LLC Tranche B 1LN, term loan 3 month U.S. LIBOR + 4.500% 6.5435% 2/10/24 (b)(c) | 2,925,000 | 2,420,438 | |
| Radiate Holdco LLC Tranche B, term loan 3 month U.S. LIBOR + 3.000% 5.0435% 2/1/24 (b)(c) | 8,450,891 | 8,412,439 | |
| Sable International Finance Ltd. Tranche B 4LN, term loan 3 month U.S. LIBOR + 3.250% 5.2935% 2/2/26 (b)(c) | 9,402,667 | 9,435,294 | |
| Sabre Industries, Inc. Tranche B 1LN, term loan 3 month U.S. LIBOR + 4.250% 6.307% 4/15/26 (b)(c) | 2,992,500 | 3,003,722 | |
| SBA Senior Finance II, LLC Tranche B, term loan 3 month U.S. LIBOR + 2.000% 4.05% 4/11/25 (b)(c) | 4,443,750 | 4,443,928 | |
| Securus Technologies, Inc. Tranche B, term loan: | |||
| 3 month U.S. LIBOR + 4.500% 6.5435% 11/1/24 (b)(c) | 4,026,015 | 3,522,763 | |
| 3 month U.S. LIBOR + 8.250% 10.2935% 11/1/25 (b)(c) | 3,000,000 | 2,627,130 | |
| SFR Group SA: | |||
| Tranche B 11LN, term loan 3 month U.S. LIBOR + 2.750% 4.7935% 7/31/25 (b)(c) | 7,209,667 | 7,022,648 | |
| Tranche B 12LN, term loan 3 month U.S. LIBOR + 3.688% 5.715% 1/31/26 (b)(c) | 1,013,993 | 1,005,760 | |
| Tranche B 13LN, term loan 3 month U.S. LIBOR + 4.000% 6.0275% 8/14/26 (b)(c) | 5,955,000 | 5,935,170 | |
| Sprint Communications, Inc.: | |||
| Tranche B 2LN, term loan 3 month U.S. LIBOR + 3.000% 5.0625% 2/2/24 (b)(c) | 3,970,000 | 3,956,343 | |
| Tranche B, term loan 3 month U.S. LIBOR + 2.500% 4.5625% 2/3/24 (b)(c) | 741,149 | 735,360 | |
| Triton Bidco Tranche B 1LN, term loan 3 month U.S. LIBOR + 4.500% 9/23/26 (b)(c)(d) | 3,500,000 | 3,442,565 | |
| Windstream Services LLC 1LN, term loan 3 month U.S. LIBOR + 2.500% 4.55% 2/26/21 (b)(c) | 3,000,000 | 3,000,000 | |
| TOTAL TELECOMMUNICATIONS | 141,102,198 | ||
| Textiles/Apparel - 0.1% | |||
| ABB Optical Group LLC Tranche B, term loan 3 month U.S. LIBOR + 5.000% 7.1678% 6/15/23 (b)(c) | 1,308,015 | 1,236,074 | |
| Transportation Ex Air/Rail - 0.5% | |||
| IBC Capital Ltd.: | |||
| 2LN, term loan 3 month U.S. LIBOR + 7.000% 9.1451% 9/11/24 (b)(c) | 670,000 | 659,950 | |
| Tranche B 1LN, term loan 3 month U.S. LIBOR + 3.750% 5.8951% 9/11/23 (b)(c) | 1,638,361 | 1,626,073 | |
| International Seaways Operating Corp. Tranche B, term loan 3 month U.S. LIBOR + 5.500% 8.05% 6/22/22 (b)(c) | 4,860,687 | 4,860,687 | |
| Navios Maritime Partners LP Tranche B, term loan 3 month U.S. LIBOR + 5.000% 7.14% 9/14/20 (b)(c) | 1,826,206 | 1,814,792 | |
| TOTAL TRANSPORTATION EX AIR/RAIL | 8,961,502 | ||
| Utilities - 3.5% | |||
| Brookfield WEC Holdings, Inc. Tranche B 1LN, term loan 3 month U.S. LIBOR + 3.500% 5.5435% 8/1/25 (b)(c) | 13,028,607 | 13,059,615 | |
| ExGen Renewables IV, LLC Tranche B, term loan 3 month U.S. LIBOR + 3.000% 5.13% 11/28/24 (b)(c) | 3,030,293 | 2,960,233 | |
| Green Energy Partners/Stonewall LLC Tranche B 1LN, term loan 3 month U.S. LIBOR + 5.500% 7.6044% 11/13/21 (b)(c) | 3,971,940 | 3,803,133 | |
| Houston Fuel Oil Terminal Co. Tranche B 1LN, term loan 3 month U.S. LIBOR + 2.750% 4.8% 6/26/25 (b)(c) | 7,900,000 | 7,875,352 | |
| Invenergy Thermal Operating I LLC Tranche B, term loan 3 month U.S. LIBOR + 3.500% 5.5435% 8/28/25 (b)(c) | 3,176,901 | 3,192,786 | |
| Limetree Bay Terminals LLC term loan 3 month U.S. LIBOR + 4.000% 6.0435% 2/15/24 (b)(c) | 3,344,260 | 3,203,333 | |
| LMBE-MC HoldCo II LLC Tranche B, term loan 3 month U.S. LIBOR + 4.000% 6.11% 12/3/25 (b)(c) | 1,883,136 | 1,883,136 | |
| Moxie Patriot LLC Tranche B, term loan 3 month U.S. LIBOR + 5.750% 7.8544% 12/19/20 (b)(c) | 7,168,228 | 6,290,120 | |
| Pike Corp. Tranche B 1LN, term loan 3 month U.S. LIBOR + 3.250% 5.3% 7/24/26 (b)(c) | 3,636,118 | 3,646,226 | |
| Tex Operations Co. LLC Tranche B, term loan 3 month U.S. LIBOR + 2.000% 4.0435% 8/4/23 (b)(c) | 5,721,057 | 5,737,763 | |
| UGI Energy Services LLC Tranche B 1LN, term loan 3 month U.S. LIBOR + 3.750% 5.7935% 8/13/26 (b)(c) | 1,496,250 | 1,505,602 | |
| Vertiv Group Corp. Tranche B, term loan 3 month U.S. LIBOR + 4.000% 6.0435% 11/30/23 (b)(c) | 6,520,468 | 6,194,445 | |
| Vistra Operations Co. LLC Tranche B 3LN, term loan 3 month U.S. LIBOR + 2.000% 4.0359% 12/31/25 (b)(c) | 9,794,400 | 9,820,257 | |
| TOTAL UTILITIES | 69,172,001 | ||
| TOTAL BANK LOAN OBLIGATIONS | |||
| (Cost $1,822,201,537) | 1,787,399,020 | ||
| Nonconvertible Bonds - 3.9% | |||
| Aerospace - 0.2% | |||
| TransDigm, Inc. 6.25% 3/15/26 (h) | 4,000,000 | 4,295,000 | |
| Broadcasting - 0.1% | |||
| Cumulus Media New Holdings, Inc. 6.75% 7/1/26 (h) | 500,000 | 524,375 | |
| iHeartCommunications, Inc.: | |||
| 6.375% 5/1/26 | 142,478 | 153,876 | |
| 8.375% 5/1/27 | 258,242 | 278,901 | |
| TOTAL BROADCASTING | 957,152 | ||
| Chemicals - 0.1% | |||
| OCI NV 6.625% 4/15/23 (h) | 1,000,000 | 1,046,200 | |
| TPC Group, Inc. 10.5% 8/1/24 (h) | 1,195,000 | 1,245,788 | |
| TOTAL CHEMICALS | 2,291,988 | ||
| Containers - 0.4% | |||
| Reynolds Group Issuer, Inc./Reynolds Group Issuer LLC/Reynolds Group Issuer (Luxembourg) SA 3 month U.S. LIBOR + 3.500% 5.8034% 7/15/21 (b)(c)(h) | 5,780,000 | 5,787,225 | |
| Trivium Packaging Finance BV 5.5% 8/15/26 (h) | 1,085,000 | 1,140,552 | |
| TOTAL CONTAINERS | 6,927,777 | ||
| Diversified Financial Services - 0.1% | |||
| EG Global Finance PLC 6.75% 2/7/25 (h) | 1,000,000 | 976,250 | |
| Transocean Poseidon Ltd. 6.875% 2/1/27 (h) | 1,140,000 | 1,185,600 | |
| TOTAL DIVERSIFIED FINANCIAL SERVICES | 2,161,850 | ||
| Energy - 0.5% | |||
| Cheniere Corpus Christi Holdings LLC 7% 6/30/24 | 1,000,000 | 1,148,750 | |
| Consolidated Energy Finance SA: | |||
| 3 month U.S. LIBOR + 3.750% 5.8685% 6/15/22 (b)(c)(h) | 4,500,000 | 4,489,521 | |
| 6.875% 6/15/25 (h) | 1,000,000 | 1,002,500 | |
| Denbury Resources, Inc.: | |||
| 9% 5/15/21 (h) | 730,000 | 677,075 | |
| 9.25% 3/31/22 (h) | 1,455,000 | 1,273,125 | |
| EP Energy LLC/Everest Acquisition Finance, Inc. 7.75% 5/15/26 (h) | 1,435,000 | 1,076,250 | |
| TOTAL ENERGY | 9,667,221 | ||
| Environmental - 0.0% | |||
| Tervita Escrow Corp. 7.625% 12/1/21 (h) | 670,000 | 680,888 | |
| Gaming - 0.4% | |||
| Golden Entertainment, Inc. 7.625% 4/15/26 (h) | 1,500,000 | 1,567,500 | |
| Scientific Games Corp. 5% 10/15/25 (h) | 3,060,000 | 3,157,308 | |
| Stars Group Holdings BV 7% 7/15/26 (h) | 2,000,000 | 2,130,000 | |
| Sugarhouse HSP Gaming Prop Mezz LP/Sugarhouse HSP Gaming Finance Corp. 5.875% 5/15/25 (h) | 1,367,000 | 1,343,078 | |
| TOTAL GAMING | 8,197,886 | ||
| Healthcare - 0.3% | |||
| Tenet Healthcare Corp.: | |||
| 4.625% 7/15/24 | 2,500,000 | 2,569,325 | |
| 5.125% 5/1/25 | 1,000,000 | 1,013,800 | |
| Valeant Pharmaceuticals International, Inc. 5.5% 11/1/25 (h) | 2,515,000 | 2,631,570 | |
| TOTAL HEALTHCARE | 6,214,695 | ||
| Insurance - 0.1% | |||
| HUB International Ltd. 7% 5/1/26 (h) | 1,000,000 | 1,028,750 | |
| Leisure - 0.2% | |||
| Studio City Co. Ltd.: | |||
| 5.875% 11/30/19 (h) | 1,220,000 | 1,212,985 | |
| 7.25% 11/30/21 (h) | 2,000,000 | 2,050,000 | |
| TOTAL LEISURE | 3,262,985 | ||
| Paper - 0.1% | |||
| CommScope Finance LLC: | |||
| 5.5% 3/1/24 (h) | 1,100,000 | 1,131,625 | |
| 6% 3/1/26 (h) | 1,100,000 | 1,138,280 | |
| TOTAL PAPER | 2,269,905 | ||
| Services - 0.1% | |||
| APX Group, Inc. 7.625% 9/1/23 | 490,000 | 436,100 | |
| Brand Energy & Infrastructure Services, Inc. 8.5% 7/15/25 (h) | 2,395,000 | 2,275,250 | |
| TOTAL SERVICES | 2,711,350 | ||
| Super Retail - 0.1% | |||
| Staples, Inc. 10.75% 4/15/27 (h) | 1,250,000 | 1,284,375 | |
| Technology - 0.4% | |||
| Diamond 1 Finance Corp./Diamond 2 Finance Corp. 4.42% 6/15/21 (h) | 3,030,000 | 3,124,159 | |
| NXP BV/NXP Funding LLC 4.125% 6/1/21 (h) | 2,665,000 | 2,734,278 | |
| Uber Technologies, Inc. 7.5% 11/1/23 (h) | 2,000,000 | 2,015,000 | |
| TOTAL TECHNOLOGY | 7,873,437 | ||
| Telecommunications - 0.7% | |||
| Altice Financing SA 7.5% 5/15/26 (h) | 3,095,000 | 3,288,407 | |
| Frontier Communications Corp. 8% 4/1/27 (h) | 5,400,000 | 5,695,326 | |
| SFR Group SA: | |||
| 6.25% 5/15/24 (h) | 1,189,000 | 1,227,048 | |
| 7.375% 5/1/26 (h) | 3,010,000 | 3,227,352 | |
| TOTAL TELECOMMUNICATIONS | 13,438,133 | ||
| Textiles/Apparel - 0.0% | |||
| Eagle Intermediate Global Holding BV 7.5% 5/1/25 (h) | 850,000 | 757,297 | |
| Transportation Ex Air/Rail - 0.1% | |||
| Avolon Holdings Funding Ltd. 5.125% 10/1/23 (h) | 2,255,000 | 2,392,330 | |
| TOTAL NONCONVERTIBLE BONDS | |||
| (Cost $75,110,655) | 76,413,019 | ||
| Shares | Value | ||
| Common Stocks - 0.5% | |||
| Automotive & Auto Parts - 0.0% | |||
| Motors Liquidation Co. GUC Trust (i) | 3,724 | 37,910 | |
| Broadcasting - 0.0% | |||
| Clear Channel Outdoor Holdings, Inc. (i) | 59,243 | 149,292 | |
| iHeartMedia, Inc. (i) | 25,194 | 377,910 | |
| TOTAL BROADCASTING | 527,202 | ||
| Energy - 0.3% | |||
| Expro Holdings U.S., Inc. (e)(i) | 240,349 | 4,085,933 | |
| Expro Holdings U.S., Inc. (e)(h)(i) | 88,205 | 1,499,485 | |
| TOTAL ENERGY | 5,585,418 | ||
| Publishing/Printing - 0.0% | |||
| Cenveo Corp. (e) | 4,167 | 121,510 | |
| Super Retail - 0.0% | |||
| David's Bridal, Inc. (e) | 8,913 | 17,648 | |
| Utilities - 0.2% | |||
| TexGen Power LLC (e)(i) | 85,051 | 3,138,382 | |
| TOTAL COMMON STOCKS | |||
| (Cost $12,292,691) | 9,428,070 | ||
| Other - 0.0% | |||
| Other - 0.0% | |||
| Tribune Co. Claim (e)(i) | |||
| (Cost $45,406) | 45,954 | 45,954 | |
| Money Market Funds - 6.4% | |||
| Fidelity Cash Central Fund 1.96% (j) | |||
| (Cost $123,838,769) | 123,820,160 | 123,844,924 | |
| TOTAL INVESTMENT IN SECURITIES - 102.6% | |||
| (Cost $2,033,489,058) | 1,997,130,987 | ||
| NET OTHER ASSETS (LIABILITIES) - (2.6)% | (50,309,086) | ||
| NET ASSETS - 100% | $1,946,821,901 |
Legend
(a) Remaining maturities of bank loan obligations may be less than the stated maturities shown as a result of contractual or optional prepayments by the borrower. Such prepayments cannot be predicted with certainty.
(b) Coupon rates for floating and adjustable rate securities reflect the rates in effect at period end.
(c) Coupon is indexed to a floating interest rate which may be multiplied by a specified factor and/or subject to caps or floors.
(d) The coupon rate will be determined upon settlement of the loan after period end.
(e) Level 3 security
(f) Position or a portion of the position represents an unfunded loan commitment. At period end, the total principal amount and market value of unfunded commitments totaled $940,328 and $929,998, respectively.
(g) Non-income producing - Security is in default.
(h) Security exempt from registration under Rule 144A of the Securities Act of 1933. These securities may be resold in transactions exempt from registration, normally to qualified institutional buyers. At the end of the period, the value of these securities amounted to $72,311,752 or 3.7% of net assets.
(i) Non-income producing
(j) Affiliated fund that is generally available only to investment companies and other accounts managed by Fidelity Investments. The rate quoted is the annualized seven-day yield of the fund at period end. A complete unaudited listing of the fund's holdings as of its most recent quarter end is available upon request. In addition, each Fidelity Central Fund's financial statements, which are not covered by the Fund's Report of Independent Registered Public Accounting Firm, are available on the SEC's website or upon request.
Affiliated Central Funds
Information regarding fiscal year to date income earned by the Fund from investments in Fidelity Central Funds is as follows:
| Fund | Income earned |
| Fidelity Cash Central Fund | $2,245,080 |
| Total | $2,245,080 |
Amounts in the income column in the above table include any capital gain distributions from underlying funds, which are presented in the corresponding line-item in the Statement of Operations, if applicable.
Investment Valuation
The following is a summary of the inputs used, as of September 30, 2019, involving the Fund's assets and liabilities carried at fair value. The inputs or methodology used for valuing securities may not be an indication of the risk associated with investing in those securities. For more information on valuation inputs, and their aggregation into the levels used below, please refer to the Investment Valuation section in the accompanying Notes to Financial Statements.
| Valuation Inputs at Reporting Date: | ||||
| Description | Total | Level 1 | Level 2 | Level 3 |
| Investments in Securities: | ||||
| Equities: | ||||
| Communication Services | $527,202 | $527,202 | $-- | $-- |
| Consumer Discretionary | 17,648 | -- | -- | 17,648 |
| Energy | 5,585,418 | -- | -- | 5,585,418 |
| Financials | 37,910 | 37,910 | -- | -- |
| Industrials | 121,510 | -- | -- | 121,510 |
| Utilities | 3,138,382 | -- | -- | 3,138,382 |
| Bank Loan Obligations | 1,787,399,020 | -- | 1,783,319,030 | 4,079,990 |
| Corporate Bonds | 76,413,019 | -- | 76,413,019 | -- |
| Other | 45,954 | -- | -- | 45,954 |
| Money Market Funds | 123,844,924 | 123,844,924 | -- | -- |
| Total Investments in Securities: | $1,997,130,987 | $124,410,036 | $1,859,732,049 | $12,988,902 |
Other Information
Distribution of investments by country or territory of incorporation, as a percentage of Total Net Assets, is as follows (Unaudited):
| United States of America | 88.5% |
| Luxembourg | 5.5% |
| Canada | 1.4% |
| Cayman Islands | 1.1% |
| Others (Individually Less Than 1%) | 3.5% |
| 100.0% |
See accompanying notes which are an integral part of the financial statements.
Financial Statements
Statement of Assets and Liabilities
| September 30, 2019 | ||
| Assets | ||
| Investment in securities, at value — See accompanying schedule: Unaffiliated issuers (cost $1,909,650,289) | $1,873,286,063 | |
| Fidelity Central Funds (cost $123,838,769) | 123,844,924 | |
| Total Investment in Securities (cost $2,033,489,058) | $1,997,130,987 | |
| Cash | 1,626,375 | |
| Receivable for investments sold | 10,188,589 | |
| Receivable for fund shares sold | 1,049,242 | |
| Interest receivable | 12,371,067 | |
| Distributions receivable from Fidelity Central Funds | 225,006 | |
| Other receivables | 554,777 | |
| Total assets | 2,023,146,043 | |
| Liabilities | ||
| Payable for investments purchased | $75,561,797 | |
| Payable for fund shares redeemed | 100,059 | |
| Distributions payable | 630,182 | |
| Other payables and accrued expenses | 32,104 | |
| Total liabilities | 76,324,142 | |
| Net Assets | $1,946,821,901 | |
| Net Assets consist of: | ||
| Paid in capital | $1,991,116,339 | |
| Total accumulated earnings (loss) | (44,294,438) | |
| Net Assets, for 19,203,232 shares outstanding | $1,946,821,901 | |
| Net Asset Value, offering price and redemption price per share ($1,946,821,901 ÷ 19,203,232 shares) | $101.38 |
See accompanying notes which are an integral part of the financial statements.
Statement of Operations
| Year ended September 30, 2019 | ||
| Investment Income | ||
| Dividends | $199,615 | |
| Interest | 119,836,780 | |
| Income from Fidelity Central Funds | 2,245,080 | |
| Total income | 122,281,475 | |
| Expenses | ||
| Custodian fees and expenses | $45,761 | |
| Independent directors' fees and expenses | 11,763 | |
| Miscellaneous | 24 | |
| Total expenses before reductions | 57,548 | |
| Expense reductions | (28,245) | |
| Total expenses after reductions | 29,303 | |
| Net investment income (loss) | 122,252,172 | |
| Realized and Unrealized Gain (Loss) | ||
| Net realized gain (loss) on: | ||
| Investment securities: | ||
| Unaffiliated issuers | (6,808,279) | |
| Fidelity Central Funds | 102 | |
| Total net realized gain (loss) | (6,808,177) | |
| Change in net unrealized appreciation (depreciation) on: | ||
| Investment securities: | ||
| Unaffiliated issuers | (33,640,369) | |
| Fidelity Central Funds | (102) | |
| Total change in net unrealized appreciation (depreciation) | (33,640,471) | |
| Net gain (loss) | (40,448,648) | |
| Net increase (decrease) in net assets resulting from operations | $81,803,524 |
See accompanying notes which are an integral part of the financial statements.
Statement of Changes in Net Assets
| Year ended September 30, 2019 | Year ended September 30, 2018 | |
| Increase (Decrease) in Net Assets | ||
| Operations | ||
| Net investment income (loss) | $122,252,172 | $108,427,622 |
| Net realized gain (loss) | (6,808,177) | (2,822,187) |
| Change in net unrealized appreciation (depreciation) | (33,640,471) | 9,369,188 |
| Net increase (decrease) in net assets resulting from operations | 81,803,524 | 114,974,623 |
| Distributions to shareholders | (121,953,549) | – |
| Distributions to shareholders from net investment income | – | (107,324,263) |
| Distributions to shareholders from net realized gain | – | (5,780,280) |
| Total distributions | (121,953,549) | (113,104,543) |
| Affiliated share transactions | ||
| Proceeds from sales of shares | 55,039,774 | 697,577,163 |
| Reinvestment of distributions | 114,264,359 | 106,258,937 |
| Cost of shares redeemed | (478,275,822) | (144,268,596) |
| Net increase (decrease) in net assets resulting from share transactions | (308,971,689) | 659,567,504 |
| Total increase (decrease) in net assets | (349,121,714) | 661,437,584 |
| Net Assets | ||
| Beginning of period | 2,295,943,615 | 1,634,506,031 |
| End of period | $1,946,821,901 | $2,295,943,615 |
| Other Information | ||
| Undistributed net investment income end of period | $1,735,079 | |
| Shares | ||
| Sold | 544,187 | 6,749,302 |
| Issued in reinvestment of distributions | 1,128,026 | 1,029,866 |
| Redeemed | (4,693,420) | (1,398,060) |
| Net increase (decrease) | (3,021,207) | 6,381,108 |
See accompanying notes which are an integral part of the financial statements.
Financial Highlights
Fidelity Floating Rate Central Fund
| Years ended September 30, | 2019 | 2018 | 2017 | 2016 | 2015 |
| Selected Per–Share Data | |||||
| Net asset value, beginning of period | $103.31 | $103.17 | $102.63 | $102.02 | $107.17 |
| Income from Investment Operations | |||||
| Net investment income (loss)A | 6.104 | 5.279 | 5.268 | 5.424 | 5.449 |
| Net realized and unrealized gain (loss) | (1.943) | .401 | .545 | .357 | (5.445) |
| Total from investment operations | 4.161 | 5.680 | 5.813 | 5.781 | .004 |
| Distributions from net investment income | (6.091) | (5.215) | (5.223) | (5.171) | (5.154) |
| Distributions from net realized gain | – | (.325) | (.050) | – | – |
| Total distributions | (6.091) | (5.540) | (5.273) | (5.171) | (5.154) |
| Net asset value, end of period | $101.38 | $103.31 | $103.17 | $102.63 | $102.02 |
| Total ReturnB | 4.20% | 5.65% | 5.77% | 5.95% | (.03)% |
| Ratios to Average Net AssetsC,D | |||||
| Expenses before reductions | –%E | - %E | .06% | - %E | - %E |
| Expenses net of fee waivers, if any | –%E | - %E | .06% | - %E | - %E |
| Expenses net of all reductions | –%E | - %E | .06% | - %E | - %E |
| Net investment income (loss) | 6.01% | 5.12% | 5.09% | 5.45% | 5.15% |
| Supplemental Data | |||||
| Net assets, end of period (000 omitted) | $1,946,822 | $2,295,944 | $1,634,506 | $1,614,419 | $1,597,788 |
| Portfolio turnover rate | 29% | 47% | 78% | 48% | 37%F |
A Calculated based on average shares outstanding during the period.
B Total returns would have been lower if certain expenses had not been reduced during the applicable periods shown.
C Fees and expenses of any underlying Fidelity Central Funds are not included in the Fund's expense ratio. The Fund indirectly bears its proportionate share of the expenses of any underlying Fidelity Central Funds.
D Expense ratios reflect operating expenses of the Fund. Expenses before reductions do not reflect amounts reimbursed by the investment adviser or reductions from expense offset arrangements and do not represent the amount paid by the Fund during periods when reimbursements or reductions occur. Expenses net of fee waivers reflect expenses after reimbursement by the investment adviser but prior to reductions from expense offset arrangements. Expenses net of all reductions represent the net expenses paid by the Fund.
E Amount represents less than .005%.
F Portfolio turnover rate excludes securities received or delivered in-kind.
See accompanying notes which are an integral part of the financial statements.
Notes to Financial Statements
For the period ended September 30, 2019
1. Organization.
Fidelity Floating Rate Central Fund (the Fund) is a fund of Fidelity Central Investment Portfolios LLC (the LLC) and is authorized to issue an unlimited number of shares. Shares of the Fund are only offered to other investment companies and accounts managed by Fidelity Management & Research Company (FMR), or its affiliates (the Investing Funds). The LLC is registered under the Investment Company Act of 1940, as amended (the 1940 Act), as an open-end management investment company organized as a Delaware Limited Liability Company.
2. Investments in Fidelity Central Funds.
The Fund invests in Fidelity Central Funds, which are open-end investment companies generally available only to other investment companies and accounts managed by the investment adviser and its affiliates. The Fund's Schedule of Investments lists each of the Fidelity Central Funds held as of period end, if any, as an investment of the Fund, but does not include the underlying holdings of each Fidelity Central Fund. As an Investing Fund, the Fund indirectly bears its proportionate share of the expenses of the underlying Fidelity Central Funds.
The Money Market Central Funds seek preservation of capital and current income and are managed by Fidelity Investments Money Management, Inc. (FIMM), an affiliate of the investment adviser. Annualized expenses of the Money Market Central Funds as of their most recent shareholder report date ranged from less than .005% to .01%.
A complete unaudited list of holdings for each Fidelity Central Fund is available upon request or at the Securities and Exchange Commission (the SEC) website at www.sec.gov. In addition, the financial statements of the Fidelity Central Funds, which are not covered by the Fund's Report of Independent Registered Public Accounting Firm, are available on the SEC website or upon request.
3. Significant Accounting Policies.
The Fund is an investment company and applies the accounting and reporting guidance of the Financial Accounting Standards Board (FASB) Accounting Standards Codification Topic 946 Financial Services – Investments Companies. The financial statements have been prepared in conformity with accounting principles generally accepted in the United States of America (GAAP), which require management to make certain estimates and assumptions at the date of the financial statements. Actual results could differ from those estimates. Subsequent events, if any, through the date that the financial statements were issued have been evaluated in the preparation of the financial statements. The following summarizes the significant accounting policies of the Fund:
Investment Valuation. Investments are valued as of 4:00 p.m. Eastern time on the last calendar day of the period. The Board of Directors (the Board) has delegated the day to day responsibility for the valuation of the Fund's investments to the Fair Value Committee (the Committee) established by the Fund's investment adviser. In accordance with valuation policies and procedures approved by the Board, the Fund attempts to obtain prices from one or more third party pricing vendors or brokers to value its investments. When current market prices, quotations or currency exchange rates are not readily available or reliable, investments will be fair valued in good faith by the Committee, in accordance with procedures adopted by the Board. Factors used in determining fair value vary by investment type and may include market or investment specific events, changes in interest rates and credit quality. The frequency with which these procedures are used cannot be predicted and they may be utilized to a significant extent. The Committee oversees the Fund's valuation policies and procedures and reports to the Board on the Committee's activities and fair value determinations. The Board monitors the appropriateness of the procedures used in valuing the Fund's investments and ratifies the fair value determinations of the Committee.
The Fund categorizes the inputs to valuation techniques used to value its investments into a disclosure hierarchy consisting of three levels as shown below:
- Level 1 – quoted prices in active markets for identical investments
- Level 2 – other significant observable inputs (including quoted prices for similar investments, interest rates, prepayment speeds, etc.)
- Level 3 – unobservable inputs (including the Fund's own assumptions based on the best information available)
Valuation techniques used to value the Fund's investments by major category are as follows:
Debt securities, including restricted securities, are valued based on evaluated prices received from third party pricing vendors or from brokers who make markets in such securities. Corporate bonds and bank loan obligations are valued by pricing vendors who utilize matrix pricing which considers yield or price of bonds of comparable quality, coupon, maturity and type or by broker-supplied prices. When independent prices are unavailable or unreliable, debt securities may be valued utilizing pricing methodologies which consider similar factors that would be used by third party pricing vendors. Debt securities are generally categorized as Level 2 in the hierarchy but may be Level 3 depending on the circumstances. The Fund invests a significant portion of its assets in below investment grade securities. The value of these securities can be more volatile due to changes in the credit quality of the issuer and is sensitive to changes in economic, market and regulatory conditions.
Equity securities, including restricted securities, for which market quotations are readily available, are valued at the last reported sale price or official closing price as reported by a third party pricing vendor on the primary market or exchange on which they are traded and are categorized as Level 1 in the hierarchy. In the event there were no sales during the day or closing prices are not available, securities are valued at the last quoted bid price or may be valued using the last available price and are generally categorized as Level 2 in the hierarchy. For foreign equity securities, when market or security specific events arise, comparisons to the valuation of American Depositary Receipts (ADRs), futures contracts, Exchange-Traded Funds (ETFs) and certain indexes as well as quoted prices for similar securities may be used and would be categorized as Level 2 in the hierarchy. For equity securities, including restricted securities, where observable inputs are limited, assumptions about market activity and risk are used and these securities may be categorized as Level 3 in the hierarchy.
Investments in open-end mutual funds, including the Fidelity Central Funds, are valued at their closing net asset value (NAV) each business day and are categorized as Level 1 in the hierarchy.
Changes in valuation techniques may result in transfers in or out of an assigned level within the disclosure hierarchy. The aggregate value of investments by input level as of September 30, 2019 is included at the end of the Fund's Schedule of Investments.
Investment Transactions and Income. For financial reporting purposes, the Fund's investment holdings and NAV include trades executed through the end of the last business day of the period. The NAV per share for processing shareholder transactions is calculated as of the close of business of the New York Stock Exchange (NYSE), normally 4:00 p.m. Eastern time and includes trades executed through the end of the prior business day. Gains and losses on securities sold are determined on the basis of identified cost and include proceeds received from litigation. Dividend income is recorded on the ex-dividend date, except for certain dividends from foreign securities where the ex-dividend date may have passed, which are recorded as soon as the Fund is informed of the ex-dividend date. Non-cash dividends included in dividend income, if any, are recorded at the fair market value of the securities received. Income and capital gain distributions from Fidelity Central Funds, if any, are recorded on the ex-dividend date. Certain distributions received by the Fund represent a return of capital or capital gain. The Fund determines the components of these distributions subsequent to the ex-dividend date, based upon receipt of tax filings or other correspondence relating to the underlying investment. These distributions are recorded as a reduction of cost of investments and/or as a realized gain. Interest income is accrued as earned and includes coupon interest and amortization of premium and accretion of discount on debt securities as applicable. Debt obligations may be placed on non-accrual status and related interest income may be reduced by ceasing current accruals and writing off interest receivables when the collection of all or a portion of interest has become doubtful based on consistently applied procedures. A debt obligation is removed from non-accrual status when the issuer resumes interest payments or when collectability of interest is reasonably assured. The Fund earns certain fees in connection with its floating rate loan purchasing activities. These fees are in addition to interest payments earned and may include amendment fees, consent fees and prepayment fees. These fees are recorded as Interest in the accompanying financial statements.
Expenses. Expenses directly attributable to a fund are charged to that fund. Expenses attributable to more than one fund are allocated among the respective funds on the basis of relative net assets or other appropriate methods. Expense estimates are accrued in the period to which they relate and adjustments are made when actual amounts are known.
Income Tax Information and Distributions to Shareholders. Each year, the Fund intends to qualify as a regulated investment company under Subchapter M of the Internal Revenue Code, including distributing substantially all of its taxable income and realized gains. As a result, no provision for U.S. Federal income taxes is required. As of September 30, 2019, the Fund did not have any unrecognized tax benefits in the financial statements; nor is the Fund aware of any tax positions for which it is reasonably possible that the total amounts of unrecognized tax benefits will significantly change in the next twelve months. The Fund files a U.S. federal tax return, in addition to state and local tax returns as required. The Fund's federal income tax returns are subject to examination by the Internal Revenue Service (IRS) for a period of three fiscal years after they are filed. State and local tax returns may be subject to examination for an additional fiscal year depending on the jurisdiction.
Distributions are declared and recorded daily and paid monthly from net investment income. Distributions from realized gains, if any, are declared and recorded on the ex-dividend date. Income and capital gain distributions are determined in accordance with income tax regulations, which may differ from GAAP.
Capital accounts within the financial statements are adjusted for permanent book-tax differences. These adjustments have no impact on net assets or the results of operations. Capital accounts are not adjusted for temporary book-tax differences which will reverse in a subsequent period.
Book-tax differences are primarily due to capital loss carryforwards and losses deferred due to wash sales and excise tax regulations.
As of period end, the cost and unrealized appreciation (depreciation) in securities, and derivatives if applicable, for federal income tax purposes were as follows:
| Gross unrealized appreciation | $11,546,342 |
| Gross unrealized depreciation | (47,161,642) |
| Net unrealized appreciation (depreciation) | $(35,615,300) |
| Tax Cost | $2,032,746,287 |
The tax-based components of distributable earnings as of period end were as follows:
| Undistributed ordinary income | $1,938,375 |
| Capital loss carryforward | $(4,710,496) |
| Net unrealized appreciation (depreciation) on securities and other investments | $(35,615,300) |
Capital loss carryforwards are only available to offset future capital gains of the Fund to the extent provided by regulations and may be limited. Under the Regulated Investment Company Modernization Act of 2010 (the Act), the Fund is permitted to carry forward capital losses incurred in taxable years beginning after December 22, 2010 for an unlimited period and such capital losses are required to be used prior to any losses that expire. The capital loss carryforward information presented below, including any applicable limitation, is estimated as of fiscal period end and is subject to adjustment.
| No expiration | |
| Short-term | $(411,563) |
| Long-term | $(4,298,933) |
| Total capital loss carryforward | $(4,710,496) |
The Fund intends to elect to defer to its next fiscal year $5,907,016 of capital losses recognized during the period November 1, 2018 to September 30, 2019.
The tax character of distributions paid was as follows:
| September 30, 2019 | September 30, 2018 | |
| Ordinary Income | $121,953,549 | $ 111,877,345 |
| Long-term Capital Gains | - | 1,227,198 |
| Total | $121,953,549 | $ 113,104,543 |
Restricted Securities. The Fund may invest in securities that are subject to legal or contractual restrictions on resale. These securities generally may be resold in transactions exempt from registration or to the public if the securities are registered. Disposal of these securities may involve time-consuming negotiations and expense, and prompt sale at an acceptable price may be difficult. Information regarding restricted securities is included at the end of the Fund's Schedule of Investments.
Loans and Other Direct Debt Instruments. The Fund invests in direct debt instruments which are interests in amounts owed to lenders by corporate or other borrowers. These instruments may be in the form of loans, trade claims or other receivables and may include standby financing commitments such as revolving credit facilities that obligate the Fund to supply additional cash to the borrower on demand. Loans may be acquired through assignment or participation. The Fund also invests in unfunded loan commitments, which are contractual obligations for future funding. Information regarding unfunded commitments is included at the end of the Fund's Schedule of Investments.
New Rule Issuance. During August 2018, the U.S. Securities and Exchange Commission issued Final Rule Release No. 33-10532, Disclosure Update and Simplification. This Final Rule includes amendments specific to registered investment companies that are intended to eliminate overlap in disclosure requirements between Regulation S-X and GAAP. In accordance with these amendments, certain line-items in the Fund's financial statements have been combined or removed for the current period as outlined in the table below.
| Financial Statement | Current Line-Item Presentation (As Applicable) | Prior Line-Item Presentation (As Applicable) |
| Statement of Assets and Liabilities | Total distributable earnings (loss) | Undistributed/Distributions in excess of/Accumulated net investment income (loss) Accumulated/Undistributed net realized gain (loss) Net unrealized appreciation (depreciation) |
| Statement of Changes in Net Assets | N/A - removed | Undistributed/Distributions in excess of/Accumulated net investment income (loss) end of period |
| Statement of Changes in Net Assets | Distributions to shareholders | Distributions to shareholders from net investment income Distributions to shareholders from net realized gain |
4. Purchase and Sales of Investments.
Purchases and sales of securities (including principal repayments of bank loan obligations), other than short-term securities, aggregated $565,796,700 and $854,710,740, respectively.
5. Fees and Other Transactions with Affiliates.
Management Fee and Expense Contract. FMR Co., Inc. (the investment adviser), an affiliate of FMR, provides the Fund with investment management services. The Fund does not pay any fees for these services. Pursuant to the Fund's management contract with the investment adviser, FMR pays the investment adviser a portion of the management fees it receives from the Investing Funds. In addition, under an expense contract, FMR also pays all other expenses of the Fund, excluding custody fees, the compensation of the independent Directors, and certain miscellaneous expenses such as proxy and shareholder meeting expenses.
Brokerage Commissions. The Fund placed a portion of its portfolio transactions with brokerage firms which are affiliates of the investment adviser. Brokerage commissions are included in net realized gain (loss) and change in net unrealized appreciation (depreciation) in the Statement of Operations. The commissions paid to these affiliated firms were $21 for the period.
Interfund Trades. The Fund may purchase from or sell securities to other Fidelity Funds under procedures adopted by the Board. The procedures have been designed to ensure these interfund trades are executed in accordance with Rule 17a-7 of the 1940 Act. Interfund trades are included within the respective purchases and sales amounts shown in the Purchases and Sales of Investments note.
6. Expense Reductions.
Through arrangements with the Fund's custodian, credits realized as a result of certain uninvested cash balances were used to reduce the Fund's expenses by $28,245.
7. Other.
The Fund's organizational documents provide former and current directors and officers with a limited indemnification against liabilities arising in connection with the performance of their duties to the Fund. In the normal course of business, the Fund may also enter into contracts that provide general indemnifications. The Fund's maximum exposure under these arrangements is unknown as this would be dependent on future claims that may be made against the Fund. The risk of material loss from such claims is considered remote.
At the end of the period, mutual funds managed by the investment adviser or its affiliates were the owners of record of all of the outstanding shares of the Fund.
8. Litigation.
The Fund and other entities managed by FMR or its affiliates were named as defendants in a lawsuit filed in the United States Bankruptcy Court for the Southern District of New York in 2009. The lawsuit was brought by creditors of Motors Liquidation Company (f/k/a General Motors), which went through Chapter 11 bankruptcy proceedings in 2009, and is captioned Official Committee of Unsecured Creditors of Motors Liquidation Company v. JPMorgan Chase Bank, N.A., et al., Adversary No. 09-00504 (REG). The plaintiffs sought an order that the Fund and other defendants return proceeds received in 2009 in full payment of the principal and interest on General Motors secured debt. The plaintiffs contended that the Fund and the other defendants were not secured creditors at the time of the 2009 payments and, thus, were not entitled to payment in full. In May 2019, the parties reached a settlement that has been approved by the Bankruptcy Court. Under the terms of the settlement, the Fund will not be required to return any of the proceeds received in 2009, and will be entitled to recover a portion of the legal costs incurred in defending the case.
Report of Independent Registered Public Accounting Firm
To the Trustees of Fidelity Central Investment Portfolios LLC and the Shareholders of Fidelity Floating Rate Central Fund:
Opinion on the Financial Statements and Financial Highlights
We have audited the accompanying statement of assets and liabilities of Fidelity Floating Rate Central Fund (the "Fund"), a fund of Fidelity Central Investment Portfolios LLC, including the schedule of investments, as of September 30, 2019, the related statement of operations for the year then ended, the statement of changes in net assets for each of the two years in the period then ended, the financial highlights for each of the five years in the period then ended, and the related notes. In our opinion, the financial statements and financial highlights present fairly, in all material respects, the financial position of the Fund as of September 30, 2019, and the results of its operations for the year then ended, the changes in its net assets for each of the two years in the period then ended, and the financial highlights for each of the five years in the period then ended in conformity with accounting principles generally accepted in the United States of America.
Basis for Opinion
These financial statements and financial highlights are the responsibility of the Fund's management. Our responsibility is to express an opinion on the Fund's financial statements and financial highlights based on our audits. We are a public accounting firm registered with the Public Company Accounting Oversight Board (United States) (PCAOB) and are required to be independent with respect to the Fund in accordance with the U.S. federal securities laws and the applicable rules and regulations of the Securities and Exchange Commission and the PCAOB.
We conducted our audits in accordance with the standards of the PCAOB. Those standards require that we plan and perform the audit to obtain reasonable assurance about whether the financial statements and financial highlights are free of material misstatement, whether due to error or fraud. The Fund is not required to have, nor were we engaged to perform, an audit of its internal control over financial reporting. As part of our audits we are required to obtain an understanding of internal control over financial reporting but not for the purpose of expressing an opinion on the effectiveness of the Fund’s internal control over financial reporting. Accordingly, we express no such opinion.
Our audits included performing procedures to assess the risks of material misstatement of the financial statements and financial highlights, whether due to error or fraud, and performing procedures that respond to those risks. Such procedures included examining, on a test basis, evidence regarding the amounts and disclosures in the financial statements and financial highlights. Our audits also included evaluating the accounting principles used and significant estimates made by management, as well as evaluating the overall presentation of the financial statements and financial highlights. Our procedures included confirmation of securities owned as of September 30, 2019, by correspondence with the custodians, brokers, and agent banks; when replies were not received from brokers or agent banks, we performed other auditing procedures. We believe that our audits provide a reasonable basis for our opinion.
/s/ Deloitte & Touche LLP
Boston, Massachusetts
November 15, 2019
We have served as the auditor of one or more of the Fidelity investment companies since 1999.
Directors and Officers (Trustees and Officers)
The Trustees, Members of the Advisory Board (if any), and officers of the trust and fund, as applicable, are listed below. The Board of Trustees governs the fund and is responsible for protecting the interests of shareholders. The Trustees are experienced executives who meet periodically throughout the year to oversee the fund's activities, review contractual arrangements with companies that provide services to the fund, oversee management of the risks associated with such activities and contractual arrangements, and review the fund's performance. Except for Michael E. Wiley, each of the Trustees oversees 298 funds. Michael E. Wiley oversees 197 funds.
The Trustees hold office without limit in time except that (a) any Trustee may resign; (b) any Trustee may be removed by written instrument, signed by at least two-thirds of the number of Trustees prior to such removal; (c) any Trustee who requests to be retired or who has become incapacitated by illness or injury may be retired by written instrument signed by a majority of the other Trustees; and (d) any Trustee may be removed at any special meeting of shareholders by a two-thirds vote of the outstanding voting securities of the trust. Each Trustee who is not an interested person (as defined in the 1940 Act) of the trust and the fund is referred to herein as an Independent Trustee. Each Independent Trustee shall retire not later than the last day of the calendar year in which his or her 75th birthday occurs. The Independent Trustees may waive this mandatory retirement age policy with respect to individual Trustees. Officers and Advisory Board Members hold office without limit in time, except that any officer or Advisory Board Member may resign or may be removed by a vote of a majority of the Trustees at any regular meeting or any special meeting of the Trustees. Except as indicated, each individual has held the office shown or other offices in the same company for the past five years.
The fund’s Statement of Additional Information (SAI) includes more information about the Trustees. To request a free copy, call Fidelity at 1-800-544-8544.
Experience, Skills, Attributes, and Qualifications of the Trustees. The Governance and Nominating Committee has adopted a statement of policy that describes the experience, qualifications, attributes, and skills that are necessary and desirable for potential Independent Trustee candidates (Statement of Policy). The Board believes that each Trustee satisfied at the time he or she was initially elected or appointed a Trustee, and continues to satisfy, the standards contemplated by the Statement of Policy. The Governance and Nominating Committee also engages professional search firms to help identify potential Independent Trustee candidates who have the experience, qualifications, attributes, and skills consistent with the Statement of Policy. From time to time, additional criteria based on the composition and skills of the current Independent Trustees, as well as experience or skills that may be appropriate in light of future changes to board composition, business conditions, and regulatory or other developments, have also been considered by the professional search firms and the Governance and Nominating Committee. In addition, the Board takes into account the Trustees' commitment and participation in Board and committee meetings, as well as their leadership of standing and ad hoc committees throughout their tenure.
In determining that a particular Trustee was and continues to be qualified to serve as a Trustee, the Board has considered a variety of criteria, none of which, in isolation, was controlling. The Board believes that, collectively, the Trustees have balanced and diverse experience, qualifications, attributes, and skills, which allow the Board to operate effectively in governing the fund and protecting the interests of shareholders. Information about the specific experience, skills, attributes, and qualifications of each Trustee, which in each case led to the Board's conclusion that the Trustee should serve (or continue to serve) as a trustee of the fund, is provided below.
Board Structure and Oversight Function. James C. Curvey is an interested person and currently serves as Chairman. The Trustees have determined that an interested Chairman is appropriate and benefits shareholders because an interested Chairman has a personal and professional stake in the quality and continuity of services provided to the fund. Independent Trustees exercise their informed business judgment to appoint an individual of their choosing to serve as Chairman, regardless of whether the Trustee happens to be independent or a member of management. The Independent Trustees have determined that they can act independently and effectively without having an Independent Trustee serve as Chairman and that a key structural component for assuring that they are in a position to do so is for the Independent Trustees to constitute a substantial majority for the Board. The Independent Trustees also regularly meet in executive session. Ned C. Lautenbach serves as Chairman of the Independent Trustees and as such (i) acts as a liaison between the Independent Trustees and management with respect to matters important to the Independent Trustees and (ii) with management prepares agendas for Board meetings.
Fidelity® funds are overseen by different Boards of Trustees. The fund's Board oversees Fidelity's high income and certain equity funds, and other Boards oversee Fidelity's investment-grade bond, money market, asset allocation, and other equity funds. The asset allocation funds may invest in Fidelity® funds overseen by the fund's Board. The use of separate Boards, each with its own committee structure, allows the Trustees of each group of Fidelity® funds to focus on the unique issues of the funds they oversee, including common research, investment, and operational issues. On occasion, the separate Boards establish joint committees to address issues of overlapping consequences for the Fidelity® funds overseen by each Board.
The Trustees operate using a system of committees to facilitate the timely and efficient consideration of all matters of importance to the Trustees, the fund, and fund shareholders and to facilitate compliance with legal and regulatory requirements and oversight of the fund's activities and associated risks. The Board, acting through its committees, has charged FMR and its affiliates with (i) identifying events or circumstances the occurrence of which could have demonstrably adverse effects on the fund's business and/or reputation; (ii) implementing processes and controls to lessen the possibility that such events or circumstances occur or to mitigate the effects of such events or circumstances if they do occur; and (iii) creating and maintaining a system designed to evaluate continuously business and market conditions in order to facilitate the identification and implementation processes described in (i) and (ii) above. Because the day-to-day operations and activities of the fund are carried out by or through FMR, its affiliates, and other service providers, the fund's exposure to risks is mitigated but not eliminated by the processes overseen by the Trustees. While each of the Board's committees has responsibility for overseeing different aspects of the fund's activities, oversight is exercised primarily through the Operations, Audit, and Compliance Committees. Appropriate personnel, including but not limited to the fund's Chief Compliance Officer (CCO), FMR's internal auditor, the independent accountants, the fund's Treasurer and portfolio management personnel, make periodic reports to the Board's committees, as appropriate, including an annual review of Fidelity's risk management program for the Fidelity® funds. The responsibilities of each standing committee, including their oversight responsibilities, are described further under "Standing Committees of the Trustees."
Interested Trustees*:
Correspondence intended for a Trustee who is an interested person may be sent to Fidelity Investments, 245 Summer Street, Boston, Massachusetts 02210.
Name, Year of Birth; Principal Occupations and Other Relevant Experience+
James C. Curvey (1935)
Year of Election or Appointment: 2007
Trustee
Chairman of the Board of Trustees
Mr. Curvey also serves as Trustee of other Fidelity® funds. Mr. Curvey is Vice Chairman (2007-present) and Director of FMR LLC (diversified financial services company). In addition, Mr. Curvey is an Overseer Emeritus for the Boston Symphony Orchestra, a Director of Artis-Naples, and a Trustee of Brewster Academy in Wolfeboro, New Hampshire. Previously, Mr. Curvey served as a Director of Fidelity Research & Analysis Co. (investment adviser firm, 2009-2018), Director of Fidelity Investments Money Management, Inc. (investment adviser firm, 2009-2014) and a Director of FMR and FMR Co., Inc. (investment adviser firms, 2007-2014).
* Determined to be an “Interested Trustee” by virtue of, among other things, his or her affiliation with the Fidelity Central Investment Portfolios LLC or various entities under common control with FMR.
+ The information includes the Trustee's principal occupation during the last five years and other information relating to the experience, attributes, and skills relevant to the Trustee's qualifications to serve as a Trustee, which led to the conclusion that the Trustee should serve as a Trustee for the fund.
Independent Trustees:
Correspondence intended for an Independent Trustee may be sent to Fidelity Investments, P.O. Box 55235, Boston, Massachusetts 02205-5235.
Name, Year of Birth; Principal Occupations and Other Relevant Experience+
Dennis J. Dirks (1948)
Year of Election or Appointment: 2005
Trustee
Mr. Dirks also serves as Trustee of other Fidelity® funds. Prior to his retirement in May 2003, Mr. Dirks was Chief Operating Officer and a member of the Board of The Depository Trust & Clearing Corporation (DTCC). He also served as President, Chief Operating Officer, and Board member of The Depository Trust Company (DTC) and President and Board member of the National Securities Clearing Corporation (NSCC). In addition, Mr. Dirks served as Chief Executive Officer and Board member of the Government Securities Clearing Corporation, Chief Executive Officer and Board member of the Mortgage-Backed Securities Clearing Corporation, as a Trustee and a member of the Finance Committee of Manhattan College (2005-2008), as a Trustee and a member of the Finance Committee of AHRC of Nassau County (2006-2008), as a member of the Independent Directors Council (IDC) Governing Council (2010-2015), and as a member of the Board of Directors for The Brookville Center for Children’s Services, Inc. (2009-2017). Mr. Dirks is a member of the Finance Committee (2016-present) and Board of Directors (2017-present) and is Treasurer (2018-present) of the Asolo Repertory Theatre.
Donald F. Donahue (1950)
Year of Election or Appointment: 2018
Trustee
Mr. Donahue also serves as a Trustee of other Fidelity® funds. Mr. Donahue is President and Chief Executive Officer of Miranda Partners, LLC (risk consulting for the financial services industry, 2012-present). Previously, Mr. Donahue served as a Member of the Advisory Board of certain Fidelity® funds (2015-2018) and Chief Executive Officer (2006-2012), Chief Operating Officer (2003-2006), and Managing Director, Customer Marketing and Development (1999-2003) of The Depository Trust & Clearing Corporation (financial markets infrastructure). Mr. Donahue serves as a Member (2007-present) and Co-Chairman (2016-present) of the Board of Directors of United Way of New York, Member of the Board of Directors of NYC Leadership Academy (2012-present) and Member of the Board of Advisors of Ripple Labs, Inc. (financial services, 2015-present). He also served as Chairman (2010-2012) and Member of the Board of Directors (2012-2013) of Omgeo, LLC (financial services), Treasurer of United Way of New York (2012-2016), and Member of the Board of Directors of XBRL US (financial services non-profit, 2009-2012) and the International Securities Services Association (2009-2012).
Alan J. Lacy (1953)
Year of Election or Appointment: 2008
Trustee
Mr. Lacy also serves as Trustee of other Fidelity® funds. Mr. Lacy serves as a Director of Bristol-Myers Squibb Company (global pharmaceuticals, 2008-present). He is a Trustee of the California Chapter of The Nature Conservancy (2015-present) and a Director of the Center for Advanced Study in the Behavioral Sciences at Stanford University (2015-present). In addition, Mr. Lacy served as Senior Adviser (2007-2014) of Oak Hill Capital Partners, L.P. (private equity) and also served as Chief Executive Officer (2005) and Vice Chairman (2005-2006) of Sears Holdings Corporation (retail) and Chief Executive Officer and Chairman of the Board of Sears, Roebuck and Co. (retail, 2000-2005). Previously, Mr. Lacy served as Chairman (2014-2017) and a member (2010-2017) of the Board of Directors of Dave & Buster’s Entertainment, Inc. (restaurant and entertainment complexes), as Chairman (2008-2011) and a member (2006-2015) of the Board of Trustees of the National Parks Conservation Association, and as a member of the Board of Directors for The Hillman Companies, Inc. (hardware wholesalers, 2010-2014), Earth Fare, Inc. (retail grocery, 2010-2014), and The Western Union Company (global money transfer, 2006-2011).
Ned C. Lautenbach (1944)
Year of Election or Appointment: 2004
Trustee
Chairman of the Independent Trustees
Mr. Lautenbach also serves as Trustee of other Fidelity® funds. Mr. Lautenbach currently serves as Chair (2018-present) and Member (2013-present) of the Board of Governors, State University System of Florida and is a member of the Council on Foreign Relations (1994-present). He is also a member and has most recently served as Chairman of the Board of Directors of Artis-Naples (2012-present). Previously, Mr. Lautenbach served as a member and then Lead Director of the Board of Directors of Eaton Corporation (diversified industrial, 1997-2016). He was also a Partner and Advisory Partner at Clayton, Dubilier & Rice, LLC (private equity investment, 1998-2010), as well as a Director of Sony Corporation (2006-2007). In addition, Mr. Lautenbach also had a 30-year career with IBM (technology company) during which time he served as Senior Vice President and a member of the Corporate Executive Committee (1968-1998).
Joseph Mauriello (1944)
Year of Election or Appointment: 2008
Trustee
Mr. Mauriello also serves as Trustee of other Fidelity® funds. Prior to his retirement in January 2006, Mr. Mauriello served in numerous senior management positions including Deputy Chairman and Chief Operating Officer (2004-2005), and Vice Chairman of Financial Services (2002-2004) of KPMG LLP US (professional services, 1965-2005). Mr. Mauriello currently serves as a member of the Independent Directors Council (IDC) Governing Council (2015-present). Previously, Mr. Mauriello served as a member of the Board of Directors of XL Group plc. (global insurance and re-insurance, 2006-2018).
Cornelia M. Small (1944)
Year of Election or Appointment: 2005
Trustee
Ms. Small also serves as Trustee of other Fidelity® funds. Ms. Small is a member of the Board of Directors (2009-present) and Chair of the Investment Committee (2010-present) of the Teagle Foundation. Ms. Small also serves on the Investment Committee of the Berkshire Taconic Community Foundation (2008-present). Previously, Ms. Small served as Chairperson (2002-2008) and a member of the Investment Committee and Chairperson (2008-2012) and a member of the Board of Trustees of Smith College. In addition, Ms. Small served as Chief Investment Officer, Director of Global Equity Investments, and a member of the Board of Directors of Scudder, Stevens & Clark and Scudder Kemper Investments.
Garnett A. Smith (1947)
Year of Election or Appointment: 2018
Trustee
Mr. Smith also serves as Trustee of other Fidelity® funds. Prior to Mr. Smith's retirement, he served as Chairman and Chief Executive Officer of Inbrand Corp. (manufacturer of personal absorbent products, 1990-1997). He also served as President (1986-1990) of Inbrand Corp. Prior to his employment with Inbrand Corp., he was employed by a retail fabric chain and North Carolina National Bank. In addition, Mr. Smith served as a Member of the Advisory Board of certain Fidelity® funds (2012-2013) and as a board member of the Jackson Hole Land Trust (2009-2012).
David M. Thomas (1949)
Year of Election or Appointment: 2008
Trustee
Mr. Thomas also serves as Trustee of other Fidelity® funds. Mr. Thomas serves as Non-Executive Chairman of the Board of Directors of Fortune Brands Home and Security (home and security products, 2011-present) and as a member of the Board of Directors (2004-present) and Presiding Director (2013-present) of Interpublic Group of Companies, Inc. (marketing communication). Previously, Mr. Thomas served as Executive Chairman (2005-2006) and Chairman and Chief Executive Officer (2000-2005) of IMS Health, Inc. (pharmaceutical and healthcare information solutions), a Director of Fortune Brands, Inc. (consumer products, 2000-2011), and a member of the Board of Trustees of the University of Florida (2013-2018).
Michael E. Wiley (1950)
Year of Election or Appointment: 2018
Trustee
Mr. Wiley also serves as Trustee or Member of the Advisory Board of other Fidelity® funds. Mr. Wiley serves as a Director of High Point Resources (exploration and production, 2005-present). Previously, Mr. Wiley served as a Director of Andeavor Corporation (independent oil refiner and marketer, 2005-2018), a Director of Andeavor Logistics LP (natural resources logistics, 2015-2018), a Director of Post Oak Bank (privately-held bank, 2004-2018), a Director of Asia Pacific Exploration Consolidated (international oil and gas exploration and production, 2008-2013), a member of the Board of Trustees of the University of Tulsa (2000-2006; 2007-2010), a Senior Energy Advisor of Katzenbach Partners, LLC (consulting, 2006-2007), an Advisory Director of Riverstone Holdings (private investment), a Director of Spinnaker Exploration Company (exploration and production, 2001-2005) and Chairman, President, and CEO of Baker Hughes, Inc. (oilfield services, 2000-2004).
+ The information includes the Trustee's principal occupation during the last five years and other information relating to the experience, attributes, and skills relevant to the Trustee's qualifications to serve as a Trustee, which led to the conclusion that the Trustee should serve as a Trustee for the fund.
Advisory Board Members and Officers:
Correspondence intended for a Member of the Advisory Board (if any) may be sent to Fidelity Investments, P.O. Box 55235, Boston, Massachusetts 02205-5235. Correspondence intended for an officer or Peter S. Lynch may be sent to Fidelity Investments, 245 Summer Street, Boston, Massachusetts 02210. Officers appear below in alphabetical order.
Name, Year of Birth; Principal Occupation
Vicki L. Fuller (1957)
Year of Election or Appointment: 2018
Member of the Advisory Board
Ms. Fuller also serves as Member of the Advisory Board of other Fidelity® funds. Ms. Fuller serves as a member of the Board of Directors, Audit Committee, and Nominating and Governance Committee of The Williams Companies, Inc. (natural gas infrastructure, 2018-present). Previously, Ms. Fuller served as the Chief Investment Officer of the New York State Common Retirement Fund (2012-2018) and held a variety of positions at AllianceBernstein L.P. (global asset management, 1985-2012), including Managing Director (2006-2012) and Senior Vice President and Senior Portfolio Manager (2001-2006).
Peter S. Lynch (1944)
Year of Election or Appointment: 2004
Member of the Advisory Board
Mr. Lynch also serves as Member of the Advisory Board of other Fidelity® funds. Mr. Lynch is Vice Chairman and a Director of FMR (investment adviser firm) and FMR Co., Inc. (investment adviser firm). In addition, Mr. Lynch serves as a Trustee of Boston College and as the Chairman of the Inner-City Scholarship Fund. Previously, Mr. Lynch served on the Special Olympics International Board of Directors (1997-2006).
Elizabeth Paige Baumann (1968)
Year of Election or Appointment: 2017
Anti-Money Laundering (AML) Officer
Ms. Baumann also serves as AML Officer of other funds. She is Chief AML Officer (2012-present) and Senior Vice President (2014-present) of FMR LLC (diversified financial services company) and is an employee of Fidelity Investments. Previously, Ms. Baumann served as AML Officer of the funds (2012-2016), and Vice President (2007-2014) and Deputy Anti-Money Laundering Officer (2007-2012) of FMR LLC.
Craig S. Brown (1977)
Year of Election or Appointment: 2019
Assistant Treasurer
Mr. Brown also serves as Assistant Treasurer of other funds. Mr. Brown is an employee of Fidelity Investments (2013-present).
John J. Burke III (1964)
Year of Election or Appointment: 2018
Chief Financial Officer
Mr. Burke also serves as Chief Financial Officer of other funds. Mr. Burke serves as Head of Investment Operations for Fidelity Fund and Investment Operations (2018-present) and is an employee of Fidelity Investments (1998-present). Previously Mr. Burke served as head of Asset Management Investment Operations (2012-2018).
William C. Coffey (1969)
Year of Election or Appointment: 2019
Assistant Secretary
Mr. Coffey also serves as Assistant Secretary of other funds. He is Senior Vice President and Deputy General Counsel of FMR LLC (diversified financial services company, 2010-present), and is an employee of Fidelity Investments. Previously, Mr. Coffey served as Secretary and CLO of certain funds (2018-2019); CLO, Secretary, and Senior Vice President of Fidelity Management & Research Company and FMR Co., Inc. (investment adviser firms, 2018-2019); Secretary of Fidelity SelectCo, LLC and Fidelity Investments Money Management, Inc. (investment adviser firms, 2018-2019); CLO of Fidelity Management & Research (Hong Kong) Limited, FMR Investment Management (UK) Limited, and Fidelity Management & Research (Japan) Limited (investment adviser firms, 2018-2019); and Assistant Secretary of certain funds (2009-2018).
Timothy M. Cohen (1969)
Year of Election or Appointment: 2018
Vice President
Mr. Cohen also serves as Vice President of other funds. Mr. Cohen serves as Executive Vice President of Fidelity SelectCo, LLC (2019-present), Co-Head of Equity (2018-present), a Director of Fidelity Management & Research (Japan) Limited (investment adviser firm, 2016-present), and is an employee of Fidelity Investments. Previously, Mr. Cohen served as Head of Global Equity Research (2016-2018), Chief Investment Officer - Equity and a Director of Fidelity Management & Research (U.K.) Inc. (investment adviser firm, 2013-2015) and as a Director of Fidelity Management & Research (Hong Kong) Limited (investment adviser firm, 2017).
Jonathan Davis (1968)
Year of Election or Appointment: 2010
Assistant Treasurer
Mr. Davis also serves as Assistant Treasurer of other funds. Mr. Davis serves as Assistant Treasurer of FMR Capital, Inc. (2017-present) and is an employee of Fidelity Investments. Previously, Mr. Davis served as Vice President and Associate General Counsel of FMR LLC (diversified financial services company, 2003-2010).
Adrien E. Deberghes (1967)
Year of Election or Appointment: 2016
Assistant Treasurer
Mr. Deberghes also serves as an officer of other funds. He serves as Assistant Treasurer of FMR Capital, Inc. (2017-present), Executive Vice President of Fidelity Investments Money Management, Inc. (FIMM) (investment adviser firm, 2016-present), and is an employee of Fidelity Investments (2008-present). Previously, Mr. Deberghes served as President and Treasurer of certain Fidelity® funds (2013-2018). Prior to joining Fidelity Investments, Mr. Deberghes was Senior Vice President of Mutual Fund Administration at State Street Corporation (2007-2008), Senior Director of Mutual Fund Administration at Investors Bank & Trust (2005-2007), and Director of Finance for Dunkin' Brands (2000-2005). Previously, Mr. Deberghes served in other fund officer roles.
Laura M. Del Prato (1964)
Year of Election or Appointment: 2018
Assistant Treasurer
Ms. Del Prato also serves as an officer of other funds. Ms. Del Prato is an employee of Fidelity Investments (2017-present). Prior to joining Fidelity Investments, Ms. Del Prato served as a Managing Director and Treasurer of the JPMorgan Mutual Funds (2014-2017). Prior to JPMorgan, Ms. Del Prato served as a partner at Cohen Fund Audit Services (accounting firm, 2012-2013) and KPMG LLP (accounting firm, 2004-2012).
Colm A. Hogan (1973)
Year of Election or Appointment: 2016
Deputy Treasurer
Mr. Hogan also serves as an officer of other funds. Mr. Hogan serves as Assistant Treasurer of FMR Capital, Inc. (2017-present) and is an employee of Fidelity Investments (2005-present). Previously, Mr. Hogan served as Assistant Treasurer of certain Fidelity® funds (2016-2018).
Pamela R. Holding (1964)
Year of Election or Appointment: 2018
Vice President
Ms. Holding also serves as Vice President of other funds. Ms. Holding serves as Executive Vice President of Fidelity SelectCo, LLC (2019-present), Co-Head of Equity (2018-present) and is an employee of Fidelity Investments (2013-present). Previously, Ms. Holding served as Chief Investment Officer of Fidelity Institutional Asset Management (2013-2018).
Cynthia Lo Bessette (1969)
Year of Election or Appointment: 2019
Secretary and Chief Legal Officer (CLO)
Ms. Lo Bessette also serves as Secretary and CLO of other funds. Ms. Lo Bessette serves as CLO, Secretary, and Senior Vice President of Fidelity Management & Research Company and FMR Co., Inc. (investment adviser firms, 2019-present); Secretary of Fidelity SelectCo, LLC and Fidelity Investments Money Management, Inc. (investment adviser firms, 2019-present); and CLO of Fidelity Management & Research (Hong Kong) Limited, FMR Investment Management (UK) Limited, and Fidelity Management & Research (Japan) Limited (investment adviser firms, 2019-present). She is a Senior Vice President and Deputy General Counsel of FMR LLC (diversified financial services company, 2019-present), and is an employee of Fidelity Investments. Previously, Ms. Lo Bessette served as Executive Vice President, General Counsel (2016-2019) and Senior Vice President, Deputy General Counsel (2015-2016) of OppenheimerFunds (investment management company) and Deputy Chief Legal Officer (2013-2015) of Jennison Associates LLC (investment adviser firm).
Chris Maher (1972)
Year of Election or Appointment: 2013
Assistant Treasurer
Mr. Maher serves as Assistant Treasurer of other funds. Mr. Maher is Vice President of Valuation Oversight, serves as Assistant Treasurer of FMR Capital, Inc. (2017-present), and is an employee of Fidelity Investments. Previously, Mr. Maher served as Vice President of Asset Management Compliance (2013), Vice President of the Program Management Group of FMR (investment adviser firm, 2010-2013), and Vice President of Valuation Oversight (2008-2010).
Kenneth B. Robins (1969)
Year of Election or Appointment: 2016
Chief Compliance Officer
Mr. Robins also serves as an officer of other funds. Mr. Robins serves as Compliance Officer of Fidelity Management & Research Company and FMR Co., Inc. (investment adviser firms, 2016-present) and is an employee of Fidelity Investments (2004-present). Previously, Mr. Robins served as Executive Vice President of Fidelity Investments Money Management, Inc. (investment adviser firm, 2013-2016) and served in other fund officer roles.
Stacie M. Smith (1974)
Year of Election or Appointment: 2016
President and Treasurer
Ms. Smith also serves as an officer of other funds. Ms. Smith serves as Assistant Treasurer of FMR Capital, Inc. (2017-present), is an employee of Fidelity Investments (2009-present), and has served in other fund officer roles. Prior to joining Fidelity Investments, Ms. Smith served as Senior Audit Manager of Ernst & Young LLP (accounting firm, 1996-2009). Previously, Ms. Smith served as Assistant Treasurer (2013-2018) and Deputy Treasurer (2013-2016) of certain Fidelity® funds.
Marc L. Spector (1972)
Year of Election or Appointment: 2016
Assistant Treasurer
Mr. Spector also serves as an officer of other funds. Mr. Spector serves as Assistant Treasurer of FMR Capital, Inc. (2017-present) and is an employee of Fidelity Investments (2016-present). Prior to joining Fidelity Investments, Mr. Spector served as Director at the Siegfried Group (accounting firm, 2013-2016), and prior to Siegfried Group as audit senior manager at Deloitte & Touche (accounting firm, 2005-2013).
Jim Wegmann (1979)
Year of Election or Appointment: 2019
Assistant Treasurer
Mr. Wegmann also serves as Assistant Treasurer of other funds. Mr. Wegmann is an employee of Fidelity Investments (2011-present).
Shareholder Expense Example
As a shareholder of the Fund, you incur two types of costs: (1) transaction costs and (2) ongoing costs, including other Fund expenses. This Example is intended to help you understand your ongoing costs (in dollars) of investing in the Fund and to compare these costs with the ongoing costs of investing in other mutual funds.
The Example is based on an investment of $1,000 invested at the beginning of the period and held for the entire period (April 1, 2019 to September 30, 2019).
Actual Expenses
The first line of the accompanying table provides information about actual account values and actual expenses. You may use the information in this line, together with the amount you invested, to estimate the expenses that you paid over the period. Simply divide your account value by $1,000.00 (for example, an $8,600 account value divided by $1,000.00 = 8.6), then multiply the result by the number in the first line under the heading entitled "Expenses Paid During Period" to estimate the expenses you paid on your account during this period. In addition, the Fund, as a shareholder in the underlying Fidelity Central Funds, will indirectly bear its pro-rata share of the fees and expenses incurred by the underlying Fidelity Central Funds. These fees and expenses are not included in the Fund's annualized expense ratio used to calculate the expense estimate in the table below.
Hypothetical Example for Comparison Purposes
The second line of the accompanying table provides information about hypothetical account values and hypothetical expenses based on the Fund's actual expense ratio and an assumed rate of return of 5% per year before expenses, which is not the Fund's actual return. The hypothetical account values and expenses may not be used to estimate the actual ending account balance or expenses you paid for the period. You may use this information to compare the ongoing costs of investing in the Fund and other funds. To do so, compare this 5% hypothetical example with the 5% hypothetical examples that appear in the shareholder reports of the other funds. In addition, the Fund, as a shareholder in the underlying Fidelity Central Funds, will indirectly bear its pro-rata share of the fees and expenses incurred by the underlying Fidelity Central Funds. These fees and expenses are not included in the Fund's annualized expense ratio used to calculate the expense estimate in the table below.
Please note that the expenses shown in the table are meant to highlight your ongoing costs only and do not reflect any transaction costs. Therefore, the second line of the table is useful in comparing ongoing costs only, and will not help you determine the relative total costs of owning different funds.
| Annualized Expense Ratio-A | Beginning Account Value April 1, 2019 | Ending Account Value September 30, 2019 | Expenses Paid During Period-B April 1, 2019 to September 30, 2019 | |
| Actual | .0013% | $1,000.00 | $1,032.30 | $.01 |
| Hypothetical-C | $1,000.00 | $1,025.06 | $.01 |
A Annualized expense ratio reflects expenses net of applicable fee waivers.
B Expenses are equal to the Fund's annualized expense ratio, multiplied by the average account value over the period, multiplied by 183/365 (to reflect the one-half year period).
C 5% return per year before expenses
Distributions (Unaudited)
A total of 0.48% of the dividends distributed during the fiscal year was derived from interest on U.S. Government securities which is generally exempt from state income tax.
The fund designates $78,804,118 of distributions paid during the period January 1, 2019 to September 30, 2019 as qualifying to be taxed as interest-related dividends for nonresident alien shareholders.
The fund will notify shareholders in January 2020 of amounts for use in preparing 2019 income tax returns.
![]()
FR1-ANN-1119
1.814672.114
Fidelity® International Equity Central Fund
Annual Report
September 30, 2019
Beginning on January 1, 2021, as permitted by regulations adopted by the Securities and Exchange Commission, paper copies of a fund’s shareholder reports will no longer be sent by mail, unless you specifically request paper copies of the reports from the fund or from your financial intermediary, such as a financial advisor, broker-dealer or bank. Instead, the reports will be made available on a website, and you will be notified by mail each time a report is posted and provided with a website link to access the report.
If you already elected to receive shareholder reports electronically, you will not be affected by this change and you need not take any action. You may elect to receive shareholder reports and other communications from a fund electronically, by contacting your financial intermediary. For Fidelity customers, visit Fidelity's web site or call Fidelity using the contact information listed below.
You may elect to receive all future reports in paper free of charge. If you wish to continue receiving paper copies of your shareholder reports, you may contact your financial intermediary or, if you are a Fidelity customer, visit Fidelity’s website, or call Fidelity at the applicable toll-free number listed below. Your election to receive reports in paper will apply to all funds held with the fund complex/your financial intermediary.
| Account Type | Website | Phone Number |
| Brokerage, Mutual Fund, or Annuity Contracts: | fidelity.com/mailpreferences | 1-800-343-3548 |
| Employer Provided Retirement Accounts: | netbenefits.fidelity.com/preferences (choose 'no' under Required Disclosures to continue to print) | 1-800-343-0860 |
| Advisor Sold Accounts Serviced Through Your Financial Intermediary: | Contact Your Financial Intermediary | Your Financial Intermediary's phone number |
| Advisor Sold Accounts Serviced by Fidelity: | institutional.fidelity.com | 1-877-208-0098 |
Contents
To view a fund's proxy voting guidelines and proxy voting record for the 12-month period ended June 30, visit http://www.fidelity.com/proxyvotingresults or visit the Securities and Exchange Commission's (SEC) web site at http://www.sec.gov.
You may also call 1-800-544-8544 to request a free copy of the proxy voting guidelines.
Standard & Poor's, S&P and S&P 500 are registered service marks of The McGraw-Hill Companies, Inc. and have been licensed for use by Fidelity Distributors Corporation.
Other third-party marks appearing herein are the property of their respective owners.
All other marks appearing herein are registered or unregistered trademarks or service marks of FMR LLC or an affiliated company. © 2019 FMR LLC. All rights reserved.
A fund files its complete schedule of portfolio holdings with the SEC for the first and third quarters of each fiscal year on Form N-PORT. Forms N-PORT are available on the SEC’s web site at http://www.sec.gov. A fund's Forms N-PORT may be reviewed and copied at the SEC’s Public Reference Room in Washington, DC. Information regarding the operation of the SEC's Public Reference Room may be obtained by calling 1-800-SEC-0330.
Performance: The Bottom Line
Average annual total return reflects the change in the value of an investment, assuming reinvestment of distributions from dividend income and capital gains (the profits earned upon the sale of securities that have grown in value, if any) and assuming a constant rate of performance each year. The hypothetical investment and the average annual total returns do not reflect the deduction of taxes that a shareholder would pay on fund distributions or the redemption of fund shares. During periods of reimbursement by Fidelity, a fund’s total return will be greater than it would be had the reimbursement not occurred. How a fund did yesterday is no guarantee of how it will do tomorrow.
Average Annual Total Returns
| For the periods ended September 30, 2019 | Past 1 year | Past 5 years | Past 10 years |
| Fidelity® International Equity Central Fund | (0.21)% | 4.00% | 5.43% |
$10,000 Over 10 Years
Let's say hypothetically that $10,000 was invested in Fidelity® International Equity Central Fund on September 30, 2009.
The chart shows how the value of your investment would have changed, and also shows how the MSCI World ex USA Index performed over the same period.
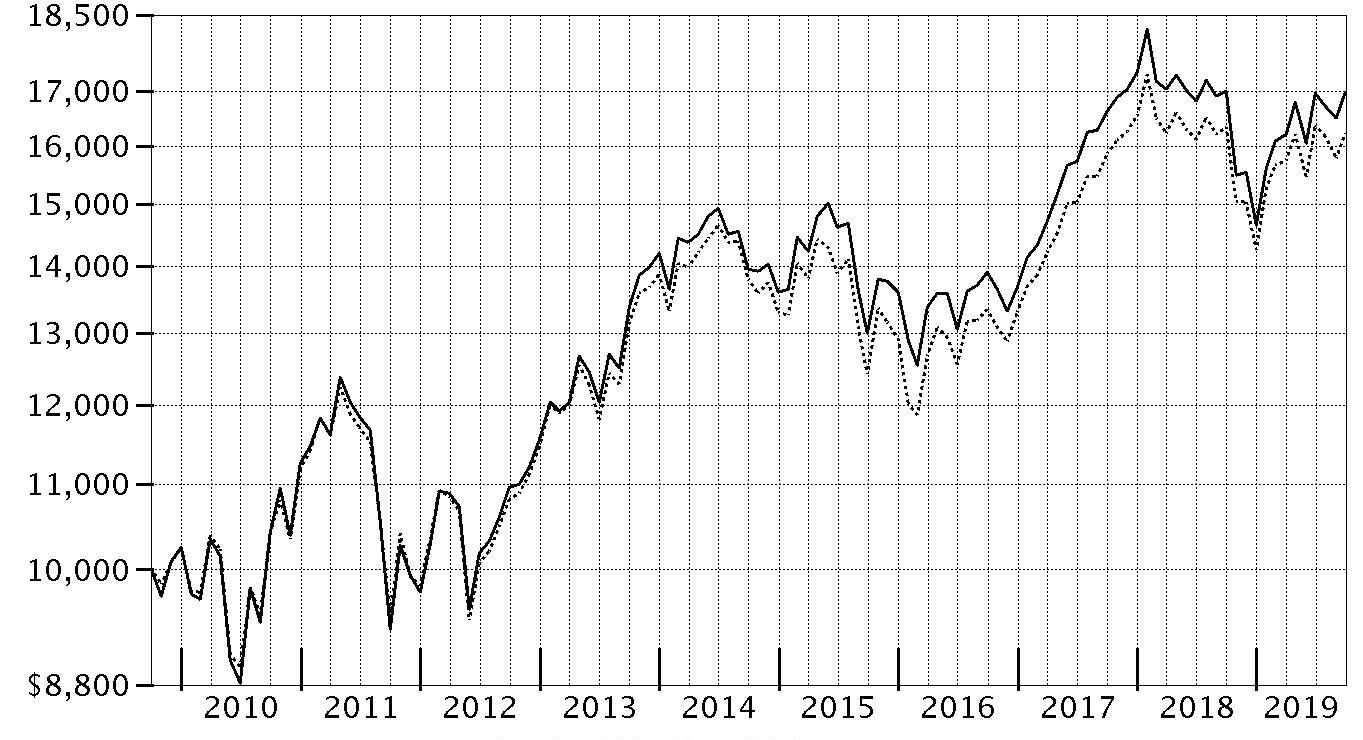
| Period Ending Values | ||
| $16,972 | Fidelity® International Equity Central Fund | |
| $16,223 | MSCI World ex USA Index | |
Management's Discussion of Fund Performance
Market Recap: The MSCI ACWI (All Country World Index) ex USA Index returned -1.05% for the 12 months ending September 30, 2019, as international stocks reflected a confluence of negative factors, including escalating trade tension, lackluster global economic growth, uncertainty about the U.K.’s planned “Brexit” from the European Union and reports of slowing in China’s economy. In late December, the U.S. Federal Reserve shifted from raising interest rates to a more dovish policy in 2019, joining many foreign central banks that had been cutting rates. Sentiment ebbed and flowed in 2019, primarily due to geopolitical factors, including elections and trade disputes, resulting in increased volatility. In June, international stocks rose 6.03%, as policy stimulus in China stabilized that country’s economic growth trajectory. In July, the Fed cut its policy rate for the first time since 2007. However, the index returned -1.21% for the month, followed by a -3.08% result in August, before rebounding with a 2.59% advance in September. For the full 12 months, six sectors lost ground, with energy (-9%), materials (-7%) and communication services (-4%) faring worst. Conversely, utilities (+13%), consumer staples (+7%) and real estate (+5%) led the way. By region, Japan (-4%) and the U.K. (-3%) fell the hardest, followed by emerging markets (-2%). Meanwhile, Canada (+4%), Asia Pacific ex Japan (+3%) and Europe ex U.K (+1%) turned in the best results.Comments from Co-Portfolio Manager Steven Kaye: For the fiscal year, the fund returned -0.21%, slightly ahead of the -0.71% result of the MSCI World ex USA Index. Versus the index, the fund benefited from favorable stock selection, particularly in the health care and financial sectors. Geographically, choices in Japan and among emerging markets were the most helpful. Conversely, stock picking in materials, industrials, utilities and consumer staples hurt, as did our choices in Europe and the U.K., and Asia Pacific ex Japan. Among individual stocks, an overweighting in Hoya (+39% stock return), a Japanese manufacturer of optical products in health care and tech markets, helped more than any other active decision. Hoya’s growth this period was owed in part to strong sales of its contact lenses. Another positive was our stake in Zurich Insurance Group (+28% stock return), which benefited from its three-year turnaround under new management. On the flip side, an overweighting in Spain’s Caixabank (-39% stock return) detracted the most. The lender struggled with falling profits this period and, in June, it lowered its full-year income outlook due to expected falling interest rates in the eurozone. Japanese power tool maker Makita (-36% stock return) was another relative laggard. The fund did not own Caixabank or Makita at period end.The views expressed above reflect those of the portfolio manager(s) only through the end of the period as stated on the cover of this report and do not necessarily represent the views of Fidelity or any other person in the Fidelity organization. Any such views are subject to change at any time based upon market or other conditions and Fidelity disclaims any responsibility to update such views. These views may not be relied on as investment advice and, because investment decisions for a Fidelity fund are based on numerous factors, may not be relied on as an indication of trading intent on behalf of any Fidelity fund.
Notes to shareholders: On November 1, 2018, Faris Rahman, Allyson Ke and Jennifer Moon all became Co-Managers for the fund. Grace Anne-Wood is no longer a Co-Manager for the fund. On September 3, 2019, Vince Montemaggiore assumed co-management responsibilities for the fund.Investment Summary (Unaudited)
Geographic Diversification (% of fund's net assets)
| As of September 30, 2019 | ||
| Japan | 19.0% | |
| United Kingdom | 12.6% | |
| Germany | 11.0% | |
| France | 9.3% | |
| Canada | 7.8% | |
| Switzerland | 7.3% | |
| Netherlands | 7.1% | |
| United States of America* | 4.8% | |
| Australia | 2.9% | |
| Other | 18.2% | |

* Includes Short-Term investments and Net Other Assets (Liabilities).
Percentages are based on country or territory of incorporation and are adjusted for the effect of futures contracts, if applicable.
Asset Allocation as of September 30, 2019
| % of fund's net assets | |
| Stocks | 97.9 |
| Short-Term Investments and Net Other Assets (Liabilities) | 2.1 |
Top Ten Stocks as of September 30, 2019
| % of fund's net assets | |
| Nestle SA (Reg. S) (Switzerland, Food Products) | 2.4 |
| Roche Holding AG (participation certificate) (Switzerland, Pharmaceuticals) | 2.4 |
| The Toronto-Dominion Bank (Canada, Banks) | 1.7 |
| LVMH Moet Hennessy Louis Vuitton SE (France, Textiles, Apparel & Luxury Goods) | 1.5 |
| Unilever NV (Netherlands, Personal Products) | 1.5 |
| AstraZeneca PLC (United Kingdom) (United Kingdom, Pharmaceuticals) | 1.4 |
| Sanofi SA (France, Pharmaceuticals) | 1.3 |
| Diageo PLC (United Kingdom, Beverages) | 1.3 |
| SAP SE (Germany, Software) | 1.2 |
| Hoya Corp. (Japan, Health Care Equipment & Supplies) | 1.2 |
| 15.9 |
Top Market Sectors as of September 30, 2019
| % of fund's net assets | |
| Financials | 19.2 |
| Industrials | 16.3 |
| Health Care | 11.4 |
| Consumer Staples | 11.2 |
| Consumer Discretionary | 10.4 |
| Information Technology | 6.5 |
| Materials | 6.2 |
| Energy | 5.9 |
| Communication Services | 4.7 |
| Utilities | 3.3 |
Schedule of Investments September 30, 2019
Showing Percentage of Net Assets
| Common Stocks - 97.1% | |||
| Shares | Value | ||
| Australia - 2.9% | |||
| Abacus Property Group unit | 1,361,524 | $3,602,326 | |
| AGL Energy Ltd. | 202,597 | 2,619,993 | |
| Aub Group Ltd. | 470,647 | 3,710,306 | |
| Australia & New Zealand Banking Group Ltd. | 315,929 | 6,081,499 | |
| Coles Group Ltd. | 621,299 | 6,457,925 | |
| Commonwealth Bank of Australia | 397,554 | 21,689,039 | |
| CSL Ltd. | 98,100 | 15,473,221 | |
| Inghams Group Ltd. | 2,588,851 | 5,504,137 | |
| Woodside Petroleum Ltd. | 305,715 | 6,681,365 | |
| TOTAL AUSTRALIA | 71,819,811 | ||
| Austria - 0.9% | |||
| Erste Group Bank AG | 693,191 | 22,923,191 | |
| Bailiwick of Jersey - 1.5% | |||
| Experian PLC | 734,600 | 23,474,881 | |
| Glencore Xstrata PLC | 4,163,181 | 12,545,955 | |
| Sanne Group PLC | 134,300 | 896,648 | |
| TOTAL BAILIWICK OF JERSEY | 36,917,484 | ||
| Belgium - 1.8% | |||
| KBC Groep NV | 441,885 | 28,714,933 | |
| Umicore SA | 396,864 | 14,994,810 | |
| TOTAL BELGIUM | 43,709,743 | ||
| Bermuda - 0.3% | |||
| Credicorp Ltd. (United States) | 9,000 | 1,875,960 | |
| Hiscox Ltd. | 129,000 | 2,632,958 | |
| IHS Markit Ltd. (a) | 53,300 | 3,564,704 | |
| TOTAL BERMUDA | 8,073,622 | ||
| Brazil - 0.1% | |||
| IRB Brasil Resseguros SA | 214,800 | 1,946,923 | |
| Canada - 7.8% | |||
| ATCO Ltd. Class I (non-vtg.) | 46,000 | 1,683,270 | |
| Barrick Gold Corp. (Canada) | 755,109 | 13,063,440 | |
| Canadian Natural Resources Ltd. | 329,500 | 8,766,936 | |
| Canadian Pacific Railway Ltd. | 95,900 | 21,311,755 | |
| Canadian Utilities Ltd. Class A (non-vtg.) | 68,900 | 2,030,830 | |
| Cenovus Energy, Inc. (Canada) | 1,190,800 | 11,172,317 | |
| Constellation Software, Inc. | 3,900 | 3,894,996 | |
| Emera, Inc. | 72,800 | 3,195,870 | |
| First Quantum Minerals Ltd. | 1,078,000 | 9,056,225 | |
| Fortis, Inc. | 104,900 | 4,434,803 | |
| Hydro One Ltd. (b) | 137,700 | 2,545,400 | |
| Intact Financial Corp. | 238,200 | 23,973,724 | |
| Lundin Mining Corp. | 3,586,100 | 16,863,345 | |
| Pembina Pipeline Corp. | 203,600 | 7,547,116 | |
| Suncor Energy, Inc. | 543,500 | 17,143,726 | |
| The Toronto-Dominion Bank | 724,200 | 42,227,007 | |
| TOTAL CANADA | 188,910,760 | ||
| Cayman Islands - 0.9% | |||
| Cheung Kong Property Holdings Ltd. | 1,342,000 | 9,091,979 | |
| Hansoh Pharmaceutical Group Co. Ltd. (b) | 340,000 | 1,041,122 | |
| HKBN Ltd. | 3,509,500 | 6,465,823 | |
| Tencent Holdings Ltd. | 84,800 | 3,547,008 | |
| Wuxi Biologics (Cayman), Inc. (a)(b) | 135,500 | 1,383,059 | |
| TOTAL CAYMAN ISLANDS | 21,528,991 | ||
| China - 0.2% | |||
| PICC Property & Casualty Co. Ltd. (H Shares) | 4,135,000 | 4,827,341 | |
| Denmark - 0.9% | |||
| A.P. Moller - Maersk A/S Series B | 16,154 | 18,261,017 | |
| DSV A/S | 37,000 | 3,520,697 | |
| TOTAL DENMARK | 21,781,714 | ||
| France - 9.3% | |||
| ALTEN | 18,900 | 2,158,886 | |
| Amundi SA (b) | 254,800 | 17,774,033 | |
| Capgemini SA | 84,100 | 9,908,964 | |
| Danone SA | 53,000 | 4,668,331 | |
| Edenred SA | 43,100 | 2,068,390 | |
| EDF SA | 267,300 | 2,992,099 | |
| Elior SA (b) | 52,500 | 697,541 | |
| ENGIE | 395,980 | 6,465,344 | |
| Essilor International SA | 15,000 | 2,162,188 | |
| LVMH Moet Hennessy Louis Vuitton SE | 91,845 | 36,440,405 | |
| Pernod Ricard SA | 87,500 | 15,583,560 | |
| Sanofi SA | 346,355 | 32,083,832 | |
| SMCP S.A.S. (a)(b) | 197,100 | 2,736,923 | |
| SR Teleperformance SA | 119,400 | 25,884,852 | |
| Total SA | 548,346 | 28,619,415 | |
| Veolia Environnement SA | 145,000 | 3,676,074 | |
| VINCI SA | 200,394 | 21,586,257 | |
| Vivendi SA | 358,140 | 9,829,131 | |
| TOTAL FRANCE | 225,336,225 | ||
| Germany - 10.2% | |||
| adidas AG | 45,900 | 14,290,700 | |
| BASF AG | 217,047 | 15,175,506 | |
| Bayer AG | 98,038 | 6,907,079 | |
| Daimler AG (Germany) | 316,200 | 15,722,577 | |
| Delivery Hero AG (a)(b) | 185,200 | 8,227,762 | |
| Deutsche Borse AG | 131,450 | 20,500,817 | |
| Deutsche Post AG | 802,831 | 26,815,774 | |
| Deutsche Telekom AG | 787,830 | 13,214,277 | |
| E.ON AG | 495,368 | 4,816,268 | |
| Hannover Reuck SE | 20,200 | 3,414,835 | |
| LEG Immobilien AG | 53,359 | 6,106,657 | |
| Linde PLC | 92,712 | 17,987,157 | |
| Rheinmetall AG | 156,800 | 19,833,428 | |
| RWE AG | 135,130 | 4,223,162 | |
| SAP SE | 255,459 | 30,060,721 | |
| Scout24 AG (b) | 84,200 | 4,799,769 | |
| Siemens AG | 255,500 | 27,350,033 | |
| Uniper SE | 79,900 | 2,620,448 | |
| Vonovia SE | 42,100 | 2,136,035 | |
| Wirecard AG | 23,000 | 3,678,854 | |
| TOTAL GERMANY | 247,881,859 | ||
| Hong Kong - 1.4% | |||
| AIA Group Ltd. | 2,755,600 | 25,988,201 | |
| Dah Sing Banking Group Ltd. | 2,904,800 | 3,906,324 | |
| Dah Sing Financial Holdings Ltd. | 1,086,000 | 4,018,271 | |
| TOTAL HONG KONG | 33,912,796 | ||
| Hungary - 0.5% | |||
| OTP Bank PLC | 290,200 | 12,082,134 | |
| India - 0.4% | |||
| Axis Bank Ltd. | 840,197 | 8,146,860 | |
| HDFC Bank Ltd. sponsored ADR | 23,400 | 1,334,970 | |
| TOTAL INDIA | 9,481,830 | ||
| Indonesia - 0.3% | |||
| PT Bank Central Asia Tbk | 1,948,900 | 4,166,898 | |
| PT Bank Rakyat Indonesia Tbk | 13,278,300 | 3,853,934 | |
| TOTAL INDONESIA | 8,020,832 | ||
| Ireland - 1.7% | |||
| DCC PLC (United Kingdom) | 36,800 | 3,210,758 | |
| Greencore Group PLC | 1,314,176 | 3,651,810 | |
| Irish Residential Properties REIT PLC | 2,684,700 | 5,027,192 | |
| James Hardie Industries PLC CDI | 16,333 | 274,056 | |
| Kerry Group PLC Class A | 97,600 | 11,414,480 | |
| Kingspan Group PLC (Ireland) | 30,700 | 1,499,074 | |
| Ryanair Holdings PLC sponsored ADR (a) | 229,780 | 15,252,796 | |
| TOTAL IRELAND | 40,330,166 | ||
| Israel - 0.3% | |||
| Mizrahi Tefahot Bank Ltd. | 267,300 | 6,643,573 | |
| Tel Aviv Stock Exchange Ltd. | 213,957 | 662,874 | |
| TOTAL ISRAEL | 7,306,447 | ||
| Italy - 1.4% | |||
| Banca Generali SpA | 284,084 | 8,762,737 | |
| Davide Campari-Milano SpA | 992,600 | 8,968,821 | |
| Enel SpA | 1,412,336 | 10,549,156 | |
| FinecoBank SpA | 198,200 | 2,098,065 | |
| Recordati SpA | 72,600 | 3,114,571 | |
| TOTAL ITALY | 33,493,350 | ||
| Japan - 19.0% | |||
| A/S One Corp. | 7,300 | 605,938 | |
| Advance Residence Investment Corp. | 2,858 | 9,386,301 | |
| Bandai Namco Holdings, Inc. | 233,500 | 14,560,497 | |
| Chubu Electric Power Co., Inc. | 202,200 | 2,933,041 | |
| Chugai Pharmaceutical Co. Ltd. | 93,100 | 7,275,503 | |
| Chugoku Electric Power Co., Inc. | 134,600 | 1,732,155 | |
| Electric Power Development Co. Ltd. | 90,200 | 2,062,027 | |
| Fanuc Corp. | 126,000 | 23,816,955 | |
| Fast Retailing Co. Ltd. | 16,600 | 9,902,722 | |
| Hennge K.K. (a) | 12,500 | 161,850 | |
| Hitachi High-Technologies Corp. | 107,400 | 6,243,182 | |
| Hoshizaki Corp. | 260,700 | 20,550,062 | |
| Hoya Corp. | 350,700 | 28,723,357 | |
| Isuzu Motors Ltd. | 625,200 | 6,925,590 | |
| JSR Corp. | 990,500 | 15,947,803 | |
| Kansai Electric Power Co., Inc. | 231,800 | 2,596,228 | |
| Kao Corp. | 198,900 | 14,753,793 | |
| Keyence Corp. | 27,550 | 17,148,666 | |
| Minebea Mitsumi, Inc. | 449,400 | 7,174,030 | |
| Mitsubishi Estate Co. Ltd. | 470,000 | 9,088,168 | |
| Mitsubishi UFJ Financial Group, Inc. | 2,567,400 | 13,075,414 | |
| Money Forward, Inc. (a)(c) | 172,500 | 5,738,865 | |
| Nidec Corp. | 40,000 | 5,416,860 | |
| Nintendo Co. Ltd. | 32,947 | 12,272,639 | |
| Nippon Telegraph & Telephone Corp. | 187,287 | 8,960,505 | |
| Nitori Holdings Co. Ltd. | 51,500 | 7,557,606 | |
| NSD Co. Ltd. | 127,600 | 3,678,342 | |
| Olympus Corp. | 209,500 | 2,838,283 | |
| Oracle Corp. Japan | 95,900 | 8,360,196 | |
| ORIX Corp. | 945,700 | 14,146,727 | |
| Otsuka Corp. | 52,600 | 2,105,133 | |
| Persol Holdings Co., Ltd. | 354,800 | 6,743,635 | |
| Recruit Holdings Co. Ltd. | 811,100 | 24,781,946 | |
| Relo Group, Inc. | 51,800 | 1,276,042 | |
| Shinsei Bank Ltd. | 391,500 | 5,724,603 | |
| Shiseido Co. Ltd. | 39,100 | 3,138,133 | |
| SMC Corp. | 49,300 | 21,190,529 | |
| SoftBank Corp. | 381,008 | 15,034,738 | |
| Sony Corp. | 198,300 | 11,721,149 | |
| Subaru Corp. | 247,000 | 6,985,187 | |
| Suzuki Motor Corp. | 40,000 | 1,703,973 | |
| Taiheiyo Cement Corp. | 255,300 | 6,860,274 | |
| Takeda Pharmaceutical Co. Ltd. | 197,895 | 6,790,902 | |
| Terumo Corp. | 291,700 | 9,438,894 | |
| Tokio Marine Holdings, Inc. | 167,300 | 8,975,169 | |
| Tokyo Electric Power Co., Inc. (a) | 495,700 | 2,431,188 | |
| Toyota Motor Corp. | 347,100 | 23,311,322 | |
| Tsuruha Holdings, Inc. | 88,700 | 9,686,359 | |
| Welcia Holdings Co. Ltd. | 42,700 | 2,157,998 | |
| Yahoo! Japan Corp. | 2,230,919 | 6,285,357 | |
| Zozo, Inc. (c) | 140,400 | 3,252,232 | |
| TOTAL JAPAN | 463,228,068 | ||
| Korea (South) - 0.2% | |||
| LG Chemical Ltd. | 3,500 | 874,183 | |
| Samsung Electronics Co. Ltd. | 93,380 | 3,819,709 | |
| TOTAL KOREA (SOUTH) | 4,693,892 | ||
| Luxembourg - 0.5% | |||
| B&M European Value Retail SA | 2,445,876 | 11,409,798 | |
| Eurofins Scientific SA | 2,241 | 1,041,515 | |
| TOTAL LUXEMBOURG | 12,451,313 | ||
| Mexico - 0.0% | |||
| Grupo Financiero Banorte S.A.B. de CV Series O | 161,300 | 866,985 | |
| Netherlands - 7.1% | |||
| AerCap Holdings NV (a) | 339,900 | 18,609,525 | |
| ASML Holding NV (Netherlands) | 108,178 | 26,829,594 | |
| Basic-Fit NV (a)(b) | 286,000 | 8,962,114 | |
| Elastic NV | 38,800 | 3,194,792 | |
| Ferrari NV | 104,000 | 16,045,372 | |
| Heineken NV (Bearer) | 147,000 | 15,887,678 | |
| IMCD Group BV | 44,600 | 3,298,309 | |
| Koninklijke Philips Electronics NV | 352,185 | 16,274,141 | |
| NIBC Holding NV (b) | 961,636 | 7,525,610 | |
| NXP Semiconductors NV | 96,500 | 10,530,080 | |
| Prosus NV (a) | 8,800 | 645,992 | |
| QIAGEN NV (Germany) (a) | 46,800 | 1,532,330 | |
| Takeaway.com Holding BV (a)(b) | 69,100 | 5,513,098 | |
| Unilever NV | 470,025 | 28,223,781 | |
| Unilever NV (NY Reg.) | 118,300 | 7,101,549 | |
| Wolters Kluwer NV | 33,700 | 2,460,263 | |
| TOTAL NETHERLANDS | 172,634,228 | ||
| Norway - 0.6% | |||
| Adevinta ASA: | |||
| Class A (a) | 75,700 | 877,015 | |
| Class B | 365,000 | 4,220,650 | |
| Equinor ASA | 167,200 | 3,180,377 | |
| Schibsted ASA: | |||
| (A Shares) | 64,400 | 1,904,892 | |
| (B Shares) | 130,300 | 3,652,207 | |
| TOTAL NORWAY | 13,835,141 | ||
| Poland - 0.5% | |||
| Bank Polska Kasa Opieki SA | 497,600 | 12,706,476 | |
| Portugal - 0.2% | |||
| Galp Energia SGPS SA Class B | 257,724 | 3,875,949 | |
| Singapore - 1.0% | |||
| Parkway Life REIT | 3,209,400 | 7,267,968 | |
| United Overseas Bank Ltd. | 647,613 | 12,023,116 | |
| UOL Group Ltd. | 920,800 | 4,996,563 | |
| TOTAL SINGAPORE | 24,287,647 | ||
| South Africa - 0.1% | |||
| Naspers Ltd. Class N | 8,800 | 1,332,401 | |
| Spain - 1.1% | |||
| Amadeus IT Holding SA Class A | 36,400 | 2,607,387 | |
| Cellnex Telecom SA (b) | 198,568 | 8,202,666 | |
| Enagas SA | 87,700 | 2,032,214 | |
| Endesa SA | 124,700 | 3,281,031 | |
| Iberdrola SA | 417,600 | 4,340,436 | |
| Laboratorios Farmaceuticos ROVI SA | 84,004 | 2,005,168 | |
| Masmovil Ibercom SA (a) | 239,470 | 4,865,232 | |
| TOTAL SPAIN | 27,334,134 | ||
| Sweden - 1.3% | |||
| AddTech AB (B Shares) | 47,200 | 1,227,462 | |
| ASSA ABLOY AB (B Shares) | 126,000 | 2,801,127 | |
| EQT AB (a) | 249,100 | 2,213,396 | |
| Hexagon AB (B Shares) | 48,800 | 2,352,739 | |
| Indutrade AB | 97,300 | 2,728,024 | |
| John Mattson Fastighetsforetag (a) | 322,069 | 3,782,099 | |
| Lundin Petroleum AB | 123,873 | 3,715,919 | |
| Svenska Handelsbanken AB (A Shares) | 284,300 | 2,659,650 | |
| Swedish Match Co. AB | 75,600 | 3,126,433 | |
| Telefonaktiebolaget LM Ericsson (B Shares) | 911,339 | 7,278,259 | |
| TOTAL SWEDEN | 31,885,108 | ||
| Switzerland - 7.3% | |||
| Alcon, Inc. (a) | 128,189 | 7,472,137 | |
| Julius Baer Group Ltd. | 59,900 | 2,653,026 | |
| Lonza Group AG | 26,100 | 8,823,346 | |
| Nestle SA (Reg. S) | 549,088 | 59,551,085 | |
| Roche Holding AG (participation certificate) | 197,950 | 57,636,054 | |
| Sonova Holding AG Class B | 48,775 | 11,337,909 | |
| Swiss Re Ltd. | 30,000 | 3,129,102 | |
| Zurich Insurance Group Ltd. | 67,686 | 25,924,277 | |
| TOTAL SWITZERLAND | 176,526,936 | ||
| Taiwan - 0.1% | |||
| Taiwan Semiconductor Manufacturing Co. Ltd. | 269,000 | 2,387,478 | |
| United Kingdom - 12.6% | |||
| AstraZeneca PLC (United Kingdom) | 384,100 | 34,295,949 | |
| Beazley PLC | 2,110,300 | 16,139,154 | |
| BP PLC | 4,535,319 | 28,712,039 | |
| British American Tobacco PLC (United Kingdom) | 157,681 | 5,823,201 | |
| Centrica PLC | 2,140,800 | 1,941,000 | |
| Cineworld Group PLC | 562,800 | 1,577,739 | |
| Compass Group PLC | 172,100 | 4,428,603 | |
| Cranswick PLC | 136,193 | 4,936,606 | |
| Dechra Pharmaceuticals PLC | 175,500 | 5,972,957 | |
| Diageo PLC | 766,457 | 31,310,020 | |
| Diploma PLC | 115,100 | 2,353,498 | |
| Grainger Trust PLC | 1,319,878 | 3,992,226 | |
| Hotel Chocolat Group Ltd. (c) | 965,900 | 4,489,212 | |
| HSBC Holdings PLC (United Kingdom) | 901,400 | 6,906,762 | |
| InterContinental Hotel Group PLC | 57,100 | 3,563,349 | |
| Intertek Group PLC | 40,700 | 2,741,338 | |
| John David Group PLC | 1,665,500 | 15,387,286 | |
| London Stock Exchange Group PLC | 44,400 | 3,987,108 | |
| Mondi PLC | 70,900 | 1,358,188 | |
| Prudential PLC | 1,480,843 | 26,834,705 | |
| RELX PLC (London Stock Exchange) | 112,000 | 2,661,238 | |
| Rentokil Initial PLC | 490,300 | 2,820,125 | |
| Rolls-Royce Holdings PLC | 1,241,675 | 12,065,167 | |
| Rotork PLC | 4,866,257 | 18,637,999 | |
| Royal Dutch Shell PLC: | |||
| Class A (United Kingdom) | 414,527 | 12,157,233 | |
| Class B (United Kingdom) | 281,171 | 8,310,136 | |
| Scottish & Southern Energy PLC | 274,800 | 4,203,848 | |
| Smith & Nephew PLC | 456,635 | 10,996,648 | |
| Spectris PLC | 9,360 | 281,270 | |
| Standard Life PLC | 3,000,524 | 10,544,003 | |
| Victrex PLC | 381,900 | 10,133,216 | |
| Vodafone Group PLC | 3,770,500 | 7,511,993 | |
| TOTAL UNITED KINGDOM | 307,073,816 | ||
| United States of America - 2.7% | |||
| Alphabet, Inc. Class C (a) | 1,400 | 1,706,600 | |
| Altria Group, Inc. | 168,000 | 6,871,200 | |
| Becton, Dickinson & Co. | 8,600 | 2,175,456 | |
| Boston Beer Co., Inc. Class A (a) | 13,900 | 5,060,712 | |
| Boston Scientific Corp. (a) | 53,900 | 2,193,191 | |
| Constellation Brands, Inc. Class A (sub. vtg.) | 26,500 | 5,492,920 | |
| Global Payments, Inc. | 15,310 | 2,434,290 | |
| International Flavors & Fragrances, Inc. (c) | 164,200 | 20,145,698 | |
| Kosmos Energy Ltd. | 638,200 | 3,982,368 | |
| Marsh & McLennan Companies, Inc. | 31,400 | 3,141,570 | |
| Moody's Corp. | 9,400 | 1,925,402 | |
| Philip Morris International, Inc. | 86,300 | 6,552,759 | |
| Roper Technologies, Inc. | 6,100 | 2,175,260 | |
| S&P Global, Inc. | 10,900 | 2,670,282 | |
| TOTAL UNITED STATES OF AMERICA | 66,527,708 | ||
| TOTAL COMMON STOCKS | |||
| (Cost $2,085,387,757) | 2,361,932,499 | ||
| Nonconvertible Preferred Stocks - 0.8% | |||
| Germany - 0.8% | |||
| Henkel AG & Co. KGaA | 17,600 | 1,741,827 | |
| Porsche Automobil Holding SE (Germany) | 262,400 | 17,010,577 | |
| TOTAL NONCONVERTIBLE PREFERRED STOCKS | |||
| (Cost $15,507,458) | 18,752,404 | ||
| Investment Companies - 0.0% | |||
| United States of America - 0.0% | |||
| iShares MSCI Japan ETF | |||
| (Cost $1,572,848) | 27,800 | 1,577,372 | |
| Principal Amount | Value | ||
| Government Obligations - 0.2% | |||
| United States of America - 0.2% | |||
| U.S. Treasury Bills, yield at date of purchase 1.92% 12/12/19 (Cost $4,692,041) | 4,710,000 | 4,693,221 | |
| Shares | Value | ||
| Money Market Funds - 2.5% | |||
| Fidelity Cash Central Fund 1.96% (d) | 34,468,710 | 34,475,603 | |
| Fidelity Securities Lending Cash Central Fund 1.96% (d)(e) | 25,940,193 | 25,942,787 | |
| TOTAL MONEY MARKET FUNDS | |||
| (Cost $60,418,389) | 60,418,390 | ||
| TOTAL INVESTMENT IN SECURITIES - 100.6% | |||
| (Cost $2,167,578,493) | 2,447,373,886 | ||
| NET OTHER ASSETS (LIABILITIES) - (0.6)% | (14,588,234) | ||
| NET ASSETS - 100% | $2,432,785,652 |
Security Type Abbreviations
ETF – Exchange-Traded Fund
Categorizations in the Schedule of Investments are based on country or territory of incorporation.
Legend
(a) Non-income producing
(b) Security exempt from registration under Rule 144A of the Securities Act of 1933. These securities may be resold in transactions exempt from registration, normally to qualified institutional buyers. At the end of the period, the value of these securities amounted to $69,409,097 or 2.9% of net assets.
(c) Security or a portion of the security is on loan at period end.
(d) Affiliated fund that is generally available only to investment companies and other accounts managed by Fidelity Investments. The rate quoted is the annualized seven-day yield of the fund at period end. A complete unaudited listing of the fund's holdings as of its most recent quarter end is available upon request. In addition, each Fidelity Central Fund's financial statements, which are not covered by the Fund's Report of Independent Registered Public Accounting Firm, are available on the SEC's website or upon request.
(e) Investment made with cash collateral received from securities on loan.
Affiliated Central Funds
Information regarding fiscal year to date income earned by the Fund from investments in Fidelity Central Funds is as follows:
| Fund | Income earned |
| Fidelity Cash Central Fund | $1,252,454 |
| Fidelity Securities Lending Cash Central Fund | 517,974 |
| Total | $1,770,428 |
Amounts in the income column in the above table include any capital gain distributions from underlying funds, which are presented in the corresponding line-item in the Statement of Operations, if applicable. Amount for Fidelity Securities Lending Cash Central Fund represents the income earned on investing cash collateral, less rebates paid to borrowers and any lending agent fees associated with the loan, plus any premium payments received for lending certain types of securities.
Investment Valuation
The following is a summary of the inputs used, as of September 30, 2019, involving the Fund's assets and liabilities carried at fair value. The inputs or methodology used for valuing securities may not be an indication of the risk associated with investing in those securities. For more information on valuation inputs, and their aggregation into the levels used below, please refer to the Investment Valuation section in the accompanying Notes to Financial Statements.
| Valuation Inputs at Reporting Date: | ||||
| Description | Total | Level 1 | Level 2 | Level 3 |
| Investments in Securities: | ||||
| Equities: | ||||
| Communication Services | $110,128,472 | $43,301,955 | $66,826,517 | $-- |
| Consumer Discretionary | 249,850,972 | 101,155,359 | 148,695,613 | -- |
| Consumer Staples | 272,154,330 | 112,841,629 | 159,312,701 | -- |
| Energy | 143,864,896 | 90,809,539 | 53,055,357 | -- |
| Financials | 471,230,158 | 313,853,699 | 157,376,459 | -- |
| Health Care | 277,432,562 | 63,565,982 | 213,866,580 | -- |
| Industrials | 398,550,642 | 206,813,024 | 191,737,618 | -- |
| Information Technology | 159,654,022 | 49,661,736 | 109,992,286 | -- |
| Materials | 155,279,856 | 89,755,508 | 65,524,348 | -- |
| Real Estate | 65,753,556 | 46,003,045 | 19,750,511 | -- |
| Utilities | 76,785,437 | 41,238,364 | 35,547,073 | -- |
| Investment Companies | 1,577,372 | 1,577,372 | -- | -- |
| Government Obligations | 4,693,221 | -- | 4,693,221 | -- |
| Money Market Funds | 60,418,390 | 60,418,390 | -- | -- |
| Total Investments in Securities: | $2,447,373,886 | $1,220,995,602 | $1,226,378,284 | $-- |
See accompanying notes which are an integral part of the financial statements.
Financial Statements
Statement of Assets and Liabilities
| September 30, 2019 | ||
| Assets | ||
| Investment in securities, at value (including securities loaned of $25,497,271) — See accompanying schedule: Unaffiliated issuers (cost $2,107,160,104) | $2,386,955,496 | |
| Fidelity Central Funds (cost $60,418,389) | 60,418,390 | |
| Total Investment in Securities (cost $2,167,578,493) | $2,447,373,886 | |
| Cash | 56,470 | |
| Foreign currency held at value (cost $24,732) | 45,602 | |
| Receivable for investments sold | 5,443,117 | |
| Receivable for fund shares sold | 92,360 | |
| Dividends receivable | 13,496,752 | |
| Distributions receivable from Fidelity Central Funds | 106,152 | |
| Other receivables | 18,572,882 | |
| Total assets | 2,485,187,221 | |
| Liabilities | ||
| Payable for investments purchased | $6,189,596 | |
| Payable for fund shares redeemed | 1,428,996 | |
| Other payables and accrued expenses | 18,841,052 | |
| Collateral on securities loaned | 25,941,925 | |
| Total liabilities | 52,401,569 | |
| Net Assets | $2,432,785,652 | |
| Net Assets consist of: | ||
| Paid in capital | $2,219,818,527 | |
| Total accumulated earnings (loss) | 212,967,125 | |
| Net Assets, for 31,219,991 shares outstanding | $2,432,785,652 | |
| Net Asset Value, offering price and redemption price per share ($2,432,785,652 ÷ 31,219,991 shares) | $77.92 |
See accompanying notes which are an integral part of the financial statements.
Statement of Operations
| Year ended September 30, 2019 | ||
| Investment Income | ||
| Dividends | $77,397,395 | |
| Interest | 51,660 | |
| Income from Fidelity Central Funds (including $517,974 from security lending) | 1,770,428 | |
| Income before foreign taxes withheld | 79,219,483 | |
| Less foreign taxes withheld | (7,128,032) | |
| Total income | 72,091,451 | |
| Expenses | ||
| Custodian fees and expenses | $262,461 | |
| Independent directors' fees and expenses | 13,968 | |
| Interest | 26,753 | |
| Miscellaneous | 27 | |
| Total expenses | 303,209 | |
| Net investment income (loss) | 71,788,242 | |
| Realized and Unrealized Gain (Loss) | ||
| Net realized gain (loss) on: | ||
| Investment securities: | ||
| Unaffiliated issuers (net of foreign taxes of $141,894) | (64,239,258) | |
| Fidelity Central Funds | 1,903 | |
| Foreign currency transactions | (144,028) | |
| Futures contracts | (321,265) | |
| Total net realized gain (loss) | (64,702,648) | |
| Change in net unrealized appreciation (depreciation) on: | ||
| Investment securities: | ||
| Unaffiliated issuers (net of increase in deferred foreign taxes of $123,125) | (16,517,513) | |
| Fidelity Central Funds | (180) | |
| Assets and liabilities in foreign currencies | (79,022) | |
| Futures contracts | (89,405) | |
| Total change in net unrealized appreciation (depreciation) | (16,686,120) | |
| Net gain (loss) | (81,388,768) | |
| Net increase (decrease) in net assets resulting from operations | $(9,600,526) |
See accompanying notes which are an integral part of the financial statements.
Statement of Changes in Net Assets
| Year ended September 30, 2019 | Year ended September 30, 2018 | |
| Increase (Decrease) in Net Assets | ||
| Operations | ||
| Net investment income (loss) | $71,788,242 | $76,845,009 |
| Net realized gain (loss) | (64,702,648) | 162,484,178 |
| Change in net unrealized appreciation (depreciation) | (16,686,120) | (160,419,767) |
| Net increase (decrease) in net assets resulting from operations | (9,600,526) | 78,909,420 |
| Distributions to shareholders | (181,492,635) | – |
| Distributions to shareholders from net investment income | – | (77,089,559) |
| Distributions to shareholders from net realized gain | – | (90,648,501) |
| Total distributions | (181,492,635) | (167,738,060) |
| Affiliated share transactions | ||
| Proceeds from sales of shares | 170,137,375 | 371,362,580 |
| Reinvestment of distributions | 181,492,635 | 167,738,059 |
| Cost of shares redeemed | (372,812,401) | (899,594,488) |
| Net increase (decrease) in net assets resulting from share transactions | (21,182,391) | (360,493,849) |
| Total increase (decrease) in net assets | (212,275,552) | (449,322,489) |
| Net Assets | ||
| Beginning of period | 2,645,061,204 | 3,094,383,693 |
| End of period | $2,432,785,652 | $2,645,061,204 |
| Other Information | ||
| Undistributed net investment income end of period | $3,625,716 | |
| Shares | ||
| Sold | 2,256,424 | 4,209,064 |
| Issued in reinvestment of distributions | 2,549,322 | 1,939,830 |
| Redeemed | (4,869,713) | (10,247,744) |
| Net increase (decrease) | (63,967) | (4,098,850) |
See accompanying notes which are an integral part of the financial statements.
Financial Highlights
Fidelity International Equity Central Fund
| Years ended September 30, | 2019 | 2018 | 2017 | 2016 | 2015 |
| Selected Per–Share Data | |||||
| Net asset value, beginning of period | $84.55 | $87.45 | $74.96 | $71.96 | $79.13 |
| Income from Investment Operations | |||||
| Net investment income (loss)A | 2.23 | 2.30 | 2.18 | 2.09 | 2.13 |
| Net realized and unrealized gain (loss) | (3.09) | (.27)B | 12.27 | 2.87 | (7.28) |
| Total from investment operations | (.86) | 2.03 | 14.45 | 4.96 | (5.15) |
| Distributions from net investment income | (2.12) | (2.34) | (1.92) | (1.96) | (2.02) |
| Distributions from net realized gain | (3.65) | (2.60) | (.03) | – | – |
| Total distributions | (5.77) | (4.93)C | (1.96)D | (1.96) | (2.02) |
| Net asset value, end of period | $77.92 | $84.55 | $87.45 | $74.96 | $71.96 |
| Total ReturnE | (.21)% | 2.30% | 19.54% | 6.95% | (6.78)% |
| Ratios to Average Net AssetsF,G | |||||
| Expenses before reductions | .01% | .01% | .01% | .01% | .01% |
| Expenses net of fee waivers, if any | .01% | .01% | .01% | .01% | .01% |
| Expenses net of all reductions | .01% | .01% | .01% | .01% | .01% |
| Net investment income (loss) | 2.93% | 2.63% | 2.74% | 2.87% | 2.67% |
| Supplemental Data | |||||
| Net assets, end of period (000 omitted) | $2,432,786 | $2,645,061 | $3,094,384 | $2,138,296 | $2,104,932 |
| Portfolio turnover rateH | 70% | 53% | 61% | 59% | 81% |
A Calculated based on average shares outstanding during the period.
B The amount shown for a share outstanding does not correspond with the aggregate net gain (loss) on investments for the period due to the timing of sales and repurchases of shares in relation to fluctuating market values of the investments of the Fund.
C Total distributions of $4.93 per share is comprised of distributions from net investment income of $2.338 and distributions from net realized gain of $2.595 per share.
D Total distributions of $1.96 per share is comprised of distributions from net investment income of $1.921 and distributions from net realized gain of $.034 per share.
E Total returns would have been lower if certain expenses had not been reduced during the applicable periods shown.
F Fees and expenses of any underlying Fidelity Central Funds are not included in the Fund's expense ratio. The Fund indirectly bears its proportionate share of the expenses of any underlying Fidelity Central Funds.
G Expense ratios reflect operating expenses of the Fund. Expenses before reductions do not reflect amounts reimbursed by the investment adviser or reductions from expense offset arrangements and do not represent the amount paid by the Fund during periods when reimbursements or reductions occur. Expenses net of fee waivers reflect expenses after reimbursement by the investment adviser but prior to reductions from expense offset arrangements. Expenses net of all reductions represent the net expenses paid by the Fund.
H Amount does not include the portfolio activity of any underlying Fidelity Central Funds.
See accompanying notes which are an integral part of the financial statements.
Notes to Financial Statements
For the period ended September 30, 2019
1. Organization.
Fidelity International Equity Central Fund (the Fund) is a fund of Fidelity Central Investment Portfolios LLC (the LLC) and is authorized to issue an unlimited number of shares. Shares of the Fund are only offered to other investment companies and accounts managed by Fidelity Management & Research Company (FMR), or its affiliates (the Investing Funds). The LLC is registered under the Investment Company Act of 1940, as amended (the 1940 Act), as an open-end management investment company organized as a Delaware Limited Liability Company.
2. Investments in Fidelity Central Funds.
The Fund invests in Fidelity Central Funds, which are open-end investment companies generally available only to other investment companies and accounts managed by the investment adviser and its affiliates. The Fund's Schedule of Investments lists each of the Fidelity Central Funds held as of period end, if any, as an investment of the Fund, but does not include the underlying holdings of each Fidelity Central Fund. As an Investing Fund, the Fund indirectly bears its proportionate share of the expenses of the underlying Fidelity Central Funds.
The Money Market Central Funds seek preservation of capital and current income and are managed by Fidelity Investments Money Management, Inc. (FIMM), an affiliate of the investment adviser. Annualized expenses of the Money Market Central Funds as of their most recent shareholder report date ranged from less than .005% to .01%.
A complete unaudited list of holdings for each Fidelity Central Fund is available upon request or at the Securities and Exchange Commission (the SEC) website at www.sec.gov. In addition, the financial statements of the Fidelity Central Funds, which are not covered by the Fund's Report of Independent Registered Public Accounting Firm, are available on the SEC website or upon request.
3. Significant Accounting Policies.
The Fund is an investment company and applies the accounting and reporting guidance of the Financial Accounting Standards Board (FASB) Accounting Standards Codification Topic 946 Financial Services – Investments Companies. The financial statements have been prepared in conformity with accounting principles generally accepted in the United States of America (GAAP), which require management to make certain estimates and assumptions at the date of the financial statements. Actual results could differ from those estimates. Subsequent events, if any, through the date that the financial statements were issued have been evaluated in the preparation of the financial statements. The following summarizes the significant accounting policies of the Fund:
Investment Valuation. Investments are valued as of 4:00 p.m. Eastern time on the last calendar day of the period. The Board of Directors (the Board) has delegated the day to day responsibility for the valuation of the Fund's investments to the Fair Value Committee (the Committee) established by the Fund's investment adviser. In accordance with valuation policies and procedures approved by the Board, the Fund attempts to obtain prices from one or more third party pricing vendors or brokers to value its investments. When current market prices, quotations or currency exchange rates are not readily available or reliable, investments will be fair valued in good faith by the Committee, in accordance with procedures adopted by the Board. Factors used in determining fair value vary by investment type and may include market or investment specific events, changes in interest rates and credit quality. The frequency with which these procedures are used cannot be predicted and they may be utilized to a significant extent. The Committee oversees the Fund's valuation policies and procedures and reports to the Board on the Committee's activities and fair value determinations. The Board monitors the appropriateness of the procedures used in valuing the Fund's investments and ratifies the fair value determinations of the Committee.
The Fund categorizes the inputs to valuation techniques used to value its investments into a disclosure hierarchy consisting of three levels as shown below:
- Level 1 – quoted prices in active markets for identical investments
- Level 2 – other significant observable inputs (including quoted prices for similar investments, interest rates, prepayment speeds, etc.)
- Level 3 – unobservable inputs (including the Fund's own assumptions based on the best information available)
Valuation techniques used to value the Fund's investments by major category are as follows:
Equity securities, including restricted securities, for which market quotations are readily available, are valued at the last reported sale price or official closing price as reported by a third party pricing vendor on the primary market or exchange on which they are traded and are categorized as Level 1 in the hierarchy. In the event there were no sales during the day or closing prices are not available, securities are valued at the last quoted bid price or may be valued using the last available price and are generally categorized as Level 2 in the hierarchy. For foreign equity securities, when market or security specific events arise, comparisons to the valuation of American Depositary Receipts (ADRs), futures contracts, Exchange-Traded Funds (ETFs) and certain indexes as well as quoted prices for similar securities may be used and would be categorized as Level 2 in the hierarchy. For equity securities, including restricted securities, where observable inputs are limited, assumptions about market activity and risk are used and these securities may be categorized as Level 3 in the hierarchy.
Debt securities, including restricted securities, are valued based on evaluated prices received from third party pricing vendors or from brokers who make markets in such securities. U.S. government and government agency obligations are valued by pricing vendors who utilize matrix pricing which considers yield or price of bonds of comparable quality, coupon, maturity and type or by broker-supplied prices. When independent prices are unavailable or unreliable, debt securities may be valued utilizing pricing methodologies which consider similar factors that would be used by third party pricing vendors. Debt securities are generally categorized as Level 2 in the hierarchy but may be Level 3 depending on the circumstances. ETFs are valued at their last sale price or official closing price as reported by a third party pricing vendor on the primary market or exchange on which they are traded and are categorized as Level 1 in the hierarchy. In the event there were no sales during the day but the exchange reports a closing bid level, ETFs are valued at the closing bid and would be categorized as Level 1 in the hierarchy. In the event there was no closing bid, ETFs may be valued by another method that the Board believes reflects fair value in accordance with the Board's fair value pricing policies and may be categorized as Level 2 in the hierarchy.
Investments in open-end mutual funds, including the Fidelity Central Funds, are valued at their closing net asset value (NAV) each business day and are categorized as Level 1 in the hierarchy.
Changes in valuation techniques may result in transfers in or out of an assigned level within the disclosure hierarchy. The aggregate value of investments by input level as of September 30, 2019 is included at the end of the Fund's Schedule of Investments.
Foreign Currency. The Fund may use foreign currency contracts to facilitate transactions in foreign-denominated securities. Gains and losses from these transactions may arise from changes in the value of the foreign currency or if the counterparties do not perform under the contracts' terms.
Foreign-denominated assets, including investment securities, and liabilities are translated into U.S. dollars at the exchange rates at period end. Purchases and sales of investment securities, income and dividends received and expenses denominated in foreign currencies are translated into U.S. dollars at the exchange rate in effect on the transaction date.
The effects of exchange rate fluctuations on investments are included with the net realized and unrealized gain (loss) on investment securities. Other foreign currency transactions resulting in realized and unrealized gain (loss) are disclosed separately.
Investment Transactions and Income. For financial reporting purposes, the Fund's investment holdings and NAV include trades executed through the end of the last business day of the period. The NAV per share for processing shareholder transactions is calculated as of the close of business of the New York Stock Exchange (NYSE), normally 4:00 p.m. Eastern time and includes trades executed through the end of the prior business day. Gains and losses on securities sold are determined on the basis of identified cost and include proceeds received from litigation. Dividend income is recorded on the ex-dividend date, except for certain dividends from foreign securities where the ex-dividend date may have passed, which are recorded as soon as the Fund is informed of the ex-dividend date. Non-cash dividends included in dividend income, if any, are recorded at the fair market value of the securities received. Income and capital gain distributions from Fidelity Central Funds, if any, are recorded on the ex-dividend date. Certain distributions received by the Fund represent a return of capital or capital gain. The Fund determines the components of these distributions subsequent to the ex-dividend date, based upon receipt of tax filings or other correspondence relating to the underlying investment. These distributions are recorded as a reduction of cost of investments and/or as a realized gain. Interest income is accrued as earned and includes coupon interest and amortization of premium and accretion of discount on debt securities as applicable. Investment income is recorded net of foreign taxes withheld where recovery of such taxes is uncertain.
Expenses. Expenses directly attributable to a fund are charged to that fund. Expenses attributable to more than one fund are allocated among the respective funds on the basis of relative net assets or other appropriate methods. Expense estimates are accrued in the period to which they relate and adjustments are made when actual amounts are known.
Income Tax Information and Distributions to Shareholders. Each year, the Fund intends to qualify as a regulated investment company under Subchapter M of the Internal Revenue Code, including distributing substantially all of its taxable income and realized gains. As a result, no provision for U.S. Federal income taxes is required. As of September 30, 2019, the Fund did not have any unrecognized tax benefits in the financial statements; nor is the Fund aware of any tax positions for which it is reasonably possible that the total amounts of unrecognized tax benefits will significantly change in the next twelve months. The Fund files a U.S. federal tax return, in addition to state and local tax returns as required. The Fund's federal income tax returns are subject to examination by the Internal Revenue Service (IRS) for a period of three fiscal years after they are filed. State and local tax returns may be subject to examination for an additional fiscal year depending on the jurisdiction. Foreign taxes are provided for based on the Fund's understanding of the tax rules and rates that exist in the foreign markets in which it invests. The Fund is subject to a tax imposed on capital gains by certain countries in which it invests. An estimated deferred tax liability for net unrealized appreciation on the applicable securities is included in Other payables and accrued expenses on the Statement of Assets & Liabilities.
Distributions are declared and recorded on the ex-dividend date. Income and capital gain distributions are determined in accordance with income tax regulations, which may differ from GAAP. In addition, the Fund claimed a portion of the payment made to redeeming shareholders as a distribution for income tax purposes.
Capital accounts within the financial statements are adjusted for permanent book-tax differences. These adjustments have no impact on net assets or the results of operations. Capital accounts are not adjusted for temporary book-tax differences which will reverse in a subsequent period.
Book-tax differences are primarily due to futures contracts, foreign currency transactions, certain foreign taxes, capital loss carryforwards, certain deemed distributions, passive foreign investment companies (PFIC) and losses deferred due to wash sales.
As of period end, the cost and unrealized appreciation (depreciation) in securities, and derivatives if applicable, for federal income tax purposes were as follows:
| Gross unrealized appreciation | $354,540,554 |
| Gross unrealized depreciation | (87,770,260) |
| Net unrealized appreciation (depreciation) | $266,770,294 |
| Tax Cost | $2,180,603,592 |
The tax-based components of distributable earnings as of period end were as follows:
| Undistributed ordinary income | $13,501,444 |
| Capital loss carryforward | $(66,953,925) |
| Net unrealized appreciation (depreciation) on securities and other investments | $266,558,041 |
Capital loss carryforwards are only available to offset future capital gains of the Fund to the extent provided by regulations and may be limited. Under the Regulated Investment Company Modernization Act of 2010 (the Act), the Fund is permitted to carry forward capital losses incurred in taxable years beginning after December 22, 2010 for an unlimited period and such capital losses are required to be used prior to any losses that expire. The capital loss carryforward information presented below, including any applicable limitation, is estimated as of fiscal period end and is subject to adjustment.
| No expiration | |
| Short-term | $(66,953,925) |
The tax character of distributions paid was as follows:
| September 30, 2019 | September 30, 2018 | |
| Ordinary Income | $79,651,585 | $ 135,740,362 |
| Long-term Capital Gains | 101,841,050 | 31,997,698 |
| Total | $181,492,635 | $ 167,738,060 |
Restricted Securities. The Fund may invest in securities that are subject to legal or contractual restrictions on resale. These securities generally may be resold in transactions exempt from registration or to the public if the securities are registered. Disposal of these securities may involve time-consuming negotiations and expense, and prompt sale at an acceptable price may be difficult. Information regarding restricted securities is included at the end of the Fund's Schedule of Investments.
New Rule Issuance. During August 2018, the U.S. Securities and Exchange Commission issued Final Rule Release No. 33-10532, Disclosure Update and Simplification. This Final Rule includes amendments specific to registered investment companies that are intended to eliminate overlap in disclosure requirements between Regulation S-X and GAAP. In accordance with these amendments, certain line-items in the Fund's financial statements have been combined or removed for the current period as outlined in the table below.
| Financial Statement | Current Line-Item Presentation (As Applicable) | Prior Line-Item Presentation (As Applicable) |
| Statement of Assets and Liabilities | Total distributable earnings (loss) | Undistributed/Distributions in excess of/Accumulated net investment income (loss) Accumulated/Undistributed net realized gain (loss) Net unrealized appreciation (depreciation) |
| Statement of Changes in Net Assets | N/A - removed | Undistributed/Distributions in excess of/Accumulated net investment income (loss) end of period |
| Statement of Changes in Net Assets | Distributions to shareholders | Distributions to shareholders from net investment income Distributions to shareholders from net realized gain |
4. Derivative Instruments.
Risk Exposures and the Use of Derivative Instruments. The Fund's investment objective allows the Fund to enter into various types of derivative contracts, including futures contracts. Derivatives are investments whose value is primarily derived from underlying assets, indices or reference rates and may be transacted on an exchange or over-the-counter (OTC). Derivatives may involve a future commitment to buy or sell a specified asset based on specified terms, to exchange future cash flows at periodic intervals based on a notional principal amount, or for one party to make one or more payments upon the occurrence of specified events in exchange for periodic payments from the other party.
The Fund used derivatives to increase returns and to manage exposure to certain risks as defined below. The success of any strategy involving derivatives depends on analysis of numerous economic factors, and if the strategies for investment do not work as intended, the Fund may not achieve its objectives.
The Fund's use of derivatives increased or decreased its exposure to the following risk:
| Equity Risk | Equity risk relates to the fluctuations in the value of financial instruments as a result of changes in market prices (other than those arising from interest rate risk or foreign exchange risk), whether caused by factors specific to an individual investment, its issuer, or all factors affecting all instruments traded in a market or market segment. |
The Fund is also exposed to additional risks from investing in derivatives, such as liquidity risk and counterparty credit risk. Liquidity risk is the risk that the Fund will be unable to close out the derivative in the open market in a timely manner. Counterparty credit risk is the risk that the counterparty will not be able to fulfill its obligation to the Fund. Counterparty credit risk related to exchange-traded futures contracts may be mitigated by the protection provided by the exchange on which they trade.
Investing in derivatives may involve greater risks than investing in the underlying assets directly and, to varying degrees, may involve risk of loss in excess of any initial investment and collateral received and amounts recognized in the Statement of Assets and Liabilities. In addition, there may be the risk that the change in value of the derivative contract does not correspond to the change in value of the underlying instrument.
Futures Contracts. A futures contract is an agreement between two parties to buy or sell a specified underlying instrument for a fixed price at a specified future date. The Fund used futures contracts to manage its exposure to the stock market.
Upon entering into a futures contract, a fund is required to deposit either cash or securities (initial margin) with a clearing broker in an amount equal to a certain percentage of the face value of the contract. Futures contracts are marked-to-market daily and subsequent daily payments (variation margin) are made or received by a fund depending on the daily fluctuations in the value of the futures contracts and are recorded as unrealized appreciation or (depreciation). This receivable and/or payable, if any, is included in daily variation margin on futures contracts in the Statement of Assets and Liabilities. Realized gain or (loss) is recorded upon the expiration or closing of a futures contract. The net realized gain (loss) and change in net unrealized appreciation (depreciation) on futures contracts during the period is presented in the Statement of Operations.
Any open futures contracts at period end are presented in the Schedule of Investments under the caption "Futures Contracts". The notional amount at value reflects each contract's exposure to the underlying instrument or index at period end.
5. Purchases and Sales of Investments.
Purchases and sales of securities, other than short-term securities, aggregated $1,680,577,671 and $1,788,195,875, respectively.
6. Fees and Other Transactions with Affiliates.
Management Fee and Expense Contract. FMR Co., Inc. (the investment adviser), an affiliate of FMR, provides the Fund with investment management services. The Fund does not pay any fees for these services. Pursuant to the Fund's management contract with the investment adviser, FMR pays the investment adviser a portion of the management fees it receives from the Investing Funds. In addition, under an expense contract, FMR also pays all other expenses of the Fund, excluding custody fees, the compensation of the independent Directors, and certain miscellaneous expenses such as proxy and shareholder meeting expenses.
Brokerage Commissions. The Fund placed a portion of its portfolio transactions with brokerage firms which are affiliates of the investment adviser. Brokerage commissions are included in net realized gain (loss) and change in net unrealized appreciation (depreciation) in the Statement of Operations. The commissions paid to these affiliated firms were $5,887 for the period.
Interfund Lending Program. Pursuant to an Exemptive Order issued by the SEC, the Fund, along with other registered investment companies having management contracts with FMR or other affiliated entities of FMR, may participate in an interfund lending program. This program provides an alternative credit facility allowing the funds to borrow from, or lend money to, other participating affiliated funds. At period end, there were no interfund loans outstanding. The Fund's activity in this program during the period for which loans were outstanding was as follows:
| Borrower or Lender | Average Loan Balance | Weighted Average Interest Rate | Interest Expense |
| Borrower | $55,715,857 | 2.47% | $26,753 |
Interfund Trades. The Fund may purchase from or sell securities to other Fidelity Funds under procedures adopted by the Board. The procedures have been designed to ensure these interfund trades are executed in accordance with Rule 17a-7 of the 1940 Act. Interfund trades are included within the respective purchases and sales amounts shown in the Purchases and Sales of Investments note.
7. Security Lending.
The Fund lends portfolio securities from time to time in order to earn additional income. For equity securities, lending agents are used, including National Financial Services (NFS), an affiliate of the Fund. Pursuant to a securities lending agreement, NFS will receive a fee, which is capped at 9.9% of daily lending revenue, for its services as lending agent. The Fund may lend securities to certain qualified borrowers, including NFS. On the settlement date of the loan, the Fund receives collateral (in the form of U.S. Treasury obligations, letters of credit and/or cash) against the loaned securities and maintains collateral in an amount not less than 100% of the market value of the loaned securities during the period of the loan. The market value of the loaned securities is determined at the close of business of the Fund and any additional required collateral is delivered to the Fund on the next business day. The Fund or borrower may terminate the loan at any time, and if the borrower defaults on its obligation to return the securities loaned because of insolvency or other reasons, the Fund may apply collateral received from the borrower against the obligation. The Fund may experience delays and costs in recovering the securities loaned. Any cash collateral received is invested in the Fidelity Securities Lending Cash Central Fund. The value of loaned securities and cash collateral at period end are disclosed on the Fund's Statement of Assets and Liabilities. Total fees paid by the Fund to NFS, as lending agent, amounted to $547. Security lending income represents the income earned on investing cash collateral, less rebates paid to borrowers and any lending agent fees associated with the loan, plus any premium payments received for lending certain types of securities. Security lending income is presented in the Statement of Operations as a component of income from Fidelity Central Funds. During the period, there were no securities loaned to NFS.
8. Other.
The Fund's organizational documents provide former and current directors and officers with a limited indemnification against liabilities arising in connection with the performance of their duties to the Fund. In the normal course of business, the Fund may also enter into contracts that provide general indemnifications. The Fund's maximum exposure under these arrangements is unknown as this would be dependent on future claims that may be made against the Fund. The risk of material loss from such claims is considered remote.
At the end of the period, mutual funds managed by FMR or its affiliates were the owners of record of all of the outstanding shares of the Fund.
Report of Independent Registered Public Accounting Firm
To the Trustees of Fidelity Central Investment Portfolios LLC and the Shareholders of Fidelity International Equity Central Fund:
Opinion on the Financial Statements and Financial Highlights
We have audited the accompanying statement of assets and liabilities of Fidelity International Equity Central Fund (the "Fund"), a fund of Fidelity Central Investment Portfolios LLC, including the schedule of investments, as of September 30, 2019, the related statement of operations for the year then ended, the statement of changes in net assets for each of the two years in the period then ended, the financial highlights for each of the five years in the period then ended, and the related notes. In our opinion, the financial statements and financial highlights present fairly, in all material respects, the financial position of the Fund as of September 30, 2019, the results of its operations for the year then ended, the changes in its net assets for each of the two years in the period then ended, and the financial highlights for each of the five years in the period then ended in conformity with accounting principles generally accepted in the United States of America.
Basis for Opinion
These financial statements and financial highlights are the responsibility of the Fund's management. Our responsibility is to express an opinion on the Fund's financial statements and financial highlights based on our audits. We are a public accounting firm registered with the Public Company Accounting Oversight Board (United States) (PCAOB) and are required to be independent with respect to the Fund in accordance with the U.S. federal securities laws and the applicable rules and regulations of the Securities and Exchange Commission and the PCAOB.
We conducted our audits in accordance with the standards of the PCAOB. Those standards require that we plan and perform the audit to obtain reasonable assurance about whether the financial statements and financial highlights are free of material misstatement, whether due to error or fraud. The Fund is not required to have, nor were we engaged to perform, an audit of its internal control over financial reporting. As part of our audits we are required to obtain an understanding of internal control over financial reporting but not for the purpose of expressing an opinion on the effectiveness of the Fund’s internal control over financial reporting. Accordingly, we express no such opinion.
Our audits included performing procedures to assess the risks of material misstatement of the financial statements and financial highlights, whether due to error or fraud, and performing procedures that respond to those risks. Such procedures included examining, on a test basis, evidence regarding the amounts and disclosures in the financial statements and financial highlights. Our audits also included evaluating the accounting principles used and significant estimates made by management, as well as evaluating the overall presentation of the financial statements and financial highlights. Our procedures included confirmation of securities owned as of September 30, 2019, by correspondence with the custodians and brokers; when replies were not received from brokers, we performed other auditing procedures. We believe that our audits provide a reasonable basis for our opinion.
/s/ Deloitte & Touche LLP
Boston, Massachusetts
November 12, 2019
We have served as the auditor of one or more of the Fidelity investment companies since 1999.
Directors and Officers (Trustees and Officers)
The Trustees, Members of the Advisory Board (if any), and officers of the Fidelity Central Investments Portfolios LLC and fund, as applicable, are listed below. The Board of Trustees governs the fund and is responsible for protecting the interests of shareholders. The Trustees are experienced executives who meet periodically throughout the year to oversee the fund's activities, review contractual arrangements with companies that provide services to the fund, oversee management of the risks associated with such activities and contractual arrangements, and review the fund's performance. Except for Michael E. Wiley, each of the Trustees oversees 298 funds. Mr. Wiley oversees 197 funds.
The Trustees hold office without limit in time except that (a) any Trustee may resign; (b) any Trustee may be removed by written instrument, signed by at least two-thirds of the number of Trustees prior to such removal; (c) any Trustee who requests to be retired or who has become incapacitated by illness or injury may be retired by written instrument signed by a majority of the other Trustees; and (d) any Trustee may be removed at any special meeting of shareholders by a two-thirds vote of the outstanding voting securities of the trust. Each Trustee who is not an interested person (as defined in the 1940 Act) of the trust and the fund is referred to herein as an Independent Trustee. Each Independent Trustee shall retire not later than the last day of the calendar year in which his or her 75th birthday occurs. The Independent Trustees may waive this mandatory retirement age policy with respect to individual Trustees. Officers and Advisory Board Members hold office without limit in time, except that any officer or Advisory Board Member may resign or may be removed by a vote of a majority of the Trustees at any regular meeting or any special meeting of the Trustees. Except as indicated, each individual has held the office shown or other offices in the same company for the past five years.
The fund’s Statement of Additional Information (SAI) includes more information about the Trustees. To request a free copy, call Fidelity at 1-800-544-8544.
Experience, Skills, Attributes, and Qualifications of the Trustees. The Governance and Nominating Committee has adopted a statement of policy that describes the experience, qualifications, attributes, and skills that are necessary and desirable for potential Independent Trustee candidates (Statement of Policy). The Board believes that each Trustee satisfied at the time he or she was initially elected or appointed a Trustee, and continues to satisfy, the standards contemplated by the Statement of Policy. The Governance and Nominating Committee also engages professional search firms to help identify potential Independent Trustee candidates who have the experience, qualifications, attributes, and skills consistent with the Statement of Policy. From time to time, additional criteria based on the composition and skills of the current Independent Trustees, as well as experience or skills that may be appropriate in light of future changes to board composition, business conditions, and regulatory or other developments, have also been considered by the professional search firms and the Governance and Nominating Committee. In addition, the Board takes into account the Trustees' commitment and participation in Board and committee meetings, as well as their leadership of standing and ad hoc committees throughout their tenure.
In determining that a particular Trustee was and continues to be qualified to serve as a Trustee, the Board has considered a variety of criteria, none of which, in isolation, was controlling. The Board believes that, collectively, the Trustees have balanced and diverse experience, qualifications, attributes, and skills, which allow the Board to operate effectively in governing the fund and protecting the interests of shareholders. Information about the specific experience, skills, attributes, and qualifications of each Trustee, which in each case led to the Board's conclusion that the Trustee should serve (or continue to serve) as a trustee of the fund, is provided below.
Board Structure and Oversight Function. James C. Curvey is an interested person and currently serves as Chairman. The Trustees have determined that an interested Chairman is appropriate and benefits shareholders because an interested Chairman has a personal and professional stake in the quality and continuity of services provided to the fund. Independent Trustees exercise their informed business judgment to appoint an individual of their choosing to serve as Chairman, regardless of whether the Trustee happens to be independent or a member of management. The Independent Trustees have determined that they can act independently and effectively without having an Independent Trustee serve as Chairman and that a key structural component for assuring that they are in a position to do so is for the Independent Trustees to constitute a substantial majority for the Board. The Independent Trustees also regularly meet in executive session. Ned C. Lautenbach serves as Chairman of the Independent Trustees and as such (i) acts as a liaison between the Independent Trustees and management with respect to matters important to the Independent Trustees and (ii) with management prepares agendas for Board meetings.
Fidelity® funds are overseen by different Boards of Trustees. The fund's Board oversees Fidelity's high income and certain equity funds, and other Boards oversee Fidelity's investment-grade bond, money market, asset allocation, and other equity funds. The asset allocation funds may invest in Fidelity® funds overseen by the fund's Board. The use of separate Boards, each with its own committee structure, allows the Trustees of each group of Fidelity® funds to focus on the unique issues of the funds they oversee, including common research, investment, and operational issues. On occasion, the separate Boards establish joint committees to address issues of overlapping consequences for the Fidelity® funds overseen by each Board.
The Trustees operate using a system of committees to facilitate the timely and efficient consideration of all matters of importance to the Trustees, the fund, and fund shareholders and to facilitate compliance with legal and regulatory requirements and oversight of the fund's activities and associated risks. The Board, acting through its committees, has charged FMR and its affiliates with (i) identifying events or circumstances the occurrence of which could have demonstrably adverse effects on the fund's business and/or reputation; (ii) implementing processes and controls to lessen the possibility that such events or circumstances occur or to mitigate the effects of such events or circumstances if they do occur; and (iii) creating and maintaining a system designed to evaluate continuously business and market conditions in order to facilitate the identification and implementation processes described in (i) and (ii) above. Because the day-to-day operations and activities of the fund are carried out by or through FMR, its affiliates, and other service providers, the fund's exposure to risks is mitigated but not eliminated by the processes overseen by the Trustees. While each of the Board's committees has responsibility for overseeing different aspects of the fund's activities, oversight is exercised primarily through the Operations, Audit, and Compliance Committees. Appropriate personnel, including but not limited to the fund's Chief Compliance Officer (CCO), FMR's internal auditor, the independent accountants, the fund's Treasurer and portfolio management personnel, make periodic reports to the Board's committees, as appropriate, including an annual review of Fidelity's risk management program for the Fidelity® funds. The responsibilities of each standing committee, including their oversight responsibilities, are described further under "Standing Committees of the Trustees."
Interested Trustees*:
Correspondence intended for a Trustee who is an interested person may be sent to Fidelity Investments, 245 Summer Street, Boston, Massachusetts 02210.
Name, Year of Birth; Principal Occupations and Other Relevant Experience+
James C. Curvey (1935)
Year of Election or Appointment: 2007
Trustee
Chairman of the Board of Trustees
Mr. Curvey also serves as Trustee of other Fidelity® funds. Mr. Curvey is Vice Chairman (2007-present) and Director of FMR LLC (diversified financial services company). In addition, Mr. Curvey is an Overseer Emeritus for the Boston Symphony Orchestra, a Director of Artis-Naples, and a Trustee of Brewster Academy in Wolfeboro, New Hampshire. Previously, Mr. Curvey served as a Director of Fidelity Research & Analysis Co. (investment adviser firm, 2009-2018), Director of Fidelity Investments Money Management, Inc. (investment adviser firm, 2009-2014) and a Director of FMR and FMR Co., Inc. (investment adviser firms, 2007-2014).
* Determined to be an “Interested Trustee” by virtue of, among other things, his or her affiliation with the Fidelity Central Investments Portfolios LLC or various entities under common control with FMR.
+ The information includes the Trustee's principal occupation during the last five years and other information relating to the experience, attributes, and skills relevant to the Trustee's qualifications to serve as a Trustee, which led to the conclusion that the Trustee should serve as a Trustee for the fund.
Independent Trustees:
Correspondence intended for an Independent Trustee may be sent to Fidelity Investments, P.O. Box 55235, Boston, Massachusetts 02205-5235.
Name, Year of Birth; Principal Occupations and Other Relevant Experience+
Dennis J. Dirks (1948)
Year of Election or Appointment: 2005
Trustee
Mr. Dirks also serves as Trustee of other Fidelity® funds. Prior to his retirement in May 2003, Mr. Dirks was Chief Operating Officer and a member of the Board of The Depository Trust & Clearing Corporation (DTCC). He also served as President, Chief Operating Officer, and Board member of The Depository Trust Company (DTC) and President and Board member of the National Securities Clearing Corporation (NSCC). In addition, Mr. Dirks served as Chief Executive Officer and Board member of the Government Securities Clearing Corporation, Chief Executive Officer and Board member of the Mortgage-Backed Securities Clearing Corporation, as a Trustee and a member of the Finance Committee of Manhattan College (2005-2008), as a Trustee and a member of the Finance Committee of AHRC of Nassau County (2006-2008), as a member of the Independent Directors Council (IDC) Governing Council (2010-2015), and as a member of the Board of Directors for The Brookville Center for Children’s Services, Inc. (2009-2017). Mr. Dirks is a member of the Finance Committee (2016-present) and Board of Directors (2017-present) and is Treasurer (2018-present) of the Asolo Repertory Theatre.
Donald F. Donahue (1950)
Year of Election or Appointment: 2018
Trustee
Mr. Donahue also serves as a Trustee of other Fidelity® funds. Mr. Donahue is President and Chief Executive Officer of Miranda Partners, LLC (risk consulting for the financial services industry, 2012-present). Previously, Mr. Donahue served as a Member of the Advisory Board of certain Fidelity® funds (2015-2018) and Chief Executive Officer (2006-2012), Chief Operating Officer (2003-2006), and Managing Director, Customer Marketing and Development (1999-2003) of The Depository Trust & Clearing Corporation (financial markets infrastructure). Mr. Donahue serves as a Member (2007-present) and Co-Chairman (2016-present) of the Board of Directors of United Way of New York, Member of the Board of Directors of NYC Leadership Academy (2012-present) and Member of the Board of Advisors of Ripple Labs, Inc. (financial services, 2015-present). He also served as Chairman (2010-2012) and Member of the Board of Directors (2012-2013) of Omgeo, LLC (financial services), Treasurer of United Way of New York (2012-2016), and Member of the Board of Directors of XBRL US (financial services non-profit, 2009-2012) and the International Securities Services Association (2009-2012).
Alan J. Lacy (1953)
Year of Election or Appointment: 2008
Trustee
Mr. Lacy also serves as Trustee of other Fidelity® funds. Mr. Lacy serves as a Director of Bristol-Myers Squibb Company (global pharmaceuticals, 2008-present). He is a Trustee of the California Chapter of The Nature Conservancy (2015-present) and a Director of the Center for Advanced Study in the Behavioral Sciences at Stanford University (2015-present). In addition, Mr. Lacy served as Senior Adviser (2007-2014) of Oak Hill Capital Partners, L.P. (private equity) and also served as Chief Executive Officer (2005) and Vice Chairman (2005-2006) of Sears Holdings Corporation (retail) and Chief Executive Officer and Chairman of the Board of Sears, Roebuck and Co. (retail, 2000-2005). Previously, Mr. Lacy served as Chairman (2014-2017) and a member (2010-2017) of the Board of Directors of Dave & Buster’s Entertainment, Inc. (restaurant and entertainment complexes), as Chairman (2008-2011) and a member (2006-2015) of the Board of Trustees of the National Parks Conservation Association, and as a member of the Board of Directors for The Hillman Companies, Inc. (hardware wholesalers, 2010-2014), Earth Fare, Inc. (retail grocery, 2010-2014), and The Western Union Company (global money transfer, 2006-2011).
Ned C. Lautenbach (1944)
Year of Election or Appointment: 2004
Trustee
Chairman of the Independent Trustees
Mr. Lautenbach also serves as Trustee of other Fidelity® funds. Mr. Lautenbach currently serves as Chair (2018-present) and Member (2013-present) of the Board of Governors, State University System of Florida and is a member of the Council on Foreign Relations (1994-present). He is also a member and has most recently served as Chairman of the Board of Directors of Artis-Naples (2012-present). Previously, Mr. Lautenbach served as a member and then Lead Director of the Board of Directors of Eaton Corporation (diversified industrial, 1997-2016). He was also a Partner and Advisory Partner at Clayton, Dubilier & Rice, LLC (private equity investment, 1998-2010), as well as a Director of Sony Corporation (2006-2007). In addition, Mr. Lautenbach also had a 30-year career with IBM (technology company) during which time he served as Senior Vice President and a member of the Corporate Executive Committee (1968-1998).
Joseph Mauriello (1944)
Year of Election or Appointment: 2008
Trustee
Mr. Mauriello also serves as Trustee of other Fidelity® funds. Prior to his retirement in January 2006, Mr. Mauriello served in numerous senior management positions including Deputy Chairman and Chief Operating Officer (2004-2005), and Vice Chairman of Financial Services (2002-2004) of KPMG LLP US (professional services, 1965-2005). Mr. Mauriello currently serves as a member of the Independent Directors Council (IDC) Governing Council (2015-present). Previously, Mr. Mauriello served as a member of the Board of Directors of XL Group plc. (global insurance and re-insurance, 2006-2018).
Cornelia M. Small (1944)
Year of Election or Appointment: 2005
Trustee
Ms. Small also serves as Trustee of other Fidelity® funds. Ms. Small is a member of the Board of Directors (2009-present) and Chair of the Investment Committee (2010-present) of the Teagle Foundation. Ms. Small also serves on the Investment Committee of the Berkshire Taconic Community Foundation (2008-present). Previously, Ms. Small served as Chairperson (2002-2008) and a member of the Investment Committee and Chairperson (2008-2012) and a member of the Board of Trustees of Smith College. In addition, Ms. Small served as Chief Investment Officer, Director of Global Equity Investments, and a member of the Board of Directors of Scudder, Stevens & Clark and Scudder Kemper Investments.
Garnett A. Smith (1947)
Year of Election or Appointment: 2018
Trustee
Mr. Smith also serves as Trustee of other Fidelity® funds. Prior to Mr. Smith's retirement, he served as Chairman and Chief Executive Officer of Inbrand Corp. (manufacturer of personal absorbent products, 1990-1997). He also served as President (1986-1990) of Inbrand Corp. Prior to his employment with Inbrand Corp., he was employed by a retail fabric chain and North Carolina National Bank. In addition, Mr. Smith served as a Member of the Advisory Board of certain Fidelity® funds (2012-2013) and as a board member of the Jackson Hole Land Trust (2009-2012).
David M. Thomas (1949)
Year of Election or Appointment: 2008
Trustee
Mr. Thomas also serves as Trustee of other Fidelity® funds. Mr. Thomas serves as Non-Executive Chairman of the Board of Directors of Fortune Brands Home and Security (home and security products, 2011-present) and as a member of the Board of Directors (2004-present) and Presiding Director (2013-present) of Interpublic Group of Companies, Inc. (marketing communication). Previously, Mr. Thomas served as Executive Chairman (2005-2006) and Chairman and Chief Executive Officer (2000-2005) of IMS Health, Inc. (pharmaceutical and healthcare information solutions), a Director of Fortune Brands, Inc. (consumer products, 2000-2011), and a member of the Board of Trustees of the University of Florida (2013-2018).
Michael E. Wiley (1950)
Year of Election or Appointment: 2018
Trustee
Mr. Wiley also serves as Trustee or Member of the Advisory Board of other Fidelity® funds. Mr. Wiley serves as a Director of High Point Resources (exploration and production, 2005-present). Previously, Mr. Wiley served as a Director of Andeavor Corporation (independent oil refiner and marketer, 2005-2018), a Director of Andeavor Logistics LP (natural resources logistics, 2015-2018), a Director of Post Oak Bank (privately-held bank, 2004-2018), a Director of Asia Pacific Exploration Consolidated (international oil and gas exploration and production, 2008-2013), a member of the Board of Trustees of the University of Tulsa (2000-2006; 2007-2010), a Senior Energy Advisor of Katzenbach Partners, LLC (consulting, 2006-2007), an Advisory Director of Riverstone Holdings (private investment), a Director of Spinnaker Exploration Company (exploration and production, 2001-2005) and Chairman, President, and CEO of Baker Hughes, Inc. (oilfield services, 2000-2004).
+ The information includes the Trustee's principal occupation during the last five years and other information relating to the experience, attributes, and skills relevant to the Trustee's qualifications to serve as a Trustee, which led to the conclusion that the Trustee should serve as a Trustee for the fund.
Advisory Board Members and Officers:
Correspondence intended for a Member of the Advisory Board (if any) may be sent to Fidelity Investments, P.O. Box 55235, Boston, Massachusetts 02205-5235. Correspondence intended for an officer or Peter S. Lynch may be sent to Fidelity Investments, 245 Summer Street, Boston, Massachusetts 02210. Officers appear below in alphabetical order.
Name, Year of Birth; Principal Occupation
Vicki L. Fuller (1957)
Year of Election or Appointment: 2018
Member of the Advisory Board
Ms. Fuller also serves as Member of the Advisory Board of other Fidelity® funds. Ms. Fuller serves as a member of the Board of Directors, Audit Committee, and Nominating and Governance Committee of The Williams Companies, Inc. (natural gas infrastructure, 2018-present). Previously, Ms. Fuller served as the Chief Investment Officer of the New York State Common Retirement Fund (2012-2018) and held a variety of positions at AllianceBernstein L.P. (global asset management, 1985-2012), including Managing Director (2006-2012) and Senior Vice President and Senior Portfolio Manager (2001-2006).
Peter S. Lynch (1944)
Year of Election or Appointment: 2004
Member of the Advisory Board
Mr. Lynch also serves as Member of the Advisory Board of other Fidelity® funds. Mr. Lynch is Vice Chairman and a Director of FMR (investment adviser firm) and FMR Co., Inc. (investment adviser firm). In addition, Mr. Lynch serves as a Trustee of Boston College and as the Chairman of the Inner-City Scholarship Fund. Previously, Mr. Lynch served on the Special Olympics International Board of Directors (1997-2006).
Elizabeth Paige Baumann (1968)
Year of Election or Appointment: 2017
Anti-Money Laundering (AML) Officer
Ms. Baumann also serves as AML Officer of other funds. She is Chief AML Officer (2012-present) and Senior Vice President (2014-present) of FMR LLC (diversified financial services company) and is an employee of Fidelity Investments. Previously, Ms. Baumann served as AML Officer of the funds (2012-2016), and Vice President (2007-2014) and Deputy Anti-Money Laundering Officer (2007-2012) of FMR LLC.
Craig S. Brown (1977)
Year of Election or Appointment: 2019
Assistant Treasurer
Mr. Brown also serves as Assistant Treasurer of other funds. Mr. Brown is an employee of Fidelity Investments (2013-present).
John J. Burke III (1964)
Year of Election or Appointment: 2018
Chief Financial Officer
Mr. Burke also serves as Chief Financial Officer of other funds. Mr. Burke serves as Head of Investment Operations for Fidelity Fund and Investment Operations (2018-present) and is an employee of Fidelity Investments (1998-present). Previously Mr. Burke served as head of Asset Management Investment Operations (2012-2018).
William C. Coffey (1969)
Year of Election or Appointment: 2019
Assistant Secretary
Mr. Coffey also serves as Assistant Secretary of other funds. He is Senior Vice President and Deputy General Counsel of FMR LLC (diversified financial services company, 2010-present), and is an employee of Fidelity Investments. Previously, Mr. Coffey served as Secretary and CLO of certain funds (2018-2019); CLO, Secretary, and Senior Vice President of Fidelity Management & Research Company and FMR Co., Inc. (investment adviser firms, 2018-2019); Secretary of Fidelity SelectCo, LLC and Fidelity Investments Money Management, Inc. (investment adviser firms, 2018-2019); CLO of Fidelity Management & Research (Hong Kong) Limited, FMR Investment Management (UK) Limited, and Fidelity Management & Research (Japan) Limited (investment adviser firms, 2018-2019); and Assistant Secretary of certain funds (2009-2018).
Timothy M. Cohen (1969)
Year of Election or Appointment: 2018
Vice President
Mr. Cohen also serves as Vice President of other funds. Mr. Cohen serves as Executive Vice President of Fidelity SelectCo, LLC (2019-present), Co-Head of Equity (2018-present), a Director of Fidelity Management & Research (Japan) Limited (investment adviser firm, 2016-present), and is an employee of Fidelity Investments. Previously, Mr. Cohen served as Head of Global Equity Research (2016-2018), Chief Investment Officer - Equity and a Director of Fidelity Management & Research (U.K.) Inc. (investment adviser firm, 2013-2015) and as a Director of Fidelity Management & Research (Hong Kong) Limited (investment adviser firm, 2017).
Jonathan Davis (1968)
Year of Election or Appointment: 2010
Assistant Treasurer
Mr. Davis also serves as Assistant Treasurer of other funds. Mr. Davis serves as Assistant Treasurer of FMR Capital, Inc. (2017-present) and is an employee of Fidelity Investments. Previously, Mr. Davis served as Vice President and Associate General Counsel of FMR LLC (diversified financial services company, 2003-2010).
Adrien E. Deberghes (1967)
Year of Election or Appointment: 2016
Assistant Treasurer
Mr. Deberghes also serves as an officer of other funds. He serves as Assistant Treasurer of FMR Capital, Inc. (2017-present), Executive Vice President of Fidelity Investments Money Management, Inc. (FIMM) (investment adviser firm, 2016-present), and is an employee of Fidelity Investments (2008-present). Previously, Mr. Deberghes served as President and Treasurer of certain Fidelity® funds (2013-2018). Prior to joining Fidelity Investments, Mr. Deberghes was Senior Vice President of Mutual Fund Administration at State Street Corporation (2007-2008), Senior Director of Mutual Fund Administration at Investors Bank & Trust (2005-2007), and Director of Finance for Dunkin' Brands (2000-2005). Previously, Mr. Deberghes served in other fund officer roles.
Laura M. Del Prato (1964)
Year of Election or Appointment: 2018
Assistant Treasurer
Ms. Del Prato also serves as an officer of other funds. Ms. Del Prato is an employee of Fidelity Investments (2017-present). Prior to joining Fidelity Investments, Ms. Del Prato served as a Managing Director and Treasurer of the JPMorgan Mutual Funds (2014-2017). Prior to JPMorgan, Ms. Del Prato served as a partner at Cohen Fund Audit Services (accounting firm, 2012-2013) and KPMG LLP (accounting firm, 2004-2012).
Colm A. Hogan (1973)
Year of Election or Appointment: 2016
Deputy Treasurer
Mr. Hogan also serves as an officer of other funds. Mr. Hogan serves as Assistant Treasurer of FMR Capital, Inc. (2017-present) and is an employee of Fidelity Investments (2005-present). Previously, Mr. Hogan served as Assistant Treasurer of certain Fidelity® funds (2016-2018).
Pamela R. Holding (1964)
Year of Election or Appointment: 2018
Vice President
Ms. Holding also serves as Vice President of other funds. Ms. Holding serves as Executive Vice President of Fidelity SelectCo, LLC (2019-present), Co-Head of Equity (2018-present) and is an employee of Fidelity Investments (2013-present). Previously, Ms. Holding served as Chief Investment Officer of Fidelity Institutional Asset Management (2013-2018).
Cynthia Lo Bessette (1969)
Year of Election or Appointment: 2019
Secretary and Chief Legal Officer (CLO)
Ms. Lo Bessette also serves as Secretary and CLO of other funds. Ms. Lo Bessette serves as CLO, Secretary, and Senior Vice President of Fidelity Management & Research Company and FMR Co., Inc. (investment adviser firms, 2019-present); Secretary of Fidelity SelectCo, LLC and Fidelity Investments Money Management, Inc. (investment adviser firms, 2019-present); and CLO of Fidelity Management & Research (Hong Kong) Limited, FMR Investment Management (UK) Limited, and Fidelity Management & Research (Japan) Limited (investment adviser firms, 2019-present). She is a Senior Vice President and Deputy General Counsel of FMR LLC (diversified financial services company, 2019-present), and is an employee of Fidelity Investments. Previously, Ms. Lo Bessette served as Executive Vice President, General Counsel (2016-2019) and Senior Vice President, Deputy General Counsel (2015-2016) of OppenheimerFunds (investment management company) and Deputy Chief Legal Officer (2013-2015) of Jennison Associates LLC (investment adviser firm).
Chris Maher (1972)
Year of Election or Appointment: 2013
Assistant Treasurer
Mr. Maher serves as Assistant Treasurer of other funds. Mr. Maher is Vice President of Valuation Oversight, serves as Assistant Treasurer of FMR Capital, Inc. (2017-present), and is an employee of Fidelity Investments. Previously, Mr. Maher served as Vice President of Asset Management Compliance (2013), Vice President of the Program Management Group of FMR (investment adviser firm, 2010-2013), and Vice President of Valuation Oversight (2008-2010).
Kenneth B. Robins (1969)
Year of Election or Appointment: 2016
Chief Compliance Officer
Mr. Robins also serves as an officer of other funds. Mr. Robins serves as Compliance Officer of Fidelity Management & Research Company and FMR Co., Inc. (investment adviser firms, 2016-present) and is an employee of Fidelity Investments (2004-present). Previously, Mr. Robins served as Executive Vice President of Fidelity Investments Money Management, Inc. (investment adviser firm, 2013-2016) and served in other fund officer roles.
Stacie M. Smith (1974)
Year of Election or Appointment: 2016
President and Treasurer
Ms. Smith also serves as an officer of other funds. Ms. Smith serves as Assistant Treasurer of FMR Capital, Inc. (2017-present), is an employee of Fidelity Investments (2009-present), and has served in other fund officer roles. Prior to joining Fidelity Investments, Ms. Smith served as Senior Audit Manager of Ernst & Young LLP (accounting firm, 1996-2009). Previously, Ms. Smith served as Assistant Treasurer (2013-2018) and Deputy Treasurer (2013-2016) of certain Fidelity® funds.
Marc L. Spector (1972)
Year of Election or Appointment: 2016
Assistant Treasurer
Mr. Spector also serves as an officer of other funds. Mr. Spector serves as Assistant Treasurer of FMR Capital, Inc. (2017-present) and is an employee of Fidelity Investments (2016-present). Prior to joining Fidelity Investments, Mr. Spector served as Director at the Siegfried Group (accounting firm, 2013-2016), and prior to Siegfried Group as audit senior manager at Deloitte & Touche (accounting firm, 2005-2013).
Jim Wegmann (1979)
Year of Election or Appointment: 2019
Assistant Treasurer
Mr. Wegmann also serves as Assistant Treasurer of other funds. Mr. Wegmann is an employee of Fidelity Investments (2011-present).
Shareholder Expense Example
As a shareholder of the Fund, you incur two types of costs: (1) transaction costs and (2) ongoing costs, including other Fund expenses. This Example is intended to help you understand your ongoing costs (in dollars) of investing in the Fund and to compare these costs with the ongoing costs of investing in other mutual funds.
The Example is based on an investment of $1,000 invested at the beginning of the period and held for the entire period (April 1, 2019 to September 30, 2019).
Actual Expenses
The first line of the accompanying table provides information about actual account values and actual expenses. You may use the information in this line, together with the amount you invested, to estimate the expenses that you paid over the period. Simply divide your account value by $1,000.00 (for example, an $8,600 account value divided by $1,000.00 = 8.6), then multiply the result by the number in the first line under the heading entitled "Expenses Paid During Period" to estimate the expenses you paid on your account during this period. In addition, the Fund, as a shareholder in the underlying Fidelity Central Funds, will indirectly bear its pro-rata share of the fees and expenses incurred by the underlying Fidelity Central Funds. These fees and expenses are not included in the Fund's annualized expense ratio used to calculate the expense estimate in the table below.
Hypothetical Example for Comparison Purposes
The second line of the accompanying table provides information about hypothetical account values and hypothetical expenses based on the Fund's actual expense ratio and an assumed rate of return of 5% per year before expenses, which is not the Fund's actual return. The hypothetical account values and expenses may not be used to estimate the actual ending account balance or expenses you paid for the period. You may use this information to compare the ongoing costs of investing in the Fund and other funds. To do so, compare this 5% hypothetical example with the 5% hypothetical examples that appear in the shareholder reports of the other funds. In addition, the Fund, as a shareholder in the underlying Fidelity Central Funds, will indirectly bear its pro-rata share of the fees and expenses incurred by the underlying Fidelity Central Funds. These fees and expenses are not included in the Fund's annualized expense ratio used to calculate the expense estimate in the table below.
Please note that the expenses shown in the table are meant to highlight your ongoing costs only and do not reflect any transaction costs. Therefore, the second line of the table is useful in comparing ongoing costs only, and will not help you determine the relative total costs of owning different funds.
| Annualized Expense Ratio-A | Beginning Account Value April 1, 2019 | Ending Account Value September 30, 2019 | Expenses Paid During Period-B April 1, 2019 to September 30, 2019 | |
| Actual | .0106% | $1,000.00 | $1,047.20 | $.05 |
| Hypothetical-C | $1,000.00 | $1,025.02 | $.05 |
A Annualized expense ratio reflects expenses net of applicable fee waivers.
B Expenses are equal to the Fund's annualized expense ratio, multiplied by the average account value over the period, multiplied by 183/365 (to reflect the one-half year period).
C 5% return per year before expenses
Distributions (Unaudited)
A percentage of the dividends distributed during the fiscal year for fund qualify for the dividends–received deduction for corporate shareholders:
| December 2018 | 1% |
| February 2019 | 2% |
| March 2019 | 2% |
| April 2019 | 2% |
| May 2019 | 2% |
| June 2019 | 2% |
| July 2019 | 2% |
| August 2019 | 2% |
| September 2019 | 2% |
A percentage of the dividends distributed during the fiscal year for the fund may be taken into account as a dividend for purposes of the maximum rate under section 1(h)(11) of the Internal Revenue Code:
| December 2018 | 34% |
| February 2019 | 98% |
| March 2019 | 98% |
| April 2019 | 98% |
| May 2019 | 98% |
| June 2019 | 98% |
| July 2019 | 98% |
| August 2019 | 98% |
| September 2019 | 98% |
The amounts per share which represent income derived from sources within, and taxes paid to, foreign countries or possessions of the United States are $0.7988 and $0.1678 for the dividend paid December 20, 2018.
The fund will notify shareholders in January 2020 of amounts for use in preparing 2019 income tax returns.
![]()
INTCEN-ANN-1119
1.859208.111
Item 2.
Code of Ethics
As of the end of the period, September 30, 2019, Fidelity Central Investment Portfolios LLC (the trust) has adopted a code of ethics, as defined in Item 2 of Form N-CSR, that applies to its President and Treasurer and its Chief Financial Officer. A copy of the code of ethics is filed as an exhibit to this Form N-CSR.
Item 3.
Audit Committee Financial Expert
The Board of Trustees of the trust has determined that Joseph Mauriello is an audit committee financial expert, as defined in Item 3 of Form N-CSR. Mr. Mauriello is independent for purposes of Item 3 of Form N-CSR.
Item 4.
Principal Accountant Fees and Services
Fees and Services
The following table presents fees billed by Deloitte & Touche LLP, the member firms of Deloitte Touche Tohmatsu, and their respective affiliates (collectively, “Deloitte Entities”) in each of the last two fiscal years for services rendered to Fidelity Communication Services Central Fund, Fidelity Consumer Discretionary Central Fund, Fidelity Consumer Staples Central Fund, Fidelity Emerging Markets Equity Central Fund, Fidelity Energy Central Fund, Fidelity Financials Central Fund, Fidelity Floating Rate Central Fund, Fidelity Health Care Central Fund, Fidelity Industrials Central Fund, Fidelity Information Technology Central Fund, Fidelity International Equity Central Fund, Fidelity Materials Central Fund, Fidelity Real Estate Equity Central Fund and Fidelity Utilities Central Fund (the “Funds”):
Services Billed by Deloitte Entities
September 30, 2019 FeesA
Audit Fees | Audit-Related Fees | Tax Fees | All Other Fees | |
Fidelity Communication Services Central Fund | $45,000 | $100 | $6,000 | $1,100 |
Fidelity Consumer Discretionary Central Fund | $45,000 | $100 | $6,000 | $1,100 |
Fidelity Consumer Staples Central Fund | $45,000 | $100 | $6,000 | $1,100 |
Fidelity Emerging Markets Equity Central Fund | $44,000 | $100 | $6,300 | $1,200 |
Fidelity Energy Central Fund | $48,000 | $100 | $7,100 | $1,200 |
Fidelity Financials Central Fund | $48,000 | $100 | $6,700 | $1,200 |
Fidelity Floating Rate Central Fund | $79,000 | $100 | $6,300 | $2,100 |
Fidelity Health Care Central Fund | $47,000 | $100 | $6,000 | $1,100 |
Fidelity Industrials Central Fund | $46,000 | $100 | $6,000 | $1,100 |
Fidelity Information Technology Central Fund | $58,000 | $100 | $6,000 | $1,400 |
Fidelity International Equity Central Fund | $49,000 | $100 | $6,400 | $1,300 |
Fidelity Materials Central Fund | $45,000 | $100 | $6,200 | $1,100 |
Fidelity Real Estate Equity Central Fund | $41,000 | $100 | $5,700 | $1,100 |
Fidelity Utilities Central Fund | $45,000 | $100 | $6,200 | $1,100 |
September 30, 2018 FeesA
Audit Fees | Audit-Related Fees | Tax Fees | All Other Fees | |
Fidelity Communication Services Central Fund | $40,000 | $100 | $6,000 | $1,200 |
Fidelity Consumer Discretionary Central Fund | $40,000 | $100 | $6,000 | $1,200 |
Fidelity Consumer Staples Central Fund | $40,000 | $100 | $6,000 | $1,200 |
Fidelity Emerging Markets Equity Central Fund | $45,000 | $100 | $6,300 | $1,300 |
Fidelity Energy Central Fund | $42,000 | $100 | $7,100 | $1,300 |
Fidelity Financials Central Fund | $43,000 | $100 | $6,900 | $1,300 |
Fidelity Floating Rate Central Fund | $82,000 | $100 | $6,300 | $2,300 |
Fidelity Health Care Central Fund | $42,000 | $100 | $6,000 | $1,200 |
Fidelity Industrials Central Fund | $41,000 | $100 | $6,000 | $1,200 |
Fidelity Information Technology Central Fund | $54,000 | $100 | $6,000 | $1,500 |
Fidelity International Equity Central Fund | $50,000 | $100 | $6,400 | $1,400 |
Fidelity Materials Central Fund | $40,000 | $100 | $6,000 | $1,200 |
Fidelity Real Estate Equity Central Fund | $41,000 | $100 | $6,000 | $1,200 |
Fidelity Utilities Central Fund | $40,000 | $100 | $6,000 | $1,200 |
AAmounts may reflect rounding.
The following table(s) present(s) fees billed by Deloitte Entities that were required to be approved by the Audit Committee for services that relate directly to the operations and financial reporting of the Fund(s) and that are rendered on behalf of Fidelity Management & Research Company ("FMR") and entities controlling, controlled by, or under common control with FMR (not including any sub-adviser whose role is primarily portfolio management and is subcontracted with or overseen by another investment adviser) that provide ongoing services to the Fund(s) (“Fund Service Providers”):
Services Billed by Deloitte Entities
September 30, 2019A | September 30, 2018A | |
Audit-Related Fees | $290,000 | $5,000 |
Tax Fees | $- | $5,000 |
All Other Fees | $- | $- |
A Amounts may reflect rounding.
“Audit-Related Fees” represent fees billed for assurance and related services that are reasonably related to the performance of the fund audit or the review of the fund's financial statements and that are not reported under Audit Fees.
“Tax Fees” represent fees billed for tax compliance, tax advice or tax planning that relate directly to the operations and financial reporting of the fund.
“All Other Fees” represent fees billed for services provided to the fund or Fund Service Provider, a significant portion of which are assurance related, that relate directly to the operations and financial reporting of the fund, excluding those services that are reported under Audit Fees, Audit-Related Fees or Tax Fees.
Assurance services must be performed by an independent public accountant.
* * *
The aggregate non-audit fees billed by Deloitte Entities for services rendered to the Fund(s), FMR (not including any sub-adviser whose role is primarily portfolio
management and is subcontracted with or overseen by another investment adviser), and any Fund Service Provider for each of the last two fiscal years of the Fund(s) are as follows:
Billed By | September 30, 2019A | September 30, 2018A |
Deloitte Entities | $675,000 | $585,000 |
A Amounts may reflect rounding.
The trust's Audit Committee has considered non-audit services that were not pre-approved that were provided by Deloitte Entities to Fund Service Providers to be compatible with maintaining the independence of Deloitte Entities in its(their) audit of the Fund(s), taking into account representations from Deloitte Entities, in accordance with Public Company Accounting Oversight Board rules, regarding its independence from the Fund(s) and its(their) related entities and FMR’s review of the appropriateness and permissibility under applicable law of such non-audit services prior to their provision to the Fund(s) Service Providers.
Audit Committee Pre-Approval Policies and Procedures
The trust’s Audit Committee must pre-approve all audit and non-audit services provided by a fund’s independent registered public accounting firm relating to the operations or financial reporting of the fund. Prior to the commencement of any audit or non-audit services to a fund, the Audit Committee reviews the services to determine whether they are appropriate and permissible under applicable law.
The Audit Committee has adopted policies and procedures to, among other purposes, provide a framework for the Committee’s consideration of non-audit services by the audit firms that audit the Fidelity funds. The policies and procedures require that any non-audit service provided by a fund audit firm to a Fidelity fund and any non-audit service provided by a fund auditor to a Fund Service Provider that relates directly to the operations and financial reporting of a Fidelity fund (“Covered Service”) are subject to approval by the Audit Committee before such service is provided.
All Covered Services must be approved in advance of provision of the service either: (i) by formal resolution of the Audit Committee, or (ii) by oral or written approval of the service by the Chair of the Audit Committee (or if the Chair is unavailable, such other member of the Audit Committee as may be designated by the Chair to act in the Chair’s absence). The approval contemplated by (ii) above is permitted where the Treasurer determines that action on such an engagement is necessary before the next meeting of the Audit Committee.
Non-audit services provided by a fund audit firm to a Fund Service Provider that do not relate directly to the operations and financial reporting of a Fidelity fund are reported to the Audit Committee periodically.
Non-Audit Services Approved Pursuant to Rule 2-01(c)(7)(i)(C) and (ii) of Regulation S-X (“De Minimis Exception”)
There were no non-audit services approved or required to be approved by the Audit Committee pursuant to the De Minimis Exception during the Fund’s(s’) last two fiscal years relating to services provided to (i) the Fund(s) or (ii) any Fund Service Provider that relate directly to the operations and financial reporting of the Fund(s).
Item 5.
Audit Committee of Listed Registrants
Not applicable.
Item 6.
Investments
(a)
Not applicable.
(b)
Not applicable
Item 7.
Disclosure of Proxy Voting Policies and Procedures for Closed-End Management Investment Companies
Not applicable.
Item 8.
Portfolio Managers of Closed-End Management Investment Companies
Not applicable.
Item 9.
Purchase of Equity Securities by Closed-End Management Investment Company and Affiliated Purchasers
Not applicable.
Item 10.
Submission of Matters to a Vote of Security Holders
There were no material changes to the procedures by which shareholders may recommend nominees to the trust’s Board of Trustees.
Item 11.
Controls and Procedures
(a)(i) The President and Treasurer and the Chief Financial Officer have concluded that the trust’s disclosure controls and procedures (as defined in Rule 30a-3(c) under the Investment Company Act) provide reasonable assurances that material information relating to the trust is made known to them by the appropriate persons, based on their evaluation of these controls and procedures as of a date within 90 days of the filing date of this report.
(a)(ii) There was no change in the trust’s internal control over financial reporting (as defined in Rule 30a-3(d) under the Investment Company Act) that occurred during the period covered by this report that has materially affected, or is reasonably likely to materially affect, the trust’s internal control over financial reporting.
Item 12.
Disclosure of Securities Lending Activities for Closed-End Management
Investment Companies
Not applicable.
Item 13.
Exhibits
(a) | (1) | Code of Ethics pursuant to Item 2 of Form N-CSR is filed and attached hereto as EX-99.CODE ETH. |
(a) | (2) | Certification pursuant to Rule 30a-2(a) under the Investment Company Act of 1940 (17 CFR 270.30a-2(a)) is filed and attached hereto as Exhibit 99.CERT. |
(a) | (3) | Not applicable. |
(b) | Certification pursuant to Rule 30a-2(b) under the Investment Company Act of 1940 (17 CFR 270.30a-2(b)) is furnished and attached hereto as Exhibit 99.906CERT. |
SIGNATURES
Pursuant to the requirements of the Securities Exchange Act of 1934 and the Investment Company Act of 1940, the registrant has duly caused this report to be signed on its behalf by the undersigned, thereunto duly authorized.
Fidelity Central Investment Portfolios LLC
By: | /s/Stacie M. Smith |
Stacie M. Smith | |
President and Treasurer | |
Date: | November 26, 2019 |
Pursuant to the requirements of the Securities Exchange Act of 1934 and the Investment Company Act of 1940, this report has been signed below by the following persons on behalf of the registrant and in the capacities and on the dates indicated.
By: | /s/Stacie M. Smith |
Stacie M. Smith | |
President and Treasurer | |
Date: | November 26, 2019 |
By: | /s/John J. Burke III |
John J. Burke III | |
Chief Financial Officer | |
Date: | November 26, 2019 |