UNITED STATES
SECURITIES AND EXCHANGE COMMISSION
Washington, D.C. 20549
FORM N-CSR
CERTIFIED SHAREHOLDER REPORT OF REGISTERED
MANAGEMENT INVESTMENT COMPANIES
Investment Company Act file number 811-21667
Fidelity Central Investment Portfolios LLC
(Exact name of registrant as specified in charter)
245 Summer St., Boston, Massachusetts 02210
(Address of principal executive offices) (Zip code)
Cynthia Lo Bessette, Secretary
245 Summer St.
Boston, Massachusetts 02210
(Name and address of agent for service)
Registrant's telephone number, including area code:
617-563-7000
Date of fiscal year end: | September 30 |
Date of reporting period: | September 30, 2020 |
Item 1.
Reports to Stockholders
Fidelity® International Equity Central Fund
September 30, 2020

See the inside front cover for important information about access to your fund’s shareholder reports.
Beginning on January 1, 2021, as permitted by regulations adopted by the Securities and Exchange Commission, paper copies of a fund’s shareholder reports will no longer be sent by mail, unless you specifically request paper copies of the reports from the fund or from your financial intermediary, such as a financial advisor, broker-dealer or bank. Instead, the reports will be made available on a website, and you will be notified by mail each time a report is posted and provided with a website link to access the report.
If you already elected to receive shareholder reports electronically, you will not be affected by this change and you need not take any action. You may elect to receive shareholder reports and other communications from a fund electronically, by contacting your financial intermediary. For Fidelity customers, visit Fidelity's web site or call Fidelity using the contact information listed below.
You may elect to receive all future reports in paper free of charge. If you wish to continue receiving paper copies of your shareholder reports, you may contact your financial intermediary or, if you are a Fidelity customer, visit Fidelity’s website, or call Fidelity at the applicable toll-free number listed below. Your election to receive reports in paper will apply to all funds held with the fund complex/your financial intermediary.
| Account Type | Website | Phone Number |
| Brokerage, Mutual Fund, or Annuity Contracts: | fidelity.com/mailpreferences | 1-800-343-3548 |
| Employer Provided Retirement Accounts: | netbenefits.fidelity.com/preferences (choose 'no' under Required Disclosures to continue to print) | 1-800-343-0860 |
| Advisor Sold Accounts Serviced Through Your Financial Intermediary: | Contact Your Financial Intermediary | Your Financial Intermediary's phone number |
| Advisor Sold Accounts Serviced by Fidelity: | institutional.fidelity.com | 1-877-208-0098 |
Contents
To view a fund's proxy voting guidelines and proxy voting record for the 12-month period ended June 30, visit http://www.fidelity.com/proxyvotingresults or visit the Securities and Exchange Commission's (SEC) web site at http://www.sec.gov.
You may also call 1-800-544-8544 to request a free copy of the proxy voting guidelines.
Standard & Poor's, S&P and S&P 500 are registered service marks of The McGraw-Hill Companies, Inc. and have been licensed for use by Fidelity Distributors Corporation.
Other third-party marks appearing herein are the property of their respective owners.
All other marks appearing herein are registered or unregistered trademarks or service marks of FMR LLC or an affiliated company. © 2020 FMR LLC. All rights reserved.
A fund files its complete schedule of portfolio holdings with the SEC for the first and third quarters of each fiscal year on Form N-PORT. Forms N-PORT are available on the SEC’s web site at http://www.sec.gov. A fund's Forms N-PORT may be reviewed and copied at the SEC’s Public Reference Room in Washington, DC. Information regarding the operation of the SEC's Public Reference Room may be obtained by calling 1-800-SEC-0330.
Note to Shareholders:
Early in 2020, the outbreak and spread of a new coronavirus emerged as a public health emergency that had a major influence on financial markets, primarily based on its impact on the global economy and the outlook for corporate earnings. The virus causes a respiratory disease known as COVID-19. On March 11, the World Health Organization declared the COVID-19 outbreak a pandemic, citing sustained risk of further global spread.
In the weeks following, as the crisis worsened, we witnessed an escalating human tragedy with wide-scale social and economic consequences from coronavirus-containment measures. The outbreak of COVID-19 prompted a number of measures to limit the spread, including travel and border restrictions, quarantines, and restrictions on large gatherings. In turn, these resulted in lower consumer activity, diminished demand for a wide range of products and services, disruption in manufacturing and supply chains, and – given the wide variability in outcomes regarding the outbreak – significant market uncertainty and volatility. Amid the turmoil, the U.S. government took unprecedented action – in concert with the U.S. Federal Reserve and central banks around the world – to help support consumers, businesses, and the broader economy, and to limit disruption to the financial system.
The situation continues to unfold, and the extent and duration of its impact on financial markets and the economy remain highly uncertain. Extreme events such as the coronavirus crisis are “exogenous shocks” that can have significant adverse effects on mutual funds and their investments. Although multiple asset classes may be affected by market disruption, the duration and impact may not be the same for all types of assets.
Fidelity is committed to helping you stay informed amid news about COVID-19 and during increased market volatility, and we’re taking extra steps to be responsive to customer needs. We encourage you to visit our websites, where we offer ongoing updates, commentary, and analysis on the markets and our funds.
Performance: The Bottom Line
Average annual total return reflects the change in the value of an investment, assuming reinvestment of distributions from dividend income and capital gains (the profits earned upon the sale of securities that have grown in value, if any) and assuming a constant rate of performance each year. The hypothetical investment and the average annual total returns do not reflect the deduction of taxes that a shareholder would pay on fund distributions or the redemption of fund shares. During periods of reimbursement by Fidelity, a fund’s total return will be greater than it would be had the reimbursement not occurred. How a fund did yesterday is no guarantee of how it will do tomorrow.
Average Annual Total Returns
| For the periods ended September 30, 2020 | Past 1 year | Past 5 years | Past 10 years |
| Fidelity® International Equity Central Fund | 10.91% | 7.68% | 6.09% |
$10,000 Over 10 Years
Let's say hypothetically that $10,000 was invested in Fidelity® International Equity Central Fund on September 30, 2010.
The chart shows how the value of your investment would have changed, and also shows how the MSCI World ex USA Index performed over the same period.
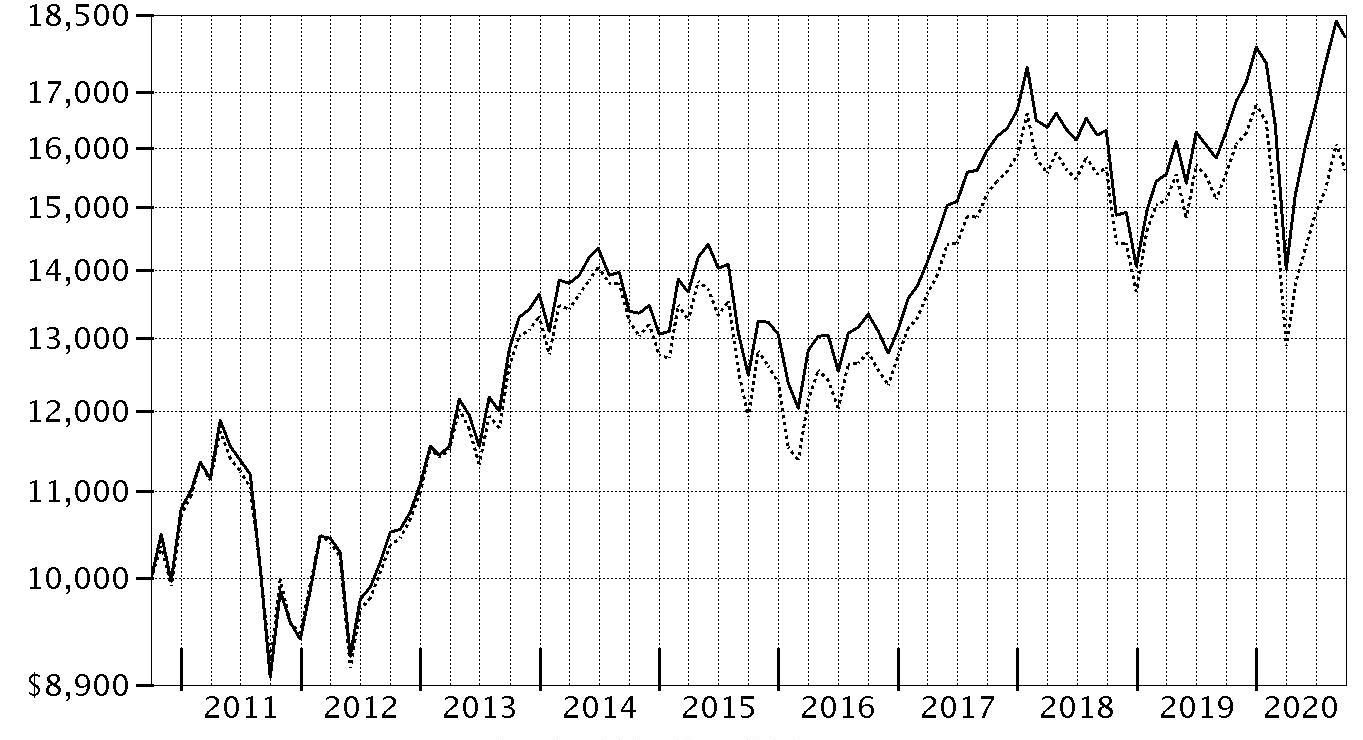
| Period Ending Values | ||
| $18,063 | Fidelity® International Equity Central Fund | |
| $15,614 | MSCI World ex USA Index | |
Management's Discussion of Fund Performance
Market Recap: The MSCI ACWI (All Country World Index) ex USA Index gained 3.16% for the 12 months ending September 30, 2020, in what was a bumpy ride for non-U.S. equities, marked by a steep but brief decline due to the early-2020 outbreak and spread of the coronavirus, followed by a sharp upturn. Declared a pandemic on March 11, the crisis and containment efforts caused broad contraction in economic activity, elevated volatility and dislocation in financial markets. The outbreak escalated globally in February, when the index returned -7.90% after a surge in cases outside China pushed investors to safer asset classes. In March, when the outbreak spread in many countries, the index returned -14.45%, the steepest monthly drop since the global financial crisis. A historically rapid and expansive monetary- and fiscal-policy response provided a partial offset to the economic disruption, as did progress on potential treatments and signs of an early recovery in economic activity. This was evident as the index advanced 23.48% in the final six months of the period, supported by broad U.S.-dollar weakness. For the full year, emerging markets (+11%), Japan (+7%) and Europe ex U.K. (+5%) led, whereas the U.K. (-16%), Asia Pacific ex Japan (-5%) and Canada (-2%) lagged. By sector, information technology rose 35%, followed by health care (+23%) and consumer discretionary (+18%). Conversely, energy stocks (-33%) fell hard along with the price of oil. Financials (-17%) and real estate (-14%) also notably lagged.Comments from Co-Portfolio Manager Steven Kaye: For the fiscal year, the fund advanced 10.91%, well ahead of the 0.37% gain of the benchmark, the MSCI World ex USA Index. Versus the benchmark, the fund benefited from stock selection, particularly in the industrials, financials, communication services, consumer discretionary and real estate sectors. An underweighting in energy also helped. Choices across nearly all regions added value, especially in Europe (including the U.K.), Japan, the U.S., and emerging markets. Among individual stocks, an underweighting in Royal Dutch Shell helped more than any other stock decision, as shares of the Anglo-Dutch multinational oil company suffered as the coronavirus pandemic hampered oil demand. Elsewhere, shares of HSBC faced pressure due to declining interest rates and the impact of COVID-19. We significantly reduced the fund’s stake in Royal Dutch Shell and eliminated our position in HSBC by period end. It also helped to overweight Danish transport and logistics company DSV Panalpina, which withstood the global trade slump and exceeded second-quarter profit expectations. Conversely, our decision to underweight Canadian firm Shopify detracted. Online retailers like Shopify benefited as the COVID-19 pandemic accelerated the broader shift to e-commerce. An out-of-index stake in U.K.-based specialty insurer Beazley also weighed on the fund’s relative result.The views expressed above reflect those of the portfolio manager(s) only through the end of the period as stated on the cover of this report and do not necessarily represent the views of Fidelity or any other person in the Fidelity organization. Any such views are subject to change at any time based upon market or other conditions and Fidelity disclaims any responsibility to update such views. These views may not be relied on as investment advice and, because investment decisions for a Fidelity fund are based on numerous factors, may not be relied on as an indication of trading intent on behalf of any Fidelity fund.
Notes to shareholders: On February 1, 2020, Jeriel Rivera came off of the fund. On August 1, 2020, Isabelle Mast assumed co-management responsibilities for the fund.Investment Summary (Unaudited)
Geographic Diversification (% of fund's net assets)
| As of September 30, 2020 | ||
| Japan | 17.7% | |
| United Kingdom | 11.1% | |
| Switzerland | 9.9% | |
| France | 9.2% | |
| Germany | 9.1% | |
| Netherlands | 6.8% | |
| United States of America* | 6.6% | |
| Canada | 4.8% | |
| Sweden | 3.7% | |
| Other | 21.1% | |

* Includes Short-Term investments and Net Other Assets (Liabilities).
Percentages are based on country or territory of incorporation and are adjusted for the effect of futures contracts, if applicable.
Asset Allocation as of September 30, 2020
| % of fund's net assets | |
| Stocks and Equity Futures | 97.6 |
| Short-Term Investments and Net Other Assets (Liabilities) | 2.4 |
Top Ten Stocks as of September 30, 2020
| % of fund's net assets | |
| Nestle SA (Reg. S) (Switzerland, Food Products) | 3.0 |
| Roche Holding AG (participation certificate) (Switzerland, Pharmaceuticals) | 2.5 |
| LVMH Moet Hennessy Louis Vuitton SE (France, Textiles, Apparel & Luxury Goods) | 1.8 |
| SAP SE (Germany, Software) | 1.7 |
| ASML Holding NV (Netherlands) (Netherlands, Semiconductors & Semiconductor Equipment) | 1.6 |
| Sanofi SA (France, Pharmaceuticals) | 1.4 |
| Hoya Corp. (Japan, Health Care Equipment & Supplies) | 1.4 |
| AIA Group Ltd. (Hong Kong, Insurance) | 1.4 |
| Diageo PLC (United Kingdom, Beverages) | 1.2 |
| Sony Corp. (Japan, Household Durables) | 1.2 |
| 17.2 |
Top Market Sectors as of September 30, 2020
| % of fund's net assets | |
| Industrials | 16.5 |
| Financials | 16.1 |
| Health Care | 14.3 |
| Information Technology | 13.9 |
| Consumer Staples | 10.3 |
| Consumer Discretionary | 10.1 |
| Materials | 5.6 |
| Communication Services | 3.7 |
| Real Estate | 2.4 |
| Utilities | 2.3 |
Schedule of Investments September 30, 2020
Showing Percentage of Net Assets
| Common Stocks - 97.0% | |||
| Shares | Value | ||
| Australia - 1.4% | |||
| AGL Energy Ltd. | 109,346 | $1,067,690 | |
| Arena (REIT) unit | 1,802,955 | 3,531,106 | |
| Coles Group Ltd. | 307,559 | 3,746,922 | |
| Commonwealth Bank of Australia | 161,616 | 7,436,969 | |
| CSL Ltd. | 22,902 | 4,730,793 | |
| Inghams Group Ltd. | 1,975,146 | 4,241,324 | |
| National Australia Bank Ltd. | 727,003 | 9,339,769 | |
| SP AusNet | 584,027 | 788,398 | |
| Treasury Wine Estates Ltd. | 697,619 | 4,482,385 | |
| Woodside Petroleum Ltd. | 217,908 | 2,765,704 | |
| TOTAL AUSTRALIA | 42,131,060 | ||
| Austria - 0.2% | |||
| Erste Group Bank AG | 216,800 | 4,543,595 | |
| Bailiwick of Jersey - 0.9% | |||
| Experian PLC | 694,898 | 26,110,361 | |
| Sanne Group PLC | 134,300 | 1,138,542 | |
| TOTAL BAILIWICK OF JERSEY | 27,248,903 | ||
| Belgium - 1.3% | |||
| KBC Groep NV | 384,785 | 19,304,331 | |
| UCB SA | 82,000 | 9,325,667 | |
| Umicore SA | 233,964 | 9,751,759 | |
| TOTAL BELGIUM | 38,381,757 | ||
| Bermuda - 1.1% | |||
| Cheung Kong Infrastructure Holdings Ltd. | 195,500 | 917,443 | |
| Credicorp Ltd. (United States) | 42,400 | 5,257,176 | |
| Genpact Ltd. | 211,900 | 8,253,505 | |
| Hiscox Ltd. | 583,837 | 6,730,465 | |
| IHS Markit Ltd. | 172,000 | 13,503,720 | |
| TOTAL BERMUDA | 34,662,309 | ||
| Canada - 4.8% | |||
| AltaGas Ltd. | 54,500 | 658,150 | |
| ATCO Ltd. Class I (non-vtg.) | 19,700 | 569,451 | |
| Barrick Gold Corp. (Canada) | 577,609 | 16,223,632 | |
| Boardwalk (REIT) | 89,300 | 1,840,926 | |
| Canadian Natural Resources Ltd. | 259,200 | 4,154,052 | |
| Canadian Pacific Railway Ltd. | 51,500 | 15,666,010 | |
| Canadian Utilities Ltd. Class A (non-vtg.) | 29,300 | 698,861 | |
| Cenovus Energy, Inc. (Canada) | 716,100 | 2,791,152 | |
| Cogeco Communications, Inc. | 25,600 | 2,099,256 | |
| Constellation Software, Inc. | 14,200 | 15,779,164 | |
| Emera, Inc. | 36,350 | 1,493,256 | |
| Enbridge, Inc. | 96,900 | 2,830,844 | |
| First Quantum Minerals Ltd. | 674,500 | 6,012,778 | |
| Fortis, Inc. | 58,900 | 2,408,108 | |
| Hydro One Ltd. (a) | 60,700 | 1,286,436 | |
| Intact Financial Corp. | 73,400 | 7,859,541 | |
| Lightspeed POS, Inc. | 46,300 | 1,482,526 | |
| Lundin Mining Corp. | 1,567,600 | 8,747,150 | |
| Pembina Pipeline Corp. | 138,300 | 2,935,194 | |
| Shopify, Inc. (b) | 9,000 | 9,206,730 | |
| Sun Life Financial, Inc. | 217,000 | 8,842,642 | |
| Suncor Energy, Inc. | 318,100 | 3,884,425 | |
| The Toronto-Dominion Bank | 467,200 | 21,631,092 | |
| Wheaton Precious Metals Corp. | 103,900 | 5,097,658 | |
| TOTAL CANADA | 144,199,034 | ||
| Cayman Islands - 1.2% | |||
| Alibaba Group Holding Ltd. sponsored ADR (b) | 40,100 | 11,788,598 | |
| Cheung Kong Property Holdings Ltd. | 748,000 | 3,675,474 | |
| China Feihe Ltd. (a) | 1,223,000 | 2,859,286 | |
| HKBN Ltd. | 2,039,170 | 3,891,488 | |
| KE Holdings, Inc. ADR (b) | 88,890 | 5,448,957 | |
| Tencent Holdings Ltd. | 74,030 | 5,000,237 | |
| Zai Lab Ltd. (b) | 15,400 | 1,281,363 | |
| Zai Lab Ltd. ADR (b) | 12,800 | 1,064,576 | |
| TOTAL CAYMAN ISLANDS | 35,009,979 | ||
| China - 0.2% | |||
| Hangzhou Tigermed Consulting Co. Ltd. (H Shares) (a)(b) | 128,200 | 1,837,175 | |
| Shenzhen Mindray Bio-Medical Electronics Co. Ltd. (A Shares) | 39,907 | 2,050,154 | |
| WuXi AppTec Co. Ltd. (H Shares) (a) | 133,800 | 1,934,851 | |
| TOTAL CHINA | 5,822,180 | ||
| Denmark - 2.2% | |||
| A.P. Moller - Maersk A/S Series B | 10,223 | 16,161,351 | |
| Ascendis Pharma A/S sponsored ADR (b) | 9,000 | 1,388,880 | |
| DSV Panalpina A/S | 208,500 | 34,066,481 | |
| Vestas Wind Systems A/S | 92,450 | 14,996,063 | |
| TOTAL DENMARK | 66,612,775 | ||
| Finland - 0.4% | |||
| Fortum Corp. | 66,600 | 1,348,921 | |
| Nordea Bank ABP (Stockholm Stock Exchange) | 1,297,700 | 9,860,877 | |
| TOTAL FINLAND | 11,209,798 | ||
| France - 9.2% | |||
| ALTEN (b) | 102,000 | 9,686,782 | |
| Amundi SA (a) | 27,600 | 1,948,049 | |
| ARGAN SA | 21,000 | 2,063,278 | |
| AXA SA | 603,300 | 11,165,862 | |
| Capgemini SA | 129,400 | 16,650,724 | |
| Dassault Systemes SA | 80,800 | 15,133,750 | |
| Edenred SA | 268,000 | 12,065,917 | |
| EDF SA | 111,200 | 1,176,778 | |
| ENGIE (b) | 221,280 | 2,962,802 | |
| Kering SA | 22,998 | 15,304,769 | |
| Legrand SA | 154,200 | 12,326,384 | |
| LVMH Moet Hennessy Louis Vuitton SE | 113,845 | 53,268,159 | |
| Pernod Ricard SA | 143,500 | 22,906,771 | |
| Sanofi SA | 430,155 | 43,106,625 | |
| Sartorius Stedim Biotech | 13,600 | 4,697,491 | |
| SR Teleperformance SA | 63,700 | 19,686,983 | |
| Suez Environnement SA | 63,000 | 1,167,426 | |
| Total SA | 330,672 | 11,356,123 | |
| Veolia Environnement SA | 72,800 | 1,572,227 | |
| VINCI SA | 109,021 | 9,109,422 | |
| Vivendi SA | 198,940 | 5,556,171 | |
| Worldline SA (a)(b) | 59,900 | 4,924,510 | |
| TOTAL FRANCE | 277,837,003 | ||
| Germany - 8.8% | |||
| adidas AG | 79,200 | 25,638,105 | |
| Allianz SE | 83,100 | 15,941,594 | |
| BASF AG | 169,247 | 10,306,478 | |
| Bayer AG | 198,100 | 12,221,529 | |
| Daimler AG (Germany) | 191,800 | 10,352,162 | |
| Delivery Hero AG (a)(b) | 64,200 | 7,385,619 | |
| Deutsche Borse AG | 86,900 | 15,262,509 | |
| Deutsche Post AG | 422,031 | 19,248,118 | |
| Deutsche Telekom AG | 387,140 | 6,445,899 | |
| DWS Group GmbH & Co. KGaA (a) | 218,200 | 7,520,081 | |
| E.ON AG | 282,368 | 3,112,378 | |
| Hannover Reuck SE | 81,700 | 12,663,328 | |
| HeidelbergCement AG | 82,500 | 5,060,763 | |
| LEG Immobilien AG (c) | 34,345 | 4,904,617 | |
| Linde PLC | 12 | 2,841 | |
| Rheinmetall AG | 108,700 | 9,782,702 | |
| RWE AG | 72,430 | 2,715,759 | |
| SAP SE | 321,735 | 50,099,996 | |
| Siemens AG | 194,050 | 24,544,202 | |
| Symrise AG | 40,800 | 5,644,643 | |
| Uniper SE | 38,900 | 1,256,965 | |
| Vonovia SE | 242,700 | 16,669,151 | |
| TOTAL GERMANY | 266,779,439 | ||
| Hong Kong - 1.8% | |||
| AIA Group Ltd. | 4,127,000 | 41,022,783 | |
| CLP Holdings Ltd. | 262,500 | 2,451,030 | |
| Dah Sing Banking Group Ltd. | 2,208,400 | 1,919,738 | |
| Hong Kong Exchanges and Clearing Ltd. | 124,870 | 5,878,067 | |
| Power Assets Holdings Ltd. | 257,500 | 1,357,220 | |
| Smoore International Holdings Ltd. (a)(b) | 346,000 | 1,569,700 | |
| TOTAL HONG KONG | 54,198,538 | ||
| Hungary - 0.2% | |||
| OTP Bank PLC (b) | 187,400 | 5,645,939 | |
| Richter Gedeon PLC | 65,000 | 1,373,328 | |
| TOTAL HUNGARY | 7,019,267 | ||
| India - 0.8% | |||
| HDFC Bank Ltd. | 792,100 | 11,661,071 | |
| Reliance Industries Ltd. | 445,200 | 13,540,527 | |
| Reliance Industries Ltd. | 24,986 | 459,700 | |
| TOTAL INDIA | 25,661,298 | ||
| Indonesia - 0.2% | |||
| PT Bank Central Asia Tbk | 1,306,700 | 2,385,257 | |
| PT Bank Rakyat Indonesia Tbk | 20,326,900 | 4,170,152 | |
| TOTAL INDONESIA | 6,555,409 | ||
| Ireland - 1.8% | |||
| DCC PLC (United Kingdom) | 207,539 | 16,089,301 | |
| Irish Residential Properties REIT PLC | 1,952,600 | 3,227,949 | |
| Kerry Group PLC Class A | 97,500 | 12,517,369 | |
| Linde PLC | 34,500 | 8,215,485 | |
| Ryanair Holdings PLC (b) | 103,400 | 1,372,829 | |
| Ryanair Holdings PLC sponsored ADR (b) | 153,480 | 12,548,525 | |
| TOTAL IRELAND | 53,971,458 | ||
| Israel - 0.4% | |||
| Mizrahi Tefahot Bank Ltd. | 365,200 | 6,475,245 | |
| NICE Systems Ltd. (b) | 24,752 | 5,591,725 | |
| TOTAL ISRAEL | 12,066,970 | ||
| Italy - 1.2% | |||
| Enel SpA | 865,336 | 7,507,582 | |
| FinecoBank SpA | 794,300 | 10,947,162 | |
| GVS SpA (a) | 111,500 | 1,503,374 | |
| Recordati SpA | 300,700 | 15,420,787 | |
| Snam Rete Gas SpA | 346,600 | 1,783,563 | |
| TOTAL ITALY | 37,162,468 | ||
| Japan - 17.7% | |||
| A/S One Corp. | 20,100 | 2,879,679 | |
| Advance Residence Investment Corp. | 999 | 2,942,866 | |
| Astellas Pharma, Inc. | 1,136,600 | 16,942,838 | |
| Axis Co. Ltd. (b) | 3,400 | 34,495 | |
| Bandai Namco Holdings, Inc. | 108,300 | 7,935,149 | |
| Chubu Electric Power Co., Inc. | 120,900 | 1,470,562 | |
| Chugai Pharmaceutical Co. Ltd. | 176,300 | 7,911,548 | |
| Chugoku Electric Power Co., Inc. | 71,700 | 896,452 | |
| Daiichi Sankyo Kabushiki Kaisha | 325,500 | 9,992,122 | |
| Daiichikosho Co. Ltd. | 48,670 | 1,563,156 | |
| Daikin Industries Ltd. | 75,100 | 13,876,553 | |
| Dip Corp. | 72,270 | 1,488,776 | |
| Electric Power Development Co. Ltd. | 39,700 | 612,343 | |
| FANUC Corp. | 62,600 | 12,013,915 | |
| Fast Retailing Co. Ltd. | 13,200 | 8,295,164 | |
| Headwaters Co. Ltd. | 500 | 11,378 | |
| Hitachi Ltd. | 142,400 | 4,821,587 | |
| Hoya Corp. | 378,800 | 42,772,706 | |
| Isuzu Motors Ltd. | 290,300 | 2,538,897 | |
| IT Holdings Corp. | 258,800 | 5,496,904 | |
| Itochu Corp. | 440,900 | 11,289,616 | |
| Kansai Electric Power Co., Inc. | 123,600 | 1,197,918 | |
| Kao Corp. | 265,000 | 19,893,752 | |
| KDDI Corp. | 197,240 | 4,960,893 | |
| Keyence Corp. | 61,200 | 28,609,733 | |
| Lifenet Insurance Co. (b) | 207,800 | 2,906,953 | |
| Minebea Mitsumi, Inc. | 157,000 | 2,990,573 | |
| Mitsubishi Estate Co. Ltd. | 420,900 | 6,375,629 | |
| Money Forward, Inc. (b) | 94,600 | 6,847,180 | |
| Murata Manufacturing Co. Ltd. | 96,600 | 6,281,625 | |
| Nexon Co. Ltd. | 389,900 | 9,725,577 | |
| Nintendo Co. Ltd. | 13,653 | 7,737,036 | |
| Nitori Holdings Co. Ltd. | 80,300 | 16,658,386 | |
| Olympus Corp. | 595,400 | 12,381,786 | |
| Oracle Corp. Japan | 79,128 | 8,543,992 | |
| ORIX Corp. | 513,100 | 6,408,758 | |
| Otsuka Corp. | 139,500 | 7,128,640 | |
| Persol Holdings Co., Ltd. | 1,077,700 | 17,603,344 | |
| Recruit Holdings Co. Ltd. | 799,300 | 31,744,487 | |
| Relo Group, Inc. | 299,900 | 7,203,909 | |
| Shin-Etsu Chemical Co. Ltd. | 68,200 | 8,924,265 | |
| Shiseido Co. Ltd. | 62,400 | 3,612,334 | |
| SMC Corp. | 28,400 | 15,842,563 | |
| SoftBank Group Corp. | 232,226 | 14,368,887 | |
| Sony Corp. | 462,600 | 35,454,605 | |
| Sumitomo Mitsui Financial Group, Inc. | 267,000 | 7,465,535 | |
| Suzuki Motor Corp. | 205,600 | 8,807,465 | |
| T&D Holdings, Inc. | 301,900 | 2,976,229 | |
| Taiheiyo Cement Corp. | 189,700 | 4,843,710 | |
| Terumo Corp. | 162,000 | 6,449,982 | |
| Tohoku Electric Power Co., Inc. | 84,440 | 846,266 | |
| Tokio Marine Holdings, Inc. | 146,200 | 6,396,919 | |
| Tokyo Electric Power Co., Inc. (b) | 272,800 | 750,246 | |
| Tokyo Electron Ltd. | 72,300 | 18,888,716 | |
| Tokyo Gas Co. Ltd. | 10 | 228 | |
| Toyota Motor Corp. | 241,600 | 16,034,996 | |
| Tsuruha Holdings, Inc. | 119,000 | 16,870,280 | |
| Z Holdings Corp. | 882,600 | 5,895,262 | |
| TOTAL JAPAN | 535,415,365 | ||
| Korea (South) - 0.6% | |||
| Big Hit Entertainment Co. Ltd. (b)(d) | 2,000 | 231,535 | |
| LG Chemical Ltd. | 15,660 | 8,782,589 | |
| Samsung Electronics Co. Ltd. | 168,140 | 8,391,644 | |
| TOTAL KOREA (SOUTH) | 17,405,768 | ||
| Luxembourg - 0.4% | |||
| B&M European Value Retail SA | 1,774,776 | 11,329,037 | |
| Mexico - 0.1% | |||
| Grupo Financiero Banorte S.A.B. de CV Series O (b) | 631,300 | 2,187,559 | |
| Netherlands - 6.8% | |||
| Adyen BV (a)(b) | 3,800 | 7,009,040 | |
| Argenx SE ADR (b) | 7,400 | 1,942,648 | |
| ASML Holding NV (Netherlands) | 128,078 | 47,308,570 | |
| Basic-Fit NV (a)(b) | 50,321 | 1,200,627 | |
| BE Semiconductor Industries NV | 131,400 | 5,637,053 | |
| Elastic NV (b) | 43,500 | 4,693,215 | |
| Euronext NV (a) | 127,800 | 16,017,801 | |
| Ferrari NV | 71,000 | 13,040,165 | |
| Heineken NV (Bearer) | 71,900 | 6,396,620 | |
| IMCD NV | 168,100 | 20,024,227 | |
| ING Groep NV (Certificaten Van Aandelen) | 1,511,500 | 10,787,376 | |
| JDE Peet's BV | 355,700 | 14,483,815 | |
| Koninklijke Philips Electronics NV | 397,245 | 18,757,568 | |
| NXP Semiconductors NV | 50,800 | 6,340,348 | |
| RHI Magnesita NV | 189,545 | 6,217,208 | |
| Unilever NV | 159,225 | 9,669,316 | |
| Wolters Kluwer NV | 198,800 | 16,977,770 | |
| TOTAL NETHERLANDS | 206,503,367 | ||
| Norway - 0.9% | |||
| Adevinta ASA Class B (b) | 368,680 | 6,336,039 | |
| Schibsted ASA: | |||
| (A Shares) | 279,900 | 12,408,325 | |
| (B Shares) | 189,170 | 7,564,772 | |
| TOTAL NORWAY | 26,309,136 | ||
| Poland - 0.2% | |||
| CD Projekt RED SA (b) | 44,000 | 4,762,664 | |
| Portugal - 0.1% | |||
| Energias de Portugal SA | 405,300 | 1,993,439 | |
| Galp Energia SGPS SA Class B | 242,524 | 2,249,529 | |
| TOTAL PORTUGAL | 4,242,968 | ||
| Singapore - 0.4% | |||
| Parkway Life REIT | 1,107,200 | 3,373,967 | |
| United Overseas Bank Ltd. | 450,713 | 6,349,281 | |
| Wing Tai Holdings Ltd. | 1,995,800 | 2,550,697 | |
| TOTAL SINGAPORE | 12,273,945 | ||
| South Africa - 0.4% | |||
| Naspers Ltd. Class N | 71,900 | 12,699,259 | |
| Spain - 2.2% | |||
| Amadeus IT Holding SA Class A | 317,549 | 17,718,248 | |
| Bankinter SA | 1,891,500 | 8,154,443 | |
| Cellnex Telecom SA (a) | 114,148 | 6,959,307 | |
| Enagas SA | 47,100 | 1,087,605 | |
| Gas Natural SDG SA | 63,800 | 1,280,616 | |
| Iberdrola SA | 2,351,833 | 28,980,343 | |
| Red Electrica Corporacion SA | 81,400 | 1,528,430 | |
| TOTAL SPAIN | 65,708,992 | ||
| Sweden - 3.7% | |||
| AddTech AB (B Shares) | 692,000 | 9,086,709 | |
| ASSA ABLOY AB (B Shares) | 537,300 | 12,562,138 | |
| Atlas Copco AB (A Shares) | 295,800 | 14,162,703 | |
| Ericsson (B Shares) | 481,411 | 5,268,196 | |
| Hexagon AB (B Shares) (b) | 224,400 | 16,983,125 | |
| Indutrade AB (b) | 309,763 | 16,629,806 | |
| John Mattson Fastighetsforetag (b) | 58,869 | 1,008,336 | |
| Lundin Petroleum AB | 96,873 | 1,930,786 | |
| NP3 Fastigheter AB | 149,000 | 2,043,044 | |
| Svenska Handelsbanken AB (A Shares) (b) | 193,345 | 1,617,673 | |
| Swedbank AB (A Shares) (b) | 583,100 | 9,163,339 | |
| Swedish Match Co. AB | 268,900 | 22,002,369 | |
| TOTAL SWEDEN | 112,458,224 | ||
| Switzerland - 9.9% | |||
| Alcon, Inc. (b) | 154,451 | 8,795,984 | |
| Julius Baer Group Ltd. | 263,540 | 11,193,175 | |
| Lonza Group AG | 56,530 | 34,886,673 | |
| Nestle SA (Reg. S) | 762,968 | 90,802,384 | |
| Roche Holding AG (participation certificate) | 221,460 | 75,859,032 | |
| Siemens Energy AG rights (b) | 92,675 | 2,374,151 | |
| Sika AG | 115,414 | 28,356,971 | |
| Sonova Holding AG Class B | 72,153 | 18,299,702 | |
| Zurich Insurance Group Ltd. | 79,556 | 27,742,394 | |
| TOTAL SWITZERLAND | 298,310,466 | ||
| Taiwan - 0.5% | |||
| Taiwan Semiconductor Manufacturing Co. Ltd. | 991,000 | 14,926,204 | |
| United Kingdom - 11.1% | |||
| Abcam PLC | 114,000 | 1,800,503 | |
| AstraZeneca PLC (United Kingdom) | 248,100 | 27,108,515 | |
| Beazley PLC | 2,818,800 | 11,122,676 | |
| BP PLC | 3,463,376 | 10,016,020 | |
| British American Tobacco PLC (United Kingdom) | 67,781 | 2,431,394 | |
| Compass Group PLC | 1,110,500 | 16,681,679 | |
| Cranswick PLC | 115,980 | 5,426,483 | |
| Dechra Pharmaceuticals PLC | 280,300 | 11,660,728 | |
| Diageo PLC | 1,050,845 | 36,095,177 | |
| Diploma PLC | 183,468 | 5,212,969 | |
| Direct Line Insurance Group PLC | 2,062,576 | 7,169,933 | |
| Grainger Trust PLC | 743,886 | 2,852,743 | |
| Helical Bar PLC | 362,403 | 1,381,837 | |
| Hotel Chocolat Group Ltd. (c) | 955,500 | 4,376,899 | |
| Informa PLC | 297,660 | 1,442,661 | |
| John David Group PLC | 863,200 | 9,015,341 | |
| London Stock Exchange Group PLC | 271,300 | 31,122,696 | |
| Mondi PLC | 776,400 | 16,424,966 | |
| Ocado Group PLC (b) | 157,199 | 5,565,977 | |
| Prudential PLC | 1,757,643 | 25,219,223 | |
| Reckitt Benckiser Group PLC | 145,830 | 14,219,203 | |
| RELX PLC (London Stock Exchange) | 1,423,500 | 31,703,396 | |
| Rentokil Initial PLC | 2,016,900 | 13,939,027 | |
| Rio Tinto PLC | 216,600 | 13,033,362 | |
| Rolls-Royce Holdings PLC | 7,051 | 11,707 | |
| Royal Dutch Shell PLC: | |||
| Class A (United Kingdom) | 273,727 | 3,417,027 | |
| Class B (United Kingdom) | 190,130 | 2,305,717 | |
| Scottish & Southern Energy PLC | 133,700 | 2,080,930 | |
| Smith & Nephew PLC | 506,800 | 9,927,879 | |
| THG Holdings Ltd. | 417,200 | 3,220,314 | |
| Victrex PLC | 385,200 | 9,100,854 | |
| TOTAL UNITED KINGDOM | 335,087,836 | ||
| United States of America - 3.9% | |||
| Ares Management Corp. | 191,700 | 7,748,514 | |
| Aspen Technology, Inc. (b) | 37,079 | 4,693,831 | |
| Becton, Dickinson & Co. | 37,400 | 8,702,232 | |
| Black Knight, Inc. (b) | 122,000 | 10,620,100 | |
| Boston Beer Co., Inc. Class A (b) | 8,000 | 7,066,880 | |
| Boston Scientific Corp. (b) | 215,000 | 8,215,150 | |
| Constellation Brands, Inc. Class A (sub. vtg.) | 14,000 | 2,653,140 | |
| Fidelity National Information Services, Inc. | 56,000 | 8,243,760 | |
| Global Payments, Inc. | 66,310 | 11,775,330 | |
| Intercontinental Exchange, Inc. | 85,700 | 8,574,285 | |
| Kosmos Energy Ltd. | 672,800 | 656,384 | |
| Marsh & McLennan Companies, Inc. | 116,200 | 13,328,140 | |
| NICE Systems Ltd. sponsored ADR (b) | 54,300 | 12,327,729 | |
| Philip Morris International, Inc. | 61,900 | 4,641,881 | |
| Roper Technologies, Inc. | 24,100 | 9,522,151 | |
| TOTAL UNITED STATES OF AMERICA | 118,769,507 | ||
| TOTAL COMMON STOCKS | |||
| (Cost $2,449,121,247) | 2,929,463,537 | ||
| Nonconvertible Preferred Stocks - 0.3% | |||
| Germany - 0.3% | |||
| Porsche Automobil Holding SE (Germany) | |||
| (Cost $8,081,839) | 176,700 | 10,545,050 | |
| Principal Amount | Value | ||
| Government Obligations - 0.1% | |||
| United States of America - 0.1% | |||
| U.S. Treasury Bills, yield at date of purchase 0.1% to 0.1% 11/12/20 to 11/19/20(e) | |||
| (Cost $1,669,773) | 1,670,000 | 1,669,798 | |
| Shares | Value | ||
| Money Market Funds - 2.2% | |||
| Fidelity Cash Central Fund 0.10% (f) | 65,325,217 | 65,338,282 | |
| Fidelity Securities Lending Cash Central Fund 0.10% (f)(g) | 583,704 | 583,763 | |
| TOTAL MONEY MARKET FUNDS | |||
| (Cost $65,922,044) | 65,922,045 | ||
| TOTAL INVESTMENT IN SECURITIES - 99.6% | |||
| (Cost $2,524,794,903) | 3,007,600,430 | ||
| NET OTHER ASSETS (LIABILITIES) - 0.4% | 13,328,083 | ||
| NET ASSETS - 100% | $3,020,928,513 |
| Futures Contracts | |||||
| Number of contracts | Expiration Date | Notional Amount | Value | Unrealized Appreciation/(Depreciation) | |
| Purchased | |||||
| Equity Index Contracts | |||||
| ICE E-mini MSCI EAFE Index Contracts (United States) | 102 | Dec. 2020 | $9,451,320 | $(179,828) | $(179,828) |
| TME S&P/TSX 60 Index Contracts (Canada) | 5 | Dec. 2020 | 722,091 | (439) | (439) |
| TOTAL FUTURES CONTRACTS | $(180,267) |
The notional amount of futures purchased as a percentage of Net Assets is 0.3%
Categorizations in the Schedule of Investments are based on country or territory of incorporation.
Legend
(a) Security exempt from registration under Rule 144A of the Securities Act of 1933. These securities may be resold in transactions exempt from registration, normally to qualified institutional buyers. At the end of the period, the value of these securities amounted to $63,955,856 or 2.1% of net assets.
(b) Non-income producing
(c) Security or a portion of the security is on loan at period end.
(d) Security or a portion of the security purchased on a delayed delivery or when-issued basis.
(e) Security or a portion of the security was pledged to cover margin requirements for futures contracts. At period end, the value of securities pledged amounted to $1,042,875.
(f) Affiliated fund that is generally available only to investment companies and other accounts managed by Fidelity Investments. The rate quoted is the annualized seven-day yield of the fund at period end. A complete unaudited listing of the fund's holdings as of its most recent quarter end is available upon request. In addition, each Fidelity Central Fund's financial statements, which are not covered by the Fund's Report of Independent Registered Public Accounting Firm, are available on the SEC's website or upon request.
(g) Investment made with cash collateral received from securities on loan.
Affiliated Central Funds
Information regarding fiscal year to date income earned by the Fund from investments in Fidelity Central Funds is as follows:
| Fund | Income earned |
| Fidelity Cash Central Fund | $511,238 |
| Fidelity Securities Lending Cash Central Fund | 242,814 |
| Total | $754,052 |
Amounts in the income column in the above table include any capital gain distributions from underlying funds, which are presented in the corresponding line-item in the Statement of Operations, if applicable. Amount for Fidelity Securities Lending Cash Central Fund represents the income earned on investing cash collateral, less rebates paid to borrowers and any lending agent fees associated with the loan, plus any premium payments received for lending certain types of securities.
Investment Valuation
The following is a summary of the inputs used, as of September 30, 2020, involving the Fund's assets and liabilities carried at fair value. The inputs or methodology used for valuing securities may not be an indication of the risk associated with investing in those securities. For more information on valuation inputs, and their aggregation into the levels used below, please refer to the Investment Valuation section in the accompanying Notes to Financial Statements.
| Valuation Inputs at Reporting Date: | ||||
| Description | Total | Level 1 | Level 2 | Level 3 |
| Investments in Securities: | ||||
| Equities: | ||||
| Communication Services | $108,437,941 | $40,130,363 | $68,307,578 | $-- |
| Consumer Discretionary | 302,759,523 | 124,385,764 | 178,373,759 | -- |
| Consumer Staples | 312,965,684 | 102,472,227 | 210,493,457 | -- |
| Energy | 65,293,184 | 19,182,837 | 46,110,347 | -- |
| Financials | 480,204,738 | 235,177,981 | 245,026,757 | -- |
| Health Care | 427,223,868 | 94,191,050 | 333,032,818 | -- |
| Industrials | 500,406,106 | 329,717,247 | 170,688,859 | -- |
| Information Technology | 417,475,972 | 206,199,716 | 211,276,256 | -- |
| Materials | 170,747,112 | 133,639,297 | 37,107,815 | -- |
| Real Estate | 71,094,486 | 41,440,838 | 29,653,648 | -- |
| Utilities | 83,399,973 | 55,969,136 | 27,430,837 | -- |
| Government Obligations | 1,669,798 | -- | 1,669,798 | -- |
| Money Market Funds | 65,922,045 | 65,922,045 | -- | -- |
| Total Investments in Securities: | $3,007,600,430 | $1,448,428,501 | $1,559,171,929 | $-- |
| Derivative Instruments: | ||||
| Liabilities | ||||
| Futures Contracts | $(180,267) | $(180,267) | $-- | $-- |
| Total Liabilities | $(180,267) | $(180,267) | $-- | $-- |
| Total Derivative Instruments: | $(180,267) | $(180,267) | $-- | $-- |
Value of Derivative Instruments
The following table is a summary of the Fund's value of derivative instruments by primary risk exposure as of September 30, 2020. For additional information on derivative instruments, please refer to the Derivative Instruments section in the accompanying Notes to Financial Statements.
| Primary Risk Exposure / Derivative Type | Value | |
| Asset | Liability | |
| Equity Risk | ||
| Futures Contracts(a) | $0 | $(180,267) |
| Total Equity Risk | 0 | (180,267) |
| Total Value of Derivatives | $0 | $(180,267) |
(a) Reflects gross cumulative appreciation (depreciation) on futures contracts as presented in the Schedule of Investments. In the Statement of Assets and Liabilities, the period end daily variation margin is included in receivable or payable for daily variation margin on futures contracts, and the net cumulative appreciation (depreciation) is included in Total accumulated earnings (loss).
See accompanying notes which are an integral part of the financial statements.
Financial Statements
Statement of Assets and Liabilities
| September 30, 2020 | ||
| Assets | ||
| Investment in securities, at value (including securities loaned of $567,351) — See accompanying schedule: Unaffiliated issuers (cost $2,458,872,859) | $2,941,678,385 | |
| Fidelity Central Funds (cost $65,922,044) | 65,922,045 | |
| Total Investment in Securities (cost $2,524,794,903) | $3,007,600,430 | |
| Cash | 120,603 | |
| Foreign currency held at value (cost $58,322) | 58,307 | |
| Receivable for investments sold | 6,344,100 | |
| Receivable for fund shares sold | 1,208,886 | |
| Dividends receivable | 14,215,524 | |
| Distributions receivable from Fidelity Central Funds | 9,582 | |
| Other receivables | 264 | |
| Total assets | 3,029,557,696 | |
| Liabilities | ||
| Payable for investments purchased | ||
| Regular delivery | $4,838,928 | |
| Delayed delivery | 233,850 | |
| Payable for fund shares redeemed | 1,948,934 | |
| Payable for daily variation margin on futures contracts | 58,281 | |
| Other payables and accrued expenses | 965,651 | |
| Collateral on securities loaned | 583,539 | |
| Total liabilities | 8,629,183 | |
| Net Assets | $3,020,928,513 | |
| Net Assets consist of: | ||
| Paid in capital | $2,587,827,877 | |
| Total accumulated earnings (loss) | 433,100,636 | |
| Net Assets | $3,020,928,513 | |
| Net Asset Value, offering price and redemption price per share ($3,020,928,513 ÷ 35,698,404 shares) | $84.62 |
See accompanying notes which are an integral part of the financial statements.
Statement of Operations
| Year ended September 30, 2020 | ||
| Investment Income | ||
| Dividends | $47,653,285 | |
| Non-Cash dividends | 2,618,905 | |
| Interest | 48,695 | |
| Income from Fidelity Central Funds (including $242,814 from security lending) | 754,052 | |
| Income before foreign taxes withheld | 51,074,937 | |
| Less foreign taxes withheld | (4,745,928) | |
| Total income | 46,329,009 | |
| Expenses | ||
| Custodian fees and expenses | $318,197 | |
| Independent directors' fees and expenses | 15,027 | |
| Miscellaneous | 26 | |
| Total expenses | 333,250 | |
| Net investment income (loss) | 45,995,759 | |
| Realized and Unrealized Gain (Loss) | ||
| Net realized gain (loss) on: | ||
| Investment securities: | ||
| Unaffiliated issuers (net of foreign taxes of $48,002) | 33,950,300 | |
| Fidelity Central Funds | 5,919 | |
| Foreign currency transactions | (444,459) | |
| Futures contracts | (9,384,912) | |
| Total net realized gain (loss) | 24,126,848 | |
| Change in net unrealized appreciation (depreciation) on: | ||
| Investment securities: | ||
| Unaffiliated issuers (net of increase in deferred foreign taxes of $699,730) | 202,310,404 | |
| Assets and liabilities in foreign currencies | 653,241 | |
| Futures contracts | (180,267) | |
| Total change in net unrealized appreciation (depreciation) | 202,783,378 | |
| Net gain (loss) | 226,910,226 | |
| Net increase (decrease) in net assets resulting from operations | $272,905,985 |
See accompanying notes which are an integral part of the financial statements.
Statement of Changes in Net Assets
| Year ended September 30, 2020 | Year ended September 30, 2019 | |
| Increase (Decrease) in Net Assets | ||
| Operations | ||
| Net investment income (loss) | $45,995,759 | $71,788,242 |
| Net realized gain (loss) | 24,126,848 | (64,702,648) |
| Change in net unrealized appreciation (depreciation) | 202,783,378 | (16,686,120) |
| Net increase (decrease) in net assets resulting from operations | 272,905,985 | (9,600,526) |
| Distributions to shareholders | (52,772,474) | (181,492,635) |
| Affiliated share transactions | ||
| Proceeds from sales of shares | 636,315,288 | 170,137,375 |
| Reinvestment of distributions | 52,772,474 | 181,492,635 |
| Cost of shares redeemed | (321,078,412) | (372,812,401) |
| Net increase (decrease) in net assets resulting from share transactions | 368,009,350 | (21,182,391) |
| Total increase (decrease) in net assets | 588,142,861 | (212,275,552) |
| Net Assets | ||
| Beginning of period | 2,432,785,652 | 2,645,061,204 |
| End of period | $3,020,928,513 | $2,432,785,652 |
| Other Information | ||
| Shares | ||
| Sold | 8,168,239 | 2,256,424 |
| Issued in reinvestment of distributions | 676,964 | 2,549,322 |
| Redeemed | (4,366,790) | (4,869,713) |
| Net increase (decrease) | 4,478,413 | (63,967) |
See accompanying notes which are an integral part of the financial statements.
Financial Highlights
Fidelity International Equity Central Fund
| Years ended September 30, | 2020 | 2019 | 2018 | 2017 | 2016 |
| Selected Per–Share Data | |||||
| Net asset value, beginning of period | $77.92 | $84.55 | $87.45 | $74.96 | $71.96 |
| Income from Investment Operations | |||||
| Net investment income (loss)A | 1.40 | 2.23 | 2.30 | 2.18 | 2.09 |
| Net realized and unrealized gain (loss) | 6.94 | (3.09) | (.27) | 12.27 | 2.87 |
| Total from investment operations | 8.34 | (.86) | 2.03 | 14.45 | 4.96 |
| Distributions from net investment income | (1.39) | (2.12) | (2.34) | (1.92) | (1.96) |
| Distributions from net realized gain | (.25) | (3.65) | (2.60) | (.03) | – |
| Total distributions | (1.64) | (5.77) | (4.93)B | (1.96)B | (1.96) |
| Net asset value, end of period | $84.62 | $77.92 | $84.55 | $87.45 | $74.96 |
| Total ReturnC | 10.91% | (.21)% | 2.30% | 19.54% | 6.95% |
| Ratios to Average Net AssetsD,E | |||||
| Expenses before reductions | .01% | .01% | .01% | .01% | .01% |
| Expenses net of fee waivers, if any | .01% | .01% | .01% | .01% | .01% |
| Expenses net of all reductions | .01% | .01% | .01% | .01% | .01% |
| Net investment income (loss) | 1.77% | 2.93% | 2.63% | 2.74% | 2.87% |
| Supplemental Data | |||||
| Net assets, end of period (000 omitted) | $3,020,929 | $2,432,786 | $2,645,061 | $3,094,384 | $2,138,296 |
| Portfolio turnover rateF | 81% | 70% | 53% | 61% | 59% |
A Calculated based on average shares outstanding during the period.
B Total distributions per share do not sum due to rounding.
C Total returns would have been lower if certain expenses had not been reduced during the applicable periods shown.
D Fees and expenses of any underlying mutual funds or exchange-traded funds (ETFs) are not included in the Fund's expense ratio. The Fund indirectly bears its proportionate share of these expenses. For additional expense information related to investments in Fidelity Central Funds, please refer to the "Investments in Fidelity Central Funds" note found in the Notes to Financial Statements section of the most recent Annual or Semi-Annual report.
E Expense ratios reflect operating expenses of the class. Expenses before reductions do not reflect amounts reimbursed, waived, or reduced through arrangements with the investment advisor, brokerage services, or other offset arrangements, if applicable, and do not represent the amount paid by the class during periods when reimbursements, waivers or reductions occur.
F Amount does not include the portfolio activity of any underlying mutual funds or exchange-traded funds (ETFs).
See accompanying notes which are an integral part of the financial statements.
Notes to Financial Statements
For the period ended September 30, 2020
1. Organization.
Fidelity International Equity Central Fund (the Fund) is a fund of Fidelity Central Investment Portfolios LLC (the LLC) and is authorized to issue an unlimited number of shares. Shares of the Fund are only offered to other investment companies and accounts managed by Fidelity Management & Research Company LLC (FMR), or its affiliates (the Investing Funds). The LLC is registered under the Investment Company Act of 1940, as amended (the 1940 Act), as an open-end management investment company organized as a Delaware Limited Liability Company.
Effective January 1, 2020:
Investment advisers Fidelity Investments Money Management, Inc., FMR Co., Inc., and Fidelity SelectCo, LLC, merged with and into Fidelity Management & Research Company. In connection with the merger transactions, the resulting, merged investment adviser was then redomiciled from Massachusetts to Delaware, changed its corporate structure from a corporation to a limited liability company, and changed its name to "Fidelity Management & Research Company LLC".
2. Investments in Fidelity Central Funds.
The Fund invests in Fidelity Central Funds, which are open-end investment companies generally available only to other investment companies and accounts managed by the investment adviser and its affiliates. The Fund's Schedule of Investments lists each of the Fidelity Central Funds held as of period end, if any, as an investment of the Fund, but does not include the underlying holdings of each Fidelity Central Fund. As an Investing Fund, the Fund indirectly bears its proportionate share of the expenses of the underlying Fidelity Central Funds.
The Money Market Central Funds seek preservation of capital and current income and are managed by the investment adviser. Annualized expenses of the Money Market Central Funds as of their most recent shareholder report date ranged from less than .005% to .01%.
A complete unaudited list of holdings for each Fidelity Central Fund is available upon request or at the Securities and Exchange Commission (the SEC) website at www.sec.gov. In addition, the financial statements of the Fidelity Central Funds, which are not covered by the Fund's Report of Independent Registered Public Accounting Firm, are available on the SEC website or upon request.
3. Significant Accounting Policies.
The Fund is an investment company and applies the accounting and reporting guidance of the Financial Accounting Standards Board (FASB) Accounting Standards Codification Topic 946 Financial Services – Investment Companies. The financial statements have been prepared in conformity with accounting principles generally accepted in the United States of America (GAAP), which require management to make certain estimates and assumptions at the date of the financial statements. Actual results could differ from those estimates. Subsequent events, if any, through the date that the financial statements were issued have been evaluated in the preparation of the financial statements. The following summarizes the significant accounting policies of the Fund:
Investment Valuation. Investments are valued as of 4:00 p.m. Eastern time on the last calendar day of the period. The Board of Directors (the Board) has delegated the day to day responsibility for the valuation of the Fund's investments to the Fair Value Committee (the Committee) established by the Fund's investment adviser. In accordance with valuation policies and procedures approved by the Board, the Fund attempts to obtain prices from one or more third party pricing vendors or brokers to value its investments. When current market prices, quotations or currency exchange rates are not readily available or reliable, investments will be fair valued in good faith by the Committee, in accordance with procedures adopted by the Board. Factors used in determining fair value vary by investment type and may include market or investment specific events, changes in interest rates and credit quality. The frequency with which these procedures are used cannot be predicted and they may be utilized to a significant extent. The Committee oversees the Fund's valuation policies and procedures and reports to the Board on the Committee's activities and fair value determinations. The Board monitors the appropriateness of the procedures used in valuing the Fund's investments and ratifies the fair value determinations of the Committee.
The Fund categorizes the inputs to valuation techniques used to value its investments into a disclosure hierarchy consisting of three levels as shown below:
- Level 1 – quoted prices in active markets for identical investments
- Level 2 – other significant observable inputs (including quoted prices for similar investments, interest rates, prepayment speeds, etc.)
- Level 3 – unobservable inputs (including the Fund's own assumptions based on the best information available)
Valuation techniques used to value the Fund's investments by major category are as follows:
Equity securities, including restricted securities, for which market quotations are readily available, are valued at the last reported sale price or official closing price as reported by a third party pricing vendor on the primary market or exchange on which they are traded and are categorized as Level 1 in the hierarchy. In the event there were no sales during the day or closing prices are not available, securities are valued at the last quoted bid price or may be valued using the last available price and are generally categorized as Level 2 in the hierarchy. For foreign equity securities, when market or security specific events arise, comparisons to the valuation of American Depositary Receipts (ADRs), futures contracts, Exchange-Traded Funds (ETFs) and certain indexes as well as quoted prices for similar securities may be used and would be categorized as Level 2 in the hierarchy. For equity securities, including restricted securities, where observable inputs are limited, assumptions about market activity and risk are used and these securities may be categorized as Level 3 in the hierarchy.
Debt securities, including restricted securities, are valued based on evaluated prices received from third party pricing vendors or from brokers who make markets in such securities. U.S. government and government agency obligations are valued by pricing vendors who utilize matrix pricing which considers yield or price of bonds of comparable quality, coupon, maturity and type or by broker-supplied prices. When independent prices are unavailable or unreliable, debt securities may be valued utilizing pricing methodologies which consider similar factors that would be used by third party pricing vendors. Debt securities are generally categorized as Level 2 in the hierarchy but may be Level 3 depending on the circumstances.
Futures contracts are valued at the settlement price established each day by the board of trade or exchange on which they are traded and are categorized as Level 1 in the hierarchy. Investments in open-end mutual funds, including the Fidelity Central Funds, are valued at their closing net asset value (NAV) each business day and are categorized as Level 1 in the hierarchy.
Changes in valuation techniques may result in transfers in or out of an assigned level within the disclosure hierarchy. The aggregate value of investments by input level as of September 30, 2020 is included at the end of the Fund's Schedule of Investments.
Foreign Currency. Certain Funds may use foreign currency contracts to facilitate transactions in foreign-denominated securities. Gains and losses from these transactions may arise from changes in the value of the foreign currency or if the counterparties do not perform under the contracts' terms.
Foreign-denominated assets, including investment securities, and liabilities are translated into U.S. dollars at the exchange rates at period end. Purchases and sales of investment securities, income and dividends received, and expenses denominated in foreign currencies are translated into U.S. dollars at the exchange rate in effect on the transaction date.
The effects of exchange rate fluctuations on investments are included with the net realized and unrealized gain (loss) on investment securities. Other foreign currency transactions resulting in realized and unrealized gain (loss) are disclosed separately.
Investment Transactions and Income. For financial reporting purposes, the Fund's investment holdings and NAV include trades executed through the end of the last business day of the period. The NAV per share for processing shareholder transactions is calculated as of the close of business of the New York Stock Exchange (NYSE), normally 4:00 p.m. Eastern time and includes trades executed through the end of the prior business day. Gains and losses on securities sold are determined on the basis of identified cost and include proceeds received from litigation. Dividend income is recorded on the ex-dividend date, except for certain dividends from foreign securities where the ex-dividend date may have passed, which are recorded as soon as the Fund is informed of the ex-dividend date. Non-cash dividends included in dividend income, if any, are recorded at the fair market value of the securities received. Income and capital gain distributions from Fidelity Central Funds, if any, are recorded on the ex-dividend date. Certain distributions received by the Fund represent a return of capital or capital gain. The Fund determines the components of these distributions subsequent to the ex-dividend date, based upon receipt of tax filings or other correspondence relating to the underlying investment. These distributions are recorded as a reduction of cost of investments and/or as a realized gain. Interest income is accrued as earned and includes coupon interest and amortization of premium and accretion of discount on debt securities as applicable. Investment income is recorded net of foreign taxes withheld where recovery of such taxes is uncertain.
Expenses. Expenses directly attributable to a fund are charged to that fund. Expenses attributable to more than one fund are allocated among the respective funds on the basis of relative net assets or other appropriate methods. Expense estimates are accrued in the period to which they relate and adjustments are made when actual amounts are known.
Income Tax Information and Distributions to Shareholders. Each year, the Fund intends to qualify as a regulated investment company under Subchapter M of the Internal Revenue Code, including distributing substantially all of its taxable income and realized gains. As a result, no provision for U.S. Federal income taxes is required. As of September 30, 2020, the Fund did not have any unrecognized tax benefits in the financial statements; nor is the Fund aware of any tax positions for which it is reasonably possible that the total amounts of unrecognized tax benefits will significantly change in the next twelve months. The Fund files a U.S. federal tax return, in addition to state and local tax returns as required. The Fund's federal income tax returns are subject to examination by the Internal Revenue Service (IRS) for a period of three fiscal years after they are filed. State and local tax returns may be subject to examination for an additional fiscal year depending on the jurisdiction. Foreign taxes are provided for based on the Fund's understanding of the tax rules and rates that exist in the foreign markets in which it invests. The Fund is subject to a tax imposed on capital gains by certain countries in which it invests. An estimated deferred tax liability for net unrealized appreciation on the applicable securities is included in Other payables and accrued expenses on the Statement of Assets & Liabilities.
Distributions are declared and recorded on the ex-dividend date. Income and capital gain distributions are determined in accordance with income tax regulations, which may differ from GAAP.
Capital accounts within the financial statements are adjusted for permanent book-tax differences. These adjustments have no impact on net assets or the results of operations. Capital accounts are not adjusted for temporary book-tax differences which will reverse in a subsequent period.
Book-tax differences are primarily due to futures contracts, foreign currency transactions, certain foreign taxes, passive foreign investment companies (PFIC), capital loss carryforwards and losses deferred due to wash sales.
As of period end, the cost and unrealized appreciation (depreciation) in securities, and derivatives if applicable, for federal income tax purposes were as follows:
| Gross unrealized appreciation | $603,805,055 |
| Gross unrealized depreciation | (136,056,420) |
| Net unrealized appreciation (depreciation) | $467,748,635 |
| Tax Cost | $2,539,851,356 |
The tax-based components of distributable earnings as of period end were as follows:
| Undistributed ordinary income | $7,280,640 |
| Capital loss carryforward | $(41,531,096) |
| Net unrealized appreciation (depreciation) on securities and other investments | $468,189,257 |
Capital loss carryforwards are only available to offset future capital gains of the Fund to the extent provided by regulations and may be limited. The capital loss carryforward information presented below, including any applicable limitation, is estimated as of fiscal period end and is subject to adjustment.
| No expiration | |
| Short-term | $(41,531,096) |
The tax character of distributions paid was as follows:
| September 30, 2020 | September 30, 2019 | |
| Ordinary Income | $52,772,474 | $ 79,651,585 |
| Long-term Capital Gains | – | 101,841,050 |
| Total | $52,772,474 | $ 181,492,635 |
Delayed Delivery Transactions and When-Issued Securities. During the period, certain Funds transacted in securities on a delayed delivery or when-issued basis. Payment and delivery may take place after the customary settlement period for that security. The price of the underlying securities and the date when the securities will be delivered and paid for are fixed at the time the transaction is negotiated. Securities purchased on a delayed delivery or when-issued basis are identified as such in the Schedule of Investments. Compensation for interest forgone in the purchase of a delayed delivery or when-issued debt security may be received. With respect to purchase commitments, each applicable Fund identifies securities as segregated in its records with a value at least equal to the amount of the commitment. Payables and receivables associated with the purchases and sales of delayed delivery securities having the same coupon, settlement date and broker are offset. Delayed delivery or when-issued securities that have been purchased from and sold to different brokers are reflected as both payables and receivables in the Statement of Assets and Liabilities under the caption "Delayed delivery", as applicable. Losses may arise due to changes in the value of the underlying securities or if the counterparty does not perform under the contract's terms, or if the issuer does not issue the securities due to political, economic, or other factors.
Restricted Securities (including Private Placements). The Fund may invest in securities that are subject to legal or contractual restrictions on resale. These securities generally may be resold in transactions exempt from registration or to the public if the securities are registered. Disposal of these securities may involve time-consuming negotiations and expense, and prompt sale at an acceptable price may be difficult. Information regarding restricted securities is included at the end of the Fund's Schedule of Investments.
4. Derivative Instruments.
Risk Exposures and the Use of Derivative Instruments. The Fund's investment objective allows the Fund to enter into various types of derivative contracts, including futures contracts. Derivatives are investments whose value is primarily derived from underlying assets, indices or reference rates and may be transacted on an exchange or over-the-counter (OTC). Derivatives may involve a future commitment to buy or sell a specified asset based on specified terms, to exchange future cash flows at periodic intervals based on a notional principal amount, or for one party to make one or more payments upon the occurrence of specified events in exchange for periodic payments from the other party.
The Fund used derivatives to increase returns and to manage exposure to certain risks as defined below. The success of any strategy involving derivatives depends on analysis of numerous economic factors, and if the strategies for investment do not work as intended, the Fund may not achieve its objectives.
The Fund's use of derivatives increased or decreased its exposure to the following risk:
| Equity Risk | Equity risk relates to the fluctuations in the value of financial instruments as a result of changes in market prices (other than those arising from interest rate risk or foreign exchange risk), whether caused by factors specific to an individual investment, its issuer, or all factors affecting all instruments traded in a market or market segment. |
The Fund is also exposed to additional risks from investing in derivatives, such as liquidity risk and counterparty credit risk. Liquidity risk is the risk that the Fund will be unable to close out the derivative in the open market in a timely manner. Counterparty credit risk is the risk that the counterparty will not be able to fulfill its obligation to the Fund. Counterparty credit risk related to exchange-traded futures contracts may be mitigated by the protection provided by the exchange on which they trade.
Investing in derivatives may involve greater risks than investing in the underlying assets directly and, to varying degrees, may involve risk of loss in excess of any initial investment and collateral received and amounts recognized in the Statement of Assets and Liabilities. In addition, there may be the risk that the change in value of the derivative contract does not correspond to the change in value of the underlying instrument.
Futures Contracts. A futures contract is an agreement between two parties to buy or sell a specified underlying instrument for a fixed price at a specified future date. The Fund used futures contracts to manage its exposure to the stock market.
Upon entering into a futures contract, a fund is required to deposit either cash or securities (initial margin) with a clearing broker in an amount equal to a certain percentage of the face value of the contract. Futures contracts are marked-to-market daily and subsequent daily payments (variation margin) are made or received by a fund depending on the daily fluctuations in the value of the futures contracts and are recorded as unrealized appreciation or (depreciation). This receivable and/or payable, if any, is included in daily variation margin on futures contracts in the Statement of Assets and Liabilities. Realized gain or (loss) is recorded upon the expiration or closing of a futures contract. The net realized gain (loss) and change in net unrealized appreciation (depreciation) on futures contracts during the period is presented in the Statement of Operations.
Any open futures contracts at period end are presented in the Schedule of Investments under the caption "Futures Contracts". The notional amount at value reflects each contract's exposure to the underlying instrument or index at period end and is representative of volume of activity during the period. Securities deposited to meet initial margin requirements are identified in the Schedule of Investments.
5. Purchases and Sales of Investments.
Purchases and sales of securities, other than short-term securities and U.S. government securities are noted in the table below.
| Purchases ($) | Sales ($) | |
| Fidelity International Equity Central Fund | 2,384,861,965 | 2,063,130,774 |
6. Fees and Other Transactions with Affiliates.
Management Fee and Expense Contract. Fidelity Management & Research Company LLC (the investment adviser) provides the Fund with investment management services. The Fund does not pay any fees for these services. Pursuant to the Fund's management contract, the investment adviser receives a monthly management fee that represents a portion of the management fees it receives from the Investing Funds. In addition, under an expense contract, the investment adviser also pays all other expenses of the Fund, excluding custody fees, the compensation of the independent Directors, and certain miscellaneous expenses such as proxy and shareholder meeting expenses.
Brokerage Commissions. A portion of portfolio transactions were placed with brokerage firms which are affiliates of the investment adviser. Brokerage commissions are included in net realized gain (loss) and change in net unrealized appreciation (depreciation) in the Statement of Operations. The commissions paid to these affiliated firms were as follows:
| Amount | |
| Fidelity International Equity Central Fund | $3,270 |
Interfund Trades. Funds may purchase from or sell securities to other Fidelity Funds under procedures adopted by the Board. The procedures have been designed to ensure these interfund trades are executed in accordance with Rule 17a-7 of the 1940 Act. Interfund trades are included within the respective purchases and sales amounts shown in the Purchases and Sales of Investments note.
Other. During the period, the investment adviser reimbursed the Fund for certain losses in the amount of $28,660.
7. Security Lending.
The Fund lends portfolio securities from time to time in order to earn additional income. Lending agents are used, including National Financial Services (NFS), an affiliate of the Fund. Pursuant to a securities lending agreement, NFS will receive a fee, which is capped at 9.9% of daily lending revenue, for its services as lending agent. The Fund may lend securities to certain qualified borrowers, including NFS. On the settlement date of the loan, the Fund receives collateral (in the form of U.S. Treasury obligations, letters of credit and/or cash) against the loaned securities and maintains collateral in an amount not less than 100% of the market value of the loaned securities during the period of the loan. The market value of the loaned securities is determined at the close of business of the Fund and any additional required collateral is delivered to the Fund on the next business day. The Fund or borrower may terminate the loan at any time, and if the borrower defaults on its obligation to return the securities loaned because of insolvency or other reasons, the Fund may apply collateral received from the borrower against the obligation. The Fund may experience delays and costs in recovering the securities loaned. Any cash collateral received is invested in the Fidelity Securities Lending Cash Central Fund. The value of loaned securities and cash collateral at period end are disclosed on the Fund's Statement of Assets and Liabilities. Total fees paid by the Fund to NFS, as lending agent, amounted to $2,691. Security lending income represents the income earned on investing cash collateral, less rebates paid to borrowers and any lending agent fees associated with the loan, plus any premium payments received for lending certain types of securities. Net income from the Fidelity Securities Lending Cash Central Fund during the period is presented in the Statement of Operations as a component of income from Fidelity Central Funds. During the period, there were no securities loaned to NFS.
8. Other.
The Fund's organizational documents provide former and current directors and officers with a limited indemnification against liabilities arising in connection with the performance of their duties to the Fund. In the normal course of business, the Fund may also enter into contracts that provide general indemnifications. The Fund's maximum exposure under these arrangements is unknown as this would be dependent on future claims that may be made against the Fund. The risk of material loss from such claims is considered remote.
At the end of the period, mutual funds managed by the investment adviser or its affiliates were the owners of record of all of the outstanding shares of the Fund.
9. Coronavirus (COVID-19) Pandemic.
An outbreak of COVID-19 first detected in China during December 2019 has since spread globally and was declared a pandemic by the World Health Organization during March 2020. Developments that disrupt global economies and financial markets, such as the COVID-19 pandemic, may magnify factors that affect the Fund's performance.
Report of Independent Registered Public Accounting Firm
To the Board of Trustees of Fidelity Central Investment Portfolios LLC and the Shareholders of Fidelity International Equity Central Fund:
Opinion on the Financial Statements and Financial Highlights
We have audited the accompanying statement of assets and liabilities of Fidelity International Equity Central Fund (the "Fund"), a fund of Fidelity Central Investment Portfolios LLC, including the schedule of investments, as of September 30, 2020, the related statement of operations for the year then ended, the statement of changes in net assets for each of the two years in the period then ended, the financial highlights for each of the five years in the period then ended, and the related notes. In our opinion, the financial statements and financial highlights present fairly, in all material respects, the financial position of the Fund as of September 30, 2020, and the results of its operations for the year then ended, the changes in its net assets for each of the two years in the period then ended, and the financial highlights for each of the five years in the period then ended in conformity with accounting principles generally accepted in the United States of America.
Basis for Opinion
These financial statements and financial highlights are the responsibility of the Fund's management. Our responsibility is to express an opinion on the Fund's financial statements and financial highlights based on our audits. We are a public accounting firm registered with the Public Company Accounting Oversight Board (United States) (PCAOB) and are required to be independent with respect to the Fund in accordance with the U.S. federal securities laws and the applicable rules and regulations of the Securities and Exchange Commission and the PCAOB.
We conducted our audits in accordance with the standards of the PCAOB. Those standards require that we plan and perform the audit to obtain reasonable assurance about whether the financial statements and financial highlights are free of material misstatement, whether due to error or fraud. The Fund is not required to have, nor were we engaged to perform, an audit of its internal control over financial reporting. As part of our audits we are required to obtain an understanding of internal control over financial reporting but not for the purpose of expressing an opinion on the effectiveness of the Fund’s internal control over financial reporting. Accordingly, we express no such opinion.
Our audits included performing procedures to assess the risks of material misstatement of the financial statements and financial highlights, whether due to error or fraud, and performing procedures that respond to those risks. Such procedures included examining, on a test basis, evidence regarding the amounts and disclosures in the financial statements and financial highlights. Our audits also included evaluating the accounting principles used and significant estimates made by management, as well as evaluating the overall presentation of the financial statements and financial highlights. Our procedures included confirmation of securities owned as of September 30, 2020, by correspondence with the custodian and brokers; when replies were not received from brokers, we performed other auditing procedures. We believe that our audits provide a reasonable basis for our opinion.
/s/ Deloitte & Touche LLP
Boston, Massachusetts
November 13, 2020
We have served as the auditor of one or more of the Fidelity investment companies since 1999.
Directors and Officers (Trustees and Officers)
The Trustees, Members of the Advisory Board (if any), and officers of the trust and fund, as applicable, are listed below. The Board of Trustees governs the fund and is responsible for protecting the interests of shareholders. The Trustees are experienced executives who meet periodically throughout the year to oversee the fund's activities, review contractual arrangements with companies that provide services to the fund, oversee management of the risks associated with such activities and contractual arrangements, and review the fund's performance. Except for Bettina Doulton, each of the Trustees oversees 304 funds. Mrs. Doulton oversees 203 funds.
The Trustees hold office without limit in time except that (a) any Trustee may resign; (b) any Trustee may be removed by written instrument, signed by at least two-thirds of the number of Trustees prior to such removal; (c) any Trustee who requests to be retired or who has become incapacitated by illness or injury may be retired by written instrument signed by a majority of the other Trustees; and (d) any Trustee may be removed at any special meeting of shareholders by a two-thirds vote of the outstanding voting securities of the trust. Each Trustee who is not an interested person (as defined in the 1940 Act) of the trust and the fund is referred to herein as an Independent Trustee. Each Independent Trustee shall retire not later than the last day of the calendar year in which his or her 75th birthday occurs. The Independent Trustees may waive this mandatory retirement age policy with respect to individual Trustees. Officers and Advisory Board Members hold office without limit in time, except that any officer or Advisory Board Member may resign or may be removed by a vote of a majority of the Trustees at any regular meeting or any special meeting of the Trustees. Except as indicated, each individual has held the office shown or other offices in the same company for the past five years.
The fund’s Statement of Additional Information (SAI) includes more information about the Trustees. To request a free copy, call Fidelity at 1-800-544-8544.
Experience, Skills, Attributes, and Qualifications of the Trustees. The Governance and Nominating Committee has adopted a statement of policy that describes the experience, qualifications, attributes, and skills that are necessary and desirable for potential Independent Trustee candidates (Statement of Policy). The Board believes that each Trustee satisfied at the time he or she was initially elected or appointed a Trustee, and continues to satisfy, the standards contemplated by the Statement of Policy. The Governance and Nominating Committee also engages professional search firms to help identify potential Independent Trustee candidates who have the experience, qualifications, attributes, and skills consistent with the Statement of Policy. From time to time, additional criteria based on the composition and skills of the current Independent Trustees, as well as experience or skills that may be appropriate in light of future changes to board composition, business conditions, and regulatory or other developments, have also been considered by the professional search firms and the Governance and Nominating Committee. In addition, the Board takes into account the Trustees' commitment and participation in Board and committee meetings, as well as their leadership of standing and ad hoc committees throughout their tenure.
In determining that a particular Trustee was and continues to be qualified to serve as a Trustee, the Board has considered a variety of criteria, none of which, in isolation, was controlling. The Board believes that, collectively, the Trustees have balanced and diverse experience, qualifications, attributes, and skills, which allow the Board to operate effectively in governing the fund and protecting the interests of shareholders. Information about the specific experience, skills, attributes, and qualifications of each Trustee, which in each case led to the Board's conclusion that the Trustee should serve (or continue to serve) as a trustee of the fund, is provided below.
Board Structure and Oversight Function. Robert A. Lawrence is an interested person and currently serves as Acting Chairman. The Trustees have determined that an interested Chairman is appropriate and benefits shareholders because an interested Chairman has a personal and professional stake in the quality and continuity of services provided to the fund. Independent Trustees exercise their informed business judgment to appoint an individual of their choosing to serve as Chairman, regardless of whether the Trustee happens to be independent or a member of management. The Independent Trustees have determined that they can act independently and effectively without having an Independent Trustee serve as Chairman and that a key structural component for assuring that they are in a position to do so is for the Independent Trustees to constitute a substantial majority for the Board. The Independent Trustees also regularly meet in executive session. Ned C. Lautenbach and David M. Thomas serve as Co-Lead Independent Trustees and as such each (i) acts as a liaison between the Independent Trustees and management with respect to matters important to the Independent Trustees and (ii) with management prepares agendas for Board meetings.
Fidelity® funds are overseen by different Boards of Trustees. The fund's Board oversees Fidelity's high income and certain equity funds, and other Boards oversee Fidelity's investment-grade bond, money market, asset allocation, and other equity funds. The asset allocation funds may invest in Fidelity® funds overseen by the fund's Board. The use of separate Boards, each with its own committee structure, allows the Trustees of each group of Fidelity® funds to focus on the unique issues of the funds they oversee, including common research, investment, and operational issues. On occasion, the separate Boards establish joint committees to address issues of overlapping consequences for the Fidelity® funds overseen by each Board.
The Trustees operate using a system of committees to facilitate the timely and efficient consideration of all matters of importance to the Trustees, the fund, and fund shareholders and to facilitate compliance with legal and regulatory requirements and oversight of the fund's activities and associated risks. The Board, acting through its committees, has charged FMR and its affiliates with (i) identifying events or circumstances the occurrence of which could have demonstrably adverse effects on the fund's business and/or reputation; (ii) implementing processes and controls to lessen the possibility that such events or circumstances occur or to mitigate the effects of such events or circumstances if they do occur; and (iii) creating and maintaining a system designed to evaluate continuously business and market conditions in order to facilitate the identification and implementation processes described in (i) and (ii) above. Because the day-to-day operations and activities of the fund are carried out by or through FMR, its affiliates, and other service providers, the fund's exposure to risks is mitigated but not eliminated by the processes overseen by the Trustees. While each of the Board's committees has responsibility for overseeing different aspects of the fund's activities, oversight is exercised primarily through the Operations, Audit, and Compliance Committees. Appropriate personnel, including but not limited to the fund's Chief Compliance Officer (CCO), FMR's internal auditor, the independent accountants, the fund's Treasurer and portfolio management personnel, make periodic reports to the Board's committees, as appropriate, including an annual review of Fidelity's risk management program for the Fidelity® funds. The responsibilities of each standing committee, including their oversight responsibilities, are described further under "Standing Committees of the Trustees."
Interested Trustees*:
Correspondence intended for a Trustee who is an interested person may be sent to Fidelity Investments, 245 Summer Street, Boston, Massachusetts 02210.
Name, Year of Birth; Principal Occupations and Other Relevant Experience+
Bettina Doulton (1964)
Year of Election or Appointment: 2020
Trustee
Ms. Doulton also serves as Trustee of other Fidelity® funds. Prior to her retirement, Ms. Doulton served in a variety of positions at Fidelity Investments, including as a managing director of research (2006-2007), portfolio manager to certain Fidelity® funds (1993-2005), equity analyst and portfolio assistant (1990-1993), and research assistant (1987-1990). Ms. Doulton currently owns and operates Phi Builders + Architects and Cellardoor Winery. Previously, Ms. Doulton served as a member of the Board of Brown Capital Management, LLC (2013-2018).
Robert A. Lawrence (1952)
Year of Election or Appointment: 2020
Trustee
Acting Chairman of the Board of Trustees
Mr. Lawrence also serves as Trustee of other funds. Previously, Mr. Lawrence served as a Member of the Advisory Board of certain funds. Prior to his retirement in 2008, Mr. Lawrence served as Vice President of certain Fidelity® funds (2006-2008), Senior Vice President, Head of High Income Division of Fidelity Management & Research Company (investment adviser firm, 2006-2008), and President of Fidelity Strategic Investments (investment adviser firm, 2002-2005).
* Determined to be an “Interested Trustee” by virtue of, among other things, his or her affiliation with the Fidelity Central Investments Portfolios LLC or various entities under common control with FMR.
+ The information includes the Trustee's principal occupation during the last five years and other information relating to the experience, attributes, and skills relevant to the Trustee's qualifications to serve as a Trustee, which led to the conclusion that the Trustee should serve as a Trustee for the fund.
Independent Trustees:
Correspondence intended for an Independent Trustee may be sent to Fidelity Investments, P.O. Box 55235, Boston, Massachusetts 02205-5235.
Name, Year of Birth; Principal Occupations and Other Relevant Experience+
Dennis J. Dirks (1948)
Year of Election or Appointment: 2005
Trustee
Mr. Dirks also serves as Trustee of other Fidelity® funds. Prior to his retirement in May 2003, Mr. Dirks served as Chief Operating Officer and as a member of the Board of The Depository Trust & Clearing Corporation (financial markets infrastructure), President, Chief Operating Officer and a member of the Board of The Depository Trust Company (DTC), President and a member of the Board of the National Securities Clearing Corporation (NSCC), Chief Executive Officer and a member of the Board of the Government Securities Clearing Corporation and Chief Executive Officer and a member of the Board of the Mortgage-Backed Securities Clearing Corporation. Mr. Dirks currently serves as a member of the Finance Committee (2016-present) and Board (2017-present) and is Treasurer (2018-present) of the Asolo Repertory Theatre.
Donald F. Donahue (1950)
Year of Election or Appointment: 2018
Trustee
Mr. Donahue also serves as Trustee of other Fidelity® funds. Mr. Donahue serves as President and Chief Executive Officer of Miranda Partners, LLC (risk consulting for the financial services industry, 2012-present). Previously, Mr. Donahue served as Chief Executive Officer (2006-2012), Chief Operating Officer (2003-2006) and Managing Director, Customer Marketing and Development (1999-2003) of The Depository Trust & Clearing Corporation (financial markets infrastructure). Mr. Donahue currently serves as a member (2007-present) and Co-Chairman (2016-present) of the Board of United Way of New York, a member of the Board of NYC Leadership Academy (2012-present) and a member of the Board of Advisors of Ripple Labs, Inc. (financial services, 2015-present). Mr. Donahue previously served as a member of the Advisory Board of certain Fidelity® funds (2015-2018).
Vicki L. Fuller (1957)
Year of Election or Appointment: 2020
Trustee
Ms. Fuller also serves as Trustee of other Fidelity® funds. Previously, Ms. Fuller served as a member of the Advisory Board of certain Fidelity® funds (2018-2020), Chief Investment Officer of the New York State Common Retirement Fund (2012-2018) and held a variety of positions at AllianceBernstein L.P. (global asset management, 1985-2012), including Managing Director (2006-2012) and Senior Vice President and Senior Portfolio Manager (2001-2006). Ms. Fuller currently serves as a member of the Board, Audit Committee and Nominating and Governance Committee of The Williams Companies, Inc. (natural gas infrastructure, 2018-present), as a member of the Board, Audit Committee and Nominating and Governance Committee of two Blackstone business development companies (2020-present) and as a member of the Board of Treliant, LLC (consulting, 2019-present).
Patricia L. Kampling (1959)
Year of Election or Appointment: 2020
Trustee
Ms. Kampling also serves as Trustee of other Fidelity® funds. Prior to her retirement, Ms. Kampling served as Chairman of the Board and Chief Executive Officer (2012-2019), President and Chief Operating Officer (2011-2012) and Executive Vice President and Chief Financial Officer (2010-2011) of Alliant Energy Corporation. Ms. Kampling currently serves as a member of the Board, Compensation Committee and Executive Committee and as Chair of the Audit Committee of Briggs & Stratton Corporation (manufacturing, 2011-present) and as a member of the Board, Audit, Finance and Risk Committee and Safety, Environmental, Technology and Operations Committee of American Water Works Company, Inc. (utilities company, 2019-present). In addition, Ms. Kampling currently serves as a member of the Board of the Nature Conservancy, Wisconsin Chapter (2019-present). Previously, Ms. Kampling served as a Member of the Advisory Board of certain Fidelity® funds (2020), a member of the Board of Interstate Power and Light Company (2012-2019) and Wisconsin Power and Light Company (2012-2019) (each a subsidiary of Alliant Energy Corporation) and as a member of the Board and Workforce Development Committee of the Business Roundtable (2018-2019).
Alan J. Lacy (1953)
Year of Election or Appointment: 2008
Trustee
Mr. Lacy also serves as Trustee of other Fidelity® funds. Previously, Mr. Lacy served as Senior Adviser (2007-2014) of Oak Hill Capital Partners, L.P. (private equity), Chief Executive Officer (2005) and Vice Chairman (2005-2006) of Sears Holdings Corporation (retail), Chief Executive Officer and Chairman of the Board of Sears, Roebuck and Co. (retail, 2000-2005), Chairman (2014-2017) and a member of the Board (2010-2017) of Dave & Buster’s Entertainment, Inc. (restaurant and entertainment complexes) and a member of the Board of Bristol-Myers Squibb Company (global pharmaceuticals, 2008-2020). Mr. Lacy currently serves as a Trustee of the California Chapter of The Nature Conservancy (2015-present) and a member of the Board of the Center for Advanced Study in the Behavioral Sciences at Stanford University (2015-present).
Ned C. Lautenbach (1944)
Year of Election or Appointment: 2004
Trustee
Co-Lead Independent Trustee
Mr. Lautenbach also serves as Trustee of other Fidelity® funds. Mr. Lautenbach currently serves as Chair of the Board of Governors, State University System of Florida (2013-present) and is a member of the Council on Foreign Relations (1994-present). He is also a member and has in the past served as Chairman of the Board of Directors of Artis-Naples (2012-present). Previously, Mr. Lautenbach served as a member and then Lead Director of the Board of Directors of Eaton Corporation (diversified industrial, 1997-2016). He was also a Partner at Clayton, Dubilier & Rice, LLC (private equity investment, 1998-2010); as well as Director of Sony Corporation (2006-2007). In addition, Mr. Lautenbach had a 30-year career with IBM (technology company), during which time he served as Senior Vice President and as a member of the Corporate Executive Committee (1968-1998).
Joseph Mauriello (1944)
Year of Election or Appointment: 2008
Trustee
Mr. Mauriello also serves as Trustee of other Fidelity® funds. Prior to his retirement in January 2006, Mr. Mauriello served in numerous senior management positions including Deputy Chairman and Chief Operating Officer (2004-2005), and Vice Chairman of Financial Services (2002-2004) of KPMG LLP US (professional services, 1965-2005). Mr. Mauriello currently serves as a member of the Independent Directors Council Governing Council (2015-present). Previously, Mr. Mauriello served as a member of the Board of XL Group plc. (global insurance and re-insurance, 2006-2018).
Cornelia M. Small (1944)
Year of Election or Appointment: 2005
Trustee
Ms. Small also serves as Trustee of other Fidelity® funds. Previously, Ms. Small served as Chief Investment Officer, Director of Global Equity Investments and a member of Scudder, Stevens & Clark and Scudder Kemper Investments. Ms. Small previously served as a member of the Board (2009-2019) and Chair of the Investment Committee (2010-2019) of the Teagle Foundation and a member of the Investment Committee of the Berkshire Taconic Community Foundation (2008-2019).
Garnett A. Smith (1947)
Year of Election or Appointment: 2018
Trustee
Mr. Smith also serves as Trustee of other Fidelity® funds. Prior to his retirement, Mr. Smith served as Chairman and Chief Executive Officer (1990-1997) and President (1986-1990) of Inbrand Corp. (manufacturer of personal absorbent products). Prior to his employment with Inbrand Corp., he was employed by a retail fabric chain and North Carolina National Bank (now Bank of America). Mr. Smith previously served as a member of the Advisory Board of certain Fidelity® funds (2012-2013).
David M. Thomas (1949)
Year of Election or Appointment: 2008
Trustee
Co-Lead Independent Trustee
Mr. Thomas also serves as Trustee of other Fidelity® funds. Previously, Mr. Thomas served as Executive Chairman (2005-2006) and Chairman and Chief Executive Officer (2000-2005) of IMS Health, Inc. (pharmaceutical and healthcare information solutions). Mr. Thomas currently serves as Non-Executive Chairman of the Board of Fortune Brands Home and Security (home and security products, 2011-present), and a member of the Board (2004-present) and Presiding Director (2013-present) of Interpublic Group of Companies, Inc. (marketing communication).
Susan Tomasky (1953)
Year of Election or Appointment: 2020
Trustee
Ms. Tomasky also serves as Trustee of other Fidelity® funds. Prior to her retirement, Ms. Tomasky served in various executive officer positions at American Electric Power Company, Inc. (1998-2011), including most recently as President of AEP Transmission (2007-2011). Ms. Tomasky currently serves as a member of the Board and Sustainability Committee and as Chair of the Audit Committee of Marathon Petroleum Corporation (2018-present) and as a member of the Board, Corporate Governance Committee and Organization and Compensation Committee and as Chair of the Audit Committee of Public Service Enterprise Group, Inc. (utilities company, 2012-present). In addition, Ms. Tomasky currently serves as a member of the Board of the Columbus Regional Airport Authority (2007-present), as a member of the Board of the Royal Shakespeare Company – America (2009-present), as a member of the Board of the Columbus Association for the Performing Arts (2011-present) and as a member of the Board of Kenyon College (2016-present). Previously, Ms. Tomasky served as a Member of the Advisory Board of certain Fidelity® funds (2020), a member of the Board (2011-2019) and as Lead Independent Director (2015-2018) of Andeavor Corporation (previously Tesoro Corporation) (independent oil refiner and marketer) and as a member of the Board of Summit Midstream Partners LP (energy, 2012-2018).
Michael E. Wiley (1950)
Year of Election or Appointment: 2018
Trustee
Mr. Wiley also serves as Trustee of other Fidelity® funds. Previously, Mr. Wiley served as a member of the Advisory Board of certain Fidelity® funds (2018-2020), Chairman, President and CEO of Baker Hughes, Inc. (oilfield services, 2000-2004). Mr. Wiley also previously served as a member of the Board of Andeavor Corporation (independent oil refiner and marketer, 2005-2018), a member of the Board of Andeavor Logistics LP (natural resources logistics, 2015-2018) and a member of the Board of High Point Resources (exploration and production, 2005-2020).
+ The information includes the Trustee's principal occupation during the last five years and other information relating to the experience, attributes, and skills relevant to the Trustee's qualifications to serve as a Trustee, which led to the conclusion that the Trustee should serve as a Trustee for the fund.
Advisory Board Members and Officers:
Correspondence intended for a Member of the Advisory Board (if any) may be sent to Fidelity Investments, P.O. Box 55235, Boston, Massachusetts 02205-5235. Correspondence intended for an officer or Peter S. Lynch may be sent to Fidelity Investments, 245 Summer Street, Boston, Massachusetts 02210. Officers appear below in alphabetical order.
Name, Year of Birth; Principal Occupation
Lloyd James Austin, III (1953)
Year of Election or Appointment: 2020
Member of the Advisory Board
General Austin also serves as a Member of the Advisory Board of other Fidelity® funds. Prior to his retirement, General Austin (United States Army, Retired) held a variety of positions within the U.S. Government, including Commander, U.S. Central Command (2013-2016), Vice Chief of Staff, U.S. Army (2012-2013) and Commanding General, U.S. Forces – Iraq, Operation New Dawn (2010-2012). General Austin currently serves as a Partner of Pine Island Capital Partners (private equity, 2020-present) and as President of the Austin Strategy Group LLC (consulting, 2016-present). General Austin serves as a member of the Board of Directors of Nucor Corporation (steel products, 2017-present), as a member of the Board of Directors of Tenet Healthcare Corporation (2018-present) and as a member of the Board of Directors of Raytheon Technologies Corporation (aerospace and defense, 2020-present). In addition, General Austin currently serves as a member of the Board of Trustees of the Carnegie Corporation of New York (2017-present) and as a member of the Board of Trustees of Auburn University (2017-present). Previously, General Austin served as a member of the Board of Directors of United Technologies Corporation (aerospace, defense and building, 2016-2020).
Thomas A. Kennedy (1955)
Year of Election or Appointment: 2020
Member of the Advisory Board
Mr. Kennedy also serves as a Member of the Advisory Board of other Fidelity® funds. Previously, Mr. Kennedy held a variety of positions at Raytheon Company (aerospace and defense, 1983-2020), including Chairman and Chief Executive Officer (2014-2020) and Executive Vice President and Chief Operating Officer (2013-2014). Mr. Kennedy currently serves as Executive Chairman of the Board of Directors of Raytheon Technologies Corporation (aerospace and defense, 2020-present). He is also a member of the Rutgers School of Engineering Industry Advisory Board (2011-present) and a member of the UCLA Engineering Dean’s Executive Board (2016-present).
Peter S. Lynch (1944)
Year of Election or Appointment: 2004
Member of the Advisory Board
Mr. Lynch also serves as a Member of the Advisory Board of other Fidelity® funds. Mr. Lynch is Vice Chairman and a Director of Fidelity Management & Research Company LLC (investment adviser firm). In addition, Mr. Lynch serves as a Trustee of Boston College and as the Chairman of the Inner-City Scholarship Fund. Previously, Mr. Lynch served as Vice Chairman and a Director of FMR Co., Inc. (investment adviser firm) and on the Special Olympics International Board of Directors (1997-2006).
Elizabeth Paige Baumann (1968)
Year of Election or Appointment: 2017
Anti-Money Laundering (AML) Officer
Ms. Baumann also serves as AML Officer of other funds. She is Chief AML Officer (2012-present) and Senior Vice President (2014-present) of FMR LLC (diversified financial services company) and is an employee of Fidelity Investments. Previously, Ms. Baumann served as AML Officer of certain funds (2017-2019), as AML Officer of the funds (2012-2016), and Vice President (2007-2014) and Deputy Anti-Money Laundering Officer (2007-2012) of FMR LLC.
Craig S. Brown (1977)
Year of Election or Appointment: 2019
Assistant Treasurer
Mr. Brown also serves as Assistant Treasurer of other funds. Mr. Brown is an employee of Fidelity Investments (2013-present).
John J. Burke III (1964)
Year of Election or Appointment: 2018
Chief Financial Officer
Mr. Burke also serves as Chief Financial Officer of other funds. Mr. Burke serves as Head of Investment Operations for Fidelity Fund and Investment Operations (2018-present) and is an employee of Fidelity Investments (1998-present). Previously Mr. Burke served as head of Asset Management Investment Operations (2012-2018).
William C. Coffey (1969)
Year of Election or Appointment: 2019
Assistant Secretary
Mr. Coffey also serves as Assistant Secretary of other funds. He is Senior Vice President and Deputy General Counsel of FMR LLC (diversified financial services company, 2010-present), and is an employee of Fidelity Investments. Previously, Mr. Coffey served as Secretary and CLO of certain funds (2018-2019); CLO, Secretary, and Senior Vice President of Fidelity Management & Research Company and FMR Co., Inc. (investment adviser firms, 2018-2019); Secretary of Fidelity SelectCo, LLC and Fidelity Investments Money Management, Inc. (investment adviser firms, 2018-2019); CLO of Fidelity Management & Research (Hong Kong) Limited, FMR Investment Management (UK) Limited, and Fidelity Management & Research (Japan) Limited (investment adviser firms, 2018-2019); and Assistant Secretary of certain funds (2009-2018).
Timothy M. Cohen (1969)
Year of Election or Appointment: 2018
Vice President
Mr. Cohen also serves as Vice President of other funds. Mr. Cohen serves as Co-Head of Equity (2018-present), a Director of Fidelity Management & Research (Japan) Limited (investment adviser firm, 2016-present), and is an employee of Fidelity Investments. Previously, Mr. Cohen served as Executive Vice President of Fidelity SelectCo, LLC (2019), Head of Global Equity Research (2016-2018), Chief Investment Officer - Equity and a Director of Fidelity Management & Research (U.K.) Inc. (investment adviser firm, 2013-2015) and as a Director of Fidelity Management & Research (Hong Kong) Limited (investment adviser firm, 2017).
Jonathan Davis (1968)
Year of Election or Appointment: 2010
Assistant Treasurer
Mr. Davis also serves as Assistant Treasurer of other funds. Mr. Davis serves as Assistant Treasurer of FMR Capital, Inc. (2017-present) and is an employee of Fidelity Investments. Previously, Mr. Davis served as Vice President and Associate General Counsel of FMR LLC (diversified financial services company, 2003-2010).
Laura M. Del Prato (1964)
Year of Election or Appointment: 2018
Assistant Treasurer
Ms. Del Prato also serves as an officer of other funds. Ms. Del Prato is an employee of Fidelity Investments (2017-present). Previously, Ms. Del Prato served as President and Treasurer of The North Carolina Capital Management Trust: Cash Portfolio and Term Portfolio (2018-2020). Prior to joining Fidelity Investments, Ms. Del Prato served as a Managing Director and Treasurer of the JPMorgan Mutual Funds (2014-2017). Prior to JPMorgan, Ms. Del Prato served as a partner at Cohen Fund Audit Services (accounting firm, 2012-2013) and KPMG LLP (accounting firm, 2004-2012).
Colm A. Hogan (1973)
Year of Election or Appointment: 2020
Assistant Treasurer
Mr. Hogan also serves as an officer of other funds. Mr. Hogan serves as Assistant Treasurer of FMR Capital, Inc. (2017-present) and is an employee of Fidelity Investments (2005-present). Previously, Mr. Hogan served as Deputy Treasurer of certain Fidelity® funds (2016-2020) and Assistant Treasurer of certain Fidelity® funds (2016-2018).
Pamela R. Holding (1964)
Year of Election or Appointment: 2018
Vice President
Ms. Holding also serves as Vice President of other funds. Ms. Holding serves as Co-Head of Equity (2018-present) and is an employee of Fidelity Investments (2013-present). Previously, Ms. Holding served as Executive Vice President of Fidelity SelectCo, LLC (2019) and as Chief Investment Officer of Fidelity Institutional Asset Management (2013-2018).
Cynthia Lo Bessette (1969)
Year of Election or Appointment: 2019
Secretary and Chief Legal Officer (CLO)
Ms. Lo Bessette also serves as an officer of other funds. Ms. Lo Bessette serves as CLO, Secretary, and Senior Vice President of Fidelity Management & Research Company LLC (investment adviser firm, 2019-present); and CLO of Fidelity Management & Research (Hong Kong) Limited, FMR Investment Management (UK) Limited, and Fidelity Management & Research (Japan) Limited (investment adviser firms, 2019-present). She is a Senior Vice President and Deputy General Counsel of FMR LLC (diversified financial services company, 2019-present), and is an employee of Fidelity Investments. Previously, Ms. Lo Bessette served as CLO, Secretary, and Senior Vice President of FMR Co., Inc. (investment adviser firm, 2019); Secretary of Fidelity SelectCo, LLC and Fidelity Investments Money Management, Inc. (investment adviser firms, 2019). Prior to joining Fidelity Investments, Ms. Lo Bessette was Executive Vice President, General Counsel (2016-2019) and Senior Vice President, Deputy General Counsel (2015-2016) of OppenheimerFunds (investment management company) and Deputy Chief Legal Officer (2013-2015) of Jennison Associates LLC (investment adviser firm).
Chris Maher (1972)
Year of Election or Appointment: 2020
Deputy Treasurer
Mr. Maher also serves as an officer of other funds. Mr. Maher serves as Assistant Treasurer of FMR Capital, Inc. (2017-present), and is an employee of Fidelity Investments (2008-present). Previously, Mr. Maher served as Assistant Treasurer of certain funds (2013-2020); Vice President of Asset Management Compliance (2013), Vice President of the Program Management Group of FMR (investment adviser firm, 2010-2013), and Vice President of Valuation Oversight (2008-2010).
Jason P. Pogorelec (1975)
Year of Election or Appointment: 2020
Chief Compliance Officer
Mr. Pogorelec also serves as Chief Compliance Officer of other funds. Mr. Pogorelec is a senior Vice President of Asset Management Compliance for Fidelity Investments and is an employee of Fidelity Investments (2006-present). Previously, Mr. Pogorelec served as Vice President, Associate General Counsel for Fidelity Investments (2010-2020) and Assistant Secretary of certain Fidelity funds (2015-2020).
Stacie M. Smith (1974)
Year of Election or Appointment: 2016
President and Treasurer
Ms. Smith also serves as an officer of other funds. Ms. Smith serves as Assistant Treasurer of FMR Capital, Inc. (2017-present), is an employee of Fidelity Investments (2009-present), and has served in other fund officer roles. Prior to joining Fidelity Investments, Ms. Smith served as Senior Audit Manager of Ernst & Young LLP (accounting firm, 1996-2009). Previously, Ms. Smith served as Assistant Treasurer (2013-2019) and Deputy Treasurer (2013-2016) of certain Fidelity® funds.
Marc L. Spector (1972)
Year of Election or Appointment: 2016
Assistant Treasurer
Mr. Spector also serves as an officer of other funds. Mr. Spector serves as Assistant Treasurer of FMR Capital, Inc. (2017-present) and is an employee of Fidelity Investments (2016-present). Prior to joining Fidelity Investments, Mr. Spector served as Director at the Siegfried Group (accounting firm, 2013-2016), and prior to Siegfried Group as audit senior manager at Deloitte & Touche LLP (accounting firm, 2005-2013).
Jim Wegmann (1979)
Year of Election or Appointment: 2019
Assistant Treasurer
Mr. Wegmann also serves as Assistant Treasurer of other funds. Mr. Wegmann is an employee of Fidelity Investments (2011-present).
Shareholder Expense Example
As a shareholder, you incur two types of costs: (1) transaction costs, which may include sales charges (loads) on purchase payments or redemption proceeds, as applicable and (2) ongoing costs, which generally include management fees, distribution and/or service (12b-1) fees and other Fund expenses. This Example is intended to help you understand your ongoing costs (in dollars) of investing in a fund and to compare these costs with the ongoing costs of investing in other mutual funds.
The Example is based on an investment of $1,000 invested at the beginning of the period and held for the entire period (April 1, 2020 to September 30, 2020).
Actual Expenses
The first line of the accompanying table provides information about actual account values and actual expenses. You may use the information in this line, together with the amount you invested, to estimate the expenses that you paid over the period. Simply divide your account value by $1,000.00 (for example, an $8,600 account value divided by $1,000.00 = 8.6), then multiply the result by the number in the first line for a class/Fund under the heading entitled "Expenses Paid During Period" to estimate the expenses you paid on your account during this period. If any fund is a shareholder of any underlying mutual funds or exchange-traded funds (ETFs) (the Underlying Funds), such fund indirectly bears its proportional share of the expenses of the Underlying Funds in addition to the direct expenses incurred presented in the table. These fees and expenses are not included in the annualized expense ratio used to calculate the expense estimate in the table below.
Hypothetical Example for Comparison Purposes
The second line of the accompanying table provides information about hypothetical account values and hypothetical expenses based on the actual expense ratio and an assumed rate of return of 5% per year before expenses, which is not the actual return. The hypothetical account values and expenses may not be used to estimate the actual ending account balance or expenses you paid for the period. You may use this information to compare the ongoing costs of investing in the Fund and other funds. To do so, compare this 5% hypothetical example with the 5% hypothetical examples that appear in the shareholder reports of the other funds. If any fund is a shareholder of any Underlying Funds, such fund indirectly bears its proportional share of the expenses of the Underlying Funds in addition to the direct expenses as presented in the table. These fees and expenses are not included in the annualized expense ratio used to calculate the expense estimate in the table below.
Please note that the expenses shown in the table are meant to highlight your ongoing costs only and do not reflect any transaction costs. Therefore, the second line of the table is useful in comparing ongoing costs only, and will not help you determine the relative total costs of owning different funds.
| Annualized Expense Ratio-A | Beginning Account Value April 1, 2020 | Ending Account Value September 30, 2020 | Expenses Paid During Period-B April 1, 2020 to September 30, 2020 | |
| Fidelity International Equity Central Fund | .0122% | |||
| Actual | $1,000.00 | $1,288.60 | $.07 | |
| Hypothetical-C | $1,000.00 | $1,024.94 | $.06 |
A Annualized expense ratio reflects expenses net of applicable fee waivers.
B Expenses are equal to the annualized expense ratio, multiplied by the average account value over the period, multiplied by 183/ 366 (to reflect the one-half year period). The fees and expenses of any Underlying Funds are not included in each annualized expense ratio.
C 5% return per year before expenses
Distributions (Unaudited)
A percentage of the dividends distributed during the fiscal year for the fund qualify for the dividends–received deduction for corporate shareholders:
| October 2019 | 0% |
| November 2019 | 0% |
| December 2019 | 2% |
| February 2020 | 3% |
| March 2020 | 3% |
| April 2020 | 3% |
| May 2020 | 3% |
| June 2020 | 3% |
| July 2020 | 3% |
| August 2020 | 3% |
| September 2020 | 3% |
A percentage of the dividends distributed during the fiscal year for the fund may be taken into account as a dividend for purposes of the maximum rate under section 1(h)(11) of the Internal Revenue Code:
| October 2019 | 19% |
| November 2019 | 19% |
| December 2019 | 36% |
| February 2020 | 100% |
| March 2020 | 100% |
| April 2020 | 100% |
| May 2020 | 100% |
| June 2020 | 100% |
| July 2020 | 100% |
| August 2020 | 100% |
| September 2020 | 100% |
The amounts per share which represent income derived from sources within, and taxes paid to, foreign countries or possessions of the United States are $0.6043 and $0.1883 for the dividend paid December 19, 2019.
The fund will notify shareholders in January 2021 of amounts for use in preparing 2020 income tax returns.
![]()
INTCEN-ANN-1120
1.859208.112
Fidelity® Emerging Markets Equity Central Fund
September 30, 2020
See the inside front cover for important information about access to your fund’s shareholder reports.
Beginning on January 1, 2021, as permitted by regulations adopted by the Securities and Exchange Commission, paper copies of a fund’s shareholder reports will no longer be sent by mail, unless you specifically request paper copies of the reports from the fund or from your financial intermediary, such as a financial advisor, broker-dealer or bank. Instead, the reports will be made available on a website, and you will be notified by mail each time a report is posted and provided with a website link to access the report.
If you already elected to receive shareholder reports electronically, you will not be affected by this change and you need not take any action. You may elect to receive shareholder reports and other communications from a fund electronically, by contacting your financial intermediary. For Fidelity customers, visit Fidelity's web site or call Fidelity using the contact information listed below.
You may elect to receive all future reports in paper free of charge. If you wish to continue receiving paper copies of your shareholder reports, you may contact your financial intermediary or, if you are a Fidelity customer, visit Fidelity’s website, or call Fidelity at the applicable toll-free number listed below. Your election to receive reports in paper will apply to all funds held with the fund complex/your financial intermediary.
| Account Type | Website | Phone Number |
| Brokerage, Mutual Fund, or Annuity Contracts: | fidelity.com/mailpreferences | 1-800-343-3548 |
| Employer Provided Retirement Accounts: | netbenefits.fidelity.com/preferences (choose 'no' under Required Disclosures to continue to print) | 1-800-343-0860 |
| Advisor Sold Accounts Serviced Through Your Financial Intermediary: | Contact Your Financial Intermediary | Your Financial Intermediary's phone number |
| Advisor Sold Accounts Serviced by Fidelity: | institutional.fidelity.com | 1-877-208-0098 |
Contents
To view a fund's proxy voting guidelines and proxy voting record for the 12-month period ended June 30, visit http://www.fidelity.com/proxyvotingresults or visit the Securities and Exchange Commission's (SEC) web site at http://www.sec.gov.
You may also call 1-800-544-8544 to request a free copy of the proxy voting guidelines.
Standard & Poor's, S&P and S&P 500 are registered service marks of The McGraw-Hill Companies, Inc. and have been licensed for use by Fidelity Distributors Corporation.
Other third-party marks appearing herein are the property of their respective owners.
All other marks appearing herein are registered or unregistered trademarks or service marks of FMR LLC or an affiliated company. © 2020 FMR LLC. All rights reserved.
A fund files its complete schedule of portfolio holdings with the SEC for the first and third quarters of each fiscal year on Form N-PORT. Forms N-PORT are available on the SEC’s web site at http://www.sec.gov. A fund's Forms N-PORT may be reviewed and copied at the SEC’s Public Reference Room in Washington, DC. Information regarding the operation of the SEC's Public Reference Room may be obtained by calling 1-800-SEC-0330.
Note to Shareholders:
Early in 2020, the outbreak and spread of a new coronavirus emerged as a public health emergency that had a major influence on financial markets, primarily based on its impact on the global economy and the outlook for corporate earnings. The virus causes a respiratory disease known as COVID-19. On March 11, the World Health Organization declared the COVID-19 outbreak a pandemic, citing sustained risk of further global spread.
In the weeks following, as the crisis worsened, we witnessed an escalating human tragedy with wide-scale social and economic consequences from coronavirus-containment measures. The outbreak of COVID-19 prompted a number of measures to limit the spread, including travel and border restrictions, quarantines, and restrictions on large gatherings. In turn, these resulted in lower consumer activity, diminished demand for a wide range of products and services, disruption in manufacturing and supply chains, and – given the wide variability in outcomes regarding the outbreak – significant market uncertainty and volatility. Amid the turmoil, the U.S. government took unprecedented action – in concert with the U.S. Federal Reserve and central banks around the world – to help support consumers, businesses, and the broader economy, and to limit disruption to the financial system.
The situation continues to unfold, and the extent and duration of its impact on financial markets and the economy remain highly uncertain. Extreme events such as the coronavirus crisis are “exogenous shocks” that can have significant adverse effects on mutual funds and their investments. Although multiple asset classes may be affected by market disruption, the duration and impact may not be the same for all types of assets.
Fidelity is committed to helping you stay informed amid news about COVID-19 and during increased market volatility, and we’re taking extra steps to be responsive to customer needs. We encourage you to visit our websites, where we offer ongoing updates, commentary, and analysis on the markets and our funds.
Performance: The Bottom Line
Average annual total return reflects the change in the value of an investment, assuming reinvestment of distributions from dividend income and capital gains (the profits earned upon the sale of securities that have grown in value, if any) and assuming a constant rate of performance each year. The hypothetical investment and the average annual total returns do not reflect the deduction of taxes that a shareholder would pay on fund distributions or the redemption of fund shares. During periods of reimbursement by Fidelity, a fund’s total return will be greater than it would be had the reimbursement not occurred. How a fund did yesterday is no guarantee of how it will do tomorrow.
Average Annual Total Returns
| For the periods ended September 30, 2020 | Past 1 year | Past 5 years | Past 10 years |
| Fidelity® Emerging Markets Equity Central Fund | 15.71% | 11.67% | 4.93% |
$10,000 Over 10 Years
Let's say hypothetically that $10,000 was invested in Fidelity® Emerging Markets Equity Central Fund on September 30, 2010.
The chart shows how the value of your investment would have changed, and also shows how the MSCI Emerging Markets Index performed over the same period.
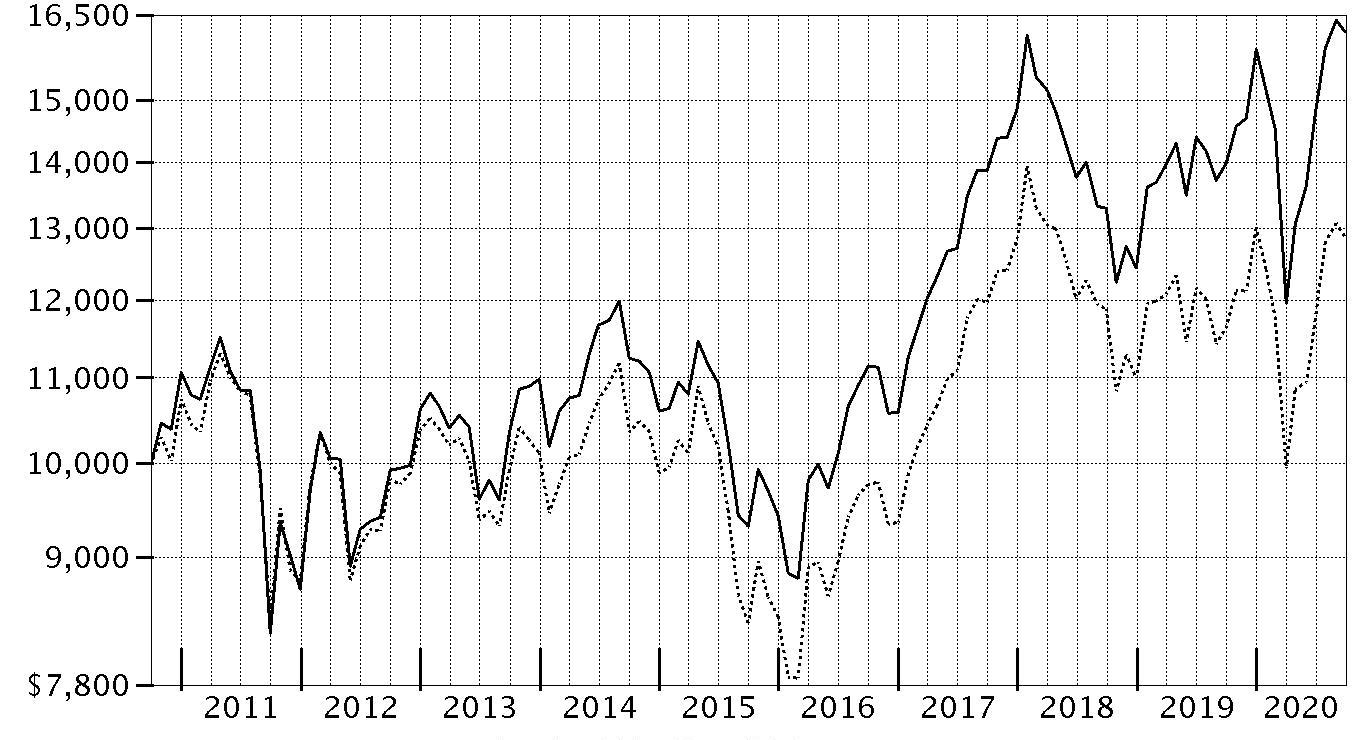
| Period Ending Values | ||
| $16,176 | Fidelity® Emerging Markets Equity Central Fund | |
| $12,865 | MSCI Emerging Markets Index | |
Management's Discussion of Fund Performance
Market Recap: The MSCI ACWI (All Country World Index) ex USA Index gained 3.16% for the 12 months ending September 30, 2020, in what was a bumpy ride for non-U.S. equities, marked by a steep but brief decline due to the early-2020 outbreak and spread of the coronavirus, followed by a sharp upturn. Declared a pandemic on March 11, the crisis and containment efforts caused broad contraction in economic activity, elevated volatility and dislocation in financial markets. The outbreak escalated globally in February, when the index returned -7.90% after a surge in cases outside China pushed investors to safer asset classes. In March, when the outbreak spread in many countries, the index returned -14.45%, the steepest monthly drop since the global financial crisis. A historically rapid and expansive monetary- and fiscal-policy response provided a partial offset to the economic disruption, as did progress on potential treatments and signs of an early recovery in economic activity. This was evident as the index advanced 23.48% in the final six months of the period, supported by broad U.S.-dollar weakness. For the full year, emerging markets (+11%), Japan (+7%) and Europe ex U.K. (+5%) led, whereas the U.K. (-16%), Asia Pacific ex Japan (-5%) and Canada (-2%) lagged. By sector, information technology rose 35%, followed by health care (+23%) and consumer discretionary (+18%). Conversely, energy stocks (-33%) fell hard along with the price of oil. Financials (-17%) and real estate (-14%) also notably lagged.Comments from Co-Portfolio Manager Sam Polyak: For the fiscal year, the fund gained 15.71%, outpacing the 9.40% advance of the Fidelity Emerging Markets Equity Central Fund Linked Index. Versus the index, the fund benefited from strong stock selection, particularly in the communication services and consumer discretionary sectors. An overweighting in the latter sector was another positive, as were picks in energy and health care. Conversely, choices in financials and industrials detracted. Geographically, choices in China and Taiwan added notable value while security selection in Brazil hurt. Among individual stocks, it helped to own shares of several online retailers as the COVID-19 pandemic accelerated the broader shift to e-commerce. For example, an overweighting in Meituan Dianping, the operator of a leading food-delivery service in China, helped more than any other stock decision. Shares of Meituan Dianping benefited from strong second-quarter earnings as pandemic-related lockdown efforts in China relaxed and consumers continued to order online. Similarly, Pinduoduo, China’s largest interactive e-commerce platform, and MercadoLibre, an Argentine e-commerce and online auction firm, also contributed to the fund’s relative result. MercadoLibre was not a part of the index. Conversely, it hurt to overweight two bank stocks: Banco do Brasil and India-based Axis Bank. The financials sector faced pressure this period due to declining interest rates and the impact of COVID-19. Also, for the banks, investors worried about potential credit losses. We continued to hold stakes in each of the contributors and detractors we mentioned in the fund on September 30.The views expressed above reflect those of the portfolio manager(s) only through the end of the period as stated on the cover of this report and do not necessarily represent the views of Fidelity or any other person in the Fidelity organization. Any such views are subject to change at any time based upon market or other conditions and Fidelity disclaims any responsibility to update such views. These views may not be relied on as investment advice and, because investment decisions for a Fidelity fund are based on numerous factors, may not be relied on as an indication of trading intent on behalf of any Fidelity fund.
Note to shareholders: On October 1, 2020, Guillermo de Las Casas and Will Pruett assumed co-management responsibilities for the fund.Investment Summary (Unaudited)
Geographic Diversification (% of fund's net assets)
| As of September 30, 2020 | ||
| Cayman Islands | 27.1% | |
| Korea (South) | 12.5% | |
| India | 9.8% | |
| China | 9.1% | |
| Taiwan | 7.6% | |
| Brazil | 5.6% | |
| United States of America* | 5.0% | |
| Russia | 2.9% | |
| South Africa | 2.7% | |
| Other | 17.7% | |
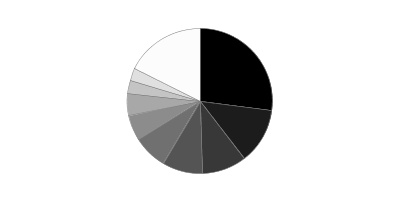
* Includes Short-Term investments and Net Other Assets (Liabilities).
Percentages are based on country or territory of incorporation and are adjusted for the effect of futures contracts, if applicable.
Asset Allocation as of September 30, 2020
| % of fund's net assets | |
| Stocks and Equity Futures | 98.3 |
| Short-Term Investments and Net Other Assets (Liabilities) | 1.7 |
Top Ten Stocks as of September 30, 2020
| % of fund's net assets | |
| Alibaba Group Holding Ltd. sponsored ADR (Cayman Islands, Internet & Direct Marketing Retail) | 8.4 |
| Tencent Holdings Ltd. (Cayman Islands, Interactive Media & Services) | 7.6 |
| Taiwan Semiconductor Manufacturing Co. Ltd. (Taiwan, Semiconductors & Semiconductor Equipment) | 6.3 |
| Samsung Electronics Co. Ltd. (Korea (South), Technology Hardware, Storage & Peripherals) | 4.8 |
| Reliance Industries Ltd. (India, Oil, Gas & Consumable Fuels) | 2.0 |
| Ping An Insurance Group Co. of China Ltd. (H Shares) (China, Insurance) | 1.5 |
| ICICI Bank Ltd. sponsored ADR (India, Banks) | 1.5 |
| JD.com, Inc. sponsored ADR (Cayman Islands, Internet & Direct Marketing Retail) | 1.0 |
| Meituan Dianping Class B (Cayman Islands, Internet & Direct Marketing Retail) | 1.0 |
| New Oriental Education & Technology Group, Inc. sponsored ADR (Cayman Islands, Diversified Consumer Services) | 0.9 |
| 35.0 |
Top Market Sectors as of September 30, 2020
| % of fund's net assets | |
| Consumer Discretionary | 20.3 |
| Information Technology | 18.0 |
| Financials | 16.9 |
| Communication Services | 13.2 |
| Materials | 6.9 |
| Consumer Staples | 6.0 |
| Energy | 4.8 |
| Health Care | 3.8 |
| Industrials | 3.2 |
| Real Estate | 2.1 |
Schedule of Investments September 30, 2020
Showing Percentage of Net Assets
| Common Stocks - 94.2% | |||
| Shares | Value | ||
| Bahrain - 0.1% | |||
| Ahli United Bank | 3,292,894 | $2,514,808 | |
| Bangladesh - 0.1% | |||
| BRAC Bank Ltd. | 1,972,177 | 946,273 | |
| Olympic Industries Ltd. | 261,516 | 536,135 | |
| Square Pharmaceuticals Ltd. | 643,016 | 1,546,422 | |
| TOTAL BANGLADESH | 3,028,830 | ||
| Belgium - 0.3% | |||
| Titan Cement International Trading SA | 402,000 | 5,278,839 | |
| Bermuda - 1.1% | |||
| AGTech Holdings Ltd. (a) | 4,092,000 | 153,407 | |
| China Gas Holdings Ltd. | 932,800 | 2,669,394 | |
| Credicorp Ltd. (United States) | 67,875 | 8,415,821 | |
| GP Investments Ltd. Class A (depositary receipt) (a) | 88,607 | 69,265 | |
| Haier Electronics Group Co. Ltd. | 648,000 | 2,355,821 | |
| Kunlun Energy Co. Ltd. | 4,154,000 | 2,742,978 | |
| Marvell Technology Group Ltd. | 59,900 | 2,378,030 | |
| Shangri-La Asia Ltd. | 3,600,000 | 2,951,701 | |
| TOTAL BERMUDA | 21,736,417 | ||
| Brazil - 3.6% | |||
| Atacadao Distribuicao Comercio e Industria Ltda | 2,313,100 | 8,439,506 | |
| B2W Companhia Global do Varejo (a) | 372,455 | 5,967,610 | |
| Banco do Brasil SA | 2,292,140 | 12,089,458 | |
| BM&F BOVESPA SA | 360,300 | 3,529,283 | |
| BR Malls Participacoes SA (a) | 764,000 | 1,140,035 | |
| BTG Pactual Participations Ltd. unit | 213,700 | 2,772,137 | |
| Centrais Eletricas Brasileiras SA (Electrobras) | 367,000 | 1,981,417 | |
| Companhia de Saneamento Basico do Estado de Sao Paulo (SABESP) | 53,700 | 447,508 | |
| Companhia de Saneamento de Minas Gerais | 106,430 | 885,606 | |
| Direcional Engenharia SA | 758,300 | 1,828,270 | |
| Equatorial Energia SA | 638,600 | 2,408,438 | |
| LOG Commercial Properties e Participacoes SA | 30,900 | 165,452 | |
| MRV Engenharia e Participacoes SA | 490,500 | 1,405,322 | |
| Natura & Co. Holding SA | 1,044,867 | 9,512,999 | |
| Petrobras Distribuidora SA | 410,700 | 1,473,603 | |
| Rumo SA (a) | 1,589,900 | 5,396,017 | |
| Suzano Papel e Celulose SA (a) | 896,000 | 7,267,366 | |
| Vale SA sponsored ADR (b) | 499,115 | 5,280,637 | |
| TOTAL BRAZIL | 71,990,664 | ||
| British Virgin Islands - 0.1% | |||
| Mail.Ru Group Ltd. GDR (Reg. S) (a) | 79,040 | 2,165,696 | |
| Cayman Islands - 27.1% | |||
| 51job, Inc. sponsored ADR (a) | 38,000 | 2,963,620 | |
| Agora, Inc. ADR (a)(b) | 5,300 | 227,794 | |
| Akeso, Inc. | 760,000 | 2,608,499 | |
| Alibaba Group Holding Ltd. sponsored ADR (a) | 570,092 | 167,595,639 | |
| Ant International Co. Ltd. Class C (a)(c)(d) | 296,486 | 3,273,205 | |
| Archosaur Games, Inc. (a)(e) | 200,000 | 604,894 | |
| Bilibili, Inc. ADR (a)(b) | 413,530 | 17,202,848 | |
| Chailease Holding Co. Ltd. | 838,228 | 3,795,903 | |
| China Resources Land Ltd. | 865,000 | 3,945,113 | |
| China State Construction International Holdings Ltd. | 3,952,000 | 2,592,438 | |
| CStone Pharmaceuticals Co. Ltd. (a)(e) | 45,330 | 57,692 | |
| Eurocharm Holdings Co. Ltd. | 156,000 | 520,395 | |
| Haitian International Holdings Ltd. | 1,273,000 | 2,963,259 | |
| Hansoh Pharmaceutical Group Co. Ltd. (a)(e) | 1,249,670 | 6,107,935 | |
| Hua Medicine (a)(e) | 2,221,970 | 1,433,594 | |
| Innovent Biologics, Inc. (a)(e) | 540,530 | 4,030,838 | |
| iQIYI, Inc. ADR (a)(b) | 64,600 | 1,458,668 | |
| JD.com, Inc. sponsored ADR (a) | 264,300 | 20,512,323 | |
| JHBP CY Holdings Ltd. (a)(e) | 142,500 | 441,287 | |
| Kangji Medical Holdings Ltd. | 817,500 | 1,940,047 | |
| KE Holdings, Inc. ADR (a) | 48,500 | 2,973,050 | |
| Kingdee International Software Group Co. Ltd. | 1,197,000 | 3,122,140 | |
| LexinFintech Holdings Ltd. ADR (a) | 62,000 | 424,700 | |
| Li Ning Co. Ltd. | 3,788,000 | 17,823,674 | |
| Meituan Dianping Class B (a) | 625,180 | 19,693,985 | |
| Ming Yuan Cloud Group Holdings Ltd. | 53,200 | 200,264 | |
| NagaCorp Ltd. | 392,000 | 468,496 | |
| NetEase, Inc. ADR | 9,800 | 4,455,766 | |
| New Oriental Education & Technology Group, Inc. sponsored ADR (a) | 123,655 | 18,486,423 | |
| NIO, Inc. sponsored ADR (a) | 57,900 | 1,228,638 | |
| PagSeguro Digital Ltd. (a)(b) | 152,609 | 5,754,885 | |
| Phoenix Tree Holdings Ltd. ADR | 40,400 | 166,044 | |
| Pinduoduo, Inc. ADR (a) | 142,433 | 10,561,407 | |
| Semiconductor Manufacturing International Corp. (a) | 1,274,500 | 2,983,791 | |
| Shenzhou International Group Holdings Ltd. | 688,500 | 11,724,391 | |
| Shimao Property Holdings Ltd. | 583,720 | 2,435,249 | |
| Sino Biopharmaceutical Ltd. | 4,276,810 | 4,683,292 | |
| SITC International Holdings Co. Ltd. | 438,000 | 606,833 | |
| StoneCo Ltd. Class A (a) | 63,000 | 3,332,070 | |
| Sunny Optical Technology Group Co. Ltd. | 365,500 | 5,677,065 | |
| TAL Education Group ADR (a) | 128,739 | 9,789,314 | |
| Tencent Holdings Ltd. | 2,228,500 | 150,520,445 | |
| Uni-President China Holdings Ltd. | 6,298,400 | 5,776,294 | |
| Wise Talent Information Technology Co. Ltd. (a) | 587,541 | 1,470,134 | |
| Xinyi Solar Holdings Ltd. | 328,000 | 522,914 | |
| YY, Inc. ADR | 52,900 | 4,267,443 | |
| Zai Lab Ltd. (a) | 18,900 | 1,572,582 | |
| Zai Lab Ltd. ADR (a) | 44,030 | 3,661,975 | |
| TOTAL CAYMAN ISLANDS | 538,659,255 | ||
| Chile - 0.1% | |||
| Sociedad Quimica y Minera de Chile SA (PN-B) sponsored ADR | 21,300 | 690,546 | |
| Vina Concha y Toro SA | 1,431,604 | 2,344,718 | |
| TOTAL CHILE | 3,035,264 | ||
| China - 9.1% | |||
| Bafang Electric Suzhou Co. Ltd. (A Shares) | 138,500 | 3,247,181 | |
| BBMG Corp. (H Shares) | 10,201,500 | 1,894,178 | |
| China Communications Construction Co. Ltd. (H Shares) | 3,746,000 | 1,969,879 | |
| China Communications Services Corp. Ltd. (H Shares) | 4,886,000 | 2,884,480 | |
| China Jushi Co. Ltd. (A Shares) | 100,000 | 213,921 | |
| China Life Insurance Co. Ltd. (H Shares) | 7,008,900 | 15,889,010 | |
| China Longyuan Power Grid Corp. Ltd. (H Shares) | 11,162,650 | 7,013,488 | |
| China Merchants Bank Co. Ltd. (H Shares) | 1,218,000 | 5,779,916 | |
| China Petroleum & Chemical Corp. (H Shares) | 15,528,000 | 6,269,716 | |
| China Tower Corp. Ltd. (H Shares) (e) | 10,624,000 | 1,848,352 | |
| Chongqing Changan Automobile Co. Ltd. (A Shares) (a) | 1,747,300 | 3,470,101 | |
| CRRC Corp. Ltd. (H Shares) | 7,469,000 | 2,991,629 | |
| Glodon Co. Ltd. (A Shares) | 201,800 | 2,176,504 | |
| Great Wall Motor Co. Ltd. (H Shares) | 6,018,500 | 7,677,300 | |
| Guangzhou Automobile Group Co. Ltd. (H Shares) | 7,850,000 | 6,585,278 | |
| Haier Smart Home Co. Ltd. (A Shares) | 1,268,000 | 4,095,349 | |
| Hangzhou Tigermed Consulting Co. Ltd. (H Shares) (a)(e) | 344,800 | 4,941,170 | |
| Industrial & Commercial Bank of China Ltd. (H Shares) | 25,786,400 | 13,432,026 | |
| Jiangsu Hengrui Medicine Co. Ltd. (A Shares) | 361,278 | 4,796,819 | |
| NARI Technology Co. Ltd. (A Shares) | 480,800 | 1,401,912 | |
| Pharmaron Beijing Co. Ltd. (H Shares) (e) | 454,630 | 5,692,671 | |
| PICC Property & Casualty Co. Ltd. (H Shares) | 9,006,900 | 6,326,968 | |
| Ping An Bank Co. Ltd. (A Shares) | 1,765,500 | 3,961,779 | |
| Ping An Insurance Group Co. of China Ltd. (H Shares) | 2,918,500 | 30,296,505 | |
| Shenzhen Mindray Bio-Medical Electronics Co. Ltd. (A Shares) | 158,983 | 8,167,481 | |
| Sinopec Engineering Group Co. Ltd. (H Shares) | 2,099,500 | 776,076 | |
| Titan Wind Energy Suzhou Co. Ltd. (A Shares) | 300,000 | 330,158 | |
| TravelSky Technology Ltd. (H Shares) | 944,000 | 2,028,971 | |
| Tsingtao Brewery Co. Ltd. (H Shares) | 1,508,000 | 12,339,840 | |
| Venus MedTech Hangzhou, Inc. (H Shares) (a)(e) | 187,500 | 2,001,271 | |
| WuXi AppTec Co. Ltd. (H Shares) (e) | 468,131 | 6,769,534 | |
| Zhuzhou CRRC Times Electric Co. Ltd. (H Shares) | 937,500 | 3,150,030 | |
| TOTAL CHINA | 180,419,493 | ||
| Colombia - 0.2% | |||
| Bancolombia SA sponsored ADR | 74,490 | 1,903,220 | |
| Ecopetrol SA | 1,033,174 | 511,593 | |
| Interconexion Electrica SA ESP | 236,400 | 1,258,906 | |
| TOTAL COLOMBIA | 3,673,719 | ||
| Egypt - 0.2% | |||
| Commercial International Bank SAE | 579,600 | 2,444,872 | |
| Six of October Development & Investment Co. | 1,031,002 | 825,325 | |
| TOTAL EGYPT | 3,270,197 | ||
| France - 0.1% | |||
| Ubisoft Entertainment SA (a) | 33,000 | 2,981,517 | |
| Germany - 0.3% | |||
| Delivery Hero AG (a)(e) | 60,400 | 6,948,464 | |
| Hong Kong - 2.2% | |||
| China Overseas Land and Investment Ltd. | 2,996,460 | 7,568,987 | |
| China Resources Beer Holdings Co. Ltd. | 2,458,666 | 15,100,848 | |
| China Unicom Ltd. | 8,685,720 | 5,701,241 | |
| CNOOC Ltd. | 7,413,000 | 7,130,403 | |
| Everest Medicines Ltd. | 49,500 | 351,288 | |
| Far East Horizon Ltd. | 4,221,074 | 3,444,649 | |
| Sun Art Retail Group Ltd. | 3,208,500 | 3,562,254 | |
| TOTAL HONG KONG | 42,859,670 | ||
| Hungary - 0.2% | |||
| OTP Bank PLC (a) | 126,500 | 3,811,160 | |
| Iceland - 0.1% | |||
| Festi hf | 609,800 | 639,134 | |
| Siminn HF | 10,600,000 | 530,977 | |
| TOTAL ICELAND | 1,170,111 | ||
| India - 9.8% | |||
| Adani Ports & Special Economic Zone Ltd. | 989,408 | 4,620,152 | |
| Axis Bank Ltd. (a) | 3,012,843 | 17,486,222 | |
| Axis Bank Ltd. GDR (Reg. S) (a) | 19,740 | 580,356 | |
| Bharti Infratel Ltd. | 142,900 | 341,309 | |
| Computer Age Management Services Private Ltd. (a) | 141 | 2,357 | |
| DLF Ltd. | 1,050,754 | 2,189,262 | |
| Eicher Motors Ltd. | 137,240 | 4,125,615 | |
| Federal Bank Ltd. (a) | 2,589,667 | 1,718,989 | |
| HDFC Bank Ltd. | 95,500 | 1,405,924 | |
| HDFC Bank Ltd. sponsored ADR (a) | 70,541 | 3,524,228 | |
| Housing Development Finance Corp. Ltd. | 75,700 | 1,799,416 | |
| ICICI Bank Ltd. (a) | 487,938 | 2,366,036 | |
| ICICI Bank Ltd. sponsored ADR (a) | 2,742,195 | 26,955,777 | |
| Indraprastha Gas Ltd. (a) | 779,320 | 4,116,515 | |
| ITC Ltd. | 2,402,287 | 5,628,170 | |
| JK Cement Ltd. | 331,898 | 6,808,282 | |
| JM Financial Ltd. (a) | 2,033,421 | 2,145,899 | |
| Larsen & Toubro Ltd. | 458,678 | 5,640,359 | |
| LIC Housing Finance Ltd. (a) | 622,741 | 2,348,674 | |
| Mahanagar Gas Ltd. | 108,729 | 1,230,734 | |
| Manappuram General Finance & Leasing Ltd. | 2,033,357 | 4,376,842 | |
| Maruti Suzuki India Ltd. | 55,500 | 5,102,554 | |
| Mindspace Business Parks (a)(e) | 101,200 | 420,230 | |
| Mindspace Business Parks | 265,000 | 986,418 | |
| NTPC Ltd. | 2,088,702 | 2,423,535 | |
| Oberoi Realty Ltd. (a) | 511,012 | 2,745,108 | |
| Petronet LNG Ltd. | 793,268 | 2,383,566 | |
| Phoenix Mills Ltd. (a) | 160,543 | 1,276,014 | |
| Power Grid Corp. of India Ltd. | 2,981,618 | 6,594,485 | |
| Reliance Industries Ltd. | 1,276,397 | 38,820,953 | |
| Reliance Industries Ltd. | 85,093 | 1,565,568 | |
| Shree Cement Ltd. | 26,627 | 7,356,937 | |
| Shriram Transport Finance Co. Ltd. | 900,700 | 7,624,245 | |
| State Bank of India (a) | 3,334,563 | 8,440,621 | |
| Sunteck Realty Ltd. | 72,397 | 271,306 | |
| Tata Consultancy Services Ltd. | 109,100 | 3,701,654 | |
| Torrent Pharmaceuticals Ltd. | 142,130 | 5,416,468 | |
| TOTAL INDIA | 194,540,780 | ||
| Indonesia - 0.7% | |||
| PT Bank Mandiri (Persero) Tbk | 22,287,500 | 7,453,517 | |
| PT Bank Rakyat Indonesia Tbk | 21,040,500 | 4,316,550 | |
| PT Indofood CBP Sukses Makmur Tbk | 600,000 | 406,687 | |
| PT Perusahaan Gas Negara Tbk Series B | 7,006,300 | 438,348 | |
| PT United Tractors Tbk | 956,100 | 1,468,985 | |
| TOTAL INDONESIA | 14,084,087 | ||
| Japan - 1.3% | |||
| Capcom Co. Ltd. | 72,800 | 4,062,862 | |
| Freee KK (a) | 67,300 | 5,103,860 | |
| Keyence Corp. | 6,000 | 2,804,876 | |
| Money Forward, Inc. (a) | 64,200 | 4,646,818 | |
| Murata Manufacturing Co. Ltd. | 34,800 | 2,262,946 | |
| Rakus Co. Ltd. | 209,800 | 3,763,907 | |
| Square Enix Holdings Co. Ltd. | 52,500 | 3,474,520 | |
| TOTAL JAPAN | 26,119,789 | ||
| Kazakhstan - 0.1% | |||
| JSC Halyk Bank of Kazakhstan GDR unit | 208,779 | 2,233,935 | |
| Kenya - 0.1% | |||
| Safaricom Ltd. | 8,956,433 | 2,451,669 | |
| Korea (South) - 11.5% | |||
| AMOREPACIFIC Group, Inc. | 135,457 | 5,680,196 | |
| Coway Co. Ltd. | 68,450 | 4,654,785 | |
| DuzonBizon Co. Ltd. | 23,050 | 2,065,572 | |
| Hanon Systems | 240,180 | 2,543,647 | |
| Hyundai Fire & Marine Insurance Co. Ltd. | 258,369 | 4,951,890 | |
| Hyundai Mobis | 38,093 | 7,513,219 | |
| Hyundai Motor Co. | 9,200 | 1,408,248 | |
| Kakao Corp. | 30,140 | 9,420,931 | |
| KB Financial Group, Inc. | 338,346 | 10,926,224 | |
| Korea Electric Power Corp. (a) | 154,179 | 2,694,191 | |
| Korea Electric Power Corp. sponsored ADR (a) | 14,700 | 128,037 | |
| LG Chemical Ltd. | 7,220 | 4,049,188 | |
| LG Corp. | 78,865 | 5,011,359 | |
| NAVER Corp. | 12,367 | 3,144,431 | |
| NCSOFT Corp. | 9,046 | 6,252,370 | |
| Netmarble Corp. (a)(e) | 10,110 | 1,439,171 | |
| POSCO | 55,131 | 9,266,270 | |
| S-Oil Corp. | 43,680 | 1,932,793 | |
| Samsung Biologics Co. Ltd. (a)(e) | 13,088 | 7,744,179 | |
| Samsung Electronics Co. Ltd. | 1,918,643 | 95,756,925 | |
| Samsung Fire & Marine Insurance Co. Ltd. | 36,745 | 5,734,858 | |
| Samsung SDI Co. Ltd. | 28,832 | 10,718,078 | |
| Shinhan Financial Group Co. Ltd. | 270,905 | 6,373,955 | |
| SK Hynix, Inc. | 254,515 | 18,333,513 | |
| TOTAL KOREA (SOUTH) | 227,744,030 | ||
| Kuwait - 0.6% | |||
| Mobile Telecommunication Co. | 1,752,800 | 3,283,640 | |
| National Bank of Kuwait | 3,082,045 | 8,751,237 | |
| TOTAL KUWAIT | 12,034,877 | ||
| Luxembourg - 0.2% | |||
| Adecoagro SA (a) | 189,004 | 882,649 | |
| Globant SA (a) | 14,200 | 2,544,924 | |
| TOTAL LUXEMBOURG | 3,427,573 | ||
| Mexico - 1.7% | |||
| America Movil S.A.B. de CV Series L sponsored ADR | 221,500 | 2,766,535 | |
| CEMEX S.A.B. de CV sponsored ADR | 2,641,300 | 10,036,940 | |
| Fibra Uno Administracion SA de CV | 2,636,100 | 2,085,132 | |
| Grupo Aeroportuario del Pacifico S.A.B. de CV Series B | 353,296 | 2,835,923 | |
| Grupo Aeroportuario Norte S.A.B. de CV (a) | 279,300 | 1,282,722 | |
| Grupo Financiero Banorte S.A.B. de CV Series O (a) | 1,375,032 | 4,764,713 | |
| Macquarie Mexican (REIT) (e) | 2,896,340 | 3,557,633 | |
| Wal-Mart de Mexico SA de CV Series V | 2,478,000 | 5,945,228 | |
| TOTAL MEXICO | 33,274,826 | ||
| Morocco - 0.1% | |||
| Attijariwafa Bank (a) | 30,051 | 1,163,181 | |
| Label Vie | 900 | 287,201 | |
| TOTAL MOROCCO | 1,450,382 | ||
| Multi-National - 0.2% | |||
| HKT Trust/HKT Ltd. unit | 2,868,000 | 3,806,718 | |
| Netherlands - 1.6% | |||
| Adyen BV (a)(e) | 3,000 | 5,533,453 | |
| ASML Holding NV (Netherlands) | 5,900 | 2,179,301 | |
| NXP Semiconductors NV | 17,600 | 2,196,656 | |
| X5 Retail Group NV GDR (Reg. S) | 208,600 | 7,718,200 | |
| Yandex NV Series A (a) | 222,914 | 14,545,139 | |
| TOTAL NETHERLANDS | 32,172,749 | ||
| Nigeria - 0.3% | |||
| Dangote Cement PLC | 1,114,110 | 412,987 | |
| Guaranty Trust Bank PLC | 36,343,973 | 2,644,484 | |
| Guaranty Trust Bank PLC GDR (Reg. S) | 210,274 | 546,712 | |
| Nigerian Breweries PLC | 7,975,531 | 1,013,751 | |
| Zenith Bank PLC | 21,827,703 | 1,010,699 | |
| TOTAL NIGERIA | 5,628,633 | ||
| Pakistan - 0.1% | |||
| Glaxosmithkline Pakistan Ltd. | 190,000 | 210,496 | |
| Habib Bank Ltd. | 1,803,400 | 1,422,483 | |
| Lucky Cement Ltd. | 120,000 | 468,467 | |
| Searle Co. Ltd. | 316,200 | 488,961 | |
| United Bank Ltd. | 618,400 | 429,466 | |
| TOTAL PAKISTAN | 3,019,873 | ||
| Panama - 0.1% | |||
| Copa Holdings SA Class A | 52,600 | 2,647,884 | |
| Peru - 0.6% | |||
| Alicorp SA Class C | 205,559 | 437,517 | |
| Compania de Minas Buenaventura SA sponsored ADR | 894,649 | 10,932,611 | |
| TOTAL PERU | 11,370,128 | ||
| Philippines - 1.3% | |||
| AC Energy Corp. | 7,000,000 | 449,542 | |
| Ayala Corp. | 187,275 | 2,678,349 | |
| Ayala Land, Inc. | 6,091,000 | 3,749,516 | |
| BDO Unibank, Inc. | 903,433 | 1,612,399 | |
| Globe Telecom, Inc. | 41,500 | 1,780,434 | |
| International Container Terminal Services, Inc. | 748,717 | 1,708,451 | |
| Jollibee Food Corp. | 451,563 | 1,354,016 | |
| Metropolitan Bank & Trust Co. | 6,757,103 | 5,350,754 | |
| Pilipinas Shell Petroleum Corp. (a) | 584,100 | 195,253 | |
| PUREGOLD Price Club, Inc. | 1,415,287 | 1,434,628 | |
| Robinsons Land Corp. | 3,401,870 | 1,002,664 | |
| Robinsons Retail Holdings, Inc. | 556,000 | 746,645 | |
| SM Investments Corp. | 136,825 | 2,495,828 | |
| Universal Robina Corp. | 777,543 | 2,156,906 | |
| TOTAL PHILIPPINES | 26,715,385 | ||
| Poland - 0.2% | |||
| Powszechny Zaklad Ubezpieczen SA | 640,300 | 4,106,441 | |
| Romania - 0.2% | |||
| Banca Transilvania SA | 4,131,021 | 2,350,277 | |
| BRD-Groupe Societe Generale | 414,426 | 1,296,047 | |
| TOTAL ROMANIA | 3,646,324 | ||
| Russia - 2.8% | |||
| LSR Group OJSC | 26,000 | 285,680 | |
| Lukoil PJSC sponsored ADR | 196,600 | 11,379,208 | |
| MMC Norilsk Nickel PJSC sponsored ADR | 462,200 | 11,162,130 | |
| NOVATEK OAO GDR (Reg. S) | 40,500 | 5,548,500 | |
| Sberbank of Russia | 2,981,150 | 8,720,779 | |
| Sberbank of Russia sponsored ADR (a) | 1,270,192 | 14,842,194 | |
| Tatneft PAO | 492,700 | 2,929,379 | |
| Unipro PJSC | 35,547,800 | 1,270,398 | |
| TOTAL RUSSIA | 56,138,268 | ||
| Saudi Arabia - 0.1% | |||
| Aldrees Petroleum and Transport Services Co. | 26,100 | 460,641 | |
| Bupa Arabia for Cooperative Insurance Co. (a) | 15,820 | 517,928 | |
| Saudi Arabian Oil Co. | 39,200 | 375,185 | |
| Saudi Dairy & Foodstuffs Co. | 9,200 | 447,381 | |
| TOTAL SAUDI ARABIA | 1,801,135 | ||
| Singapore - 0.3% | |||
| First Resources Ltd. | 5,702,800 | 5,081,743 | |
| Slovenia - 0.1% | |||
| Krka dd Novo mesto | 18,100 | 1,740,150 | |
| South Africa - 2.7% | |||
| Absa Group Ltd. | 1,483,241 | 7,909,438 | |
| AngloGold Ashanti Ltd. | 499,900 | 13,077,225 | |
| Bidvest Group Ltd. | 290,362 | 2,394,143 | |
| DRDGOLD Ltd. | 743,645 | 875,881 | |
| Impala Platinum Holdings Ltd. | 1,532,180 | 13,306,640 | |
| Imperial Holdings Ltd. | 298,667 | 675,790 | |
| Naspers Ltd. Class N | 64,500 | 11,392,242 | |
| Pick 'n Pay Stores Ltd. | 1,469,908 | 4,120,130 | |
| TOTAL SOUTH AFRICA | 53,751,489 | ||
| Taiwan - 7.6% | |||
| ECLAT Textile Co. Ltd. | 38,000 | 471,585 | |
| Feng Tay Enterprise Co. Ltd. | 80,400 | 482,211 | |
| Formosa Plastics Corp. | 1,000,000 | 2,717,091 | |
| Largan Precision Co. Ltd. | 36,000 | 4,181,416 | |
| MediaTek, Inc. | 444,000 | 9,316,510 | |
| Taiwan Semiconductor Manufacturing Co. Ltd. | 8,251,869 | 124,287,671 | |
| Unified-President Enterprises Corp. | 4,453,000 | 9,620,869 | |
| TOTAL TAIWAN | 151,077,353 | ||
| Thailand - 0.5% | |||
| Carabao Group PCL | 130,000 | 483,270 | |
| Kasikornbank PCL (For. Reg.) | 1,152,100 | 2,808,110 | |
| Mega Lifesciences PCL | 368,500 | 405,970 | |
| PTT Global Chemical PCL (For. Reg.) | 3,544,900 | 4,428,804 | |
| Siam Cement PCL: | |||
| (For. Reg.) | 163,900 | 1,671,331 | |
| rights (a)(d) | 45,398 | 30,540 | |
| Thai Beverage PCL | 1,078,533 | 479,870 | |
| TOA Paint Thailand PCL | 314,000 | 376,310 | |
| TOTAL THAILAND | 10,684,205 | ||
| Turkey - 0.4% | |||
| Aselsan A/S | 1,802,000 | 4,508,063 | |
| Turkiye Garanti Bankasi A/S (a) | 3,055,900 | 2,809,477 | |
| TOTAL TURKEY | 7,317,540 | ||
| United Arab Emirates - 0.1% | |||
| Dubai Financial Market PJSC (a) | 1,682,794 | 383,916 | |
| Emaar Properties PJSC (a) | 2,017,033 | 1,532,070 | |
| TOTAL UNITED ARAB EMIRATES | 1,915,986 | ||
| United Kingdom - 1.1% | |||
| Antofagasta PLC | 125,800 | 1,661,407 | |
| Georgia Capital PLC (a) | 48,500 | 228,737 | |
| Midea Group Co. Ltd.(UBS AG London Branch Bank Warrant Program) Class A warrants 7/21/22 (a)(e) | 673,700 | 7,231,289 | |
| Mondi PLC | 484,642 | 10,285,984 | |
| Network International Holdings PLC (e) | 648,200 | 2,285,058 | |
| Shenzhen Transsion Holdings Co. Ltd. (UBS AG London Branch Bank Warrant Program) Class A warrants 7/14/22 (a)(e) | 18,000 | 257,662 | |
| TOTAL UNITED KINGDOM | 21,950,137 | ||
| United States of America - 2.3% | |||
| Activision Blizzard, Inc. | 103,800 | 8,402,610 | |
| Arco Platform Ltd. Class A (a) | 38,400 | 1,568,256 | |
| DouYu International Holdings Ltd. ADR (a) | 152,100 | 2,009,241 | |
| MercadoLibre, Inc. (a) | 15,100 | 16,345,448 | |
| Micron Technology, Inc. (a) | 327,800 | 15,393,488 | |
| ON Semiconductor Corp. (a) | 78,700 | 1,707,003 | |
| TOTAL UNITED STATES OF AMERICA | 45,426,046 | ||
| Vietnam - 0.6% | |||
| Bank For Foreign Trade JSC | 311,180 | 1,139,562 | |
| Digiworld Corp. | 146,900 | 348,461 | |
| Ho Chi Minh City Development JSCB (a) | 514,300 | 700,348 | |
| Ho Chi Minh City Securities Co. | 752,082 | 691,022 | |
| Hoa Phat Group JSC | 500,000 | 573,589 | |
| Phu Nhuan Jewelry JSC | 165,000 | 437,935 | |
| Quang Ngai Sugar JSC | 70,000 | 101,864 | |
| Ssi Securities Corp. | 909,448 | 672,389 | |
| Vietnam Dairy Products Corp. | 676,507 | 3,201,236 | |
| Vietnam Engine & Agricultural Machinery Corp. | 252,300 | 472,045 | |
| Viettel Post Joint Stock Corp. | 59,899 | 289,253 | |
| Vincom Retail JSC (a) | 1,400,400 | 1,685,850 | |
| Vingroup JSC (a) | 336,200 | 1,334,683 | |
| TOTAL VIETNAM | 11,648,237 | ||
| TOTAL COMMON STOCKS | |||
| (Cost $1,550,713,563) | 1,872,552,476 | ||
| Preferred Stocks - 3.1% | |||
| Convertible Preferred Stocks - 0.0% | |||
| Hong Kong - 0.0% | |||
| Antengene Corp. Series C1 (c)(d) | 216,650 | 612,228 | |
| Nonconvertible Preferred Stocks - 3.1% | |||
| Brazil - 2.0% | |||
| Ambev SA sponsored ADR | 2,065,800 | 4,668,708 | |
| Banco do Estado Rio Grande do Sul SA | 510,960 | 1,085,445 | |
| Companhia de Saneamento Basico do Estado de Sao Paulo (SABESP) sponsored ADR | 199,140 | 1,652,862 | |
| Companhia Paranaense de Energia-Copel: | |||
| (PN-B) | 6,960 | 76,851 | |
| (PN-B) sponsored ADR | 132,919 | 1,464,767 | |
| Itau Unibanco Holding SA sponsored ADR | 2,764,894 | 11,004,278 | |
| Metalurgica Gerdau SA (PN) | 3,117,900 | 5,218,800 | |
| Petroleo Brasileiro SA - Petrobras: | |||
| (PN) sponsored ADR (non-vtg.) | 1,017,300 | 7,161,792 | |
| sponsored ADR | 899,100 | 6,401,592 | |
| Telefonica Brasil SA | 174,980 | 1,352,879 | |
| 40,087,974 | |||
| Cayman Islands - 0.0% | |||
| Chailease Holding Co. Ltd. (a) | 78,552 | 271,272 | |
| Korea (South) - 1.0% | |||
| Hyundai Motor Co. Series 2 | 118,448 | 8,958,790 | |
| Samsung Electronics Co. Ltd. | 242,623 | 10,506,943 | |
| 19,465,733 | |||
| Russia - 0.1% | |||
| Tatneft PAO | 84,600 | 482,635 | |
| TOTAL NONCONVERTIBLE PREFERRED STOCKS | 60,307,614 | ||
| TOTAL PREFERRED STOCKS | |||
| (Cost $70,523,064) | 60,919,842 | ||
| Principal Amount | Value | ||
| Government Obligations - 0.1% | |||
| United States of America - 0.1% | |||
| U.S. Treasury Bills, yield at date of purchase 0.09% to 0.14% 10/8/20 to 12/24/20(f) | |||
| (Cost $2,129,792) | 2,130,000 | 2,129,799 | |
| Shares | Value | ||
| Money Market Funds - 2.8% | |||
| Fidelity Cash Central Fund 0.10% (g) | 47,204,608 | 47,214,048 | |
| Fidelity Securities Lending Cash Central Fund 0.10% (g)(h) | 7,941,193 | 7,941,987 | |
| TOTAL MONEY MARKET FUNDS | |||
| (Cost $55,155,652) | 55,156,035 | ||
| TOTAL INVESTMENT IN SECURITIES - 100.2% | |||
| (Cost $1,678,522,071) | 1,990,758,152 | ||
| NET OTHER ASSETS (LIABILITIES) - (0.2)% | (3,950,912) | ||
| NET ASSETS - 100% | $1,986,807,240 |
| Futures Contracts | |||||
| Number of contracts | Expiration Date | Notional Amount | Value | Unrealized Appreciation/(Depreciation) | |
| Purchased | |||||
| Equity Index Contracts | |||||
| ICE E-mini MSCI Emerging Markets Index Contracts (United States) | 376 | Dec. 2020 | $20,463,800 | $(8,396) | $(8,396) |
The notional amount of futures purchased as a percentage of Net Assets is 1.0%
Categorizations in the Schedule of Investments are based on country or territory of incorporation.
Legend
(a) Non-income producing
(b) Security or a portion of the security is on loan at period end.
(c) Restricted securities (including private placements) - Investment in securities not registered under the Securities Act of 1933 (excluding 144A issues). At the end of the period, the value of restricted securities (excluding 144A issues) amounted to $3,885,434 or 0.2% of net assets.
(d) Level 3 security
(e) Security exempt from registration under Rule 144A of the Securities Act of 1933. These securities may be resold in transactions exempt from registration, normally to qualified institutional buyers. At the end of the period, the value of these securities amounted to $69,346,377 or 3.5% of net assets.
(f) Security or a portion of the security was pledged to cover margin requirements for futures contracts. At period end, the value of securities pledged amounted to $2,129,799.
(g) Affiliated fund that is generally available only to investment companies and other accounts managed by Fidelity Investments. The rate quoted is the annualized seven-day yield of the fund at period end. A complete unaudited listing of the fund's holdings as of its most recent quarter end is available upon request. In addition, each Fidelity Central Fund's financial statements, which are not covered by the Fund's Report of Independent Registered Public Accounting Firm, are available on the SEC's website or upon request.
(h) Investment made with cash collateral received from securities on loan.
Additional information on each restricted holding is as follows:
| Security | Acquisition Date | Acquisition Cost |
| Ant International Co. Ltd. Class C | 5/16/18 | $1,663,286 |
| Antengene Corp. Series C1 | 7/11/20 | $612,228 |
Affiliated Central Funds
Information regarding fiscal year to date income earned by the Fund from investments in Fidelity Central Funds is as follows:
| Fund | Income earned |
| Fidelity Cash Central Fund | $411,361 |
| Fidelity Securities Lending Cash Central Fund | 157,301 |
| Total | $568,662 |
Amounts in the income column in the above table include any capital gain distributions from underlying funds, which are presented in the corresponding line-item in the Statement of Operations, if applicable. Amount for Fidelity Securities Lending Cash Central Fund represents the income earned on investing cash collateral, less rebates paid to borrowers and any lending agent fees associated with the loan, plus any premium payments received for lending certain types of securities.
Investment Valuation
The following is a summary of the inputs used, as of September 30, 2020, involving the Fund's assets and liabilities carried at fair value. The inputs or methodology used for valuing securities may not be an indication of the risk associated with investing in those securities. For more information on valuation inputs, and their aggregation into the levels used below, please refer to the Investment Valuation section in the accompanying Notes to Financial Statements.
| Valuation Inputs at Reporting Date: | ||||
| Description | Total | Level 1 | Level 2 | Level 3 |
| Investments in Securities: | ||||
| Equities: | ||||
| Communication Services | $261,742,440 | $88,131,531 | $173,610,909 | $-- |
| Consumer Discretionary | 400,639,659 | 290,902,731 | 109,736,928 | -- |
| Consumer Staples | 118,155,443 | 61,655,188 | 56,500,255 | -- |
| Energy | 95,017,762 | 37,183,318 | 57,834,444 | -- |
| Financials | 337,121,261 | 154,236,369 | 179,611,687 | 3,273,205 |
| Health Care | 77,422,849 | 15,392,183 | 61,418,438 | 612,228 |
| Industrials | 65,286,652 | 27,715,521 | 37,571,131 | -- |
| Information Technology | 358,454,530 | 186,698,865 | 171,755,665 | -- |
| Materials | 135,342,901 | 98,035,903 | 37,276,458 | 30,540 |
| Real Estate | 42,340,821 | 12,730,421 | 29,610,400 | -- |
| Utilities | 41,948,000 | 11,574,790 | 30,373,210 | -- |
| Government Obligations | 2,129,799 | -- | 2,129,799 | -- |
| Money Market Funds | 55,156,035 | 55,156,035 | -- | -- |
| Total Investments in Securities: | $1,990,758,152 | $1,039,412,855 | $947,429,324 | $3,915,973 |
| Derivative Instruments: | ||||
| Liabilities | ||||
| Futures Contracts | $(8,396) | $(8,396) | $-- | $-- |
| Total Liabilities | $(8,396) | $(8,396) | $-- | $-- |
| Total Derivative Instruments: | $(8,396) | $(8,396) | $-- | $-- |
Value of Derivative Instruments
The following table is a summary of the Fund's value of derivative instruments by primary risk exposure as of September 30, 2020. For additional information on derivative instruments, please refer to the Derivative Instruments section in the accompanying Notes to Financial Statements.
| Primary Risk Exposure / Derivative Type | Value | |
| Asset | Liability | |
| Equity Risk | ||
| Futures Contracts(a) | $0 | $(8,396) |
| Total Equity Risk | 0 | (8,396) |
| Total Value of Derivatives | $0 | $(8,396) |
(a) Reflects gross cumulative appreciation (depreciation) on futures contracts as presented in the Schedule of Investments. In the Statement of Assets and Liabilities, the period end daily variation margin is included in receivable or payable for daily variation margin on futures contracts, and the net cumulative appreciation (depreciation) is included in Total accumulated earnings (loss).
See accompanying notes which are an integral part of the financial statements.
Financial Statements
Statement of Assets and Liabilities
| September 30, 2020 | ||
| Assets | ||
| Investment in securities, at value (including securities loaned of $7,672,705) — See accompanying schedule: Unaffiliated issuers (cost $1,623,366,419) | $1,935,602,117 | |
| Fidelity Central Funds (cost $55,155,652) | 55,156,035 | |
| Total Investment in Securities (cost $1,678,522,071) | $1,990,758,152 | |
| Cash | 13,235 | |
| Foreign currency held at value (cost $3,331,968) | 3,325,583 | |
| Receivable for investments sold | 5,647,816 | |
| Receivable for fund shares sold | 620,145 | |
| Dividends receivable | 3,746,107 | |
| Distributions receivable from Fidelity Central Funds | 6,218 | |
| Receivable for daily variation margin on futures contracts | 327,120 | |
| Other receivables | 147,096 | |
| Total assets | 2,004,591,472 | |
| Liabilities | ||
| Payable for investments purchased | $8,569,938 | |
| Payable for fund shares redeemed | 980,295 | |
| Other payables and accrued expenses | 292,362 | |
| Collateral on securities loaned | 7,941,637 | |
| Total liabilities | 17,784,232 | |
| Net Assets | $1,986,807,240 | |
| Net Assets consist of: | ||
| Paid in capital | $1,716,455,230 | |
| Total accumulated earnings (loss) | 270,352,010 | |
| Net Assets | $1,986,807,240 | |
| Net Asset Value, offering price and redemption price per share ($1,986,807,240 ÷ 8,378,115 shares) | $237.14 |
See accompanying notes which are an integral part of the financial statements.
Statement of Operations
| Year ended September 30, 2020 | ||
| Investment Income | ||
| Dividends | $37,292,367 | |
| Interest | 9,832 | |
| Income from Fidelity Central Funds (including $157,301 from security lending) | 568,662 | |
| Income before foreign taxes withheld | 37,870,861 | |
| Less foreign taxes withheld | (4,431,166) | |
| Total income | 33,439,695 | |
| Expenses | ||
| Custodian fees and expenses | $842,678 | |
| Independent directors' fees and expenses | 10,651 | |
| Interest | 164 | |
| Miscellaneous | 19 | |
| Total expenses | 853,512 | |
| Net investment income (loss) | 32,586,183 | |
| Realized and Unrealized Gain (Loss) | ||
| Net realized gain (loss) on: | ||
| Investment securities: | ||
| Unaffiliated issuers (net of foreign taxes of $24,649) | 8,578,795 | |
| Fidelity Central Funds | 4,625 | |
| Foreign currency transactions | (489,986) | |
| Futures contracts | (727,195) | |
| Total net realized gain (loss) | 7,366,239 | |
| Change in net unrealized appreciation (depreciation) on: | ||
| Investment securities: | ||
| Unaffiliated issuers (net of decrease in deferred foreign taxes of $10,247) | 217,209,053 | |
| Fidelity Central Funds | (652) | |
| Assets and liabilities in foreign currencies | (8,653) | |
| Futures contracts | 387,877 | |
| Total change in net unrealized appreciation (depreciation) | 217,587,625 | |
| Net gain (loss) | 224,953,864 | |
| Net increase (decrease) in net assets resulting from operations | $257,540,047 |
See accompanying notes which are an integral part of the financial statements.
Statement of Changes in Net Assets
| Year ended September 30, 2020 | Year ended September 30, 2019 | |
| Increase (Decrease) in Net Assets | ||
| Operations | ||
| Net investment income (loss) | $32,586,183 | $38,856,683 |
| Net realized gain (loss) | 7,366,239 | (43,016,847) |
| Change in net unrealized appreciation (depreciation) | 217,587,625 | 20,644,267 |
| Net increase (decrease) in net assets resulting from operations | 257,540,047 | 16,484,103 |
| Distributions to shareholders | (49,669,829) | (65,500,810) |
| Affiliated share transactions | ||
| Proceeds from sales of shares | 101,125,240 | 1,234,849,860 |
| Reinvestment of distributions | 49,669,829 | 65,500,810 |
| Cost of shares redeemed | (151,723,010) | (135,282,360) |
| Net increase (decrease) in net assets resulting from share transactions | (927,941) | 1,165,068,310 |
| Total increase (decrease) in net assets | 206,942,277 | 1,116,051,603 |
| Net Assets | ||
| Beginning of period | 1,779,864,963 | 663,813,360 |
| End of period | $1,986,807,240 | $1,779,864,963 |
| Other Information | ||
| Shares | ||
| Sold | 447,788 | 5,753,763 |
| Issued in reinvestment of distributions | 230,523 | 336,509 |
| Redeemed | (751,353) | (648,106) |
| Net increase (decrease) | (73,042) | 5,442,166 |
See accompanying notes which are an integral part of the financial statements.
Financial Highlights
Fidelity Emerging Markets Equity Central Fund
| Years ended September 30, | 2020 | 2019 | 2018 | 2017 | 2016 |
| Selected Per–Share Data | |||||
| Net asset value, beginning of period | $210.61 | $220.61 | $246.26 | $202.55 | $172.95 |
| Income from Investment Operations | |||||
| Net investment income (loss)A | 3.85 | 7.79B | 5.11 | 4.65 | 4.05 |
| Net realized and unrealized gain (loss) | 28.57 | 1.52C | (14.13) | 44.19 | 29.35 |
| Total from investment operations | 32.42 | 9.31 | (9.02) | 48.84 | 33.40 |
| Distributions from net investment income | (5.52) | (4.54) | (4.95) | (4.06) | (3.80) |
| Distributions from net realized gain | (.37) | (14.76) | (11.68) | (1.07) | – |
| Total distributions | (5.89) | (19.31)D | (16.63) | (5.13) | (3.80) |
| Net asset value, end of period | $237.14 | $210.61 | $220.61 | $246.26 | $202.55 |
| Total ReturnE | 15.71% | 5.22% | (4.20)% | 24.55% | 19.51% |
| Ratios to Average Net AssetsF,G | |||||
| Expenses before reductions | .05% | .06% | .07% | .07% | .09% |
| Expenses net of fee waivers, if any | .05% | .06% | .07% | .07% | .09% |
| Expenses net of all reductions | .05% | .06% | .07% | .07% | .09% |
| Net investment income (loss) | 1.76% | 3.73%B | 2.07% | 2.12% | 2.23% |
| Supplemental Data | |||||
| Net assets, end of period (000 omitted) | $1,986,807 | $1,779,865 | $663,813 | $763,186 | $414,821 |
| Portfolio turnover rateH | 50% | 60% | 65% | 59% | 52% |
A Calculated based on average shares outstanding during the period.
B Net investment income per share reflects one or more large, non-recurring dividend(s) which amounted to $2.72 per share. Excluding such non-recurring dividend(s), the ratio of net investment income (loss) to average net assets would have been 2.43%.
C The amount shown for a share outstanding does not correspond with the aggregate net gain (loss) on investments for the period due to the timing of sales and repurchases of shares in relation to fluctuating market values of the investments of the Fund.
D Total distributions per share do not sum due to rounding.
E Total returns would have been lower if certain expenses had not been reduced during the applicable periods shown.
F Fees and expenses of any underlying mutual funds or exchange-traded funds (ETFs) are not included in the Fund's expense ratio. The Fund indirectly bears its proportionate share of these expenses. For additional expense information related to investments in Fidelity Central Funds, please refer to the "Investments in Fidelity Central Funds" note found in the Notes to Financial Statements section of the most recent Annual or Semi-Annual report.
G Expense ratios reflect operating expenses of the class. Expenses before reductions do not reflect amounts reimbursed, waived, or reduced through arrangements with the investment advisor, brokerage services, or other offset arrangements, if applicable, and do not represent the amount paid by the class during periods when reimbursements, waivers or reductions occur.
H Amount does not include the portfolio activity of any underlying mutual funds or exchange-traded funds (ETFs).
See accompanying notes which are an integral part of the financial statements.
Notes to Financial Statements
For the period ended September 30, 2020
1. Organization.
Fidelity Emerging Markets Equity Central Fund (the Fund) is a fund of Fidelity Central Investment Portfolios LLC (the LLC) and is authorized to issue an unlimited number of shares. Shares of the Fund are only offered to other investment companies and accounts managed by Fidelity Management & Research Company LLC (FMR), or its affiliates (the Investing Funds). The LLC is registered under the Investment Company Act of 1940, as amended (the 1940 Act), as an open-end management investment company organized as a Delaware Limited Liability Company. The Fund's investments in emerging markets can be subject to social, economic, regulatory, and political uncertainties and can be extremely volatile.
Effective January 1, 2020:
Investment advisers Fidelity Investments Money Management, Inc., FMR Co., Inc., and Fidelity SelectCo, LLC, merged with and into Fidelity Management & Research Company. In connection with the merger transactions, the resulting, merged investment adviser was then redomiciled from Massachusetts to Delaware, changed its corporate structure from a corporation to a limited liability company, and changed its name to "Fidelity Management & Research Company LLC".
2. Investments in Fidelity Central Funds.
The Fund invests in Fidelity Central Funds, which are open-end investment companies generally available only to other investment companies and accounts managed by the investment adviser and its affiliates. The Fund's Schedule of Investments lists each of the Fidelity Central Funds held as of period end, if any, as an investment of the Fund, but does not include the underlying holdings of each Fidelity Central Fund. As an Investing Fund, the Fund indirectly bears its proportionate share of the expenses of the underlying Fidelity Central Funds.
The Money Market Central Funds seek preservation of capital and current income and are managed by the investment adviser. Annualized expenses of the Money Market Central Funds as of their most recent shareholder report date ranged from less than .005% to .01%.
A complete unaudited list of holdings for each Fidelity Central Fund is available upon request or at the Securities and Exchange Commission (the SEC) website at www.sec.gov. In addition, the financial statements of the Fidelity Central Funds, which are not covered by the Fund's Report of Independent Registered Public Accounting Firm, are available on the SEC website or upon request.
3. Significant Accounting Policies.
The Fund is an investment company and applies the accounting and reporting guidance of the Financial Accounting Standards Board (FASB) Accounting Standards Codification Topic 946 Financial Services – Investment Companies. The financial statements have been prepared in conformity with accounting principles generally accepted in the United States of America (GAAP), which require management to make certain estimates and assumptions at the date of the financial statements. Actual results could differ from those estimates. Subsequent events, if any, through the date that the financial statements were issued have been evaluated in the preparation of the financial statements. The following summarizes the significant accounting policies of the Fund:
Investment Valuation. Investments are valued as of 4:00 p.m. Eastern time on the last calendar day of the period. The Board of Directors (the Board) has delegated the day to day responsibility for the valuation of the Fund's investments to the Fair Value Committee (the Committee) established by the Fund's investment adviser. In accordance with valuation policies and procedures approved by the Board, the Fund attempts to obtain prices from one or more third party pricing vendors or brokers to value its investments. When current market prices, quotations or currency exchange rates are not readily available or reliable, investments will be fair valued in good faith by the Committee, in accordance with procedures adopted by the Board. Factors used in determining fair value vary by investment type and may include market or investment specific events, changes in interest rates and credit quality. The frequency with which these procedures are used cannot be predicted and they may be utilized to a significant extent. The Committee oversees the Fund's valuation policies and procedures and reports to the Board on the Committee's activities and fair value determinations. The Board monitors the appropriateness of the procedures used in valuing the Fund's investments and ratifies the fair value determinations of the Committee.
The Fund categorizes the inputs to valuation techniques used to value its investments into a disclosure hierarchy consisting of three levels as shown below:
- Level 1 – quoted prices in active markets for identical investments
- Level 2 – other significant observable inputs (including quoted prices for similar investments, interest rates, prepayment speeds, etc.)
- Level 3 – unobservable inputs (including the Fund's own assumptions based on the best information available)
Valuation techniques used to value the Fund's investments by major category are as follows:
Equity securities, including restricted securities, for which market quotations are readily available, are valued at the last reported sale price or official closing price as reported by a third party pricing vendor on the primary market or exchange on which they are traded and are categorized as Level 1 in the hierarchy. In the event there were no sales during the day or closing prices are not available, securities are valued at the last quoted bid price or may be valued using the last available price and are generally categorized as Level 2 in the hierarchy. For foreign equity securities, when market or security specific events arise, comparisons to the valuation of American Depositary Receipts (ADRs), futures contracts, Exchange-Traded Funds (ETFs) and certain indexes as well as quoted prices for similar securities may be used and would be categorized as Level 2 in the hierarchy. For equity securities, including restricted securities, where observable inputs are limited, assumptions about market activity and risk are used and these securities may be categorized as Level 3 in the hierarchy.
Debt securities, including restricted securities, are valued based on evaluated prices received from third party pricing vendors or from brokers who make markets in such securities. U.S. government and government agency obligations are valued by pricing vendors who utilize matrix pricing which considers yield or price of bonds of comparable quality, coupon, maturity and type or by broker-supplied prices. When independent prices are unavailable or unreliable, debt securities may be valued utilizing pricing methodologies which consider similar factors that would be used by third party pricing vendors. Debt securities are generally categorized as Level 2 in the hierarchy but may be Level 3 depending on the circumstances.
Futures contracts are valued at the settlement price established each day by the board of trade or exchange on which they are traded and are categorized as Level 1 in the hierarchy. Investments in open-end mutual funds, including the Fidelity Central Funds, are valued at their closing net asset value (NAV) each business day and are categorized as Level 1 in the hierarchy.
Changes in valuation techniques may result in transfers in or out of an assigned level within the disclosure hierarchy. The aggregate value of investments by input level as of September 30, 2020 is included at the end of the Fund's Schedule of Investments.
Foreign Currency. Certain Funds may use foreign currency contracts to facilitate transactions in foreign-denominated securities. Gains and losses from these transactions may arise from changes in the value of the foreign currency or if the counterparties do not perform under the contracts' terms.
Foreign-denominated assets, including investment securities, and liabilities are translated into U.S. dollars at the exchange rates at period end. Purchases and sales of investment securities, income and dividends received, and expenses denominated in foreign currencies are translated into U.S. dollars at the exchange rate in effect on the transaction date.
The effects of exchange rate fluctuations on investments are included with the net realized and unrealized gain (loss) on investment securities. Other foreign currency transactions resulting in realized and unrealized gain (loss) are disclosed separately.
Investment Transactions and Income. For financial reporting purposes, the Fund's investment holdings and NAV include trades executed through the end of the last business day of the period. The NAV per share for processing shareholder transactions is calculated as of the close of business of the New York Stock Exchange (NYSE), normally 4:00 p.m. Eastern time and includes trades executed through the end of the prior business day. Gains and losses on securities sold are determined on the basis of identified cost and include proceeds received from litigation. Dividend income is recorded on the ex-dividend date, except for certain dividends from foreign securities where the ex-dividend date may have passed, which are recorded as soon as the Fund is informed of the ex-dividend date. Non-cash dividends included in dividend income, if any, are recorded at the fair market value of the securities received. Income and capital gain distributions from Fidelity Central Funds, if any, are recorded on the ex-dividend date. Certain distributions received by the Fund represent a return of capital or capital gain. The Fund determines the components of these distributions subsequent to the ex-dividend date, based upon receipt of tax filings or other correspondence relating to the underlying investment. These distributions are recorded as a reduction of cost of investments and/or as a realized gain. Interest income is accrued as earned and includes coupon interest and amortization of premium and accretion of discount on debt securities as applicable. Investment income is recorded net of foreign taxes withheld where recovery of such taxes is uncertain.
Expenses. Expenses directly attributable to a fund are charged to that fund. Expenses attributable to more than one fund are allocated among the respective funds on the basis of relative net assets or other appropriate methods. Expense estimates are accrued in the period to which they relate and adjustments are made when actual amounts are known.
Income Tax Information and Distributions to Shareholders. Each year, the Fund intends to qualify as a regulated investment company under Subchapter M of the Internal Revenue Code, including distributing substantially all of its taxable income and realized gains. As a result, no provision for U.S. Federal income taxes is required. As of September 30, 2020, the Fund did not have any unrecognized tax benefits in the financial statements; nor is the Fund aware of any tax positions for which it is reasonably possible that the total amounts of unrecognized tax benefits will significantly change in the next twelve months. The Fund files a U.S. federal tax return, in addition to state and local tax returns as required. The Fund's federal income tax returns are subject to examination by the Internal Revenue Service (IRS) for a period of three fiscal years after they are filed. State and local tax returns may be subject to examination for an additional fiscal year depending on the jurisdiction. Foreign taxes are provided for based on the Fund's understanding of the tax rules and rates that exist in the foreign markets in which it invests. The Fund is subject to a tax imposed on capital gains by certain countries in which it invests. An estimated deferred tax liability for net unrealized appreciation on the applicable securities is included in Other payables and accrued expenses on the Statement of Assets & Liabilities.
Distributions are declared and recorded on the ex-dividend date. Income and capital gain distributions are determined in accordance with income tax regulations, which may differ from GAAP.
Capital accounts within the financial statements are adjusted for permanent book-tax differences. These adjustments have no impact on net assets or the results of operations. Capital accounts are not adjusted for temporary book-tax differences which will reverse in a subsequent period.
Book-tax differences are primarily due to futures contracts, foreign currency transactions, certain foreign taxes, passive foreign investment companies (PFIC), capital loss carryforwards and losses deferred due to wash sales.
As of period end, the cost and unrealized appreciation (depreciation) in securities, and derivatives if applicable, for federal income tax purposes were as follows:
| Gross unrealized appreciation | $496,153,475 |
| Gross unrealized depreciation | (202,601,835) |
| Net unrealized appreciation (depreciation) | $293,551,640 |
| Tax Cost | $1,697,206,512 |
The tax-based components of distributable earnings as of period end were as follows:
| Undistributed ordinary income | $4,637,906 |
| Capital loss carryforward | $(27,735,927) |
| Net unrealized appreciation (depreciation) on securities and other investments | $293,439,784 |
Capital loss carryforwards are only available to offset future capital gains of the Fund to the extent provided by regulations and may be limited. The capital loss carryforward information presented below, including any applicable limitation, is estimated as of fiscal period end and is subject to adjustment.
| No expiration | |
| Short-term | $(27,735,927) |
| Total capital loss carryforward | $(27,735,927) |
The tax character of distributions paid was as follows:
| September 30, 2020 | September 30, 2019 | |
| Ordinary Income | $49,669,829 | $ 21,821,182 |
| Long-term Capital Gains | – | 43,679,628 |
| Total | $49,669,829 | $ 65,500,810 |
Restricted Securities (including Private Placements). The Fund may invest in securities that are subject to legal or contractual restrictions on resale. These securities generally may be resold in transactions exempt from registration or to the public if the securities are registered. Disposal of these securities may involve time-consuming negotiations and expense, and prompt sale at an acceptable price may be difficult. Information regarding restricted securities is included at the end of the Fund's Schedule of Investments.
4. Derivative Instruments.
Risk Exposures and the Use of Derivative Instruments. The Fund's investment objective allows the Fund to enter into various types of derivative contracts, including futures contracts. Derivatives are investments whose value is primarily derived from underlying assets, indices or reference rates and may be transacted on an exchange or over-the-counter (OTC). Derivatives may involve a future commitment to buy or sell a specified asset based on specified terms, to exchange future cash flows at periodic intervals based on a notional principal amount, or for one party to make one or more payments upon the occurrence of specified events in exchange for periodic payments from the other party.
The Fund used derivatives to increase returns and to manage exposure to certain risks as defined below. The success of any strategy involving derivatives depends on analysis of numerous economic factors, and if the strategies for investment do not work as intended, the Fund may not achieve its objectives.
The Fund's use of derivatives increased or decreased its exposure to the following risk:
| Equity Risk | Equity risk relates to the fluctuations in the value of financial instruments as a result of changes in market prices (other than those arising from interest rate risk or foreign exchange risk), whether caused by factors specific to an individual investment, its issuer, or all factors affecting all instruments traded in a market or market segment. |
The Fund is also exposed to additional risks from investing in derivatives, such as liquidity risk and counterparty credit risk. Liquidity risk is the risk that the Fund will be unable to close out the derivative in the open market in a timely manner. Counterparty credit risk is the risk that the counterparty will not be able to fulfill its obligation to the Fund. Counterparty credit risk related to exchange-traded futures contracts may be mitigated by the protection provided by the exchange on which they trade.
Investing in derivatives may involve greater risks than investing in the underlying assets directly and, to varying degrees, may involve risk of loss in excess of any initial investment and collateral received and amounts recognized in the Statement of Assets and Liabilities. In addition, there may be the risk that the change in value of the derivative contract does not correspond to the change in value of the underlying instrument.
Futures Contracts. A futures contract is an agreement between two parties to buy or sell a specified underlying instrument for a fixed price at a specified future date. The Fund used futures contracts to manage its exposure to the stock market.
Upon entering into a futures contract, a fund is required to deposit either cash or securities (initial margin) with a clearing broker in an amount equal to a certain percentage of the face value of the contract. Futures contracts are marked-to-market daily and subsequent daily payments (variation margin) are made or received by a fund depending on the daily fluctuations in the value of the futures contracts and are recorded as unrealized appreciation or (depreciation). This receivable and/or payable, if any, is included in daily variation margin on futures contracts in the Statement of Assets and Liabilities. Realized gain or (loss) is recorded upon the expiration or closing of a futures contract. The net realized gain (loss) and change in net unrealized appreciation (depreciation) on futures contracts during the period is presented in the Statement of Operations.
Any open futures contracts at period end are presented in the Schedule of Investments under the caption "Futures Contracts". The notional amount at value reflects each contract's exposure to the underlying instrument or index at period end and is representative of volume of activity during the period. Securities deposited to meet initial margin requirements are identified in the Schedule of Investments.
5. Purchases and Sales of Investments.
Purchases and sales of securities, other than short-term securities and U.S. government securities, are noted in the table below.
| Purchases ($) | Sales ($) | |
| Fidelity Emerging Markets Equity Central Fund | 900,142,421 | 926,793,514 |
6. Fees and Other Transactions with Affiliates.
Management Fee and Expense Contract. Fidelity Management & Research Company LLC (the investment adviser) provides the Fund with investment management services. The Fund does not pay any fees for these services. Pursuant to the Fund's management contract, the investment adviser receives a monthly management fee that represents a portion of the management fees it receives from the Investing Funds. In addition, under an expense contract, the investment adviser also pays all other expenses of the Fund, excluding custody fees, the compensation of the independent Directors, and certain miscellaneous expenses such as proxy and shareholder meeting expenses.
Brokerage Commissions. A portion of portfolio transactions were placed with brokerage firms which are affiliates of the investment adviser. Brokerage commissions are included in net realized gain (loss) and change in net unrealized appreciation (depreciation) in the Statement of Operations. The commissions paid to these affiliated firms were as follows:
| Amount | |
| Fidelity Emerging Markets Equity Central Fund | $9,503 |
Interfund Lending Program. Pursuant to an Exemptive Order issued by the SEC, the Fund, along with other registered investment companies having management contracts with FMR, or other affiliated entities of FMR, may participate in an interfund lending program. This program provides an alternative credit facility allowing the Fund to borrow from, or lend money to, other participating affiliated funds. At period end, there were no interfund loans outstanding. Activity in this program during the period for which loans were outstanding was as follows:
| Borrower or Lender | Average Loan Balance | Weighted Average Interest Rate | Interest Expense | |
| Fidelity Emerging Markets Equity Central Fund | Borrower | $7,226,000 | .27% | $164 |
Interfund Trades. Funds may purchase from or sell securities to other Fidelity Funds under procedures adopted by the Board. The procedures have been designed to ensure these interfund trades are executed in accordance with Rule 17a-7 of the 1940 Act. Interfund trades are included within the respective purchases and sales amounts shown in the Purchases and Sales of Investments note.
7. Security Lending.
The Fund lends portfolio securities from time to time in order to earn additional income. Lending agents are used, including National Financial Services (NFS), an affiliate of the Fund. Pursuant to a securities lending agreement, NFS will receive a fee, which is capped at 9.9% of daily lending revenue, for its services as lending agent. The Fund may lend securities to certain qualified borrowers, including NFS. On the settlement date of the loan, the Fund receives collateral (in the form of U.S. Treasury obligations, letters of credit and/or cash) against the loaned securities and maintains collateral in an amount not less than 100% of the market value of the loaned securities during the period of the loan. The market value of the loaned securities is determined at the close of business of the Fund and any additional required collateral is delivered to the Fund on the next business day. The Fund or borrower may terminate the loan at any time, and if the borrower defaults on its obligation to return the securities loaned because of insolvency or other reasons, the Fund may apply collateral received from the borrower against the obligation. The Fund may experience delays and costs in recovering the securities loaned. Any cash collateral received is invested in the Fidelity Securities Lending Cash Central Fund. The value of loaned securities and cash collateral at period end are disclosed on the Fund's Statement of Assets and Liabilities. At period end, there were no security loans outstanding with NFS, as affiliated borrower. Total fees paid by the Fund to NFS, as lending agent, amounted to $8,138. Security lending income represents the income earned on investing cash collateral, less rebates paid to borrowers and any lending agent fees associated with the loan, plus any premium payments received for lending certain types of securities. Net income from the Fidelity Securities Lending Cash Central Fund during the period is presented in the Statement of Operations as a component of income from Fidelity Central Funds (and includes $1,442 from securities loaned to NFS, as affiliated borrower).
8. Other.
The Fund's organizational documents provide former and current directors and officers with a limited indemnification against liabilities arising in connection with the performance of their duties to the Fund. In the normal course of business, the Fund may also enter into contracts that provide general indemnifications. The Fund's maximum exposure under these arrangements is unknown as this would be dependent on future claims that may be made against the Fund. The risk of material loss from such claims is considered remote.
At the end of the period, mutual funds managed by the investment adviser or its affiliates were the owners of record of all of the outstanding shares of the Fund.
9. Coronavirus (COVID-19) Pandemic.
An outbreak of COVID-19 first detected in China during December 2019 has since spread globally and was declared a pandemic by the World Health Organization during March 2020. Developments that disrupt global economies and financial markets, such as the COVID-19 pandemic, may magnify factors that affect the Fund's performance.
Report of Independent Registered Public Accounting Firm
To the Board of Trustees of Fidelity Central Investment Portfolios LLC and the Shareholders of Fidelity Emerging Markets Equity Central Fund:
Opinion on the Financial Statements and Financial Highlights
We have audited the accompanying statement of assets and liabilities of Fidelity Emerging Markets Equity Central Fund (the "Fund"), a fund of Fidelity Central Investment Portfolios LLC, including the schedule of investments, as of September 30, 2020, the related statement of operations for the year then ended, the statement of changes in net assets for each of the two years in the period then ended, the financial highlights for each of the five years in the period then ended, and the related notes. In our opinion, the financial statements and financial highlights present fairly, in all material respects, the financial position of the Fund as of September 30, 2020, and the results of its operations for the year then ended, the changes in its net assets for each of the two years in the period then ended, and the financial highlights for each of the five years in the period then ended in conformity with accounting principles generally accepted in the United States of America.
Basis for Opinion
These financial statements and financial highlights are the responsibility of the Fund's management. Our responsibility is to express an opinion on the Fund's financial statements and financial highlights based on our audits. We are a public accounting firm registered with the Public Company Accounting Oversight Board (United States) (PCAOB) and are required to be independent with respect to the Fund in accordance with the U.S. federal securities laws and the applicable rules and regulations of the Securities and Exchange Commission and the PCAOB.
We conducted our audits in accordance with the standards of the PCAOB. Those standards require that we plan and perform the audit to obtain reasonable assurance about whether the financial statements and financial highlights are free of material misstatement, whether due to error or fraud. The Fund is not required to have, nor were we engaged to perform, an audit of its internal control over financial reporting. As part of our audits we are required to obtain an understanding of internal control over financial reporting but not for the purpose of expressing an opinion on the effectiveness of the Fund’s internal control over financial reporting. Accordingly, we express no such opinion.
Our audits included performing procedures to assess the risks of material misstatement of the financial statements and financial highlights, whether due to error or fraud, and performing procedures that respond to those risks. Such procedures included examining, on a test basis, evidence regarding the amounts and disclosures in the financial statements and financial highlights. Our audits also included evaluating the accounting principles used and significant estimates made by management, as well as evaluating the overall presentation of the financial statements and financial highlights. Our procedures included confirmation of securities owned as of September 30, 2020, by correspondence with the custodian and brokers; when replies were not received from brokers, we performed other auditing procedures. We believe that our audits provide a reasonable basis for our opinion.
/s/ Deloitte & Touche LLP
Boston, Massachusetts
November 11, 2020
We have served as the auditor of one or more of the Fidelity investment companies since 1999.
Directors and Officers (Trustees and Officers)
The Trustees, Members of the Advisory Board (if any), and officers of the Fidelity Central Investment Portfolios LLC and fund, as applicable, are listed below. The Board of Trustees governs the fund and is responsible for protecting the interests of shareholders. The Trustees are experienced executives who meet periodically throughout the year to oversee the fund's activities, review contractual arrangements with companies that provide services to the fund, oversee management of the risks associated with such activities and contractual arrangements, and review the fund's performance. Except for Bettina Doulton, each of the Trustees oversees 304 funds. Mrs. Doulton oversees 203 funds.
The Trustees hold office without limit in time except that (a) any Trustee may resign; (b) any Trustee may be removed by written instrument, signed by at least two-thirds of the number of Trustees prior to such removal; (c) any Trustee who requests to be retired or who has become incapacitated by illness or injury may be retired by written instrument signed by a majority of the other Trustees; and (d) any Trustee may be removed at any special meeting of shareholders by a two-thirds vote of the outstanding voting securities of the trust. Each Trustee who is not an interested person (as defined in the 1940 Act) of the trust and the fund is referred to herein as an Independent Trustee. Each Independent Trustee shall retire not later than the last day of the calendar year in which his or her 75th birthday occurs. The Independent Trustees may waive this mandatory retirement age policy with respect to individual Trustees. Officers and Advisory Board Members hold office without limit in time, except that any officer or Advisory Board Member may resign or may be removed by a vote of a majority of the Trustees at any regular meeting or any special meeting of the Trustees. Except as indicated, each individual has held the office shown or other offices in the same company for the past five years.
The fund’s Statement of Additional Information (SAI) includes more information about the Trustees. To request a free copy, call Fidelity at 1-800-544-8544.
Experience, Skills, Attributes, and Qualifications of the Trustees. The Governance and Nominating Committee has adopted a statement of policy that describes the experience, qualifications, attributes, and skills that are necessary and desirable for potential Independent Trustee candidates (Statement of Policy). The Board believes that each Trustee satisfied at the time he or she was initially elected or appointed a Trustee, and continues to satisfy, the standards contemplated by the Statement of Policy. The Governance and Nominating Committee also engages professional search firms to help identify potential Independent Trustee candidates who have the experience, qualifications, attributes, and skills consistent with the Statement of Policy. From time to time, additional criteria based on the composition and skills of the current Independent Trustees, as well as experience or skills that may be appropriate in light of future changes to board composition, business conditions, and regulatory or other developments, have also been considered by the professional search firms and the Governance and Nominating Committee. In addition, the Board takes into account the Trustees' commitment and participation in Board and committee meetings, as well as their leadership of standing and ad hoc committees throughout their tenure.
In determining that a particular Trustee was and continues to be qualified to serve as a Trustee, the Board has considered a variety of criteria, none of which, in isolation, was controlling. The Board believes that, collectively, the Trustees have balanced and diverse experience, qualifications, attributes, and skills, which allow the Board to operate effectively in governing the fund and protecting the interests of shareholders. Information about the specific experience, skills, attributes, and qualifications of each Trustee, which in each case led to the Board's conclusion that the Trustee should serve (or continue to serve) as a trustee of the fund, is provided below.
Board Structure and Oversight Function. Robert A. Lawrence is an interested person and currently serves as Acting Chairman. The Trustees have determined that an interested Chairman is appropriate and benefits shareholders because an interested Chairman has a personal and professional stake in the quality and continuity of services provided to the fund. Independent Trustees exercise their informed business judgment to appoint an individual of their choosing to serve as Chairman, regardless of whether the Trustee happens to be independent or a member of management. The Independent Trustees have determined that they can act independently and effectively without having an Independent Trustee serve as Chairman and that a key structural component for assuring that they are in a position to do so is for the Independent Trustees to constitute a substantial majority for the Board. The Independent Trustees also regularly meet in executive session. Ned C. Lautenbach and David M. Thomas serve as Co-Lead Independent Trustees and as such each (i) acts as a liaison between the Independent Trustees and management with respect to matters important to the Independent Trustees and (ii) with management prepares agendas for Board meetings.
Fidelity® funds are overseen by different Boards of Trustees. The fund's Board oversees Fidelity's high income and certain equity funds, and other Boards oversee Fidelity's investment-grade bond, money market, asset allocation, and other equity funds. The asset allocation funds may invest in Fidelity® funds overseen by the fund's Board. The use of separate Boards, each with its own committee structure, allows the Trustees of each group of Fidelity® funds to focus on the unique issues of the funds they oversee, including common research, investment, and operational issues. On occasion, the separate Boards establish joint committees to address issues of overlapping consequences for the Fidelity® funds overseen by each Board.
The Trustees operate using a system of committees to facilitate the timely and efficient consideration of all matters of importance to the Trustees, the fund, and fund shareholders and to facilitate compliance with legal and regulatory requirements and oversight of the fund's activities and associated risks. The Board, acting through its committees, has charged FMR and its affiliates with (i) identifying events or circumstances the occurrence of which could have demonstrably adverse effects on the fund's business and/or reputation; (ii) implementing processes and controls to lessen the possibility that such events or circumstances occur or to mitigate the effects of such events or circumstances if they do occur; and (iii) creating and maintaining a system designed to evaluate continuously business and market conditions in order to facilitate the identification and implementation processes described in (i) and (ii) above. Because the day-to-day operations and activities of the fund are carried out by or through FMR, its affiliates, and other service providers, the fund's exposure to risks is mitigated but not eliminated by the processes overseen by the Trustees. While each of the Board's committees has responsibility for overseeing different aspects of the fund's activities, oversight is exercised primarily through the Operations, Audit, and Compliance Committees. Appropriate personnel, including but not limited to the fund's Chief Compliance Officer (CCO), FMR's internal auditor, the independent accountants, the fund's Treasurer and portfolio management personnel, make periodic reports to the Board's committees, as appropriate, including an annual review of Fidelity's risk management program for the Fidelity® funds. The responsibilities of each standing committee, including their oversight responsibilities, are described further under "Standing Committees of the Trustees."
Interested Trustees*:
Correspondence intended for a Trustee who is an interested person may be sent to Fidelity Investments, 245 Summer Street, Boston, Massachusetts 02210.
Name, Year of Birth; Principal Occupations and Other Relevant Experience+
Bettina Doulton (1964)
Year of Election or Appointment: 2020
Trustee
Ms. Doulton also serves as Trustee of other Fidelity® funds. Prior to her retirement, Ms. Doulton served in a variety of positions at Fidelity Investments, including as a managing director of research (2006-2007), portfolio manager to certain Fidelity® funds (1993-2005), equity analyst and portfolio assistant (1990-1993), and research assistant (1987-1990). Ms. Doulton currently owns and operates Phi Builders + Architects and Cellardoor Winery. Previously, Ms. Doulton served as a member of the Board of Brown Capital Management, LLC (2013-2018).
Robert A. Lawrence (1952)
Year of Election or Appointment: 2020
Trustee
Acting Chairman of the Board of Trustees
Mr. Lawrence also serves as Trustee of other funds. Previously, Mr. Lawrence served as a Member of the Advisory Board of certain funds. Prior to his retirement in 2008, Mr. Lawrence served as Vice President of certain Fidelity® funds (2006-2008), Senior Vice President, Head of High Income Division of Fidelity Management & Research Company (investment adviser firm, 2006-2008), and President of Fidelity Strategic Investments (investment adviser firm, 2002-2005).
* Determined to be an “Interested Trustee” by virtue of, among other things, his or her affiliation with the Fidelity Central Investment Portfolio LLC or various entities under common control with FMR.
+ The information includes the Trustee's principal occupation during the last five years and other information relating to the experience, attributes, and skills relevant to the Trustee's qualifications to serve as a Trustee, which led to the conclusion that the Trustee should serve as a Trustee for the fund.
Independent Trustees:
Correspondence intended for an Independent Trustee may be sent to Fidelity Investments, P.O. Box 55235, Boston, Massachusetts 02205-5235.
Name, Year of Birth; Principal Occupations and Other Relevant Experience+
Dennis J. Dirks (1948)
Year of Election or Appointment: 2005
Trustee
Mr. Dirks also serves as Trustee of other Fidelity® funds. Prior to his retirement in May 2003, Mr. Dirks served as Chief Operating Officer and as a member of the Board of The Depository Trust & Clearing Corporation (financial markets infrastructure), President, Chief Operating Officer and a member of the Board of The Depository Trust Company (DTC), President and a member of the Board of the National Securities Clearing Corporation (NSCC), Chief Executive Officer and a member of the Board of the Government Securities Clearing Corporation and Chief Executive Officer and a member of the Board of the Mortgage-Backed Securities Clearing Corporation. Mr. Dirks currently serves as a member of the Finance Committee (2016-present) and Board (2017-present) and is Treasurer (2018-present) of the Asolo Repertory Theatre.
Donald F. Donahue (1950)
Year of Election or Appointment: 2018
Trustee
Mr. Donahue also serves as Trustee of other Fidelity® funds. Mr. Donahue serves as President and Chief Executive Officer of Miranda Partners, LLC (risk consulting for the financial services industry, 2012-present). Previously, Mr. Donahue served as Chief Executive Officer (2006-2012), Chief Operating Officer (2003-2006) and Managing Director, Customer Marketing and Development (1999-2003) of The Depository Trust & Clearing Corporation (financial markets infrastructure). Mr. Donahue currently serves as a member (2007-present) and Co-Chairman (2016-present) of the Board of United Way of New York, a member of the Board of NYC Leadership Academy (2012-present) and a member of the Board of Advisors of Ripple Labs, Inc. (financial services, 2015-present). Mr. Donahue previously served as a member of the Advisory Board of certain Fidelity® funds (2015-2018).
Vicki L. Fuller (1957)
Year of Election or Appointment: 2020
Trustee
Ms. Fuller also serves as Trustee of other Fidelity® funds. Previously, Ms. Fuller served as a member of the Advisory Board of certain Fidelity® funds (2018-2020), Chief Investment Officer of the New York State Common Retirement Fund (2012-2018) and held a variety of positions at AllianceBernstein L.P. (global asset management, 1985-2012), including Managing Director (2006-2012) and Senior Vice President and Senior Portfolio Manager (2001-2006). Ms. Fuller currently serves as a member of the Board, Audit Committee and Nominating and Governance Committee of The Williams Companies, Inc. (natural gas infrastructure, 2018-present), as a member of the Board, Audit Committee and Nominating and Governance Committee of two Blackstone business development companies (2020-present) and as a member of the Board of Treliant, LLC (consulting, 2019-present).
Patricia L. Kampling (1959)
Year of Election or Appointment: 2020
Trustee
Ms. Kampling also serves as Trustee of other Fidelity® funds. Prior to her retirement, Ms. Kampling served as Chairman of the Board and Chief Executive Officer (2012-2019), President and Chief Operating Officer (2011-2012) and Executive Vice President and Chief Financial Officer (2010-2011) of Alliant Energy Corporation. Ms. Kampling currently serves as a member of the Board, Compensation Committee and Executive Committee and as Chair of the Audit Committee of Briggs & Stratton Corporation (manufacturing, 2011-present) and as a member of the Board, Audit, Finance and Risk Committee and Safety, Environmental, Technology and Operations Committee of American Water Works Company, Inc. (utilities company, 2019-present). In addition, Ms. Kampling currently serves as a member of the Board of the Nature Conservancy, Wisconsin Chapter (2019-present). Previously, Ms. Kampling served as a Member of the Advisory Board of certain Fidelity® funds (2020), a member of the Board of Interstate Power and Light Company (2012-2019) and Wisconsin Power and Light Company (2012-2019) (each a subsidiary of Alliant Energy Corporation) and as a member of the Board and Workforce Development Committee of the Business Roundtable (2018-2019).
Alan J. Lacy (1953)
Year of Election or Appointment: 2008
Trustee
Mr. Lacy also serves as Trustee of other Fidelity® funds. Previously, Mr. Lacy served as Senior Adviser (2007-2014) of Oak Hill Capital Partners, L.P. (private equity), Chief Executive Officer (2005) and Vice Chairman (2005-2006) of Sears Holdings Corporation (retail), Chief Executive Officer and Chairman of the Board of Sears, Roebuck and Co. (retail, 2000-2005), Chairman (2014-2017) and a member of the Board (2010-2017) of Dave & Buster’s Entertainment, Inc. (restaurant and entertainment complexes) and a member of the Board of Bristol-Myers Squibb Company (global pharmaceuticals, 2008-2020). Mr. Lacy currently serves as a Trustee of the California Chapter of The Nature Conservancy (2015-present) and a member of the Board of the Center for Advanced Study in the Behavioral Sciences at Stanford University (2015-present).
Ned C. Lautenbach (1944)
Year of Election or Appointment: 2004
Trustee
Co-Lead Independent Trustee
Mr. Lautenbach also serves as Trustee of other Fidelity® funds. Mr. Lautenbach currently serves as Chair of the Board of Governors, State University System of Florida (2013-present) and is a member of the Council on Foreign Relations (1994-present). He is also a member and has in the past served as Chairman of the Board of Directors of Artis-Naples (2012-present). Previously, Mr. Lautenbach served as a member and then Lead Director of the Board of Directors of Eaton Corporation (diversified industrial, 1997-2016). He was also a Partner at Clayton, Dubilier & Rice, LLC (private equity investment, 1998-2010); as well as Director of Sony Corporation (2006-2007). In addition, Mr. Lautenbach had a 30-year career with IBM (technology company), during which time he served as Senior Vice President and as a member of the Corporate Executive Committee (1968-1998).
Joseph Mauriello (1944)
Year of Election or Appointment: 2008
Trustee
Mr. Mauriello also serves as Trustee of other Fidelity® funds. Prior to his retirement in January 2006, Mr. Mauriello served in numerous senior management positions including Deputy Chairman and Chief Operating Officer (2004-2005), and Vice Chairman of Financial Services (2002-2004) of KPMG LLP US (professional services, 1965-2005). Mr. Mauriello currently serves as a member of the Independent Directors Council Governing Council (2015-present). Previously, Mr. Mauriello served as a member of the Board of XL Group plc. (global insurance and re-insurance, 2006-2018).
Cornelia M. Small (1944)
Year of Election or Appointment: 2005
Trustee
Ms. Small also serves as Trustee of other Fidelity® funds. Previously, Ms. Small served as Chief Investment Officer, Director of Global Equity Investments and a member of Scudder, Stevens & Clark and Scudder Kemper Investments. Ms. Small previously served as a member of the Board (2009-2019) and Chair of the Investment Committee (2010-2019) of the Teagle Foundation and a member of the Investment Committee of the Berkshire Taconic Community Foundation (2008-2019).
Garnett A. Smith (1947)
Year of Election or Appointment: 2018
Trustee
Mr. Smith also serves as Trustee of other Fidelity® funds. Prior to his retirement, Mr. Smith served as Chairman and Chief Executive Officer (1990-1997) and President (1986-1990) of Inbrand Corp. (manufacturer of personal absorbent products). Prior to his employment with Inbrand Corp., he was employed by a retail fabric chain and North Carolina National Bank (now Bank of America). Mr. Smith previously served as a member of the Advisory Board of certain Fidelity® funds (2012-2013).
David M. Thomas (1949)
Year of Election or Appointment: 2008
Trustee
Co-Lead Independent Trustee
Mr. Thomas also serves as Trustee of other Fidelity® funds. Previously, Mr. Thomas served as Executive Chairman (2005-2006) and Chairman and Chief Executive Officer (2000-2005) of IMS Health, Inc. (pharmaceutical and healthcare information solutions). Mr. Thomas currently serves as Non-Executive Chairman of the Board of Fortune Brands Home and Security (home and security products, 2011-present), and a member of the Board (2004-present) and Presiding Director (2013-present) of Interpublic Group of Companies, Inc. (marketing communication).
Susan Tomasky (1953)
Year of Election or Appointment: 2020
Trustee
Ms. Tomasky also serves as Trustee of other Fidelity® funds. Prior to her retirement, Ms. Tomasky served in various executive officer positions at American Electric Power Company, Inc. (1998-2011), including most recently as President of AEP Transmission (2007-2011). Ms. Tomasky currently serves as a member of the Board and Sustainability Committee and as Chair of the Audit Committee of Marathon Petroleum Corporation (2018-present) and as a member of the Board, Corporate Governance Committee and Organization and Compensation Committee and as Chair of the Audit Committee of Public Service Enterprise Group, Inc. (utilities company, 2012-present). In addition, Ms. Tomasky currently serves as a member of the Board of the Columbus Regional Airport Authority (2007-present), as a member of the Board of the Royal Shakespeare Company – America (2009-present), as a member of the Board of the Columbus Association for the Performing Arts (2011-present) and as a member of the Board of Kenyon College (2016-present). Previously, Ms. Tomasky served as a Member of the Advisory Board of certain Fidelity® funds (2020), a member of the Board (2011-2019) and as Lead Independent Director (2015-2018) of Andeavor Corporation (previously Tesoro Corporation) (independent oil refiner and marketer) and as a member of the Board of Summit Midstream Partners LP (energy, 2012-2018).
Michael E. Wiley (1950)
Year of Election or Appointment: 2018
Trustee
Mr. Wiley also serves as Trustee of other Fidelity® funds. Previously, Mr. Wiley served as a member of the Advisory Board of certain Fidelity® funds (2018-2020), Chairman, President and CEO of Baker Hughes, Inc. (oilfield services, 2000-2004). Mr. Wiley also previously served as a member of the Board of Andeavor Corporation (independent oil refiner and marketer, 2005-2018), a member of the Board of Andeavor Logistics LP (natural resources logistics, 2015-2018) and a member of the Board of High Point Resources (exploration and production, 2005-2020).
+ The information includes the Trustee's principal occupation during the last five years and other information relating to the experience, attributes, and skills relevant to the Trustee's qualifications to serve as a Trustee, which led to the conclusion that the Trustee should serve as a Trustee for the fund.
Advisory Board Members and Officers:
Correspondence intended for a Member of the Advisory Board (if any) may be sent to Fidelity Investments, P.O. Box 55235, Boston, Massachusetts 02205-5235. Correspondence intended for an officer or Peter S. Lynch may be sent to Fidelity Investments, 245 Summer Street, Boston, Massachusetts 02210. Officers appear below in alphabetical order.
Name, Year of Birth; Principal Occupation
Lloyd James Austin, III (1953)
Year of Election or Appointment: 2020
Member of the Advisory Board
General Austin also serves as a Member of the Advisory Board of other Fidelity® funds. Prior to his retirement, General Austin (United States Army, Retired) held a variety of positions within the U.S. Government, including Commander, U.S. Central Command (2013-2016), Vice Chief of Staff, U.S. Army (2012-2013) and Commanding General, U.S. Forces – Iraq, Operation New Dawn (2010-2012). General Austin currently serves as a Partner of Pine Island Capital Partners (private equity, 2020-present) and as President of the Austin Strategy Group LLC (consulting, 2016-present). General Austin serves as a member of the Board of Directors of Nucor Corporation (steel products, 2017-present), as a member of the Board of Directors of Tenet Healthcare Corporation (2018-present) and as a member of the Board of Directors of Raytheon Technologies Corporation (aerospace and defense, 2020-present). In addition, General Austin currently serves as a member of the Board of Trustees of the Carnegie Corporation of New York (2017-present) and as a member of the Board of Trustees of Auburn University (2017-present). Previously, General Austin served as a member of the Board of Directors of United Technologies Corporation (aerospace, defense and building, 2016-2020).
Thomas A. Kennedy (1955)
Year of Election or Appointment: 2020
Member of the Advisory Board
Mr. Kennedy also serves as a Member of the Advisory Board of other Fidelity® funds. Previously, Mr. Kennedy held a variety of positions at Raytheon Company (aerospace and defense, 1983-2020), including Chairman and Chief Executive Officer (2014-2020) and Executive Vice President and Chief Operating Officer (2013-2014). Mr. Kennedy currently serves as Executive Chairman of the Board of Directors of Raytheon Technologies Corporation (aerospace and defense, 2020-present). He is also a member of the Rutgers School of Engineering Industry Advisory Board (2011-present) and a member of the UCLA Engineering Dean’s Executive Board (2016-present).
Peter S. Lynch (1944)
Year of Election or Appointment: 2004
Member of the Advisory Board
Mr. Lynch also serves as a Member of the Advisory Board of other Fidelity® funds. Mr. Lynch is Vice Chairman and a Director of Fidelity Management & Research Company LLC (investment adviser firm). In addition, Mr. Lynch serves as a Trustee of Boston College and as the Chairman of the Inner-City Scholarship Fund. Previously, Mr. Lynch served as Vice Chairman and a Director of FMR Co., Inc. (investment adviser firm) and on the Special Olympics International Board of Directors (1997-2006).
Elizabeth Paige Baumann (1968)
Year of Election or Appointment: 2017
Anti-Money Laundering (AML) Officer
Ms. Baumann also serves as AML Officer of other funds. She is Chief AML Officer (2012-present) and Senior Vice President (2014-present) of FMR LLC (diversified financial services company) and is an employee of Fidelity Investments. Previously, Ms. Baumann served as AML Officer of certain funds (2017-2019), as AML Officer of the funds (2012-2016), and Vice President (2007-2014) and Deputy Anti-Money Laundering Officer (2007-2012) of FMR LLC.
Craig S. Brown (1977)
Year of Election or Appointment: 2019
Assistant Treasurer
Mr. Brown also serves as Assistant Treasurer of other funds. Mr. Brown is an employee of Fidelity Investments (2013-present).
John J. Burke III (1964)
Year of Election or Appointment: 2018
Chief Financial Officer
Mr. Burke also serves as Chief Financial Officer of other funds. Mr. Burke serves as Head of Investment Operations for Fidelity Fund and Investment Operations (2018-present) and is an employee of Fidelity Investments (1998-present). Previously Mr. Burke served as head of Asset Management Investment Operations (2012-2018).
William C. Coffey (1969)
Year of Election or Appointment: 2019
Assistant Secretary
Mr. Coffey also serves as Assistant Secretary of other funds. He is Senior Vice President and Deputy General Counsel of FMR LLC (diversified financial services company, 2010-present), and is an employee of Fidelity Investments. Previously, Mr. Coffey served as Secretary and CLO of certain funds (2018-2019); CLO, Secretary, and Senior Vice President of Fidelity Management & Research Company and FMR Co., Inc. (investment adviser firms, 2018-2019); Secretary of Fidelity SelectCo, LLC and Fidelity Investments Money Management, Inc. (investment adviser firms, 2018-2019); CLO of Fidelity Management & Research (Hong Kong) Limited, FMR Investment Management (UK) Limited, and Fidelity Management & Research (Japan) Limited (investment adviser firms, 2018-2019); and Assistant Secretary of certain funds (2009-2018).
Timothy M. Cohen (1969)
Year of Election or Appointment: 2018
Vice President
Mr. Cohen also serves as Vice President of other funds. Mr. Cohen serves as Co-Head of Equity (2018-present), a Director of Fidelity Management & Research (Japan) Limited (investment adviser firm, 2016-present), and is an employee of Fidelity Investments. Previously, Mr. Cohen served as Executive Vice President of Fidelity SelectCo, LLC (2019), Head of Global Equity Research (2016-2018), Chief Investment Officer - Equity and a Director of Fidelity Management & Research (U.K.) Inc. (investment adviser firm, 2013-2015) and as a Director of Fidelity Management & Research (Hong Kong) Limited (investment adviser firm, 2017).
Jonathan Davis (1968)
Year of Election or Appointment: 2010
Assistant Treasurer
Mr. Davis also serves as Assistant Treasurer of other funds. Mr. Davis serves as Assistant Treasurer of FMR Capital, Inc. (2017-present) and is an employee of Fidelity Investments. Previously, Mr. Davis served as Vice President and Associate General Counsel of FMR LLC (diversified financial services company, 2003-2010).
Laura M. Del Prato (1964)
Year of Election or Appointment: 2018
Assistant Treasurer
Ms. Del Prato also serves as an officer of other funds. Ms. Del Prato is an employee of Fidelity Investments (2017-present). Previously, Ms. Del Prato served as President and Treasurer of The North Carolina Capital Management Trust: Cash Portfolio and Term Portfolio (2018-2020). Prior to joining Fidelity Investments, Ms. Del Prato served as a Managing Director and Treasurer of the JPMorgan Mutual Funds (2014-2017). Prior to JPMorgan, Ms. Del Prato served as a partner at Cohen Fund Audit Services (accounting firm, 2012-2013) and KPMG LLP (accounting firm, 2004-2012).
Colm A. Hogan (1973)
Year of Election or Appointment: 2020
Assistant Treasurer
Mr. Hogan also serves as an officer of other funds. Mr. Hogan serves as Assistant Treasurer of FMR Capital, Inc. (2017-present) and is an employee of Fidelity Investments (2005-present). Previously, Mr. Hogan served as Deputy Treasurer of certain Fidelity® funds (2016-2020) and Assistant Treasurer of certain Fidelity® funds (2016-2018).
Pamela R. Holding (1964)
Year of Election or Appointment: 2018
Vice President
Ms. Holding also serves as Vice President of other funds. Ms. Holding serves as Co-Head of Equity (2018-present) and is an employee of Fidelity Investments (2013-present). Previously, Ms. Holding served as Executive Vice President of Fidelity SelectCo, LLC (2019) and as Chief Investment Officer of Fidelity Institutional Asset Management (2013-2018).
Cynthia Lo Bessette (1969)
Year of Election or Appointment: 2019
Secretary and Chief Legal Officer (CLO)
Ms. Lo Bessette also serves as an officer of other funds. Ms. Lo Bessette serves as CLO, Secretary, and Senior Vice President of Fidelity Management & Research Company LLC (investment adviser firm, 2019-present); and CLO of Fidelity Management & Research (Hong Kong) Limited, FMR Investment Management (UK) Limited, and Fidelity Management & Research (Japan) Limited (investment adviser firms, 2019-present). She is a Senior Vice President and Deputy General Counsel of FMR LLC (diversified financial services company, 2019-present), and is an employee of Fidelity Investments. Previously, Ms. Lo Bessette served as CLO, Secretary, and Senior Vice President of FMR Co., Inc. (investment adviser firm, 2019); Secretary of Fidelity SelectCo, LLC and Fidelity Investments Money Management, Inc. (investment adviser firms, 2019). Prior to joining Fidelity Investments, Ms. Lo Bessette was Executive Vice President, General Counsel (2016-2019) and Senior Vice President, Deputy General Counsel (2015-2016) of OppenheimerFunds (investment management company) and Deputy Chief Legal Officer (2013-2015) of Jennison Associates LLC (investment adviser firm).
Chris Maher (1972)
Year of Election or Appointment: 2020
Deputy Treasurer
Mr. Maher also serves as an officer of other funds. Mr. Maher serves as Assistant Treasurer of FMR Capital, Inc. (2017-present), and is an employee of Fidelity Investments (2008-present). Previously, Mr. Maher served as Assistant Treasurer of certain funds (2013-2020); Vice President of Asset Management Compliance (2013), Vice President of the Program Management Group of FMR (investment adviser firm, 2010-2013), and Vice President of Valuation Oversight (2008-2010).
Jason P. Pogorelec (1975)
Year of Election or Appointment: 2020
Chief Compliance Officer
Mr. Pogorelec also serves as Chief Compliance Officer of other funds. Mr. Pogorelec is a senior Vice President of Asset Management Compliance for Fidelity Investments and is an employee of Fidelity Investments (2006-present). Previously, Mr. Pogorelec served as Vice President, Associate General Counsel for Fidelity Investments (2010-2020) and Assistant Secretary of certain Fidelity funds (2015-2020).
Stacie M. Smith (1974)
Year of Election or Appointment: 2016
President and Treasurer
Ms. Smith also serves as an officer of other funds. Ms. Smith serves as Assistant Treasurer of FMR Capital, Inc. (2017-present), is an employee of Fidelity Investments (2009-present), and has served in other fund officer roles. Prior to joining Fidelity Investments, Ms. Smith served as Senior Audit Manager of Ernst & Young LLP (accounting firm, 1996-2009). Previously, Ms. Smith served as Assistant Treasurer (2013-2019) and Deputy Treasurer (2013-2016) of certain Fidelity® funds.
Marc L. Spector (1972)
Year of Election or Appointment: 2016
Assistant Treasurer
Mr. Spector also serves as an officer of other funds. Mr. Spector serves as Assistant Treasurer of FMR Capital, Inc. (2017-present) and is an employee of Fidelity Investments (2016-present). Prior to joining Fidelity Investments, Mr. Spector served as Director at the Siegfried Group (accounting firm, 2013-2016), and prior to Siegfried Group as audit senior manager at Deloitte & Touche LLP (accounting firm, 2005-2013).
Jim Wegmann (1979)
Year of Election or Appointment: 2019
Assistant Treasurer
Mr. Wegmann also serves as Assistant Treasurer of other funds. Mr. Wegmann is an employee of Fidelity Investments (2011-present).
Shareholder Expense Example
As a shareholder, you incur two types of costs: (1) transaction costs, which may include sales charges (loads) on purchase payments or redemption proceeds, as applicable and (2) ongoing costs, which generally include management fees, distribution and/or service (12b-1) fees and other Fund expenses. This Example is intended to help you understand your ongoing costs (in dollars) of investing in a fund and to compare these costs with the ongoing costs of investing in other mutual funds.
The Example is based on an investment of $1,000 invested at the beginning of the period and held for the entire period (April 1, 2020 to September 30, 2020).
Actual Expenses
The first line of the accompanying table provides information about actual account values and actual expenses. You may use the information in this line, together with the amount you invested, to estimate the expenses that you paid over the period. Simply divide your account value by $1,000.00 (for example, an $8,600 account value divided by $1,000.00 = 8.6), then multiply the result by the number in the first line for a class/Fund under the heading entitled "Expenses Paid During Period" to estimate the expenses you paid on your account during this period. If any fund is a shareholder of any underlying mutual funds or exchange-traded funds (ETFs) (the Underlying Funds), such fund indirectly bears its proportional share of the expenses of the Underlying Funds in addition to the direct expenses incurred presented in the table. These fees and expenses are not included in the annualized expense ratio used to calculate the expense estimate in the table below.
Hypothetical Example for Comparison Purposes
The second line of the accompanying table provides information about hypothetical account values and hypothetical expenses based on the actual expense ratio and an assumed rate of return of 5% per year before expenses, which is not the actual return. The hypothetical account values and expenses may not be used to estimate the actual ending account balance or expenses you paid for the period. You may use this information to compare the ongoing costs of investing in the Fund and other funds. To do so, compare this 5% hypothetical example with the 5% hypothetical examples that appear in the shareholder reports of the other funds. If any fund is a shareholder of any Underlying Funds, such fund indirectly bears its proportional share of the expenses of the Underlying Funds in addition to the direct expenses as presented in the table. These fees and expenses are not included in the annualized expense ratio used to calculate the expense estimate in the table below.
Please note that the expenses shown in the table are meant to highlight your ongoing costs only and do not reflect any transaction costs. Therefore, the second line of the table is useful in comparing ongoing costs only, and will not help you determine the relative total costs of owning different funds.
| Annualized Expense Ratio-A | Beginning Account Value April 1, 2020 | Ending Account Value September 30, 2020 | Expenses Paid During Period-B April 1, 2020 to September 30, 2020 | |
| Fidelity Emerging Markets Equity Central Fund | .0394% | |||
| Actual | $1,000.00 | $1,353.40 | $.23 | |
| Hypothetical-C | $1,000.00 | $1,024.80 | $.20 |
A Annualized expense ratio reflects expenses net of applicable fee waivers.
B Expenses are equal to the annualized expense ratio, multiplied by the average account value over the period, multiplied by 183/ 366 (to reflect the one-half year period). The fees and expenses of any Underlying Funds are not included in each annualized expense ratio.
C 5% return per year before expenses
Distributions (Unaudited)
The fund designates a percentage of the dividends distributed during the fiscal year as qualifying for the dividends–received deduction for corporate shareholders:
| October 2019 | 0% |
| November 2019 | 0% |
| December 2019 | 0% |
| February 2020 | 1% |
| March 2020 | 1% |
| April 2020 | 1% |
| May 2020 | 1% |
| June 2019 | 1% |
| July 2019 | 1% |
| August 2019 | 1% |
| September 2019 | 1% |
A percentage of the dividends distributed during the fiscal year for the fund may be taken into account as a dividend for purposes of the maximum rate under section 1(h)(11) of the Internal Revenue Code:
| October 2019 | 52% |
| November 2019 | 52% |
| December 2019 | 64% |
| February 2020 | 76% |
| March 2020 | 76% |
| April 2020 | 76% |
| May 2020 | 76% |
| June 2019 | 76% |
| July 2019 | 76% |
| August 2019 | 76% |
| September 2019 | 76% |
The amounts per share which represent income derived from sources within, and taxes paid to, foreign countries or possessions of the United States are $1.5976 and $0.3476 for the dividend paid December 19, 2019.
The fund will notify shareholders in January 2021 of amounts for use in preparing 2020 income tax returns.
![]()
EMQ-ANN-1120
1.876933.111
Fidelity® Floating Rate Central Fund
September 30, 2020
See the inside front cover for important information about access to your fund’s shareholder reports.
Beginning on January 1, 2021, as permitted by regulations adopted by the Securities and Exchange Commission, paper copies of a fund’s shareholder reports will no longer be sent by mail, unless you specifically request paper copies of the reports from the fund or from your financial intermediary, such as a financial advisor, broker-dealer or bank. Instead, the reports will be made available on a website, and you will be notified by mail each time a report is posted and provided with a website link to access the report.
If you already elected to receive shareholder reports electronically, you will not be affected by this change and you need not take any action. You may elect to receive shareholder reports and other communications from a fund electronically, by contacting your financial intermediary. For Fidelity customers, visit Fidelity's web site or call Fidelity using the contact information listed below.
You may elect to receive all future reports in paper free of charge. If you wish to continue receiving paper copies of your shareholder reports, you may contact your financial intermediary or, if you are a Fidelity customer, visit Fidelity’s website, or call Fidelity at the applicable toll-free number listed below. Your election to receive reports in paper will apply to all funds held with the fund complex/your financial intermediary.
| Account Type | Website | Phone Number |
| Brokerage, Mutual Fund, or Annuity Contracts: | fidelity.com/mailpreferences | 1-800-343-3548 |
| Employer Provided Retirement Accounts: | netbenefits.fidelity.com/preferences (choose 'no' under Required Disclosures to continue to print) | 1-800-343-0860 |
| Advisor Sold Accounts Serviced Through Your Financial Intermediary: | Contact Your Financial Intermediary | Your Financial Intermediary's phone number |
| Advisor Sold Accounts Serviced by Fidelity: | institutional.fidelity.com | 1-877-208-0098 |
Contents
To view a fund's proxy voting guidelines and proxy voting record for the 12-month period ended June 30, visit http://www.fidelity.com/proxyvotingresults or visit the Securities and Exchange Commission's (SEC) web site at http://www.sec.gov.
You may also call 1-800-544-8544 to request a free copy of the proxy voting guidelines.
Standard & Poor's, S&P and S&P 500 are registered service marks of The McGraw-Hill Companies, Inc. and have been licensed for use by Fidelity Distributors Corporation.
Other third-party marks appearing herein are the property of their respective owners.
All other marks appearing herein are registered or unregistered trademarks or service marks of FMR LLC or an affiliated company. © 2020 FMR LLC. All rights reserved.
A fund files its complete schedule of portfolio holdings with the SEC for the first and third quarters of each fiscal year on Form N-PORT. Forms N-PORT are available on the SEC’s web site at http://www.sec.gov. A fund's Forms N-PORT may be reviewed and copied at the SEC’s Public Reference Room in Washington, DC. Information regarding the operation of the SEC's Public Reference Room may be obtained by calling 1-800-SEC-0330.
Note to Shareholders:
Early in 2020, the outbreak and spread of a new coronavirus emerged as a public health emergency that had a major influence on financial markets, primarily based on its impact on the global economy and the outlook for corporate earnings. The virus causes a respiratory disease known as COVID-19. On March 11, the World Health Organization declared the COVID-19 outbreak a pandemic, citing sustained risk of further global spread.
In the weeks following, as the crisis worsened, we witnessed an escalating human tragedy with wide-scale social and economic consequences from coronavirus-containment measures. The outbreak of COVID-19 prompted a number of measures to limit the spread, including travel and border restrictions, quarantines, and restrictions on large gatherings. In turn, these resulted in lower consumer activity, diminished demand for a wide range of products and services, disruption in manufacturing and supply chains, and – given the wide variability in outcomes regarding the outbreak – significant market uncertainty and volatility. Amid the turmoil, the U.S. government took unprecedented action – in concert with the U.S. Federal Reserve and central banks around the world – to help support consumers, businesses, and the broader economy, and to limit disruption to the financial system.
The situation continues to unfold, and the extent and duration of its impact on financial markets and the economy remain highly uncertain. Extreme events such as the coronavirus crisis are “exogenous shocks” that can have significant adverse effects on mutual funds and their investments. Although multiple asset classes may be affected by market disruption, the duration and impact may not be the same for all types of assets.
Fidelity is committed to helping you stay informed amid news about COVID-19 and during increased market volatility, and we’re taking extra steps to be responsive to customer needs. We encourage you to visit our websites, where we offer ongoing updates, commentary, and analysis on the markets and our funds.
Performance: The Bottom Line
Average annual total return reflects the change in the value of an investment, assuming reinvestment of distributions from dividend income and capital gains (the profits earned upon the sale of securities that have grown in value, if any) and assuming a constant rate of performance each year. The hypothetical investment and the average annual total returns do not reflect the deduction of taxes that a shareholder would pay on fund distributions or the redemption of fund shares. During periods of reimbursement by Fidelity, a fund’s total return will be greater than it would be had the reimbursement not occurred. How a fund did yesterday is no guarantee of how it will do tomorrow.
Average Annual Total Returns
| For the periods ended September 30, 2020 | Past 1 year | Past 5 years | Past 10 years |
| Fidelity® Floating Rate Central Fund | 0.42% | 4.38% | 5.28% |
$10,000 Over 10 Years
Let's say hypothetically that $10,000 was invested in Fidelity® Floating Rate Central Fund on September 30, 2010.
The chart shows how the value of your investment would have changed, and also shows how the S&P®/LSTA Leveraged Performing Loan Index performed over the same period.
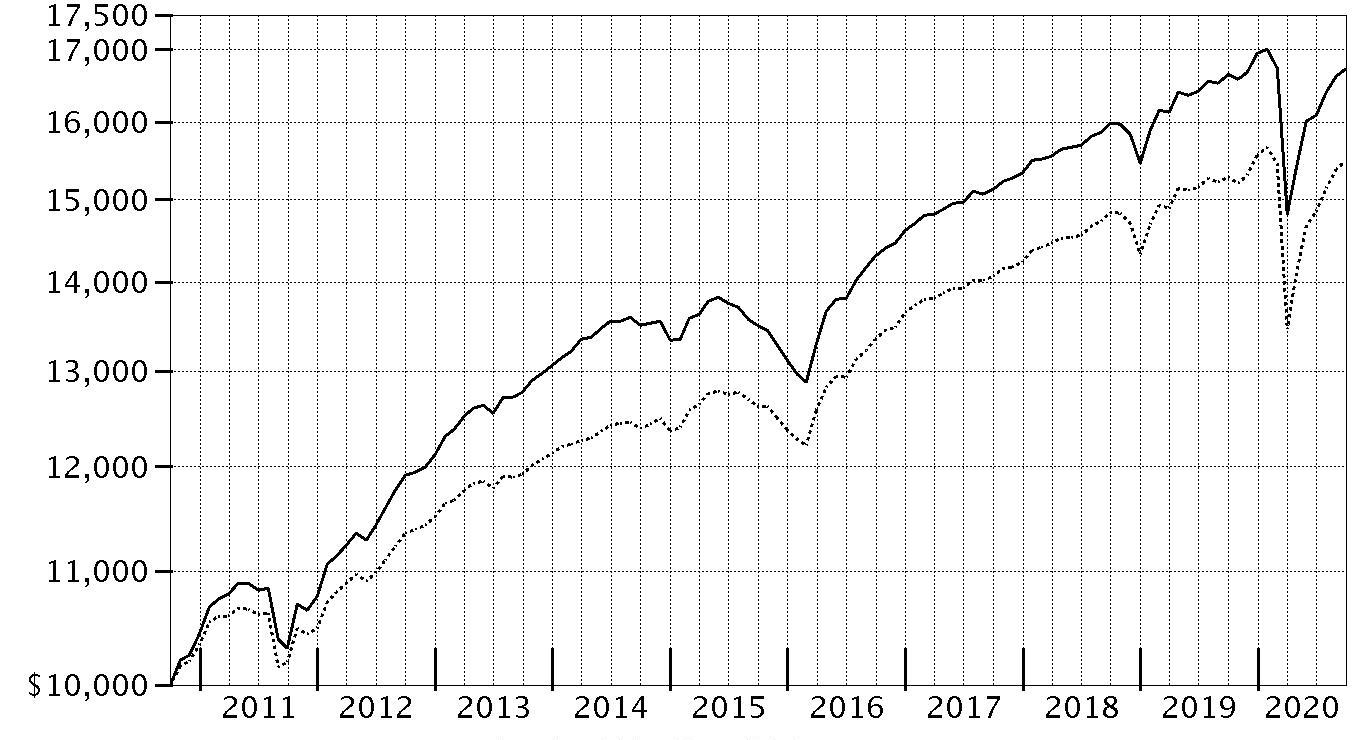
| Period Ending Values | ||
| $16,730 | Fidelity® Floating Rate Central Fund | |
| $15,493 | S&P®/LSTA Leveraged Performing Loan Index | |
Management's Discussion of Fund Performance
Market Recap: Floating-rate bank loans gained a meager 1.35% for the 12 months ending September 30, 2020, as measured by the S&P/LSTA® Leveraged Performing Loan Index, modestly lagging high-yield bonds but materially underperforming the broad investment-grade fixed-income market. Loans posted monthly gains early on, aided by strong corporate earnings growth and the announcement of a phase-one trade deal between the U.S. and China. Cracks began to appear in the favorable backdrop in January, leading to an eventual collapse in March, as intensifying investor anxiety about the outbreak and spread of COVID-19 sparked a global sell-off in risk assets. The loan market began to recover in late March and continued to rebound in April on hopes that massive government stimulus would be enough to offset the near-term economic fallout from the pandemic. The market rally moderated in June on concerns that a possible second wave of infections could slow progress toward the economy reopening. After posting solid gains in July and August, loans pulled back in September, due to an upsurge in virus cases in Europe, fading hope for more U.S. fiscal stimulus and uncertainty surrounding upcoming U.S. elections. Within the index, industry returns were mixed. More-defensive groups, such as food products (+9%), drugs (+7%) and telecom (+5%), handily outperformed, whereas oil & gas (-11%), leisure goods/activities/movies (-8%) and food service (-2%) suffered due to coronavirus-related lockdowns.Comments from Co-Portfolio Managers Eric Mollenhauer and Kevin Nielsen: For the fiscal year, the fund rose 0.42%, trailing the benchmark S&P/LSTA® Leveraged Performing Loan Index. The fund’s core bank loan portfolio, which comprised about 92% of assets, on average, modestly lagged the benchmark and, as a result, hampered relative performance. A cash stake of 4%, on average, was a further relative dampener. At the industry group level, security selection and an overweighting in oil & gas worked against relative performance. Conversely, picks among retailers added the most value versus the benchmark. Turning to individual holdings, falling oil prices placed heavy pressure on energy exploration & production company California Resources (-75%), and it was the biggest relative detractor. An out-of-benchmark equity stake in oil-field services provider Expro (-41%) fell victim to prolonged weakness in the offshore drilling market. On the plus side, major fund holding Bass Pro Shops (+18%) was the top relative contributor. The outdoor retailer reported solid quarterly financial results, driven by cost-saving measures and strong sales once its stores reopened. Avoiding benchmark member American Airlines (-24%) proved advantageous, as COVID-19 continued to weigh heavily on demand for air travel. Looking ahead, excluding oil & gas, we have a fairly positive intermediate-term view of corporate fundamentals and the market’s supply-and-demand backdrop.The views expressed above reflect those of the portfolio manager(s) only through the end of the period as stated on the cover of this report and do not necessarily represent the views of Fidelity or any other person in the Fidelity organization. Any such views are subject to change at any time based upon market or other conditions and Fidelity disclaims any responsibility to update such views. These views may not be relied on as investment advice and, because investment decisions for a Fidelity fund are based on numerous factors, may not be relied on as an indication of trading intent on behalf of any Fidelity fund.
Investment Summary (Unaudited)
Top Five Holdings as of September 30, 2020
| (by issuer, excluding cash equivalents) | % of fund's net assets |
| Bass Pro Shops LLC. | 2.4 |
| Intelsat Jackson Holdings SA | 2.2 |
| Asurion LLC | 1.9 |
| TransDigm, Inc. | 1.3 |
| Caesars Resort Collection LLC | 1.1 |
| 8.9 |
Top Five Market Sectors as of September 30, 2020
| % of fund's net assets | |
| Technology | 14.7 |
| Telecommunications | 8.9 |
| Services | 7.1 |
| Healthcare | 6.2 |
| Gaming | 6.2 |
Quality Diversification (% of fund's net assets)
| As of September 30, 2020 | ||
| BBB | 4.1% | |
| BB | 23.0% | |
| B | 58.3% | |
| CCC,CC,C | 5.0% | |
| D | 0.3% | |
| Not Rated | 5.5% | |
| Equities | 0.5% | |
| Short-Term Investments and Net Other Assets | 3.3% | |

We have used ratings from Moody's Investors Service, Inc. Where Moody's® ratings are not available, we have used S&P® ratings. All ratings are as of the date indicated and do not reflect subsequent changes.
Asset Allocation (% of fund's net assets)
| As of September 30, 2020* | ||
| Bank Loan Obligations | 92.7% | |
| Nonconvertible Bonds | 3.4% | |
| Convertible Bonds, Preferred Stocks | 0.1% | |
| Common Stocks | 0.4% | |
| Other Investments | 0.1% | |
| Short-Term Investments and Net Other Assets (Liabilities) | 3.3% | |

* Foreign investments - 12.2%
Schedule of Investments September 30, 2020
Showing Percentage of Net Assets
| Bank Loan Obligations - 92.7% | |||
| Principal Amount | Value | ||
| Aerospace - 1.6% | |||
| AI Convoy Luxembourg SARL Tranche B 1LN, term loan 3 month U.S. LIBOR + 3.500% 4.6501% 1/20/27 (a)(b)(c) | $5,373,000 | $5,332,703 | |
| Jazz Acquisition, Inc. 1LN, term loan 3 month U.S. LIBOR + 4.250% 4.4% 6/19/26 (a)(b)(c) | 866,250 | 744,975 | |
| TransDigm, Inc.: | |||
| Tranche E 1LN, term loan 3 month U.S. LIBOR + 2.250% 2.3966% 5/30/25 (a)(b)(c) | 3,121,730 | 2,945,758 | |
| Tranche F 1LN, term loan 3 month U.S. LIBOR + 2.250% 2.3966% 12/9/25 (a)(b)(c) | 11,417,011 | 10,774,804 | |
| Tranche G 1LN, term loan 3 month U.S. LIBOR + 2.250% 2.3966% 8/22/24 (a)(b)(c) | 6,068,105 | 5,733,692 | |
| WP CPP Holdings LLC: | |||
| Tranche B 1LN, term loan 3 month U.S. LIBOR + 3.500% 4.75% 4/30/25 (a)(b)(c) | 4,957,132 | 4,317,662 | |
| Tranche B 2LN, term loan 3 month U.S. LIBOR + 7.750% 8.75% 4/30/26 (a)(b)(c) | 1,000,000 | 766,250 | |
| TOTAL AEROSPACE | 30,615,844 | ||
| Air Transportation - 1.6% | |||
| Delta Air Lines, Inc. Tranche B, term loan 3 month U.S. LIBOR + 4.750% 5.75% 4/29/23 (a)(b)(c) | 1,870,313 | 1,865,637 | |
| Dynasty Acquisition Co., Inc.: | |||
| Tranche B 1LN, term loan 3 month U.S. LIBOR + 3.500% 3.7204% 4/8/26 (a)(b)(c) | 3,917,804 | 3,444,886 | |
| Tranche B2 1LN, term loan 3 month U.S. LIBOR + 3.500% 3.7204% 4/4/26 (a)(b)(c) | 2,106,346 | 1,852,089 | |
| JetBlue Airways Corp. Tranche B 1LN, term loan 3 month U.S. LIBOR + 5.250% 6.25% 6/17/24 (a)(b)(c) | 2,611,938 | 2,589,632 | |
| Mileage Plus Holdings LLC Tranche B 1LN, term loan 3 month U.S. LIBOR + 5.250% 6.25% 7/2/27 (a)(b)(c) | 6,580,000 | 6,682,385 | |
| SkyMiles IP Ltd. Tranche B 1LN, term loan 3 month U.S. LIBOR + 3.750% 9/16/27 (b)(c)(d) | 5,905,000 | 5,944,032 | |
| Transplace Holding, Inc. Tranche B 1LN, term loan 3 month U.S. LIBOR + 3.750% 4.75% 10/5/24 (a)(b)(c) | 3,404,984 | 3,341,140 | |
| WestJet Airlines Ltd. 1LN, term loan 3 month U.S. LIBOR + 2.750% 4% 12/11/26 (a)(b)(c) | 4,570,463 | 3,950,205 | |
| TOTAL AIR TRANSPORTATION | 29,670,006 | ||
| Automotive & Auto Parts - 0.4% | |||
| North American Lifting Holdings, Inc.: | |||
| 1LN, term loan 3 month U.S. LIBOR + 9.000% 10% 11/27/20 (a)(b)(c)(e) | 708,448 | 708,448 | |
| Tranche 1LN, term loan 3 month U.S. LIBOR + 6.500% 7.5% 11/27/20 (a)(b)(c) | 6,437,426 | 4,396,762 | |
| Tranche 2LN, term loan 3 month U.S. LIBOR + 9.000% 10% 11/27/21 (a)(b)(c) | 2,641,000 | 132,050 | |
| UOS LLC Tranche B 1LN, term loan 3 month U.S. LIBOR + 4.250% 4.4011% 4/18/25 (a)(b)(c) | 3,058,179 | 3,023,774 | |
| TOTAL AUTOMOTIVE & AUTO PARTS | 8,261,034 | ||
| Banks & Thrifts - 1.0% | |||
| Blackstone CQP Holdco LP Tranche B, term loan 3 month U.S. LIBOR + 3.500% 3.7254% 9/30/24 (a)(b)(c) | 5,668,150 | 5,539,200 | |
| Citadel Securities LP Tranche B 1LN, term loan 3 month U.S. LIBOR + 2.750% 2.8966% 2/27/26 (a)(b)(c) | 6,726,974 | 6,680,760 | |
| Deerfield Dakota Holding LLC Tranche B 1LN, term loan 3 month U.S. LIBOR + 3.750% 4.75% 4/9/27 (a)(b)(c) | 3,162,075 | 3,139,023 | |
| Russell Investments U.S. Institutional Holdco, Inc. Tranche B 1LN, term loan 3 month U.S. LIBOR + 2.750% 3.75% 6/1/23 (a)(b)(c) | 1,456,135 | 1,447,034 | |
| Victory Capital Holdings, Inc. Tranche B 1LN, term loan 3 month U.S. LIBOR + 2.500% 2.7985% 7/1/26 (a)(b)(c) | 1,575,843 | 1,550,897 | |
| TOTAL BANKS & THRIFTS | 18,356,914 | ||
| Broadcasting - 2.3% | |||
| AppLovin Corp.: | |||
| Tranche B 1LN, term loan 3 month U.S. LIBOR + 4.000% 4.1466% 8/15/25 (a)(b)(c) | 1,189,025 | 1,168,217 | |
| Tranche B, term loan 3 month U.S. LIBOR + 3.500% 3.6466% 8/15/25 (a)(b)(c) | 5,258,953 | 5,178,754 | |
| Cumulus Media New Holdings, Inc. Tranche B 1LN, term loan 3 month U.S. LIBOR + 3.750% 4.75% 3/31/26 (a)(b)(c) | 487,207 | 462,847 | |
| Diamond Sports Group LLC Tranche B 1LN, term loan 3 month U.S. LIBOR + 3.250% 3.4% 8/24/26 (a)(b)(c) | 12,558,150 | 9,690,748 | |
| Entercom Media Corp. Tranche B 2LN, term loan 3 month U.S. LIBOR + 2.500% 2.6448% 11/17/24 (a)(b)(c) | 2,884,344 | 2,707,678 | |
| iHeartCommunications, Inc. Tranche B 1LN, term loan 3 month U.S. LIBOR + 4.000% 4.75% 5/1/26 (a)(b)(c) | 1,635,900 | 1,571,822 | |
| ION Media Networks, Inc. Tranche B 1LN, term loan 3 month U.S. LIBOR + 3.000% 3.1875% 12/18/24 (a)(b)(c) | 3,850,999 | 3,832,552 | |
| Nexstar Broadcasting, Inc. Tranche B, term loan 3 month U.S. LIBOR + 2.750% 2.9051% 9/19/26 (a)(b)(c) | 7,897,169 | 7,712,928 | |
| Nielsen Finance LLC Tranche B5 1LN, term loan 3 month U.S. LIBOR + 3.750% 4.75% 6/4/25 (a)(b)(c) | 2,718,188 | 2,712,751 | |
| Sinclair Television Group, Inc. Tranche B 1LN, term loan 3 month U.S. LIBOR + 2.500% 2.65% 9/30/26 (a)(b)(c) | 2,397,959 | 2,333,214 | |
| Springer Nature Deutschland Gm Tranche B16 1LN, term loan 3 month U.S. LIBOR + 3.500% 4.5% 8/24/24 (a)(b)(c) | 4,461,159 | 4,421,187 | |
| Univision Communications, Inc. Tranche B 1LN, term loan 3 month U.S. LIBOR + 3.750% 4.75% 3/15/26 (a)(b)(c) | 1,765,972 | 1,716,154 | |
| TOTAL BROADCASTING | 43,508,852 | ||
| Building Materials - 1.3% | |||
| ACProducts, Inc. 1LN, term loan 3 month U.S. LIBOR + 6.500% 7.5% 8/13/25 (a)(b)(c) | 2,695,875 | 2,696,549 | |
| APi Group DE, Inc. Tranche B 1LN, term loan 3 month U.S. LIBOR + 2.500% 2.6466% 10/1/26 (a)(b)(c) | 4,962,500 | 4,854,963 | |
| GYP Holdings III Corp. Tranche B 1LN, term loan 3 month U.S. LIBOR + 2.750% 2.8966% 6/1/25 (a)(b)(c) | 1,765,942 | 1,731,948 | |
| Hamilton Holdco LLC Tranche B 1LN, term loan 3 month U.S. LIBOR + 2.000% 2.23% 1/4/27 (a)(b)(c) | 2,931,275 | 2,857,993 | |
| Ingersoll-Rand Services Co. Tranche B 1LN, term loan 3 month U.S. LIBOR + 1.750% 1.8966% 2/28/27 (a)(b)(c) | 4,512,325 | 4,355,657 | |
| LEB Holdings U.S.A., Inc. Tranche B 1LN, term loan 3 month U.S. LIBOR + 4.000% 9/25/27 (b)(c)(d) | 1,305,000 | 1,293,581 | |
| Traverse Midstream Partners Ll Tranche B, term loan 3 month U.S. LIBOR + 4.000% 5% 9/27/24 (a)(b)(c) | 3,209,500 | 2,940,704 | |
| Ventia Deco LLC Tranche B, term loan 3 month U.S. LIBOR + 4.000% 5% 5/21/26 (a)(b)(c)(e) | 4,349,451 | 4,295,083 | |
| TOTAL BUILDING MATERIALS | 25,026,478 | ||
| Cable/Satellite TV - 3.4% | |||
| Charter Communication Operating LLC Tranche B2 1LN, term loan 3 month U.S. LIBOR + 1.750% 1.9% 2/1/27 (a)(b)(c) | 20,704,904 | 20,205,709 | |
| Coral-U.S. Co.-Borrower LLC Tranche B, term loan 3 month U.S. LIBOR + 2.250% 2.3966% 1/31/28 (a)(b)(c) | 8,355,000 | 8,071,097 | |
| CSC Holdings LLC: | |||
| Tranche B 5LN, term loan 3 month U.S. LIBOR + 2.500% 2.6524% 4/15/27 (a)(b)(c) | 9,576,875 | 9,267,638 | |
| Tranche B3 1LN, term loan 3 month U.S. LIBOR + 2.250% 2.4024% 1/15/26 (a)(b)(c) | 1,970,000 | 1,900,636 | |
| LCPR Loan Financing LLC Tranche B 1LN, term loan 3 month U.S. LIBOR + 5.000% 5.1524% 10/22/26 (a)(b)(c) | 3,750,000 | 3,742,200 | |
| Neptune Finco Corp. Tranche B, term loan 3 month U.S. LIBOR + 2.250% 2.4024% 7/17/25 (a)(b)(c) | 4,790,392 | 4,626,129 | |
| Virgin Media Bristol LLC Tranche N, term loan 3 month U.S. LIBOR + 2.500% 2.6524% 1/31/28 (a)(b)(c) | 4,000,000 | 3,876,680 | |
| WideOpenWest Finance LLC Tranche B, term loan 3 month U.S. LIBOR + 3.250% 4.25% 8/19/23 (a)(b)(c) | 14,101,728 | 13,865,947 | |
| TOTAL CABLE/SATELLITE TV | 65,556,036 | ||
| Capital Goods - 0.6% | |||
| Altra Industrial Motion Corp. Tranche B 1LN, term loan 3 month U.S. LIBOR + 2.000% 2.1466% 10/1/25 (a)(b)(c) | 2,347,234 | 2,275,362 | |
| CPM Holdings, Inc.: | |||
| 2LN, term loan 3 month U.S. LIBOR + 8.250% 8.4051% 11/15/26 (a)(b)(c) | 645,000 | 586,950 | |
| Tranche B 1LN, term loan 3 month U.S. LIBOR + 3.750% 3.9051% 11/15/25 (a)(b)(c) | 2,097,638 | 1,951,453 | |
| MHI Holdings LLC Tranche B 1LN, term loan 3 month U.S. LIBOR + 5.000% 5.1466% 9/20/26 (a)(b)(c) | 3,726,850 | 3,708,216 | |
| Vertical U.S. Newco, Inc. Tranche B 1LN, term loan 3 month U.S. LIBOR + 4.250% 4.5666% 7/31/27 (a)(b)(c) | 2,175,000 | 2,154,425 | |
| TOTAL CAPITAL GOODS | 10,676,406 | ||
| Chemicals - 2.1% | |||
| ASP Chromaflo Dutch I BV Tranche B-2 1LN, term loan 3 month U.S. LIBOR + 3.500% 4.5% 11/18/23 (a)(b)(c) | 599,678 | 571,446 | |
| ASP Chromaflo Intermediate Holdings, Inc. Tranche B 1LN, term loan 3 month U.S. LIBOR + 3.500% 4.5% 11/18/23 (a)(b)(c) | 461,178 | 439,466 | |
| Consolidated Energy Finance SA Tranche B, term loan 3 month U.S. LIBOR + 2.500% 2.6562% 5/7/25 (a)(b)(c) | 7,820,000 | 7,106,425 | |
| Element Solutions, Inc. Tranche B 1LN, term loan 3 month U.S. LIBOR + 2.000% 2.1466% 1/31/26 (a)(b)(c) | 2,775,774 | 2,711,598 | |
| Emerald Performance Materials, LLC Tranche B 1LN, term loan 3 month U.S. LIBOR + 4.000% 5% 8/7/25 (a)(b)(c) | 1,750,000 | 1,742,353 | |
| GrafTech Finance, Inc. Tranche B 1LN, term loan 3 month U.S. LIBOR + 3.500% 2/12/25 (b)(c)(d) | 1,000,000 | 985,830 | |
| Hexion, Inc. Tranche B 1LN, term loan 3 month U.S. LIBOR + 3.500% 3.8% 7/1/26 (a)(b)(c) | 1,876,250 | 1,843,416 | |
| Messer Industries U.S.A., Inc. Tranche B 1LN, term loan 3 month U.S. LIBOR + 2.500% 2.7204% 3/1/26 (a)(b)(c) | 3,915,126 | 3,827,036 | |
| Oxea Corp. Tranche B2, term loan 3 month U.S. LIBOR + 3.500% 3.6875% 10/11/24 (a)(b)(c) | 5,317,098 | 5,095,535 | |
| SCIH Salt Holdings, Inc. Tranche B 1LN, term loan 3 month U.S. LIBOR + 4.500% 5.5% 3/16/27 (a)(b)(c) | 2,369,063 | 2,363,140 | |
| Starfruit U.S. Holdco LLC Tranche B, term loan 3 month U.S. LIBOR + 3.000% 3.1511% 10/1/25 (a)(b)(c) | 9,888,174 | 9,559,787 | |
| The Chemours Co. LLC Tranche B 1LN, term loan 3 month U.S. LIBOR + 1.750% 1.9% 4/3/25 (a)(b)(c) | 2,473,916 | 2,381,144 | |
| W. R. Grace & Co.-Conn.: | |||
| Tranche B 1LN, term loan 3 month U.S. LIBOR + 1.750% 1.9704% 4/3/25 (a)(b)(c) | 745,565 | 725,248 | |
| Tranche B 2LN, term loan 3 month U.S. LIBOR + 1.750% 1.9704% 4/3/25 (a)(b)(c) | 1,278,111 | 1,243,282 | |
| TOTAL CHEMICALS | 40,595,706 | ||
| Consumer Products - 0.4% | |||
| BCPE Empire Holdings, Inc.: | |||
| 1LN, term loan 3 month U.S. LIBOR + 4.000% 4.1466% 6/11/26 (a)(b)(c) | 1,447,405 | 1,406,400 | |
| Tranche DD 1LN, term loan 3 month U.S. LIBOR + 4.000% 4.1166% 6/11/26 (a)(b)(c)(f) | 286,169 | 278,062 | |
| Bombardier Recreational Products, Inc. Tranche B2 1LN, term loan 3 month U.S. LIBOR + 5.000% 6% 5/24/27 (a)(b)(c) | 4,165,000 | 4,197,987 | |
| Buzz Merger Sub Ltd. Tranche B 1LN, term loan 3 month U.S. LIBOR + 2.750% 2.8966% 1/29/27 (a)(b)(c) | 995,000 | 972,613 | |
| Rodan & Fields LLC Tranche B, term loan 3 month U.S. LIBOR + 4.000% 4.1524% 6/15/25 (a)(b)(c) | 1,798,600 | 1,221,555 | |
| TOTAL CONSUMER PRODUCTS | 8,076,617 | ||
| Containers - 3.2% | |||
| Berlin Packaging, LLC Tranche B 1LN, term loan 3 month U.S. LIBOR + 3.000% 3.1606% 11/7/25 (a)(b)(c) | 7,145,414 | 6,917,690 | |
| Berry Global, Inc.: | |||
| 1LN, term loan 3 month U.S. LIBOR + 2.000% 2.1555% 10/1/22 (a)(b)(c) | 5,099,973 | 5,051,371 | |
| Tranche Y 1LN, term loan 3 month U.S. LIBOR + 2.000% 2.1555% 7/1/26 (a)(b)(c) | 4,826,668 | 4,676,462 | |
| BWAY Holding Co. Tranche B, term loan 3 month U.S. LIBOR + 3.250% 3.5229% 4/3/24 (a)(b)(c) | 1,451,250 | 1,359,647 | |
| Canister International Group, Inc. 1LN, term loan 3 month U.S. LIBOR + 4.750% 4.8966% 12/21/26 (a)(b)(c) | 1,243,750 | 1,240,641 | |
| Charter Nex U.S., Inc.: | |||
| 1LN, term loan 3 month U.S. LIBOR + 3.250% 3.3966% 5/16/24 (a)(b)(c) | 1,161,290 | 1,131,050 | |
| Tranche B 1LN, term loan 3 month U.S. LIBOR + 3.000% 3.75% 5/16/24 (a)(b)(c) | 1,295,526 | 1,262,063 | |
| Consolidated Container Co. Tranche B 1LN, term loan 3 month U.S. LIBOR + 2.750% 3.75% 5/22/24 (a)(b)(c) | 1,017,333 | 1,005,888 | |
| Flex Acquisition Co., Inc.: | |||
| Tranche B 1LN, term loan 3 month U.S. LIBOR + 3.000% 4% 12/29/23 (a)(b)(c) | 6,641,497 | 6,483,761 | |
| Tranche B 1LN, term loan 3 month U.S. LIBOR + 3.250% 3.5461% 6/29/25 (a)(b)(c) | 7,296,851 | 7,068,824 | |
| Graham Packaging Co., Inc. 1LN, term loan 3 month U.S. LIBOR + 3.750% 4.5% 8/4/27 (a)(b)(c) | 5,630,000 | 5,590,140 | |
| Pixelle Specialty Solutions LLC Tranche B 1LN, term loan 3 month U.S. LIBOR + 6.500% 7.5% 10/31/24 (a)(b)(c) | 1,226,326 | 1,220,194 | |
| Pregis TopCo Corp. 1LN, term loan 3 month U.S. LIBOR + 3.750% 3.8966% 7/31/26 (a)(b)(c) | 2,090,983 | 2,058,573 | |
| Reynolds Consumer Products LLC Tranche B 1LN, term loan 3 month U.S. LIBOR + 1.750% 1.8966% 1/30/27 (a)(b)(c) | 4,777,753 | 4,712,059 | |
| Reynolds Group Holdings, Inc.: | |||
| Tranche B 1LN, term loan 3 month U.S. LIBOR + 3.250% 2/16/26 (b)(c)(d) | 4,125,000 | 4,046,625 | |
| Tranche B, term loan 3 month U.S. LIBOR + 2.750% 3.9794% 2/5/23 (a)(b)(c) | 7,043,630 | 6,949,456 | |
| TOTAL CONTAINERS | 60,774,444 | ||
| Diversified Financial Services - 3.7% | |||
| ACNR Holdings, Inc. term loan 14% 9/21/27 (a)(c)(e) | 3,678,269 | 3,678,269 | |
| AlixPartners LLP Tranche B, term loan 3 month U.S. LIBOR + 2.500% 2.6466% 4/4/24 (a)(b)(c) | 5,311,648 | 5,174,714 | |
| Alpine Finance Merger Sub LLC Tranche B, term loan 3 month U.S. LIBOR + 3.000% 4% 7/12/24 (a)(b)(c) | 4,656,256 | 4,586,412 | |
| Avolon TLB Borrower 1 (U.S.) LLC Tranche B3 1LN, term loan 3 month U.S. LIBOR + 1.750% 2.5% 1/15/25 (a)(b)(c) | 1,758,396 | 1,706,857 | |
| AVSC Holding Corp. Tranche B 1LN, term loan 3 month U.S. LIBOR + 4.500% 5.5% 10/15/26 (a)(b)(c) | 2,977,500 | 2,233,125 | |
| BCP Renaissance Parent LLC Tranche B, term loan 3 month U.S. LIBOR + 3.500% 4.5% 10/31/24 (a)(b)(c) | 3,434,014 | 3,175,399 | |
| Financial & Risk U.S. Holdings, Inc. Tranche B, term loan 3 month U.S. LIBOR + 3.250% 3.3966% 10/1/25 (a)(b)(c) | 13,381,871 | 13,236,142 | |
| Finco I LLC: | |||
| Tranche B 1LN, term loan 3 month U.S. LIBOR + 2.500% 2.6481% 6/27/25 (a)(b)(c) | 375,000 | 372,424 | |
| Tranche B, term loan 3 month U.S. LIBOR + 2.000% 2.1564% 12/27/22 (a)(b)(c) | 1,921,926 | 1,908,722 | |
| Fly Funding II SARL Tranche B 1LN, term loan 3 month U.S. LIBOR + 1.750% 1.99% 8/9/25 (a)(b)(c) | 5,117,562 | 4,401,103 | |
| Focus Financial Partners LLC Tranche B3 1LN, term loan 3 month U.S. LIBOR + 2.000% 2.1466% 7/3/24 (a)(b)(c) | 1,609,670 | 1,562,184 | |
| GT Polaris, Inc. Tranche B 1LN, term loan 3 month U.S. LIBOR + 4.000% 5% 8/4/27 (a)(b)(c) | 2,295,000 | 2,275,630 | |
| HarbourVest Partners LLC Tranche B 1LN, term loan 3 month U.S. LIBOR + 2.250% 2.525% 3/1/25 (a)(b)(c) | 4,598,075 | 4,529,104 | |
| Kingpin Intermediate Holdings LLC Tranche B 1LN, term loan 3 month U.S. LIBOR + 3.500% 4.5% 7/3/24 (a)(b)(c) | 1,207,826 | 1,026,277 | |
| KREF Holdings X LLC Tranche B 1LN, term loan 3 month U.S. LIBOR + 4.750% 5.75% 9/1/27 (a)(b)(c) | 2,655,000 | 2,641,725 | |
| Recess Holdings, Inc. Tranche B, term loan 3 month U.S. LIBOR + 3.750% 4.75% 9/29/24 (a)(b)(c) | 1,326,148 | 1,213,426 | |
| RPI Intermediate Finance Trust Tranche B 1LN, term loan 3 month U.S. LIBOR + 1.750% 1.8966% 2/11/27 (a)(b)(c) | 7,849,867 | 7,813,914 | |
| TransUnion LLC Tranche B5 1LN, term loan 3 month U.S. LIBOR + 1.750% 1.8966% 11/16/26 (a)(b)(c) | 7,011,383 | 6,826,213 | |
| UFC Holdings LLC Tranche B 1LN, term loan 3 month U.S. LIBOR + 3.250% 4.25% 4/29/26 (a)(b)(c) | 1,613,985 | 1,583,722 | |
| TOTAL DIVERSIFIED FINANCIAL SERVICES | 69,945,362 | ||
| Diversified Media - 1.1% | |||
| Allen Media LLC Tranche B 1LN, term loan 3 month U.S. LIBOR + 5.500% 5.7204% 2/10/27 (a)(b)(c) | 8,296,985 | 8,029,905 | |
| Lamar Media Corp. Tranche B 1LN, term loan 3 month U.S. LIBOR + 1.500% 1.6586% 1/30/27 (a)(b)(c) | 1,750,000 | 1,709,890 | |
| Terrier Media Buyer, Inc. Tranche B 1LN, term loan 3 month U.S. LIBOR + 4.250% 4.3966% 12/12/26 (a)(b)(c) | 10,783,177 | 10,502,059 | |
| TOTAL DIVERSIFIED MEDIA | 20,241,854 | ||
| Energy - 3.9% | |||
| Apro LLC Tranche B, term loan 3 month U.S. LIBOR + 4.000% 5% 11/14/26 (a)(b)(c) | 1,986,106 | 1,956,314 | |
| BCP Raptor II LLC Tranche B, term loan 3 month U.S. LIBOR + 4.750% 4.8966% 11/3/25 (a)(b)(c) | 4,937,500 | 3,439,808 | |
| BCP Raptor LLC Tranche B, term loan 3 month U.S. LIBOR + 4.250% 5.25% 6/24/24 (a)(b)(c) | 5,248,476 | 4,089,455 | |
| Brazos Delaware II LLC Tranche B, term loan 3 month U.S. LIBOR + 4.000% 4.1562% 5/21/25 (a)(b)(c) | 2,722,096 | 2,051,290 | |
| BW Gas & Convenience Holdings LLC Tranche B 1LN, term loan 3 month U.S. LIBOR + 6.250% 6.4% 11/18/24 (a)(b)(c) | 2,406,250 | 2,406,250 | |
| California Resources Corp.: | |||
| 2LN, term loan 3 month U.S. LIBOR + 9.000% 10% 1/15/21 (a)(b)(c)(e) | 6,467,403 | 6,467,403 | |
| Tranche 1LN, term loan 3 month U.S. LIBOR + 10.375% 11.375% 12/31/21 (a)(b)(c)(g) | 13,000,000 | 249,210 | |
| Tranche B, term loan 3 month U.S. LIBOR + 4.750% 5.75% 12/31/22 (a)(b)(c)(g) | 11,240,000 | 4,043,253 | |
| ChampionX Holding, Inc. Tranche B 1LN, term loan 3 month U.S. LIBOR + 5.000% 6% 6/3/27 (a)(b)(c) | 2,493,438 | 2,477,854 | |
| Chesapeake Energy Corp. term loan 3 month U.S. LIBOR + 8.000% 9% 6/9/24 (a)(b)(c)(g) | 3,375,000 | 2,361,454 | |
| Citgo Holding, Inc. Tranche B 1LN, term loan 3 month U.S. LIBOR + 7.000% 8% 8/1/23 (a)(b)(c) | 2,262,150 | 2,117,938 | |
| Citgo Petroleum Corp. Tranche B 1LN, term loan 3 month U.S. LIBOR + 5.000% 6% 3/28/24 (a)(b)(c) | 6,799,675 | 6,431,337 | |
| Delek U.S. Holdings, Inc. Tranche B 1LN, term loan 3 month U.S. LIBOR + 2.250% 2.3966% 3/31/25 (a)(b)(c) | 1,529,442 | 1,442,141 | |
| EG America LLC: | |||
| 2LN, term loan 3 month U.S. LIBOR + 8.000% 9% 3/23/26 (a)(b)(c) | 739,117 | 708,939 | |
| Tranche B 1LN, term loan 3 month U.S. LIBOR + 4.000% 4.2204% 2/6/25 (a)(b)(c) | 2,465,356 | 2,411,808 | |
| Epic Crude Services LP Tranche B 1LN, term loan 3 month U.S. LIBOR + 5.000% 5.26% 3/1/26 (a)(b)(c) | 4,130,000 | 2,911,650 | |
| Gavilan Resources LLC Tranche 2LN, term loan 3 month U.S. LIBOR + 6.000% 0% 3/1/24 (b)(c)(g) | 8,225,000 | 20,563 | |
| GIP III Stetson I LP Tranche B, term loan 3 month U.S. LIBOR + 4.250% 4.3948% 7/18/25 (a)(b)(c) | 9,537,304 | 6,239,495 | |
| Gulf Finance LLC Tranche B 1LN, term loan 3 month U.S. LIBOR + 5.250% 6.25% 8/25/23 (a)(b)(c) | 3,927,648 | 2,759,173 | |
| Hamilton Projs. Acquiror LLC Tranche B 1LN, term loan 3 month U.S. LIBOR + 4.750% 5.75% 6/17/27 (a)(b)(c) | 4,778,025 | 4,760,107 | |
| Lower Cadence Holdings LLC Tranche B 1LN, term loan 3 month U.S. LIBOR + 4.000% 4.1466% 5/22/26 (a)(b)(c) | 2,521,092 | 2,323,187 | |
| Matador Bidco SARL Tranche B 1LN, term loan 3 month U.S. LIBOR + 4.750% 4.8966% 10/15/26 (a)(b)(c) | 995,000 | 963,160 | |
| Medallion Midland Acquisition Tranche B, term loan 3 month U.S. LIBOR + 3.250% 4.25% 10/30/24 (a)(b)(c) | 395,721 | 371,780 | |
| Natgasoline LLC Tranche B, term loan 3 month U.S. LIBOR + 3.500% 3.8125% 11/14/25 (a)(b)(c) | 4,101,938 | 3,896,841 | |
| Rockwood Service Corp. Tranche B 1LN, term loan 3 month U.S. LIBOR + 4.250% 4.3966% 1/23/27 (a)(b)(c) | 5,395,681 | 5,348,468 | |
| Terra-Gen Finance Co. LLC Tranche B, term loan 3 month U.S. LIBOR + 4.250% 5.25% 12/9/21 (a)(b)(c) | 3,072,916 | 3,011,458 | |
| TOTAL ENERGY | 75,260,336 | ||
| Entertainment/Film - 0.1% | |||
| SMG U.S. Midco 2, Inc. 1LN, term loan 3 month U.S. LIBOR + 2.500% 2.7274% 1/23/25 (a)(b)(c) | 2,409,756 | 2,096,488 | |
| Environmental - 0.1% | |||
| Tunnel Hill Partners LP Tranche B 1LN, term loan 3 month U.S. LIBOR + 3.500% 3.6466% 2/8/26 (a)(b)(c) | 1,295,275 | 1,243,464 | |
| WTG Holdings III Corp. Tranche B 1LN, term loan 3 month U.S. LIBOR + 2.750% 2.8966% 12/20/24 (a)(b)(c) | 1,090,397 | 1,071,653 | |
| TOTAL ENVIRONMENTAL | 2,315,117 | ||
| Food & Drug Retail - 2.5% | |||
| Agro Merchants Intermediate Holdings LP Tranche B, term loan 3 month U.S. LIBOR + 3.750% 4.75% 12/6/24 (a)(b)(c) | 2,841,931 | 2,777,987 | |
| BellRing Brands, Inc. Tranche B 1LN, term loan 3 month U.S. LIBOR + 5.000% 6% 10/10/24 (a)(b)(c) | 2,887,500 | 2,888,713 | |
| BI-LO LLC Tranche B, term loan 3 month U.S. LIBOR + 8.000% 9% 5/31/24 (a)(b)(c) | 13,685,000 | 13,662,146 | |
| Froneri U.S., Inc. Tranche B 1LN, term loan 3 month U.S. LIBOR + 2.250% 2.3966% 1/30/27 (a)(b)(c) | 4,558,575 | 4,371,354 | |
| GOBP Holdings, Inc. Tranche B 1LN, term loan 3 month U.S. LIBOR + 2.750% 2.9011% 10/22/25 (a)(b)(c) | 1,541,044 | 1,513,428 | |
| JBS U.S.A. Lux SA Tranche B 1LN, term loan 3 month U.S. LIBOR + 2.000% 2.1466% 5/1/26 (a)(b)(c) | 10,353,665 | 10,058,586 | |
| JP Intermediate B LLC Tranche B, term loan 3 month U.S. LIBOR + 5.500% 6.5% 11/20/25 (a)(b)(c) | 1,659,406 | 1,445,757 | |
| Lannett Co., Inc.: | |||
| Tranche B, term loan 3 month U.S. LIBOR + 5.000% 6% 11/25/20 (a)(b)(c) | 71,907 | 70,708 | |
| Tranche B, term loan 3 month U.S. LIBOR + 5.370% 6.375% 11/25/22 (a)(b)(c) | 10,323,836 | 10,091,549 | |
| TOTAL FOOD & DRUG RETAIL | 46,880,228 | ||
| Food/Beverage/Tobacco - 1.4% | |||
| 8th Avenue Food & Provisions, Inc.: | |||
| 2LN, term loan 3 month U.S. LIBOR + 7.750% 7.9005% 10/1/26 (a)(b)(c) | 410,000 | 403,338 | |
| Tranche B 1LN, term loan 3 month U.S. LIBOR + 3.500% 3.6505% 10/1/25 (a)(b)(c) | 1,179,000 | 1,166,479 | |
| Atkins Nutritional Holdings II, Inc. Tranche B 1LN, term loan 3 month U.S. LIBOR + 3.750% 4.75% 7/7/24 (a)(b)(c) | 2,692,668 | 2,694,364 | |
| Chobani LLC Tranche B, term loan 3 month U.S. LIBOR + 3.500% 4.5% 10/7/23 (a)(b)(c) | 9,348,253 | 9,231,399 | |
| EG Finco Ltd. Tranche B, term loan 3 month U.S. LIBOR + 4.000% 4.2204% 2/6/25 (a)(b)(c) | 1,408,875 | 1,378,274 | |
| Saffron Borrowco LLC Tranche B 1LN, term loan 3 month U.S. LIBOR + 6.750% 6.8966% 6/20/25 (a)(b)(c) | 1,229,688 | 1,229,688 | |
| Shearer's Foods, Inc. Tranche B 1LN, term loan 3 month U.S. LIBOR + 4.000% 4.75% 9/14/27 (a)(b)(c) | 3,577,038 | 3,547,992 | |
| U.S. Foods, Inc.: | |||
| 1LN, term loan 3 month U.S. LIBOR + 2.000% 2.1466% 9/13/26 (a)(b)(c) | 3,586,269 | 3,418,180 | |
| Tranche B, term loan 3 month U.S. LIBOR + 1.750% 1.8966% 6/27/23 (a)(b)(c) | 2,845,424 | 2,731,607 | |
| TOTAL FOOD/BEVERAGE/TOBACCO | 25,801,321 | ||
| Gaming - 5.8% | |||
| Affinity Gaming LLC Tranche B, term loan 3 month U.S. LIBOR + 3.250% 4.25% 7/1/23 (a)(b)(c) | 1,840,549 | 1,640,389 | |
| AP Gaming I LLC Tranche B, term loan 3 month U.S. LIBOR + 3.500% 4.5% 2/15/24 (a)(b)(c) | 1,762,798 | 1,551,262 | |
| Aristocrat International Pty Ltd. Tranche B 1LN, term loan 3 month U.S. LIBOR + 3.750% 4.75% 10/19/24 (a)(b)(c) | 1,092,263 | 1,085,097 | |
| Aristocrat Technologies, Inc. Tranche B 3LN, term loan 3 month U.S. LIBOR + 1.750% 2.0214% 10/19/24 (a)(b)(c) | 1,435,371 | 1,393,803 | |
| Boyd Gaming Corp. Tranche B 1LN, term loan 3 month U.S. LIBOR + 2.250% 2.356% 9/15/23 (a)(b)(c) | 1,816,252 | 1,763,781 | |
| Caesars Growth Properties Holdings LLC Tranche B 1LN, term loan 3 month U.S. LIBOR + 4.500% 4.6883% 6/19/25 (a)(b)(c) | 14,000,000 | 13,529,460 | |
| Caesars Resort Collection LLC Tranche B 1LN, term loan 3 month U.S. LIBOR + 2.750% 2.8966% 12/22/24 (a)(b)(c) | 23,470,757 | 21,931,545 | |
| CityCenter Holdings LLC Tranche B, term loan 3 month U.S. LIBOR + 2.250% 3% 4/18/24 (a)(b)(c) | 5,338,561 | 5,113,007 | |
| Gaming VC Holdings SA Tranche B3 1LN, term loan 3 month U.S. LIBOR + 2.250% 3.25% 3/16/24 (a)(b)(c) | 3,980,425 | 3,910,768 | |
| Golden Entertainment, Inc. Tranche B, term loan 3 month U.S. LIBOR + 3.000% 3.75% 10/20/24 (a)(b)(c) | 8,663,123 | 8,284,112 | |
| Golden Nugget, Inc. Tranche B 1LN, term loan 3 month U.S. LIBOR + 2.500% 3.25% 10/4/23 (a)(b)(c) | 13,880,062 | 12,338,542 | |
| Mohegan Tribal Gaming Authority Tranche B, term loan 3 month U.S. LIBOR + 6.370% 7.375% 10/14/23 (a)(b)(c) | 2,040,468 | 1,812,609 | |
| PCI Gaming Authority 1LN, term loan 3 month U.S. LIBOR + 2.500% 2.6466% 5/29/26 (a)(b)(c) | 2,538,198 | 2,460,986 | |
| Penn National Gaming, Inc. Tranche B, term loan 3 month U.S. LIBOR + 2.250% 3% 10/15/25 (a)(b)(c) | 3,586,866 | 3,480,551 | |
| Playtika Holding Corp. Tranche B 1LN, term loan 3 month U.S. LIBOR + 6.000% 7% 12/10/24 (a)(b)(c) | 6,625,208 | 6,622,757 | |
| Scientific Games Corp. Tranche B 5LN, term loan 3 month U.S. LIBOR + 2.750% 3.4713% 8/14/24 (a)(b)(c) | 5,138,117 | 4,822,688 | |
| Stars Group Holdings BV Tranche B, term loan 3 month U.S. LIBOR + 3.500% 3.7204% 7/10/25 (a)(b)(c) | 6,271,892 | 6,250,567 | |
| Station Casinos LLC Tranche B 1LN, term loan 3 month U.S. LIBOR + 2.250% 2.5% 2/7/27 (a)(b)(c) | 9,083,528 | 8,665,686 | |
| Twin River Worldwide Holdings, Inc. Tranche B 1LN, term loan 3 month U.S. LIBOR + 8.000% 9% 5/10/26 (a)(b)(c) | 3,082,275 | 3,247,947 | |
| TOTAL GAMING | 109,905,557 | ||
| Healthcare - 5.8% | |||
| Aldevron LLC 1LN, term loan 3 month U.S. LIBOR + 4.250% 5.25% 10/11/26 (a)(b)(c) | 8,265,969 | 8,262,497 | |
| American Renal Holdings, Inc. Tranche B, term loan 3 month U.S. LIBOR + 5.000% 5.1466% 6/22/24 (a)(b)(c) | 5,612,872 | 5,402,389 | |
| Da Vinci Purchaser Corp. Tranche B 1LN, term loan 3 month U.S. LIBOR + 4.000% 5.2382% 12/13/26 (a)(b)(c) | 4,618,425 | 4,556,861 | |
| Elanco Animal Health, Inc. Tranche B 1LN, term loan 3 month U.S. LIBOR + 1.750% 1.9051% 8/1/27 (a)(b)(c) | 12,207,602 | 11,851,507 | |
| HCA Holdings, Inc.: | |||
| Tranche B12 1LN, term loan 3 month U.S. LIBOR + 1.750% 1.8966% 3/13/25 (a)(b)(c) | 10,726,650 | 10,667,224 | |
| Tranche B13, term loan 3 month U.S. LIBOR + 1.750% 1.8966% 3/18/26 (a)(b)(c) | 655,997 | 652,441 | |
| MED ParentCo LP: | |||
| 1LN, term loan 3 month U.S. LIBOR + 4.250% 4.3966% 8/31/26 (a)(b)(c) | 2,800,986 | 2,655,923 | |
| 2LN, term loan 3 month U.S. LIBOR + 8.250% 8.3966% 8/30/27 (a)(b)(c) | 1,310,000 | 1,205,200 | |
| Tranche DD 1LN, term loan 3 month U.S. LIBOR + 4.250% 4.3526% 8/31/26 (a)(b)(c)(f) | 704,654 | 668,160 | |
| Milano Acquisition Corp. Tranche B 1LN, term loan 3 month U.S. LIBOR + 4.000% 8/17/27 (b)(c)(d) | 10,390,000 | 10,260,125 | |
| MPH Acquisition Holdings LLC Tranche B, term loan 3 month U.S. LIBOR + 2.750% 3.75% 6/7/23 (a)(b)(c) | 4,398,916 | 4,323,519 | |
| Ortho-Clinical Diagnostics, Inc. Tranche B 1LN, term loan 3 month U.S. LIBOR + 3.250% 3.4056% 6/30/25 (a)(b)(c) | 2,762,663 | 2,639,725 | |
| Packaging Coordinators Midco, Inc. Tranche B 1LN, term loan 3 month U.S. LIBOR + 3.750% 9/25/27 (b)(c)(d) | 2,715,000 | 2,699,742 | |
| Pathway Vet Alliance LLC: | |||
| 1LN, term loan 3 month U.S. LIBOR + 4.000% 3/31/27 (b)(c)(d)(f) | 258,187 | 253,863 | |
| Tranche B 1LN, term loan 3 month U.S. LIBOR + 4.000% 4.1466% 3/31/27 (a)(b)(c) | 3,160,929 | 3,107,983 | |
| Radiology Partners, Inc. Tranche B 1LN, term loan 3 month U.S. LIBOR + 4.250% 7/9/25 (b)(c)(d) | 490,000 | 468,685 | |
| RegionalCare Hospital Partners Holdings, Inc. Tranche B, term loan 3 month U.S. LIBOR + 3.750% 3.8966% 11/16/25 (a)(b)(c) | 3,299,069 | 3,200,097 | |
| Surgery Center Holdings, Inc.: | |||
| 1LN, term loan 3 month U.S. LIBOR + 8.000% 9% 8/31/24 (a)(b)(c) | 746,250 | 752,780 | |
| Tranche B, term loan 3 month U.S. LIBOR + 3.250% 4.25% 8/31/24 (a)(b)(c) | 550,022 | 517,021 | |
| U.S. Anesthesia Partners, Inc. Tranche B, term loan 3 month U.S. LIBOR + 3.000% 4% 6/23/24 (a)(b)(c) | 4,053,964 | 3,820,861 | |
| U.S. Renal Care, Inc. Tranche B 1LN, term loan 3 month U.S. LIBOR + 5.000% 5.1466% 6/13/26 (a)(b)(c) | 8,667,481 | 8,431,292 | |
| Upstream Newco, Inc. 1LN, term loan 3 month U.S. LIBOR + 4.500% 4.6466% 11/20/26 (a)(b)(c) | 1,741,250 | 1,632,422 | |
| Valeant Pharmaceuticals International, Inc.: | |||
| Tranche B 2LN, term loan 3 month U.S. LIBOR + 2.750% 2.9011% 11/27/25 (a)(b)(c) | 6,442,353 | 6,281,294 | |
| Tranche B, term loan 3 month U.S. LIBOR + 3.000% 3.1511% 6/1/25 (a)(b)(c) | 1,757,697 | 1,720,715 | |
| VVC Holding Corp. Tranche B 1LN, term loan 3 month U.S. LIBOR + 4.500% 4.7502% 2/11/26 (a)(b)(c) | 11,591,738 | 11,388,883 | |
| Wink Holdco, Inc. Tranche B, term loan 3 month U.S. LIBOR + 3.000% 4% 12/1/24 (a)(b)(c) | 3,639,526 | 3,625,878 | |
| TOTAL HEALTHCARE | 111,047,087 | ||
| Homebuilders/Real Estate - 1.6% | |||
| DTZ U.S. Borrower LLC Tranche B 1LN, term loan 3 month U.S. LIBOR + 2.750% 2.8966% 8/21/25 (a)(b)(c) | 9,334,344 | 8,980,945 | |
| Landry's Finance Acquisition Co. Tranche B 1LN, term loan 3 month U.S. LIBOR + 12.000% 13% 10/4/23 (a)(b)(c) | 1,250,000 | 1,412,500 | |
| Lightstone Holdco LLC: | |||
| Tranche B 1LN, term loan 3 month U.S. LIBOR + 3.750% 4.75% 1/30/24 (a)(b)(c) | 4,512,428 | 3,882,132 | |
| Tranche C 1LN, term loan 3 month U.S. LIBOR + 3.750% 4.75% 1/30/24 (a)(b)(c) | 254,508 | 218,958 | |
| Ryan Specialty Group LLC Tranche B 1LN, term loan 3 month U.S. LIBOR + 3.250% 4% 7/23/27 (a)(b)(c) | 4,620,000 | 4,570,936 | |
| VICI Properties, LLC Tranche B 1LN, term loan 3 month U.S. LIBOR + 1.750% 1.9058% 12/22/24 (a)(b)(c) | 12,500,682 | 12,061,783 | |
| TOTAL HOMEBUILDERS/REAL ESTATE | 31,127,254 | ||
| Hotels - 1.5% | |||
| Aimbridge Acquisition Co., Inc.: | |||
| Tranche B 1LN, term loan 3 month U.S. LIBOR + 6.000% 2/1/26 (b)(c)(d) | 1,235,000 | 1,210,300 | |
| Tranche B, term loan 3 month U.S. LIBOR + 3.750% 3.8948% 2/1/26 (a)(b)(c) | 3,232,300 | 2,876,747 | |
| Four Seasons Holdings, Inc. Tranche B, term loan 3 month U.S. LIBOR + 2.000% 2.1466% 11/30/23 (a)(b)(c) | 7,816,909 | 7,592,173 | |
| Hilton Worldwide Finance LLC Tranche B 1LN, term loan 3 month U.S. LIBOR + 1.750% 1.8981% 6/21/26 (a)(b)(c) | 2,792,849 | 2,691,273 | |
| Marriott Ownership Resorts, Inc. Tranche B 1LN, term loan 3 month U.S. LIBOR + 1.750% 1.8966% 8/31/25 (a)(b)(c) | 3,822,018 | 3,645,250 | |
| Travelport Finance Luxembourg SARL 1LN, term loan: | |||
| 3 month U.S. LIBOR + 5.000% 5.2203% 5/30/26 (a)(b)(c) | 4,650,458 | 3,487,843 | |
| 3 month U.S. LIBOR + 7.000% 9% 2/28/25 (a)(b)(c) | 3,276,777 | 3,143,674 | |
| Wyndham Hotels & Resorts, Inc. Tranche B, term loan 3 month U.S. LIBOR + 1.750% 1.8966% 5/30/25 (a)(b)(c) | 3,683,700 | 3,546,703 | |
| TOTAL HOTELS | 28,193,963 | ||
| Insurance - 5.0% | |||
| Acrisure LLC Tranche B 1LN, term loan 3 month U.S. LIBOR + 3.500% 3.6466% 2/13/27 (a)(b)(c) | 7,901,825 | 7,615,384 | |
| Alliant Holdings Intermediate LLC: | |||
| Tranche B, term loan 3 month U.S. LIBOR + 2.750% 2.8966% 5/10/25 (a)(b)(c) | 7,196,584 | 6,979,823 | |
| Tranche B-2 1LN, term loan 3 month U.S. LIBOR + 3.250% 3.4011% 5/9/25 (a)(b)(c) | 987,500 | 968,570 | |
| AmeriLife Holdings LLC: | |||
| 1LN, term loan 3 month U.S. LIBOR + 4.000% 4.0827% 3/18/27 (a)(b)(c)(f) | 306,977 | 302,372 | |
| Tranche B 1LN, term loan 3 month U.S. LIBOR + 4.000% 4.1551% 3/18/27 (a)(b)(c) | 4,875,395 | 4,802,264 | |
| Tranche B 2LN, term loan 3 month U.S. LIBOR + 8.500% 9.5% 3/18/28 (a)(b)(c)(e) | 655,000 | 641,900 | |
| AmWINS Group, Inc. Tranche B 1LN, term loan 3 month U.S. LIBOR + 2.750% 3.75% 1/25/24 (a)(b)(c) | 8,714,772 | 8,625,620 | |
| AssuredPartners, Inc. Tranche B 1LN, term loan 3 month U.S. LIBOR + 3.500% 3.6466% 2/13/27 (a)(b)(c) | 3,096,600 | 3,002,587 | |
| Asurion LLC: | |||
| Tranche B 6LN, term loan 3 month U.S. LIBOR + 3.000% 3.1466% 11/3/23 (a)(b)(c) | 5,326,909 | 5,242,584 | |
| Tranche B 7LN, term loan 3 month U.S. LIBOR + 3.000% 3.1466% 11/3/24 (a)(b)(c) | 6,842,500 | 6,718,514 | |
| Tranche B, term loan: | |||
| 3 month U.S. LIBOR + 3.000% 3.1466% 8/4/22 (a)(b)(c) | 9,912,287 | 9,786,302 | |
| 3 month U.S. LIBOR + 6.500% 6.6466% 8/4/25 (a)(b)(c) | 13,517,879 | 13,520,718 | |
| HUB International Ltd. Tranche B, term loan: | |||
| 3 month U.S. LIBOR + 3.000% 3.2634% 4/25/25 (a)(b)(c) | 14,154,774 | 13,662,046 | |
| 3 month U.S. LIBOR + 4.000% 5% 4/25/25 (a)(b)(c) | 4,386,850 | 4,366,276 | |
| USI, Inc.: | |||
| 1LN, term loan 3 month U.S. LIBOR + 4.000% 4.2204% 12/2/26 (a)(b)(c) | 496,250 | 490,459 | |
| Tranche B, term loan 3 month U.S. LIBOR + 3.000% 3.2204% 5/16/24 (a)(b)(c) | 9,866,879 | 9,529,727 | |
| TOTAL INSURANCE | 96,255,146 | ||
| Leisure - 2.3% | |||
| Alterra Mountain Co. Tranche B 1LN, term loan: | |||
| 3 month U.S. LIBOR + 2.750% 2.8966% 7/31/24 (a)(b)(c) | 1,993,685 | 1,918,084 | |
| 3 month U.S. LIBOR + 4.500% 5.5% 8/3/26 (a)(b)(c) | 1,447,725 | 1,429,628 | |
| Callaway Golf Co. Tranche B, term loan 3 month U.S. LIBOR + 3.500% 4.6505% 1/4/26 (a)(b)(c) | 2,744,438 | 2,746,715 | |
| Carnival Corp. Tranche B 1LN, term loan 3 month U.S. LIBOR + 7.500% 8.5% 6/30/25 (a)(b)(c) | 2,952,600 | 2,982,953 | |
| Crown Finance U.S., Inc. Tranche B 1LN, term loan: | |||
| 3 month U.S. LIBOR + 2.250% 2.5193% 2/28/25 (a)(b)(c) | 6,914,338 | 4,571,138 | |
| 3 month U.S. LIBOR + 2.500% 3.0193% 9/30/26 (a)(b)(c) | 2,351,250 | 1,544,771 | |
| Delta 2 SARL Tranche B, term loan 3 month U.S. LIBOR + 2.500% 3.5% 2/1/24 (a)(b)(c) | 10,969,747 | 10,617,838 | |
| Equinox Holdings, Inc.: | |||
| Tranche 2LN, term loan 3 month U.S. LIBOR + 7.000% 8% 9/8/24 (a)(b)(c) | 1,000,000 | 599,580 | |
| Tranche B-1, term loan 3 month U.S. LIBOR + 3.000% 4% 3/8/24 (a)(b)(c) | 3,382,850 | 2,584,091 | |
| Herschend Entertainment Co. LLC Tranche B 1LN, term loan 3 month U.S. LIBOR + 5.750% 6.75% 8/18/25 (a)(b)(c) | 1,590,000 | 1,518,450 | |
| LTF Merger Sub, Inc. Tranche B, term loan 3 month U.S. LIBOR + 2.750% 3.75% 6/10/22 (a)(b)(c) | 4,849,030 | 4,392,397 | |
| Seminole Tribe of Florida Tranche B, term loan 3 month U.S. LIBOR + 1.750% 1.8966% 7/6/24 (a)(b)(c) | 3,432,971 | 3,351,438 | |
| SP PF Buyer LLC Tranche B 1LN, term loan 3 month U.S. LIBOR + 4.500% 4.6466% 12/21/25 (a)(b)(c) | 2,706,889 | 2,433,954 | |
| United PF Holdings LLC: | |||
| 1LN, term loan 3 month U.S. LIBOR + 4.000% 4.2204% 12/30/26 (a)(b)(c) | 2,757,585 | 2,402,546 | |
| 2LN, term loan 3 month U.S. LIBOR + 8.500% 8.7204% 12/30/27 (a)(b)(c)(e) | 750,000 | 600,000 | |
| Tranche B 1LN, term loan 3 month U.S. LIBOR + 8.500% 9.5% 12/30/26 (a)(b)(c)(e) | 960,000 | 950,400 | |
| TOTAL LEISURE | 44,643,983 | ||
| Metals/Mining - 0.2% | |||
| American Rock Salt Co. LLC Tranche B, term loan 3 month U.S. LIBOR + 3.500% 4.5% 3/21/25 (a)(b)(c) | 3,217,413 | 3,185,238 | |
| Paper - 0.1% | |||
| Clearwater Paper Corp. Tranche B 1LN, term loan 3 month U.S. LIBOR + 3.000% 3.1875% 7/26/26 (a)(b)(c) | 830,208 | 823,982 | |
| Neenah, Inc. Tranche B 1LN, term loan 3 month U.S. LIBOR + 4.000% 5% 6/30/27 (a)(b)(c) | 1,152,113 | 1,146,352 | |
| TOTAL PAPER | 1,970,334 | ||
| Publishing/Printing - 0.9% | |||
| Cengage Learning, Inc. Tranche B, term loan 3 month U.S. LIBOR + 4.250% 5.25% 6/7/23 (a)(b)(c) | 5,160,563 | 4,301,690 | |
| Getty Images, Inc. Tranche B 1LN, term loan 3 month U.S. LIBOR + 4.500% 4.6875% 2/19/26 (a)(b)(c) | 1,943,846 | 1,807,777 | |
| Harland Clarke Holdings Corp. Tranche B 7LN, term loan 3 month U.S. LIBOR + 4.750% 5.75% 11/3/23 (a)(b)(c) | 4,022,849 | 3,278,139 | |
| Learning Care Group (U.S.) No 2, Inc. Tranche B 1LN, term loan: | |||
| 3 month U.S. LIBOR + 3.250% 4.25% 3/13/25 (a)(b)(c) | 3,300,375 | 2,993,044 | |
| 3 month U.S. LIBOR + 8.500% 9.5% 3/13/25 (a)(b)(c) | 2,428,913 | 2,428,913 | |
| Proquest LLC Tranche B 1LN, term loan 3 month U.S. LIBOR + 3.500% 3.6466% 10/17/26 (a)(b)(c) | 1,188,948 | 1,173,195 | |
| Recorded Books, Inc. Tranche B 1LN, term loan 3 month U.S. LIBOR + 4.000% 4.1562% 8/31/25 (a)(b)(c) | 589,661 | 584,502 | |
| TOTAL PUBLISHING/PRINTING | 16,567,260 | ||
| Railroad - 0.2% | |||
| Genesee & Wyoming, Inc. 1LN, term loan 3 month U.S. LIBOR + 2.000% 2.2204% 12/30/26 (a)(b)(c) | 3,671,550 | 3,607,885 | |
| Restaurants - 0.9% | |||
| Burger King Worldwide, Inc. Tranche B 1LN, term loan 3 month U.S. LIBOR + 1.750% 1.8966% 11/19/26 (a)(b)(c) | 4,466,250 | 4,274,559 | |
| CEC Entertainment, Inc. Tranche B 1LN, term loan 3 month U.S. LIBOR + 8.500% 9.5% 8/30/26 (a)(b)(c) | 2,611,875 | 1,658,541 | |
| KFC Holding Co. Tranche B, term loan 3 month U.S. LIBOR + 1.750% 1.9% 4/3/25 (a)(b)(c) | 2,160,953 | 2,106,476 | |
| PFC Acquisition Corp. Tranche B 1LN, term loan 3 month U.S. LIBOR + 6.250% 6.3966% 3/1/26 (a)(b)(c) | 3,570,625 | 2,647,368 | |
| Red Lobster Hospitality LLC Tranche B, term loan 3 month U.S. LIBOR + 5.250% 6.25% 7/28/21 (a)(b)(c) | 2,781,893 | 2,571,527 | |
| Whatabrands LLC Tranche B 1LN, term loan 3 month U.S. LIBOR + 2.750% 2.9055% 8/3/26 (a)(b)(c) | 3,969,975 | 3,877,554 | |
| TOTAL RESTAURANTS | 17,136,025 | ||
| Services - 7.1% | |||
| ABG Intermediate Holdings 2 LLC Tranche B 1LN, term loan 3 month U.S. LIBOR + 5.250% 6.25% 9/29/24 (a)(b)(c) | 940,000 | 930,600 | |
| Airbnb, Inc. Tranche B 1LN, term loan 3 month U.S. LIBOR + 7.500% 8.5% 4/17/25 (a)(b)(c) | 4,019,925 | 4,321,419 | |
| Almonde, Inc.: | |||
| Tranche 2LN, term loan 3 month U.S. LIBOR + 7.250% 8.25% 6/13/25 (a)(b)(c) | 8,125,000 | 7,609,063 | |
| Tranche B 1LN, term loan 3 month U.S. LIBOR + 3.500% 4.5% 6/13/24 (a)(b)(c) | 12,721,187 | 11,865,687 | |
| Ancestry.com Operations, Inc. Tranche B 1LN, term loan 3 month U.S. LIBOR + 3.750% 4.75% 10/19/23 (a)(b)(c) | 4,054,818 | 4,046,709 | |
| APX Group, Inc. Tranche B 1LN, term loan 3 month U.S. LIBOR + 5.000% 5.148% 12/31/25 (a)(b)(c) | 743,133 | 728,582 | |
| Aramark Services, Inc.: | |||
| Tranche B 3LN, term loan 3 month U.S. LIBOR + 1.750% 1.8966% 3/11/25 (a)(b)(c) | 6,711,300 | 6,404,258 | |
| Tranche B-4 1LN, term loan 3 month U.S. LIBOR + 1.750% 1.8966% 1/15/27 (a)(b)(c) | 1,368,125 | 1,305,424 | |
| Brand Energy & Infrastructure Services, Inc. Tranche B, term loan 3 month U.S. LIBOR + 4.250% 5.25% 6/21/24 (a)(b)(c) | 9,890,522 | 9,184,240 | |
| Cast & Crew Payroll LLC Tranche B 1LN, term loan 3 month U.S. LIBOR + 3.750% 3.8966% 2/7/26 (a)(b)(c) | 2,093,125 | 1,992,132 | |
| Conservice Midco LLC Tranche B 1LN, term loan 3 month U.S. LIBOR + 4.250% 4.4704% 5/13/27 (a)(b)(c) | 2,245,000 | 2,216,938 | |
| CoreCivic, Inc. Tranche B 1LN, term loan 3 month U.S. LIBOR + 4.500% 5.5% 12/18/24 (a)(b)(c) | 2,372,563 | 2,325,111 | |
| Creative Artists Agency LLC Tranche B 1LN, term loan 3 month U.S. LIBOR + 3.750% 3.8966% 11/26/26 (a)(b)(c) | 1,985,000 | 1,902,623 | |
| Ensemble RCM LLC 1LN, term loan 3 month U.S. LIBOR + 3.750% 4.0106% 8/1/26 (a)(b)(c) | 2,722,500 | 2,683,922 | |
| Filtration Group Corp. Tranche B, term loan 3 month U.S. LIBOR + 3.000% 3.1466% 3/29/25 (a)(b)(c) | 2,250,714 | 2,203,247 | |
| GEMS MENASA Cayman Ltd. Tranche B 1LN, term loan 3 month U.S. LIBOR + 5.000% 6% 7/30/26 (a)(b)(c) | 5,872,547 | 5,686,563 | |
| IAA Spinco, Inc. Tranche B 1LN, term loan 3 month U.S. LIBOR + 2.250% 2.4375% 6/29/26 (a)(b)(c) | 2,418,750 | 2,376,422 | |
| Ion Trading Finance Ltd. Tranche B 1LN, term loan 3 month U.S. LIBOR + 4.000% 5% 11/21/24 (a)(b)(c) | 7,935,670 | 7,773,624 | |
| KUEHG Corp.: | |||
| Tranche B 2LN, term loan 3 month U.S. LIBOR + 8.250% 9.25% 8/22/25 (a)(b)(c) | 1,000,000 | 877,500 | |
| Tranche B, term loan 3 month U.S. LIBOR + 3.750% 4.75% 2/21/25 (a)(b)(c) | 6,911,914 | 6,304,979 | |
| Lineage Logistics Holdings, LLC. Tranche B, term loan 3 month U.S. LIBOR + 3.000% 4% 2/27/25 (a)(b)(c) | 17,115,086 | 16,853,054 | |
| Maverick Purchaser Sub LLC Tranche B 1LN, term loan 3 month U.S. LIBOR + 3.500% 3.6466% 1/23/27 (a)(b)(c) | 5,738,846 | 5,640,826 | |
| Sabert Corp. Tranche B 1LN, term loan 3 month U.S. LIBOR + 4.500% 5.5% 12/10/26 (a)(b)(c) | 3,606,875 | 3,540,761 | |
| Sotheby's 1LN, term loan 3 month U.S. LIBOR + 5.500% 6.5% 1/3/27 (a)(b)(c) | 3,026,198 | 3,007,284 | |
| Spin Holdco, Inc. Tranche B, term loan 3 month U.S. LIBOR + 3.250% 4.25% 11/14/22 (a)(b)(c) | 7,774,600 | 7,603,870 | |
| Staples, Inc.: | |||
| Tranche B 1LN, term loan 3 month U.S. LIBOR + 5.000% 5.251% 4/16/26 (a)(b)(c) | 2,981,061 | 2,765,858 | |
| Tranche B 2LN, term loan 3 month U.S. LIBOR + 4.500% 4.751% 9/12/24 (a)(b)(c) | 272,500 | 255,695 | |
| SuperMoose Borrower LLC Tranche B 1LN, term loan 3 month U.S. LIBOR + 3.750% 3.8966% 8/29/25 (a)(b)(c) | 3,586,125 | 3,207,358 | |
| The GEO Group, Inc. Tranche B 1LN, term loan 3 month U.S. LIBOR + 2.000% 2.75% 3/23/24 (a)(b)(c) | 1,848,244 | 1,694,489 | |
| WASH Multifamily Acquisition, Inc.: | |||
| 2LN, term loan 3 month U.S. LIBOR + 7.000% 8% 5/15/23 (a)(b)(c) | 96,132 | 87,000 | |
| Tranche B 1LN, term loan: | |||
| 3 month U.S. LIBOR + 3.250% 4.25% 5/14/22 (a)(b)(c) | 3,850,310 | 3,769,030 | |
| 3 month U.S. LIBOR + 3.250% 4.25% 5/14/22 (a)(b)(c) | 683,660 | 669,228 | |
| Tranche B 2LN, term loan 3 month U.S. LIBOR + 7.000% 8% 5/14/23 (a)(b)(c) | 548,868 | 496,725 | |
| WaterBridge Operating LLC Tranche B 1LN, term loan 3 month U.S. LIBOR + 5.750% 6.75% 6/21/26 (a)(b)(c) | 2,970,000 | 2,462,991 | |
| TOTAL SERVICES | 134,793,212 | ||
| Steel - 0.1% | |||
| JMC Steel Group, Inc. 1LN, term loan 3 month U.S. LIBOR + 2.000% 2.1448% 1/24/27 (a)(b)(c) | 2,985,000 | 2,885,182 | |
| Super Retail - 4.5% | |||
| Academy Ltd. Tranche B, term loan 3 month U.S. LIBOR + 4.000% 5% 7/2/22 (a)(b)(c) | 5,284,537 | 5,155,066 | |
| Bass Pro Shops LLC. Tranche B, term loan 3 month U.S. LIBOR + 5.000% 5.75% 9/25/24 (a)(b)(c) | 47,012,392 | 46,513,112 | |
| BJ's Wholesale Club, Inc. Tranche B 1LN, term loan 3 month U.S. LIBOR + 2.000% 2.1511% 2/3/24 (a)(b)(c) | 5,991,149 | 5,879,474 | |
| David's Bridal, Inc.: | |||
| 2LN, term loan 3 month U.S. LIBOR + 8.000% 9% 1/18/24 (a)(b)(c)(e) | 158,167 | 0 | |
| Tranche B 1LN, term loan 3 month U.S. LIBOR + 6.000% 7% 6/30/23 (a)(b)(c)(e) | 115,457 | 0 | |
| Harbor Freight Tools U.S.A., Inc. Tranche B, term loan 3 month U.S. LIBOR + 2.500% 3.25% 8/19/23 (a)(b)(c) | 3,009,332 | 2,962,778 | |
| Michaels Stores, Inc. Tranche B 1LN, term loan 3 month U.S. LIBOR + 3.500% 9/16/27 (b)(c)(d) | 3,735,000 | 3,641,625 | |
| Party City Holdings, Inc. term loan 3 month U.S. LIBOR + 2.500% 3.25% 8/19/22 (a)(b)(c) | 4,174,919 | 3,392,121 | |
| PETCO Animal Supplies, Inc. Tranche B 1LN, term loan 3 month U.S. LIBOR + 3.250% 4.25% 1/26/23 (a)(b)(c) | 2,450,533 | 2,246,061 | |
| Red Ventures LLC Tranche B 1LN, term loan 3 month U.S. LIBOR + 2.500% 2.6466% 11/8/24 (a)(b)(c) | 5,756,714 | 5,512,054 | |
| Sports Authority, Inc. Tranche B, term loan 3 month U.S. LIBOR + 6.000% 0% 11/16/17 (b)(c)(e)(g) | 2,858,872 | 0 | |
| The Hillman Group, Inc. Tranche B, term loan 3 month U.S. LIBOR + 4.000% 4.1466% 5/31/25 (a)(b)(c) | 6,414,929 | 6,260,778 | |
| Weight Watchers International, Inc. Tranche B, term loan 3 month U.S. LIBOR + 4.750% 5.5% 11/29/24 (a)(b)(c) | 4,018,315 | 3,999,228 | |
| TOTAL SUPER RETAIL | 85,562,297 | ||
| Technology - 14.5% | |||
| Allegro MicroSystems LLC Tranche B 1LN, term loan 3 month U.S. LIBOR + 4.250% 9/24/27 (b)(c)(d) | 750,000 | 744,375 | |
| Anastasia Parent LLC Tranche B, term loan 3 month U.S. LIBOR + 3.750% 3.9704% 8/10/25 (a)(b)(c) | 5,713,400 | 2,425,510 | |
| Aptean, Inc. 1LN, term loan 3 month U.S. LIBOR + 4.250% 4.3966% 4/23/26 (a)(b)(c) | 2,219,367 | 2,186,077 | |
| Big Ass Fans LLC 1LN, term loan 3 month U.S. LIBOR + 3.750% 4.75% 5/21/24 (a)(b)(c) | 993,950 | 914,434 | |
| Boxer Parent Co., Inc. Tranche B, term loan 3 month U.S. LIBOR + 4.250% 4.3966% 10/2/25 (a)(b)(c) | 7,292,816 | 7,062,436 | |
| Brave Parent Holdings, Inc. Tranche B 1LN, term loan 3 month U.S. LIBOR + 4.000% 4.1466% 4/19/25 (a)(b)(c) | 865,863 | 852,875 | |
| Cabot Microelectronics Corp. Tranche B 1LN, term loan 3 month U.S. LIBOR + 2.000% 2.1875% 11/15/25 (a)(b)(c) | 2,430,141 | 2,375,463 | |
| Camelot Finance SA: | |||
| Tranche B 1LN, term loan 3 month U.S. LIBOR + 3.000% 10/31/26 (b)(c)(d) | 9,000,000 | 8,951,220 | |
| Tranche B, term loan 3 month U.S. LIBOR + 3.000% 3.1466% 10/31/26 (a)(b)(c) | 4,455,044 | 4,364,562 | |
| CCC Information Services, Inc. Tranche B 1LN, term loan 3 month U.S. LIBOR + 3.000% 4% 4/27/24 (a)(b)(c) | 3,904,276 | 3,870,934 | |
| Ceridian HCM Holding, Inc. Tranche B, term loan 3 month U.S. LIBOR + 2.500% 2.5996% 4/30/25 (a)(b)(c) | 4,892,594 | 4,735,102 | |
| CommScope, Inc. Tranche B 1LN, term loan 3 month U.S. LIBOR + 3.250% 3.3966% 4/4/26 (a)(b)(c) | 7,637,838 | 7,429,172 | |
| Cvent, Inc. Tranche B, term loan 3 month U.S. LIBOR + 3.750% 3.8966% 11/29/24 (a)(b)(c) | 2,922,550 | 2,632,370 | |
| Datto, Inc. 1LN, term loan 3 month U.S. LIBOR + 4.250% 4.3966% 4/2/26 (a)(b)(c) | 1,975,000 | 1,970,063 | |
| DCert Buyer, Inc. 1LN, term loan 3 month U.S. LIBOR + 4.000% 4.1466% 10/16/26 (a)(b)(c) | 7,188,875 | 7,087,799 | |
| Dell International LLC Tranche B 1LN, term loan 3 month U.S. LIBOR + 2.000% 2.75% 9/19/25 (a)(b)(c) | 4,630,917 | 4,606,512 | |
| DG Investment Intermediate Holdings, Inc.: | |||
| Tranche B 1LN, term loan 3 month U.S. LIBOR + 3.000% 3.75% 2/1/25 (a)(b)(c) | 1,541,143 | 1,476,615 | |
| Tranche B 2LN, term loan 3 month U.S. LIBOR + 6.750% 7.5% 2/1/26 (a)(b)(c) | 600,000 | 540,000 | |
| Dynatrace LLC Tranche B 1LN, term loan 3 month U.S. LIBOR + 2.250% 2.3966% 8/23/25 (a)(b)(c) | 1,879,199 | 1,844,547 | |
| EIG Investors Corp. Tranche B, term loan 3 month U.S. LIBOR + 3.750% 4.75% 2/9/23 (a)(b)(c) | 5,893,352 | 5,862,412 | |
| Emerald TopCo, Inc. 1LN, term loan 3 month U.S. LIBOR + 3.500% 3.7606% 7/22/26 (a)(b)(c) | 2,475,000 | 2,377,559 | |
| Epicor Software Corp. Tranche B 1LN, term loan 3 month U.S. LIBOR + 4.250% 5.25% 7/30/27 (a)(b)(c) | 4,360,000 | 4,349,710 | |
| EPV Merger Sub, Inc.: | |||
| Tranche 2LN, term loan 3 month U.S. LIBOR + 7.250% 7.3966% 3/8/26 (a)(b)(c) | 545,000 | 508,213 | |
| Tranche B 1LN, term loan 3 month U.S. LIBOR + 3.250% 3.3966% 3/8/25 (a)(b)(c) | 4,649,617 | 4,494,645 | |
| EXC Holdings III Corp. Tranche B, term loan: | |||
| 3 month U.S. LIBOR + 3.500% 4.5% 12/2/24 (a)(b)(c) | 1,788,310 | 1,764,847 | |
| 3 month U.S. LIBOR + 7.500% 8.5% 12/1/25 (a)(b)(c) | 1,000,000 | 978,750 | |
| Fastball Merger Sub LLC Tranche B 1LN, term loan 3 month U.S. LIBOR + 3.250% 3.3966% 1/22/27 (a)(b)(c) | 1,027,425 | 1,004,308 | |
| Go Daddy Operating Co. LLC: | |||
| Tranche B 1LN, term loan 3 month U.S. LIBOR + 2.500% 2.6466% 8/7/27 (a)(b)(c) | 3,865,313 | 3,803,313 | |
| Tranche B, term loan 3 month U.S. LIBOR + 1.750% 1.8966% 2/15/24 (a)(b)(c) | 4,559,976 | 4,464,490 | |
| Hyland Software, Inc.: | |||
| Tranche 2LN, term loan 3 month U.S. LIBOR + 7.000% 7.75% 7/7/25 (a)(b)(c) | 685,000 | 680,150 | |
| Tranche B 1LN, term loan 3 month U.S. LIBOR + 3.250% 4% 7/1/24 (a)(b)(c) | 4,495,252 | 4,471,832 | |
| Landesk Group, Inc. term loan: | |||
| 3 month U.S. LIBOR + 4.250% 5.25% 1/20/24 (a)(b)(c) | 8,610,761 | 8,542,564 | |
| 3 month U.S. LIBOR + 9.000% 10% 1/20/25 (a)(b)(c) | 2,270,000 | 2,182,991 | |
| MA FinanceCo. LLC: | |||
| Tranche B 1LN, term loan 3 month U.S. LIBOR + 4.250% 5.25% 6/5/25 (a)(b)(c) | 1,750,000 | 1,738,328 | |
| Tranche B 3LN, term loan: | |||
| 3 month U.S. LIBOR + 2.500% 2.6466% 6/21/24 (a)(b)(c) | 15,068,760 | 14,277,650 | |
| 3 month U.S. LIBOR + 2.500% 2.6466% 6/21/24 (a)(b)(c) | 2,415,575 | 2,288,758 | |
| McAfee LLC Tranche B, term loan: | |||
| 3 month U.S. LIBOR + 3.750% 3.8961% 9/29/24 (a)(b)(c) | 8,091,136 | 8,022,604 | |
| 3 month U.S. LIBOR + 8.500% 9.5% 9/29/25 (a)(b)(c) | 1,607,727 | 1,615,766 | |
| MH Sub I LLC Tranche B, term loan 3 month U.S. LIBOR + 3.750% 3.6466% 9/15/24 (a)(b)(c) | 1,185,556 | 1,151,471 | |
| NAVEX TopCo, Inc.: | |||
| 2LN, term loan 3 month U.S. LIBOR + 7.000% 7.15% 9/4/26 (a)(b)(c) | 415,000 | 400,475 | |
| Tranche B 1LN, term loan 3 month U.S. LIBOR + 3.250% 3.4% 9/4/25 (a)(b)(c) | 1,602,383 | 1,552,981 | |
| Northwest Fiber LLC Tranche B 1LN, term loan 3 month U.S. LIBOR + 5.500% 5.6556% 4/30/27 (a)(b)(c) | 7,915,163 | 7,895,375 | |
| Omnitracs LLC 1LN, term loan 3 month U.S. LIBOR + 4.250% 3/23/25 (b)(c)(d) | 1,000,000 | 991,880 | |
| Project Boost Purchaser LLC 1LN, term loan 3 month U.S. LIBOR + 3.500% 3.6466% 5/30/26 (a)(b)(c) | 2,841,300 | 2,753,703 | |
| Rackspace Hosting, Inc. Tranche B, term loan 3 month U.S. LIBOR + 3.000% 4% 11/3/23 (a)(b)(c) | 7,453,983 | 7,304,009 | |
| Renaissance Holding Corp. Tranche B 1LN, term loan 3 month U.S. LIBOR + 3.250% 3.3966% 5/31/25 (a)(b)(c) | 3,686,197 | 3,544,905 | |
| Severin Acquisition LLC Tranche B 1LN, term loan 3 month U.S. LIBOR + 3.250% 3.4055% 8/1/25 (a)(b)(c) | 3,433,838 | 3,326,530 | |
| Solera LLC Tranche B, term loan 3 month U.S. LIBOR + 2.750% 2.9379% 3/3/23 (a)(b)(c) | 3,476,881 | 3,400,598 | |
| Sophia LP: | |||
| 1LN, term loan 3 month U.S. LIBOR + 3.750% 10/6/27 (b)(c)(d) | 6,850,000 | 6,800,338 | |
| term loan 3 month U.S. LIBOR + 3.250% 4.25% 9/30/22 (a)(b)(c) | 5,545,047 | 5,516,157 | |
| SS&C Technologies, Inc.: | |||
| Tranche B 3LN, term loan 3 month U.S. LIBOR + 1.750% 1.8966% 4/16/25 (a)(b)(c) | 5,020,598 | 4,853,262 | |
| Tranche B 4LN, term loan 3 month U.S. LIBOR + 1.750% 1.8966% 4/16/25 (a)(b)(c) | 3,527,320 | 3,409,754 | |
| Tranche B 5LN, term loan 3 month U.S. LIBOR + 1.750% 1.8966% 4/16/25 (a)(b)(c) | 6,960,796 | 6,734,570 | |
| SUSE Tranche B 1LN, term loan 3 month U.S. LIBOR + 4.000% 9/22/27 (b)(c)(d) | 1,660,000 | 1,651,700 | |
| Tempo Acquisition LLC Tranche B, term loan 3 month U.S. LIBOR + 2.750% 2.8966% 5/1/24 (a)(b)(c) | 7,717,848 | 7,515,255 | |
| TTM Technologies, Inc. Tranche B, term loan 3 month U.S. LIBOR + 2.500% 2.6551% 9/28/24 (a)(b)(c) | 3,662,361 | 3,589,114 | |
| Uber Technologies, Inc. Tranche B, term loan: | |||
| 3 month U.S. LIBOR + 3.500% 3.6466% 7/13/23 (a)(b)(c) | 2,984,456 | 2,930,049 | |
| 3 month U.S. LIBOR + 4.000% 5% 4/4/25 (a)(b)(c) | 6,934,833 | 6,871,657 | |
| Ultimate Software Group, Inc.: | |||
| 1LN, term loan: | |||
| 3 month U.S. LIBOR + 3.750% 3.8966% 5/4/26 (a)(b)(c) | 6,296,400 | 6,235,199 | |
| 3 month U.S. LIBOR + 4.000% 4.75% 5/3/26 (a)(b)(c) | 10,985,000 | 10,945,234 | |
| 2LN, term loan 3 month U.S. LIBOR + 6.750% 7.5% 5/3/27 (a)(b)(c) | 4,015,000 | 4,081,930 | |
| Verscend Holding Corp. Tranche B, term loan 3 month U.S. LIBOR + 4.500% 4.6466% 8/27/25 (a)(b)(c) | 7,284,204 | 7,202,257 | |
| VFH Parent LLC Tranche B 1LN, term loan 3 month U.S. LIBOR + 3.000% 3.1511% 3/1/26 (a)(b)(c) | 7,082,829 | 7,027,512 | |
| VM Consolidated, Inc. Tranche B L1N, term loan 3 month U.S. LIBOR + 3.250% 3.3966% 2/28/25 (a)(b)(c) | 3,304,582 | 3,230,229 | |
| VS Buyer LLC Tranche B 1LN, term loan 3 month U.S. LIBOR + 3.250% 3.3966% 2/28/27 (a)(b)(c) | 3,621,800 | 3,552,370 | |
| Web.com Group, Inc.: | |||
| 2LN, term loan 3 month U.S. LIBOR + 7.750% 7.9011% 10/11/26 (a)(b)(c) | 1,829,523 | 1,724,326 | |
| Tranche B 1LN, term loan 3 month U.S. LIBOR + 3.750% 3.9011% 10/11/25 (a)(b)(c) | 2,986,461 | 2,879,695 | |
| Xperi Holding Corp. Tranche B 1LN, term loan 3 month U.S. LIBOR + 4.000% 4.1466% 6/1/25 (a)(b)(c) | 4,345,000 | 4,227,337 | |
| Zelis Payments Buyer, Inc. Tranche B 1LN, term loan 3 month U.S. LIBOR + 4.750% 4.8966% 9/30/26 (a)(b)(c) | 2,977,500 | 2,952,519 | |
| TOTAL TECHNOLOGY | 275,751,347 | ||
| Telecommunications - 8.5% | |||
| Altice Financing SA Tranche B, term loan: | |||
| 3 month U.S. LIBOR + 2.750% 2.8948% 1/31/26 (a)(b)(c) | 3,155,029 | 2,973,615 | |
| 3 month U.S. LIBOR + 2.750% 2.9024% 7/15/25 (a)(b)(c) | 5,339,509 | 5,088,766 | |
| Blucora, Inc. Tranche B, term loan 3 month U.S. LIBOR + 4.000% 5% 5/22/24 (a)(b)(c) | 1,738,602 | 1,703,830 | |
| Cablevision Lightpath LLC Tranche B 1LN, term loan 3 month U.S. LIBOR + 3.250% 9/15/27 (b)(c)(d) | 2,675,000 | 2,658,281 | |
| CenturyLink, Inc. Tranche B 1LN, term loan 3 month U.S. LIBOR + 2.250% 2.3966% 3/15/27 (a)(b)(c) | 1,601,930 | 1,536,427 | |
| Connect Finco Sarl Tranche B 1LN, term loan 3 month U.S. LIBOR + 4.500% 5.5% 12/11/26 (a)(b)(c) | 4,226,979 | 4,092,266 | |
| Consolidated Communications, Inc. Tranche B 1LN, term loan 3 month U.S. LIBOR + 4.750% 10/18/27 (b)(c)(d) | 2,665,000 | 2,634,193 | |
| Evo Payments International LLC Tranche B, term loan 3 month U.S. LIBOR + 3.250% 3.4% 12/22/23 (a)(b)(c) | 2,670,511 | 2,633,792 | |
| Frontier Communications Corp. Tranche B 1LN, term loan 3 month U.S. LIBOR + 3.750% 6% 6/15/24 (a)(b)(c) | 17,494,659 | 17,171,532 | |
| GTT Communications, Inc. Tranche B, term loan 3 month U.S. LIBOR + 2.750% 2.97% 5/31/25 (a)(b)(c) | 4,398,750 | 3,771,576 | |
| Intelsat Jackson Holdings SA: | |||
| Tranche B, term loan 3 month U.S. LIBOR + 3.750% 8% 11/27/23 (a)(b)(c) | 22,970,000 | 23,049,706 | |
| Tranche B-4, term loan 3 month U.S. LIBOR + 5.500% 8.75% 1/2/24 (a)(b)(c) | 4,000,000 | 4,025,000 | |
| Tranche B-5, term loan 8.625% 1/2/24 (c) | 6,205,000 | 6,259,294 | |
| Tranche DD 1LN, term loan 3 month U.S. LIBOR + 5.500% 5.05% 7/13/22 (a)(b)(c)(f) | 9,189,817 | 9,335,292 | |
| Iridium Satellite LLC 1LN, term loan 3 month U.S. LIBOR + 3.750% 4.75% 11/4/26 (a)(b)(c) | 2,661,625 | 2,653,081 | |
| Level 3 Financing, Inc. Tranche B 1LN, term loan 3 month U.S. LIBOR + 1.750% 1.8966% 3/1/27 (a)(b)(c) | 4,568,653 | 4,421,588 | |
| Onvoy LLC Tranche B 1LN, term loan 3 month U.S. LIBOR + 4.500% 5.5% 2/10/24 (a)(b)(c) | 1,729,797 | 1,648,721 | |
| Radiate Holdco LLC Tranche B 1LN, term loan 3 month U.S. LIBOR + 3.500% 9/10/26 (b)(c)(d) | 9,560,000 | 9,380,750 | |
| SBA Senior Finance II, LLC Tranche B, term loan 3 month U.S. LIBOR + 1.750% 1.9% 4/11/25 (a)(b)(c) | 4,398,750 | 4,279,280 | |
| Securus Technologies, Inc. Tranche B, term loan: | |||
| 3 month U.S. LIBOR + 4.500% 5.5% 11/1/24 (a)(b)(c) | 4,482,480 | 3,691,054 | |
| 3 month U.S. LIBOR + 8.250% 9.25% 11/1/25 (a)(b)(c) | 7,055,000 | 4,288,100 | |
| SFR Group SA: | |||
| Tranche B 11LN, term loan 3 month U.S. LIBOR + 2.750% 2.8966% 7/31/25 (a)(b)(c) | 7,135,911 | 6,796,527 | |
| Tranche B 12LN, term loan 3 month U.S. LIBOR + 3.680% 3.8399% 1/31/26 (a)(b)(c) | 1,003,673 | 964,780 | |
| Tranche B 13LN, term loan 3 month U.S. LIBOR + 4.000% 4.1524% 8/14/26 (a)(b)(c) | 5,895,000 | 5,714,967 | |
| T-Mobile U.S.A., Inc. Tranche B 1LN, term loan 3 month U.S. LIBOR + 3.000% 3.1466% 4/1/27 (a)(b)(c) | 11,715,638 | 11,697,830 | |
| Windstream Services LLC Tranche B 1LN, term loan 3 month U.S. LIBOR + 6.250% 7.25% 8/10/27 (a)(b)(c) | 3,760,575 | 3,630,534 | |
| Xplornet Communications, Inc. 1LN, term loan 3 month U.S. LIBOR + 4.750% 4.8966% 5/28/27 (a)(b)(c) | 2,658,338 | 2,603,523 | |
| Zayo Group Holdings, Inc. 1LN, term loan 3 month U.S. LIBOR + 3.000% 3.1466% 3/9/27 (a)(b)(c) | 14,630,739 | 14,178,796 | |
| TOTAL TELECOMMUNICATIONS | 162,883,101 | ||
| Utilities - 3.0% | |||
| Brookfield WEC Holdings, Inc. Tranche B 1LN, term loan 3 month U.S. LIBOR + 3.000% 3.75% 8/1/25 (a)(b)(c) | 12,670,067 | 12,335,197 | |
| ExGen Renewables IV, LLC Tranche B, term loan 3 month U.S. LIBOR + 3.000% 4% 11/28/24 (a)(b)(c) | 2,700,438 | 2,692,850 | |
| Granite Generation LLC 1LN, term loan 3 month U.S. LIBOR + 3.750% 4.75% 11/1/26 (a)(b)(c) | 1,931,713 | 1,918,442 | |
| Green Energy Partners/Stonewall LLC Tranche B 1LN, term loan 3 month U.S. LIBOR + 5.500% 6.5% 11/13/21 (a)(b)(c) | 3,931,410 | 3,538,269 | |
| Invenergy Thermal Operating I LLC Tranche B, term loan 3 month U.S. LIBOR + 3.000% 3.1466% 8/28/25 (a)(b)(c) | 2,936,903 | 2,914,876 | |
| Limetree Bay Terminals LLC term loan 3 month U.S. LIBOR + 4.000% 5% 2/15/24 (a)(b)(c) | 4,748,803 | 4,423,320 | |
| LMBE-MC HoldCo II LLC Tranche B, term loan 3 month U.S. LIBOR + 4.000% 5% 12/3/25 (a)(b)(c) | 1,735,451 | 1,722,435 | |
| Pacific Gas & Electric Co. Tranche B 1LN, term loan 3 month U.S. LIBOR + 4.500% 5.5% 6/23/25 (a)(b)(c) | 7,177,013 | 7,060,386 | |
| Pike Corp. Tranche B 1LN, term loan 3 month U.S. LIBOR + 3.000% 3.15% 7/24/26 (a)(b)(c) | 2,270,000 | 2,247,300 | |
| Vertiv Group Corp. Tranche B 1LN, term loan 3 month U.S. LIBOR + 3.000% 3.1567% 3/2/27 (a)(b)(c) | 10,770,875 | 10,587,770 | |
| Vistra Operations Co. LLC Tranche B 3LN, term loan 3 month U.S. LIBOR + 1.750% 1.8974% 12/31/25 (a)(b)(c) | 8,183,264 | 8,053,395 | |
| TOTAL UTILITIES | 57,494,240 | ||
| TOTAL BANK LOAN OBLIGATIONS | |||
| (Cost $1,858,199,184) | 1,766,668,154 | ||
| Nonconvertible Bonds - 3.4% | |||
| Aerospace - 0.2% | |||
| TransDigm, Inc.: | |||
| 6.25% 3/15/26 (h) | 4,000,000 | 4,194,200 | |
| 8% 12/15/25 (h) | 385,000 | 418,688 | |
| TOTAL AEROSPACE | 4,612,888 | ||
| Air Transportation - 0.1% | |||
| Delta Air Lines, Inc. / SkyMiles IP Ltd. 4.5% 10/20/25 (h) | 815,000 | 836,394 | |
| Broadcasting - 0.1% | |||
| Univision Communications, Inc.: | |||
| 6.625% 6/1/27 (h) | 1,205,000 | 1,176,381 | |
| 9.5% 5/1/25 (h) | 1,210,000 | 1,294,700 | |
| TOTAL BROADCASTING | 2,471,081 | ||
| Cable/Satellite TV - 0.1% | |||
| Charter Communications Operating LLC/Charter Communications Operating Capital Corp. 3 month U.S. LIBOR + 1.650% 1.901% 2/1/24 (a)(b) | 1,750,000 | 1,790,345 | |
| Chemicals - 0.3% | |||
| Consolidated Energy Finance SA: | |||
| 3 month U.S. LIBOR + 3.750% 4.0004% 6/15/22 (a)(b)(h) | 4,895,000 | 4,616,552 | |
| 6.875% 6/15/25 (h) | 1,000,000 | 910,000 | |
| TOTAL CHEMICALS | 5,526,552 | ||
| Containers - 0.3% | |||
| Ardagh Packaging Finance PLC/Ardagh MP Holdings U.S.A., Inc. 4.125% 8/15/26 (h) | 2,945,000 | 2,985,494 | |
| Berry Global, Inc. 4.875% 7/15/26 (h) | 1,500,000 | 1,573,125 | |
| Trivium Packaging Finance BV 5.5% 8/15/26 (h) | 1,085,000 | 1,123,490 | |
| TOTAL CONTAINERS | 5,682,109 | ||
| Diversified Financial Services - 0.2% | |||
| Financial & Risk U.S. Holdings, Inc. 6.25% 5/15/26 (h) | 3,000,000 | 3,202,500 | |
| Energy - 0.2% | |||
| Citgo Petroleum Corp. 7% 6/15/25 (h) | 2,260,000 | 2,228,925 | |
| EP Energy LLC/Everest Acquisition Finance, Inc. 7.75% 5/15/26 (g)(h) | 1,435,000 | 313,906 | |
| New Fortress Energy LLC 6.75% 9/15/25 (h) | 535,000 | 559,343 | |
| Transocean Poseidon Ltd. 6.875% 2/1/27 (h) | 1,140,000 | 913,687 | |
| TOTAL ENERGY | 4,015,861 | ||
| Food & Drug Retail - 0.0% | |||
| Albertsons Companies LLC/Safeway, Inc./New Albertson's, Inc./Albertson's LLC 3.5% 2/15/23 (h) | 220,000 | 223,685 | |
| Gaming - 0.4% | |||
| Golden Entertainment, Inc. 7.625% 4/15/26 (h) | 1,065,000 | 1,051,688 | |
| Scientific Games Corp. 5% 10/15/25 (h) | 3,060,000 | 3,079,125 | |
| Stars Group Holdings BV 7% 7/15/26 (h) | 2,000,000 | 2,125,000 | |
| Sugarhouse HSP Gaming Prop Mezz LP/Sugarhouse HSP Gaming Finance Corp. 5.875% 5/15/25 (h) | 1,367,000 | 1,332,825 | |
| VICI Properties, Inc.: | |||
| 3.5% 2/15/25 (h) | 240,000 | 237,601 | |
| 4.25% 12/1/26 (h) | 345,000 | 346,604 | |
| 4.625% 12/1/29 (h) | 200,000 | 204,287 | |
| TOTAL GAMING | 8,377,130 | ||
| Healthcare - 0.4% | |||
| Tenet Healthcare Corp.: | |||
| 4.625% 7/15/24 | 2,500,000 | 2,506,250 | |
| 5.125% 5/1/25 | 1,000,000 | 1,001,000 | |
| Valeant Pharmaceuticals International, Inc.: | |||
| 5.5% 11/1/25 (h) | 2,515,000 | 2,574,731 | |
| 7% 3/15/24 (h) | 1,780,000 | 1,842,300 | |
| TOTAL HEALTHCARE | 7,924,281 | ||
| Hotels - 0.1% | |||
| Marriott Ownership Resorts, Inc. 6.125% 9/15/25 (h) | 1,865,000 | 1,947,116 | |
| Leisure - 0.1% | |||
| NCL Corp. Ltd. 12.25% 5/15/24 (h) | 265,000 | 296,800 | |
| Royal Caribbean Cruises Ltd.: | |||
| 9.125% 6/15/23 (h) | 275,000 | 291,500 | |
| 10.875% 6/1/23 (h) | 1,335,000 | 1,493,509 | |
| TOTAL LEISURE | 2,081,809 | ||
| Publishing/Printing - 0.0% | |||
| Clear Channel International BV 6.625% 8/1/25 (h) | 200,000 | 204,440 | |
| Restaurants - 0.0% | |||
| 1011778 BC Unlimited Liability Co./New Red Finance, Inc. 5.75% 4/15/25 (h) | 160,000 | 170,800 | |
| Services - 0.0% | |||
| APX Group, Inc. 7.625% 9/1/23 | 490,000 | 494,900 | |
| Super Retail - 0.2% | |||
| EG Global Finance PLC: | |||
| 6.75% 2/7/25 (h) | 1,000,000 | 1,023,750 | |
| 8.5% 10/30/25 (h) | 1,905,000 | 2,005,013 | |
| TOTAL SUPER RETAIL | 3,028,763 | ||
| Technology - 0.2% | |||
| CommScope, Inc.: | |||
| 5.5% 3/1/24 (h) | 1,100,000 | 1,130,327 | |
| 6% 3/1/26 (h) | 1,100,000 | 1,146,640 | |
| Diamond 1 Finance Corp./Diamond 2 Finance Corp. 4.42% 6/15/21 (h) | 754,000 | 770,276 | |
| SSL Robotics LLC 9.75% 12/31/23 (h) | 1,200,000 | 1,321,776 | |
| TOTAL TECHNOLOGY | 4,369,019 | ||
| Telecommunications - 0.4% | |||
| Altice Financing SA 7.5% 5/15/26 (h) | 3,095,000 | 3,276,150 | |
| SFR Group SA: | |||
| 5.125% 1/15/29 (h) | 165,000 | 164,381 | |
| 7.375% 5/1/26 (h) | 3,010,000 | 3,154,179 | |
| TOTAL TELECOMMUNICATIONS | 6,594,710 | ||
| Transportation Ex Air/Rail - 0.1% | |||
| Avolon Holdings Funding Ltd. 5.125% 10/1/23 (h) | 2,255,000 | 2,260,638 | |
| TOTAL NONCONVERTIBLE BONDS | |||
| (Cost $65,558,603) | 65,815,021 | ||
| Shares | Value | ||
| Common Stocks - 0.4% | |||
| Automotive & Auto Parts - 0.0% | |||
| Motors Liquidation Co. GUC Trust (i) | 3,724 | 5,214 | |
| Broadcasting - 0.0% | |||
| Clear Channel Outdoor Holdings, Inc. (i) | 59,243 | 59,243 | |
| iHeartMedia, Inc. (i) | 25,194 | 204,575 | |
| TOTAL BROADCASTING | 263,818 | ||
| Diversified Financial Services - 0.0% | |||
| ACNR Holdings, Inc. (e) | 15,697 | 108,507 | |
| Energy - 0.2% | |||
| Denbury, Inc. (i) | 65,094 | 1,145,654 | |
| Expro Holdings U.S., Inc. (e)(i) | 240,349 | 2,403,490 | |
| Expro Holdings U.S., Inc. (e)(h)(i) | 88,205 | 882,050 | |
| TOTAL ENERGY | 4,431,194 | ||
| Publishing/Printing - 0.0% | |||
| Cenveo Corp. (e)(i) | 4,167 | 121,510 | |
| Super Retail - 0.0% | |||
| David's Bridal, Inc.(e)(i) | 5,338 | 0 | |
| David's Bridal, Inc. rights (e)(i) | 1,346 | 0 | |
| TOTAL SUPER RETAIL | 0 | ||
| Utilities - 0.2% | |||
| TexGen Power LLC (e) | 85,051 | 2,787,972 | |
| TOTAL COMMON STOCKS | |||
| (Cost $14,587,909) | 7,718,215 | ||
| Nonconvertible Preferred Stocks - 0.1% | |||
| Diversified Financial Services - 0.1% | |||
| ACNR Holdings, Inc. (e) | |||
| (Cost $1,123,250) | 8,986 | 1,123,250 | |
| Principal Amount | Value | ||
| Preferred Securities - 0.1% | |||
| Banks & Thrifts - 0.1% | |||
| JPMorgan Chase & Co.: | |||
| 3 month U.S. LIBOR + 3.320% 3.6161% (a)(b)(j) | 855,000 | 798,775 | |
| 3 month U.S. LIBOR + 3.470% 3.7383% (a)(b)(j) | 860,000 | 828,958 | |
| TOTAL BANKS & THRIFTS | |||
| (Cost $1,575,045) | 1,627,733 | ||
| Shares | Value | ||
| Other - 0.0% | |||
| Other - 0.0% | |||
| Tribune Co. Claim (e)(i) | |||
| (Cost $45,406) | 45,954 | 45,954 | |
| Money Market Funds - 6.2% | |||
| Fidelity Cash Central Fund 0.10% (k) | |||
| (Cost $117,683,804) | 117,666,426 | 117,689,959 | |
| TOTAL INVESTMENT IN SECURITIES - 102.9% | |||
| (Cost $2,058,773,201) | 1,960,688,286 | ||
| NET OTHER ASSETS (LIABILITIES) - (2.9)% | (54,673,634) | ||
| NET ASSETS - 100% | $1,906,014,652 |
Legend
(a) Coupon rates for floating and adjustable rate securities reflect the rates in effect at period end.
(b) Coupon is indexed to a floating interest rate which may be multiplied by a specified factor and/or subject to caps or floors.
(c) Remaining maturities of bank loan obligations may be less than the stated maturities shown as a result of contractual or optional prepayments by the borrower. Such prepayments cannot be predicted with certainty.
(d) The coupon rate will be determined upon settlement of the loan after period end.
(e) Level 3 security
(f) Position or a portion of the position represents an unfunded loan commitment. At period end, the total principal amount and market value of unfunded commitments totaled $5,266,865 and $5,320,503, respectively.
(g) Non-income producing - Security is in default.
(h) Security exempt from registration under Rule 144A of the Securities Act of 1933. These securities may be resold in transactions exempt from registration, normally to qualified institutional buyers. At the end of the period, the value of these securities amounted to $60,904,576 or 3.2% of net assets.
(i) Non-income producing
(j) Security is perpetual in nature with no stated maturity date.
(k) Affiliated fund that is generally available only to investment companies and other accounts managed by Fidelity Investments. The rate quoted is the annualized seven-day yield of the fund at period end. A complete unaudited listing of the fund's holdings as of its most recent quarter end is available upon request. In addition, each Fidelity Central Fund's financial statements, which are not covered by the Fund's Report of Independent Registered Public Accounting Firm, are available on the SEC's website or upon request.
Affiliated Central Funds
Information regarding fiscal year to date income earned by the Fund from investments in Fidelity Central Funds is as follows:
| Fund | Income earned |
| Fidelity Cash Central Fund | $1,070,528 |
| Total | $1,070,528 |
Amounts in the income column in the above table include any capital gain distributions from underlying funds, which are presented in the corresponding line-item in the Statement of Operations, if applicable.
The value, beginning of period, for the Fidelity Cash Central Fund was $123,844,924. Net realized gain (loss) and change in net unrealized appreciation (depreciation) on Fidelity Cash Central Fund is presented in the Statement of Operations, if applicable. Purchases and sales of the Fidelity Cash Central Fund were $461,012,489 and $467,163,046, respectively, during the period.
Investment Valuation
The following is a summary of the inputs used, as of September 30, 2020, involving the Fund's assets and liabilities carried at fair value. The inputs or methodology used for valuing securities may not be an indication of the risk associated with investing in those securities. For more information on valuation inputs, and their aggregation into the levels used below, please refer to the Investment Valuation section in the accompanying Notes to Financial Statements.
| Valuation Inputs at Reporting Date: | ||||
| Description | Total | Level 1 | Level 2 | Level 3 |
| Investments in Securities: | ||||
| Equities: | ||||
| Communication Services | $263,818 | $263,818 | $-- | $-- |
| Consumer Discretionary | -- | -- | -- | -- |
| Energy | 4,431,194 | 1,145,654 | -- | 3,285,540 |
| Financials | 1,236,971 | 5,214 | -- | 1,231,757 |
| Industrials | 121,510 | -- | -- | 121,510 |
| Utilities | 2,787,972 | -- | -- | 2,787,972 |
| Bank Loan Obligations | 1,766,668,154 | -- | 1,749,326,651 | 17,341,503 |
| Corporate Bonds | 65,815,021 | -- | 65,815,021 | -- |
| Preferred Securities | 1,627,733 | -- | 1,627,733 | -- |
| Other | 45,954 | -- | -- | 45,954 |
| Money Market Funds | 117,689,959 | 117,689,959 | -- | -- |
| Total Investments in Securities: | $1,960,688,286 | $119,104,645 | $1,816,769,405 | $24,814,236 |
The following is a reconciliation of Investments in Securities for which Level 3 inputs were used in determining value:
| Investments in Securities: | |
| Beginning Balance | $12,988,902 |
| Net Realized Gain (Loss) on Investment Securities | 201,488 |
| Net Unrealized Gain (Loss) on Investment Securities | (2,988,792) |
| Cost of Purchases | 14,568,034 |
| Proceeds of Sales | (3,814,694) |
| Amortization/Accretion | 4,339 |
| Transfers into Level 3 | 4,448,607 |
| Transfers out of Level 3 | (593,648) |
| Ending Balance | $24,814,236 |
| The change in unrealized gain (loss) for the period attributable to Level 3 securities held at September 30, 2020 | $(2,962,179) |
The information used in the above reconciliation represents fiscal year to date activity for any Investments in Securities identified as using Level 3 inputs at either the beginning or the end of the current fiscal period. Cost of purchases and proceeds of sales may include securities received and/or delivered through in-kind transactions. Transfers in or out of Level 3 represent the beginning value of any Security or Instrument where a change in the pricing level occurred from the beginning to the end of the period. The cost of purchases and the proceeds of sales may include securities received or delivered through corporate actions or exchanges. Realized and unrealized gains (losses) disclosed in the reconciliation are included in Net Gain (Loss) on the Fund's Statement of Operations.
Other Information
Distribution of investments by country or territory of incorporation, as a percentage of Total Net Assets, is as follows (Unaudited):
| United States of America | 87.8% |
| Luxembourg | 6.6% |
| Canada | 1.3% |
| Cayman Islands | 1.0% |
| France | 1.0% |
| Others (Individually Less Than 1%) | 2.3% |
| 100.0% |
See accompanying notes which are an integral part of the financial statements.
Financial Statements
Statement of Assets and Liabilities
| September 30, 2020 | ||
| Assets | ||
| Investment in securities, at value — See accompanying schedule: Unaffiliated issuers (cost $1,941,089,397) | $1,842,998,327 | |
| Fidelity Central Funds (cost $117,683,804) | 117,689,959 | |
| Total Investment in Securities (cost $2,058,773,201) | $1,960,688,286 | |
| Cash | 10,647,841 | |
| Receivable for investments sold | 42,218,523 | |
| Receivable for fund shares sold | 21,085 | |
| Interest receivable | 11,187,181 | |
| Distributions receivable from Fidelity Central Funds | 10,986 | |
| Total assets | 2,024,773,902 | |
| Liabilities | ||
| Payable for investments purchased | $80,699,224 | |
| Payable for fund shares redeemed | 38,048,129 | |
| Other payables and accrued expenses | 11,897 | |
| Total liabilities | 118,759,250 | |
| Net Assets | $1,906,014,652 | |
| Net Assets consist of: | ||
| Paid in capital | $2,040,919,800 | |
| Total accumulated earnings (loss) | (134,905,148) | |
| Net Assets | $1,906,014,652 | |
| Net Asset Value, offering price and redemption price per share ($1,906,014,652 ÷ 19,752,143 shares) | $96.50 |
See accompanying notes which are an integral part of the financial statements.
Statement of Operations
| Year ended September 30, 2020 | ||
| Investment Income | ||
| Dividends | $1,029,295 | |
| Interest | 96,054,015 | |
| Income from Fidelity Central Funds | 1,070,528 | |
| Total income | 98,153,838 | |
| Expenses | ||
| Custodian fees and expenses | $32,843 | |
| Independent directors' fees and expenses | 11,319 | |
| Miscellaneous | 19 | |
| Total expenses before reductions | 44,181 | |
| Expense reductions | (53,052) | |
| Total expenses after reductions | (8,871) | |
| Net investment income (loss) | 98,162,709 | |
| Realized and Unrealized Gain (Loss) | ||
| Net realized gain (loss) on: | ||
| Investment securities: | ||
| Unaffiliated issuers | (25,281,156) | |
| Fidelity Central Funds | (4,408) | |
| Total net realized gain (loss) | (25,285,564) | |
| Change in net unrealized appreciation (depreciation) on investment securities | (61,726,844) | |
| Net gain (loss) | (87,012,408) | |
| Net increase (decrease) in net assets resulting from operations | $11,150,301 |
See accompanying notes which are an integral part of the financial statements.
Statement of Changes in Net Assets
| Year ended September 30, 2020 | Year ended September 30, 2019 | |
| Increase (Decrease) in Net Assets | ||
| Operations | ||
| Net investment income (loss) | $98,162,709 | $122,252,172 |
| Net realized gain (loss) | (25,285,564) | (6,808,177) |
| Change in net unrealized appreciation (depreciation) | (61,726,844) | (33,640,471) |
| Net increase (decrease) in net assets resulting from operations | 11,150,301 | 81,803,524 |
| Distributions to shareholders | (101,753,020) | (121,953,549) |
| Affiliated share transactions | ||
| Proceeds from sales of shares | 103,890,529 | 55,039,774 |
| Reinvestment of distributions | 100,453,836 | 114,264,359 |
| Cost of shares redeemed | (154,548,895) | (478,275,822) |
| Net increase (decrease) in net assets resulting from share transactions | 49,795,470 | (308,971,689) |
| Total increase (decrease) in net assets | (40,807,249) | (349,121,714) |
| Net Assets | ||
| Beginning of period | 1,946,821,901 | 2,295,943,615 |
| End of period | $1,906,014,652 | $1,946,821,901 |
| Other Information | ||
| Shares | ||
| Sold | 1,109,366 | 544,187 |
| Issued in reinvestment of distributions | 1,040,839 | 1,128,026 |
| Redeemed | (1,601,294) | (4,693,420) |
| Net increase (decrease) | 548,911 | (3,021,207) |
See accompanying notes which are an integral part of the financial statements.
Financial Highlights
Fidelity Floating Rate Central Fund
| Years ended September 30, | 2020 | 2019 | 2018 | 2017 | 2016 |
| Selected Per–Share Data | |||||
| Net asset value, beginning of period | $101.38 | $103.31 | $103.17 | $102.63 | $102.02 |
| Income from Investment Operations | |||||
| Net investment income (loss)A | 4.985 | 6.104 | 5.279 | 5.268 | 5.424 |
| Net realized and unrealized gain (loss) | (4.687) | (1.943) | .401 | .545 | .357 |
| Total from investment operations | .298 | 4.161 | 5.680 | 5.813 | 5.781 |
| Distributions from net investment income | (5.178) | (6.091) | (5.215) | (5.223) | (5.171) |
| Distributions from net realized gain | – | – | (.325) | (.050) | – |
| Total distributions | (5.178) | (6.091) | (5.540) | (5.273) | (5.171) |
| Net asset value, end of period | $96.50 | $101.38 | $103.31 | $103.17 | $102.63 |
| Total ReturnB | .42% | 4.20% | 5.65% | 5.77% | 5.95% |
| Ratios to Average Net AssetsC,D | |||||
| Expenses before reductions | - %E | - %E | - %E | .06% | - %E |
| Expenses net of fee waivers, if any | - %E | - %E | - %E | .06% | - %E |
| Expenses net of all reductions | - %E | - %E | - %E | .06% | - %E |
| Net investment income (loss) | 5.16% | 6.01% | 5.12% | 5.09% | 5.45% |
| Supplemental Data | |||||
| Net assets, end of period (000 omitted) | $1,906,015 | $1,946,822 | $2,295,944 | $1,634,506 | $1,614,419 |
| Portfolio turnover rate | 40% | 29% | 47% | 78% | 48% |
A Calculated based on average shares outstanding during the period.
B Total returns would have been lower if certain expenses had not been reduced during the applicable periods shown.
C Fees and expenses of any underlying mutual funds or exchange-traded funds (ETFs) are not included in the Fund's expense ratio. The Fund indirectly bears its proportionate share of these expenses. For additional expense information related to investments in Fidelity Central Funds, please refer to the "Investments in Fidelity Central Funds" note found in the Notes to Financial Statements section of the most recent Annual or Semi-Annual report.
D Expense ratios reflect operating expenses of the class. Expenses before reductions do not reflect amounts reimbursed, waived, or reduced through arrangements with the investment advisor, brokerage services, or other offset arrangements, if applicable, and do not represent the amount paid by the class during periods when reimbursements, waivers or reductions occur.
E Amount represents less than .005%.
See accompanying notes which are an integral part of the financial statements.
Notes to Financial Statements
For the period ended September 30, 2020
1. Organization.
Fidelity Floating Rate Central Fund (the Fund) is a fund of Fidelity Central Investment Portfolios LLC (the LLC) and is authorized to issue an unlimited number of shares. Shares of the Fund are only offered to other investment companies and accounts managed by Fidelity Management & Research Company LLC (FMR), or its affiliates (the Investing Funds). The LLC is registered under the Investment Company Act of 1940, as amended (the 1940 Act), as an open-end management investment company organized as a Delaware Limited Liability Company.
Effective January 1, 2020:
Investment advisers Fidelity Investments Money Management, Inc., FMR Co., Inc., and Fidelity SelectCo, LLC, merged with and into Fidelity Management & Research Company. In connection with the merger transactions, the resulting, merged investment adviser was then redomiciled from Massachusetts to Delaware, changed its corporate structure from a corporation to a limited liability company, and changed its name to "Fidelity Management & Research Company LLC".
2. Investments in Fidelity Central Funds.
The Fund invests in Fidelity Central Funds, which are open-end investment companies generally available only to other investment companies and accounts managed by the investment adviser and its affiliates. The Fund's Schedule of Investments lists each of the Fidelity Central Funds held as of period end, if any, as an investment of the Fund, but does not include the underlying holdings of each Fidelity Central Fund. As an Investing Fund, the Fund indirectly bears its proportionate share of the expenses of the underlying Fidelity Central Funds.
The Money Market Central Funds seek preservation of capital and current income and are managed by the investment adviser. Annualized expenses of the Money Market Central Funds as of their most recent shareholder report date ranged from less than .005% to .01%.
A complete unaudited list of holdings for each Fidelity Central Fund is available upon request or at the Securities and Exchange Commission (the SEC) website at www.sec.gov. In addition, the financial statements of the Fidelity Central Funds, which are not covered by the Fund's Report of Independent Registered Public Accounting Firm, are available on the SEC website or upon request.
3. Significant Accounting Policies.
The Fund is an investment company and applies the accounting and reporting guidance of the Financial Accounting Standards Board (FASB) Accounting Standards Codification Topic 946 Financial Services – Investment Companies. The financial statements have been prepared in conformity with accounting principles generally accepted in the United States of America (GAAP), which require management to make certain estimates and assumptions at the date of the financial statements. Actual results could differ from those estimates. Subsequent events, if any, through the date that the financial statements were issued have been evaluated in the preparation of the financial statements. The following summarizes the significant accounting policies of the Fund:
Investment Valuation. Investments are valued as of 4:00 p.m. Eastern time on the last calendar day of the period. The Board of Directors (the Board) has delegated the day to day responsibility for the valuation of the Fund's investments to the Fair Value Committee (the Committee) established by the Fund's investment adviser. In accordance with valuation policies and procedures approved by the Board, the Fund attempts to obtain prices from one or more third party pricing vendors or brokers to value its investments. When current market prices, quotations or currency exchange rates are not readily available or reliable, investments will be fair valued in good faith by the Committee, in accordance with procedures adopted by the Board. Factors used in determining fair value vary by investment type and may include market or investment specific events, changes in interest rates and credit quality. The frequency with which these procedures are used cannot be predicted and they may be utilized to a significant extent. The Committee oversees the Fund's valuation policies and procedures and reports to the Board on the Committee's activities and fair value determinations. The Board monitors the appropriateness of the procedures used in valuing the Fund's investments and ratifies the fair value determinations of the Committee.
The Fund categorizes the inputs to valuation techniques used to value its investments into a disclosure hierarchy consisting of three levels as shown below:
- Level 1 – quoted prices in active markets for identical investments
- Level 2 – other significant observable inputs (including quoted prices for similar investments, interest rates, prepayment speeds, etc.)
- Level 3 – unobservable inputs (including the Fund's own assumptions based on the best information available)
Valuation techniques used to value the Fund's investments by major category are as follows:
Debt securities, including restricted securities, are valued based on evaluated prices received from third party pricing vendors or from brokers who make markets in such securities. Corporate bonds, bank loan obligations and preferred securities are valued by pricing vendors who utilize matrix pricing which considers yield or price of bonds of comparable quality, coupon, maturity and type or by broker-supplied prices. When independent prices are unavailable or unreliable, debt securities may be valued utilizing pricing methodologies which consider similar factors that would be used by third party pricing vendors. Debt securities are generally categorized as Level 2 in the hierarchy but may be Level 3 depending on the circumstances. The Fund invests a significant portion of its assets in below investment grade securities. The value of these securities can be more volatile due to changes in the credit quality of the issuer and is sensitive to changes in economic, market and regulatory conditions.
Equity securities, including restricted securities, for which market quotations are readily available, are valued at the last reported sale price or official closing price as reported by a third party pricing vendor on the primary market or exchange on which they are traded and are categorized as Level 1 in the hierarchy. In the event there were no sales during the day or closing prices are not available, securities are valued at the last quoted bid price or may be valued using the last available price and are generally categorized as Level 2 in the hierarchy. For equity securities, including restricted securities, where observable inputs are limited, assumptions about market activity and risk are used and these securities may be categorized as Level 3 in the hierarchy.
Investments in open-end mutual funds, including the Fidelity Central Funds, are valued at their closing net asset value (NAV) each business day and are categorized as Level 1 in the hierarchy.
The following provides information on Level 3 securities held by the Fund that were valued at period end based on unobservable inputs. These amounts exclude valuations provided by a broker.
| Asset Type | Fair Value | Valuation Technique(s) | Unobservable Input | Amount or Range/Weighted Average | Impact to Valuation from an Increase in Input(a) |
| Equities | $7,426,779 | Market comparable | Enterprise Value/EBITDA multiple (EV/EBITDA) | 3.3 - 5.3 / 3.3 | Increase |
| Recovery value | Recovery value | 125.0% | Increase | ||
| Market approach | Parity price | $6.91 - $29.16 / $18.67 | Increase | ||
| Broker quote | $10.00 | Increase | |||
| Bank Loan Obligations | $17,341,503 | Market comparable | Enterprise Value/EBITDA multiple (EV/EBITDA) | 5.3 | Increase |
| Recovery value | Recovery value | 0.0% - 100.0% / 100.0% | Increase | ||
| Market approach | Transaction price | $98.00 - $100.00 / $99.84 | Increase | ||
| Broker quoted | Bid price | $80.00 - $99.00 / $96.87 | Increase | ||
| Other | $45,954 | Recovery value | Recovery value | 1.0% | Increase |
(a) Represents the directional change in the fair value of the Level 3 investments that could have resulted from an increase in the corresponding input as of period end. A decrease to the unobservable input would have had the opposite effect. Significant changes in these inputs may have resulted in a significantly higher or lower fair value measurement at period end.
Changes in valuation techniques may result in transfers in or out of an assigned level within the disclosure hierarchy. The aggregate value of investments by input level as of September 30, 2020, as well as a roll forward of Level 3 investments, is included at the end of the Fund's Schedule of Investments.
Investment Transactions and Income. For financial reporting purposes, the Fund's investment holdings and NAV include trades executed through the end of the last business day of the period. The NAV per share for processing shareholder transactions is calculated as of the close of business of the New York Stock Exchange (NYSE), normally 4:00 p.m. Eastern time and includes trades executed through the end of the prior business day. Gains and losses on securities sold are determined on the basis of identified cost and include proceeds received from litigation. Dividend income is recorded on the ex-dividend date, except for certain dividends from foreign securities where the ex-dividend date may have passed, which are recorded as soon as the Fund is informed of the ex-dividend date. Non-cash dividends included in dividend income, if any, are recorded at the fair market value of the securities received. Income and capital gain distributions from Fidelity Central Funds, if any, are recorded on the ex-dividend date. Certain distributions received by the Fund represent a return of capital or capital gain. The Fund determines the components of these distributions subsequent to the ex-dividend date, based upon receipt of tax filings or other correspondence relating to the underlying investment. These distributions are recorded as a reduction of cost of investments and/or as a realized gain. Interest income is accrued as earned and includes coupon interest and amortization of premium and accretion of discount on debt securities as applicable. Debt obligations may be placed on non-accrual status and related interest income may be reduced by ceasing current accruals and writing off interest receivables when the collection of all or a portion of interest has become doubtful based on consistently applied procedures. A debt obligation is removed from non-accrual status when the issuer resumes interest payments or when collectability of interest is reasonably assured. The Fund earns certain fees in connection with its floating rate loan purchasing activities. These fees are in addition to interest payments earned and may include amendment fees, consent fees and prepayment fees. These fees are recorded as Interest in the accompanying financial statements.
Expenses. Expenses directly attributable to a fund are charged to that fund. Expenses attributable to more than one fund are allocated among the respective funds on the basis of relative net assets or other appropriate methods. Expense estimates are accrued in the period to which they relate and adjustments are made when actual amounts are known.
Income Tax Information and Distributions to Shareholders. Each year, the Fund intends to qualify as a regulated investment company under Subchapter M of the Internal Revenue Code, including distributing substantially all of its taxable income and realized gains. As a result, no provision for U.S. Federal income taxes is required. As of September 30, 2020, the Fund did not have any unrecognized tax benefits in the financial statements; nor is the Fund aware of any tax positions for which it is reasonably possible that the total amounts of unrecognized tax benefits will significantly change in the next twelve months. The Fund files a U.S. federal tax return, in addition to state and local tax returns as required. The Fund's federal income tax returns are subject to examination by the Internal Revenue Service (IRS) for a period of three fiscal years after they are filed. State and local tax returns may be subject to examination for an additional fiscal year depending on the jurisdiction.
Distributions are declared and recorded daily and paid monthly from net investment income. Distributions from realized gains, if any, are declared and recorded on the ex-dividend date. Income and capital gain distributions are determined in accordance with income tax regulations, which may differ from GAAP.
Capital accounts within the financial statements are adjusted for permanent book-tax differences. These adjustments have no impact on net assets or the results of operations. Capital accounts are not adjusted for temporary book-tax differences which will reverse in a subsequent period.
Book-tax differences are primarily due to capital loss carryforwards and losses deferred due to wash sales and excise tax regulations.
As of period end, the cost and unrealized appreciation (depreciation) in securities, and derivatives if applicable, for federal income tax purposes were as follows:
| Gross unrealized appreciation | $15,427,481 |
| Gross unrealized depreciation | (113,553,433) |
| Net unrealized appreciation (depreciation) | $(98,125,952) |
| Tax Cost | $2,058,814,238 |
The tax-based components of distributable earnings as of period end were as follows:
| Capital loss carryforward | $(35,084,863) |
| Net unrealized appreciation (depreciation) on securities and other investments | $(98,125,952) |
Capital loss carryforwards are only available to offset future capital gains of the Fund to the extent provided by regulations and may be limited. The capital loss carryforward information presented below, including any applicable limitation, is estimated as of fiscal period end and is subject to adjustment.
| No expiration | |
| Short-term | $(273,760) |
| Long-term | (34,811,103) |
| Total capital loss carryforward | $(35,084,863) |
The tax character of distributions paid was as follows:
| September 30, 2020 | September 30, 2019 | |
| Ordinary Income | $101,753,020 | $ 121,953,549 |
Restricted Securities (including Private Placements). The Fund may invest in securities that are subject to legal or contractual restrictions on resale. These securities generally may be resold in transactions exempt from registration or to the public if the securities are registered. Disposal of these securities may involve time-consuming negotiations and expense, and prompt sale at an acceptable price may be difficult. Information regarding restricted securities is included at the end of the Fund's Schedule of Investments.
Loans and Other Direct Debt Instruments. Direct debt instruments are interests in amounts owed to lenders by corporate or other borrowers. These instruments may be in the form of loans, trade claims or other receivables and may include standby financing commitments such as revolving credit facilities that obligate a fund to supply additional cash to the borrower on demand. Loans may be acquired through assignment, participation, or may be made directly to a borrower. Such instruments are presented in the Bank Loan Obligations section in the Schedule of Investments. Certain funds may also invest in unfunded loan commitments, which are contractual obligations for future funding. Information regarding unfunded commitments is included at the end of the Schedule of Investments, if applicable.
New Accounting Pronouncement. In March 2020, the Financial Accounting Standards Board (FASB) issued an Accounting Standards Update (ASU), ASU 2020-04, which provides optional, temporary relief with respect to the financial reporting of contracts subject to certain types of modifications due to the planned discontinuation of the London Interbank Offered Rate (LIBOR) and other IBOR-based reference rates as of the end of 2021. The temporary relief provided by ASU 2020-04 is effective for certain reference rate-related contract modifications that occur during the period March 12, 2020 through December 31, 2022. Management is currently evaluating the potential impact of ASU 2020-04 to the financial statements.
4. Purchases and Sales of Investments.
Purchases and sales of securities, other than short-term securities, are noted in the table below.
| Purchases ($) | Sales ($) | |
| Fidelity Floating Rate Central Fund | 775,123,665 | 722,866,041 |
5. Fees and Other Transactions with Affiliates.
Management Fee and Expense Contract. Fidelity Management & Research Company LLC (the investment adviser) provides the Fund with investment management services. The Fund does not pay any fees for these services. Pursuant to the Fund's management contract, the investment adviser receives a monthly management fee that represents a portion of the management fees it receives from the Investing Funds. In addition, under an expense contract, the investment adviser also pays all other expenses of the Fund, excluding custody fees, the compensation of the independent Directors, and certain miscellaneous expenses such as proxy and shareholder meeting expenses.
Interfund Trades. Funds may purchase from or sell securities to other Fidelity Funds under procedures adopted by the Board. The procedures have been designed to ensure these interfund trades are executed in accordance with Rule 17a-7 of the 1940 Act. Interfund trades are included within the respective purchases and sales amounts shown in the Purchases and Sales of Investments note.
6. Expense Reductions.
Through arrangements with the Fund's custodian, credits realized as a result of certain uninvested cash balances were used to reduce the Fund's expenses by $53,052.
7. Other.
The Fund's organizational documents provide former and current directors and officers with a limited indemnification against liabilities arising in connection with the performance of their duties to the Fund. In the normal course of business, the Fund may also enter into contracts that provide general indemnifications. The Fund's maximum exposure under these arrangements is unknown as this would be dependent on future claims that may be made against the Fund. The risk of material loss from such claims is considered remote.
At the end of the period, mutual funds managed by the investment adviser or its affiliates were the owners of record of all of the outstanding shares of the Fund.
8. Coronavirus (COVID-19) Pandemic.
An outbreak of COVID-19 first detected in China during December 2019 has since spread globally and was declared a pandemic by the World Health Organization during March 2020. Developments that disrupt global economies and financial markets, such as the COVID-19 pandemic, may magnify factors that affect the Fund's performance.
Report of Independent Registered Public Accounting Firm
To the Board of Trustees of Fidelity Central Investment Portfolios LLC and Shareholders of Fidelity Floating Rate Central Fund:
Opinion on the Financial Statements and Financial Highlights
We have audited the accompanying statement of assets and liabilities of Fidelity Floating Rate Central Fund (the "Fund"), a fund of Fidelity Central Investment Portfolios LLC, including the schedule of investments, as of September 30, 2020, the related statement of operations for the year then ended, the statement of changes in net assets for each of the two years in the period then ended, the financial highlights for each of the five years in the period then ended, and the related notes. In our opinion, the financial statements and financial highlights present fairly, in all material respects, the financial position of the Fund as of September 30, 2020, and the results of its operations for the year then ended, the changes in its net assets for each of the two years in the period then ended, and the financial highlights for each of the five years in the period then ended in conformity with accounting principles generally accepted in the United States of America.
Basis for Opinion
These financial statements and financial highlights are the responsibility of the Fund's management. Our responsibility is to express an opinion on the Fund's financial statements and financial highlights based on our audits. We are a public accounting firm registered with the Public Company Accounting Oversight Board (United States) (PCAOB) and are required to be independent with respect to the Fund in accordance with the U.S. federal securities laws and the applicable rules and regulations of the Securities and Exchange Commission and the PCAOB.
We conducted our audits in accordance with the standards of the PCAOB. Those standards require that we plan and perform the audit to obtain reasonable assurance about whether the financial statements and financial highlights are free of material misstatement, whether due to error or fraud. The Fund is not required to have, nor were we engaged to perform, an audit of its internal control over financial reporting. As part of our audits we are required to obtain an understanding of internal control over financial reporting but not for the purpose of expressing an opinion on the effectiveness of the Fund’s internal control over financial reporting. Accordingly, we express no such opinion.
Our audits included performing procedures to assess the risks of material misstatement of the financial statements and financial highlights, whether due to error or fraud, and performing procedures that respond to those risks. Such procedures included examining, on a test basis, evidence regarding the amounts and disclosures in the financial statements and financial highlights. Our audits also included evaluating the accounting principles used and significant estimates made by management, as well as evaluating the overall presentation of the financial statements and financial highlights. Our procedures included confirmation of securities owned as of September 30, 2020, by correspondence with the custodian, brokers and agent banks; when replies were not received from brokers or agent banks, we performed other auditing procedures. We believe that our audits provide a reasonable basis for our opinion.
/s/ Deloitte & Touche LLP
Boston, Massachusetts
November 17, 2020
We have served as the auditor of one or more of the Fidelity investment companies since 1999.
Directors and Officers (Trustees and Officers)
The Trustees, Members of the Advisory Board (if any), and officers of the Fidelity Central Investment Portfolios LLC and fund, as applicable, are listed below. The Board of Trustees governs the fund and is responsible for protecting the interests of shareholders. The Trustees are experienced executives who meet periodically throughout the year to oversee the fund's activities, review contractual arrangements with companies that provide services to the fund, oversee management of the risks associated with such activities and contractual arrangements, and review the fund's performance. Except for Bettina Doulton, each of the Trustees oversees 304 funds. Ms. Doulton oversees 203 funds.
The Trustees hold office without limit in time except that (a) any Trustee may resign; (b) any Trustee may be removed by written instrument, signed by at least two-thirds of the number of Trustees prior to such removal; (c) any Trustee who requests to be retired or who has become incapacitated by illness or injury may be retired by written instrument signed by a majority of the other Trustees; and (d) any Trustee may be removed at any special meeting of shareholders by a two-thirds vote of the outstanding voting securities of the trust. Each Trustee who is not an interested person (as defined in the 1940 Act) of the trust and the fund is referred to herein as an Independent Trustee. Each Independent Trustee shall retire not later than the last day of the calendar year in which his or her 75th birthday occurs. The Independent Trustees may waive this mandatory retirement age policy with respect to individual Trustees. Officers and Advisory Board Members hold office without limit in time, except that any officer or Advisory Board Member may resign or may be removed by a vote of a majority of the Trustees at any regular meeting or any special meeting of the Trustees. Except as indicated, each individual has held the office shown or other offices in the same company for the past five years.
The fund’s Statement of Additional Information (SAI) includes more information about the Trustees. To request a free copy, call Fidelity at 1-800-544-8544.
Experience, Skills, Attributes, and Qualifications of the Trustees. The Governance and Nominating Committee has adopted a statement of policy that describes the experience, qualifications, attributes, and skills that are necessary and desirable for potential Independent Trustee candidates (Statement of Policy). The Board believes that each Trustee satisfied at the time he or she was initially elected or appointed a Trustee, and continues to satisfy, the standards contemplated by the Statement of Policy. The Governance and Nominating Committee also engages professional search firms to help identify potential Independent Trustee candidates who have the experience, qualifications, attributes, and skills consistent with the Statement of Policy. From time to time, additional criteria based on the composition and skills of the current Independent Trustees, as well as experience or skills that may be appropriate in light of future changes to board composition, business conditions, and regulatory or other developments, have also been considered by the professional search firms and the Governance and Nominating Committee. In addition, the Board takes into account the Trustees' commitment and participation in Board and committee meetings, as well as their leadership of standing and ad hoc committees throughout their tenure.
In determining that a particular Trustee was and continues to be qualified to serve as a Trustee, the Board has considered a variety of criteria, none of which, in isolation, was controlling. The Board believes that, collectively, the Trustees have balanced and diverse experience, qualifications, attributes, and skills, which allow the Board to operate effectively in governing the fund and protecting the interests of shareholders. Information about the specific experience, skills, attributes, and qualifications of each Trustee, which in each case led to the Board's conclusion that the Trustee should serve (or continue to serve) as a trustee of the fund, is provided below.
Board Structure and Oversight Function. Robert A. Lawrence is an interested person and currently serves as Acting Chairman. The Trustees have determined that an interested Chairman is appropriate and benefits shareholders because an interested Chairman has a personal and professional stake in the quality and continuity of services provided to the fund. Independent Trustees exercise their informed business judgment to appoint an individual of their choosing to serve as Chairman, regardless of whether the Trustee happens to be independent or a member of management. The Independent Trustees have determined that they can act independently and effectively without having an Independent Trustee serve as Chairman and that a key structural component for assuring that they are in a position to do so is for the Independent Trustees to constitute a substantial majority for the Board. The Independent Trustees also regularly meet in executive session. Ned C. Lautenbach and David M. Thomas serve as Co-Lead Independent Trustees and as such each (i) acts as a liaison between the Independent Trustees and management with respect to matters important to the Independent Trustees and (ii) with management prepares agendas for Board meetings.
Fidelity® funds are overseen by different Boards of Trustees. The fund's Board oversees Fidelity's high income and certain equity funds, and other Boards oversee Fidelity's investment-grade bond, money market, asset allocation, and other equity funds. The asset allocation funds may invest in Fidelity® funds overseen by the fund's Board. The use of separate Boards, each with its own committee structure, allows the Trustees of each group of Fidelity® funds to focus on the unique issues of the funds they oversee, including common research, investment, and operational issues. On occasion, the separate Boards establish joint committees to address issues of overlapping consequences for the Fidelity® funds overseen by each Board.
The Trustees operate using a system of committees to facilitate the timely and efficient consideration of all matters of importance to the Trustees, the fund, and fund shareholders and to facilitate compliance with legal and regulatory requirements and oversight of the fund's activities and associated risks. The Board, acting through its committees, has charged FMR and its affiliates with (i) identifying events or circumstances the occurrence of which could have demonstrably adverse effects on the fund's business and/or reputation; (ii) implementing processes and controls to lessen the possibility that such events or circumstances occur or to mitigate the effects of such events or circumstances if they do occur; and (iii) creating and maintaining a system designed to evaluate continuously business and market conditions in order to facilitate the identification and implementation processes described in (i) and (ii) above. Because the day-to-day operations and activities of the fund are carried out by or through FMR, its affiliates, and other service providers, the fund's exposure to risks is mitigated but not eliminated by the processes overseen by the Trustees. While each of the Board's committees has responsibility for overseeing different aspects of the fund's activities, oversight is exercised primarily through the Operations, Audit, and Compliance Committees. Appropriate personnel, including but not limited to the fund's Chief Compliance Officer (CCO), FMR's internal auditor, the independent accountants, the fund's Treasurer and portfolio management personnel, make periodic reports to the Board's committees, as appropriate, including an annual review of Fidelity's risk management program for the Fidelity® funds. The responsibilities of each standing committee, including their oversight responsibilities, are described further under "Standing Committees of the Trustees."
Interested Trustees*:
Correspondence intended for a Trustee who is an interested person may be sent to Fidelity Investments, 245 Summer Street, Boston, Massachusetts 02210.
Name, Year of Birth; Principal Occupations and Other Relevant Experience+
Bettina Doulton (1964)
Year of Election or Appointment: 2020
Trustee
Ms. Doulton also serves as Trustee of other Fidelity® funds. Prior to her retirement, Ms. Doulton served in a variety of positions at Fidelity Investments, including as a managing director of research (2006-2007), portfolio manager to certain Fidelity® funds (1993-2005), equity analyst and portfolio assistant (1990-1993), and research assistant (1987-1990). Ms. Doulton currently owns and operates Phi Builders + Architects and Cellardoor Winery. Previously, Ms. Doulton served as a member of the Board of Brown Capital Management, LLC (2013-2018).
Robert A. Lawrence (1952)
Year of Election or Appointment: 2020
Trustee
Acting Chairman of the Board of Trustees
Mr. Lawrence also serves as Trustee of other funds. Previously, Mr. Lawrence served as a Member of the Advisory Board of certain funds. Prior to his retirement in 2008, Mr. Lawrence served as Vice President of certain Fidelity® funds (2006-2008), Senior Vice President, Head of High Income Division of Fidelity Management & Research Company (investment adviser firm, 2006-2008), and President of Fidelity Strategic Investments (investment adviser firm, 2002-2005).
* Determined to be an “Interested Trustee” by virtue of, among other things, his or her affiliation with the Fidelity Central Investment Portfolios LLC or various entities under common control with FMR.
+ The information includes the Trustee's principal occupation during the last five years and other information relating to the experience, attributes, and skills relevant to the Trustee's qualifications to serve as a Trustee, which led to the conclusion that the Trustee should serve as a Trustee for the fund.
Independent Trustees:
Correspondence intended for an Independent Trustee may be sent to Fidelity Investments, P.O. Box 55235, Boston, Massachusetts 02205-5235.
Name, Year of Birth; Principal Occupations and Other Relevant Experience+
Dennis J. Dirks (1948)
Year of Election or Appointment: 2005
Trustee
Mr. Dirks also serves as Trustee of other Fidelity® funds. Prior to his retirement in May 2003, Mr. Dirks served as Chief Operating Officer and as a member of the Board of The Depository Trust & Clearing Corporation (financial markets infrastructure), President, Chief Operating Officer and a member of the Board of The Depository Trust Company (DTC), President and a member of the Board of the National Securities Clearing Corporation (NSCC), Chief Executive Officer and a member of the Board of the Government Securities Clearing Corporation and Chief Executive Officer and a member of the Board of the Mortgage-Backed Securities Clearing Corporation. Mr. Dirks currently serves as a member of the Finance Committee (2016-present) and Board (2017-present) and is Treasurer (2018-present) of the Asolo Repertory Theatre.
Donald F. Donahue (1950)
Year of Election or Appointment: 2018
Trustee
Mr. Donahue also serves as Trustee of other Fidelity® funds. Mr. Donahue serves as President and Chief Executive Officer of Miranda Partners, LLC (risk consulting for the financial services industry, 2012-present). Previously, Mr. Donahue served as Chief Executive Officer (2006-2012), Chief Operating Officer (2003-2006) and Managing Director, Customer Marketing and Development (1999-2003) of The Depository Trust & Clearing Corporation (financial markets infrastructure). Mr. Donahue currently serves as a member (2007-present) and Co-Chairman (2016-present) of the Board of United Way of New York, a member of the Board of NYC Leadership Academy (2012-present) and a member of the Board of Advisors of Ripple Labs, Inc. (financial services, 2015-present). Mr. Donahue previously served as a member of the Advisory Board of certain Fidelity® funds (2015-2018).
Vicki L. Fuller (1957)
Year of Election or Appointment: 2020
Trustee
Ms. Fuller also serves as Trustee of other Fidelity® funds. Previously, Ms. Fuller served as a member of the Advisory Board of certain Fidelity® funds (2018-2020), Chief Investment Officer of the New York State Common Retirement Fund (2012-2018) and held a variety of positions at AllianceBernstein L.P. (global asset management, 1985-2012), including Managing Director (2006-2012) and Senior Vice President and Senior Portfolio Manager (2001-2006). Ms. Fuller currently serves as a member of the Board, Audit Committee and Nominating and Governance Committee of The Williams Companies, Inc. (natural gas infrastructure, 2018-present), as a member of the Board, Audit Committee and Nominating and Governance Committee of two Blackstone business development companies (2020-present) and as a member of the Board of Treliant, LLC (consulting, 2019-present).
Patricia L. Kampling (1959)
Year of Election or Appointment: 2020
Trustee
Ms. Kampling also serves as Trustee of other Fidelity® funds. Prior to her retirement, Ms. Kampling served as Chairman of the Board and Chief Executive Officer (2012-2019), President and Chief Operating Officer (2011-2012) and Executive Vice President and Chief Financial Officer (2010-2011) of Alliant Energy Corporation. Ms. Kampling currently serves as a member of the Board, Compensation Committee and Executive Committee and as Chair of the Audit Committee of Briggs & Stratton Corporation (manufacturing, 2011-present) and as a member of the Board, Audit, Finance and Risk Committee and Safety, Environmental, Technology and Operations Committee of American Water Works Company, Inc. (utilities company, 2019-present). In addition, Ms. Kampling currently serves as a member of the Board of the Nature Conservancy, Wisconsin Chapter (2019-present). Previously, Ms. Kampling served as a Member of the Advisory Board of certain Fidelity® funds (2020), a member of the Board of Interstate Power and Light Company (2012-2019) and Wisconsin Power and Light Company (2012-2019) (each a subsidiary of Alliant Energy Corporation) and as a member of the Board and Workforce Development Committee of the Business Roundtable (2018-2019).
Alan J. Lacy (1953)
Year of Election or Appointment: 2008
Trustee
Mr. Lacy also serves as Trustee of other Fidelity® funds. Previously, Mr. Lacy served as Senior Adviser (2007-2014) of Oak Hill Capital Partners, L.P. (private equity), Chief Executive Officer (2005) and Vice Chairman (2005-2006) of Sears Holdings Corporation (retail), Chief Executive Officer and Chairman of the Board of Sears, Roebuck and Co. (retail, 2000-2005), Chairman (2014-2017) and a member of the Board (2010-2017) of Dave & Buster’s Entertainment, Inc. (restaurant and entertainment complexes) and a member of the Board of Bristol-Myers Squibb Company (global pharmaceuticals, 2008-2020). Mr. Lacy currently serves as a Trustee of the California Chapter of The Nature Conservancy (2015-present) and a member of the Board of the Center for Advanced Study in the Behavioral Sciences at Stanford University (2015-present).
Ned C. Lautenbach (1944)
Year of Election or Appointment: 2004
Trustee
Co-Lead Independent Trustee
Mr. Lautenbach also serves as Trustee of other Fidelity® funds. Mr. Lautenbach currently serves as Chair of the Board of Governors, State University System of Florida (2013-present) and is a member of the Council on Foreign Relations (1994-present). He is also a member and has in the past served as Chairman of the Board of Directors of Artis-Naples (2012-present). Previously, Mr. Lautenbach served as a member and then Lead Director of the Board of Directors of Eaton Corporation (diversified industrial, 1997-2016). He was also a Partner at Clayton, Dubilier & Rice, LLC (private equity investment, 1998-2010); as well as Director of Sony Corporation (2006-2007). In addition, Mr. Lautenbach had a 30-year career with IBM (technology company), during which time he served as Senior Vice President and as a member of the Corporate Executive Committee (1968-1998).
Joseph Mauriello (1944)
Year of Election or Appointment: 2008
Trustee
Mr. Mauriello also serves as Trustee of other Fidelity® funds. Prior to his retirement in January 2006, Mr. Mauriello served in numerous senior management positions including Deputy Chairman and Chief Operating Officer (2004-2005), and Vice Chairman of Financial Services (2002-2004) of KPMG LLP US (professional services, 1965-2005). Mr. Mauriello currently serves as a member of the Independent Directors Council Governing Council (2015-present). Previously, Mr. Mauriello served as a member of the Board of XL Group plc. (global insurance and re-insurance, 2006-2018).
Cornelia M. Small (1944)
Year of Election or Appointment: 2005
Trustee
Ms. Small also serves as Trustee of other Fidelity® funds. Previously, Ms. Small served as Chief Investment Officer, Director of Global Equity Investments and a member of Scudder, Stevens & Clark and Scudder Kemper Investments. Ms. Small previously served as a member of the Board (2009-2019) and Chair of the Investment Committee (2010-2019) of the Teagle Foundation and a member of the Investment Committee of the Berkshire Taconic Community Foundation (2008-2019).
Garnett A. Smith (1947)
Year of Election or Appointment: 2018
Trustee
Mr. Smith also serves as Trustee of other Fidelity® funds. Prior to his retirement, Mr. Smith served as Chairman and Chief Executive Officer (1990-1997) and President (1986-1990) of Inbrand Corp. (manufacturer of personal absorbent products). Prior to his employment with Inbrand Corp., he was employed by a retail fabric chain and North Carolina National Bank (now Bank of America). Mr. Smith previously served as a member of the Advisory Board of certain Fidelity® funds (2012-2013).
David M. Thomas (1949)
Year of Election or Appointment: 2008
Trustee
Co-Lead Independent Trustee
Mr. Thomas also serves as Trustee of other Fidelity® funds. Previously, Mr. Thomas served as Executive Chairman (2005-2006) and Chairman and Chief Executive Officer (2000-2005) of IMS Health, Inc. (pharmaceutical and healthcare information solutions). Mr. Thomas currently serves as Non-Executive Chairman of the Board of Fortune Brands Home and Security (home and security products, 2011-present), and a member of the Board (2004-present) and Presiding Director (2013-present) of Interpublic Group of Companies, Inc. (marketing communication).
Susan Tomasky (1953)
Year of Election or Appointment: 2020
Trustee
Ms. Tomasky also serves as Trustee of other Fidelity® funds. Prior to her retirement, Ms. Tomasky served in various executive officer positions at American Electric Power Company, Inc. (1998-2011), including most recently as President of AEP Transmission (2007-2011). Ms. Tomasky currently serves as a member of the Board and Sustainability Committee and as Chair of the Audit Committee of Marathon Petroleum Corporation (2018-present) and as a member of the Board, Corporate Governance Committee and Organization and Compensation Committee and as Chair of the Audit Committee of Public Service Enterprise Group, Inc. (utilities company, 2012-present). In addition, Ms. Tomasky currently serves as a member of the Board of the Columbus Regional Airport Authority (2007-present), as a member of the Board of the Royal Shakespeare Company – America (2009-present), as a member of the Board of the Columbus Association for the Performing Arts (2011-present) and as a member of the Board of Kenyon College (2016-present). Previously, Ms. Tomasky served as a Member of the Advisory Board of certain Fidelity® funds (2020), a member of the Board (2011-2019) and as Lead Independent Director (2015-2018) of Andeavor Corporation (previously Tesoro Corporation) (independent oil refiner and marketer) and as a member of the Board of Summit Midstream Partners LP (energy, 2012-2018).
Michael E. Wiley (1950)
Year of Election or Appointment: 2018
Trustee
Mr. Wiley also serves as Trustee of other Fidelity® funds. Previously, Mr. Wiley served as a member of the Advisory Board of certain Fidelity® funds (2018-2020), Chairman, President and CEO of Baker Hughes, Inc. (oilfield services, 2000-2004). Mr. Wiley also previously served as a member of the Board of Andeavor Corporation (independent oil refiner and marketer, 2005-2018), a member of the Board of Andeavor Logistics LP (natural resources logistics, 2015-2018) and a member of the Board of High Point Resources (exploration and production, 2005-2020).
+ The information includes the Trustee's principal occupation during the last five years and other information relating to the experience, attributes, and skills relevant to the Trustee's qualifications to serve as a Trustee, which led to the conclusion that the Trustee should serve as a Trustee for the fund.
Advisory Board Members and Officers:
Correspondence intended for a Member of the Advisory Board (if any) may be sent to Fidelity Investments, P.O. Box 55235, Boston, Massachusetts 02205-5235. Correspondence intended for an officer or Peter S. Lynch may be sent to Fidelity Investments, 245 Summer Street, Boston, Massachusetts 02210. Officers appear below in alphabetical order.
Name, Year of Birth; Principal Occupation
Peter S. Lynch (1944)
Year of Election or Appointment: 2004
Member of the Advisory Board
Mr. Lynch also serves as a Member of the Advisory Board of other Fidelity® funds. Mr. Lynch is Vice Chairman and a Director of Fidelity Management & Research Company LLC (investment adviser firm). In addition, Mr. Lynch serves as a Trustee of Boston College and as the Chairman of the Inner-City Scholarship Fund. Previously, Mr. Lynch served as Vice Chairman and a Director of FMR Co., Inc. (investment adviser firm) and on the Special Olympics International Board of Directors (1997-2006).
Elizabeth Paige Baumann (1968)
Year of Election or Appointment: 2017
Anti-Money Laundering (AML) Officer
Ms. Baumann also serves as AML Officer of other funds. She is Chief AML Officer (2012-present) and Senior Vice President (2014-present) of FMR LLC (diversified financial services company) and is an employee of Fidelity Investments. Previously, Ms. Baumann served as AML Officer of certain funds (2017-2019), as AML Officer of the funds (2012-2016), and Vice President (2007-2014) and Deputy Anti-Money Laundering Officer (2007-2012) of FMR LLC.
Craig S. Brown (1977)
Year of Election or Appointment: 2019
Assistant Treasurer
Mr. Brown also serves as Assistant Treasurer of other funds. Mr. Brown is an employee of Fidelity Investments (2013-present).
John J. Burke III (1964)
Year of Election or Appointment: 2018
Chief Financial Officer
Mr. Burke also serves as Chief Financial Officer of other funds. Mr. Burke serves as Head of Investment Operations for Fidelity Fund and Investment Operations (2018-present) and is an employee of Fidelity Investments (1998-present). Previously Mr. Burke served as head of Asset Management Investment Operations (2012-2018).
William C. Coffey (1969)
Year of Election or Appointment: 2019
Assistant Secretary
Mr. Coffey also serves as Assistant Secretary of other funds. He is Senior Vice President and Deputy General Counsel of FMR LLC (diversified financial services company, 2010-present), and is an employee of Fidelity Investments. Previously, Mr. Coffey served as Secretary and CLO of certain funds (2018-2019); CLO, Secretary, and Senior Vice President of Fidelity Management & Research Company and FMR Co., Inc. (investment adviser firms, 2018-2019); Secretary of Fidelity SelectCo, LLC and Fidelity Investments Money Management, Inc. (investment adviser firms, 2018-2019); CLO of Fidelity Management & Research (Hong Kong) Limited, FMR Investment Management (UK) Limited, and Fidelity Management & Research (Japan) Limited (investment adviser firms, 2018-2019); and Assistant Secretary of certain funds (2009-2018).
Timothy M. Cohen (1969)
Year of Election or Appointment: 2018
Vice President
Mr. Cohen also serves as Vice President of other funds. Mr. Cohen serves as Co-Head of Equity (2018-present), a Director of Fidelity Management & Research (Japan) Limited (investment adviser firm, 2016-present), and is an employee of Fidelity Investments. Previously, Mr. Cohen served as Executive Vice President of Fidelity SelectCo, LLC (2019), Head of Global Equity Research (2016-2018), Chief Investment Officer - Equity and a Director of Fidelity Management & Research (U.K.) Inc. (investment adviser firm, 2013-2015) and as a Director of Fidelity Management & Research (Hong Kong) Limited (investment adviser firm, 2017).
Jonathan Davis (1968)
Year of Election or Appointment: 2010
Assistant Treasurer
Mr. Davis also serves as Assistant Treasurer of other funds. Mr. Davis serves as Assistant Treasurer of FMR Capital, Inc. (2017-present) and is an employee of Fidelity Investments. Previously, Mr. Davis served as Vice President and Associate General Counsel of FMR LLC (diversified financial services company, 2003-2010).
Laura M. Del Prato (1964)
Year of Election or Appointment: 2018
Assistant Treasurer
Ms. Del Prato also serves as an officer of other funds. Ms. Del Prato is an employee of Fidelity Investments (2017-present). Previously, Ms. Del Prato served as President and Treasurer of The North Carolina Capital Management Trust: Cash Portfolio and Term Portfolio (2018-2020). Prior to joining Fidelity Investments, Ms. Del Prato served as a Managing Director and Treasurer of the JPMorgan Mutual Funds (2014-2017). Prior to JPMorgan, Ms. Del Prato served as a partner at Cohen Fund Audit Services (accounting firm, 2012-2013) and KPMG LLP (accounting firm, 2004-2012).
Colm A. Hogan (1973)
Year of Election or Appointment: 2020
Assistant Treasurer
Mr. Hogan also serves as an officer of other funds. Mr. Hogan serves as Assistant Treasurer of FMR Capital, Inc. (2017-present) and is an employee of Fidelity Investments (2005-present). Previously, Mr. Hogan served as Deputy Treasurer of certain Fidelity® funds (2016-2020) and Assistant Treasurer of certain Fidelity® funds (2016-2018).
Pamela R. Holding (1964)
Year of Election or Appointment: 2018
Vice President
Ms. Holding also serves as Vice President of other funds. Ms. Holding serves as Co-Head of Equity (2018-present) and is an employee of Fidelity Investments (2013-present). Previously, Ms. Holding served as Executive Vice President of Fidelity SelectCo, LLC (2019) and as Chief Investment Officer of Fidelity Institutional Asset Management (2013-2018).
Cynthia Lo Bessette (1969)
Year of Election or Appointment: 2019
Secretary and Chief Legal Officer (CLO)
Ms. Lo Bessette also serves as an officer of other funds. Ms. Lo Bessette serves as CLO, Secretary, and Senior Vice President of Fidelity Management & Research Company LLC (investment adviser firm, 2019-present); and CLO of Fidelity Management & Research (Hong Kong) Limited, FMR Investment Management (UK) Limited, and Fidelity Management & Research (Japan) Limited (investment adviser firms, 2019-present). She is a Senior Vice President and Deputy General Counsel of FMR LLC (diversified financial services company, 2019-present), and is an employee of Fidelity Investments. Previously, Ms. Lo Bessette served as CLO, Secretary, and Senior Vice President of FMR Co., Inc. (investment adviser firm, 2019); Secretary of Fidelity SelectCo, LLC and Fidelity Investments Money Management, Inc. (investment adviser firms, 2019). Prior to joining Fidelity Investments, Ms. Lo Bessette was Executive Vice President, General Counsel (2016-2019) and Senior Vice President, Deputy General Counsel (2015-2016) of OppenheimerFunds (investment management company) and Deputy Chief Legal Officer (2013-2015) of Jennison Associates LLC (investment adviser firm).
Chris Maher (1972)
Year of Election or Appointment: 2020
Deputy Treasurer
Mr. Maher also serves as an officer of other funds. Mr. Maher serves as Assistant Treasurer of FMR Capital, Inc. (2017-present), and is an employee of Fidelity Investments (2008-present). Previously, Mr. Maher served as Assistant Treasurer of certain funds (2013-2020); Vice President of Asset Management Compliance (2013), Vice President of the Program Management Group of FMR (investment adviser firm, 2010-2013), and Vice President of Valuation Oversight (2008-2010).
Jason P. Pogorelec (1975)
Year of Election or Appointment: 2020
Chief Compliance Officer
Mr. Pogorelec also serves as Chief Compliance Officer of other funds. Mr. Pogorelec is a senior Vice President of Asset Management Compliance for Fidelity Investments and is an employee of Fidelity Investments (2006-present). Previously, Mr. Pogorelec served as Vice President, Associate General Counsel for Fidelity Investments (2010-2020) and Assistant Secretary of certain Fidelity funds (2015-2020).
Stacie M. Smith (1974)
Year of Election or Appointment: 2016
President and Treasurer
Ms. Smith also serves as an officer of other funds. Ms. Smith serves as Assistant Treasurer of FMR Capital, Inc. (2017-present), is an employee of Fidelity Investments (2009-present), and has served in other fund officer roles. Prior to joining Fidelity Investments, Ms. Smith served as Senior Audit Manager of Ernst & Young LLP (accounting firm, 1996-2009). Previously, Ms. Smith served as Assistant Treasurer (2013-2019) and Deputy Treasurer (2013-2016) of certain Fidelity® funds.
Marc L. Spector (1972)
Year of Election or Appointment: 2016
Assistant Treasurer
Mr. Spector also serves as an officer of other funds. Mr. Spector serves as Assistant Treasurer of FMR Capital, Inc. (2017-present) and is an employee of Fidelity Investments (2016-present). Prior to joining Fidelity Investments, Mr. Spector served as Director at the Siegfried Group (accounting firm, 2013-2016), and prior to Siegfried Group as audit senior manager at Deloitte & Touche LLP (accounting firm, 2005-2013).
Jim Wegmann (1979)
Year of Election or Appointment: 2019
Assistant Treasurer
Mr. Wegmann also serves as Assistant Treasurer of other funds. Mr. Wegmann is an employee of Fidelity Investments (2011-present).
Shareholder Expense Example
The Example is based on an investment of $1,000 invested at the beginning of the period and held for the entire period (April 1, 2020 to September 30, 2020).
As a shareholder, you incur two types of costs: (1) transaction costs, which may include sales charges (loads) on purchase payments or redemption proceeds, as applicable and (2) ongoing costs, which generally include management fees, distribution and/or service (12b-1) fees and other Fund expenses. This Example is intended to help you understand your ongoing costs (in dollars) of investing in a fund and to compare these costs with the ongoing costs of investing in other mutual funds.
Actual Expenses
The first line of the accompanying table provides information about actual account values and actual expenses. You may use the information in this line, together with the amount you invested, to estimate the expenses that you paid over the period. Simply divide your account value by $1,000.00 (for example, an $8,600 account value divided by $1,000.00 = 8.6), then multiply the result by the number in the first line for a class/Fund under the heading entitled "Expenses Paid During Period" to estimate the expenses you paid on your account during this period. If any fund is a shareholder of any underlying mutual funds or exchange-traded funds (ETFs) (the Underlying Funds), such fund indirectly bears its proportional share of the expenses of the Underlying Funds in addition to the direct expenses incurred presented in the table. These fees and expenses are not included in the annualized expense ratio used to calculate the expense estimate in the table below.
Hypothetical Example for Comparison Purposes
The second line of the accompanying table provides information about hypothetical account values and hypothetical expenses based on the actual expense ratio and an assumed rate of return of 5% per year before expenses, which is not the actual return. The hypothetical account values and expenses may not be used to estimate the actual ending account balance or expenses you paid for the period. You may use this information to compare the ongoing costs of investing in the Fund and other funds. To do so, compare this 5% hypothetical example with the 5% hypothetical examples that appear in the shareholder reports of the other funds. If any fund is a shareholder of any Underlying Funds, such fund indirectly bears its proportional share of the expenses of the Underlying Funds in addition to the direct expenses as presented in the table. These fees and expenses are not included in the annualized expense ratio used to calculate the expense estimate in the table below.
Please note that the expenses shown in the table are meant to highlight your ongoing costs only and do not reflect any transaction costs. Therefore, the second line of the table is useful in comparing ongoing costs only, and will not help you determine the relative total costs of owning different funds.
| Annualized Expense Ratio-A | Beginning Account Value April 1, 2020 | Ending Account Value September 30, 2020 | Expenses Paid During Period-B April 1, 2020 to September 30, 2020 | |
| Fidelity Floating Rate Central Fund | .0028% | |||
| Actual | $1,000.00 | $1,128.60 | $.01 | |
| Hypothetical-C | $1,000.00 | $1,024.99 | $.01 |
A Annualized expense ratio reflects expenses net of applicable fee waivers.
B Expenses are equal to the annualized expense ratio, multiplied by the average account value over the period, multiplied by 183/ 366 (to reflect the one-half year period). The fees and expenses of any Underlying Funds are not included in each annualized expense ratio.
C 5% return per year before expenses
Distributions (Unaudited)
A total of 0.32% of the dividends distributed during the fiscal year was derived from interest on U.S. Government securities which is generally exempt from state income tax.
The fund designates $62,040,706 of distributions paid during the period January 1, 2020 to September 30, 2020 as qualifying to be taxed as interest-related dividends for nonresident alien shareholders.
The fund will notify shareholders in January 2021 of amounts for use in preparing 2020 income tax returns.
![]()
FR1-ANN-1120
1.814672.115
Fidelity® Real Estate Equity Central Fund
September 30, 2020
See the inside front cover for important information about access to your fund’s shareholder reports.
Beginning on January 1, 2021, as permitted by regulations adopted by the Securities and Exchange Commission, paper copies of a fund’s shareholder reports will no longer be sent by mail, unless you specifically request paper copies of the reports from the fund or from your financial intermediary, such as a financial advisor, broker-dealer or bank. Instead, the reports will be made available on a website, and you will be notified by mail each time a report is posted and provided with a website link to access the report.
If you already elected to receive shareholder reports electronically, you will not be affected by this change and you need not take any action. You may elect to receive shareholder reports and other communications from a fund electronically, by contacting your financial intermediary. For Fidelity customers, visit Fidelity's web site or call Fidelity using the contact information listed below.
You may elect to receive all future reports in paper free of charge. If you wish to continue receiving paper copies of your shareholder reports, you may contact your financial intermediary or, if you are a Fidelity customer, visit Fidelity’s website, or call Fidelity at the applicable toll-free number listed below. Your election to receive reports in paper will apply to all funds held with the fund complex/your financial intermediary.
| Account Type | Website | Phone Number |
| Brokerage, Mutual Fund, or Annuity Contracts: | fidelity.com/mailpreferences | 1-800-343-3548 |
| Employer Provided Retirement Accounts: | netbenefits.fidelity.com/preferences (choose 'no' under Required Disclosures to continue to print) | 1-800-343-0860 |
| Advisor Sold Accounts Serviced Through Your Financial Intermediary: | Contact Your Financial Intermediary | Your Financial Intermediary's phone number |
| Advisor Sold Accounts Serviced by Fidelity: | institutional.fidelity.com | 1-877-208-0098 |
Contents
To view a fund's proxy voting guidelines and proxy voting record for the 12-month period ended June 30, visit http://www.fidelity.com/proxyvotingresults or visit the Securities and Exchange Commission's (SEC) web site at http://www.sec.gov.
You may also call 1-800-544-8544 to request a free copy of the proxy voting guidelines.
Standard & Poor's, S&P and S&P 500 are registered service marks of The McGraw-Hill Companies, Inc. and have been licensed for use by Fidelity Distributors Corporation.
Other third-party marks appearing herein are the property of their respective owners.
All other marks appearing herein are registered or unregistered trademarks or service marks of FMR LLC or an affiliated company. © 2020 FMR LLC. All rights reserved.
A fund files its complete schedule of portfolio holdings with the SEC for the first and third quarters of each fiscal year on Form N-PORT. Forms N-PORT are available on the SEC’s web site at http://www.sec.gov. A fund's Forms N-PORT may be reviewed and copied at the SEC’s Public Reference Room in Washington, DC. Information regarding the operation of the SEC's Public Reference Room may be obtained by calling 1-800-SEC-0330.
Note to Shareholders:
Early in 2020, the outbreak and spread of a new coronavirus emerged as a public health emergency that had a major influence on financial markets, primarily based on its impact on the global economy and the outlook for corporate earnings. The virus causes a respiratory disease known as COVID-19. On March 11, the World Health Organization declared the COVID-19 outbreak a pandemic, citing sustained risk of further global spread.
In the weeks following, as the crisis worsened, we witnessed an escalating human tragedy with wide-scale social and economic consequences from coronavirus-containment measures. The outbreak of COVID-19 prompted a number of measures to limit the spread, including travel and border restrictions, quarantines, and restrictions on large gatherings. In turn, these resulted in lower consumer activity, diminished demand for a wide range of products and services, disruption in manufacturing and supply chains, and – given the wide variability in outcomes regarding the outbreak – significant market uncertainty and volatility. Amid the turmoil, the U.S. government took unprecedented action – in concert with the U.S. Federal Reserve and central banks around the world – to help support consumers, businesses, and the broader economy, and to limit disruption to the financial system.
The situation continues to unfold, and the extent and duration of its impact on financial markets and the economy remain highly uncertain. Extreme events such as the coronavirus crisis are “exogenous shocks” that can have significant adverse effects on mutual funds and their investments. Although multiple asset classes may be affected by market disruption, the duration and impact may not be the same for all types of assets.
Fidelity is committed to helping you stay informed amid news about COVID-19 and during increased market volatility, and we’re taking extra steps to be responsive to customer needs. We encourage you to visit our websites, where we offer ongoing updates, commentary, and analysis on the markets and our funds.
Performance: The Bottom Line
Average annual total return reflects the change in the value of an investment, assuming reinvestment of distributions from dividend income and capital gains (the profits earned upon the sale of securities that have grown in value, if any) and assuming a constant rate of performance each year. The hypothetical investment and the average annual total returns do not reflect the deduction of taxes that a shareholder would pay on fund distributions or the redemption of fund shares. During periods of reimbursement by Fidelity, a fund’s total return will be greater than it would be had the reimbursement not occurred. How a fund did yesterday is no guarantee of how it will do tomorrow.
Average Annual Total Returns
| For the periods ended September 30, 2020 | Past 1 year | Past 5 years | Life of fundA |
| Fidelity® Real Estate Equity Central Fund | (10.48)% | 6.40% | 5.06% |
A From November 3, 2014
$10,000 Over Life of Fund
Let's say hypothetically that $10,000 was invested in Fidelity® Real Estate Equity Central Fund on November 3, 2014, when the fund started.
The chart shows how the value of your investment would have changed, and also shows how the S&P 500® Index performed over the same period.

| Period Ending Values | ||
| $13,391 | Fidelity® Real Estate Equity Central Fund | |
| $18,803 | S&P 500® Index | |
Management's Discussion of Fund Performance
Market Recap: The S&P 500® index gained 15.15% for the 12 months ending September 30, 2020, in what was a bumpy ride for U.S. equity investors, marked by a steep but brief decline due to the early-2020 outbreak and spread of the coronavirus, followed by a historic rebound. Declared a pandemic on March 11, the COVID-19 crisis and containment efforts caused broad contraction in economic activity, along with extreme uncertainty, volatility and dislocation in financial markets. By mid-March, U.S. stocks had entered bear-market territory less than a month after hitting an all-time high and extending the longest-running bull market in American history. Stocks slid in late February, following a surge in COVID-19 cases outside China. The downtrend continued in March (-12%), capping the index’s worst quarter since 2008. A historically rapid and expansive U.S. monetary/fiscal-policy response provided a partial offset to the economic disruption and fueled a sharp uptrend beginning March 24, with recent strength supported by near-term potential for a COVID-19 vaccine breakthrough and signs of an early recovery in economic activity. The historic rally continued until September 2, when the S&P 500 achieved an all-time high, before retreating and returning -3.80% for the month, partly due to the inability of Congress to reach a deal on additional stimulus funding. Growth stocks dominated value shares for the year. By sector, information technology (+47%) led. In contrast, energy (-45%) fell hard along with the price of crude oil.Comments from Manager Samuel Wald: For the fiscal year ending September 30, 2020, the fund returned -10.48%, notably outperforming the -18.16% result of the benchmark, the FTSE NAREIT Equity REITs Index. A combination of strong subsector positioning – derived from our bottom-up investment approach – and security selection aided the fund's relative performance. Overweighting the so-called specialty category helped the fund versus the benchmark. This included our investment in data center REIT Digital Realty Trust (+16%), which benefited from increased computing demand due to employees working from home. The fund's significant underweighting in the regional mall category and an overweighting in industrial REITs also contributed. From a security selection standpoint, we made helpful picks in the office category, such as overweighting Alexandria Real Estate Equity. Conversely, security selection among shopping center REITs detracted. Looking at individual stocks, an average underweighting in poor-performing benchmark component Simon Property Group, the country's largest mall REIT, and selling this stock from the fund in March, added particular value. Overweighting VICI Properties (+9%), an owner of casino gaming properties, also aided the fund's relative return. In contrast, the fund's biggest individual detractor was an overweighted stake in hotel REIT RLJ Lodging Trust (-49%), which struggled due to sharp cutbacks in travel spending resulting from the COVID-19 pandemic.The views expressed above reflect those of the portfolio manager(s) only through the end of the period as stated on the cover of this report and do not necessarily represent the views of Fidelity or any other person in the Fidelity organization. Any such views are subject to change at any time based upon market or other conditions and Fidelity disclaims any responsibility to update such views. These views may not be relied on as investment advice and, because investment decisions for a Fidelity fund are based on numerous factors, may not be relied on as an indication of trading intent on behalf of any Fidelity fund.
Investment Summary (Unaudited)
Top Ten Stocks as of September 30, 2020
| % of fund's net assets | |
| Prologis (REIT), Inc. | 11.7 |
| Equinix, Inc. | 8.2 |
| Digital Realty Trust, Inc. | 7.3 |
| VICI Properties, Inc. | 5.1 |
| CubeSmart | 4.9 |
| Mid-America Apartment Communities, Inc. | 4.3 |
| Alexandria Real Estate Equities, Inc. | 4.1 |
| Ventas, Inc. | 3.9 |
| Essex Property Trust, Inc. | 3.8 |
| Invitation Homes, Inc. | 3.8 |
| 57.1 |
Top Five REIT Sectors as of September 30, 2020
| % of fund's net assets | |
| REITs - Diversified | 21.0 |
| REITs - Warehouse/Industrial | 16.4 |
| REITs - Apartments | 15.4 |
| REITs - Health Care | 10.5 |
| REITs - Storage | 8.7 |
Asset Allocation (% of fund's net assets)
| As of September 30, 2020 | ||
| Stocks | 99.0% | |
| Short-Term Investments and Net Other Assets (Liabilities) | 1.0% | |

Schedule of Investments September 30, 2020
Showing Percentage of Net Assets
| Common Stocks - 99.0% | |||
| Shares | Value | ||
| Equity Real Estate Investment Trusts (REITs) - 97.0% | |||
| REITs - Apartments - 15.4% | |||
| Essex Property Trust, Inc. | 132,819 | $26,668,727 | |
| Invitation Homes, Inc. | 941,804 | 26,361,094 | |
| Mid-America Apartment Communities, Inc. | 262,900 | 30,483,255 | |
| UDR, Inc. | 749,382 | 24,437,347 | |
| 107,950,423 | |||
| REITs - Diversified - 21.0% | |||
| Clipper Realty, Inc. | 434,086 | 2,626,220 | |
| Digital Realty Trust, Inc. | 349,723 | 51,325,347 | |
| Equinix, Inc. | 75,038 | 57,038,635 | |
| VICI Properties, Inc. | 1,538,131 | 35,946,121 | |
| 146,936,323 | |||
| REITs - Health Care - 10.5% | |||
| CareTrust (REIT), Inc. | 618,400 | 11,004,428 | |
| Healthcare Realty Trust, Inc. | 577,410 | 17,391,589 | |
| Ventas, Inc. | 659,494 | 27,672,368 | |
| Welltower, Inc. | 311,966 | 17,186,207 | |
| 73,254,592 | |||
| REITs - Hotels - 2.7% | |||
| RLJ Lodging Trust | 2,143,767 | 18,565,022 | |
| REITs - Management/Investment - 7.2% | |||
| American Tower Corp. | 61,300 | 14,818,049 | |
| Lexington Corporate Properties Trust | 1,348,037 | 14,086,987 | |
| National Retail Properties, Inc. | 618,081 | 21,329,975 | |
| 50,235,011 | |||
| REITs - Manufactured Homes - 3.2% | |||
| Equity Lifestyle Properties, Inc. | 364,300 | 22,331,590 | |
| REITs - Office Property - 8.6% | |||
| Alexandria Real Estate Equities, Inc. | 180,680 | 28,908,800 | |
| Douglas Emmett, Inc. | 587,162 | 14,737,766 | |
| Highwoods Properties, Inc. (SBI) | 391,288 | 13,135,538 | |
| Mack-Cali Realty Corp. | 284,788 | 3,594,025 | |
| 60,376,129 | |||
| REITs - Single Tenant - 3.3% | |||
| Four Corners Property Trust, Inc. | 902,900 | 23,105,211 | |
| REITs - Storage - 8.7% | |||
| CubeSmart | 1,069,819 | 34,565,852 | |
| Extra Space Storage, Inc. | 143,335 | 15,335,412 | |
| Iron Mountain, Inc. (a) | 421,700 | 11,297,343 | |
| 61,198,607 | |||
| REITs - Warehouse/Industrial - 16.4% | |||
| Americold Realty Trust | 525,510 | 18,786,983 | |
| Prologis (REIT), Inc. | 814,821 | 81,987,290 | |
| Terreno Realty Corp. | 260,016 | 14,238,476 | |
| 115,012,749 | |||
| TOTAL EQUITY REAL ESTATE INVESTMENT TRUSTS (REITS) | 678,965,657 | ||
| Real Estate Management & Development - 2.0% | |||
| Real Estate Services - 2.0% | |||
| CBRE Group, Inc. (b) | 302,800 | 14,222,516 | |
| TOTAL COMMON STOCKS | |||
| (Cost $689,680,386) | 693,188,173 | ||
| Money Market Funds - 1.2% | |||
| Fidelity Cash Central Fund 0.10% (c) | 4,116,714 | 4,117,538 | |
| Fidelity Securities Lending Cash Central Fund 0.10% (c)(d) | 3,948,605 | 3,949,000 | |
| TOTAL MONEY MARKET FUNDS | |||
| (Cost $8,066,538) | 8,066,538 | ||
| TOTAL INVESTMENT IN SECURITIES - 100.2% | |||
| (Cost $697,746,924) | 701,254,711 | ||
| NET OTHER ASSETS (LIABILITIES) - (0.2)% | (1,184,130) | ||
| NET ASSETS - 100% | $700,070,581 |
Legend
(a) Security or a portion of the security is on loan at period end.
(b) Non-income producing
(c) Affiliated fund that is generally available only to investment companies and other accounts managed by Fidelity Investments. The rate quoted is the annualized seven-day yield of the fund at period end. A complete unaudited listing of the fund's holdings as of its most recent quarter end is available upon request. In addition, each Fidelity Central Fund's financial statements, which are not covered by the Fund's Report of Independent Registered Public Accounting Firm, are available on the SEC's website or upon request.
(d) Investment made with cash collateral received from securities on loan.
Affiliated Central Funds
Information regarding fiscal year to date income earned by the Fund from investments in Fidelity Central Funds is as follows:
| Fund | Income earned |
| Fidelity Cash Central Fund | $92,408 |
| Fidelity Securities Lending Cash Central Fund | 364 |
| Total | $92,772 |
Amounts in the income column in the above table include any capital gain distributions from underlying funds, which are presented in the corresponding line-item in the Statement of Operations, if applicable. Amount for Fidelity Securities Lending Cash Central Fund represents the income earned on investing cash collateral, less rebates paid to borrowers and any lending agent fees associated with the loan, plus any premium payments received for lending certain types of securities.
Investment Valuation
The following is a summary of the inputs used, as of September 30, 2020, involving the Fund's assets and liabilities carried at fair value. The inputs or methodology used for valuing securities may not be an indication of the risk associated with investing in those securities. For more information on valuation inputs, and their aggregation into the levels used below, please refer to the Investment Valuation section in the accompanying Notes to Financial Statements.
| Valuation Inputs at Reporting Date: | ||||
| Description | Total | Level 1 | Level 2 | Level 3 |
| Investments in Securities: | ||||
| Common Stocks | $693,188,173 | $693,188,173 | $-- | $-- |
| Money Market Funds | 8,066,538 | 8,066,538 | -- | -- |
| Total Investments in Securities: | $701,254,711 | $701,254,711 | $-- | $-- |
See accompanying notes which are an integral part of the financial statements.
Financial Statements
Statement of Assets and Liabilities
| September 30, 2020 | ||
| Assets | ||
| Investment in securities, at value (including securities loaned of $3,847,044) — See accompanying schedule: Unaffiliated issuers (cost $689,680,386) | $693,188,173 | |
| Fidelity Central Funds (cost $8,066,538) | 8,066,538 | |
| Total Investment in Securities (cost $697,746,924) | $701,254,711 | |
| Cash | 137,644 | |
| Foreign currency held at value (cost $1) | 1 | |
| Receivable for fund shares sold | 24,690 | |
| Dividends receivable | 2,870,864 | |
| Distributions receivable from Fidelity Central Funds | 805 | |
| Total assets | 704,288,715 | |
| Liabilities | ||
| Payable for investments purchased | $230,665 | |
| Payable for fund shares redeemed | 32,138 | |
| Other payables and accrued expenses | 6,331 | |
| Collateral on securities loaned | 3,949,000 | |
| Total liabilities | 4,218,134 | |
| Net Assets | $700,070,581 | |
| Net Assets consist of: | ||
| Paid in capital | $819,819,962 | |
| Total accumulated earnings (loss) | (119,749,381) | |
| Net Assets | $700,070,581 | |
| Net Asset Value, offering price and redemption price per share ($700,070,581 ÷ 6,476,583 shares) | $108.09 |
See accompanying notes which are an integral part of the financial statements.
Statement of Operations
| Year ended September 30, 2020 | ||
| Investment Income | ||
| Dividends | $21,286,404 | |
| Income from Fidelity Central Funds (including $364 from security lending) | 92,772 | |
| Total income | 21,379,176 | |
| Expenses | ||
| Custodian fees and expenses | $16,047 | |
| Independent directors' fees and expenses | 3,894 | |
| Interest | 257 | |
| Miscellaneous | 9 | |
| Total expenses before reductions | 20,207 | |
| Expense reductions | (172) | |
| Total expenses after reductions | 20,035 | |
| Net investment income (loss) | 21,359,141 | |
| Realized and Unrealized Gain (Loss) | ||
| Net realized gain (loss) on: | ||
| Investment securities: | ||
| Unaffiliated issuers | (125,536,528) | |
| Fidelity Central Funds | 479 | |
| Total net realized gain (loss) | (125,536,049) | |
| Change in net unrealized appreciation (depreciation) on: | ||
| Investment securities: | ||
| Unaffiliated issuers | (39,075,241) | |
| Fidelity Central Funds | (104) | |
| Total change in net unrealized appreciation (depreciation) | (39,075,345) | |
| Net gain (loss) | (164,611,394) | |
| Net increase (decrease) in net assets resulting from operations | $(143,252,253) |
See accompanying notes which are an integral part of the financial statements.
Statement of Changes in Net Assets
| Year ended September 30, 2020 | Year ended September 30, 2019 | |
| Increase (Decrease) in Net Assets | ||
| Operations | ||
| Net investment income (loss) | $21,359,141 | $6,574,112 |
| Net realized gain (loss) | (125,536,049) | (652,434) |
| Change in net unrealized appreciation (depreciation) | (39,075,345) | 30,902,968 |
| Net increase (decrease) in net assets resulting from operations | (143,252,253) | 36,824,646 |
| Distributions to shareholders | (19,495,484) | (7,127,321) |
| Affiliated share transactions | ||
| Proceeds from sales of shares | 712,478,792 | 302,970,039 |
| Reinvestment of distributions | 19,495,485 | 7,127,321 |
| Cost of shares redeemed | (323,058,306) | (12,596,003) |
| Net increase (decrease) in net assets resulting from share transactions | 408,915,971 | 297,501,357 |
| Total increase (decrease) in net assets | 246,168,234 | 327,198,682 |
| Net Assets | ||
| Beginning of period | 453,902,347 | 126,703,665 |
| End of period | $700,070,581 | $453,902,347 |
| Other Information | ||
| Shares | ||
| Sold | 6,116,468 | 2,536,940 |
| Issued in reinvestment of distributions | 177,230 | 66,669 |
| Redeemed | (3,465,003) | (110,408) |
| Net increase (decrease) | 2,828,695 | 2,493,201 |
See accompanying notes which are an integral part of the financial statements.
Financial Highlights
Fidelity Real Estate Equity Central Fund
| Years ended September 30, | 2020 | 2019 | 2018 | 2017 | 2016 |
| Selected Per–Share Data | |||||
| Net asset value, beginning of period | $124.43 | $109.73 | $112.82 | $113.15 | $95.92 |
| Income from Investment Operations | |||||
| Net investment income (loss)A | 3.43 | 3.92 | 3.84 | 3.00 | 3.03 |
| Net realized and unrealized gain (loss) | (16.47) | 15.85 | .13 | (.91) | 17.03 |
| Total from investment operations | (13.04) | 19.77 | 3.97 | 2.09 | 20.06 |
| Distributions from net investment income | (3.30) | (3.16) | (3.16)B | (2.29) | (2.83) |
| Distributions from net realized gain | – | (1.91) | (3.90)B | (.12) | – |
| Total distributions | (3.30) | (5.07) | (7.06) | (2.42)C | (2.83) |
| Net asset value, end of period | $108.09 | $124.43 | $109.73 | $112.82 | $113.15 |
| Total ReturnD | (10.48)% | 18.98% | 3.73% | 1.95% | 21.08% |
| Ratios to Average Net AssetsE,F | |||||
| Expenses before reductions | - %G | .01% | .01% | .01% | .01% |
| Expenses net of fee waivers, if any | - %G | .01% | .01% | .01% | .01% |
| Expenses net of all reductions | - %G | .01% | .01% | .01% | .01% |
| Net investment income (loss) | 3.05% | 3.44% | 3.59% | 2.72% | 2.86% |
| Supplemental Data | |||||
| Net assets, end of period (000 omitted) | $700,071 | $453,902 | $126,704 | $127,147 | $173,787 |
| Portfolio turnover rateH | 84%I | 37% | 47% | 64% | 69% |
A Calculated based on average shares outstanding during the period.
B The amounts shown reflect certain reclassifications related to book to tax differences that were made in the year shown.
C Total distributions per share do not sum due to rounding.
D Total returns would have been lower if certain expenses had not been reduced during the applicable periods shown.
E Fees and expenses of any underlying mutual funds or exchange-traded funds (ETFs) are not included in the Fund's expense ratio. The Fund indirectly bears its proportionate share of these expenses. For additional expense information related to investments in Fidelity Central Funds, please refer to the "Investments in Fidelity Central Funds" note found in the Notes to Financial Statements section of the most recent Annual or Semi-Annual report.
F Expense ratios reflect operating expenses of the class. Expenses before reductions do not reflect amounts reimbursed, waived, or reduced through arrangements with the investment advisor, brokerage services, or other offset arrangements, if applicable, and do not represent the amount paid by the class during periods when reimbursements, waivers or reductions occur.
G Amount represents less than .005%.
H Amount does not include the portfolio activity of any underlying mutual funds or exchange-traded funds (ETFs).
I Portfolio turnover rate excludes securities received or delivered in-kind.
See accompanying notes which are an integral part of the financial statements.
Notes to Financial Statements
For the period ended September 30, 2020
1. Organization.
Fidelity Real Estate Equity Central Fund (the Fund) is a non-diversified fund of Fidelity Central Investment Portfolios LLC (the LLC) and is authorized to issue an unlimited number of shares. Shares of the Fund are only offered to other investment companies and accounts managed by Fidelity Management & Research Company LLC (FMR), or its affiliates (the Investing Funds). The LLC is registered under the Investment Company Act of 1940, as amended (the 1940 Act), as an open-end management investment company organized as a Delaware Limited Liability Company.
Effective January 1, 2020:
Investment advisers Fidelity Investments Money Management, Inc., FMR Co., Inc., and Fidelity SelectCo, LLC, merged with and into Fidelity Management & Research Company. In connection with the merger transactions, the resulting, merged investment adviser was then redomiciled from Massachusetts to Delaware, changed its corporate structure from a corporation to a limited liability company, and changed its name to "Fidelity Management & Research Company LLC".
2. Investments in Fidelity Central Funds.
The Fund invests in Fidelity Central Funds, which are open-end investment companies generally available only to other investment companies and accounts managed by the investment adviser and its affiliates. The Fund's Schedule of Investments lists each of the Fidelity Central Funds held as of period end, if any, as an investment of the Fund, but does not include the underlying holdings of each Fidelity Central Fund. As an Investing Fund, the Fund indirectly bears its proportionate share of the expenses of the underlying Fidelity Central Funds.
The Money Market Central Funds seek preservation of capital and current income and are managed by the investment adviser. Annualized expenses of the Money Market Central Funds as of their most recent shareholder report date ranged from less than .005% to .01%.
A complete unaudited list of holdings for each Fidelity Central Fund is available upon request or at the Securities and Exchange Commission (the SEC) website at www.sec.gov. In addition, the financial statements of the Fidelity Central Funds, which are not covered by the Fund's Report of Independent Registered Public Accounting Firm, are available on the SEC website or upon request.
3. Significant Accounting Policies.
The Fund is an investment company and applies the accounting and reporting guidance of the Financial Accounting Standards Board (FASB) Accounting Standards Codification Topic 946 Financial Services – Investment Companies. The financial statements have been prepared in conformity with accounting principles generally accepted in the United States of America (GAAP), which require management to make certain estimates and assumptions at the date of the financial statements. Actual results could differ from those estimates. Subsequent events, if any, through the date that the financial statements were issued have been evaluated in the preparation of the financial statements. The following summarizes the significant accounting policies of the Fund:
Investment Valuation. Investments are valued as of 4:00 p.m. Eastern time on the last calendar day of the period. The Board of Directors (the Board) has delegated the day to day responsibility for the valuation of the Fund's investments to the Fair Value Committee (the Committee) established by the Fund's investment adviser. In accordance with valuation policies and procedures approved by the Board, the Fund attempts to obtain prices from one or more third party pricing vendors or brokers to value its investments. When current market prices, quotations or currency exchange rates are not readily available or reliable, investments will be fair valued in good faith by the Committee, in accordance with procedures adopted by the Board. Factors used in determining fair value vary by investment type and may include market or investment specific events. The frequency with which these procedures are used cannot be predicted and they may be utilized to a significant extent. The Committee oversees the Fund's valuation policies and procedures and reports to the Board on the Committee's activities and fair value determinations. The Board monitors the appropriateness of the procedures used in valuing the Fund's investments and ratifies the fair value determinations of the Committee.
The Fund categorizes the inputs to valuation techniques used to value its investments into a disclosure hierarchy consisting of three levels as shown below:
- Level 1 – quoted prices in active markets for identical investments
- Level 2 – other significant observable inputs (including quoted prices for similar investments, interest rates, prepayment speeds, etc.)
- Level 3 – unobservable inputs (including the Fund's own assumptions based on the best information available)
Valuation techniques used to value the Fund's investments by major category are as follows:
Equity securities, including restricted securities, for which market quotations are readily available, are valued at the last reported sale price or official closing price as reported by a third party pricing vendor on the primary market or exchange on which they are traded and are categorized as Level 1 in the hierarchy. In the event there were no sales during the day or closing prices are not available, securities are valued at the last quoted bid price or may be valued using the last available price and are generally categorized as Level 2 in the hierarchy. For foreign equity securities, when market or security specific events arise, comparisons to the valuation of American Depositary Receipts (ADRs), futures contracts, Exchange-Traded Funds (ETFs) and certain indexes as well as quoted prices for similar securities may be used and would be categorized as Level 2 in the hierarchy. For equity securities, including restricted securities, where observable inputs are limited, assumptions about market activity and risk are used and these securities may be categorized as Level 3 in the hierarchy.
Investments in open-end mutual funds, including other Fidelity Central Funds, are valued at their closing net asset value (NAV) each business day and are categorized as Level 1 in the hierarchy.
Changes in valuation techniques may result in transfers in or out of an assigned level within the disclosure hierarchy. The aggregate value of investments by input level as of September 30, 2020 is included at the end of the Fund's Schedule of Investments.
Investment Transactions and Income. For financial reporting purposes, the Fund's investment holdings and NAV include trades executed through the end of the last business day of the period. The NAV per share for processing shareholder transactions is calculated as of the close of business of the New York Stock Exchange (NYSE), normally 4:00 p.m. Eastern time and includes trades executed through the end of the prior business day. Gains and losses on securities sold are determined on the basis of identified cost. Dividend income is recorded on the ex-dividend date, except for certain dividends from foreign securities where the ex-dividend date may have passed, which are recorded as soon as the Fund is informed of the ex-dividend date. Non-cash dividends included in dividend income, if any, are recorded at the fair market value of the securities received. Income and capital gain distributions from Fidelity Central Funds, if any, are recorded on the ex-dividend date. Certain distributions received by the Fund represent a return of capital or capital gain. The Fund determines the components of these distributions subsequent to the ex-dividend date, based upon receipt of tax filings or other correspondence relating to the underlying investment. These distributions are recorded as a reduction of cost of investments and/or as a realized gain.
Expenses. Expenses directly attributable to a fund are charged to that fund. Expenses attributable to more than one fund are allocated among the respective funds on the basis of relative net assets or other appropriate methods. Expense estimates are accrued in the period to which they relate and adjustments are made when actual amounts are known.
Income Tax Information and Distributions to Shareholders. Each year, the Fund intends to qualify as a regulated investment company under Subchapter M of the Internal Revenue Code, including distributing substantially all of its taxable income and realized gains. As a result, no provision for U.S. Federal income taxes is required. As of September 30, 2020, the Fund did not have any unrecognized tax benefits in the financial statements; nor is the Fund aware of any tax positions for which it is reasonably possible that the total amounts of unrecognized tax benefits will significantly change in the next twelve months. The Fund files a U.S. federal tax return, in addition to state and local tax returns as required. The Fund's federal income tax returns are subject to examination by the Internal Revenue Service (IRS) for a period of three fiscal years after they are filed. State and local tax returns may be subject to examination for an additional fiscal year depending on the jurisdiction.
Distributions are declared and recorded on the ex-dividend date. Income and capital gain distributions are determined in accordance with income tax regulations, which may differ from GAAP.
Capital accounts within the financial statements are adjusted for permanent book-tax differences. These adjustments have no impact on net assets or the results of operations. Capital accounts are not adjusted for temporary book-tax differences which will reverse in a subsequent period.
Book-tax differences are primarily due to capital loss carryforwards and losses deferred due to wash sales.
As of period end, the cost and unrealized appreciation (depreciation) in securities, and derivatives if applicable, for federal income tax purposes were as follows:
| Gross unrealized appreciation | $61,339,544 |
| Gross unrealized depreciation | (86,805,373) |
| Net unrealized appreciation (depreciation) | $(25,465,829) |
| Tax Cost | $726,720,540 |
The tax-based components of distributable earnings as of period end were as follows:
| Undistributed ordinary income | $3,416,236 |
| Capital loss carryforward | $(97,699,788) |
| Net unrealized appreciation (depreciation) on securities and other investments | $(25,465,829) |
Capital loss carryforwards are only available to offset future capital gains of the Fund to the extent provided by regulations and may be limited. The capital loss carryforward information presented below, including any applicable limitation, is estimated as of fiscal period end and is subject to adjustment.
| No expiration | |
| Short-term | $(97,699,788) |
The tax character of distributions paid was as follows:
| September 30, 2020 | September 30, 2019 | |
| Ordinary Income | $19,495,484 | $ 4,921,589 |
| Long-term Capital Gains | – | 2,205,732 |
| Total | $19,495,484 | $ 7,127,321 |
4. Purchases and Sales of Investments.
Purchases and sales of securities, other than short-term securities and in-kind transactions are noted in the table below.
| Purchases ($) | Sales ($) | |
| Fidelity Real Estate Equity Central Fund | 551,480,687 | 636,105,238 |
5. Fees and Other Transactions with Affiliates.
Management Fee and Expense Contract. Fidelity Management & Research Company LLC (the investment adviser) provides the Fund with investment management services. The Fund does not pay any fees for these services. Pursuant to the Fund's management contract, the investment adviser receives a monthly management fee that represents a portion of the management fees it receives from the Investing Funds. In addition, under an expense contract, the investment adviser also pays all other expenses of the Fund, excluding custody fees, the compensation of the independent Directors, and certain miscellaneous expenses such as proxy and shareholder meeting expenses.
Brokerage Commissions. A portion of portfolio transactions were placed with brokerage firms which are affiliates of the investment adviser. Brokerage commissions are included in net realized gain (loss) and change in net unrealized appreciation (depreciation) in the Statement of Operations. The commissions paid to these affiliated firms were as follows:
| Amount | |
| Fidelity Real Estate Equity Central Fund | $8,311 |
Interfund Lending Program. Pursuant to an Exemptive Order issued by the SEC, the Fund, along with other registered investment companies having management contracts with FMR, or other affiliated entities of FMR, may participate in an interfund lending program. This program provides an alternative credit facility allowing the Fund to borrow from, or lend money to, other participating affiliated funds. At period end, there were no interfund loans outstanding. Activity in this program during the period for which loans were outstanding was as follows:
| Borrower or Lender | Average Loan Balance | Weighted Average Interest Rate | Interest Expense | |
| Fidelity Real Estate Equity Central Fund | Borrower | $5,079,000 | 1.83% | $257 |
Interfund Trades. Funds may purchase from or sell securities to other Fidelity Funds under procedures adopted by the Board. The procedures have been designed to ensure these interfund trades are executed in accordance with Rule 17a-7 of the 1940 Act. Interfund trades are included within the respective purchases and sales amounts shown in the Purchases and Sales of Investments note.
Affiliated Exchanges In-Kind. During the period, the Fund received investments, and cash valued at $505,031,710 in exchange for 4,177,959 shares of the Fund. The amount of in-kind exchanges is included in share transactions in the accompanying Statement of Changes in Net Assets.
6. Security Lending.
The Fund lends portfolio securities from time to time in order to earn additional income. Lending agents are used, including National Financial Services (NFS), an affiliate of the Fund. Pursuant to a securities lending agreement, NFS will receive a fee, which is capped at 9.9% of daily lending revenue, for its services as lending agent. The Fund may lend securities to certain qualified borrowers, including NFS. On the settlement date of the loan, the Fund receives collateral (in the form of U.S. Treasury obligations, letters of credit and/or cash) against the loaned securities and maintains collateral in an amount not less than 100% of the market value of the loaned securities during the period of the loan. The market value of the loaned securities is determined at the close of business of the Fund and any additional required collateral is delivered to the Fund on the next business day. The Fund or borrower may terminate the loan at any time, and if the borrower defaults on its obligation to return the securities loaned because of insolvency or other reasons, the Fund may apply collateral received from the borrower against the obligation. The Fund may experience delays and costs in recovering the securities loaned. Any cash collateral received is invested in the Fidelity Securities Lending Cash Central Fund. The value of loaned securities and cash collateral at period end are disclosed on the Fund's Statement of Assets and Liabilities. Total fees paid by the Fund to NFS, as lending agent, amounted to $40. Security lending income represents the income earned on investing cash collateral, less rebates paid to borrowers and any lending agent fees associated with the loan, plus any premium payments received for lending certain types of securities. Net income from the Fidelity Securities Lending Cash Central Fund during the period is presented in the Statement of Operations as a component of income from Fidelity Central Funds. During the period, there were no securities loaned to NFS.
7. Expense Reductions.
Through arrangements with the Fund's custodian, credits realized as a result of certain uninvested cash balances were used to reduce the Fund's expenses by $172.
8. Other.
The Fund's organizational documents provide former and current directors and officers with a limited indemnification against liabilities arising in connection with the performance of their duties to the Fund. In the normal course of business, the Fund may also enter into contracts that provide general indemnifications. The Fund's maximum exposure under these arrangements is unknown as this would be dependent on future claims that may be made against the Fund. The risk of material loss from such claims is considered remote.
At the end of the period, mutual funds managed by the investment adviser or its affiliates were the owners of record of all of the outstanding shares of the Fund.
9. Coronavirus (COVID-19) Pandemic.
An outbreak of COVID-19 first detected in China during December 2019 has since spread globally and was declared a pandemic by the World Health Organization during March 2020. Developments that disrupt global economies and financial markets, such as the COVID-19 pandemic, may magnify factors that affect the Fund's performance.
Report of Independent Registered Public Accounting Firm
To the Board of Trustees of Fidelity Central Investment Portfolios LLC and Shareholders of Fidelity Real Estate Equity Central Fund:
Opinion on the Financial Statements and Financial Highlights
We have audited the accompanying statement of assets and liabilities of Fidelity Real Estate Equity Central Fund (the "Fund"), a fund of Fidelity Central Investment Portfolios LLC, including the schedule of investments, as of September 30, 2020, the related statement of operations for the year then ended, the statement of changes in net assets for each of the two years in the period then ended, the financial highlights for each of the five years in the period then ended, and the related notes. In our opinion, the financial statements and financial highlights present fairly, in all material respects, the financial position of the Fund as of September 30, 2020, and the results of its operations for the year then ended, the changes in its net assets for each of the two years in the period then ended, and the financial highlights for each of the five years in the period then ended in conformity with accounting principles generally accepted in the United States of America.
Basis for Opinion
These financial statements and financial highlights are the responsibility of the Fund's management. Our responsibility is to express an opinion on the Fund's financial statements and financial highlights based on our audits. We are a public accounting firm registered with the Public Company Accounting Oversight Board (United States) (PCAOB) and are required to be independent with respect to the Fund in accordance with the U.S. federal securities laws and the applicable rules and regulations of the Securities and Exchange Commission and the PCAOB.
We conducted our audits in accordance with the standards of the PCAOB. Those standards require that we plan and perform the audit to obtain reasonable assurance about whether the financial statements and financial highlights are free of material misstatement, whether due to error or fraud. The Fund is not required to have, nor were we engaged to perform, an audit of its internal control over financial reporting. As part of our audits we are required to obtain an understanding of internal control over financial reporting but not for the purpose of expressing an opinion on the effectiveness of the Fund’s internal control over financial reporting. Accordingly, we express no such opinion.
Our audits included performing procedures to assess the risks of material misstatement of the financial statements and financial highlights, whether due to error or fraud, and performing procedures that respond to those risks. Such procedures included examining, on a test basis, evidence regarding the amounts and disclosures in the financial statements and financial highlights. Our audits also included evaluating the accounting principles used and significant estimates made by management, as well as evaluating the overall presentation of the financial statements and financial highlights. Our procedures included confirmation of securities owned as of September 30, 2020, by correspondence with the custodian and brokers; when replies were not received from brokers, we performed other auditing procedures. We believe that our audits provide a reasonable basis for our opinion.
/s/ Deloitte & Touche LLP
Boston, Massachusetts
November 10, 2020
We have served as the auditor of one or more of the Fidelity investment companies since 1999.
Directors and Officers (Trustees and Officers)
The Trustees, Members of the Advisory Board (if any), and officers of the Fidelity Central Investment Portfolios LLC and fund, as applicable, are listed below. The Board of Trustees governs the fund and is responsible for protecting the interests of shareholders. The Trustees are experienced executives who meet periodically throughout the year to oversee the fund's activities, review contractual arrangements with companies that provide services to the fund, oversee management of the risks associated with such activities and contractual arrangements, and review the fund's performance. Except for Bettina Doulton, each of the Trustees oversees 304 funds. Ms. Doulton oversees 203 funds.
The Trustees hold office without limit in time except that (a) any Trustee may resign; (b) any Trustee may be removed by written instrument, signed by at least two-thirds of the number of Trustees prior to such removal; (c) any Trustee who requests to be retired or who has become incapacitated by illness or injury may be retired by written instrument signed by a majority of the other Trustees; and (d) any Trustee may be removed at any special meeting of shareholders by a two-thirds vote of the outstanding voting securities of the trust. Each Trustee who is not an interested person (as defined in the 1940 Act) of the trust and the fund is referred to herein as an Independent Trustee. Each Independent Trustee shall retire not later than the last day of the calendar year in which his or her 75th birthday occurs. The Independent Trustees may waive this mandatory retirement age policy with respect to individual Trustees. Officers and Advisory Board Members hold office without limit in time, except that any officer or Advisory Board Member may resign or may be removed by a vote of a majority of the Trustees at any regular meeting or any special meeting of the Trustees. Except as indicated, each individual has held the office shown or other offices in the same company for the past five years.
The fund’s Statement of Additional Information (SAI) includes more information about the Trustees. To request a free copy, call Fidelity at 1-800-544-8544.
Experience, Skills, Attributes, and Qualifications of the Trustees. The Governance and Nominating Committee has adopted a statement of policy that describes the experience, qualifications, attributes, and skills that are necessary and desirable for potential Independent Trustee candidates (Statement of Policy). The Board believes that each Trustee satisfied at the time he or she was initially elected or appointed a Trustee, and continues to satisfy, the standards contemplated by the Statement of Policy. The Governance and Nominating Committee also engages professional search firms to help identify potential Independent Trustee candidates who have the experience, qualifications, attributes, and skills consistent with the Statement of Policy. From time to time, additional criteria based on the composition and skills of the current Independent Trustees, as well as experience or skills that may be appropriate in light of future changes to board composition, business conditions, and regulatory or other developments, have also been considered by the professional search firms and the Governance and Nominating Committee. In addition, the Board takes into account the Trustees' commitment and participation in Board and committee meetings, as well as their leadership of standing and ad hoc committees throughout their tenure.
In determining that a particular Trustee was and continues to be qualified to serve as a Trustee, the Board has considered a variety of criteria, none of which, in isolation, was controlling. The Board believes that, collectively, the Trustees have balanced and diverse experience, qualifications, attributes, and skills, which allow the Board to operate effectively in governing the fund and protecting the interests of shareholders. Information about the specific experience, skills, attributes, and qualifications of each Trustee, which in each case led to the Board's conclusion that the Trustee should serve (or continue to serve) as a trustee of the fund, is provided below.
Board Structure and Oversight Function. Robert A. Lawrence is an interested person and currently serves as Acting Chairman. The Trustees have determined that an interested Chairman is appropriate and benefits shareholders because an interested Chairman has a personal and professional stake in the quality and continuity of services provided to the fund. Independent Trustees exercise their informed business judgment to appoint an individual of their choosing to serve as Chairman, regardless of whether the Trustee happens to be independent or a member of management. The Independent Trustees have determined that they can act independently and effectively without having an Independent Trustee serve as Chairman and that a key structural component for assuring that they are in a position to do so is for the Independent Trustees to constitute a substantial majority for the Board. The Independent Trustees also regularly meet in executive session. Ned C. Lautenbach and David M. Thomas serve as Co-Lead Independent Trustees and as such each (i) acts as a liaison between the Independent Trustees and management with respect to matters important to the Independent Trustees and (ii) with management prepares agendas for Board meetings.
Fidelity® funds are overseen by different Boards of Trustees. The fund's Board oversees Fidelity's high income and certain equity funds, and other Boards oversee Fidelity's investment-grade bond, money market, asset allocation, and other equity funds. The asset allocation funds may invest in Fidelity® funds overseen by the fund's Board. The use of separate Boards, each with its own committee structure, allows the Trustees of each group of Fidelity® funds to focus on the unique issues of the funds they oversee, including common research, investment, and operational issues. On occasion, the separate Boards establish joint committees to address issues of overlapping consequences for the Fidelity® funds overseen by each Board.
The Trustees operate using a system of committees to facilitate the timely and efficient consideration of all matters of importance to the Trustees, the fund, and fund shareholders and to facilitate compliance with legal and regulatory requirements and oversight of the fund's activities and associated risks. The Board, acting through its committees, has charged FMR and its affiliates with (i) identifying events or circumstances the occurrence of which could have demonstrably adverse effects on the fund's business and/or reputation; (ii) implementing processes and controls to lessen the possibility that such events or circumstances occur or to mitigate the effects of such events or circumstances if they do occur; and (iii) creating and maintaining a system designed to evaluate continuously business and market conditions in order to facilitate the identification and implementation processes described in (i) and (ii) above. Because the day-to-day operations and activities of the fund are carried out by or through FMR, its affiliates, and other service providers, the fund's exposure to risks is mitigated but not eliminated by the processes overseen by the Trustees. While each of the Board's committees has responsibility for overseeing different aspects of the fund's activities, oversight is exercised primarily through the Operations, Audit, and Compliance Committees. Appropriate personnel, including but not limited to the fund's Chief Compliance Officer (CCO), FMR's internal auditor, the independent accountants, the fund's Treasurer and portfolio management personnel, make periodic reports to the Board's committees, as appropriate, including an annual review of Fidelity's risk management program for the Fidelity® funds. The responsibilities of each standing committee, including their oversight responsibilities, are described further under "Standing Committees of the Trustees."
Interested Trustees*:
Correspondence intended for a Trustee who is an interested person may be sent to Fidelity Investments, 245 Summer Street, Boston, Massachusetts 02210.
Name, Year of Birth; Principal Occupations and Other Relevant Experience+
Bettina Doulton (1964)
Year of Election or Appointment: 2020
Trustee
Ms. Doulton also serves as Trustee of other Fidelity® funds. Prior to her retirement, Ms. Doulton served in a variety of positions at Fidelity Investments, including as a managing director of research (2006-2007), portfolio manager to certain Fidelity® funds (1993-2005), equity analyst and portfolio assistant (1990-1993), and research assistant (1987-1990). Ms. Doulton currently owns and operates Phi Builders + Architects and Cellardoor Winery. Previously, Ms. Doulton served as a member of the Board of Brown Capital Management, LLC (2013-2018).
Robert A. Lawrence (1952)
Year of Election or Appointment: 2020
Trustee
Acting Chairman of the Board of Trustees
Mr. Lawrence also serves as Trustee of other funds. Previously, Mr. Lawrence served as a Member of the Advisory Board of certain funds. Prior to his retirement in 2008, Mr. Lawrence served as Vice President of certain Fidelity® funds (2006-2008), Senior Vice President, Head of High Income Division of Fidelity Management & Research Company (investment adviser firm, 2006-2008), and President of Fidelity Strategic Investments (investment adviser firm, 2002-2005).
* Determined to be an “Interested Trustee” by virtue of, among other things, his or her affiliation with the Fidelity Central Investment Portfolios LLC or various entities under common control with FMR.
+ The information includes the Trustee's principal occupation during the last five years and other information relating to the experience, attributes, and skills relevant to the Trustee's qualifications to serve as a Trustee, which led to the conclusion that the Trustee should serve as a Trustee for the fund.
Independent Trustees:
Correspondence intended for an Independent Trustee may be sent to Fidelity Investments, P.O. Box 55235, Boston, Massachusetts 02205-5235.
Name, Year of Birth; Principal Occupations and Other Relevant Experience+
Dennis J. Dirks (1948)
Year of Election or Appointment: 2005
Trustee
Mr. Dirks also serves as Trustee of other Fidelity® funds. Prior to his retirement in May 2003, Mr. Dirks served as Chief Operating Officer and as a member of the Board of The Depository Trust & Clearing Corporation (financial markets infrastructure), President, Chief Operating Officer and a member of the Board of The Depository Trust Company (DTC), President and a member of the Board of the National Securities Clearing Corporation (NSCC), Chief Executive Officer and a member of the Board of the Government Securities Clearing Corporation and Chief Executive Officer and a member of the Board of the Mortgage-Backed Securities Clearing Corporation. Mr. Dirks currently serves as a member of the Finance Committee (2016-present) and Board (2017-present) and is Treasurer (2018-present) of the Asolo Repertory Theatre.
Donald F. Donahue (1950)
Year of Election or Appointment: 2018
Trustee
Mr. Donahue also serves as Trustee of other Fidelity® funds. Mr. Donahue serves as President and Chief Executive Officer of Miranda Partners, LLC (risk consulting for the financial services industry, 2012-present). Previously, Mr. Donahue served as Chief Executive Officer (2006-2012), Chief Operating Officer (2003-2006) and Managing Director, Customer Marketing and Development (1999-2003) of The Depository Trust & Clearing Corporation (financial markets infrastructure). Mr. Donahue currently serves as a member (2007-present) and Co-Chairman (2016-present) of the Board of United Way of New York, a member of the Board of NYC Leadership Academy (2012-present) and a member of the Board of Advisors of Ripple Labs, Inc. (financial services, 2015-present). Mr. Donahue previously served as a member of the Advisory Board of certain Fidelity® funds (2015-2018).
Vicki L. Fuller (1957)
Year of Election or Appointment: 2020
Trustee
Ms. Fuller also serves as Trustee of other Fidelity® funds. Previously, Ms. Fuller served as a member of the Advisory Board of certain Fidelity® funds (2018-2020), Chief Investment Officer of the New York State Common Retirement Fund (2012-2018) and held a variety of positions at AllianceBernstein L.P. (global asset management, 1985-2012), including Managing Director (2006-2012) and Senior Vice President and Senior Portfolio Manager (2001-2006). Ms. Fuller currently serves as a member of the Board, Audit Committee and Nominating and Governance Committee of The Williams Companies, Inc. (natural gas infrastructure, 2018-present), as a member of the Board, Audit Committee and Nominating and Governance Committee of two Blackstone business development companies (2020-present) and as a member of the Board of Treliant, LLC (consulting, 2019-present).
Patricia L. Kampling (1959)
Year of Election or Appointment: 2020
Trustee
Ms. Kampling also serves as Trustee of other Fidelity® funds. Prior to her retirement, Ms. Kampling served as Chairman of the Board and Chief Executive Officer (2012-2019), President and Chief Operating Officer (2011-2012) and Executive Vice President and Chief Financial Officer (2010-2011) of Alliant Energy Corporation. Ms. Kampling currently serves as a member of the Board, Compensation Committee and Executive Committee and as Chair of the Audit Committee of Briggs & Stratton Corporation (manufacturing, 2011-present) and as a member of the Board, Audit, Finance and Risk Committee and Safety, Environmental, Technology and Operations Committee of American Water Works Company, Inc. (utilities company, 2019-present). In addition, Ms. Kampling currently serves as a member of the Board of the Nature Conservancy, Wisconsin Chapter (2019-present). Previously, Ms. Kampling served as a Member of the Advisory Board of certain Fidelity® funds (2020), a member of the Board of Interstate Power and Light Company (2012-2019) and Wisconsin Power and Light Company (2012-2019) (each a subsidiary of Alliant Energy Corporation) and as a member of the Board and Workforce Development Committee of the Business Roundtable (2018-2019).
Alan J. Lacy (1953)
Year of Election or Appointment: 2008
Trustee
Mr. Lacy also serves as Trustee of other Fidelity® funds. Previously, Mr. Lacy served as Senior Adviser (2007-2014) of Oak Hill Capital Partners, L.P. (private equity), Chief Executive Officer (2005) and Vice Chairman (2005-2006) of Sears Holdings Corporation (retail), Chief Executive Officer and Chairman of the Board of Sears, Roebuck and Co. (retail, 2000-2005), Chairman (2014-2017) and a member of the Board (2010-2017) of Dave & Buster’s Entertainment, Inc. (restaurant and entertainment complexes) and a member of the Board of Bristol-Myers Squibb Company (global pharmaceuticals, 2008-2020). Mr. Lacy currently serves as a Trustee of the California Chapter of The Nature Conservancy (2015-present) and a member of the Board of the Center for Advanced Study in the Behavioral Sciences at Stanford University (2015-present).
Ned C. Lautenbach (1944)
Year of Election or Appointment: 2004
Trustee
Co-Lead Independent Trustee
Mr. Lautenbach also serves as Trustee of other Fidelity® funds. Mr. Lautenbach currently serves as Chair of the Board of Governors, State University System of Florida (2013-present) and is a member of the Council on Foreign Relations (1994-present). He is also a member and has in the past served as Chairman of the Board of Directors of Artis-Naples (2012-present). Previously, Mr. Lautenbach served as a member and then Lead Director of the Board of Directors of Eaton Corporation (diversified industrial, 1997-2016). He was also a Partner at Clayton, Dubilier & Rice, LLC (private equity investment, 1998-2010); as well as Director of Sony Corporation (2006-2007). In addition, Mr. Lautenbach had a 30-year career with IBM (technology company), during which time he served as Senior Vice President and as a member of the Corporate Executive Committee (1968-1998).
Joseph Mauriello (1944)
Year of Election or Appointment: 2008
Trustee
Mr. Mauriello also serves as Trustee of other Fidelity® funds. Prior to his retirement in January 2006, Mr. Mauriello served in numerous senior management positions including Deputy Chairman and Chief Operating Officer (2004-2005), and Vice Chairman of Financial Services (2002-2004) of KPMG LLP US (professional services, 1965-2005). Mr. Mauriello currently serves as a member of the Independent Directors Council Governing Council (2015-present). Previously, Mr. Mauriello served as a member of the Board of XL Group plc. (global insurance and re-insurance, 2006-2018).
Cornelia M. Small (1944)
Year of Election or Appointment: 2005
Trustee
Ms. Small also serves as Trustee of other Fidelity® funds. Previously, Ms. Small served as Chief Investment Officer, Director of Global Equity Investments and a member of Scudder, Stevens & Clark and Scudder Kemper Investments. Ms. Small previously served as a member of the Board (2009-2019) and Chair of the Investment Committee (2010-2019) of the Teagle Foundation and a member of the Investment Committee of the Berkshire Taconic Community Foundation (2008-2019).
Garnett A. Smith (1947)
Year of Election or Appointment: 2018
Trustee
Mr. Smith also serves as Trustee of other Fidelity® funds. Prior to his retirement, Mr. Smith served as Chairman and Chief Executive Officer (1990-1997) and President (1986-1990) of Inbrand Corp. (manufacturer of personal absorbent products). Prior to his employment with Inbrand Corp., he was employed by a retail fabric chain and North Carolina National Bank (now Bank of America). Mr. Smith previously served as a member of the Advisory Board of certain Fidelity® funds (2012-2013).
David M. Thomas (1949)
Year of Election or Appointment: 2008
Trustee
Co-Lead Independent Trustee
Mr. Thomas also serves as Trustee of other Fidelity® funds. Previously, Mr. Thomas served as Executive Chairman (2005-2006) and Chairman and Chief Executive Officer (2000-2005) of IMS Health, Inc. (pharmaceutical and healthcare information solutions). Mr. Thomas currently serves as Non-Executive Chairman of the Board of Fortune Brands Home and Security (home and security products, 2011-present), and a member of the Board (2004-present) and Presiding Director (2013-present) of Interpublic Group of Companies, Inc. (marketing communication).
Susan Tomasky (1953)
Year of Election or Appointment: 2020
Trustee
Ms. Tomasky also serves as Trustee of other Fidelity® funds. Prior to her retirement, Ms. Tomasky served in various executive officer positions at American Electric Power Company, Inc. (1998-2011), including most recently as President of AEP Transmission (2007-2011). Ms. Tomasky currently serves as a member of the Board and Sustainability Committee and as Chair of the Audit Committee of Marathon Petroleum Corporation (2018-present) and as a member of the Board, Corporate Governance Committee and Organization and Compensation Committee and as Chair of the Audit Committee of Public Service Enterprise Group, Inc. (utilities company, 2012-present). In addition, Ms. Tomasky currently serves as a member of the Board of the Columbus Regional Airport Authority (2007-present), as a member of the Board of the Royal Shakespeare Company – America (2009-present), as a member of the Board of the Columbus Association for the Performing Arts (2011-present) and as a member of the Board of Kenyon College (2016-present). Previously, Ms. Tomasky served as a Member of the Advisory Board of certain Fidelity® funds (2020), a member of the Board (2011-2019) and as Lead Independent Director (2015-2018) of Andeavor Corporation (previously Tesoro Corporation) (independent oil refiner and marketer) and as a member of the Board of Summit Midstream Partners LP (energy, 2012-2018).
Michael E. Wiley (1950)
Year of Election or Appointment: 2018
Trustee
Mr. Wiley also serves as Trustee of other Fidelity® funds. Previously, Mr. Wiley served as a member of the Advisory Board of certain Fidelity® funds (2018-2020), Chairman, President and CEO of Baker Hughes, Inc. (oilfield services, 2000-2004). Mr. Wiley also previously served as a member of the Board of Andeavor Corporation (independent oil refiner and marketer, 2005-2018), a member of the Board of Andeavor Logistics LP (natural resources logistics, 2015-2018) and a member of the Board of High Point Resources (exploration and production, 2005-2020).
+ The information includes the Trustee's principal occupation during the last five years and other information relating to the experience, attributes, and skills relevant to the Trustee's qualifications to serve as a Trustee, which led to the conclusion that the Trustee should serve as a Trustee for the fund.
Advisory Board Members and Officers:
Correspondence intended for a Member of the Advisory Board (if any) may be sent to Fidelity Investments, P.O. Box 55235, Boston, Massachusetts 02205-5235. Correspondence intended for an officer or Peter S. Lynch may be sent to Fidelity Investments, 245 Summer Street, Boston, Massachusetts 02210. Officers appear below in alphabetical order.
Name, Year of Birth; Principal Occupation
Lloyd James Austin, III (1953)
Year of Election or Appointment: 2020
Member of the Advisory Board
General Austin also serves as a Member of the Advisory Board of other Fidelity® funds. Prior to his retirement, General Austin (United States Army, Retired) held a variety of positions within the U.S. Government, including Commander, U.S. Central Command (2013-2016), Vice Chief of Staff, U.S. Army (2012-2013) and Commanding General, U.S. Forces – Iraq, Operation New Dawn (2010-2012). General Austin currently serves as a Partner of Pine Island Capital Partners (private equity, 2020-present) and as President of the Austin Strategy Group LLC (consulting, 2016-present). General Austin serves as a member of the Board of Directors of Nucor Corporation (steel products, 2017-present), as a member of the Board of Directors of Tenet Healthcare Corporation (2018-present) and as a member of the Board of Directors of Raytheon Technologies Corporation (aerospace and defense, 2020-present). In addition, General Austin currently serves as a member of the Board of Trustees of the Carnegie Corporation of New York (2017-present) and as a member of the Board of Trustees of Auburn University (2017-present). Previously, General Austin served as a member of the Board of Directors of United Technologies Corporation (aerospace, defense and building, 2016-2020).
Thomas A. Kennedy (1955)
Year of Election or Appointment: 2020
Member of the Advisory Board
Mr. Kennedy also serves as a Member of the Advisory Board of other Fidelity® funds. Previously, Mr. Kennedy held a variety of positions at Raytheon Company (aerospace and defense, 1983-2020), including Chairman and Chief Executive Officer (2014-2020) and Executive Vice President and Chief Operating Officer (2013-2014). Mr. Kennedy currently serves as Executive Chairman of the Board of Directors of Raytheon Technologies Corporation (aerospace and defense, 2020-present). He is also a member of the Rutgers School of Engineering Industry Advisory Board (2011-present) and a member of the UCLA Engineering Dean’s Executive Board (2016-present).
Peter S. Lynch (1944)
Year of Election or Appointment: 2004
Member of the Advisory Board
Mr. Lynch also serves as a Member of the Advisory Board of other Fidelity® funds. Mr. Lynch is Vice Chairman and a Director of Fidelity Management & Research Company LLC (investment adviser firm). In addition, Mr. Lynch serves as a Trustee of Boston College and as the Chairman of the Inner-City Scholarship Fund. Previously, Mr. Lynch served as Vice Chairman and a Director of FMR Co., Inc. (investment adviser firm) and on the Special Olympics International Board of Directors (1997-2006).
Elizabeth Paige Baumann (1968)
Year of Election or Appointment: 2017
Anti-Money Laundering (AML) Officer
Ms. Baumann also serves as AML Officer of other funds. She is Chief AML Officer (2012-present) and Senior Vice President (2014-present) of FMR LLC (diversified financial services company) and is an employee of Fidelity Investments. Previously, Ms. Baumann served as AML Officer of certain funds (2017-2019), as AML Officer of the funds (2012-2016), and Vice President (2007-2014) and Deputy Anti-Money Laundering Officer (2007-2012) of FMR LLC.
Craig S. Brown (1977)
Year of Election or Appointment: 2019
Assistant Treasurer
Mr. Brown also serves as Assistant Treasurer of other funds. Mr. Brown is an employee of Fidelity Investments (2013-present).
John J. Burke III (1964)
Year of Election or Appointment: 2018
Chief Financial Officer
Mr. Burke also serves as Chief Financial Officer of other funds. Mr. Burke serves as Head of Investment Operations for Fidelity Fund and Investment Operations (2018-present) and is an employee of Fidelity Investments (1998-present). Previously Mr. Burke served as head of Asset Management Investment Operations (2012-2018).
William C. Coffey (1969)
Year of Election or Appointment: 2019
Assistant Secretary
Mr. Coffey also serves as Assistant Secretary of other funds. He is Senior Vice President and Deputy General Counsel of FMR LLC (diversified financial services company, 2010-present), and is an employee of Fidelity Investments. Previously, Mr. Coffey served as Secretary and CLO of certain funds (2018-2019); CLO, Secretary, and Senior Vice President of Fidelity Management & Research Company and FMR Co., Inc. (investment adviser firms, 2018-2019); Secretary of Fidelity SelectCo, LLC and Fidelity Investments Money Management, Inc. (investment adviser firms, 2018-2019); CLO of Fidelity Management & Research (Hong Kong) Limited, FMR Investment Management (UK) Limited, and Fidelity Management & Research (Japan) Limited (investment adviser firms, 2018-2019); and Assistant Secretary of certain funds (2009-2018).
Timothy M. Cohen (1969)
Year of Election or Appointment: 2017
Vice President
Mr. Cohen also serves as Vice President of other funds. Mr. Cohen serves as Co-Head of Equity (2018-present), a Director of Fidelity Management & Research (Japan) Limited (investment adviser firm, 2016-present), and is an employee of Fidelity Investments. Previously, Mr. Cohen served as Executive Vice President of Fidelity SelectCo, LLC (2019), Head of Global Equity Research (2016-2018), Chief Investment Officer - Equity and a Director of Fidelity Management & Research (U.K.) Inc. (investment adviser firm, 2013-2015) and as a Director of Fidelity Management & Research (Hong Kong) Limited (investment adviser firm, 2017).
Jonathan Davis (1968)
Year of Election or Appointment: 2010
Assistant Treasurer
Mr. Davis also serves as Assistant Treasurer of other funds. Mr. Davis serves as Assistant Treasurer of FMR Capital, Inc. (2017-present) and is an employee of Fidelity Investments. Previously, Mr. Davis served as Vice President and Associate General Counsel of FMR LLC (diversified financial services company, 2003-2010).
Laura M. Del Prato (1964)
Year of Election or Appointment: 2018
Assistant Treasurer
Ms. Del Prato also serves as an officer of other funds. Ms. Del Prato is an employee of Fidelity Investments (2017-present). Previously, Ms. Del Prato served as President and Treasurer of The North Carolina Capital Management Trust: Cash Portfolio and Term Portfolio (2018-2020). Prior to joining Fidelity Investments, Ms. Del Prato served as a Managing Director and Treasurer of the JPMorgan Mutual Funds (2014-2017). Prior to JPMorgan, Ms. Del Prato served as a partner at Cohen Fund Audit Services (accounting firm, 2012-2013) and KPMG LLP (accounting firm, 2004-2012).
Colm A. Hogan (1973)
Year of Election or Appointment: 2020
Assistant Treasurer
Mr. Hogan also serves as an officer of other funds. Mr. Hogan serves as Assistant Treasurer of FMR Capital, Inc. (2017-present) and is an employee of Fidelity Investments (2005-present). Previously, Mr. Hogan served as Deputy Treasurer of certain Fidelity® funds (2016-2020) and Assistant Treasurer of certain Fidelity® funds (2016-2018).
Pamela R. Holding (1964)
Year of Election or Appointment: 2018
Vice President
Ms. Holding also serves as Vice President of other funds. Ms. Holding serves as Co-Head of Equity (2018-present) and is an employee of Fidelity Investments (2013-present). Previously, Ms. Holding served as Executive Vice President of Fidelity SelectCo, LLC (2019) and as Chief Investment Officer of Fidelity Institutional Asset Management (2013-2018).
Cynthia Lo Bessette (1969)
Year of Election or Appointment: 2019
Secretary and Chief Legal Officer (CLO)
Ms. Lo Bessette also serves as an officer of other funds. Ms. Lo Bessette serves as CLO, Secretary, and Senior Vice President of Fidelity Management & Research Company LLC (investment adviser firm, 2019-present); and CLO of Fidelity Management & Research (Hong Kong) Limited, FMR Investment Management (UK) Limited, and Fidelity Management & Research (Japan) Limited (investment adviser firms, 2019-present). She is a Senior Vice President and Deputy General Counsel of FMR LLC (diversified financial services company, 2019-present), and is an employee of Fidelity Investments. Previously, Ms. Lo Bessette served as CLO, Secretary, and Senior Vice President of FMR Co., Inc. (investment adviser firm, 2019); Secretary of Fidelity SelectCo, LLC and Fidelity Investments Money Management, Inc. (investment adviser firms, 2019). Prior to joining Fidelity Investments, Ms. Lo Bessette was Executive Vice President, General Counsel (2016-2019) and Senior Vice President, Deputy General Counsel (2015-2016) of OppenheimerFunds (investment management company) and Deputy Chief Legal Officer (2013-2015) of Jennison Associates LLC (investment adviser firm).
Chris Maher (1972)
Year of Election or Appointment: 2020
Deputy Treasurer
Mr. Maher also serves as an officer of other funds. Mr. Maher serves as Assistant Treasurer of FMR Capital, Inc. (2017-present), and is an employee of Fidelity Investments (2008-present). Previously, Mr. Maher served as Assistant Treasurer of certain funds (2013-2020); Vice President of Asset Management Compliance (2013), Vice President of the Program Management Group of FMR (investment adviser firm, 2010-2013), and Vice President of Valuation Oversight (2008-2010).
Jason P. Pogorelec (1975)
Year of Election or Appointment: 2020
Chief Compliance Officer
Mr. Pogorelec also serves as Chief Compliance Officer of other funds. Mr. Pogorelec is a senior Vice President of Asset Management Compliance for Fidelity Investments and is an employee of Fidelity Investments (2006-present). Previously, Mr. Pogorelec served as Vice President, Associate General Counsel for Fidelity Investments (2010-2020) and Assistant Secretary of certain Fidelity funds (2015-2020).
Stacie M. Smith (1974)
Year of Election or Appointment: 2016
President and Treasurer
Ms. Smith also serves as an officer of other funds. Ms. Smith serves as Assistant Treasurer of FMR Capital, Inc. (2017-present), is an employee of Fidelity Investments (2009-present), and has served in other fund officer roles. Prior to joining Fidelity Investments, Ms. Smith served as Senior Audit Manager of Ernst & Young LLP (accounting firm, 1996-2009). Previously, Ms. Smith served as Assistant Treasurer (2013-2019) and Deputy Treasurer (2013-2016) of certain Fidelity® funds.
Marc L. Spector (1972)
Year of Election or Appointment: 2016
Assistant Treasurer
Mr. Spector also serves as an officer of other funds. Mr. Spector serves as Assistant Treasurer of FMR Capital, Inc. (2017-present) and is an employee of Fidelity Investments (2016-present). Prior to joining Fidelity Investments, Mr. Spector served as Director at the Siegfried Group (accounting firm, 2013-2016), and prior to Siegfried Group as audit senior manager at Deloitte & Touche LLP (accounting firm, 2005-2013).
Jim Wegmann (1979)
Year of Election or Appointment: 2019
Assistant Treasurer
Mr. Wegmann also serves as Assistant Treasurer of other funds. Mr. Wegmann is an employee of Fidelity Investments (2011-present).
Shareholder Expense Example
As a shareholder, you incur two types of costs: (1) transaction costs, which may include sales charges (loads) on purchase payments or redemption proceeds, as applicable and (2) ongoing costs, which generally include management fees, distribution and/or service (12b-1) fees and other Fund expenses. This Example is intended to help you understand your ongoing costs (in dollars) of investing in a fund and to compare these costs with the ongoing costs of investing in other mutual funds.
The Example is based on an investment of $1,000 invested at the beginning of the period and held for the entire period (April 1, 2020 to September 30, 2020).
Actual Expenses
The first line of the accompanying table provides information about actual account values and actual expenses. You may use the information in this line, together with the amount you invested, to estimate the expenses that you paid over the period. Simply divide your account value by $1,000.00 (for example, an $8,600 account value divided by $1,000.00 = 8.6), then multiply the result by the number in the first line for a class/Fund under the heading entitled "Expenses Paid During Period" to estimate the expenses you paid on your account during this period. If any fund is a shareholder of any underlying mutual funds or exchange-traded funds (ETFs) (the Underlying Funds), such fund indirectly bears its proportional share of the expenses of the Underlying Funds in addition to the direct expenses incurred presented in the table. These fees and expenses are not included in the annualized expense ratio used to calculate the expense estimate in the table below.
Hypothetical Example for Comparison Purposes
The second line of the accompanying table provides information about hypothetical account values and hypothetical expenses based on the actual expense ratio and an assumed rate of return of 5% per year before expenses, which is not the actual return. The hypothetical account values and expenses may not be used to estimate the actual ending account balance or expenses you paid for the period. You may use this information to compare the ongoing costs of investing in the Fund and other funds. To do so, compare this 5% hypothetical example with the 5% hypothetical examples that appear in the shareholder reports of the other funds. If any fund is a shareholder of any Underlying Funds, such fund indirectly bears its proportional share of the expenses of the Underlying Funds in addition to the direct expenses as presented in the table. These fees and expenses are not included in the annualized expense ratio used to calculate the expense estimate in the table below.
Please note that the expenses shown in the table are meant to highlight your ongoing costs only and do not reflect any transaction costs. Therefore, the second line of the table is useful in comparing ongoing costs only, and will not help you determine the relative total costs of owning different funds.
| Annualized Expense Ratio-A | Beginning Account Value April 1, 2020 | Ending Account Value September 30, 2020 | Expenses Paid During Period-B April 1, 2020 to September 30, 2020 | |
| Fidelity Real Estate Equity Central Fund | .0032% | |||
| Actual | $1,000.00 | $1,162.00 | $.02 | |
| Hypothetical-C | $1,000.00 | $1,024.98 | $.02 |
A Annualized expense ratio reflects expenses net of applicable fee waivers.
B Expenses are equal to the annualized expense ratio, multiplied by the average account value over the period, multiplied by 183/ 366 (to reflect the one-half year period). The fees and expenses of any Underlying Funds are not included in each annualized expense ratio.
C 5% return per year before expenses
Distributions (Unaudited)
The fund designates 1% of the dividends distributed in November and December, respectively during the fiscal year as amounts which may be taken into account as a dividend for the purposes of the maximum rate under section 1(h)(11) of the Internal Revenue Code.
A percentage of the dividends distributed during the fiscal year qualify as a Section 199A dividend:
| October, 2019 | 100% |
| November, 2019 | 100% |
| December, 2019 | 98% |
| March, 2020 | 100% |
| April, 2020 | 100% |
| May, 2020 | 100% |
| June, 2020 | 100% |
| July, 2020 | 100% |
| August, 2020 | 100% |
| September, 2020 | 100% |
The fund will notify shareholders in January 2021 of amounts for use in preparing 2020 income tax returns.
![]()
ESCIP-ANN-1120
1.831584.114
Item 2.
Code of Ethics
As of the end of the period, September 30, 2020, Fidelity Central Investment Portfolios LLC (the trust) has adopted a code of ethics, as defined in Item 2 of Form N-CSR, that applies to its President and Treasurer and its Chief Financial Officer. A copy of the code of ethics is filed as an exhibit to this Form N-CSR.
Item 3.
Audit Committee Financial Expert
The Board of Trustees of the trust has determined that Joseph Mauriello is an audit committee financial expert, as defined in Item 3 of Form N-CSR. Mr. Mauriello is independent for purposes of Item 3 of Form N-CSR.
Item 4.
Principal Accountant Fees and Services
Fees and Services
The following table presents fees billed by Deloitte & Touche LLP, the member firms of Deloitte Touche Tohmatsu, and their respective affiliates (collectively, “Deloitte Entities”) in each of the last two fiscal years for services rendered to Fidelity Emerging Markets Equity Central Fund, Fidelity Floating Rate Central Fund, Fidelity International Equity Central Fund, and Fidelity Real Estate Equity Central Fund (the “Fund(s)”):
Services Billed by Deloitte Entities
September 30, 2020 FeesA
Audit Fees | Audit-Related Fees | Tax Fees | All Other Fees | |
Fidelity Emerging Markets Equity Central Fund | $40,200 | $- | $10,000 | $1,000 |
Fidelity Floating Rate Central Fund | $75,500 | $- | $8,800 | $1,600 |
Fidelity International Equity Central Fund | $45,200 | $- | $10,000 | $1,100 |
Fidelity Real Estate Equity Central Fund | $37,900 | $- | $8,100 | $900 |
September 30, 2019 FeesA
Audit Fees | Audit-Related Fees | Tax Fees | All Other Fees | |
Fidelity Emerging Markets Equity Central Fund | $44,000 | $100 | $6,300 | $1,200 |
Fidelity Floating Rate Central Fund | $79,000 | $100 | $6,300 | $2,100 |
Fidelity International Equity Central Fund | $49,000 | $100 | $6,400 | $1,300 |
Fidelity Real Estate Central Fund | $41,000 | $100 | $5,700 | $1,100 |
A Amounts may reflect rounding.
The following table(s) present(s) fees billed by Deloitte Entities that were required to be approved by the Audit Committee for services that relate directly to the operations and financial reporting of the Fund(s) and that are rendered on behalf of Fidelity Management & Research Company LLC ("FMR") and entities controlling, controlled by, or under common control with FMR (not including any sub-adviser whose role is primarily portfolio management and is subcontracted with or overseen by another investment adviser) that provide ongoing services to the Fund(s) (“Fund Service Providers”):
Services Billed by Deloitte Entities
September 30, 2020A | September 30, 2019A | |
Audit-Related Fees | $- | $290,000 |
Tax Fees | $3,000 | $- |
All Other Fees | $- | $- |
A Amounts may reflect rounding.
“Audit-Related Fees” represent fees billed for assurance and related services that are reasonably related to the performance of the fund audit or the review of the fund's financial statements and that are not reported under Audit Fees.
“Tax Fees” represent fees billed for tax compliance, tax advice or tax planning that relate directly to the operations and financial reporting of the fund.
“All Other Fees” represent fees billed for services provided to the fund or Fund Service Provider, a significant portion of which are assurance related, that relate directly to the operations and financial reporting of the fund, excluding those services that are reported under Audit Fees, Audit-Related Fees or Tax Fees.
Assurance services must be performed by an independent public accountant.
* * *
The aggregate non-audit fees billed by Deloitte Entities for services rendered to the Fund(s), FMR (not including any sub-adviser whose role is primarily portfolio management and is subcontracted with or overseen by another investment adviser), and any Fund Service Provider for each of the last two fiscal years of the Fund(s) are as follows:
Billed By | September 30, 2020A | September 30, 2019A |
Deloitte Entities | $546,100 | $675,000 |
A Amounts may reflect rounding.
The trust's Audit Committee has considered non-audit services that were not pre-approved that were provided by Deloitte Entities to Fund Service Providers to be compatible with maintaining the independence of Deloitte Entities in its(their) audit of the Fund(s), taking into account representations from Deloitte Entities, in accordance with Public Company Accounting Oversight Board rules, regarding its independence from the Fund(s) and its(their) related entities and FMR’s review of the appropriateness and permissibility under applicable law of such non-audit services prior to their provision to the Fund(s) Service Providers.
Audit Committee Pre-Approval Policies and Procedures
The trust’s Audit Committee must pre-approve all audit and non-audit services provided by a fund’s independent registered public accounting firm relating to the operations or financial reporting of the fund. Prior to the commencement of any audit or non-audit services to a fund, the Audit Committee reviews the services to determine whether they are appropriate and permissible under applicable law.
The Audit Committee has adopted policies and procedures to, among other purposes, provide a framework for the Committee’s consideration of non-audit services by the audit firms that audit the Fidelity funds. The policies and procedures require that any non-audit service provided by a fund audit firm to a Fidelity fund and any non-audit service provided by a fund auditor to a Fund Service Provider that relates directly to the operations and financial reporting of a Fidelity fund (“Covered Service”) are subject to approval by the Audit Committee before such service is provided.
All Covered Services must be approved in advance of provision of the service either: (i) by formal resolution of the Audit Committee, or (ii) by oral or written approval of the service by the Chair of the Audit Committee (or if the Chair is unavailable, such other member of the Audit Committee as may be designated by the Chair to act in the Chair’s absence). The approval contemplated by (ii) above is permitted where the Treasurer determines that action on such an engagement is necessary before the next meeting of the Audit Committee.
Non-audit services provided by a fund audit firm to a Fund Service Provider that do not relate directly to the operations and financial reporting of a Fidelity fund are reported to the Audit Committee periodically.
Non-Audit Services Approved Pursuant to Rule 2-01(c)(7)(i)(C) and (ii) of Regulation S-X (“De Minimis Exception”)
There were no non-audit services approved or required to be approved by the Audit Committee pursuant to the De Minimis Exception during the Fund’s(s’) last two fiscal years relating to services provided to (i) the Fund(s) or (ii) any Fund Service Provider that relate directly to the operations and financial reporting of the Fund(s).
Item 5.
Audit Committee of Listed Registrants
Not applicable.
Item 6.
Investments
(a)
Not applicable.
(b)
Not applicable.
Item 7.
Disclosure of Proxy Voting Policies and Procedures for Closed-End Management Investment Companies
Not applicable.
Item 8.
Portfolio Managers of Closed-End Management Investment Companies
Not applicable.
Item 9.
Purchase of Equity Securities by Closed-End Management Investment Company and Affiliated Purchasers
Not applicable.
Item 10.
Submission of Matters to a Vote of Security Holders
There were no material changes to the procedures by which shareholders may recommend nominees to the trust’s Board of Trustees.
Item 11.
Controls and Procedures
(a)(i) The President and Treasurer and the Chief Financial Officer have concluded that the trust’s disclosure controls and procedures (as defined in Rule 30a-3(c) under the Investment Company Act) provide reasonable assurances that material information
relating to the trust is made known to them by the appropriate persons, based on their evaluation of these controls and procedures as of a date within 90 days of the filing date of this report.
(a)(ii) There was no change in the trust’s internal control over financial reporting (as defined in Rule 30a-3(d) under the Investment Company Act) that occurred during the period covered by this report that has materially affected, or is reasonably likely to materially affect, the trust’s internal control over financial reporting.
Item 12.
Disclosure of Securities Lending Activities for Closed-End Management
Investment Companies
Not applicable.
Item 13.
Exhibits
(a) | (1) | Code of Ethics pursuant to Item 2 of Form N-CSR is filed and attached hereto as EX-99.CODE ETH. |
(a) | (2) | |
(a) | (3) | Not applicable. |
(b) |
SIGNATURES
Pursuant to the requirements of the Securities Exchange Act of 1934 and the Investment Company Act of 1940, the registrant has duly caused this report to be signed on its behalf by the undersigned, thereunto duly authorized.
Fidelity Central Investment Portfolios LLC
By: | /s/Stacie M. Smith |
Stacie M. Smith | |
President and Treasurer | |
Date: | November 19, 2020 |
Pursuant to the requirements of the Securities Exchange Act of 1934 and the Investment Company Act of 1940, this report has been signed below by the following persons on behalf of the registrant and in the capacities and on the dates indicated.
By: | /s/Stacie M. Smith |
Stacie M. Smith | |
President and Treasurer | |
Date: | November 19, 2020 |
By: | /s/John J. Burke III |
John J. Burke III | |
Chief Financial Officer | |
Date: | November 19, 2020 |