UNITED STATES
SECURITIES AND EXCHANGE COMMISSION
Washington, D.C. 20549
FORM N-CSR
CERTIFIED SHAREHOLDER REPORT OF REGISTERED
MANAGEMENT INVESTMENT COMPANIES
Investment Company Act file number 811-21667
Fidelity Central Investment Portfolios LLC
(Exact name of registrant as specified in charter)
245 Summer St., Boston, Massachusetts 02210
(Address of principal executive offices) (Zip code)
Cynthia Lo Bessette, Secretary
245 Summer St.
Boston, Massachusetts 02210
(Name and address of agent for service)
Registrant's telephone number, including area code:
617-563-7000
Date of fiscal year end: | September 30 |
Date of reporting period: | September 30, 2021 |
Item 1.
Reports to Stockholders
Fidelity® Emerging Markets Equity Central Fund
September 30, 2021

Contents
Board Approval of Investment Advisory Contracts and Management Fees |
To view a fund's proxy voting guidelines and proxy voting record for the 12-month period ended June 30, visit http://www.fidelity.com/proxyvotingresults or visit the Securities and Exchange Commission's (SEC) web site at http://www.sec.gov.
You may also call 1-800-544-8544 to request a free copy of the proxy voting guidelines.
Standard & Poor's, S&P and S&P 500 are registered service marks of The McGraw-Hill Companies, Inc. and have been licensed for use by Fidelity Distributors Corporation.
Other third-party marks appearing herein are the property of their respective owners.
All other marks appearing herein are registered or unregistered trademarks or service marks of FMR LLC or an affiliated company. © 2021 FMR LLC. All rights reserved.
A fund files its complete schedule of portfolio holdings with the SEC for the first and third quarters of each fiscal year on Form N-PORT. Forms N-PORT are available on the SEC’s web site at http://www.sec.gov. A fund's Forms N-PORT may be reviewed and copied at the SEC’s Public Reference Room in Washington, DC. Information regarding the operation of the SEC's Public Reference Room may be obtained by calling 1-800-SEC-0330.
Note to Shareholders:
Early in 2020, the outbreak and spread of COVID-19 emerged as a public health emergency that had a major influence on financial markets, primarily based on its impact on the global economy and corporate earnings. On March 11, 2020, the World Health Organization declared the COVID-19 outbreak a pandemic, citing sustained risk of further global spread. The pandemic prompted a number of measures to limit the spread of COVID-19, including travel and border restrictions, quarantines, and restrictions on large gatherings. In turn, these resulted in lower consumer activity, diminished demand for a wide range of products and services, disruption in manufacturing and supply chains, and – given the wide variability in outcomes regarding the outbreak – significant market uncertainty and volatility. To help stem the turmoil, the U.S. government took unprecedented action – in concert with the U.S. Federal Reserve and central banks around the world – to help support consumers, businesses, and the broader economy, and to limit disruption to the financial system.
In general, the overall impact of the pandemic lessened in 2021, amid a resilient economy and widespread distribution of three COVID-19 vaccines granted emergency use authorization from the U.S. Food and Drug Administration (FDA) early in the year. Still, the situation remains dynamic, and the extent and duration of its influence on financial markets and the economy is highly uncertain, due in part to a recent spike in cases based on highly contagious variants of the coronavirus.
Extreme events such as the COVID-19 crisis are exogenous shocks that can have significant adverse effects on mutual funds and their investments. Although multiple asset classes may be affected by market disruption, the duration and impact may not be the same for all types of assets. Fidelity is committed to helping you stay informed amid news about COVID-19 and during increased market volatility, and we continue to take extra steps to be responsive to customer needs. We encourage you to visit us online, where we offer ongoing updates, commentary, and analysis on the markets and our funds.
Performance: The Bottom Line
Average annual total return reflects the change in the value of an investment, assuming reinvestment of distributions from dividend income and capital gains (the profits earned upon the sale of securities that have grown in value, if any) and assuming a constant rate of performance each year. The hypothetical investment and the average annual total returns do not reflect the deduction of taxes that a shareholder would pay on fund distributions or the redemption of fund shares. During periods of reimbursement by Fidelity, a fund’s total return will be greater than it would be had the reimbursement not occurred. How a fund did yesterday is no guarantee of how it will do tomorrow.
Average Annual Total Returns
| For the periods ended September 30, 2021 | Past 1 year | Past 5 years | Past 10 years |
| Fidelity® Emerging Markets Equity Central Fund | 19.17% | 11.60% | 8.84% |
$10,000 Over 10 Years
Let's say hypothetically that $10,000 was invested in Fidelity® Emerging Markets Equity Central Fund on September 30, 2011.
The chart shows how the value of your investment would have changed, and also shows how the MSCI Emerging Markets Index performed over the same period.
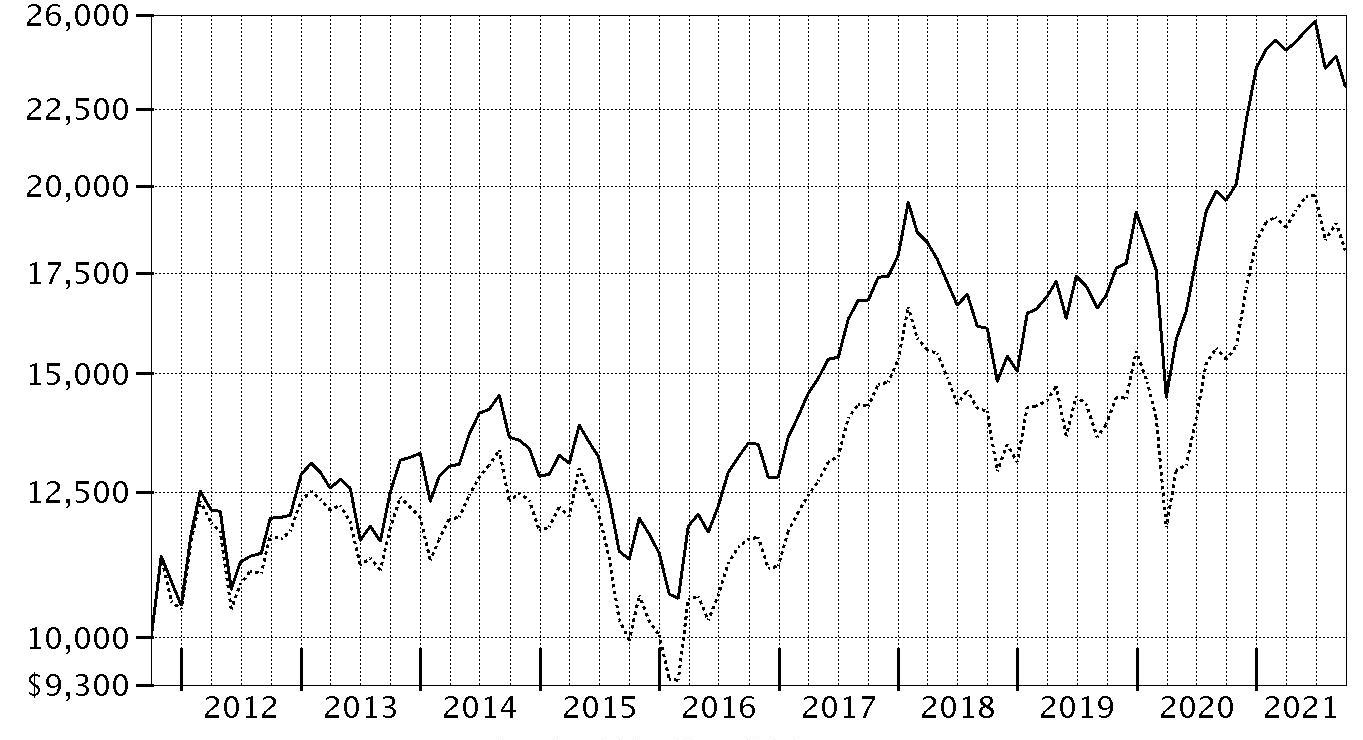
| Period Ending Values | ||
| $23,321 | Fidelity® Emerging Markets Equity Central Fund | |
| $18,125 | MSCI Emerging Markets Index | |
Management's Discussion of Fund Performance
Market Recap: The MSCI ACWI (All Country World Index) ex USA Index gained 24.10% for the 12 months ending September 30, 2021, with international equities rising amid an improved outlook for global economic growth, widespread COVID-19 vaccination, fiscal stimulus in the U.S. and abroad, and government spending programs. As 2021 began, investors saw reasons to be hopeful. The index recorded steady monthly gains as part of the economic “reopening” trade, as investors generally moved out of tech-driven mega-caps that had thrived due to the work-from-home trend in favor of cheap smaller companies they believed stood to benefit from a broad cyclical recovery. However, in early September, sentiment turned broadly negative due to inflationary pressure from surging energy/other commodity prices, rising bond yields, supply constraints and disruption, valuation concerns, and the fast-spreading delta variant of the coronavirus. Overall, foreign exchange had a material impact on market performance, with the U.S. dollar broadly weakening versus developed-market currencies (positive) and strengthening versus emerging markets (negative). By region, Canada (+35%) led, followed by the U.K. (+31%). Conversely, emerging markets (+19%) and Japan (+22%) lagged most. By sector, energy (+57%) fared best by a wide margin. Financials (+43%) and information technology (+37%) also stood out. In contrast, communication services, consumer staples and consumer discretionary (+10% each) notably trailed the index.Comments from Co-Managers Priyanshu Bakshi, Di Chen and Steven Kaye: For the fiscal year ending September 30, 2021, the fund gained 19.17%, outperforming the 17.62% advance of the Fidelity Emerging Markets Equity Central Fund Linked Index, as well as the broad-based MSCI Emerging Markets Net MA Index. From a regional standpoint, an underweighting and stock picks in emerging Asia and a non-benchmark allocation to developed markets contributed to the fund's relative result. Versus the benchmark, security selection in the financials, consumer discretionary and health care sectors added value. Among individual stocks, overweighting bank holding company TCS Group Holding (+265%), a position we initiated during the 12 months, added more value than any other stock. It also helped to own an overweighted stake in China-based video sharing website company Bilibili (+58%). We reduced the fund’s stake in Bilibili by period end. Conversely, underweighting holdings in the Middle East, security selections in Africa and our overall picks in the materials sector detracted from the fund’s relative result. Underweighting energy firm Gazprom (+134%), a stake we established this period, detracted notably. It also hurt to overweight Ping An Insurance Company of China (-31%). Lastly, underweighting information technology outsourcing company Infosys, which gained 68%, hurt on a relative basis. We established the Infosys position the past year. Notable changes in positioning included an increased allocation to Russia and India.The views expressed above reflect those of the portfolio manager(s) only through the end of the period as stated on the cover of this report and do not necessarily represent the views of Fidelity or any other person in the Fidelity organization. Any such views are subject to change at any time based upon market or other conditions and Fidelity disclaims any responsibility to update such views. These views may not be relied on as investment advice and, because investment decisions for a Fidelity fund are based on numerous factors, may not be relied on as an indication of trading intent on behalf of any Fidelity fund.
Notes to shareholders: On October 1, 2020, Guillermo de Las Casas and Will Pruett assumed co-management responsibilities for the fund. On January 30, 2021, Priyanshu Bakshi assumed co-management responsibilities for the fund, succeeding Jane Wu. On February 1, 2021, Takamitsu Nishikawa assumed co-management responsibilities for the fund. On July 1, 2021, Adam Kutas came off of the fund.Investment Summary (Unaudited)
Geographic Diversification (% of fund's net assets)
| As of September 30, 2021 | ||
| Cayman Islands | 22.8% | |
| India | 13.7% | |
| Korea (South) | 12.3% | |
| Taiwan | 9.3% | |
| China | 9.1% | |
| Brazil | 5.5% | |
| United States of America* | 3.9% | |
| Russia | 3.5% | |
| South Africa | 2.6% | |
| Other | 17.3% | |

* Includes Short-Term investments and Net Other Assets (Liabilities).
Percentages are based on country or territory of incorporation and are adjusted for the effect of futures contracts, if applicable.
Asset Allocation as of September 30, 2021
| % of fund's net assets | |
| Stocks and Equity Futures | 99.2 |
| Short-Term Investments and Net Other Assets (Liabilities) | 0.8 |
Top Ten Stocks as of September 30, 2021
| % of fund's net assets | |
| Taiwan Semiconductor Manufacturing Co. Ltd. (Taiwan, Semiconductors & Semiconductor Equipment) | 7.3 |
| Tencent Holdings Ltd. (Cayman Islands, Interactive Media & Services) | 5.6 |
| Samsung Electronics Co. Ltd. (Korea (South), Technology Hardware, Storage & Peripherals) | 4.3 |
| Alibaba Group Holding Ltd. (Cayman Islands, Internet & Direct Marketing Retail) | 3.4 |
| Meituan Class B (Cayman Islands, Internet & Direct Marketing Retail) | 2.2 |
| HDFC Bank Ltd. (India, Banks) | 1.9 |
| Reliance Industries Ltd. (India, Oil, Gas & Consumable Fuels) | 1.9 |
| China Construction Bank Corp. (H Shares) (China, Banks) | 1.4 |
| Sberbank of Russia (Russia, Banks) | 1.3 |
| POSCO (Korea (South), Metals & Mining) | 1.2 |
| 30.5 |
Top Market Sectors as of September 30, 2021
| % of fund's net assets | |
| Information Technology | 20.9 |
| Financials | 19.2 |
| Consumer Discretionary | 14.1 |
| Communication Services | 11.4 |
| Materials | 8.3 |
| Consumer Staples | 5.7 |
| Energy | 5.2 |
| Health Care | 5.1 |
| Industrials | 4.2 |
| Utilities | 2.5 |
Schedule of Investments September 30, 2021
Showing Percentage of Net Assets
| Common Stocks - 95.8% | |||
| Shares | Value | ||
| Belgium - 0.4% | |||
| Titan Cement International Trading SA | 426,600 | $7,080,211 | |
| Bermuda - 1.0% | |||
| China Gas Holdings Ltd. | 1,565,800 | 4,624,501 | |
| Credicorp Ltd. (United States) | 62,609 | 6,945,842 | |
| Huanxi Media Group Ltd. (a) | 7,746,645 | 1,499,327 | |
| Kerry Properties Ltd. | 343,000 | 902,247 | |
| Kunlun Energy Co. Ltd. | 4,082,000 | 4,250,304 | |
| Shangri-La Asia Ltd. (a) | 510,000 | 405,154 | |
| TOTAL BERMUDA | 18,627,375 | ||
| Brazil - 3.2% | |||
| Atacadao SA | 2,057,300 | 6,709,388 | |
| Azul SA sponsored ADR (a)(b) | 211,600 | 4,244,696 | |
| ENGIE Brasil Energia SA | 281,700 | 1,937,746 | |
| Equatorial Energia SA | 909,700 | 4,234,659 | |
| Localiza Rent A Car SA | 271,151 | 2,712,132 | |
| LOG Commercial Properties e Participacoes SA | 181,400 | 863,405 | |
| Natura & Co. Holding SA (a) | 1,128,775 | 9,445,582 | |
| Rede D'Oregon Sao Luiz SA (c) | 221,450 | 2,761,542 | |
| Rumo SA (a) | 1,756,600 | 5,415,841 | |
| Suzano Papel e Celulose SA (a) | 939,000 | 9,400,777 | |
| Transmissora Alianca de Energia Eletrica SA unit | 371,100 | 2,442,313 | |
| Vale SA sponsored ADR | 730,215 | 10,186,499 | |
| TOTAL BRAZIL | 60,354,580 | ||
| British Virgin Islands - 0.2% | |||
| Fix Price Group Ltd. GDR (Reg. S) | 346,682 | 3,099,363 | |
| Mail.Ru Group Ltd. GDR (Reg. S) (a) | 58,036 | 1,190,821 | |
| TOTAL BRITISH VIRGIN ISLANDS | 4,290,184 | ||
| Canada - 0.5% | |||
| Barrick Gold Corp. (b) | 545,000 | 9,837,250 | |
| Cayman Islands - 22.8% | |||
| Akeso, Inc. (a)(c) | 426,931 | 2,336,682 | |
| Alibaba Group Holding Ltd. (a) | 3,512,035 | 65,021,608 | |
| Ant International Co. Ltd. Class C (a)(d)(e) | 436,400 | 865,739 | |
| Anta Sports Products Ltd. | 403,590 | 7,621,184 | |
| Archosaur Games, Inc. (c) | 150,132 | 188,441 | |
| BeiGene Ltd. ADR (a) | 8,775 | 3,185,325 | |
| Bilibili, Inc. ADR (a)(b) | 298,322 | 19,739,967 | |
| Chailease Holding Co. Ltd. | 1,754,989 | 15,424,943 | |
| China Resources Land Ltd. | 853,000 | 3,589,981 | |
| CIFI Holdings Group Co. Ltd. | 4,625,672 | 3,140,185 | |
| CK Asset Holdings Ltd. | 118,500 | 683,718 | |
| ENN Energy Holdings Ltd. | 306,800 | 5,060,201 | |
| ESR Cayman Ltd. (a)(c) | 448,000 | 1,352,110 | |
| Haitian International Holdings Ltd. | 1,227,000 | 3,806,958 | |
| Hansoh Pharmaceutical Group Co. Ltd. (c) | 1,273,486 | 3,223,674 | |
| Innovent Biologics, Inc. (a)(c) | 513,364 | 4,943,825 | |
| iQIYI, Inc. ADR (a)(b) | 82,683 | 663,944 | |
| Jacobio Pharmaceuticals Group Co. Ltd. (c) | 1,122,372 | 2,677,672 | |
| JD Health International, Inc. (c) | 150,017 | 1,445,724 | |
| JD.com, Inc. sponsored ADR (a) | 277,991 | 20,082,070 | |
| KE Holdings, Inc. ADR (a) | 69,600 | 1,270,896 | |
| Kingdee International Software Group Co. Ltd. (a) | 1,147,553 | 3,820,961 | |
| Kuaishou Technology Class B (c) | 1,137,501 | 12,140,203 | |
| Li Auto, Inc. Class A (a) | 91,723 | 1,180,470 | |
| Li Ning Co. Ltd. | 629,277 | 7,252,884 | |
| Longfor Properties Co. Ltd. (c) | 671,000 | 3,065,858 | |
| Medlive Technology Co. Ltd. (c) | 532,486 | 2,549,584 | |
| Medlive Technology Co. Ltd. | 191,500 | 833,561 | |
| Meituan Class B (a)(c) | 1,321,719 | 42,191,187 | |
| NetEase, Inc. ADR | 36,175 | 3,089,345 | |
| PagSeguro Digital Ltd. (a)(b) | 125,109 | 6,470,637 | |
| Parade Technologies Ltd. | 34,900 | 2,044,536 | |
| Pinduoduo, Inc. ADR (a) | 166,239 | 15,072,890 | |
| Pop Mart International Group Ltd. (c) | 367,620 | 2,488,591 | |
| Sea Ltd. ADR (a) | 34,411 | 10,967,818 | |
| Shenzhou International Group Holdings Ltd. | 41,003 | 870,226 | |
| Shimao Property Holdings Ltd. | 1,035,720 | 1,898,280 | |
| Silergy Corp. | 29,000 | 4,221,563 | |
| Tencent Holdings Ltd. | 1,785,759 | 106,607,595 | |
| Tencent Music Entertainment Group ADR (a) | 114,588 | 830,763 | |
| Tongdao Liepin Group (a) | 587,541 | 832,758 | |
| Trip.com Group Ltd. ADR (a) | 131,103 | 4,031,417 | |
| Uni-President China Holdings Ltd. | 3,185,400 | 3,023,572 | |
| Wuxi Biologics (Cayman), Inc. (a)(c) | 705,123 | 11,437,304 | |
| Xiaomi Corp. Class B (a)(c) | 876,460 | 2,407,177 | |
| XPeng, Inc.: | |||
| ADR (a) | 326,751 | 11,612,731 | |
| Class A | 30,921 | 530,864 | |
| Zai Lab Ltd. (a) | 51,805 | 5,551,447 | |
| TOTAL CAYMAN ISLANDS | 433,349,069 | ||
| Chile - 0.7% | |||
| Sociedad Quimica y Minera de Chile SA (PN-B) sponsored ADR | 230,865 | 12,402,068 | |
| China - 8.9% | |||
| Bafang Electric Suzhou Co. Ltd. (A Shares) | 120,300 | 4,877,452 | |
| Beijing Enlight Media Co. Ltd. (A Shares) | 2,363,200 | 3,631,511 | |
| Beijing Sinohytec Co. Ltd. (A Shares) (a) | 39,200 | 1,415,928 | |
| C&S Paper Co. Ltd. (A Shares) | 1,542,100 | 4,121,312 | |
| China Communications Services Corp. Ltd. (H Shares) | 5,406,000 | 2,989,623 | |
| China Construction Bank Corp. (H Shares) | 36,006,000 | 25,696,862 | |
| China Merchants Bank Co. Ltd. (H Shares) | 588,500 | 4,683,370 | |
| China Merchants Shekou Industrial Zone Holdings Co. Ltd. (A Shares) | 1,275,300 | 2,553,380 | |
| China Petroleum & Chemical Corp. (H Shares) | 13,324,000 | 6,565,956 | |
| China Tower Corp. Ltd. (H Shares) (c) | 7,763,439 | 1,014,540 | |
| DBAPPSecurity Ltd. (A Shares) | 82,055 | 4,482,847 | |
| Estun Automation Co. Ltd. (A Shares) | 480,500 | 1,625,151 | |
| Flat Glass Group Co. Ltd. | 575,000 | 2,690,599 | |
| Gemdale Corp. (A Shares) | 1,528,077 | 2,651,004 | |
| Great Wall Motor Co. Ltd. (H Shares) | 2,202,452 | 8,103,991 | |
| Haier Smart Home Co. Ltd. | 1,209,000 | 4,226,492 | |
| Haier Smart Home Co. Ltd. (A Shares) | 232,100 | 933,311 | |
| OPT Machine Vision Tech Co. Ltd. (A Shares) | 28,100 | 1,637,554 | |
| Pharmaron Beijing Co. Ltd. (H Shares) (c) | 303,355 | 7,236,816 | |
| Ping An Insurance Group Co. of China Ltd. (H Shares) | 2,985,500 | 20,418,962 | |
| Poly Developments & Holdings (A Shares) | 1,023,415 | 2,220,824 | |
| Proya Cosmetics Co. Ltd. (A Shares) | 109,500 | 2,937,312 | |
| Shanghai Jinjiang International Hotels Co. Ltd. (A Shares) | 417,075 | 2,934,766 | |
| Shenzhen H&T Intelligent Control Co. Ltd. (A Shares) | 589,564 | 1,891,504 | |
| Shenzhen Mindray Bio-Medical Electronics Co. Ltd. (A Shares) | 122,513 | 7,330,781 | |
| ShenZhen Topband Co. Ltd. (A Shares) | 1,149,462 | 2,558,454 | |
| Sinopec Engineering Group Co. Ltd. (H Shares) | 2,323,500 | 1,177,510 | |
| Sinopharm Group Co. Ltd. (H Shares) | 1,083,049 | 2,838,200 | |
| Sungrow Power Supply Co. Ltd. (A Shares) | 89,873 | 2,047,486 | |
| TravelSky Technology Ltd. (H Shares) | 1,233,000 | 2,378,151 | |
| Tsingtao Brewery Co. Ltd. (H Shares) | 1,740,000 | 13,687,140 | |
| Venus MedTech Hangzhou, Inc. (H Shares) (a)(c) | 374,932 | 1,922,984 | |
| WuXi AppTec Co. Ltd. (H Shares) (c) | 375,027 | 8,730,564 | |
| Zhuzhou CRRC Times Electric Co. Ltd. (H Shares) (a) | 824,500 | 3,777,581 | |
| ZTE Corp. (H Shares) | 527,125 | 1,729,590 | |
| TOTAL CHINA | 169,719,508 | ||
| Cyprus - 1.1% | |||
| TCS Group Holding PLC GDR | 229,174 | 20,839,148 | |
| Egypt - 0.0% | |||
| Six of October Development & Investment Co. | 781,002 | 918,621 | |
| France - 0.1% | |||
| Ubisoft Entertainment SA (a) | 25,489 | 1,526,339 | |
| Germany - 0.1% | |||
| Delivery Hero AG (a)(c) | 17,957 | 2,290,509 | |
| Greece - 0.1% | |||
| Piraeus Financial Holdings SA (a) | 614,200 | 988,455 | |
| Hong Kong - 1.4% | |||
| AIA Group Ltd. | 848,600 | 9,762,640 | |
| Antengene Corp. (c) | 1,555,740 | 2,069,217 | |
| China Overseas Land and Investment Ltd. | 1,228,460 | 2,780,142 | |
| China Resources Beer Holdings Co. Ltd. | 1,140,666 | 8,436,412 | |
| Guangdong Investment Ltd. | 2,356,000 | 3,074,406 | |
| TOTAL HONG KONG | 26,122,817 | ||
| Hungary - 0.7% | |||
| OTP Bank PLC (a) | 172,200 | 10,101,041 | |
| Richter Gedeon PLC | 104,386 | 2,854,669 | |
| TOTAL HUNGARY | 12,955,710 | ||
| India - 13.5% | |||
| Adani Ports & Special Economic Zone Ltd. | 865,508 | 8,576,772 | |
| Apollo Hospitals Enterprise Ltd. | 45,360 | 2,731,931 | |
| Axis Bank Ltd. (a) | 1,405,443 | 14,419,596 | |
| Bajaj Auto Ltd. | 64,260 | 3,313,397 | |
| Bajaj Finance Ltd. | 136,148 | 14,020,273 | |
| Divi's Laboratories Ltd. | 46,688 | 3,016,761 | |
| Embassy Office Parks (REIT) | 292,500 | 1,333,341 | |
| HCL Technologies Ltd. | 762,000 | 13,079,537 | |
| HDFC Bank Ltd. | 1,714,454 | 36,680,455 | |
| Housing Development Finance Corp. Ltd. | 20,100 | 743,430 | |
| Indraprastha Gas Ltd. | 715,120 | 5,123,854 | |
| Indus Towers Ltd. | 130,800 | 541,113 | |
| IndusInd Bank Ltd. | 496,200 | 7,373,200 | |
| Infosys Ltd. | 150,340 | 3,373,270 | |
| ITC Ltd. | 1,516,387 | 4,811,507 | |
| JK Cement Ltd. | 276,698 | 11,577,692 | |
| Larsen & Toubro Ltd. | 501,978 | 11,490,742 | |
| Mahanagar Gas Ltd. | 208,054 | 3,021,533 | |
| Mahindra & Mahindra Ltd. | 232,968 | 2,510,706 | |
| Manappuram General Finance & Leasing Ltd. | 2,069,957 | 4,692,085 | |
| Max Healthcare Institute Ltd. | 369,861 | 1,785,716 | |
| NTPC Ltd. | 2,608,155 | 4,971,316 | |
| Oberoi Realty Ltd. (a) | 285,666 | 3,692,893 | |
| Petronet LNG Ltd. | 727,768 | 2,333,899 | |
| Power Grid Corp. of India Ltd. | 2,438,089 | 6,221,394 | |
| Reliance Industries Ltd. | 1,047,097 | 35,466,274 | |
| Shree Cement Ltd. | 21,927 | 8,532,411 | |
| Shriram Transport Finance Co. Ltd. | 707,200 | 12,310,443 | |
| Sun Pharmaceutical Industries Ltd. | 153,677 | 1,692,465 | |
| Tata Consultancy Services Ltd. | 337,138 | 17,098,813 | |
| Tech Mahindra Ltd. | 144,357 | 2,674,702 | |
| Torrent Pharmaceuticals Ltd. | 74,526 | 3,090,340 | |
| Voltas Ltd. | 24,900 | 406,913 | |
| Zomato Ltd. | 2,033,249 | 3,718,452 | |
| TOTAL INDIA | 256,427,226 | ||
| Indonesia - 1.5% | |||
| PT Bank Central Asia Tbk | 5,007,700 | 12,197,344 | |
| PT Bank Rakyat Indonesia Tbk | 53,418,455 | 14,238,517 | |
| PT United Tractors Tbk | 1,144,100 | 2,058,719 | |
| TOTAL INDONESIA | 28,494,580 | ||
| Japan - 1.1% | |||
| Capcom Co. Ltd. | 66,711 | 1,853,640 | |
| Ibiden Co. Ltd. | 26,240 | 1,443,339 | |
| JTOWER, Inc. (a) | 14,425 | 1,121,096 | |
| Money Forward, Inc. (a) | 34,141 | 2,437,812 | |
| Recruit Holdings Co. Ltd. | 25,003 | 1,528,330 | |
| Renesas Electronics Corp. (a) | 222,068 | 2,733,071 | |
| Square Enix Holdings Co. Ltd. | 37,593 | 2,009,186 | |
| Tokyo Electron Ltd. | 7,800 | 3,445,874 | |
| Z Holdings Corp. | 739,000 | 4,729,645 | |
| TOTAL JAPAN | 21,301,993 | ||
| Korea (South) - 12.0% | |||
| AMOREPACIFIC Group, Inc. | 137,919 | 5,662,888 | |
| Coway Co. Ltd. | 76,770 | 4,789,641 | |
| Hana Financial Group, Inc. | 238,437 | 9,264,453 | |
| Hanon Systems | 252,040 | 3,299,615 | |
| Hyundai Mobis | 23,056 | 4,863,119 | |
| Kakao Corp. | 93,851 | 9,226,058 | |
| KB Financial Group, Inc. | 326,716 | 15,188,147 | |
| Kia Corp. | 187,094 | 12,630,188 | |
| LG Chemical Ltd. | 4,550 | 2,949,712 | |
| LG Corp. | 61,782 | 4,807,639 | |
| NCSOFT Corp. | 6,686 | 3,385,346 | |
| Netmarble Corp. (c) | 7,517 | 741,662 | |
| POSCO | 82,931 | 22,825,843 | |
| S-Oil Corp. | 50,430 | 4,629,762 | |
| Samsung Biologics Co. Ltd. (a)(c) | 11,991 | 8,795,083 | |
| Samsung Electronics Co. Ltd. | 1,319,522 | 81,767,674 | |
| Samsung SDI Co. Ltd. | 19,192 | 11,447,274 | |
| SK Hynix, Inc. | 240,221 | 20,555,499 | |
| Studio Dragon Corp. (a) | 23,840 | 1,764,443 | |
| TOTAL KOREA (SOUTH) | 228,594,046 | ||
| Luxembourg - 0.1% | |||
| Adecoagro SA (a) | 116,204 | 1,049,322 | |
| Globant SA (a) | 4,500 | 1,264,545 | |
| TOTAL LUXEMBOURG | 2,313,867 | ||
| Mauritius - 0.1% | |||
| Jumo World Ltd. (e) | 161 | 1,210,033 | |
| Mexico - 2.6% | |||
| CEMEX S.A.B. de CV sponsored ADR (a) | 2,207,400 | 15,827,058 | |
| Corporacion Inmobiliaria Vesta S.A.B. de CV | 1,043,900 | 1,830,738 | |
| Grupo Aeroportuario del Pacifico S.A.B. de CV Series B | 390,996 | 4,545,945 | |
| Grupo Aeroportuario del Sureste S.A.B. de CV Series B sponsored ADR | 13,000 | 2,431,000 | |
| Grupo Aeroportuario Norte S.A.B. de CV (a) | 290,800 | 1,705,508 | |
| Grupo Financiero Banorte S.A.B. de CV Series O | 2,245,032 | 14,418,714 | |
| Wal-Mart de Mexico SA de CV Series V | 2,459,300 | 8,355,532 | |
| TOTAL MEXICO | 49,114,495 | ||
| Netherlands - 1.9% | |||
| Adyen BV (a)(c) | 759 | 2,121,681 | |
| ASML Holding NV (Netherlands) | 3,823 | 2,856,005 | |
| CTP BV (c) | 46,729 | 1,015,002 | |
| Elastic NV (a) | 14,639 | 2,181,065 | |
| X5 Retail Group NV GDR (Reg. S) | 183,900 | 5,939,659 | |
| Yandex NV Series A (a) | 278,014 | 22,154,936 | |
| TOTAL NETHERLANDS | 36,268,348 | ||
| Panama - 0.2% | |||
| Copa Holdings SA Class A (a) | 54,900 | 4,467,762 | |
| Peru - 0.1% | |||
| Compania de Minas Buenaventura SA sponsored ADR (a) | 359,900 | 2,432,924 | |
| Philippines - 0.1% | |||
| Ayala Land, Inc. | 2,889,700 | 1,894,605 | |
| Poland - 0.2% | |||
| CD Projekt RED SA (b) | 74,695 | 3,601,521 | |
| Russia - 3.5% | |||
| Gazprom OAO sponsored ADR (Reg. S) | 366,900 | 3,626,269 | |
| LSR Group OJSC | 27,000 | 280,789 | |
| Lukoil PJSC sponsored ADR | 181,900 | 17,275,838 | |
| MMC Norilsk Nickel PJSC sponsored ADR | 211,500 | 6,282,586 | |
| Novatek PJSC GDR (Reg. S) | 47,800 | 12,515,229 | |
| Sberbank of Russia | 794,750 | 3,712,862 | |
| Sberbank of Russia sponsored ADR | 1,089,092 | 20,304,538 | |
| Tatneft PAO | 452,300 | 3,282,676 | |
| TOTAL RUSSIA | 67,280,787 | ||
| Saudi Arabia - 0.9% | |||
| Al Rajhi Bank | 500,972 | 16,375,388 | |
| Singapore - 0.3% | |||
| First Resources Ltd. | 5,276,800 | 6,311,530 | |
| South Africa - 2.6% | |||
| Bidvest Group Ltd./The | 377,262 | 4,910,325 | |
| Capitec Bank Holdings Ltd. | 69,199 | 8,359,253 | |
| FirstRand Ltd. | 2,632,028 | 11,275,313 | |
| Impala Platinum Holdings Ltd. | 1,325,000 | 14,932,565 | |
| Pick 'n Pay Stores Ltd. | 2,636,408 | 9,979,265 | |
| TOTAL SOUTH AFRICA | 49,456,721 | ||
| Switzerland - 0.1% | |||
| Dufry AG (a) | 41,566 | 2,335,025 | |
| Taiwan - 9.3% | |||
| ASE Technology Holding Co. Ltd. | 1,280,799 | 4,959,178 | |
| Hon Hai Precision Industry Co. Ltd. (Foxconn) | 620,678 | 2,318,623 | |
| MediaTek, Inc. | 420,712 | 13,552,609 | |
| Taiwan Semiconductor Manufacturing Co. Ltd. | 6,684,706 | 138,365,413 | |
| Uni-President Enterprises Corp. | 3,379,000 | 8,262,061 | |
| United Microelectronics Corp. | 4,042,000 | 9,169,606 | |
| Win Semiconductors Corp. | 16,136 | 177,571 | |
| TOTAL TAIWAN | 176,805,061 | ||
| Thailand - 0.3% | |||
| Land & House PCL (For. Reg.) | 2,767,200 | 646,065 | |
| PTT Global Chemical PCL (For. Reg.) | 3,131,100 | 5,797,198 | |
| TOTAL THAILAND | 6,443,263 | ||
| Turkey - 0.3% | |||
| Aselsan A/S | 3,064,000 | 5,216,345 | |
| United Kingdom - 1.2% | |||
| Helios Towers PLC (a) | 226,500 | 549,625 | |
| Mondi PLC | 503,042 | 12,366,307 | |
| Prudential PLC (a) | 533,698 | 10,356,637 | |
| TOTAL UNITED KINGDOM | 23,272,569 | ||
| United States of America - 2.7% | |||
| Activision Blizzard, Inc. | 30,736 | 2,378,659 | |
| Airbnb, Inc. Class A | 3,000 | 503,250 | |
| Dlocal Ltd. | 53,243 | 2,904,938 | |
| First Cash Financial Services, Inc. | 76,272 | 6,673,800 | |
| Jackson Financial, Inc. | 10,729 | 278,954 | |
| Li Auto, Inc. ADR (a) | 482,259 | 12,678,589 | |
| Marvell Technology, Inc. | 54,023 | 3,258,127 | |
| MercadoLibre, Inc. (a) | 1,625 | 2,729,025 | |
| Microsoft Corp. | 6,900 | 1,945,248 | |
| NVIDIA Corp. | 17,997 | 3,728,259 | |
| ON Semiconductor Corp. (a) | 46,083 | 2,109,219 | |
| Salesforce.com, Inc. (a) | 15,800 | 4,285,276 | |
| Snap, Inc. Class A (a) | 52,856 | 3,904,473 | |
| Synopsys, Inc. (a) | 8,300 | 2,485,103 | |
| XP, Inc. Class A (a) | 31,300 | 1,257,321 | |
| TOTAL UNITED STATES OF AMERICA | 51,120,241 | ||
| TOTAL COMMON STOCKS | |||
| (Cost $1,313,926,384) | 1,822,040,174 | ||
| Preferred Stocks - 3.0% | |||
| Convertible Preferred Stocks - 0.4% | |||
| China - 0.2% | |||
| ByteDance Ltd. Series E1 (a)(d)(e) | 30,246 | 3,579,917 | |
| dMed Biopharmaceutical Co. Ltd. Series C (d)(e) | 52,588 | 727,292 | |
| 4,307,209 | |||
| India - 0.2% | |||
| Meesho Series F (d)(e) | 33,863 | 2,596,354 | |
| TOTAL CONVERTIBLE PREFERRED STOCKS | 6,903,563 | ||
| Nonconvertible Preferred Stocks - 2.6% | |||
| Brazil - 2.3% | |||
| Ambev SA sponsored ADR | 3,388,700 | 9,352,812 | |
| Companhia de Transmissao de Energia Eletrica Paulista (PN) | 280,600 | 1,253,123 | |
| Itau Unibanco Holding SA sponsored ADR | 2,151,943 | 11,340,740 | |
| Metalurgica Gerdau SA (PN) | 3,541,400 | 8,076,792 | |
| Petroleo Brasileiro SA - Petrobras: | |||
| (PN) sponsored ADR (non-vtg.) | 767,100 | 7,671,000 | |
| sponsored ADR | 592,100 | 6,122,314 | |
| 43,816,781 | |||
| Korea (South) - 0.3% | |||
| Hyundai Motor Co. Series 2 | 63,040 | 5,021,356 | |
| Russia - 0.0% | |||
| Tatneft PAO | 77,800 | 517,304 | |
| United States of America - 0.0% | |||
| Gupshup, Inc. (d)(e) | 44,950 | 1,027,791 | |
| TOTAL NONCONVERTIBLE PREFERRED STOCKS | 50,383,232 | ||
| TOTAL PREFERRED STOCKS | |||
| (Cost $49,521,450) | 57,286,795 | ||
| Principal Amount | Value | ||
| Government Obligations - 0.4% | |||
| United States of America - 0.4% | |||
| U.S. Treasury Bills, yield at date of purchase 0.05% 12/2/21 (Cost $7,549,415)(f) | 7,550,000 | 7,549,521 | |
| Shares | Value | ||
| Money Market Funds - 2.1% | |||
| Fidelity Cash Central Fund 0.06% (g) | 20,868,759 | 20,872,933 | |
| Fidelity Securities Lending Cash Central Fund 0.06% (g)(h) | 19,518,751 | 19,520,703 | |
| TOTAL MONEY MARKET FUNDS | |||
| (Cost $40,393,252) | 40,393,636 | ||
| TOTAL INVESTMENT IN SECURITIES - 101.3% | |||
| (Cost $1,411,390,501) | 1,927,270,126 | ||
| NET OTHER ASSETS (LIABILITIES) - (1.3)% | (24,555,778) | ||
| NET ASSETS - 100% | $1,902,714,348 |
| Futures Contracts | |||||
| Number of contracts | Expiration Date | Notional Amount | Value | Unrealized Appreciation/(Depreciation) | |
| Purchased | |||||
| Equity Index Contracts | |||||
| ICE MSCI Emerging Markets Index Contracts (United States) | 126 | Dec. 2021 | $7,847,280 | $(255,884) | $(255,884) |
The notional amount of futures purchased as a percentage of Net Assets is 0.4%
Categorizations in the Schedule of Investments are based on country or territory of incorporation.
Legend
(a) Non-income producing
(b) Security or a portion of the security is on loan at period end.
(c) Security exempt from registration under Rule 144A of the Securities Act of 1933. These securities may be resold in transactions exempt from registration, normally to qualified institutional buyers. At the end of the period, the value of these securities amounted to $131,147,632 or 6.9% of net assets.
(d) Restricted securities (including private placements) - Investment in securities not registered under the Securities Act of 1933 (excluding 144A issues). At the end of the period, the value of restricted securities (excluding 144A issues) amounted to $8,797,093 or 0.5% of net assets.
(e) Level 3 security
(f) Security or a portion of the security was pledged to cover margin requirements for futures contracts. At period end, the value of securities pledged amounted to $623,960.
(g) Affiliated fund that is generally available only to investment companies and other accounts managed by Fidelity Investments. The rate quoted is the annualized seven-day yield of the fund at period end. A complete unaudited listing of the fund's holdings as of its most recent quarter end is available upon request. In addition, each Fidelity Central Fund's financial statements, which are not covered by the Fund's Report of Independent Registered Public Accounting Firm, are available on the SEC's website or upon request.
(h) Investment made with cash collateral received from securities on loan.
Additional information on each restricted holding is as follows:
| Security | Acquisition Date | Acquisition Cost |
| Ant International Co. Ltd. Class C | 5/16/18 | $1,663,286 |
| ByteDance Ltd. Series E1 | 11/18/20 | $3,314,181 |
| dMed Biopharmaceutical Co. Ltd. Series C | 12/1/20 | $746,915 |
| Gupshup, Inc. | 6/8/21 | $1,027,791 |
| Meesho Series F | 9/21/21 | $2,596,355 |
Affiliated Central Funds
Fiscal year to date information regarding the Fund's investments in Fidelity Central Funds, including the ownership percentage, is presented below.
| Fund | Value, beginning of period | Purchases | Sales Proceeds | Dividend Income | Realized Gain/Loss | Change in Unrealized appreciation (depreciation) | Value, end of period | % ownership, end of period |
| Fidelity Cash Central Fund 0.06% | $47,214,048 | $1,102,228,543 | $1,128,570,175 | $42,532 | $516 | $1 | $20,872,933 | 0.0% |
| Fidelity Securities Lending Cash Central Fund 0.06% | 7,941,987 | 613,302,552 | 601,723,836 | 90,509 | -- | -- | 19,520,703 | 0.1% |
| Total | $55,156,035 | $1,715,531,095 | $1,730,294,011 | $133,041 | $516 | $1 | $40,393,636 |
Amounts in the income column in the above table include any capital gain distributions from underlying funds, which are presented in the corresponding line-item in the Statement of Operations, if applicable. Amount for Fidelity Securities Lending Cash Central Fund represents the income earned on investing cash collateral, less rebates paid to borrowers and any lending agent fees associated with the loan, plus any premium payments received for lending certain types of securities.
Investment Valuation
The following is a summary of the inputs used, as of September 30, 2021, involving the Fund's assets and liabilities carried at fair value. The inputs or methodology used for valuing securities may not be an indication of the risk associated with investing in those securities. For more information on valuation inputs, and their aggregation into the levels used below, please refer to the Investment Valuation section in the accompanying Notes to Financial Statements.
| Valuation Inputs at Reporting Date: | ||||
| Description | Total | Level 1 | Level 2 | Level 3 |
| Investments in Securities: | ||||
| Equities: | ||||
| Communication Services | $220,763,679 | $63,729,905 | $157,033,774 | $-- |
| Consumer Discretionary | 266,081,175 | 66,709,972 | 199,371,203 | -- |
| Consumer Staples | 108,085,294 | 44,891,901 | 63,193,393 | -- |
| Energy | 102,065,240 | 17,593,294 | 84,471,946 | -- |
| Financials | 362,418,498 | 87,026,366 | 273,316,360 | 2,075,772 |
| Health Care | 94,323,435 | 8,801,536 | 84,794,607 | 727,292 |
| Industrials | 79,005,355 | 35,649,554 | 43,355,801 | -- |
| Information Technology | 401,276,966 | 30,632,417 | 363,440,487 | 7,204,062 |
| Materials | 160,507,893 | 80,529,675 | 79,978,218 | -- |
| Real Estate | 38,584,084 | 5,164,449 | 33,419,635 | -- |
| Utilities | 46,215,350 | 9,867,841 | 36,347,509 | -- |
| Government Obligations | 7,549,521 | -- | 7,549,521 | -- |
| Money Market Funds | 40,393,636 | 40,393,636 | -- | -- |
| Total Investments in Securities: | $1,927,270,126 | $490,990,546 | $1,426,272,454 | $10,007,126 |
| Derivative Instruments: | ||||
| Liabilities | ||||
| Futures Contracts | $(255,884) | $(255,884) | $-- | $-- |
| Total Liabilities | $(255,884) | $(255,884) | $-- | $-- |
| Total Derivative Instruments: | $(255,884) | $(255,884) | $-- | $-- |
Value of Derivative Instruments
The following table is a summary of the Fund's value of derivative instruments by primary risk exposure as of September 30, 2021. For additional information on derivative instruments, please refer to the Derivative Instruments section in the accompanying Notes to Financial Statements.
| Primary Risk Exposure / Derivative Type | Value | |
| Asset | Liability | |
| Equity Risk | ||
| Futures Contracts(a) | $0 | $(255,884) |
| Total Equity Risk | 0 | (255,884) |
| Total Value of Derivatives | $0 | $(255,884) |
(a) Reflects gross cumulative appreciation (depreciation) on futures contracts as presented in the Schedule of Investments. In the Statement of Assets and Liabilities, the period end daily variation margin is included in receivable or payable for daily variation margin on futures contracts, and the net cumulative appreciation (depreciation) is included in Total accumulated earnings (loss).
See accompanying notes which are an integral part of the financial statements.
Financial Statements
Statement of Assets and Liabilities
| September 30, 2021 | ||
| Assets | ||
| Investment in securities, at value (including securities loaned of $19,575,851) — See accompanying schedule: Unaffiliated issuers (cost $1,370,997,249) | $1,886,876,490 | |
| Fidelity Central Funds (cost $40,393,252) | 40,393,636 | |
| Total Investment in Securities (cost $1,411,390,501) | $1,927,270,126 | |
| Foreign currency held at value (cost $10,332,854) | 10,236,786 | |
| Receivable for investments sold | 10,399,126 | |
| Receivable for fund shares sold | 11,693 | |
| Dividends receivable | 3,653,634 | |
| Distributions receivable from Fidelity Central Funds | 7,082 | |
| Receivable for daily variation margin on futures contracts | 77,823 | |
| Other receivables | 249,835 | |
| Total assets | 1,951,906,105 | |
| Liabilities | ||
| Payable to custodian bank | $1,853,765 | |
| Payable for investments purchased | 16,947,201 | |
| Payable for fund shares redeemed | 492,524 | |
| Other payables and accrued expenses | 10,377,892 | |
| Collateral on securities loaned | 19,520,375 | |
| Total liabilities | 49,191,757 | |
| Net Assets | $1,902,714,348 | |
| Net Assets consist of: | ||
| Paid in capital | $1,286,706,545 | |
| Total accumulated earnings (loss) | 616,007,803 | |
| Net Assets | $1,902,714,348 | |
| Net Asset Value, offering price and redemption price per share ($1,902,714,348 ÷ 6,851,138 shares) | $277.72 |
See accompanying notes which are an integral part of the financial statements.
Statement of Operations
| Year ended September 30, 2021 | ||
| Investment Income | ||
| Dividends | $48,703,219 | |
| Income from Fidelity Central Funds (including $90,509 from security lending) | 133,041 | |
| Income before foreign taxes withheld | 48,836,260 | |
| Less foreign taxes withheld | (6,054,179) | |
| Total income | 42,782,081 | |
| Expenses | ||
| Custodian fees and expenses | $785,294 | |
| Independent directors' fees and expenses | 9,574 | |
| Interest | 3,257 | |
| Miscellaneous | 20 | |
| Total expenses | 798,145 | |
| Net investment income (loss) | 41,983,936 | |
| Realized and Unrealized Gain (Loss) | ||
| Net realized gain (loss) on: | ||
| Investment securities: | ||
| Unaffiliated issuers (net of foreign taxes of $520,469) | 170,066,462 | |
| Fidelity Central Funds | 516 | |
| Foreign currency transactions | (763,944) | |
| Futures contracts | 5,933,728 | |
| Total net realized gain (loss) | 175,236,762 | |
| Change in net unrealized appreciation (depreciation) on: | ||
| Investment securities: | ||
| Unaffiliated issuers (net of increase in deferred foreign taxes of $10,001,285) | 193,642,258 | |
| Fidelity Central Funds | 1 | |
| Assets and liabilities in foreign currencies | (73,930) | |
| Futures contracts | (247,488) | |
| Total change in net unrealized appreciation (depreciation) | 193,320,841 | |
| Net gain (loss) | 368,557,603 | |
| Net increase (decrease) in net assets resulting from operations | $410,541,539 |
See accompanying notes which are an integral part of the financial statements.
Statement of Changes in Net Assets
| Year ended September 30, 2021 | Year ended September 30, 2020 | |
| Increase (Decrease) in Net Assets | ||
| Operations | ||
| Net investment income (loss) | $41,983,936 | $32,586,183 |
| Net realized gain (loss) | 175,236,762 | 7,366,239 |
| Change in net unrealized appreciation (depreciation) | 193,320,841 | 217,587,625 |
| Net increase (decrease) in net assets resulting from operations | 410,541,539 | 257,540,047 |
| Distributions to shareholders | (39,322,546) | (49,669,829) |
| Affiliated share transactions | ||
| Proceeds from sales of shares | 266,859,195 | 101,125,240 |
| Reinvestment of distributions | 39,322,546 | 49,669,829 |
| Cost of shares redeemed | (761,493,626) | (151,723,010) |
| Net increase (decrease) in net assets resulting from share transactions | (455,311,885) | (927,941) |
| Total increase (decrease) in net assets | (84,092,892) | 206,942,277 |
| Net Assets | ||
| Beginning of period | 1,986,807,240 | 1,779,864,963 |
| End of period | $1,902,714,348 | $1,986,807,240 |
| Other Information | ||
| Shares | ||
| Sold | 918,516 | 447,788 |
| Issued in reinvestment of distributions | 136,548 | 230,523 |
| Redeemed | (2,582,041) | (751,353) |
| Net increase (decrease) | (1,526,977) | (73,042) |
See accompanying notes which are an integral part of the financial statements.
Financial Highlights
Fidelity Emerging Markets Equity Central Fund
| Years ended September 30, | 2021 | 2020 | 2019 | 2018 | 2017 |
| Selected Per–Share Data | |||||
| Net asset value, beginning of period | $237.14 | $210.61 | $220.61 | $246.26 | $202.55 |
| Income from Investment Operations | |||||
| Net investment income (loss)A | 5.06 | 3.85 | 7.79B | 5.11 | 4.65 |
| Net realized and unrealized gain (loss) | 40.55 | 28.57 | 1.52 | (14.13) | 44.19 |
| Total from investment operations | 45.61 | 32.42 | 9.31 | (9.02) | 48.84 |
| Distributions from net investment income | (5.03) | (5.52) | (4.54) | (4.95) | (4.06) |
| Distributions from net realized gain | – | (.37) | (14.76) | (11.68) | (1.07) |
| Total distributions | (5.03) | (5.89) | (19.31)C | (16.63) | (5.13) |
| Net asset value, end of period | $277.72 | $237.14 | $210.61 | $220.61 | $246.26 |
| Total ReturnD | 19.17% | 15.71% | 5.22% | (4.20)% | 24.55% |
| Ratios to Average Net AssetsE,F | |||||
| Expenses before reductions | .03% | .05% | .06% | .07% | .07% |
| Expenses net of fee waivers, if any | .03% | .05% | .06% | .07% | .07% |
| Expenses net of all reductions | .03% | .05% | .06% | .07% | .07% |
| Net investment income (loss) | 1.74% | 1.76% | 3.73%B | 2.07% | 2.12% |
| Supplemental Data | |||||
| Net assets, end of period (000 omitted) | $1,902,714 | $1,986,807 | $1,779,865 | $663,813 | $763,186 |
| Portfolio turnover rateG | 68% | 50% | 60% | 65% | 59% |
A Calculated based on average shares outstanding during the period.
B Net investment income per share reflects one or more large, non-recurring dividend(s) which amounted to $2.72 per share. Excluding such non-recurring dividend(s), the ratio of net investment income (loss) to average net assets would have been 2.43%.
C Total distributions per share do not sum due to rounding.
D Total returns would have been lower if certain expenses had not been reduced during the applicable periods shown.
E Fees and expenses of any underlying mutual funds or exchange-traded funds (ETFs) are not included in the Fund's expense ratio. The Fund indirectly bears its proportionate share of these expenses. For additional expense information related to investments in Fidelity Central Funds, please refer to the "Investments in Fidelity Central Funds" note found in the Notes to Financial Statements section of the most recent Annual or Semi-Annual report.
F Expense ratios reflect operating expenses of the class. Expenses before reductions do not reflect amounts reimbursed, waived, or reduced through arrangements with the investment adviser, brokerage services, or other offset arrangements, if applicable, and do not represent the amount paid by the class during periods when reimbursements, waivers or reductions occur.
G Amount does not include the portfolio activity of any underlying mutual funds or exchange-traded funds (ETFs).
See accompanying notes which are an integral part of the financial statements.
Notes to Financial Statements
For the period ended September 30, 2021
1. Organization.
Fidelity Emerging Markets Equity Central Fund (the Fund) is a fund of Fidelity Central Investment Portfolios LLC (the LLC) and is authorized to issue an unlimited number of shares. Shares of the Fund are only offered to other investment companies and accounts managed by Fidelity Management & Research Company LLC (FMR), or its affiliates (the Investing Funds). The LLC is registered under the Investment Company Act of 1940, as amended (the 1940 Act), as an open-end management investment company organized as a Delaware Limited Liability Company. The Fund's investments in emerging markets can be subject to social, economic, regulatory, and political uncertainties and can be extremely volatile.
2. Investments in Fidelity Central Funds.
Funds may invest in Fidelity Central Funds, which are open-end investment companies generally available only to other investment companies and accounts managed by the investment adviser and its affiliates. The Schedule of Investments lists any Fidelity Central Funds held as an investment as of period end, but does not include the underlying holdings of each Fidelity Central Fund. An investing fund indirectly bears its proportionate share of the expenses of the underlying Fidelity Central Funds.
Based on its investment objective, each Fidelity Central Fund may invest or participate in various investment vehicles or strategies that are similar to those of the investing fund. These strategies are consistent with the investment objectives of the investing fund and may involve certain economic risks which may cause a decline in value of each of the Fidelity Central Funds and thus a decline in the value of the investing fund.
| Fidelity Central Fund | Investment Manager | Investment Objective | Investment Practices | Expense Ratio(a) |
| Fidelity Money Market Central Funds | Fidelity Management & Research Company LLC (FMR) | Each fund seeks to obtain a high level of current income consistent with the preservation of capital and liquidity. | Short-term Investments | Less than .005% |
(a) Expenses expressed as a percentage of average net assets and are as of each underlying Central Fund's most recent annual or semi-annual shareholder report.
A complete unaudited list of holdings for each Fidelity Central Fund is available upon request or at the Securities and Exchange Commission website at www.sec.gov. In addition, the financial statements of the Fidelity Central Funds which contain the significant accounting policies (including investment valuation policies) of those funds, and are not covered by the Report of Independent Registered Public Accounting Firm, are available on the Securities and Exchange Commission website or upon request.
3. Significant Accounting Policies.
The Fund is an investment company and applies the accounting and reporting guidance of the Financial Accounting Standards Board (FASB) Accounting Standards Codification Topic 946 Financial Services - Investment Companies. The financial statements have been prepared in conformity with accounting principles generally accepted in the United States of America (GAAP), which require management to make certain estimates and assumptions at the date of the financial statements. Actual results could differ from those estimates. Subsequent events, if any, through the date that the financial statements were issued have been evaluated in the preparation of the financial statements. The Fund's Schedule of Investments lists any underlying mutual funds or exchange-traded funds (ETFs) but does not include the underlying holdings of these funds. The following summarizes the significant accounting policies of the Fund:
Investment Valuation. Investments are valued as of 4:00 p.m. Eastern time on the last calendar day of the period. The Board of Directors (the Board) has delegated the day to day responsibility for the valuation of the Fund's investments to the Fair Value Committee (the Committee) established by the Fund's investment adviser. In accordance with valuation policies and procedures approved by the Board, the Fund attempts to obtain prices from one or more third party pricing vendors or brokers to value its investments. When current market prices, quotations or currency exchange rates are not readily available or reliable, investments will be fair valued in good faith by the Committee, in accordance with procedures adopted by the Board. Factors used in determining fair value vary by investment type and may include market or investment specific events, changes in interest rates and credit quality. The frequency with which these procedures are used cannot be predicted and they may be utilized to a significant extent. The Committee oversees the Fund's valuation policies and procedures and reports to the Board on the Committee's activities and fair value determinations. The Board monitors the appropriateness of the procedures used in valuing the Fund's investments and ratifies the fair value determinations of the Committee.
The Fund categorizes the inputs to valuation techniques used to value its investments into a disclosure hierarchy consisting of three levels as shown below:
- Level 1 – quoted prices in active markets for identical investments
- Level 2 – other significant observable inputs (including quoted prices for similar investments, interest rates, prepayment speeds, etc.)
- Level 3 – unobservable inputs (including the Fund's own assumptions based on the best information available)
Valuation techniques used to value the Fund's investments by major category are as follows:
Equity securities, including restricted securities, for which market quotations are readily available, are valued at the last reported sale price or official closing price as reported by a third party pricing vendor on the primary market or exchange on which they are traded and are categorized as Level 1 in the hierarchy. In the event there were no sales during the day or closing prices are not available, securities are valued at the last quoted bid price or may be valued using the last available price and are generally categorized as Level 2 in the hierarchy. For foreign equity securities, when market or security specific events arise, comparisons to the valuation of American Depositary Receipts (ADRs), futures contracts, Exchange-Traded Funds (ETFs) and certain indexes as well as quoted prices for similar securities may be used and would be categorized as Level 2 in the hierarchy. For equity securities, including restricted securities, where observable inputs are limited, assumptions about market activity and risk are used and these securities may be categorized as Level 3 in the hierarchy.
Debt securities, including restricted securities, are valued based on evaluated prices received from third party pricing vendors or from brokers who make markets in such securities. U.S. government and government agency obligations are valued by pricing vendors who utilize matrix pricing which considers yield or price of bonds of comparable quality, coupon, maturity and type or by broker-supplied prices. When independent prices are unavailable or unreliable, debt securities may be valued utilizing pricing methodologies which consider similar factors that would be used by third party pricing vendors. Debt securities are generally categorized as Level 2 in the hierarchy but may be Level 3 depending on the circumstances.
Futures contracts are valued at the settlement price established each day by the board of trade or exchange on which they are traded and are categorized as Level 1 in the hierarchy. Investments in open-end mutual funds, including other Fidelity Central Funds, are valued at their closing net asset value (NAV) each business day and are categorized as Level 1 in the hierarchy.
Changes in valuation techniques may result in transfers in or out of an assigned level within the disclosure hierarchy. The aggregate value of investments by input level as of September 30, 2021 is included at the end of the Fund's Schedule of Investments.
Foreign Currency. Certain Funds may use foreign currency contracts to facilitate transactions in foreign-denominated securities. Gains and losses from these transactions may arise from changes in the value of the foreign currency or if the counterparties do not perform under the contracts' terms.
Foreign-denominated assets, including investment securities, and liabilities are translated into U.S. dollars at the exchange rates at period end. Purchases and sales of investment securities, income and dividends received, and expenses denominated in foreign currencies are translated into U.S. dollars at the exchange rate in effect on the transaction date.
The effects of exchange rate fluctuations on investments are included with the net realized and unrealized gain (loss) on investment securities. Other foreign currency transactions resulting in realized and unrealized gain (loss) are disclosed separately.
Investment Transactions and Income. For financial reporting purposes, the Fund's investment holdings and NAV include trades executed through the end of the last business day of the period. The NAV per share for processing shareholder transactions is calculated as of the close of business of the New York Stock Exchange (NYSE), normally 4:00 p.m. Eastern time and includes trades executed through the end of the prior business day. Gains and losses on securities sold are determined on the basis of identified cost and include proceeds received from litigation. Dividend income is recorded on the ex-dividend date, except for certain dividends from foreign securities where the ex-dividend date may have passed, which are recorded as soon as the Fund is informed of the ex-dividend date. Non-cash dividends included in dividend income, if any, are recorded at the fair market value of the securities received. Income and capital gain distributions from Fidelity Central Funds, if any, are recorded on the ex-dividend date. Investment income is recorded net of foreign taxes withheld where recovery of such taxes is uncertain. Funds may file withholding tax reclaims in certain jurisdictions to recover a portion of amounts previously withheld. Any withholding tax reclaims income is included in the Statement of Operations in foreign taxes withheld. Any receivables for withholding tax reclaims are included in the Statement of Assets and Liabilities in dividends receivable.
Expenses. Expenses directly attributable to a fund are charged to that fund. Expenses attributable to more than one fund are allocated among the respective funds on the basis of relative net assets or other appropriate methods. Expenses included in the accompanying financial statements reflect the expenses of that fund and do not include any expenses associated with any underlying mutual funds or exchange-traded funds. Although not included in a fund's expenses, a fund indirectly bears its proportionate share of these expenses through the net asset value of each underlying mutual fund or exchange-traded fund. Expense estimates are accrued in the period to which they relate and adjustments are made when actual amounts are known.
Income Tax Information and Distributions to Shareholders. Each year, the Fund intends to qualify as a regulated investment company under Subchapter M of the Internal Revenue Code, including distributing substantially all of its taxable income and realized gains. As a result, no provision for U.S. Federal income taxes is required. As of September 30, 2021, the Fund did not have any unrecognized tax benefits in the financial statements; nor is the Fund aware of any tax positions for which it is reasonably possible that the total amounts of unrecognized tax benefits will significantly change in the next twelve months. The Fund files a U.S. federal tax return, in addition to state and local tax returns as required. The Fund's federal income tax returns are subject to examination by the Internal Revenue Service (IRS) for a period of three fiscal years after they are filed. State and local tax returns may be subject to examination for an additional fiscal year depending on the jurisdiction. Foreign taxes are provided for based on the Fund's understanding of the tax rules and rates that exist in the foreign markets in which it invests. The Fund is subject to a tax imposed on capital gains by certain countries in which it invests. An estimated deferred tax liability for net unrealized appreciation on the applicable securities is included in Other payables and accrued expenses on the Statement of Assets & Liabilities.
Distributions are declared and recorded on the ex-dividend date. Income and capital gain distributions are determined in accordance with income tax regulations, which may differ from GAAP. In addition, the Fund claimed a portion of the payment made to redeeming shareholders as a distribution for income tax purposes.
Capital accounts within the financial statements are adjusted for permanent book-tax differences. These adjustments have no impact on net assets or the results of operations. Capital accounts are not adjusted for temporary book-tax differences which will reverse in a subsequent period.
Book-tax differences are primarily due to futures contracts, foreign currency transactions, certain foreign taxes, passive foreign investment companies (PFIC), capital loss carryforwards and losses deferred due to wash sales.
As of period end, the cost and unrealized appreciation (depreciation) in securities, and derivatives if applicable, for federal income tax purposes were as follows:
| Gross unrealized appreciation | $590,449,754 |
| Gross unrealized depreciation | (88,007,442) |
| Net unrealized appreciation (depreciation) | $502,442,312 |
| Tax Cost | $1,424,827,814 |
The tax-based components of distributable earnings as of period end were as follows:
| Undistributed ordinary income | $4,731,868 |
| Undistributed long-term capital gain | $119,029,974 |
| Net unrealized appreciation (depreciation) on securities and other investments | $502,237,000 |
The tax character of distributions paid was as follows:
| September 30, 2021 | September 30, 2020 | |
| Ordinary Income | $39,322,546 | $ 49,669,829 |
Restricted Securities (including Private Placements). Funds may invest in securities that are subject to legal or contractual restrictions on resale. These securities generally may be resold in transactions exempt from registration or to the public if the securities are registered. Disposal of these securities may involve time-consuming negotiations and expense, and prompt sale at an acceptable price may be difficult. Information regarding restricted securities held at period end is included at the end of the Schedule of Investments, if applicable.
4. Derivative Instruments.
Risk Exposures and the Use of Derivative Instruments. The Fund's investment objective allows the Fund to enter into various types of derivative contracts, including futures contracts. Derivatives are investments whose value is primarily derived from underlying assets, indices or reference rates and may be transacted on an exchange or over-the-counter (OTC). Derivatives may involve a future commitment to buy or sell a specified asset based on specified terms, to exchange future cash flows at periodic intervals based on a notional principal amount, or for one party to make one or more payments upon the occurrence of specified events in exchange for periodic payments from the other party.
The Fund used derivatives to increase returns and to manage exposure to certain risks as defined below. The success of any strategy involving derivatives depends on analysis of numerous economic factors, and if the strategies for investment do not work as intended, the Fund may not achieve its objectives.
The Fund's use of derivatives increased or decreased its exposure to the following risk:
| Equity Risk | Equity risk relates to the fluctuations in the value of financial instruments as a result of changes in market prices (other than those arising from interest rate risk or foreign exchange risk), whether caused by factors specific to an individual investment, its issuer, or all factors affecting all instruments traded in a market or market segment. |
The Fund is also exposed to additional risks from investing in derivatives, such as liquidity risk and counterparty credit risk. Liquidity risk is the risk that the Fund will be unable to close out the derivative in the open market in a timely manner. Counterparty credit risk is the risk that the counterparty will not be able to fulfill its obligation to the Fund. Counterparty credit risk related to exchange-traded futures contracts may be mitigated by the protection provided by the exchange on which they trade.
Investing in derivatives may involve greater risks than investing in the underlying assets directly and, to varying degrees, may involve risk of loss in excess of any initial investment and collateral received and amounts recognized in the Statement of Assets and Liabilities. In addition, there may be the risk that the change in value of the derivative contract does not correspond to the change in value of the underlying instrument.
Futures Contracts. A futures contract is an agreement between two parties to buy or sell a specified underlying instrument for a fixed price at a specified future date. The Fund used futures contracts to manage its exposure to the stock market.
Upon entering into a futures contract, a fund is required to deposit either cash or securities (initial margin) with a clearing broker in an amount equal to a certain percentage of the face value of the contract. Futures contracts are marked-to-market daily and subsequent daily payments (variation margin) are made or received by a fund depending on the daily fluctuations in the value of the futures contracts and are recorded as unrealized appreciation or (depreciation). This receivable and/or payable, if any, is included in daily variation margin on futures contracts in the Statement of Assets and Liabilities. Realized gain or (loss) is recorded upon the expiration or closing of a futures contract. The net realized gain (loss) and change in net unrealized appreciation (depreciation) on futures contracts during the period is presented in the Statement of Operations.
Any open futures contracts at period end are presented in the Schedule of Investments under the caption "Futures Contracts". The notional amount at value reflects each contract's exposure to the underlying instrument or index at period end and is representative of volume of activity during the period. Securities deposited to meet initial margin requirements are identified in the Schedule of Investments.
5. Purchases and Sales of Investments.
Purchases and sales of securities, other than short-term securities and in-kind transactions, as applicable, are noted in the table below.
| Purchases ($) | Sales ($) | |
| Fidelity Emerging Markets Equity Central Fund | 1,538,558,891 | 1,966,409,895 |
6. Fees and Other Transactions with Affiliates.
Management Fee and Expense Contract. Fidelity Management & Research Company LLC (the investment adviser) provides the Fund with investment management services. The Fund does not pay any fees for these services. Pursuant to the Fund's management contract, the investment adviser receives a monthly management fee that represents a portion of the management fees it receives from the Investing Funds. In addition, under an expense contract, the investment adviser also pays all other expenses of the Fund, excluding custody fees, the compensation of the independent Directors, and certain miscellaneous expenses such as proxy and shareholder meeting expenses.
Brokerage Commissions. A portion of portfolio transactions were placed with brokerage firms which are affiliates of the investment adviser. Brokerage commissions are included in net realized gain (loss) and change in net unrealized appreciation (depreciation) in the Statement of Operations. The commissions paid to these affiliated firms were as follows:
| Amount | |
| Fidelity Emerging Markets Equity Central Fund | $7,550 |
Interfund Lending Program. Pursuant to an Exemptive Order issued by the Securities and Exchange Commission (the SEC), the Fund, along with other registered investment companies having management contracts with FMR, or other affiliated entities of FMR, may participate in an interfund lending program. This program provides an alternative credit facility allowing the Fund to borrow from, or lend money to, other participating affiliated funds. At period end, there were no interfund loans outstanding. Activity in this program during the period for which loans were outstanding was as follows:
| Borrower or Lender | Average Loan Balance | Weighted Average Interest Rate | Interest Expense | |
| Fidelity Emerging Markets Equity Central Fund | Borrower | $41,264,444 | .32% | $3,257 |
Interfund Trades. Funds may purchase from or sell securities to other Fidelity Funds under procedures adopted by the Board. The procedures have been designed to ensure these interfund trades are executed in accordance with Rule 17a-7 of the 1940 Act. Any interfund trades are included within the respective purchases and sales amounts shown in the Purchases and Sales of Investments note and are noted in the table below.
| Purchases ($) | Sales ($) | |
| Fidelity Emerging Markets Equity Central Fund | 19,389,193 | 41,399,737 |
7. Security Lending.
Funds lend portfolio securities from time to time in order to earn additional income. Lending agents are used, including National Financial Services (NFS), an affiliate of the investment adviser. Pursuant to a securities lending agreement, NFS will receive a fee, which is capped at 9.9% of a fund's daily lending revenue, for its services as lending agent. A fund may lend securities to certain qualified borrowers, including NFS. On the settlement date of the loan, a fund receives collateral (in the form of U.S. Treasury obligations, letters of credit and/or cash) against the loaned securities and maintains collateral in an amount not less than 100% of the market value of the loaned securities during the period of the loan. The market value of the loaned securities is determined at the close of business of a fund and any additional required collateral is delivered to a fund on the next business day. A fund or borrower may terminate the loan at any time, and if the borrower defaults on its obligation to return the securities loaned because of insolvency or other reasons, a fund may apply collateral received from the borrower against the obligation. A fund may experience delays and costs in recovering the securities loaned. Any cash collateral received is invested in the Fidelity Securities Lending Cash Central Fund. Any loaned securities are identified as such in the Schedule of Investments, and the value of loaned securities and cash collateral at period end, as applicable, are presented in the Statement of Assets and Liabilities. Security lending income represents the income earned on investing cash collateral, less rebates paid to borrowers and any lending agent fees associated with the loan, plus any premium payments received for lending certain types of securities. Security lending income is presented in the Statement of Operations as a component of income from Fidelity Central Funds. Affiliated security lending activity, if any, was as follows:
| Total Security Lending Fees Paid to NFS | Security Lending Income From Securities Loaned to NFS | Value of Securities Loaned to NFS at Period End | |
| Fidelity Emerging Markets Equity Central Fund | $8,973 | $– | $– |
8. Other.
Fund's organizational documents provide former and current directors and officers with a limited indemnification against liabilities arising in connection with the performance of their duties to the fund. In the normal course of business, the fund may also enter into contracts that provide general indemnifications. The fund's maximum exposure under these arrangements is unknown as this would be dependent on future claims that may be made against the fund. The risk of material loss from such claims is considered remote.
At the end of the period, mutual funds managed by the investment adviser or its affiliates were the owners of record of all of the outstanding shares of the Fund.
9. Coronavirus (COVID-19) Pandemic.
An outbreak of COVID-19 first detected in China during December 2019 has since spread globally and was declared a pandemic by the World Health Organization during March 2020. Developments that disrupt global economies and financial markets, such as the COVID-19 pandemic, may magnify factors that affect the Fund's performance.
Report of Independent Registered Public Accounting Firm
To the Board of Trustees of Fidelity Central Investment Portfolios LLC and Shareholders of Fidelity Emerging Markets Equity Central Fund
Opinion on the Financial Statements and Financial Highlights
We have audited the accompanying statement of assets and liabilities of Fidelity Emerging Markets Equity Central Fund (the "Fund"), a fund of Fidelity Central Investment Portfolios LLC, including the schedule of investments, as of September 30, 2021, the related statement of operations for the year then ended, the statement of changes in net assets for each of the two years in the period then ended, the financial highlights for each of the five years in the period then ended, and the related notes. In our opinion, the financial statements and financial highlights present fairly, in all material respects, the financial position of the Fund as of September 30, 2021, and the results of its operations for the year then ended, the changes in its net assets for each of the two years in the period then ended, and the financial highlights for each of the five years in the period then ended in conformity with accounting principles generally accepted in the United States of America.
Basis for Opinion
These financial statements and financial highlights are the responsibility of the Fund's management. Our responsibility is to express an opinion on the Fund's financial statements and financial highlights based on our audits. We are a public accounting firm registered with the Public Company Accounting Oversight Board (United States) (PCAOB) and are required to be independent with respect to the Fund in accordance with the U.S. federal securities laws and the applicable rules and regulations of the Securities and Exchange Commission and the PCAOB.
We conducted our audits in accordance with the standards of the PCAOB. Those standards require that we plan and perform the audit to obtain reasonable assurance about whether the financial statements and financial highlights are free of material misstatement, whether due to error or fraud. The Fund is not required to have, nor were we engaged to perform, an audit of its internal control over financial reporting. As part of our audits we are required to obtain an understanding of internal control over financial reporting but not for the purpose of expressing an opinion on the effectiveness of the Fund’s internal control over financial reporting. Accordingly, we express no such opinion.
Our audits included performing procedures to assess the risks of material misstatement of the financial statements and financial highlights, whether due to error or fraud, and performing procedures that respond to those risks. Such procedures included examining, on a test basis, evidence regarding the amounts and disclosures in the financial statements and financial highlights. Our audits also included evaluating the accounting principles used and significant estimates made by management, as well as evaluating the overall presentation of the financial statements and financial highlights. Our procedures included confirmation of securities owned as of September 30, 2021, by correspondence with the custodian and brokers; when replies were not received from brokers, we performed other auditing procedures. We believe that our audits provide a reasonable basis for our opinion.
/s/ Deloitte & Touche LLP
Boston, Massachusetts
November 11, 2021
We have served as the auditor of one or more of the Fidelity investment companies since 1999.
Directors and Officers (Trustees and Officers)
The Trustees, Members of the Advisory Board (if any), and officers of the Fidelity Central Investment Portfolios LLC and fund, as applicable, are listed below. The Board of Trustees governs the fund and is responsible for protecting the interests of shareholders. The Trustees are experienced executives who meet periodically throughout the year to oversee the fund's activities, review contractual arrangements with companies that provide services to the fund, oversee management of the risks associated with such activities and contractual arrangements, and review the fund's performance. Each of the Trustees oversees 313 funds.
The Trustees hold office without limit in time except that (a) any Trustee may resign; (b) any Trustee may be removed by written instrument, signed by at least two-thirds of the number of Trustees prior to such removal; (c) any Trustee who requests to be retired or who has become incapacitated by illness or injury may be retired by written instrument signed by a majority of the other Trustees; and (d) any Trustee may be removed at any special meeting of shareholders by a two-thirds vote of the outstanding voting securities of the trust. Each Trustee who is not an interested person (as defined in the 1940 Act) of the trust and the fund is referred to herein as an Independent Trustee. Each Independent Trustee shall retire not later than the last day of the calendar year in which his or her 75th birthday occurs. The Independent Trustees may waive this mandatory retirement age policy with respect to individual Trustees. Officers and Advisory Board Members hold office without limit in time, except that any officer or Advisory Board Member may resign or may be removed by a vote of a majority of the Trustees at any regular meeting or any special meeting of the Trustees. Except as indicated, each individual has held the office shown or other offices in the same company for the past five years.
The fund’s Statement of Additional Information (SAI) includes more information about the Trustees. To request a free copy, call Fidelity at 1-800-544-8544.
Experience, Skills, Attributes, and Qualifications of the Trustees. The Governance and Nominating Committee has adopted a statement of policy that describes the experience, qualifications, attributes, and skills that are necessary and desirable for potential Independent Trustee candidates (Statement of Policy). The Board believes that each Trustee satisfied at the time he or she was initially elected or appointed a Trustee, and continues to satisfy, the standards contemplated by the Statement of Policy. The Governance and Nominating Committee also engages professional search firms to help identify potential Independent Trustee candidates who have the experience, qualifications, attributes, and skills consistent with the Statement of Policy. From time to time, additional criteria based on the composition and skills of the current Independent Trustees, as well as experience or skills that may be appropriate in light of future changes to board composition, business conditions, and regulatory or other developments, have also been considered by the professional search firms and the Governance and Nominating Committee. In addition, the Board takes into account the Trustees' commitment and participation in Board and committee meetings, as well as their leadership of standing and ad hoc committees throughout their tenure.
In determining that a particular Trustee was and continues to be qualified to serve as a Trustee, the Board has considered a variety of criteria, none of which, in isolation, was controlling. The Board believes that, collectively, the Trustees have balanced and diverse experience, qualifications, attributes, and skills, which allow the Board to operate effectively in governing the fund and protecting the interests of shareholders. Information about the specific experience, skills, attributes, and qualifications of each Trustee, which in each case led to the Board's conclusion that the Trustee should serve (or continue to serve) as a trustee of the fund, is provided below.
Board Structure and Oversight Function. Robert A. Lawrence is an interested person and currently serves as Acting Chairman. The Trustees have determined that an interested Chairman is appropriate and benefits shareholders because an interested Chairman has a personal and professional stake in the quality and continuity of services provided to the fund. Independent Trustees exercise their informed business judgment to appoint an individual of their choosing to serve as Chairman, regardless of whether the Trustee happens to be independent or a member of management. The Independent Trustees have determined that they can act independently and effectively without having an Independent Trustee serve as Chairman and that a key structural component for assuring that they are in a position to do so is for the Independent Trustees to constitute a substantial majority for the Board. The Independent Trustees also regularly meet in executive session. David M. Thomas serves as Lead Independent Trustee and as such (i) acts as a liaison between the Independent Trustees and management with respect to matters important to the Independent Trustees and (ii) with management prepares agendas for Board meetings.
Fidelity® funds are overseen by different Boards of Trustees. The fund's Board oversees Fidelity's high income and certain equity funds, and other Boards oversee Fidelity's investment-grade bond, money market, asset allocation, and other equity funds. The asset allocation funds may invest in Fidelity® funds overseen by the fund's Board. The use of separate Boards, each with its own committee structure, allows the Trustees of each group of Fidelity® funds to focus on the unique issues of the funds they oversee, including common research, investment, and operational issues. On occasion, the separate Boards establish joint committees to address issues of overlapping consequences for the Fidelity® funds overseen by each Board.
The Trustees operate using a system of committees to facilitate the timely and efficient consideration of all matters of importance to the Trustees, the fund, and fund shareholders and to facilitate compliance with legal and regulatory requirements and oversight of the fund's activities and associated risks. The Board, acting through its committees, has charged FMR and its affiliates with (i) identifying events or circumstances the occurrence of which could have demonstrably adverse effects on the fund's business and/or reputation; (ii) implementing processes and controls to lessen the possibility that such events or circumstances occur or to mitigate the effects of such events or circumstances if they do occur; and (iii) creating and maintaining a system designed to evaluate continuously business and market conditions in order to facilitate the identification and implementation processes described in (i) and (ii) above. Because the day-to-day operations and activities of the fund are carried out by or through FMR, its affiliates, and other service providers, the fund's exposure to risks is mitigated but not eliminated by the processes overseen by the Trustees. While each of the Board's committees has responsibility for overseeing different aspects of the fund's activities, oversight is exercised primarily through the Operations, Audit, and Compliance Committees. Appropriate personnel, including but not limited to the fund's Chief Compliance Officer (CCO), FMR's internal auditor, the independent accountants, the fund's Treasurer and portfolio management personnel, make periodic reports to the Board's committees, as appropriate, including an annual review of Fidelity's risk management program for the Fidelity® funds. The responsibilities of each standing committee, including their oversight responsibilities, are described further under "Standing Committees of the Trustees."
Interested Trustees*:
Correspondence intended for a Trustee who is an interested person may be sent to Fidelity Investments, 245 Summer Street, Boston, Massachusetts 02210.
Name, Year of Birth; Principal Occupations and Other Relevant Experience+
Bettina Doulton (1964)
Year of Election or Appointment: 2020
Trustee
Ms. Doulton also serves as Trustee of other Fidelity® funds. Prior to her retirement, Ms. Doulton served in a variety of positions at Fidelity Investments, including as a managing director of research (2006-2007), portfolio manager to certain Fidelity® funds (1993-2005), equity analyst and portfolio assistant (1990-1993), and research assistant (1987-1990). Ms. Doulton currently owns and operates Phi Builders + Architects and Cellardoor Winery. Previously, Ms. Doulton served as a member of the Board of Brown Capital Management, LLC (2014-2018).
Robert A. Lawrence (1952)
Year of Election or Appointment: 2020
Trustee
Acting Chairman of the Board of Trustees
Mr. Lawrence also serves as Trustee of other funds. Previously, Mr. Lawrence served as a Member of the Advisory Board of certain funds. Prior to his retirement in 2008, Mr. Lawrence served as Vice President of certain Fidelity® funds (2006-2008), Senior Vice President, Head of High Income Division of Fidelity Management & Research Company (investment adviser firm, 2006-2008), and President of Fidelity Strategic Investments (investment adviser firm, 2002-2005).
* Determined to be an “Interested Trustee” by virtue of, among other things, his or her affiliation with the Fidelity Central Investment Portfolios LLC or various entities under common control with FMR.
+ The information includes the Trustee's principal occupation during the last five years and other information relating to the experience, attributes, and skills relevant to the Trustee's qualifications to serve as a Trustee, which led to the conclusion that the Trustee should serve as a Trustee for the fund.
Independent Trustees:
Correspondence intended for an Independent Trustee may be sent to Fidelity Investments, P.O. Box 55235, Boston, Massachusetts 02205-5235.
Name, Year of Birth; Principal Occupations and Other Relevant Experience+
Thomas P. Bostick (1956)
Year of Election or Appointment: 2021
Trustee
Lieutenant General Bostick also serves as Trustee of other Fidelity® funds. Prior to his retirement, General Bostick (United States Army, Retired) held a variety of positions within the U.S. Army, including Commanding General and Chief of Engineers, U.S. Army Corps of Engineers (2012-2016) and Deputy Chief of Staff and Director of Human Resources, U.S. Army (2009-2012). General Bostick currently serves as a member of the Board and Finance and Governance Committees of CSX Corporation (transportation, 2020-present) and a member of the Board and Corporate Governance and Nominating Committee of Perma-Fix Environmental Services, Inc. (nuclear waste management, 2020-present). General Bostick serves as Chief Executive Officer of Bostick Global Strategies, LLC (consulting, 2016-present) and Managing Partner, Sustainability, of Ridge-Lane Limited Partners (strategic advisory and venture development, 2016-present). Previously, General Bostick served as a Member of the Advisory Board of certain Fidelity® funds (2021), President, Intrexon Bioengineering (2018-2020) and Chief Operating Officer (2017-2020) and Senior Vice President of the Environment Sector (2016-2017) of Intrexon Corporation (biopharmaceutical company).
Dennis J. Dirks (1948)
Year of Election or Appointment: 2005
Trustee
Mr. Dirks also serves as Trustee of other Fidelity® funds. Prior to his retirement in May 2003, Mr. Dirks served as Chief Operating Officer and as a member of the Board of The Depository Trust & Clearing Corporation (financial markets infrastructure), President, Chief Operating Officer and a member of the Board of The Depository Trust Company (DTC), President and a member of the Board of the National Securities Clearing Corporation (NSCC), Chief Executive Officer and a member of the Board of the Government Securities Clearing Corporation and Chief Executive Officer and a member of the Board of the Mortgage-Backed Securities Clearing Corporation. Mr. Dirks currently serves as a member of the Finance Committee (2016-present) and Board (2017-present) and is Treasurer (2018-present) of the Asolo Repertory Theatre.
Donald F. Donahue (1950)
Year of Election or Appointment: 2018
Trustee
Mr. Donahue also serves as Trustee of other Fidelity® funds. Mr. Donahue serves as President and Chief Executive Officer of Miranda Partners, LLC (risk consulting for the financial services industry, 2012-present). Previously, Mr. Donahue served as Chief Executive Officer (2006-2012), Chief Operating Officer (2003-2006) and Managing Director, Customer Marketing and Development (1999-2003) of The Depository Trust & Clearing Corporation (financial markets infrastructure). Mr. Donahue currently serves as a member (2007-present) and Co-Chairman (2016-present) of the Board of United Way of New York and a member of the Board of NYC Leadership Academy (2012-present). Mr. Donahue previously served as a member of the Advisory Board of certain Fidelity® funds (2015-2018).
Vicki L. Fuller (1957)
Year of Election or Appointment: 2020
Trustee
Ms. Fuller also serves as Trustee of other Fidelity® funds. Previously, Ms. Fuller served as a member of the Advisory Board of certain Fidelity® funds (2018-2020), Chief Investment Officer of the New York State Common Retirement Fund (2012-2018) and held a variety of positions at AllianceBernstein L.P. (global asset management, 1985-2012), including Managing Director (2006-2012) and Senior Vice President and Senior Portfolio Manager (2001-2006). Ms. Fuller currently serves as a member of the Board, Audit Committee and Nominating and Governance Committee of The Williams Companies, Inc. (natural gas infrastructure, 2018-present), as a member of the Board, Audit Committee and Nominating and Governance Committee of two Blackstone business development companies (2020-present) and as a member of the Board of Treliant, LLC (consulting, 2019-present).
Patricia L. Kampling (1959)
Year of Election or Appointment: 2020
Trustee
Ms. Kampling also serves as Trustee of other Fidelity® funds. Prior to her retirement, Ms. Kampling served as Chairman of the Board and Chief Executive Officer (2012-2019), President and Chief Operating Officer (2011-2012) and Executive Vice President and Chief Financial Officer (2010-2011) of Alliant Energy Corporation. Ms. Kampling currently serves as a member of the Board, Finance Committee and Governance, Compensation and Nominating Committee of Xcel Energy Inc. (utilities company, 2020-present) and as a member of the Board, Audit, Finance and Risk Committee and Safety, Environmental, Technology and Operations Committee of American Water Works Company, Inc. (utilities company, 2019-present). In addition, Ms. Kampling currently serves as a member of the Board of the Nature Conservancy, Wisconsin Chapter (2019-present). Previously, Ms. Kampling served as a Member of the Advisory Board of certain Fidelity® funds (2020), a member of the Board, Compensation Committee and Executive Committee and Chair of the Audit Committee of Briggs & Stratton Corporation (manufacturing, 2011-2021), a member of the Board of Interstate Power and Light Company (2012-2019) and Wisconsin Power and Light Company (2012-2019) (each a subsidiary of Alliant Energy Corporation) and as a member of the Board and Workforce Development Committee of the Business Roundtable (2018-2019).
Thomas A. Kennedy (1955)
Year of Election or Appointment: 2021
Trustee
Mr. Kennedy also serves as Trustee of other Fidelity® funds. Previously, Mr. Kennedy served as a Member of the Advisory Board of certain Fidelity® funds (2020) and held a variety of positions at Raytheon Company (aerospace and defense, 1983-2020), including Chairman and Chief Executive Officer (2014-2020) and Executive Vice President and Chief Operating Officer (2013-2014). Mr. Kennedy currently serves as Executive Chairman of the Board of Directors of Raytheon Technologies Corporation (aerospace and defense, 2020-present). He is also a member of the Rutgers School of Engineering Industry Advisory Board (2011-present) and a member of the UCLA Engineering Dean’s Executive Board (2016-present).
Oscar Munoz (1959)
Year of Election or Appointment: 2021
Trustee
Mr. Munoz also serves as Trustee of other Fidelity® funds. Prior to his retirement, Mr. Munoz served as Executive Chairman (2020-2021), Chief Executive Officer (2015-2020), President (2015-2016) and a member of the Board (2010-2021) of United Airlines Holdings, Inc. Mr. Munoz currently serves as a member of the Board of CBRE Group, Inc. (commercial real estate, 2020-present), a member of the Board of Univision Communications, Inc. (Hispanic media, 2020-present) and a member of the Advisory Board of Salesforce.com, Inc. (cloud-based software, 2020-present). Previously, Mr. Munoz served as a Member of the Advisory Board of certain Fidelity® funds (2021).
Garnett A. Smith (1947)
Year of Election or Appointment: 2018
Trustee
Mr. Smith also serves as Trustee of other Fidelity® funds. Prior to his retirement, Mr. Smith served as Chairman and Chief Executive Officer (1990-1997) and President (1986-1990) of Inbrand Corp. (manufacturer of personal absorbent products). Prior to his employment with Inbrand Corp., he was employed by a retail fabric chain and North Carolina National Bank (now Bank of America). Mr. Smith previously served as a member of the Advisory Board of certain Fidelity® funds (2012-2013).
David M. Thomas (1949)
Year of Election or Appointment: 2008
Trustee
Lead Independent Trustee
Mr. Thomas also serves as Trustee of other Fidelity® funds. Previously, Mr. Thomas served as Executive Chairman (2005-2006) and Chairman and Chief Executive Officer (2000-2005) of IMS Health, Inc. (pharmaceutical and healthcare information solutions). Mr. Thomas currently serves as a member of the Board of Fortune Brands Home and Security (home and security products, 2004-present) and Presiding Director (2013-present) of Interpublic Group of Companies, Inc. (marketing communication).
Susan Tomasky (1953)
Year of Election or Appointment: 2020
Trustee
Ms. Tomasky also serves as Trustee of other Fidelity® funds. Prior to her retirement, Ms. Tomasky served in various executive officer positions at American Electric Power Company, Inc. (1998-2011), including most recently as President of AEP Transmission (2007-2011). Ms. Tomasky currently serves as a member of the Board and Sustainability Committee and as Chair of the Audit Committee of Marathon Petroleum Corporation (2018-present) and as a member of the Board, Corporate Governance Committee and Organization and Compensation Committee and as Chair of the Audit Committee of Public Service Enterprise Group, Inc. (utilities company, 2012-present). In addition, Ms. Tomasky currently serves as a member (2009-present) and President (2020-present) of the Board of the Royal Shakespeare Company – America (2009-present), as a member of the Board of the Columbus Association for the Performing Arts (2011-present) and as a member of the Board and Investment Committee of Kenyon College (2016-present). Previously, Ms. Tomasky served as a Member of the Advisory Board of certain Fidelity® funds (2020), as a member of the Board of the Columbus Regional Airport Authority (2007-2020), as a member of the Board (2011-2018) and Lead Independent Director (2015-2018) of Andeavor Corporation (previously Tesoro Corporation) (independent oil refiner and marketer) and as a member of the Board of Summit Midstream Partners LP (energy, 2012-2018).
Michael E. Wiley (1950)
Year of Election or Appointment: 2018
Trustee
Mr. Wiley also serves as Trustee of other Fidelity® funds. Previously, Mr. Wiley served as a member of the Advisory Board of certain Fidelity® funds (2018-2020), Chairman, President and CEO of Baker Hughes, Inc. (oilfield services, 2000-2004). Mr. Wiley also previously served as a member of the Board of Andeavor Corporation (independent oil refiner and marketer, 2005-2018), a member of the Board of Andeavor Logistics LP (natural resources logistics, 2015-2018) and a member of the Board of High Point Resources (exploration and production, 2005-2020).
+ The information includes the Trustee's principal occupation during the last five years and other information relating to the experience, attributes, and skills relevant to the Trustee's qualifications to serve as a Trustee, which led to the conclusion that the Trustee should serve as a Trustee for the fund.
Advisory Board Members and Officers:
Correspondence intended for a Member of the Advisory Board (if any) may be sent to Fidelity Investments, P.O. Box 55235, Boston, Massachusetts 02205-5235. Correspondence intended for an officer or Peter S. Lynch may be sent to Fidelity Investments, 245 Summer Street, Boston, Massachusetts 02210. Officers appear below in alphabetical order.
Name, Year of Birth; Principal Occupation
Peter S. Lynch (1944)
Year of Election or Appointment: 2004
Member of the Advisory Board
Mr. Lynch also serves as a Member of the Advisory Board of other Fidelity® funds. Mr. Lynch is Vice Chairman and a Director of Fidelity Management & Research Company LLC (investment adviser firm). In addition, Mr. Lynch serves as a Trustee of Boston College and as the Chairman of the Inner-City Scholarship Fund. Previously, Mr. Lynch served as Vice Chairman and a Director of FMR Co., Inc. (investment adviser firm) and on the Special Olympics International Board of Directors (1997-2006).
Craig S. Brown (1977)
Year of Election or Appointment: 2019
Assistant Treasurer
Mr. Brown also serves as an officer of other funds. Mr. Brown serves as Assistant Treasurer of FIMM, LLC (2021-present) and is an employee of Fidelity Investments (2013-present).
John J. Burke III (1964)
Year of Election or Appointment: 2018
Chief Financial Officer
Mr. Burke also serves as Chief Financial Officer of other funds. Mr. Burke serves as Head of Investment Operations for Fidelity Fund and Investment Operations (2018-present) and is an employee of Fidelity Investments (1998-present). Previously Mr. Burke served as head of Asset Management Investment Operations (2012-2018).
William C. Coffey (1969)
Year of Election or Appointment: 2019
Assistant Secretary
Mr. Coffey also serves as Assistant Secretary of other funds. He is Senior Vice President and Deputy General Counsel of FMR LLC (diversified financial services company, 2010-present), and is an employee of Fidelity Investments. Previously, Mr. Coffey served as Secretary and CLO of certain funds (2018-2019); CLO, Secretary, and Senior Vice President of Fidelity Management & Research Company and FMR Co., Inc. (investment adviser firms, 2018-2019); Secretary of Fidelity SelectCo, LLC and Fidelity Investments Money Management, Inc. (investment adviser firms, 2018-2019); CLO of Fidelity Management & Research (Hong Kong) Limited, FMR Investment Management (UK) Limited, and Fidelity Management & Research (Japan) Limited (investment adviser firms, 2018-2019); and Assistant Secretary of certain funds (2009-2018).
Timothy M. Cohen (1969)
Year of Election or Appointment: 2018
Vice President
Mr. Cohen also serves as Vice President of other funds. Mr. Cohen serves as Co-Head of Equity (2018-present), a Director of Fidelity Management & Research (Japan) Limited (investment adviser firm, 2016-present), and is an employee of Fidelity Investments. Previously, Mr. Cohen served as Executive Vice President of Fidelity SelectCo, LLC (2019), Head of Global Equity Research (2016-2018), Chief Investment Officer - Equity and a Director of Fidelity Management & Research (U.K.) Inc. (investment adviser firm, 2013-2015) and as a Director of Fidelity Management & Research (Hong Kong) Limited (investment adviser firm, 2017).
Jonathan Davis (1968)
Year of Election or Appointment: 2010
Assistant Treasurer
Mr. Davis also serves as an officer of other funds. Mr. Davis serves as Assistant Treasurer of FIMM, LLC (2021-present), FMR Capital, Inc. (2017-present), FD Funds GP LLC (2021-present), FD Funds Holding LLC (2021-present), and FD Funds Management LLC (2021-present); and is an employee of Fidelity Investments. Previously, Mr. Davis served as Vice President and Associate General Counsel of FMR LLC (diversified financial services company, 2003-2010).
Laura M. Del Prato (1964)
Year of Election or Appointment: 2018
Assistant Treasurer
Ms. Del Prato also serves as an officer of other funds. Ms. Del Prato serves as Assistant Treasurer of FIMM, LLC (2021-present) and is an employee of Fidelity Investments (2017-present). Previously, Ms. Del Prato served as President and Treasurer of The North Carolina Capital Management Trust: Cash Portfolio and Term Portfolio (2018-2020). Prior to joining Fidelity Investments, Ms. Del Prato served as a Managing Director and Treasurer of the JPMorgan Mutual Funds (2014-2017). Prior to JPMorgan, Ms. Del Prato served as a partner at Cohen Fund Audit Services (accounting firm, 2012-2013) and KPMG LLP (accounting firm, 2004-2012).
Colm A. Hogan (1973)
Year of Election or Appointment: 2020
Assistant Treasurer
Mr. Hogan also serves as an officer of other funds. Mr. Hogan serves as Assistant Treasurer of FIMM, LLC (2021-present) and FMR Capital, Inc. (2017-present) and is an employee of Fidelity Investments (2005-present). Previously, Mr. Hogan served as Deputy Treasurer of certain Fidelity® funds (2016-2020) and Assistant Treasurer of certain Fidelity® funds (2016-2018).
Pamela R. Holding (1964)
Year of Election or Appointment: 2018
Vice President
Ms. Holding also serves as Vice President of other funds. Ms. Holding serves as Co-Head of Equity (2018-present) and is an employee of Fidelity Investments (2013-present). Previously, Ms. Holding served as Executive Vice President of Fidelity SelectCo, LLC (2019) and as Chief Investment Officer of Fidelity Institutional Asset Management (2013-2018).
Cynthia Lo Bessette (1969)
Year of Election or Appointment: 2019
Secretary and Chief Legal Officer (CLO)
Ms. Lo Bessette also serves as an officer of other funds. Ms. Lo Bessette serves as CLO, Secretary, and Senior Vice President of Fidelity Management & Research Company LLC (investment adviser firm, 2019-present); CLO of Fidelity Management & Research (Hong Kong) Limited, FMR Investment Management (UK) Limited, and Fidelity Management & Research (Japan) Limited (investment adviser firms, 2019-present); Secretary of FD Funds GP LLC (2021-present), FD Funds Holding LLC (2021-present), and FD Funds Management LLC (2021-present); and Assistant Secretary of FIMM, LLC (2019-present). She is a Senior Vice President and Deputy General Counsel of FMR LLC (diversified financial services company, 2019-present), and is an employee of Fidelity Investments. Previously, Ms. Lo Bessette served as CLO, Secretary, and Senior Vice President of FMR Co., Inc. (investment adviser firm, 2019); Secretary of Fidelity SelectCo, LLC and Fidelity Investments Money Management, Inc. (investment adviser firms, 2019). Prior to joining Fidelity Investments, Ms. Lo Bessette was Executive Vice President, General Counsel (2016-2019) and Senior Vice President, Deputy General Counsel (2015-2016) of OppenheimerFunds (investment management company) and Deputy Chief Legal Officer (2013-2015) of Jennison Associates LLC (investment adviser firm).
Chris Maher (1972)
Year of Election or Appointment: 2020
Deputy Treasurer
Mr. Maher also serves as an officer of other funds. Mr. Maher serves as Assistant Treasurer of FIMM, LLC (2021-present) and FMR Capital, Inc. (2017-present), and is an employee of Fidelity Investments (2008-present). Previously, Mr. Maher served as Assistant Treasurer of certain funds (2013-2020); Vice President of Asset Management Compliance (2013), Vice President of the Program Management Group of FMR (investment adviser firm, 2010-2013), and Vice President of Valuation Oversight (2008-2010).
Jason P. Pogorelec (1975)
Year of Election or Appointment: 2020
Chief Compliance Officer
Mr. Pogorelec also serves as Chief Compliance Officer of other funds. Mr. Pogorelec is a senior Vice President of Asset Management Compliance for Fidelity Investments and is an employee of Fidelity Investments (2006-present). Previously, Mr. Pogorelec served as Vice President, Associate General Counsel for Fidelity Investments (2010-2020) and Assistant Secretary of certain Fidelity funds (2015-2020).
Brett Segaloff (1972)
Year of Election or Appointment: 2021
Anti-Money Laundering (AML) Officer
Mr. Segaloff also serves as an AML Officer of other funds and other related entities. He is Director, Anti-Money Laundering (2007-present) of FMR LLC (diversified financial services company) and is an employee of Fidelity Investments (1996-present).
Stacie M. Smith (1974)
Year of Election or Appointment: 2016
President and Treasurer
Ms. Smith also serves as an officer of other funds. Ms. Smith serves as Assistant Treasurer of FIMM, LLC (2021-present) and FMR Capital, Inc. (2017-present), is an employee of Fidelity Investments (2009-present), and has served in other fund officer roles. Prior to joining Fidelity Investments, Ms. Smith served as Senior Audit Manager of Ernst & Young LLP (accounting firm, 1996-2009). Previously, Ms. Smith served as Assistant Treasurer (2013-2019) and Deputy Treasurer (2013-2016) of certain Fidelity® funds.
Jim Wegmann (1979)
Year of Election or Appointment: 2019
Assistant Treasurer
Mr. Wegmann also serves as an officer of other funds. Mr. Wegmann serves as Assistant Treasurer of FIMM, LLC (2021-present) and is an employee of Fidelity Investments (2011-present).
Shareholder Expense Example
As a shareholder, you incur two types of costs: (1) transaction costs, which may include sales charges (loads) on purchase payments or redemption proceeds, as applicable and (2) ongoing costs, which generally include management fees, distribution and/or service (12b-1) fees and other Fund expenses. This Example is intended to help you understand your ongoing costs (in dollars) of investing in a fund and to compare these costs with the ongoing costs of investing in other mutual funds.
The Example is based on an investment of $1,000 invested at the beginning of the period and held for the entire period (April 1, 2021 to September 30, 2021).
Actual Expenses
The first line of the accompanying table provides information about actual account values and actual expenses. You may use the information in this line, together with the amount you invested, to estimate the expenses that you paid over the period. Simply divide your account value by $1,000.00 (for example, an $8,600 account value divided by $1,000.00 = 8.6), then multiply the result by the number in the first line for a class/Fund under the heading entitled "Expenses Paid During Period" to estimate the expenses you paid on your account during this period. If any fund is a shareholder of any underlying mutual funds or exchange-traded funds (ETFs) (the Underlying Funds), such fund indirectly bears its proportional share of the expenses of the Underlying Funds in addition to the direct expenses incurred presented in the table. These fees and expenses are not included in the annualized expense ratio used to calculate the expense estimate in the table below.
Hypothetical Example for Comparison Purposes
The second line of the accompanying table provides information about hypothetical account values and hypothetical expenses based on the actual expense ratio and an assumed rate of return of 5% per year before expenses, which is not the actual return. The hypothetical account values and expenses may not be used to estimate the actual ending account balance or expenses you paid for the period. You may use this information to compare the ongoing costs of investing in the Fund and other funds. To do so, compare this 5% hypothetical example with the 5% hypothetical examples that appear in the shareholder reports of the other funds. If any fund is a shareholder of any Underlying Funds, such fund indirectly bears its proportional share of the expenses of the Underlying Funds in addition to the direct expenses as presented in the table. These fees and expenses are not included in the annualized expense ratio used to calculate the expense estimate in the table below.
Please note that the expenses shown in the table are meant to highlight your ongoing costs only and do not reflect any transaction costs. Therefore, the second line of the table is useful in comparing ongoing costs only, and will not help you determine the relative total costs of owning different funds.
| Annualized Expense Ratio-A | Beginning Account Value April 1, 2021 | Ending Account Value September 30, 2021 | Expenses Paid During Period-B April 1, 2021 to September 30, 2021 | |
| Fidelity Emerging Markets Equity Central Fund | .0261% | |||
| Actual | $1,000.00 | $946.60 | $.13 | |
| Hypothetical-C | $1,000.00 | $1,024.94 | $.13 |
A Annualized expense ratio reflects expenses net of applicable fee waivers.
B Expenses are equal to the annualized expense ratio, multiplied by the average account value over the period, multiplied by 183/ 365 (to reflect the one-half year period). The fees and expenses of any Underlying Funds are not included in each annualized expense ratio.
C 5% return per year before expenses
Distributions (Unaudited)
The fund hereby designates as a capital gain dividend with respect to the taxable year ended September 30, 2021 $144,593,175, or, if subsequently determined to be different, the net capital gain of such year.
The fund designates a percentage of the dividends distributed during the fiscal year as qualifying for the dividends–received deduction for corporate shareholders:
| October 2020 | 0% |
| November 2020 | 0% |
| December 2020 | 0% |
| March 2021 | 1% |
| June 2021 | 1% |
| September 2021 | 1% |
A percentage of the dividends distributed during the fiscal year for the fund may be taken into account as a dividend for purposes of the maximum rate under section 1(h)(11) of the Internal Revenue Code:
| October 2020 | 0% |
| November 2020 | 25% |
| December 2020 | 53% |
| March 2021 | 100% |
| June 2021 | 100% |
| September 2021 | 100% |
The amounts per share which represent income derived from sources within, and taxes paid to, foreign countries or possessions of the United States are $1.1758 and $0.5118 for the dividend paid December 14,2020.
The fund will notify shareholders in January 2022 of amounts for use in preparing 2021 income tax returns.
Board Approval of Investment Advisory Contracts and Management Fees
Fidelity Emerging Markets Equity Central Fund
Each year, the Board of Directors, including the Independent Directors (together, the Board), votes on the renewal of the management contract with Fidelity Management & Research Company LLC (FMR) and the sub-advisory agreements (together, the Advisory Contracts) for the fund. FMR and the sub-advisers are referred to herein as the Investment Advisers. The Board, assisted by the advice of fund counsel and Independent Directors' counsel, requests and considers a broad range of information relevant to the renewal of the Advisory Contracts throughout the year.The Board meets regularly and, at each of its meetings, covers an extensive agenda of topics and materials and considers factors that are relevant to its annual consideration of the renewal of the fund's Advisory Contracts, including the services and support provided to the fund and its shareholders. The Board has established various standing committees (Committees), each composed of and chaired by Independent Directors with varying backgrounds, to which the Board has assigned specific subject matter responsibilities in order to enhance effective decision-making by the Board. The Board, acting directly and through its Committees, requests and receives information concerning the annual consideration of the renewal of the fund's Advisory Contracts. The Board also meets as needed to review matters specifically related to the Board's annual consideration of the renewal of the Advisory Contracts. Members of the Board may also meet with trustees of other Fidelity funds through joint ad hoc committees to discuss certain matters relevant to all of the Fidelity funds.At its May 2021 meeting, the Board unanimously determined to renew the fund's Advisory Contracts. In reaching its determination, the Board considered all factors it believed relevant and reached a determination, with the assistance of fund counsel and Independent Directors' counsel and through the exercise of its business judgment, that the renewal of the Advisory Contracts was in the best interests of the fund and its shareholders and the fact that no fee is payable under the management contract was fair and reasonable.Nature, Extent, and Quality of Services Provided. The Board considered Fidelity's staffing as it relates to the fund, including the backgrounds of investment personnel of Fidelity, and also considered the fund's investment objective, strategies, and related investment philosophy. The Independent Directors also had discussions with senior management of Fidelity's investment operations and investment groups. The Board considered the structure of the investment personnel compensation program and whether this structure provides appropriate incentives to act in the best interests of the fund.Resources Dedicated to Investment Management and Support Services. The Board and the Fund Oversight and Research Committees reviewed the general qualifications and capabilities of Fidelity's investment staff, including its size, education, experience, and resources, as well as Fidelity's approach to recruiting, training, managing, and compensating investment personnel. The Board noted that Fidelity has continued to increase the resources devoted to non-U.S. offices, including expansion of Fidelity's global investment organization. The Board also noted that Fidelity's analysts have extensive resources, tools and capabilities that allow them to conduct sophisticated quantitative and fundamental analysis, as well as credit analysis of issuers, counterparties and guarantors. Further, the Board considered that Fidelity's investment professionals have sufficient access to global information and data so as to provide competitive investment results over time, and that those professionals also have access to sophisticated tools that permit them to assess portfolio construction and risk and performance attribution characteristics continuously, as well as to transmit new information and research conclusions rapidly around the world. Additionally, in its deliberations, the Board considered Fidelity's trading, risk management, compliance, and technology and operations capabilities and resources, which are integral parts of the investment management process. The Board also considered Fidelity's investments in business continuity planning, and its success in continuously providing services to the fund notwithstanding the severe disruptions caused by the COVID-19 pandemic.Administrative Services. The Board considered (i) the nature, extent, quality, and cost of advisory and administrative services performed by the Investment Advisers and their affiliates under the Advisory Contracts and under separate agreements covering transfer agency, pricing and bookkeeping, and securities lending services for the fund; (ii) the nature and extent of the supervision of third party service providers, principally custodians, subcustodians, and pricing vendors; and (iii) the resources devoted to, and the record of compliance with, the fund's compliance policies and procedures. The Board also reviewed the allocation of fund brokerage, including allocations to brokers affiliated with the Investment Advisers, and the use of "soft" commission dollars to pay for research services.Investment Performance. The Board considered whether the fund has operated in accordance with its investment objective, as well as its record of compliance with its investment restrictions. The Board reviewed the fund's absolute investment performance, as well as the fund's relative investment performance, but did not consider performance to be a material factor in its decision to renew the fund's Advisory Contracts, as the fund is not publicly offered as a stand-alone investment product. In this regard, the Board noted that the fund is designed to offer a liquid investment option for other investment companies managed by Fidelity and ultimately to enhance the performance of those investment companies.Based on its review, the Board concluded that the nature, extent, and quality of services provided to the fund under the Advisory Contracts should continue to benefit the shareholders of the fund.Competitiveness of Management Fee and Total Expense Ratio. The Board considered that while the fund does not pay a management fee, FMR receives fees for providing services to funds that invest in the fund. The Board also noted that FMR bears all expenses of the fund with certain limited exceptions (i.e., custody fees, interest, taxes, fees and expenses of the Independent Trustees, proxy and shareholder meeting expenses, and extraordinary expenses). The Board further noted that the fund pays its non-operating expenses, including brokerage commissions and fees and expenses associated with the fund's securities lending program, if applicable. Based on its review, the Board concluded that the management fee received for providing services to the fund and the fund's total expense ratio were reasonable in light of the services that the fund and its shareholders receive and the other factors considered.Costs of the Services and Profitability. The Board considered the level of Fidelity's profits in respect of all the Fidelity funds, as well as the profitability of the funds that invest in the fund.A public accounting firm has been engaged annually by the Board as part of the Board's assessment of Fidelity's profitability analysis. The engagement includes the review and assessment of the methodologies used by Fidelity in determining the revenues and expenses attributable to Fidelity's mutual fund business, and completion of agreed-upon procedures in respect of the mathematical accuracy of certain fund profitability information and its conformity to established allocation methodologies. After considering the reports issued under the engagement and information provided by Fidelity, the Board concluded that while other allocation methods may also be reasonable, Fidelity's profitability methodologies are reasonable in all material respects.The Board also reviewed Fidelity's non-fund businesses and potential indirect benefits such businesses may have received as a result of their association with Fidelity's mutual fund business (i.e., fall-out benefits) as well as cases where Fidelity's affiliates may benefit from the funds' business. The Board considered areas where potential indirect benefits to the Fidelity funds from their relationships with Fidelity may exist. The Board also considered that in 2019 a joint ad hoc committee created by it and the boards of other Fidelity funds evaluated potential fall-out benefits (PFOB Committee). The Board noted that it considered the PFOB Committee's findings in connection with its consideration of the renewal of the Advisory Contracts.The Board concluded that the costs of the services provided by and the profits realized by Fidelity in connection with the operation of the fund were not relevant to the renewal of the Advisory Contracts because the fund pays no advisory fees and FMR bears all expenses of the fund with certain exceptions.Economies of Scale. The Board concluded that because the fund pays no advisory fees and FMR bears all expenses of the fund with certain exceptions, the realization of economies of scale was not a material factor in the Board's decision to renew the fund's Advisory Contract.Additional Information Requested by the Board. In order to develop fully the factual basis for consideration of the Fidelity funds' advisory contracts, the Board requested and received additional information on certain topics, including: (i) fund flow and performance trends, in particular the underperformance of certain funds and strategies, and Fidelity's long-term strategies for certain funds; (ii) consideration of expanding the use of performance fees for additional funds; (iii) Fidelity's pricing philosophy compared to competitors; (iv) metrics for evaluating index fund and ETF performance and information about ETF trading characteristics; (v) the methodology with respect to evaluating competitive fund data and peer group classifications and fee and expense comparisons; (vi) the expense structures for different funds and classes and information about the differences between various expense structures; (vii) group fee breakpoints; (viii) information regarding other accounts managed by Fidelity and sub-advisory arrangements; and (ix) Fidelity's philosophies and strategies for evaluating funds and classes with lower or declining asset levels.Based on its evaluation of all of the conclusions noted above, and after considering all factors it believed relevant, the Board concluded that the advisory fee arrangements are fair and reasonable, and that the fund's Advisory Contracts should be renewed.![]()
EMQ-ANN-1121
1.876933.112
Fidelity® Real Estate Equity Central Fund
September 30, 2021
Contents
Board Approval of Investment Advisory Contracts and Management Fees |
To view a fund's proxy voting guidelines and proxy voting record for the 12-month period ended June 30, visit http://www.fidelity.com/proxyvotingresults or visit the Securities and Exchange Commission's (SEC) web site at http://www.sec.gov.
You may also call 1-800-544-8544 to request a free copy of the proxy voting guidelines.
Standard & Poor's, S&P and S&P 500 are registered service marks of The McGraw-Hill Companies, Inc. and have been licensed for use by Fidelity Distributors Corporation.
Other third-party marks appearing herein are the property of their respective owners.
All other marks appearing herein are registered or unregistered trademarks or service marks of FMR LLC or an affiliated company. © 2021 FMR LLC. All rights reserved.
A fund files its complete schedule of portfolio holdings with the SEC for the first and third quarters of each fiscal year on Form N-PORT. Forms N-PORT are available on the SEC’s web site at http://www.sec.gov. A fund's Forms N-PORT may be reviewed and copied at the SEC’s Public Reference Room in Washington, DC. Information regarding the operation of the SEC's Public Reference Room may be obtained by calling 1-800-SEC-0330.
Note to Shareholders:
Early in 2020, the outbreak and spread of COVID-19 emerged as a public health emergency that had a major influence on financial markets, primarily based on its impact on the global economy and corporate earnings. On March 11, 2020, the World Health Organization declared the COVID-19 outbreak a pandemic, citing sustained risk of further global spread. The pandemic prompted a number of measures to limit the spread of COVID-19, including travel and border restrictions, quarantines, and restrictions on large gatherings. In turn, these resulted in lower consumer activity, diminished demand for a wide range of products and services, disruption in manufacturing and supply chains, and – given the wide variability in outcomes regarding the outbreak – significant market uncertainty and volatility. To help stem the turmoil, the U.S. government took unprecedented action – in concert with the U.S. Federal Reserve and central banks around the world – to help support consumers, businesses, and the broader economy, and to limit disruption to the financial system.
In general, the overall impact of the pandemic lessened in 2021, amid a resilient economy and widespread distribution of three COVID-19 vaccines granted emergency use authorization from the U.S. Food and Drug Administration (FDA) early in the year. Still, the situation remains dynamic, and the extent and duration of its influence on financial markets and the economy is highly uncertain, due in part to a recent spike in cases based on highly contagious variants of the coronavirus.
Extreme events such as the COVID-19 crisis are exogenous shocks that can have significant adverse effects on mutual funds and their investments. Although multiple asset classes may be affected by market disruption, the duration and impact may not be the same for all types of assets. Fidelity is committed to helping you stay informed amid news about COVID-19 and during increased market volatility, and we continue to take extra steps to be responsive to customer needs. We encourage you to visit us online, where we offer ongoing updates, commentary, and analysis on the markets and our funds.
Performance: The Bottom Line
Average annual total return reflects the change in the value of an investment, assuming reinvestment of distributions from dividend income and capital gains (the profits earned upon the sale of securities that have grown in value, if any) and assuming a constant rate of performance each year. The hypothetical investment and the average annual total returns do not reflect the deduction of taxes that a shareholder would pay on fund distributions or the redemption of fund shares. During periods of reimbursement by Fidelity, a fund’s total return will be greater than it would be had the reimbursement not occurred. How a fund did yesterday is no guarantee of how it will do tomorrow.
Average Annual Total Returns
| For the periods ended September 30, 2021 | Past 1 year | Past 5 years | Life of fundA |
| Fidelity® Real Estate Equity Central Fund | 33.38% | 8.48% | 8.75% |
A From November 3, 2014
$10,000 Over Life of Fund
Let's say hypothetically that $10,000 was invested in Fidelity® Real Estate Equity Central Fund on November 3, 2014, when the fund started.
The chart shows how the value of your investment would have changed, and also shows how the S&P 500® Index performed over the same period.

| Period Ending Values | ||
| $17,862 | Fidelity® Real Estate Equity Central Fund | |
| $24,445 | S&P 500® Index | |
Management's Discussion of Fund Performance
Market Recap: The S&P 500® index gained 30.00% for the 12 months ending September 30, 2021, with U.S. equities rising on the prospect of a surge in economic growth and corporate earnings, widespread COVID-19 vaccination, fiscal stimulus and fresh spending programs. After the index closed 2020 at an all-time high, investors were hopeful as the new year began. The rollout of three COVID-19 vaccines was underway, the U.S. Federal Reserve pledged to hold interest rates near zero until the economy recovered, and the federal government planned to deploy trillions of dollars to boost consumers and the economy. As part of the “reopening” theme, investors moved out of tech-driven mega-caps that had thrived due to the work-from-home trend in favor of cheap smaller companies poised to benefit from a broad cyclical recovery. A flattish May reflected concerns about inflation and jobs, but the rally resumed through August amid strong earnings, and momentum shifted back to growth stocks. However, in early September, sentiment turned broadly negative due to a host of factors. These included inflationary pressure from surging energy/other commodity prices, rising bond yields, supply constraints and disruption, valuation concerns, and the fast-spreading delta variant of the coronavirus. In addition, the Fed signaled it could soon begin to taper the bond purchases it has made since the onset of the pandemic. By sector, energy led by a big margin, followed by financials, while the defensive utilities and consumer staples groups notably lagged.Comments from Portfolio Manager Samuel Wald: For the fiscal year ending September 30, 2021, the fund gained 33.38%, trailing the 37.39% advance of the FTSE NAREIT Equity REITs Index Link but outperforming the broad-based S&P 500® index. An underweighting and stock selection among retail REITs, including regional malls and shopping centers, detracted notably versus the industry index. Stock selection in industrial REITs also hurt. Not owning regional mall REIT Simon Property Group, which gained 115% the past 12 months, detracted more than any other individual security decision. Simon Property Group was not held at period end. An outsized stake in industrial REIT Americold Realty Trust, which returned about -17%, also held back the fund’s result versus the industry index. Conversely, security selection among certain real estate services firms contributed versus the industry index, as did an underweighting in office REITs. Our non-index stake in CBRE Group, which gained 106% for the 12 months, added more value than any other individual position. It also helped to overweight the self-storage REIT CubeSmart, which gained 55%. Notable changes in fund positioning for the 12 months included reduced exposure to office REITs.The views expressed above reflect those of the portfolio manager(s) only through the end of the period as stated on the cover of this report and do not necessarily represent the views of Fidelity or any other person in the Fidelity organization. Any such views are subject to change at any time based upon market or other conditions and Fidelity disclaims any responsibility to update such views. These views may not be relied on as investment advice and, because investment decisions for a Fidelity fund are based on numerous factors, may not be relied on as an indication of trading intent on behalf of any Fidelity fund.
Investment Summary (Unaudited)
Top Ten Stocks as of September 30, 2021
| % of fund's net assets | |
| Prologis (REIT), Inc. | 12.2 |
| CubeSmart | 6.6 |
| Digital Realty Trust, Inc. | 5.8 |
| Equinix, Inc. | 5.8 |
| Essex Property Trust, Inc. | 4.8 |
| Mid-America Apartment Communities, Inc. | 4.7 |
| Ventas, Inc. | 4.6 |
| RLJ Lodging Trust | 4.0 |
| Alexandria Real Estate Equities, Inc. | 3.8 |
| Equity Lifestyle Properties, Inc. | 3.8 |
| 56.1 |
Top Five REIT Sectors as of September 30, 2021
| % of fund's net assets | |
| REITs - Diversified | 20.1 |
| REITs - Warehouse/Industrial | 15.8 |
| REITs - Apartments | 15.5 |
| REITs - Health Care | 9.8 |
| REITs - Storage | 8.7 |
Asset Allocation (% of fund's net assets)
| As of September 30, 2021 | ||
| Stocks | 99.1% | |
| Short-Term Investments and Net Other Assets (Liabilities) | 0.9% | |

Schedule of Investments September 30, 2021
Showing Percentage of Net Assets
| Common Stocks - 99.1% | |||
| Shares | Value | ||
| Commercial Services & Supplies - 0.5% | |||
| REITs - Diversified - 0.5% | |||
| CoreCivic, Inc. (a) | 858,700 | $7,642,430 | |
| Equity Real Estate Investment Trusts (REITs) - 94.8% | |||
| REITs - Apartments - 15.5% | |||
| Essex Property Trust, Inc. | 248,075 | 79,319,501 | |
| Invitation Homes, Inc. | 1,391,804 | 53,347,847 | |
| Mid-America Apartment Communities, Inc. | 409,100 | 76,399,425 | |
| UDR, Inc. | 834,782 | 44,226,750 | |
| 253,293,523 | |||
| REITs - Diversified - 19.6% | |||
| Digital Realty Trust, Inc. | 662,423 | 95,687,002 | |
| Equinix, Inc. | 119,238 | 94,213,521 | |
| Lamar Advertising Co. Class A | 445,500 | 50,541,975 | |
| VICI Properties, Inc. (b) | 1,885,431 | 53,565,095 | |
| Washington REIT (SBI) | 1,038,800 | 25,710,300 | |
| 319,717,893 | |||
| REITs - Health Care - 9.8% | |||
| CareTrust (REIT), Inc. | 1,084,600 | 22,039,072 | |
| Healthcare Realty Trust, Inc. | 508,810 | 15,152,362 | |
| Healthcare Trust of America, Inc. | 477,400 | 14,159,684 | |
| Ventas, Inc. | 1,348,994 | 74,477,959 | |
| Welltower, Inc. | 424,666 | 34,992,478 | |
| 160,821,555 | |||
| REITs - Hotels - 4.9% | |||
| Host Hotels & Resorts, Inc. (a) | 866,600 | 14,151,578 | |
| RLJ Lodging Trust | 4,378,067 | 65,058,076 | |
| 79,209,654 | |||
| REITs - Management/Investment - 2.1% | |||
| American Tower Corp. | 65,600 | 17,410,896 | |
| Lexington Corporate Properties Trust | 1,283,237 | 16,361,272 | |
| 33,772,168 | |||
| REITs - Manufactured Homes - 3.8% | |||
| Equity Lifestyle Properties, Inc. | 795,900 | 62,159,790 | |
| REITs - Office Property - 5.7% | |||
| Alexandria Real Estate Equities, Inc. | 328,680 | 62,800,888 | |
| Douglas Emmett, Inc. | 967,062 | 30,568,830 | |
| 93,369,718 | |||
| REITs - Shopping Centers - 3.4% | |||
| Phillips Edison & Co., Inc. (b) | 400,900 | 12,311,639 | |
| SITE Centers Corp. | 2,807,500 | 43,347,800 | |
| 55,659,439 | |||
| REITs - Single Tenant - 5.5% | |||
| Four Corners Property Trust, Inc. | 1,543,000 | 41,444,980 | |
| Spirit Realty Capital, Inc. | 1,049,100 | 48,300,564 | |
| 89,745,544 | |||
| REITs - Storage - 8.7% | |||
| CubeSmart | 2,235,219 | 108,296,361 | |
| Extra Space Storage, Inc. | 200,835 | 33,738,272 | |
| 142,034,633 | |||
| REITs - Warehouse/Industrial - 15.8% | |||
| Americold Realty Trust | 1,015,010 | 29,486,041 | |
| Prologis (REIT), Inc. | 1,583,621 | 198,633,579 | |
| Terreno Realty Corp. | 475,016 | 30,035,262 | |
| 258,154,882 | |||
| TOTAL EQUITY REAL ESTATE INVESTMENT TRUSTS (REITS) | 1,547,938,799 | ||
| Hotels, Restaurants & Leisure - 1.1% | |||
| Casinos & Gaming - 1.1% | |||
| Caesars Entertainment, Inc. (a) | 156,410 | 17,561,715 | |
| IT Services - 0.3% | |||
| Internet Services & Infrastructure - 0.3% | |||
| Cyxtera Technologies, Inc. (a)(c) | 391,426 | 3,620,691 | |
| Cyxtera Technologies, Inc. Class A | 174,021 | 1,609,694 | |
| 5,230,385 | |||
| Real Estate Management & Development - 2.4% | |||
| Real Estate Services - 2.4% | |||
| CBRE Group, Inc. (a) | 405,000 | 39,430,800 | |
| TOTAL COMMON STOCKS | |||
| (Cost $1,325,189,296) | 1,617,804,129 | ||
| Money Market Funds - 4.0% | |||
| Fidelity Cash Central Fund 0.06% (d) | 10,550,392 | 10,552,502 | |
| Fidelity Securities Lending Cash Central Fund 0.06% (d)(e) | 54,865,188 | 54,870,675 | |
| TOTAL MONEY MARKET FUNDS | |||
| (Cost $65,423,177) | 65,423,177 | ||
| TOTAL INVESTMENT IN SECURITIES - 103.1% | |||
| (Cost $1,390,612,473) | 1,683,227,306 | ||
| NET OTHER ASSETS (LIABILITIES) - (3.1)% | (50,625,972) | ||
| NET ASSETS - 100% | $1,632,601,334 |
Legend
(a) Non-income producing
(b) Security or a portion of the security is on loan at period end.
(c) Restricted securities (including private placements) - Investment in securities not registered under the Securities Act of 1933 (excluding 144A issues). At the end of the period, the value of restricted securities (excluding 144A issues) amounted to $3,620,691 or 0.2% of net assets.
(d) Affiliated fund that is generally available only to investment companies and other accounts managed by Fidelity Investments. The rate quoted is the annualized seven-day yield of the fund at period end. A complete unaudited listing of the fund's holdings as of its most recent quarter end is available upon request. In addition, each Fidelity Central Fund's financial statements, which are not covered by the Fund's Report of Independent Registered Public Accounting Firm, are available on the SEC's website or upon request.
(e) Investment made with cash collateral received from securities on loan.
Additional information on each restricted holding is as follows:
| Security | Acquisition Date | Acquisition Cost |
| Cyxtera Technologies, Inc. | 2/21/21 | $3,914,260 |
Affiliated Central Funds
Fiscal year to date information regarding the Fund's investments in Fidelity Central Funds, including the ownership percentage, is presented below.
| Fund | Value, beginning of period | Purchases | Sales Proceeds | Dividend Income | Realized Gain/Loss | Change in Unrealized appreciation (depreciation) | Value, end of period | % ownership, end of period |
| Fidelity Cash Central Fund 0.06% | $4,117,538 | $713,420,160 | $706,985,196 | $7,131 | $-- | $-- | $10,552,502 | 0.0% |
| Fidelity Securities Lending Cash Central Fund 0.06% | 3,949,000 | 288,640,669 | 237,718,994 | 20,122 | -- | -- | 54,870,675 | 0.2% |
| Total | $8,066,538 | $1,002,060,829 | $944,704,190 | $27,253 | $-- | $-- | $65,423,177 |
Amounts in the income column in the above table include any capital gain distributions from underlying funds, which are presented in the corresponding line-item in the Statement of Operations, if applicable. Amount for Fidelity Securities Lending Cash Central Fund represents the income earned on investing cash collateral, less rebates paid to borrowers and any lending agent fees associated with the loan, plus any premium payments received for lending certain types of securities.
Investment Valuation
The following is a summary of the inputs used, as of September 30, 2021, involving the Fund's assets and liabilities carried at fair value. The inputs or methodology used for valuing securities may not be an indication of the risk associated with investing in those securities. For more information on valuation inputs, and their aggregation into the levels used below, please refer to the Investment Valuation section in the accompanying Notes to Financial Statements.
| Valuation Inputs at Reporting Date: | ||||
| Description | Total | Level 1 | Level 2 | Level 3 |
| Investments in Securities: | ||||
| Common Stocks | $1,617,804,129 | $1,617,804,129 | $-- | $-- |
| Money Market Funds | 65,423,177 | 65,423,177 | -- | -- |
| Total Investments in Securities: | $1,683,227,306 | $1,683,227,306 | $-- | $-- |
See accompanying notes which are an integral part of the financial statements.
Financial Statements
Statement of Assets and Liabilities
| September 30, 2021 | ||
| Assets | ||
| Investment in securities, at value (including securities loaned of $52,843,290) — See accompanying schedule: Unaffiliated issuers (cost $1,325,189,296) | $1,617,804,129 | |
| Fidelity Central Funds (cost $65,423,177) | 65,423,177 | |
| Total Investment in Securities (cost $1,390,612,473) | $1,683,227,306 | |
| Receivable for investments sold | 18,466,704 | |
| Receivable for fund shares sold | 1,981,166 | |
| Dividends receivable | 5,691,077 | |
| Distributions receivable from Fidelity Central Funds | 3,051 | |
| Total assets | 1,709,369,304 | |
| Liabilities | ||
| Payable for investments purchased | $2,009,980 | |
| Payable for fund shares redeemed | 19,877,499 | |
| Other payables and accrued expenses | 9,816 | |
| Collateral on securities loaned | 54,870,675 | |
| Total liabilities | 76,767,970 | |
| Net Assets | $1,632,601,334 | |
| Net Assets consist of: | ||
| Paid in capital | $1,433,666,767 | |
| Total accumulated earnings (loss) | 198,934,567 | |
| Net Assets | $1,632,601,334 | |
| Net Asset Value, offering price and redemption price per share ($1,632,601,334 ÷ 11,578,681 shares) | $141.00 |
See accompanying notes which are an integral part of the financial statements.
Statement of Operations
| Year ended September 30, 2021 | ||
| Investment Income | ||
| Dividends | $32,487,540 | |
| Income from Fidelity Central Funds (including $20,122 from security lending) | 27,253 | |
| Total income | 32,514,793 | |
| Expenses | ||
| Custodian fees and expenses | $17,489 | |
| Independent directors' fees and expenses | 4,397 | |
| Interest | 868 | |
| Miscellaneous | 11 | |
| Total expenses before reductions | 22,765 | |
| Expense reductions | (16) | |
| Total expenses after reductions | 22,749 | |
| Net investment income (loss) | 32,492,044 | |
| Realized and Unrealized Gain (Loss) | ||
| Net realized gain (loss) on: | ||
| Investment securities: | ||
| Unaffiliated issuers | 23,174,038 | |
| Total net realized gain (loss) | 23,174,038 | |
| Change in net unrealized appreciation (depreciation) on investment securities | 289,107,046 | |
| Net gain (loss) | 312,281,084 | |
| Net increase (decrease) in net assets resulting from operations | $344,773,128 |
See accompanying notes which are an integral part of the financial statements.
Statement of Changes in Net Assets
| Year ended September 30, 2021 | Year ended September 30, 2020 | |
| Increase (Decrease) in Net Assets | ||
| Operations | ||
| Net investment income (loss) | $32,492,044 | $21,359,141 |
| Net realized gain (loss) | 23,174,038 | (125,536,049) |
| Change in net unrealized appreciation (depreciation) | 289,107,046 | (39,075,345) |
| Net increase (decrease) in net assets resulting from operations | 344,773,128 | (143,252,253) |
| Distributions to shareholders | (26,089,180) | (19,495,484) |
| Affiliated share transactions | ||
| Proceeds from sales of shares | 702,838,441 | 712,478,792 |
| Reinvestment of distributions | 26,089,180 | 19,495,485 |
| Cost of shares redeemed | (115,080,816) | (323,058,306) |
| Net increase (decrease) in net assets resulting from share transactions | 613,846,805 | 408,915,971 |
| Total increase (decrease) in net assets | 932,530,753 | 246,168,234 |
| Net Assets | ||
| Beginning of period | 700,070,581 | 453,902,347 |
| End of period | $1,632,601,334 | $700,070,581 |
| Other Information | ||
| Shares | ||
| Sold | 5,716,656 | 6,116,468 |
| Issued in reinvestment of distributions | 197,926 | 177,230 |
| Redeemed | (812,484) | (3,465,003) |
| Net increase (decrease) | 5,102,098 | 2,828,695 |
See accompanying notes which are an integral part of the financial statements.
Financial Highlights
Fidelity Real Estate Equity Central Fund
| Years ended September 30, | 2021 | 2020 | 2019 | 2018 | 2017 |
| Selected Per–Share Data | |||||
| Net asset value, beginning of period | $108.09 | $124.43 | $109.73 | $112.82 | $113.15 |
| Income from Investment Operations | |||||
| Net investment income (loss)A | 3.33 | 3.43 | 3.92 | 3.84 | 3.00 |
| Net realized and unrealized gain (loss) | 32.42 | (16.47) | 15.85 | .13 | (.91) |
| Total from investment operations | 35.75 | (13.04) | 19.77 | 3.97 | 2.09 |
| Distributions from net investment income | (2.84) | (3.30) | (3.16) | (3.16)B | (2.29) |
| Distributions from net realized gain | – | – | (1.91) | (3.90)B | (.12) |
| Total distributions | (2.84) | (3.30) | (5.07) | (7.06) | (2.42)C |
| Net asset value, end of period | $141.00 | $108.09 | $124.43 | $109.73 | $112.82 |
| Total ReturnD | 33.38% | (10.48)% | 18.98% | 3.73% | 1.95% |
| Ratios to Average Net AssetsE,F | |||||
| Expenses before reductions | - %G | - %G | .01% | .01% | .01% |
| Expenses net of fee waivers, if any | - %G | - %G | .01% | .01% | .01% |
| Expenses net of all reductions | - %G | - %G | .01% | .01% | .01% |
| Net investment income (loss) | 2.54% | 3.05% | 3.44% | 3.59% | 2.72% |
| Supplemental Data | |||||
| Net assets, end of period (000 omitted) | $1,632,601 | $700,071 | $453,902 | $126,704 | $127,147 |
| Portfolio turnover rateH | 28% | 84%I | 37% | 47% | 64% |
A Calculated based on average shares outstanding during the period.
B The amounts shown reflect certain reclassifications related to book to tax differences that were made in the year shown.
C Total distributions per share do not sum due to rounding.
D Total returns would have been lower if certain expenses had not been reduced during the applicable periods shown.
E Fees and expenses of any underlying mutual funds or exchange-traded funds (ETFs) are not included in the Fund's expense ratio. The Fund indirectly bears its proportionate share of these expenses. For additional expense information related to investments in Fidelity Central Funds, please refer to the "Investments in Fidelity Central Funds" note found in the Notes to Financial Statements section of the most recent Annual or Semi-Annual report.
F Expense ratios reflect operating expenses of the class. Expenses before reductions do not reflect amounts reimbursed, waived, or reduced through arrangements with the investment adviser, brokerage services, or other offset arrangements, if applicable, and do not represent the amount paid by the class during periods when reimbursements, waivers or reductions occur.
G Amount represents less than .005%.
H Amount does not include the portfolio activity of any underlying mutual funds or exchange-traded funds (ETFs).
I Portfolio turnover rate excludes securities received or delivered in-kind.
See accompanying notes which are an integral part of the financial statements.
Notes to Financial Statements
For the period ended September 30, 2021
1. Organization.
Fidelity Real Estate Equity Central Fund (the Fund) is a non-diversified fund of Fidelity Central Investment Portfolios LLC (the LLC) and is authorized to issue an unlimited number of shares. Shares of the Fund are only offered to other investment companies and accounts managed by Fidelity Management & Research Company LLC (FMR), or its affiliates (the Investing Funds). The LLC is registered under the Investment Company Act of 1940, as amended (the 1940 Act), as an open-end management investment company organized as a Delaware Limited Liability Company.
2. Investments in Fidelity Central Funds.
Funds may invest in Fidelity Central Funds, which are open-end investment companies generally available only to other investment companies and accounts managed by the investment adviser and its affiliates. The Schedule of Investments lists any Fidelity Central Funds held as an investment as of period end, but does not include the underlying holdings of each Fidelity Central Fund. An investing fund indirectly bears its proportionate share of the expenses of the underlying Fidelity Central Funds.
Based on its investment objective, each Fidelity Central Fund may invest or participate in various investment vehicles or strategies that are similar to those of the investing fund. These strategies are consistent with the investment objectives of the investing fund and may involve certain economic risks which may cause a decline in value of each of the Fidelity Central Funds and thus a decline in the value of the investing fund.
| Fidelity Central Fund | Investment Manager | Investment Objective | Investment Practices | Expense Ratio(a) |
| Fidelity Money Market Central Funds | Fidelity Management & Research Company LLC (FMR) | Each fund seeks to obtain a high level of current income consistent with the preservation of capital and liquidity. | Short-term Investments | Less than .005% |
(a) Expenses expressed as a percentage of average net assets and are as of each underlying Central Fund's most recent annual or semi-annual shareholder report.
A complete unaudited list of holdings for each Fidelity Central Fund is available upon request or at the Securities and Exchange Commission website at www.sec.gov. In addition, the financial statements of the Fidelity Central Funds which contain the significant accounting policies (including investment valuation policies) of those funds, and are not covered by the Report of Independent Registered Public Accounting Firm, are available on the Securities and Exchange Commission website or upon request.
3. Significant Accounting Policies.
The Fund is an investment company and applies the accounting and reporting guidance of the Financial Accounting Standards Board (FASB) Accounting Standards Codification Topic 946 Financial Services - Investment Companies. The financial statements have been prepared in conformity with accounting principles generally accepted in the United States of America (GAAP), which require management to make certain estimates and assumptions at the date of the financial statements. Actual results could differ from those estimates. Subsequent events, if any, through the date that the financial statements were issued have been evaluated in the preparation of the financial statements. The Fund's Schedule of Investments lists any underlying mutual funds or exchange-traded funds (ETFs) but does not include the underlying holdings of these funds. The following summarizes the significant accounting policies of the Fund:
Investment Valuation. Investments are valued as of 4:00 p.m. Eastern time on the last calendar day of the period. The Board of Directors (the Board) has delegated the day to day responsibility for the valuation of the Fund's investments to the Fair Value Committee (the Committee) established by the Fund's investment adviser. In accordance with valuation policies and procedures approved by the Board, the Fund attempts to obtain prices from one or more third party pricing vendors or brokers to value its investments. When current market prices, quotations or currency exchange rates are not readily available or reliable, investments will be fair valued in good faith by the Committee, in accordance with procedures adopted by the Board. Factors used in determining fair value vary by investment type and may include market or investment specific events. The frequency with which these procedures are used cannot be predicted and they may be utilized to a significant extent. The Committee oversees the Fund's valuation policies and procedures and reports to the Board on the Committee's activities and fair value determinations. The Board monitors the appropriateness of the procedures used in valuing the Fund's investments and ratifies the fair value determinations of the Committee.
The Fund categorizes the inputs to valuation techniques used to value its investments into a disclosure hierarchy consisting of three levels as shown below:
- Level 1 – quoted prices in active markets for identical investments
- Level 2 – other significant observable inputs (including quoted prices for similar investments, interest rates, prepayment speeds, etc.)
- Level 3 – unobservable inputs (including the Fund's own assumptions based on the best information available)
Valuation techniques used to value the Fund's investments by major category are as follows:
Equity securities, including restricted securities, for which market quotations are readily available, are valued at the last reported sale price or official closing price as reported by a third party pricing vendor on the primary market or exchange on which they are traded and are categorized as Level 1 in the hierarchy. In the event there were no sales during the day or closing prices are not available, securities are valued at the last quoted bid price or may be valued using the last available price and are generally categorized as Level 2 in the hierarchy. For foreign equity securities, when market or security specific events arise, comparisons to the valuation of American Depositary Receipts (ADRs), futures contracts, Exchange-Traded Funds (ETFs) and certain indexes as well as quoted prices for similar securities may be used and would be categorized as Level 2 in the hierarchy. For equity securities, including restricted securities, where observable inputs are limited, assumptions about market activity and risk are used and these securities may be categorized as Level 3 in the hierarchy.
Investments in open-end mutual funds, including other Fidelity Central Funds, are valued at their closing net asset value (NAV) each business day and are categorized as Level 1 in the hierarchy.
Changes in valuation techniques may result in transfers in or out of an assigned level within the disclosure hierarchy. The aggregate value of investments by input level as of September 30, 2021 is included at the end of the Fund's Schedule of Investments.
Investment Transactions and Income. For financial reporting purposes, the Fund's investment holdings and NAV include trades executed through the end of the last business day of the period. The NAV per share for processing shareholder transactions is calculated as of the close of business of the New York Stock Exchange (NYSE), normally 4:00 p.m. Eastern time and includes trades executed through the end of the prior business day. Gains and losses on securities sold are determined on the basis of identified cost. Dividend income is recorded on the ex-dividend date, except for certain dividends from foreign securities where the ex-dividend date may have passed, which are recorded as soon as the Fund is informed of the ex-dividend date. Non-cash dividends included in dividend income, if any, are recorded at the fair market value of the securities received. Income and capital gain distributions from Fidelity Central Funds, if any, are recorded on the ex-dividend date. Certain distributions received by the Fund represent a return of capital or capital gain. The Fund determines the components of these distributions subsequent to the ex-dividend date, based upon receipt of tax filings or other correspondence relating to the underlying investment. These distributions are recorded as a reduction of cost of investments and/or as a realized gain.
Expenses. Expenses directly attributable to a fund are charged to that fund. Expenses attributable to more than one fund are allocated among the respective funds on the basis of relative net assets or other appropriate methods. Expenses included in the accompanying financial statements reflect the expenses of that fund and do not include any expenses associated with any underlying mutual funds or exchange-traded funds. Although not included in a fund's expenses, a fund indirectly bears its proportionate share of these expenses through the net asset value of each underlying mutual fund or exchange-traded fund. Expense estimates are accrued in the period to which they relate and adjustments are made when actual amounts are known.
Income Tax Information and Distributions to Shareholders. Each year, the Fund intends to qualify as a regulated investment company under Subchapter M of the Internal Revenue Code, including distributing substantially all of its taxable income and realized gains. As a result, no provision for U.S. Federal income taxes is required. As of September 30, 2021, the Fund did not have any unrecognized tax benefits in the financial statements; nor is the Fund aware of any tax positions for which it is reasonably possible that the total amounts of unrecognized tax benefits will significantly change in the next twelve months. The Fund files a U.S. federal tax return, in addition to state and local tax returns as required. The Fund's federal income tax returns are subject to examination by the Internal Revenue Service (IRS) for a period of three fiscal years after they are filed. State and local tax returns may be subject to examination for an additional fiscal year depending on the jurisdiction.
Distributions are declared and recorded on the ex-dividend date. Income and capital gain distributions are determined in accordance with income tax regulations, which may differ from GAAP.
Capital accounts within the financial statements are adjusted for permanent book-tax differences. These adjustments have no impact on net assets or the results of operations. Capital accounts are not adjusted for temporary book-tax differences which will reverse in a subsequent period.
Book-tax differences are primarily due to capital loss carryforwards and losses deferred due to wash sales.
As of period end, the cost and unrealized appreciation (depreciation) in securities, and derivatives if applicable, for federal income tax purposes were as follows:
| Gross unrealized appreciation | $306,817,877 |
| Gross unrealized depreciation | (24,290,464) |
| Net unrealized appreciation (depreciation) | $282,527,413 |
| Tax Cost | $1,400,699,893 |
The tax-based components of distributable earnings as of period end were as follows:
| Undistributed ordinary income | $7,086,533 |
| Capital loss carryforward | $(90,679,378) |
| Net unrealized appreciation (depreciation) on securities and other investments | $282,527,413 |
Capital loss carryforwards are only available to offset future capital gains of the Fund to the extent provided by regulations and may be limited. The capital loss carryforward information presented below, including any applicable limitation, is estimated as of fiscal period end and is subject to adjustment.
| No expiration | |
| Short-term | $(90,679,378) |
The tax character of distributions paid was as follows:
| September 30, 2021 | September 30, 2020 | |
| Ordinary Income | $26,089,180 | $ 19,495,484 |
Restricted Securities (including Private Placements). Funds may invest in securities that are subject to legal or contractual restrictions on resale. These securities generally may be resold in transactions exempt from registration or to the public if the securities are registered. Disposal of these securities may involve time-consuming negotiations and expense, and prompt sale at an acceptable price may be difficult. Information regarding restricted securities held at period end is included at the end of the Schedule of Investments, if applicable.
4. Purchases and Sales of Investments.
Purchases and sales of securities, other than short-term securities and in-kind transactions, as applicable, are noted in the table below.
| Purchases ($) | Sales ($) | |
| Fidelity Real Estate Equity Central Fund | 963,157,514 | 346,688,919 |
5. Fees and Other Transactions with Affiliates.
Management Fee and Expense Contract. Fidelity Management & Research Company LLC (the investment adviser) provides the Fund with investment management services. The Fund does not pay any fees for these services. Pursuant to the Fund's management contract, the investment adviser receives a monthly management fee that represents a portion of the management fees it receives from the Investing Funds. In addition, under an expense contract, the investment adviser also pays all other expenses of the Fund, excluding custody fees, the compensation of the independent Directors, and certain miscellaneous expenses such as proxy and shareholder meeting expenses.
Brokerage Commissions. A portion of portfolio transactions were placed with brokerage firms which are affiliates of the investment adviser. Brokerage commissions are included in net realized gain (loss) and change in net unrealized appreciation (depreciation) in the Statement of Operations. The commissions paid to these affiliated firms were as follows:
| Amount | |
| Fidelity Real Estate Equity Central Fund | $9,475 |
Interfund Lending Program. Pursuant to an Exemptive Order issued by the Securities and Exchange Commission (the SEC), the Fund, along with other registered investment companies having management contracts with FMR, or other affiliated entities of FMR, may participate in an interfund lending program. This program provides an alternative credit facility allowing the Fund to borrow from, or lend money to, other participating affiliated funds. At period end, there were no interfund loans outstanding. Activity in this program during the period for which loans were outstanding was as follows:
| Borrower or Lender | Average Loan Balance | Weighted Average Interest Rate | Interest Expense | |
| Fidelity Real Estate Equity Central Fund | Borrower | $32,033,000 | .33% | $868 |
Interfund Trades. Funds may purchase from or sell securities to other Fidelity Funds under procedures adopted by the Board. The procedures have been designed to ensure these interfund trades are executed in accordance with Rule 17a-7 of the 1940 Act. Any interfund trades are included within the respective purchases and sales amounts shown in the Purchases and Sales of Investments note and are noted in the table below.
| Purchases ($) | Sales ($) | |
| Fidelity Real Estate Equity Central Fund | 63,962,936 | 12,546,107 |
Prior Fiscal Year Affiliated Exchanges In-Kind. Shares that were exchanged for investments, including accrued interest and cash, if any, are shown in the table below. The amount of in-kind exchanges is included in share transactions in the accompanying Statement of Changes in Net Assets.
| Shares | Total Proceeds ($) | |
| Fidelity Real Estate Equity Central Fund | 4,177,959 | 505,031,710 |
6. Security Lending.
Funds lend portfolio securities from time to time in order to earn additional income. Lending agents are used, including National Financial Services (NFS), an affiliate of the investment adviser. Pursuant to a securities lending agreement, NFS will receive a fee, which is capped at 9.9% of a fund's daily lending revenue, for its services as lending agent. A fund may lend securities to certain qualified borrowers, including NFS. On the settlement date of the loan, a fund receives collateral (in the form of U.S. Treasury obligations, letters of credit and/or cash) against the loaned securities and maintains collateral in an amount not less than 100% of the market value of the loaned securities during the period of the loan. The market value of the loaned securities is determined at the close of business of a fund and any additional required collateral is delivered to a fund on the next business day. A fund or borrower may terminate the loan at any time, and if the borrower defaults on its obligation to return the securities loaned because of insolvency or other reasons, a fund may apply collateral received from the borrower against the obligation. A fund may experience delays and costs in recovering the securities loaned. Any cash collateral received is invested in the Fidelity Securities Lending Cash Central Fund. Any loaned securities are identified as such in the Schedule of Investments, and the value of loaned securities and cash collateral at period end, as applicable, are presented in the Statement of Assets and Liabilities. Security lending income represents the income earned on investing cash collateral, less rebates paid to borrowers and any lending agent fees associated with the loan, plus any premium payments received for lending certain types of securities. Security lending income is presented in the Statement of Operations as a component of income from Fidelity Central Funds. Affiliated security lending activity, if any, was as follows:
| Total Security Lending Fees Paid to NFS | Security Lending Income From Securities Loaned to NFS | Value of Securities Loaned to NFS at Period End | |
| Fidelity Real Estate Equity Central Fund | $2,090 | $– | $– |
7. Expense Reductions.
Through arrangements with the Fund's custodian, credits realized as a result of certain uninvested cash balances were used to reduce the Fund's expenses by $16.
8. Other.
Fund's organizational documents provide former and current directors and officers with a limited indemnification against liabilities arising in connection with the performance of their duties to the fund. In the normal course of business, the fund may also enter into contracts that provide general indemnifications. The fund's maximum exposure under these arrangements is unknown as this would be dependent on future claims that may be made against the fund. The risk of material loss from such claims is considered remote.
At the end of the period, mutual funds managed by the investment adviser or its affiliates were the owners of record of all of the outstanding shares of the Fund.
9. Coronavirus (COVID-19) Pandemic.
An outbreak of COVID-19 first detected in China during December 2019 has since spread globally and was declared a pandemic by the World Health Organization during March 2020. Developments that disrupt global economies and financial markets, such as the COVID-19 pandemic, may magnify factors that affect the Fund's performance.
Report of Independent Registered Public Accounting Firm
To the Board of Trustees of Fidelity Central Investment Portfolios LLC and Shareholders of Fidelity Real Estate Equity Central Fund
Opinion on the Financial Statements and Financial Highlights
We have audited the accompanying statement of assets and liabilities of Fidelity Real Estate Equity Central Fund (the "Fund"), a fund of Fidelity Central Investment Portfolios LLC, including the schedule of investments, as of September 30, 2021, the related statement of operations for the year then ended, the statement of changes in net assets for each of the two years in the period then ended, the financial highlights for each of the five years in the period then ended, and the related notes. In our opinion, the financial statements and financial highlights present fairly, in all material respects, the financial position of the Fund as of September 30, 2021, and the results of its operations for the year then ended, the changes in its net assets for each of the two years in the period then ended, and the financial highlights for each of the five years in the period then ended in conformity with accounting principles generally accepted in the United States of America.
Basis for Opinion
These financial statements and financial highlights are the responsibility of the Fund's management. Our responsibility is to express an opinion on the Fund's financial statements and financial highlights based on our audits. We are a public accounting firm registered with the Public Company Accounting Oversight Board (United States) (PCAOB) and are required to be independent with respect to the Fund in accordance with the U.S. federal securities laws and the applicable rules and regulations of the Securities and Exchange Commission and the PCAOB.
We conducted our audits in accordance with the standards of the PCAOB. Those standards require that we plan and perform the audit to obtain reasonable assurance about whether the financial statements and financial highlights are free of material misstatement, whether due to error or fraud. The Fund is not required to have, nor were we engaged to perform, an audit of its internal control over financial reporting. As part of our audits we are required to obtain an understanding of internal control over financial reporting but not for the purpose of expressing an opinion on the effectiveness of the Fund’s internal control over financial reporting. Accordingly, we express no such opinion.
Our audits included performing procedures to assess the risks of material misstatement of the financial statements and financial highlights, whether due to error or fraud, and performing procedures that respond to those risks. Such procedures included examining, on a test basis, evidence regarding the amounts and disclosures in the financial statements and financial highlights. Our audits also included evaluating the accounting principles used and significant estimates made by management, as well as evaluating the overall presentation of the financial statements and financial highlights. Our procedures included confirmation of securities owned as of September 30, 2021, by correspondence with the custodian and brokers; when replies were not received from brokers, we performed other auditing procedures. We believe that our audits provide a reasonable basis for our opinion.
/s/ Deloitte & Touche LLP
Boston, Massachusetts
November 10, 2021
We have served as the auditor of one or more of the Fidelity investment companies since 1999.
Directors and Officers (Trustees and Officers)
The Trustees, Members of the Advisory Board (if any), and officers of the Fidelity Central Investment Portfolios LLC and fund, as applicable, are listed below. The Board of Trustees governs the fund and is responsible for protecting the interests of shareholders. The Trustees are experienced executives who meet periodically throughout the year to oversee the fund's activities, review contractual arrangements with companies that provide services to the fund, oversee management of the risks associated with such activities and contractual arrangements, and review the fund's performance. Each of the Trustees oversees 313 funds.
The Trustees hold office without limit in time except that (a) any Trustee may resign; (b) any Trustee may be removed by written instrument, signed by at least two-thirds of the number of Trustees prior to such removal; (c) any Trustee who requests to be retired or who has become incapacitated by illness or injury may be retired by written instrument signed by a majority of the other Trustees; and (d) any Trustee may be removed at any special meeting of shareholders by a two-thirds vote of the outstanding voting securities of the trust. Each Trustee who is not an interested person (as defined in the 1940 Act) of the trust and the fund is referred to herein as an Independent Trustee. Each Independent Trustee shall retire not later than the last day of the calendar year in which his or her 75th birthday occurs. The Independent Trustees may waive this mandatory retirement age policy with respect to individual Trustees. Officers and Advisory Board Members hold office without limit in time, except that any officer or Advisory Board Member may resign or may be removed by a vote of a majority of the Trustees at any regular meeting or any special meeting of the Trustees. Except as indicated, each individual has held the office shown or other offices in the same company for the past five years.
The fund’s Statement of Additional Information (SAI) includes more information about the Trustees. To request a free copy, call Fidelity at 1-800-544-8544.
Experience, Skills, Attributes, and Qualifications of the Trustees. The Governance and Nominating Committee has adopted a statement of policy that describes the experience, qualifications, attributes, and skills that are necessary and desirable for potential Independent Trustee candidates (Statement of Policy). The Board believes that each Trustee satisfied at the time he or she was initially elected or appointed a Trustee, and continues to satisfy, the standards contemplated by the Statement of Policy. The Governance and Nominating Committee also engages professional search firms to help identify potential Independent Trustee candidates who have the experience, qualifications, attributes, and skills consistent with the Statement of Policy. From time to time, additional criteria based on the composition and skills of the current Independent Trustees, as well as experience or skills that may be appropriate in light of future changes to board composition, business conditions, and regulatory or other developments, have also been considered by the professional search firms and the Governance and Nominating Committee. In addition, the Board takes into account the Trustees' commitment and participation in Board and committee meetings, as well as their leadership of standing and ad hoc committees throughout their tenure.
In determining that a particular Trustee was and continues to be qualified to serve as a Trustee, the Board has considered a variety of criteria, none of which, in isolation, was controlling. The Board believes that, collectively, the Trustees have balanced and diverse experience, qualifications, attributes, and skills, which allow the Board to operate effectively in governing the fund and protecting the interests of shareholders. Information about the specific experience, skills, attributes, and qualifications of each Trustee, which in each case led to the Board's conclusion that the Trustee should serve (or continue to serve) as a trustee of the fund, is provided below.
Board Structure and Oversight Function. Robert A. Lawrence is an interested person and currently serves as Acting Chairman. The Trustees have determined that an interested Chairman is appropriate and benefits shareholders because an interested Chairman has a personal and professional stake in the quality and continuity of services provided to the fund. Independent Trustees exercise their informed business judgment to appoint an individual of their choosing to serve as Chairman, regardless of whether the Trustee happens to be independent or a member of management. The Independent Trustees have determined that they can act independently and effectively without having an Independent Trustee serve as Chairman and that a key structural component for assuring that they are in a position to do so is for the Independent Trustees to constitute a substantial majority for the Board. The Independent Trustees also regularly meet in executive session. David M. Thomas serves as Lead Independent Trustee and as such (i) acts as a liaison between the Independent Trustees and management with respect to matters important to the Independent Trustees and (ii) with management prepares agendas for Board meetings.
Fidelity® funds are overseen by different Boards of Trustees. The fund's Board oversees Fidelity's high income and certain equity funds, and other Boards oversee Fidelity's investment-grade bond, money market, asset allocation, and other equity funds. The asset allocation funds may invest in Fidelity® funds overseen by the fund's Board. The use of separate Boards, each with its own committee structure, allows the Trustees of each group of Fidelity® funds to focus on the unique issues of the funds they oversee, including common research, investment, and operational issues. On occasion, the separate Boards establish joint committees to address issues of overlapping consequences for the Fidelity® funds overseen by each Board.
The Trustees operate using a system of committees to facilitate the timely and efficient consideration of all matters of importance to the Trustees, the fund, and fund shareholders and to facilitate compliance with legal and regulatory requirements and oversight of the fund's activities and associated risks. The Board, acting through its committees, has charged FMR and its affiliates with (i) identifying events or circumstances the occurrence of which could have demonstrably adverse effects on the fund's business and/or reputation; (ii) implementing processes and controls to lessen the possibility that such events or circumstances occur or to mitigate the effects of such events or circumstances if they do occur; and (iii) creating and maintaining a system designed to evaluate continuously business and market conditions in order to facilitate the identification and implementation processes described in (i) and (ii) above. Because the day-to-day operations and activities of the fund are carried out by or through FMR, its affiliates, and other service providers, the fund's exposure to risks is mitigated but not eliminated by the processes overseen by the Trustees. While each of the Board's committees has responsibility for overseeing different aspects of the fund's activities, oversight is exercised primarily through the Operations, Audit, and Compliance Committees. Appropriate personnel, including but not limited to the fund's Chief Compliance Officer (CCO), FMR's internal auditor, the independent accountants, the fund's Treasurer and portfolio management personnel, make periodic reports to the Board's committees, as appropriate, including an annual review of Fidelity's risk management program for the Fidelity® funds. The responsibilities of each standing committee, including their oversight responsibilities, are described further under "Standing Committees of the Trustees."
Interested Trustees*:
Correspondence intended for a Trustee who is an interested person may be sent to Fidelity Investments, 245 Summer Street, Boston, Massachusetts 02210.
Name, Year of Birth; Principal Occupations and Other Relevant Experience+
Bettina Doulton (1964)
Year of Election or Appointment: 2020
Trustee
Ms. Doulton also serves as Trustee of other Fidelity® funds. Prior to her retirement, Ms. Doulton served in a variety of positions at Fidelity Investments, including as a managing director of research (2006-2007), portfolio manager to certain Fidelity® funds (1993-2005), equity analyst and portfolio assistant (1990-1993), and research assistant (1987-1990). Ms. Doulton currently owns and operates Phi Builders + Architects and Cellardoor Winery. Previously, Ms. Doulton served as a member of the Board of Brown Capital Management, LLC (2014-2018).
Robert A. Lawrence (1952)
Year of Election or Appointment: 2020
Trustee
Acting Chairman of the Board of Trustees
Mr. Lawrence also serves as Trustee of other funds. Previously, Mr. Lawrence served as a Member of the Advisory Board of certain funds. Prior to his retirement in 2008, Mr. Lawrence served as Vice President of certain Fidelity® funds (2006-2008), Senior Vice President, Head of High Income Division of Fidelity Management & Research Company (investment adviser firm, 2006-2008), and President of Fidelity Strategic Investments (investment adviser firm, 2002-2005).
* Determined to be an “Interested Trustee” by virtue of, among other things, his or her affiliation with the Fidelity Central Investment Portfolios LLC or various entities under common control with FMR.
+ The information includes the Trustee's principal occupation during the last five years and other information relating to the experience, attributes, and skills relevant to the Trustee's qualifications to serve as a Trustee, which led to the conclusion that the Trustee should serve as a Trustee for the fund.
Independent Trustees:
Correspondence intended for an Independent Trustee may be sent to Fidelity Investments, P.O. Box 55235, Boston, Massachusetts 02205-5235.
Name, Year of Birth; Principal Occupations and Other Relevant Experience+
Thomas P. Bostick (1956)
Year of Election or Appointment: 2021
Trustee
Lieutenant General Bostick also serves as Trustee of other Fidelity® funds. Prior to his retirement, General Bostick (United States Army, Retired) held a variety of positions within the U.S. Army, including Commanding General and Chief of Engineers, U.S. Army Corps of Engineers (2012-2016) and Deputy Chief of Staff and Director of Human Resources, U.S. Army (2009-2012). General Bostick currently serves as a member of the Board and Finance and Governance Committees of CSX Corporation (transportation, 2020-present) and a member of the Board and Corporate Governance and Nominating Committee of Perma-Fix Environmental Services, Inc. (nuclear waste management, 2020-present). General Bostick serves as Chief Executive Officer of Bostick Global Strategies, LLC (consulting, 2016-present) and Managing Partner, Sustainability, of Ridge-Lane Limited Partners (strategic advisory and venture development, 2016-present). Previously, General Bostick served as a Member of the Advisory Board of certain Fidelity® funds (2021), President, Intrexon Bioengineering (2018-2020) and Chief Operating Officer (2017-2020) and Senior Vice President of the Environment Sector (2016-2017) of Intrexon Corporation (biopharmaceutical company).
Dennis J. Dirks (1948)
Year of Election or Appointment: 2005
Trustee
Mr. Dirks also serves as Trustee of other Fidelity® funds. Prior to his retirement in May 2003, Mr. Dirks served as Chief Operating Officer and as a member of the Board of The Depository Trust & Clearing Corporation (financial markets infrastructure), President, Chief Operating Officer and a member of the Board of The Depository Trust Company (DTC), President and a member of the Board of the National Securities Clearing Corporation (NSCC), Chief Executive Officer and a member of the Board of the Government Securities Clearing Corporation and Chief Executive Officer and a member of the Board of the Mortgage-Backed Securities Clearing Corporation. Mr. Dirks currently serves as a member of the Finance Committee (2016-present) and Board (2017-present) and is Treasurer (2018-present) of the Asolo Repertory Theatre.
Donald F. Donahue (1950)
Year of Election or Appointment: 2018
Trustee
Mr. Donahue also serves as Trustee of other Fidelity® funds. Mr. Donahue serves as President and Chief Executive Officer of Miranda Partners, LLC (risk consulting for the financial services industry, 2012-present). Previously, Mr. Donahue served as Chief Executive Officer (2006-2012), Chief Operating Officer (2003-2006) and Managing Director, Customer Marketing and Development (1999-2003) of The Depository Trust & Clearing Corporation (financial markets infrastructure). Mr. Donahue currently serves as a member (2007-present) and Co-Chairman (2016-present) of the Board of United Way of New York and a member of the Board of NYC Leadership Academy (2012-present). Mr. Donahue previously served as a member of the Advisory Board of certain Fidelity® funds (2015-2018).
Vicki L. Fuller (1957)
Year of Election or Appointment: 2020
Trustee
Ms. Fuller also serves as Trustee of other Fidelity® funds. Previously, Ms. Fuller served as a member of the Advisory Board of certain Fidelity® funds (2018-2020), Chief Investment Officer of the New York State Common Retirement Fund (2012-2018) and held a variety of positions at AllianceBernstein L.P. (global asset management, 1985-2012), including Managing Director (2006-2012) and Senior Vice President and Senior Portfolio Manager (2001-2006). Ms. Fuller currently serves as a member of the Board, Audit Committee and Nominating and Governance Committee of The Williams Companies, Inc. (natural gas infrastructure, 2018-present), as a member of the Board, Audit Committee and Nominating and Governance Committee of two Blackstone business development companies (2020-present) and as a member of the Board of Treliant, LLC (consulting, 2019-present).
Patricia L. Kampling (1959)
Year of Election or Appointment: 2020
Trustee
Ms. Kampling also serves as Trustee of other Fidelity® funds. Prior to her retirement, Ms. Kampling served as Chairman of the Board and Chief Executive Officer (2012-2019), President and Chief Operating Officer (2011-2012) and Executive Vice President and Chief Financial Officer (2010-2011) of Alliant Energy Corporation. Ms. Kampling currently serves as a member of the Board, Finance Committee and Governance, Compensation and Nominating Committee of Xcel Energy Inc. (utilities company, 2020-present) and as a member of the Board, Audit, Finance and Risk Committee and Safety, Environmental, Technology and Operations Committee of American Water Works Company, Inc. (utilities company, 2019-present). In addition, Ms. Kampling currently serves as a member of the Board of the Nature Conservancy, Wisconsin Chapter (2019-present). Previously, Ms. Kampling served as a Member of the Advisory Board of certain Fidelity® funds (2020), a member of the Board, Compensation Committee and Executive Committee and Chair of the Audit Committee of Briggs & Stratton Corporation (manufacturing, 2011-2021), a member of the Board of Interstate Power and Light Company (2012-2019) and Wisconsin Power and Light Company (2012-2019) (each a subsidiary of Alliant Energy Corporation) and as a member of the Board and Workforce Development Committee of the Business Roundtable (2018-2019).
Thomas A. Kennedy (1955)
Year of Election or Appointment: 2021
Trustee
Mr. Kennedy also serves as Trustee of other Fidelity® funds. Previously, Mr. Kennedy served as a Member of the Advisory Board of certain Fidelity® funds (2020) and held a variety of positions at Raytheon Company (aerospace and defense, 1983-2020), including Chairman and Chief Executive Officer (2014-2020) and Executive Vice President and Chief Operating Officer (2013-2014). Mr. Kennedy currently serves as Executive Chairman of the Board of Directors of Raytheon Technologies Corporation (aerospace and defense, 2020-present). He is also a member of the Rutgers School of Engineering Industry Advisory Board (2011-present) and a member of the UCLA Engineering Dean’s Executive Board (2016-present).
Oscar Munoz (1959)
Year of Election or Appointment: 2021
Trustee
Mr. Munoz also serves as Trustee of other Fidelity® funds. Prior to his retirement, Mr. Munoz served as Executive Chairman (2020-2021), Chief Executive Officer (2015-2020), President (2015-2016) and a member of the Board (2010-2021) of United Airlines Holdings, Inc. Mr. Munoz currently serves as a member of the Board of CBRE Group, Inc. (commercial real estate, 2020-present), a member of the Board of Univision Communications, Inc. (Hispanic media, 2020-present) and a member of the Advisory Board of Salesforce.com, Inc. (cloud-based software, 2020-present). Previously, Mr. Munoz served as a Member of the Advisory Board of certain Fidelity® funds (2021).
Garnett A. Smith (1947)
Year of Election or Appointment: 2018
Trustee
Mr. Smith also serves as Trustee of other Fidelity® funds. Prior to his retirement, Mr. Smith served as Chairman and Chief Executive Officer (1990-1997) and President (1986-1990) of Inbrand Corp. (manufacturer of personal absorbent products). Prior to his employment with Inbrand Corp., he was employed by a retail fabric chain and North Carolina National Bank (now Bank of America). Mr. Smith previously served as a member of the Advisory Board of certain Fidelity® funds (2012-2013).
David M. Thomas (1949)
Year of Election or Appointment: 2008
Trustee
Lead Independent Trustee
Mr. Thomas also serves as Trustee of other Fidelity® funds. Previously, Mr. Thomas served as Executive Chairman (2005-2006) and Chairman and Chief Executive Officer (2000-2005) of IMS Health, Inc. (pharmaceutical and healthcare information solutions). Mr. Thomas currently serves as a member of the Board of Fortune Brands Home and Security (home and security products, 2004-present) and Presiding Director (2013-present) of Interpublic Group of Companies, Inc. (marketing communication).
Susan Tomasky (1953)
Year of Election or Appointment: 2020
Trustee
Ms. Tomasky also serves as Trustee of other Fidelity® funds. Prior to her retirement, Ms. Tomasky served in various executive officer positions at American Electric Power Company, Inc. (1998-2011), including most recently as President of AEP Transmission (2007-2011). Ms. Tomasky currently serves as a member of the Board and Sustainability Committee and as Chair of the Audit Committee of Marathon Petroleum Corporation (2018-present) and as a member of the Board, Corporate Governance Committee and Organization and Compensation Committee and as Chair of the Audit Committee of Public Service Enterprise Group, Inc. (utilities company, 2012-present). In addition, Ms. Tomasky currently serves as a member (2009-present) and President (2020-present) of the Board of the Royal Shakespeare Company – America (2009-present), as a member of the Board of the Columbus Association for the Performing Arts (2011-present) and as a member of the Board and Investment Committee of Kenyon College (2016-present). Previously, Ms. Tomasky served as a Member of the Advisory Board of certain Fidelity® funds (2020), as a member of the Board of the Columbus Regional Airport Authority (2007-2020), as a member of the Board (2011-2018) and Lead Independent Director (2015-2018) of Andeavor Corporation (previously Tesoro Corporation) (independent oil refiner and marketer) and as a member of the Board of Summit Midstream Partners LP (energy, 2012-2018).
Michael E. Wiley (1950)
Year of Election or Appointment: 2018
Trustee
Mr. Wiley also serves as Trustee of other Fidelity® funds. Previously, Mr. Wiley served as a member of the Advisory Board of certain Fidelity® funds (2018-2020), Chairman, President and CEO of Baker Hughes, Inc. (oilfield services, 2000-2004). Mr. Wiley also previously served as a member of the Board of Andeavor Corporation (independent oil refiner and marketer, 2005-2018), a member of the Board of Andeavor Logistics LP (natural resources logistics, 2015-2018) and a member of the Board of High Point Resources (exploration and production, 2005-2020).
+ The information includes the Trustee's principal occupation during the last five years and other information relating to the experience, attributes, and skills relevant to the Trustee's qualifications to serve as a Trustee, which led to the conclusion that the Trustee should serve as a Trustee for the fund.
Advisory Board Members and Officers:
Correspondence intended for a Member of the Advisory Board (if any) may be sent to Fidelity Investments, P.O. Box 55235, Boston, Massachusetts 02205-5235. Correspondence intended for an officer or Peter S. Lynch may be sent to Fidelity Investments, 245 Summer Street, Boston, Massachusetts 02210. Officers appear below in alphabetical order.
Name, Year of Birth; Principal Occupation
Peter S. Lynch (1944)
Year of Election or Appointment: 2004
Member of the Advisory Board
Mr. Lynch also serves as a Member of the Advisory Board of other Fidelity® funds. Mr. Lynch is Vice Chairman and a Director of Fidelity Management & Research Company LLC (investment adviser firm). In addition, Mr. Lynch serves as a Trustee of Boston College and as the Chairman of the Inner-City Scholarship Fund. Previously, Mr. Lynch served as Vice Chairman and a Director of FMR Co., Inc. (investment adviser firm) and on the Special Olympics International Board of Directors (1997-2006).
Craig S. Brown (1977)
Year of Election or Appointment: 2019
Assistant Treasurer
Mr. Brown also serves as an officer of other funds. Mr. Brown serves as Assistant Treasurer of FIMM, LLC (2021-present) and is an employee of Fidelity Investments (2013-present).
John J. Burke III (1964)
Year of Election or Appointment: 2018
Chief Financial Officer
Mr. Burke also serves as Chief Financial Officer of other funds. Mr. Burke serves as Head of Investment Operations for Fidelity Fund and Investment Operations (2018-present) and is an employee of Fidelity Investments (1998-present). Previously Mr. Burke served as head of Asset Management Investment Operations (2012-2018).
William C. Coffey (1969)
Year of Election or Appointment: 2019
Assistant Secretary
Mr. Coffey also serves as Assistant Secretary of other funds. He is Senior Vice President and Deputy General Counsel of FMR LLC (diversified financial services company, 2010-present), and is an employee of Fidelity Investments. Previously, Mr. Coffey served as Secretary and CLO of certain funds (2018-2019); CLO, Secretary, and Senior Vice President of Fidelity Management & Research Company and FMR Co., Inc. (investment adviser firms, 2018-2019); Secretary of Fidelity SelectCo, LLC and Fidelity Investments Money Management, Inc. (investment adviser firms, 2018-2019); CLO of Fidelity Management & Research (Hong Kong) Limited, FMR Investment Management (UK) Limited, and Fidelity Management & Research (Japan) Limited (investment adviser firms, 2018-2019); and Assistant Secretary of certain funds (2009-2018).
Timothy M. Cohen (1969)
Year of Election or Appointment: 2017
Vice President
Mr. Cohen also serves as Vice President of other funds. Mr. Cohen serves as Co-Head of Equity (2018-present), a Director of Fidelity Management & Research (Japan) Limited (investment adviser firm, 2016-present), and is an employee of Fidelity Investments. Previously, Mr. Cohen served as Executive Vice President of Fidelity SelectCo, LLC (2019), Head of Global Equity Research (2016-2018), Chief Investment Officer - Equity and a Director of Fidelity Management & Research (U.K.) Inc. (investment adviser firm, 2013-2015) and as a Director of Fidelity Management & Research (Hong Kong) Limited (investment adviser firm, 2017).
Jonathan Davis (1968)
Year of Election or Appointment: 2010
Assistant Treasurer
Mr. Davis also serves as an officer of other funds. Mr. Davis serves as Assistant Treasurer of FIMM, LLC (2021-present), FMR Capital, Inc. (2017-present), FD Funds GP LLC (2021-present), FD Funds Holding LLC (2021-present), and FD Funds Management LLC (2021-present); and is an employee of Fidelity Investments. Previously, Mr. Davis served as Vice President and Associate General Counsel of FMR LLC (diversified financial services company, 2003-2010).
Laura M. Del Prato (1964)
Year of Election or Appointment: 2018
Assistant Treasurer
Ms. Del Prato also serves as an officer of other funds. Ms. Del Prato serves as Assistant Treasurer of FIMM, LLC (2021-present) and is an employee of Fidelity Investments (2017-present). Previously, Ms. Del Prato served as President and Treasurer of The North Carolina Capital Management Trust: Cash Portfolio and Term Portfolio (2018-2020). Prior to joining Fidelity Investments, Ms. Del Prato served as a Managing Director and Treasurer of the JPMorgan Mutual Funds (2014-2017). Prior to JPMorgan, Ms. Del Prato served as a partner at Cohen Fund Audit Services (accounting firm, 2012-2013) and KPMG LLP (accounting firm, 2004-2012).
Colm A. Hogan (1973)
Year of Election or Appointment: 2020
Assistant Treasurer
Mr. Hogan also serves as an officer of other funds. Mr. Hogan serves as Assistant Treasurer of FIMM, LLC (2021-present) and FMR Capital, Inc. (2017-present) and is an employee of Fidelity Investments (2005-present). Previously, Mr. Hogan served as Deputy Treasurer of certain Fidelity® funds (2016-2020) and Assistant Treasurer of certain Fidelity® funds (2016-2018).
Pamela R. Holding (1964)
Year of Election or Appointment: 2018
Vice President
Ms. Holding also serves as Vice President of other funds. Ms. Holding serves as Co-Head of Equity (2018-present) and is an employee of Fidelity Investments (2013-present). Previously, Ms. Holding served as Executive Vice President of Fidelity SelectCo, LLC (2019) and as Chief Investment Officer of Fidelity Institutional Asset Management (2013-2018).
Cynthia Lo Bessette (1969)
Year of Election or Appointment: 2019
Secretary and Chief Legal Officer (CLO)
Ms. Lo Bessette also serves as an officer of other funds. Ms. Lo Bessette serves as CLO, Secretary, and Senior Vice President of Fidelity Management & Research Company LLC (investment adviser firm, 2019-present); CLO of Fidelity Management & Research (Hong Kong) Limited, FMR Investment Management (UK) Limited, and Fidelity Management & Research (Japan) Limited (investment adviser firms, 2019-present); Secretary of FD Funds GP LLC (2021-present), FD Funds Holding LLC (2021-present), and FD Funds Management LLC (2021-present); and Assistant Secretary of FIMM, LLC (2019-present). She is a Senior Vice President and Deputy General Counsel of FMR LLC (diversified financial services company, 2019-present), and is an employee of Fidelity Investments. Previously, Ms. Lo Bessette served as CLO, Secretary, and Senior Vice President of FMR Co., Inc. (investment adviser firm, 2019); Secretary of Fidelity SelectCo, LLC and Fidelity Investments Money Management, Inc. (investment adviser firms, 2019). Prior to joining Fidelity Investments, Ms. Lo Bessette was Executive Vice President, General Counsel (2016-2019) and Senior Vice President, Deputy General Counsel (2015-2016) of OppenheimerFunds (investment management company) and Deputy Chief Legal Officer (2013-2015) of Jennison Associates LLC (investment adviser firm).
Chris Maher (1972)
Year of Election or Appointment: 2020
Deputy Treasurer
Mr. Maher also serves as an officer of other funds. Mr. Maher serves as Assistant Treasurer of FIMM, LLC (2021-present) and FMR Capital, Inc. (2017-present), and is an employee of Fidelity Investments (2008-present). Previously, Mr. Maher served as Assistant Treasurer of certain funds (2013-2020); Vice President of Asset Management Compliance (2013), Vice President of the Program Management Group of FMR (investment adviser firm, 2010-2013), and Vice President of Valuation Oversight (2008-2010).
Jason P. Pogorelec (1975)
Year of Election or Appointment: 2020
Chief Compliance Officer
Mr. Pogorelec also serves as Chief Compliance Officer of other funds. Mr. Pogorelec is a senior Vice President of Asset Management Compliance for Fidelity Investments and is an employee of Fidelity Investments (2006-present). Previously, Mr. Pogorelec served as Vice President, Associate General Counsel for Fidelity Investments (2010-2020) and Assistant Secretary of certain Fidelity funds (2015-2020).
Brett Segaloff (1972)
Year of Election or Appointment: 2021
Anti-Money Laundering (AML) Officer
Mr. Segaloff also serves as an AML Officer of other funds and other related entities. He is Director, Anti-Money Laundering (2007-present) of FMR LLC (diversified financial services company) and is an employee of Fidelity Investments (1996-present).
Stacie M. Smith (1974)
Year of Election or Appointment: 2016
President and Treasurer
Ms. Smith also serves as an officer of other funds. Ms. Smith serves as Assistant Treasurer of FIMM, LLC (2021-present) and FMR Capital, Inc. (2017-present), is an employee of Fidelity Investments (2009-present), and has served in other fund officer roles. Prior to joining Fidelity Investments, Ms. Smith served as Senior Audit Manager of Ernst & Young LLP (accounting firm, 1996-2009). Previously, Ms. Smith served as Assistant Treasurer (2013-2019) and Deputy Treasurer (2013-2016) of certain Fidelity® funds.
Jim Wegmann (1979)
Year of Election or Appointment: 2019
Assistant Treasurer
Mr. Wegmann also serves as an officer of other funds. Mr. Wegmann serves as Assistant Treasurer of FIMM, LLC (2021-present) and is an employee of Fidelity Investments (2011-present).
Shareholder Expense Example
As a shareholder, you incur two types of costs: (1) transaction costs, which may include sales charges (loads) on purchase payments or redemption proceeds, as applicable and (2) ongoing costs, which generally include management fees, distribution and/or service (12b-1) fees and other Fund expenses. This Example is intended to help you understand your ongoing costs (in dollars) of investing in a fund and to compare these costs with the ongoing costs of investing in other mutual funds.
The Example is based on an investment of $1,000 invested at the beginning of the period and held for the entire period (April 1, 2021 to September 30, 2021).
Actual Expenses
The first line of the accompanying table provides information about actual account values and actual expenses. You may use the information in this line, together with the amount you invested, to estimate the expenses that you paid over the period. Simply divide your account value by $1,000.00 (for example, an $8,600 account value divided by $1,000.00 = 8.6), then multiply the result by the number in the first line for a class/Fund under the heading entitled "Expenses Paid During Period" to estimate the expenses you paid on your account during this period. If any fund is a shareholder of any underlying mutual funds or exchange-traded funds (ETFs) (the Underlying Funds), such fund indirectly bears its proportional share of the expenses of the Underlying Funds in addition to the direct expenses incurred presented in the table. These fees and expenses are not included in the annualized expense ratio used to calculate the expense estimate in the table below.
Hypothetical Example for Comparison Purposes
The second line of the accompanying table provides information about hypothetical account values and hypothetical expenses based on the actual expense ratio and an assumed rate of return of 5% per year before expenses, which is not the actual return. The hypothetical account values and expenses may not be used to estimate the actual ending account balance or expenses you paid for the period. You may use this information to compare the ongoing costs of investing in the Fund and other funds. To do so, compare this 5% hypothetical example with the 5% hypothetical examples that appear in the shareholder reports of the other funds. If any fund is a shareholder of any Underlying Funds, such fund indirectly bears its proportional share of the expenses of the Underlying Funds in addition to the direct expenses as presented in the table. These fees and expenses are not included in the annualized expense ratio used to calculate the expense estimate in the table below.
Please note that the expenses shown in the table are meant to highlight your ongoing costs only and do not reflect any transaction costs. Therefore, the second line of the table is useful in comparing ongoing costs only, and will not help you determine the relative total costs of owning different funds.
| Annualized Expense Ratio-A | Beginning Account Value April 1, 2021 | Ending Account Value September 30, 2021 | Expenses Paid During Period-B April 1, 2021 to September 30, 2021 | |
| Fidelity Real Estate Equity Central Fund | .0018% | |||
| Actual | $1,000.00 | $1,136.50 | $.01 | |
| Hypothetical-C | $1,000.00 | $1,025.06 | $.01 |
A Annualized expense ratio reflects expenses net of applicable fee waivers.
B Expenses are equal to the annualized expense ratio, multiplied by the average account value over the period, multiplied by 183/ 365 (to reflect the one-half year period). The fees and expenses of any Underlying Funds are not included in each annualized expense ratio.
C 5% return per year before expenses
Distributions (Unaudited)
A percentage of the dividends distributed during the fiscal year qualify as a Section 199A dividend:
| October, 2020 | 93% |
| November, 2020 | 94% |
| December, 2020 | 99% |
| June, 2021 | 100% |
| September, 2021 | 100% |
The fund will notify shareholders in January 2022 of amounts for use in preparing 2021 income tax returns.
Board Approval of Investment Advisory Contracts and Management Fees
Fidelity Real Estate Equity Central Fund
Each year, the Board of Directors, including the Independent Directors (together, the Board), votes on the renewal of the management contract with Fidelity Management & Research Company LLC (FMR) and the sub-advisory agreements (together, the Advisory Contracts) for the fund. FMR and the sub-advisers are referred to herein as the Investment Advisers. The Board, assisted by the advice of fund counsel and Independent Directors' counsel, requests and considers a broad range of information relevant to the renewal of the Advisory Contracts throughout the year.The Board meets regularly and, at each of its meetings, covers an extensive agenda of topics and materials and considers factors that are relevant to its annual consideration of the renewal of the fund's Advisory Contracts, including the services and support provided to the fund and its shareholders. The Board has established various standing committees (Committees), each composed of and chaired by Independent Directors with varying backgrounds, to which the Board has assigned specific subject matter responsibilities in order to enhance effective decision-making by the Board. The Board, acting directly and through its Committees, requests and receives information concerning the annual consideration of the renewal of the fund's Advisory Contracts. The Board also meets as needed to review matters specifically related to the Board's annual consideration of the renewal of the Advisory Contracts. Members of the Board may also meet with trustees of other Fidelity funds through joint ad hoc committees to discuss certain matters relevant to all of the Fidelity funds.At its May 2021 meeting, the Board unanimously determined to renew the fund's Advisory Contracts. In reaching its determination, the Board considered all factors it believed relevant and reached a determination, with the assistance of fund counsel and Independent Directors' counsel and through the exercise of its business judgment, that the renewal of the Advisory Contracts was in the best interests of the fund and its shareholders and the fact that no fee is payable under the management contract was fair and reasonable.Nature, Extent, and Quality of Services Provided. The Board considered Fidelity's staffing as it relates to the fund, including the backgrounds of investment personnel of Fidelity, and also considered the fund's investment objective, strategies, and related investment philosophy. The Independent Directors also had discussions with senior management of Fidelity's investment operations and investment groups. The Board considered the structure of the investment personnel compensation program and whether this structure provides appropriate incentives to act in the best interests of the fund.Resources Dedicated to Investment Management and Support Services. The Board and the Fund Oversight and Research Committees reviewed the general qualifications and capabilities of Fidelity's investment staff, including its size, education, experience, and resources, as well as Fidelity's approach to recruiting, training, managing, and compensating investment personnel. The Board noted that Fidelity has continued to increase the resources devoted to non-U.S. offices, including expansion of Fidelity's global investment organization. The Board also noted that Fidelity's analysts have extensive resources, tools and capabilities that allow them to conduct sophisticated quantitative and fundamental analysis, as well as credit analysis of issuers, counterparties and guarantors. Further, the Board considered that Fidelity's investment professionals have sufficient access to global information and data so as to provide competitive investment results over time, and that those professionals also have access to sophisticated tools that permit them to assess portfolio construction and risk and performance attribution characteristics continuously, as well as to transmit new information and research conclusions rapidly around the world. Additionally, in its deliberations, the Board considered Fidelity's trading, risk management, compliance, and technology and operations capabilities and resources, which are integral parts of the investment management process. The Board also considered Fidelity's investments in business continuity planning, and its success in continuously providing services to the fund notwithstanding the severe disruptions caused by the COVID-19 pandemic.Administrative Services. The Board considered (i) the nature, extent, quality, and cost of advisory and administrative services performed by the Investment Advisers and their affiliates under the Advisory Contracts and under separate agreements covering transfer agency, pricing and bookkeeping, and securities lending services for the fund; (ii) the nature and extent of the supervision of third party service providers, principally custodians, subcustodians, and pricing vendors; and (iii) the resources devoted to, and the record of compliance with, the fund's compliance policies and procedures. The Board also reviewed the allocation of fund brokerage, including allocations to brokers affiliated with the Investment Advisers, and the use of "soft" commission dollars to pay for research services.Investment Performance. The Board considered whether the fund has operated in accordance with its investment objective, as well as its record of compliance with its investment restrictions. The Board reviewed the fund's absolute investment performance, as well as the fund's relative investment performance, but did not consider performance to be a material factor in its decision to renew the fund's Advisory Contracts, as the fund is not publicly offered as a stand-alone investment product. In this regard, the Board noted that the fund is designed to offer a liquid investment option for other investment companies managed by Fidelity and ultimately to enhance the performance of those investment companies.Based on its review, the Board concluded that the nature, extent, and quality of services provided to the fund under the Advisory Contracts should continue to benefit the shareholders of the fund.Competitiveness of Management Fee and Total Expense Ratio. The Board considered that while the fund does not pay a management fee, FMR receives fees for providing services to funds that invest in the fund. The Board also noted that FMR bears all expenses of the fund with certain limited exceptions (i.e., custody fees, interest, taxes, fees and expenses of the Independent Trustees, proxy and shareholder meeting expenses, and extraordinary expenses). The Board further noted that the fund pays its non-operating expenses, including brokerage commissions and fees and expenses associated with the fund's securities lending program, if applicable. Based on its review, the Board concluded that the management fee received for providing services to the fund and the fund's total expense ratio were reasonable in light of the services that the fund and its shareholders receive and the other factors considered.Costs of the Services and Profitability. The Board considered the level of Fidelity's profits in respect of all the Fidelity funds, as well as the profitability of the funds that invest in the fund.A public accounting firm has been engaged annually by the Board as part of the Board's assessment of Fidelity's profitability analysis. The engagement includes the review and assessment of the methodologies used by Fidelity in determining the revenues and expenses attributable to Fidelity's mutual fund business, and completion of agreed-upon procedures in respect of the mathematical accuracy of certain fund profitability information and its conformity to established allocation methodologies. After considering the reports issued under the engagement and information provided by Fidelity, the Board concluded that while other allocation methods may also be reasonable, Fidelity's profitability methodologies are reasonable in all material respects.The Board also reviewed Fidelity's non-fund businesses and potential indirect benefits such businesses may have received as a result of their association with Fidelity's mutual fund business (i.e., fall-out benefits) as well as cases where Fidelity's affiliates may benefit from the funds' business. The Board considered areas where potential indirect benefits to the Fidelity funds from their relationships with Fidelity may exist. The Board also considered that in 2019 a joint ad hoc committee created by it and the boards of other Fidelity funds evaluated potential fall-out benefits (PFOB Committee). The Board noted that it considered the PFOB Committee's findings in connection with its consideration of the renewal of the Advisory Contracts.The Board concluded that the costs of the services provided by and the profits realized by Fidelity in connection with the operation of the fund were not relevant to the renewal of the Advisory Contracts because the fund pays no advisory fees and FMR bears all expenses of the fund with certain exceptions.Economies of Scale. The Board concluded that because the fund pays no advisory fees and FMR bears all expenses of the fund with certain exceptions, the realization of economies of scale was not a material factor in the Board's decision to renew the fund's Advisory Contract.Additional Information Requested by the Board. In order to develop fully the factual basis for consideration of the Fidelity funds' advisory contracts, the Board requested and received additional information on certain topics, including: (i) fund flow and performance trends, in particular the underperformance of certain funds and strategies, and Fidelity's long-term strategies for certain funds; (ii) consideration of expanding the use of performance fees for additional funds; (iii) Fidelity's pricing philosophy compared to competitors; (iv) metrics for evaluating index fund and ETF performance and information about ETF trading characteristics; (v) the methodology with respect to evaluating competitive fund data and peer group classifications and fee and expense comparisons; (vi) the expense structures for different funds and classes and information about the differences between various expense structures; (vii) group fee breakpoints; (viii) information regarding other accounts managed by Fidelity and sub-advisory arrangements; and (ix) Fidelity's philosophies and strategies for evaluating funds and classes with lower or declining asset levels.Based on its evaluation of all of the conclusions noted above, and after considering all factors it believed relevant, the Board concluded that the advisory fee arrangements are fair and reasonable, and that the fund's Advisory Contracts should be renewed.![]()
ESCIP-ANN-1121
1.831584.115
Fidelity® Floating Rate Central Fund
September 30, 2021
Contents
Board Approval of Investment Advisory Contracts and Management Fees |
To view a fund's proxy voting guidelines and proxy voting record for the 12-month period ended June 30, visit http://www.fidelity.com/proxyvotingresults or visit the Securities and Exchange Commission's (SEC) web site at http://www.sec.gov.
You may also call 1-800-544-8544 to request a free copy of the proxy voting guidelines.
Standard & Poor's, S&P and S&P 500 are registered service marks of The McGraw-Hill Companies, Inc. and have been licensed for use by Fidelity Distributors Corporation.
Other third-party marks appearing herein are the property of their respective owners.
All other marks appearing herein are registered or unregistered trademarks or service marks of FMR LLC or an affiliated company. © 2021 FMR LLC. All rights reserved.
A fund files its complete schedule of portfolio holdings with the SEC for the first and third quarters of each fiscal year on Form N-PORT. Forms N-PORT are available on the SEC’s web site at http://www.sec.gov. A fund's Forms N-PORT may be reviewed and copied at the SEC’s Public Reference Room in Washington, DC. Information regarding the operation of the SEC's Public Reference Room may be obtained by calling 1-800-SEC-0330.
Note to Shareholders:
Early in 2020, the outbreak and spread of COVID-19 emerged as a public health emergency that had a major influence on financial markets, primarily based on its impact on the global economy and corporate earnings. On March 11, 2020, the World Health Organization declared the COVID-19 outbreak a pandemic, citing sustained risk of further global spread. The pandemic prompted a number of measures to limit the spread of COVID-19, including travel and border restrictions, quarantines, and restrictions on large gatherings. In turn, these resulted in lower consumer activity, diminished demand for a wide range of products and services, disruption in manufacturing and supply chains, and – given the wide variability in outcomes regarding the outbreak – significant market uncertainty and volatility. To help stem the turmoil, the U.S. government took unprecedented action – in concert with the U.S. Federal Reserve and central banks around the world – to help support consumers, businesses, and the broader economy, and to limit disruption to the financial system.
In general, the overall impact of the pandemic lessened in 2021, amid a resilient economy and widespread distribution of three COVID-19 vaccines granted emergency use authorization from the U.S. Food and Drug Administration (FDA) early in the year. Still, the situation remains dynamic, and the extent and duration of its influence on financial markets and the economy is highly uncertain, due in part to a recent spike in cases based on highly contagious variants of the coronavirus.
Extreme events such as the COVID-19 crisis are exogenous shocks that can have significant adverse effects on mutual funds and their investments. Although multiple asset classes may be affected by market disruption, the duration and impact may not be the same for all types of assets. Fidelity is committed to helping you stay informed amid news about COVID-19 and during increased market volatility, and we continue to take extra steps to be responsive to customer needs. We encourage you to visit us online, where we offer ongoing updates, commentary, and analysis on the markets and our funds.
Performance: The Bottom Line
Average annual total return reflects the change in the value of an investment, assuming reinvestment of distributions from dividend income and capital gains (the profits earned upon the sale of securities that have grown in value, if any) and assuming a constant rate of performance each year. The hypothetical investment and the average annual total returns do not reflect the deduction of taxes that a shareholder would pay on fund distributions or the redemption of fund shares. During periods of reimbursement by Fidelity, a fund’s total return will be greater than it would be had the reimbursement not occurred. How a fund did yesterday is no guarantee of how it will do tomorrow.
Average Annual Total Returns
| For the periods ended September 30, 2021 | Past 1 year | Past 5 years | Past 10 years |
| Fidelity® Floating Rate Central Fund | 8.99% | 4.97% | 5.87% |
$10,000 Over 10 Years
Let's say hypothetically that $10,000 was invested in Fidelity® Floating Rate Central Fund on September 30, 2011.
The chart shows how the value of your investment would have changed, and also shows how the S&P®/LSTA Leveraged Performing Loan Index performed over the same period.
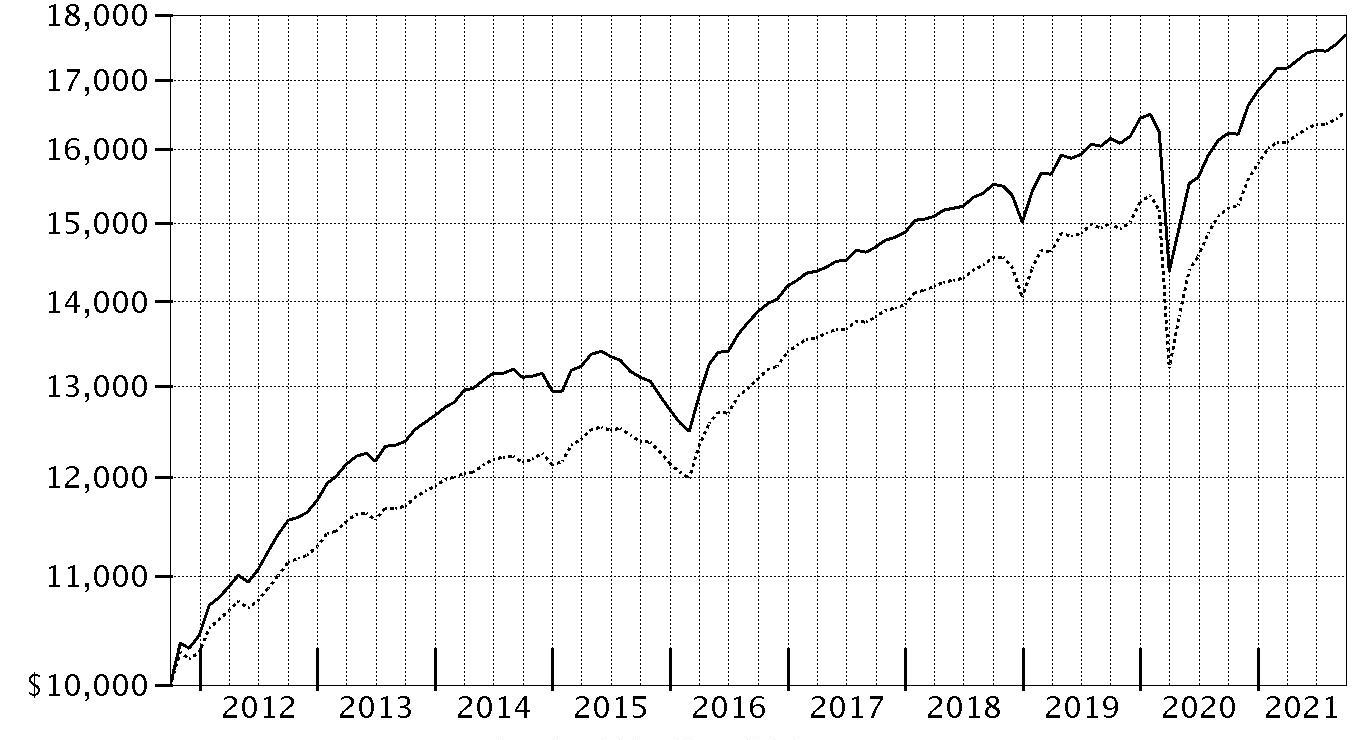
| Period Ending Values | ||
| $17,687 | Fidelity® Floating Rate Central Fund | |
| $16,540 | S&P®/LSTA Leveraged Performing Loan Index | |
Management's Discussion of Fund Performance
Market Recap: Floating-rate bank loans advanced 8.82% for the 12 months ending September 30, 2021, as measured by the S&P/LSTA® Leveraged Performing Loan Index, lagging high-yield bonds but substantially outperforming investment-grade corporate credit and the broad investment-grade fixed-income market. Loans posted strong gains during the early months of the period, as encouraging COVID-19 vaccine news bolstered investor optimism about the strength of the economic recovery in 2021. Better-than-expected corporate earnings also fueled strength in the asset class. The rally paused in March, when loans with higher-quality credit ratings underperformed because heavy new issuance outweighed demand. The positive trend resumed in April, lifted by an improved tone for risk assets, consistent retail fund inflows and strong origination of collateralized loan obligations (CLOs). Except for a modest pullback in July, loans registered modest, income-driven gains for the rest of the period, aided by advancing vaccination campaigns, accelerating economic growth, strong earnings and continued solid demand from CLOs. Roughly half of the industry groups within the S&P/LSTA index posted double-digit gains, led by air transport (+17%), oil & gas (+16%), publishing (+13%), and leisure goods/activities/movies (+13%). Several major industries also topped the benchmark, including health care and retailers (ex food & drug), with each gaining about 9%. Notable "laggards" included utilities (+5%), insurance (+6%), and cable & satellite TV (+6%). From a credit-rating perspective, lower-quality loans far outstripped the benchmark, signaling a comfort level with risk as investors sought higher yields.Comments from Co-Managers Eric Mollenhauer and Kevin Nielsen: For the fiscal year ending September 30, 2021, the fund gained 8.99%, roughly in line with the 8.82% result of the benchmark S&P/LSTA® Leveraged Performing Loan Index. The fund's core allocation to floating-rate leveraged loans gained 8.21% and detracted from performance versus the benchmark. By industry, security selection was the primary contributor, especially in oil & gas. Security selection in nonferrous metals/minerals and utilities also boosted the fund's relative result. California Resources, the fund's top individual contributor, increased approximately 164% this period. Our second-largest contributor was Chesapeake Energy, which gained 307% the past year. Another contributor this period was Denbury. The fund's investment in securities issued by Denbury gained 299% the past 12 months. All of these contributors were out-of-benchmark positions. Conversely, the biggest detractor from performance versus the benchmark was our security selection in business equipment & services. Security picks and an underweighting in health care and security selection in lodging & casinos also hampered the fund's relative performance. Not owning American Airlines, a benchmark component that gained 38%, was the biggest individual relative detractor. Our second-largest relative detractor this period was avoiding Envision Health, a benchmark component that gained 31%. Another notable relative detractor was an outsized stake in Sinclair (-11%). By quality, security selection in unrated bonds added the most value versus the benchmark, while positioning among CCC-rated bonds hurt the most. Notable changes in positioning include decreased exposure to the telecom industry and a higher allocation to health care.The views expressed above reflect those of the portfolio manager(s) only through the end of the period as stated on the cover of this report and do not necessarily represent the views of Fidelity or any other person in the Fidelity organization. Any such views are subject to change at any time based upon market or other conditions and Fidelity disclaims any responsibility to update such views. These views may not be relied on as investment advice and, because investment decisions for a Fidelity fund are based on numerous factors, may not be relied on as an indication of trading intent on behalf of any Fidelity fund.
Investment Summary (Unaudited)
Top Five Holdings as of September 30, 2021
| (by issuer, excluding cash equivalents) | % of fund's net assets |
| Asurion LLC | 2.1 |
| Bass Pro Group LLC | 1.9 |
| Intelsat Jackson Holdings SA | 1.5 |
| Caesars Resort Collection LLC | 1.4 |
| Peraton Corp. | 1.0 |
| 7.9 |
Top Five Market Sectors as of September 30, 2021
| % of fund's net assets | |
| Technology | 14.5 |
| Services | 9.0 |
| Healthcare | 7.1 |
| Telecommunications | 5.8 |
| Energy | 5.2 |
Quality Diversification (% of fund's net assets)
| As of September 30, 2021 | ||
| BBB | 2.5% | |
| BB | 23.7% | |
| B | 58.8% | |
| CCC,CC,C | 3.6% | |
| Not Rated | 5.4% | |
| Equities | 1.4% | |
| Short-Term Investments and Net Other Assets | 4.6% | |

We have used ratings from Moody's Investors Service, Inc. Where Moody's® ratings are not available, we have used S&P® ratings. All ratings are as of the date indicated and do not reflect subsequent changes.
Asset Allocation (% of fund's net assets)
| As of September 30, 2021* | ||
| Bank Loan Obligations | 92.0% | |
| Nonconvertible Bonds | 1.9% | |
| Common Stocks | 1.4% | |
| Other Investments | 0.1% | |
| Short-Term Investments and Net Other Assets (Liabilities) | 4.6% | |

* Foreign investments - 11.5%
Schedule of Investments September 30, 2021
Showing Percentage of Net Assets
| Bank Loan Obligations - 92.0% | |||
| Principal Amount | Value | ||
| Aerospace - 1.2% | |||
| ADS Tactical, Inc. Tranche B 1LN, term loan 3 month U.S. LIBOR + 5.750% 6.75% 3/19/26 (a)(b)(c) | $4,740,000 | $4,751,850 | |
| Gemini HDPE LLC Tranche B 1LN, term loan 3 month U.S. LIBOR + 3.000% 3.5% 12/31/27 (a)(b)(c) | 2,118,569 | 2,118,569 | |
| Jazz Acquisition, Inc. 1LN, term loan 3 month U.S. LIBOR + 4.250% 4.33% 6/19/26 (a)(b)(c) | 857,500 | 832,847 | |
| TransDigm, Inc.: | |||
| Tranche E 1LN, term loan 3 month U.S. LIBOR + 2.250% 2.3341% 5/30/25 (a)(b)(c) | 3,090,276 | 3,051,339 | |
| Tranche F 1LN, term loan 3 month U.S. LIBOR + 2.250% 2.3341% 12/9/25 (a)(b)(c) | 9,322,129 | 9,205,603 | |
| Tranche G 1LN, term loan 3 month U.S. LIBOR + 2.250% 2.3341% 8/22/24 (a)(b)(c) | 9,986,712 | 9,874,362 | |
| WP CPP Holdings LLC: | |||
| Tranche B 1LN, term loan 3 month U.S. LIBOR + 3.750% 4.75% 4/30/25 (a)(b)(c) | 3,918,533 | 3,807,090 | |
| Tranche B 2LN, term loan 3 month U.S. LIBOR + 7.750% 8.75% 4/30/26 (a)(b)(c) | 1,000,000 | 983,440 | |
| TOTAL AEROSPACE | 34,625,100 | ||
| Air Transportation - 1.7% | |||
| AAdvantage Loyalty IP Ltd. Tranche B 1LN, term loan 3 month U.S. LIBOR + 4.750% 5.5% 4/20/28 (a)(b)(c) | 6,475,000 | 6,691,718 | |
| Air Canada Tranche B 1LN, term loan 1 month U.S. LIBOR + 3.500% 4.25% 8/11/28 (a)(b)(c) | 6,000,000 | 6,019,980 | |
| Dynasty Acquisition Co., Inc.: | |||
| Tranche B 1LN, term loan 3 month U.S. LIBOR + 3.500% 3.6315% 4/8/26 (a)(b)(c) | 3,878,230 | 3,789,768 | |
| Tranche B2 1LN, term loan 3 month U.S. LIBOR + 3.500% 3.6315% 4/4/26 (a)(b)(c) | 2,085,070 | 2,037,509 | |
| Mileage Plus Holdings LLC Tranche B 1LN, term loan 3 month U.S. LIBOR + 5.250% 6.25% 7/2/27 (a)(b)(c) | 5,580,000 | 5,925,290 | |
| SkyMiles IP Ltd. Tranche B 1LN, term loan 3 month U.S. LIBOR + 3.750% 4.75% 10/20/27 (a)(b)(c) | 4,905,000 | 5,213,721 | |
| Transplace Holding, Inc. Tranche B 1LN, term loan 3 month U.S. LIBOR + 3.750% 4.75% 10/5/24 (a)(b)(c) | 3,369,056 | 3,364,845 | |
| United Airlines, Inc. Tranche B 1LN, term loan 3 month U.S. LIBOR + 3.750% 4.5% 4/21/28 (a)(b)(c) | 9,979,850 | 10,041,126 | |
| WestJet Airlines Ltd. 1LN, term loan 3 month U.S. LIBOR + 2.750% 4% 12/11/26 (a)(b)(c) | 4,524,413 | 4,410,805 | |
| TOTAL AIR TRANSPORTATION | 47,494,762 | ||
| Automotive & Auto Parts - 1.4% | |||
| Adient U.S. LLC Tranche B 1LN, term loan 3 month U.S. LIBOR + 3.500% 3.5841% 4/8/28 (a)(b)(c) | 2,593,500 | 2,592,411 | |
| American Trailer World Corp. Tranche B 1LN, term loan 3 month U.S. LIBOR + 3.750% 4.5% 3/5/28 (a)(b)(c) | 5,625,900 | 5,596,364 | |
| Clarios Global LP Tranche B 1LN, term loan 3 month U.S. LIBOR + 3.250% 3.3341% 4/30/26 (a)(b)(c) | 4,037,090 | 4,016,905 | |
| CWGS Group LLC Tranche B 1LN, term loan 1 month U.S. LIBOR + 2.500% 3.25% 6/3/28 (a)(b)(c) | 7,780,142 | 7,737,352 | |
| Les Schwab Tire Centers Tranche B 1LN, term loan 3 month U.S. LIBOR + 3.250% 4% 11/2/27 (a)(b)(c) | 4,034,513 | 4,026,968 | |
| Midas Intermediate Holdco II LLC Tranche B 1LN, term loan 3 month U.S. LIBOR + 7.750% 7.5% 12/16/25 (a)(b)(c) | 4,778,509 | 4,540,682 | |
| Rough Country LLC Tranche B 1LN, term loan 1 month U.S. LIBOR + 3.500% 4.25% 7/28/28 (a)(b)(c) | 4,472,202 | 4,461,021 | |
| Thor Industries, Inc. Tranche B 1LN, term loan 3 month U.S. LIBOR + 3.000% 3.125% 2/1/26 (a)(b)(c) | 629,044 | 628,258 | |
| Truck Hero, Inc. Tranche B 1LN, term loan 3 month U.S. LIBOR + 3.250% 4% 1/29/28 (a)(b)(c) | 4,969,676 | 4,956,208 | |
| TOTAL AUTOMOTIVE & AUTO PARTS | 38,556,169 | ||
| Banks & Thrifts - 0.7% | |||
| Citadel Securities LP Tranche B 1LN, term loan 3 month U.S. LIBOR + 2.500% 2.5841% 2/27/28 (a)(b)(c) | 9,382,850 | 9,292,399 | |
| Deerfield Dakota Holding LLC Tranche B 1LN, term loan 3 month U.S. LIBOR + 3.750% 4.75% 4/9/27 (a)(b)(c) | 4,615,337 | 4,624,707 | |
| eResearchTechnology, Inc. Tranche B 1LN, term loan 3 month U.S. LIBOR + 4.500% 5.5% 2/4/27 (a)(b)(c) | 2,283,438 | 2,293,440 | |
| Russell Investments U.S. Institutional Holdco, Inc. Tranche B 1LN, term loan 3 month U.S. LIBOR + 3.500% 4.5% 5/30/25 (a)(b)(c) | 1,456,135 | 1,457,955 | |
| Superannuation & Investments U.S. LLC 1LN, term loan 1 month U.S. LIBOR + 3.750% 9/24/28 (b)(c)(d)(e) | 1,805,000 | 1,793,719 | |
| Victory Capital Holdings, Inc. Tranche B 1LN, term loan 3 month U.S. LIBOR + 2.250% 2.3948% 7/1/26 (a)(b)(c) | 1,216,344 | 1,211,783 | |
| TOTAL BANKS & THRIFTS | 20,674,003 | ||
| Broadcasting - 1.9% | |||
| AppLovin Corp. Tranche B, term loan 3 month U.S. LIBOR + 3.250% 3.3341% 8/15/25 (a)(b)(c) | 11,461,555 | 11,441,842 | |
| Diamond Sports Group LLC Tranche B 1LN, term loan 3 month U.S. LIBOR + 3.250% 3.34% 8/24/26 (a)(b)(c) | 16,261,757 | 10,093,510 | |
| Entercom Media Corp. Tranche B 2LN, term loan 3 month U.S. LIBOR + 2.500% 2.5851% 11/17/24 (a)(b)(c) | 2,585,087 | 2,544,708 | |
| Nexstar Broadcasting, Inc. Tranche B, term loan 3 month U.S. LIBOR + 2.500% 2.586% 9/19/26 (a)(b)(c) | 8,092,517 | 8,080,378 | |
| Sinclair Television Group, Inc. Tranche B 1LN, term loan 3 month U.S. LIBOR + 2.500% 2.59% 9/30/26 (a)(b)(c) | 2,373,737 | 2,330,725 | |
| Springer Nature Deutschland GmbH Tranche B18 1LN, term loan 3 month U.S. LIBOR + 3.000% 3.75% 8/14/26 (a)(b)(c) | 3,155,852 | 3,153,043 | |
| Univision Communications, Inc. Tranche B 1LN, term loan: | |||
| 1 month U.S. LIBOR + 3.250% 5/6/28(b)(c)(d) | 10,890,000 | 10,864,735 | |
| 1 month U.S. LIBOR + 3.250% 4% 3/24/26 (a)(b)(c) | 4,859,630 | 4,850,834 | |
| TOTAL BROADCASTING | 53,359,775 | ||
| Building Materials - 1.8% | |||
| Acproducts Holdings, Inc. Tranche B 1LN, term loan 1 month U.S. LIBOR + 4.250% 4.75% 5/17/28 (a)(b)(c) | 8,807,279 | 8,786,846 | |
| APi Group DE, Inc. Tranche B 1LN, term loan 3 month U.S. LIBOR + 2.500% 2.5841% 10/1/26 (a)(b)(c) | 3,792,821 | 3,766,764 | |
| Beacon Roofing Supply, Inc. Tranche B 1LN, term loan 1 month U.S. LIBOR + 2.500% 2.3341% 5/19/28 (a)(b)(c) | 2,054,850 | 2,042,213 | |
| Core & Main LP Tranche B 1LN, term loan 1 month U.S. LIBOR + 2.500% 2.586% 6/10/28 (a)(b)(c) | 4,880,000 | 4,855,600 | |
| Gypsum Management & Supply, Inc. Tranche B 1LN, term loan 3 month U.S. LIBOR + 2.500% 2.5841% 6/1/25 (a)(b)(c) | 1,747,097 | 1,742,450 | |
| Hamilton Holdco LLC Tranche B 1LN, term loan 3 month U.S. LIBOR + 2.000% 2.14% 1/4/27 (a)(b)(c) | 2,428,262 | 2,413,085 | |
| Ingersoll-Rand Services Co. Tranche B 1LN, term loan 3 month U.S. LIBOR + 1.750% 1.8341% 2/28/27 (a)(b)(c) | 3,477,025 | 3,427,756 | |
| SRS Distribution, Inc. Tranche B 1LN, term loan 1 month U.S. LIBOR + 3.750% 4.25% 6/4/28 (a)(b)(c) | 8,945,000 | 8,941,243 | |
| Traverse Midstream Partners Ll Tranche B, term loan 3 month U.S. LIBOR + 5.500% 6.5% 9/27/24 (a)(b)(c) | 2,287,453 | 2,287,453 | |
| USIC Holdings, Inc. Tranche B 1LN, term loan 1 month U.S. LIBOR + 3.500% 4.25% 5/7/28 (a)(b)(c) | 2,820,000 | 2,816,475 | |
| Ventia Deco LLC Tranche B, term loan 3 month U.S. LIBOR + 4.000% 5% 5/21/26 (a)(b)(c) | 3,772,660 | 3,786,807 | |
| White Capital Buyer LLC Tranche B 1LN, term loan 3 month U.S. LIBOR + 4.000% 4.5% 10/19/27 (a)(b)(c) | 3,706,988 | 3,715,402 | |
| TOTAL BUILDING MATERIALS | 48,582,094 | ||
| Cable/Satellite TV - 2.5% | |||
| Charter Communication Operating LLC Tranche B2 1LN, term loan 3 month U.S. LIBOR + 1.750% 1.84% 2/1/27 (a)(b)(c) | 18,515,966 | 18,395,056 | |
| Coral-U.S. Co.-Borrower LLC: | |||
| Tranche B, term loan 3 month U.S. LIBOR + 2.250% 2.3341% 1/31/28 (a)(b)(c) | 8,740,000 | 8,618,427 | |
| Tranche B6 1LN, term loan 1 month U.S. LIBOR + 3.000% 9/23/29 (b)(c)(d) | 1,940,000 | 1,927,274 | |
| CSC Holdings LLC: | |||
| Tranche B 5LN, term loan 3 month U.S. LIBOR + 2.500% 2.5838% 4/15/27 (a)(b)(c) | 8,491,960 | 8,384,027 | |
| Tranche B3 1LN, term loan 3 month U.S. LIBOR + 2.250% 2.3338% 1/15/26 (a)(b)(c) | 1,950,000 | 1,920,750 | |
| DIRECTV Financing LLC 1LN, term loan 1 month U.S. LIBOR + 5.000% 5.75% 8/2/27 (a)(b)(c) | 12,200,000 | 12,203,782 | |
| LCPR Loan Financing LLC 1LN, term loan 3 month U.S. LIBOR + 3.750% 3.8338% 9/25/28 (a)(b)(c) | 1,910,000 | 1,910,000 | |
| Neptune Finco Corp. Tranche B, term loan 3 month U.S. LIBOR + 2.250% 2.3338% 7/17/25 (a)(b)(c) | 4,740,879 | 4,669,766 | |
| Virgin Media Bristol LLC Tranche N, term loan 3 month U.S. LIBOR + 2.500% 2.5838% 1/31/28 (a)(b)(c) | 4,000,000 | 3,971,520 | |
| WideOpenWest Finance LLC Tranche B, term loan 3 month U.S. LIBOR + 3.250% 4.25% 8/19/23 (a)(b)(c) | 6,566,520 | 6,563,762 | |
| TOTAL CABLE/SATELLITE TV | 68,564,364 | ||
| Capital Goods - 1.2% | |||
| Altra Industrial Motion Corp. Tranche B 1LN, term loan 3 month U.S. LIBOR + 2.000% 2.0841% 10/1/25 (a)(b)(c) | 1,941,803 | 1,929,181 | |
| Columbus McKinnon Corp. Tranche B 1LN, term loan 1 month U.S. LIBOR + 2.750% 3.25% 5/14/28 (a)(b)(c)(e) | 2,500,000 | 2,490,625 | |
| CPM Holdings, Inc.: | |||
| 2LN, term loan 3 month U.S. LIBOR + 8.250% 8.336% 11/15/26 (a)(b)(c) | 514,697 | 505,690 | |
| Tranche B 1LN, term loan 3 month U.S. LIBOR + 3.500% 3.586% 11/15/25 (a)(b)(c) | 2,076,283 | 2,062,787 | |
| Doosan Bobcat Tranche B 1LN, term loan 1 month U.S. LIBOR + 2.250% 2.3815% 5/18/24 (a)(b)(c) | 2,134,275 | 2,130,284 | |
| MHI Holdings LLC Tranche B 1LN, term loan 3 month U.S. LIBOR + 5.000% 5.0841% 9/20/26 (a)(b)(c) | 3,689,283 | 3,704,963 | |
| Resideo Funding, Inc. Tranche B 1LN, term loan 3 month U.S. LIBOR + 2.250% 2.75% 2/12/28 (a)(b)(c) | 1,890,263 | 1,890,263 | |
| SRAM LLC. Tranche B 1LN, term loan 1 month U.S. LIBOR + 2.750% 3.25% 5/12/28 (a)(b)(c) | 4,772,727 | 4,764,757 | |
| Standard Industries, Inc. Tranche B 1LN, term loan 1 month U.S. LIBOR + 2.500% 8/6/28 (b)(c)(d) | 10,380,000 | 10,385,605 | |
| TNT Crane & Rigging LLC 2LN, term loan 3 month U.S. LIBOR + 8.750% 9.75% 4/16/25 (a)(b)(c)(e) | 1,498,878 | 1,438,923 | |
| Vertical U.S. Newco, Inc. Tranche B 1LN, term loan 1 month U.S. LIBOR + 3.500% 4% 7/31/27 (a)(b)(c) | 2,557,319 | 2,560,874 | |
| TOTAL CAPITAL GOODS | 33,863,952 | ||
| Chemicals - 3.0% | |||
| ARC Falcon I, Inc.: | |||
| Tranche B 1LN, term loan 1 month U.S. LIBOR + 3.750% 9/22/28 (b)(c)(d) | 3,608,248 | 3,605,254 | |
| Tranche B 2LN, term loan 1 month U.S. LIBOR + 7.000% 9/22/29 (b)(c)(d) | 930,000 | 923,025 | |
| Tranche DD 1LN, term loan 1 month U.S. LIBOR + 3.750% 9/22/28 (b)(c)(d) | 526,752 | 526,314 | |
| Aruba Investment Holdings LLC: | |||
| 2LN, term loan 3 month U.S. LIBOR + 7.750% 8.5% 11/24/28 (a)(b)(c) | 610,000 | 611,525 | |
| Tranche B 1LN, term loan 3 month U.S. LIBOR + 4.000% 4.75% 11/24/27 (a)(b)(c) | 2,263,625 | 2,266,455 | |
| ASP Chromaflo Dutch I BV Tranche B-2 1LN, term loan 3 month U.S. LIBOR + 3.500% 4.5% 11/18/23 (a)(b)(c) | 586,929 | 586,929 | |
| ASP Chromaflo Intermediate Holdings, Inc. Tranche B 1LN, term loan 3 month U.S. LIBOR + 3.500% 4.5% 11/18/23 (a)(b)(c) | 449,867 | 449,867 | |
| Cimpress U.S.A., Inc. Tranche B 1LN, term loan 1 month U.S. LIBOR + 3.500% 4% 5/17/28 (a)(b)(c) | 2,563,575 | 2,562,780 | |
| Consolidated Energy Finance SA: | |||
| Tranche B 1LN, term loan 3 month U.S. LIBOR + 3.500% 4% 5/7/25 (a)(b)(c)(e) | 3,087,263 | 3,010,081 | |
| Tranche B, term loan 3 month U.S. LIBOR + 2.500% 2.6573% 5/7/25 (a)(b)(c) | 5,688,461 | 5,588,913 | |
| Element Solutions, Inc. Tranche B 1LN, term loan: | |||
| 1 month U.S. LIBOR + 2.000% 1/31/26 (b)(c)(d) | 1,670,000 | 1,666,877 | |
| 3 month U.S. LIBOR + 2.000% 2.0841% 1/31/26 (a)(b)(c) | 2,747,736 | 2,742,598 | |
| GEON Performance Solutions LLC Tranche B 1LN, term loan 1 month U.S. LIBOR + 4.750% 5.5% 8/18/28 (a)(b)(c) | 3,895,000 | 3,920,551 | |
| Groupe Solmax, Inc. Tranche B 1LN, term loan 3 month U.S. LIBOR + 4.750% 5.5% 6/24/28 (a)(b)(c) | 3,155,000 | 3,148,438 | |
| Herens U.S. Holdco Corp. Tranche B 1LN, term loan 3 month U.S. LIBOR + 4.000% 4.75% 7/3/28 (a)(b)(c) | 2,259,338 | 2,265,393 | |
| Hexion, Inc. Tranche B 1LN, term loan 3 month U.S. LIBOR + 3.500% 3.65% 7/1/26 (a)(b)(c) | 1,857,250 | 1,857,250 | |
| ICP Group Tranche B 1LN, term loan 3 month U.S. LIBOR + 3.750% 4.5% 12/29/27 (a)(b)(c) | 1,870,600 | 1,868,262 | |
| INEOS U.S. Petrochem LLC Tranche B 1LN, term loan 3 month U.S. LIBOR + 2.750% 3.25% 1/20/26 (a)(b)(c) | 8,758,050 | 8,758,050 | |
| Messer Industries U.S.A., Inc. Tranche B 1LN, term loan 3 month U.S. LIBOR + 2.500% 2.6315% 3/1/26 (a)(b)(c) | 2,928,559 | 2,911,720 | |
| Olympus Water U.S. Holding Corp. Tranche B 1LN, term loan 1 month U.S. LIBOR + 3.750% 9/21/28 (b)(c)(d) | 5,520,000 | 5,511,941 | |
| Oxea Corp. Tranche B2, term loan 3 month U.S. LIBOR + 3.250% 3.375% 10/11/24 (a)(b)(c) | 3,274,850 | 3,257,657 | |
| SCIH Salt Holdings, Inc. Tranche B 1LN, term loan 3 month U.S. LIBOR + 4.000% 4.75% 3/16/27 (a)(b)(c) | 1,937,388 | 1,938,298 | |
| Starfruit U.S. Holdco LLC Tranche B, term loan 3 month U.S. LIBOR + 2.750% 2.8318% 10/1/25 (a)(b)(c) | 14,394,129 | 14,289,772 | |
| The Chemours Co. LLC Tranche B 1LN, term loan 3 month U.S. LIBOR + 1.750% 1.84% 4/3/25 (a)(b)(c) | 2,448,216 | 2,394,013 | |
| Valcour Packaging LLC: | |||
| 2LN, term loan 1 month U.S. LIBOR + 7.000% 9/30/29 (b)(c)(d)(e) | 430,000 | 430,000 | |
| Tranche B 1LN, term loan 1 month U.S. LIBOR + 3.750% 9/30/28 (b)(c)(d)(e) | 1,450,000 | 1,450,000 | |
| W.R. Grace Holding LLC Tranche B 1LN, term loan 1 month U.S. LIBOR + 3.750% 8/12/28 (b)(c)(d) | 4,760,000 | 4,774,899 | |
| TOTAL CHEMICALS | 83,316,862 | ||
| Conglomerates - 0.0% | |||
| TGP Holdings III LLC Tranche DD 1LN, term loan 1 month U.S. LIBOR + 3.500% 6/29/28 (b)(c)(f) | 208,482 | 208,353 | |
| Consumer Products - 2.4% | |||
| BCPE Empire Holdings, Inc.: | |||
| 1LN, term loan: | |||
| 1 month U.S. LIBOR + 4.000% 4.5% 6/11/26 (a)(b)(c) | 2,635,294 | 2,625,412 | |
| 3 month U.S. LIBOR + 4.000% 4.0841% 6/11/26 (a)(b)(c) | 1,716,074 | 1,704,628 | |
| Tranche DD 1LN, term loan 1 month U.S. LIBOR + 4.000% 6/11/26 (b)(c)(f) | 1,364,706 | 1,359,588 | |
| Bombardier Recreational Products, Inc. Tranche B 1LN, term loan 3 month U.S. LIBOR + 2.000% 2.0841% 5/23/27 (a)(b)(c) | 1,382,980 | 1,370,450 | |
| Buzz Finco LLC Tranche B 1LN, term loan 3 month U.S. LIBOR + 3.250% 3.75% 1/29/27 (a)(b)(c) | 1,434,672 | 1,434,672 | |
| Buzz Merger Sub Ltd. Tranche B 1LN, term loan 3 month U.S. LIBOR + 2.750% 2.8341% 1/29/27 (a)(b)(c) | 985,000 | 982,538 | |
| CNT Holdings I Corp. Tranche B 1LN, term loan 3 month U.S. LIBOR + 3.750% 4.5% 11/8/27 (a)(b)(c) | 4,039,875 | 4,042,420 | |
| Conair Holdings LLC Tranche B 1LN, term loan 1 month U.S. LIBOR + 3.750% 4.25% 5/17/28 (a)(b)(c) | 4,085,000 | 4,086,716 | |
| Diamond BC BV Tranche B 1LN, term loan 1 month U.S. LIBOR + 3.000% 9/14/28 (b)(c)(d) | 4,145,000 | 4,147,860 | |
| Energizer Holdings, Inc. Tranche B 1LN, term loan 3 month U.S. LIBOR + 2.250% 2.75% 12/16/27 (a)(b)(c) | 2,736,250 | 2,732,830 | |
| Gannett Holdings LLC Tranche B 1LN, term loan 3 month U.S. LIBOR + 7.000% 7.75% 2/9/26 (a)(b)(c) | 1,293,831 | 1,299,498 | |
| Gloves Buyer, Inc. Tranche B 1LN, term loan 3 month U.S. LIBOR + 4.000% 4.75% 1/6/28 (a)(b)(c) | 1,668,233 | 1,664,062 | |
| Hunter Fan Co. 1LN, term loan 3 month U.S. LIBOR + 5.000% 5.75% 5/7/28 (a)(b)(c) | 3,010,000 | 3,004,371 | |
| Knowlton Development Corp., Inc. Tranche B 1LN, term loan 3 month U.S. LIBOR + 3.750% 3.8368% 12/21/25 (a)(b)(c) | 3,734,064 | 3,716,551 | |
| Kronos Acquisition Holdings, Inc. Tranche B 1LN, term loan 3 month U.S. LIBOR + 3.750% 4.25% 12/22/26 (a)(b)(c) | 8,210,624 | 7,999,529 | |
| Mattress Firm, Inc. Tranche B 1LN, term loan 1 month U.S. LIBOR + 4.250% 9/21/28 (b)(c)(d) | 3,560,000 | 3,553,343 | |
| Michaels Companies, Inc. 1LN, term loan 3 month U.S. LIBOR + 4.250% 5% 4/15/28 (a)(b)(c) | 4,862,813 | 4,865,001 | |
| Petco Health & Wellness Co., Inc. Tranche B 1LN, term loan 3 month U.S. LIBOR + 3.250% 4% 3/4/28 (a)(b)(c) | 2,243,725 | 2,242,917 | |
| Rodan & Fields LLC Tranche B, term loan 3 month U.S. LIBOR + 4.000% 4.0838% 6/15/25 (a)(b)(c) | 2,531,318 | 1,849,963 | |
| Sweetwater Borrower LLC Tranche B 1LN, term loan 3 month U.S. LIBOR + 4.750% 5.5% 8/5/28 (a)(b)(c) | 4,000,000 | 3,980,000 | |
| TGP Holdings III LLC Tranche B 1LN, term loan 1 month U.S. LIBOR + 3.500% 4.25% 6/29/28 (a)(b)(c) | 1,581,129 | 1,580,148 | |
| TKC Holdings, Inc. 1LN, term loan 1 month U.S. LIBOR + 5.500% 6.5% 5/3/28 (a)(b)(c) | 2,354,583 | 2,345,753 | |
| Woof Holdings LLC: | |||
| Tranche B 1LN, term loan 3 month U.S. LIBOR + 3.750% 4.5% 12/21/27 (a)(b)(c) | 2,313,375 | 2,314,832 | |
| Tranche B 2LN, term loan 3 month U.S. LIBOR + 7.250% 8% 12/21/28 (a)(b)(c) | 605,000 | 609,919 | |
| TOTAL CONSUMER PRODUCTS | 65,513,001 | ||
| Containers - 2.7% | |||
| AOT Packaging Products AcquisitionCo LLC: | |||
| 1LN, term loan 3 month U.S. LIBOR + 3.250% 3.75% 3/3/28 (a)(b)(c) | 5,370,522 | 5,337,655 | |
| Tranche DD 1LN, term loan 3 month U.S. LIBOR + 3.250% 3.4208% 3/3/28 (a)(b)(c)(f) | 1,209,983 | 1,202,578 | |
| Berlin Packaging, LLC Tranche B 1LN, term loan: | |||
| 1 month U.S. LIBOR + 3.750% 4.25% 3/11/28 (a)(b)(c) | 9,170,000 | 9,156,612 | |
| 3 month U.S. LIBOR + 3.250% 3.75% 3/11/28 (a)(b)(c) | 587,054 | 581,770 | |
| Berry Global, Inc. Tranche Z 1LN, term loan 3 month U.S. LIBOR + 1.750% 1.8563% 7/1/26 (a)(b)(c) | 4,302,210 | 4,275,321 | |
| BWAY Holding Co. Tranche B, term loan 3 month U.S. LIBOR + 3.250% 3.3341% 4/3/24 (a)(b)(c) | 1,436,250 | 1,405,500 | |
| Canister International Group, Inc. 1LN, term loan 3 month U.S. LIBOR + 4.750% 4.8341% 12/21/26 (a)(b)(c) | 1,231,250 | 1,230,228 | |
| Charter NEX U.S., Inc. 1LN, term loan 1 month U.S. LIBOR + 3.750% 4.5% 12/1/27 (a)(b)(c) | 4,911,834 | 4,920,283 | |
| Flex Acquisition Co., Inc. Tranche B 1LN, term loan: | |||
| 3 month U.S. LIBOR + 3.000% 3.1449% 6/29/25 (a)(b)(c) | 8,722,073 | 8,666,601 | |
| 3 month U.S. LIBOR + 3.500% 4% 3/2/28 (a)(b)(c) | 6,547,944 | 6,532,490 | |
| Graham Packaging Co., Inc. Tranche B 1LN, term loan 3 month U.S. LIBOR + 3.000% 3.75% 8/4/27 (a)(b)(c) | 4,513,151 | 4,508,142 | |
| Kloeckner Pentaplast of America, Inc. Tranche B 1LN, term loan 3 month U.S. LIBOR + 4.750% 5.25% 2/12/26 (a)(b)(c) | 2,159,150 | 2,163,209 | |
| Pixelle Specialty Solutions LLC Tranche B 1LN, term loan 3 month U.S. LIBOR + 6.500% 7.5% 10/31/24 (a)(b)(c) | 1,226,326 | 1,223,517 | |
| Pregis TopCo Corp. 1LN, term loan: | |||
| 1 month U.S. LIBOR + 4.000% 4.5% 8/1/26 (a)(b)(c) | 500,000 | 500,000 | |
| 3 month U.S. LIBOR + 4.000% 4.0841% 7/31/26 (a)(b)(c) | 2,200,436 | 2,202,263 | |
| Proampac PG Borrower LLC Tranche B 1LN, term loan 3 month U.S. LIBOR + 3.750% 4.5% 11/18/25 (a)(b)(c) | 1,303,450 | 1,305,079 | |
| Reynolds Consumer Products LLC Tranche B 1LN, term loan 3 month U.S. LIBOR + 1.750% 1.8341% 1/30/27 (a)(b)(c) | 5,300,376 | 5,284,157 | |
| Reynolds Group Holdings, Inc. Tranche B 1LN, term loan: | |||
| 1 month U.S. LIBOR + 3.500% 4% 9/20/28 (a)(b)(c) | 4,155,000 | 4,148,768 | |
| 3 month U.S. LIBOR + 3.250% 3.3341% 2/5/26 (a)(b)(c) | 3,101,563 | 3,078,301 | |
| Ring Container Technologies Group LLC Tranche B 1LN, term loan 1 month U.S. LIBOR + 3.750% 8/12/28 (b)(c)(d) | 4,600,000 | 4,602,300 | |
| Trident Holdings, Inc.: | |||
| 1LN, term loan 1 month U.S. LIBOR + 4.000% 7/29/28 (b)(c)(d) | 2,189,441 | 2,191,718 | |
| Tranche DD 1LN, term loan 1 month U.S. LIBOR + 4.000% 7/29/28 (b)(c)(d) | 310,559 | 310,882 | |
| TOTAL CONTAINERS | 74,827,374 | ||
| Diversified Financial Services - 2.2% | |||
| ACNR Holdings, Inc. term loan 17% 9/21/27 (a)(c)(e) | 2,415,080 | 2,439,231 | |
| AlixPartners LLP Tranche B 1LN, term loan 3 month U.S. LIBOR + 2.750% 3.25% 2/4/28 (a)(b)(c) | 3,999,900 | 3,987,660 | |
| Avolon TLB Borrower 1 (U.S.) LLC Tranche B3 1LN, term loan 3 month U.S. LIBOR + 1.750% 2.5% 1/15/25 (a)(b)(c) | 2,284,596 | 2,274,612 | |
| AVSC Holding Corp.: | |||
| Tranche B 1LN, term loan 3 month U.S. LIBOR + 3.500% 4.5% 3/1/25 (a)(b)(c) | 2,976,256 | 2,646,635 | |
| Tranche B2 1LN, term loan 3 month U.S. LIBOR + 5.500% 6.5% 10/15/26 (a)(b)(c) | 2,970,595 | 2,736,126 | |
| BCP Renaissance Parent LLC Tranche B, term loan 3 month U.S. LIBOR + 3.500% 4.5% 10/31/24 (a)(b)(c) | 3,205,103 | 3,176,257 | |
| Finco I LLC Tranche B 1LN, term loan 3 month U.S. LIBOR + 2.500% 2.5841% 6/27/25 (a)(b)(c) | 2,099,370 | 2,090,007 | |
| Fly Funding II SARL Tranche B 1LN, term loan 3 month U.S. LIBOR + 1.750% 1.88% 8/9/25 (a)(b)(c) | 2,801,982 | 2,763,455 | |
| Focus Financial Partners LLC: | |||
| Tranche B 1LN, term loan 1 month U.S. LIBOR + 2.500% 3% 6/24/28 (a)(b)(c) | 3,018,996 | 3,008,430 | |
| Tranche B-DD 1LN, term loan 1 month U.S. LIBOR + 2.500% 6/30/28 (b)(c)(f) | 698,438 | 695,993 | |
| Tranche B3 1LN, term loan 3 month U.S. LIBOR + 2.000% 2.0841% 7/3/24 (a)(b)(c) | 2,089,356 | 2,072,809 | |
| Fort Dearborn Holding Co., Inc. Tranche B, term loan 3 month U.S. LIBOR + 4.000% 5% 10/19/23 (a)(b)(c) | 259,631 | 259,416 | |
| GT Polaris, Inc. Tranche B 1LN, term loan 3 month U.S. LIBOR + 3.750% 4.5% 9/24/27 (a)(b)(c) | 2,277,816 | 2,277,816 | |
| HarbourVest Partners LLC Tranche B 1LN, term loan 3 month U.S. LIBOR + 2.250% 2.3761% 3/1/25 (a)(b)(c) | 4,464,470 | 4,433,799 | |
| Hightower Holding LLC: | |||
| Tranche B 1LN, term loan 3 month U.S. LIBOR + 4.000% 4.75% 4/21/28 (a)(b)(c) | 4,196,000 | 4,190,755 | |
| Tranche DD 1LN, term loan 3 month U.S. LIBOR + 1.500% 4/21/28 (b)(c)(f) | 424,000 | 423,470 | |
| Kingpin Intermediate Holdings LLC Tranche B 1LN, term loan 3 month U.S. LIBOR + 3.500% 4.5% 7/3/24 (a)(b)(c) | 2,101,371 | 2,096,118 | |
| KREF Holdings X LLC Tranche B 1LN, term loan 3 month U.S. LIBOR + 4.750% 5.75% 9/1/27 (a)(b)(c) | 2,635,088 | 2,635,088 | |
| Paysafe Holdings U.S. Corp. Tranche B 1LN, term loan 1 month U.S. LIBOR + 2.750% 3.25% 6/10/28 (a)(b)(c) | 1,840,388 | 1,818,763 | |
| Recess Holdings, Inc. Tranche B, term loan 3 month U.S. LIBOR + 3.750% 4.75% 9/29/24 (a)(b)(c) | 1,312,477 | 1,304,825 | |
| RPI Intermediate Finance Trust Tranche B 1LN, term loan 3 month U.S. LIBOR + 1.750% 1.8341% 2/11/27 (a)(b)(c) | 5,974,780 | 5,952,375 | |
| TransUnion LLC Tranche B5 1LN, term loan 3 month U.S. LIBOR + 1.750% 1.8341% 11/16/26 (a)(b)(c) | 5,385,172 | 5,348,984 | |
| UFC Holdings LLC Tranche B 1LN, term loan 3 month U.S. LIBOR + 2.750% 3.5% 4/29/26 (a)(b)(c) | 3,573,471 | 3,563,537 | |
| TOTAL DIVERSIFIED FINANCIAL SERVICES | 62,196,161 | ||
| Diversified Media - 1.3% | |||
| Advantage Sales & Marketing, Inc. Tranche B 1LN, term loan 3 month U.S. LIBOR + 5.250% 6% 10/28/27 (a)(b)(c) | 7,037,144 | 7,063,533 | |
| Allen Media LLC Tranche B 1LN, term loan 3 month U.S. LIBOR + 5.500% 5.6315% 2/10/27 (a)(b)(c) | 11,550,285 | 11,532,267 | |
| Lamar Media Corp. Tranche B 1LN, term loan 3 month U.S. LIBOR + 1.500% 1.5826% 1/30/27 (a)(b)(c) | 1,750,000 | 1,734,145 | |
| Terrier Media Buyer, Inc. Tranche B 1LN, term loan 3 month U.S. LIBOR + 3.500% 3.5841% 12/17/26 (a)(b)(c) | 15,410,416 | 15,371,890 | |
| TOTAL DIVERSIFIED MEDIA | 35,701,835 | ||
| Energy - 4.1% | |||
| Apro LLC Tranche B 1LN, term loan 1 month U.S. LIBOR + 3.750% 4.5% 11/14/26 (a)(b)(c) | 3,204,994 | 3,204,994 | |
| Array Technologies, Inc. Tranche B 1LN, term loan 3 month U.S. LIBOR + 3.250% 3.75% 10/14/27 (a)(b)(c) | 5,865,047 | 5,846,748 | |
| BCP Raptor II LLC Tranche B, term loan 3 month U.S. LIBOR + 4.750% 4.8341% 11/3/25 (a)(b)(c) | 4,899,082 | 4,841,518 | |
| BCP Raptor LLC Tranche B, term loan 3 month U.S. LIBOR + 4.250% 5.25% 6/24/24 (a)(b)(c) | 5,193,871 | 5,173,459 | |
| Brazos Delaware II LLC Tranche B, term loan 3 month U.S. LIBOR + 4.000% 4.0835% 5/21/25 (a)(b)(c) | 2,693,279 | 2,650,348 | |
| BW Gas & Convenience Holdings LLC Tranche B 1LN, term loan 3 month U.S. LIBOR + 3.500% 4% 3/17/28 (a)(b)(c)(e) | 1,900,238 | 1,900,238 | |
| ChampionX Holding, Inc. Tranche B 1LN, term loan 3 month U.S. LIBOR + 5.000% 6% 6/3/27 (a)(b)(c) | 2,398,750 | 2,434,731 | |
| Citgo Holding, Inc. Tranche B 1LN, term loan 3 month U.S. LIBOR + 7.000% 8% 8/1/23 (a)(b)(c) | 2,239,300 | 2,207,950 | |
| Citgo Petroleum Corp. Tranche B 1LN, term loan 3 month U.S. LIBOR + 6.250% 7.25% 3/28/24 (a)(b)(c) | 5,740,795 | 5,736,031 | |
| CQP Holdco LP / BIP-V Chinook Holdco LLC Tranche B 1LN, term loan 1 month U.S. LIBOR + 3.750% 4.25% 6/4/28 (a)(b)(c) | 20,683,163 | 20,614,288 | |
| Delek U.S. Holdings, Inc. Tranche B 1LN, term loan 3 month U.S. LIBOR + 2.250% 2.3341% 3/30/25 (a)(b)(c) | 1,513,824 | 1,466,896 | |
| EG America LLC Tranche B 1LN, term loan: | |||
| 3 month U.S. LIBOR + 4.000% 4.1315% 2/6/25 (a)(b)(c) | 4,937,463 | 4,918,158 | |
| 3 month U.S. LIBOR + 4.250% 4.75% 3/10/26 (a)(b)(c) | 1,335,565 | 1,334,230 | |
| EG Finco Ltd. Tranche B, term loan 3 month U.S. LIBOR + 4.000% 4.1315% 2/6/25 (a)(b)(c) | 1,394,425 | 1,388,973 | |
| Epic Crude Services LP Tranche B 1LN, term loan 3 month U.S. LIBOR + 5.000% 5.1208% 3/1/26 (a)(b)(c) | 3,950,100 | 2,955,978 | |
| Esdec Solar Group BV Tranche B 1LN, term loan 1 month U.S. LIBOR + 5.000% 5.75% 8/27/28 (a)(b)(c)(e) | 5,445,000 | 5,431,388 | |
| GIP II Blue Holding LP Tranche B 1LN, term loan 1 month U.S. LIBOR + 4.500% 9/22/28 (b)(c)(d) | 5,415,000 | 5,404,874 | |
| GIP III Stetson I LP Tranche B, term loan 3 month U.S. LIBOR + 4.250% 4.3341% 7/18/25 (a)(b)(c) | 6,381,063 | 6,115,547 | |
| Granite Acquisition, Inc. Tranche B 1LN, term loan 3 month U.S. LIBOR + 2.750% 3.25% 3/25/28 (a)(b)(c) | 5,236,875 | 5,230,329 | |
| Gulf Finance LLC Tranche B 1LN, term loan 3 month U.S. LIBOR + 5.250% 6.25% 8/25/23 (a)(b)(c) | 3,191,333 | 3,062,339 | |
| Hamilton Projs. Acquiror LLC Tranche B 1LN, term loan 3 month U.S. LIBOR + 4.750% 5.75% 6/17/27 (a)(b)(c) | 2,350,984 | 2,358,343 | |
| ITT Holdings LLC Tranche B 1LN, term loan 1 month U.S. LIBOR + 2.750% 3.25% 7/30/28 (a)(b)(c) | 2,000,000 | 1,995,840 | |
| Lower Cadence Holdings LLC Tranche B 1LN, term loan 3 month U.S. LIBOR + 4.000% 4.0841% 5/22/26 (a)(b)(c) | 2,495,476 | 2,492,357 | |
| Murphy U.S.A., Inc. Tranche B 1LN, term loan 3 month U.S. LIBOR + 1.750% 2.25% 1/29/28 (a)(b)(c) | 3,037,388 | 3,037,388 | |
| Natgasoline LLC Tranche B, term loan 3 month U.S. LIBOR + 3.500% 3.625% 11/14/25 (a)(b)(c) | 4,060,188 | 4,050,037 | |
| Rockwood Service Corp. Tranche B 1LN, term loan 3 month U.S. LIBOR + 4.000% 4.0841% 1/23/27 (a)(b)(c) | 4,241,053 | 4,243,725 | |
| Terra-Gen Finance Co. LLC Tranche B, term loan 3 month U.S. LIBOR + 4.250% 5.25% 12/9/21 (a)(b)(c) | 896,180 | 887,594 | |
| WaterBridge Operating LLC Tranche B 1LN, term loan 3 month U.S. LIBOR + 5.750% 6.75% 6/21/26 (a)(b)(c) | 2,947,500 | 2,868,536 | |
| TOTAL ENERGY | 113,852,837 | ||
| Entertainment/Film - 0.3% | |||
| AP Core Holdings II LLC: | |||
| Tranche B1 1LN, term loan 1 month U.S. LIBOR + 5.500% 6.25% 9/1/27 (a)(b)(c) | 2,800,000 | 2,810,500 | |
| Tranche B2 1LN, term loan 1 month U.S. LIBOR + 5.500% 6.25% 9/1/27 (a)(b)(c) | 2,800,000 | 2,807,000 | |
| SMG U.S. Midco 2, Inc. 1LN, term loan 3 month U.S. LIBOR + 2.500% 2.6156% 1/23/25 (a)(b)(c) | 4,110,921 | 4,033,842 | |
| TOTAL ENTERTAINMENT/FILM | 9,651,342 | ||
| Environmental - 0.8% | |||
| Clean Harbors, Inc. Tranche B 1LN, term loan 1 month U.S. LIBOR + 2.000% 9/21/28 (b)(c)(d) | 4,000,000 | 3,998,320 | |
| Erm Emerald U.S., Inc. Tranche B 1LN, term loan 3 month U.S. LIBOR + 3.250% 3.3341% 7/12/26 (a)(b)(c) | 3,397,850 | 3,361,323 | |
| Madison IAQ LLC Tranche B 1LN, term loan 1 month U.S. LIBOR + 3.250% 3.75% 6/21/28 (a)(b)(c) | 9,690,000 | 9,673,818 | |
| The Brickman Group, Ltd. Tranche B, term loan 3 month U.S. LIBOR + 2.500% 2.625% 8/15/25 (a)(b)(c) | 2,984,576 | 2,965,922 | |
| WTG Holdings III Corp. Tranche B 1LN, term loan 3 month U.S. LIBOR + 2.500% 2.625% 4/1/28 (a)(b)(c) | 1,206,975 | 1,199,057 | |
| TOTAL ENVIRONMENTAL | 21,198,440 | ||
| Food & Drug Retail - 1.0% | |||
| 8th Avenue Food & Provisions, Inc. Tranche B 1LN, term loan 1 month U.S. LIBOR + 4.750% 5.5% 10/1/25 (a)(b)(c) | 1,270,000 | 1,260,475 | |
| Froneri U.S., Inc. Tranche B 1LN, term loan 3 month U.S. LIBOR + 2.250% 2.3341% 1/29/27 (a)(b)(c) | 3,522,900 | 3,478,864 | |
| GOBP Holdings, Inc. Tranche B 1LN, term loan 3 month U.S. LIBOR + 2.750% 2.8785% 10/22/25 (a)(b)(c) | 1,541,044 | 1,537,838 | |
| JBS U.S.A. Lux SA Tranche B 1LN, term loan 3 month U.S. LIBOR + 2.000% 2.0841% 5/1/26 (a)(b)(c) | 11,253,589 | 11,198,559 | |
| JP Intermediate B LLC Tranche B, term loan 3 month U.S. LIBOR + 5.500% 6.5% 11/20/25 (a)(b)(c) | 6,097,795 | 5,731,927 | |
| PetIQ, Inc. Tranche B 1LN, term loan 3 month U.S. LIBOR + 4.250% 4.75% 4/7/28 (a)(b)(c) | 3,426,413 | 3,400,714 | |
| TOTAL FOOD & DRUG RETAIL | 26,608,377 | ||
| Food/Beverage/Tobacco - 1.2% | |||
| 8th Avenue Food & Provisions, Inc.: | |||
| 2LN, term loan 3 month U.S. LIBOR + 7.750% 7.836% 10/1/26 (a)(b)(c) | 410,000 | 405,388 | |
| Tranche B 1LN, term loan 3 month U.S. LIBOR + 3.750% 3.836% 10/1/25 (a)(b)(c) | 2,882,366 | 2,842,734 | |
| Atkins Nutritional Holdings II, Inc. Tranche B 1LN, term loan 3 month U.S. LIBOR + 3.750% 4.75% 7/7/24 (a)(b)(c) | 2,026,715 | 2,030,343 | |
| BellRing Brands LLC Tranche B 1LN, term loan 3 month U.S. LIBOR + 4.000% 4.75% 10/21/24 (a)(b)(c) | 2,614,071 | 2,623,221 | |
| Chobani LLC Tranche B 1LN, term loan 3 month U.S. LIBOR + 3.500% 4.5% 10/23/27 (a)(b)(c) | 4,821,300 | 4,828,194 | |
| Shearer's Foods, Inc. Tranche B 1LN, term loan 3 month U.S. LIBOR + 3.500% 4.25% 9/23/27 (a)(b)(c) | 3,541,334 | 3,535,314 | |
| Triton Water Holdings, Inc. Tranche B 1LN, term loan 3 month U.S. LIBOR + 3.500% 4% 3/31/28 (a)(b)(c) | 11,162,025 | 11,141,152 | |
| U.S. Foods, Inc.: | |||
| 1LN, term loan 3 month U.S. LIBOR + 2.000% 2.0841% 9/13/26 (a)(b)(c) | 2,807,620 | 2,768,313 | |
| Tranche B, term loan 3 month U.S. LIBOR + 1.750% 1.8341% 6/27/23 (a)(b)(c) | 2,410,472 | 2,395,407 | |
| TOTAL FOOD/BEVERAGE/TOBACCO | 32,570,066 | ||
| Gaming - 4.9% | |||
| Aristocrat International Pty Ltd.: | |||
| Tranche B 1LN, term loan 3 month U.S. LIBOR + 3.750% 4.75% 10/19/24 (a)(b)(c) | 1,081,313 | 1,086,384 | |
| Tranche B 3LN, term loan 3 month U.S. LIBOR + 1.750% 1.8843% 10/19/24 (a)(b)(c) | 3,435,371 | 3,411,048 | |
| Bally's Corp. Tranche B 1LN, term loan: | |||
| 1 month U.S. LIBOR + 3.250% 8/6/28 (b)(c)(d) | 12,000,000 | 11,991,720 | |
| 3 month U.S. LIBOR + 8.000% 10.25% 5/10/26 (a)(b)(c) | 3,051,375 | 3,188,687 | |
| Boyd Gaming Corp. Tranche B 1LN, term loan 3 month U.S. LIBOR + 2.250% 2.3219% 9/15/23 (a)(b)(c) | 1,786,252 | 1,783,466 | |
| Caesars Resort Collection LLC: | |||
| Tranche B 1LN, term loan 3 month U.S. LIBOR + 2.750% 2.8341% 12/22/24 (a)(b)(c) | 25,234,421 | 25,069,893 | |
| Tranche B 1LN, term loan 3 month U.S. LIBOR + 4.500% 3.5833% 7/20/25 (a)(b)(c) | 13,860,000 | 13,864,990 | |
| CCM Merger, Inc. Tranche B 1LN, term loan 3 month U.S. LIBOR + 3.750% 4.5% 11/4/25 (a)(b)(c) | 1,670,327 | 1,670,327 | |
| Cypress Intermediate Holdings, Inc. Tranche B 1LN, term loan 1 month U.S. LIBOR + 2.500% 3% 9/21/28 (a)(b)(c) | 1,745,500 | 1,743,318 | |
| Golden Entertainment, Inc. Tranche B, term loan 3 month U.S. LIBOR + 3.000% 3.75% 10/20/24 (a)(b)(c) | 11,539,045 | 11,495,774 | |
| Golden Nugget LLC Tranche B 1LN, term loan 3 month U.S. LIBOR + 2.500% 3.25% 10/4/23 (a)(b)(c) | 20,167,818 | 20,061,533 | |
| GVC Holdings Gibraltar Ltd. Tranche B4 1LN, term loan 1 month U.S. LIBOR + 2.500% 3% 3/16/27 (a)(b)(c) | 4,987,500 | 4,978,173 | |
| J&J Ventures Gaming LLC 1LN, term loan 3 month U.S. LIBOR + 4.000% 4.75% 4/26/28 (a)(b)(c) | 2,825,000 | 2,835,594 | |
| PCI Gaming Authority 1LN, term loan 3 month U.S. LIBOR + 2.500% 2.5841% 5/29/26 (a)(b)(c) | 3,471,506 | 3,456,752 | |
| Penn National Gaming, Inc. Tranche B, term loan 3 month U.S. LIBOR + 2.250% 3% 10/15/25 (a)(b)(c) | 3,178,410 | 3,172,244 | |
| Playtika Holding Corp. Tranche B 1LN, term loan 3 month U.S. LIBOR + 2.750% 2.8341% 3/11/28 (a)(b)(c) | 4,716,300 | 4,712,527 | |
| Scientific Games Corp. Tranche B 5LN, term loan 3 month U.S. LIBOR + 2.750% 2.8341% 8/14/24 (a)(b)(c) | 3,353,367 | 3,337,036 | |
| Stars Group Holdings BV Tranche B, term loan 3 month U.S. LIBOR + 2.250% 2.3818% 7/10/25 (a)(b)(c) | 10,146,741 | 10,108,691 | |
| Station Casinos LLC Tranche B 1LN, term loan 3 month U.S. LIBOR + 2.250% 2.5% 2/7/27 (a)(b)(c) | 8,010,665 | 7,929,277 | |
| TOTAL GAMING | 135,897,434 | ||
| Healthcare - 7.0% | |||
| AHP Health Partners, Inc. Tranche B 1LN, term loan 1 month U.S. LIBOR + 3.500% 4% 8/23/28 (a)(b)(c) | 3,115,000 | 3,122,788 | |
| Avantor Funding, Inc. Tranche B5 1LN, term loan 1 month U.S. LIBOR + 2.250% 2.75% 11/6/27 (a)(b)(c) | 3,303,400 | 3,307,529 | |
| Aveanna Healthcare LLC: | |||
| Tranche B 1LN, term loan 1 month U.S. LIBOR + 3.750% 4.25% 7/17/28 (a)(b)(c) | 1,557,736 | 1,555,789 | |
| Tranche B-DD 1LN, term loan 1 month U.S. LIBOR + 3.750% 7/17/28 (b)(c)(d) | 362,264 | 361,811 | |
| Curia Global, Inc. Tranche B 1LN, term loan 3 month U.S. LIBOR + 3.750% 8/30/26 (b)(c)(d) | 2,305,000 | 2,305,715 | |
| Da Vinci Purchaser Corp. Tranche B 1LN, term loan 3 month U.S. LIBOR + 4.000% 5% 12/13/26 (a)(b)(c) | 6,928,265 | 6,952,099 | |
| DaVita HealthCare Partners, Inc. Tranche B 1LN, term loan 3 month U.S. LIBOR + 1.750% 1.8341% 8/12/26 (a)(b)(c) | 2,984,810 | 2,966,155 | |
| Elanco Animal Health, Inc. Tranche B 1LN, term loan 3 month U.S. LIBOR + 1.750% 1.836% 8/1/27 (a)(b)(c) | 11,084,704 | 10,942,155 | |
| Gainwell Acquisition Corp. Tranche B 1LN, term loan 3 month U.S. LIBOR + 4.000% 4.75% 10/1/27 (a)(b)(c) | 17,117,827 | 17,142,819 | |
| HAH Group Holding Co. LLC: | |||
| 1LN, term loan 3 month U.S. LIBOR + 5.000% 6% 10/29/27 (a)(b)(c) | 914,415 | 914,415 | |
| Tranche DD 1LN, term loan 3 month U.S. LIBOR + 5.000% 6% 10/29/27 (a)(b)(c) | 115,992 | 115,992 | |
| Horizon Pharma U.S.A., Inc. Tranche B 1LN, term loan 3 month U.S. LIBOR + 2.000% 2.5% 3/15/28 (a)(b)(c) | 2,855,650 | 2,849,025 | |
| Indigo Merger Sub, Inc. Tranche B 1LN, term loan 1 month U.S. LIBOR + 2.500% 3% 7/1/28 (a)(b)(c) | 4,075,642 | 4,088,643 | |
| Insulet Corp. Tranche B 1LN, term loan 1 month U.S. LIBOR + 3.250% 3.75% 5/4/28 (a)(b)(c) | 7,675,763 | 7,688,581 | |
| Jazz Financing Lux SARL Tranche B 1LN, term loan 1 month U.S. LIBOR + 3.500% 4% 5/5/28 (a)(b)(c) | 9,236,850 | 9,247,288 | |
| Mamba Purchaser, Inc.: | |||
| 2LN, term loan 1 month U.S. LIBOR + 6.500% 9/29/29 (b)(c)(d) | 600,000 | 600,000 | |
| Tranche B 1LN, term loan 1 month U.S. LIBOR + 3.750% 9/29/28 (b)(c)(d) | 2,765,000 | 2,763,286 | |
| Maravai Intermediate Holdings LLC Tranche B 1LN, term loan 3 month U.S. LIBOR + 3.750% 4.75% 10/19/27 (a)(b)(c) | 4,256,553 | 4,267,194 | |
| MED ParentCo LP: | |||
| 1LN, term loan 3 month U.S. LIBOR + 4.250% 4.3341% 8/31/26 (a)(b)(c) | 3,470,245 | 3,459,938 | |
| 2LN, term loan 3 month U.S. LIBOR + 8.250% 8.3341% 8/30/27 (a)(b)(c) | 1,310,000 | 1,304,537 | |
| Milk Specialties Co. 1LN, term loan 1 month U.S. LIBOR + 4.000% 5% 8/15/25 (a)(b)(c) | 2,329,163 | 2,326,973 | |
| Mozart Borrower LP Tranche B 1LN, term loan 1 month U.S. LIBOR + 3.250% 9/30/28 (b)(c)(d) | 23,215,000 | 23,164,159 | |
| Organon & Co. Tranche B 1LN, term loan 3 month U.S. LIBOR + 3.000% 3.5% 6/2/28 (a)(b)(c) | 9,057,300 | 9,071,882 | |
| Ortho-Clinical Diagnostics, Inc. Tranche B 1LN, term loan 3 month U.S. LIBOR + 3.000% 3.0833% 6/30/25 (a)(b)(c) | 1,623,446 | 1,621,417 | |
| Packaging Coordinators Midco, Inc. Tranche B 1LN, term loan 3 month U.S. LIBOR + 3.500% 4.25% 11/30/27 (a)(b)(c) | 2,701,425 | 2,703,127 | |
| Pathway Vet Alliance LLC Tranche B 1LN, term loan 3 month U.S. LIBOR + 3.750% 3.8341% 3/31/27 (a)(b)(c) | 5,872,415 | 5,856,501 | |
| Phoenix Newco, Inc. Tranche B 1LN, term loan 1 month U.S. LIBOR + 3.500% 8/10/28 (b)(c)(d) | 14,810,000 | 14,812,370 | |
| Pluto Acquisition I, Inc. term loan 1 month U.S. LIBOR + 4.000% 4.1208% 6/20/26 (a)(b)(c) | 3,393,495 | 3,387,828 | |
| PPD, Inc. Tranche B 1LN, term loan 3 month U.S. LIBOR + 2.000% 2.5% 1/13/28 (a)(b)(c) | 5,661,550 | 5,649,774 | |
| Radiology Partners, Inc. Tranche B 1LN, term loan 3 month U.S. LIBOR + 4.250% 4.3337% 7/9/25 (a)(b)(c) | 5,490,000 | 5,483,138 | |
| RadNet Management, Inc. Tranche B 1LN, term loan 3 month U.S. LIBOR + 3.000% 3.75% 4/23/28 (a)(b)(c) | 1,556,100 | 1,552,863 | |
| RegionalCare Hospital Partners Holdings, Inc. Tranche B, term loan 3 month U.S. LIBOR + 3.750% 3.8341% 11/16/25 (a)(b)(c) | 2,854,989 | 2,849,650 | |
| Surgery Center Holdings, Inc. Tranche B 1LN, term loan 1 month U.S. LIBOR + 3.750% 4.5% 8/31/26 (a)(b)(c) | 544,451 | 544,979 | |
| U.S. Anesthesia Partners, Inc.: | |||
| 2LN, term loan 1 month U.S. LIBOR + 7.500% 9/22/29 (b)(c)(d) | 775,000 | 776,938 | |
| Tranche B 1LN, term loan 1 month U.S. LIBOR + 4.250% 9/22/28 (b)(c)(d) | 6,200,000 | 6,206,758 | |
| Tranche B, term loan 3 month U.S. LIBOR + 3.000% 4% 6/23/24 (a)(b)(c) | 5,504,269 | 5,502,563 | |
| U.S. Radiology Specialists, Inc. Tranche B 1LN, term loan 3 month U.S. LIBOR + 5.500% 6.25% 12/15/27 (a)(b)(c) | 1,989,963 | 1,997,106 | |
| U.S. Renal Care, Inc. Tranche B 1LN, term loan 3 month U.S. LIBOR + 5.000% 5.0841% 6/13/26 (a)(b)(c) | 7,590,032 | 7,573,410 | |
| Upstream Newco, Inc. 1LN, term loan 1 month U.S. LIBOR + 4.250% 4.3341% 11/20/26 (a)(b)(c) | 2,182,655 | 2,181,301 | |
| Valeant Pharmaceuticals International, Inc.: | |||
| Tranche B 2LN, term loan 3 month U.S. LIBOR + 2.750% 2.8341% 11/27/25 (a)(b)(c) | 4,309,799 | 4,296,869 | |
| Tranche B, term loan 3 month U.S. LIBOR + 3.000% 3.0841% 6/1/25 (a)(b)(c) | 1,417,942 | 1,415,815 | |
| TOTAL HEALTHCARE | 194,931,180 | ||
| Homebuilders/Real Estate - 0.8% | |||
| Baldwin Risk Partners LLC Tranche B 1LN, term loan 1 month U.S. LIBOR + 3.500% 4% 10/14/27 (a)(b)(c) | 798,000 | 795,510 | |
| DTZ U.S. Borrower LLC Tranche B 1LN, term loan 3 month U.S. LIBOR + 2.750% 2.8341% 8/21/25 (a)(b)(c) | 10,553,505 | 10,450,609 | |
| Landry's Finance Acquisition Co. Tranche B 1LN, term loan 3 month U.S. LIBOR + 12.000% 13% 10/4/23 (a)(b)(c) | 1,250,000 | 1,350,000 | |
| Lightstone Holdco LLC: | |||
| Tranche B 1LN, term loan 3 month U.S. LIBOR + 3.750% 4.75% 1/30/24 (a)(b)(c) | 4,512,428 | 3,712,103 | |
| Tranche C 1LN, term loan 3 month U.S. LIBOR + 3.750% 4.75% 1/30/24 (a)(b)(c) | 254,508 | 209,369 | |
| RE/MAX LLC Tranche B 1LN, term loan 1 month U.S. LIBOR + 2.500% 3% 7/21/28 (a)(b)(c) | 1,321,688 | 1,316,731 | |
| Ryan Specialty Group LLC Tranche B 1LN, term loan 3 month U.S. LIBOR + 3.000% 3.75% 9/1/27 (a)(b)(c) | 4,573,800 | 4,569,226 | |
| TOTAL HOMEBUILDERS/REAL ESTATE | 22,403,548 | ||
| Hotels - 1.8% | |||
| Aimbridge Acquisition Co., Inc.: | |||
| Tranche B 1LN, term loan 3 month U.S. LIBOR + 4.750% 5.5% 2/1/26 (a)(b)(c) | 1,222,681 | 1,211,982 | |
| Tranche B, term loan 3 month U.S. LIBOR + 3.750% 3.8341% 2/1/26 (a)(b)(c) | 3,199,651 | 3,142,313 | |
| ASP LS Acquisition Corp. Tranche B 1LN, term loan 3 month U.S. LIBOR + 4.500% 5.25% 4/30/28 (a)(b)(c) | 1,550,000 | 1,551,287 | |
| BRE/Everbright M6 Borrower LLC Tranche B 1LN, term loan 1 month U.S. LIBOR + 5.000% 5.75% 9/9/26 (a)(b)(c) | 3,010,000 | 3,017,525 | |
| Four Seasons Holdings, Inc. Tranche B, term loan 3 month U.S. LIBOR + 2.000% 2.0868% 11/30/23 (a)(b)(c) | 6,746,084 | 6,720,786 | |
| Hilton Grand Vacations Borrower LLC Tranche B 1LN, term loan 1 month U.S. LIBOR + 3.000% 3.5% 8/2/28 (a)(b)(c) | 12,629,810 | 12,658,227 | |
| Hilton Worldwide Finance LLC Tranche B 1LN, term loan 3 month U.S. LIBOR + 1.750% 1.836% 6/21/26 (a)(b)(c) | 2,792,849 | 2,768,216 | |
| Marriott Ownership Resorts, Inc. Tranche B 1LN, term loan 3 month U.S. LIBOR + 1.750% 1.8341% 8/31/25 (a)(b)(c) | 3,381,280 | 3,317,881 | |
| Oravel Stays Singapore Pte Ltd. Tranche B 1LN, term loan 1 month U.S. LIBOR + 8.250% 9% 6/23/26 (a)(b)(c) | 2,080,000 | 2,184,000 | |
| Raptor Acquisition Corp. Tranche B 1LN, term loan 1 month U.S. LIBOR + 4.000% 4.75% 11/1/26 (a)(b)(c) | 3,300,000 | 3,309,075 | |
| Travelport Finance Luxembourg SARL 1LN, term loan: | |||
| 3 month U.S. LIBOR + 2.500% 9.75% 2/28/25 (a)(b)(c) | 3,502,139 | 3,629,722 | |
| 3 month U.S. LIBOR + 6.250% 6.8815% 5/29/26 (a)(b)(c) | 4,612,330 | 3,953,136 | |
| Wyndham Hotels & Resorts, Inc. Tranche B, term loan 3 month U.S. LIBOR + 1.750% 1.8341% 5/30/25 (a)(b)(c) | 3,646,111 | 3,619,348 | |
| TOTAL HOTELS | 51,083,498 | ||
| Insurance - 4.8% | |||
| Acrisure LLC: | |||
| Tranche B 1LN, term loan 3 month U.S. LIBOR + 3.500% 3.6315% 2/13/27 (a)(b)(c) | 14,056,480 | 13,912,963 | |
| Tranche B-2 1LN, term loan 1 month U.S. LIBOR + 3.750% 4.25% 2/15/27 (a)(b)(c) | 840,000 | 836,153 | |
| Alliant Holdings Intermediate LLC: | |||
| Tranche B, term loan 3 month U.S. LIBOR + 3.250% 3.3341% 5/10/25 (a)(b)(c) | 6,133,192 | 6,087,193 | |
| Tranche B-2 1LN, term loan 3 month U.S. LIBOR + 3.250% 3.3341% 5/9/25 (a)(b)(c) | 977,500 | 969,504 | |
| Tranche B3 1LN, term loan 3 month U.S. LIBOR + 3.750% 4.25% 11/5/27 (a)(b)(c) | 2,007,537 | 2,008,099 | |
| AmeriLife Holdings LLC: | |||
| Tranche B 1LN, term loan: | |||
| 3 month U.S. LIBOR + 4.000% 4.0841% 3/18/27 (a)(b)(c) | 5,130,547 | 5,114,540 | |
| 3 month U.S. LIBOR + 4.000% 4.75% 3/18/27 (a)(b)(c)(e) | 808,888 | 806,865 | |
| Tranche B 2LN, term loan 3 month U.S. LIBOR + 8.500% 9.5% 3/18/28 (a)(b)(c)(e) | 655,000 | 655,000 | |
| AmWINS Group, Inc. Tranche B 1LN, term loan 3 month U.S. LIBOR + 2.250% 3% 2/19/28 (a)(b)(c) | 6,292,235 | 6,252,153 | |
| AssuredPartners, Inc. Tranche B 1LN, term loan: | |||
| 1 month U.S. LIBOR + 3.500% 4% 2/13/27 (a)(b)(c) | 194,513 | 194,172 | |
| 3 month U.S. LIBOR + 3.500% 3.5841% 2/13/27 (a)(b)(c) | 6,107,596 | 6,066,858 | |
| Asurion LLC: | |||
| Tranche B 6LN, term loan 3 month U.S. LIBOR + 3.000% 3.2091% 11/3/23 (a)(b)(c) | 3,076,493 | 3,057,265 | |
| Tranche B 7LN, term loan 3 month U.S. LIBOR + 3.000% 3.0841% 11/3/24 (a)(b)(c) | 6,772,500 | 6,696,309 | |
| Tranche B3 2LN, term loan 3 month U.S. LIBOR + 5.250% 5.3341% 1/31/28 (a)(b)(c) | 10,975,000 | 10,936,149 | |
| Tranche B4 2LN, term loan 1 month U.S. LIBOR + 5.250% 5.3341% 1/20/29 (a)(b)(c) | 19,820,000 | 19,715,945 | |
| Tranche B8 1LN, term loan 3 month U.S. LIBOR + 3.250% 3.3341% 12/23/26 (a)(b)(c) | 9,341,695 | 9,198,207 | |
| Tranche B9 1LN, term loan 3 month U.S. LIBOR + 3.250% 3.3341% 7/31/27 (a)(b)(c) | 8,050,393 | 7,927,625 | |
| HUB International Ltd.: | |||
| Tranche B 1LN, term loan 3 month U.S. LIBOR + 3.250% 4% 4/25/25 (a)(b)(c) | 4,342,982 | 4,342,982 | |
| Tranche B, term loan 3 month U.S. LIBOR + 2.750% 2.8753% 4/25/25 (a)(b)(c) | 17,136,790 | 16,963,709 | |
| USI, Inc.: | |||
| 1LN, term loan 3 month U.S. LIBOR + 3.250% 3.3815% 12/2/26 (a)(b)(c) | 1,486,201 | 1,475,515 | |
| Tranche B, term loan 3 month U.S. LIBOR + 3.000% 3.1315% 5/16/24 (a)(b)(c) | 8,775,467 | 8,711,231 | |
| TOTAL INSURANCE | 131,928,437 | ||
| Leisure - 3.0% | |||
| Alterra Mountain Co. Tranche B 1LN, term loan 1 month U.S. LIBOR + 3.500% 4% 7/21/28 (a)(b)(c) | 6,403,815 | 6,379,801 | |
| Callaway Golf Co. Tranche B, term loan 3 month U.S. LIBOR + 4.500% 4.586% 1/4/26 (a)(b)(c) | 2,722,125 | 2,734,592 | |
| Carnival Corp. Tranche B 1LN, term loan 3 month U.S. LIBOR + 3.000% 3.75% 6/30/25 (a)(b)(c) | 4,925,362 | 4,893,052 | |
| City Football Group Ltd. Tranche B 1LN, term loan 1 month U.S. LIBOR + 3.500% 4% 7/21/28 (a)(b)(c) | 11,725,000 | 11,666,375 | |
| Crown Finance U.S., Inc. Tranche B 1LN, term loan: | |||
| 1 month U.S. LIBOR + 8.250% 9.25% 5/23/24 (a)(b)(c) | 731,517 | 780,895 | |
| 3 month U.S. LIBOR + 2.500% 3.5% 2/28/25 (a)(b)(c) | 5,716,366 | 4,698,510 | |
| 3 month U.S. LIBOR + 2.750% 3.75% 9/30/26 (a)(b)(c) | 2,333,382 | 1,901,706 | |
| 15.25% 5/23/24 (c) | 1,141,860 | 1,407,822 | |
| Delta 2 SARL Tranche B, term loan 3 month U.S. LIBOR + 2.500% 3.5% 2/1/24 (a)(b)(c) | 14,394,747 | 14,340,767 | |
| Equinox Holdings, Inc.: | |||
| Tranche 2LN, term loan 3 month U.S. LIBOR + 7.000% 8% 9/8/24 (a)(b)(c) | 1,000,000 | 869,170 | |
| Tranche B-1, term loan 3 month U.S. LIBOR + 3.000% 4% 3/8/24 (a)(b)(c) | 4,450,105 | 4,113,321 | |
| Hayward Industries, Inc. Tranche B 1LN, term loan 1 month U.S. LIBOR + 2.500% 3% 5/28/28 (a)(b)(c) | 2,783,025 | 2,774,342 | |
| Herschend Entertainment Co. LLC Tranche B 1LN, term loan 1 month U.S. LIBOR + 3.750% 4.25% 8/18/28 (a)(b)(c) | 1,835,000 | 1,831,569 | |
| MajorDrive Holdings IV LLC 1LN, term loan 3 month U.S. LIBOR + 4.000% 4.5% 5/12/28 (a)(b)(c) | 3,880,275 | 3,886,328 | |
| Rising Tide Holdings, Inc. Tranche B 1LN, term loan 1 month U.S. LIBOR + 4.750% 5.5% 6/1/28 (a)(b)(c) | 3,241,875 | 3,256,723 | |
| SeaWorld Parks & Entertainment, Inc. Tranche B 1LN, term loan 1 month U.S. LIBOR + 3.000% 3.5% 8/13/28 (a)(b)(c) | 6,650,000 | 6,620,940 | |
| Seminole Tribe of Florida Tranche B, term loan 3 month U.S. LIBOR + 1.750% 1.8341% 7/6/24 (a)(b)(c) | 3,044,406 | 3,039,170 | |
| SP PF Buyer LLC Tranche B 1LN, term loan 3 month U.S. LIBOR + 4.500% 4.5841% 12/21/25 (a)(b)(c) | 4,175,572 | 4,099,368 | |
| United PF Holdings LLC: | |||
| 1LN, term loan 3 month U.S. LIBOR + 4.000% 4.1315% 12/30/26 (a)(b)(c) | 2,729,873 | 2,666,185 | |
| 2LN, term loan 3 month U.S. LIBOR + 8.500% 8.6315% 12/30/27 (a)(b)(c)(e) | 750,000 | 697,500 | |
| Tranche B 1LN, term loan 3 month U.S. LIBOR + 8.500% 9.5% 12/30/26 (a)(b)(c)(e) | 950,400 | 950,400 | |
| TOTAL LEISURE | 83,608,536 | ||
| Metals/Mining - 0.1% | |||
| American Rock Salt Co. LLC 1LN, term loan 1 month U.S. LIBOR + 4.000% 4.75% 6/4/28 (a)(b)(c) | 3,491,250 | 3,505,215 | |
| Paper - 0.2% | |||
| Ahlstrom-Munksjo OYJ 1LN, term loan 3 month U.S. LIBOR + 4.000% 4.75% 2/4/28 (a)(b)(c) | 2,568,563 | 2,571,773 | |
| Neenah, Inc. Tranche B 1LN, term loan 3 month U.S. LIBOR + 3.000% 3.5% 4/6/28 (a)(b)(c) | 1,717,034 | 1,721,327 | |
| TOTAL PAPER | 4,293,100 | ||
| Publishing/Printing - 0.8% | |||
| Cengage Learning, Inc. Tranche B 1LN, term loan 1 month U.S. LIBOR + 4.750% 5.75% 7/14/26 (a)(b)(c) | 5,555,000 | 5,587,219 | |
| Harland Clarke Holdings Corp. 1LN, term loan 1 month U.S. LIBOR + 7.750% 8.75% 8/31/26 (a)(b)(c) | 3,096,159 | 2,896,859 | |
| Learning Care Group (U.S.) No 2, Inc. Tranche B 1LN, term loan: | |||
| 3 month U.S. LIBOR + 3.250% 4.25% 3/13/25 (a)(b)(c) | 2,276,781 | 2,241,218 | |
| 3 month U.S. LIBOR + 8.500% 9.5% 3/13/25 (a)(b)(c) | 2,404,563 | 2,404,563 | |
| Proquest LLC Tranche B 1LN, term loan 3 month U.S. LIBOR + 3.250% 3.3341% 10/17/26 (a)(b)(c) | 1,056,494 | 1,055,269 | |
| Recorded Books, Inc. Tranche B 1LN, term loan 3 month U.S. LIBOR + 4.000% 4.0831% 8/29/25 (a)(b)(c) | 2,288,077 | 2,288,786 | |
| RLG Holdings LLC: | |||
| 2LN, term loan 1 month U.S. LIBOR + 7.500% 8.25% 7/2/29 (a)(b)(c) | 590,000 | 583,363 | |
| Tranche B 1LN, term loan 1 month U.S. LIBOR + 4.250% 5% 7/8/28 (a)(b)(c) | 1,887,222 | 1,888,411 | |
| Tranche DD 1LN, term loan 1 month U.S. LIBOR + 3.250% 3.1313% 7/8/28 (a)(b)(c)(f) | 477,778 | 478,079 | |
| Scripps (E.W.) Co. Tranche B 1LN, term loan 3 month U.S. LIBOR + 3.000% 3.75% 1/7/28 (a)(b)(c) | 2,602,500 | 2,606,117 | |
| TOTAL PUBLISHING/PRINTING | 22,029,884 | ||
| Railroad - 0.7% | |||
| AIT Worldwide Logistics Holdings, Inc. 1LN, term loan 3 month U.S. LIBOR + 4.750% 5.5% 4/6/28 (a)(b)(c) | 3,980,000 | 3,989,950 | |
| First Student Bidco, Inc.: | |||
| Tranche B 1LN, term loan 1 month U.S. LIBOR + 3.000% 3.5% 7/21/28 (a)(b)(c) | 3,695,784 | 3,673,610 | |
| Tranche C 1LN, term loan 1 month U.S. LIBOR + 3.000% 3.5% 7/21/28 (a)(b)(c) | 1,364,216 | 1,356,030 | |
| Genesee & Wyoming, Inc. 1LN, term loan 3 month U.S. LIBOR + 2.000% 2.1315% 12/30/26 (a)(b)(c) | 3,634,650 | 3,610,698 | |
| Worldwide Express, Inc.: | |||
| 1LN, term loan 1 month U.S. LIBOR + 4.250% 5% 7/22/28 (a)(b)(c) | 6,675,000 | 6,693,557 | |
| Tranche B 2LN, term loan 1 month U.S. LIBOR + 7.000% 7.75% 7/22/29 (a)(b)(c) | 1,295,000 | 1,280,431 | |
| TOTAL RAILROAD | 20,604,276 | ||
| Restaurants - 0.8% | |||
| Burger King Worldwide, Inc. Tranche B 1LN, term loan 3 month U.S. LIBOR + 1.750% 1.8368% 11/19/26 (a)(b)(c) | 2,936,363 | 2,898,426 | |
| KFC Holding Co. Tranche B 1LN, term loan 3 month U.S. LIBOR + 1.750% 1.8362% 3/15/28 (a)(b)(c) | 1,679,062 | 1,676,964 | |
| PFC Acquisition Corp. Tranche B 1LN, term loan 3 month U.S. LIBOR + 6.250% 6.3341% 3/1/26 (a)(b)(c) | 3,534,375 | 3,479,592 | |
| Sovos Brands Intermediate, Inc. 1LN, term loan 1 month U.S. LIBOR + 4.250% 4.5% 6/8/28 (a)(b)(c) | 1,193,102 | 1,193,102 | |
| Whatabrands LLC Tranche B 1LN, term loan 1 month U.S. LIBOR + 3.250% 3.75% 7/21/28 (a)(b)(c) | 13,050,000 | 13,030,686 | |
| TOTAL RESTAURANTS | 22,278,770 | ||
| Services - 9.0% | |||
| ABG Intermediate Holdings 2 LLC Tranche B 1LN, term loan: | |||
| 3 month U.S. LIBOR + 3.250% 4% 9/27/24 (a)(b)(c) | 2,847,127 | 2,841,347 | |
| 3 month U.S. LIBOR + 5.250% 6.25% 9/29/24 (a)(b)(c) | 930,600 | 930,600 | |
| Adtalem Global Education, Inc. Tranche B 1LN, term loan 3 month U.S. LIBOR + 4.500% 5.25% 8/12/28 (a)(b)(c) | 7,160,000 | 7,163,580 | |
| AEA International Holdings Luxembourg SARL Tranche B 1LN, term loan 3 month U.S. LIBOR + 3.750% 4.25% 9/7/28 (a)(b)(c)(e) | 3,630,000 | 3,625,463 | |
| All-Star Bidco AB Tranche B1 1LN, term loan 1 month U.S. LIBOR + 3.500% 7/21/28 (b)(c)(d) | 4,450,000 | 4,437,006 | |
| Allied Universal Holdco LLC Tranche B 1LN, term loan 1 month U.S. LIBOR + 3.750% 4.25% 5/14/28 (a)(b)(c) | 3,950,000 | 3,951,778 | |
| APX Group, Inc. Tranche B 1LN, term loan 1 month U.S. LIBOR + 3.500% 4% 7/9/28 (a)(b)(c) | 5,560,000 | 5,540,874 | |
| Aramark Services, Inc.: | |||
| Tranche B 3LN, term loan 3 month U.S. LIBOR + 1.750% 1.8341% 3/11/25 (a)(b)(c) | 5,211,300 | 5,091,857 | |
| Tranche B-4 1LN, term loan 3 month U.S. LIBOR + 1.750% 1.8341% 1/15/27 (a)(b)(c) | 1,282,188 | 1,250,453 | |
| Ascend Learning LLC: | |||
| Tranche B 1LN, term loan 3 month U.S. LIBOR + 3.750% 4.75% 7/12/24 (a)(b)(c) | 2,781,900 | 2,783,291 | |
| Tranche B, term loan 3 month U.S. LIBOR + 3.000% 4% 7/12/24 (a)(b)(c) | 4,608,253 | 4,604,152 | |
| Brand Energy & Infrastructure Services, Inc. Tranche B, term loan 3 month U.S. LIBOR + 4.250% 5.25% 6/21/24 (a)(b)(c) | 12,216,603 | 12,099,935 | |
| Cast & Crew Payroll LLC Tranche B 1LN, term loan 3 month U.S. LIBOR + 3.750% 3.8341% 2/7/26 (a)(b)(c) | 8,077,261 | 8,040,267 | |
| CHG Healthcare Services, Inc. 1LN, term loan 1 month U.S. LIBOR + 3.500% 9/30/28 (b)(c)(d) | 2,705,000 | 2,707,894 | |
| Conservice Midco LLC Tranche B 1LN, term loan 3 month U.S. LIBOR + 4.250% 4.3815% 5/13/27 (a)(b)(c) | 2,222,550 | 2,223,950 | |
| CoreCivic, Inc. Tranche B 1LN, term loan 3 month U.S. LIBOR + 4.500% 5.5% 12/18/24 (a)(b)(c) | 2,203,094 | 2,179,697 | |
| CoreLogic, Inc. Tranche B 1LN, term loan 3 month U.S. LIBOR + 3.500% 4% 6/2/28 (a)(b)(c) | 10,285,000 | 10,272,144 | |
| Creative Artists Agency LLC Tranche B 1LN, term loan 3 month U.S. LIBOR + 3.750% 3.8341% 11/26/26 (a)(b)(c) | 1,965,000 | 1,953,642 | |
| Division Holding Corp. Tranche B 1LN, term loan 1 month U.S. LIBOR + 4.750% 5.5% 5/21/28 (a)(b)(c) | 3,000,000 | 3,011,250 | |
| EAB Global, Inc. Tranche B 1LN, term loan 1 month U.S. LIBOR + 3.500% 4% 8/16/28 (a)(b)(c) | 3,430,000 | 3,410,278 | |
| EmployBridge LLC Tranche B 1LN, term loan 1 month U.S. LIBOR + 4.750% 5.5% 7/19/28 (a)(b)(c) | 5,570,000 | 5,531,010 | |
| Ensemble RCM LLC 1LN, term loan 3 month U.S. LIBOR + 3.750% 3.8785% 8/1/26 (a)(b)(c) | 4,183,608 | 4,190,343 | |
| Filtration Group Corp.: | |||
| Tranche B 1LN, term loan 3 month U.S. LIBOR + 3.750% 4.5% 3/29/25 (a)(b)(c) | 990,000 | 991,485 | |
| Tranche B, term loan 3 month U.S. LIBOR + 3.000% 3.0841% 3/29/25 (a)(b)(c) | 2,226,714 | 2,214,200 | |
| Finastra U.S.A., Inc.: | |||
| Tranche 2LN, term loan 3 month U.S. LIBOR + 7.250% 8.25% 6/13/25 (a)(b)(c) | 4,950,000 | 4,973,067 | |
| Tranche B 1LN, term loan 3 month U.S. LIBOR + 3.500% 4.5% 6/13/24 (a)(b)(c) | 11,591,235 | 11,490,971 | |
| Flexera Software LLC Tranche B 1LN, term loan 3 month U.S. LIBOR + 3.750% 4.5% 3/3/28 (a)(b)(c) | 1,860,938 | 1,861,514 | |
| Franchise Group, Inc. Tranche B 1LN, term loan 3 month U.S. LIBOR + 4.750% 5.5% 3/10/26 (a)(b)(c) | 4,741,813 | 4,759,594 | |
| Gateway Merger Sub 2021, Inc. Tranche B 1LN, term loan 1 month U.S. LIBOR + 5.250% 6% 6/25/28 (a)(b)(c)(e) | 1,885,000 | 1,889,713 | |
| GEMS MENASA Cayman Ltd. Tranche B 1LN, term loan 3 month U.S. LIBOR + 5.000% 6% 7/30/26 (a)(b)(c) | 5,814,041 | 5,815,844 | |
| Greeneden U.S. Holdings II LLC Tranche B 1LN, term loan 3 month U.S. LIBOR + 4.000% 4.75% 12/1/27 (a)(b)(c) | 4,363,075 | 4,376,339 | |
| Ion Trading Finance Ltd. Tranche B 1LN, term loan 3 month U.S. LIBOR + 4.750% 4.9166% 3/26/28 (a)(b)(c) | 10,349,063 | 10,360,757 | |
| KNS Acquisitions, Inc. Tranche B 1LN, term loan 3 month U.S. LIBOR + 6.250% 7% 4/21/27 (a)(b)(c) | 1,845,000 | 1,834,631 | |
| KUEHG Corp.: | |||
| Tranche B 2LN, term loan 3 month U.S. LIBOR + 8.250% 9.25% 8/22/25 (a)(b)(c) | 1,000,000 | 999,500 | |
| Tranche B, term loan 3 month U.S. LIBOR + 3.750% 4.75% 2/21/25 (a)(b)(c) | 8,893,573 | 8,802,147 | |
| Lakeshore Intermediate LLC 1LN, term loan 1 month U.S. LIBOR + 3.500% 9/29/28 (b)(c)(d)(e) | 1,840,000 | 1,835,400 | |
| Life Time, Inc. Tranche B 1LN, term loan 3 month U.S. LIBOR + 4.750% 5.75% 12/15/24 (a)(b)(c) | 5,686,425 | 5,725,548 | |
| Maverick Purchaser Sub LLC: | |||
| Tranche B 1LN, term loan: | |||
| 3 month U.S. LIBOR + 3.500% 3.5841% 1/23/27 (a)(b)(c) | 4,691,339 | 4,679,610 | |
| 3 month U.S. LIBOR + 4.750% 5.5% 2/3/27 (a)(b)(c) | 497,500 | 500,361 | |
| Tranche B 2LN, term loan 1 month U.S. LIBOR + 8.750% 1/31/28 (b)(c)(d) | 4,060,000 | 4,060,000 | |
| McKissock LLC Tranche B 1LN, term loan 1 month U.S. LIBOR + 5.000% 5.75% 6/23/28 (a)(b)(c)(e) | 2,768,063 | 2,723,081 | |
| Nielsen Holdings PLC Tranche B 1LN, term loan 3 month U.S. LIBOR + 4.000% 4.0841% 3/5/28 (a)(b)(c) | 2,298,450 | 2,302,564 | |
| Pilot Travel Centers LLC Tranche B 1LN, term loan 1 month U.S. LIBOR + 2.000% 8/4/28 (b)(c)(d) | 12,650,000 | 12,604,840 | |
| PowerTeam Services LLC Tranche B 1LN, term loan 1 month U.S. LIBOR + 3.500% 4.5% 3/6/25 (a)(b)(c) | 2,768,063 | 2,752,506 | |
| Sabert Corp. Tranche B 1LN, term loan 3 month U.S. LIBOR + 4.500% 5.5% 12/10/26 (a)(b)(c) | 4,728,642 | 4,734,553 | |
| Sabre GLBL, Inc.: | |||
| Tranche B-1 1LN, term loan 1 month U.S. LIBOR + 3.500% 4% 12/17/27 (a)(b)(c) | 561,417 | 558,083 | |
| Tranche B-2 1LN, term loan 1 month U.S. LIBOR + 3.500% 4% 12/17/27 (a)(b)(c) | 894,933 | 889,617 | |
| Signal Parent, Inc. Tranche B 1LN, term loan 3 month U.S. LIBOR + 3.500% 4.25% 4/1/28 (a)(b)(c) | 6,774,847 | 6,690,161 | |
| Sitel Worldwide Corp. Tranche B 1LN, term loan 1 month U.S. LIBOR + 3.750% 4.25% 8/27/28 (a)(b)(c) | 3,460,000 | 3,464,325 | |
| Sotheby's Tranche B 1LN, term loan 1 month U.S. LIBOR + 4.500% 5% 1/15/27 (a)(b)(c) | 3,994,810 | 4,004,797 | |
| Spin Holdco, Inc. Tranche B 1LN, term loan 3 month U.S. LIBOR + 4.000% 4.75% 3/4/28 (a)(b)(c) | 15,592,500 | 15,629,766 | |
| SuperMoose Borrower LLC Tranche B 1LN, term loan 3 month U.S. LIBOR + 3.750% 3.8815% 8/29/25 (a)(b)(c) | 3,558,750 | 3,294,086 | |
| The GEO Group, Inc. Tranche B 1LN, term loan 3 month U.S. LIBOR + 2.000% 2.75% 3/23/24 (a)(b)(c) | 1,829,091 | 1,687,538 | |
| Uber Technologies, Inc. Tranche B 1LN, term loan: | |||
| 3 month U.S. LIBOR + 3.500% 3.5841% 4/4/25 (a)(b)(c) | 5,953,846 | 5,952,179 | |
| 3 month U.S. LIBOR + 3.500% 3.5841% 2/25/27 (a)(b)(c) | 5,937,661 | 5,932,733 | |
| TOTAL SERVICES | 248,232,321 | ||
| Steel - 0.4% | |||
| Atkore International, Inc. Tranche B1LN, term loan 1 month U.S. LIBOR + 2.000% 2.5% 5/26/28 (a)(b)(c) | 2,079,475 | 2,071,032 | |
| Hyperion Materials & Technologies, Inc. Tranche B 1LN, term loan 3 month U.S. LIBOR + 4.500% 5% 7/29/28 (a)(b)(c) | 2,000,000 | 2,002,500 | |
| JMC Steel Group, Inc. 1LN, term loan 3 month U.S. LIBOR + 2.000% 2.0833% 1/24/27 (a)(b)(c) | 2,912,324 | 2,878,948 | |
| Tiger Acquisition LLC Tranche B 1LN, term loan 1 month U.S. LIBOR + 3.250% 3.75% 6/1/28 (a)(b)(c) | 3,500,000 | 3,485,790 | |
| TOTAL STEEL | 10,438,270 | ||
| Super Retail - 3.5% | |||
| Academy Ltd. Tranche B 1LN, term loan 1 month U.S. LIBOR + 2.750% 4.5% 11/6/27 (a)(b)(c) | 3,328,275 | 3,331,603 | |
| Ambience Merger Sub, Inc. Tranche B 1LN, term loan 1 month U.S. LIBOR + 4.250% 4.75% 7/24/28 (a)(b)(c) | 4,111,255 | 4,116,395 | |
| Bass Pro Group LLC Tranche B 1LN, term loan 3 month U.S. LIBOR + 4.250% 5% 3/5/28 (a)(b)(c) | 52,808,836 | 52,967,237 | |
| BJ's Wholesale Club, Inc. Tranche B 1LN, term loan 3 month U.S. LIBOR + 2.000% 2.0826% 2/3/24 (a)(b)(c) | 2,743,975 | 2,744,716 | |
| Empire Today LLC Tranche B 1LN, term loan 3 month U.S. LIBOR + 5.000% 5.75% 4/1/28 (a)(b)(c) | 4,693,238 | 4,658,038 | |
| Harbor Freight Tools U.S.A., Inc. Tranche B 1LN, term loan 1 month U.S. LIBOR + 2.750% 3.25% 10/19/27 (a)(b)(c) | 9,683,750 | 9,673,485 | |
| LBM Acquisition LLC Tranche B 1LN, term loan 3 month U.S. LIBOR + 3.750% 4.5% 12/18/27 (a)(b)(c) | 3,583,655 | 3,547,818 | |
| Red Ventures LLC Tranche B 1LN, term loan 3 month U.S. LIBOR + 2.500% 2.5841% 11/8/24 (a)(b)(c) | 8,390,996 | 8,309,184 | |
| Rent-A-Center, Inc. Tranche B 1LN, term loan 1 month U.S. LIBOR + 3.250% 3.75% 2/17/28 (a)(b)(c) | 3,741,700 | 3,751,054 | |
| WW International, Inc. Tranche B 1LN, term loan 3 month U.S. LIBOR + 3.500% 4% 4/13/28 (a)(b)(c) | 4,473,788 | 4,465,422 | |
| TOTAL SUPER RETAIL | 97,564,952 | ||
| Technology - 14.4% | |||
| A&V Holdings Midco LLC Tranche B 1LN, term loan 3 month U.S. LIBOR + 5.370% 6.375% 3/10/27 (a)(b)(c) | 2,459,817 | 2,447,518 | |
| Acuris Finance U.S., Inc. 1LN, term loan 3 month U.S. LIBOR + 4.000% 4.5% 2/16/28 (a)(b)(c) | 3,631,771 | 3,641,504 | |
| Alliance Laundry Systems LLC Tranche B 1LN, term loan 3 month U.S. LIBOR + 3.500% 4.25% 10/8/27 (a)(b)(c) | 1,645,809 | 1,647,274 | |
| Anastasia Parent LLC Tranche B, term loan 3 month U.S. LIBOR + 3.750% 3.8815% 8/10/25 (a)(b)(c) | 8,567,670 | 7,207,553 | |
| Applied Systems, Inc. Tranche B, term loan 3 month U.S. LIBOR + 3.250% 3.75% 9/19/24 (a)(b)(c) | 2,000,000 | 1,999,260 | |
| Aptean, Inc. 1LN, term loan 3 month U.S. LIBOR + 4.250% 4.3341% 4/23/26 (a)(b)(c) | 5,850,584 | 5,814,018 | |
| Arches Buyer, Inc. Tranche B 1LN, term loan 3 month U.S. LIBOR + 3.250% 3.75% 12/4/27 (a)(b)(c) | 6,799,922 | 6,761,706 | |
| athenahealth, Inc. Tranche B 1LN, term loan 3 month U.S. LIBOR + 4.250% 4.3771% 2/11/26 (a)(b)(c) | 13,755,731 | 13,783,243 | |
| Boxer Parent Co., Inc. Tranche B 1LN, term loan 3 month U.S. LIBOR + 3.750% 3.8815% 10/2/25 (a)(b)(c) | 4,782,231 | 4,753,346 | |
| Camelot Finance SA: | |||
| Tranche B 1LN, term loan 3 month U.S. LIBOR + 3.000% 4% 10/31/26 (a)(b)(c) | 7,940,000 | 7,957,389 | |
| Tranche B, term loan 3 month U.S. LIBOR + 3.000% 3.0841% 10/31/26 (a)(b)(c) | 5,601,800 | 5,585,443 | |
| Ceridian HCM Holding, Inc. Tranche B, term loan 3 month U.S. LIBOR + 2.500% 2.5719% 4/30/25 (a)(b)(c) | 6,297,670 | 6,206,354 | |
| Cloudera, Inc. Tranche B 1LN, term loan 3 month U.S. LIBOR + 2.500% 3.25% 12/22/27 (a)(b)(c) | 2,487,500 | 2,484,391 | |
| CMC Materials, Inc. Tranche B 1LN, term loan 3 month U.S. LIBOR + 2.000% 2.125% 11/15/25 (a)(b)(c) | 2,402,501 | 2,396,495 | |
| CMI Marketing, Inc. Tranche B 1LN, term loan 3 month U.S. LIBOR + 4.750% 5.5% 3/23/28 (a)(b)(c) | 1,850,000 | 1,856,938 | |
| Cologix Holdings, Inc. Tranche B 1LN, term loan 3 month U.S. LIBOR + 3.750% 4.5% 4/30/28 (a)(b)(c) | 3,865,313 | 3,866,511 | |
| CommerceHub, Inc.: | |||
| Tranche B 1LN, term loan 3 month U.S. LIBOR + 4.000% 4.75% 12/29/27 (a)(b)(c) | 2,203,350 | 2,204,275 | |
| Tranche B 2LN, term loan 3 month U.S. LIBOR + 7.000% 7.75% 12/29/28 (a)(b)(c) | 605,000 | 616,344 | |
| CommScope, Inc. Tranche B 1LN, term loan 3 month U.S. LIBOR + 3.250% 3.3341% 4/4/26 (a)(b)(c) | 9,053,073 | 8,998,393 | |
| ConnectWise LLC Tranche B 1LN, term loan 3 month U.S. LIBOR + 3.500% 9/24/28 (b)(c)(d) | 6,395,000 | 6,379,013 | |
| Constant Contact, Inc. Tranche B 1LN, term loan 3 month U.S. LIBOR + 4.000% 4.75% 2/10/28 (a)(b)(c) | 2,055,941 | 2,050,801 | |
| Cvent, Inc. Tranche B, term loan 3 month U.S. LIBOR + 3.750% 3.8341% 11/29/24 (a)(b)(c) | 3,443,295 | 3,427,697 | |
| DCert Buyer, Inc.: | |||
| 1LN, term loan 3 month U.S. LIBOR + 4.000% 4.0841% 10/16/26 (a)(b)(c) | 8,709,721 | 8,707,282 | |
| Tranche B 2LN, term loan 3 month U.S. LIBOR + 7.000% 7.0841% 2/19/29 (a)(b)(c) | 3,925,000 | 3,953,613 | |
| Dell International LLC Tranche B 1LN, term loan 3 month U.S. LIBOR + 1.750% 2% 9/19/25 (a)(b)(c) | 2,754,232 | 2,752,882 | |
| DG Investment Intermediate Holdings, Inc.: | |||
| 2LN, term loan 3 month U.S. LIBOR + 6.750% 7.5% 3/31/29 (a)(b)(c) | 630,000 | 633,150 | |
| Tranche B 1LN, term loan 3 month U.S. LIBOR + 3.750% 4.5% 3/31/28 (a)(b)(c) | 2,296,992 | 2,304,779 | |
| Tranche DD 1LN, term loan 3 month U.S. LIBOR + 3.750% 4.4425% 3/31/28 (a)(b)(c)(f) | 481,138 | 482,769 | |
| Dynatrace LLC 1LN, term loan 3 month U.S. LIBOR + 2.250% 2.3341% 8/23/25 (a)(b)(c) | 2,143,581 | 2,133,314 | |
| Emerald TopCo, Inc.: | |||
| 1LN, term loan 3 month U.S. LIBOR + 3.500% 3.6284% 7/22/26 (a)(b)(c) | 2,450,000 | 2,433,169 | |
| Tranche B 1LN, term loan 1 month U.S. LIBOR + 3.750% 4.5% 7/25/26 (a)(b)(c) | 213,926 | 214,194 | |
| Epicor Software Corp. Tranche B 1LN, term loan 3 month U.S. LIBOR + 3.250% 4% 7/31/27 (a)(b)(c) | 5,418,617 | 5,416,178 | |
| EPV Merger Sub, Inc. Tranche B 1LN, term loan 3 month U.S. LIBOR + 3.250% 3.3341% 3/8/25 (a)(b)(c) | 1,291,645 | 1,266,135 | |
| EXC Holdings III Corp. Tranche B, term loan 3 month U.S. LIBOR + 3.500% 4.5% 12/2/24 (a)(b)(c) | 2,707,486 | 2,714,254 | |
| Go Daddy Operating Co. LLC: | |||
| Tranche B 1LN, term loan 3 month U.S. LIBOR + 2.000% 2.0841% 8/10/27 (a)(b)(c) | 3,826,563 | 3,802,646 | |
| Tranche B, term loan 3 month U.S. LIBOR + 1.750% 1.8341% 2/15/24 (a)(b)(c) | 4,497,182 | 4,468,535 | |
| Grab Holdings, Inc. Tranche B 1LN, term loan 3 month U.S. LIBOR + 4.500% 5.5% 1/29/26 (a)(b)(c) | 3,144,200 | 3,170,391 | |
| Helios Software Holdings, Inc. Tranche B 1LN, term loan 3 month U.S. LIBOR + 3.750% 3.9166% 3/11/28 (a)(b)(c) | 2,000,000 | 1,997,000 | |
| Hunter U.S. Bidco, Inc. Tranche B 1LN, term loan 1 month U.S. LIBOR + 4.250% 4.75% 8/19/28 (a)(b)(c) | 5,190,000 | 5,209,463 | |
| Hyland Software, Inc.: | |||
| 2LN, term loan 3 month U.S. LIBOR + 6.250% 7% 7/10/25 (a)(b)(c) | 602,800 | 608,075 | |
| Tranche B 1LN, term loan 3 month U.S. LIBOR + 3.500% 4.25% 7/1/24 (a)(b)(c) | 4,449,382 | 4,451,696 | |
| Icon Luxembourg Sarl Tranche B 1LN, term loan 1 month U.S. LIBOR + 2.500% 3% 7/1/28 (a)(b)(c) | 16,358,145 | 16,410,328 | |
| Imprivata, Inc. Tranche B 1LN, term loan 3 month U.S. LIBOR + 3.500% 4% 12/1/27 (a)(b)(c) | 3,348,175 | 3,347,472 | |
| Liftoff Mobile, Inc. Tranche B 1LN, term loan 1 month U.S. LIBOR + 3.750% 9/30/28 (a)(b)(c)(d) | 4,340,000 | 4,323,725 | |
| MA FinanceCo. LLC: | |||
| Tranche B 1LN, term loan 3 month U.S. LIBOR + 4.250% 5.25% 6/5/25 (a)(b)(c) | 1,706,250 | 1,715,310 | |
| Tranche B 3LN, term loan 3 month U.S. LIBOR + 2.750% 2.8341% 6/21/24 (a)(b)(c) | 2,879,286 | 2,846,894 | |
| McAfee LLC Tranche B, term loan 3 month U.S. LIBOR + 3.750% 3.8368% 9/29/24 (a)(b)(c) | 5,923,527 | 5,924,297 | |
| MH Sub I LLC: | |||
| 1LN, term loan 3 month U.S. LIBOR + 3.750% 4.75% 9/15/24 (a)(b)(c) | 1,465,163 | 1,468,372 | |
| Tranche B 2LN, term loan 3 month U.S. LIBOR + 6.250% 6.336% 2/23/29 (a)(b)(c) | 565,000 | 572,944 | |
| Tranche B, term loan 3 month U.S. LIBOR + 3.500% 3.5841% 9/15/24 (a)(b)(c) | 4,913,593 | 4,896,838 | |
| NAVEX TopCo, Inc.: | |||
| 2LN, term loan 3 month U.S. LIBOR + 7.000% 7.09% 9/4/26 (a)(b)(c) | 415,000 | 403,243 | |
| Tranche B 1LN, term loan 3 month U.S. LIBOR + 3.250% 3.34% 9/5/25 (a)(b)(c) | 1,586,032 | 1,570,568 | |
| Osmosis Debt Merger Sub, Inc.: | |||
| Tranche B 1LN, term loan 1 month U.S. LIBOR + 4.000% 4.5% 7/30/28 (a)(b)(c) | 2,906,667 | 2,914,660 | |
| Tranche DD 1LN, term loan 1 month U.S. LIBOR + 4.000% 7/30/28 (b)(c)(d) | 363,333 | 364,333 | |
| Park Place Technologies LLC 1LN, term loan 3 month U.S. LIBOR + 5.000% 6% 11/10/27 (a)(b)(c) | 6,314,123 | 6,297,012 | |
| Peraton Corp. Tranche B 1LN, term loan 3 month U.S. LIBOR + 3.750% 4.5% 2/1/28 (a)(b)(c) | 28,885,835 | 28,890,457 | |
| PointClickCare Technologies, Inc. Tranche B 1LN, term loan 3 month U.S. LIBOR + 3.000% 3.75% 12/29/27 (a)(b)(c) | 1,631,800 | 1,629,760 | |
| Polaris Newco LLC Tranche B 1LN, term loan 1 month U.S. LIBOR + 4.000% 4.5% 6/2/28 (a)(b)(c) | 10,005,000 | 10,023,809 | |
| Project Boost Purchaser LLC: | |||
| 1LN, term loan 3 month U.S. LIBOR + 3.500% 3.5841% 5/30/26 (a)(b)(c) | 4,225,392 | 4,202,279 | |
| Tranche B 1LN, term loan 1 month U.S. LIBOR + 3.500% 4% 5/30/26 (a)(b)(c) | 2,034,900 | 2,033,801 | |
| Proofpoint, Inc. Tranche B 1LN, term loan 1 month U.S. LIBOR + 3.250% 3.75% 6/9/28 (a)(b)(c) | 10,050,000 | 9,994,725 | |
| Rackspace Technology Global, Inc. Tranche B 1LN, term loan 3 month U.S. LIBOR + 2.750% 3.5% 2/15/28 (a)(b)(c) | 8,231,742 | 8,169,099 | |
| RealPage, Inc. Tranche B 1LN, term loan 3 month U.S. LIBOR + 3.250% 3.75% 4/22/28 (a)(b)(c) | 10,770,000 | 10,732,951 | |
| Renaissance Holding Corp. Tranche B 1LN, term loan 3 month U.S. LIBOR + 3.250% 3.3341% 5/31/25 (a)(b)(c) | 4,848,368 | 4,804,199 | |
| Seattle Spinco, Inc. Tranche B 3LN, term loan 3 month U.S. LIBOR + 2.750% 2.8341% 6/21/24 (a)(b)(c) | 18,229,540 | 18,024,457 | |
| Severin Acquisition LLC Tranche B 1LN, term loan 3 month U.S. LIBOR + 3.250% 3.3374% 8/1/25 (a)(b)(c) | 3,398,888 | 3,379,072 | |
| Sophia LP 1LN, term loan 3 month U.S. LIBOR + 3.750% 4.5% 10/7/27 (a)(b)(c) | 5,309,875 | 5,327,557 | |
| SS&C Technologies, Inc.: | |||
| Tranche B 3LN, term loan 3 month U.S. LIBOR + 1.750% 1.8341% 4/16/25 (a)(b)(c) | 3,835,083 | 3,793,395 | |
| Tranche B 4LN, term loan 3 month U.S. LIBOR + 1.750% 1.8341% 4/16/25 (a)(b)(c) | 2,904,087 | 2,872,519 | |
| Tranche B 5LN, term loan 3 month U.S. LIBOR + 1.750% 1.8341% 4/16/25 (a)(b)(c) | 5,896,112 | 5,839,627 | |
| STG-Fairway Holdings LLC Tranche B 1LN, term loan 3 month U.S. LIBOR + 3.250% 2.8341% 1/31/27 (a)(b)(c) | 2,274,231 | 2,271,388 | |
| Taboola.com Ltd. Tranche B 1LN, term loan 1 month U.S. LIBOR + 4.000% 4.5% 9/1/28 (a)(b)(c) | 2,000,000 | 1,985,000 | |
| Tempo Acquisition LLC: | |||
| Tranche B 1LN, term loan 1 month U.S. LIBOR + 3.000% 3.5% 8/31/28 (a)(b)(c) | 5,330,000 | 5,334,424 | |
| Tranche B, term loan 3 month U.S. LIBOR + 2.750% 2.8341% 5/1/24 (a)(b)(c) | 717,808 | 717,133 | |
| TTM Technologies, Inc. Tranche B, term loan 3 month U.S. LIBOR + 2.500% 2.586% 9/28/24 (a)(b)(c) | 2,662,361 | 2,663,480 | |
| UKG, Inc.: | |||
| 1LN, term loan 3 month U.S. LIBOR + 3.750% 3.8341% 5/4/26 (a)(b)(c) | 6,232,800 | 6,241,651 | |
| 2LN, term loan 3 month U.S. LIBOR + 6.750% 7.5% 5/3/27 (a)(b)(c) | 4,015,000 | 4,078,557 | |
| Tranche B 1LN, term loan 3 month U.S. LIBOR + 3.250% 4% 5/4/26 (a)(b)(c) | 9,887,818 | 9,900,969 | |
| Verscend Holding Corp. Tranche B 1LN, term loan 3 month U.S. LIBOR + 4.000% 4.0841% 8/27/25 (a)(b)(c) | 6,627,142 | 6,632,643 | |
| VFH Parent LLC Tranche B 1LN, term loan 3 month U.S. LIBOR + 3.000% 3.0818% 3/1/26 (a)(b)(c) | 4,682,829 | 4,674,447 | |
| Virgin Pulse, Inc. Tranche B 1LN, term loan 3 month U.S. LIBOR + 4.000% 4.75% 4/6/28 (a)(b)(c) | 1,885,000 | 1,880,288 | |
| VM Consolidated, Inc. Tranche B 1LN, term loan 3 month U.S. LIBOR + 3.250% 3.4166% 3/19/28 (a)(b)(c) | 5,030,039 | 5,018,520 | |
| VS Buyer LLC Tranche B 1LN, term loan 3 month U.S. LIBOR + 3.000% 3.0841% 2/28/27 (a)(b)(c) | 3,594,500 | 3,590,007 | |
| Weber-Stephen Products LLC Tranche B 1LN, term loan 3 month U.S. LIBOR + 3.250% 4% 10/30/27 (a)(b)(c) | 2,437,014 | 2,441,278 | |
| WEX, Inc. Tranche B 1LN, term loan 3 month U.S. LIBOR + 2.250% 2.3341% 4/1/28 (a)(b)(c) | 1,795,975 | 1,787,498 | |
| Xperi Holding Corp. Tranche B 1LN, term loan 1 month U.S. LIBOR + 3.500% 3.5841% 6/8/28 (a)(b)(c) | 3,738,974 | 3,728,467 | |
| Zelis Payments Buyer, Inc. Tranche B 1LN, term loan 3 month U.S. LIBOR + 3.500% 3.586% 9/30/26 (a)(b)(c) | 3,609,392 | 3,592,969 | |
| TOTAL TECHNOLOGY | 398,117,413 | ||
| Telecommunications - 5.5% | |||
| Altice Financing SA Tranche B, term loan: | |||
| 3 month U.S. LIBOR + 2.750% 2.8761% 7/15/25 (a)(b)(c) | 4,292,093 | 4,219,685 | |
| 3 month U.S. LIBOR + 2.750% 2.9004% 1/31/26 (a)(b)(c) | 3,122,586 | 3,065,599 | |
| Altice France SA: | |||
| Tranche B 11LN, term loan 3 month U.S. LIBOR + 2.750% 2.8785% 7/31/25 (a)(b)(c) | 6,069,927 | 5,966,253 | |
| Tranche B 12LN, term loan 3 month U.S. LIBOR + 3.680% 3.8136% 1/31/26 (a)(b)(c) | 1,492,057 | 1,478,255 | |
| Tranche B 13LN, term loan 3 month U.S. LIBOR + 4.000% 4.1248% 8/14/26 (a)(b)(c) | 5,835,000 | 5,810,668 | |
| Blucora, Inc. Tranche B, term loan 3 month U.S. LIBOR + 4.000% 5% 5/22/24 (a)(b)(c) | 2,086,871 | 2,089,479 | |
| Cablevision Lightpath LLC Tranche B 1LN, term loan 3 month U.S. LIBOR + 3.250% 3.75% 11/30/27 (a)(b)(c) | 1,521,370 | 1,522,511 | |
| Connect Finco SARL Tranche B 1LN, term loan 3 month U.S. LIBOR + 3.500% 4.5% 12/12/26 (a)(b)(c) | 3,867,713 | 3,869,106 | |
| Consolidated Communications, Inc. Tranche B 1LN, term loan 3 month U.S. LIBOR + 3.500% 4.25% 10/2/27 (a)(b)(c) | 1,902,823 | 1,903,717 | |
| Crown Subsea Communications Holding, Inc. Tranche B 1LN, term loan 1 month U.S. LIBOR + 5.000% 5.75% 4/20/27 (a)(b)(c) | 1,438,459 | 1,446,845 | |
| Evo Payments International LLC Tranche B, term loan 3 month U.S. LIBOR + 3.250% 3.34% 12/22/23 (a)(b)(c) | 2,640,811 | 2,634,764 | |
| Frontier Communications Corp. Tranche B 1LN, term loan 3 month U.S. LIBOR + 3.750% 4.5% 10/8/27 (a)(b)(c) | 11,778,369 | 11,752,574 | |
| GTT Communications, Inc. Tranche B, term loan 3 month U.S. LIBOR + 0.000% 2.88% 5/31/25 (a)(b)(c)(g) | 4,087,166 | 3,449,405 | |
| Intelsat Jackson Holdings SA: | |||
| Tranche B, term loan 3 month U.S. LIBOR + 3.750% 8% 11/27/23 (a)(b)(c) | 19,970,000 | 20,191,068 | |
| Tranche B-4, term loan 3 month U.S. LIBOR + 5.500% 8.75% 1/2/24 (a)(b)(c) | 4,000,000 | 4,057,520 | |
| Tranche B-5, term loan 8.625% 1/2/24 (c) | 6,205,000 | 6,292,925 | |
| Tranche DD 1LN, term loan 3 month U.S. LIBOR + 4.750% 5.3917% 7/13/22 (a)(b)(c)(f) | 12,612,912 | 12,686,445 | |
| Iridium Satellite LLC Tranche B 1LN, term loan 1 month U.S. LIBOR + 2.500% 3.25% 11/4/26 (a)(b)(c) | 2,642,485 | 2,643,436 | |
| Level 3 Financing, Inc. Tranche B 1LN, term loan 3 month U.S. LIBOR + 1.750% 1.8341% 3/1/27 (a)(b)(c) | 4,568,653 | 4,510,723 | |
| Lumen Technologies, Inc. Tranche B 1LN, term loan 3 month U.S. LIBOR + 2.250% 2.3341% 3/15/27 (a)(b)(c) | 1,585,789 | 1,567,061 | |
| Northwest Fiber LLC Tranche B 1LN, term loan 3 month U.S. LIBOR + 3.750% 3.8326% 4/30/27 (a)(b)(c) | 9,841,689 | 9,826,926 | |
| Radiate Holdco LLC Tranche B 1LN, term loan 3 month U.S. LIBOR + 3.500% 4.25% 9/10/26 (a)(b)(c) | 8,495,800 | 8,483,566 | |
| SBA Senior Finance II, LLC Tranche B, term loan 3 month U.S. LIBOR + 1.750% 1.84% 4/11/25 (a)(b)(c) | 3,363,980 | 3,330,340 | |
| Securus Technologies Holdings Tranche B, term loan: | |||
| 3 month U.S. LIBOR + 4.500% 5.5% 11/1/24 (a)(b)(c) | 4,436,388 | 4,215,944 | |
| 3 month U.S. LIBOR + 8.250% 9.25% 11/1/25 (a)(b)(c) | 7,055,000 | 6,453,561 | |
| Windstream Services LLC Tranche B 1LN, term loan 3 month U.S. LIBOR + 6.250% 7.25% 9/21/27 (a)(b)(c) | 3,722,638 | 3,733,806 | |
| Zayo Group Holdings, Inc. 1LN, term loan 3 month U.S. LIBOR + 3.000% 3.0841% 3/9/27 (a)(b)(c) | 15,838,135 | 15,690,365 | |
| TOTAL TELECOMMUNICATIONS | 152,892,547 | ||
| Textiles/Apparel - 0.6% | |||
| Birkenstock GmbH & Co. KG Tranche B 1LN, term loan 3 month U.S. LIBOR + 3.750% 4.25% 4/26/28 (a)(b)(c) | 5,645,850 | 5,634,107 | |
| Canada Goose, Inc. Tranche B 1LN, term loan 3 month U.S. LIBOR + 3.500% 4.25% 10/7/27 (a)(b)(c) | 1,771,635 | 1,773,849 | |
| Jo-Ann Stores LLC Tranche B 1LN, term loan 1 month U.S. LIBOR + 4.750% 5.5% 7/7/28 (a)(b)(c) | 2,030,000 | 1,971,130 | |
| Samsonite IP Holdings SARL Tranche B2 1LN, term loan 3 month U.S. LIBOR + 3.000% 3.75% 4/25/25 (a)(b)(c) | 1,042,932 | 1,033,973 | |
| Tory Burch LLC Tranche B 1LN, term loan 3 month U.S. LIBOR + 3.500% 4% 4/14/28 (a)(b)(c) | 2,942,625 | 2,946,303 | |
| Victoria's Secret & Co. Tranche B 1LN, term loan 1 month U.S. LIBOR + 3.250% 3.75% 6/30/28 (a)(b)(c) | 2,260,000 | 2,251,525 | |
| TOTAL TEXTILES/APPAREL | 15,610,887 | ||
| Transportation Ex Air/Rail - 0.1% | |||
| XPO Logistics, Inc. Tranche B, term loan 3 month U.S. LIBOR + 2.000% 1.8333% 2/23/25 (a)(b)(c) | 2,000,000 | 1,988,760 | |
| Utilities - 2.2% | |||
| Brookfield WEC Holdings, Inc. Tranche B 1LN, term loan 3 month U.S. LIBOR + 2.750% 3.25% 8/1/25 (a)(b)(c) | 15,552,994 | 15,438,057 | |
| ExGen Renewables IV, LLC Tranche B 1LN, term loan 3 month U.S. LIBOR + 2.500% 3.5% 12/15/27 (a)(b)(c) | 2,500,000 | 2,496,875 | |
| Granite Generation LLC 1LN, term loan 3 month U.S. LIBOR + 3.750% 4.75% 11/1/26 (a)(b)(c) | 1,833,857 | 1,799,930 | |
| Green Energy Partners/Stonewall LLC Tranche B 1LN, term loan 3 month U.S. LIBOR + 5.500% 6.5% 11/13/21 (a)(b)(c) | 3,890,880 | 3,540,701 | |
| Herman Miller, Inc. Tranche B 1LN, term loan 1 month U.S. LIBOR + 2.000% 2.0625% 6/29/28 (a)(b)(c) | 2,425,000 | 2,424,564 | |
| Limetree Bay Terminals LLC term loan 3 month U.S. LIBOR + 4.000% 5% 2/15/24 (a)(b)(c) | 4,699,599 | 3,959,412 | |
| LMBE-MC HoldCo II LLC Tranche B, term loan 3 month U.S. LIBOR + 4.000% 5% 12/3/25 (a)(b)(c) | 967,899 | 921,923 | |
| Osmose Utilities Services, Inc. Tranche B 1LN, term loan 1 month U.S. LIBOR + 3.250% 3.75% 6/17/28 (a)(b)(c) | 3,835,000 | 3,818,241 | |
| PG&E Corp. Tranche B 1LN, term loan 3 month U.S. LIBOR + 3.000% 3.5% 6/23/25 (a)(b)(c) | 8,816,410 | 8,659,390 | |
| Pike Corp. Tranche B 1LN, term loan 3 month U.S. LIBOR + 3.000% 3.09% 1/21/28 (a)(b)(c) | 2,598,630 | 2,596,863 | |
| Vertiv Group Corp. Tranche B 1LN, term loan 3 month U.S. LIBOR + 2.750% 2.8325% 3/2/27 (a)(b)(c) | 9,673,228 | 9,608,707 | |
| Vistra Operations Co. LLC Tranche B 3LN, term loan 3 month U.S. LIBOR + 1.750% 1.8341% 12/31/25 (a)(b)(c) | 7,103,910 | 7,046,510 | |
| TOTAL UTILITIES | 62,311,173 | ||
| TOTAL BANK LOAN OBLIGATIONS | |||
| (Cost $2,550,503,607) | 2,551,085,068 | ||
| Nonconvertible Bonds - 1.9% | |||
| Aerospace - 0.2% | |||
| Bombardier, Inc. 7.125% 6/15/26 (h) | 310,000 | 326,275 | |
| TransDigm, Inc.: | |||
| 6.25% 3/15/26 (h) | 4,000,000 | 4,170,000 | |
| 8% 12/15/25 (h) | 385,000 | 410,506 | |
| TOTAL AEROSPACE | 4,906,781 | ||
| Air Transportation - 0.1% | |||
| American Airlines, Inc. / AAdvantage Loyalty IP Ltd. 5.5% 4/20/26 (h) | 1,105,000 | 1,161,631 | |
| Delta Air Lines, Inc. / SkyMiles IP Ltd. 4.5% 10/20/25 (h) | 815,000 | 872,050 | |
| TOTAL AIR TRANSPORTATION | 2,033,681 | ||
| Broadcasting - 0.1% | |||
| Univision Communications, Inc.: | |||
| 6.625% 6/1/27 (h) | 1,205,000 | 1,308,931 | |
| 9.5% 5/1/25 (h) | 1,210,000 | 1,312,850 | |
| TOTAL BROADCASTING | 2,621,781 | ||
| Building Materials - 0.0% | |||
| SRS Distribution, Inc. 4.625% 7/1/28 (h) | 160,000 | 163,232 | |
| Cable/Satellite TV - 0.1% | |||
| Charter Communications Operating LLC/Charter Communications Operating Capital Corp. 3 month U.S. LIBOR + 1.650% 1.7758% 2/1/24 (a)(b) | 1,750,000 | 1,799,500 | |
| Chemicals - 0.0% | |||
| Consolidated Energy Finance SA 3 month U.S. LIBOR + 3.750% 3.866% 6/15/22 (a)(b)(h) | 1,596,000 | 1,594,040 | |
| Kronos Acquisition Holdings, Inc. / KIK Custom Products, Inc. 5% 12/31/26 (h) | 40,000 | 39,941 | |
| TOTAL CHEMICALS | 1,633,981 | ||
| Containers - 0.2% | |||
| Ardagh Packaging Finance PLC/Ardagh MP Holdings U.S.A., Inc. 4.125% 8/15/26 (h) | 2,945,000 | 3,055,231 | |
| Berry Global, Inc. 4.875% 7/15/26 (h) | 500,000 | 525,025 | |
| Trivium Packaging Finance BV 5.5% 8/15/26 (h) | 1,085,000 | 1,136,331 | |
| TOTAL CONTAINERS | 4,716,587 | ||
| Energy - 0.1% | |||
| Citgo Petroleum Corp. 7% 6/15/25 (h) | 1,050,000 | 1,073,625 | |
| New Fortress Energy, Inc. 6.75% 9/15/25 (h) | 535,000 | 514,938 | |
| PBF Holding Co. LLC/PBF Finance Corp. 9.25% 5/15/25 (h) | 1,135,000 | 1,069,738 | |
| Transocean Poseidon Ltd. 6.875% 2/1/27 (h) | 1,140,000 | 1,134,220 | |
| TOTAL ENERGY | 3,792,521 | ||
| Gaming - 0.2% | |||
| Golden Entertainment, Inc. 7.625% 4/15/26 (h) | 1,065,000 | 1,123,575 | |
| Scientific Games Corp. 5% 10/15/25 (h) | 2,060,000 | 2,119,225 | |
| Sugarhouse HSP Gaming Prop Mezz LP/Sugarhouse HSP Gaming Finance Corp. 5.875% 5/15/25 (h) | 1,367,000 | 1,367,000 | |
| VICI Properties, Inc.: | |||
| 3.5% 2/15/25 (h) | 240,000 | 244,800 | |
| 4.25% 12/1/26 (h) | 345,000 | 360,294 | |
| 4.625% 12/1/29 (h) | 200,000 | 215,000 | |
| TOTAL GAMING | 5,429,894 | ||
| Healthcare - 0.1% | |||
| Bausch Health Companies, Inc. 5.5% 11/1/25 (h) | 2,515,000 | 2,552,725 | |
| HCRX Investments Holdco LP 4.5% 8/1/29 (h) | 115,000 | 115,575 | |
| Tenet Healthcare Corp. 4.625% 7/15/24 | 1,028,000 | 1,043,420 | |
| TOTAL HEALTHCARE | 3,711,720 | ||
| Hotels - 0.1% | |||
| Marriott Ownership Resorts, Inc. 6.125% 9/15/25 (h) | 1,865,000 | 1,969,906 | |
| Leisure - 0.1% | |||
| Royal Caribbean Cruises Ltd.: | |||
| 9.125% 6/15/23 (h) | 275,000 | 298,872 | |
| 10.875% 6/1/23 (h) | 1,335,000 | 1,495,200 | |
| TOTAL LEISURE | 1,794,072 | ||
| Paper - 0.0% | |||
| Ardagh Metal Packaging Finance U.S.A. LLC/Ardagh Metal Packaging Finance PLC 3.25% 9/1/28 (h) | 895,000 | 892,763 | |
| Restaurants - 0.0% | |||
| 1011778 BC Unlimited Liability Co./New Red Finance, Inc. 5.75% 4/15/25 (h) | 160,000 | 167,976 | |
| Services - 0.0% | |||
| Adtalem Global Education, Inc. 5.5% 3/1/28 (h) | 1,130,000 | 1,140,603 | |
| Sotheby's 7.375% 10/15/27 (h) | 200,000 | 211,500 | |
| TOTAL SERVICES | 1,352,103 | ||
| Super Retail - 0.1% | |||
| EG Global Finance PLC: | |||
| 6.75% 2/7/25 (h) | 1,000,000 | 1,022,500 | |
| 8.5% 10/30/25 (h) | 1,905,000 | 1,983,581 | |
| TOTAL SUPER RETAIL | 3,006,081 | ||
| Technology - 0.1% | |||
| CommScope, Inc. 6% 3/1/26 (h) | 1,100,000 | 1,142,163 | |
| SSL Robotics LLC 9.75% 12/31/23 (h) | 710,000 | 769,463 | |
| TOTAL TECHNOLOGY | 1,911,626 | ||
| Telecommunications - 0.3% | |||
| Altice Financing SA 5.75% 8/15/29 (h) | 6,000,000 | 5,832,900 | |
| Altice France SA: | |||
| 5.125% 1/15/29 (h) | 165,000 | 161,700 | |
| 7.375% 5/1/26 (h) | 1,335,000 | 1,385,343 | |
| Frontier Communications Holdings LLC 5% 5/1/28 (h) | 1,160,000 | 1,218,000 | |
| LCPR Senior Secured Financing DAC 5.125% 7/15/29 (h) | 205,000 | 211,140 | |
| Northwest Fiber LLC/Northwest Fiber Finance Sub, Inc. 4.75% 4/30/27 (h)(i) | 195,000 | 196,950 | |
| TOTAL TELECOMMUNICATIONS | 9,006,033 | ||
| Transportation Ex Air/Rail - 0.1% | |||
| Avolon Holdings Funding Ltd. 5.125% 10/1/23 (h) | 2,255,000 | 2,422,829 | |
| TOTAL NONCONVERTIBLE BONDS | |||
| (Cost $51,677,149) | 53,333,067 | ||
| Shares | Value�� | ||
| Common Stocks - 1.4% | |||
| Capital Goods - 0.2% | |||
| TNT Crane & Rigging LLC (e)(j) | 170,494 | 4,141,299 | |
| TNT Crane & Rigging LLC warrants 10/31/25 (e)(j) | 9,492 | 31,324 | |
| TOTAL CAPITAL GOODS | 4,172,623 | ||
| Diversified Financial Services - 0.0% | |||
| ACNR Holdings, Inc. (e)(j) | 15,697 | 549,395 | |
| Energy - 1.0% | |||
| California Resources Corp. (j) | 289,671 | 11,876,511 | |
| California Resources Corp. warrants 10/27/24 (j) | 7,511 | 90,132 | |
| Chesapeake Energy Corp. | 167,441 | 10,312,691 | |
| Chesapeake Energy Corp. (k) | 928 | 57,156 | |
| Denbury, Inc. (j) | 65,094 | 4,572,854 | |
| EP Energy Corp. (e)(j) | 15,785 | 1,416,704 | |
| TOTAL ENERGY | 28,326,048 | ||
| Entertainment/Film - 0.0% | |||
| Cineworld Group PLC warrants 11/23/25 (j) | 341,212 | 183,808 | |
| Publishing/Printing - 0.0% | |||
| Cenveo Corp. (e)(j) | 4,167 | 121,510 | |
| Restaurants - 0.1% | |||
| CEC Entertainment, Inc. (e)(j) | 105,486 | 1,898,748 | |
| Super Retail - 0.0% | |||
| David's Bridal, Inc. rights (e)(j) | 1,346 | 0 | |
| Utilities - 0.1% | |||
| TexGen Power LLC (e)(j) | 85,051 | 3,086,501 | |
| TOTAL COMMON STOCKS | |||
| (Cost $19,497,023) | 38,338,633 | ||
| Nonconvertible Preferred Stocks - 0.0% | |||
| Diversified Financial Services - 0.0% | |||
| ACNR Holdings, Inc. (e)(j) | |||
| (Cost $1,123,250) | 8,986 | 1,617,480 | |
| Principal Amount | Value | ||
| Preferred Securities - 0.1% | |||
| Banks & Thrifts - 0.1% | |||
| JPMorgan Chase & Co.: | |||
| 3 month U.S. LIBOR + 3.320% 3.4649% (a)(b)(l) | 855,000 | 865,612 | |
| 3 month U.S. LIBOR + 3.470% 3.5985% (a)(b)(l) | 860,000 | 870,122 | |
| TOTAL PREFERRED SECURITIES | |||
| (Cost $1,575,045) | 1,735,734 | ||
| Shares | Value | ||
| Other - 0.0% | |||
| Other - 0.0% | |||
| Tribune Co. Claim (e)(j) | |||
| (Cost $45,406) | 45,954 | 30,789 | |
| Money Market Funds - 12.7% | |||
| Fidelity Cash Central Fund 0.06% (m) | |||
| (Cost $351,286,710) | 351,222,621 | 351,292,865 | |
| TOTAL INVESTMENT IN SECURITIES - 108.1% | |||
| (Cost $2,975,708,190) | 2,997,433,636 | ||
| NET OTHER ASSETS (LIABILITIES) - (8.1)% | (223,525,558) | ||
| NET ASSETS - 100% | $2,773,908,078 |
Legend
(a) Coupon rates for floating and adjustable rate securities reflect the rates in effect at period end.
(b) Coupon is indexed to a floating interest rate which may be multiplied by a specified factor and/or subject to caps or floors.
(c) Remaining maturities of bank loan obligations may be less than the stated maturities shown as a result of contractual or optional prepayments by the borrower. Such prepayments cannot be predicted with certainty.
(d) The coupon rate will be determined upon settlement of the loan after period end.
(e) Level 3 security
(f) Position or a portion of the position represents an unfunded loan commitment. At period end, the total principal amount and market value of unfunded commitments totaled $5,942,479 and $5,941,954, respectively.
(g) Non-income producing - Security is in default.
(h) Security exempt from registration under Rule 144A of the Securities Act of 1933. These securities may be resold in transactions exempt from registration, normally to qualified institutional buyers. At the end of the period, the value of these securities amounted to $50,490,147 or 1.8% of net assets.
(i) Security or a portion of the security purchased on a delayed delivery or when-issued basis.
(j) Non-income producing
(k) Restricted securities (including private placements) - Investment in securities not registered under the Securities Act of 1933 (excluding 144A issues). At the end of the period, the value of restricted securities (excluding 144A issues) amounted to $57,156 or 0.0% of net assets.
(l) Security is perpetual in nature with no stated maturity date.
(m) Affiliated fund that is generally available only to investment companies and other accounts managed by Fidelity Investments. The rate quoted is the annualized seven-day yield of the fund at period end. A complete unaudited listing of the fund's holdings as of its most recent quarter end is available upon request. In addition, each Fidelity Central Fund's financial statements, which are not covered by the Fund's Report of Independent Registered Public Accounting Firm, are available on the SEC's website or upon request.
Additional information on each restricted holding is as follows:
| Security | Acquisition Date | Acquisition Cost |
| Chesapeake Energy Corp. | 2/10/21 | $8,788 |
Affiliated Central Funds
Fiscal year to date information regarding the Fund's investments in Fidelity Central Funds, including the ownership percentage, is presented below.
| Fund | Value, beginning of period | Purchases | Sales Proceeds | Dividend Income | Realized Gain/Loss | Change in Unrealized appreciation (depreciation) | Value, end of period | % ownership, end of period |
| Fidelity Cash Central Fund 0.06% | $117,689,959 | $1,109,460,286 | $875,856,138 | $120,588 | $(1,242) | $-- | $351,292,865 | 0.5% |
| Total | $117,689,959 | $1,109,460,286 | $875,856,138 | $120,588 | $(1,242) | $-- | $351,292,865 |
Amounts in the income column in the above table include any capital gain distributions from underlying funds, which are presented in the corresponding line-item in the Statement of Operations, if applicable.
Investment Valuation
The following is a summary of the inputs used, as of September 30, 2021, involving the Fund's assets and liabilities carried at fair value. The inputs or methodology used for valuing securities may not be an indication of the risk associated with investing in those securities. For more information on valuation inputs, and their aggregation into the levels used below, please refer to the Investment Valuation section in the accompanying Notes to Financial Statements.
| Valuation Inputs at Reporting Date: | ||||
| Description | Total | Level 1 | Level 2 | Level 3 |
| Investments in Securities: | ||||
| Equities: | ||||
| Communication Services | $183,808 | $-- | $183,808 | $-- |
| Consumer Discretionary | 1,898,748 | -- | -- | 1,898,748 |
| Energy | 28,326,048 | 26,909,344 | -- | 1,416,704 |
| Financials | 2,166,875 | -- | -- | 2,166,875 |
| Industrials | 4,294,133 | -- | -- | 4,294,133 |
| Utilities | 3,086,501 | -- | -- | 3,086,501 |
| Bank Loan Obligations | 2,551,085,068 | -- | 2,517,517,441 | 33,567,627 |
| Corporate Bonds | 53,333,067 | -- | 53,333,067 | -- |
| Preferred Securities | 1,735,734 | -- | 1,735,734 | -- |
| Other | 30,789 | -- | -- | 30,789 |
| Money Market Funds | 351,292,865 | 351,292,865 | -- | -- |
| Total Investments in Securities: | $2,997,433,636 | $378,202,209 | $2,572,770,050 | $46,461,377 |
The following is a reconciliation of Investments in Securities for which Level 3 inputs were used in determining value:
| Investments in Securities: | |
| Bank Loan Obligations | |
| Beginning Balance | $17,341,503 |
| Net Realized Gain (Loss) on Investment Securities | (2,744,611) |
| Net Unrealized Gain (Loss) on Investment Securities | 3,567,060 |
| Cost of Purchases | 27,445,500 |
| Proceeds of Sales | (8,721,124) |
| Amortization/Accretion | (368,508) |
| Transfers into Level 3 | 1,342,890 |
| Transfers out of Level 3 | (4,295,083) |
| Ending Balance | $33,567,627 |
| The change in unrealized gain (loss) for the period attributable to Level 3 securities held at September 30, 2021 | $658,706 |
| Other Investments in Securities | |
| Beginning Balance | $7,472,733 |
| Net Realized Gain (Loss) on Investment Securities | (5,581,568) |
| Net Unrealized Gain (Loss) on Investment Securities | 10,599,782 |
| Cost of Purchases | -- |
| Proceeds of Sales | (3,097,025) |
| Amortization/Accretion | -- |
| Transfers into Level 3 | 3,499,828 |
| Transfers out of Level 3 | -- |
| Ending Balance | $12,893,750 |
| The change in unrealized gain (loss) for the period attributable to Level 3 securities held at September 30, 2021 | $5,206,729 |
The information used in the above reconciliation represents fiscal year to date activity for any Investments in Securities identified as using Level 3 inputs at either the beginning or the end of the current fiscal period. Cost of purchases and proceeds of sales may include securities received and/or delivered through in-kind transactions. Transfers in or out of Level 3 represent the beginning value of any Security or Instrument where a change in the pricing level occurred from the beginning to the end of the period. The cost of purchases and the proceeds of sales may include securities received or delivered through corporate actions or exchanges. Realized and unrealized gains (losses) disclosed in the reconciliation are included in Net Gain (Loss) on the Fund's Statement of Operations.
Other Information
Distribution of investments by country or territory of incorporation, as a percentage of Total Net Assets, is as follows (Unaudited):
| United States of America | 88.5% |
| Luxembourg | 5.0% |
| Canada | 1.4% |
| Others (Individually Less Than 1%) | 5.1% |
| 100.0% |
See accompanying notes which are an integral part of the financial statements.
Financial Statements
Statement of Assets and Liabilities
| September 30, 2021 | ||
| Assets | ||
| Investment in securities, at value — See accompanying schedule: Unaffiliated issuers (cost $2,624,421,480) | $2,646,140,771 | |
| Fidelity Central Funds (cost $351,286,710) | 351,292,865 | |
| Total Investment in Securities (cost $2,975,708,190) | $2,997,433,636 | |
| Cash | 3,616,494 | |
| Receivable for investments sold | 15,370,056 | |
| Receivable for fund shares sold | 17,934 | |
| Dividends receivable | 638 | |
| Interest receivable | 10,484,465 | |
| Distributions receivable from Fidelity Central Funds | 18,060 | |
| Other receivables | 1,242 | |
| Total assets | 3,026,942,525 | |
| Liabilities | ||
| Payable for investments purchased | ||
| Regular delivery | $252,530,590 | |
| Delayed delivery | 195,000 | |
| Payable for fund shares redeemed | 302,353 | |
| Other payables and accrued expenses | 6,504 | |
| Total liabilities | 253,034,447 | |
| Net Assets | $2,773,908,078 | |
| Net Assets consist of: | ||
| Paid in capital | $2,818,622,020 | |
| Total accumulated earnings (loss) | (44,713,942) | |
| Net Assets | $2,773,908,078 | |
| Net Asset Value, offering price and redemption price per share ($2,773,908,078 ÷ 27,490,145 shares) | $100.91 |
See accompanying notes which are an integral part of the financial statements.
Statement of Operations
| Year ended September 30, 2021 | ||
| Investment Income | ||
| Dividends | $1,464,646 | |
| Interest | 86,652,713 | |
| Income from Fidelity Central Funds | 120,588 | |
| Total income | 88,237,947 | |
| Expenses | ||
| Custodian fees and expenses | $22,387 | |
| Independent directors' fees and expenses | 8,207 | |
| Legal | 1,451 | |
| Miscellaneous | 15 | |
| Total expenses before reductions | 32,060 | |
| Expense reductions | (3,257) | |
| Total expenses after reductions | 28,803 | |
| Net investment income (loss) | 88,209,144 | |
| Realized and Unrealized Gain (Loss) | ||
| Net realized gain (loss) on: | ||
| Investment securities: | ||
| Unaffiliated issuers | (29,925,041) | |
| Fidelity Central Funds | (1,242) | |
| Foreign currency transactions | 4 | |
| Total net realized gain (loss) | (29,926,279) | |
| Change in net unrealized appreciation (depreciation) on investment securities | 119,810,361 | |
| Net gain (loss) | 89,884,082 | |
| Net increase (decrease) in net assets resulting from operations | $178,093,226 |
See accompanying notes which are an integral part of the financial statements.
Statement of Changes in Net Assets
| Year ended September 30, 2021 | Year ended September 30, 2020 | |
| Increase (Decrease) in Net Assets | ||
| Operations | ||
| Net investment income (loss) | $88,209,144 | $98,162,709 |
| Net realized gain (loss) | (29,926,279) | (25,285,564) |
| Change in net unrealized appreciation (depreciation) | 119,810,361 | (61,726,844) |
| Net increase (decrease) in net assets resulting from operations | 178,093,226 | 11,150,301 |
| Distributions to shareholders | (87,902,022) | (101,753,020) |
| Affiliated share transactions | ||
| Proceeds from sales of shares | 921,138,985 | 103,890,529 |
| Reinvestment of distributions | 87,902,022 | 100,453,836 |
| Cost of shares redeemed | (231,338,785) | (154,548,895) |
| Net increase (decrease) in net assets resulting from share transactions | 777,702,222 | 49,795,470 |
| Total increase (decrease) in net assets | 867,893,426 | (40,807,249) |
| Net Assets | ||
| Beginning of period | 1,906,014,652 | 1,946,821,901 |
| End of period | $2,773,908,078 | $1,906,014,652 |
| Other Information | ||
| Shares | ||
| Sold | 9,194,003 | 1,109,366 |
| Issued in reinvestment of distributions | 881,835 | 1,040,839 |
| Redeemed | (2,337,836) | (1,601,294) |
| Net increase (decrease) | 7,738,002 | 548,911 |
See accompanying notes which are an integral part of the financial statements.
Financial Highlights
Fidelity Floating Rate Central Fund
| Years ended September 30, | 2021 | 2020 | 2019 | 2018 | 2017 |
| Selected Per–Share Data | |||||
| Net asset value, beginning of period | $96.50 | $101.38 | $103.31 | $103.17 | $102.63 |
| Income from Investment Operations | |||||
| Net investment income (loss)A | 4.112 | 4.985 | 6.104 | 5.279 | 5.268 |
| Net realized and unrealized gain (loss) | 4.431 | (4.687) | (1.943) | .401 | .545 |
| Total from investment operations | 8.543 | .298 | 4.161 | 5.680 | 5.813 |
| Distributions from net investment income | (4.133) | (5.178) | (6.091) | (5.215) | (5.223) |
| Distributions from net realized gain | – | – | – | (.325) | (.050) |
| Total distributions | (4.133) | (5.178) | (6.091) | (5.540) | (5.273) |
| Net asset value, end of period | $100.91 | $96.50 | $101.38 | $103.31 | $103.17 |
| Total ReturnB | 8.99% | .42% | 4.20% | 5.65% | 5.77% |
| Ratios to Average Net AssetsC,D | |||||
| Expenses before reductions | - %E | - %E | - %E | - %E | .06% |
| Expenses net of fee waivers, if any | - %E | - %E | - %E | - %E | .06% |
| Expenses net of all reductions | - %E | - %E | - %E | - %E | .06% |
| Net investment income (loss) | 4.14% | 5.16% | 6.01% | 5.12% | 5.09% |
| Supplemental Data | |||||
| Net assets, end of period (000 omitted) | $2,773,908 | $1,906,015 | $1,946,822 | $2,295,944 | $1,634,506 |
| Portfolio turnover rateF | 41% | 40% | 29% | 47% | 78% |
A Calculated based on average shares outstanding during the period.
B Total returns would have been lower if certain expenses had not been reduced during the applicable periods shown.
C Fees and expenses of any underlying mutual funds or exchange-traded funds (ETFs) are not included in the Fund's expense ratio. The Fund indirectly bears its proportionate share of these expenses. For additional expense information related to investments in Fidelity Central Funds, please refer to the "Investments in Fidelity Central Funds" note found in the Notes to Financial Statements section of the most recent Annual or Semi-Annual report.
D Expense ratios reflect operating expenses of the class. Expenses before reductions do not reflect amounts reimbursed, waived, or reduced through arrangements with the investment adviser, brokerage services, or other offset arrangements, if applicable, and do not represent the amount paid by the class during periods when reimbursements, waivers or reductions occur.
E Amount represents less than .005%.
F Amount does not include the portfolio activity of any underlying mutual funds or exchange-traded funds (ETFs).
See accompanying notes which are an integral part of the financial statements.
Notes to Financial Statements
For the period ended September 30, 2021
1. Organization.
Fidelity Floating Rate Central Fund (the Fund) is a fund of Fidelity Central Investment Portfolios LLC (the LLC) and is authorized to issue an unlimited number of shares. Shares of the Fund are only offered to other investment companies and accounts managed by Fidelity Management & Research Company LLC (FMR), or its affiliates (the Investing Funds). The LLC is registered under the Investment Company Act of 1940, as amended (the 1940 Act), as an open-end management investment company organized as a Delaware Limited Liability Company.
2. Investments in Fidelity Central Funds.
Funds may invest in Fidelity Central Funds, which are open-end investment companies generally available only to other investment companies and accounts managed by the investment adviser and its affiliates. The Schedule of Investments lists any Fidelity Central Funds held as an investment as of period end, but does not include the underlying holdings of each Fidelity Central Fund. An investing fund indirectly bears its proportionate share of the expenses of the underlying Fidelity Central Funds.
Based on its investment objective, each Fidelity Central Fund may invest or participate in various investment vehicles or strategies that are similar to those of the investing fund. These strategies are consistent with the investment objectives of the investing fund and may involve certain economic risks which may cause a decline in value of each of the Fidelity Central Funds and thus a decline in the value of the investing fund.
| Fidelity Central Fund | Investment Manager | Investment Objective | Investment Practices | Expense Ratio(a) |
| Fidelity Money Market Central Funds | Fidelity Management & Research Company LLC (FMR) | Each fund seeks to obtain a high level of current income consistent with the preservation of capital and liquidity. | Short-term Investments | Less than .005% |
(a) Expenses expressed as a percentage of average net assets and are as of each underlying Central Fund's most recent annual or semi-annual shareholder report.
A complete unaudited list of holdings for each Fidelity Central Fund is available upon request or at the Securities and Exchange Commission website at www.sec.gov. In addition, the financial statements of the Fidelity Central Funds which contain the significant accounting policies (including investment valuation policies) of those funds, and are not covered by the Report of Independent Registered Public Accounting Firm, are available on the Securities and Exchange Commission website or upon request.
3. Significant Accounting Policies.
The Fund is an investment company and applies the accounting and reporting guidance of the Financial Accounting Standards Board (FASB) Accounting Standards Codification Topic 946 Financial Services - Investment Companies. The financial statements have been prepared in conformity with accounting principles generally accepted in the United States of America (GAAP), which require management to make certain estimates and assumptions at the date of the financial statements. Actual results could differ from those estimates. Subsequent events, if any, through the date that the financial statements were issued have been evaluated in the preparation of the financial statements. The Fund's Schedule of Investments lists any underlying mutual funds or exchange-traded funds (ETFs) but does not include the underlying holdings of these funds. The following summarizes the significant accounting policies of the Fund:
Investment Valuation. Investments are valued as of 4:00 p.m. Eastern time on the last calendar day of the period. The Board of Directors (the Board) has delegated the day to day responsibility for the valuation of the Fund's investments to the Fair Value Committee (the Committee) established by the Fund's investment adviser. In accordance with valuation policies and procedures approved by the Board, the Fund attempts to obtain prices from one or more third party pricing vendors or brokers to value its investments. When current market prices, quotations or currency exchange rates are not readily available or reliable, investments will be fair valued in good faith by the Committee, in accordance with procedures adopted by the Board. Factors used in determining fair value vary by investment type and may include market or investment specific events, changes in interest rates and credit quality. The frequency with which these procedures are used cannot be predicted and they may be utilized to a significant extent. The Committee oversees the Fund's valuation policies and procedures and reports to the Board on the Committee's activities and fair value determinations. The Board monitors the appropriateness of the procedures used in valuing the Fund's investments and ratifies the fair value determinations of the Committee.
The Fund categorizes the inputs to valuation techniques used to value its investments into a disclosure hierarchy consisting of three levels as shown below:
- Level 1 – quoted prices in active markets for identical investments
- Level 2 – other significant observable inputs (including quoted prices for similar investments, interest rates, prepayment speeds, etc.)
- Level 3 – unobservable inputs (including the Fund's own assumptions based on the best information available)
Valuation techniques used to value the Fund's investments by major category are as follows:
Debt securities, including restricted securities, are valued based on evaluated prices received from third party pricing vendors or from brokers who make markets in such securities. Corporate bonds, bank loan obligations and preferred securities are valued by pricing vendors who utilize matrix pricing which considers yield or price of bonds of comparable quality, coupon, maturity and type or by broker-supplied prices. When independent prices are unavailable or unreliable, debt securities may be valued utilizing pricing methodologies which consider similar factors that would be used by third party pricing vendors. Debt securities are generally categorized as Level 2 in the hierarchy but may be Level 3 depending on the circumstances. The Fund invests a significant portion of its assets in below investment grade securities. The value of these securities can be more volatile due to changes in the credit quality of the issuer and is sensitive to changes in economic, market and regulatory conditions.
Equity securities, including restricted securities, for which market quotations are readily available, are valued at the last reported sale price or official closing price as reported by a third party pricing vendor on the primary market or exchange on which they are traded and are categorized as Level 1 in the hierarchy. In the event there were no sales during the day or closing prices are not available, securities are valued at the last quoted bid price or may be valued using the last available price and are generally categorized as Level 2 in the hierarchy. For foreign equity securities, when market or security specific events arise, comparisons to the valuation of American Depositary Receipts (ADRs), futures contracts, Exchange-Traded Funds (ETFs) and certain indexes as well as quoted prices for similar securities may be used and would be categorized as Level 2 in the hierarchy. For equity securities, including restricted securities, where observable inputs are limited, assumptions about market activity and risk are used and these securities may be categorized as Level 3 in the hierarchy.
Investments in open-end mutual funds, including other Fidelity Central Funds, are valued at their closing net asset value (NAV) each business day and are categorized as Level 1 in the hierarchy.
The following provides information on Level 3 securities held by the Fund that were valued at period end based on unobservable inputs. These amounts exclude valuations provided by a broker.
| Asset Type | Fair Value | Valuation Technique(s) | Unobservable Input | Amount or Range/Weighted Average | Impact to Valuation from an Increase in Input(a) |
| Equities | $12,862,961 | Market comparable | Discount rate | 45.0% | Decrease |
| Enterprise value/EBITDA multiple (EV/EBITDA) | 3.8 - 8.4 / 6.4 | Increase | |||
| Strike price | $31.17 | Increase | |||
| Recovery value | Recovery value | 0.0% | Increase | ||
| Market approach | Transaction price | $89.75 | Increase | ||
| Parity price | $29.16 | Increase | |||
| Indicative market price | Mid price | $35.00 | Increase | ||
| Bid price | $18.00 - $180.00 / $92.52 | Increase | |||
| Bank Loan Obligations | $33,567,627 | Market approach | Parity price | $96.00 | Increase |
| Indicative market price | Evaluated bid | $93.00 - $100.25 / $99.30 | Increase | ||
| Bid price | $101.00 | Increase | |||
| Other | $30,789 | Recovery value | Recovery value | 0.7% | Increase |
(a) Represents the directional change in the fair value of the Level 3 investments that could have resulted from an increase in the corresponding input as of period end. A decrease to the unobservable input would have had the opposite effect. Significant changes in these inputs may have resulted in a significantly higher or lower fair value measurement at period end.
Changes in valuation techniques may result in transfers in or out of an assigned level within the disclosure hierarchy. The aggregate value of investments by input level as of September 30, 2021, as well as a roll forward of Level 3 investments, is included at the end of the Fund's Schedule of Investments.
Foreign Currency. Certain Funds may use foreign currency contracts to facilitate transactions in foreign-denominated securities. Gains and losses from these transactions may arise from changes in the value of the foreign currency or if the counterparties do not perform under the contracts' terms.
Foreign-denominated assets, including investment securities, and liabilities are translated into U.S. dollars at the exchange rates at period end. Purchases and sales of investment securities, income and dividends received, and expenses denominated in foreign currencies are translated into U.S. dollars at the exchange rate in effect on the transaction date.
The effects of exchange rate fluctuations on investments are included with the net realized and unrealized gain (loss) on investment securities. Other foreign currency transactions resulting in realized and unrealized gain (loss) are disclosed separately.
Investment Transactions and Income. For financial reporting purposes, the Fund's investment holdings and NAV include trades executed through the end of the last business day of the period. The NAV per share for processing shareholder transactions is calculated as of the close of business of the New York Stock Exchange (NYSE), normally 4:00 p.m. Eastern time and includes trades executed through the end of the prior business day. Gains and losses on securities sold are determined on the basis of identified cost and include proceeds received from litigation. Dividend income is recorded on the ex-dividend date, except for certain dividends from foreign securities where the ex-dividend date may have passed, which are recorded as soon as the Fund is informed of the ex-dividend date. Non-cash dividends included in dividend income, if any, are recorded at the fair market value of the securities received. Income and capital gain distributions from Fidelity Central Funds, if any, are recorded on the ex-dividend date. Certain distributions received by the Fund represent a return of capital or capital gain. The Fund determines the components of these distributions subsequent to the ex-dividend date, based upon receipt of tax filings or other correspondence relating to the underlying investment. These distributions are recorded as a reduction of cost of investments and/or as a realized gain. Interest income is accrued as earned and includes coupon interest and amortization of premium and accretion of discount on debt securities as applicable. Investment income is recorded net of foreign taxes withheld where recovery of such taxes is uncertain. Debt obligations may be placed on non-accrual status and related interest income may be reduced by ceasing current accruals and writing off interest receivables when the collection of all or a portion of interest has become doubtful based on consistently applied procedures. A debt obligation is removed from non-accrual status when the issuer resumes interest payments or when collectability of interest is reasonably assured. The Fund earns certain fees in connection with its floating rate loan purchasing activities. These fees are in addition to interest payments earned and may include amendment fees, consent fees and prepayment fees. These fees are recorded as Interest in the accompanying financial statements.
Expenses. Expenses directly attributable to a fund are charged to that fund. Expenses attributable to more than one fund are allocated among the respective funds on the basis of relative net assets or other appropriate methods. Expenses included in the accompanying financial statements reflect the expenses of that fund and do not include any expenses associated with any underlying mutual funds or exchange-traded funds. Although not included in a fund's expenses, a fund indirectly bears its proportionate share of these expenses through the net asset value of each underlying mutual fund or exchange-traded fund. Expense estimates are accrued in the period to which they relate and adjustments are made when actual amounts are known.
Income Tax Information and Distributions to Shareholders. Each year, the Fund intends to qualify as a regulated investment company under Subchapter M of the Internal Revenue Code, including distributing substantially all of its taxable income and realized gains. As a result, no provision for U.S. Federal income taxes is required. As of September 30, 2021, the Fund did not have any unrecognized tax benefits in the financial statements; nor is the Fund aware of any tax positions for which it is reasonably possible that the total amounts of unrecognized tax benefits will significantly change in the next twelve months. The Fund files a U.S. federal tax return, in addition to state and local tax returns as required. The Fund's federal income tax returns are subject to examination by the Internal Revenue Service (IRS) for a period of three fiscal years after they are filed. State and local tax returns may be subject to examination for an additional fiscal year depending on the jurisdiction. Foreign taxes are provided for based on the Fund's understanding of the tax rules and rates that exist in the foreign markets in which it invests.
Distributions are declared and recorded daily and paid monthly from net investment income. Distributions from realized gains, if any, are declared and recorded on the ex-dividend date. Income and capital gain distributions are determined in accordance with income tax regulations, which may differ from GAAP.
Capital accounts within the financial statements are adjusted for permanent book-tax differences. These adjustments have no impact on net assets or the results of operations. Capital accounts are not adjusted for temporary book-tax differences which will reverse in a subsequent period.
Book-tax differences are primarily due to capital loss carryforwards and losses deferred due to wash sales.
As of period end, the cost and unrealized appreciation (depreciation) in securities, and derivatives if applicable, for federal income tax purposes were as follows:
| Gross unrealized appreciation | $46,144,318 |
| Gross unrealized depreciation | (24,586,318) |
| Net unrealized appreciation (depreciation) | $21,558,000 |
| Tax Cost | $2,975,875,636 |
The tax-based components of distributable earnings as of period end were as follows:
| Capital loss carryforward | $(64,566,314) |
| Net unrealized appreciation (depreciation) on securities and other investments | $21,558,000 |
Capital loss carryforwards are only available to offset future capital gains of the Fund to the extent provided by regulations and may be limited. The capital loss carryforward information presented below, including any applicable limitation, is estimated as of fiscal period end and is subject to adjustment.
| No expiration | |
| Long-term | $(64,566,314) |
The tax character of distributions paid was as follows:
| September 30, 2021 | September 30, 2020 | |
| Ordinary Income | $87,902,022 | $ 101,753,020 |
Delayed Delivery Transactions and When-Issued Securities. During the period, certain Funds transacted in securities on a delayed delivery or when-issued basis. Payment and delivery may take place after the customary settlement period for that security. The price of the underlying securities and the date when the securities will be delivered and paid for are fixed at the time the transaction is negotiated. Securities purchased on a delayed delivery or when-issued basis are identified as such in the Schedule of Investments. Compensation for interest forgone in the purchase of a delayed delivery or when-issued debt security may be received. With respect to purchase commitments, each applicable Fund identifies securities as segregated in its records with a value at least equal to the amount of the commitment. Payables and receivables associated with the purchases and sales of delayed delivery securities having the same coupon, settlement date and broker are offset. Delayed delivery or when-issued securities that have been purchased from and sold to different brokers are reflected as both payables and receivables in the Statement of Assets and Liabilities under the caption "Delayed delivery", as applicable. Losses may arise due to changes in the value of the underlying securities or if the counterparty does not perform under the contract's terms, or if the issuer does not issue the securities due to political, economic, or other factors.
Restricted Securities (including Private Placements). Funds may invest in securities that are subject to legal or contractual restrictions on resale. These securities generally may be resold in transactions exempt from registration or to the public if the securities are registered. Disposal of these securities may involve time-consuming negotiations and expense, and prompt sale at an acceptable price may be difficult. Information regarding restricted securities held at period end is included at the end of the Schedule of Investments, if applicable.
Loans and Other Direct Debt Instruments. Direct debt instruments are interests in amounts owed to lenders by corporate or other borrowers. These instruments may be in the form of loans, trade claims or other receivables and may include standby financing commitments such as revolving credit facilities that obligate a fund to supply additional cash to the borrower on demand. Loans may be acquired through assignment, participation, or may be made directly to a borrower. Such instruments are presented in the Bank Loan Obligations section in the Schedule of Investments. Certain funds may also invest in unfunded loan commitments, which are contractual obligations for future funding. Information regarding unfunded commitments is included at the end of the Schedule of Investments, if applicable.
New Accounting Pronouncement. In March 2020, the Financial Accounting Standards Board (FASB) issued an Accounting Standards Update (ASU), ASU 2020-04, which provides optional, temporary relief with respect to the financial reporting of contracts subject to certain types of modifications due to the planned discontinuation of the London Interbank Offered Rate (LIBOR) and other IBOR-based reference rates. The temporary relief provided by ASU 2020-04 is effective for certain reference rate-related contract modifications that occur during the period March 12, 2020 through December 31, 2022. Management is currently evaluating the potential impact of ASU 2020-04 to the financial statements.
4. Purchases and Sales of Investments.
Purchases and sales of securities, other than short-term securities and in-kind transactions, as applicable, are noted in the table below.
| Purchases ($) | Sales ($) | |
| Fidelity Floating Rate Central Fund | 1,548,612,596 | 840,064,290 |
5. Fees and Other Transactions with Affiliates.
Management Fee and Expense Contract. Fidelity Management & Research Company LLC (the investment adviser) provides the Fund with investment management services. The Fund does not pay any fees for these services. Pursuant to the Fund's management contract, the investment adviser receives a monthly management fee that represents a portion of the management fees it receives from the Investing Funds. In addition, under an expense contract, the investment adviser also pays all other expenses of the Fund, excluding custody fees, the compensation of the independent Directors, and certain miscellaneous expenses such as proxy and shareholder meeting expenses.
Brokerage Commissions. A portion of portfolio transactions were placed with brokerage firms which are affiliates of the investment adviser. Brokerage commissions are included in net realized gain (loss) and change in net unrealized appreciation (depreciation) in the Statement of Operations. The commissions paid to these affiliated firms were as follows:
| Amount | |
| Fidelity Floating Rate Central Fund | $255 |
Interfund Trades. Funds may purchase from or sell securities to other Fidelity Funds under procedures adopted by the Board. The procedures have been designed to ensure these interfund trades are executed in accordance with Rule 17a-7 of the 1940 Act. Any interfund trades are included within the respective purchases and sales amounts shown in the Purchases and Sales of Investments note and are noted in the table below.
| Purchases ($) | Sales ($) | |
| Fidelity Floating Rate Central Fund | 4,509,979 | – |
6. Expense Reductions.
Through arrangements with the Fund's custodian, credits realized as a result of certain uninvested cash balances were used to reduce the Fund's expenses by $3,257.
7. Other.
Fund's organizational documents provide former and current directors and officers with a limited indemnification against liabilities arising in connection with the performance of their duties to the fund. In the normal course of business, the fund may also enter into contracts that provide general indemnifications. The fund's maximum exposure under these arrangements is unknown as this would be dependent on future claims that may be made against the fund. The risk of material loss from such claims is considered remote.
At the end of the period, mutual funds managed by the investment adviser or its affiliates were the owners of record of all of the outstanding shares of the Fund.
8. Coronavirus (COVID-19) Pandemic.
An outbreak of COVID-19 first detected in China during December 2019 has since spread globally and was declared a pandemic by the World Health Organization during March 2020. Developments that disrupt global economies and financial markets, such as the COVID-19 pandemic, may magnify factors that affect the Fund's performance.
Report of Independent Registered Public Accounting Firm
To the Board of Trustees of Fidelity Central Investment Portfolios LLC and Shareholders of Fidelity Floating Rate Central Fund
Opinion on the Financial Statements and Financial Highlights
We have audited the accompanying statement of assets and liabilities of Fidelity Floating Rate Central Fund (the "Fund"), a fund of Fidelity Central Investment Portfolios LLC, including the schedule of investments, as of September 30, 2021, the related statement of operations for the year then ended, the statement of changes in net assets for each of the two years in the period then ended, the financial highlights for each of the five years in the period then ended, and the related notes. In our opinion, the financial statements and financial highlights present fairly, in all material respects, the financial position of the Fund as of September 30, 2021, and the results of its operations for the year then ended, the changes in its net assets for each of the two years in the period then ended, and the financial highlights for each of the five years in the period then ended in conformity with accounting principles generally accepted in the United States of America.
Basis for Opinion
These financial statements and financial highlights are the responsibility of the Fund's management. Our responsibility is to express an opinion on the Fund's financial statements and financial highlights based on our audits. We are a public accounting firm registered with the Public Company Accounting Oversight Board (United States) (PCAOB) and are required to be independent with respect to the Fund in accordance with the U.S. federal securities laws and the applicable rules and regulations of the Securities and Exchange Commission and the PCAOB.
We conducted our audits in accordance with the standards of the PCAOB. Those standards require that we plan and perform the audit to obtain reasonable assurance about whether the financial statements and financial highlights are free of material misstatement, whether due to error or fraud. The Fund is not required to have, nor were we engaged to perform, an audit of its internal control over financial reporting. As part of our audits we are required to obtain an understanding of internal control over financial reporting but not for the purpose of expressing an opinion on the effectiveness of the Fund’s internal control over financial reporting. Accordingly, we express no such opinion.
Our audits included performing procedures to assess the risks of material misstatement of the financial statements and financial highlights, whether due to error or fraud, and performing procedures that respond to those risks. Such procedures included examining, on a test basis, evidence regarding the amounts and disclosures in the financial statements and financial highlights. Our audits also included evaluating the accounting principles used and significant estimates made by management, as well as evaluating the overall presentation of the financial statements and financial highlights. Our procedures included confirmation of securities owned as of September 30, 2021, by correspondence with the custodian, brokers and agent banks; when replies were not received from brokers or agent banks, we performed other auditing procedures. We believe that our audits provide a reasonable basis for our opinion.
/s/ Deloitte & Touche LLP
Boston, Massachusetts
November 15, 2021
We have served as the auditor of one or more of the Fidelity investment companies since 1999.
Directors and Officers (Trustees and Officers)
The Trustees, Members of the Advisory Board (if any), and officers of the Fidelity Central Investment Portfolios LLC and fund, as applicable, are listed below. The Board of Trustees governs the fund and is responsible for protecting the interests of shareholders. The Trustees are experienced executives who meet periodically throughout the year to oversee the fund's activities, review contractual arrangements with companies that provide services to the fund, oversee management of the risks associated with such activities and contractual arrangements, and review the fund's performance. Each of the Trustees oversees 313 funds.
The Trustees hold office without limit in time except that (a) any Trustee may resign; (b) any Trustee may be removed by written instrument, signed by at least two-thirds of the number of Trustees prior to such removal; (c) any Trustee who requests to be retired or who has become incapacitated by illness or injury may be retired by written instrument signed by a majority of the other Trustees; and (d) any Trustee may be removed at any special meeting of shareholders by a two-thirds vote of the outstanding voting securities of the trust. Each Trustee who is not an interested person (as defined in the 1940 Act) of the trust and the fund is referred to herein as an Independent Trustee. Each Independent Trustee shall retire not later than the last day of the calendar year in which his or her 75th birthday occurs. The Independent Trustees may waive this mandatory retirement age policy with respect to individual Trustees. Officers and Advisory Board Members hold office without limit in time, except that any officer or Advisory Board Member may resign or may be removed by a vote of a majority of the Trustees at any regular meeting or any special meeting of the Trustees. Except as indicated, each individual has held the office shown or other offices in the same company for the past five years.
The fund’s Statement of Additional Information (SAI) includes more information about the Trustees. To request a free copy, call Fidelity at 1-800-544-8544.
Experience, Skills, Attributes, and Qualifications of the Trustees. The Governance and Nominating Committee has adopted a statement of policy that describes the experience, qualifications, attributes, and skills that are necessary and desirable for potential Independent Trustee candidates (Statement of Policy). The Board believes that each Trustee satisfied at the time he or she was initially elected or appointed a Trustee, and continues to satisfy, the standards contemplated by the Statement of Policy. The Governance and Nominating Committee also engages professional search firms to help identify potential Independent Trustee candidates who have the experience, qualifications, attributes, and skills consistent with the Statement of Policy. From time to time, additional criteria based on the composition and skills of the current Independent Trustees, as well as experience or skills that may be appropriate in light of future changes to board composition, business conditions, and regulatory or other developments, have also been considered by the professional search firms and the Governance and Nominating Committee. In addition, the Board takes into account the Trustees' commitment and participation in Board and committee meetings, as well as their leadership of standing and ad hoc committees throughout their tenure.
In determining that a particular Trustee was and continues to be qualified to serve as a Trustee, the Board has considered a variety of criteria, none of which, in isolation, was controlling. The Board believes that, collectively, the Trustees have balanced and diverse experience, qualifications, attributes, and skills, which allow the Board to operate effectively in governing the fund and protecting the interests of shareholders. Information about the specific experience, skills, attributes, and qualifications of each Trustee, which in each case led to the Board's conclusion that the Trustee should serve (or continue to serve) as a trustee of the fund, is provided below.
Board Structure and Oversight Function. Robert A. Lawrence is an interested person and currently serves as Acting Chairman. The Trustees have determined that an interested Chairman is appropriate and benefits shareholders because an interested Chairman has a personal and professional stake in the quality and continuity of services provided to the fund. Independent Trustees exercise their informed business judgment to appoint an individual of their choosing to serve as Chairman, regardless of whether the Trustee happens to be independent or a member of management. The Independent Trustees have determined that they can act independently and effectively without having an Independent Trustee serve as Chairman and that a key structural component for assuring that they are in a position to do so is for the Independent Trustees to constitute a substantial majority for the Board. The Independent Trustees also regularly meet in executive session. David M. Thomas serves as Lead Independent Trustee and as such (i) acts as a liaison between the Independent Trustees and management with respect to matters important to the Independent Trustees and (ii) with management prepares agendas for Board meetings.
Fidelity® funds are overseen by different Boards of Trustees. The fund's Board oversees Fidelity's high income and certain equity funds, and other Boards oversee Fidelity's investment-grade bond, money market, asset allocation, and other equity funds. The asset allocation funds may invest in Fidelity® funds overseen by the fund's Board. The use of separate Boards, each with its own committee structure, allows the Trustees of each group of Fidelity® funds to focus on the unique issues of the funds they oversee, including common research, investment, and operational issues. On occasion, the separate Boards establish joint committees to address issues of overlapping consequences for the Fidelity® funds overseen by each Board.
The Trustees operate using a system of committees to facilitate the timely and efficient consideration of all matters of importance to the Trustees, the fund, and fund shareholders and to facilitate compliance with legal and regulatory requirements and oversight of the fund's activities and associated risks. The Board, acting through its committees, has charged FMR and its affiliates with (i) identifying events or circumstances the occurrence of which could have demonstrably adverse effects on the fund's business and/or reputation; (ii) implementing processes and controls to lessen the possibility that such events or circumstances occur or to mitigate the effects of such events or circumstances if they do occur; and (iii) creating and maintaining a system designed to evaluate continuously business and market conditions in order to facilitate the identification and implementation processes described in (i) and (ii) above. Because the day-to-day operations and activities of the fund are carried out by or through FMR, its affiliates, and other service providers, the fund's exposure to risks is mitigated but not eliminated by the processes overseen by the Trustees. While each of the Board's committees has responsibility for overseeing different aspects of the fund's activities, oversight is exercised primarily through the Operations, Audit, and Compliance Committees. Appropriate personnel, including but not limited to the fund's Chief Compliance Officer (CCO), FMR's internal auditor, the independent accountants, the fund's Treasurer and portfolio management personnel, make periodic reports to the Board's committees, as appropriate, including an annual review of Fidelity's risk management program for the Fidelity® funds. The responsibilities of each standing committee, including their oversight responsibilities, are described further under "Standing Committees of the Trustees."
Interested Trustees*:
Correspondence intended for a Trustee who is an interested person may be sent to Fidelity Investments, 245 Summer Street, Boston, Massachusetts 02210.
Name, Year of Birth; Principal Occupations and Other Relevant Experience+
Bettina Doulton (1964)
Year of Election or Appointment: 2020
Trustee
Ms. Doulton also serves as Trustee of other Fidelity® funds. Prior to her retirement, Ms. Doulton served in a variety of positions at Fidelity Investments, including as a managing director of research (2006-2007), portfolio manager to certain Fidelity® funds (1993-2005), equity analyst and portfolio assistant (1990-1993), and research assistant (1987-1990). Ms. Doulton currently owns and operates Phi Builders + Architects and Cellardoor Winery. Previously, Ms. Doulton served as a member of the Board of Brown Capital Management, LLC (2014-2018).
Robert A. Lawrence (1952)
Year of Election or Appointment: 2020
Trustee
Acting Chairman of the Board of Trustees
Mr. Lawrence also serves as Trustee of other funds. Previously, Mr. Lawrence served as a Member of the Advisory Board of certain funds. Prior to his retirement in 2008, Mr. Lawrence served as Vice President of certain Fidelity® funds (2006-2008), Senior Vice President, Head of High Income Division of Fidelity Management & Research Company (investment adviser firm, 2006-2008), and President of Fidelity Strategic Investments (investment adviser firm, 2002-2005).
* Determined to be an “Interested Trustee” by virtue of, among other things, his or her affiliation with the Fidelity Central Investment Portfolios LLC or various entities under common control with FMR.
+ The information includes the Trustee's principal occupation during the last five years and other information relating to the experience, attributes, and skills relevant to the Trustee's qualifications to serve as a Trustee, which led to the conclusion that the Trustee should serve as a Trustee for the fund.
Independent Trustees:
Correspondence intended for an Independent Trustee may be sent to Fidelity Investments, P.O. Box 55235, Boston, Massachusetts 02205-5235.
Name, Year of Birth; Principal Occupations and Other Relevant Experience+
Thomas P. Bostick (1956)
Year of Election or Appointment: 2021
Trustee
Lieutenant General Bostick also serves as Trustee of other Fidelity® funds. Prior to his retirement, General Bostick (United States Army, Retired) held a variety of positions within the U.S. Army, including Commanding General and Chief of Engineers, U.S. Army Corps of Engineers (2012-2016) and Deputy Chief of Staff and Director of Human Resources, U.S. Army (2009-2012). General Bostick currently serves as a member of the Board and Finance and Governance Committees of CSX Corporation (transportation, 2020-present) and a member of the Board and Corporate Governance and Nominating Committee of Perma-Fix Environmental Services, Inc. (nuclear waste management, 2020-present). General Bostick serves as Chief Executive Officer of Bostick Global Strategies, LLC (consulting, 2016-present) and Managing Partner, Sustainability, of Ridge-Lane Limited Partners (strategic advisory and venture development, 2016-present). Previously, General Bostick served as a Member of the Advisory Board of certain Fidelity® funds (2021), President, Intrexon Bioengineering (2018-2020) and Chief Operating Officer (2017-2020) and Senior Vice President of the Environment Sector (2016-2017) of Intrexon Corporation (biopharmaceutical company).
Dennis J. Dirks (1948)
Year of Election or Appointment: 2005
Trustee
Mr. Dirks also serves as Trustee of other Fidelity® funds. Prior to his retirement in May 2003, Mr. Dirks served as Chief Operating Officer and as a member of the Board of The Depository Trust & Clearing Corporation (financial markets infrastructure), President, Chief Operating Officer and a member of the Board of The Depository Trust Company (DTC), President and a member of the Board of the National Securities Clearing Corporation (NSCC), Chief Executive Officer and a member of the Board of the Government Securities Clearing Corporation and Chief Executive Officer and a member of the Board of the Mortgage-Backed Securities Clearing Corporation. Mr. Dirks currently serves as a member of the Finance Committee (2016-present) and Board (2017-present) and is Treasurer (2018-present) of the Asolo Repertory Theatre.
Donald F. Donahue (1950)
Year of Election or Appointment: 2018
Trustee
Mr. Donahue also serves as Trustee of other Fidelity® funds. Mr. Donahue serves as President and Chief Executive Officer of Miranda Partners, LLC (risk consulting for the financial services industry, 2012-present). Previously, Mr. Donahue served as Chief Executive Officer (2006-2012), Chief Operating Officer (2003-2006) and Managing Director, Customer Marketing and Development (1999-2003) of The Depository Trust & Clearing Corporation (financial markets infrastructure). Mr. Donahue currently serves as a member (2007-present) and Co-Chairman (2016-present) of the Board of United Way of New York and a member of the Board of NYC Leadership Academy (2012-present). Mr. Donahue previously served as a member of the Advisory Board of certain Fidelity® funds (2015-2018).
Vicki L. Fuller (1957)
Year of Election or Appointment: 2020
Trustee
Ms. Fuller also serves as Trustee of other Fidelity® funds. Previously, Ms. Fuller served as a member of the Advisory Board of certain Fidelity® funds (2018-2020), Chief Investment Officer of the New York State Common Retirement Fund (2012-2018) and held a variety of positions at AllianceBernstein L.P. (global asset management, 1985-2012), including Managing Director (2006-2012) and Senior Vice President and Senior Portfolio Manager (2001-2006). Ms. Fuller currently serves as a member of the Board, Audit Committee and Nominating and Governance Committee of The Williams Companies, Inc. (natural gas infrastructure, 2018-present), as a member of the Board, Audit Committee and Nominating and Governance Committee of two Blackstone business development companies (2020-present) and as a member of the Board of Treliant, LLC (consulting, 2019-present).
Patricia L. Kampling (1959)
Year of Election or Appointment: 2020
Trustee
Ms. Kampling also serves as Trustee of other Fidelity® funds. Prior to her retirement, Ms. Kampling served as Chairman of the Board and Chief Executive Officer (2012-2019), President and Chief Operating Officer (2011-2012) and Executive Vice President and Chief Financial Officer (2010-2011) of Alliant Energy Corporation. Ms. Kampling currently serves as a member of the Board, Finance Committee and Governance, Compensation and Nominating Committee of Xcel Energy Inc. (utilities company, 2020-present) and as a member of the Board, Audit, Finance and Risk Committee and Safety, Environmental, Technology and Operations Committee of American Water Works Company, Inc. (utilities company, 2019-present). In addition, Ms. Kampling currently serves as a member of the Board of the Nature Conservancy, Wisconsin Chapter (2019-present). Previously, Ms. Kampling served as a Member of the Advisory Board of certain Fidelity® funds (2020), a member of the Board, Compensation Committee and Executive Committee and Chair of the Audit Committee of Briggs & Stratton Corporation (manufacturing, 2011-2021), a member of the Board of Interstate Power and Light Company (2012-2019) and Wisconsin Power and Light Company (2012-2019) (each a subsidiary of Alliant Energy Corporation) and as a member of the Board and Workforce Development Committee of the Business Roundtable (2018-2019).
Thomas A. Kennedy (1955)
Year of Election or Appointment: 2021
Trustee
Mr. Kennedy also serves as Trustee of other Fidelity® funds. Previously, Mr. Kennedy served as a Member of the Advisory Board of certain Fidelity® funds (2020) and held a variety of positions at Raytheon Company (aerospace and defense, 1983-2020), including Chairman and Chief Executive Officer (2014-2020) and Executive Vice President and Chief Operating Officer (2013-2014). Mr. Kennedy currently serves as Executive Chairman of the Board of Directors of Raytheon Technologies Corporation (aerospace and defense, 2020-present). He is also a member of the Rutgers School of Engineering Industry Advisory Board (2011-present) and a member of the UCLA Engineering Dean’s Executive Board (2016-present).
Oscar Munoz (1959)
Year of Election or Appointment: 2021
Trustee
Mr. Munoz also serves as Trustee of other Fidelity® funds. Prior to his retirement, Mr. Munoz served as Executive Chairman (2020-2021), Chief Executive Officer (2015-2020), President (2015-2016) and a member of the Board (2010-2021) of United Airlines Holdings, Inc. Mr. Munoz currently serves as a member of the Board of CBRE Group, Inc. (commercial real estate, 2020-present), a member of the Board of Univision Communications, Inc. (Hispanic media, 2020-present) and a member of the Advisory Board of Salesforce.com, Inc. (cloud-based software, 2020-present). Previously, Mr. Munoz served as a Member of the Advisory Board of certain Fidelity® funds (2021).
Garnett A. Smith (1947)
Year of Election or Appointment: 2018
Trustee
Mr. Smith also serves as Trustee of other Fidelity® funds. Prior to his retirement, Mr. Smith served as Chairman and Chief Executive Officer (1990-1997) and President (1986-1990) of Inbrand Corp. (manufacturer of personal absorbent products). Prior to his employment with Inbrand Corp., he was employed by a retail fabric chain and North Carolina National Bank (now Bank of America). Mr. Smith previously served as a member of the Advisory Board of certain Fidelity® funds (2012-2013).
David M. Thomas (1949)
Year of Election or Appointment: 2008
Trustee
Lead Independent Trustee
Mr. Thomas also serves as Trustee of other Fidelity® funds. Previously, Mr. Thomas served as Executive Chairman (2005-2006) and Chairman and Chief Executive Officer (2000-2005) of IMS Health, Inc. (pharmaceutical and healthcare information solutions). Mr. Thomas currently serves as a member of the Board of Fortune Brands Home and Security (home and security products, 2004-present) and Presiding Director (2013-present) of Interpublic Group of Companies, Inc. (marketing communication).
Susan Tomasky (1953)
Year of Election or Appointment: 2020
Trustee
Ms. Tomasky also serves as Trustee of other Fidelity® funds. Prior to her retirement, Ms. Tomasky served in various executive officer positions at American Electric Power Company, Inc. (1998-2011), including most recently as President of AEP Transmission (2007-2011). Ms. Tomasky currently serves as a member of the Board and Sustainability Committee and as Chair of the Audit Committee of Marathon Petroleum Corporation (2018-present) and as a member of the Board, Corporate Governance Committee and Organization and Compensation Committee and as Chair of the Audit Committee of Public Service Enterprise Group, Inc. (utilities company, 2012-present). In addition, Ms. Tomasky currently serves as a member (2009-present) and President (2020-present) of the Board of the Royal Shakespeare Company – America (2009-present), as a member of the Board of the Columbus Association for the Performing Arts (2011-present) and as a member of the Board and Investment Committee of Kenyon College (2016-present). Previously, Ms. Tomasky served as a Member of the Advisory Board of certain Fidelity® funds (2020), as a member of the Board of the Columbus Regional Airport Authority (2007-2020), as a member of the Board (2011-2018) and Lead Independent Director (2015-2018) of Andeavor Corporation (previously Tesoro Corporation) (independent oil refiner and marketer) and as a member of the Board of Summit Midstream Partners LP (energy, 2012-2018).
Michael E. Wiley (1950)
Year of Election or Appointment: 2018
Trustee
Mr. Wiley also serves as Trustee of other Fidelity® funds. Previously, Mr. Wiley served as a member of the Advisory Board of certain Fidelity® funds (2018-2020), Chairman, President and CEO of Baker Hughes, Inc. (oilfield services, 2000-2004). Mr. Wiley also previously served as a member of the Board of Andeavor Corporation (independent oil refiner and marketer, 2005-2018), a member of the Board of Andeavor Logistics LP (natural resources logistics, 2015-2018) and a member of the Board of High Point Resources (exploration and production, 2005-2020).
+ The information includes the Trustee's principal occupation during the last five years and other information relating to the experience, attributes, and skills relevant to the Trustee's qualifications to serve as a Trustee, which led to the conclusion that the Trustee should serve as a Trustee for the fund.
Advisory Board Members and Officers:
Correspondence intended for a Member of the Advisory Board (if any) may be sent to Fidelity Investments, P.O. Box 55235, Boston, Massachusetts 02205-5235. Correspondence intended for an officer or Peter S. Lynch may be sent to Fidelity Investments, 245 Summer Street, Boston, Massachusetts 02210. Officers appear below in alphabetical order.
Name, Year of Birth; Principal Occupation
Peter S. Lynch (1944)
Year of Election or Appointment: 2004
Member of the Advisory Board
Mr. Lynch also serves as a Member of the Advisory Board of other Fidelity® funds. Mr. Lynch is Vice Chairman and a Director of Fidelity Management & Research Company LLC (investment adviser firm). In addition, Mr. Lynch serves as a Trustee of Boston College and as the Chairman of the Inner-City Scholarship Fund. Previously, Mr. Lynch served as Vice Chairman and a Director of FMR Co., Inc. (investment adviser firm) and on the Special Olympics International Board of Directors (1997-2006).
Craig S. Brown (1977)
Year of Election or Appointment: 2019
Assistant Treasurer
Mr. Brown also serves as an officer of other funds. Mr. Brown serves as Assistant Treasurer of FIMM, LLC (2021-present) and is an employee of Fidelity Investments (2013-present).
John J. Burke III (1964)
Year of Election or Appointment: 2018
Chief Financial Officer
Mr. Burke also serves as Chief Financial Officer of other funds. Mr. Burke serves as Head of Investment Operations for Fidelity Fund and Investment Operations (2018-present) and is an employee of Fidelity Investments (1998-present). Previously Mr. Burke served as head of Asset Management Investment Operations (2012-2018).
William C. Coffey (1969)
Year of Election or Appointment: 2019
Assistant Secretary
Mr. Coffey also serves as Assistant Secretary of other funds. He is Senior Vice President and Deputy General Counsel of FMR LLC (diversified financial services company, 2010-present), and is an employee of Fidelity Investments. Previously, Mr. Coffey served as Secretary and CLO of certain funds (2018-2019); CLO, Secretary, and Senior Vice President of Fidelity Management & Research Company and FMR Co., Inc. (investment adviser firms, 2018-2019); Secretary of Fidelity SelectCo, LLC and Fidelity Investments Money Management, Inc. (investment adviser firms, 2018-2019); CLO of Fidelity Management & Research (Hong Kong) Limited, FMR Investment Management (UK) Limited, and Fidelity Management & Research (Japan) Limited (investment adviser firms, 2018-2019); and Assistant Secretary of certain funds (2009-2018).
Timothy M. Cohen (1969)
Year of Election or Appointment: 2018
Vice President
Mr. Cohen also serves as Vice President of other funds. Mr. Cohen serves as Co-Head of Equity (2018-present), a Director of Fidelity Management & Research (Japan) Limited (investment adviser firm, 2016-present), and is an employee of Fidelity Investments. Previously, Mr. Cohen served as Executive Vice President of Fidelity SelectCo, LLC (2019), Head of Global Equity Research (2016-2018), Chief Investment Officer - Equity and a Director of Fidelity Management & Research (U.K.) Inc. (investment adviser firm, 2013-2015) and as a Director of Fidelity Management & Research (Hong Kong) Limited (investment adviser firm, 2017).
Jonathan Davis (1968)
Year of Election or Appointment: 2010
Assistant Treasurer
Mr. Davis also serves as an officer of other funds. Mr. Davis serves as Assistant Treasurer of FIMM, LLC (2021-present), FMR Capital, Inc. (2017-present), FD Funds GP LLC (2021-present), FD Funds Holding LLC (2021-present), and FD Funds Management LLC (2021-present); and is an employee of Fidelity Investments. Previously, Mr. Davis served as Vice President and Associate General Counsel of FMR LLC (diversified financial services company, 2003-2010).
Laura M. Del Prato (1964)
Year of Election or Appointment: 2018
Assistant Treasurer
Ms. Del Prato also serves as an officer of other funds. Ms. Del Prato serves as Assistant Treasurer of FIMM, LLC (2021-present) and is an employee of Fidelity Investments (2017-present). Previously, Ms. Del Prato served as President and Treasurer of The North Carolina Capital Management Trust: Cash Portfolio and Term Portfolio (2018-2020). Prior to joining Fidelity Investments, Ms. Del Prato served as a Managing Director and Treasurer of the JPMorgan Mutual Funds (2014-2017). Prior to JPMorgan, Ms. Del Prato served as a partner at Cohen Fund Audit Services (accounting firm, 2012-2013) and KPMG LLP (accounting firm, 2004-2012).
Colm A. Hogan (1973)
Year of Election or Appointment: 2020
Assistant Treasurer
Mr. Hogan also serves as an officer of other funds. Mr. Hogan serves as Assistant Treasurer of FIMM, LLC (2021-present) and FMR Capital, Inc. (2017-present) and is an employee of Fidelity Investments (2005-present). Previously, Mr. Hogan served as Deputy Treasurer of certain Fidelity® funds (2016-2020) and Assistant Treasurer of certain Fidelity® funds (2016-2018).
Pamela R. Holding (1964)
Year of Election or Appointment: 2018
Vice President
Ms. Holding also serves as Vice President of other funds. Ms. Holding serves as Co-Head of Equity (2018-present) and is an employee of Fidelity Investments (2013-present). Previously, Ms. Holding served as Executive Vice President of Fidelity SelectCo, LLC (2019) and as Chief Investment Officer of Fidelity Institutional Asset Management (2013-2018).
Cynthia Lo Bessette (1969)
Year of Election or Appointment: 2019
Secretary and Chief Legal Officer (CLO)
Ms. Lo Bessette also serves as an officer of other funds. Ms. Lo Bessette serves as CLO, Secretary, and Senior Vice President of Fidelity Management & Research Company LLC (investment adviser firm, 2019-present); CLO of Fidelity Management & Research (Hong Kong) Limited, FMR Investment Management (UK) Limited, and Fidelity Management & Research (Japan) Limited (investment adviser firms, 2019-present); Secretary of FD Funds GP LLC (2021-present), FD Funds Holding LLC (2021-present), and FD Funds Management LLC (2021-present); and Assistant Secretary of FIMM, LLC (2019-present). She is a Senior Vice President and Deputy General Counsel of FMR LLC (diversified financial services company, 2019-present), and is an employee of Fidelity Investments. Previously, Ms. Lo Bessette served as CLO, Secretary, and Senior Vice President of FMR Co., Inc. (investment adviser firm, 2019); Secretary of Fidelity SelectCo, LLC and Fidelity Investments Money Management, Inc. (investment adviser firms, 2019). Prior to joining Fidelity Investments, Ms. Lo Bessette was Executive Vice President, General Counsel (2016-2019) and Senior Vice President, Deputy General Counsel (2015-2016) of OppenheimerFunds (investment management company) and Deputy Chief Legal Officer (2013-2015) of Jennison Associates LLC (investment adviser firm).
Chris Maher (1972)
Year of Election or Appointment: 2020
Deputy Treasurer
Mr. Maher also serves as an officer of other funds. Mr. Maher serves as Assistant Treasurer of FIMM, LLC (2021-present) and FMR Capital, Inc. (2017-present), and is an employee of Fidelity Investments (2008-present). Previously, Mr. Maher served as Assistant Treasurer of certain funds (2013-2020); Vice President of Asset Management Compliance (2013), Vice President of the Program Management Group of FMR (investment adviser firm, 2010-2013), and Vice President of Valuation Oversight (2008-2010).
Jason P. Pogorelec (1975)
Year of Election or Appointment: 2020
Chief Compliance Officer
Mr. Pogorelec also serves as Chief Compliance Officer of other funds. Mr. Pogorelec is a senior Vice President of Asset Management Compliance for Fidelity Investments and is an employee of Fidelity Investments (2006-present). Previously, Mr. Pogorelec served as Vice President, Associate General Counsel for Fidelity Investments (2010-2020) and Assistant Secretary of certain Fidelity funds (2015-2020).
Brett Segaloff (1972)
Year of Election or Appointment: 2021
Anti-Money Laundering (AML) Officer
Mr. Segaloff also serves as an AML Officer of other funds and other related entities. He is Director, Anti-Money Laundering (2007-present) of FMR LLC (diversified financial services company) and is an employee of Fidelity Investments (1996-present).
Stacie M. Smith (1974)
Year of Election or Appointment: 2016
President and Treasurer
Ms. Smith also serves as an officer of other funds. Ms. Smith serves as Assistant Treasurer of FIMM, LLC (2021-present) and FMR Capital, Inc. (2017-present), is an employee of Fidelity Investments (2009-present), and has served in other fund officer roles. Prior to joining Fidelity Investments, Ms. Smith served as Senior Audit Manager of Ernst & Young LLP (accounting firm, 1996-2009). Previously, Ms. Smith served as Assistant Treasurer (2013-2019) and Deputy Treasurer (2013-2016) of certain Fidelity® funds.
Jim Wegmann (1979)
Year of Election or Appointment: 2019
Assistant Treasurer
Mr. Wegmann also serves as an officer of other funds. Mr. Wegmann serves as Assistant Treasurer of FIMM, LLC (2021-present) and is an employee of Fidelity Investments (2011-present).
Shareholder Expense Example
As a shareholder, you incur two types of costs: (1) transaction costs, which may include sales charges (loads) on purchase payments or redemption proceeds, as applicable and (2) ongoing costs, which generally include management fees, distribution and/or service (12b-1) fees and other Fund expenses. This Example is intended to help you understand your ongoing costs (in dollars) of investing in a fund and to compare these costs with the ongoing costs of investing in other mutual funds.
The Example is based on an investment of $1,000 invested at the beginning of the period and held for the entire period (April 1, 2021 to September 30, 2021).
Actual Expenses
The first line of the accompanying table provides information about actual account values and actual expenses. You may use the information in this line, together with the amount you invested, to estimate the expenses that you paid over the period. Simply divide your account value by $1,000.00 (for example, an $8,600 account value divided by $1,000.00 = 8.6), then multiply the result by the number in the first line for a class/Fund under the heading entitled "Expenses Paid During Period" to estimate the expenses you paid on your account during this period. If any fund is a shareholder of any underlying mutual funds or exchange-traded funds (ETFs) (the Underlying Funds), such fund indirectly bears its proportional share of the expenses of the Underlying Funds in addition to the direct expenses incurred presented in the table. These fees and expenses are not included in the annualized expense ratio used to calculate the expense estimate in the table below.
Hypothetical Example for Comparison Purposes
The second line of the accompanying table provides information about hypothetical account values and hypothetical expenses based on the actual expense ratio and an assumed rate of return of 5% per year before expenses, which is not the actual return. The hypothetical account values and expenses may not be used to estimate the actual ending account balance or expenses you paid for the period. You may use this information to compare the ongoing costs of investing in the Fund and other funds. To do so, compare this 5% hypothetical example with the 5% hypothetical examples that appear in the shareholder reports of the other funds. If any fund is a shareholder of any Underlying Funds, such fund indirectly bears its proportional share of the expenses of the Underlying Funds in addition to the direct expenses as presented in the table. These fees and expenses are not included in the annualized expense ratio used to calculate the expense estimate in the table below.
Please note that the expenses shown in the table are meant to highlight your ongoing costs only and do not reflect any transaction costs. Therefore, the second line of the table is useful in comparing ongoing costs only, and will not help you determine the relative total costs of owning different funds.
| Annualized Expense Ratio-A | Beginning Account Value April 1, 2021 | Ending Account Value September 30, 2021 | Expenses Paid During Period-B April 1, 2021 to September 30, 2021 | |
| Fidelity Floating Rate Central Fund | .0007% | |||
| Actual | $1,000.00 | $1,029.50 | $--C | |
| Hypothetical-D | $1,000.00 | $1,025.06 | $--C |
A Annualized expense ratio reflects expenses net of applicable fee waivers.
B Expenses are equal to the annualized expense ratio, multiplied by the average account value over the period, multiplied by 183/ 365 (to reflect the one-half year period). The fees and expenses of any Underlying Funds are not included in each annualized expense ratio.
C Amount represents less than $.005.
D 5% return per year before expenses
Distributions (Unaudited)
A total of 0.05% of the dividends distributed during the fiscal year was derived from interest on U.S. Government securities which is generally exempt from state income tax.
The fund designates $79,340,080 of distributions paid during the calendar year 2020 as qualifying to be taxed as interest-related dividends for nonresident alien shareholders.
The fund designates $87,582,825 of distributions paid in the calendar year 2020 as qualifying to be taxed as section 163(j) interest dividends.
The fund will notify shareholders in January 2022 of amounts for use in preparing 2021 income tax returns.
Board Approval of Investment Advisory Contracts and Management Fees
Fidelity Floating Rate Central Fund
Each year, the Board of Directors, including the Independent Directors (together, the Board), votes on the renewal of the management contract with Fidelity Management & Research Company LLC (FMR) and the sub-advisory agreements (together, the Advisory Contracts) for the fund. FMR and the sub-advisers are referred to herein as the Investment Advisers. The Board, assisted by the advice of fund counsel and Independent Directors' counsel, requests and considers a broad range of information relevant to the renewal of the Advisory Contracts throughout the year.The Board meets regularly and, at each of its meetings, covers an extensive agenda of topics and materials and considers factors that are relevant to its annual consideration of the renewal of the fund's Advisory Contracts, including the services and support provided to the fund and its shareholders. The Board has established various standing committees (Committees), each composed of and chaired by Independent Directors with varying backgrounds, to which the Board has assigned specific subject matter responsibilities in order to enhance effective decision-making by the Board. The Board, acting directly and through its Committees, requests and receives information concerning the annual consideration of the renewal of the fund's Advisory Contracts. The Board also meets as needed to review matters specifically related to the Board's annual consideration of the renewal of the Advisory Contracts. Members of the Board may also meet with trustees of other Fidelity funds through joint ad hoc committees to discuss certain matters relevant to all of the Fidelity funds.At its May 2021 meeting, the Board unanimously determined to renew the fund's Advisory Contracts. In reaching its determination, the Board considered all factors it believed relevant and reached a determination, with the assistance of fund counsel and Independent Directors' counsel and through the exercise of its business judgment, that the renewal of the Advisory Contracts was in the best interests of the fund and its shareholders and the fact that no fee is payable under the management contract was fair and reasonable.Nature, Extent, and Quality of Services Provided. The Board considered Fidelity's staffing as it relates to the fund, including the backgrounds of investment personnel of Fidelity, and also considered the fund's investment objective, strategies, and related investment philosophy. The Independent Directors also had discussions with senior management of Fidelity's investment operations and investment groups. The Board considered the structure of the investment personnel compensation program and whether this structure provides appropriate incentives to act in the best interests of the fund.Resources Dedicated to Investment Management and Support Services. The Board and the Fund Oversight and Research Committees reviewed the general qualifications and capabilities of Fidelity's investment staff, including its size, education, experience, and resources, as well as Fidelity's approach to recruiting, training, managing, and compensating investment personnel. The Board noted that Fidelity has continued to increase the resources devoted to non-U.S. offices, including expansion of Fidelity's global investment organization. The Board also noted that Fidelity's analysts have extensive resources, tools and capabilities that allow them to conduct sophisticated quantitative and fundamental analysis, as well as credit analysis of issuers, counterparties and guarantors. Further, the Board considered that Fidelity's investment professionals have sufficient access to global information and data so as to provide competitive investment results over time, and that those professionals also have access to sophisticated tools that permit them to assess portfolio construction and risk and performance attribution characteristics continuously, as well as to transmit new information and research conclusions rapidly around the world. Additionally, in its deliberations, the Board considered Fidelity's trading, risk management, compliance, and technology and operations capabilities and resources, which are integral parts of the investment management process. The Board also considered Fidelity's investments in business continuity planning, and its success in continuously providing services to the fund notwithstanding the severe disruptions caused by the COVID-19 pandemic.Administrative Services. The Board considered (i) the nature, extent, quality, and cost of advisory and administrative services performed by the Investment Advisers and their affiliates under the Advisory Contracts and under separate agreements covering transfer agency, pricing and bookkeeping, and securities lending services for the fund; (ii) the nature and extent of the supervision of third party service providers, principally custodians, subcustodians, and pricing vendors; and (iii) the resources devoted to, and the record of compliance with, the fund's compliance policies and procedures. The Board also reviewed the allocation of fund brokerage, including allocations to brokers affiliated with the Investment Advisers, and the use of "soft" commission dollars to pay for research services.Investment Performance. The Board considered whether the fund has operated in accordance with its investment objective, as well as its record of compliance with its investment restrictions. The Board reviewed the fund's absolute investment performance, as well as the fund's relative investment performance, but did not consider performance to be a material factor in its decision to renew the fund's Advisory Contracts, as the fund is not publicly offered as a stand-alone investment product. In this regard, the Board noted that the fund is designed to offer a liquid investment option for other investment companies managed by Fidelity and ultimately to enhance the performance of those investment companies.Based on its review, the Board concluded that the nature, extent, and quality of services provided to the fund under the Advisory Contracts should continue to benefit the shareholders of the fund.Competitiveness of Management Fee and Total Expense Ratio. The Board considered that while the fund does not pay a management fee, FMR receives fees for providing services to funds that invest in the fund. The Board also noted that FMR bears all expenses of the fund with certain limited exceptions (i.e., custody fees, interest, taxes, fees and expenses of the Independent Trustees, proxy and shareholder meeting expenses, and extraordinary expenses). The Board further noted that the fund pays its non-operating expenses, including brokerage commissions and fees and expenses associated with the fund's securities lending program, if applicable. Based on its review, the Board concluded that the management fee received for providing services to the fund and the fund's total expense ratio were reasonable in light of the services that the fund and its shareholders receive and the other factors considered.Costs of the Services and Profitability. The Board considered the level of Fidelity's profits in respect of all the Fidelity funds, as well as the profitability of the funds that invest in the fund.A public accounting firm has been engaged annually by the Board as part of the Board's assessment of Fidelity's profitability analysis. The engagement includes the review and assessment of the methodologies used by Fidelity in determining the revenues and expenses attributable to Fidelity's mutual fund business, and completion of agreed-upon procedures in respect of the mathematical accuracy of certain fund profitability information and its conformity to established allocation methodologies. After considering the reports issued under the engagement and information provided by Fidelity, the Board concluded that while other allocation methods may also be reasonable, Fidelity's profitability methodologies are reasonable in all material respects.The Board also reviewed Fidelity's non-fund businesses and potential indirect benefits such businesses may have received as a result of their association with Fidelity's mutual fund business (i.e., fall-out benefits) as well as cases where Fidelity's affiliates may benefit from the funds' business. The Board considered areas where potential indirect benefits to the Fidelity funds from their relationships with Fidelity may exist. The Board also considered that in 2019 a joint ad hoc committee created by it and the boards of other Fidelity funds evaluated potential fall-out benefits (PFOB Committee). The Board noted that it considered the PFOB Committee's findings in connection with its consideration of the renewal of the Advisory Contracts.The Board concluded that the costs of the services provided by and the profits realized by Fidelity in connection with the operation of the fund were not relevant to the renewal of the Advisory Contracts because the fund pays no advisory fees and FMR bears all expenses of the fund with certain exceptions.Economies of Scale. The Board concluded that because the fund pays no advisory fees and FMR bears all expenses of the fund with certain exceptions, the realization of economies of scale was not a material factor in the Board's decision to renew the fund's Advisory Contract.Additional Information Requested by the Board. In order to develop fully the factual basis for consideration of the Fidelity funds' advisory contracts, the Board requested and received additional information on certain topics, including: (i) fund flow and performance trends, in particular the underperformance of certain funds and strategies, and Fidelity's long-term strategies for certain funds; (ii) consideration of expanding the use of performance fees for additional funds; (iii) Fidelity's pricing philosophy compared to competitors; (iv) metrics for evaluating index fund and ETF performance and information about ETF trading characteristics; (v) the methodology with respect to evaluating competitive fund data and peer group classifications and fee and expense comparisons; (vi) the expense structures for different funds and classes and information about the differences between various expense structures; (vii) group fee breakpoints; (viii) information regarding other accounts managed by Fidelity and sub-advisory arrangements; and (ix) Fidelity's philosophies and strategies for evaluating funds and classes with lower or declining asset levels.Based on its evaluation of all of the conclusions noted above, and after considering all factors it believed relevant, the Board concluded that the advisory fee arrangements are fair and reasonable, and that the fund's Advisory Contracts should be renewed.![]()
FR1-ANN-1121
1.814672.116
Fidelity® International Equity Central Fund
September 30, 2021
Contents
Board Approval of Investment Advisory Contracts and Management Fees |
To view a fund's proxy voting guidelines and proxy voting record for the 12-month period ended June 30, visit http://www.fidelity.com/proxyvotingresults or visit the Securities and Exchange Commission's (SEC) web site at http://www.sec.gov.
You may also call 1-800-544-8544 to request a free copy of the proxy voting guidelines.
Standard & Poor's, S&P and S&P 500 are registered service marks of The McGraw-Hill Companies, Inc. and have been licensed for use by Fidelity Distributors Corporation.
Other third-party marks appearing herein are the property of their respective owners.
All other marks appearing herein are registered or unregistered trademarks or service marks of FMR LLC or an affiliated company. © 2021 FMR LLC. All rights reserved.
A fund files its complete schedule of portfolio holdings with the SEC for the first and third quarters of each fiscal year on Form N-PORT. Forms N-PORT are available on the SEC’s web site at http://www.sec.gov. A fund's Forms N-PORT may be reviewed and copied at the SEC’s Public Reference Room in Washington, DC. Information regarding the operation of the SEC's Public Reference Room may be obtained by calling 1-800-SEC-0330.
Note to Shareholders:
Early in 2020, the outbreak and spread of COVID-19 emerged as a public health emergency that had a major influence on financial markets, primarily based on its impact on the global economy and corporate earnings. On March 11, 2020, the World Health Organization declared the COVID-19 outbreak a pandemic, citing sustained risk of further global spread. The pandemic prompted a number of measures to limit the spread of COVID-19, including travel and border restrictions, quarantines, and restrictions on large gatherings. In turn, these resulted in lower consumer activity, diminished demand for a wide range of products and services, disruption in manufacturing and supply chains, and – given the wide variability in outcomes regarding the outbreak – significant market uncertainty and volatility. To help stem the turmoil, the U.S. government took unprecedented action – in concert with the U.S. Federal Reserve and central banks around the world – to help support consumers, businesses, and the broader economy, and to limit disruption to the financial system.
In general, the overall impact of the pandemic lessened in 2021, amid a resilient economy and widespread distribution of three COVID-19 vaccines granted emergency use authorization from the U.S. Food and Drug Administration (FDA) early in the year. Still, the situation remains dynamic, and the extent and duration of its influence on financial markets and the economy is highly uncertain, due in part to a recent spike in cases based on highly contagious variants of the coronavirus.
Extreme events such as the COVID-19 crisis are exogenous shocks that can have significant adverse effects on mutual funds and their investments. Although multiple asset classes may be affected by market disruption, the duration and impact may not be the same for all types of assets. Fidelity is committed to helping you stay informed amid news about COVID-19 and during increased market volatility, and we continue to take extra steps to be responsive to customer needs. We encourage you to visit us online, where we offer ongoing updates, commentary, and analysis on the markets and our funds.
Performance: The Bottom Line
Average annual total return reflects the change in the value of an investment, assuming reinvestment of distributions from dividend income and capital gains (the profits earned upon the sale of securities that have grown in value, if any) and assuming a constant rate of performance each year. The hypothetical investment and the average annual total returns do not reflect the deduction of taxes that a shareholder would pay on fund distributions or the redemption of fund shares. During periods of reimbursement by Fidelity, a fund’s total return will be greater than it would be had the reimbursement not occurred. How a fund did yesterday is no guarantee of how it will do tomorrow.
Average Annual Total Returns
| For the periods ended September 30, 2021 | Past 1 year | Past 5 years | Past 10 years |
| Fidelity® International Equity Central Fund | 28.42% | 11.69% | 9.96% |
$10,000 Over 10 Years
Let's say hypothetically that $10,000 was invested in Fidelity® International Equity Central Fund on September 30, 2011.
The chart shows how the value of your investment would have changed, and also shows how the MSCI World ex USA Index performed over the same period.

| Period Ending Values | ||
| $25,832 | Fidelity® International Equity Central Fund | |
| $21,749 | MSCI World ex USA Index | |
Management's Discussion of Fund Performance
Market Recap: The MSCI ACWI (All Country World Index) ex USA Index gained 24.10% for the 12 months ending September 30, 2021, with international equities rising amid an improved outlook for global economic growth, widespread COVID-19 vaccination, fiscal stimulus in the U.S. and abroad, and government spending programs. As 2021 began, investors saw reasons to be hopeful. The index recorded steady monthly gains as part of the economic “reopening” trade, as investors generally moved out of tech-driven mega-caps that had thrived due to the work-from-home trend in favor of cheap smaller companies they believed stood to benefit from a broad cyclical recovery. However, in early September, sentiment turned broadly negative due to inflationary pressure from surging energy/other commodity prices, rising bond yields, supply constraints and disruption, valuation concerns, and the fast-spreading delta variant of the coronavirus. Overall, foreign exchange had a material impact on market performance, with the U.S. dollar broadly weakening versus developed-market currencies (positive) and strengthening versus emerging markets (negative). By region, Canada (+35%) led, followed by the U.K. (+31%). Conversely, emerging markets (+19%) and Japan (+22%) lagged most. By sector, energy (+57%) fared best by a wide margin. Financials (+43%) and information technology (+37%) also stood out. In contrast, communication services, consumer staples and consumer discretionary (+10% each) notably trailed the index.Comments from Co-Managers Adarsh Bala, Ashley Fernandes and James Hancock: For the fiscal year ending September 30, 2021, the fund returned 28.42%, topping the 26.76% advance of the MSCI World ex USA (Linked 10/1/2015) Index, as well as the broad-based MSCI World ex US (Net MA) Index. Stock picks in Japan, Europe outside of the U.K., and the Asia Pacific region added value. Conversely, selections in the U.K. detracted. By sector, choices in industrials, health care and information technology helped the fund’s relative result, whereas choices in financials hurt. Looking at individual stocks, owning chip equipment company ASML Holding, which gained about 104% for the 12 months, contributed more than any other individual position. It also helped to avoid biotech company Novartis, and overweight Belgium-based bank KBC Groupe (+81%). On the other hand, the fund’s non-benchmark stake in internet retailer Alibaba Group Holding (-32%) detracted, as did overweighting in London Stock Exchange Group (-11%). We sold Alibaba Group Holding from the fund and reduced the London Stock Exchange Group position by September 30. Notable changes in positioning for the 12 months included a higher allocation to positions in the Netherlands and France. By sector, meaningful changes included reducing the fund’s exposure to consumer staples increasing our allocation to industrials.The views expressed above reflect those of the portfolio manager(s) only through the end of the period as stated on the cover of this report and do not necessarily represent the views of Fidelity or any other person in the Fidelity organization. Any such views are subject to change at any time based upon market or other conditions and Fidelity disclaims any responsibility to update such views. These views may not be relied on as investment advice and, because investment decisions for a Fidelity fund are based on numerous factors, may not be relied on as an indication of trading intent on behalf of any Fidelity fund.
Notes to shareholders: On October 1, 2020, Niamh Brodie Machura came off of the fund. On June 23, 2021, Katharine O'Donovan assumed co-management responsibilities for the fund.Investment Summary (Unaudited)
Geographic Diversification (% of fund's net assets)
| As of September 30, 2021 | ||
| Japan | 17.2% | |
| United Kingdom | 12.1% | |
| France | 11.3% | |
| Germany | 9.1% | |
| Switzerland | 8.6% | |
| Netherlands | 8.5% | |
| United States of America* | 5.6% | |
| Canada | 5.2% | |
| Sweden | 4.2% | |
| Other | 18.2% | |

* Includes Short-Term investments and Net Other Assets (Liabilities).
Percentages are based on country or territory of incorporation and are adjusted for the effect of futures contracts, if applicable.
Asset Allocation as of September 30, 2021
| % of fund's net assets | |
| Stocks and Equity Futures | 98.0 |
| Short-Term Investments and Net Other Assets (Liabilities) | 2.0 |
Top Ten Stocks as of September 30, 2021
| % of fund's net assets | |
| ASML Holding NV (Netherlands) (Netherlands, Semiconductors & Semiconductor Equipment) | 2.4 |
| Nestle SA (Reg. S) (Switzerland, Food Products) | 2.4 |
| Roche Holding AG (participation certificate) (Switzerland, Pharmaceuticals) | 2.0 |
| LVMH Moet Hennessy Louis Vuitton SE (France, Textiles, Apparel & Luxury Goods) | 2.0 |
| Hoya Corp. (Japan, Health Care Equipment & Supplies) | 1.5 |
| Sony Group Corp. (Japan, Household Durables) | 1.5 |
| Diageo PLC (United Kingdom, Beverages) | 1.3 |
| AIA Group Ltd. (Hong Kong, Insurance) | 1.2 |
| Recruit Holdings Co. Ltd. (Japan, Professional Services) | 1.2 |
| RELX PLC (London Stock Exchange) (United Kingdom, Professional Services) | 1.1 |
| 16.6 |
Top Market Sectors as of September 30, 2021
| % of fund's net assets | |
| Industrials | 19.5 |
| Financials | 18.5 |
| Information Technology | 13.8 |
| Health Care | 12.2 |
| Consumer Discretionary | 10.3 |
| Consumer Staples | 7.7 |
| Materials | 6.4 |
| Communication Services | 3.2 |
| Energy | 2.5 |
| Utilities | 1.9 |
Schedule of Investments September 30, 2021
Showing Percentage of Net Assets
| Common Stocks - 97.4% | |||
| Shares | Value | ||
| Australia - 1.1% | |||
| Arena (REIT) unit | 2,130,901 | $6,452,929 | |
| Commonwealth Bank of Australia | 148,150 | 10,994,264 | |
| CSL Ltd. | 20,003 | 4,179,252 | |
| Lynas Rare Earths Ltd. (a) | 598,760 | 2,833,418 | |
| National Australia Bank Ltd. | 660,074 | 13,017,340 | |
| Treasury Wine Estates Ltd. | 280,262 | 2,471,346 | |
| Whitehaven Coal Ltd. (a) | 582,196 | 1,332,687 | |
| TOTAL AUSTRALIA | 41,281,236 | ||
| Austria - 0.3% | |||
| Erste Group Bank AG | 207,700 | 9,119,944 | |
| Verbund AG | 19,060 | 1,927,631 | |
| TOTAL AUSTRIA | 11,047,575 | ||
| Bailiwick of Jersey - 0.9% | |||
| Ferguson PLC | 220,879 | 30,662,841 | |
| WPP PLC | 268,140 | 3,592,424 | |
| TOTAL BAILIWICK OF JERSEY | 34,255,265 | ||
| Belgium - 1.5% | |||
| Anheuser-Busch InBev SA NV | 106,800 | 6,057,420 | |
| Azelis Group NV | 181,600 | 5,693,085 | |
| KBC Groep NV | 381,785 | 34,438,735 | |
| Kinepolis Group NV (a) | 30,190 | 1,959,880 | |
| UCB SA | 72,200 | 8,084,760 | |
| TOTAL BELGIUM | 56,233,880 | ||
| Bermuda - 1.1% | |||
| Genpact Ltd. | 226,200 | 10,746,762 | |
| Hiscox Ltd. (a) | 1,047,637 | 11,809,394 | |
| IHS Markit Ltd. | 171,400 | 19,988,668 | |
| TOTAL BERMUDA | 42,544,824 | ||
| Canada - 5.2% | |||
| Advantage Energy Ltd. (a) | 145,200 | 733,681 | |
| Africa Oil Corp. (a) | 1,586,831 | 2,179,919 | |
| Barrick Gold Corp. (Canada) | 522,909 | 9,441,757 | |
| Boardwalk (REIT) (b) | 75,500 | 2,818,881 | |
| Brookfield Renewable Corp. | 42,650 | 1,656,703 | |
| Cameco Corp. | 37,140 | 806,958 | |
| Canadian Natural Resources Ltd. | 253,918 | 9,283,864 | |
| Canadian Pacific Railway Ltd. | 245,800 | 16,050,938 | |
| Cenovus Energy, Inc. (Canada) | 324,500 | 3,271,645 | |
| Constellation Software, Inc. | 14,100 | 23,099,465 | |
| dentalcorp Holdings Ltd. (a) | 165,800 | 2,169,040 | |
| Enbridge, Inc. | 162,845 | 6,487,572 | |
| First Quantum Minerals Ltd. | 284,200 | 5,261,716 | |
| Fortis, Inc. | 64,050 | 2,841,441 | |
| Gibson Energy, Inc. (b) | 52,005 | 955,026 | |
| Imperial Oil Ltd. (b) | 144,923 | 4,580,189 | |
| Intact Financial Corp. | 73,400 | 9,705,536 | |
| Lundin Mining Corp. | 693,400 | 4,987,268 | |
| MEG Energy Corp. (a) | 181,500 | 1,417,207 | |
| Nutrien Ltd. | 155,500 | 10,092,890 | |
| Shopify, Inc. Class A (a) | 12,101 | 16,406,294 | |
| TC Energy Corp. | 63,471 | 3,054,786 | |
| The Toronto-Dominion Bank | 533,200 | 35,298,295 | |
| TMX Group Ltd. | 69,800 | 7,527,224 | |
| Topicus.Com, Inc. | 26,781 | 2,811,942 | |
| Tourmaline Oil Corp. | 145,103 | 5,069,326 | |
| Trican Well Service Ltd. (a) | 346,500 | 809,758 | |
| Wheaton Precious Metals Corp. | 219,400 | 8,259,113 | |
| TOTAL CANADA | 197,078,434 | ||
| Cayman Islands - 0.8% | |||
| CK Asset Holdings Ltd. | 1,000,588 | 5,773,167 | |
| HKBN Ltd. | 3,011,740 | 3,554,584 | |
| Parade Technologies Ltd. | 187,000 | 10,954,965 | |
| Sea Ltd. ADR (a) | 17,770 | 5,663,832 | |
| Tencent Holdings Ltd. | 75,010 | 4,478,004 | |
| TOTAL CAYMAN ISLANDS | 30,424,552 | ||
| Denmark - 1.2% | |||
| A.P. Moller - Maersk A/S Series B | 23 | 62,263 | |
| Ascendis Pharma A/S sponsored ADR (a) | 10,500 | 1,673,595 | |
| DSV A/S | 132,100 | 31,619,974 | |
| GN Store Nord A/S | 127,500 | 8,818,299 | |
| ORSTED A/S (c) | 23,430 | 3,088,417 | |
| TOTAL DENMARK | 45,262,548 | ||
| Finland - 1.0% | |||
| Elisa Corp. (A Shares) | 68,830 | 4,273,189 | |
| Fortum Corp. | 127,690 | 3,877,447 | |
| Nordea Bank ABP | 1,353,900 | 17,446,738 | |
| Sampo Oyj (A Shares) | 229,900 | 11,366,447 | |
| TOTAL FINLAND | 36,963,821 | ||
| France - 11.3% | |||
| Air Liquide SA | 111,100 | 17,793,793 | |
| ALTEN | 100,800 | 14,749,942 | |
| Amundi SA (c) | 132,400 | 11,135,760 | |
| Antin Infrastructure Partners SA | 113,100 | 3,793,311 | |
| ARGAN SA | 17,002 | 2,096,750 | |
| BNP Paribas SA (b) | 323,400 | 20,691,360 | |
| Capgemini SA | 133,200 | 27,622,590 | |
| Compagnie de St. Gobain | 180,100 | 12,120,197 | |
| Dassault Systemes SA | 368,200 | 19,376,717 | |
| Edenred SA | 303,200 | 16,322,000 | |
| ENGIE | 251,520 | 3,290,686 | |
| Exclusive Networks SA | 26,300 | 606,246 | |
| Hermes International SCA | 8,000 | 11,037,876 | |
| L'Oreal SA | 34,500 | 14,276,239 | |
| Legrand SA | 338,600 | 36,280,881 | |
| LVMH Moet Hennessy Louis Vuitton SE | 104,145 | 74,595,339 | |
| Pernod Ricard SA | 142,800 | 31,482,144 | |
| Safran SA | 117,100 | 14,810,883 | |
| Sanofi SA | 186,455 | 17,948,913 | |
| Sartorius Stedim Biotech | 13,000 | 7,264,464 | |
| Societe Generale Series A | 477,200 | 14,943,455 | |
| Suez Environnement SA | 254,570 | 5,775,712 | |
| Teleperformance | 63,300 | 24,898,097 | |
| Total SA (b) | 344,638 | 16,472,992 | |
| Veolia Environnement SA (b) | 107,000 | 3,269,469 | |
| Vivendi SA (b) | 167,140 | 2,104,284 | |
| Worldline SA (a)(c) | 63,800 | 4,863,222 | |
| TOTAL FRANCE | 429,623,322 | ||
| Germany - 8.8% | |||
| adidas AG | 70,900 | 22,280,791 | |
| Allianz SE | 97,600 | 21,866,862 | |
| Auto1 Group SE (c) | 23,800 | 865,993 | |
| BASF AG | 157,547 | 11,943,682 | |
| Brenntag AG | 261,100 | 24,254,800 | |
| Daimler AG (Germany) | 195,500 | 17,249,297 | |
| Delivery Hero AG (a)(c) | 83,800 | 10,689,125 | |
| Deutsche Borse AG | 133,800 | 21,711,274 | |
| Deutsche Post AG | 288,031 | 18,062,370 | |
| Deutsche Telekom AG | 426,100 | 8,545,094 | |
| E.ON AG | 106,290 | 1,297,344 | |
| Hannover Reuck SE | 93,100 | 16,212,544 | |
| HeidelbergCement AG | 71,400 | 5,326,682 | |
| LEG Immobilien AG | 41,371 | 5,843,813 | |
| Linde PLC | 23,512 | 6,914,377 | |
| Merck KGaA | 141,200 | 30,561,296 | |
| Rheinmetall AG | 143,798 | 14,045,951 | |
| RWE AG | 106,920 | 3,770,895 | |
| SAP SE | 170,335 | 23,034,269 | |
| Siemens AG | 137,850 | 22,545,511 | |
| Siemens Healthineers AG (c) | 390,100 | 25,300,121 | |
| SUSE SA (a)(b) | 145,800 | 5,945,361 | |
| Symrise AG | 59,200 | 7,759,413 | |
| Synlab AG (a) | 273,900 | 6,487,341 | |
| Uniper SE | 54,090 | 2,251,745 | |
| TOTAL GERMANY | 334,765,951 | ||
| Hong Kong - 1.7% | |||
| AIA Group Ltd. | 4,042,600 | 46,507,716 | |
| CLP Holdings Ltd. | 219,460 | 2,113,055 | |
| Dah Sing Banking Group Ltd. | 1,616,800 | 1,480,841 | |
| Hang Seng Bank Ltd. | 288,600 | 4,943,378 | |
| Hong Kong Exchanges and Clearing Ltd. | 128,900 | 7,920,971 | |
| TOTAL HONG KONG | 62,965,961 | ||
| Hungary - 0.5% | |||
| OTP Bank PLC (a) | 191,500 | 11,233,156 | |
| Richter Gedeon PLC | 209,600 | 5,731,981 | |
| TOTAL HUNGARY | 16,965,137 | ||
| India - 1.0% | |||
| HDFC Bank Ltd. | 982,400 | 21,018,283 | |
| Reliance Industries Ltd. | 24,986 | 626,790 | |
| Reliance Industries Ltd. | 460,400 | 15,594,231 | |
| TOTAL INDIA | 37,239,304 | ||
| Ireland - 1.1% | |||
| Flutter Entertainment PLC (a) | 46,041 | 9,056,103 | |
| Greencore Group PLC (a) | 1,795,800 | 3,406,973 | |
| Irish Residential Properties REIT PLC | 1,884,700 | 3,145,886 | |
| Kingspan Group PLC (Ireland) | 150,700 | 15,032,221 | |
| Linde PLC | 40,800 | 11,969,904 | |
| TOTAL IRELAND | 42,611,087 | ||
| Israel - 0.2% | |||
| NICE Systems Ltd. (a) | 21,452 | 5,988,554 | |
| Italy - 1.4% | |||
| Enel SpA | 849,066 | 6,516,767 | |
| FinecoBank SpA | 794,200 | 14,344,745 | |
| GVS SpA (c) | 115,000 | 1,632,070 | |
| Moncler SpA | 191,900 | 11,704,098 | |
| Recordati SpA | 314,500 | 18,228,301 | |
| TOTAL ITALY | 52,425,981 | ||
| Japan - 17.2% | |||
| Advance Residence Investment Corp. | 1,116 | 3,625,990 | |
| Bandai Namco Holdings, Inc. | 56,700 | 4,262,576 | |
| Daiichi Sankyo Kabushiki Kaisha | 424,700 | 11,289,023 | |
| Daiichikosho Co. Ltd. | 83,990 | 3,109,926 | |
| DENSO Corp. | 99,300 | 6,484,028 | |
| Dip Corp. | 96,230 | 3,671,802 | |
| ENEOS Holdings, Inc. | 660,155 | 2,681,784 | |
| Fast Retailing Co. Ltd. | 6,200 | 4,572,598 | |
| FUJIFILM Holdings Corp. | 344,700 | 29,764,764 | |
| Fujitsu Ltd. | 28,400 | 5,132,183 | |
| Hitachi Ltd. | 469,600 | 27,781,869 | |
| Hoya Corp. | 357,100 | 55,714,319 | |
| Idemitsu Kosan Co. Ltd. | 78,100 | 2,054,551 | |
| Itochu Corp. | 534,500 | 15,567,840 | |
| JEOL Ltd. | 29,500 | 2,148,339 | |
| JTOWER, Inc. (a) | 61,190 | 4,755,623 | |
| Kao Corp. | 171,500 | 10,206,583 | |
| KDDI Corp. | 65,810 | 2,166,670 | |
| Keyence Corp. | 58,400 | 34,857,273 | |
| Lifenet Insurance Co. (a) | 286,600 | 3,213,250 | |
| Minebea Mitsumi, Inc. | 112,100 | 2,854,943 | |
| Misumi Group, Inc. | 372,574 | 15,852,677 | |
| Mitsubishi Estate Co. Ltd. | 453,900 | 7,227,365 | |
| Mitsubishi UFJ Financial Group, Inc. | 1,716,100 | 10,144,440 | |
| Money Forward, Inc. (a) | 111,324 | 7,949,005 | |
| Nitori Holdings Co. Ltd. | 85,900 | 16,928,478 | |
| Olympus Corp. | 928,900 | 20,331,752 | |
| One Career, Inc. | 11,300 | 212,202 | |
| ORIX Corp. | 484,300 | 9,061,993 | |
| Persol Holdings Co. Ltd. | 1,125,600 | 28,060,172 | |
| Recruit Holdings Co. Ltd. | 734,600 | 44,903,055 | |
| Relo Group, Inc. | 341,000 | 7,037,988 | |
| Renesas Electronics Corp. (a) | 704,900 | 8,675,459 | |
| Shin-Etsu Chemical Co. Ltd. | 171,600 | 28,960,750 | |
| Shiseido Co. Ltd. | 67,800 | 4,556,802 | |
| SMC Corp. | 27,700 | 17,282,320 | |
| SoftBank Group Corp. | 189,996 | 10,978,973 | |
| Sony Group Corp. | 500,900 | 55,609,293 | |
| Suzuki Motor Corp. | 197,200 | 8,810,710 | |
| T&D Holdings, Inc. | 270,900 | 3,716,177 | |
| TIS, Inc. | 295,200 | 8,057,217 | |
| Tokio Marine Holdings, Inc. | 180,000 | 9,648,901 | |
| Tokyo Electron Ltd. | 75,400 | 33,310,118 | |
| Toyota Motor Corp. | 1,342,000 | 23,910,932 | |
| Tsuruha Holdings, Inc. | 91,900 | 11,333,310 | |
| Uzabase, Inc. (a) | 149,900 | 3,255,067 | |
| Yamato Holdings Co. Ltd. | 517,600 | 13,100,653 | |
| Z Holdings Corp. | 1,020,640 | 6,532,158 | |
| TOTAL JAPAN | 651,363,901 | ||
| Korea (South) - 0.3% | |||
| Samsung Electronics Co. Ltd. | 183,720 | 11,384,696 | |
| Luxembourg - 0.3% | |||
| B&M European Value Retail SA | 1,314,276 | 10,426,697 | |
| Netherlands - 8.5% | |||
| Adyen BV (a)(c) | 3,400 | 9,504,237 | |
| Airbus Group NV (a) | 168,400 | 22,325,786 | |
| Akzo Nobel NV | 189,800 | 20,738,437 | |
| Argenx SE ADR (a) | 11,400 | 3,442,800 | |
| ASM International NV (Netherlands) | 38,800 | 15,194,795 | |
| ASML Holding NV (Netherlands) | 123,478 | 92,245,283 | |
| Boskalis Westminster | 375,900 | 11,442,882 | |
| Corbion NV | 66,100 | 3,193,673 | |
| Elastic NV (a) | 47,600 | 7,091,924 | |
| Euronext NV (c) | 117,640 | 13,274,499 | |
| Ferrari NV | 32,700 | 6,824,490 | |
| Heineken NV (Bearer) | 85,900 | 8,965,800 | |
| IMCD NV | 137,600 | 26,333,897 | |
| ING Groep NV (Certificaten Van Aandelen) | 1,330,600 | 19,344,945 | |
| Koninklijke Philips Electronics NV | 294,645 | 13,090,171 | |
| NXP Semiconductors NV | 17,800 | 3,486,486 | |
| Prosus NV | 149,500 | 11,966,139 | |
| RHI Magnesita NV | 128,045 | 5,628,116 | |
| Universal Music Group NV | 182,040 | 4,849,798 | |
| Wolters Kluwer NV | 231,000 | 24,485,194 | |
| TOTAL NETHERLANDS | 323,429,352 | ||
| Norway - 0.5% | |||
| Equinor ASA | 77,100 | 1,960,716 | |
| Schibsted ASA: | |||
| (A Shares) | 281,500 | 13,362,170 | |
| (B Shares) | 123,140 | 5,212,564 | |
| TOTAL NORWAY | 20,535,450 | ||
| Poland - 0.1% | |||
| Allegro.eu SA (c) | 124,700 | 1,804,721 | |
| Portugal - 0.1% | |||
| Energias de Portugal SA | 515,760 | 2,709,753 | |
| Singapore - 0.3% | |||
| Parkway Life REIT | 344,448 | 1,176,471 | |
| United Overseas Bank Ltd. | 453,505 | 8,579,218 | |
| Wing Tai Holdings Ltd. | 2,064,300 | 2,732,529 | |
| TOTAL SINGAPORE | 12,488,218 | ||
| South Africa - 0.0% | |||
| Thungela Resources Ltd. (a)(b) | 242,600 | 1,498,403 | |
| Spain - 2.4% | |||
| Aena SME SA (a)(c) | 68,800 | 11,868,279 | |
| Amadeus IT Holding SA Class A (a) | 355,449 | 23,378,534 | |
| Bankinter SA | 1,588,200 | 9,292,781 | |
| Cellnex Telecom SA (c) | 453,035 | 27,944,681 | |
| EDP Renovaveis SA | 67,090 | 1,665,416 | |
| Iberdrola SA | 1,469,878 | 14,787,611 | |
| Linea Directa Aseguradora SA Compania de Seguros y Reaseguros | 1,588,200 | 3,132,277 | |
| TOTAL SPAIN | 92,069,579 | ||
| Sweden - 4.2% | |||
| AddTech AB (B Shares) | 634,900 | 11,264,580 | |
| ASSA ABLOY AB (B Shares) | 550,000 | 15,953,635 | |
| Atlas Copco AB (A Shares) | 295,300 | 17,831,884 | |
| Ericsson (B Shares) | 438,411 | 4,948,314 | |
| Fastighets AB Balder (a) | 20,100 | 1,207,943 | |
| Fortinova Fastigheter AB | 42,196 | 243,631 | |
| Hexagon AB (B Shares) | 1,564,700 | 24,202,771 | |
| Indutrade AB | 966,789 | 26,884,718 | |
| Investor AB (B Shares) | 402,700 | 8,659,813 | |
| Kry International AB (d) | 527 | 218,315 | |
| Nordnet AB | 330,500 | 5,920,511 | |
| NP3 Fastigheter AB | 25,900 | 671,168 | |
| Oatly Group AB ADR (b) | 49,800 | 752,976 | |
| Swedbank AB (A Shares) | 653,400 | 13,175,611 | |
| Swedish Match Co. AB | 2,883,200 | 25,235,477 | |
| TOTAL SWEDEN | 157,171,347 | ||
| Switzerland - 8.6% | |||
| Dufry AG (a) | 61,388 | 3,448,552 | |
| Julius Baer Group Ltd. | 271,140 | 18,014,464 | |
| Lonza Group AG | 48,300 | 36,230,304 | |
| Nestle SA (Reg. S) | 753,198 | 90,752,878 | |
| Roche Holding AG (participation certificate) | 205,030 | 74,829,794 | |
| Sika AG | 116,714 | 36,901,842 | |
| Sonova Holding AG Class B | 79,253 | 29,950,363 | |
| Temenos Group AG | 52,000 | 7,055,702 | |
| UBS Group AG | 621,750 | 9,924,135 | |
| Zurich Insurance Group Ltd. | 45,940 | 18,785,801 | |
| TOTAL SWITZERLAND | 325,893,835 | ||
| Taiwan - 0.4% | |||
| Taiwan Semiconductor Manufacturing Co. Ltd. | 798,000 | 16,517,645 | |
| United Kingdom - 12.1% | |||
| Anglo American PLC (United Kingdom) | 239,580 | 8,396,957 | |
| AstraZeneca PLC (United Kingdom) | 225,400 | 27,164,698 | |
| BAE Systems PLC | 2,174,311 | 16,468,355 | |
| Beazley PLC (a) | 1,366,100 | 6,955,001 | |
| Big Yellow Group PLC | 19,000 | 355,343 | |
| Bridgepoint Group Holdings Ltd. (c) | 1,215,356 | 8,212,089 | |
| Compass Group PLC (a) | 1,722,400 | 35,225,100 | |
| Cranswick PLC | 30,900 | 1,483,396 | |
| Dechra Pharmaceuticals PLC | 270,000 | 17,631,277 | |
| Deliveroo PLC Class A (a)(b)(c) | 1,759,500 | 6,807,659 | |
| Diageo PLC | 1,032,145 | 49,971,307 | |
| Diploma PLC | 183,468 | 6,976,413 | |
| Dr. Martens Ltd. (a) | 157,900 | 843,306 | |
| Future PLC | 77,000 | 3,814,194 | |
| Grainger Trust PLC | 751,460 | 3,083,452 | |
| Harbour Energy PLC (a) | 209,505 | 1,022,569 | |
| Hotel Chocolat Group Ltd. (a) | 795,671 | 4,341,786 | |
| Informa PLC | 467,280 | 3,436,360 | |
| JD Sports Fashion PLC | 904,000 | 12,704,355 | |
| Jet2 PLC (a) | 941,600 | 16,315,105 | |
| Legal & General Group PLC | 2,867,416 | 10,773,134 | |
| Lloyds Banking Group PLC | 29,136,000 | 18,134,871 | |
| London Stock Exchange Group PLC | 124,700 | 12,495,967 | |
| Mondi PLC | 644,200 | 15,786,759 | |
| Ocado Group PLC (a) | 104,500 | 2,335,348 | |
| Prudential PLC (a) | 1,106,360 | 21,469,387 | |
| Reckitt Benckiser Group PLC | 138,030 | 10,843,666 | |
| RELX PLC (London Stock Exchange) | 1,383,609 | 39,828,919 | |
| Rentokil Initial PLC | 2,495,400 | 19,595,874 | |
| Rio Tinto PLC | 227,800 | 14,932,776 | |
| Royal Dutch Shell PLC: | |||
| Class A (United Kingdom) | 444,897 | 9,894,142 | |
| Class B (United Kingdom) | 407,425 | 9,027,160 | |
| Smith & Nephew PLC | 566,800 | 9,764,737 | |
| SSE PLC | 161,640 | 3,403,352 | |
| St. James's Place Capital PLC | 572,800 | 11,554,698 | |
| Supreme PLC (a) | 1,126,200 | 2,944,217 | |
| THG PLC | 406,300 | 2,773,892 | |
| Unilever PLC (Netherlands) | 94,625 | 5,111,278 | |
| WH Smith PLC (a) | 343,600 | 7,890,416 | |
| TOTAL UNITED KINGDOM | 459,769,315 | ||
| United States of America - 3.3% | |||
| Airbnb, Inc. Class A | 1,800 | 301,950 | |
| Ares Management Corp. | 186,100 | 13,739,763 | |
| Boston Scientific Corp. (a) | 210,600 | 9,137,934 | |
| CBRE Group, Inc. (a) | 118,700 | 11,556,632 | |
| Constellation Brands, Inc. Class A (sub. vtg.) | 19,400 | 4,087,386 | |
| Equifax, Inc. | 43,900 | 11,125,138 | |
| Hess Corp. | 36,642 | 2,862,107 | |
| Intercontinental Exchange, Inc. | 113,100 | 12,986,142 | |
| Jackson Financial, Inc. | 27,659 | 719,134 | |
| Marsh & McLennan Companies, Inc. | 124,600 | 18,868,178 | |
| Moody's Corp. | 31,500 | 11,185,965 | |
| Philip Morris International, Inc. | 58,100 | 5,507,299 | |
| ResMed, Inc. | 23,700 | 6,246,135 | |
| Roper Technologies, Inc. | 34,600 | 15,436,098 | |
| The AES Corp. | 93,800 | 2,141,454 | |
| TOTAL UNITED STATES OF AMERICA | 125,901,315 | ||
| TOTAL COMMON STOCKS | |||
| (Cost $2,705,110,441) | 3,690,641,659 | ||
| Nonconvertible Preferred Stocks - 0.3% | |||
| Germany - 0.3% | |||
| Porsche Automobil Holding SE (Germany) | 101,200 | 10,007,704 | |
| Sweden - 0.0% | |||
| Kry International AB Series E (d) | 3,043 | 1,326,968 | |
| TOTAL NONCONVERTIBLE PREFERRED STOCKS | |||
| (Cost $5,883,509) | 11,334,672 | ||
| Principal Amount | Value | ||
| Government Obligations - 0.1% | |||
| United States of America - 0.1% | |||
| U.S. Treasury Bills, yield at date of purchase 0.05% to 0.05% 11/26/21 to 12/2/21 (Cost $2,449,810)(e) | 2,450,000 | 2,449,852 | |
| Shares | Value | ||
| Money Market Funds - 3.0% | |||
| Fidelity Cash Central Fund 0.06% (f) | 74,372,865 | 74,387,739 | |
| Fidelity Securities Lending Cash Central Fund 0.06% (f)(g) | 39,662,714 | 39,666,680 | |
| TOTAL MONEY MARKET FUNDS | |||
| (Cost $114,054,418) | 114,054,419 | ||
| TOTAL INVESTMENT IN SECURITIES - 100.8% | |||
| (Cost $2,827,498,178) | 3,818,480,602 | ||
| NET OTHER ASSETS (LIABILITIES) - (0.8)% | (28,522,842) | ||
| NET ASSETS - 100% | $3,789,957,760 |
| Futures Contracts | |||||
| Number of contracts | Expiration Date | Notional Amount | Value | Unrealized Appreciation/(Depreciation) | |
| Purchased | |||||
| Equity Index Contracts | |||||
| ICE E-mini MSCI EAFE Index Contracts (United States) | 109 | Dec. 2021 | $12,355,150 | $(588,976) | $(588,976) |
| TME S&P/TSX 60 Index Contracts (Canada) | 5 | Dec. 2021 | 944,339 | (27,190) | (27,190) |
| TOTAL FUTURES CONTRACTS | $(616,166) |
The notional amount of futures purchased as a percentage of Net Assets is 0.3%
Categorizations in the Schedule of Investments are based on country or territory of incorporation.
Legend
(a) Non-income producing
(b) Security or a portion of the security is on loan at period end.
(c) Security exempt from registration under Rule 144A of the Securities Act of 1933. These securities may be resold in transactions exempt from registration, normally to qualified institutional buyers. At the end of the period, the value of these securities amounted to $136,990,873 or 3.6% of net assets.
(d) Level 3 security
(e) Security or a portion of the security was pledged to cover margin requirements for futures contracts. At period end, the value of securities pledged amounted to $762,952.
(f) Affiliated fund that is generally available only to investment companies and other accounts managed by Fidelity Investments. The rate quoted is the annualized seven-day yield of the fund at period end. A complete unaudited listing of the fund's holdings as of its most recent quarter end is available upon request. In addition, each Fidelity Central Fund's financial statements, which are not covered by the Fund's Report of Independent Registered Public Accounting Firm, are available on the SEC's website or upon request.
(g) Investment made with cash collateral received from securities on loan.
Affiliated Central Funds
Fiscal year to date information regarding the Fund's investments in Fidelity Central Funds, including the ownership percentage, is presented below.
| Fund | Value, beginning of period | Purchases | Sales Proceeds | Dividend Income | Realized Gain/Loss | Change in Unrealized appreciation (depreciation) | Value, end of period | % ownership, end of period |
| Fidelity Cash Central Fund 0.06% | $65,338,282 | $1,460,629,593 | $1,451,581,593 | $47,253 | $1,457 | $-- | $74,387,739 | 0.1% |
| Fidelity Securities Lending Cash Central Fund 0.06% | 583,763 | 242,237,123 | 203,154,206 | 670,194 | -- | -- | 39,666,680 | 0.1% |
| Total | $65,922,045 | $1,702,866,716 | $1,654,735,799 | $717,447 | $1,457 | $-- | $114,054,419 |
Amounts in the income column in the above table include any capital gain distributions from underlying funds, which are presented in the corresponding line-item in the Statement of Operations, if applicable. Amount for Fidelity Securities Lending Cash Central Fund represents the income earned on investing cash collateral, less rebates paid to borrowers and any lending agent fees associated with the loan, plus any premium payments received for lending certain types of securities.
Investment Valuation
The following is a summary of the inputs used, as of September 30, 2021, involving the Fund's assets and liabilities carried at fair value. The inputs or methodology used for valuing securities may not be an indication of the risk associated with investing in those securities. For more information on valuation inputs, and their aggregation into the levels used below, please refer to the Investment Valuation section in the accompanying Notes to Financial Statements.
| Valuation Inputs at Reporting Date: | ||||
| Description | Total | Level 1 | Level 2 | Level 3 |
| Investments in Securities: | ||||
| Equities: | ||||
| Communication Services | $119,250,587 | $5,663,832 | $113,586,755 | $-- |
| Consumer Discretionary | 392,026,435 | 301,950 | 391,724,485 | -- |
| Consumer Staples | 293,179,414 | 10,347,661 | 282,831,753 | -- |
| Energy | 103,678,063 | 41,512,038 | 62,166,025 | -- |
| Financials | 692,765,785 | 121,263,393 | 571,502,392 | -- |
| Health Care | 455,051,079 | 28,401,485 | 426,649,594 | -- |
| Industrials | 744,731,504 | 62,600,842 | 682,130,662 | -- |
| Information Technology | 527,042,220 | 69,631,427 | 455,865,510 | 1,545,283 |
| Materials | 242,816,408 | 50,012,648 | 192,803,760 | -- |
| Real Estate | 65,049,938 | 14,375,513 | 50,674,425 | -- |
| Utilities | 66,384,898 | 6,639,598 | 59,745,300 | -- |
| Government Obligations | 2,449,852 | -- | 2,449,852 | -- |
| Money Market Funds | 114,054,419 | 114,054,419 | -- | -- |
| Total Investments in Securities: | $3,818,480,602 | $524,804,806 | $3,292,130,513 | $1,545,283 |
| Derivative Instruments: | ||||
| Liabilities | ||||
| Futures Contracts | $(616,166) | $(616,166) | $-- | $-- |
| Total Liabilities | $(616,166) | $(616,166) | $-- | $-- |
| Total Derivative Instruments: | $(616,166) | $(616,166) | $-- | $-- |
Value of Derivative Instruments
The following table is a summary of the Fund's value of derivative instruments by primary risk exposure as of September 30, 2021. For additional information on derivative instruments, please refer to the Derivative Instruments section in the accompanying Notes to Financial Statements.
| Primary Risk Exposure / Derivative Type | Value | |
| Asset | Liability | |
| Equity Risk | ||
| Futures Contracts(a) | $0 | $(616,166) |
| Total Equity Risk | 0 | (616,166) |
| Total Value of Derivatives | $0 | $(616,166) |
(a) Reflects gross cumulative appreciation (depreciation) on futures contracts as presented in the Schedule of Investments. In the Statement of Assets and Liabilities, the period end daily variation margin is included in receivable or payable for daily variation margin on futures contracts, and the net cumulative appreciation (depreciation) is included in Total accumulated earnings (loss).
See accompanying notes which are an integral part of the financial statements.
Financial Statements
Statement of Assets and Liabilities
| September 30, 2021 | ||
| Assets | ||
| Investment in securities, at value (including securities loaned of $37,680,922) — See accompanying schedule: Unaffiliated issuers (cost $2,713,443,760) | $3,704,426,183 | |
| Fidelity Central Funds (cost $114,054,418) | 114,054,419 | |
| Total Investment in Securities (cost $2,827,498,178) | $3,818,480,602 | |
| Foreign currency held at value (cost $3,538,911) | 3,538,788 | |
| Receivable for investments sold | 10,475,370 | |
| Receivable for fund shares sold | 42,136 | |
| Dividends receivable | 5,713,360 | |
| Reclaims receivable | 8,563,930 | |
| Distributions receivable from Fidelity Central Funds | 22,188 | |
| Other receivables | 155 | |
| Total assets | 3,846,836,529 | |
| Liabilities | ||
| Payable to custodian bank | $1,240,249 | |
| Payable for investments purchased | 13,000,149 | |
| Payable for fund shares redeemed | 1,287,590 | |
| Payable for daily variation margin on futures contracts | 49,972 | |
| Other payables and accrued expenses | 1,634,129 | |
| Collateral on securities loaned | 39,666,680 | |
| Total liabilities | 56,878,769 | |
| Net Assets | $3,789,957,760 | |
| Net Assets consist of: | ||
| Paid in capital | $2,591,779,064 | |
| Total accumulated earnings (loss) | 1,198,178,696 | |
| Net Assets | $3,789,957,760 | |
| Net Asset Value, offering price and redemption price per share ($3,789,957,760 ÷ 35,458,557 shares) | $106.88 |
See accompanying notes which are an integral part of the financial statements.
Statement of Operations
| Year ended September 30, 2021 | ||
| Investment Income | ||
| Dividends | $64,394,466 | |
| Non-Cash dividends | 7,191,734 | |
| Income from Fidelity Central Funds (including $670,194 from security lending) | 717,447 | |
| Income before foreign taxes withheld | 72,303,647 | |
| Less foreign taxes withheld | (9,295,639) | |
| Total income | 63,008,008 | |
| Expenses | ||
| Custodian fees and expenses | $353,033 | |
| Independent directors' fees and expenses | 13,581 | |
| Miscellaneous | 26 | |
| Total expenses | 366,640 | |
| Net investment income (loss) | 62,641,368 | |
| Realized and Unrealized Gain (Loss) | ||
| Net realized gain (loss) on: | ||
| Investment securities: | ||
| Unaffiliated issuers (net of foreign taxes of $42,570) | 265,618,926 | |
| Fidelity Central Funds | 1,457 | |
| Foreign currency transactions | (99,463) | |
| Futures contracts | 4,233,097 | |
| Total net realized gain (loss) | 269,754,017 | |
| Change in net unrealized appreciation (depreciation) on: | ||
| Investment securities: | ||
| Unaffiliated issuers (net of increase in deferred foreign taxes of $612,302) | 507,564,595 | |
| Assets and liabilities in foreign currencies | (268,495) | |
| Futures contracts | (435,899) | |
| Total change in net unrealized appreciation (depreciation) | 506,860,201 | |
| Net gain (loss) | 776,614,218 | |
| Net increase (decrease) in net assets resulting from operations | $839,255,586 |
See accompanying notes which are an integral part of the financial statements.
Statement of Changes in Net Assets
| Year ended September 30, 2021 | Year ended September 30, 2020 | |
| Increase (Decrease) in Net Assets | ||
| Operations | ||
| Net investment income (loss) | $62,641,368 | $45,995,759 |
| Net realized gain (loss) | 269,754,017 | 24,126,848 |
| Change in net unrealized appreciation (depreciation) | 506,860,201 | 202,783,378 |
| Net increase (decrease) in net assets resulting from operations | 839,255,586 | 272,905,985 |
| Distributions to shareholders | (58,312,100) | (52,772,474) |
| Affiliated share transactions | ||
| Proceeds from sales of shares | 529,663,856 | 636,315,288 |
| Reinvestment of distributions | 58,312,100 | 52,772,474 |
| Cost of shares redeemed | (599,890,195) | (321,078,412) |
| Net increase (decrease) in net assets resulting from share transactions | (11,914,239) | 368,009,350 |
| Total increase (decrease) in net assets | 769,029,247 | 588,142,861 |
| Net Assets | ||
| Beginning of period | 3,020,928,513 | 2,432,785,652 |
| End of period | $3,789,957,760 | $3,020,928,513 |
| Other Information | ||
| Shares | ||
| Sold | 5,192,192 | 8,168,239 |
| Issued in reinvestment of distributions | 568,317 | 676,964 |
| Redeemed | (6,000,356) | (4,366,790) |
| Net increase (decrease) | (239,847) | 4,478,413 |
See accompanying notes which are an integral part of the financial statements.
Financial Highlights
Fidelity International Equity Central Fund
| Years ended September 30, | 2021 | 2020 | 2019 | 2018 | 2017 |
| Selected Per–Share Data | |||||
| Net asset value, beginning of period | $84.62 | $77.92 | $84.55 | $87.45 | $74.96 |
| Income from Investment Operations | |||||
| Net investment income (loss)A | 1.80 | 1.40 | 2.23 | 2.30 | 2.18 |
| Net realized and unrealized gain (loss) | 22.17 | 6.94 | (3.09) | (.27) | 12.27 |
| Total from investment operations | 23.97 | 8.34 | (.86) | 2.03 | 14.45 |
| Distributions from net investment income | (1.71) | (1.39) | (2.12) | (2.34) | (1.92) |
| Distributions from net realized gain | – | (.25) | (3.65) | (2.60) | (.03) |
| Total distributions | (1.71) | (1.64) | (5.77) | (4.93)B | (1.96)B |
| Net asset value, end of period | $106.88 | $84.62 | $77.92 | $84.55 | $87.45 |
| Total ReturnC | 28.42% | 10.91% | (.21)% | 2.30% | 19.54% |
| Ratios to Average Net AssetsD,E | |||||
| Expenses before reductions | .01% | .01% | .01% | .01% | .01% |
| Expenses net of fee waivers, if any | .01% | .01% | .01% | .01% | .01% |
| Expenses net of all reductions | .01% | .01% | .01% | .01% | .01% |
| Net investment income (loss) | 1.79% | 1.77% | 2.93% | 2.63% | 2.74% |
| Supplemental Data | |||||
| Net assets, end of period (000 omitted) | $3,789,958 | $3,020,929 | $2,432,786 | $2,645,061 | $3,094,384 |
| Portfolio turnover rateF | 52% | 81% | 70% | 53% | 61% |
A Calculated based on average shares outstanding during the period.
B Total distributions per share do not sum due to rounding.
C Total returns would have been lower if certain expenses had not been reduced during the applicable periods shown.
D Fees and expenses of any underlying mutual funds or exchange-traded funds (ETFs) are not included in the Fund's expense ratio. The Fund indirectly bears its proportionate share of these expenses. For additional expense information related to investments in Fidelity Central Funds, please refer to the "Investments in Fidelity Central Funds" note found in the Notes to Financial Statements section of the most recent Annual or Semi-Annual report.
E Expense ratios reflect operating expenses of the class. Expenses before reductions do not reflect amounts reimbursed, waived, or reduced through arrangements with the investment adviser, brokerage services, or other offset arrangements, if applicable, and do not represent the amount paid by the class during periods when reimbursements, waivers or reductions occur.
F Amount does not include the portfolio activity of any underlying mutual funds or exchange-traded funds (ETFs).
See accompanying notes which are an integral part of the financial statements.
Notes to Financial Statements
For the period ended September 30, 2021
1. Organization.
Fidelity International Equity Central Fund (the Fund) is a fund of Fidelity Central Investment Portfolios LLC (the LLC) and is authorized to issue an unlimited number of shares. Shares of the Fund are only offered to other investment companies and accounts managed by Fidelity Management & Research Company LLC (FMR), or its affiliates (the Investing Funds). The LLC is registered under the Investment Company Act of 1940, as amended (the 1940 Act), as an open-end management investment company organized as a Delaware Limited Liability Company.
2. Investments in Fidelity Central Funds.
Funds may invest in Fidelity Central Funds, which are open-end investment companies generally available only to other investment companies and accounts managed by the investment adviser and its affiliates. The Schedule of Investments lists any Fidelity Central Funds held as an investment as of period end, but does not include the underlying holdings of each Fidelity Central Fund. An investing fund indirectly bears its proportionate share of the expenses of the underlying Fidelity Central Funds.
Based on its investment objective, each Fidelity Central Fund may invest or participate in various investment vehicles or strategies that are similar to those of the investing fund. These strategies are consistent with the investment objectives of the investing fund and may involve certain economic risks which may cause a decline in value of each of the Fidelity Central Funds and thus a decline in the value of the investing fund.
| Fidelity Central Fund | Investment Manager | Investment Objective | Investment Practices | Expense Ratio(a) |
| Fidelity Money Market Central Funds | Fidelity Management & Research Company LLC (FMR) | Each fund seeks to obtain a high level of current income consistent with the preservation of capital and liquidity. | Short-term Investments | Less than .005% |
(a) Expenses expressed as a percentage of average net assets and are as of each underlying Central Fund's most recent annual or semi-annual shareholder report.
A complete unaudited list of holdings for each Fidelity Central Fund is available upon request or at the Securities and Exchange Commission website at www.sec.gov. In addition, the financial statements of the Fidelity Central Funds which contain the significant accounting policies (including investment valuation policies) of those funds, and are not covered by the Report of Independent Registered Public Accounting Firm, are available on the Securities and Exchange Commission website or upon request.
3. Significant Accounting Policies.
The Fund is an investment company and applies the accounting and reporting guidance of the Financial Accounting Standards Board (FASB) Accounting Standards Codification Topic 946 Financial Services - Investment Companies. The financial statements have been prepared in conformity with accounting principles generally accepted in the United States of America (GAAP), which require management to make certain estimates and assumptions at the date of the financial statements. Actual results could differ from those estimates. Subsequent events, if any, through the date that the financial statements were issued have been evaluated in the preparation of the financial statements. The Fund's Schedule of Investments lists any underlying mutual funds or exchange-traded funds (ETFs) but does not include the underlying holdings of these funds. The following summarizes the significant accounting policies of the Fund:
Investment Valuation. Investments are valued as of 4:00 p.m. Eastern time on the last calendar day of the period. The Board of Directors (the Board) has delegated the day to day responsibility for the valuation of the Fund's investments to the Fair Value Committee (the Committee) established by the Fund's investment adviser. In accordance with valuation policies and procedures approved by the Board, the Fund attempts to obtain prices from one or more third party pricing vendors or brokers to value its investments. When current market prices, quotations or currency exchange rates are not readily available or reliable, investments will be fair valued in good faith by the Committee, in accordance with procedures adopted by the Board. Factors used in determining fair value vary by investment type and may include market or investment specific events, changes in interest rates and credit quality. The frequency with which these procedures are used cannot be predicted and they may be utilized to a significant extent. The Committee oversees the Fund's valuation policies and procedures and reports to the Board on the Committee's activities and fair value determinations. The Board monitors the appropriateness of the procedures used in valuing the Fund's investments and ratifies the fair value determinations of the Committee.
The Fund categorizes the inputs to valuation techniques used to value its investments into a disclosure hierarchy consisting of three levels as shown below:
- Level 1 – quoted prices in active markets for identical investments
- Level 2 – other significant observable inputs (including quoted prices for similar investments, interest rates, prepayment speeds, etc.)
- Level 3 – unobservable inputs (including the Fund's own assumptions based on the best information available)
Valuation techniques used to value the Fund's investments by major category are as follows:
Equity securities, including restricted securities, for which market quotations are readily available, are valued at the last reported sale price or official closing price as reported by a third party pricing vendor on the primary market or exchange on which they are traded and are categorized as Level 1 in the hierarchy. In the event there were no sales during the day or closing prices are not available, securities are valued at the last quoted bid price or may be valued using the last available price and are generally categorized as Level 2 in the hierarchy. For foreign equity securities, when market or security specific events arise, comparisons to the valuation of American Depositary Receipts (ADRs), futures contracts, Exchange-Traded Funds (ETFs) and certain indexes as well as quoted prices for similar securities may be used and would be categorized as Level 2 in the hierarchy. For equity securities, including restricted securities, where observable inputs are limited, assumptions about market activity and risk are used and these securities may be categorized as Level 3 in the hierarchy.
Debt securities, including restricted securities, are valued based on evaluated prices received from third party pricing vendors or from brokers who make markets in such securities. U.S. government and government agency obligations are valued by pricing vendors who utilize matrix pricing which considers yield or price of bonds of comparable quality, coupon, maturity and type or by broker-supplied prices. When independent prices are unavailable or unreliable, debt securities may be valued utilizing pricing methodologies which consider similar factors that would be used by third party pricing vendors. Debt securities are generally categorized as Level 2 in the hierarchy but may be Level 3 depending on the circumstances.
Futures contracts are valued at the settlement price established each day by the board of trade or exchange on which they are traded and are categorized as Level 1 in the hierarchy. Investments in open-end mutual funds, including the Fidelity Central Funds, are valued at their closing net asset value (NAV) each business day and are categorized as Level 1 in the hierarchy.
Changes in valuation techniques may result in transfers in or out of an assigned level within the disclosure hierarchy. The aggregate value of investments by input level as of September 30, 2021 is included at the end of the Fund's Schedule of Investments.
Foreign Currency. Certain Funds may use foreign currency contracts to facilitate transactions in foreign-denominated securities. Gains and losses from these transactions may arise from changes in the value of the foreign currency or if the counterparties do not perform under the contracts' terms.
Foreign-denominated assets, including investment securities, and liabilities are translated into U.S. dollars at the exchange rates at period end. Purchases and sales of investment securities, income and dividends received, and expenses denominated in foreign currencies are translated into U.S. dollars at the exchange rate in effect on the transaction date.
The effects of exchange rate fluctuations on investments are included with the net realized and unrealized gain (loss) on investment securities. Other foreign currency transactions resulting in realized and unrealized gain (loss) are disclosed separately.
Investment Transactions and Income. For financial reporting purposes, the Fund's investment holdings and NAV include trades executed through the end of the last business day of the period. The NAV per share for processing shareholder transactions is calculated as of the close of business of the New York Stock Exchange (NYSE), normally 4:00 p.m. Eastern time and includes trades executed through the end of the prior business day. Gains and losses on securities sold are determined on the basis of identified cost and include proceeds received from litigation. Dividend income is recorded on the ex-dividend date, except for certain dividends from foreign securities where the ex-dividend date may have passed, which are recorded as soon as the Fund is informed of the ex-dividend date. Non-cash dividends included in dividend income, if any, are recorded at the fair market value of the securities received. Income and capital gain distributions from Fidelity Central Funds, if any, are recorded on the ex-dividend date. Certain distributions received by the Fund represent a return of capital or capital gain. The Fund determines the components of these distributions subsequent to the ex-dividend date, based upon receipt of tax filings or other correspondence relating to the underlying investment. These distributions are recorded as a reduction of cost of investments and/or as a realized gain. Investment income is recorded net of foreign taxes withheld where recovery of such taxes is uncertain. Funds may file withholding tax reclaims in certain jurisdictions to recover a portion of amounts previously withheld. Any withholding tax reclaims income is included in the Statement of Operations in foreign taxes withheld. Any receivables for withholding tax reclaims are included in the Statement of Assets and Liabilities in reclaims receivable.
Expenses. Expenses directly attributable to a fund are charged to that fund. Expenses attributable to more than one fund are allocated among the respective funds on the basis of relative net assets or other appropriate methods. Expenses included in the accompanying financial statements reflect the expenses of that fund and do not include any expenses associated with any underlying mutual funds or exchange-traded funds. Although not included in a fund's expenses, a fund indirectly bears its proportionate share of these expenses through the net asset value of each underlying mutual fund or exchange-traded fund. Expense estimates are accrued in the period to which they relate and adjustments are made when actual amounts are known.
Income Tax Information and Distributions to Shareholders. Each year, the Fund intends to qualify as a regulated investment company under Subchapter M of the Internal Revenue Code, including distributing substantially all of its taxable income and realized gains. As a result, no provision for U.S. Federal income taxes is required. As of September 30, 2021, the Fund did not have any unrecognized tax benefits in the financial statements; nor is the Fund aware of any tax positions for which it is reasonably possible that the total amounts of unrecognized tax benefits will significantly change in the next twelve months. The Fund files a U.S. federal tax return, in addition to state and local tax returns as required. The Fund's federal income tax returns are subject to examination by the Internal Revenue Service (IRS) for a period of three fiscal years after they are filed. State and local tax returns may be subject to examination for an additional fiscal year depending on the jurisdiction. Foreign taxes are provided for based on the Fund's understanding of the tax rules and rates that exist in the foreign markets in which it invests. The Fund is subject to a tax imposed on capital gains by certain countries in which it invests. An estimated deferred tax liability for net unrealized appreciation on the applicable securities is included in Other payables and accrued expenses on the Statement of Assets & Liabilities.
Distributions are declared and recorded on the ex-dividend date. Income and capital gain distributions are determined in accordance with income tax regulations, which may differ from GAAP. In addition, the Fund claimed a portion of the payment made to redeeming shareholders as a distribution for income tax purposes.
Capital accounts within the financial statements are adjusted for permanent book-tax differences. These adjustments have no impact on net assets or the results of operations. Capital accounts are not adjusted for temporary book-tax differences which will reverse in a subsequent period.
Book-tax differences are primarily due to futures contracts, foreign currency transactions, certain foreign taxes, passive foreign investment companies (PFIC), capital loss carryforwards and losses deferred due to wash sales.
As of period end, the cost and unrealized appreciation (depreciation) in securities, and derivatives if applicable, for federal income tax purposes were as follows:
| Gross unrealized appreciation | $1,044,124,208 |
| Gross unrealized depreciation | (66,505,473) |
| Net unrealized appreciation (depreciation) | $977,618,735 |
| Tax Cost | $2,840,834,677 |
The tax-based components of distributable earnings as of period end were as follows:
| Undistributed ordinary income | $70,353,765 |
| Undistributed long-term capital gain | $151,485,546 |
| Net unrealized appreciation (depreciation) on securities and other investments | $977,789,850 |
The tax character of distributions paid was as follows:
| September 30, 2021 | September 30, 2020 | |
| Ordinary Income | $58,312,100 | $ 52,772,474 |
Restricted Securities (including Private Placements). Funds may invest in securities that are subject to legal or contractual restrictions on resale. These securities generally may be resold in transactions exempt from registration or to the public if the securities are registered. Disposal of these securities may involve time-consuming negotiations and expense, and prompt sale at an acceptable price may be difficult. Information regarding restricted securities held at period end is included at the end of the Schedule of Investments, if applicable.
4. Derivative Instruments.
Risk Exposures and the Use of Derivative Instruments. The Fund's investment objective allows the Fund to enter into various types of derivative contracts, including futures contracts. Derivatives are investments whose value is primarily derived from underlying assets, indices or reference rates and may be transacted on an exchange or over-the-counter (OTC). Derivatives may involve a future commitment to buy or sell a specified asset based on specified terms, to exchange future cash flows at periodic intervals based on a notional principal amount, or for one party to make one or more payments upon the occurrence of specified events in exchange for periodic payments from the other party.
The Fund used derivatives to increase returns and to manage exposure to certain risks as defined below. The success of any strategy involving derivatives depends on analysis of numerous economic factors, and if the strategies for investment do not work as intended, the Fund may not achieve its objectives.
The Fund's use of derivatives increased or decreased its exposure to the following risk:
| Equity Risk | Equity risk relates to the fluctuations in the value of financial instruments as a result of changes in market prices (other than those arising from interest rate risk or foreign exchange risk), whether caused by factors specific to an individual investment, its issuer, or all factors affecting all instruments traded in a market or market segment. |
The Fund is also exposed to additional risks from investing in derivatives, such as liquidity risk and counterparty credit risk. Liquidity risk is the risk that the Fund will be unable to close out the derivative in the open market in a timely manner. Counterparty credit risk is the risk that the counterparty will not be able to fulfill its obligation to the Fund. Counterparty credit risk related to exchange-traded futures contracts may be mitigated by the protection provided by the exchange on which they trade.
Investing in derivatives may involve greater risks than investing in the underlying assets directly and, to varying degrees, may involve risk of loss in excess of any initial investment and collateral received and amounts recognized in the Statement of Assets and Liabilities. In addition, there may be the risk that the change in value of the derivative contract does not correspond to the change in value of the underlying instrument.
Futures Contracts. A futures contract is an agreement between two parties to buy or sell a specified underlying instrument for a fixed price at a specified future date. The Fund used futures contracts to manage its exposure to the stock market.
Upon entering into a futures contract, a fund is required to deposit either cash or securities (initial margin) with a clearing broker in an amount equal to a certain percentage of the face value of the contract. Futures contracts are marked-to-market daily and subsequent daily payments variation margin) are made or received by a fund depending on the daily fluctuations in the value of the futures contracts and are recorded as unrealized appreciation or (depreciation). This receivable and/or payable, if any, is included in daily variation margin on futures contracts in the Statement of Assets and Liabilities. Realized gain or (loss) is recorded upon the expiration or closing of a futures contract. The net realized gain (loss) and change in net unrealized appreciation (depreciation) on futures contracts during the period is presented in the Statement of Operations.
Any open futures contracts at period end are presented in the Schedule of Investments under the caption "Futures Contracts". The notional amount at value reflects each contract's exposure to the underlying instrument or index at period end and is representative of volume of activity during the period. Securities deposited to meet initial margin requirements are identified in the Schedule of Investments.
5. Purchases and Sales of Investments.
Purchases and sales of securities, other than short-term securities and in-kind transactions, as applicable, are noted in the table below.
| Purchases ($) | Sales ($) | |
| Fidelity International Equity Central Fund | 1,740,894,625 | 1,756,553,018 |
6. Fees and Other Transactions with Affiliates.
Management Fee and Expense Contract. Fidelity Management & Research Company LLC (the investment adviser) provides the Fund with investment management services. The Fund does not pay any fees for these services. Pursuant to the Fund's management contract, the investment adviser receives a monthly management fee that represents a portion of the management fees it receives from the Investing Funds. In addition, under an expense contract, the investment adviser also pays all other expenses of the Fund, excluding custody fees, the compensation of the independent Directors, and certain miscellaneous expenses such as proxy and shareholder meeting expenses.
Brokerage Commissions. A portion of portfolio transactions were placed with brokerage firms which are affiliates of the investment adviser. Brokerage commissions are included in net realized gain (loss) and change in net unrealized appreciation (depreciation) in the Statement of Operations. The commissions paid to these affiliated firms were as follows:
| Amount | |
| Fidelity International Equity Central Fund | $2,128 |
Interfund Trades. Funds may purchase from or sell securities to other Fidelity Funds under procedures adopted by the Board. The procedures have been designed to ensure these interfund trades are executed in accordance with Rule 17a-7 of the 1940 Act. Any interfund trades are included within the respective purchases and sales amounts shown in the Purchases and Sales of Investments note and are noted in the table below.
| Purchases ($) | Sales ($) | |
| Fidelity International Equity Central Fund | 26,825,817 | 35,279,735 |
Other. During the period, the investment adviser reimbursed the Fund for certain losses as follows:
| Amount ($) | |
| Fidelity International Equity Central Fund | 8,207 |
7. Security Lending.
Funds lend portfolio securities from time to time in order to earn additional income. Lending agents are used, including National Financial Services (NFS), an affiliate of the investment adviser. Pursuant to a securities lending agreement, NFS will receive a fee, which is capped at 9.9% of a fund's daily lending revenue, for its services as lending agent. A fund may lend securities to certain qualified borrowers, including NFS. On the settlement date of the loan, a fund receives collateral (in the form of U.S. Treasury obligations, letters of credit and/or cash) against the loaned securities and maintains collateral in an amount not less than 100% of the market value of the loaned securities during the period of the loan. The market value of the loaned securities is determined at the close of business of a fund and any additional required collateral is delivered to a fund on the next business day. A fund or borrower may terminate the loan at any time, and if the borrower defaults on its obligation to return the securities loaned because of insolvency or other reasons, a fund may apply collateral received from the borrower against the obligation. A fund may experience delays and costs in recovering the securities loaned. Any cash collateral received is invested in the Fidelity Securities Lending Cash Central Fund. Any loaned securities are identified as such in the Schedule of Investments, and the value of loaned securities and cash collateral at period end, as applicable, are presented in the Statement of Assets and Liabilities. Security lending income represents the income earned on investing cash collateral, less rebates paid to borrowers and any lending agent fees associated with the loan, plus any premium payments received for lending certain types of securities. Security lending income is presented in the Statement of Operations as a component of income from Fidelity Central Funds. Affiliated security lending activity, if any, was as follows:
| Total Security Lending Fees Paid to NFS | Security Lending Income From Securities Loaned to NFS | Value of Securities Loaned to NFS at Period End | |
| Fidelity International Equity Central Fund | $34,905 | $– | $– |
8. Other.
Fund's organizational documents provide former and current directors and officers with a limited indemnification against liabilities arising in connection with the performance of their duties to the fund. In the normal course of business, the fund may also enter into contracts that provide general indemnifications. The fund's maximum exposure under these arrangements is unknown as this would be dependent on future claims that may be made against the fund. The risk of material loss from such claims is considered remote.
At the end of the period, mutual funds managed by the investment adviser or its affiliates were the owners of record of all of the outstanding shares of the Fund.
9. Coronavirus (COVID-19) Pandemic.
An outbreak of COVID-19 first detected in China during December 2019 has since spread globally and was declared a pandemic by the World Health Organization during March 2020. Developments that disrupt global economies and financial markets, such as the COVID-19 pandemic, may magnify factors that affect the Fund's performance.
Report of Independent Registered Public Accounting Firm
To the Board of Trustees of Fidelity Central Investment Portfolios LLC and Shareholders of Fidelity International Equity Central Fund
Opinion on the Financial Statements and Financial Highlights
We have audited the accompanying statement of assets and liabilities of Fidelity International Equity Central Fund (the "Fund"), a fund of Fidelity Central Investment Portfolios LLC, including the schedule of investments, as of September 30, 2021, the related statement of operations for the year then ended, the statement of changes in net assets for each of the two years in the period then ended, the financial highlights for each of the five years in the period then ended, and the related notes. In our opinion, the financial statements and financial highlights present fairly, in all material respects, the financial position of the Fund as of September 30, 2021, and the results of its operations for the year then ended, the changes in its net assets for each of the two years in the period then ended, and the financial highlights for each of the five years in the period then ended in conformity with accounting principles generally accepted in the United States of America.
Basis for Opinion
These financial statements and financial highlights are the responsibility of the Fund's management. Our responsibility is to express an opinion on the Fund's financial statements and financial highlights based on our audits. We are a public accounting firm registered with the Public Company Accounting Oversight Board (United States) (PCAOB) and are required to be independent with respect to the Fund in accordance with the U.S. federal securities laws and the applicable rules and regulations of the Securities and Exchange Commission and the PCAOB.
We conducted our audits in accordance with the standards of the PCAOB. Those standards require that we plan and perform the audit to obtain reasonable assurance about whether the financial statements and financial highlights are free of material misstatement, whether due to error or fraud. The Fund is not required to have, nor were we engaged to perform, an audit of its internal control over financial reporting. As part of our audits we are required to obtain an understanding of internal control over financial reporting but not for the purpose of expressing an opinion on the effectiveness of the Fund’s internal control over financial reporting. Accordingly, we express no such opinion.
Our audits included performing procedures to assess the risks of material misstatement of the financial statements and financial highlights, whether due to error or fraud, and performing procedures that respond to those risks. Such procedures included examining, on a test basis, evidence regarding the amounts and disclosures in the financial statements and financial highlights. Our audits also included evaluating the accounting principles used and significant estimates made by management, as well as evaluating the overall presentation of the financial statements and financial highlights. Our procedures included confirmation of securities owned as of September 30, 2021, by correspondence with the custodian and brokers; when replies were not received from brokers, we performed other auditing procedures. We believe that our audits provide a reasonable basis for our opinion.
/s/ Deloitte & Touche LLP
Boston, Massachusetts
November 11, 2021
We have served as the auditor of one or more of the Fidelity investment companies since 1999.
Directors and Officers (Trustees and Officers)
The Trustees, Members of the Advisory Board (if any), and officers of the Fidelity Central Investment Portfolios LLC and fund, as applicable, are listed below. The Board of Trustees governs the fund and is responsible for protecting the interests of shareholders. The Trustees are experienced executives who meet periodically throughout the year to oversee the fund's activities, review contractual arrangements with companies that provide services to the fund, oversee management of the risks associated with such activities and contractual arrangements, and review the fund's performance. Each of the Trustees oversees 313 funds.
The Trustees hold office without limit in time except that (a) any Trustee may resign; (b) any Trustee may be removed by written instrument, signed by at least two-thirds of the number of Trustees prior to such removal; (c) any Trustee who requests to be retired or who has become incapacitated by illness or injury may be retired by written instrument signed by a majority of the other Trustees; and (d) any Trustee may be removed at any special meeting of shareholders by a two-thirds vote of the outstanding voting securities of the trust. Each Trustee who is not an interested person (as defined in the 1940 Act) of the trust and the fund is referred to herein as an Independent Trustee. Each Independent Trustee shall retire not later than the last day of the calendar year in which his or her 75th birthday occurs. The Independent Trustees may waive this mandatory retirement age policy with respect to individual Trustees. Officers and Advisory Board Members hold office without limit in time, except that any officer or Advisory Board Member may resign or may be removed by a vote of a majority of the Trustees at any regular meeting or any special meeting of the Trustees. Except as indicated, each individual has held the office shown or other offices in the same company for the past five years.
The fund’s Statement of Additional Information (SAI) includes more information about the Trustees. To request a free copy, call Fidelity at 1-800-544-8544.
Experience, Skills, Attributes, and Qualifications of the Trustees. The Governance and Nominating Committee has adopted a statement of policy that describes the experience, qualifications, attributes, and skills that are necessary and desirable for potential Independent Trustee candidates (Statement of Policy). The Board believes that each Trustee satisfied at the time he or she was initially elected or appointed a Trustee, and continues to satisfy, the standards contemplated by the Statement of Policy. The Governance and Nominating Committee also engages professional search firms to help identify potential Independent Trustee candidates who have the experience, qualifications, attributes, and skills consistent with the Statement of Policy. From time to time, additional criteria based on the composition and skills of the current Independent Trustees, as well as experience or skills that may be appropriate in light of future changes to board composition, business conditions, and regulatory or other developments, have also been considered by the professional search firms and the Governance and Nominating Committee. In addition, the Board takes into account the Trustees' commitment and participation in Board and committee meetings, as well as their leadership of standing and ad hoc committees throughout their tenure.
In determining that a particular Trustee was and continues to be qualified to serve as a Trustee, the Board has considered a variety of criteria, none of which, in isolation, was controlling. The Board believes that, collectively, the Trustees have balanced and diverse experience, qualifications, attributes, and skills, which allow the Board to operate effectively in governing the fund and protecting the interests of shareholders. Information about the specific experience, skills, attributes, and qualifications of each Trustee, which in each case led to the Board's conclusion that the Trustee should serve (or continue to serve) as a trustee of the fund, is provided below.
Board Structure and Oversight Function. Robert A. Lawrence is an interested person and currently serves as Acting Chairman. The Trustees have determined that an interested Chairman is appropriate and benefits shareholders because an interested Chairman has a personal and professional stake in the quality and continuity of services provided to the fund. Independent Trustees exercise their informed business judgment to appoint an individual of their choosing to serve as Chairman, regardless of whether the Trustee happens to be independent or a member of management. The Independent Trustees have determined that they can act independently and effectively without having an Independent Trustee serve as Chairman and that a key structural component for assuring that they are in a position to do so is for the Independent Trustees to constitute a substantial majority for the Board. The Independent Trustees also regularly meet in executive session. David M. Thomas serves as Lead Independent Trustee and as such (i) acts as a liaison between the Independent Trustees and management with respect to matters important to the Independent Trustees and (ii) with management prepares agendas for Board meetings.
Fidelity® funds are overseen by different Boards of Trustees. The fund's Board oversees Fidelity's high income and certain equity funds, and other Boards oversee Fidelity's investment-grade bond, money market, asset allocation, and other equity funds. The asset allocation funds may invest in Fidelity® funds overseen by the fund's Board. The use of separate Boards, each with its own committee structure, allows the Trustees of each group of Fidelity® funds to focus on the unique issues of the funds they oversee, including common research, investment, and operational issues. On occasion, the separate Boards establish joint committees to address issues of overlapping consequences for the Fidelity® funds overseen by each Board.
The Trustees operate using a system of committees to facilitate the timely and efficient consideration of all matters of importance to the Trustees, the fund, and fund shareholders and to facilitate compliance with legal and regulatory requirements and oversight of the fund's activities and associated risks. The Board, acting through its committees, has charged FMR and its affiliates with (i) identifying events or circumstances the occurrence of which could have demonstrably adverse effects on the fund's business and/or reputation; (ii) implementing processes and controls to lessen the possibility that such events or circumstances occur or to mitigate the effects of such events or circumstances if they do occur; and (iii) creating and maintaining a system designed to evaluate continuously business and market conditions in order to facilitate the identification and implementation processes described in (i) and (ii) above. Because the day-to-day operations and activities of the fund are carried out by or through FMR, its affiliates, and other service providers, the fund's exposure to risks is mitigated but not eliminated by the processes overseen by the Trustees. While each of the Board's committees has responsibility for overseeing different aspects of the fund's activities, oversight is exercised primarily through the Operations, Audit, and Compliance Committees. Appropriate personnel, including but not limited to the fund's Chief Compliance Officer (CCO), FMR's internal auditor, the independent accountants, the fund's Treasurer and portfolio management personnel, make periodic reports to the Board's committees, as appropriate, including an annual review of Fidelity's risk management program for the Fidelity® funds. The responsibilities of each standing committee, including their oversight responsibilities, are described further under "Standing Committees of the Trustees."
Interested Trustees*:
Correspondence intended for a Trustee who is an interested person may be sent to Fidelity Investments, 245 Summer Street, Boston, Massachusetts 02210.
Name, Year of Birth; Principal Occupations and Other Relevant Experience+
Bettina Doulton (1964)
Year of Election or Appointment: 2020
Trustee
Ms. Doulton also serves as Trustee of other Fidelity® funds. Prior to her retirement, Ms. Doulton served in a variety of positions at Fidelity Investments, including as a managing director of research (2006-2007), portfolio manager to certain Fidelity® funds (1993-2005), equity analyst and portfolio assistant (1990-1993), and research assistant (1987-1990). Ms. Doulton currently owns and operates Phi Builders + Architects and Cellardoor Winery. Previously, Ms. Doulton served as a member of the Board of Brown Capital Management, LLC (2014-2018).
Robert A. Lawrence (1952)
Year of Election or Appointment: 2020
Trustee
Acting Chairman of the Board of Trustees
Mr. Lawrence also serves as Trustee of other funds. Previously, Mr. Lawrence served as a Member of the Advisory Board of certain funds. Prior to his retirement in 2008, Mr. Lawrence served as Vice President of certain Fidelity® funds (2006-2008), Senior Vice President, Head of High Income Division of Fidelity Management & Research Company (investment adviser firm, 2006-2008), and President of Fidelity Strategic Investments (investment adviser firm, 2002-2005).
* Determined to be an “Interested Trustee” by virtue of, among other things, his or her affiliation with the Fidelity Central Investment Portfolios LLC or various entities under common control with FMR.
+ The information includes the Trustee's principal occupation during the last five years and other information relating to the experience, attributes, and skills relevant to the Trustee's qualifications to serve as a Trustee, which led to the conclusion that the Trustee should serve as a Trustee for the fund.
Independent Trustees:
Correspondence intended for an Independent Trustee may be sent to Fidelity Investments, P.O. Box 55235, Boston, Massachusetts 02205-5235.
Name, Year of Birth; Principal Occupations and Other Relevant Experience+
Thomas P. Bostick (1956)
Year of Election or Appointment: 2021
Trustee
Lieutenant General Bostick also serves as Trustee of other Fidelity® funds. Prior to his retirement, General Bostick (United States Army, Retired) held a variety of positions within the U.S. Army, including Commanding General and Chief of Engineers, U.S. Army Corps of Engineers (2012-2016) and Deputy Chief of Staff and Director of Human Resources, U.S. Army (2009-2012). General Bostick currently serves as a member of the Board and Finance and Governance Committees of CSX Corporation (transportation, 2020-present) and a member of the Board and Corporate Governance and Nominating Committee of Perma-Fix Environmental Services, Inc. (nuclear waste management, 2020-present). General Bostick serves as Chief Executive Officer of Bostick Global Strategies, LLC (consulting, 2016-present) and Managing Partner, Sustainability, of Ridge-Lane Limited Partners (strategic advisory and venture development, 2016-present). Previously, General Bostick served as a Member of the Advisory Board of certain Fidelity® funds (2021), President, Intrexon Bioengineering (2018-2020) and Chief Operating Officer (2017-2020) and Senior Vice President of the Environment Sector (2016-2017) of Intrexon Corporation (biopharmaceutical company).
Dennis J. Dirks (1948)
Year of Election or Appointment: 2005
Trustee
Mr. Dirks also serves as Trustee of other Fidelity® funds. Prior to his retirement in May 2003, Mr. Dirks served as Chief Operating Officer and as a member of the Board of The Depository Trust & Clearing Corporation (financial markets infrastructure), President, Chief Operating Officer and a member of the Board of The Depository Trust Company (DTC), President and a member of the Board of the National Securities Clearing Corporation (NSCC), Chief Executive Officer and a member of the Board of the Government Securities Clearing Corporation and Chief Executive Officer and a member of the Board of the Mortgage-Backed Securities Clearing Corporation. Mr. Dirks currently serves as a member of the Finance Committee (2016-present) and Board (2017-present) and is Treasurer (2018-present) of the Asolo Repertory Theatre.
Donald F. Donahue (1950)
Year of Election or Appointment: 2018
Trustee
Mr. Donahue also serves as Trustee of other Fidelity® funds. Mr. Donahue serves as President and Chief Executive Officer of Miranda Partners, LLC (risk consulting for the financial services industry, 2012-present). Previously, Mr. Donahue served as Chief Executive Officer (2006-2012), Chief Operating Officer (2003-2006) and Managing Director, Customer Marketing and Development (1999-2003) of The Depository Trust & Clearing Corporation (financial markets infrastructure). Mr. Donahue currently serves as a member (2007-present) and Co-Chairman (2016-present) of the Board of United Way of New York and a member of the Board of NYC Leadership Academy (2012-present). Mr. Donahue previously served as a member of the Advisory Board of certain Fidelity® funds (2015-2018).
Vicki L. Fuller (1957)
Year of Election or Appointment: 2020
Trustee
Ms. Fuller also serves as Trustee of other Fidelity® funds. Previously, Ms. Fuller served as a member of the Advisory Board of certain Fidelity® funds (2018-2020), Chief Investment Officer of the New York State Common Retirement Fund (2012-2018) and held a variety of positions at AllianceBernstein L.P. (global asset management, 1985-2012), including Managing Director (2006-2012) and Senior Vice President and Senior Portfolio Manager (2001-2006). Ms. Fuller currently serves as a member of the Board, Audit Committee and Nominating and Governance Committee of The Williams Companies, Inc. (natural gas infrastructure, 2018-present), as a member of the Board, Audit Committee and Nominating and Governance Committee of two Blackstone business development companies (2020-present) and as a member of the Board of Treliant, LLC (consulting, 2019-present).
Patricia L. Kampling (1959)
Year of Election or Appointment: 2020
Trustee
Ms. Kampling also serves as Trustee of other Fidelity® funds. Prior to her retirement, Ms. Kampling served as Chairman of the Board and Chief Executive Officer (2012-2019), President and Chief Operating Officer (2011-2012) and Executive Vice President and Chief Financial Officer (2010-2011) of Alliant Energy Corporation. Ms. Kampling currently serves as a member of the Board, Finance Committee and Governance, Compensation and Nominating Committee of Xcel Energy Inc. (utilities company, 2020-present) and as a member of the Board, Audit, Finance and Risk Committee and Safety, Environmental, Technology and Operations Committee of American Water Works Company, Inc. (utilities company, 2019-present). In addition, Ms. Kampling currently serves as a member of the Board of the Nature Conservancy, Wisconsin Chapter (2019-present). Previously, Ms. Kampling served as a Member of the Advisory Board of certain Fidelity® funds (2020), a member of the Board, Compensation Committee and Executive Committee and Chair of the Audit Committee of Briggs & Stratton Corporation (manufacturing, 2011-2021), a member of the Board of Interstate Power and Light Company (2012-2019) and Wisconsin Power and Light Company (2012-2019) (each a subsidiary of Alliant Energy Corporation) and as a member of the Board and Workforce Development Committee of the Business Roundtable (2018-2019).
Thomas A. Kennedy (1955)
Year of Election or Appointment: 2021
Trustee
Mr. Kennedy also serves as Trustee of other Fidelity® funds. Previously, Mr. Kennedy served as a Member of the Advisory Board of certain Fidelity® funds (2020) and held a variety of positions at Raytheon Company (aerospace and defense, 1983-2020), including Chairman and Chief Executive Officer (2014-2020) and Executive Vice President and Chief Operating Officer (2013-2014). Mr. Kennedy currently serves as Executive Chairman of the Board of Directors of Raytheon Technologies Corporation (aerospace and defense, 2020-present). He is also a member of the Rutgers School of Engineering Industry Advisory Board (2011-present) and a member of the UCLA Engineering Dean’s Executive Board (2016-present).
Oscar Munoz (1959)
Year of Election or Appointment: 2021
Trustee
Mr. Munoz also serves as Trustee of other Fidelity® funds. Prior to his retirement, Mr. Munoz served as Executive Chairman (2020-2021), Chief Executive Officer (2015-2020), President (2015-2016) and a member of the Board (2010-2021) of United Airlines Holdings, Inc. Mr. Munoz currently serves as a member of the Board of CBRE Group, Inc. (commercial real estate, 2020-present), a member of the Board of Univision Communications, Inc. (Hispanic media, 2020-present) and a member of the Advisory Board of Salesforce.com, Inc. (cloud-based software, 2020-present). Previously, Mr. Munoz served as a Member of the Advisory Board of certain Fidelity® funds (2021).
Garnett A. Smith (1947)
Year of Election or Appointment: 2018
Trustee
Mr. Smith also serves as Trustee of other Fidelity® funds. Prior to his retirement, Mr. Smith served as Chairman and Chief Executive Officer (1990-1997) and President (1986-1990) of Inbrand Corp. (manufacturer of personal absorbent products). Prior to his employment with Inbrand Corp., he was employed by a retail fabric chain and North Carolina National Bank (now Bank of America). Mr. Smith previously served as a member of the Advisory Board of certain Fidelity® funds (2012-2013).
David M. Thomas (1949)
Year of Election or Appointment: 2008
Trustee
Lead Independent Trustee
Mr. Thomas also serves as Trustee of other Fidelity® funds. Previously, Mr. Thomas served as Executive Chairman (2005-2006) and Chairman and Chief Executive Officer (2000-2005) of IMS Health, Inc. (pharmaceutical and healthcare information solutions). Mr. Thomas currently serves as a member of the Board of Fortune Brands Home and Security (home and security products, 2004-present) and Presiding Director (2013-present) of Interpublic Group of Companies, Inc. (marketing communication).
Susan Tomasky (1953)
Year of Election or Appointment: 2020
Trustee
Ms. Tomasky also serves as Trustee of other Fidelity® funds. Prior to her retirement, Ms. Tomasky served in various executive officer positions at American Electric Power Company, Inc. (1998-2011), including most recently as President of AEP Transmission (2007-2011). Ms. Tomasky currently serves as a member of the Board and Sustainability Committee and as Chair of the Audit Committee of Marathon Petroleum Corporation (2018-present) and as a member of the Board, Corporate Governance Committee and Organization and Compensation Committee and as Chair of the Audit Committee of Public Service Enterprise Group, Inc. (utilities company, 2012-present). In addition, Ms. Tomasky currently serves as a member (2009-present) and President (2020-present) of the Board of the Royal Shakespeare Company – America (2009-present), as a member of the Board of the Columbus Association for the Performing Arts (2011-present) and as a member of the Board and Investment Committee of Kenyon College (2016-present). Previously, Ms. Tomasky served as a Member of the Advisory Board of certain Fidelity® funds (2020), as a member of the Board of the Columbus Regional Airport Authority (2007-2020), as a member of the Board (2011-2018) and Lead Independent Director (2015-2018) of Andeavor Corporation (previously Tesoro Corporation) (independent oil refiner and marketer) and as a member of the Board of Summit Midstream Partners LP (energy, 2012-2018).
Michael E. Wiley (1950)
Year of Election or Appointment: 2018
Trustee
Mr. Wiley also serves as Trustee of other Fidelity® funds. Previously, Mr. Wiley served as a member of the Advisory Board of certain Fidelity® funds (2018-2020), Chairman, President and CEO of Baker Hughes, Inc. (oilfield services, 2000-2004). Mr. Wiley also previously served as a member of the Board of Andeavor Corporation (independent oil refiner and marketer, 2005-2018), a member of the Board of Andeavor Logistics LP (natural resources logistics, 2015-2018) and a member of the Board of High Point Resources (exploration and production, 2005-2020).
+ The information includes the Trustee's principal occupation during the last five years and other information relating to the experience, attributes, and skills relevant to the Trustee's qualifications to serve as a Trustee, which led to the conclusion that the Trustee should serve as a Trustee for the fund.
Advisory Board Members and Officers:
Correspondence intended for a Member of the Advisory Board (if any) may be sent to Fidelity Investments, P.O. Box 55235, Boston, Massachusetts 02205-5235. Correspondence intended for an officer or Peter S. Lynch may be sent to Fidelity Investments, 245 Summer Street, Boston, Massachusetts 02210. Officers appear below in alphabetical order.
Name, Year of Birth; Principal Occupation
Peter S. Lynch (1944)
Year of Election or Appointment: 2004
Member of the Advisory Board
Mr. Lynch also serves as a Member of the Advisory Board of other Fidelity® funds. Mr. Lynch is Vice Chairman and a Director of Fidelity Management & Research Company LLC (investment adviser firm). In addition, Mr. Lynch serves as a Trustee of Boston College and as the Chairman of the Inner-City Scholarship Fund. Previously, Mr. Lynch served as Vice Chairman and a Director of FMR Co., Inc. (investment adviser firm) and on the Special Olympics International Board of Directors (1997-2006).
Craig S. Brown (1977)
Year of Election or Appointment: 2019
Assistant Treasurer
Mr. Brown also serves as an officer of other funds. Mr. Brown serves as Assistant Treasurer of FIMM, LLC (2021-present) and is an employee of Fidelity Investments (2013-present).
John J. Burke III (1964)
Year of Election or Appointment: 2018
Chief Financial Officer
Mr. Burke also serves as Chief Financial Officer of other funds. Mr. Burke serves as Head of Investment Operations for Fidelity Fund and Investment Operations (2018-present) and is an employee of Fidelity Investments (1998-present). Previously Mr. Burke served as head of Asset Management Investment Operations (2012-2018).
William C. Coffey (1969)
Year of Election or Appointment: 2019
Assistant Secretary
Mr. Coffey also serves as Assistant Secretary of other funds. He is Senior Vice President and Deputy General Counsel of FMR LLC (diversified financial services company, 2010-present), and is an employee of Fidelity Investments. Previously, Mr. Coffey served as Secretary and CLO of certain funds (2018-2019); CLO, Secretary, and Senior Vice President of Fidelity Management & Research Company and FMR Co., Inc. (investment adviser firms, 2018-2019); Secretary of Fidelity SelectCo, LLC and Fidelity Investments Money Management, Inc. (investment adviser firms, 2018-2019); CLO of Fidelity Management & Research (Hong Kong) Limited, FMR Investment Management (UK) Limited, and Fidelity Management & Research (Japan) Limited (investment adviser firms, 2018-2019); and Assistant Secretary of certain funds (2009-2018).
Timothy M. Cohen (1969)
Year of Election or Appointment: 2018
Vice President
Mr. Cohen also serves as Vice President of other funds. Mr. Cohen serves as Co-Head of Equity (2018-present), a Director of Fidelity Management & Research (Japan) Limited (investment adviser firm, 2016-present), and is an employee of Fidelity Investments. Previously, Mr. Cohen served as Executive Vice President of Fidelity SelectCo, LLC (2019), Head of Global Equity Research (2016-2018), Chief Investment Officer - Equity and a Director of Fidelity Management & Research (U.K.) Inc. (investment adviser firm, 2013-2015) and as a Director of Fidelity Management & Research (Hong Kong) Limited (investment adviser firm, 2017).
Jonathan Davis (1968)
Year of Election or Appointment: 2010
Assistant Treasurer
Mr. Davis also serves as an officer of other funds. Mr. Davis serves as Assistant Treasurer of FIMM, LLC (2021-present), FMR Capital, Inc. (2017-present), FD Funds GP LLC (2021-present), FD Funds Holding LLC (2021-present), and FD Funds Management LLC (2021-present); and is an employee of Fidelity Investments. Previously, Mr. Davis served as Vice President and Associate General Counsel of FMR LLC (diversified financial services company, 2003-2010).
Laura M. Del Prato (1964)
Year of Election or Appointment: 2018
Assistant Treasurer
Ms. Del Prato also serves as an officer of other funds. Ms. Del Prato serves as Assistant Treasurer of FIMM, LLC (2021-present) and is an employee of Fidelity Investments (2017-present). Previously, Ms. Del Prato served as President and Treasurer of The North Carolina Capital Management Trust: Cash Portfolio and Term Portfolio (2018-2020). Prior to joining Fidelity Investments, Ms. Del Prato served as a Managing Director and Treasurer of the JPMorgan Mutual Funds (2014-2017). Prior to JPMorgan, Ms. Del Prato served as a partner at Cohen Fund Audit Services (accounting firm, 2012-2013) and KPMG LLP (accounting firm, 2004-2012).
Colm A. Hogan (1973)
Year of Election or Appointment: 2020
Assistant Treasurer
Mr. Hogan also serves as an officer of other funds. Mr. Hogan serves as Assistant Treasurer of FIMM, LLC (2021-present) and FMR Capital, Inc. (2017-present) and is an employee of Fidelity Investments (2005-present). Previously, Mr. Hogan served as Deputy Treasurer of certain Fidelity® funds (2016-2020) and Assistant Treasurer of certain Fidelity® funds (2016-2018).
Pamela R. Holding (1964)
Year of Election or Appointment: 2018
Vice President
Ms. Holding also serves as Vice President of other funds. Ms. Holding serves as Co-Head of Equity (2018-present) and is an employee of Fidelity Investments (2013-present). Previously, Ms. Holding served as Executive Vice President of Fidelity SelectCo, LLC (2019) and as Chief Investment Officer of Fidelity Institutional Asset Management (2013-2018).
Cynthia Lo Bessette (1969)
Year of Election or Appointment: 2019
Secretary and Chief Legal Officer (CLO)
Ms. Lo Bessette also serves as an officer of other funds. Ms. Lo Bessette serves as CLO, Secretary, and Senior Vice President of Fidelity Management & Research Company LLC (investment adviser firm, 2019-present); CLO of Fidelity Management & Research (Hong Kong) Limited, FMR Investment Management (UK) Limited, and Fidelity Management & Research (Japan) Limited (investment adviser firms, 2019-present); Secretary of FD Funds GP LLC (2021-present), FD Funds Holding LLC (2021-present), and FD Funds Management LLC (2021-present); and Assistant Secretary of FIMM, LLC (2019-present). She is a Senior Vice President and Deputy General Counsel of FMR LLC (diversified financial services company, 2019-present), and is an employee of Fidelity Investments. Previously, Ms. Lo Bessette served as CLO, Secretary, and Senior Vice President of FMR Co., Inc. (investment adviser firm, 2019); Secretary of Fidelity SelectCo, LLC and Fidelity Investments Money Management, Inc. (investment adviser firms, 2019). Prior to joining Fidelity Investments, Ms. Lo Bessette was Executive Vice President, General Counsel (2016-2019) and Senior Vice President, Deputy General Counsel (2015-2016) of OppenheimerFunds (investment management company) and Deputy Chief Legal Officer (2013-2015) of Jennison Associates LLC (investment adviser firm).
Chris Maher (1972)
Year of Election or Appointment: 2020
Deputy Treasurer
Mr. Maher also serves as an officer of other funds. Mr. Maher serves as Assistant Treasurer of FIMM, LLC (2021-present) and FMR Capital, Inc. (2017-present), and is an employee of Fidelity Investments (2008-present). Previously, Mr. Maher served as Assistant Treasurer of certain funds (2013-2020); Vice President of Asset Management Compliance (2013), Vice President of the Program Management Group of FMR (investment adviser firm, 2010-2013), and Vice President of Valuation Oversight (2008-2010).
Jason P. Pogorelec (1975)
Year of Election or Appointment: 2020
Chief Compliance Officer
Mr. Pogorelec also serves as Chief Compliance Officer of other funds. Mr. Pogorelec is a senior Vice President of Asset Management Compliance for Fidelity Investments and is an employee of Fidelity Investments (2006-present). Previously, Mr. Pogorelec served as Vice President, Associate General Counsel for Fidelity Investments (2010-2020) and Assistant Secretary of certain Fidelity funds (2015-2020).
Brett Segaloff (1972)
Year of Election or Appointment: 2021
Anti-Money Laundering (AML) Officer
Mr. Segaloff also serves as an AML Officer of other funds and other related entities. He is Director, Anti-Money Laundering (2007-present) of FMR LLC (diversified financial services company) and is an employee of Fidelity Investments (1996-present).
Stacie M. Smith (1974)
Year of Election or Appointment: 2016
President and Treasurer
Ms. Smith also serves as an officer of other funds. Ms. Smith serves as Assistant Treasurer of FIMM, LLC (2021-present) and FMR Capital, Inc. (2017-present), is an employee of Fidelity Investments (2009-present), and has served in other fund officer roles. Prior to joining Fidelity Investments, Ms. Smith served as Senior Audit Manager of Ernst & Young LLP (accounting firm, 1996-2009). Previously, Ms. Smith served as Assistant Treasurer (2013-2019) and Deputy Treasurer (2013-2016) of certain Fidelity® funds.
Jim Wegmann (1979)
Year of Election or Appointment: 2019
Assistant Treasurer
Mr. Wegmann also serves as an officer of other funds. Mr. Wegmann serves as Assistant Treasurer of FIMM, LLC (2021-present) and is an employee of Fidelity Investments (2011-present).
Shareholder Expense Example
As a shareholder, you incur two types of costs: (1) transaction costs, which may include sales charges (loads) on purchase payments or redemption proceeds, as applicable and (2) ongoing costs, which generally include management fees, distribution and/or service (12b-1) fees and other Fund expenses. This Example is intended to help you understand your ongoing costs (in dollars) of investing in a fund and to compare these costs with the ongoing costs of investing in other mutual funds.
The Example is based on an investment of $1,000 invested at the beginning of the period and held for the entire period (April 1, 2021 to September 30, 2021).
Actual Expenses
The first line of the accompanying table provides information about actual account values and actual expenses. You may use the information in this line, together with the amount you invested, to estimate the expenses that you paid over the period. Simply divide your account value by $1,000.00 (for example, an $8,600 account value divided by $1,000.00 = 8.6), then multiply the result by the number in the first line for a class/Fund under the heading entitled "Expenses Paid During Period" to estimate the expenses you paid on your account during this period. If any fund is a shareholder of any underlying mutual funds or exchange-traded funds (ETFs) (the Underlying Funds), such fund indirectly bears its proportional share of the expenses of the Underlying Funds in addition to the direct expenses incurred presented in the table. These fees and expenses are not included in the annualized expense ratio used to calculate the expense estimate in the table below.
Hypothetical Example for Comparison Purposes
The second line of the accompanying table provides information about hypothetical account values and hypothetical expenses based on the actual expense ratio and an assumed rate of return of 5% per year before expenses, which is not the actual return. The hypothetical account values and expenses may not be used to estimate the actual ending account balance or expenses you paid for the period. You may use this information to compare the ongoing costs of investing in the Fund and other funds. To do so, compare this 5% hypothetical example with the 5% hypothetical examples that appear in the shareholder reports of the other funds. If any fund is a shareholder of any Underlying Funds, such fund indirectly bears its proportional share of the expenses of the Underlying Funds in addition to the direct expenses as presented in the table. These fees and expenses are not included in the annualized expense ratio used to calculate the expense estimate in the table below.
Please note that the expenses shown in the table are meant to highlight your ongoing costs only and do not reflect any transaction costs. Therefore, the second line of the table is useful in comparing ongoing costs only, and will not help you determine the relative total costs of owning different funds.
| Annualized Expense Ratio-A | Beginning Account Value April 1, 2021 | Ending Account Value September 30, 2021 | Expenses Paid During Period-B April 1, 2021 to September 30, 2021 | |
| Fidelity International Equity Central Fund | .0089% | |||
| Actual | $1,000.00 | $1,089.20 | $.05 | |
| Hypothetical-C | $1,000.00 | $1,025.02 | $.05 |
A Annualized expense ratio reflects expenses net of applicable fee waivers.
B Expenses are equal to the annualized expense ratio, multiplied by the average account value over the period, multiplied by 183/ 365 (to reflect the one-half year period). The fees and expenses of any Underlying Funds are not included in each annualized expense ratio.
C 5% return per year before expenses
Distributions (Unaudited)
The fund hereby designates as a capital gain dividend with respect to the taxable year ended September 30, 2021, $ 151,485,546, or, if subsequently determined to be different, the net capital gain of such year.
A percentage of the dividends distributed during the fiscal year for the following funds qualify for the dividends–received deduction for corporate shareholders:
| October 2020 | 0% |
| November 2020 | 0% |
| December 2020 | 2% |
| March 2021 | 2% |
| June 2021 | 2% |
| September 2021 | 2% |
A percentage of the dividends distributed during the fiscal year for the fund may be taken into account as a dividend for purposes of the maximum rate under section 1(h)(11) of the Internal Revenue Code:
| October 2020 | 100% |
| November 2020 | 94% |
| December 2020 | 57% |
| March 2021 | 100% |
| June 2021 | 100% |
| September 2021 | 100% |
The amounts per share which represent income derived from sources within, and taxes paid to, foreign countries or possessions of the United States are $.2705 and $.1225 for the dividend paid December 14, 2020.
The fund will notify shareholders in January 2022 of amounts for use in preparing 2021 income tax returns.
Board Approval of Investment Advisory Contracts and Management Fees
Fidelity International Equity Central Fund
Each year, the Board of Directors, including the Independent Directors (together, the Board), votes on the renewal of the management contract with Fidelity Management & Research Company LLC (FMR) and the sub-advisory agreements (together, the Advisory Contracts) for the fund. FMR and the sub-advisers are referred to herein as the Investment Advisers. The Board, assisted by the advice of fund counsel and Independent Directors' counsel, requests and considers a broad range of information relevant to the renewal of the Advisory Contracts throughout the year.The Board meets regularly and, at each of its meetings, covers an extensive agenda of topics and materials and considers factors that are relevant to its annual consideration of the renewal of the fund's Advisory Contracts, including the services and support provided to the fund and its shareholders. The Board has established various standing committees (Committees), each composed of and chaired by Independent Directors with varying backgrounds, to which the Board has assigned specific subject matter responsibilities in order to enhance effective decision-making by the Board. The Board, acting directly and through its Committees, requests and receives information concerning the annual consideration of the renewal of the fund's Advisory Contracts. The Board also meets as needed to review matters specifically related to the Board's annual consideration of the renewal of the Advisory Contracts. Members of the Board may also meet with trustees of other Fidelity funds through joint ad hoc committees to discuss certain matters relevant to all of the Fidelity funds.At its May 2021 meeting, the Board unanimously determined to renew the fund's Advisory Contracts. In reaching its determination, the Board considered all factors it believed relevant and reached a determination, with the assistance of fund counsel and Independent Directors' counsel and through the exercise of its business judgment, that the renewal of the Advisory Contracts was in the best interests of the fund and its shareholders and the fact that no fee is payable under the management contract was fair and reasonable.Nature, Extent, and Quality of Services Provided. The Board considered Fidelity's staffing as it relates to the fund, including the backgrounds of investment personnel of Fidelity, and also considered the fund's investment objective, strategies, and related investment philosophy. The Independent Directors also had discussions with senior management of Fidelity's investment operations and investment groups. The Board considered the structure of the investment personnel compensation program and whether this structure provides appropriate incentives to act in the best interests of the fund.Resources Dedicated to Investment Management and Support Services. The Board and the Fund Oversight and Research Committees reviewed the general qualifications and capabilities of Fidelity's investment staff, including its size, education, experience, and resources, as well as Fidelity's approach to recruiting, training, managing, and compensating investment personnel. The Board noted that Fidelity has continued to increase the resources devoted to non-U.S. offices, including expansion of Fidelity's global investment organization. The Board also noted that Fidelity's analysts have extensive resources, tools and capabilities that allow them to conduct sophisticated quantitative and fundamental analysis, as well as credit analysis of issuers, counterparties and guarantors. Further, the Board considered that Fidelity's investment professionals have sufficient access to global information and data so as to provide competitive investment results over time, and that those professionals also have access to sophisticated tools that permit them to assess portfolio construction and risk and performance attribution characteristics continuously, as well as to transmit new information and research conclusions rapidly around the world. Additionally, in its deliberations, the Board considered Fidelity's trading, risk management, compliance, and technology and operations capabilities and resources, which are integral parts of the investment management process. The Board also considered Fidelity's investments in business continuity planning, and its success in continuously providing services to the fund notwithstanding the severe disruptions caused by the COVID-19 pandemic.Administrative Services. The Board considered (i) the nature, extent, quality, and cost of advisory and administrative services performed by the Investment Advisers and their affiliates under the Advisory Contracts and under separate agreements covering transfer agency, pricing and bookkeeping, and securities lending services for the fund; (ii) the nature and extent of the supervision of third party service providers, principally custodians, subcustodians, and pricing vendors; and (iii) the resources devoted to, and the record of compliance with, the fund's compliance policies and procedures. The Board also reviewed the allocation of fund brokerage, including allocations to brokers affiliated with the Investment Advisers, and the use of "soft" commission dollars to pay for research services.Investment Performance. The Board considered whether the fund has operated in accordance with its investment objective, as well as its record of compliance with its investment restrictions. The Board reviewed the fund's absolute investment performance, as well as the fund's relative investment performance, but did not consider performance to be a material factor in its decision to renew the fund's Advisory Contracts, as the fund is not publicly offered as a stand-alone investment product. In this regard, the Board noted that the fund is designed to offer a liquid investment option for other investment companies managed by Fidelity and ultimately to enhance the performance of those investment companies.Based on its review, the Board concluded that the nature, extent, and quality of services provided to the fund under the Advisory Contracts should continue to benefit the shareholders of the fund.Competitiveness of Management Fee and Total Expense Ratio. The Board considered that while the fund does not pay a management fee, FMR receives fees for providing services to funds that invest in the fund. The Board also noted that FMR bears all expenses of the fund with certain limited exceptions (i.e., custody fees, interest, taxes, fees and expenses of the Independent Trustees, proxy and shareholder meeting expenses, and extraordinary expenses). The Board further noted that the fund pays its non-operating expenses, including brokerage commissions and fees and expenses associated with the fund's securities lending program, if applicable. Based on its review, the Board concluded that the management fee received for providing services to the fund and the fund's total expense ratio were reasonable in light of the services that the fund and its shareholders receive and the other factors considered.Costs of the Services and Profitability. The Board considered the level of Fidelity's profits in respect of all the Fidelity funds, as well as the profitability of the funds that invest in the fund.A public accounting firm has been engaged annually by the Board as part of the Board's assessment of Fidelity's profitability analysis. The engagement includes the review and assessment of the methodologies used by Fidelity in determining the revenues and expenses attributable to Fidelity's mutual fund business, and completion of agreed-upon procedures in respect of the mathematical accuracy of certain fund profitability information and its conformity to established allocation methodologies. After considering the reports issued under the engagement and information provided by Fidelity, the Board concluded that while other allocation methods may also be reasonable, Fidelity's profitability methodologies are reasonable in all material respects.The Board also reviewed Fidelity's non-fund businesses and potential indirect benefits such businesses may have received as a result of their association with Fidelity's mutual fund business (i.e., fall-out benefits) as well as cases where Fidelity's affiliates may benefit from the funds' business. The Board considered areas where potential indirect benefits to the Fidelity funds from their relationships with Fidelity may exist. The Board also considered that in 2019 a joint ad hoc committee created by it and the boards of other Fidelity funds evaluated potential fall-out benefits (PFOB Committee). The Board noted that it considered the PFOB Committee's findings in connection with its consideration of the renewal of the Advisory Contracts.The Board concluded that the costs of the services provided by and the profits realized by Fidelity in connection with the operation of the fund were not relevant to the renewal of the Advisory Contracts because the fund pays no advisory fees and FMR bears all expenses of the fund with certain exceptions.Economies of Scale. The Board concluded that because the fund pays no advisory fees and FMR bears all expenses of the fund with certain exceptions, the realization of economies of scale was not a material factor in the Board's decision to renew the fund's Advisory Contract.Additional Information Requested by the Board. In order to develop fully the factual basis for consideration of the Fidelity funds' advisory contracts, the Board requested and received additional information on certain topics, including: (i) fund flow and performance trends, in particular the underperformance of certain funds and strategies, and Fidelity's long-term strategies for certain funds; (ii) consideration of expanding the use of performance fees for additional funds; (iii) Fidelity's pricing philosophy compared to competitors; (iv) metrics for evaluating index fund and ETF performance and information about ETF trading characteristics; (v) the methodology with respect to evaluating competitive fund data and peer group classifications and fee and expense comparisons; (vi) the expense structures for different funds and classes and information about the differences between various expense structures; (vii) group fee breakpoints; (viii) information regarding other accounts managed by Fidelity and sub-advisory arrangements; and (ix) Fidelity's philosophies and strategies for evaluating funds and classes with lower or declining asset levels.Based on its evaluation of all of the conclusions noted above, and after considering all factors it believed relevant, the Board concluded that the advisory fee arrangements are fair and reasonable, and that the fund's Advisory Contracts should be renewed.![]()
INTCEN-ANN-1121
1.859208.113
Item 2.
Code of Ethics
As of the end of the period, September 30, 2021, Fidelity Central Investment Portfolios LLC (the trust) has adopted a code of ethics, as defined in Item 2 of Form N-CSR, that applies to its President and Treasurer and its Chief Financial Officer. A copy of the code of ethics is filed as an exhibit to this Form N-CSR.
Item 3.
Audit Committee Financial Expert
The Board of Trustees of the trust has determined that Joseph Mauriello is an audit committee financial expert, as defined in Item 3 of Form N-CSR. Mr. Mauriello is independent for purposes of Item 3 of Form N-CSR.
Item 4.
Principal Accountant Fees and Services
Fees and Services
The following table presents fees billed by Deloitte & Touche LLP, the member firms of Deloitte Touche Tohmatsu, and their respective affiliates (collectively, “Deloitte Entities”) in each of the last two fiscal years for services rendered to Fidelity Emerging Markets Equity Central Fund, Fidelity Floating Rate Central Fund, Fidelity International Equity Central Fund, and Fidelity Real Estate Equity Central Fund (the “Fund(s)”):
Services Billed by Deloitte Entities
September 30, 2021 FeesA
Audit Fees | Audit-Related Fees | Tax Fees | All Other Fees | |
Fidelity Emerging Markets Equity Central Fund | $39,200 | $- | $10,000 | $1,000 |
Fidelity Floating Rate Central Fund | $73,800 | $- | $8,800 | $1,700 |
Fidelity International Equity Central Fund | $44,200 | $- | $10,000 | $1,100 |
Fidelity Real Estate Equity Central Fund | $41,500 | $- | $8,100 | $900 |
September 30, 2020 FeesA
Audit Fees | Audit-Related Fees | Tax Fees | All Other Fees | |
Fidelity Emerging Markets Equity Central Fund | $40,200 | $- | $10,000 | $1,000 |
Fidelity Floating Rate Central Fund | $75,500 | $- | $8,800 | $1,600 |
Fidelity International Equity Central Fund | $45,200 | $- | $10,000 | $1,100 |
Fidelity Real Estate Central Fund | $37,900 | $- | $8,100 | $900 |
A Amounts may reflect rounding.
The following table(s) present(s) fees billed by Deloitte Entities that were required to be approved by the Audit Committee for services that relate directly to the operations and financial reporting of the Fund(s) and that are rendered on behalf of Fidelity Management & Research Company LLC ("FMR") and entities controlling, controlled by, or under common control with FMR (not including any sub-adviser whose role is primarily portfolio management and is subcontracted with or overseen by another investment adviser) that provide ongoing services to the Fund(s) (“Fund Service Providers”):
Services Billed by Deloitte Entities
September 30, 2021A | September 30, 2020A | |
Audit-Related Fees | $- | $- |
Tax Fees | $- | $3,000 |
All Other Fees | $- | $- |
A Amounts may reflect rounding.
“Audit-Related Fees” represent fees billed for assurance and related services that are reasonably related to the performance of the fund audit or the review of the fund's financial statements and that are not reported under Audit Fees.
“Tax Fees” represent fees billed for tax compliance, tax advice or tax planning that relate directly to the operations and financial reporting of the fund.
“All Other Fees” represent fees billed for services provided to the fund or Fund Service Provider, a significant portion of which are assurance related, that relate directly to the operations and financial reporting of the fund, excluding those services that are reported under Audit Fees, Audit-Related Fees or Tax Fees.
Assurance services must be performed by an independent public accountant.
* * *
The aggregate non-audit fees billed by Deloitte Entities for services rendered to the Fund(s), FMR (not including any sub-adviser whose role is primarily portfolio management and is subcontracted with or overseen by another investment adviser), and any Fund Service Provider for each of the last two fiscal years of the Fund(s) are as follows:
Billed By | September 30, 2021A | September 30, 2020A |
Deloitte Entities | $564,800 | $642,700 |
A Amounts may reflect rounding.
The trust's Audit Committee has considered non-audit services that were not pre-approved that were provided by Deloitte Entities to Fund Service Providers to be compatible with maintaining the independence of Deloitte Entities in its(their) audit of the Fund(s), taking into account representations from Deloitte Entities, in accordance with Public Company Accounting Oversight Board rules, regarding its independence from the Fund(s) and its(their) related entities and FMR’s review of the appropriateness and permissibility under applicable law of such non-audit services prior to their provision to the Fund(s) Service Providers.
Audit Committee Pre-Approval Policies and Procedures
The trust’s Audit Committee must pre-approve all audit and non-audit services provided by a fund’s independent registered public accounting firm relating to the operations or financial reporting of the fund. Prior to the commencement of any audit or non-audit services to a fund, the Audit Committee reviews the services to determine whether they are appropriate and permissible under applicable law.
The Audit Committee has adopted policies and procedures to, among other purposes, provide a framework for the Committee’s consideration of non-audit services by the audit firms that audit the Fidelity funds. The policies and procedures require that any non-audit service provided by a fund audit firm to a Fidelity fund and any non-audit service provided by a fund auditor to a Fund Service Provider that relates directly to the operations and financial reporting of a Fidelity fund (“Covered Service”) are subject to approval by the Audit Committee before such service is provided.
All Covered Services must be approved in advance of provision of the service either: (i) by formal resolution of the Audit Committee, or (ii) by oral or written approval of the service by the Chair of the Audit Committee (or if the Chair is unavailable, such other member of the Audit Committee as may be designated by the Chair to act in the Chair’s absence). The approval contemplated by (ii) above is permitted where the Treasurer determines that action on such an engagement is necessary before the next meeting of the Audit Committee.
Non-audit services provided by a fund audit firm to a Fund Service Provider that do not relate directly to the operations and financial reporting of a Fidelity fund are reported to the Audit Committee periodically.
Non-Audit Services Approved Pursuant to Rule 2-01(c)(7)(i)(C) and (ii) of Regulation S-X (“De Minimis Exception”)
There were no non-audit services approved or required to be approved by the Audit Committee pursuant to the De Minimis Exception during the Fund’s(s’) last two fiscal years relating to services provided to (i) the Fund(s) or (ii) any Fund Service Provider that relate directly to the operations and financial reporting of the Fund(s).
Item 5.
Audit Committee of Listed Registrants
Not applicable.
Item 6.
Investments
(a)
Not applicable.
(b)
Not applicable.
Item 7.
Disclosure of Proxy Voting Policies and Procedures for Closed-End Management Investment Companies
Not applicable.
Item 8.
Portfolio Managers of Closed-End Management Investment Companies
Not applicable.
Item 9.
Purchase of Equity Securities by Closed-End Management Investment Company and Affiliated Purchasers
Not applicable.
Item 10.
Submission of Matters to a Vote of Security Holders
There were no material changes to the procedures by which shareholders may recommend nominees to the trust’s Board of Trustees.
Item 11.
Controls and Procedures
(a)(i) The President and Treasurer and the Chief Financial Officer have concluded that the trust’s disclosure controls and procedures (as defined in Rule 30a-3(c) under the Investment Company Act) provide reasonable assurances that material information
relating to the trust is made known to them by the appropriate persons, based on their evaluation of these controls and procedures as of a date within 90 days of the filing date of this report.
(a)(ii) There was no change in the trust’s internal control over financial reporting (as defined in Rule 30a-3(d) under the Investment Company Act) that occurred during the period covered by this report that has materially affected, or is reasonably likely to materially affect, the trust’s internal control over financial reporting.
Item 12.
Disclosure of Securities Lending Activities for Closed-End Management
Investment Companies
Not applicable.
Item 13.
Exhibits
(a) | (1) | Code of Ethics pursuant to Item 2 of Form N-CSR is filed and attached hereto as EX-99.CODE ETH. |
(a) | (2) | |
(a) | (3) | Not applicable. |
(b) |
SIGNATURES
Pursuant to the requirements of the Securities Exchange Act of 1934 and the Investment Company Act of 1940, the registrant has duly caused this report to be signed on its behalf by the undersigned, thereunto duly authorized.
Fidelity Central Investment Portfolios LLC
By: | /s/Stacie M. Smith |
Stacie M. Smith | |
President and Treasurer | |
Date: | November 18, 2021 |
Pursuant to the requirements of the Securities Exchange Act of 1934 and the Investment Company Act of 1940, this report has been signed below by the following persons on behalf of the registrant and in the capacities and on the dates indicated.
By: | /s/Stacie M. Smith |
Stacie M. Smith | |
President and Treasurer | |
Date: | November 18, 2021 |
By: | /s/John J. Burke III |
John J. Burke III | |
Chief Financial Officer | |
Date: | November 18, 2021 |