UNITED STATES
SECURITIES AND EXCHANGE COMMISSION
Washington, D.C. 20549
FORM N-CSR
CERTIFIED SHAREHOLDER REPORT OF REGISTERED
MANAGEMENT INVESTMENT COMPANIES
Investment Company Act file number 811-21667
Fidelity Central Investment Portfolios LLC
(Exact name of registrant as specified in charter)
245 Summer St., Boston, Massachusetts 02210
(Address of principal executive offices) (Zip code)
Cynthia Lo Bessette, Secretary
245 Summer St.
Boston, Massachusetts 02210
(Name and address of agent for service)
Registrant's telephone number, including area code:
617-563-7000
| |
Date of fiscal year end: | August 31 |
|
|
Date of reporting period: | August 31, 2022 |
Item 1.
Reports to Stockholders
Fidelity® High Income Central Fund
Annual Report
August 31, 2022


Contents
To view a fund's proxy voting guidelines and proxy voting record for the 12-month period ended June 30, visit http://www.fidelity.com/proxyvotingresults or visit the Securities and Exchange Commission's (SEC) web site at http://www.sec.gov.
You may also call 1-800-544-8544 to request a free copy of the proxy voting guidelines.
Standard & Poor's, S&P and S&P 500 are registered service marks of The McGraw-Hill Companies, Inc. and have been licensed for use by Fidelity Distributors Corporation.
Other third-party marks appearing herein are the property of their respective owners.
All other marks appearing herein are registered or unregistered trademarks or service marks of FMR LLC or an affiliated company. © 2022 FMR LLC. All rights reserved.
A fund files its complete schedule of portfolio holdings with the SEC for the first and third quarters of each fiscal year on Form N-PORT. Forms N-PORT are available on the SEC’s web site at http://www.sec.gov. A fund's Forms N-PORT may be reviewed and copied at the SEC’s Public Reference Room in Washington, DC. Information regarding the operation of the SEC's Public Reference Room may be obtained by calling 1-800-SEC-0330.
Performance: The Bottom Line
Average annual total return reflects the change in the value of an investment, assuming reinvestment of distributions from dividend income and capital gains (the profits earned upon the sale of securities that have grown in value, if any) and assuming a constant rate of performance each year. The hypothetical investment and the average annual total returns do not reflect the deduction of taxes that a shareholder would pay on fund distributions or the redemption of fund shares. During periods of reimbursement by Fidelity, a fund’s total return will be greater than it would be had the reimbursement not occurred. How a fund did yesterday is no guarantee of how it will do tomorrow.
Average Annual Total Returns
| For the periods ended August 31, 2022 | Past 1 year | Past 5 years | Past 10 years |
| Fidelity® High Income Central Fund | (5.81)% | 4.28% | 5.34% |
$10,000 Over 10 Years
Let's say hypothetically that $10,000 was invested in Fidelity® High Income Central Fund on August 31, 2012.
The chart shows how the value of your investment would have changed, and also shows how the ICE® BofA® US High Yield Constrained Index performed over the same period.
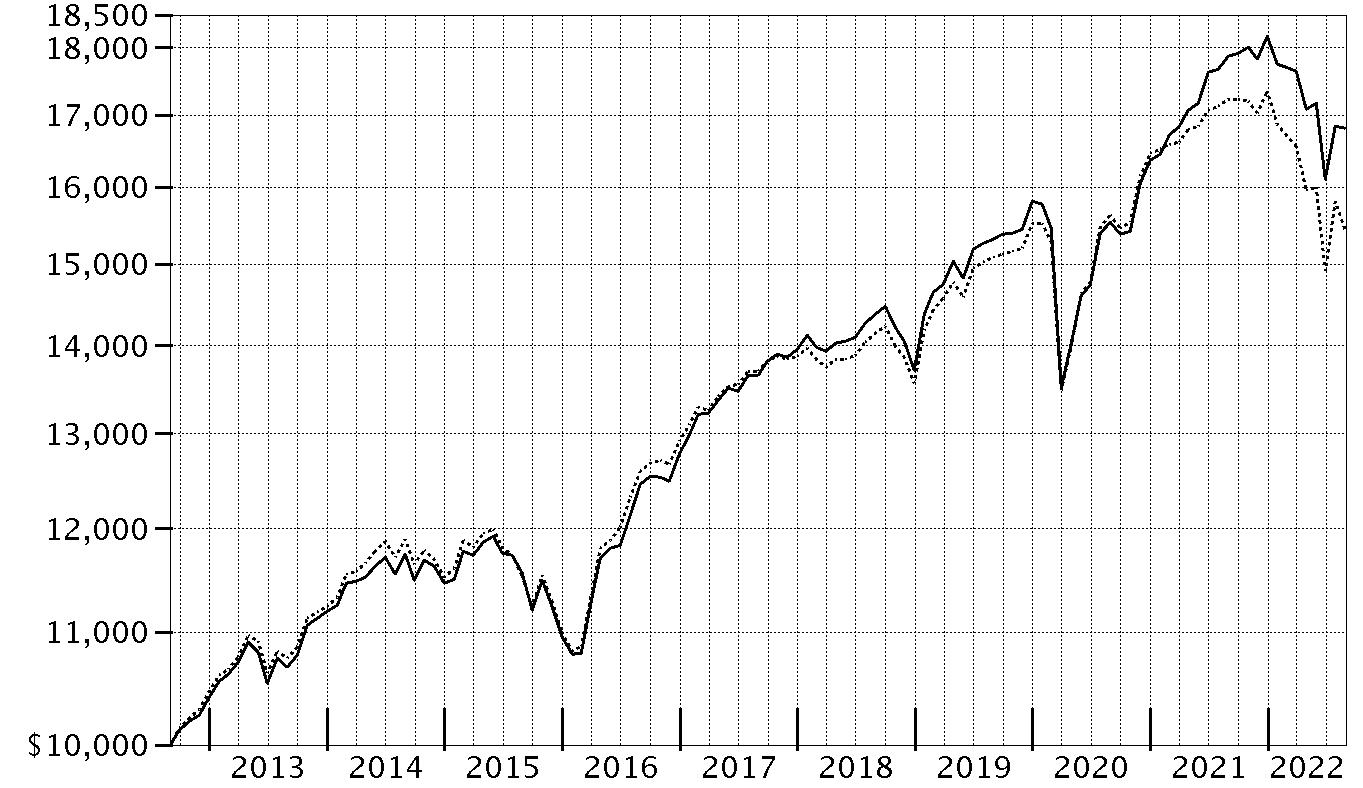
| Period Ending Values |
| $16,829 | Fidelity® High Income Central Fund |
| $15,430 | ICE® BofA® US High Yield Constrained Index |
Management's Discussion of Fund Performance
Market Recap: The ICE BofA
® US High Yield Constrained Index returned -10.43% for the 12 months ending August 31, 2022, as a multitude of crosscurrents challenged the global economy and financial markets. Persistently high inflation, exacerbated by energy price shocks from the Russia–Ukraine conflict, spurred the U.S. Federal Reserve to hike interest rates more aggressively than anticipated, and concerns about the outlook for economic growth sent stocks into bear market territory. In early May, the Fed approved a rare half-percentage-point interest rate increase and announced plans to shrink its $9 trillion asset portfolio. June began with the Fed allowing up to billions in Treasuries and mortgage bonds to mature every month without investing the proceeds. Two weeks later, the central bank raised rates by 0.75 percentage points, its largest increase since 1994, and said it was becoming more difficult to achieve a soft landing, in which the economy slows enough to bring down inflation while avoiding a recession. Against this volatile backdrop, the index returned -14.03% in the first half of 2022. High yield sharply reversed course in July (+6.02%), even as the central bank again raised its benchmark interest rate by 0.75%, before a leg down in August (-2.39%). For the full 12 months, the health care and banking industries (-16% each) lagged most, followed by retail (-14%). In contrast, energy led the way, returning about -4% amid a surge in commodity prices, while transportation returned roughly -7%.
Comments from Co-Managers Alexandre Karam and Harley Lank: For the fiscal year ending August 31, 2022, the fund returned -5.81%, outperforming the -10.43% result of the benchmark, the ICE BofA
® US High Yield Constrained Index. The fund's core investment in high-yield bonds returned -9.44% and contributed to performance versus the benchmark. By industry, security selection was the primary contributor, especially in energy. Positioning in health care also helped. Our non-benchmark stake in Mesquite Energy was the fund's largest individual relative contributor, driven by a rise of roughly 108%. This was among our biggest holdings. The fund's out-of-benchmark stake in Jonah Energy, one of the largest holdings at period end, gained 68%. Another notable relative contributor was an outsized stake in Chesapeake Energy (+78%). Conversely, the primary detractor from performance versus the benchmark was security selection in leisure. Security selection in financial services and media also hampered the fund's relative performance. Our non-benchmark stake in Melco Crown was the fund's biggest individual relative detractor, due to its roughly -57% result. Also hindering performance was an underweighting in T-Mobile USA, which returned roughly -8%. The company was among the largest holdings in the fund. Another notable relative detractor was our overweighting in Coinbase Global (-34%), a stake we established this period. By quality, security selection in unrated bonds added the most value versus the benchmark, while security choices and positioning among BB-rated bonds hurt the most. Notable changes in positioning include reduced exposure to the leisure industry and a higher allocation to media.
The views expressed above reflect those of the portfolio manager(s) only through the end of the period as stated on the cover of this report and do not necessarily represent the views of Fidelity or any other person in the Fidelity organization. Any such views are subject to change at any time based upon market or other conditions and Fidelity disclaims any responsibility to update such views. These views may not be relied on as investment advice and, because investment decisions for a Fidelity fund are based on numerous factors, may not be relied on as an indication of trading intent on behalf of any Fidelity fund.
Investment Summary (Unaudited)
Top Bond Issuers as of August 31, 2022
| (by issuer, excluding cash equivalents) | % of fund's net assets |
| Occidental Petroleum Corp. | 2.6 |
| Mesquite Energy, Inc. | 2.4 |
| CCO Holdings LLC/CCO Holdings Capital Corp. | 1.9 |
| Pacific Gas & Electric Co. | 1.9 |
| Sprint Capital Corp. | 1.7 |
| Jonah Energy Parent LLC | 1.6 |
| InterGen NV | 1.5 |
| Community Health Systems, Inc. | 1.4 |
| CSC Holdings LLC | 1.3 |
| DISH Network Corp. | 1.2 |
| | 17.5 |
Top Five Market Sectors as of August 31, 2022
| | % of fund's net assets |
| Energy | 17.6 |
| Telecommunications | 7.5 |
| Healthcare | 7.2 |
| Utilities | 6.3 |
| Technology | 5.4 |
Quality Diversification (% of fund's net assets)
| As of August 31, 2022 * |
| | BBB | 6.1% |
| | BB | 26.3% |
| | B | 39.8% |
| | CCC,CC,C | 10.4% |
| | Not Rated | 3.8% |
| | Equities | 7.4% |
| | Short-Term Investments and Net Other Assets | 6.2% |
We have used ratings from Moody's Investors Service, Inc. Where Moody's® ratings are not available, we have used S&P® ratings. All ratings are as of the date indicated and do not reflect subsequent changes.
Asset Allocation (% of fund's net assets)
| As of August 31, 2022* |
| | Nonconvertible Bonds | 77.7% |
| | Convertible Bonds, Preferred Stocks | 3.4% |
| | Common Stocks | 6.4% |
| | Bank Loan Obligations | 4.1% |
| | Preferred Securities | 1.6% |
| | Other | 0.6% |
| | Short-Term Investments and Net Other Assets (Liabilities) | 6.2% |

* Foreign investments - 16.2%
Geographic Diversification (% of fund's net assets)
| As of August 31, 2022 |
| | United States of America* | 83.8% |
| | Luxembourg | 2.8% |
| | Canada | 2.8% |
| | Netherlands | 2.7% |
| | Multi-National | 1.2% |
| | United Kingdom | 1.0% |
| | Liberia | 1.0% |
| | Ireland | 0.9% |
| | Australia | 0.7% |
| | Other | 3.1% |

* Includes Short-Term investments and Net Other Assets (Liabilities).
Percentages are based on country or territory of incorporation and are adjusted for the effect of futures contracts, if applicable.
Schedule of Investments August 31, 2022
Showing Percentage of Net Assets
| Corporate Bonds - 80.7% | | | |
| | | Principal Amount | Value |
| Convertible Bonds - 3.0% | | | |
| Broadcasting - 1.3% | | | |
| DISH Network Corp.: | | | |
| 2.375% 3/15/24 | | $10,212,000 | $9,216,330 |
| 3.375% 8/15/26 | | 20,439,000 | 14,707,114 |
| | | | 23,923,444 |
| Diversified Financial Services - 0.1% | | | |
| New Cotai LLC 5% 2/24/27 (a) | | 1,552,961 | 1,149,191 |
| Energy - 1.6% | | | |
| Mesquite Energy, Inc. 15% 7/15/23 (a)(b) | | 1,687,240 | 11,450,117 |
| Mesquite Energy, Inc. 15% 7/15/23 (a)(b) | | 2,913,114 | 19,769,266 |
| | | | 31,219,383 |
|
| TOTAL CONVERTIBLE BONDS | | | 56,292,018 |
|
| Nonconvertible Bonds - 77.7% | | | |
| Aerospace - 1.8% | | | |
| ATI, Inc.: | | | |
| 4.875% 10/1/29 | | 1,205,000 | 1,078,000 |
| 5.125% 10/1/31 | | 845,000 | 743,505 |
| 5.875% 12/1/27 | | 2,480,000 | 2,356,863 |
| Bombardier, Inc.: | | | |
| 6% 2/15/28 (c) | | 3,615,000 | 3,195,859 |
| 7.125% 6/15/26 (c) | | 3,320,000 | 3,163,562 |
| 7.875% 4/15/27 (c) | | 6,180,000 | 5,917,659 |
| Moog, Inc. 4.25% 12/15/27 (c) | | 735,000 | 672,782 |
| TransDigm, Inc.: | | | |
| 5.5% 11/15/27 | | 12,450,000 | 11,205,000 |
| 7.5% 3/15/27 | | 5,250,000 | 5,118,750 |
| Wesco Aircraft Holdings, Inc. 8.5% 11/15/24 (c) | | 1,610,000 | 869,400 |
| | | | 34,321,380 |
| Air Transportation - 0.4% | | | |
| Air Canada 3.875% 8/15/26 (c) | | 2,110,000 | 1,882,806 |
| Allegiant Travel Co. 7.25% 8/15/27 (c) | | 1,545,000 | 1,534,540 |
| United Airlines, Inc. 4.625% 4/15/29 (c) | | 1,650,000 | 1,447,875 |
| Western Global Airlines LLC 10.375% 8/15/25 (c) | | 2,660,000 | 2,423,264 |
| | | | 7,288,485 |
| Automotive - 0.3% | | | |
| Ford Motor Co. 6.1% 8/19/32 | | 4,430,000 | 4,313,757 |
| Ford Motor Credit Co. LLC 3.625% 6/17/31 | | 2,480,000 | 2,008,130 |
| | | | 6,321,887 |
| Automotive & Auto Parts - 2.2% | | | |
| Dana, Inc.: | | | |
| 4.25% 9/1/30 | | 1,400,000 | 1,130,000 |
| 5.625% 6/15/28 | | 2,450,000 | 2,198,358 |
| Ford Motor Co. 3.25% 2/12/32 | | 4,510,000 | 3,530,969 |
| Ford Motor Credit Co. LLC: | | | |
| 2.9% 2/16/28 | | 2,000,000 | 1,672,500 |
| 4.95% 5/28/27 | | 5,375,000 | 5,046,184 |
| 5.125% 6/16/25 | | 7,810,000 | 7,629,120 |
| General Motors Financial Co., Inc. 4.25% 5/15/23 | | 615,000 | 615,269 |
| LCM Investments Holdings 4.875% 5/1/29 (c) | | 3,665,000 | 3,059,558 |
| Nesco Holdings II, Inc. 5.5% 4/15/29 (c) | | 1,770,000 | 1,557,600 |
| PECF USS Intermediate Holding III Corp. 8% 11/15/29 (c) | | 875,000 | 730,764 |
| Real Hero Merger Sub 2 6.25% 2/1/29 (c) | | 685,000 | 556,798 |
| Rivian Holdco & Rivian LLC & Rivian Automotive LLC 6 month U.S. LIBOR + 5.620% 7.1766% 10/15/26 (c)(d)(e) | | 9,915,000 | 9,196,163 |
| Thor Industries, Inc. 4% 10/15/29 (c) | | 3,220,000 | 2,610,929 |
| Winnebago Industries, Inc. 6.25% 7/15/28 (c) | | 2,075,000 | 1,967,847 |
| | | | 41,502,059 |
| Banks & Thrifts - 1.5% | | | |
| Ally Financial, Inc.: | | | |
| 5.8% 5/1/25 | | 20,000 | 20,459 |
| 8% 11/1/31 | | 11,003,000 | 12,120,428 |
| 8% 11/1/31 | | 5,273,000 | 5,867,738 |
| CQP Holdco LP / BIP-V Chinook Holdco LLC 5.5% 6/15/31 (c) | | 7,280,000 | 6,438,942 |
| VistaJet Malta Finance PLC / XO Management Holding, Inc. 6.375% 2/1/30 (c) | | 4,250,000 | 3,655,000 |
| | | | 28,102,567 |
| Broadcasting - 1.6% | | | |
| Clear Channel Outdoor Holdings, Inc.: | | | |
| 7.5% 6/1/29 (c) | | 2,590,000 | 2,082,295 |
| 7.75% 4/15/28 (c) | | 1,370,000 | 1,114,228 |
| Diamond Sports Group LLC/Diamond Sports Finance Co. 5.375% 8/15/26 (c) | | 2,515,000 | 477,850 |
| Gray Escrow II, Inc. 5.375% 11/15/31 (c) | | 2,970,000 | 2,510,185 |
| iHeartCommunications, Inc. 9% 12/31/49 (a)(f) | | 780,000 | 0 |
| Nexstar Broadcasting, Inc. 5.625% 7/15/27 (c) | | 2,755,000 | 2,623,242 |
| Scripps Escrow II, Inc.: | | | |
| 3.875% 1/15/29 (c) | | 2,170,000 | 1,839,856 |
| 5.375% 1/15/31 (c) | | 1,130,000 | 935,075 |
| Scripps Escrow, Inc. 5.875% 7/15/27 (c) | | 2,215,000 | 2,004,520 |
| Sirius XM Radio, Inc.: | | | |
| 4.125% 7/1/30 (c) | | 2,155,000 | 1,825,867 |
| 5% 8/1/27 (c) | | 5,295,000 | 4,984,607 |
| TEGNA, Inc. 5% 9/15/29 | | 2,100,000 | 2,010,141 |
| Univision Communications, Inc.: | | | |
| 6.625% 6/1/27 (c) | | 5,150,000 | 4,969,855 |
| 7.375% 6/30/30 (c) | | 3,455,000 | 3,429,191 |
| | | | 30,806,912 |
| Building Materials - 0.6% | | | |
| Advanced Drain Systems, Inc.: | | | |
| 5% 9/30/27 (c) | | 505,000 | 479,750 |
| 6.375% 6/15/30 (c) | | 3,635,000 | 3,516,942 |
| MIWD Holdco II LLC / MIWD Finance Corp. 5.5% 2/1/30 (c) | | 590,000 | 484,554 |
| SRS Distribution, Inc.: | | | |
| 4.625% 7/1/28 (c) | | 1,825,000 | 1,615,410 |
| 6% 12/1/29 (c) | | 1,705,000 | 1,388,173 |
| 6.125% 7/1/29 (c) | | 1,005,000 | 833,738 |
| Victors Merger Corp. 6.375% 5/15/29 (c) | | 3,465,000 | 2,321,550 |
| | | | 10,640,117 |
| Cable/Satellite TV - 5.0% | | | |
| CCO Holdings LLC/CCO Holdings Capital Corp.: | | | |
| 4.25% 1/15/34 (c) | | 3,730,000 | 2,839,873 |
| 4.5% 8/15/30 (c) | | 3,095,000 | 2,602,818 |
| 4.5% 6/1/33 (c) | | 4,415,000 | 3,465,775 |
| 4.75% 3/1/30 (c) | | 5,200,000 | 4,469,582 |
| 5% 2/1/28 (c) | | 12,055,000 | 11,016,100 |
| 5.125% 5/1/27 (c) | | 8,920,000 | 8,466,819 |
| 6.375% 9/1/29 (c) | | 2,165,000 | 2,102,756 |
| CSC Holdings LLC: | | | |
| 3.375% 2/15/31 (c) | | 3,305,000 | 2,475,313 |
| 4.125% 12/1/30 (c) | | 2,590,000 | 2,097,900 |
| 4.5% 11/15/31 (c) | | 2,175,000 | 1,744,854 |
| 4.625% 12/1/30 (c) | | 5,895,000 | 4,214,925 |
| 5% 11/15/31 (c) | | 2,290,000 | 1,633,337 |
| 5.375% 2/1/28 (c) | | 4,625,000 | 4,201,165 |
| 5.75% 1/15/30 (c) | | 3,690,000 | 2,857,684 |
| 5.875% 9/15/22 | | 805,000 | 803,994 |
| 7.5% 4/1/28 (c) | | 4,545,000 | 4,040,005 |
| DIRECTV Financing LLC / DIRECTV Financing Co-Obligor, Inc. 5.875% 8/15/27 (c) | | 2,505,000 | 2,292,075 |
| DISH DBS Corp.: | | | |
| 5.25% 12/1/26 (c) | | 1,465,000 | 1,209,541 |
| 5.75% 12/1/28 (c) | | 1,465,000 | 1,124,925 |
| Radiate Holdco LLC/Radiate Financial Service Ltd.: | | | |
| 4.5% 9/15/26 (c) | | 6,820,000 | 5,878,840 |
| 6.5% 9/15/28 (c) | | 5,050,000 | 3,760,937 |
| Telenet Finance Luxembourg Notes SARL 5.5% 3/1/28 (c) | | 8,600,000 | 7,826,000 |
| VZ Secured Financing BV 5% 1/15/32 (c) | | 6,990,000 | 5,699,297 |
| Ziggo Bond Co. BV: | | | |
| 5.125% 2/28/30 (c) | | 1,155,000 | 924,578 |
| 6% 1/15/27 (c) | | 4,760,000 | 4,287,737 |
| Ziggo BV 4.875% 1/15/30 (c) | | 1,730,000 | 1,460,463 |
| | | | 93,497,293 |
| Chemicals - 2.0% | | | |
| Avient Corp. 5.75% 5/15/25 (c) | | 1,970,000 | 1,942,853 |
| Axalta Coating Systems/Dutch Holding BV 4.75% 6/15/27 (c) | | 2,445,000 | 2,264,681 |
| Cheever Escrow Issuer LLC 7.125% 10/1/27 (c) | | 1,560,000 | 1,521,000 |
| CVR Partners LP 6.125% 6/15/28 (c) | | 3,010,000 | 2,748,204 |
| Kobe U.S. Midco 2, Inc. 9.25% 11/1/26 pay-in-kind (c)(d) | | 5,905,000 | 4,783,050 |
| Kronos Acquisition Holdings, Inc. / KIK Custom Products, Inc.: | | | |
| 5% 12/31/26 (c) | | 535,000 | 484,630 |
| 7% 12/31/27 (c) | | 680,000 | 561,000 |
| LSB Industries, Inc. 6.25% 10/15/28 (c) | | 270,000 | 249,899 |
| NOVA Chemicals Corp. 4.25% 5/15/29 (c) | | 2,650,000 | 2,179,625 |
| SCIH Salt Holdings, Inc.: | | | |
| 4.875% 5/1/28 (c) | | 2,630,000 | 2,256,038 |
| 6.625% 5/1/29 (c) | | 1,755,000 | 1,444,892 |
| The Chemours Co. LLC: | | | |
| 4.625% 11/15/29 (c) | | 2,245,000 | 1,852,125 |
| 5.375% 5/15/27 | | 6,915,000 | 6,378,119 |
| 5.75% 11/15/28 (c) | | 3,490,000 | 3,123,550 |
| Tronox, Inc. 4.625% 3/15/29 (c) | | 2,210,000 | 1,838,278 |
| W.R. Grace Holding LLC: | | | |
| 4.875% 6/15/27 (c) | | 3,255,000 | 3,010,484 |
| 5.625% 8/15/29 (c) | | 2,375,000 | 1,876,250 |
| | | | 38,514,678 |
| Consumer Products - 1.0% | | | |
| Central Garden & Pet Co. 4.125% 10/15/30 | | 1,675,000 | 1,394,278 |
| Diamond BC BV 4.625% 10/1/29 (c) | | 1,145,000 | 976,181 |
| Ferrellgas LP/Ferrellgas Finance Corp. 5.375% 4/1/26 (c) | | 1,775,000 | 1,544,250 |
| Gannett Holdings LLC 6% 11/1/26 (c) | | 1,390,000 | 1,084,200 |
| Macy's Retail Holdings LLC: | | | |
| 5.875% 3/15/30 (c) | | 915,000 | 782,325 |
| 6.125% 3/15/32 (c) | | 1,065,000 | 884,383 |
| Mattel, Inc. 3.375% 4/1/26 (c) | | 745,000 | 676,888 |
| Michaels Companies, Inc.: | | | |
| 5.25% 5/1/28 (c) | | 2,370,000 | 1,817,079 |
| 7.875% 5/1/29 (c) | | 3,590,000 | 2,387,350 |
| Tempur Sealy International, Inc.: | | | |
| 3.875% 10/15/31 (c) | | 2,515,000 | 1,935,236 |
| 4% 4/15/29 (c) | | 2,345,000 | 1,926,677 |
| The Scotts Miracle-Gro Co. 4% 4/1/31 | | 1,495,000 | 1,122,924 |
| TKC Holdings, Inc. 10.5% 5/15/29 (c) | | 2,545,000 | 2,038,938 |
| | | | 18,570,709 |
| Containers - 0.5% | | | |
| ARD Finance SA 6.5% 6/30/27 pay-in-kind (c)(d) | | 2,525,000 | 1,954,479 |
| Berry Global, Inc.: | | | |
| 4.5% 2/15/26 (c) | | 2,134,000 | 2,048,640 |
| 4.875% 7/15/26 (c) | | 1,355,000 | 1,319,135 |
| Graham Packaging Co., Inc. 7.125% 8/15/28 (c) | | 1,430,000 | 1,227,955 |
| Graphic Packaging International, Inc. 3.75% 2/1/30 (c) | | 1,185,000 | 1,018,483 |
| Trivium Packaging Finance BV 5.5% 8/15/26 (c) | | 1,510,000 | 1,449,600 |
| | | | 9,018,292 |
| Diversified Financial Services - 2.3% | | | |
| Altice France Holding SA 10.5% 5/15/27 (c) | | 4,240,000 | 3,660,697 |
| Coinbase Global, Inc.: | | | |
| 3.375% 10/1/28 (c) | | 9,445,000 | 6,103,886 |
| 3.625% 10/1/31 (c) | | 6,085,000 | 3,704,761 |
| Diamond Sports Group LLC/Diamond Sports Finance Co. 6.625% 8/15/27 (c) | | 3,500,000 | 319,410 |
| FLY Leasing Ltd. 7% 10/15/24 (c) | | 7,485,000 | 4,079,325 |
| Hightower Holding LLC 6.75% 4/15/29 (c) | | 970,000 | 815,244 |
| Icahn Enterprises LP/Icahn Enterprises Finance Corp.: | | | |
| 4.75% 9/15/24 | | 2,200,000 | 2,092,816 |
| 5.25% 5/15/27 | | 5,970,000 | 5,425,238 |
| 6.375% 12/15/25 | | 1,740,000 | 1,697,970 |
| MSCI, Inc. 4% 11/15/29 (c) | | 5,785,000 | 5,149,286 |
| OneMain Finance Corp. 7.125% 3/15/26 | | 3,460,000 | 3,254,874 |
| PRA Group, Inc. 5% 10/1/29 (c) | | 7,620,000 | 6,565,533 |
| | | | 42,869,040 |
| Diversified Media - 1.7% | | | |
| Allen Media LLC 10.5% 2/15/28 (c) | | 7,650,000 | 3,863,250 |
| Lamar Media Corp. 4.875% 1/15/29 | | 1,980,000 | 1,838,371 |
| Nielsen Co. SARL (Luxembourg) 5% 2/1/25 (c) | | 1,645,000 | 1,651,646 |
| Nielsen Finance LLC/Nielsen Finance Co.: | | | |
| 5.625% 10/1/28 (c) | | 2,530,000 | 2,535,768 |
| 5.875% 10/1/30 (c) | | 2,530,000 | 2,531,915 |
| Terrier Media Buyer, Inc. 8.875% 12/15/27 (c) | | 3,285,000 | 2,825,183 |
| Twitter, Inc. 5% 3/1/30 (c) | | 17,170,000 | 16,180,064 |
| | | | 31,426,197 |
| Energy - 11.2% | | | |
| Antero Midstream Partners LP/Antero Midstream Finance Corp. 5.75% 1/15/28 (c) | | 2,220,000 | 2,104,516 |
| Archrock Partners LP / Archrock Partners Finance Corp.: | | | |
| 6.25% 4/1/28 (c) | | 2,475,000 | 2,252,250 |
| 6.875% 4/1/27 (c) | | 700,000 | 656,250 |
| Atlantica Sustainable Infrastructure PLC 4.125% 6/15/28 (c) | | 1,235,000 | 1,105,326 |
| California Resources Corp. 7.125% 2/1/26 (c) | | 3,735,000 | 3,671,692 |
| Cheniere Energy, Inc. 4.625% 10/15/28 | | 3,250,000 | 3,131,570 |
| Citgo Holding, Inc. 9.25% 8/1/24 (c) | | 2,625,000 | 2,616,075 |
| Citgo Petroleum Corp.: | | | |
| 6.375% 6/15/26 (c) | | 2,610,000 | 2,483,929 |
| 7% 6/15/25 (c) | | 6,180,000 | 6,009,865 |
| CNX Resources Corp. 6% 1/15/29 (c) | | 1,185,000 | 1,114,133 |
| Colgate Energy Partners III LLC 5.875% 7/1/29 (c) | | 2,610,000 | 2,433,825 |
| Comstock Resources, Inc.: | | | |
| 5.875% 1/15/30 (c) | | 1,595,000 | 1,459,287 |
| 6.75% 3/1/29 (c) | | 3,485,000 | 3,326,345 |
| Crestwood Midstream Partners LP/Crestwood Midstream Finance Corp.: | | | |
| 5.75% 4/1/25 | | 1,045,000 | 1,007,145 |
| 6% 2/1/29 (c) | | 7,210,000 | 6,660,238 |
| CrownRock LP/CrownRock Finance, Inc. 5% 5/1/29 (c) | | 830,000 | 762,311 |
| CVR Energy, Inc.: | | | |
| 5.25% 2/15/25 (c) | | 4,990,000 | 4,707,373 |
| 5.75% 2/15/28 (c) | | 3,995,000 | 3,635,450 |
| DCP Midstream Operating LP 5.85% 5/21/43 (c)(d) | | 3,410,000 | 3,322,704 |
| Delek Logistics Partners LP 7.125% 6/1/28 (c) | | 1,520,000 | 1,420,136 |
| DT Midstream, Inc.: | | | |
| 4.125% 6/15/29 (c) | | 2,545,000 | 2,234,459 |
| 4.375% 6/15/31 (c) | | 2,545,000 | 2,175,975 |
| Endeavor Energy Resources LP/EER Finance, Inc. 5.75% 1/30/28 (c) | | 4,185,000 | 4,128,084 |
| EnLink Midstream LLC: | | | |
| 5.625% 1/15/28 (c) | | 1,060,000 | 1,018,289 |
| 6.5% 9/1/30 (c) | | 2,150,000 | 2,139,250 |
| EQT Corp.: | | | |
| 3.125% 5/15/26 (c) | | 1,720,000 | 1,618,595 |
| 3.625% 5/15/31 (c) | | 1,720,000 | 1,518,339 |
| 5% 1/15/29 | | 2,500,000 | 2,443,626 |
| Exterran Energy Solutions LP 8.125% 5/1/25 | | 885,000 | 861,287 |
| Harvest Midstream I LP 7.5% 9/1/28 (c) | | 5,565,000 | 5,265,258 |
| Hess Midstream Partners LP: | | | |
| 4.25% 2/15/30 (c) | | 1,560,000 | 1,339,249 |
| 5.125% 6/15/28 (c) | | 2,905,000 | 2,698,019 |
| 5.5% 10/15/30 (c) | | 920,000 | 837,673 |
| 5.625% 2/15/26 (c) | | 6,900,000 | 6,727,983 |
| KLX Energy Services Holdings, Inc. 11.5% 11/1/25 (c) | | 2,685,000 | 1,946,625 |
| MC Brazil Downstream Trading SARL 7.25% 6/30/31 (c) | | 7,410,000 | 6,196,613 |
| MEG Energy Corp. 5.875% 2/1/29 (c) | | 4,235,000 | 3,938,550 |
| Nabors Industries, Inc. 5.75% 2/1/25 | | 4,196,000 | 3,867,999 |
| Neptune Energy Bondco PLC 6.625% 5/15/25 (c) | | 1,065,000 | 1,027,993 |
| New Fortress Energy, Inc. 6.75% 9/15/25 (c) | | 6,830,000 | 6,607,001 |
| NGL Energy Operating LLC/NGL Energy Finance Corp. 7.5% 2/1/26 (c) | | 7,325,000 | 6,702,375 |
| Nine Energy Service, Inc. 8.75% 11/1/23 (c) | | 600,000 | 468,138 |
| Northern Oil & Gas, Inc. 8.125% 3/1/28 (c) | | 3,455,000 | 3,316,800 |
| Occidental Petroleum Corp.: | | | |
| 4.3% 8/15/39 | | 880,000 | 759,256 |
| 4.4% 4/15/46 | | 1,750,000 | 1,518,125 |
| 4.5% 7/15/44 | | 815,000 | 705,166 |
| 5.875% 9/1/25 | | 1,665,000 | 1,706,658 |
| 6.125% 1/1/31 | | 4,345,000 | 4,515,580 |
| 6.2% 3/15/40 | | 980,000 | 994,700 |
| 6.375% 9/1/28 | | 2,500,000 | 2,611,159 |
| 6.45% 9/15/36 | | 1,717,000 | 1,834,941 |
| 6.6% 3/15/46 | | 2,590,000 | 2,850,800 |
| 6.625% 9/1/30 | | 8,330,000 | 8,898,939 |
| 6.95% 7/1/24 | | 2,770,000 | 2,891,326 |
| 7.5% 5/1/31 | | 10,215,000 | 11,506,125 |
| 8.875% 7/15/30 | | 6,715,000 | 7,844,463 |
| PBF Holding Co. LLC/PBF Finance Corp.: | | | |
| 6% 2/15/28 | | 5,755,000 | 5,168,940 |
| 7.25% 6/15/25 | | 2,085,000 | 2,025,161 |
| SM Energy Co.: | | | |
| 6.5% 7/15/28 | | 920,000 | 885,960 |
| 6.625% 1/15/27 | | 1,145,000 | 1,116,375 |
| 6.75% 9/15/26 | | 805,000 | 791,669 |
| Southwestern Energy Co.: | | | |
| 4.75% 2/1/32 | | 2,135,000 | 1,903,058 |
| 5.375% 2/1/29 | | 4,415,000 | 4,173,323 |
| 8.375% 9/15/28 | | 2,500,000 | 2,629,850 |
| Suburban Propane Partners LP/Suburban Energy Finance Corp. 5.875% 3/1/27 | | 3,905,000 | 3,797,793 |
| Sunoco LP/Sunoco Finance Corp. 4.5% 5/15/29 | | 2,280,000 | 1,937,063 |
| Tallgrass Energy Partners LP / Tallgrass Energy Finance Corp. 6% 12/31/30 (c) | | 2,370,000 | 2,074,375 |
| Transocean Sentry Ltd. 5.375% 5/15/23 (c) | | 2,021,570 | 1,946,634 |
| Tullow Oil PLC 10.25% 5/15/26 (c) | | 5,450,000 | 5,025,445 |
| Valaris Ltd. 8.25% 4/30/28 pay-in-kind (d) | | 660,000 | 661,650 |
| Venture Global Calcasieu Pass LLC: | | | |
| 3.875% 8/15/29 (c) | | 2,220,000 | 1,936,950 |
| 4.125% 8/15/31 (c) | | 2,220,000 | 1,926,808 |
| Viper Energy Partners LP 5.375% 11/1/27 (c) | | 1,105,000 | 1,058,038 |
| | | | 210,654,930 |
| Environmental - 0.6% | | | |
| Covanta Holding Corp. 4.875% 12/1/29 (c) | | 1,355,000 | 1,143,281 |
| Darling Ingredients, Inc.: | | | |
| 5.25% 4/15/27 (c) | | 2,760,000 | 2,707,036 |
| 6% 6/15/30 (c) | | 2,240,000 | 2,242,822 |
| Madison IAQ LLC: | | | |
| 4.125% 6/30/28 (c) | | 1,795,000 | 1,539,213 |
| 5.875% 6/30/29 (c) | | 2,775,000 | 2,282,826 |
| Stericycle, Inc. 3.875% 1/15/29 (c) | | 1,645,000 | 1,424,981 |
| | | | 11,340,159 |
| Food & Drug Retail - 0.9% | | | |
| Albertsons Companies LLC/Safeway, Inc./New Albertson's, Inc./Albertson's LLC: | | | |
| 3.5% 3/15/29 (c) | | 1,655,000 | 1,360,079 |
| 4.625% 1/15/27 (c) | | 4,615,000 | 4,211,279 |
| 4.875% 2/15/30 (c) | | 6,890,000 | 6,033,918 |
| BellRing Brands, Inc. 7% 3/15/30 (c) | | 845,000 | 806,967 |
| Emergent BioSolutions, Inc. 3.875% 8/15/28 (c) | | 1,605,000 | 1,123,500 |
| Murphy Oil U.S.A., Inc. 3.75% 2/15/31 (c) | | 960,000 | 810,931 |
| SEG Holding LLC/SEG Finance Corp. 5.625% 10/15/28 (c) | | 2,200,000 | 1,988,931 |
| | | | 16,335,605 |
| Food/Beverage/Tobacco - 1.4% | | | |
| C&S Group Enterprises LLC 5% 12/15/28 (c) | | 1,905,000 | 1,408,349 |
| Chobani LLC/Finance Corp., Inc.: | | | |
| 4.625% 11/15/28 (c) | | 1,465,000 | 1,282,060 |
| 7.5% 4/15/25 (c) | | 450,000 | 427,364 |
| KeHE Distributors LLC / KeHE Finance Corp. 8.625% 10/15/26 (c) | | 1,702,000 | 1,723,275 |
| Kraft Heinz Foods Co.: | | | |
| 4.375% 6/1/46 | | 645,000 | 547,914 |
| 4.875% 10/1/49 | | 3,225,000 | 2,935,343 |
| 5.5% 6/1/50 | | 855,000 | 847,908 |
| Lamb Weston Holdings, Inc. 4.125% 1/31/30 (c) | | 2,290,000 | 2,063,863 |
| Performance Food Group, Inc.: | | | |
| 4.25% 8/1/29 (c) | | 1,350,000 | 1,155,978 |
| 5.5% 10/15/27 (c) | | 5,775,000 | 5,443,688 |
| 6.875% 5/1/25 (c) | | 995,000 | 993,756 |
| Post Holdings, Inc.: | | | |
| 4.625% 4/15/30 (c) | | 625,000 | 542,791 |
| 5.75% 3/1/27 (c) | | 282,000 | 275,501 |
| TreeHouse Foods, Inc. 4% 9/1/28 | | 860,000 | 721,024 |
| Triton Water Holdings, Inc. 6.25% 4/1/29 (c) | | 1,080,000 | 885,816 |
| U.S. Foods, Inc.: | | | |
| 4.625% 6/1/30 (c) | | 1,110,000 | 957,375 |
| 4.75% 2/15/29 (c) | | 3,100,000 | 2,762,767 |
| United Natural Foods, Inc. 6.75% 10/15/28 (c) | | 1,810,000 | 1,738,523 |
| | | | 26,713,295 |
| Gaming - 2.8% | | | |
| Affinity Gaming LLC 6.875% 12/15/27 (c) | | 890,000 | 772,863 |
| Caesars Entertainment, Inc.: | | | |
| 4.625% 10/15/29 (c) | | 2,860,000 | 2,300,427 |
| 8.125% 7/1/27 (c) | | 6,225,000 | 6,115,876 |
| CDI Escrow Issuer, Inc. 5.75% 4/1/30 (c) | | 4,380,000 | 4,058,026 |
| Fertitta Entertainment LLC / Fertitta Entertainment Finance Co., Inc.: | | | |
| 4.625% 1/15/29 (c) | | 2,925,000 | 2,548,933 |
| 6.75% 1/15/30 (c) | | 5,120,000 | 4,175,053 |
| Golden Entertainment, Inc. 7.625% 4/15/26 (c) | | 935,000 | 956,038 |
| Jacobs Entertainment, Inc. 6.75% 2/15/29 (c) | | 1,245,000 | 1,104,938 |
| MGM Resorts International 6.75% 5/1/25 | | 3,350,000 | 3,346,215 |
| Peninsula Pacific Entertainment LLC 8.5% 11/15/27 (c) | | 3,010,000 | 3,235,750 |
| Station Casinos LLC 4.625% 12/1/31 (c) | | 3,685,000 | 3,078,854 |
| Studio City Finance Ltd. 6.5% 1/15/28 (c) | | 5,015,000 | 2,814,669 |
| Sugarhouse HSP Gaming Prop Mezz LP/Sugarhouse HSP Gaming Finance Corp. 5.875% 5/15/25 (c) | | 3,915,000 | 3,626,884 |
| VICI Properties LP / VICI Note Co.: | | | |
| 4.5% 9/1/26 (c) | | 4,310,000 | 4,061,248 |
| 4.625% 6/15/25 (c) | | 5,180,000 | 5,014,027 |
| Wynn Resorts Finance LLC / Wynn Resorts Capital Corp. 7.75% 4/15/25 (c) | | 4,675,000 | 4,659,409 |
| | | | 51,869,210 |
| Healthcare - 7.1% | | | |
| AHP Health Partners, Inc. 5.75% 7/15/29 (c) | | 2,665,000 | 2,045,388 |
| Akumin, Inc. 7% 11/1/25 (c) | | 4,155,000 | 3,529,299 |
| Avantor Funding, Inc.: | | | |
| 3.875% 11/1/29 (c) | | 2,290,000 | 1,981,265 |
| 4.625% 7/15/28 (c) | | 3,345,000 | 3,043,549 |
| Bausch Health Companies, Inc.: | | | |
| 7.25% 5/30/29 (c) | | 1,055,000 | 406,175 |
| 9% 12/15/25 (c) | | 1,775,000 | 1,101,618 |
| Catalent Pharma Solutions 5% 7/15/27 (c) | | 825,000 | 778,247 |
| Centene Corp.: | | | |
| 3.375% 2/15/30 | | 2,690,000 | 2,306,675 |
| 4.25% 12/15/27 | | 3,475,000 | 3,300,069 |
| 4.625% 12/15/29 | | 3,825,000 | 3,603,303 |
| Charles River Laboratories International, Inc.: | | | |
| 3.75% 3/15/29 (c) | | 740,000 | 637,784 |
| 4% 3/15/31 (c) | | 2,080,000 | 1,765,434 |
| 4.25% 5/1/28 (c) | | 735,000 | 673,605 |
| Community Health Systems, Inc.: | | | |
| 4.75% 2/15/31 (c) | | 2,885,000 | 2,130,284 |
| 5.25% 5/15/30 (c) | | 4,900,000 | 3,711,897 |
| 6% 1/15/29 (c) | | 3,475,000 | 2,852,140 |
| 6.125% 4/1/30 (c) | | 5,840,000 | 3,619,048 |
| 6.875% 4/15/29 (c) | | 2,815,000 | 1,759,375 |
| 8% 3/15/26 (c) | | 12,925,000 | 12,084,875 |
| DaVita HealthCare Partners, Inc.: | | | |
| 3.75% 2/15/31 (c) | | 2,495,000 | 1,835,759 |
| 4.625% 6/1/30 (c) | | 6,965,000 | 5,607,104 |
| Encompass Health Corp. 5.75% 9/15/25 | | 4,660,000 | 4,616,573 |
| Grifols Escrow Issuer SA 4.75% 10/15/28 (c) | | 1,085,000 | 904,511 |
| HealthEquity, Inc. 4.5% 10/1/29 (c) | | 1,005,000 | 883,938 |
| Hologic, Inc. 3.25% 2/15/29 (c) | | 2,525,000 | 2,152,449 |
| IQVIA, Inc.: | | | |
| 5% 10/15/26 (c) | | 1,750,000 | 1,695,330 |
| 5% 5/15/27 (c) | | 1,385,000 | 1,338,450 |
| Jazz Securities DAC 4.375% 1/15/29 (c) | | 1,980,000 | 1,785,445 |
| Minerva Merger Sub, Inc. 6.5% 2/15/30 (c) | | 8,510,000 | 7,225,288 |
| Molina Healthcare, Inc.: | | | |
| 3.875% 11/15/30 (c) | | 2,430,000 | 2,103,287 |
| 3.875% 5/15/32 (c) | | 3,315,000 | 2,852,723 |
| 4.375% 6/15/28 (c) | | 1,835,000 | 1,692,788 |
| Mozart Borrower LP 3.875% 4/1/29 (c) | | 4,435,000 | 3,758,663 |
| Option Care Health, Inc. 4.375% 10/31/29 (c) | | 1,060,000 | 932,238 |
| Organon & Co. / Organon Foreign Debt Co-Issuer BV: | | | |
| 4.125% 4/30/28 (c) | | 3,005,000 | 2,695,996 |
| 5.125% 4/30/31 (c) | | 2,995,000 | 2,620,625 |
| Owens & Minor, Inc. 6.625% 4/1/30 (c) | | 5,190,000 | 4,793,821 |
| Radiology Partners, Inc. 9.25% 2/1/28 (c) | | 5,385,000 | 4,012,855 |
| RP Escrow Issuer LLC 5.25% 12/15/25 (c) | | 2,295,000 | 2,048,653 |
| Surgery Center Holdings, Inc.: | | | |
| 6.75% 7/1/25 (c) | | 250,000 | 241,200 |
| 10% 4/15/27 (c) | | 3,010,000 | 3,012,197 |
| Tenet Healthcare Corp.: | | | |
| 4.25% 6/1/29 (c) | | 6,200,000 | 5,346,539 |
| 4.375% 1/15/30 (c) | | 6,565,000 | 5,744,375 |
| 6.125% 10/1/28 (c) | | 7,085,000 | 6,500,488 |
| 6.125% 6/15/30 (c) | | 3,680,000 | 3,533,168 |
| 6.875% 11/15/31 | | 330,000 | 308,963 |
| Valeant Pharmaceuticals International, Inc. 9.25% 4/1/26 (c) | | 2,030,000 | 1,218,000 |
| | | | 132,791,456 |
| Homebuilders/Real Estate - 1.4% | | | |
| Arcosa, Inc. 4.375% 4/15/29 (c) | | 1,425,000 | 1,290,836 |
| Ashton Woods U.S.A. LLC/Ashton Woods Finance Co.: | | | |
| 4.625% 8/1/29 (c) | | 1,380,000 | 1,083,057 |
| 6.625% 1/15/28 (c) | | 40,000 | 35,909 |
| Kennedy-Wilson, Inc.: | | | |
| 4.75% 3/1/29 | | 2,190,000 | 1,827,292 |
| 5% 3/1/31 | | 2,190,000 | 1,800,947 |
| New Home Co., Inc. 7.25% 10/15/25 (c) | | 1,685,000 | 1,390,809 |
| Realogy Group LLC/Realogy Co-Issuer Corp. 5.75% 1/15/29 (c) | | 1,225,000 | 957,031 |
| Realogy Group LLC/Realogy Co.-Issuer Corp. 5.25% 4/15/30 (c) | | 3,620,000 | 2,722,095 |
| Starwood Property Trust, Inc. 4.75% 3/15/25 | | 2,420,000 | 2,304,324 |
| Taylor Morrison Communities, Inc./Monarch Communities, Inc. 5.75% 1/15/28 (c) | | 2,945,000 | 2,697,353 |
| TRI Pointe Homes, Inc. 5.7% 6/15/28 | | 795,000 | 720,265 |
| Uniti Group LP / Uniti Group Finance, Inc.: | | | |
| 4.75% 4/15/28 (c) | | 2,035,000 | 1,700,413 |
| 6.5% 2/15/29 (c) | | 3,300,000 | 2,514,204 |
| VICI Properties LP / VICI Note Co.: | | | |
| 3.75% 2/15/27 (c) | | 1,965,000 | 1,776,772 |
| 4.125% 8/15/30 (c) | | 2,575,000 | 2,264,079 |
| Weekley Homes LLC/Weekley Finance Corp. 4.875% 9/15/28 (c) | | 1,185,000 | 982,309 |
| | | | 26,067,695 |
| Hotels - 0.4% | | | |
| Hilton Domestic Operating Co., Inc.: | | | |
| 3.625% 2/15/32 (c) | | 1,470,000 | 1,186,753 |
| 3.75% 5/1/29 (c) | | 1,650,000 | 1,423,571 |
| 5.375% 5/1/25 (c) | | 3,525,000 | 3,494,514 |
| Lindblad Expeditions LLC 6.75% 2/15/27 (c) | | 2,120,000 | 1,949,616 |
| | | | 8,054,454 |
| Insurance - 1.6% | | | |
| Acrisure LLC / Acrisure Finance, Inc.: | | | |
| 7% 11/15/25 (c) | | 9,401,000 | 8,858,656 |
| 10.125% 8/1/26 (c) | | 2,450,000 | 2,451,113 |
| Alliant Holdings Intermediate LLC: | | | |
| 5.875% 11/1/29 (c) | | 3,030,000 | 2,606,282 |
| 6.75% 10/15/27 (c) | | 9,895,000 | 8,987,629 |
| AmWINS Group, Inc. 4.875% 6/30/29 (c) | | 1,400,000 | 1,218,037 |
| AssuredPartners, Inc. 5.625% 1/15/29 (c) | | 1,445,000 | 1,201,099 |
| HUB International Ltd. 7% 5/1/26 (c) | | 1,395,000 | 1,366,758 |
| USI, Inc. 6.875% 5/1/25 (c) | | 3,250,000 | 3,182,985 |
| | | | 29,872,559 |
| Leisure - 2.1% | | | |
| Carnival Corp.: | | | |
| 5.75% 3/1/27 (c) | | 5,135,000 | 4,002,168 |
| 9.875% 8/1/27 (c) | | 4,130,000 | 4,145,498 |
| 10.5% 2/1/26 (c) | | 2,400,000 | 2,471,988 |
| NCL Corp. Ltd.: | | | |
| 5.875% 3/15/26 (c) | | 735,000 | 594,354 |
| 5.875% 2/15/27 (c) | | 2,890,000 | 2,619,279 |
| 7.75% 2/15/29 (c) | | 2,575,000 | 2,092,378 |
| NCL Finance Ltd. 6.125% 3/15/28 (c) | | 910,000 | 706,606 |
| Royal Caribbean Cruises Ltd.: | | | |
| 4.25% 7/1/26 (c) | | 4,375,000 | 3,361,177 |
| 5.375% 7/15/27 (c) | | 1,975,000 | 1,527,928 |
| 5.5% 8/31/26 (c) | | 4,495,000 | 3,593,033 |
| 11.5% 6/1/25 (c) | | 1,196,000 | 1,255,800 |
| 11.625% 8/15/27 (c) | | 8,060,000 | 7,920,240 |
| Studio City Co. Ltd. 7% 2/15/27 (c) | | 2,315,000 | 1,921,450 |
| Vail Resorts, Inc. 6.25% 5/15/25 (c) | | 1,435,000 | 1,436,363 |
| Viking Cruises Ltd. 13% 5/15/25 (c) | | 2,135,000 | 2,239,859 |
| | | | 39,888,121 |
| Metals/Mining - 2.0% | | | |
| Alcoa Nederland Holding BV 4.125% 3/31/29 (c) | | 2,670,000 | 2,354,433 |
| Alpha Natural Resources, Inc. 9.75% 4/15/18 (a)(f) | | 1,099,000 | 0 |
| Arconic Corp. 6% 5/15/25(c) | | 1,520,000 | 1,491,500 |
| Cleveland-Cliffs, Inc.: | | | |
| 4.625% 3/1/29 (c) | | 1,465,000 | 1,300,517 |
| 4.875% 3/1/31 (c) | | 1,465,000 | 1,278,967 |
| Constellium NV 5.875% 2/15/26 (c) | | 990,000 | 952,159 |
| ERO Copper Corp. 6.5% 2/15/30 (c) | | 7,425,000 | 5,499,141 |
| First Quantum Minerals Ltd.: | | | |
| 6.875% 3/1/26 (c) | | 3,930,000 | 3,772,309 |
| 6.875% 10/15/27 (c) | | 2,995,000 | 2,866,574 |
| 7.5% 4/1/25 (c) | | 2,320,000 | 2,289,550 |
| FMG Resources Pty Ltd.: | | | |
| 4.375% 4/1/31 (c) | | 1,615,000 | 1,317,323 |
| 5.125% 5/15/24 (c) | | 770,000 | 761,930 |
| 5.875% 4/15/30 (c) | | 4,300,000 | 3,966,750 |
| Howmet Aerospace, Inc. 5.95% 2/1/37 | | 1,505,000 | 1,459,399 |
| HudBay Minerals, Inc. 6.125% 4/1/29 (c) | | 4,755,000 | 4,185,550 |
| Mineral Resources Ltd.: | | | |
| 8% 11/1/27 (c) | | 2,835,000 | 2,828,238 |
| 8.5% 5/1/30 (c) | | 680,000 | 684,977 |
| | | | 37,009,317 |
| Paper - 0.8% | | | |
| Berry Global, Inc. 5.625% 7/15/27 (c) | | 1,110,000 | 1,083,915 |
| Clydesdale Acquisition Holdings, Inc.: | | | |
| 6.625% 4/15/29 (c) | | 1,070,000 | 1,027,109 |
| 8.75% 4/15/30 (c) | | 6,430,000 | 5,591,078 |
| Enviva Partners LP / Enviva Partners Finance Corp. 6.5% 1/15/26 (c) | | 3,315,000 | 3,220,025 |
| Mercer International, Inc. 5.125% 2/1/29 | | 2,220,000 | 1,938,171 |
| SPA Holdings 3 OY 4.875% 2/4/28 (c) | | 1,770,000 | 1,437,932 |
| | | | 14,298,230 |
| Restaurants - 0.7% | | | |
| 1011778 BC Unlimited Liability Co./New Red Finance, Inc. 4% 10/15/30 (c) | | 7,635,000 | 6,196,299 |
| CEC Entertainment LLC 6.75% 5/1/26 (c) | | 2,250,000 | 2,047,500 |
| KFC Holding Co./Pizza Hut Holding LLC 4.75% 6/1/27 (c) | | 1,325,000 | 1,271,569 |
| Papa John's International, Inc. 3.875% 9/15/29 (c) | | 870,000 | 743,850 |
| Yum! Brands, Inc. 4.625% 1/31/32 | | 2,585,000 | 2,283,770 |
| | | | 12,542,988 |
| Services - 4.1% | | | |
| Adtalem Global Education, Inc. 5.5% 3/1/28 (c) | | 4,564,000 | 4,335,800 |
| Allied Universal Holdco LLC / Allied Universal Finance Corp. 6% 6/1/29 (c) | | 1,050,000 | 779,305 |
| Aramark Services, Inc. 6.375% 5/1/25 (c) | | 3,410,000 | 3,380,163 |
| ASGN, Inc. 4.625% 5/15/28 (c) | | 5,875,000 | 5,192,186 |
| Atlas Luxco 4 SARL / Allied Universal Holdco LLC / Allied Universal Finance Corp. 4.625% 6/1/28 (c) | | 1,328,000 | 1,112,778 |
| Avis Budget Car Rental LLC/Avis Budget Finance, Inc. 5.375% 3/1/29 (c) | | 1,470,000 | 1,293,600 |
| Booz Allen Hamilton, Inc. 3.875% 9/1/28 (c) | | 2,405,000 | 2,139,248 |
| Brand Energy & Infrastructure Services, Inc. 8.5% 7/15/25 (c) | | 15,565,000 | 12,607,650 |
| CoreCivic, Inc.: | | | |
| 4.625% 5/1/23 | | 255,000 | 253,065 |
| 8.25% 4/15/26 | | 3,735,000 | 3,692,387 |
| GEMS MENASA Cayman Ltd. 7.125% 7/31/26 (c) | | 9,979,000 | 9,438,263 |
| H&E Equipment Services, Inc. 3.875% 12/15/28 (c) | | 4,110,000 | 3,472,457 |
| Hertz Corp.: | | | |
| 4.625% 12/1/26 (c) | | 1,680,000 | 1,438,937 |
| 5% 12/1/29 (c) | | 2,190,000 | 1,761,615 |
| 5.5% 10/15/24 (a)(c)(f) | | 3,155,000 | 7,888 |
| 6% 1/15/28 (a)(c)(f) | | 3,900,000 | 229,125 |
| 6.25% 10/15/22 (a)(f) | | 2,880,000 | 3,600 |
| 7.125% 8/1/26 (a)(c)(f) | | 3,980,000 | 159,200 |
| KAR Auction Services, Inc. 5.125% 6/1/25 (c) | | 178,000 | 174,787 |
| Sabre GLBL, Inc. 7.375% 9/1/25 (c) | | 2,500,000 | 2,368,500 |
| Service Corp. International 5.125% 6/1/29 | | 1,845,000 | 1,747,971 |
| The GEO Group, Inc.: | | | |
| 9.5% 12/31/28 (c) | | 6,055,000 | 5,419,225 |
| 10.5% 6/30/28 | | 2,453,000 | 2,333,213 |
| Uber Technologies, Inc.: | | | |
| 4.5% 8/15/29 (c) | | 12,875,000 | 11,177,109 |
| 6.25% 1/15/28 (c) | | 2,145,000 | 2,048,475 |
| WASH Multifamily Acquisition, Inc. 5.75% 4/15/26 (c) | | 1,640,000 | 1,580,911 |
| | | | 78,147,458 |
| Steel - 0.4% | | | |
| Commercial Metals Co. 3.875% 2/15/31 | | 1,125,000 | 933,772 |
| Infrabuild Australia Pty Ltd. 12% 10/1/24 (c) | | 5,970,000 | 5,630,904 |
| Roller Bearing Co. of America, Inc. 4.375% 10/15/29 (c) | | 690,000 | 619,275 |
| | | | 7,183,951 |
| Super Retail - 1.2% | | | |
| Asbury Automotive Group, Inc.: | | | |
| 4.5% 3/1/28 | | 681,000 | 608,181 |
| 4.625% 11/15/29 (c) | | 1,520,000 | 1,303,400 |
| 4.75% 3/1/30 | | 680,000 | 578,000 |
| 5% 2/15/32 (c) | | 1,520,000 | 1,269,428 |
| Bath & Body Works, Inc. 6.625% 10/1/30 (c) | | 5,045,000 | 4,583,181 |
| Carvana Co. 4.875% 9/1/29 (c) | | 1,730,000 | 983,522 |
| EG Global Finance PLC: | | | |
| 6.75% 2/7/25 (c) | | 12,050,000 | 11,384,957 |
| 8.5% 10/30/25 (c) | | 2,520,000 | 2,353,176 |
| | | | 23,063,845 |
| Technology - 4.2% | | | |
| Arches Buyer, Inc.: | | | |
| 4.25% 6/1/28 (c) | | 1,580,000 | 1,271,900 |
| 6.125% 12/1/28 (c) | | 555,000 | 434,121 |
| Black Knight InfoServ LLC 3.625% 9/1/28 (c) | | 2,675,000 | 2,340,625 |
| Block, Inc.: | | | |
| 2.75% 6/1/26 | | 2,555,000 | 2,270,552 |
| 3.5% 6/1/31 | | 2,555,000 | 2,102,075 |
| CA Magnum Holdings 5.375% (c)(g) | | 770,000 | 689,150 |
| Camelot Finance SA 4.5% 11/1/26 (c) | | 2,285,000 | 2,125,050 |
| CDW LLC/CDW Finance Corp. 4.25% 4/1/28 | | 2,960,000 | 2,740,042 |
| Central Parent, Inc./Central Merger Sub, Inc. 7.25% 6/15/29 (c) | | 4,225,000 | 4,045,902 |
| Elastic NV 4.125% 7/15/29 (c) | | 1,275,000 | 1,078,943 |
| Go Daddy Operating Co. LLC / GD Finance Co., Inc. 5.25% 12/1/27 (c) | | 2,235,000 | 2,100,900 |
| II-VI, Inc. 5% 12/15/29 (c) | | 1,385,000 | 1,233,162 |
| Match Group Holdings II LLC: | | | |
| 4.125% 8/1/30 (c) | | 2,335,000 | 1,932,079 |
| 5% 12/15/27 (c) | | 1,235,000 | 1,139,288 |
| 5.625% 2/15/29 (c) | | 2,035,000 | 1,900,500 |
| MicroStrategy, Inc. 6.125% 6/15/28 (c) | | 7,785,000 | 6,496,416 |
| NCR Corp. 5.125% 4/15/29 (c) | | 1,775,000 | 1,657,442 |
| Northwest Fiber LLC/Northwest Fiber Finance Sub, Inc. 10.75% 6/1/28 (c) | | 1,450,000 | 1,337,886 |
| NortonLifeLock, Inc. 5% 4/15/25 (c) | | 6,075,000 | 5,996,025 |
| onsemi 3.875% 9/1/28 (c) | | 3,110,000 | 2,773,498 |
| Open Text Corp. 3.875% 12/1/29 (c) | | 2,200,000 | 1,774,151 |
| Open Text Holdings, Inc.: | | | |
| 4.125% 2/15/30 (c) | | 3,095,000 | 2,491,057 |
| 4.125% 12/1/31 (c) | | 2,200,000 | 1,738,000 |
| Qorvo, Inc. 4.375% 10/15/29 | | 5,505,000 | 4,858,163 |
| Rackspace Hosting, Inc. 5.375% 12/1/28 (c) | | 1,430,000 | 788,644 |
| Roblox Corp. 3.875% 5/1/30 (c) | | 6,055,000 | 5,050,903 |
| Sensata Technologies BV 4% 4/15/29 (c) | | 2,480,000 | 2,143,811 |
| Synaptics, Inc. 4% 6/15/29 (c) | | 1,210,000 | 1,039,862 |
| TTM Technologies, Inc. 4% 3/1/29 (c) | | 2,215,000 | 1,915,980 |
| Twilio, Inc.: | | | |
| 3.625% 3/15/29 | | 1,725,000 | 1,440,375 |
| 3.875% 3/15/31 | | 1,805,000 | 1,456,509 |
| Uber Technologies, Inc.: | | | |
| 7.5% 5/15/25 (c) | | 5,010,000 | 5,042,412 |
| 7.5% 9/15/27 (c) | | 2,765,000 | 2,768,525 |
| Unisys Corp. 6.875% 11/1/27 (c) | | 1,425,000 | 1,188,878 |
| | | | 79,362,826 |
| Telecommunications - 7.4% | | | |
| Altice Financing SA: | | | |
| 5% 1/15/28 (c) | | 2,375,000 | 1,916,364 |
| 5.75% 8/15/29 (c) | | 7,480,000 | 6,033,443 |
| Altice France SA: | | | |
| 5.125% 1/15/29 (c) | | 2,270,000 | 1,762,832 |
| 5.125% 7/15/29 (c) | | 4,510,000 | 3,426,067 |
| 5.5% 1/15/28 (c) | | 4,825,000 | 3,926,754 |
| C&W Senior Financing Designated Activity Co. 6.875% 9/15/27 (c) | | 9,965,000 | 8,794,113 |
| Cablevision Lightpath LLC: | | | |
| 3.875% 9/15/27 (c) | | 1,280,000 | 1,117,094 |
| 5.625% 9/15/28 (c) | | 1,010,000 | 822,964 |
| Cogent Communications Group, Inc. 3.5% 5/1/26 (c) | | 1,700,000 | 1,530,560 |
| Consolidated Communications, Inc. 5% 10/1/28 (c) | | 1,320,000 | 1,016,813 |
| Frontier Communications Holdings LLC: | | | |
| 5% 5/1/28 (c) | | 2,480,000 | 2,173,621 |
| 5.875% 10/15/27 (c) | | 2,440,000 | 2,275,910 |
| 5.875% 11/1/29 | | 615,475 | 502,381 |
| 6% 1/15/30 (c) | | 3,035,000 | 2,500,901 |
| 6.75% 5/1/29 (c) | | 2,795,000 | 2,410,660 |
| 8.75% 5/15/30 (c) | | 2,210,000 | 2,274,930 |
| Intelsat Jackson Holdings SA: | | | |
| 5.5% 8/1/23 (a)(f) | | 7,570,000 | 1 |
| 6.5% 3/15/30 (c) | | 10,625,000 | 9,631,350 |
| 8.5% 10/15/24 (a)(c)(f) | | 2,965,000 | 0 |
| LCPR Senior Secured Financing DAC: | | | |
| 5.125% 7/15/29 (c) | | 2,520,000 | 2,167,200 |
| 6.75% 10/15/27 (c) | | 4,724,000 | 4,458,700 |
| Level 3 Financing, Inc.: | | | |
| 3.75% 7/15/29 (c) | | 3,850,000 | 3,091,088 |
| 4.25% 7/1/28 (c) | | 3,420,000 | 2,842,875 |
| 4.625% 9/15/27 (c) | | 7,220,000 | 6,378,292 |
| Lumen Technologies, Inc. 4% 2/15/27 (c) | | 4,225,000 | 3,672,518 |
| Northwest Fiber LLC/Northwest Fiber Finance Sub, Inc.: | | | |
| 4.75% 4/30/27 (c) | | 1,700,000 | 1,482,638 |
| 6% 2/15/28 (c) | | 790,000 | 616,322 |
| Sable International Finance Ltd. 5.75% 9/7/27 (c) | | 4,895,000 | 4,466,688 |
| Sabre GLBL, Inc. 9.25% 4/15/25 (c) | | 1,820,000 | 1,793,228 |
| SBA Communications Corp. 3.875% 2/15/27 | | 5,020,000 | 4,569,590 |
| Sprint Capital Corp. 8.75% 3/15/32 | | 26,030,000 | 31,423,917 |
| Telecom Italia SpA 5.303% 5/30/24 (c) | | 2,020,000 | 1,944,492 |
| Uniti Group, Inc. 6% 1/15/30 (c) | | 6,860,000 | 4,837,019 |
| Windstream Escrow LLC 7.75% 8/15/28 (c) | | 10,615,000 | 9,124,452 |
| Zayo Group Holdings, Inc.: | | | |
| 4% 3/1/27 (c) | | 3,835,000 | 3,269,338 |
| 6.125% 3/1/28 (c) | | 2,115,000 | 1,619,625 |
| | | | 139,874,740 |
| Textiles/Apparel - 0.4% | | | |
| Crocs, Inc.: | | | |
| 4.125% 8/15/31 (c) | | 3,760,000 | 2,959,321 |
| 4.25% 3/15/29 (c) | | 3,735,000 | 3,049,267 |
| Victoria's Secret & Co. 4.625% 7/15/29 (c) | | 1,665,000 | 1,319,513 |
| | | | 7,328,101 |
| Transportation Ex Air/Rail - 0.5% | | | |
| Avolon Holdings Funding Ltd.: | | | |
| 3.95% 7/1/24 (c) | | 9,000 | 8,594 |
| 4.375% 5/1/26 (c) | | 7,000 | 6,471 |
| Navios South American Logistics, Inc./Navios Logistics Finance U.S., Inc. 10.75% 7/1/25 (c) | | 5,110,000 | 4,844,919 |
| Seaspan Corp.: | | | |
| 5.5% 8/1/29 (c) | | 3,695,000 | 3,042,962 |
| 6.5% 4/29/26 (c) | | 2,100,000 | 2,052,750 |
| | | | 9,955,696 |
| Utilities - 5.6% | | | |
| Clearway Energy Operating LLC 4.75% 3/15/28 (c) | | 5,885,000 | 5,509,831 |
| DPL, Inc. 4.35% 4/15/29 | | 9,480,000 | 8,330,408 |
| InterGen NV 7% 6/30/23 (c) | | 30,215,000 | 28,704,250 |
| NRG Energy, Inc.: | | | |
| 3.875% 2/15/32 (c) | | 1,470,000 | 1,164,975 |
| 5.25% 6/15/29 (c) | | 3,050,000 | 2,726,090 |
| 6.625% 1/15/27 | | 891,000 | 883,939 |
| Pacific Gas & Electric Co.: | | | |
| 3.75% 8/15/42 | | 350,000 | 241,969 |
| 3.95% 12/1/47 | | 2,495,000 | 1,704,100 |
| 4.55% 7/1/30 | | 16,150,000 | 14,362,497 |
| 4.95% 7/1/50 | | 23,225,000 | 18,535,482 |
| PG&E Corp.: | | | |
| 5% 7/1/28 | | 3,405,000 | 3,023,521 |
| 5.25% 7/1/30 | | 9,430,000 | 8,152,235 |
| Pike Corp. 5.5% 9/1/28 (c) | | 6,330,000 | 5,233,086 |
| TerraForm Global, Inc. 6.125% 3/1/26 (c) | | 2,450,000 | 2,307,900 |
| Vertiv Group Corp. 4.125% 11/15/28 (c) | | 3,055,000 | 2,642,575 |
| Vistra Operations Co. LLC 5.625% 2/15/27 (c) | | 2,000,000 | 1,925,000 |
| | | | 105,447,858 |
|
| TOTAL NONCONVERTIBLE BONDS | | | 1,460,682,110 |
|
| TOTAL CORPORATE BONDS | | | |
| (Cost $1,681,054,884) | | | 1,516,974,128 |
| | | Shares | Value |
|
| Common Stocks - 6.4% | | | |
| Automotive & Auto Parts - 0.0% | | | |
| UC Holdings, Inc. (a)(h) | | 32,168 | 161,805 |
| Broadcasting - 0.0% | | | |
| iHeartMedia, Inc. (h) | | 8,204 | 72,605 |
| Chemicals - 0.0% | | | |
| Corteva, Inc. | | 10,266 | 630,640 |
| Energy - 4.7% | | | |
| California Resources Corp. | | 233,262 | 11,653,770 |
| California Resources Corp. warrants 10/27/24 (h) | | 20,004 | 367,073 |
| Chesapeake Energy Corp. (i) | | 111,481 | 11,202,726 |
| Chesapeake Energy Corp. (b) | | 2,990 | 300,465 |
| Denbury, Inc. (h) | | 91,241 | 8,114,062 |
| Denbury, Inc. warrants 9/18/25 (h) | | 117,577 | 7,054,620 |
| EP Energy Corp. (a)(h) | | 218,900 | 2,046,715 |
| Forbes Energy Services Ltd. (a)(h) | | 72,087 | 7 |
| Jonah Energy Parent LLC (a)(h) | | 425,801 | 29,942,326 |
| Mesquite Energy, Inc. (a)(h) | | 214,437 | 13,606,008 |
| Noble Corp. (c) | | 1,017 | 30,866 |
| Noble Corp. (h) | | 6,653 | 201,919 |
| Noble Corp.: | | | |
| warrants 2/5/28 (h) | | 27,051 | 435,521 |
| warrants 2/5/28 (h) | | 27,051 | 371,951 |
| PureWest Energy (a) | | 2,832 | 33,999 |
| PureWest Energy rights (a)(h) | | 1,707 | 0 |
| Superior Energy Services, Inc. Class A (a)(h) | | 15,005 | 384,137 |
| Tidewater, Inc. warrants 11/14/42 (h) | | 8,251 | 201,079 |
| Tribune Resources, Inc. (a)(h) | | 182,155 | 103,828 |
| Tribune Resources, Inc. warrants 3/30/23 (a)(h) | | 51,925 | 1 |
| Valaris Ltd. (h) | | 38,587 | 1,967,165 |
|
| TOTAL ENERGY | | | 88,018,238 |
|
| Entertainment/Film - 0.0% | | | |
| New Cotai LLC/New Cotai Capital Corp. (a)(b)(h) | | 1,330,466 | 13 |
| Food & Drug Retail - 0.9% | | | |
| Northeast Grocery, Inc. (a)(b) | | 228,430 | 90,888 |
| Southeastern Grocers, Inc. (a)(b)(h) | | 687,397 | 15,837,627 |
|
| TOTAL FOOD & DRUG RETAIL | | | 15,928,515 |
|
| Gaming - 0.1% | | | |
| Caesars Entertainment, Inc. (h) | | 57,808 | 2,492,681 |
| Studio City International Holdings Ltd.: | | | |
| ADR (c) | | 25,434 | 44,255 |
| (NYSE) ADR (h) | | 28,000 | 48,720 |
|
| TOTAL GAMING | | | 2,585,656 |
|
| Telecommunications - 0.1% | | | |
| CUI Acquisition Corp. Class E (a)(h) | | 0 | 16,065 |
| Frontier Communications Parent, Inc. (h) | | 77,463 | 1,995,447 |
| Intelsat Jackson Holdings SA: | | | |
| Series A rights (a)(h) | | 10,413 | 89,552 |
| Series B rights (a)(h) | | 10,413 | 330,300 |
|
| TOTAL TELECOMMUNICATIONS | | | 2,431,364 |
|
| Textiles/Apparel - 0.3% | | | |
| Intelsat Emergence SA (a) | | 99,434 | 4,492,428 |
| Utilities - 0.3% | | | |
| Vistra Corp. | | 220,662 | 5,461,385 |
| TOTAL COMMON STOCKS | | | |
| (Cost $49,721,251) | | | 119,782,649 |
|
| Convertible Preferred Stocks - 0.4% | | | |
| Utilities - 0.4% | | | |
| PG&E Corp. | | | |
| (Cost $6,993,013) | | 61,000 | 6,938,574 |
| | | Principal Amount | Value |
|
| Bank Loan Obligations - 4.1% | | | |
| Banks & Thrifts - 0.0% | | | |
| First Eagle Holdings, Inc. Tranche B 1LN, term loan 1 month U.S. LIBOR + 2.500% 4.7504% 2/1/27 (d)(e)(j) | | 1,067,902 | 1,020,231 |
| Broadcasting - 0.1% | | | |
| Diamond Sports Group LLC 1LN, term loan CME Term SOFR 1 Month Index + 8.000% 10.3874% 5/25/26 (d)(e)(j) | | 367,030 | 344,894 |
| Springer Nature Deutschland GmbH Tranche B18 1LN, term loan 1 month U.S. LIBOR + 3.500% 5.5239% 8/14/26 (d)(e)(j) | | 1,130,162 | 1,112,645 |
|
| TOTAL BROADCASTING | | | 1,457,539 |
|
| Building Materials - 0.1% | | | |
| Hunter Douglas, Inc. Tranche B 1LN, term loan CME Term SOFR 1 Month Index + 3.500% 6.3399% 2/25/29 (d)(e)(j) | | 1,545,000 | 1,346,468 |
| Cable/Satellite TV - 0.1% | | | |
| Numericable LLC Tranche B 13LN, term loan 3 month U.S. LIBOR + 4.000% 6.9051% 8/14/26 (d)(e)(j) | | 1,058,750 | 1,023,811 |
| Chemicals - 0.5% | | | |
| Consolidated Energy Finance SA: | | | |
| Tranche B 1LN, term loan 1 month U.S. LIBOR + 3.500% 6.3633% 5/7/25 (a)(d)(e)(j) | | 5,727,150 | 5,526,700 |
| Tranche B, term loan 3 month U.S. LIBOR + 2.500% 5.2929% 5/7/25 (d)(e)(j) | | 523,200 | 507,504 |
| Discovery Purchaser Corp. 1LN, term loan CME Term SOFR 1 Month Index + 4.370% 8/3/29 (e)(j)(k) | | 2,860,000 | 2,677,675 |
| Starfruit U.S. Holdco LLC Tranche B, term loan 1 month U.S. LIBOR + 3.000% 5.2504% 10/1/25 (d)(e)(j) | | 653,189 | 635,716 |
|
| TOTAL CHEMICALS | | | 9,347,595 |
|
| Consumer Products - 0.1% | | | |
| Michaels Companies, Inc. 1LN, term loan 1 month U.S. LIBOR + 4.250% 6.5004% 4/15/28 (d)(e)(j) | | 925,650 | 764,531 |
| The Golub Corp. 2LN, term loan 3 month U.S. LIBOR + 13.500% 16.37% 5/8/26 (a)(d)(e)(j) | | 1,416,448 | 1,416,448 |
|
| TOTAL CONSUMER PRODUCTS | | | 2,180,979 |
|
| Diversified Financial Services - 0.7% | | | |
| Cabazon Finance Authority term loan 11% 3/7/24 pay-in-kind (a)(d)(j) | | 2,887,033 | 2,887,033 |
| HarbourVest Partners LLC Tranche B 1LN, term loan 3 month U.S. LIBOR + 2.250% 4.762% 3/1/25 (d)(e)(j) | | 251,648 | 246,721 |
| Softbank SVF II Cayman LP 1LN, term loan 3 month U.S. LIBOR + 5.000% 5% 12/31/24 (a)(d)(e)(j) | | 10,424,789 | 10,424,789 |
|
| TOTAL DIVERSIFIED FINANCIAL SERVICES | | | 13,558,543 |
|
| Energy - 0.1% | | | |
| Citgo Holding, Inc. Tranche B 1LN, term loan 1 month U.S. LIBOR + 7.000% 9.5239% 8/1/23 (d)(e)(j) | | 294,424 | 293,779 |
| Epic Crude Services LP Tranche B 1LN, term loan 3 month U.S. LIBOR + 5.000% 7.08% 3/1/26 (d)(e)(j) | | 1,758,372 | 1,489,781 |
| Mesquite Energy, Inc.: | | | |
| 1LN, term loan 3 month U.S. LIBOR + 8.000% 0% (a)(e)(f)(j) | | 3,964,252 | 0 |
| term loan 3 month U.S. LIBOR + 0.000% 0% (a)(e)(f)(j) | | 1,710,000 | 0 |
|
| TOTAL ENERGY | | | 1,783,560 |
|
| Food/Beverage/Tobacco - 0.1% | | | |
| Del Monte Foods, Inc. Tranche B 1LN, term loan CME Term SOFR 1 Month Index + 4.250% 6.647% 5/16/29 (d)(e)(j) | | 1,885,000 | 1,813,144 |
| Gaming - 0.1% | | | |
| Golden Entertainment, Inc. Tranche B, term loan 3 month U.S. LIBOR + 3.000% 5.46% 10/20/24 (d)(e)(j) | | 967,500 | 955,706 |
| Scientific Games Holdings LP term loan CME Term SOFR 1 Month Index + 3.500% 5.6165% 4/4/29 (d)(e)(j) | | 455,000 | 437,624 |
|
| TOTAL GAMING | | | 1,393,330 |
|
| Healthcare - 0.1% | | | |
| Electron BidCo, Inc. Tranche B 1LN, term loan 1 month U.S. LIBOR + 3.000% 5.5239% 11/1/28 (d)(e)(j) | | 289,275 | 281,592 |
| Phoenix Newco, Inc. Tranche B 1LN, term loan 1 month U.S. LIBOR + 3.250% 5.7739% 11/15/28 (d)(e)(j) | | 1,132,163 | 1,101,028 |
|
| TOTAL HEALTHCARE | | | 1,382,620 |
|
| Hotels - 0.1% | | | |
| Travelport Finance Luxembourg SARL 1LN, term loan 3 month U.S. LIBOR + 6.750% 9.0004% 5/30/26 (d)(e)(j) | | 1,387,211 | 1,025,385 |
| Insurance - 0.1% | | | |
| Acrisure LLC Tranche B 1LN, term loan 1 month U.S. LIBOR + 4.250% 6.6223% 2/15/27 (d)(e)(j) | | 213,925 | 207,330 |
| Alliant Holdings Intermediate LLC: | | | |
| Tranche B, term loan 1 month U.S. LIBOR + 3.250% 5.7739% 5/10/25 (d)(e)(j) | | 61,766 | 60,473 |
| Tranche B-2 1LN, term loan 1 month U.S. LIBOR + 3.250% 5.7739% 5/9/25 (d)(e)(j) | | 1,998,200 | 1,954,080 |
| USI, Inc. Tranche B, term loan 3 month U.S. LIBOR + 3.000% 5.2504% 5/16/24 (d)(e)(j) | | 438,150 | 432,581 |
|
| TOTAL INSURANCE | | | 2,654,464 |
|
| Leisure - 0.0% | | | |
| Alterra Mountain Co. Tranche B 1LN, term loan 1 month U.S. LIBOR + 3.500% 6.0239% 8/17/28 (d)(e)(j) | | 43,099 | 41,860 |
| Railroad - 0.0% | | | |
| Einstein Merger Sub, Inc. 2LN, term loan 3 month U.S. LIBOR + 7.000% 9.8059% 11/23/29 (a)(d)(e)(j) | | 915,000 | 910,425 |
| Services - 0.6% | | | |
| ABG Intermediate Holdings 2 LLC Tranche B 2LN, term loan CME Term SOFR 1 Month Index + 6.000% 8.5553% 12/20/29 (d)(e)(j) | | 165,000 | 153,450 |
| Ascend Learning LLC 2LN, term loan 1 month U.S. LIBOR + 5.750% 8.2739% 12/10/29 (d)(e)(j) | | 305,000 | 273,280 |
| Asurion LLC 1LN, term loan CME Term SOFR 1 Month Index + 4.000% 6.4011% 8/16/28 (d)(e)(j) | | 4,300,000 | 4,006,181 |
| Finastra U.S.A., Inc. Tranche 2LN, term loan 3 month U.S. LIBOR + 7.250% 10.6207% 6/13/25 (d)(e)(j) | | 4,035,000 | 3,590,020 |
| KUEHG Corp. Tranche B 2LN, term loan 3 month U.S. LIBOR + 8.250% 10.5004% 8/22/25 (d)(e)(j) | | 2,230,000 | 2,170,526 |
| Spin Holdco, Inc. Tranche B 1LN, term loan 1 month U.S. LIBOR + 4.000% 5.6107% 3/4/28 (d)(e)(j) | | 1,491,125 | 1,397,930 |
|
| TOTAL SERVICES | | | 11,591,387 |
|
| Super Retail - 0.1% | | | |
| Bass Pro Group LLC Tranche B 1LN, term loan 1 month U.S. LIBOR + 3.750% 6.1223% 3/5/28 (d)(e)(j) | | 2,636,248 | 2,546,615 |
| Technology - 1.2% | | | |
| Anastasia Parent LLC Tranche B, term loan 3 month U.S. LIBOR + 3.750% 6.0004% 8/10/25 (d)(e)(j) | | 4,935,897 | 3,998,077 |
| Athenahealth Group, Inc.: | | | |
| Tranche B 1LN, term loan CME Term SOFR 1 Month Index + 3.500% 5.7998% 2/15/29 (d)(e)(j) | | 2,727,681 | 2,604,936 |
| Tranche DD 1LN, term loan CME Term SOFR 1 Month Index + 3.500% 2/15/29 (e)(j)(l) | | 462,319 | 441,514 |
| Ceridian HCM Holding, Inc. Tranche B, term loan 1 month U.S. LIBOR + 2.500% 5.0239% 4/30/25 (d)(e)(j) | | 1,578,500 | 1,536,670 |
| Epicor Software Corp. 2LN, term loan 1 month U.S. LIBOR + 7.750% 10.2739% 7/31/28 (d)(e)(j) | | 1,945,000 | 1,934,458 |
| UKG, Inc. 1LN, term loan 3 month U.S. LIBOR + 3.750% 6.1223% 5/4/26 (d)(e)(j) | | 695,338 | 676,306 |
| Ultimate Software Group, Inc.: | | | |
| 1LN, term loan 1 month U.S. LIBOR + 3.250% 5.5351% 5/3/26 (d)(e)(j) | | 3,928,310 | 3,799,933 |
| 2LN, term loan 1 month U.S. LIBOR + 5.250% 7.5351% 5/3/27 (d)(e)(j) | | 6,955,000 | 6,758,313 |
| VS Buyer LLC Tranche B 1LN, term loan 1 month U.S. LIBOR + 3.000% 5.3723% 2/28/27 (d)(e)(j) | | 439,875 | 430,528 |
|
| TOTAL TECHNOLOGY | | | 22,180,735 |
|
| TOTAL BANK LOAN OBLIGATIONS | | | |
| (Cost $83,477,281) | | | 77,258,691 |
|
| Preferred Securities - 1.6% | | | |
| Banks & Thrifts - 1.4% | | | |
| Bank of America Corp.: | | | |
| 4.3% (d)(g) | | 2,610,000 | 2,198,180 |
| 6.1% (d)(g) | | 3,690,000 | 3,758,157 |
| 6.25% (d)(g) | | 2,310,000 | 2,352,861 |
| Citigroup, Inc. 5.95% (d)(g) | | 4,825,000 | 4,801,064 |
| JPMorgan Chase & Co. 6% (d)(g) | | 11,680,000 | 11,482,659 |
| Wells Fargo & Co. 5.9% (d)(g) | | 1,955,000 | 1,863,751 |
|
| TOTAL BANKS & THRIFTS | | | 26,456,672 |
|
| Energy - 0.0% | | | |
| MPLX LP 6.875% (d)(g) | | 1,270,000 | 1,228,878 |
| Summit Midstream Partners LP 9.5% (d)(g) | | 204,000 | 146,930 |
|
| TOTAL ENERGY | | | 1,375,808 |
|
| Insurance - 0.2% | | | |
| Alliant Holdings Intermediate LLC 9.75% (a)(g) | | 4,000,000 | 3,326,766 |
| TOTAL PREFERRED SECURITIES | | | |
| (Cost $33,485,267) | | | 31,159,246 |
| | | Shares | Value |
|
| Other - 0.6% | | | |
| Other - 0.6% | | | |
| Fidelity Direct Lending Fund, LP (b)(m) | | | 11,189,162 |
| Tribune Co. Claim (a)(h) | | 11,217 | 7,516 |
|
| TOTAL OTHER | | | |
|
| (Cost $11,283,309) | | | 11,196,678 |
|
| Money Market Funds - 5.8% | | | |
| Fidelity Cash Central Fund 2.33% (n) | | 99,228,550 | 99,248,396 |
| Fidelity Securities Lending Cash Central Fund 2.34% (n)(o) | | 10,578,942 | 10,580,000 |
| TOTAL MONEY MARKET FUNDS | | | |
| (Cost $109,828,396) | | | 109,828,396 |
| TOTAL INVESTMENT IN SECURITIES - 99.6% | | | |
| (Cost $1,975,843,401) | | | 1,873,138,362 |
| NET OTHER ASSETS (LIABILITIES) - 0.4% | | | 7,058,389 |
| NET ASSETS - 100% | | | $1,880,196,751 |
Legend
(a) Level 3 security
(b) Restricted securities (including private placements) - Investment in securities not registered under the Securities Act of 1933 (excluding 144A issues). At the end of the period, the value of restricted securities (excluding 144A issues) amounted to $58,637,538 or 3.1% of net assets.
(c) Security exempt from registration under Rule 144A of the Securities Act of 1933. These securities may be resold in transactions exempt from registration, normally to qualified institutional buyers. At the end of the period, the value of these securities amounted to $1,131,427,669 or 60.2% of net assets.
(d) Coupon rates for floating and adjustable rate securities reflect the rates in effect at period end.
(e) Coupon is indexed to a floating interest rate which may be multiplied by a specified factor and/or subject to caps or floors.
(f) Non-income producing - Security is in default.
(g) Security is perpetual in nature with no stated maturity date.
(h) Non-income producing
(i) Security or a portion of the security is on loan at period end.
(j) Remaining maturities of bank loan obligations may be less than the stated maturities shown as a result of contractual or optional prepayments by the borrower. Such prepayments cannot be predicted with certainty.
(k) The coupon rate will be determined upon settlement of the loan after period end.
(l) Position or a portion of the position represents an unfunded loan commitment. At period end, the total principal amount and market value of unfunded commitments totaled $462,319 and $441,514, respectively.
(m) Affiliated Fund
(n) Affiliated fund that is generally available only to investment companies and other accounts managed by Fidelity Investments. The rate quoted is the annualized seven-day yield of the fund at period end. A complete unaudited listing of the fund's holdings as of its most recent quarter end is available upon request. In addition, each Fidelity Central Fund's financial statements, which are not covered by the Fund's Report of Independent Registered Public Accounting Firm, are available on the SEC's website or upon request.
(o) Investment made with cash collateral received from securities on loan.
Additional information on each restricted holding is as follows:
| Security | Acquisition Date | Acquisition Cost |
| Chesapeake Energy Corp. | 2/10/21 | $28,315 |
| Fidelity Direct Lending Fund, LP | 12/9/21 - 8/31/22 | $11,272,092 |
| Mesquite Energy, Inc. 15% 7/15/23 | 7/10/20 - 1/18/22 | $1,687,240 |
| Mesquite Energy, Inc. 15% 7/15/23 | 11/5/20 - 1/18/22 | $2,913,114 |
| New Cotai LLC/New Cotai Capital Corp. | 9/11/20 | $6,590,796 |
| Northeast Grocery, Inc. | 11/8/21 | $90,888 |
| Southeastern Grocers, Inc. | 6/1/18 - 4/26/19 | $5,072,958 |
Affiliated Central Funds
Fiscal year to date information regarding the Fund's investments in Fidelity Central Funds, including the ownership percentage, is presented below.
| Fund | Value, beginning of period | Purchases | Sales Proceeds | Dividend Income | Realized Gain/Loss | Change in Unrealized appreciation (depreciation) | Value, end of period | % ownership, end of period |
| Fidelity Cash Central Fund 2.33% | $101,214,485 | $609,729,238 | $611,695,327 | $451,029 | $-- | $-- | $99,248,396 | 0.2% |
| Fidelity Securities Lending Cash Central Fund 2.34% | -- | 59,297,544 | 48,717,544 | 5,229 | -- | -- | 10,580,000 | 0.0% |
| Total | $101,214,485 | $669,026,782 | $660,412,871 | $456,258 | $-- | $-- | $109,828,396 | |
Amounts in the income column in the above table include any capital gain distributions from underlying funds, which are presented in the corresponding line-item in the Statement of Operations, if applicable. Amount for Fidelity Securities Lending Cash Central Fund represents the income earned on investing cash collateral, less rebates paid to borrowers and any lending agent fees associated with the loan, plus any premium payments received for lending certain types of securities.
Affiliated Underlying Funds
Fiscal year to date information regarding the Fund's investments in affiliated Underlying Funds is presented below. Exchanges between classes of the same affiliated Underlying Funds may occur, and are excluded from purchases and sales below if applicable. If an underlying Fund changes its name, the name presented below is the name in effect at period end.
| Affiliate | Value, beginning of period | Purchases | Sales Proceeds | Dividend Income | Realized Gain (loss) | Change in Unrealized appreciation (depreciation) | Value, end of period |
| Fidelity Direct Lending Fund, LP | $-- | $11,272,092 | $-- | $359,363 | $-- | $(82,930) | $11,189,162 |
| Total | $-- | $11,272,092 | $-- | $359,363 | $-- | $(82,930) | $11,189,162 |
Amounts in the income column in the above table include any capital gain distributions from underlying funds, which are presented in the corresponding line-item in the Statement of Operations, if applicable.
Investment Valuation
The following is a summary of the inputs used, as of August 31, 2022, involving the Fund's assets and liabilities carried at fair value. The inputs or methodology used for valuing securities may not be an indication of the risk associated with investing in those securities. For more information on valuation inputs, and their aggregation into the levels used below, please refer to the Investment Valuation section in the accompanying Notes to Financial Statements.
Amounts in this Investment Valuation section exclude the value of Fidelity Direct Lending Fund, LP as presented in the Schedule of Investments. Fidelity Direct Lending Fund, LP is valued using NAV as a practical expedient.
| | Valuation Inputs at Reporting Date: |
| Description | Total | Level 1 | Level 2 | Level 3 |
| Investments in Securities: | | | | |
| Equities: | | | | |
| Communication Services | $6,996,410 | $2,068,052 | $-- | $4,928,358 |
| Consumer Discretionary | 2,747,461 | 2,585,656 | -- | 161,805 |
| Consumer Staples | 15,928,515 | -- | -- | 15,928,515 |
| Energy | 87,984,239 | 41,700,138 | 201,079 | 46,083,022 |
| Materials | 630,640 | 630,640 | -- | -- |
| Utilities | 12,433,958 | 5,461,385 | 6,938,574 | 33,999 |
| Corporate Bonds | 1,516,974,128 | -- | 1,484,205,740 | 32,768,388 |
| Bank Loan Obligations | 77,258,691 | -- | 56,093,296 | 21,165,395 |
| Preferred Securities | 31,159,246 | -- | 27,832,480 | 3,326,766 |
| Other | 7,516 | -- | -- | 7,516 |
| Money Market Funds | 109,828,396 | 109,828,396 | -- | -- |
| Total Investments in Securities: | $1,861,949,200 | $162,274,267 | $1,575,271,169 | $124,403,764 |
The following is a reconciliation of Investments in Securities for which Level 3 inputs were used in determining value:
| Investments in Securities: | |
| Equities - Energy | |
| Beginning Balance | $47,227,878 |
| Net Realized Gain (Loss) on Investment Securities | 1,515,188 |
| Net Unrealized Gain (Loss) on Investment Securities | 16,924,492 |
| Cost of Purchases | -- |
| Proceeds of Sales | (19,591,550) |
| Amortization/Accretion | -- |
| Transfers into Level 3 | 7,014 |
| Transfers out of Level 3 | -- |
| Ending Balance | $46,083,022 |
| The change in unrealized gain (loss) for the period attributable to Level 3 securities held at August 31, 2022 | $16,924,492 |
| Corporate Bonds | |
| Beginning Balance | $15,036,742 |
| Net Realized Gain (Loss) on Investment Securities | (3,431,383) |
| Net Unrealized Gain (Loss) on Investment Securities | 19,489,906 |
| Cost of Purchases | 1,821,149 |
| Proceeds of Sales | (5,540,463) |
| Amortization/Accretion | (130,715) |
| Transfers into Level 3 | 5,537,500 |
| Transfers out of Level 3 | (14,348) |
| Ending Balance | $32,768,388 |
| The change in unrealized gain (loss) for the period attributable to Level 3 securities held at August 31, 2022 | $18,611,796 |
| Bank Loan Obligations | |
| Beginning Balance | $9,456,454 |
| Net Realized Gain (Loss) on Investment Securities | 17,522 |
| Net Unrealized Gain (Loss) on Investment Securities | (110,946) |
| Cost of Purchases | 13,499,356 |
| Proceeds of Sales | (1,732,786) |
| Amortization/Accretion | 35,795 |
| Transfers into Level 3 | -- |
| Transfers out of Level 3 | -- |
| Ending Balance | $21,165,395 |
| The change in unrealized gain (loss) for the period attributable to Level 3 securities held at August 31, 2022 | $(92,715) |
| Other Investments in Securities | |
| Beginning Balance | $23,816,346 |
| Net Realized Gain (Loss) on Investment Securities | (1) |
| Net Unrealized Gain (Loss) on Investment Securities | (2,445,670) |
| Cost of Purchases | 4,055,143 |
| Proceeds of Sales | (1,038,859) |
| Amortization/Accretion | -- |
| Transfers into Level 3 | -- |
| Transfers out of Level 3 | -- |
| Ending Balance | $24,386,959 |
| The change in unrealized gain (loss) for the period attributable to Level 3 securities held at August 31, 2022 | $(2,445,670) |
The information used in the above reconciliations represents fiscal year to date activity for any Investments in Securities identified as using Level 3 inputs at either the beginning or the end of the current fiscal period. Transfers into Level 3 were attributable to a lack of observable market data resulting from decreases in market activity, decreases in liquidity, security restructurings or corporate actions. Transfers out of Level 3 were attributable to observable market data becoming available for those securities. Cost of purchases and proceeds of sales may include securities received and/or delivered through in-kind transactions. Transfers in or out of Level 3 represent the beginning value of any Security or Instrument where a change in the pricing level occurred from the beginning to the end of the period. The cost of purchases and the proceeds of sales may include securities received or delivered through corporate actions or exchanges. Realized and unrealized gains (losses) disclosed in the reconciliations are included in Net Gain (Loss) on the Fund's Statement of Operations.
See accompanying notes which are an integral part of the financial statements.
Financial Statements
Statement of Assets and Liabilities
| | | August 31, 2022 |
| Assets | | |
Investment in securities, at value (including securities loaned of $10,631,842) — See accompanying schedule:
Unaffiliated issuers (cost $1,854,742,913) | $1,752,120,804 | |
| Fidelity Central Funds (cost $109,828,396) | 109,828,396 | |
| Other affiliated issuers (cost $11,272,092) | 11,189,162 | |
| Total Investment in Securities (cost $1,975,843,401) | | $1,873,138,362 |
| Cash | | 53,565 |
| Receivable for fund shares sold | | 553 |
| Dividends receivable | | 407,808 |
| Interest receivable | | 26,649,093 |
| Distributions receivable from Fidelity Central Funds | | 229,253 |
| Other receivables | | 113 |
| Total assets | | 1,900,478,747 |
| Liabilities | | |
| Payable for investments purchased | $9,404,523 | |
| Payable for fund shares redeemed | 102,726 | |
| Accrued management fee | 194,483 | |
| Other payables and accrued expenses | 264 | |
| Collateral on securities loaned | 10,580,000 | |
| Total liabilities | | 20,281,996 |
| Net Assets | | $1,880,196,751 |
| Net Assets consist of: | | |
| Paid in capital | | $1,979,839,033 |
| Total accumulated earnings (loss) | | (99,642,282) |
| Net Assets | | $1,880,196,751 |
| Net Asset Value, offering price and redemption price per share ($1,880,196,751 ÷ 18,253,501 shares) | | $103.00 |
See accompanying notes which are an integral part of the financial statements.
Statement of Operations
| | | Year ended August 31, 2022 |
| Investment Income | | |
| Dividends (including $359,363 earned from other affiliated issuers) | | $7,478,871 |
| Interest | | 110,875,860 |
| Income from Fidelity Central Funds (including $5,229 from security lending) | | 456,258 |
| Total income | | 118,810,989 |
| Expenses | | |
| Custodian fees and expenses | $2,118 | |
| Independent directors' fees and expenses | 7,189 | |
| Legal | 884,307 | |
| Miscellaneous | 18 | |
| Total expenses before reductions | 893,632 | |
| Expense reductions | (327) | |
| Total expenses after reductions | | 893,305 |
| Net investment income (loss) | | 117,917,684 |
| Realized and Unrealized Gain (Loss) | | |
| Net realized gain (loss) on: | | |
| Investment securities: | | |
| Unaffiliated issuers | 32,474,161 | |
| Total net realized gain (loss) | | 32,474,161 |
| Change in net unrealized appreciation (depreciation) on: | | |
| Investment securities: | | |
| Unaffiliated issuers | (268,237,283) | |
| Affiliated issuers | (82,930) | |
| Total change in net unrealized appreciation (depreciation) | | (268,320,213) |
| Net gain (loss) | | (235,846,052) |
| Net increase (decrease) in net assets resulting from operations | | $(117,928,368) |
See accompanying notes which are an integral part of the financial statements.
Statement of Changes in Net Assets
| | Year ended August 31, 2022 | Year ended August 31, 2021 |
| Increase (Decrease) in Net Assets | | |
| Operations | | |
| Net investment income (loss) | $117,917,684 | $138,033,576 |
| Net realized gain (loss) | 32,474,161 | 8,306,687 |
| Change in net unrealized appreciation (depreciation) | (268,320,213) | 196,172,701 |
| Net increase (decrease) in net assets resulting from operations | (117,928,368) | 342,512,964 |
| Distributions to shareholders | (114,089,238) | (134,064,264) |
| Affiliated share transactions | | |
| Proceeds from sales of shares | 33,321,999 | 419,626,749 |
| Reinvestment of distributions | 113,960,859 | 133,259,818 |
| Cost of shares redeemed | (469,474,595) | (1,016,564,138) |
| Net increase (decrease) in net assets resulting from share transactions | (322,191,737) | (463,677,571) |
| Total increase (decrease) in net assets | (554,209,343) | (255,228,871) |
| Net Assets | | |
| Beginning of period | 2,434,406,094 | 2,689,634,965 |
| End of period | $1,880,196,751 | $2,434,406,094 |
| Other Information | | |
| Shares | | |
| Sold | 294,378 | 3,910,646 |
| Issued in reinvestment of distributions | 1,041,571 | 1,207,995 |
| Redeemed | (4,157,418) | (9,398,838) |
| Net increase (decrease) | (2,821,469) | (4,280,197) |
See accompanying notes which are an integral part of the financial statements.
Financial Highlights
Fidelity High Income Central Fund
| | | | | | |
| Years ended August 31, | 2022 | 2021 | 2020 | 2019 | 2018 |
| Selected Per–Share Data | | | | | |
| Net asset value, beginning of period | $115.51 | $106.08 | $111.37 | $112.30 | $113.78 |
| Income from Investment Operations | | | | | |
| Net investment income (loss)A,B | 6.198 | 6.202 | 6.432 | 7.276 | 7.336 |
| Net realized and unrealized gain (loss) | (12.709) | 9.246 | (5.023) | (.267) | (1.497) |
| Total from investment operations | (6.511) | 15.448 | 1.409 | 7.009 | 5.839 |
| Distributions from net investment income | (5.999) | (6.018) | (6.685) | (7.089) | (7.240) |
| Distributions from net realized gain | – | – | (.014) | (.850) | (.079) |
| Total distributions | (5.999) | (6.018) | (6.699) | (7.939) | (7.319) |
| Net asset value, end of period | $103.00 | $115.51 | $106.08 | $111.37 | $112.30 |
| Total ReturnC | (5.81)% | 14.97% | 1.45% | 6.59% | 5.29% |
| Ratios to Average Net AssetsB,D,E | | | | | |
| Expenses before reductions | .04% | - %F | - %F | - %F | - %F |
| Expenses net of fee waivers, if any | .04% | - %F | - %F | - %F | - %F |
| Expenses net of all reductions | .04% | - %F | - %F | - %F | - %F |
| Net investment income (loss) | 5.63% | 5.62% | 6.06% | 6.70% | 6.49% |
| Supplemental Data | | | | | |
| Net assets, end of period (000 omitted) | $1,880,197 | $2,434,406 | $2,689,635 | $2,600,771 | $884,331 |
| Portfolio turnover rateG | 23% | 37% | 59%H | 39%H,I | 57% |
A Calculated based on average shares outstanding during the period.
B Net investment income (loss) is affected by the timing of the declaration of dividends by any underlying mutual funds or exchange-traded funds (ETFs). Net investment income (loss) of any such underlying funds is not included in the Fund's net investment income (loss) ratio.
C Total returns would have been lower if certain expenses had not been reduced during the applicable periods shown.
D Fees and expenses of any underlying mutual funds or exchange-traded funds (ETFs) are not included in the Fund's expense ratio. The Fund indirectly bears its proportionate share of these expenses. For additional expense information related to investments in Fidelity Central Funds, please refer to the "Investments in Fidelity Central Funds" note found in the Notes to Financial Statements section of the most recent Annual or Semi-Annual report. For additional expense information related to investments in Fidelity Direct Lending Fund, LP, please refer to the Investment in Fidelity Direct Lending Fund, LP note found in the Notes to Financial Statements section of the most recent Annual or Semi-Annual report.
E Expense ratios reflect operating expenses of the class. Expenses before reductions do not reflect amounts reimbursed, waived, or reduced through arrangements with the investment adviser, brokerage services, or other offset arrangements, if applicable, and do not represent the amount paid by the class during periods when reimbursements, waivers or reductions occur.
F Amount represents less than .005%.
G Amount does not include the portfolio activity of any underlying mutual funds or exchange-traded funds (ETFs).
H Portfolio turnover rate excludes securities received or delivered in-kind.
I The portfolio turnover rate does not include the assets acquired in the merger.
See accompanying notes which are an integral part of the financial statements.
Notes to Financial Statements
For the period ended August 31, 2022
1. Organization.
Fidelity High Income Central Fund (the Fund) is a fund of Fidelity Central Investment Portfolios LLC (the LLC) and is authorized to issue an unlimited number of shares. Shares of the Fund are only offered to other investment companies and accounts managed by Fidelity Management & Research Company LLC (FMR), or its affiliates (the Investing Funds). The LLC is registered under the Investment Company Act of 1940, as amended (the 1940 Act), as an open-end management investment company organized as a Delaware Limited Liability Company.
2. Investments in Fidelity Central Funds.
Funds may invest in Fidelity Central Funds, which are open-end investment companies generally available only to other investment companies and accounts managed by the investment adviser and its affiliates. The Schedule of Investments lists any Fidelity Central Funds held as an investment as of period end, but does not include the underlying holdings of each Fidelity Central Fund. An investing fund indirectly bears its proportionate share of the expenses of the underlying Fidelity Central Funds.
Based on its investment objective, each Fidelity Central Fund may invest or participate in various investment vehicles or strategies that are similar to those of the investing fund. These strategies are consistent with the investment objectives of the investing fund and may involve certain economic risks which may cause a decline in value of each of the Fidelity Central Funds and thus a decline in the value of the investing fund.
| Fidelity Central Fund | Investment Manager | Investment Objective | Investment Practices | Expense Ratio(a) |
| Fidelity Money Market Central Funds | Fidelity Management & Research Company LLC (FMR) | Each fund seeks to obtain a high level of current income consistent with the preservation of capital and liquidity. | Short-term Investments | Less than .005% |
(a) Expenses expressed as a percentage of average net assets and are as of each underlying Central Fund's most recent annual or semi-annual shareholder report.
A complete unaudited list of holdings for each Fidelity Central Fund is available upon request or at the Securities and Exchange Commission website at www.sec.gov. In addition, the financial statements of the Fidelity Central Funds which contain the significant accounting policies (including investment valuation policies) of those funds, and are not covered by the Report of Independent Registered Public Accounting Firm, are available on the Securities and Exchange Commission website or upon request.
3. Investment in Fidelity Direct Lending Fund, LP.
The Fund invests in Fidelity Direct Lending Fund, LP, which is a limited partnership available only to certain investment companies managed by the investment adviser and its affiliates. The Fund's limited partnership interest is not registered under the Securities Act of 1933, and is subject to substantial restrictions on transfer. The Fund has no redemption rights under the partnership agreement. There will be no trading market for the partnership interest, and the Fund most likely will hold its interest until Fidelity Direct Lending Fund, LP converts by operation of law to a Delaware corporation, trust, or other limited liability entity and (i) registers as a closed-end management investment company under the 1940 Act or (ii) elects to be treated as a business development company under the 1940 Act.
Based on its investment objective, Fidelity Direct Lending Fund, LP may invest or participate in various investments or strategies that are similar to those in which the Fund may invest or participate. These strategies are consistent with the investment objectives of the Fund and may involve certain economic risks which may cause a decline in value of Fidelity Direct Lending Fund, LP and thus a decline in the value of the Fund. The Fidelity Direct Lending Fund, LP intends to invest primarily in direct loans made to private U.S. companies, specifically small- and middle-market companies.
The Schedule of Investments lists Fidelity Direct Lending Fund, LP as an investment as of period end, but does not include the underlying holdings of Fidelity Direct Lending Fund, LP. Fidelity Direct Lending Fund, LP represented less than 5% of the Fund's net assets at period end. The Fund indirectly bears its proportionate share of the expenses of Fidelity Direct Lending Fund, LP, which commenced operations on December 8, 2021. The annualized expense ratio for Fidelity Direct Lending Fund, LP for the period ended April 30, 2022 was .07%.
4. Significant Accounting Policies.
The Fund is an investment company and applies the accounting and reporting guidance of the Financial Accounting Standards Board (FASB) Accounting Standards Codification Topic 946 Financial Services - Investment Companies. The financial statements have been prepared in conformity with accounting principles generally accepted in the United States of America (GAAP), which require management to make certain estimates and assumptions at the date of the financial statements. Actual results could differ from those estimates. Subsequent events, if any, through the date that the financial statements were issued have been evaluated in the preparation of the financial statements. The Fund's Schedule of Investments lists any underlying mutual funds or exchange-traded funds (ETFs) but does not include the underlying holdings of these funds. The following summarizes the significant accounting policies of the Fund:
Investment Valuation. Investments are valued as of 4:00 p.m. Eastern time on the last calendar day of the period. The Board of Directors (the Board) has delegated the day to day responsibility for the valuation of the Fund's investments to the Fair Value Committee (the Committee) established by the Fund's investment adviser. In accordance with valuation policies and procedures approved by the Board, the Fund attempts to obtain prices from one or more third party pricing vendors or brokers to value its investments. When current market prices, quotations or currency exchange rates are not readily available or reliable, investments will be fair valued in good faith by the Committee, in accordance with procedures adopted by the Board. Factors used in determining fair value vary by investment type and may include market or investment specific events, changes in interest rates and credit quality. The frequency with which these procedures are used cannot be predicted and they may be utilized to a significant extent. The Committee oversees the Fund's valuation policies and procedures and reports to the Board on the Committee's activities and fair value determinations. The Board monitors the appropriateness of the procedures used in valuing the Fund's investments and ratifies the fair value determinations of the Committee.
The Fund categorizes the inputs to valuation techniques used to value its investments into a disclosure hierarchy consisting of three levels as shown below:
- Level 1 – unadjusted quoted prices in active markets for identical investments
- Level 2 – other significant observable inputs (including quoted prices for similar investments, interest rates, prepayment speeds, etc.)
- Level 3 – unobservable inputs (including the Fund's own assumptions based on the best information available)
Valuation techniques used to value the Fund's investments by major category are as follows:
Debt securities, including restricted securities, are valued based on evaluated prices received from third party pricing vendors or from brokers who make markets in such securities. Corporate bonds, bank loan obligations and preferred securities are valued by pricing vendors who utilize matrix pricing which considers yield or price of bonds of comparable quality, coupon, maturity and type or by broker-supplied prices. When independent prices are unavailable or unreliable, debt securities may be valued utilizing pricing methodologies which consider similar factors that would be used by third party pricing vendors. Debt securities are generally categorized as Level 2 in the hierarchy but may be Level 3 depending on the circumstances. The Fund invests a significant portion of its assets in below investment grade securities. The value of these securities can be more volatile due to changes in the credit quality of the issuer and is sensitive to changes in economic, market and regulatory conditions.
Equity securities, including restricted securities, for which market quotations are readily available, are valued at the last reported sale price or official closing price as reported by a third party pricing vendor on the primary market or exchange on which they are traded and are categorized as Level 1 in the hierarchy. In the event there were no sales during the day or closing prices are not available, securities are valued at the last quoted bid price or may be valued using the last available price and are generally categorized as Level 2 in the hierarchy. For equity securities, including restricted securities, where observable inputs are limited, assumptions about market activity and risk are used and these securities may be categorized as Level 3 in the hierarchy. Securities, including private placements or other restricted securities, for which observable inputs are not available are valued using alternate valuation approaches, including the market approach, the income approach and cost approach, and are categorized as Level 3 in the hierarchy. The market approach considers factors including the price of recent investments in the same or a similar security or financial metrics of comparable securities. The income approach considers factors including expected future cash flows, security specific risks and corresponding discount rates. The cost approach considers factors including the value of the security's underlying assets and liabilities.
Investments in open-end mutual funds, including the Fidelity Central Funds, are valued at their closing net asset value (NAV) each business day and are categorized as Level 1 in the hierarchy.
Fidelity Direct Lending Fund, LP is valued using NAV as a practical expedient in accordance with the specialized accounting guidance for investment companies.
The following provides information on Level 3 securities held by the Fund that were valued at period end based on unobservable inputs. These amounts exclude valuations provided by a broker and valuations using NAV as a practical expedient.
| Asset Type | Fair Value | Valuation Technique (s) | Unobservable Input | Amount or Range / Weighted Average | Impact to Valuation from an Increase in Input(a) |
| Equities | $67,135,699 | Market approach | Transaction price | $0.77 | Increase |
| | | | Parity price | $0.40 - $25.60 / $20.19 | Increase |
| | | Recovery value | Recovery value | $0.00 - $45,228.15 / $45,228.15 | Increase |
| | | Book value | Book value multiple | 1.0 | Increase |
| | | Market comparable | Enterprise value/Revenue multiple (EV/R) | 0.3 | Increase |
| | | | Enterprise value/EBITDA multiple (EV/EBITDA) | 3.0 - 6.0 / 3.6 | Increase |
| | | | Daily production multiple ($/Million cubic feet per day) | $2,750.00 | Increase |
| | | | Daily production multiple ($/Barrels of oil equivalent per day) | $26,000.00 | Increase |
| | | | Enterprise value/PV-10 multiple (EV/PV10) | 0.4 - 0.9 / 0.6 | Increase |
| | | | Enterprise value/Proved reserves multiple (EV/PR) | 0.6 - 6.5 / 2.4 | Increase |
| | | Discounted cash flow | Discount rate | 8.0% - 12.6% / 9.9% | Decrease |
| | | | Term | 1.3 | Increase |
| | | Straight line | Price of underlying security | $0.77 | Increase |
| | | | Strike price | $6.15 | Decrease |
| Corporate Bonds | $32,768,388 | Recovery value | Recovery value | $0.00 | Increase |
| | | Indicative market price | Evaluated bid | $0.13 - $5.88 / $4.97 | Increase |
| | | Book value | Book value multiple | 1.0 | Increase |
| | | Market comparable | Enterprise value/EBITDA multiple (EV/EBITDA) | 3.0 | Increase |
| | | | Daily production multiple ($/Barrels of oil equivalent per day) | $26,000.00 | Increase |
| | | | Enterprise value/PV-10 multiple (EV/PV10) | 0.9 | Increase |
| | | | Enterprise value/Proved reserves multiple (EV/PR) | 6.5 | Increase |
| | | Discounted cash flow | Discount rate | 10.0% | Decrease |
| Preferred Securities | $3,326,766 | Discounted cash flow | Discount rate | 12.3% | Decrease |
| Bank Loan Obligations | $21,165,395 | Market approach | Transaction price | $99.50 - $100.00 / $99.96 | Increase |
| | | Recovery value | Recovery value | $0.00 | Increase |
| | | Indicative market price | Evaluated bid | $96.50 | Increase |
| | | Market comparable | Enterprise value/EBITDA multiple (EV/EBITDA) | 6.5 | Increase |
| | | | Discount for lack of marketability | 15.0% | Decrease |
| Other | $7,516 | Recovery value | Recovery value | $0.67 | Increase |
(a) Represents the directional change in the fair value of the Level 3 investments that could have resulted from an increase in the corresponding input as of period end. A decrease to the unobservable input would have had the opposite effect. Significant changes in these inputs may have resulted in a significantly higher or lower fair value measurement at period end.
Changes in valuation techniques may result in transfers in or out of an assigned level within the disclosure hierarchy. The aggregate value of investments by input level as of August 31, 2022, as well as a roll forward of Level 3 investments, is included at the end of the Fund's Schedule of Investments.
Investment Transactions and Income. For financial reporting purposes, the Fund's investment holdings and NAV include trades executed through the end of the last business day of the period. The NAV per share for processing shareholder transactions is calculated as of the close of business of the New York Stock Exchange (NYSE), normally 4:00 p.m. Eastern time and includes trades executed through the end of the prior business day. Gains and losses on securities sold are determined on the basis of identified cost and include proceeds received from litigation. Commissions paid to certain brokers with whom the investment adviser, or its affiliates, places trades on behalf of a fund include an amount in addition to trade execution, which may be rebated back to a fund. Any such rebates are included in net realized gain (loss) on investments in the Statement of Operations. Dividend income is recorded on the ex-dividend date, except for certain dividends from foreign securities where the ex-dividend date may have passed, which are recorded as soon as the Fund is informed of the ex-dividend date. Non-cash dividends included in dividend income, if any, are recorded at the fair market value of the securities received. Income and capital gain distributions from Fidelity Central Funds, if any, are recorded on the ex-dividend date. Certain distributions received by the Fund represent a return of capital or capital gain. The Fund determines the components of these distributions subsequent to the ex-dividend date, based upon receipt of tax filings or other correspondence relating to the underlying investment. These distributions are recorded as a reduction of cost of investments and/or as a realized gain. Interest income is accrued as earned and includes coupon interest and amortization of premium and accretion of discount on debt securities as applicable. Paid in Kind (PIK) income is recorded at the fair market value of the securities received. Debt obligations may be placed on non-accrual status and related interest income may be reduced by ceasing current accruals and writing off interest receivables when the collection of all or a portion of interest has become doubtful based on consistently applied procedures. A debt obligation is removed from non-accrual status when the issuer resumes interest payments or when collectability of interest is reasonably assured.
Expenses. Expenses directly attributable to a fund are charged to that fund. Expenses attributable to more than one fund are allocated among the respective funds on the basis of relative net assets or other appropriate methods. Expenses included in the accompanying financial statements reflect the expenses of that fund and do not include any expenses associated with any underlying mutual funds or exchange-traded funds. Although not included in a fund's expenses, a fund indirectly bears its proportionate share of these expenses through the net asset value of each underlying mutual fund or exchange-traded fund. Expense estimates are accrued in the period to which they relate and adjustments are made when actual amounts are known.
Income Tax Information and Distributions to Shareholders. Each year, the Fund intends to qualify as a regulated investment company under Subchapter M of the Internal Revenue Code, including distributing substantially all of its taxable income and realized gains. As a result, no provision for U.S. Federal income taxes is required. As of August 31, 2022, the Fund did not have any unrecognized tax benefits in the financial statements; nor is the Fund aware of any tax positions for which it is reasonably possible that the total amounts of unrecognized tax benefits will significantly change in the next twelve months. The Fund files a U.S. federal tax return, in addition to state and local tax returns as required. The Fund's federal income tax returns are subject to examination by the Internal Revenue Service (IRS) for a period of three fiscal years after they are filed. State and local tax returns may be subject to examination for an additional fiscal year depending on the jurisdiction.
Distributions are declared and recorded daily and paid monthly from net investment income. Distributions from realized gains, if any, are declared and recorded on the ex-dividend date. Income and capital gain distributions are determined in accordance with income tax regulations, which may differ from GAAP. In addition, the Fund claimed a portion of the payment made to redeeming shareholders as a distribution for income tax purposes.
Capital accounts within the financial statements are adjusted for permanent book-tax differences. These adjustments have no impact on net assets or the results of operations. Capital accounts are not adjusted for temporary book-tax differences which will reverse in a subsequent period.
Book-tax differences are primarily due to foreign currency transactions, prior period premium and discount on debt securities, defaulted bonds, partnerships, capital loss carryforwards and losses deferred due to wash sales.
As of period end, the cost and unrealized appreciation (depreciation) in securities, and derivatives if applicable, for federal income tax purposes were as follows:
| Gross unrealized appreciation | $121,803,141 |
| Gross unrealized depreciation | (225,506,695) |
| Net unrealized appreciation (depreciation) | $(103,703,554) |
| Tax Cost | $1,976,841,916 |
The tax-based components of distributable earnings as of period end were as follows:
| Undistributed ordinary income | $4,061,273 |
| Net unrealized appreciation (depreciation) on securities and other investments | $(103,703,554) |
The tax character of distributions paid was as follows:
| | August 31, 2022 | August 31, 2021 |
| Ordinary Income | $114,089,238 | $ 134,064,264 |
Restricted Securities (including Private Placements). Funds may invest in securities that are subject to legal or contractual restrictions on resale. These securities generally may be resold in transactions exempt from registration or to the public if the securities are registered. Disposal of these securities may involve time-consuming negotiations and expense, and prompt sale at an acceptable price may be difficult. Information regarding restricted securities held at period end is included at the end of the Schedule of Investments, if applicable.
Loans and Other Direct Debt Instruments. Direct debt instruments are interests in amounts owed to lenders by corporate or other borrowers. These instruments may be in the form of loans, trade claims or other receivables and may include standby financing commitments such as revolving credit facilities that obligate a fund to supply additional cash to the borrower on demand. Loans may be acquired through assignment, participation, or may be made directly to a borrower. Such instruments are presented in the Bank Loan Obligations section in the Schedule of Investments. Certain funds may also invest in unfunded loan commitments, which are contractual obligations for future funding. Information regarding unfunded commitments is included at the end of the Schedule of Investments, if applicable.
Commitments. A commitment is an agreement to acquire an investment at a future date (subject to conditions) in connection with a potential public or non-public offering. The amount of commitments outstanding at period end are presented in the table below. These commitments are not included in the net assets of the Fund at period end.
| | Investment to be Acquired | Commitment Amount |
| Fidelity High Income Central Fund | Fidelity Direct Lending Fund, LP | $15,727,908 |
5. Purchases and Sales of Investments.
Purchases and sales of securities, other than short-term securities and in-kind transactions, as applicable, are noted in the table below.
| | Purchases ($) | Sales ($) |
| Fidelity High Income Central Fund | 471,126,512 | 769,579,230 |
6. Fees and Other Transactions with Affiliates.
Management Fee and Expense Contract. Fidelity Management & Research Company LLC (the investment adviser) provides the Fund with investment management services. The Fund does not pay any fees for these services. Pursuant to the Fund's management contract, the investment adviser receives a monthly management fee that represents a portion of the management fees it receives from the Investing Funds. In addition, under an expense contract, the investment adviser also pays all other expenses of the Fund, excluding custody fees, the compensation of the independent Directors, and certain miscellaneous expenses such as proxy and shareholder meeting expenses.
Brokerage Commissions. A portion of portfolio transactions were placed with brokerage firms which are affiliates of the investment adviser. Brokerage commissions are included in net realized gain (loss) and change in net unrealized appreciation (depreciation) in the Statement of Operations. The commissions paid to these affiliated firms were as follows:
| | Amount |
| Fidelity High Income Central Fund | $660 |
Interfund Trades. Funds may purchase from or sell securities to other Fidelity Funds under procedures adopted by the Board. The procedures have been designed to ensure these interfund trades are executed in accordance with Rule 17a-7 of the 1940 Act. Any interfund trades are included within the respective purchases and sales amounts shown in the Purchases and Sales of Investments note. Interfund trades during the period are noted in the table below.
| | Purchases ($) | Sales ($) | Realized Gain (Loss) ($) |
| Fidelity High Income Central Fund | – | 2,870,701 | 1,317,141 |
7. Security Lending.
Funds lend portfolio securities from time to time in order to earn additional income. Lending agents are used, including National Financial Services (NFS), an affiliate of the investment adviser. Pursuant to a securities lending agreement, NFS will receive a fee, which is capped at 9.9% of a fund's daily lending revenue, for its services as lending agent. A fund may lend securities to certain qualified borrowers, including NFS. On the settlement date of the loan, a fund receives collateral (in the form of U.S. Treasury obligations, letters of credit and/or cash) against the loaned securities and maintains collateral in an amount not less than 100% of the market value of the loaned securities during the period of the loan. The market value of the loaned securities is determined at the close of business of a fund and any additional required collateral is delivered to a fund on the next business day. A fund or borrower may terminate the loan at any time, and if the borrower defaults on its obligation to return the securities loaned because of insolvency or other reasons, a fund may apply collateral received from the borrower against the obligation. A fund may experience delays and costs in recovering the securities loaned. Any cash collateral received is invested in the Fidelity Securities Lending Cash Central Fund. Any loaned securities are identified as such in the Schedule of Investments, and the value of loaned securities and cash collateral at period end, as applicable, are presented in the Statement of Assets and Liabilities. Security lending income represents the income earned on investing cash collateral, less rebates paid to borrowers and any lending agent fees associated with the loan, plus any premium payments received for lending certain types of securities. Security lending income is presented in the Statement of Operations as a component of income from Fidelity Central Funds. Affiliated security lending activity, if any, was as follows:
| | Total Security Lending Fees Paid to NFS | Security Lending Income From Securities Loaned to NFS | Value of Securities Loaned to NFS at Period End |
| Fidelity High Income Central Fund | $533 | $– | $– |
8. Expense Reductions.
Through arrangements with the Fund's custodian, credits realized as a result of certain uninvested cash balances were used to reduce the Fund's expenses by $327.
9. Other.
A fund's organizational documents provide former and current directors and officers with a limited indemnification against liabilities arising in connection with the performance of their duties to the fund. In the normal course of business, a fund may also enter into contracts that provide general indemnifications. A fund's maximum exposure under these arrangements is unknown as this would be dependent on future claims that may be made against a fund. The risk of material loss from such claims is considered remote.
At the end of the period, mutual funds managed by the investment adviser or its affiliates were the owners of record of all of the outstanding shares of the Fund.
10. Risk and Uncertainties.
Many factors affect a fund's performance. Developments that disrupt global economies and financial markets, such as pandemics, epidemics, outbreaks of infectious diseases, war, terrorism, and environmental disasters, may significantly affect a fund's investment performance. The effects of these developments to a fund will be impacted by the types of securities in which a fund invests, the financial condition, industry, economic sector, and geographic location of an issuer, and a fund's level of investment in the securities of that issuer.
Report of Independent Registered Public Accounting Firm
To the Board of Directors of Fidelity Central Investment Portfolios LLC and the Shareholders of Fidelity High Income Central Fund
Opinion on the Financial Statements and Financial Highlights
We have audited the accompanying statement of assets and liabilities of Fidelity High Income Central Fund (the "Fund"), a fund of Fidelity Central Investment Portfolios LLC, including the schedule of investments, as of August 31, 2022, the related statement of operations for the year then ended, the statement of changes in net assets for each of the two years in the period then ended, the financial highlights for each of the five years in the period then ended, and the related notes. In our opinion, the financial statements and financial highlights present fairly, in all material respects, the financial position of the Fund as of August 31, 2022, and the results of its operations for the year then ended, the changes in its net assets for each of the two years in the period then ended, and the financial highlights for each of the five years in the period then ended in conformity with accounting principles generally accepted in the United States of America.
Basis for Opinion
These financial statements and financial highlights are the responsibility of the Fund's management. Our responsibility is to express an opinion on the Fund's financial statements and financial highlights based on our audits. We are a public accounting firm registered with the Public Company Accounting Oversight Board (United States) (PCAOB) and are required to be independent with respect to the Fund in accordance with the U.S. federal securities laws and the applicable rules and regulations of the Securities and Exchange Commission and the PCAOB.
We conducted our audits in accordance with the standards of the PCAOB. Those standards require that we plan and perform the audit to obtain reasonable assurance about whether the financial statements and financial highlights are free of material misstatement, whether due to error or fraud. The Fund is not required to have, nor were we engaged to perform, an audit of its internal control over financial reporting. As part of our audits we are required to obtain an understanding of internal control over financial reporting but not for the purpose of expressing an opinion on the effectiveness of the Fund’s internal control over financial reporting. Accordingly, we express no such opinion.
Our audits included performing procedures to assess the risks of material misstatement of the financial statements and financial highlights, whether due to error or fraud, and performing procedures that respond to those risks. Such procedures included examining, on a test basis, evidence regarding the amounts and disclosures in the financial statements and financial highlights. Our audits also included evaluating the accounting principles used and significant estimates made by management, as well as evaluating the overall presentation of the financial statements and financial highlights. Our procedures included confirmation of securities owned as of August 31, 2022, by correspondence with the custodian and brokers and agent banks; when replies were not received from brokers or agent banks, we performed other auditing procedures. We believe that our audits provide a reasonable basis for our opinion.
/s/ Deloitte & Touche LLP
Boston, Massachusetts
October 14, 2022
We have served as the auditor of one or more of the Fidelity investment companies since 1999.
Directors and Officers (Trustees and Officers)
The Trustees, Members of the Advisory Board (if any), and officers of the Fidelity Central Investment Portfolios LLC and fund, as applicable, are listed below. The Board of Trustees governs the fund and is responsible for protecting the interests of shareholders. The Trustees are experienced executives who meet periodically throughout the year to oversee the fund's activities, review contractual arrangements with companies that provide services to the fund, oversee management of the risks associated with such activities and contractual arrangements, and review the fund's performance. Each of the Trustees oversees 316 funds.
The Trustees hold office without limit in time except that (a) any Trustee may resign; (b) any Trustee may be removed by written instrument, signed by at least two-thirds of the number of Trustees prior to such removal; (c) any Trustee who requests to be retired or who has become incapacitated by illness or injury may be retired by written instrument signed by a majority of the other Trustees; and (d) any Trustee may be removed at any special meeting of shareholders by a two-thirds vote of the outstanding voting securities of the trust. Each Trustee who is not an interested person (as defined in the 1940 Act) of the trust and the fund is referred to herein as an Independent Trustee. Each Independent Trustee shall retire not later than the last day of the calendar year in which his or her 75th birthday occurs. The Independent Trustees may waive this mandatory retirement age policy with respect to individual Trustees. Officers and Advisory Board Members hold office without limit in time, except that any officer or Advisory Board Member may resign or may be removed by a vote of a majority of the Trustees at any regular meeting or any special meeting of the Trustees. Except as indicated, each individual has held the office shown or other offices in the same company for the past five years.
The fund’s Statement of Additional Information (SAI) includes more information about the Trustees. To request a free copy, call Fidelity at 1-800-544-8544.
Experience, Skills, Attributes, and Qualifications of the Trustees. The Governance and Nominating Committee has adopted a statement of policy that describes the experience, qualifications, attributes, and skills that are necessary and desirable for potential Independent Trustee candidates (Statement of Policy). The Board believes that each Trustee satisfied at the time he or she was initially elected or appointed a Trustee, and continues to satisfy, the standards contemplated by the Statement of Policy. The Governance and Nominating Committee also engages professional search firms to help identify potential Independent Trustee candidates who have the experience, qualifications, attributes, and skills consistent with the Statement of Policy. From time to time, additional criteria based on the composition and skills of the current Independent Trustees, as well as experience or skills that may be appropriate in light of future changes to board composition, business conditions, and regulatory or other developments, have also been considered by the professional search firms and the Governance and Nominating Committee. In addition, the Board takes into account the Trustees' commitment and participation in Board and committee meetings, as well as their leadership of standing and ad hoc committees throughout their tenure.
In determining that a particular Trustee was and continues to be qualified to serve as a Trustee, the Board has considered a variety of criteria, none of which, in isolation, was controlling. The Board believes that, collectively, the Trustees have balanced and diverse experience, qualifications, attributes, and skills, which allow the Board to operate effectively in governing the fund and protecting the interests of shareholders. Information about the specific experience, skills, attributes, and qualifications of each Trustee, which in each case led to the Board's conclusion that the Trustee should serve (or continue to serve) as a trustee of the fund, is provided below.
Board Structure and Oversight Function. Robert A. Lawrence is an interested person and currently serves as Chair. The Trustees have determined that an interested Chair is appropriate and benefits shareholders because an interested Chair has a personal and professional stake in the quality and continuity of services provided to the fund. Independent Trustees exercise their informed business judgment to appoint an individual of their choosing to serve as Chair, regardless of whether the Trustee happens to be independent or a member of management. The Independent Trustees have determined that they can act independently and effectively without having an Independent Trustee serve as Chair and that a key structural component for assuring that they are in a position to do so is for the Independent Trustees to constitute a substantial majority for the Board. The Independent Trustees also regularly meet in executive session. David M. Thomas serves as Lead Independent Trustee and as such (i) acts as a liaison between the Independent Trustees and management with respect to matters important to the Independent Trustees and (ii) with management prepares agendas for Board meetings.
Fidelity® funds are overseen by different Boards of Trustees. The fund's Board oversees Fidelity's high income and certain equity funds, and other Boards oversee Fidelity's investment-grade bond, money market, asset allocation, and other equity funds. The asset allocation funds may invest in Fidelity® funds overseen by the fund's Board. The use of separate Boards, each with its own committee structure, allows the Trustees of each group of Fidelity® funds to focus on the unique issues of the funds they oversee, including common research, investment, and operational issues. On occasion, the separate Boards establish joint committees to address issues of overlapping consequences for the Fidelity® funds overseen by each Board.
The Trustees operate using a system of committees to facilitate the timely and efficient consideration of all matters of importance to the Trustees, the fund, and fund shareholders and to facilitate compliance with legal and regulatory requirements and oversight of the fund's activities and associated risks. The Board, acting through its committees, has charged FMR and its affiliates with (i) identifying events or circumstances the occurrence of which could have demonstrably adverse effects on the fund's business and/or reputation; (ii) implementing processes and controls to lessen the possibility that such events or circumstances occur or to mitigate the effects of such events or circumstances if they do occur; and (iii) creating and maintaining a system designed to evaluate continuously business and market conditions in order to facilitate the identification and implementation processes described in (i) and (ii) above. Because the day-to-day operations and activities of the fund are carried out by or through FMR, its affiliates, and other service providers, the fund's exposure to risks is mitigated but not eliminated by the processes overseen by the Trustees. While each of the Board's committees has responsibility for overseeing different aspects of the fund's activities, oversight is exercised primarily through the Operations, Audit, and Compliance Committees. Appropriate personnel, including but not limited to the fund's Chief Compliance Officer (CCO), FMR's internal auditor, the independent accountants, the fund's Treasurer and portfolio management personnel, make periodic reports to the Board's committees, as appropriate, including an annual review of Fidelity's risk management program for the Fidelity® funds. The responsibilities of each standing committee, including their oversight responsibilities, are described further under "Standing Committees of the Trustees."
Interested Trustees*:
Correspondence intended for a Trustee who is an interested person may be sent to Fidelity Investments, 245 Summer Street, Boston, Massachusetts 02210.
Name, Year of Birth; Principal Occupations and Other Relevant Experience+
Bettina Doulton (1964)
Year of Election or Appointment: 2020
Trustee
Ms. Doulton also serves as Trustee of other Fidelity® funds. Prior to her retirement, Ms. Doulton served in a variety of positions at Fidelity Investments, including as a managing director of research (2006-2007), portfolio manager to certain Fidelity® funds (1993-2005), equity analyst and portfolio assistant (1990-1993), and research assistant (1987-1990). Ms. Doulton currently owns and operates Phi Builders + Architects and Cellardoor Winery. Previously, Ms. Doulton served as a member of the Board of Brown Capital Management, LLC (2014-2018).
Robert A. Lawrence (1952)
Year of Election or Appointment: 2020
Trustee
Chair of the Board of Trustees
Mr. Lawrence also serves as Trustee of other funds. Previously, Mr. Lawrence served as a Trustee and Member of the Advisory Board of certain funds. Prior to his retirement in 2008, Mr. Lawrence served as Vice President of certain Fidelity® funds (2006-2008), Senior Vice President, Head of High Income Division of Fidelity Management & Research Company (investment adviser firm, 2006-2008), and President of Fidelity Strategic Investments (investment adviser firm, 2002-2005).
* Determined to be an “Interested Trustee” by virtue of, among other things, his or her affiliation with the Fidelity Central Investment Portfolios LLC or various entities under common control with FMR.
+ The information includes the Trustee's principal occupation during the last five years and other information relating to the experience, attributes, and skills relevant to the Trustee's qualifications to serve as a Trustee, which led to the conclusion that the Trustee should serve as a Trustee for the fund.
Independent Trustees:
Correspondence intended for an Independent Trustee may be sent to Fidelity Investments, P.O. Box 55235, Boston, Massachusetts 02205-5235.
Name, Year of Birth; Principal Occupations and Other Relevant Experience+
Thomas P. Bostick (1956)
Year of Election or Appointment: 2021
Trustee
Lieutenant General Bostick also serves as Trustee of other Fidelity® funds. Prior to his retirement, General Bostick (United States Army, Retired) held a variety of positions within the U.S. Army, including Commanding General and Chief of Engineers, U.S. Army Corps of Engineers (2012-2016) and Deputy Chief of Staff and Director of Human Resources, U.S. Army (2009-2012). General Bostick currently serves as a member of the Board and Finance and Governance Committees of CSX Corporation (transportation, 2020-present) and a member of the Board and Corporate Governance and Nominating Committee of Perma-Fix Environmental Services, Inc. (nuclear waste management, 2020-present). General Bostick serves as Chief Executive Officer of Bostick Global Strategies, LLC (consulting, 2016-present) and as a member of the Board of HireVue, Inc. (video interview and assessment, 2020-present). Previously, General Bostick served as a Member of the Advisory Board of certain Fidelity® funds (2021), President, Intrexon Bioengineering (2018-2020) and Chief Operating Officer (2017-2020) and Senior Vice President of the Environment Sector (2016-2017) of Intrexon Corporation (biopharmaceutical company).
Dennis J. Dirks (1948)
Year of Election or Appointment: 2005
Trustee
Mr. Dirks also serves as Trustee of other Fidelity® funds. Prior to his retirement in May 2003, Mr. Dirks served as Chief Operating Officer and as a member of the Board of The Depository Trust & Clearing Corporation (financial markets infrastructure), President, Chief Operating Officer and a member of the Board of The Depository Trust Company (DTC), President and a member of the Board of the National Securities Clearing Corporation (NSCC), Chief Executive Officer and a member of the Board of the Government Securities Clearing Corporation and Chief Executive Officer and a member of the Board of the Mortgage-Backed Securities Clearing Corporation. Mr. Dirks currently serves as a member of the Finance Committee (2016-present) and Board (2017-present) and is Treasurer (2018-present) of the Asolo Repertory Theatre.
Donald F. Donahue (1950)
Year of Election or Appointment: 2018
Trustee
Mr. Donahue also serves as Trustee of other Fidelity® funds. Mr. Donahue serves as President and Chief Executive Officer of Miranda Partners, LLC (risk consulting for the financial services industry, 2012-present). Previously, Mr. Donahue served as Chief Executive Officer (2006-2012), Chief Operating Officer (2003-2006) and Managing Director, Customer Marketing and Development (1999-2003) of The Depository Trust & Clearing Corporation (financial markets infrastructure). Mr. Donahue currently serves as a member (2007-present) and Co-Chairman (2016-present) of the Board of United Way of New York and a member of the Board of The Leadership Academy (previously NYC Leadership Academy) (2012-present). Mr. Donahue previously served as a member of the Advisory Board of certain Fidelity® funds (2015-2018).
Vicki L. Fuller (1957)
Year of Election or Appointment: 2020
Trustee
Ms. Fuller also serves as Trustee of other Fidelity® funds. Previously, Ms. Fuller served as a member of the Advisory Board of certain Fidelity® funds (2018-2020), Chief Investment Officer of the New York State Common Retirement Fund (2012-2018) and held a variety of positions at AllianceBernstein L.P. (global asset management, 1985-2012), including Managing Director (2006-2012) and Senior Vice President and Senior Portfolio Manager (2001-2006). Ms. Fuller currently serves as a member of the Board, Audit Committee and Nominating and Governance Committee of two Blackstone business development companies (2020-present), as a member of the Board of Treliant, LLC (consulting, 2019-present), as a member of the Advisory Board of Ariel Alternatives, LLC (private equity, 2021-present) and as a member of the Board and Chair of the Audit Committee of Gusto, Inc. (software, 2021-present). In addition, Ms. Fuller currently serves as a member of the Board of Roosevelt University (2019-present) and as a member of the Executive Board of New York University’s Stern School of Business. Ms. Fuller previously served as a member of the Board, Audit Committee and Nominating and Governance Committee of The Williams Companies, Inc. (natural gas infrastructure, 2018-2021).
Patricia L. Kampling (1959)
Year of Election or Appointment: 2020
Trustee
Ms. Kampling also serves as Trustee of other Fidelity® funds. Prior to her retirement, Ms. Kampling served as Chairman of the Board and Chief Executive Officer (2012-2019), President and Chief Operating Officer (2011-2012) and Executive Vice President and Chief Financial Officer (2010-2011) of Alliant Energy Corporation. Ms. Kampling currently serves as a member of the Board, Finance Committee and Governance, Compensation and Nominating Committee of Xcel Energy Inc. (utilities company, 2020-present) and as a member of the Board, Audit, Finance and Risk Committee and Safety, Environmental, Technology and Operations Committee and Chair of the Executive Development and Compensation Committee of American Water Works Company, Inc. (utilities company, 2019-present). In addition, Ms. Kampling currently serves as a member of the Board of the Nature Conservancy, Wisconsin Chapter (2019-present). Previously, Ms. Kampling served as a Member of the Advisory Board of certain Fidelity® funds (2020), a member of the Board, Compensation Committee and Executive Committee and Chair of the Audit Committee of Briggs & Stratton Corporation (manufacturing, 2011-2021), a member of the Board of Interstate Power and Light Company (2012-2019) and Wisconsin Power and Light Company (2012-2019) (each a subsidiary of Alliant Energy Corporation) and as a member of the Board and Workforce Development Committee of the Business Roundtable (2018-2019).
Thomas A. Kennedy (1955)
Year of Election or Appointment: 2021
Trustee
Mr. Kennedy also serves as Trustee of other Fidelity® funds. Previously, Mr. Kennedy served as a Member of the Advisory Board of certain Fidelity® funds (2020) and held a variety of positions at Raytheon Company (aerospace and defense, 1983-2020), including Chairman and Chief Executive Officer (2014-2020) and Executive Vice President and Chief Operating Officer (2013-2014). Mr. Kennedy currently serves as Executive Chairman of the Board of Directors of Raytheon Technologies Corporation (aerospace and defense, 2020-present). He is also a member of the Rutgers School of Engineering Industry Advisory Board (2011-present) and a member of the UCLA Engineering Dean’s Executive Board (2016-present).
Oscar Munoz (1959)
Year of Election or Appointment: 2021
Trustee
Mr. Munoz also serves as Trustee of other Fidelity® funds. Prior to his retirement, Mr. Munoz served as Executive Chairman (2020-2021), Chief Executive Officer (2015-2020), President (2015-2016) and a member of the Board (2010-2021) of United Airlines Holdings, Inc. Mr. Munoz currently serves as a member of the Board of CBRE Group, Inc. (commercial real estate, 2020-present), a member of the Board of Univision Communications, Inc. (Hispanic media, 2020-present) and a member of the Advisory Board of Salesforce.com, Inc. (cloud-based software, 2020-present). Previously, Mr. Munoz served as a Member of the Advisory Board of certain Fidelity® funds (2021).
Garnett A. Smith (1947)
Year of Election or Appointment: 2018
Trustee
Mr. Smith also serves as Trustee of other Fidelity® funds. Prior to his retirement, Mr. Smith served as Chairman and Chief Executive Officer (1990-1997) and President (1986-1990) of Inbrand Corp. (manufacturer of personal absorbent products). Prior to his employment with Inbrand Corp., he was employed by a retail fabric chain and North Carolina National Bank (now Bank of America). Mr. Smith previously served as a member of the Advisory Board of certain Fidelity® funds (2012-2013).
David M. Thomas (1949)
Year of Election or Appointment: 2008
Trustee
Lead Independent Trustee
Mr. Thomas also serves as Trustee of other Fidelity® funds. Previously, Mr. Thomas served as Executive Chairman (2005-2006) and Chairman and Chief Executive Officer (2000-2005) of IMS Health, Inc. (pharmaceutical and healthcare information solutions). Mr. Thomas currently serves as a member of the Board of Fortune Brands Home and Security (home and security products, 2004-present) and as Director (2013-present) and Non-Executive Chairman of the Board (2022-present) of Interpublic Group of Companies, Inc. (marketing communication).
Susan Tomasky (1953)
Year of Election or Appointment: 2020
Trustee
Ms. Tomasky also serves as Trustee of other Fidelity® funds. Prior to her retirement, Ms. Tomasky served in various executive officer positions at American Electric Power Company, Inc. (1998-2011), including most recently as President of AEP Transmission (2007-2011). Ms. Tomasky currently serves as a member of the Board and Sustainability Committee and as Chair of the Audit Committee of Marathon Petroleum Corporation (2018-present) and as a member of the Board, Executive Committee, Corporate Governance Committee and Organization and Compensation Committee and as Chair of the Audit Committee of Public Service Enterprise Group, Inc. (utilities company, 2012-present) and as a member of the Board of its subsidiary company, Public Service Electric and Gas Co. (2021-present). In addition, Ms. Tomasky currently serves as a member (2009-present) and President (2020-present) of the Board of the Royal Shakespeare Company – America (2009-present), as a member of the Board of the Columbus Association for the Performing Arts (2011-present) and as a member of the Board and Kenyon in the World Committee of Kenyon College (2016-present). Previously, Ms. Tomasky served as a Member of the Advisory Board of certain Fidelity® funds (2020), as a member of the Board of the Columbus Regional Airport Authority (2007-2020), as a member of the Board (2011-2018) and Lead Independent Director (2015-2018) of Andeavor Corporation (previously Tesoro Corporation) (independent oil refiner and marketer) and as a member of the Board of Summit Midstream Partners LP (energy, 2012-2018).
Michael E. Wiley (1950)
Year of Election or Appointment: 2018
Trustee
Mr. Wiley also serves as Trustee of other Fidelity® funds. Previously, Mr. Wiley served as a member of the Advisory Board of certain Fidelity® funds (2018-2020), Chairman, President and CEO of Baker Hughes, Inc. (oilfield services, 2000-2004). Mr. Wiley also previously served as a member of the Board of Andeavor Corporation (independent oil refiner and marketer, 2005-2018), a member of the Board of Andeavor Logistics LP (natural resources logistics, 2015-2018) and a member of the Board of High Point Resources (exploration and production, 2005-2020).
+ The information includes the Trustee's principal occupation during the last five years and other information relating to the experience, attributes, and skills relevant to the Trustee's qualifications to serve as a Trustee, which led to the conclusion that the Trustee should serve as a Trustee for the fund.
Advisory Board Members and Officers:
Correspondence intended for a Member of the Advisory Board (if any) may be sent to Fidelity Investments, P.O. Box 55235, Boston, Massachusetts 02205-5235. Correspondence intended for an officer or Peter S. Lynch may be sent to Fidelity Investments, 245 Summer Street, Boston, Massachusetts 02210. Officers appear below in alphabetical order.
Name, Year of Birth; Principal Occupation
Peter S. Lynch (1944)
Year of Election or Appointment: 2004
Member of the Advisory Board
Mr. Lynch also serves as a Member of the Advisory Board of other Fidelity® funds. Mr. Lynch is Vice Chairman and a Director of Fidelity Management & Research Company LLC (investment adviser firm). In addition, Mr. Lynch serves as a Trustee of Boston College and as the Chairman of the Inner-City Scholarship Fund. Previously, Mr. Lynch served as Vice Chairman and a Director of FMR Co., Inc. (investment adviser firm) and on the Special Olympics International Board of Directors (1997-2006).
Craig S. Brown (1977)
Year of Election or Appointment: 2019
Assistant Treasurer
Mr. Brown also serves as an officer of other funds. Mr. Brown serves as Assistant Treasurer of FIMM, LLC (2021-present) and is an employee of Fidelity Investments (2013-present).
John J. Burke III (1964)
Year of Election or Appointment: 2018
Chief Financial Officer
Mr. Burke also serves as Chief Financial Officer of other funds. Mr. Burke serves as Head of Investment Operations for Fidelity Fund and Investment Operations (2018-present) and is an employee of Fidelity Investments (1998-present). Previously Mr. Burke served as head of Asset Management Investment Operations (2012-2018).
William C. Coffey (1969)
Year of Election or Appointment: 2019
Assistant Secretary
Mr. Coffey also serves as Assistant Secretary of other funds. He is Senior Vice President and Deputy General Counsel of FMR LLC (diversified financial services company, 2010-present), and is an employee of Fidelity Investments. Previously, Mr. Coffey served as Secretary and CLO of certain funds (2018-2019); CLO, Secretary, and Senior Vice President of Fidelity Management & Research Company and FMR Co., Inc. (investment adviser firms, 2018-2019); Secretary of Fidelity SelectCo, LLC and Fidelity Investments Money Management, Inc. (investment adviser firms, 2018-2019); CLO of Fidelity Management & Research (Hong Kong) Limited, FMR Investment Management (UK) Limited, and Fidelity Management & Research (Japan) Limited (investment adviser firms, 2018-2019); and Assistant Secretary of certain funds (2009-2018).
Timothy M. Cohen (1969)
Year of Election or Appointment: 2018
Vice President
Mr. Cohen also serves as Vice President of other funds. Mr. Cohen serves as Co-Head of Equity (2018-present), a Director of Fidelity Management & Research (Japan) Limited (investment adviser firm, 2016-present), and is an employee of Fidelity Investments. Previously, Mr. Cohen served as Executive Vice President of Fidelity SelectCo, LLC (2019), Head of Global Equity Research (2016-2018), Chief Investment Officer - Equity and a Director of Fidelity Management & Research (U.K.) Inc. (investment adviser firm, 2013-2015) and as a Director of Fidelity Management & Research (Hong Kong) Limited (investment adviser firm, 2017).
Jonathan Davis (1968)
Year of Election or Appointment: 2010
Assistant Treasurer
Mr. Davis also serves as an officer of other funds. Mr. Davis serves as Assistant Treasurer of FIMM, LLC (2021-present), FMR Capital, Inc. (2017-present), FD Funds GP LLC (2021-present), FD Funds Holding LLC (2021-present), and FD Funds Management LLC (2021-present); and is an employee of Fidelity Investments. Previously, Mr. Davis served as Vice President and Associate General Counsel of FMR LLC (diversified financial services company, 2003-2010).
Laura M. Del Prato (1964)
Year of Election or Appointment: 2018
Assistant Treasurer
Ms. Del Prato also serves as an officer of other funds. Ms. Del Prato serves as Assistant Treasurer of FIMM, LLC (2021-present) and is an employee of Fidelity Investments (2017-present). Previously, Ms. Del Prato served as President and Treasurer of The North Carolina Capital Management Trust: Cash Portfolio and Term Portfolio (2018-2020). Prior to joining Fidelity Investments, Ms. Del Prato served as a Managing Director and Treasurer of the JPMorgan Mutual Funds (2014-2017). Prior to JPMorgan, Ms. Del Prato served as a partner at Cohen Fund Audit Services (accounting firm, 2012-2013) and KPMG LLP (accounting firm, 2004-2012).
Colm A. Hogan (1973)
Year of Election or Appointment: 2020
Assistant Treasurer
Mr. Hogan also serves as an officer of other funds. Mr. Hogan serves as Assistant Treasurer of FIMM, LLC (2021-present) and FMR Capital, Inc. (2017-present) and is an employee of Fidelity Investments (2005-present). Previously, Mr. Hogan served as Deputy Treasurer of certain Fidelity® funds (2016-2020) and Assistant Treasurer of certain Fidelity® funds (2016-2018).
Pamela R. Holding (1964)
Year of Election or Appointment: 2018
Vice President
Ms. Holding also serves as Vice President of other funds. Ms. Holding serves as Co-Head of Equity (2018-present) and is an employee of Fidelity Investments (2013-present). Previously, Ms. Holding served as Executive Vice President of Fidelity SelectCo, LLC (2019) and as Chief Investment Officer of Fidelity Institutional Asset Management (2013-2018).
Cynthia Lo Bessette (1969)
Year of Election or Appointment: 2019
Secretary and Chief Legal Officer (CLO)
Ms. Lo Bessette also serves as an officer of other funds. Ms. Lo Bessette serves as CLO, Secretary, and Senior Vice President of Fidelity Management & Research Company LLC (investment adviser firm, 2019-present); CLO of Fidelity Management & Research (Hong Kong) Limited, FMR Investment Management (UK) Limited, and Fidelity Management & Research (Japan) Limited (investment adviser firms, 2019-present); Secretary of FD Funds GP LLC (2021-present), FD Funds Holding LLC (2021-present), and FD Funds Management LLC (2021-present); and Assistant Secretary of FIMM, LLC (2019-present). She is a Senior Vice President and Deputy General Counsel of FMR LLC (diversified financial services company, 2019-present), and is an employee of Fidelity Investments. Previously, Ms. Lo Bessette served as CLO, Secretary, and Senior Vice President of FMR Co., Inc. (investment adviser firm, 2019); Secretary of Fidelity SelectCo, LLC and Fidelity Investments Money Management, Inc. (investment adviser firms, 2019). Prior to joining Fidelity Investments, Ms. Lo Bessette was Executive Vice President, General Counsel (2016-2019) and Senior Vice President, Deputy General Counsel (2015-2016) of OppenheimerFunds (investment management company) and Deputy Chief Legal Officer (2013-2015) of Jennison Associates LLC (investment adviser firm).
Chris Maher (1972)
Year of Election or Appointment: 2020
Deputy Treasurer
Mr. Maher also serves as an officer of other funds. Mr. Maher serves as Assistant Treasurer of FIMM, LLC (2021-present) and FMR Capital, Inc. (2017-present), and is an employee of Fidelity Investments (2008-present). Previously, Mr. Maher served as Assistant Treasurer of certain funds (2013-2020); Vice President of Asset Management Compliance (2013), Vice President of the Program Management Group of FMR (investment adviser firm, 2010-2013), and Vice President of Valuation Oversight (2008-2010).
Jason P. Pogorelec (1975)
Year of Election or Appointment: 2020
Chief Compliance Officer
Mr. Pogorelec also serves as Chief Compliance Officer of other funds. Mr. Pogorelec is a senior Vice President of Asset Management Compliance for Fidelity Investments and is an employee of Fidelity Investments (2006-present). Previously, Mr. Pogorelec served as Vice President, Associate General Counsel for Fidelity Investments (2010-2020) and Assistant Secretary of certain Fidelity funds (2015-2020).
Brett Segaloff (1972)
Year of Election or Appointment: 2021
Anti-Money Laundering (AML) Officer
Mr. Segaloff also serves as an AML Officer of other funds and other related entities. He is Director, Anti-Money Laundering (2007-present) of FMR LLC (diversified financial services company) and is an employee of Fidelity Investments (1996-present).
Stacie M. Smith (1974)
Year of Election or Appointment: 2016
President and Treasurer
Ms. Smith also serves as an officer of other funds. Ms. Smith serves as Assistant Treasurer of FIMM, LLC (2021-present) and FMR Capital, Inc. (2017-present), is an employee of Fidelity Investments (2009-present), and has served in other fund officer roles. Prior to joining Fidelity Investments, Ms. Smith served as Senior Audit Manager of Ernst & Young LLP (accounting firm, 1996-2009). Previously, Ms. Smith served as Assistant Treasurer (2013-2019) and Deputy Treasurer (2013-2016) of certain Fidelity® funds.
Jim Wegmann (1979)
Year of Election or Appointment: 2019
Assistant Treasurer
Mr. Wegmann also serves as an officer of other funds. Mr. Wegmann serves as Assistant Treasurer of FIMM, LLC (2021-present) and is an employee of Fidelity Investments (2011-present). Previously, Mr. Wegmann served as Assistant Treasurer of certain Fidelity® funds (2019-2021).
Shareholder Expense Example
As a shareholder, you incur two types of costs: (1) transaction costs, which may include sales charges (loads) on purchase payments or redemption proceeds, as applicable and (2) ongoing costs, which generally include management fees, distribution and/or service (12b-1) fees and other Fund expenses. This Example is intended to help you understand your ongoing costs (in dollars) of investing in a fund and to compare these costs with the ongoing costs of investing in other mutual funds.
The Example is based on an investment of $1,000 invested at the beginning of the period and held for the entire period (March 1, 2022 to August 31, 2022).
Actual Expenses
The first line of the accompanying table provides information about actual account values and actual expenses. You may use the information in this line, together with the amount you invested, to estimate the expenses that you paid over the period. Simply divide your account value by $1,000.00 (for example, an $8,600 account value divided by $1,000.00 = 8.6), then multiply the result by the number in the first line for a class/Fund under the heading entitled "Expenses Paid During Period" to estimate the expenses you paid on your account during this period. If any fund is a shareholder of any underlying mutual funds or exchange-traded funds (ETFs) (the Underlying Funds), such fund indirectly bears its proportional share of the expenses of the Underlying Funds in addition to the direct expenses incurred presented in the table. These fees and expenses are not included in the annualized expense ratio used to calculate the expense estimate in the table below.
Hypothetical Example for Comparison Purposes
The second line of the accompanying table provides information about hypothetical account values and hypothetical expenses based on the actual expense ratio and an assumed rate of return of 5% per year before expenses, which is not the actual return. The hypothetical account values and expenses may not be used to estimate the actual ending account balance or expenses you paid for the period. You may use this information to compare the ongoing costs of investing in the Fund and other funds. To do so, compare this 5% hypothetical example with the 5% hypothetical examples that appear in the shareholder reports of the other funds. If any fund is a shareholder of any Underlying Funds, such fund indirectly bears its proportional share of the expenses of the Underlying Funds in addition to the direct expenses as presented in the table. These fees and expenses are not included in the annualized expense ratio used to calculate the expense estimate in the table below.
Please note that the expenses shown in the table are meant to highlight your ongoing costs only and do not reflect any transaction costs. Therefore, the second line of the table is useful in comparing ongoing costs only, and will not help you determine the relative total costs of owning different funds. In addition, if these transactional costs were included, your costs would have been higher.
| | Annualized Expense Ratio-A | Beginning
Account Value
March 1, 2022 | Ending
Account Value
August 31, 2022 | Expenses Paid
During Period-B
March 1, 2022
to August 31, 2022 |
| Fidelity High Income Central Fund | .0816% | | | |
| Actual | | $1,000.00 | $951.00 | $.40 |
| Hypothetical-C | | $1,000.00 | $1,024.79 | $.42 |
A Annualized expense ratio reflects expenses net of applicable fee waivers.
B Expenses are equal to the annualized expense ratio, multiplied by the average account value over the period, multiplied by 184/ 365 (to reflect the one-half year period). The fees and expenses of any Underlying Funds are not included in each annualized expense ratio.
C 5% return per year before expenses
Distributions (Unaudited)
The dividend and capital gains distributions for the fund(s) are available on Fidelity.com or Institutional.Fidelity.com.
The fund designates $97,334,244 of distributions paid in the calendar year 2021 as qualifying to be taxed as interest-related dividends for nonresident alien shareholders.
The fund designates $113,154,691 of distributions paid in the calendar year 2021 as qualifying to be taxed as section 163(j) interest dividends.
The fund will notify shareholders in January 2023 of amounts for use in preparing 2022 income tax returns.
Board Approval of Investment Advisory Contracts and Management Fees
Fidelity High Income Central Fund
Each year, the Board of Directors, including the Independent Directors (together, the Board), votes on the renewal of the management contract with Fidelity Management & Research Company LLC (FMR) and the sub-advisory agreements (together, the Advisory Contracts) for the fund. FMR and the sub-advisers are referred to herein as the Investment Advisers. The Board, assisted by the advice of fund counsel and Independent Directors' counsel, requests and considers a broad range of information relevant to the renewal of the Advisory Contracts throughout the year.
The Board meets regularly and, at each of its meetings, covers an extensive agenda of topics and materials and considers factors that are relevant to its annual consideration of the renewal of the fund's Advisory Contracts, including the services and support provided to the fund and its shareholders. The Board has established various standing committees (Committees), each composed of and chaired by Independent Directors with varying backgrounds, to which the Board has assigned specific subject matter responsibilities in order to enhance effective decision-making by the Board. The Board, acting directly and through its Committees, requests and receives information concerning the annual consideration of the renewal of the fund's Advisory Contracts. The Board also meets as needed to review matters specifically related to the Board's annual consideration of the renewal of the Advisory Contracts. Members of the Board may also meet with trustees of other Fidelity funds through joint ad hoc committees to discuss certain matters relevant to all of the Fidelity funds.
At its May 2022 meeting, the Board unanimously determined to renew the fund's Advisory Contracts. In reaching its determination, the Board considered all factors it believed relevant and reached a determination, with the assistance of fund counsel and Independent Directors' counsel and through the exercise of its business judgment, that the renewal of the Advisory Contracts was in the best interests of the fund and its shareholders and the fact that no fee is payable under the management contract was fair and reasonable.
Nature, Extent, and Quality of Services Provided. The Board considered Fidelity's staffing as it relates to the fund, including the backgrounds of investment personnel of Fidelity, and also considered the fund's investment objective, strategies, and related investment philosophy. The Independent Directors also had discussions with senior management of Fidelity's investment operations and investment groups. The Board considered the structure of the investment personnel compensation program and whether this structure provides appropriate incentives to act in the best interests of the fund. The Board also considered the steps Fidelity had taken to ensure the continued provision of high quality services to the Fidelity funds during the COVID-19 pandemic, including the expansion of staff in client facing positions to maintain service levels in periods of high volumes and volatility.
Resources Dedicated to Investment Management and Support Services. The Board and the Fund Oversight and Research Committees reviewed the general qualifications and capabilities of Fidelity's investment staff, including its size, education, experience, and resources, as well as Fidelity's approach to recruiting, training, managing, and compensating investment personnel. The Board noted the resources devoted to expansion of Fidelity's global investment organization, and that Fidelity's analysts have extensive resources, tools, and capabilities that allow them to conduct sophisticated quantitative and fundamental analysis, as well as credit analysis of issuers, counterparties, and guarantors. Further, the Board considered that Fidelity's investment professionals have sufficient access to global information and data so as to provide competitive investment results over time, and that those professionals also have access to sophisticated tools that permit them to assess portfolio construction and risk and performance attribution characteristics continuously, as well as to transmit new information and research conclusions rapidly around the world. Additionally, in its deliberations, the Board considered Fidelity's trading, risk management, compliance, and technology and operations capabilities and resources, which are integral parts of the investment management process.
Administrative Services. The Board considered (i) the nature, extent, quality, and cost of advisory and administrative services performed by the Investment Advisers and their affiliates under the Advisory Contracts and under separate agreements covering transfer agency, pricing and bookkeeping, and securities lending services for the fund; (ii) the nature and extent of the supervision of third party service providers, principally custodians, subcustodians, and pricing vendors; and (iii) the resources devoted to, and the record of compliance with, the fund's compliance policies and procedures. The Board also reviewed the allocation of fund brokerage, including allocations to brokers affiliated with the Investment Advisers, and the use of "soft" commission dollars to pay for research services.
Investment Performance. The Board considered whether the fund has operated in accordance with its investment objective, as well as its record of compliance with its investment restrictions. The Board reviewed the fund's absolute investment performance, as well as the fund's relative investment performance. The Board did not consider performance to be a material factor in its decision to renew the fund's Advisory Contracts, as the fund is not publicly offered as a stand-alone investment product. In this regard, the Board noted that the fund is designed to offer a liquid investment option for other investment companies managed by Fidelity and ultimately to enhance the performance of those investment companies.
Based on its review, the Board concluded that the nature, extent, and quality of services provided to the fund under the Advisory Contracts should continue to benefit the shareholders of the fund.
Competitiveness of Management Fee and Total Expense Ratio. The Board considered that while the fund does not pay a management fee, FMR receives fees for providing services to funds that invest in the fund. The Board also noted that FMR bears all expenses of the fund with certain limited exceptions (i.e., custody fees, interest, taxes, fees and expenses of the Independent Trustees, proxy and shareholder meeting expenses, and extraordinary expenses). The Board further noted that the fund pays its non-operating expenses, including brokerage commissions and fees and expenses associated with the fund's securities lending program, if applicable. Based on its review, the Board concluded that the management fee received for providing services to the fund and the fund's total expense ratio were reasonable in light of the services that the fund and its shareholders receive and the other factors considered.
Costs of the Services and Profitability. The Board considered the level of Fidelity's profits in respect of all the Fidelity funds, as well as the profitability of the funds that invest in the fund.
A public accounting firm has been engaged annually by the Board as part of the Board's assessment of Fidelity's profitability analysis. The engagement includes the review and assessment of the methodologies used by Fidelity in determining the revenues and expenses attributable to Fidelity's mutual fund business, and completion of agreed-upon procedures in respect of the mathematical accuracy of certain fund profitability information and its conformity to established allocation methodologies. After considering the reports issued under the engagement and information provided by Fidelity, the Board concluded that while other allocation methods may also be reasonable, Fidelity's profitability methodologies are reasonable in all material respects.
The Board also reviewed Fidelity's non-fund businesses and potential indirect benefits such businesses may have received as a result of their association with Fidelity's mutual fund business (i.e., fall-out benefits) as well as cases where Fidelity's affiliates may benefit from the funds' business. The Board considered areas where potential indirect benefits to the Fidelity funds from their relationships with Fidelity may exist. The Board's consideration of these matters was informed by the findings of a joint ad hoc committee created by it and the boards of other Fidelity funds to evaluate potential fall-out benefits.
The Board concluded that the costs of the services provided by and the profits realized by Fidelity in connection with the operation of the fund were not relevant to the renewal of the Advisory Contracts because the fund pays no advisory fees and FMR bears all expenses of the fund with certain exceptions.
Economies of Scale. The Board concluded that because the fund pays no advisory fees and FMR bears all expenses of the fund with certain exceptions, the realization of economies of scale was not a material factor in the Board's decision to renew the fund's Advisory Contract.
Additional Information Requested by the Board. In order to develop fully the factual basis for consideration of the Fidelity funds' advisory contracts, the Board requested and received additional information on certain topics, including: (i) fund flow and performance trends, in particular the underperformance of certain funds and strategies, and Fidelity's long-term strategies for certain funds, including any consideration of fund liquidations or mergers; (ii) the operation of performance fees, competitor use of performance fees, and consideration of the expansion of performance fees to additional funds; (iii) Fidelity's pricing philosophy compared to competitors; (iv) fund profitability methodology and data; (v) evaluation of competitive fund data and peer group classifications and fee and expense comparisons; (vi) the management fee and expense structures for different funds and classes and information about the differences between various fee and expense structures; (vii) group fee breakpoints and related voluntary fee waivers; and (viii) information regarding other accounts managed by Fidelity and the funds' sub-advisory arrangements.
Based on its evaluation of all of the conclusions noted above, and after considering all factors it believed relevant, the Board concluded that the advisory fee arrangements are fair and reasonable, and that the fund's Advisory Contracts should be renewed.

HICII-ANN-1022
1.861961.114
Fidelity® Specialized High Income Central Fund
Annual Report
August 31, 2022
Contents
To view a fund's proxy voting guidelines and proxy voting record for the 12-month period ended June 30, visit http://www.fidelity.com/proxyvotingresults or visit the Securities and Exchange Commission's (SEC) web site at http://www.sec.gov.
You may also call 1-800-544-8544 to request a free copy of the proxy voting guidelines.
Standard & Poor's, S&P and S&P 500 are registered service marks of The McGraw-Hill Companies, Inc. and have been licensed for use by Fidelity Distributors Corporation.
Other third-party marks appearing herein are the property of their respective owners.
All other marks appearing herein are registered or unregistered trademarks or service marks of FMR LLC or an affiliated company. © 2022 FMR LLC. All rights reserved.
A fund files its complete schedule of portfolio holdings with the SEC for the first and third quarters of each fiscal year on Form N-PORT. Forms N-PORT are available on the SEC’s web site at http://www.sec.gov. A fund's Forms N-PORT may be reviewed and copied at the SEC’s Public Reference Room in Washington, DC. Information regarding the operation of the SEC's Public Reference Room may be obtained by calling 1-800-SEC-0330.
Performance: The Bottom Line
Average annual total return reflects the change in the value of an investment, assuming reinvestment of distributions from dividend income and capital gains (the profits earned upon the sale of securities that have grown in value, if any) and assuming a constant rate of performance each year. The hypothetical investment and the average annual total returns do not reflect the deduction of taxes that a shareholder would pay on fund distributions or the redemption of fund shares. During periods of reimbursement by Fidelity, a fund’s total return will be greater than it would be had the reimbursement not occurred. How a fund did yesterday is no guarantee of how it will do tomorrow.
Average Annual Total Returns
| For the periods ended August 31, 2022 | Past 1 year | Past 5 years | Past 10 years |
| Fidelity® Specialized High Income Central Fund | (9.98)% | 2.16% | 3.85% |
$10,000 Over 10 Years
Let's say hypothetically that $10,000 was invested in Fidelity® Specialized High Income Central Fund on August 31, 2012.
The chart shows how the value of your investment would have changed, and also shows how the ICE® BofA® BB US High Yield Constrained Index performed over the same period.
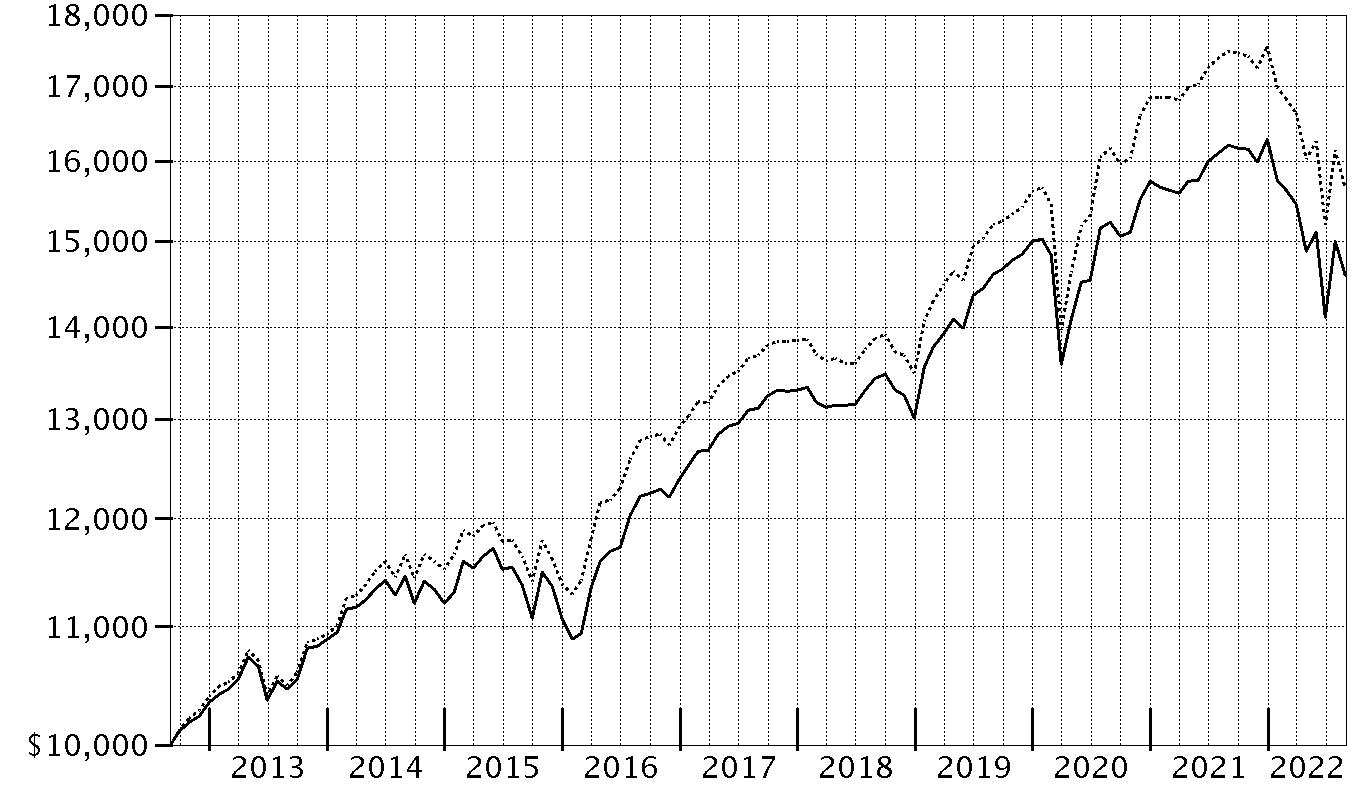
| Period Ending Values |
| $14,596 | Fidelity® Specialized High Income Central Fund |
| $15,658 | ICE® BofA® BB US High Yield Constrained Index |
Management's Discussion of Fund Performance
Market Recap: The ICE BofA
® US High Yield Constrained Index returned -10.43% for the 12 months ending August 31, 2022, as a multitude of crosscurrents challenged the global economy and financial markets. Persistently high inflation, exacerbated by energy price shocks from the Russia–Ukraine conflict, spurred the U.S. Federal Reserve to hike interest rates more aggressively than anticipated, and concerns about the outlook for economic growth sent stocks into bear market territory. In early May, the Fed approved a rare half-percentage-point interest rate increase and announced plans to shrink its $9 trillion asset portfolio. June began with the Fed allowing up to billions in Treasuries and mortgage bonds to mature every month without investing the proceeds. Two weeks later, the central bank raised rates by 0.75 percentage points, its largest increase since 1994, and said it was becoming more difficult to achieve a soft landing, in which the economy slows enough to bring down inflation while avoiding a recession. Against this volatile backdrop, the index returned -14.03% in the first half of 2022. High yield sharply reversed course in July (+6.02%), even as the central bank again raised its benchmark interest rate by 0.75%, before a leg down in August (-2.39%). For the full 12 months, the health care and banking industries (-16% each) lagged most, followed by retail (-14%). In contrast, energy led the way, returning about -4% amid a surge in commodity prices, while transportation returned roughly -7%.
Comments from Co-Managers Benjamin Harrison, Alexandre Karam and Michael Weaver: For the fiscal year ending August 31, 2022, the fund returned -9.98%, outperforming the -10.42% result of the benchmark, the ICE BofA
® BB US High Yield Constrained Index. The fund's core allocation to high-yield bonds returned -10.39% and contributed to performance versus the benchmark. By industry, market selection was the primary contributor, especially an underweighting in banking. Security selection in consumer goods and utility also helped. The biggest individual relative contributor was an overweight position in Crestwood Midstream (-2%). Crestwood Midstream was among the biggest holdings in the fund. Also adding value was our outsized stake in JBS, which returned 0%. The fund's non-benchmark stake in TransDigm returned roughly 0% and helped our relative result. Conversely, the largest detractor from performance versus the benchmark was our security picks in telecommunications. Security selection in leisure and media also hampered the fund's relative performance. The biggest individual relative detractor was an overweight position in T-Mobile USA (-14%). T-Mobile was among our largest holdings. Our second-largest detractor this period was Telecom Italia Capital. The fund's investment in securities issued by Telecom Italia Capital returned -26% the past year. Another notable relative detractor was our lighter-than-benchmark stake in Newell Brands (-15%). By quality, security selection in bonds rated BBB and Above added the most value versus the benchmark, while security choices among BB-rated bonds hurt the most. Notable changes in positioning include increased exposure to the health care industry and a lower allocation to telecommunications.
The views expressed above reflect those of the portfolio manager(s) only through the end of the period as stated on the cover of this report and do not necessarily represent the views of Fidelity or any other person in the Fidelity organization. Any such views are subject to change at any time based upon market or other conditions and Fidelity disclaims any responsibility to update such views. These views may not be relied on as investment advice and, because investment decisions for a Fidelity fund are based on numerous factors, may not be relied on as an indication of trading intent on behalf of any Fidelity fund.
Note to shareholders: On January 3, 2022, Benjamin Harrison assumed co-management responsibilities for the fund.
Investment Summary (Unaudited)
Top Bond Issuers as of August 31, 2022
| (by issuer, excluding cash equivalents) | % of fund's net assets |
| Sprint Capital Corp. | 3.1 |
| Icahn Enterprises LP/Icahn Enterprises Finance Corp. | 2.7 |
| Occidental Petroleum Corp. | 2.7 |
| CCO Holdings LLC/CCO Holdings Capital Corp. | 2.3 |
| Crestwood Midstream Partners LP/Crestwood Midstream Finance Corp. | 2.2 |
| Tenet Healthcare Corp. | 2.2 |
| HCA Holdings, Inc. | 2.2 |
| PG&E Corp. | 2.1 |
| TransDigm, Inc. | 1.7 |
| Vistra Operations Co. LLC | 1.7 |
| | 22.9 |
Top Five Market Sectors as of August 31, 2022
| | % of fund's net assets |
| Energy | 14.6 |
| Telecommunications | 9.4 |
| Healthcare | 8.2 |
| Utilities | 7.3 |
| Diversified Financial Services | 5.3 |
Quality Diversification (% of fund's net assets)
| As of August 31, 2022 |
| | BBB | 7.1% |
| | BB | 57.3% |
| | B | 24.1% |
| | Short-Term Investments and Net Other Assets | 11.5% |

We have used ratings from Moody's Investors Service, Inc. Where Moody's® ratings are not available, we have used S&P® ratings. All ratings are as of the date indicated and do not reflect subsequent changes.
Asset Allocation (% of fund's net assets)
| As of August 31, 2022* |
| | Nonconvertible Bonds | 86.8% |
| | Convertible Bonds, Preferred Stocks | 0.6% |
| | Bank Loan Obligations | 0.1% |
| | Preferred Securities | 1.0% |
| | Short-Term Investments and Net Other Assets (Liabilities) | 11.5% |

* Foreign investments - 11.1%
Geographic Diversification (% of fund's net assets)
| As of August 31, 2022 |
| | United States of America* | 88.9% |
| | Canada | 2.0% |
| | Multi-National | 1.7% |
| | Netherlands | 1.5% |
| | United Kingdom | 1.3% |
| | Panama | 1.0% |
| | Luxembourg | 1.0% |
| | Cayman Islands | 1.0% |
| | Ireland | 0.8% |
| | Other | 0.8% |

* Includes Short-Term investments and Net Other Assets (Liabilities).
Percentages are based on country or territory of incorporation and are adjusted for the effect of futures contracts, if applicable.
Schedule of Investments August 31, 2022
Showing Percentage of Net Assets
| Corporate Bonds - 87.4% | | | |
| | | Principal Amount | Value |
| Convertible Bonds - 0.6% | | | |
| Broadcasting - 0.6% | | | |
| DISH Network Corp. 3.375% 8/15/26 | | $2,658,000 | $1,912,594 |
| Nonconvertible Bonds - 86.8% | | | |
| Aerospace - 3.5% | | | |
| BWX Technologies, Inc. 4.125% 6/30/28 (a) | | 995,000 | 915,400 |
| Howmet Aerospace, Inc. 6.75% 1/15/28 | | 755,000 | 777,650 |
| Kaiser Aluminum Corp. 4.625% 3/1/28 (a) | | 2,085,000 | 1,795,884 |
| Moog, Inc. 4.25% 12/15/27 (a) | | 1,460,000 | 1,336,411 |
| Rolls-Royce PLC 5.75% 10/15/27 (a) | | 1,270,000 | 1,149,134 |
| TransDigm, Inc. 6.25% 3/15/26 (a) | | 5,853,000 | 5,750,573 |
| | | | 11,725,052 |
| Air Transportation - 0.2% | | | |
| United Airlines, Inc. 4.375% 4/15/26 (a) | | 670,000 | 610,873 |
| Automotive & Auto Parts - 1.8% | | | |
| Allison Transmission, Inc. 3.75% 1/30/31 (a) | | 1,270,000 | 1,029,119 |
| Dana, Inc. 4.5% 2/15/32 | | 365,000 | 291,395 |
| Ford Motor Credit Co. LLC: | | | |
| 2.3% 2/10/25 | | 360,000 | 328,176 |
| 2.9% 2/10/29 | | 360,000 | 291,330 |
| 4% 11/13/30 | | 1,710,000 | 1,428,500 |
| 4.687% 6/9/25 | | 1,005,000 | 964,800 |
| 5.113% 5/3/29 | | 650,000 | 600,714 |
| 5.125% 6/16/25 | | 660,000 | 644,714 |
| LCM Investments Holdings 4.875% 5/1/29 (a) | | 160,000 | 133,569 |
| Thor Industries, Inc. 4% 10/15/29 (a) | | 475,000 | 385,153 |
| | | | 6,097,470 |
| Banks & Thrifts - 0.4% | | | |
| Jane Street Group LLC/JSG Finance, Inc. 4.5% 11/15/29 (a) | | 205,000 | 185,748 |
| Quicken Loans LLC/Quicken Loans Co-Issuer, Inc. 3.625% 3/1/29 (a) | | 1,360,000 | 1,094,800 |
| | | | 1,280,548 |
| Broadcasting - 1.8% | | | |
| Diamond Sports Group LLC/Diamond Sports Finance Co. 5.375% 8/15/26 (a) | | 650,000 | 123,500 |
| Scripps Escrow II, Inc. 3.875% 1/15/29 (a) | | 465,000 | 394,255 |
| Sirius XM Radio, Inc.: | | | |
| 3.875% 9/1/31 (a) | | 365,000 | 294,738 |
| 5% 8/1/27 (a) | | 1,160,000 | 1,092,001 |
| 5.5% 7/1/29 (a) | | 2,845,000 | 2,660,303 |
| TEGNA, Inc.: | | | |
| 4.625% 3/15/28 | | 1,270,000 | 1,216,812 |
| 5% 9/15/29 | | 240,000 | 229,730 |
| | | | 6,011,339 |
| Building Materials - 1.0% | | | |
| Advanced Drain Systems, Inc. 5% 9/30/27 (a) | | 1,880,000 | 1,786,000 |
| Builders FirstSource, Inc. 4.25% 2/1/32 (a) | | 350,000 | 279,382 |
| Standard Industries, Inc./New Jersey 4.375% 7/15/30 (a) | | 1,485,000 | 1,179,127 |
| | | | 3,244,509 |
| Cable/Satellite TV - 4.1% | | | |
| CCO Holdings LLC/CCO Holdings Capital Corp.: | | | |
| 4.25% 2/1/31 (a) | | 200,000 | 163,189 |
| 4.5% 8/15/30 (a) | | 780,000 | 655,961 |
| 4.5% 5/1/32 | | 2,370,000 | 1,923,208 |
| 4.5% 6/1/33 (a) | | 730,000 | 573,050 |
| 5% 2/1/28 (a) | | 4,914,000 | 4,490,511 |
| CSC Holdings LLC: | | | |
| 3.375% 2/15/31 (a) | | 2,495,000 | 1,868,655 |
| 4.125% 12/1/30 (a) | | 5,000 | 4,050 |
| 5.375% 2/1/28 (a) | | 700,000 | 635,852 |
| 5.5% 4/15/27 (a) | | 1,961,000 | 1,858,597 |
| VZ Secured Financing BV 5% 1/15/32 (a) | | 1,805,000 | 1,471,707 |
| | | | 13,644,780 |
| Chemicals - 4.9% | | | |
| Axalta Coating Systems/Dutch Holding BV 4.75% 6/15/27 (a) | | 1,200,000 | 1,111,500 |
| Methanex Corp.: | | | |
| 5.125% 10/15/27 | | 1,585,000 | 1,443,143 |
| 5.25% 12/15/29 | | 130,000 | 109,211 |
| 5.65% 12/1/44 | | 1,034,000 | 754,794 |
| NOVA Chemicals Corp. 5.25% 6/1/27 (a) | | 1,960,000 | 1,730,474 |
| Nufarm Australia Ltd. 5% 1/27/30 (a) | | 895,000 | 742,850 |
| Olin Corp.: | | | |
| 5% 2/1/30 | | 1,944,000 | 1,764,214 |
| 5.125% 9/15/27 | | 2,525,000 | 2,396,616 |
| SPCM SA 3.125% 3/15/27 (a) | | 360,000 | 319,500 |
| The Chemours Co. LLC 5.375% 5/15/27 | | 2,885,000 | 2,661,009 |
| Valvoline, Inc. 4.25% 2/15/30 (a) | | 1,410,000 | 1,374,609 |
| W.R. Grace Holding LLC: | | | |
| 4.875% 6/15/27 (a) | | 630,000 | 582,674 |
| 5.625% 10/1/24 (a) | | 1,246,000 | 1,230,425 |
| | | | 16,221,019 |
| Consumer Products - 0.4% | | | |
| Mattel, Inc. 3.75% 4/1/29 (a) | | 630,000 | 561,330 |
| Newell Brands, Inc. 5.625% 4/1/36 (b) | | 565,000 | 506,014 |
| Tempur Sealy International, Inc. 3.875% 10/15/31 (a) | | 375,000 | 288,554 |
| | | | 1,355,898 |
| Containers - 0.7% | | | |
| Ardagh Packaging Finance PLC/Ardagh MP Holdings U.S.A., Inc. 4.125% 8/15/26 (a) | | 1,155,000 | 996,384 |
| Ball Corp. 3.125% 9/15/31 | | 1,280,000 | 1,036,705 |
| Graphic Packaging International, Inc. 3.75% 2/1/30 (a) | | 180,000 | 154,706 |
| OI European Group BV 4.75% 2/15/30 (a) | | 370,000 | 299,589 |
| | | | 2,487,384 |
| Diversified Financial Services - 5.3% | | | |
| Altus Midstream LP 5.875% 6/15/30 (a) | | 340,000 | 323,445 |
| Coinbase Global, Inc.: | | | |
| 3.375% 10/1/28 (a) | | 905,000 | 584,861 |
| 3.625% 10/1/31 (a) | | 2,005,000 | 1,220,714 |
| Icahn Enterprises LP/Icahn Enterprises Finance Corp.: | | | |
| 5.25% 5/15/27 | | 6,705,000 | 6,093,169 |
| 6.25% 5/15/26 | | 3,149,000 | 3,018,742 |
| Ladder Capital Finance Holdings LLLP/Ladder Capital Finance Corp. 4.25% 2/1/27 (a) | | 1,005,000 | 879,132 |
| LPL Holdings, Inc. 4% 3/15/29 (a) | | 1,420,000 | 1,257,296 |
| MSCI, Inc. 3.25% 8/15/33 (a) | | 285,000 | 226,203 |
| OneMain Finance Corp.: | | | |
| 3.5% 1/15/27 | | 2,475,000 | 2,042,841 |
| 6.875% 3/15/25 | | 1,585,000 | 1,540,659 |
| 7.125% 3/15/26 | | 624,000 | 587,006 |
| | | | 17,774,068 |
| Diversified Media - 0.5% | | | |
| Advantage Sales & Marketing, Inc. 6.5% 11/15/28 (a) | | 1,765,000 | 1,517,900 |
| Energy - 14.6% | | | |
| Apache Corp.: | | | |
| 4.25% 1/15/30 | | 244,000 | 220,361 |
| 5.1% 9/1/40 | | 686,000 | 583,100 |
| 5.25% 2/1/42 | | 1,030,000 | 863,011 |
| 5.35% 7/1/49 | | 170,000 | 139,507 |
| Cheniere Energy Partners LP: | | | |
| 3.25% 1/31/32 | | 365,000 | 292,183 |
| 4% 3/1/31 | | 1,355,000 | 1,187,319 |
| Cheniere Energy, Inc. 4.625% 10/15/28 | | 1,233,000 | 1,188,069 |
| CNX Midstream Partners LP 4.75% 4/15/30 (a) | | 150,000 | 126,629 |
| Colgate Energy Partners III LLC 5.875% 7/1/29 (a) | | 190,000 | 177,175 |
| Continental Resources, Inc. 5.75% 1/15/31 (a) | | 1,860,000 | 1,780,324 |
| Crestwood Midstream Partners LP/Crestwood Midstream Finance Corp.: | | | |
| 5.625% 5/1/27 (a) | | 2,198,000 | 2,049,635 |
| 5.75% 4/1/25 | | 3,871,000 | 3,730,773 |
| 6% 2/1/29 (a) | | 1,910,000 | 1,764,363 |
| CVR Energy, Inc.: | | | |
| 5.25% 2/15/25 (a) | | 840,000 | 792,424 |
| 5.75% 2/15/28 (a) | | 175,000 | 159,250 |
| DCP Midstream Operating LP: | | | |
| 5.6% 4/1/44 | | 100,000 | 96,391 |
| 6.45% 11/3/36 (a) | | 435,000 | 438,558 |
| 8.125% 8/16/30 | | 30,000 | 33,795 |
| Endeavor Energy Resources LP/EER Finance, Inc. 5.75% 1/30/28 (a) | | 905,000 | 892,692 |
| EnLink Midstream LLC 5.625% 1/15/28 (a) | | 220,000 | 211,343 |
| EnLink Midstream Partners LP: | | | |
| 5.05% 4/1/45 | | 290,000 | 208,928 |
| 5.45% 6/1/47 | | 605,000 | 462,069 |
| 5.6% 4/1/44 | | 1,018,000 | 797,730 |
| EQM Midstream Partners LP: | | | |
| 4.75% 1/15/31 (a) | | 1,140,000 | 985,940 |
| 5.5% 7/15/28 | | 905,000 | 827,405 |
| 6.5% 7/15/48 | | 550,000 | 466,659 |
| 7.5% 6/1/27 (a) | | 710,000 | 702,076 |
| EQT Corp. 3.9% 10/1/27 | | 1,654,000 | 1,565,709 |
| Hess Midstream Partners LP: | | | |
| 5.125% 6/15/28 (a) | | 1,130,000 | 1,049,488 |
| 5.625% 2/15/26 (a) | | 592,000 | 577,241 |
| Hilcorp Energy I LP/Hilcorp Finance Co. 6.25% 11/1/28 (a) | | 380,000 | 359,077 |
| Holly Energy Partners LP/Holly Energy Finance Corp.: | | | |
| 5% 2/1/28 (a) | | 365,000 | 339,877 |
| 6.375% 4/15/27 (a) | | 300,000 | 291,949 |
| New Fortress Energy, Inc. 6.5% 9/30/26 (a) | | 3,570,000 | 3,382,040 |
| Occidental Petroleum Corp.: | | | |
| 4.2% 3/15/48 | | 645,000 | 542,045 |
| 4.3% 8/15/39 | | 340,000 | 293,349 |
| 4.4% 4/15/46 | | 995,000 | 863,163 |
| 4.4% 8/15/49 | | 1,140,000 | 971,334 |
| 5.55% 3/15/26 | | 1,660,000 | 1,700,230 |
| 6.125% 1/1/31 | | 765,000 | 795,033 |
| 6.2% 3/15/40 | | 330,000 | 334,950 |
| 6.45% 9/15/36 | | 1,745,000 | 1,864,864 |
| 7.5% 5/1/31 | | 330,000 | 371,710 |
| 7.875% 9/15/31 | | 210,000 | 242,036 |
| 8.875% 7/15/30 | | 715,000 | 835,263 |
| Rockies Express Pipeline LLC: | | | |
| 4.8% 5/15/30 (a) | | 1,095,000 | 918,431 |
| 4.95% 7/15/29 (a) | | 570,000 | 514,123 |
| 6.875% 4/15/40 (a) | | 220,000 | 183,108 |
| Sunoco LP/Sunoco Finance Corp.: | | | |
| 4.5% 5/15/29 | | 1,295,000 | 1,100,218 |
| 5.875% 3/15/28 | | 215,000 | 199,913 |
| 6% 4/15/27 | | 1,405,000 | 1,358,818 |
| Superior Plus LP / Superior General Partner, Inc. 4.5% 3/15/29 (a) | | 265,000 | 233,680 |
| Tallgrass Energy Partners LP / Tallgrass Energy Finance Corp.: | | | |
| 5.5% 1/15/28 (a) | | 255,000 | 220,485 |
| 6% 3/1/27 (a) | | 1,111,000 | 1,013,788 |
| 6% 12/31/30 (a) | | 1,360,000 | 1,190,359 |
| Targa Resources Partners LP/Targa Resources Partners Finance Corp. 5.5% 3/1/30 | | 280,000 | 273,494 |
| Venture Global Calcasieu Pass LLC: | | | |
| 3.875% 8/15/29 (a) | | 445,000 | 388,263 |
| 3.875% 11/1/33 (a) | | 365,000 | 303,255 |
| 4.125% 8/15/31 (a) | | 430,000 | 373,211 |
| Western Gas Partners LP: | | | |
| 4.3% 2/1/30 | | 2,950,000 | 2,662,375 |
| 4.65% 7/1/26 | | 122,000 | 116,104 |
| | | | 48,606,692 |
| Environmental - 0.7% | | | |
| Darling Ingredients, Inc.: | | | |
| 5.25% 4/15/27 (a) | | 1,275,000 | 1,250,533 |
| 6% 6/15/30 (a) | | 220,000 | 220,277 |
| Stericycle, Inc. 3.875% 1/15/29 (a) | | 925,000 | 801,281 |
| | | | 2,272,091 |
| Food & Drug Retail - 1.7% | | | |
| Albertsons Companies LLC/Safeway, Inc./New Albertson's, Inc./Albertson's LLC: | | | |
| 3.5% 3/15/29 (a) | | 3,770,000 | 3,098,186 |
| 4.625% 1/15/27 (a) | | 1,400,000 | 1,277,528 |
| Emergent BioSolutions, Inc. 3.875% 8/15/28 (a) | | 1,585,000 | 1,109,500 |
| Murphy Oil U.S.A., Inc. 3.75% 2/15/31 (a) | | 165,000 | 139,379 |
| | | | 5,624,593 |
| Food/Beverage/Tobacco - 1.2% | | | |
| JBS U.S.A. Lux SA / JBS Food Co.: | | | |
| 5.5% 1/15/30 (a) | | 1,660,000 | 1,660,000 |
| 6.5% 4/15/29 (a) | | 636,000 | 659,793 |
| U.S. Foods, Inc.: | | | |
| 4.625% 6/1/30 (a) | | 175,000 | 150,938 |
| 6.25% 4/15/25 (a) | | 1,660,000 | 1,668,084 |
| | | | 4,138,815 |
| Gaming - 1.9% | | | |
| Melco Resorts Finance Ltd.: | | | |
| 5.375% 12/4/29 (a) | | 535,000 | 346,864 |
| 5.75% 7/21/28 (a) | | 805,000 | 543,778 |
| MGM Resorts International 5.75% 6/15/25 | | 620,000 | 601,369 |
| VICI Properties LP / VICI Note Co.: | | | |
| 4.25% 12/1/26 (a) | | 725,000 | 679,086 |
| 4.5% 9/1/26 (a) | | 2,592,000 | 2,442,403 |
| 4.625% 6/15/25 (a) | | 315,000 | 304,907 |
| Wynn Las Vegas LLC/Wynn Las Vegas Capital Corp. 5.5% 3/1/25 (a) | | 1,330,000 | 1,273,621 |
| | | | 6,192,028 |
| Healthcare - 8.2% | | | |
| 180 Medical, Inc. 3.875% 10/15/29 (a) | | 200,000 | 174,119 |
| Avantor Funding, Inc. 4.625% 7/15/28 (a) | | 1,215,000 | 1,105,504 |
| Catalent Pharma Solutions: | | | |
| 3.125% 2/15/29 (a) | | 1,100,000 | 911,945 |
| 3.5% 4/1/30 (a) | | 1,625,000 | 1,338,358 |
| Centene Corp.: | | | |
| 2.45% 7/15/28 | | 70,000 | 59,037 |
| 2.5% 3/1/31 | | 1,390,000 | 1,109,109 |
| 3.375% 2/15/30 | | 2,000,000 | 1,715,000 |
| 4.25% 12/15/27 | | 1,425,000 | 1,353,266 |
| Charles River Laboratories International, Inc.: | | | |
| 3.75% 3/15/29 (a) | | 265,000 | 228,396 |
| 4.25% 5/1/28 (a) | | 150,000 | 137,471 |
| DaVita HealthCare Partners, Inc. 4.625% 6/1/30 (a) | | 640,000 | 515,226 |
| HCA Holdings, Inc.: | | | |
| 5.375% 2/1/25 | | 1,600,000 | 1,615,200 |
| 5.375% 9/1/26 | | 5,515,000 | 5,530,139 |
| Hologic, Inc.: | | | |
| 3.25% 2/15/29 (a) | | 1,125,000 | 959,012 |
| 4.625% 2/1/28 (a) | | 170,000 | 158,313 |
| IQVIA, Inc. 5% 5/15/27 (a) | | 630,000 | 608,826 |
| Jazz Securities DAC 4.375% 1/15/29 (a) | | 305,000 | 275,031 |
| Molina Healthcare, Inc. 3.875% 5/15/32 (a) | | 485,000 | 417,367 |
| Organon & Co. / Organon Foreign Debt Co-Issuer BV: | | | |
| 4.125% 4/30/28 (a) | | 775,000 | 695,307 |
| 5.125% 4/30/31 (a) | | 1,050,000 | 918,750 |
| Teleflex, Inc. 4.25% 6/1/28 (a) | | 305,000 | 277,105 |
| Tenet Healthcare Corp.: | | | |
| 4.625% 6/15/28 (a) | | 5,745,000 | 5,222,176 |
| 4.875% 1/1/26 (a) | | 690,000 | 655,500 |
| 5.125% 11/1/27 (a) | | 1,500,000 | 1,389,750 |
| | | | 27,369,907 |
| Homebuilders/Real Estate - 2.6% | | | |
| Century Communities, Inc. 3.875% 8/15/29 (a) | | 430,000 | 345,615 |
| HAT Holdings I LLC/HAT Holdings II LLC 3.375% 6/15/26 (a) | | 460,000 | 399,183 |
| Howard Hughes Corp. 4.375% 2/1/31 (a) | | 675,000 | 539,777 |
| Kennedy-Wilson, Inc. 4.75% 2/1/30 | | 715,000 | 588,088 |
| MPT Operating Partnership LP/MPT Finance Corp. 5% 10/15/27 | | 3,516,000 | 3,158,551 |
| Ryan Specialty Group LLC 4.375% 2/1/30 (a) | | 530,000 | 477,663 |
| Service Properties Trust: | | | |
| 3.95% 1/15/28 | | 85,000 | 63,289 |
| 4.375% 2/15/30 | | 605,000 | 443,495 |
| 4.95% 10/1/29 | | 515,000 | 389,222 |
| 5.5% 12/15/27 | | 480,000 | 415,267 |
| TopBuild Corp. 4.125% 2/15/32 (a) | | 765,000 | 630,053 |
| Uniti Group LP / Uniti Group Finance, Inc. 4.75% 4/15/28 (a) | | 1,630,000 | 1,362,002 |
| | | | 8,812,205 |
| Hotels - 1.4% | | | |
| Hilton Domestic Operating Co., Inc.: | | | |
| 3.625% 2/15/32 (a) | | 1,130,000 | 912,266 |
| 4% 5/1/31 (a) | | 3,185,000 | 2,691,798 |
| Hilton Worldwide Finance LLC/Hilton Worldwide Finance Corp. 4.875% 4/1/27 | | 426,000 | 406,830 |
| Wyndham Hotels & Resorts, Inc. 4.375% 8/15/28 (a) | | 592,000 | 529,463 |
| | | | 4,540,357 |
| Leisure - 1.2% | | | |
| Carnival Corp.: | | | |
| 7.625% 3/1/26 (a) | | 1,465,000 | 1,245,250 |
| 10.5% 2/1/26 (a) | | 2,290,000 | 2,358,689 |
| Royal Caribbean Cruises Ltd.: | | | |
| 5.375% 7/15/27 (a) | | 325,000 | 251,431 |
| 9.125% 6/15/23 (a) | | 265,000 | 267,642 |
| | | | 4,123,012 |
| Metals/Mining - 0.2% | | | |
| FMG Resources Pty Ltd. 4.5% 9/15/27 (a) | | 20,000 | 18,271 |
| Howmet Aerospace, Inc. 5.95% 2/1/37 | | 55,000 | 53,334 |
| Mineral Resources Ltd. 8% 11/1/27 (a) | | 495,000 | 493,819 |
| | | | 565,424 |
| Paper - 0.2% | | | |
| Ardagh Metal Packaging Finance U.S.A. LLC/Ardagh Metal Packaging Finance PLC 6% 6/15/27 (a) | | 475,000 | 465,563 |
| Glatfelter Corp. 4.75% 11/15/29 (a) | | 290,000 | 179,800 |
| | | | 645,363 |
| Restaurants - 0.2% | | | |
| Garden SpinCo Corp. 8.625% 7/20/30 (a) | | 150,000 | 159,750 |
| Yum! Brands, Inc. 3.625% 3/15/31 | | 470,000 | 395,834 |
| | | | 555,584 |
| Services - 5.1% | | | |
| ADT Corp.: | | | |
| 4.125% 8/1/29 (a) | | 360,000 | 309,143 |
| 4.875% 7/15/32 (a) | | 355,000 | 296,974 |
| Adtalem Global Education, Inc. 5.5% 3/1/28 (a) | | 196,000 | 186,200 |
| AECOM 5.125% 3/15/27 | | 2,030,000 | 1,969,100 |
| Aramark Services, Inc. 5% 2/1/28 (a) | | 3,660,000 | 3,368,371 |
| ASGN, Inc. 4.625% 5/15/28 (a) | | 3,400,000 | 3,004,840 |
| Booz Allen Hamilton, Inc.: | | | |
| 3.875% 9/1/28 (a) | | 1,595,000 | 1,418,753 |
| 4% 7/1/29 (a) | | 140,000 | 123,435 |
| Fair Isaac Corp. 4% 6/15/28 (a) | | 435,000 | 384,267 |
| Gartner, Inc.: | | | |
| 3.625% 6/15/29 (a) | | 205,000 | 176,300 |
| 3.75% 10/1/30 (a) | | 530,000 | 454,475 |
| GEMS MENASA Cayman Ltd. 7.125% 7/31/26 (a) | | 800,000 | 756,650 |
| Iron Mountain, Inc. 4.875% 9/15/29 (a) | | 1,270,000 | 1,101,376 |
| Prime Securities Services Borrower LLC/Prime Finance, Inc. 3.375% 8/31/27 (a) | | 2,545,000 | 2,190,291 |
| Service Corp. International 5.125% 6/1/29 | | 695,000 | 658,450 |
| TriNet Group, Inc. 3.5% 3/1/29 (a) | | 595,000 | 510,251 |
| | | | 16,908,876 |
| Steel - 0.2% | | | |
| Commercial Metals Co. 3.875% 2/15/31 | | 755,000 | 626,665 |
| Super Retail - 1.3% | | | |
| Asbury Automotive Group, Inc.: | | | |
| 4.625% 11/15/29 (a) | | 230,000 | 197,225 |
| 5% 2/15/32 (a) | | 250,000 | 208,788 |
| Bath & Body Works, Inc. 6.625% 10/1/30 (a) | | 1,095,000 | 994,764 |
| Gap, Inc. 3.875% 10/1/31 (a) | | 360,000 | 249,665 |
| Hanesbrands, Inc. 4.875% 5/15/26 (a) | | 1,270,000 | 1,168,451 |
| Levi Strauss & Co. 3.5% 3/1/31 (a) | | 525,000 | 440,963 |
| The William Carter Co. 5.625% 3/15/27 (a) | | 1,154,000 | 1,114,337 |
| | | | 4,374,193 |
| Technology - 4.7% | | | |
| Block, Inc. 2.75% 6/1/26 | | 360,000 | 319,921 |
| Central Parent, Inc./Central Merger Sub, Inc. 7.25% 6/15/29 (a) | | 440,000 | 421,348 |
| Crowdstrike Holdings, Inc. 3% 2/15/29 | | 610,000 | 539,850 |
| Entegris, Inc. 4.375% 4/15/28 (a) | | 2,100,000 | 1,853,660 |
| Gartner, Inc. 4.5% 7/1/28 (a) | | 820,000 | 756,819 |
| Go Daddy Operating Co. LLC / GD Finance Co., Inc. 5.25% 12/1/27 (a) | | 1,400,000 | 1,316,000 |
| II-VI, Inc. 5% 12/15/29 (a) | | 1,385,000 | 1,233,162 |
| Match Group Holdings II LLC: | | | |
| 3.625% 10/1/31 (a) | | 575,000 | 449,787 |
| 4.125% 8/1/30 (a) | | 305,000 | 252,370 |
| MicroStrategy, Inc. 6.125% 6/15/28 (a) | | 545,000 | 454,791 |
| onsemi 3.875% 9/1/28 (a) | | 620,000 | 552,916 |
| Open Text Corp.: | | | |
| 3.875% 2/15/28 (a) | | 2,760,000 | 2,352,900 |
| 3.875% 12/1/29 (a) | | 180,000 | 145,158 |
| Roblox Corp. 3.875% 5/1/30 (a) | | 890,000 | 742,412 |
| Sensata Technologies BV: | | | |
| 4% 4/15/29 (a) | | 1,115,000 | 963,851 |
| 5.625% 11/1/24 (a) | | 1,000,000 | 1,004,833 |
| Sensata Technologies, Inc. 3.75% 2/15/31 (a) | | 1,335,000 | 1,102,806 |
| TTM Technologies, Inc. 4% 3/1/29 (a) | | 460,000 | 397,901 |
| Twilio, Inc. 3.875% 3/15/31 | | 295,000 | 238,044 |
| Viavi Solutions, Inc. 3.75% 10/1/29 (a) | | 725,000 | 622,106 |
| | | | 15,720,635 |
| Telecommunications - 9.4% | | | |
| C&W Senior Financing Designated Activity Co. 6.875% 9/15/27 (a) | | 2,719,000 | 2,399,518 |
| Cogent Communications Group, Inc. 7% 6/15/27 (a) | | 830,000 | 793,223 |
| Level 3 Financing, Inc. 4.25% 7/1/28 (a) | | 3,815,000 | 3,171,219 |
| Lumen Technologies, Inc.: | | | |
| 5.125% 12/15/26 (a) | | 2,440,000 | 2,108,367 |
| 5.625% 4/1/25 | | 1,765,000 | 1,711,902 |
| 6.875% 1/15/28 | | 80,000 | 72,016 |
| Millicom International Cellular SA: | | | |
| 4.5% 4/27/31 (a) | | 200,000 | 164,163 |
| 5.125% 1/15/28 (a) | | 1,800,000 | 1,651,059 |
| Sable International Finance Ltd. 5.75% 9/7/27 (a) | | 2,404,000 | 2,193,650 |
| SBA Communications Corp. 3.875% 2/15/27 | | 705,000 | 641,745 |
| Sprint Capital Corp.: | | | |
| 6.875% 11/15/28 | | 7,935,000 | 8,378,912 |
| 8.75% 3/15/32 | | 1,720,000 | 2,076,418 |
| Telecom Italia Capital SA: | | | |
| 6% 9/30/34 | | 739,000 | 596,743 |
| 7.2% 7/18/36 | | 855,000 | 729,614 |
| Virgin Media Secured Finance PLC 4.5% 8/15/30 (a) | | 3,700,000 | 3,080,990 |
| Windstream Escrow LLC 7.75% 8/15/28 (a) | | 1,585,000 | 1,362,436 |
| | | | 31,131,975 |
| Textiles/Apparel - 0.1% | | | |
| Foot Locker, Inc. 4% 10/1/29 (a) | | 190,000 | 154,850 |
| Kontoor Brands, Inc. 4.125% 11/15/29 (a) | | 125,000 | 106,606 |
| | | | 261,456 |
| Transportation Ex Air/Rail - 0.1% | | | |
| Seaspan Corp. 5.5% 8/1/29 (a) | | 360,000 | 296,473 |
| XPO Logistics, Inc. 6.25% 5/1/25 (a) | | 168,000 | 169,958 |
| | | | 466,431 |
| Utilities - 7.2% | | | |
| Clearway Energy Operating LLC: | | | |
| 3.75% 2/15/31 (a) | | 1,355,000 | 1,131,456 |
| 4.75% 3/15/28 (a) | | 290,000 | 271,513 |
| DCP Midstream Operating LP 5.125% 5/15/29 | | 3,305,000 | 3,221,384 |
| InterGen NV 7% 6/30/23 (a) | | 1,496,000 | 1,421,200 |
| NextEra Energy Partners LP 4.25% 9/15/24 (a) | | 146,000 | 142,350 |
| NRG Energy, Inc.: | | | |
| 3.625% 2/15/31 (a) | | 1,710,000 | 1,358,253 |
| 5.25% 6/15/29 (a) | | 1,251,000 | 1,118,144 |
| 5.75% 1/15/28 | | 1,319,000 | 1,243,303 |
| 6.625% 1/15/27 | | 339,000 | 336,313 |
| PG&E Corp.: | | | |
| 5% 7/1/28 | | 5,555,000 | 4,932,646 |
| 5.25% 7/1/30 | | 2,395,000 | 2,070,478 |
| TerraForm Power Operating LLC 5% 1/31/28 (a) | | 624,000 | 571,939 |
| Vertiv Group Corp. 4.125% 11/15/28 (a) | | 895,000 | 774,175 |
| Vistra Operations Co. LLC: | | | |
| 5% 7/31/27 (a) | | 2,705,000 | 2,517,489 |
| 5.5% 9/1/26 (a) | | 2,052,000 | 1,981,309 |
| 5.625% 2/15/27 (a) | | 960,000 | 924,000 |
| | | | 24,015,952 |
|
| TOTAL NONCONVERTIBLE BONDS | | | 288,923,094 |
|
| TOTAL CORPORATE BONDS | | | |
| (Cost $323,061,628) | | | 290,835,688 |
|
| Bank Loan Obligations - 0.1% | | | |
| Services - 0.0% | | | |
| ABG Intermediate Holdings 2 LLC Tranche B1 LN, term loan CME Term SOFR 1 Month Index + 3.500% 6.0553% 12/21/28 (c)(d)(e) | | 130,000 | 126,750 |
| Utilities - 0.1% | | | |
| Brookfield WEC Holdings, Inc. 1LN, term loan CME Term SOFR 1 Month Index + 3.750% 6.1905% 8/1/25 (c)(d)(e) | | 330,000 | 324,390 |
| TOTAL BANK LOAN OBLIGATIONS | | | |
| (Cost $446,613) | | | 451,140 |
|
| Preferred Securities - 1.0% | | | |
| Banks & Thrifts - 1.0% | | | |
Ally Financial, Inc. 4.7%
(Cost $3,800,000)(c)(f) | | 3,800,000 | 3,143,076 |
| | | Shares | Value |
|
| Money Market Funds - 10.2% | | | |
| Fidelity Cash Central Fund 2.33% (g) | | | |
| (Cost $33,914,088) | | 33,909,245 | 33,916,027 |
| TOTAL INVESTMENT IN SECURITIES - 98.7% | | | |
| (Cost $361,222,329) | | | 328,345,931 |
| NET OTHER ASSETS (LIABILITIES) - 1.3% | | | 4,411,987 |
| NET ASSETS - 100% | | | $332,757,918 |
Legend
(a) Security exempt from registration under Rule 144A of the Securities Act of 1933. These securities may be resold in transactions exempt from registration, normally to qualified institutional buyers. At the end of the period, the value of these securities amounted to $180,823,500 or 54.3% of net assets.
(b) Security initially issued at one coupon which converts to a higher coupon at a specified date. The rate shown is the rate at period end.
(c) Coupon rates for floating and adjustable rate securities reflect the rates in effect at period end.
(d) Coupon is indexed to a floating interest rate which may be multiplied by a specified factor and/or subject to caps or floors.
(e) Remaining maturities of bank loan obligations may be less than the stated maturities shown as a result of contractual or optional prepayments by the borrower. Such prepayments cannot be predicted with certainty.
(f) Security is perpetual in nature with no stated maturity date.
(g) Affiliated fund that is generally available only to investment companies and other accounts managed by Fidelity Investments. The rate quoted is the annualized seven-day yield of the fund at period end. A complete unaudited listing of the fund's holdings as of its most recent quarter end is available upon request. In addition, each Fidelity Central Fund's financial statements, which are not covered by the Fund's Report of Independent Registered Public Accounting Firm, are available on the SEC's website or upon request.
Affiliated Central Funds
Fiscal year to date information regarding the Fund's investments in Fidelity Central Funds, including the ownership percentage, is presented below.
| Fund | Value, beginning of period | Purchases | Sales Proceeds | Dividend Income | Realized Gain/Loss | Change in Unrealized appreciation (depreciation) | Value, end of period | % ownership, end of period |
| Fidelity Cash Central Fund 2.33% | $24,916,243 | $85,527,091 | $76,527,308 | $147,962 | $-- | $1 | $33,916,027 | 0.1% |
| Total | $24,916,243 | $85,527,091 | $76,527,308 | $147,962 | $-- | $1 | $33,916,027 | |
Amounts in the income column in the above table include any capital gain distributions from underlying funds, which are presented in the corresponding line-item in the Statement of Operations, if applicable.
Investment Valuation
The following is a summary of the inputs used, as of August 31, 2022, involving the Fund's assets and liabilities carried at fair value. The inputs or methodology used for valuing securities may not be an indication of the risk associated with investing in those securities. For more information on valuation inputs, and their aggregation into the levels used below, please refer to the Investment Valuation section in the accompanying Notes to Financial Statements.
| | Valuation Inputs at Reporting Date: |
| Description | Total | Level 1 | Level 2 | Level 3 |
| Investments in Securities: | | | | |
| Corporate Bonds | $290,835,688 | $-- | $290,835,688 | $-- |
| Bank Loan Obligations | 451,140 | -- | 451,140 | -- |
| Preferred Securities | 3,143,076 | -- | 3,143,076 | -- |
| Money Market Funds | 33,916,027 | 33,916,027 | -- | -- |
| Total Investments in Securities: | $328,345,931 | $33,916,027 | $294,429,904 | $-- |
See accompanying notes which are an integral part of the financial statements.
Financial Statements
Statement of Assets and Liabilities
| | | August 31, 2022 |
| Assets | | |
Investment in securities, at value — See accompanying schedule:
Unaffiliated issuers (cost $327,308,241) | $294,429,904 | |
| Fidelity Central Funds (cost $33,914,088) | 33,916,027 | |
| Total Investment in Securities (cost $361,222,329) | | $328,345,931 |
| Receivable for investments sold | | 89,793 |
| Interest receivable | | 4,344,081 |
| Distributions receivable from Fidelity Central Funds | | 65,928 |
| Total assets | | 332,845,733 |
| Liabilities | | |
| Payable to custodian bank | $87,749 | |
| Other payables and accrued expenses | 66 | |
| Total liabilities | | 87,815 |
| Net Assets | | $332,757,918 |
| Net Assets consist of: | | |
| Paid in capital | | $369,068,263 |
| Total accumulated earnings (loss) | | (36,310,345) |
| Net Assets | | $332,757,918 |
| Net Asset Value, offering price and redemption price per share ($332,757,918 ÷ 3,972,820 shares) | | $83.76 |
See accompanying notes which are an integral part of the financial statements.
Statement of Operations
| | | Year ended August 31, 2022 |
| Investment Income | | |
| Dividends | | $178,600 |
| Interest | | 15,782,249 |
| Income from Fidelity Central Funds | | 147,962 |
| Total income | | 16,108,811 |
| Expenses | | |
| Custodian fees and expenses | $858 | |
| Independent directors' fees and expenses | 1,176 | |
| Miscellaneous | 3 | |
| Total expenses before reductions | 2,037 | |
| Expense reductions | (96) | |
| Total expenses after reductions | | 1,941 |
| Net investment income (loss) | | 16,106,870 |
| Realized and Unrealized Gain (Loss) | | |
| Net realized gain (loss) on: | | |
| Investment securities: | | |
| Unaffiliated issuers | (2,997,053) | |
| Total net realized gain (loss) | | (2,997,053) |
| Change in net unrealized appreciation (depreciation) on: | | |
| Investment securities: | | |
| Unaffiliated issuers | (49,825,398) | |
| Fidelity Central Funds | 1 | |
| Total change in net unrealized appreciation (depreciation) | | (49,825,397) |
| Net gain (loss) | | (52,822,450) |
| Net increase (decrease) in net assets resulting from operations | | $(36,715,580) |
See accompanying notes which are an integral part of the financial statements.
Statement of Changes in Net Assets
| | Year ended August 31, 2022 | Year ended August 31, 2021 |
| Increase (Decrease) in Net Assets | | |
| Operations | | |
| Net investment income (loss) | $16,106,870 | $20,169,902 |
| Net realized gain (loss) | (2,997,053) | 16,514,516 |
| Change in net unrealized appreciation (depreciation) | (49,825,397) | (8,540,200) |
| Net increase (decrease) in net assets resulting from operations | (36,715,580) | 28,144,218 |
| Distributions to shareholders | (28,332,812) | (24,179,309) |
| Affiliated share transactions | | |
| Proceeds from sales of shares | 15,400,000 | 7,650,000 |
| Reinvestment of distributions | 28,330,870 | 24,179,308 |
| Cost of shares redeemed | (7,441,587) | (205,326,776) |
| Net increase (decrease) in net assets resulting from share transactions | 36,289,283 | (173,497,468) |
| Total increase (decrease) in net assets | (28,759,109) | (169,532,559) |
| Net Assets | | |
| Beginning of period | 361,517,027 | 531,049,586 |
| End of period | $332,757,918 | $361,517,027 |
| Other Information | | |
| Shares | | |
| Sold | 169,484 | 76,937 |
| Issued in reinvestment of distributions | 305,098 | 243,094 |
| Redeemed | (84,911) | (2,047,003) |
| Net increase (decrease) | 389,671 | (1,726,972) |
See accompanying notes which are an integral part of the financial statements.
Financial Highlights
Fidelity Specialized High Income Central Fund
| | | | | | |
| Years ended August 31, | 2022 | 2021 | 2020 | 2019 | 2018 |
| Selected Per–Share Data | | | | | |
| Net asset value, beginning of period | $100.89 | $100.01 | $102.28 | $99.83 | $104.63 |
| Income from Investment Operations | | | | | |
| Net investment income (loss)A,B | 4.198 | 4.670 | 5.162 | 5.368 | 5.188 |
| Net realized and unrealized gain (loss) | (13.727) | 1.582 | (1.042) | 2.981 | (2.758) |
| Total from investment operations | (9.529) | 6.252 | 4.120 | 8.349 | 2.430 |
| Distributions from net investment income | (4.181) | (4.623) | (5.093) | (5.335) | (5.217) |
| Distributions from net realized gain | (3.420) | (.749) | (1.297) | (.564) | (2.013) |
| Total distributions | (7.601) | (5.372) | (6.390) | (5.899) | (7.230) |
| Net asset value, end of period | $83.76 | $100.89 | $100.01 | $102.28 | $99.83 |
| Total ReturnC | (9.98)% | 6.46% | 4.25% | 8.73% | 2.42% |
| Ratios to Average Net AssetsB,D,E | �� | | | | |
| Expenses before reductionsF | -% | -% | -% | -% | -% |
| Expenses net of fee waivers, if anyF | -% | -% | -% | -% | -% |
| Expenses net of all reductionsF | -% | -% | -% | -% | -% |
| Net investment income (loss) | 4.61% | 4.67% | 5.20% | 5.42% | 5.13% |
| Supplemental Data | | | | | |
| Net assets, end of period (000 omitted) | $332,758 | $361,517 | $531,050 | $601,159 | $719,197 |
| Portfolio turnover rateG | 23% | 55% | 54% | 45%H | 62% |
A Calculated based on average shares outstanding during the period.
B Net investment income (loss) is affected by the timing of the declaration of dividends by any underlying mutual funds or exchange-traded funds (ETFs). Net investment income (loss) of any such underlying funds is not included in the Fund's net investment income (loss) ratio.
C Total returns would have been lower if certain expenses had not been reduced during the applicable periods shown.
D Fees and expenses of any underlying mutual funds or exchange-traded funds (ETFs) are not included in the Fund's expense ratio. The Fund indirectly bears its proportionate share of these expenses. For additional expense information related to investments in Fidelity Central Funds, please refer to the "Investments in Fidelity Central Funds" note found in the Notes to Financial Statements section of the most recent Annual or Semi-Annual report.
E Expense ratios reflect operating expenses of the class. Expenses before reductions do not reflect amounts reimbursed, waived, or reduced through arrangements with the investment adviser, brokerage services, or other offset arrangements, if applicable, and do not represent the amount paid by the class during periods when reimbursements, waivers or reductions occur.
F Amount represents less than .005%.
G Amount does not include the portfolio activity of any underlying mutual funds or exchange-traded funds (ETFs).
H Portfolio turnover rate excludes securities received or delivered in-kind.
See accompanying notes which are an integral part of the financial statements.
Notes to Financial Statements
For the period ended August 31, 2022
1. Organization.
Fidelity Specialized High Income Central Fund (the Fund) is a fund of Fidelity Central Investment Portfolios LLC (the LLC) and is authorized to issue an unlimited number of shares. Shares of the Fund are only offered to other investment companies and accounts managed by Fidelity Management & Research Company LLC (FMR), or its affiliates (the Investing Funds). The LLC is registered under the Investment Company Act of 1940, as amended (the 1940 Act), as an open-end management investment company organized as a Delaware Limited Liability Company.
2. Investments in Fidelity Central Funds.
Funds may invest in Fidelity Central Funds, which are open-end investment companies generally available only to other investment companies and accounts managed by the investment adviser and its affiliates. The Schedule of Investments lists any Fidelity Central Funds held as an investment as of period end, but does not include the underlying holdings of each Fidelity Central Fund. An investing fund indirectly bears its proportionate share of the expenses of the underlying Fidelity Central Funds.
Based on its investment objective, each Fidelity Central Fund may invest or participate in various investment vehicles or strategies that are similar to those of the investing fund. These strategies are consistent with the investment objectives of the investing fund and may involve certain economic risks which may cause a decline in value of each of the Fidelity Central Funds and thus a decline in the value of the investing fund.
| Fidelity Central Fund | Investment Manager | Investment Objective | Investment Practices | Expense Ratio(a) |
| Fidelity Money Market Central Funds | Fidelity Management & Research Company LLC (FMR) | Each fund seeks to obtain a high level of current income consistent with the preservation of capital and liquidity. | Short-term Investments | Less than .005% |
(a) Expenses expressed as a percentage of average net assets and are as of each underlying Central Fund's most recent annual or semi-annual shareholder report.
A complete unaudited list of holdings for each Fidelity Central Fund is available upon request or at the Securities and Exchange Commission website at www.sec.gov. In addition, the financial statements of the Fidelity Central Funds which contain the significant accounting policies (including investment valuation policies) of those funds, and are not covered by the Report of Independent Registered Public Accounting Firm, are available on the Securities and Exchange Commission website or upon request.
3. Significant Accounting Policies.
The Fund is an investment company and applies the accounting and reporting guidance of the Financial Accounting Standards Board (FASB) Accounting Standards Codification Topic 946 Financial Services - Investment Companies. The financial statements have been prepared in conformity with accounting principles generally accepted in the United States of America (GAAP), which require management to make certain estimates and assumptions at the date of the financial statements. Actual results could differ from those estimates. Subsequent events, if any, through the date that the financial statements were issued have been evaluated in the preparation of the financial statements. The Fund's Schedule of Investments lists any underlying mutual funds or exchange-traded funds (ETFs) but does not include the underlying holdings of these funds. The following summarizes the significant accounting policies of the Fund:
Investment Valuation. Investments are valued as of 4:00 p.m. Eastern time on the last calendar day of the period. The Board of Directors (the Board) has delegated the day to day responsibility for the valuation of the Fund's investments to the Fair Value Committee (the Committee) established by the Fund's investment adviser. In accordance with valuation policies and procedures approved by the Board, the Fund attempts to obtain prices from one or more third party pricing vendors or brokers to value its investments. When current market prices, quotations or currency exchange rates are not readily available or reliable, investments will be fair valued in good faith by the Committee, in accordance with procedures adopted by the Board. Factors used in determining fair value vary by investment type and may include market or investment specific events, changes in interest rates and credit quality. The frequency with which these procedures are used cannot be predicted and they may be utilized to a significant extent. The Committee oversees the Fund's valuation policies and procedures and reports to the Board on the Committee's activities and fair value determinations. The Board monitors the appropriateness of the procedures used in valuing the Fund's investments and ratifies the fair value determinations of the Committee.
The Fund categorizes the inputs to valuation techniques used to value its investments into a disclosure hierarchy consisting of three levels as shown below:
- Level 1 – unadjusted quoted prices in active markets for identical investments
- Level 2 – other significant observable inputs (including quoted prices for similar investments, interest rates, prepayment speeds, etc.)
- Level 3 – unobservable inputs (including the Fund's own assumptions based on the best information available)
Valuation techniques used to value the Fund's investments by major category are as follows:
Debt securities, including restricted securities, are valued based on evaluated prices received from third party pricing vendors or from brokers who make markets in such securities. Corporate bonds, bank loan obligations and preferred securities are valued by pricing vendors who utilize matrix pricing which considers yield or price of bonds of comparable quality, coupon, maturity and type or by broker-supplied prices. When independent prices are unavailable or unreliable, debt securities may be valued utilizing pricing methodologies which consider similar factors that would be used by third party pricing vendors. Debt securities are generally categorized as Level 2 in the hierarchy but may be Level 3 depending on the circumstances. The Fund invests a significant portion of its assets in below investment grade securities. The value of these securities can be more volatile due to changes in the credit quality of the issuer and is sensitive to changes in economic, market and regulatory conditions.
Investments in open-end mutual funds, including the Fidelity Central Funds, are valued at their closing net asset value (NAV) each business day and are categorized as Level 1 in the hierarchy.
Changes in valuation techniques may result in transfers in or out of an assigned level within the disclosure hierarchy. The aggregate value of investments by input level as of August 31, 2022 is included at the end of the Fund's Schedule of Investments.
Investment Transactions and Income. For financial reporting purposes, the Fund's investment holdings and NAV include trades executed through the end of the last business day of the period. The NAV per share for processing shareholder transactions is calculated as of the close of business of the New York Stock Exchange (NYSE), normally 4:00 p.m. Eastern time and includes trades executed through the end of the prior business day. Gains and losses on securities sold are determined on the basis of identified cost and include proceeds received from litigation. Dividend income is recorded on the ex-dividend date. Non-cash dividends included in dividend income, if any, are recorded at the fair market value of the securities received. Income and capital gain distributions from Fidelity Central Funds, if any, are recorded on the ex-dividend date. Interest income is accrued as earned and includes coupon interest and amortization of premium and accretion of discount on debt securities as applicable. Debt obligations may be placed on non-accrual status and related interest income may be reduced by ceasing current accruals and writing off interest receivables when the collection of all or a portion of interest has become doubtful based on consistently applied procedures. A debt obligation is removed from non-accrual status when the issuer resumes interest payments or when collectability of interest is reasonably assured.
Expenses. Expenses directly attributable to a fund are charged to that fund. Expenses attributable to more than one fund are allocated among the respective funds on the basis of relative net assets or other appropriate methods. Expenses included in the accompanying financial statements reflect the expenses of that fund and do not include any expenses associated with any underlying mutual funds or exchange-traded funds. Although not included in a fund's expenses, a fund indirectly bears its proportionate share of these expenses through the net asset value of each underlying mutual fund or exchange-traded fund. Expense estimates are accrued in the period to which they relate and adjustments are made when actual amounts are known.
Income Tax Information and Distributions to Shareholders. Each year, the Fund intends to qualify as a regulated investment company under Subchapter M of the Internal Revenue Code, including distributing substantially all of its taxable income and realized gains. As a result, no provision for U.S. Federal income taxes is required. As of August 31, 2022, the Fund did not have any unrecognized tax benefits in the financial statements; nor is the Fund aware of any tax positions for which it is reasonably possible that the total amounts of unrecognized tax benefits will significantly change in the next twelve months. The Fund files a U.S. federal tax return, in addition to state and local tax returns as required. The Fund's federal income tax returns are subject to examination by the Internal Revenue Service (IRS) for a period of three fiscal years after they are filed. State and local tax returns may be subject to examination for an additional fiscal year depending on the jurisdiction.
Distributions are declared and recorded daily and paid monthly from net investment income. Distributions from realized gains, if any, are declared and recorded on the ex-dividend date. Income and capital gain distributions are determined in accordance with income tax regulations, which may differ from GAAP.
Capital accounts within the financial statements are adjusted for permanent book-tax differences. These adjustments have no impact on net assets or the results of operations. Capital accounts are not adjusted for temporary book-tax differences which will reverse in a subsequent period.
Book-tax differences are primarily due to prior period premium and discount on debt securities, capital loss carryforwards and losses deferred due to wash sales.
As of period end, the cost and unrealized appreciation (depreciation) in securities, and derivatives if applicable, for federal income tax purposes were as follows:
| Gross unrealized appreciation | $2,563,749 |
| Gross unrealized depreciation | (35,395,403) |
| Net unrealized appreciation (depreciation) | $(32,831,654) |
| Tax Cost | $361,177,585 |
The tax-based components of distributable earnings as of period end were as follows:
| Capital loss carryforward | $(2,750,483) |
| Net unrealized appreciation (depreciation) on securities and other investments | $(32,831,653) |
Capital loss carryforwards are only available to offset future capital gains of the Fund to the extent provided by regulations and may be limited. The capital loss carryforward information presented below, including any applicable limitation, is estimated as of fiscal period end and is subject to adjustment.
| Short-term | $(751,491) |
| Long-term | (1,998,992) |
| Total capital loss carryforward | $(2,750,483) |
The tax character of distributions paid was as follows:
| | August 31, 2022 | August 31, 2021 |
| Ordinary Income | $18,419,491 | $ 20,185,985 |
| Long-term Capital Gains | 9,913,321 | 3,993,324 |
| Total | $28,332,812 | $ 24,179,309 |
Restricted Securities (including Private Placements). Funds may invest in securities that are subject to legal or contractual restrictions on resale. These securities generally may be resold in transactions exempt from registration or to the public if the securities are registered. Disposal of these securities may involve time-consuming negotiations and expense, and prompt sale at an acceptable price may be difficult. Information regarding restricted securities held at period end is included at the end of the Schedule of Investments, if applicable.
Loans and Other Direct Debt Instruments. Direct debt instruments are interests in amounts owed to lenders by corporate or other borrowers. These instruments may be in the form of loans, trade claims or other receivables and may include standby financing commitments such as revolving credit facilities that obligate a fund to supply additional cash to the borrower on demand. Loans may be acquired through assignment, participation, or may be made directly to a borrower. Such instruments are presented in the Bank Loan Obligations section in the Schedule of Investments. Certain funds may also invest in unfunded loan commitments, which are contractual obligations for future funding. Information regarding unfunded commitments is included at the end of the Schedule of Investments, if applicable.
4. Purchases and Sales of Investments.
Purchases and sales of securities, other than short-term securities and in-kind transactions, as applicable, are noted in the table below.
| | Purchases ($) | Sales ($) |
| Fidelity Specialized High Income Central Fund | 91,660,647 | 75,961,218 |
5. Fees and Other Transactions with Affiliates.
Management Fee and Expense Contract. Fidelity Management & Research Company LLC (the investment adviser) provides the Fund with investment management services. The Fund does not pay any fees for these services. Pursuant to the Fund's management contract, the investment adviser receives a monthly management fee that represents a portion of the management fees it receives from the Investing Funds. In addition, under an expense contract, the investment adviser also pays all other expenses of the Fund, excluding custody fees, the compensation of the independent Directors, and certain miscellaneous expenses such as proxy and shareholder meeting expenses.
Interfund Trades. Funds may purchase from or sell securities to other Fidelity Funds under procedures adopted by the Board. The procedures have been designed to ensure these interfund trades are executed in accordance with Rule 17a-7 of the 1940 Act. Any interfund trades are included within the respective purchases and sales amounts shown in the Purchases and Sales of Investments note. During the period, there were no interfund trades.
6. Expense Reductions.
Through arrangements with the Fund's custodian, credits realized as a result of certain uninvested cash balances were used to reduce the Fund's expenses by $96.
7. Other.
A fund's organizational documents provide former and current directors and officers with a limited indemnification against liabilities arising in connection with the performance of their duties to the fund. In the normal course of business, a fund may also enter into contracts that provide general indemnifications. A fund's maximum exposure under these arrangements is unknown as this would be dependent on future claims that may be made against a fund. The risk of material loss from such claims is considered remote.
At the end of the period, mutual funds managed by the investment adviser or its affiliates were the owners of record of all of the outstanding shares of the Fund.
8. Risk and Uncertainties.
Many factors affect a fund's performance. Developments that disrupt global economies and financial markets, such as pandemics, epidemics, outbreaks of infectious diseases, war, terrorism, and environmental disasters, may significantly affect a fund's investment performance. The effects of these developments to a fund will be impacted by the types of securities in which a fund invests, the financial condition, industry, economic sector, and geographic location of an issuer, and a fund's level of investment in the securities of that issuer.
Report of Independent Registered Public Accounting Firm
To the Board of Trustees of Fidelity Central Investment Portfolios LLC and the Shareholders of Fidelity Specialized High Income Central Fund
Opinion on the Financial Statements and Financial Highlights
We have audited the accompanying statement of assets and liabilities of Fidelity Specialized High Income Central Fund (the "Fund"), a fund of Fidelity Central Investment Portfolios LLC, including the schedule of investments, as of August 31, 2022, the related statement of operations for the year then ended, the statement of changes in net assets for each of the two years in the period then ended, the financial highlights for each of the five years in the period then ended, and the related notes. In our opinion, the financial statements and financial highlights present fairly, in all material respects, the financial position of the Fund as of August 31, 2022, and the results of its operations for the year then ended, the changes in its net assets for each of the two years in the period then ended, and the financial highlights for each of the five years in the period then ended in conformity with accounting principles generally accepted in the United States of America.
Basis for Opinion
These financial statements and financial highlights are the responsibility of the Fund's management. Our responsibility is to express an opinion on the Fund's financial statements and financial highlights based on our audits. We are a public accounting firm registered with the Public Company Accounting Oversight Board (United States) (PCAOB) and are required to be independent with respect to the Fund in accordance with the U.S. federal securities laws and the applicable rules and regulations of the Securities and Exchange Commission and the PCAOB.
We conducted our audits in accordance with the standards of the PCAOB. Those standards require that we plan and perform the audit to obtain reasonable assurance about whether the financial statements and financial highlights are free of material misstatement, whether due to error or fraud. The Fund is not required to have, nor were we engaged to perform, an audit of its internal control over financial reporting. As part of our audits we are required to obtain an understanding of internal control over financial reporting but not for the purpose of expressing an opinion on the effectiveness of the Fund’s internal control over financial reporting. Accordingly, we express no such opinion.
Our audits included performing procedures to assess the risks of material misstatement of the financial statements and financial highlights, whether due to error or fraud, and performing procedures that respond to those risks. Such procedures included examining, on a test basis, evidence regarding the amounts and disclosures in the financial statements and financial highlights. Our audits also included evaluating the accounting principles used and significant estimates made by management, as well as evaluating the overall presentation of the financial statements and financial highlights. Our procedures included confirmation of securities owned as of August 31, 2022, by correspondence with the custodian and brokers; when replies were not received from brokers, we performed other auditing procedures. We believe that our audits provide a reasonable basis for our opinion.
/s/ Deloitte & Touche LLP
Boston, Massachusetts
October 12, 2022
We have served as the auditor of one or more of the Fidelity investment companies since 1999.
Directors and Officers (Trustees and Officers)
The Trustees, Members of the Advisory Board (if any), and officers of the trust and fund, as applicable, are listed below. The Board of Trustees governs the fund and is responsible for protecting the interests of shareholders. The Trustees are experienced executives who meet periodically throughout the year to oversee the fund's activities, review contractual arrangements with companies that provide services to the fund, oversee management of the risks associated with such activities and contractual arrangements, and review the fund's performance. Each of the Trustees oversees 316 funds.
The Trustees hold office without limit in time except that (a) any Trustee may resign; (b) any Trustee may be removed by written instrument, signed by at least two-thirds of the number of Trustees prior to such removal; (c) any Trustee who requests to be retired or who has become incapacitated by illness or injury may be retired by written instrument signed by a majority of the other Trustees; and (d) any Trustee may be removed at any special meeting of shareholders by a two-thirds vote of the outstanding voting securities of the trust. Each Trustee who is not an interested person (as defined in the 1940 Act) of the trust and the fund is referred to herein as an Independent Trustee. Each Independent Trustee shall retire not later than the last day of the calendar year in which his or her 75th birthday occurs. The Independent Trustees may waive this mandatory retirement age policy with respect to individual Trustees. Officers and Advisory Board Members hold office without limit in time, except that any officer or Advisory Board Member may resign or may be removed by a vote of a majority of the Trustees at any regular meeting or any special meeting of the Trustees. Except as indicated, each individual has held the office shown or other offices in the same company for the past five years.
The fund’s Statement of Additional Information (SAI) includes more information about the Trustees. To request a free copy, call Fidelity at 1-800-544-8544.
Experience, Skills, Attributes, and Qualifications of the Trustees. The Governance and Nominating Committee has adopted a statement of policy that describes the experience, qualifications, attributes, and skills that are necessary and desirable for potential Independent Trustee candidates (Statement of Policy). The Board believes that each Trustee satisfied at the time he or she was initially elected or appointed a Trustee, and continues to satisfy, the standards contemplated by the Statement of Policy. The Governance and Nominating Committee also engages professional search firms to help identify potential Independent Trustee candidates who have the experience, qualifications, attributes, and skills consistent with the Statement of Policy. From time to time, additional criteria based on the composition and skills of the current Independent Trustees, as well as experience or skills that may be appropriate in light of future changes to board composition, business conditions, and regulatory or other developments, have also been considered by the professional search firms and the Governance and Nominating Committee. In addition, the Board takes into account the Trustees' commitment and participation in Board and committee meetings, as well as their leadership of standing and ad hoc committees throughout their tenure.
In determining that a particular Trustee was and continues to be qualified to serve as a Trustee, the Board has considered a variety of criteria, none of which, in isolation, was controlling. The Board believes that, collectively, the Trustees have balanced and diverse experience, qualifications, attributes, and skills, which allow the Board to operate effectively in governing the fund and protecting the interests of shareholders. Information about the specific experience, skills, attributes, and qualifications of each Trustee, which in each case led to the Board's conclusion that the Trustee should serve (or continue to serve) as a trustee of the fund, is provided below.
Board Structure and Oversight Function. Robert A. Lawrence is an interested person and currently serves as Chair. The Trustees have determined that an interested Chair is appropriate and benefits shareholders because an interested Chair has a personal and professional stake in the quality and continuity of services provided to the fund. Independent Trustees exercise their informed business judgment to appoint an individual of their choosing to serve as Chair, regardless of whether the Trustee happens to be independent or a member of management. The Independent Trustees have determined that they can act independently and effectively without having an Independent Trustee serve as Chair and that a key structural component for assuring that they are in a position to do so is for the Independent Trustees to constitute a substantial majority for the Board. The Independent Trustees also regularly meet in executive session. David M. Thomas serves as Lead Independent Trustee and as such (i) acts as a liaison between the Independent Trustees and management with respect to matters important to the Independent Trustees and (ii) with management prepares agendas for Board meetings.
Fidelity® funds are overseen by different Boards of Trustees. The fund's Board oversees Fidelity's high income and certain equity funds, and other Boards oversee Fidelity's investment-grade bond, money market, asset allocation, and other equity funds. The asset allocation funds may invest in Fidelity® funds overseen by the fund's Board. The use of separate Boards, each with its own committee structure, allows the Trustees of each group of Fidelity® funds to focus on the unique issues of the funds they oversee, including common research, investment, and operational issues. On occasion, the separate Boards establish joint committees to address issues of overlapping consequences for the Fidelity® funds overseen by each Board.
The Trustees operate using a system of committees to facilitate the timely and efficient consideration of all matters of importance to the Trustees, the fund, and fund shareholders and to facilitate compliance with legal and regulatory requirements and oversight of the fund's activities and associated risks. The Board, acting through its committees, has charged FMR and its affiliates with (i) identifying events or circumstances the occurrence of which could have demonstrably adverse effects on the fund's business and/or reputation; (ii) implementing processes and controls to lessen the possibility that such events or circumstances occur or to mitigate the effects of such events or circumstances if they do occur; and (iii) creating and maintaining a system designed to evaluate continuously business and market conditions in order to facilitate the identification and implementation processes described in (i) and (ii) above. Because the day-to-day operations and activities of the fund are carried out by or through FMR, its affiliates, and other service providers, the fund's exposure to risks is mitigated but not eliminated by the processes overseen by the Trustees. While each of the Board's committees has responsibility for overseeing different aspects of the fund's activities, oversight is exercised primarily through the Operations, Audit, and Compliance Committees. Appropriate personnel, including but not limited to the fund's Chief Compliance Officer (CCO), FMR's internal auditor, the independent accountants, the fund's Treasurer and portfolio management personnel, make periodic reports to the Board's committees, as appropriate, including an annual review of Fidelity's risk management program for the Fidelity® funds. The responsibilities of each standing committee, including their oversight responsibilities, are described further under "Standing Committees of the Trustees."
Interested Trustees*:
Correspondence intended for a Trustee who is an interested person may be sent to Fidelity Investments, 245 Summer Street, Boston, Massachusetts 02210.
Name, Year of Birth; Principal Occupations and Other Relevant Experience+
Bettina Doulton (1964)
Year of Election or Appointment: 2020
Trustee
Ms. Doulton also serves as Trustee of other Fidelity® funds. Prior to her retirement, Ms. Doulton served in a variety of positions at Fidelity Investments, including as a managing director of research (2006-2007), portfolio manager to certain Fidelity® funds (1993-2005), equity analyst and portfolio assistant (1990-1993), and research assistant (1987-1990). Ms. Doulton currently owns and operates Phi Builders + Architects and Cellardoor Winery. Previously, Ms. Doulton served as a member of the Board of Brown Capital Management, LLC (2014-2018).
Robert A. Lawrence (1952)
Year of Election or Appointment: 2020
Trustee
Chair of the Board of Trustees
Mr. Lawrence also serves as Trustee of other funds. Previously, Mr. Lawrence served as a Trustee and Member of the Advisory Board of certain funds. Prior to his retirement in 2008, Mr. Lawrence served as Vice President of certain Fidelity® funds (2006-2008), Senior Vice President, Head of High Income Division of Fidelity Management & Research Company (investment adviser firm, 2006-2008), and President of Fidelity Strategic Investments (investment adviser firm, 2002-2005).
* Determined to be an “Interested Trustee” by virtue of, among other things, his or her affiliation with the Fidelity Central Investment Portfolios LLC or various entities under common control with FMR.
+ The information includes the Trustee's principal occupation during the last five years and other information relating to the experience, attributes, and skills relevant to the Trustee's qualifications to serve as a Trustee, which led to the conclusion that the Trustee should serve as a Trustee for the fund.
Independent Trustees:
Correspondence intended for an Independent Trustee may be sent to Fidelity Investments, P.O. Box 55235, Boston, Massachusetts 02205-5235.
Name, Year of Birth; Principal Occupations and Other Relevant Experience+
Thomas P. Bostick (1956)
Year of Election or Appointment: 2021
Trustee
Lieutenant General Bostick also serves as Trustee of other Fidelity® funds. Prior to his retirement, General Bostick (United States Army, Retired) held a variety of positions within the U.S. Army, including Commanding General and Chief of Engineers, U.S. Army Corps of Engineers (2012-2016) and Deputy Chief of Staff and Director of Human Resources, U.S. Army (2009-2012). General Bostick currently serves as a member of the Board and Finance and Governance Committees of CSX Corporation (transportation, 2020-present) and a member of the Board and Corporate Governance and Nominating Committee of Perma-Fix Environmental Services, Inc. (nuclear waste management, 2020-present). General Bostick serves as Chief Executive Officer of Bostick Global Strategies, LLC (consulting, 2016-present) and as a member of the Board of HireVue, Inc. (video interview and assessment, 2020-present). Previously, General Bostick served as a Member of the Advisory Board of certain Fidelity® funds (2021), President, Intrexon Bioengineering (2018-2020) and Chief Operating Officer (2017-2020) and Senior Vice President of the Environment Sector (2016-2017) of Intrexon Corporation (biopharmaceutical company).
Dennis J. Dirks (1948)
Year of Election or Appointment: 2005
Trustee
Mr. Dirks also serves as Trustee of other Fidelity® funds. Prior to his retirement in May 2003, Mr. Dirks served as Chief Operating Officer and as a member of the Board of The Depository Trust & Clearing Corporation (financial markets infrastructure), President, Chief Operating Officer and a member of the Board of The Depository Trust Company (DTC), President and a member of the Board of the National Securities Clearing Corporation (NSCC), Chief Executive Officer and a member of the Board of the Government Securities Clearing Corporation and Chief Executive Officer and a member of the Board of the Mortgage-Backed Securities Clearing Corporation. Mr. Dirks currently serves as a member of the Finance Committee (2016-present) and Board (2017-present) and is Treasurer (2018-present) of the Asolo Repertory Theatre.
Donald F. Donahue (1950)
Year of Election or Appointment: 2018
Trustee
Mr. Donahue also serves as Trustee of other Fidelity® funds. Mr. Donahue serves as President and Chief Executive Officer of Miranda Partners, LLC (risk consulting for the financial services industry, 2012-present). Previously, Mr. Donahue served as Chief Executive Officer (2006-2012), Chief Operating Officer (2003-2006) and Managing Director, Customer Marketing and Development (1999-2003) of The Depository Trust & Clearing Corporation (financial markets infrastructure). Mr. Donahue currently serves as a member (2007-present) and Co-Chairman (2016-present) of the Board of United Way of New York and a member of the Board of The Leadership Academy (previously NYC Leadership Academy) (2012-present). Mr. Donahue previously served as a member of the Advisory Board of certain Fidelity® funds (2015-2018).
Vicki L. Fuller (1957)
Year of Election or Appointment: 2020
Trustee
Ms. Fuller also serves as Trustee of other Fidelity® funds. Previously, Ms. Fuller served as a member of the Advisory Board of certain Fidelity® funds (2018-2020), Chief Investment Officer of the New York State Common Retirement Fund (2012-2018) and held a variety of positions at AllianceBernstein L.P. (global asset management, 1985-2012), including Managing Director (2006-2012) and Senior Vice President and Senior Portfolio Manager (2001-2006). Ms. Fuller currently serves as a member of the Board, Audit Committee and Nominating and Governance Committee of two Blackstone business development companies (2020-present), as a member of the Board of Treliant, LLC (consulting, 2019-present), as a member of the Advisory Board of Ariel Alternatives, LLC (private equity, 2021-present) and as a member of the Board and Chair of the Audit Committee of Gusto, Inc. (software, 2021-present). In addition, Ms. Fuller currently serves as a member of the Board of Roosevelt University (2019-present) and as a member of the Executive Board of New York University’s Stern School of Business. Ms. Fuller previously served as a member of the Board, Audit Committee and Nominating and Governance Committee of The Williams Companies, Inc. (natural gas infrastructure, 2018-2021).
Patricia L. Kampling (1959)
Year of Election or Appointment: 2020
Trustee
Ms. Kampling also serves as Trustee of other Fidelity® funds. Prior to her retirement, Ms. Kampling served as Chairman of the Board and Chief Executive Officer (2012-2019), President and Chief Operating Officer (2011-2012) and Executive Vice President and Chief Financial Officer (2010-2011) of Alliant Energy Corporation. Ms. Kampling currently serves as a member of the Board, Finance Committee and Governance, Compensation and Nominating Committee of Xcel Energy Inc. (utilities company, 2020-present) and as a member of the Board, Audit, Finance and Risk Committee and Safety, Environmental, Technology and Operations Committee and Chair of the Executive Development and Compensation Committee of American Water Works Company, Inc. (utilities company, 2019-present). In addition, Ms. Kampling currently serves as a member of the Board of the Nature Conservancy, Wisconsin Chapter (2019-present). Previously, Ms. Kampling served as a Member of the Advisory Board of certain Fidelity® funds (2020), a member of the Board, Compensation Committee and Executive Committee and Chair of the Audit Committee of Briggs & Stratton Corporation (manufacturing, 2011-2021), a member of the Board of Interstate Power and Light Company (2012-2019) and Wisconsin Power and Light Company (2012-2019) (each a subsidiary of Alliant Energy Corporation) and as a member of the Board and Workforce Development Committee of the Business Roundtable (2018-2019).
Thomas A. Kennedy (1955)
Year of Election or Appointment: 2021
Trustee
Mr. Kennedy also serves as Trustee of other Fidelity® funds. Previously, Mr. Kennedy served as a Member of the Advisory Board of certain Fidelity® funds (2020) and held a variety of positions at Raytheon Company (aerospace and defense, 1983-2020), including Chairman and Chief Executive Officer (2014-2020) and Executive Vice President and Chief Operating Officer (2013-2014). Mr. Kennedy currently serves as Executive Chairman of the Board of Directors of Raytheon Technologies Corporation (aerospace and defense, 2020-present). He is also a member of the Rutgers School of Engineering Industry Advisory Board (2011-present) and a member of the UCLA Engineering Dean’s Executive Board (2016-present).
Oscar Munoz (1959)
Year of Election or Appointment: 2021
Trustee
Mr. Munoz also serves as Trustee of other Fidelity® funds. Prior to his retirement, Mr. Munoz served as Executive Chairman (2020-2021), Chief Executive Officer (2015-2020), President (2015-2016) and a member of the Board (2010-2021) of United Airlines Holdings, Inc. Mr. Munoz currently serves as a member of the Board of CBRE Group, Inc. (commercial real estate, 2020-present), a member of the Board of Univision Communications, Inc. (Hispanic media, 2020-present) and a member of the Advisory Board of Salesforce.com, Inc. (cloud-based software, 2020-present). Previously, Mr. Munoz served as a Member of the Advisory Board of certain Fidelity® funds (2021).
Garnett A. Smith (1947)
Year of Election or Appointment: 2018
Trustee
Mr. Smith also serves as Trustee of other Fidelity® funds. Prior to his retirement, Mr. Smith served as Chairman and Chief Executive Officer (1990-1997) and President (1986-1990) of Inbrand Corp. (manufacturer of personal absorbent products). Prior to his employment with Inbrand Corp., he was employed by a retail fabric chain and North Carolina National Bank (now Bank of America). Mr. Smith previously served as a member of the Advisory Board of certain Fidelity® funds (2012-2013).
David M. Thomas (1949)
Year of Election or Appointment: 2008
Trustee
Lead Independent Trustee
Mr. Thomas also serves as Trustee of other Fidelity® funds. Previously, Mr. Thomas served as Executive Chairman (2005-2006) and Chairman and Chief Executive Officer (2000-2005) of IMS Health, Inc. (pharmaceutical and healthcare information solutions). Mr. Thomas currently serves as a member of the Board of Fortune Brands Home and Security (home and security products, 2004-present) and as Director (2013-present) and Non-Executive Chairman of the Board (2022-present) of Interpublic Group of Companies, Inc. (marketing communication).
Susan Tomasky (1953)
Year of Election or Appointment: 2020
Trustee
Ms. Tomasky also serves as Trustee of other Fidelity® funds. Prior to her retirement, Ms. Tomasky served in various executive officer positions at American Electric Power Company, Inc. (1998-2011), including most recently as President of AEP Transmission (2007-2011). Ms. Tomasky currently serves as a member of the Board and Sustainability Committee and as Chair of the Audit Committee of Marathon Petroleum Corporation (2018-present) and as a member of the Board, Executive Committee, Corporate Governance Committee and Organization and Compensation Committee and as Chair of the Audit Committee of Public Service Enterprise Group, Inc. (utilities company, 2012-present) and as a member of the Board of its subsidiary company, Public Service Electric and Gas Co. (2021-present). In addition, Ms. Tomasky currently serves as a member (2009-present) and President (2020-present) of the Board of the Royal Shakespeare Company – America (2009-present), as a member of the Board of the Columbus Association for the Performing Arts (2011-present) and as a member of the Board and Kenyon in the World Committee of Kenyon College (2016-present). Previously, Ms. Tomasky served as a Member of the Advisory Board of certain Fidelity® funds (2020), as a member of the Board of the Columbus Regional Airport Authority (2007-2020), as a member of the Board (2011-2018) and Lead Independent Director (2015-2018) of Andeavor Corporation (previously Tesoro Corporation) (independent oil refiner and marketer) and as a member of the Board of Summit Midstream Partners LP (energy, 2012-2018).
Michael E. Wiley (1950)
Year of Election or Appointment: 2018
Trustee
Mr. Wiley also serves as Trustee of other Fidelity® funds. Previously, Mr. Wiley served as a member of the Advisory Board of certain Fidelity® funds (2018-2020), Chairman, President and CEO of Baker Hughes, Inc. (oilfield services, 2000-2004). Mr. Wiley also previously served as a member of the Board of Andeavor Corporation (independent oil refiner and marketer, 2005-2018), a member of the Board of Andeavor Logistics LP (natural resources logistics, 2015-2018) and a member of the Board of High Point Resources (exploration and production, 2005-2020).
+ The information includes the Trustee's principal occupation during the last five years and other information relating to the experience, attributes, and skills relevant to the Trustee's qualifications to serve as a Trustee, which led to the conclusion that the Trustee should serve as a Trustee for the fund.
Advisory Board Members and Officers:
Correspondence intended for a Member of the Advisory Board (if any) may be sent to Fidelity Investments, P.O. Box 55235, Boston, Massachusetts 02205-5235. Correspondence intended for an officer or Peter S. Lynch may be sent to Fidelity Investments, 245 Summer Street, Boston, Massachusetts 02210. Officers appear below in alphabetical order.
Name, Year of Birth; Principal Occupation
Peter S. Lynch (1944)
Year of Election or Appointment: 2004
Member of the Advisory Board
Mr. Lynch also serves as a Member of the Advisory Board of other Fidelity® funds. Mr. Lynch is Vice Chairman and a Director of Fidelity Management & Research Company LLC (investment adviser firm). In addition, Mr. Lynch serves as a Trustee of Boston College and as the Chairman of the Inner-City Scholarship Fund. Previously, Mr. Lynch served as Vice Chairman and a Director of FMR Co., Inc. (investment adviser firm) and on the Special Olympics International Board of Directors (1997-2006).
Craig S. Brown (1977)
Year of Election or Appointment: 2019
Assistant Treasurer
Mr. Brown also serves as an officer of other funds. Mr. Brown serves as Assistant Treasurer of FIMM, LLC (2021-present) and is an employee of Fidelity Investments (2013-present).
John J. Burke III (1964)
Year of Election or Appointment: 2018
Chief Financial Officer
Mr. Burke also serves as Chief Financial Officer of other funds. Mr. Burke serves as Head of Investment Operations for Fidelity Fund and Investment Operations (2018-present) and is an employee of Fidelity Investments (1998-present). Previously Mr. Burke served as head of Asset Management Investment Operations (2012-2018).
William C. Coffey (1969)
Year of Election or Appointment: 2019
Assistant Secretary
Mr. Coffey also serves as Assistant Secretary of other funds. He is Senior Vice President and Deputy General Counsel of FMR LLC (diversified financial services company, 2010-present), and is an employee of Fidelity Investments. Previously, Mr. Coffey served as Secretary and CLO of certain funds (2018-2019); CLO, Secretary, and Senior Vice President of Fidelity Management & Research Company and FMR Co., Inc. (investment adviser firms, 2018-2019); Secretary of Fidelity SelectCo, LLC and Fidelity Investments Money Management, Inc. (investment adviser firms, 2018-2019); CLO of Fidelity Management & Research (Hong Kong) Limited, FMR Investment Management (UK) Limited, and Fidelity Management & Research (Japan) Limited (investment adviser firms, 2018-2019); and Assistant Secretary of certain funds (2009-2018).
Timothy M. Cohen (1969)
Year of Election or Appointment: 2018
Vice President
Mr. Cohen also serves as Vice President of other funds. Mr. Cohen serves as Co-Head of Equity (2018-present), a Director of Fidelity Management & Research (Japan) Limited (investment adviser firm, 2016-present), and is an employee of Fidelity Investments. Previously, Mr. Cohen served as Executive Vice President of Fidelity SelectCo, LLC (2019), Head of Global Equity Research (2016-2018), Chief Investment Officer - Equity and a Director of Fidelity Management & Research (U.K.) Inc. (investment adviser firm, 2013-2015) and as a Director of Fidelity Management & Research (Hong Kong) Limited (investment adviser firm, 2017).
Jonathan Davis (1968)
Year of Election or Appointment: 2010
Assistant Treasurer
Mr. Davis also serves as an officer of other funds. Mr. Davis serves as Assistant Treasurer of FIMM, LLC (2021-present), FMR Capital, Inc. (2017-present), FD Funds GP LLC (2021-present), FD Funds Holding LLC (2021-present), and FD Funds Management LLC (2021-present); and is an employee of Fidelity Investments. Previously, Mr. Davis served as Vice President and Associate General Counsel of FMR LLC (diversified financial services company, 2003-2010).
Laura M. Del Prato (1964)
Year of Election or Appointment: 2018
Assistant Treasurer
Ms. Del Prato also serves as an officer of other funds. Ms. Del Prato serves as Assistant Treasurer of FIMM, LLC (2021-present) and is an employee of Fidelity Investments (2017-present). Previously, Ms. Del Prato served as President and Treasurer of The North Carolina Capital Management Trust: Cash Portfolio and Term Portfolio (2018-2020). Prior to joining Fidelity Investments, Ms. Del Prato served as a Managing Director and Treasurer of the JPMorgan Mutual Funds (2014-2017). Prior to JPMorgan, Ms. Del Prato served as a partner at Cohen Fund Audit Services (accounting firm, 2012-2013) and KPMG LLP (accounting firm, 2004-2012).
Colm A. Hogan (1973)
Year of Election or Appointment: 2020
Assistant Treasurer
Mr. Hogan also serves as an officer of other funds. Mr. Hogan serves as Assistant Treasurer of FIMM, LLC (2021-present) and FMR Capital, Inc. (2017-present) and is an employee of Fidelity Investments (2005-present). Previously, Mr. Hogan served as Deputy Treasurer of certain Fidelity® funds (2016-2020) and Assistant Treasurer of certain Fidelity® funds (2016-2018).
Pamela R. Holding (1964)
Year of Election or Appointment: 2018
Vice President
Ms. Holding also serves as Vice President of other funds. Ms. Holding serves as Co-Head of Equity (2018-present) and is an employee of Fidelity Investments (2013-present). Previously, Ms. Holding served as Executive Vice President of Fidelity SelectCo, LLC (2019) and as Chief Investment Officer of Fidelity Institutional Asset Management (2013-2018).
Cynthia Lo Bessette (1969)
Year of Election or Appointment: 2019
Secretary and Chief Legal Officer (CLO)
Ms. Lo Bessette also serves as an officer of other funds. Ms. Lo Bessette serves as CLO, Secretary, and Senior Vice President of Fidelity Management & Research Company LLC (investment adviser firm, 2019-present); CLO of Fidelity Management & Research (Hong Kong) Limited, FMR Investment Management (UK) Limited, and Fidelity Management & Research (Japan) Limited (investment adviser firms, 2019-present); Secretary of FD Funds GP LLC (2021-present), FD Funds Holding LLC (2021-present), and FD Funds Management LLC (2021-present); and Assistant Secretary of FIMM, LLC (2019-present). She is a Senior Vice President and Deputy General Counsel of FMR LLC (diversified financial services company, 2019-present), and is an employee of Fidelity Investments. Previously, Ms. Lo Bessette served as CLO, Secretary, and Senior Vice President of FMR Co., Inc. (investment adviser firm, 2019); Secretary of Fidelity SelectCo, LLC and Fidelity Investments Money Management, Inc. (investment adviser firms, 2019). Prior to joining Fidelity Investments, Ms. Lo Bessette was Executive Vice President, General Counsel (2016-2019) and Senior Vice President, Deputy General Counsel (2015-2016) of OppenheimerFunds (investment management company) and Deputy Chief Legal Officer (2013-2015) of Jennison Associates LLC (investment adviser firm).
Chris Maher (1972)
Year of Election or Appointment: 2020
Deputy Treasurer
Mr. Maher also serves as an officer of other funds. Mr. Maher serves as Assistant Treasurer of FIMM, LLC (2021-present) and FMR Capital, Inc. (2017-present), and is an employee of Fidelity Investments (2008-present). Previously, Mr. Maher served as Assistant Treasurer of certain funds (2013-2020); Vice President of Asset Management Compliance (2013), Vice President of the Program Management Group of FMR (investment adviser firm, 2010-2013), and Vice President of Valuation Oversight (2008-2010).
Jason P. Pogorelec (1975)
Year of Election or Appointment: 2020
Chief Compliance Officer
Mr. Pogorelec also serves as Chief Compliance Officer of other funds. Mr. Pogorelec is a senior Vice President of Asset Management Compliance for Fidelity Investments and is an employee of Fidelity Investments (2006-present). Previously, Mr. Pogorelec served as Vice President, Associate General Counsel for Fidelity Investments (2010-2020) and Assistant Secretary of certain Fidelity funds (2015-2020).
Brett Segaloff (1972)
Year of Election or Appointment: 2021
Anti-Money Laundering (AML) Officer
Mr. Segaloff also serves as an AML Officer of other funds and other related entities. He is Director, Anti-Money Laundering (2007-present) of FMR LLC (diversified financial services company) and is an employee of Fidelity Investments (1996-present).
Stacie M. Smith (1974)
Year of Election or Appointment: 2016
President and Treasurer
Ms. Smith also serves as an officer of other funds. Ms. Smith serves as Assistant Treasurer of FIMM, LLC (2021-present) and FMR Capital, Inc. (2017-present), is an employee of Fidelity Investments (2009-present), and has served in other fund officer roles. Prior to joining Fidelity Investments, Ms. Smith served as Senior Audit Manager of Ernst & Young LLP (accounting firm, 1996-2009). Previously, Ms. Smith served as Assistant Treasurer (2013-2019) and Deputy Treasurer (2013-2016) of certain Fidelity® funds.
Jim Wegmann (1979)
Year of Election or Appointment: 2019
Assistant Treasurer
Mr. Wegmann also serves as an officer of other funds. Mr. Wegmann serves as Assistant Treasurer of FIMM, LLC (2021-present) and is an employee of Fidelity Investments (2011-present). Previously, Mr. Wegmann served as Assistant Treasurer of certain Fidelity® funds (2019-2021).
Shareholder Expense Example
As a shareholder, you incur two types of costs: (1) transaction costs, which may include sales charges (loads) on purchase payments or redemption proceeds, as applicable and (2) ongoing costs, which generally include management fees, distribution and/or service (12b-1) fees and other Fund expenses. This Example is intended to help you understand your ongoing costs (in dollars) of investing in a fund and to compare these costs with the ongoing costs of investing in other mutual funds.
The Example is based on an investment of $1,000 invested at the beginning of the period and held for the entire period (March 1, 2022 to August 31, 2022).
Actual Expenses
The first line of the accompanying table provides information about actual account values and actual expenses. You may use the information in this line, together with the amount you invested, to estimate the expenses that you paid over the period. Simply divide your account value by $1,000.00 (for example, an $8,600 account value divided by $1,000.00 = 8.6), then multiply the result by the number in the first line for a class/Fund under the heading entitled "Expenses Paid During Period" to estimate the expenses you paid on your account during this period. If any fund is a shareholder of any underlying mutual funds or exchange-traded funds (ETFs) (the Underlying Funds), such fund indirectly bears its proportional share of the expenses of the Underlying Funds in addition to the direct expenses incurred presented in the table. These fees and expenses are not included in the annualized expense ratio used to calculate the expense estimate in the table below.
Hypothetical Example for Comparison Purposes
The second line of the accompanying table provides information about hypothetical account values and hypothetical expenses based on the actual expense ratio and an assumed rate of return of 5% per year before expenses, which is not the actual return. The hypothetical account values and expenses may not be used to estimate the actual ending account balance or expenses you paid for the period. You may use this information to compare the ongoing costs of investing in the Fund and other funds. To do so, compare this 5% hypothetical example with the 5% hypothetical examples that appear in the shareholder reports of the other funds. If any fund is a shareholder of any Underlying Funds, such fund indirectly bears its proportional share of the expenses of the Underlying Funds in addition to the direct expenses as presented in the table. These fees and expenses are not included in the annualized expense ratio used to calculate the expense estimate in the table below.
Please note that the expenses shown in the table are meant to highlight your ongoing costs only and do not reflect any transaction costs. Therefore, the second line of the table is useful in comparing ongoing costs only, and will not help you determine the relative total costs of owning different funds. In addition, if these transactional costs were included, your costs would have been higher.
| | Annualized Expense Ratio-A | Beginning
Account Value
March 1, 2022 | Ending
Account Value
August 31, 2022 | Expenses Paid
During Period-B
March 1, 2022
to August 31, 2022 |
| Fidelity Specialized High Income Central Fund | .0004% | | | |
| Actual | | $1,000.00 | $933.60 | $--C |
| Hypothetical-D | | $1,000.00 | $1,025.20 | $--C |
A Annualized expense ratio reflects expenses net of applicable fee waivers.
B Expenses are equal to the annualized expense ratio, multiplied by the average account value over the period, multiplied by 184/ 365 (to reflect the one-half year period). The fees and expenses of any Underlying Funds are not included in each annualized expense ratio.
C Amount Represents less than $.005.
D 5% return per year before expenses
Distributions (Unaudited)
The dividend and capital gains distributions for the fund(s) are available on Fidelity.com or Institutional.Fidelity.com.
A total of 0.01% of the dividends distributed during the fiscal year was derived from interest on U.S. Government securities which is generally exempt from state income tax.
The fund designates $13,712,012 of distributions paid in the calendar year 2021 as qualifying to be taxed as interest-related dividends for nonresident alien shareholders.
The fund designates 100% of the short-term capital gain dividends distributed in October 2021 as qualifying to be taxed as short-term capital gain dividends for nonresident alien shareholders.
The fund designates $17,171,598 of distributions paid in the calendar year 2021 as qualifying to be taxed as section 163(j) interest dividends.
The fund will notify shareholders in January 2023 of amounts for use in preparing 2022 income tax returns.
Board Approval of Investment Advisory Contracts and Management Fees
Fidelity Specialized High Income Central Fund
Each year, the Board of Directors, including the Independent Directors (together, the Board), votes on the renewal of the management contract with Fidelity Management & Research Company LLC (FMR) and the sub-advisory agreements (together, the Advisory Contracts) for the fund. FMR and the sub-advisers are referred to herein as the Investment Advisers. The Board, assisted by the advice of fund counsel and Independent Directors' counsel, requests and considers a broad range of information relevant to the renewal of the Advisory Contracts throughout the year.
The Board meets regularly and, at each of its meetings, covers an extensive agenda of topics and materials and considers factors that are relevant to its annual consideration of the renewal of the fund's Advisory Contracts, including the services and support provided to the fund and its shareholders. The Board has established various standing committees (Committees), each composed of and chaired by Independent Directors with varying backgrounds, to which the Board has assigned specific subject matter responsibilities in order to enhance effective decision-making by the Board. The Board, acting directly and through its Committees, requests and receives information concerning the annual consideration of the renewal of the fund's Advisory Contracts. The Board also meets as needed to review matters specifically related to the Board's annual consideration of the renewal of the Advisory Contracts. Members of the Board may also meet with trustees of other Fidelity funds through joint ad hoc committees to discuss certain matters relevant to all of the Fidelity funds.
At its May 2022 meeting, the Board unanimously determined to renew the fund's Advisory Contracts. In reaching its determination, the Board considered all factors it believed relevant and reached a determination, with the assistance of fund counsel and Independent Directors' counsel and through the exercise of its business judgment, that the renewal of the Advisory Contracts was in the best interests of the fund and its shareholders and the fact that no fee is payable under the management contract was fair and reasonable.
Nature, Extent, and Quality of Services Provided. The Board considered Fidelity's staffing as it relates to the fund, including the backgrounds of investment personnel of Fidelity, and also considered the fund's investment objective, strategies, and related investment philosophy. The Independent Directors also had discussions with senior management of Fidelity's investment operations and investment groups. The Board considered the structure of the investment personnel compensation program and whether this structure provides appropriate incentives to act in the best interests of the fund. The Board also considered the steps Fidelity had taken to ensure the continued provision of high quality services to the Fidelity funds during the COVID-19 pandemic, including the expansion of staff in client facing positions to maintain service levels in periods of high volumes and volatility.
Resources Dedicated to Investment Management and Support Services. The Board and the Fund Oversight and Research Committees reviewed the general qualifications and capabilities of Fidelity's investment staff, including its size, education, experience, and resources, as well as Fidelity's approach to recruiting, training, managing, and compensating investment personnel. The Board noted the resources devoted to expansion of Fidelity's global investment organization, and that Fidelity's analysts have extensive resources, tools, and capabilities that allow them to conduct sophisticated quantitative and fundamental analysis, as well as credit analysis of issuers, counterparties, and guarantors. Further, the Board considered that Fidelity's investment professionals have sufficient access to global information and data so as to provide competitive investment results over time, and that those professionals also have access to sophisticated tools that permit them to assess portfolio construction and risk and performance attribution characteristics continuously, as well as to transmit new information and research conclusions rapidly around the world. Additionally, in its deliberations, the Board considered Fidelity's trading, risk management, compliance, and technology and operations capabilities and resources, which are integral parts of the investment management process.
Administrative Services. The Board considered (i) the nature, extent, quality, and cost of advisory and administrative services performed by the Investment Advisers and their affiliates under the Advisory Contracts and under separate agreements covering transfer agency, pricing and bookkeeping, and securities lending services for the fund; (ii) the nature and extent of the supervision of third party service providers, principally custodians, subcustodians, and pricing vendors; and (iii) the resources devoted to, and the record of compliance with, the fund's compliance policies and procedures. The Board also reviewed the allocation of fund brokerage, including allocations to brokers affiliated with the Investment Advisers, and the use of "soft" commission dollars to pay for research services.
Investment Performance. The Board considered whether the fund has operated in accordance with its investment objective, as well as its record of compliance with its investment restrictions. The Board reviewed the fund's absolute investment performance, as well as the fund's relative investment performance, and considered the fund's underperformance for different time periods ended December 31, 2021. The Board did not consider performance to be a material factor in its decision to renew the fund's Advisory Contracts, as the fund is not publicly offered as a stand-alone investment product. In this regard, the Board noted that the fund is designed to offer a liquid investment option for other investment companies managed by Fidelity and ultimately to enhance the performance of those investment companies.
Based on its review, the Board concluded that the nature, extent, and quality of services provided to the fund under the Advisory Contracts should continue to benefit the shareholders of the fund.
Competitiveness of Management Fee and Total Expense Ratio. The Board considered that while the fund does not pay a management fee, FMR receives fees for providing services to funds that invest in the fund. The Board also noted that FMR bears all expenses of the fund with certain limited exceptions (i.e., custody fees, interest, taxes, fees and expenses of the Independent Trustees, proxy and shareholder meeting expenses, and extraordinary expenses). The Board further noted that the fund pays its non-operating expenses, including brokerage commissions and fees and expenses associated with the fund's securities lending program, if applicable. Based on its review, the Board concluded that the management fee received for providing services to the fund and the fund's total expense ratio were reasonable in light of the services that the fund and its shareholders receive and the other factors considered.
Costs of the Services and Profitability. The Board considered the level of Fidelity's profits in respect of all the Fidelity funds, as well as the profitability of the funds that invest in the fund.
A public accounting firm has been engaged annually by the Board as part of the Board's assessment of Fidelity's profitability analysis. The engagement includes the review and assessment of the methodologies used by Fidelity in determining the revenues and expenses attributable to Fidelity's mutual fund business, and completion of agreed-upon procedures in respect of the mathematical accuracy of certain fund profitability information and its conformity to established allocation methodologies. After considering the reports issued under the engagement and information provided by Fidelity, the Board concluded that while other allocation methods may also be reasonable, Fidelity's profitability methodologies are reasonable in all material respects.
The Board also reviewed Fidelity's non-fund businesses and potential indirect benefits such businesses may have received as a result of their association with Fidelity's mutual fund business (i.e., fall-out benefits) as well as cases where Fidelity's affiliates may benefit from the funds' business. The Board considered areas where potential indirect benefits to the Fidelity funds from their relationships with Fidelity may exist. The Board's consideration of these matters was informed by the findings of a joint ad hoc committee created by it and the boards of other Fidelity funds to evaluate potential fall-out benefits.
The Board concluded that the costs of the services provided by and the profits realized by Fidelity in connection with the operation of the fund were not relevant to the renewal of the Advisory Contracts because the fund pays no advisory fees and FMR bears all expenses of the fund with certain exceptions.
Economies of Scale. The Board concluded that because the fund pays no advisory fees and FMR bears all expenses of the fund with certain exceptions, the realization of economies of scale was not a material factor in the Board's decision to renew the fund's Advisory Contract.
Additional Information Requested by the Board. In order to develop fully the factual basis for consideration of the Fidelity funds' advisory contracts, the Board requested and received additional information on certain topics, including: (i) fund flow and performance trends, in particular the underperformance of certain funds and strategies, and Fidelity's long-term strategies for certain funds, including any consideration of fund liquidations or mergers; (ii) the operation of performance fees, competitor use of performance fees, and consideration of the expansion of performance fees to additional funds; (iii) Fidelity's pricing philosophy compared to competitors; (iv) fund profitability methodology and data; (v) evaluation of competitive fund data and peer group classifications and fee and expense comparisons; (vi) the management fee and expense structures for different funds and classes and information about the differences between various fee and expense structures; (vii) group fee breakpoints and related voluntary fee waivers; and (viii) information regarding other accounts managed by Fidelity and the funds' sub-advisory arrangements.
Based on its evaluation of all of the conclusions noted above, and after considering all factors it believed relevant, the Board concluded that the advisory fee arrangements are fair and reasonable, and that the fund's Advisory Contracts should be renewed.
SHI-ANN-1022
1.820817.117
Item 2.
Code of Ethics
As of the end of the period, August 31, 2022, Fidelity Central Investment Portfolios LLC (the trust) has adopted a code of ethics, as defined in Item 2 of Form N-CSR, that applies to its President and Treasurer and its Chief Financial Officer. A copy of the code of ethics is filed as an exhibit to this Form N-CSR.
Item 3.
Audit Committee Financial Expert
The Board of Trustees of the trust has determined that Donald F. Donahue is an audit committee financial expert, as defined in Item 3 of Form N-CSR. Mr. Donahue is independent for purposes of Item 3 of Form N-CSR.
Item 4.
Principal Accountant Fees and Services
Fees and Services
The following table presents fees billed by Deloitte & Touche LLP, the member firms of Deloitte Touche Tohmatsu, and their respective affiliates (collectively, “Deloitte Entities”) in each of the last two fiscal years for services rendered to Fidelity High Income Central Fund and Fidelity Specialized High Income Central Fund (the “Funds”):
Services Billed by Deloitte Entities
August 31, 2022 FeesA
| | | | |
| Audit Fees | Audit-Related Fees | Tax Fees | All Other Fees |
Fidelity High Income Central Fund | $50,400 | $- | $9,600 | $1,200 |
Fidelity Specialized High Income Central Fund | $54,000 | $- | $9,400 | $1,300 |
| | | | |
| Audit Fees | Audit-Related Fees | Tax Fees | All Other Fees |
Fidelity High Income Central Fund | $51,000 | $- | $8,500 | $1,200 |
Fidelity Specialized High Income Central Fund | $52,500 | $- | $8,500 | $1,300 |
A Amounts may reflect rounding.
The following table(s) present(s) fees billed by Deloitte Entities that were required to be approved by the Audit Committee for services that relate directly to the operations and financial reporting of the Fund(s) and that are rendered on behalf of Fidelity Management & Research Company LLC ("FMR") and entities controlling, controlled by, or under common control with FMR (not including any sub-adviser whose role is primarily portfolio management and is subcontracted with or overseen by another investment adviser) that provide ongoing services to the Fund(s) (“Fund Service Providers”):
Services Billed by Deloitte Entities
| | |
| August 31, 2022A | August 31, 2021A |
Audit-Related Fees | $- | $- |
Tax Fees | $- | $- |
All Other Fees | $- | $- |
A Amounts may reflect rounding.
“Audit-Related Fees” represent fees billed for assurance and related services that are reasonably related to the performance of the fund audit or the review of the fund's financial statements and that are not reported under Audit Fees.
“Tax Fees” represent fees billed for tax compliance, tax advice or tax planning that relate directly to the operations and financial reporting of the fund.
“All Other Fees” represent fees billed for services provided to the fund or Fund Service Provider, a significant portion of which are assurance related, that relate directly to the operations and financial reporting of the fund, excluding those services that are reported under Audit Fees, Audit-Related Fees or Tax Fees.
Assurance services must be performed by an independent public accountant.
* * *
The aggregate non-audit fees billed by Deloitte Entities for services rendered to the Fund(s), FMR (not including any sub-adviser whose role is primarily portfolio management and is subcontracted with or overseen by another investment adviser), and any Fund Service Provider for each of the last two fiscal years of the Fund(s) are as follows:
| | |
Billed By | August 31, 2022A | August 31, 2021A |
Deloitte Entities | $479,100 | $541,100 |
A Amounts may reflect rounding.
The trust's Audit Committee has considered non-audit services that were not pre-approved that were provided by Deloitte Entities to Fund Service Providers to be compatible with maintaining the independence of Deloitte Entities in its(their) audit of the Fund(s), taking into account representations from Deloitte Entities, in accordance with Public Company Accounting Oversight Board rules, regarding its independence from the Fund(s) and its(their) related entities and FMR’s review of the appropriateness and permissibility under applicable law of such non-audit services prior to their provision to the Fund(s) Service Providers.
Audit Committee Pre-Approval Policies and Procedures
The trust’s Audit Committee must pre-approve all audit and non-audit services provided by a fund’s independent registered public accounting firm relating to the operations or financial reporting of the fund. Prior to the commencement of any audit or non-audit services to a fund, the Audit Committee reviews the services to determine whether they are appropriate and permissible under applicable law.
The Audit Committee has adopted policies and procedures to, among other purposes, provide a framework for the Committee’s consideration of non-audit services by the audit firms that audit the Fidelity funds. The policies and procedures require that any non-audit service provided by a fund audit firm to a Fidelity fund and any non-audit service provided by a fund auditor to a Fund Service Provider that relates directly to the operations and financial reporting of a Fidelity fund (“Covered Service”) are subject to approval by the Audit Committee before such service is provided.
All Covered Services must be approved in advance of provision of the service either: (i) by formal resolution of the Audit Committee, or (ii) by oral or written approval of the service by the Chair of the Audit Committee (or if the Chair is unavailable, such other member of the Audit Committee as may be designated by the Chair to act in the Chair’s absence). The approval contemplated by (ii) above is permitted where the Treasurer determines that action on such an engagement is necessary before the next meeting of the Audit Committee.
Non-audit services provided by a fund audit firm to a Fund Service Provider that do not relate directly to the operations and financial reporting of a Fidelity fund are reported to the Audit Committee periodically.
Non-Audit Services Approved Pursuant to Rule 2-01(c)(7)(i)(C) and (ii) of Regulation S-X (“De Minimis Exception”)
There were no non-audit services approved or required to be approved by the Audit Committee pursuant to the De Minimis Exception during the Fund’s(s’) last two fiscal years relating to services provided to (i) the Fund(s) or (ii) any Fund Service Provider that relate directly to the operations and financial reporting of the Fund(s).
Item 5.
Audit Committee of Listed Registrants
Not applicable.
Item 6.
Investments
(a)
Not applicable.
(b)
Not applicable.
Item 7.
Disclosure of Proxy Voting Policies and Procedures for Closed-End Management Investment Companies
Not applicable.
Item 8.
Portfolio Managers of Closed-End Management Investment Companies
Not applicable.
Item 9.
Purchase of Equity Securities by Closed-End Management Investment Company and Affiliated Purchasers
Not applicable.
Item 10.
Submission of Matters to a Vote of Security Holders
There were no material changes to the procedures by which shareholders may recommend nominees to the trust’s Board of Trustees.
Item 11.
Controls and Procedures
(a)(i) The President and Treasurer and the Chief Financial Officer have concluded that the trust’s disclosure controls and procedures (as defined in Rule 30a-3(c) under the Investment Company Act) provide reasonable assurances that material information relating to the trust is made known to them by the appropriate persons, based on their evaluation of these controls and procedures as of a date within 90 days of the filing date of this report.
(a)(ii) There was no change in the trust’s internal control over financial reporting (as defined in Rule 30a-3(d) under the Investment Company Act) that occurred during the period covered by this report that has materially affected, or is reasonably likely to materially affect, the trust’s internal control over financial reporting.
Item 12.
Disclosure of Securities Lending Activities for Closed-End Management
Investment Companies
Not applicable.
Item 13.
Exhibits
SIGNATURES
Pursuant to the requirements of the Securities Exchange Act of 1934 and the Investment Company Act of 1940, the registrant has duly caused this report to be signed on its behalf by the undersigned, thereunto duly authorized.
Fidelity Central Investment Portfolios LLC
| |
By: | /s/Stacie M. Smith |
| Stacie M. Smith |
| President and Treasurer |
|
|
Date: | October 20, 2022 |
Pursuant to the requirements of the Securities Exchange Act of 1934 and the Investment Company Act of 1940, this report has been signed below by the following persons on behalf of the registrant and in the capacities and on the dates indicated.
| |
By: | /s/Stacie M. Smith |
| Stacie M. Smith |
| President and Treasurer |
|
|
Date: | October 20, 2022 |
| |
By: | /s/John J. Burke III |
| John J. Burke III |
| Chief Financial Officer |
|
|
Date: | October 20, 2022 |