UNITED STATES
SECURITIES AND EXCHANGE COMMISSION
Washington, D.C. 20549
FORM N-CSR
CERTIFIED SHAREHOLDER REPORT OF REGISTERED
MANAGEMENT INVESTMENT COMPANIES
Investment Company Act file number 811-21667
Fidelity Central Investment Portfolios LLC
(Exact name of registrant as specified in charter)
245 Summer St., Boston, Massachusetts 02210
(Address of principal executive offices) (Zip code)
Margaret Carey, Secretary
245 Summer St.
Boston, Massachusetts 02210
(Name and address of agent for service)
Registrant's telephone number, including area code:
617-563-7000
| |
Date of fiscal year end: | June 30 |
|
|
Date of reporting period: | June 30, 2023 |
Item 1.
Reports to Stockholders
Fidelity® U.S. Equity Central Fund
Annual Report
June 30, 2023
Contents
To view a fund's proxy voting guidelines and proxy voting record for the 12-month period ended June 30, visit http://www.fidelity.com/proxyvotingresults or visit the Securities and Exchange Commission's (SEC) web site at http://www.sec.gov.
You may also call 1-800-544-8544 to request a free copy of the proxy voting guidelines.
Standard & Poor's, S&P and S&P 500 are registered service marks of The McGraw-Hill Companies, Inc. and have been licensed for use by Fidelity Distributors Corporation.
Other third-party marks appearing herein are the property of their respective owners.
All other marks appearing herein are registered or unregistered trademarks or service marks of FMR LLC or an affiliated company. © 2023 FMR LLC. All rights reserved.
A fund files its complete schedule of portfolio holdings with the SEC for the first and third quarters of each fiscal year on Form N-PORT. Forms N-PORT are available on the SEC's web site at http://www.sec.gov. A fund's Forms N-PORT may be reviewed and copied at the SEC's Public Reference Room in Washington, DC. Information regarding the operation of the SEC's Public Reference Room may be obtained by calling 1-800-SEC-0330.
A fund files its complete schedule of portfolio holdings with the SEC for the first and third quarters of each fiscal year on Form N-PORT. Forms N-PORT are available on the SEC's web site at http://www.sec.gov. A fund's Forms N-PORT may be reviewed and copied at the SEC's Public Reference Room in Washington, DC. Information regarding the operation of the SEC's Public Reference Room may be obtained by calling 1-800-SEC-0330.
Average annual total return reflects the change in the value of an investment, assuming reinvestment of distributions from dividend income and capital gains (the profits earned upon the sale of securities that have grown in value, if any) and assuming a constant rate of performance each year. The hypothetical investment and the average annual total returns do not reflect the deduction of taxes that a shareholder would pay on fund distributions or the redemption of fund shares. During periods of reimbursement by Fidelity, a fund's total return will be greater than it would be had the reimbursement not occurred. How a fund did yesterday is no guarantee of how it will do tomorrow.
| Average Annual Total Returns |
| | | | |
Periods ended June 30, 2023 | Past 1 year | Life of Fund A |
| Fidelity® U.S. Equity Central Fund | 20.95% | 12.00% |
A From September 18, 2020
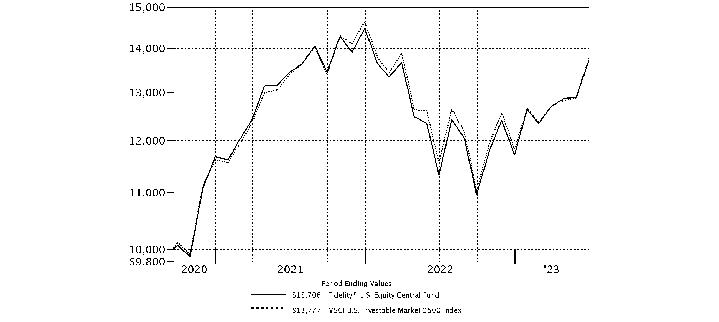
| $10,000 Over Life of Fund |
| |
Let's say hypothetically that $10,000 was invested in Fidelity® U.S. Equity Central Fund, on September 18, 2020, when the fund started. The chart shows how the value of your investment would have changed, and also shows how the MSCI U.S. Investable Market 2500 Index performed over the same period. |
|
|
Market Recap:
U.S. equities gained 19.59% for the 12 months ending June 30, 2023, according to the S&P 500 ® index, as continued global economic expansion, falling commodity prices and a slowing in the pace of inflation provided a favorable backdrop for risk assets. U.S. large-cap stocks spearheaded the rally, which was driven by the shares of a narrow set of mega-cap companies concentrated in the information technology and communication services sectors, largely due to exuberance related to artificial intelligence. Aggressive monetary tightening by major central banks, including the U.S. Federal Reserve, continued amid signs of consistent pressure on core inflation, a closely watched measure that excludes food and energy. Since March 2022, the Fed has hiked its benchmark interest rate 10 times, by 5 percentage points - the fastest-ever pace of monetary tightening - while also shrinking its massive asset portfolio. The latest bump came in early May, a third consecutive raise of a stepped down 25 basis points. In June, the Fed held interest rates steady and signaled it was prepared to raise rates next month if the economy and inflation don't cool more. The S&P 500 ® gained 6.61% for the month, raising hopes for a "soft landing" of the economy and bringing the index's year-to-date result to 16.89%. June saw the long-awaited return of market breadth and lower dispersion. Smaller-cap stocks had a particularly strong month, achieving the best result for the category since January. For the full 12 months, value stocks (+19.99%) topped growth (+18.25%). All 11 sectors in the index gained strongly over the period. Information technology (+42%), consumer discretionary and industrials (+25% each) led, while real estate and utilities (-4% each) lagged most.
Comments from Portfolio Manager Christopher Lee:
For the fiscal year ending June 30, 2023, the fund gained 20.95%, outperforming the 19.23% advance of the benchmark MSCI US Investable Market 2500 Index. Versus the benchmark, security selection was the primary contributor, led by strong picks within the health care sector. Investment choices among communication services companies also bolstered the portfolio's relative result. The largest individual relative contributor was an outsized stake in Penumbra, which gained approximately 175% the past year. The decision to avoid the shares of Pfizer, a benchmark component that returned about -27%, proved beneficial as well. Not owning Johnson & Johnson, a benchmark component that returned -4%, also helped. Conversely, the biggest detractor from performance versus the benchmark was security selection in information technology. The fund's largest individual relative detractor was our smaller-than-benchmark stake in Nvidia, which increased roughly 179% the past 12 months. The company was among the biggest holdings as of June 30. Avoiding Broadcom, a benchmark component that gained 84%, also hurt relative performance, as did not owning General Electric, a benchmark component that rose 123%. Notable changes in positioning this period include increased exposure to the industrials sector.
Note to shareholders:
On August 1, 2022, Chris Lee assumed co-management responsibilities for the fund, joining Robert Stansky. After nearly four decades with Fidelity, Robert Stansky retired from Fidelity on December 31, 2022. On January 1, 2023, Lee assumed Stansky's responsibilities for the fund.
The views expressed above reflect those of the portfolio manager(s) only through the end of the period as stated on the cover of this report and do not necessarily represent the views of Fidelity or any other person in the Fidelity organization. Any such views are subject to change at any time based upon market or other conditions and Fidelity disclaims any responsibility to update such views. These views may not be relied on as investment advice and, because investment decisions for a Fidelity fund are based on numerous factors, may not be relied on as an indication of trading intent on behalf of any Fidelity fund.
Top Holdings (% of Fund's net assets) |
| |
| Microsoft Corp. | 6.9 | |
| Apple, Inc. | 5.8 | |
| Alphabet, Inc. Class A | 3.5 | |
| Amazon.com, Inc. | 3.1 | |
| Exxon Mobil Corp. | 1.8 | |
| Meta Platforms, Inc. Class A | 1.7 | |
| JPMorgan Chase & Co. | 1.5 | |
| NVIDIA Corp. | 1.5 | |
| Tesla, Inc. | 1.4 | |
| Visa, Inc. Class A | 1.3 | |
| | 28.5 | |
| |
| Market Sectors (% of Fund's net assets) |
| |
| Information Technology | 25.1 | |
| Health Care | 13.0 | |
| Financials | 12.6 | |
| Consumer Discretionary | 10.5 | |
| Industrials | 10.2 | |
| Communication Services | 8.5 | |
| Consumer Staples | 6.7 | |
| Energy | 4.2 | |
| Real Estate | 2.9 | |
| Materials | 2.7 | |
| Utilities | 2.5 | |
| |
Asset Allocation (% of Fund's net assets) |
|
Futures - 0.2% |
|
Showing Percentage of Net Assets
| Common Stocks - 98.4% |
| | | Shares | Value ($) |
| COMMUNICATION SERVICES - 8.4% | | | |
| Diversified Telecommunication Services - 0.1% | | | |
| AT&T, Inc. | | 89,800 | 1,432,310 |
| Liberty Global PLC Class C (a) | | 592,218 | 10,523,714 |
| | | | 11,956,024 |
| Entertainment - 1.8% | | | |
| Activision Blizzard, Inc. | | 353,825 | 29,827,448 |
| Cinemark Holdings, Inc. (a)(b) | | 441,500 | 7,284,750 |
| Electronic Arts, Inc. | | 305,196 | 39,583,921 |
| Endeavor Group Holdings, Inc. (a) | | 123,100 | 2,944,552 |
| Lions Gate Entertainment Corp.: | | | |
| Class A (a)(b) | | 89,400 | 789,402 |
| Class B (a) | | 483,026 | 4,033,267 |
| Marcus Corp. (b) | | 344,000 | 5,101,520 |
| Netflix, Inc. (a) | | 260,605 | 114,793,896 |
| Sea Ltd. ADR (a) | | 143,500 | 8,328,740 |
| Take-Two Interactive Software, Inc. (a) | | 143,860 | 21,170,438 |
| The Walt Disney Co. (a) | | 491,020 | 43,838,266 |
| Warner Music Group Corp. Class A | | 188,000 | 4,904,920 |
| World Wrestling Entertainment, Inc. Class A (b) | | 207,412 | 22,497,980 |
| | | | 305,099,100 |
| Interactive Media & Services - 5.4% | | | |
| Alphabet, Inc. Class A (a) | | 4,946,400 | 592,084,080 |
| Angi, Inc. (a) | | 1,155,332 | 3,812,596 |
| IAC, Inc. (a) | | 15,000 | 942,000 |
| Meta Platforms, Inc. Class A (a) | | 965,525 | 277,086,365 |
| Pinterest, Inc. Class A (a) | | 460,200 | 12,581,868 |
| Shutterstock, Inc. | | 7,700 | 374,759 |
| Snap, Inc. Class A (a) | | 1,547,800 | 18,325,952 |
| Zoominfo Technologies, Inc. (a) | | 118,000 | 2,996,020 |
| | | | 908,203,640 |
| Media - 0.7% | | | |
| Advantage Solutions, Inc. Class A (a) | | 429,700 | 1,005,498 |
| Altice U.S.A., Inc. Class A (a) | | 715,600 | 2,161,112 |
| Comcast Corp. Class A | | 1,488,482 | 61,846,427 |
| DISH Network Corp. Class A (a)(b) | | 77,263 | 509,163 |
| Liberty Broadband Corp.: | | | |
| Class A (a) | | 294,831 | 23,506,876 |
| Class C (a) | | 241,800 | 19,370,598 |
| S4 Capital PLC (a) | | 692,100 | 1,107,498 |
| TechTarget, Inc. (a) | | 25,500 | 793,815 |
| | | | 110,300,987 |
| Wireless Telecommunication Services - 0.4% | | | |
| T-Mobile U.S., Inc. (a) | | 463,538 | 64,385,428 |
TOTAL COMMUNICATION SERVICES | | | 1,399,945,179 |
| CONSUMER DISCRETIONARY - 10.5% | | | |
| Automobile Components - 0.2% | | | |
| Adient PLC (a) | | 271,745 | 10,413,268 |
| Aptiv PLC (a) | | 137,100 | 13,996,539 |
| | | | 24,409,807 |
| Automobiles - 1.5% | | | |
| Ferrari NV | | 41,991 | 13,655,893 |
| Tesla, Inc. (a) | | 899,110 | 235,360,025 |
| | | | 249,015,918 |
| Broadline Retail - 3.4% | | | |
| Amazon.com, Inc. (a) | | 4,014,568 | 523,339,084 |
| eBay, Inc. | | 778,216 | 34,778,473 |
| Ollie's Bargain Outlet Holdings, Inc. (a) | | 225,459 | 13,060,840 |
| | | | 571,178,397 |
| Hotels, Restaurants & Leisure - 2.3% | | | |
| ARAMARK Holdings Corp. | | 642,594 | 27,663,672 |
| Booking Holdings, Inc. (a) | | 24,123 | 65,140,061 |
| Caesars Entertainment, Inc. (a) | | 427,358 | 21,782,437 |
| Churchill Downs, Inc. | | 287,364 | 39,992,448 |
| Domino's Pizza, Inc. | | 84,319 | 28,414,660 |
| Hilton Worldwide Holdings, Inc. | | 293,003 | 42,646,587 |
| Marriott International, Inc. Class A | | 266,576 | 48,967,345 |
| McDonald's Corp. | | 115,690 | 34,523,053 |
| Penn Entertainment, Inc. (a) | | 270,500 | 6,500,115 |
| Planet Fitness, Inc. (a)(b) | | 182,407 | 12,301,528 |
| Red Rock Resorts, Inc. | | 230,800 | 10,796,824 |
| Yum! Brands, Inc. | | 339,600 | 47,051,580 |
| | | | 385,780,310 |
| Household Durables - 0.2% | | | |
| D.R. Horton, Inc. | | 135,120 | 16,442,753 |
| Helen of Troy Ltd. (a) | | 31,900 | 3,445,838 |
| Mohawk Industries, Inc. (a) | | 103,557 | 10,682,940 |
| Newell Brands, Inc. | | 39,200 | 341,040 |
| | | | 30,912,571 |
| Specialty Retail - 1.9% | | | |
| Fast Retailing Co. Ltd. | | 40,400 | 10,361,582 |
| Five Below, Inc. (a) | | 113,029 | 22,214,720 |
| Lowe's Companies, Inc. | | 494,361 | 111,577,278 |
| The Home Depot, Inc. | | 159,234 | 49,464,450 |
| TJX Companies, Inc. | | 1,265,776 | 107,325,147 |
| Valvoline, Inc. | | 500,471 | 18,772,667 |
| | | | 319,715,844 |
| Textiles, Apparel & Luxury Goods - 1.0% | | | |
| Capri Holdings Ltd. (a) | | 338,836 | 12,160,824 |
| lululemon athletica, Inc. (a) | | 125,567 | 47,527,110 |
| LVMH Moet Hennessy Louis Vuitton SE | | 13,291 | 12,532,247 |
| NIKE, Inc. Class B | | 343,110 | 37,869,051 |
| PVH Corp. | | 381,221 | 32,392,348 |
| Tapestry, Inc. | | 616,561 | 26,388,811 |
| | | | 168,870,391 |
TOTAL CONSUMER DISCRETIONARY | | | 1,749,883,238 |
| CONSUMER STAPLES - 6.7% | | | |
| Beverages - 2.2% | | | |
| Boston Beer Co., Inc. Class A (a) | | 97,550 | 30,088,322 |
| Brown-Forman Corp. Class B (non-vtg.) | | 10,800 | 721,224 |
| Constellation Brands, Inc. Class A (sub. vtg.) | | 136,366 | 33,563,764 |
| Diageo PLC | | 232,613 | 10,000,266 |
| Keurig Dr. Pepper, Inc. | | 2,025,401 | 63,334,289 |
| Monster Beverage Corp. | | 626,756 | 36,000,865 |
| PepsiCo, Inc. | | 207,700 | 38,470,194 |
| Primo Water Corp. | | 331,300 | 4,154,502 |
| The Coca-Cola Co. | | 2,450,091 | 147,544,480 |
| | | | 363,877,906 |
| Consumer Staples Distribution & Retail - 1.5% | | | |
| Albertsons Companies, Inc. | | 350,600 | 7,650,092 |
| Alimentation Couche-Tard, Inc. Class A (multi-vtg.) | | 306,700 | 15,726,840 |
| BJ's Wholesale Club Holdings, Inc. (a) | | 215,800 | 13,597,558 |
| Costco Wholesale Corp. | | 900 | 484,542 |
| Dollar General Corp. | | 165,169 | 28,042,393 |
| Dollar Tree, Inc. (a) | | 150,300 | 21,568,050 |
| Grocery Outlet Holding Corp. (a) | | 21,600 | 661,176 |
| Kroger Co. | | 28,900 | 1,358,300 |
| Performance Food Group Co. (a) | | 613,702 | 36,969,408 |
| Sysco Corp. | | 149,800 | 11,115,160 |
| Target Corp. | | 211,600 | 27,910,040 |
| U.S. Foods Holding Corp. (a) | | 78,908 | 3,471,952 |
| United Natural Foods, Inc. (a) | | 3,700 | 72,335 |
| Walgreens Boots Alliance, Inc. | | 38,400 | 1,094,016 |
| Walmart, Inc. | | 515,600 | 81,042,008 |
| | | | 250,763,870 |
| Food Products - 0.9% | | | |
| Archer Daniels Midland Co. | | 107,700 | 8,137,812 |
| Bunge Ltd. | | 156,300 | 14,746,905 |
| Conagra Brands, Inc. | | 199,700 | 6,733,884 |
| Darling Ingredients, Inc. (a) | | 108,226 | 6,903,737 |
| Freshpet, Inc. (a) | | 178,400 | 11,740,504 |
| General Mills, Inc. | | 38,200 | 2,929,940 |
| Ingredion, Inc. | | 4,600 | 487,370 |
| Laird Superfood, Inc. (a) | | 119,100 | 94,690 |
| Mondelez International, Inc. | | 772,512 | 56,347,025 |
| Nomad Foods Ltd. (a) | | 1,116,000 | 19,552,320 |
| Pilgrim's Pride Corp. (a) | | 9,000 | 193,410 |
| The Hain Celestial Group, Inc. (a) | | 41,500 | 519,165 |
| The J.M. Smucker Co. | | 7,700 | 1,137,059 |
| The Kraft Heinz Co. | | 6,400 | 227,200 |
| The Real Good Food Co. LLC: | | | |
| Class B (a)(c) | | 155,856 | 2 |
| Class B unit (a)(d) | | 155,856 | 540,820 |
| The Real Good Food Co., Inc. (a) | | 300 | 1,041 |
| The Simply Good Foods Co. (a) | | 81,600 | 2,985,744 |
| TreeHouse Foods, Inc. (a) | | 38,703 | 1,949,857 |
| Tyson Foods, Inc. Class A | | 219,400 | 11,198,176 |
| | | | 146,426,661 |
| Household Products - 1.3% | | | |
| Colgate-Palmolive Co. | | 57,800 | 4,452,912 |
| Energizer Holdings, Inc. | | 636,815 | 21,384,248 |
| Kimberly-Clark Corp. | | 117,800 | 16,263,468 |
| Procter & Gamble Co. | | 1,061,593 | 161,086,122 |
| Reynolds Consumer Products, Inc. | | 283,226 | 8,001,135 |
| Spectrum Brands Holdings, Inc. (b) | | 56,000 | 4,370,800 |
| The Clorox Co. | | 22,700 | 3,610,208 |
| | | | 219,168,893 |
| Personal Care Products - 0.2% | | | |
| Estee Lauder Companies, Inc. Class A | | 65,700 | 12,902,166 |
| Herbalife Ltd. (a) | | 423,613 | 5,608,636 |
| Olaplex Holdings, Inc. (a) | | 1,992,900 | 7,413,588 |
| The Beauty Health Co. (a) | | 44,000 | 368,280 |
| The Beauty Health Co. (a)(e) | | 600,000 | 5,022,000 |
| | | | 31,314,670 |
| Tobacco - 0.6% | | | |
| Altria Group, Inc. | | 1,054,667 | 47,776,415 |
| Philip Morris International, Inc. | | 598,453 | 58,420,982 |
| | | | 106,197,397 |
TOTAL CONSUMER STAPLES | | | 1,117,749,397 |
| ENERGY - 4.2% | | | |
| Energy Equipment & Services - 0.6% | | | |
| Core Laboratories, Inc. | | 80,700 | 1,876,275 |
| Diamond Offshore Drilling, Inc. (a) | | 167,800 | 2,389,472 |
| Expro Group Holdings NV (a) | | 1,053,300 | 18,664,476 |
| Noble Corp. PLC | | 59,000 | 2,437,290 |
| Schlumberger Ltd. | | 507,600 | 24,933,312 |
| TechnipFMC PLC (a) | | 875,200 | 14,545,824 |
| Valaris Ltd. (a) | | 72,300 | 4,549,839 |
| Weatherford International PLC (a) | | 490,800 | 32,598,936 |
| | | | 101,995,424 |
| Oil, Gas & Consumable Fuels - 3.6% | | | |
| Africa Oil Corp. | | 6,537,700 | 13,916,825 |
| Athabasca Oil Corp. (a) | | 380,900 | 825,199 |
| Canadian Natural Resources Ltd. | | 531,759 | 29,896,517 |
| Cheniere Energy, Inc. | | 30,000 | 4,570,800 |
| Eco Atlantic Oil & Gas Ltd. (a) | | 4,861,000 | 825,609 |
| Exxon Mobil Corp. | | 2,739,538 | 293,815,451 |
| Hess Corp. | | 451,975 | 61,446,001 |
| Imperial Oil Ltd. | | 1,031,200 | 52,760,699 |
| Kosmos Energy Ltd. (a) | | 2,777,673 | 16,638,261 |
| MEG Energy Corp. (a) | | 2,455,550 | 38,925,495 |
| PBF Energy, Inc. Class A | | 110,900 | 4,540,246 |
| Phillips 66 Co. | | 324,959 | 30,994,589 |
| Tourmaline Oil Corp. | | 124,800 | 5,880,367 |
| Valero Energy Corp. | | 331,286 | 38,859,848 |
| | | | 593,895,907 |
TOTAL ENERGY | | | 695,891,331 |
| FINANCIALS - 12.4% | | | |
| Banks - 5.1% | | | |
| AIB Group PLC | | 1,494,840 | 6,280,002 |
| Bank of America Corp. | | 4,830,454 | 138,585,725 |
| Bank of Ireland Group PLC | | 2,348,400 | 22,391,772 |
| BNP Paribas SA | | 430,903 | 27,192,546 |
| Citigroup, Inc. | | 796,739 | 36,681,864 |
| DNB Bank ASA | | 773,000 | 14,455,648 |
| JPMorgan Chase & Co. | | 1,772,269 | 257,758,803 |
| KBC Group NV | | 189,200 | 13,196,606 |
| KeyCorp | | 1,838,700 | 16,989,588 |
| M&T Bank Corp. | | 202,249 | 25,030,336 |
| NatWest Group PLC | | 4,592,606 | 14,037,261 |
| Piraeus Financial Holdings SA (a) | | 3,343,502 | 10,967,179 |
| PNC Financial Services Group, Inc. | | 211,900 | 26,688,805 |
| Popular, Inc. | | 442,500 | 26,780,100 |
| Starling Bank Ltd. Series D (a)(c)(e) | | 4,618,325 | 17,126,597 |
| Sumitomo Mitsui Financial Group, Inc. | | 374,600 | 16,055,149 |
| U.S. Bancorp | | 536,916 | 17,739,705 |
| UniCredit SpA | | 1,181,737 | 27,479,610 |
| Wells Fargo & Co. | | 2,746,271 | 117,210,846 |
| Zions Bancorp NA | | 405,700 | 10,897,102 |
| | | | 843,545,244 |
| Capital Markets - 1.2% | | | |
| Bank of New York Mellon Corp. | | 1,805,575 | 80,384,199 |
| BlackRock, Inc. Class A | | 10,816 | 7,475,370 |
| Brookfield Corp. Class A | | 291,739 | 9,817,017 |
| Cboe Global Markets, Inc. | | 170,630 | 23,548,646 |
| Patria Investments Ltd. | | 898,838 | 12,853,383 |
| State Street Corp. | | 455,100 | 33,304,218 |
| StepStone Group, Inc. Class A | | 343,672 | 8,526,502 |
| UBS Group AG | | 1,174,500 | 23,807,115 |
| Virtu Financial, Inc. Class A | | 434,424 | 7,424,306 |
| | | | 207,140,756 |
| Consumer Finance - 0.2% | | | |
| Capital One Financial Corp. | | 60,935 | 6,664,461 |
| NerdWallet, Inc. (a) | | 193,200 | 1,818,012 |
| OneMain Holdings, Inc. | | 569,304 | 24,872,892 |
| | | | 33,355,365 |
| Financial Services - 2.9% | | | |
| Ant International Co. Ltd. Class C (a)(c)(e) | | 5,601,170 | 8,457,767 |
| Apollo Global Management, Inc. | | 531,162 | 40,798,553 |
| Block, Inc. Class A (a) | | 379,100 | 25,236,687 |
| Essent Group Ltd. | | 499,933 | 23,396,864 |
| Fiserv, Inc. (a) | | 526,400 | 66,405,360 |
| Global Payments, Inc. | | 221,700 | 21,841,884 |
| Jumo World Ltd. (a)(c) | | 998 | 953,240 |
| MGIC Investment Corp. | | 790,819 | 12,487,032 |
| Mr. Cooper Group, Inc. (a) | | 20 | 1,013 |
| Repay Holdings Corp. (a) | | 1,047,644 | 8,203,053 |
| Shift4 Payments, Inc. (a) | | 207,117 | 14,065,315 |
| UWM Holdings Corp. Class A (b) | | 1,699,603 | 9,517,777 |
| Visa, Inc. Class A | | 911,300 | 216,415,524 |
| Voya Financial, Inc. | | 329,800 | 23,649,958 |
| Worldline SA (a)(d) | | 314,265 | 11,488,020 |
| | | | 482,918,047 |
| Insurance - 3.0% | | | |
| Arthur J. Gallagher & Co. | | 119,658 | 26,273,307 |
| Beazley PLC | | 2,184,767 | 16,342,713 |
| Chubb Ltd. | | 491,767 | 94,694,654 |
| Direct Line Insurance Group PLC | | 4,577,028 | 7,902,536 |
| Fairfax Financial Holdings Ltd. (sub. vtg.) | | 26,301 | 19,700,486 |
| Globe Life, Inc. | | 212,405 | 23,283,836 |
| Hartford Financial Services Group, Inc. | | 652,933 | 47,024,235 |
| Marsh & McLennan Companies, Inc. | | 242,739 | 45,654,351 |
| Progressive Corp. | | 420,723 | 55,691,104 |
| Prudential PLC | | 838,302 | 11,839,670 |
| Reinsurance Group of America, Inc. | | 147,200 | 20,415,168 |
| The Travelers Companies, Inc. | | 595,017 | 103,330,652 |
| Unum Group | | 746,181 | 35,592,834 |
| | | | 507,745,546 |
TOTAL FINANCIALS | | | 2,074,704,958 |
| HEALTH CARE - 12.8% | | | |
| Biotechnology - 2.4% | | | |
| Acelyrin, Inc. | | 280,000 | 5,852,000 |
| Akero Therapeutics, Inc. (a) | | 275,000 | 12,839,750 |
| Allogene Therapeutics, Inc. (a) | | 1,000,000 | 4,970,000 |
| Alnylam Pharmaceuticals, Inc. (a) | | 32,500 | 6,173,050 |
| Ambrx Biopharma, Inc. ADR (a) | | 148,700 | 2,447,602 |
| Apellis Pharmaceuticals, Inc. (a) | | 154,000 | 14,029,400 |
| Arcellx, Inc. (a) | | 128,000 | 4,047,360 |
| Arcus Biosciences, Inc. (a) | | 135,000 | 2,741,850 |
| Arcutis Biotherapeutics, Inc. (a) | | 300,000 | 2,859,000 |
| Argenx SE ADR (a) | | 120,000 | 46,767,600 |
| Ascendis Pharma A/S sponsored ADR (a) | | 240,000 | 21,420,000 |
| Avidity Biosciences, Inc. (a) | | 360,000 | 3,992,400 |
| Beam Therapeutics, Inc. (a) | | 100,000 | 3,193,000 |
| Blueprint Medicines Corp. (a) | | 167,000 | 10,554,400 |
| Caris Life Sciences, Inc. (c)(e) | | 227,063 | 1,271,553 |
| Celldex Therapeutics, Inc. (a) | | 200,000 | 6,786,000 |
| Cerevel Therapeutics Holdings (a) | | 415,000 | 13,192,850 |
| Cytokinetics, Inc. (a) | | 385,000 | 12,558,700 |
| Generation Bio Co. (a) | | 240,000 | 1,320,000 |
| Janux Therapeutics, Inc. (a) | | 160,000 | 1,899,200 |
| Karuna Therapeutics, Inc. (a) | | 75,000 | 16,263,750 |
| Keros Therapeutics, Inc. (a) | | 160,000 | 6,428,800 |
| Legend Biotech Corp. ADR (a) | | 435,000 | 30,028,050 |
| Morphic Holding, Inc. (a) | | 100,000 | 5,733,000 |
| Nuvalent, Inc. Class A (a) | | 165,000 | 6,958,050 |
| Poseida Therapeutics, Inc. (a) | | 800,000 | 1,408,000 |
| PTC Therapeutics, Inc. (a) | | 145,000 | 5,897,150 |
| Regeneron Pharmaceuticals, Inc. (a) | | 86,500 | 62,153,710 |
| Repligen Corp. (a) | | 110,000 | 15,560,600 |
| Sarepta Therapeutics, Inc. (a) | | 60,000 | 6,871,200 |
| Shattuck Labs, Inc. (a) | | 280,000 | 873,600 |
| uniQure B.V. (a) | | 180,000 | 2,062,800 |
| Vaxcyte, Inc. (a) | | 325,000 | 16,230,500 |
| Vera Therapeutics, Inc. (a) | | 280,000 | 4,494,000 |
| Vertex Pharmaceuticals, Inc. (a) | | 24,000 | 8,445,840 |
| Xencor, Inc. (a) | | 360,000 | 8,989,200 |
| Xenon Pharmaceuticals, Inc. (a) | | 200,000 | 7,700,000 |
| Zentalis Pharmaceuticals, Inc. (a) | | 340,000 | 9,591,400 |
| | | | 394,605,365 |
| Health Care Equipment & Supplies - 2.7% | | | |
| Boston Scientific Corp. (a) | | 2,760,000 | 149,288,400 |
| Insulet Corp. (a) | | 160,000 | 46,134,400 |
| Intuitive Surgical, Inc. (a) | | 50,000 | 17,097,000 |
| iRhythm Technologies, Inc. (a) | | 100,000 | 10,432,000 |
| Masimo Corp. (a) | | 356,000 | 58,579,800 |
| Nevro Corp. (a) | | 70,000 | 1,779,400 |
| Novocure Ltd. (a) | | 142,000 | 5,893,000 |
| Outset Medical, Inc. (a) | | 240,000 | 5,248,800 |
| Penumbra, Inc. (a) | | 290,000 | 99,777,400 |
| PROCEPT BioRobotics Corp. (a) | | 170,000 | 6,009,500 |
| ResMed, Inc. | | 145,000 | 31,682,500 |
| Stryker Corp. | | 70,000 | 21,356,300 |
| Tandem Diabetes Care, Inc. (a) | | 130,000 | 3,190,200 |
| | | | 456,468,700 |
| Health Care Providers & Services - 3.5% | | | |
| Acadia Healthcare Co., Inc. (a) | | 250,000 | 19,910,000 |
| agilon health, Inc. (a) | | 2,800,000 | 48,552,000 |
| Alignment Healthcare, Inc. (a) | | 1,000,000 | 5,750,000 |
| Centene Corp. (a) | | 810,000 | 54,634,500 |
| Cigna Group | | 235,000 | 65,941,000 |
| CVS Health Corp. | | 350,000 | 24,195,500 |
| Elevance Health, Inc. | | 35,000 | 15,550,150 |
| Humana, Inc. | | 102,200 | 45,696,686 |
| LifeStance Health Group, Inc. (a) | | 1,350,000 | 12,325,500 |
| Molina Healthcare, Inc. (a) | | 32,500 | 9,790,300 |
| Privia Health Group, Inc. (a) | | 820,000 | 21,410,200 |
| Surgery Partners, Inc. (a) | | 1,000,000 | 44,990,000 |
| UnitedHealth Group, Inc. | | 450,000 | 216,288,000 |
| | | | 585,033,836 |
| Health Care Technology - 0.3% | | | |
| Doximity, Inc. (a)(b) | | 175,000 | 5,953,500 |
| Evolent Health, Inc. (e) | | 500,000 | 14,392,500 |
| Evolent Health, Inc. (a) | | 80,000 | 2,424,000 |
| Phreesia, Inc. (a) | | 280,000 | 8,682,800 |
| Veeva Systems, Inc. Class A (a) | | 60,000 | 11,863,800 |
| | | | 43,316,600 |
| Life Sciences Tools & Services - 2.1% | | | |
| 10X Genomics, Inc. (a) | | 440,000 | 24,569,600 |
| Bruker Corp. | | 280,000 | 20,697,600 |
| Danaher Corp. | | 536,000 | 128,640,000 |
| Eden Biologics, Inc. (a)(c) | | 1,008,062 | 0 |
| IQVIA Holdings, Inc. (a) | | 146,000 | 32,816,420 |
| Lonza Group AG | | 18,500 | 11,024,971 |
| Olink Holding AB ADR (a) | | 375,000 | 7,031,250 |
| Sartorius Stedim Biotech | | 46,000 | 11,479,642 |
| Thermo Fisher Scientific, Inc. | | 196,000 | 102,263,000 |
| West Pharmaceutical Services, Inc. | | 48,500 | 18,549,795 |
| | | | 357,072,278 |
| Pharmaceuticals - 1.8% | | | |
| Arvinas Holding Co. LLC (a) | | 180,000 | 4,467,600 |
| AstraZeneca PLC (United Kingdom) | | 370,000 | 53,041,083 |
| Chime Biologics Wuhan Co. Ltd. (a)(c) | | 1,008,062 | 525,029 |
| Eli Lilly & Co. | | 265,000 | 124,279,700 |
| Enliven Therapeutics, Inc. (a) | | 100,000 | 2,041,000 |
| Merck & Co., Inc. | | 365,000 | 42,117,350 |
| Novo Nordisk A/S Series B | | 135,000 | 21,807,879 |
| Pharvaris BV (a) | | 208,000 | 3,267,680 |
| Royalty Pharma PLC | | 900,000 | 27,666,000 |
| UCB SA | | 145,000 | 12,847,789 |
| Ventyx Biosciences, Inc. (a) | | 200,632 | 6,580,730 |
| Verona Pharma PLC ADR (a) | | 150,000 | 3,171,000 |
| | | | 301,812,840 |
TOTAL HEALTH CARE | | | 2,138,309,619 |
| INDUSTRIALS - 10.2% | | | |
| Aerospace & Defense - 2.2% | | | |
| Axon Enterprise, Inc. (a) | | 71,700 | 13,990,104 |
| HEICO Corp. Class A | | 101,261 | 14,237,297 |
| Howmet Aerospace, Inc. | | 528,000 | 26,167,680 |
| L3Harris Technologies, Inc. | | 184,310 | 36,082,369 |
| Lockheed Martin Corp. | | 164,300 | 75,640,434 |
| Northrop Grumman Corp. | | 63,600 | 28,988,880 |
| Raytheon Technologies Corp. (b) | | 636,798 | 62,380,732 |
| The Boeing Co. (a) | | 498,700 | 105,305,492 |
| | | | 362,792,988 |
| Building Products - 0.7% | | | |
| Carlisle Companies, Inc. | | 172,778 | 44,322,740 |
| Trane Technologies PLC | | 401,310 | 76,754,551 |
| | | | 121,077,291 |
| Commercial Services & Supplies - 0.7% | | | |
| Cintas Corp. | | 129,128 | 64,186,946 |
| The GEO Group, Inc. (a) | | 487,500 | 3,490,500 |
| Waste Connections, Inc. (United States) | | 391,072 | 55,895,921 |
| | | | 123,573,367 |
| Construction & Engineering - 0.5% | | | |
| Willscot Mobile Mini Holdings (a) | | 1,665,600 | 79,599,024 |
| Electrical Equipment - 1.0% | | | |
| AMETEK, Inc. | | 729,232 | 118,048,076 |
| Eaton Corp. PLC | | 95,000 | 19,104,500 |
| Nextracker, Inc. Class A (b) | | 69,800 | 2,778,738 |
| Regal Rexnord Corp. | | 158,000 | 24,316,200 |
| | | | 164,247,514 |
| Ground Transportation - 1.4% | | | |
| CSX Corp. | | 2,187,278 | 74,586,180 |
| Landstar System, Inc. | | 270,885 | 52,156,198 |
| Old Dominion Freight Lines, Inc. | | 80,583 | 29,795,564 |
| Uber Technologies, Inc. (a) | | 716,300 | 30,922,671 |
| Union Pacific Corp. | | 245,416 | 50,217,022 |
| | | | 237,677,635 |
| Industrial Conglomerates - 0.2% | | | |
| Honeywell International, Inc. | | 134,213 | 27,849,198 |
| Machinery - 2.7% | | | |
| AGCO Corp. | | 307,600 | 40,424,792 |
| Caterpillar, Inc. | | 433,583 | 106,683,097 |
| Chart Industries, Inc. (a) | | 109,700 | 17,528,963 |
| Deere & Co. | | 174,700 | 70,786,693 |
| Flowserve Corp. | | 1,273,300 | 47,303,095 |
| Fortive Corp. | | 1,388,894 | 103,847,604 |
| IDEX Corp. | | 202,371 | 43,562,381 |
| ITT, Inc. | | 275,300 | 25,660,713 |
| | | | 455,797,338 |
| Marine Transportation - 0.1% | | | |
| Eagle Bulk Shipping, Inc. (b) | | 121,200 | 5,822,448 |
| Genco Shipping & Trading Ltd. (b) | | 256,400 | 3,597,292 |
| | | | 9,419,740 |
| Passenger Airlines - 0.4% | | | |
| Delta Air Lines, Inc. | | 973,600 | 46,284,944 |
| JetBlue Airways Corp. (a) | | 2,108,800 | 18,683,968 |
| | | | 64,968,912 |
| Professional Services - 0.3% | | | |
| Ceridian HCM Holding, Inc. (a) | | 356,600 | 23,881,502 |
| ExlService Holdings, Inc. (a) | | 34,666 | 5,236,646 |
| TransUnion Holding Co., Inc. | | 338,295 | 26,498,647 |
| | | | 55,616,795 |
| Trading Companies & Distributors - 0.0% | | | |
| Air Lease Corp. Class A | | 129,800 | 5,432,130 |
TOTAL INDUSTRIALS | | | 1,708,051,932 |
| INFORMATION TECHNOLOGY - 25.1% | | | |
| Electronic Equipment, Instruments & Components - 0.5% | | | |
| Cognex Corp. | | 205,522 | 11,513,342 |
| Corning, Inc. | | 924,777 | 32,404,186 |
| TE Connectivity Ltd. | | 247,541 | 34,695,347 |
| | | | 78,612,875 |
| IT Services - 2.1% | | | |
| Akamai Technologies, Inc. (a) | | 363,705 | 32,686,168 |
| Capgemini SA | | 301,217 | 57,033,196 |
| Cognizant Technology Solutions Corp. Class A | | 1,001,477 | 65,376,419 |
| EPAM Systems, Inc. (a) | | 108,500 | 24,385,375 |
| GoDaddy, Inc. (a) | | 502,000 | 37,715,260 |
| MongoDB, Inc. Class A (a) | | 132,000 | 54,250,680 |
| Shopify, Inc. Class A (a) | | 93,500 | 6,040,100 |
| Snowflake, Inc. (a) | | 220,400 | 38,785,992 |
| Twilio, Inc. Class A (a) | | 582,941 | 37,086,706 |
| Wix.com Ltd. (a) | | 88,300 | 6,908,592 |
| X Holdings Corp. Class A (c) | | 31,890 | 1,234,781 |
| | | | 361,503,269 |
| Semiconductors & Semiconductor Equipment - 4.1% | | | |
| Advanced Micro Devices, Inc. (a) | | 352,371 | 40,138,581 |
| Analog Devices, Inc. | | 796,361 | 155,139,086 |
| Intel Corp. | | 1,023,400 | 34,222,496 |
| Marvell Technology, Inc. | | 338,244 | 20,220,226 |
| Microchip Technology, Inc. | | 450,604 | 40,369,612 |
| Micron Technology, Inc. | | 1,507,011 | 95,107,464 |
| NVIDIA Corp. | | 570,200 | 241,206,004 |
| ON Semiconductor Corp. (a) | | 182,500 | 17,260,850 |
| Skyworks Solutions, Inc. | | 150,763 | 16,687,956 |
| SolarEdge Technologies, Inc. (a) | | 96,400 | 25,936,420 |
| | | | 686,288,695 |
| Software - 12.5% | | | |
| Adobe, Inc. (a) | | 418,349 | 204,568,478 |
| Aspen Technology, Inc. (a) | | 60,990 | 10,222,534 |
| Atlassian Corp. PLC (a) | | 217,100 | 36,431,551 |
| Autodesk, Inc. (a) | | 334,832 | 68,509,976 |
| Blackbaud, Inc. (a) | | 223,900 | 15,937,202 |
| Constellation Software, Inc. | | 9,990 | 20,698,360 |
| Elastic NV (a) | | 420,200 | 26,943,224 |
| Five9, Inc. (a) | | 390,400 | 32,188,480 |
| Gen Digital, Inc. | | 1,429,210 | 26,511,846 |
| HubSpot, Inc. (a) | | 94,304 | 50,178,215 |
| Lumine Group, Inc. | | 33,574 | 460,494 |
| Microsoft Corp. | | 3,381,759 | 1,151,624,206 |
| New Relic, Inc. (a) | | 90,800 | 5,941,952 |
| Palo Alto Networks, Inc. (a) | | 220,990 | 56,465,155 |
| PTC, Inc. (a) | | 286,557 | 40,777,061 |
| Roper Technologies, Inc. | | 28,900 | 13,895,120 |
| Salesforce, Inc. (a) | | 938,938 | 198,360,042 |
| Tenable Holdings, Inc. (a) | | 962,900 | 41,934,295 |
| Workday, Inc. Class A (a) | | 312,189 | 70,520,373 |
| Workiva, Inc. (a) | | 152,811 | 15,534,766 |
| | | | 2,087,703,330 |
| Technology Hardware, Storage & Peripherals - 5.9% | | | |
| Apple, Inc. | | 4,995,432 | 968,963,945 |
| Western Digital Corp. (a) | | 329,014 | 12,479,501 |
| | | | 981,443,446 |
TOTAL INFORMATION TECHNOLOGY | | | 4,195,551,615 |
| MATERIALS - 2.7% | | | |
| Chemicals - 1.7% | | | |
| Air Products & Chemicals, Inc. | | 80,789 | 24,198,729 |
| Ashland, Inc. | | 71,500 | 6,214,065 |
| Cabot Corp. | | 150,000 | 10,033,500 |
| Celanese Corp. Class A | | 171,900 | 19,906,020 |
| Chemtrade Logistics Income Fund | | 904,680 | 5,593,002 |
| Corteva, Inc. | | 430,500 | 24,667,650 |
| Dow, Inc. | | 88,900 | 4,734,814 |
| DuPont de Nemours, Inc. | | 251,207 | 17,946,228 |
| Eastman Chemical Co. | | 31,000 | 2,595,320 |
| Element Solutions, Inc. | | 167,900 | 3,223,680 |
| Huntsman Corp. | | 112,900 | 3,050,558 |
| Linde PLC | | 245,700 | 93,631,356 |
| LyondellBasell Industries NV Class A | | 251,700 | 23,113,611 |
| Olin Corp. | | 225,084 | 11,567,067 |
| Orion SA | | 85,700 | 1,818,554 |
| RPM International, Inc. | | 24,600 | 2,207,358 |
| The Chemours Co. LLC | | 427,300 | 15,763,097 |
| Tronox Holdings PLC | | 772,700 | 9,821,017 |
| Westlake Corp. | | 59,800 | 7,144,306 |
| | | | 287,229,932 |
| Construction Materials - 0.2% | | | |
| Martin Marietta Materials, Inc. | | 26,622 | 12,291,111 |
| Vulcan Materials Co. | | 56,200 | 12,669,728 |
| | | | 24,960,839 |
| Containers & Packaging - 0.2% | | | |
| Aptargroup, Inc. | | 109,400 | 12,675,084 |
| Avery Dennison Corp. | | 43,800 | 7,524,840 |
| Crown Holdings, Inc. | | 80,195 | 6,966,540 |
| Greif, Inc. Class A | | 152,800 | 10,526,392 |
| | | | 37,692,856 |
| Metals & Mining - 0.6% | | | |
| Alcoa Corp. | | 56,900 | 1,930,617 |
| Commercial Metals Co. | | 141,556 | 7,454,339 |
| First Quantum Minerals Ltd. | | 955,980 | 22,615,900 |
| Franco-Nevada Corp. | | 50,900 | 7,254,523 |
| Freeport-McMoRan, Inc. | | 812,200 | 32,488,000 |
| Glencore PLC | | 856,200 | 4,854,556 |
| Horizonte Minerals PLC (a) | | 1,616,300 | 2,955,889 |
| Ivanhoe Mines Ltd. (a) | | 522,100 | 4,768,756 |
| Major Drilling Group International, Inc. (a) | | 341,500 | 2,356,150 |
| Reliance Steel & Aluminum Co. | | 41,400 | 11,243,826 |
| Steel Dynamics, Inc. | | 46,300 | 5,043,459 |
| Wheaton Precious Metals Corp. | | 71,600 | 3,096,406 |
| | | | 106,062,421 |
TOTAL MATERIALS | | | 455,946,048 |
| REAL ESTATE - 2.9% | | | |
| Equity Real Estate Investment Trusts (REITs) - 2.7% | | | |
| Alexandria Real Estate Equities, Inc. | | 95,800 | 10,872,342 |
| American Tower Corp. | | 120,704 | 23,409,334 |
| Crown Castle International Corp. | | 405,700 | 46,225,458 |
| CubeSmart | | 866,815 | 38,711,958 |
| Digital Realty Trust, Inc. | | 118,000 | 13,436,660 |
| Equinix, Inc. | | 55,800 | 43,743,852 |
| Equity Lifestyle Properties, Inc. | | 240,000 | 16,053,600 |
| Essex Property Trust, Inc. | | 84,059 | 19,695,024 |
| Four Corners Property Trust, Inc. | | 557,503 | 14,160,576 |
| Invitation Homes, Inc. | | 435,151 | 14,969,194 |
| Lamar Advertising Co. Class A | | 147,400 | 14,629,450 |
| Mid-America Apartment Communities, Inc. | | 146,800 | 22,293,048 |
| Omega Healthcare Investors, Inc. | | 467,300 | 14,341,437 |
| Prologis (REIT), Inc. | | 484,451 | 59,408,226 |
| Ryman Hospitality Properties, Inc. | | 149,900 | 13,928,708 |
| SITE Centers Corp. | | 766,600 | 10,134,452 |
| Spirit Realty Capital, Inc. | | 219,300 | 8,636,034 |
| Tanger Factory Outlet Centers, Inc. | | 68,100 | 1,502,967 |
| Terreno Realty Corp. | | 203,500 | 12,230,350 |
| UDR, Inc. | | 233,300 | 10,022,568 |
| Urban Edge Properties | | 627,600 | 9,683,868 |
| Ventas, Inc. | | 627,000 | 29,638,290 |
| VICI Properties, Inc. | | 181,700 | 5,710,831 |
| | | | 453,438,227 |
| Real Estate Management & Development - 0.2% | | | |
| CBRE Group, Inc. (a) | | 245,300 | 19,798,163 |
| Doma Holdings, Inc. Class A (a)(b) | | 169,561 | 837,631 |
| Jones Lang LaSalle, Inc. (a) | | 38,600 | 6,013,880 |
| | | | 26,649,674 |
TOTAL REAL ESTATE | | | 480,087,901 |
| UTILITIES - 2.5% | | | |
| Electric Utilities - 1.6% | | | |
| Constellation Energy Corp. | | 362,181 | 33,157,671 |
| Duke Energy Corp. | | 92,800 | 8,327,872 |
| Edison International | | 339,882 | 23,604,805 |
| Exelon Corp. | | 105,895 | 4,314,162 |
| FirstEnergy Corp. | | 296,479 | 11,527,104 |
| NextEra Energy, Inc. | | 860,417 | 63,842,941 |
| NRG Energy, Inc. | | 175,100 | 6,546,989 |
| PG&E Corp. (a) | | 2,084,506 | 36,020,264 |
| Pinnacle West Capital Corp. | | 112,900 | 9,196,834 |
| PPL Corp. | | 443,600 | 11,737,656 |
| Southern Co. | | 841,955 | 59,147,339 |
| | | | 267,423,637 |
| Independent Power and Renewable Electricity Producers - 0.2% | | | |
| Clearway Energy, Inc. Class A | | 44,888 | 1,211,976 |
| Energy Harbor Corp. (a) | | 72,800 | 5,623,800 |
| NextEra Energy Partners LP | | 81,998 | 4,808,363 |
| Sunnova Energy International, Inc. (a)(b) | | 112,700 | 2,063,537 |
| The AES Corp. | | 266,900 | 5,532,837 |
| Vistra Corp. | | 566,478 | 14,870,048 |
| | | | 34,110,561 |
| Multi-Utilities - 0.6% | | | |
| Dominion Energy, Inc. | | 329,313 | 17,055,120 |
| DTE Energy Co. | | 128,600 | 14,148,572 |
| NiSource, Inc. | | 642,002 | 17,558,755 |
| Public Service Enterprise Group, Inc. | | 321,436 | 20,125,108 |
| Sempra Energy | | 214,603 | 31,244,051 |
| | | | 100,131,606 |
| Water Utilities - 0.1% | | | |
| American Water Works Co., Inc. | | 107,000 | 15,274,250 |
TOTAL UTILITIES | | | 416,940,054 |
| TOTAL COMMON STOCKS (Cost $10,909,242,589) | | | 16,433,061,272 |
| | | | |
| Preferred Stocks - 0.4% |
| | | Shares | Value ($) |
| Convertible Preferred Stocks - 0.3% | | | |
| COMMUNICATION SERVICES - 0.1% | | | |
| Interactive Media & Services - 0.1% | | | |
| Reddit, Inc. Series F (a)(c)(e) | | 236,672 | 8,186,484 |
| | | | |
| FINANCIALS - 0.0% | | | |
| Financial Services - 0.0% | | | |
| Circle Internet Financial Ltd. Series F (a)(c)(e) | | 160,054 | 3,849,299 |
| Saluda Medical, Inc. Series E (c)(e) | | 301,188 | 2,424,563 |
| | | | 6,273,862 |
| HEALTH CARE - 0.2% | | | |
| Biotechnology - 0.1% | | | |
| Asimov, Inc. Series B (a)(c)(e) | | 35,044 | 1,695,779 |
| Caris Life Sciences, Inc. Series D (a)(c)(e) | | 1,077,331 | 6,033,054 |
| Cleerly, Inc. Series C (c)(e) | | 411,426 | 4,788,999 |
| Element Biosciences, Inc. Series C (a)(c)(e) | | 195,016 | 3,118,306 |
| ElevateBio LLC Series C (a)(c)(e) | | 626,000 | 2,654,240 |
| Inscripta, Inc. Series E (a)(c)(e) | | 423,474 | 1,791,295 |
| | | | 20,081,673 |
| Health Care Providers & Services - 0.0% | | | |
| dMed Biopharmaceutical Co. Ltd. Series C (a)(c)(e) | | 416,172 | 3,258,627 |
| | | | |
| Health Care Technology - 0.1% | | | |
| Aledade, Inc.: | | | |
| Series B1(a)(c)(e) | | 67,586 | 3,387,410 |
| Series E1(a)(c)(e) | | 14,822 | 742,879 |
| Omada Health, Inc. Series E (a)(c)(e) | | 597,550 | 1,971,915 |
| Wugen, Inc. Series B (a)(c)(e) | | 155,150 | 775,750 |
| | | | 6,877,954 |
| Pharmaceuticals - 0.0% | | | |
| Aristea Therapeutics, Inc. Series B (a)(c)(e) | | 391,809 | 2,158,868 |
| Galvanize Therapeutics Series B (a)(c)(e) | | 1,112,588 | 1,802,393 |
| | | | 3,961,261 |
TOTAL HEALTH CARE | | | 34,179,515 |
| | | | |
| TOTAL CONVERTIBLE PREFERRED STOCKS | | | 48,639,861 |
| Nonconvertible Preferred Stocks - 0.1% | | | |
| FINANCIALS - 0.1% | | | |
| Financial Services - 0.1% | | | |
| Circle Internet Financial Ltd. Series E (a)(c)(e) | | 388,096 | 9,333,709 |
| Thriveworks TopCo LLC Series B (a)(c)(e)(f) | | 141,317 | 2,046,270 |
| | | | 11,379,979 |
| TOTAL PREFERRED STOCKS (Cost $79,511,579) | | | 60,019,840 |
| | | | |
| Convertible Bonds - 0.1% |
| | | Principal Amount (g) | Value ($) |
| FINANCIALS - 0.1% | | | |
| Financial Services - 0.1% | | | |
Affirm Holdings, Inc. 0% 11/15/26 (Cost $6,892,837) | | 10,273,000 | 7,582,501 |
| | | | |
| U.S. Treasury Obligations - 0.0% |
| | | Principal Amount (g) | Value ($) |
U.S. Treasury Bills, yield at date of purchase 5.11% to 5.2% 7/27/23 to 9/14/23 (h) (Cost $3,889,047) | | 3,920,000 | 3,889,729 |
| | | | |
| Money Market Funds - 1.6% |
| | | Shares | Value ($) |
| Fidelity Cash Central Fund 5.14% (i) | | 204,998,854 | 205,039,854 |
| Fidelity Securities Lending Cash Central Fund 5.14% (i)(j) | | 65,699,168 | 65,705,738 |
| TOTAL MONEY MARKET FUNDS (Cost $270,745,592) | | | 270,745,592 |
| | | | |
| TOTAL INVESTMENT IN SECURITIES - 100.5% (Cost $11,270,281,644) | 16,775,298,934 |
NET OTHER ASSETS (LIABILITIES) - (0.5)% | (75,842,028) |
| NET ASSETS - 100.0% | 16,699,456,906 |
| | |
| Futures Contracts |
| | Number of contracts | Expiration Date | Notional Amount ($) | Value ($) | Unrealized Appreciation/ (Depreciation) ($) |
| Purchased | | | | | |
| | | | | | |
| Equity Index Contracts | | | | | |
| CME E-mini S&P 500 Index Contracts (United States) | 169 | Sep 2023 | 37,925,713 | 661,416 | 661,416 |
| | | | | | |
| The notional amount of futures purchased as a percentage of Net Assets is 0.2% |
Legend
| (b) | Security or a portion of the security is on loan at period end. |
| (d) | Security exempt from registration under Rule 144A of the Securities Act of 1933. These securities may be resold in transactions exempt from registration, normally to qualified institutional buyers. At the end of the period, the value of these securities amounted to $12,028,840 or 0.1% of net assets. |
| (e) | Restricted securities (including private placements) - Investment in securities not registered under the Securities Act of 1933 (excluding 144A issues). At the end of the period, the value of restricted securities (excluding 144A issues) amounted to $106,290,257 or 0.6% of net assets. |
| (f) | Investment is owned by a wholly-owned subsidiary (Subsidiary) that is treated as a corporation for U.S. tax purposes. |
| (g) | Amount is stated in United States dollars unless otherwise noted. |
| (h) | Security or a portion of the security was pledged to cover margin requirements for futures contracts. At period end, the value of securities pledged amounted to $2,003,560. |
| (i) | Affiliated fund that is generally available only to investment companies and other accounts managed by Fidelity Investments. The rate quoted is the annualized seven-day yield of the fund at period end. A complete unaudited listing of the fund's holdings as of its most recent quarter end is available upon request. In addition, each Fidelity Central Fund's financial statements, which are not covered by the Fund's Report of Independent Registered Public Accounting Firm, are available on the SEC's website or upon request. |
| (j) | Investment made with cash collateral received from securities on loan. |
| Additional information on each restricted holding is as follows: |
| Security | Acquisition Date | Acquisition Cost ($) |
| Aledade, Inc. Series B1 | 5/07/21 | 2,587,915 |
| | | |
| Aledade, Inc. Series E1 | 5/20/22 | 738,349 |
| | | |
| Ant International Co. Ltd. Class C | 5/16/18 | 21,348,159 |
| | | |
| Aristea Therapeutics, Inc. Series B | 10/06/20 | 2,160,317 |
| | | |
| Asimov, Inc. Series B | 10/29/21 | 3,247,902 |
| | | |
| Caris Life Sciences, Inc. | 10/06/22 | 1,271,553 |
| | | |
| Caris Life Sciences, Inc. Series D | 5/11/21 | 8,726,381 |
| | | |
| Circle Internet Financial Ltd. Series E | 5/11/21 | 6,298,800 |
| | | |
| Circle Internet Financial Ltd. Series F | 5/09/22 | 6,744,676 |
| | | |
| Cleerly, Inc. Series C | 7/08/22 | 4,846,845 |
| | | |
| dMed Biopharmaceutical Co. Ltd. Series C | 12/01/20 | 5,910,953 |
| | | |
| Element Biosciences, Inc. Series C | 6/21/21 | 4,008,885 |
| | | |
| ElevateBio LLC Series C | 3/09/21 | 2,626,070 |
| | | |
| Evolent Health, Inc. | 3/28/23 | 14,500,000 |
| | | |
| Galvanize Therapeutics Series B | 3/29/22 | 1,926,207 |
| | | |
| Inscripta, Inc. Series E | 3/30/21 | 3,739,275 |
| | | |
| Omada Health, Inc. Series E | 12/22/21 | 3,582,432 |
| | | |
| Reddit, Inc. Series F | 8/11/21 | 14,625,004 |
| | | |
| Saluda Medical, Inc. Series E | 4/06/23 | 2,431,732 |
| | | |
| Starling Bank Ltd. Series D | 6/18/21 | 8,257,037 |
| | | |
| The Beauty Health Co. | 12/08/20 | 6,000,000 |
| | | |
| Thriveworks TopCo LLC Series B | 7/23/21 - 2/25/22 | 4,060,362 |
| | | |
| Wugen, Inc. Series B | 7/09/21 | 1,203,173 |
| | | |
Affiliated Central Funds
Fiscal year to date information regarding the Fund's investments in Fidelity Central Funds, including the ownership percentage, is presented below.
| Affiliate | Value, beginning of period ($) | Purchases ($) | Sales Proceeds ($) | Dividend Income ($) | Realized Gain (loss) ($) | Change in Unrealized appreciation (depreciation) ($) | Value, end of period ($) | % ownership, end of period |
| Fidelity Cash Central Fund 5.14% | 149,637,573 | 4,076,682,508 | 4,021,280,227 | 5,760,865 | - | - | 205,039,854 | 0.5% |
| Fidelity Securities Lending Cash Central Fund 5.14% | 130,631,814 | 761,978,874 | 826,904,950 | 635,260 | - | - | 65,705,738 | 0.2% |
| Total | 280,269,387 | 4,838,661,382 | 4,848,185,177 | 6,396,125 | - | - | 270,745,592 | |
| | | | | | | | | |
Amounts in the dividend income column in the above table include any capital gain distributions from underlying funds, which are presented in the corresponding line item in the Statement of Operations, if applicable.
Amounts in the dividend income column for Fidelity Securities Lending Cash Central Fund represents the income earned on investing cash collateral, less rebates paid to borrowers and any lending agent fees associated with the loan, plus any premium payments received for lending certain types of securities.
Amounts included in the purchases and sales proceeds columns may include in-kind transactions, if applicable.
Investment Valuation
The following is a summary of the inputs used, as of June 30, 2023, involving the Fund's assets and liabilities carried at fair value. The inputs or methodology used for valuing securities may not be an indication of the risk associated with investing in those securities. For more information on valuation inputs, and their aggregation into the levels used below, please refer to the Investment Valuation section in the accompanying Notes to Financial Statements.
| Valuation Inputs at Reporting Date: |
| Description | Total ($) | Level 1 ($) | Level 2 ($) | Level 3 ($) |
Investments in Securities: | | | | |
|
| Equities: | | | | |
Communication Services | 1,408,131,663 | 1,399,945,179 | - | 8,186,484 |
Consumer Discretionary | 1,749,883,238 | 1,726,989,409 | 22,893,829 | - |
Consumer Staples | 1,117,749,397 | 1,107,749,129 | 10,000,266 | 2 |
Energy | 695,891,331 | 695,891,331 | - | - |
Financials | 2,092,358,799 | 1,937,107,470 | 111,059,884 | 44,191,445 |
Health Care | 2,172,489,134 | 2,047,271,575 | 89,241,462 | 35,976,097 |
Industrials | 1,708,051,932 | 1,708,051,932 | - | - |
Information Technology | 4,195,551,615 | 4,137,283,638 | 57,033,196 | 1,234,781 |
Materials | 455,946,048 | 451,091,492 | 4,854,556 | - |
Real Estate | 480,087,901 | 480,087,901 | - | - |
Utilities | 416,940,054 | 416,940,054 | - | - |
|
| Corporate Bonds | 7,582,501 | - | 7,582,501 | - |
|
| U.S. Government and Government Agency Obligations | 3,889,729 | - | 3,889,729 | - |
|
| Money Market Funds | 270,745,592 | 270,745,592 | - | - |
| Total Investments in Securities: | 16,775,298,934 | 16,379,154,702 | 306,555,423 | 89,588,809 |
Derivative Instruments: | | | | |
|
| Assets | | | | |
Futures Contracts | 661,416 | 661,416 | - | - |
| Total Assets | 661,416 | 661,416 | - | - |
| Total Derivative Instruments: | 661,416 | 661,416 | - | - |
Value of Derivative Instruments
The following table is a summary of the Fund's value of derivative instruments by primary risk exposure as of June 30, 2023. For additional information on derivative instruments, please refer to the Derivative Instruments section in the accompanying Notes to Financial Statements.
Primary Risk Exposure / Derivative Type | Value |
| Asset ($) | Liability ($) |
| Equity Risk | | |
Futures Contracts (a) | 661,416 | 0 |
| Total Equity Risk | 661,416 | 0 |
| Total Value of Derivatives | 661,416 | 0 |
(a)Reflects gross cumulative appreciation (depreciation) on futures contracts as presented in the Schedule of Investments. In the Statement of Assets and Liabilities, the period end daily variation margin is included in receivable or payable for daily variation margin on futures contracts, and the net cumulative appreciation (depreciation) is included in Total accumulated earnings (loss).
| Statement of Assets and Liabilities |
| | | | June 30, 2023 |
| | | | | |
| Assets | | | | |
| Investment in securities, at value (including securities loaned of $63,339,233) - See accompanying schedule: | | | | |
Unaffiliated issuers (cost $10,999,536,052) | $ | 16,504,553,342 | | |
Fidelity Central Funds (cost $270,745,592) | | 270,745,592 | | |
| | | | | |
| | | | | |
| Total Investment in Securities (cost $11,270,281,644) | | | $ | 16,775,298,934 |
| Cash | | | | 410,038 |
| Foreign currency held at value (cost $1,598,493) | | | | 1,594,191 |
| Receivable for investments sold | | | | 26,028,057 |
| Receivable for fund shares sold | | | | 24,956 |
| Dividends receivable | | | | 11,437,816 |
| Distributions receivable from Fidelity Central Funds | | | | 861,057 |
| Receivable for daily variation margin on futures contracts | | | | 443,625 |
| Other receivables | | | | 250,289 |
Total assets | | | | 16,816,348,963 |
| Liabilities | | | | |
| Payable for investments purchased | $ | 36,736,977 | | |
| Payable for fund shares redeemed | | 14,422,953 | | |
| Other payables and accrued expenses | | 26,389 | | |
| Collateral on securities loaned | | 65,705,738 | | |
| Total Liabilities | | | | 116,892,057 |
| Net Assets | | | $ | 16,699,456,906 |
| Net Assets consist of: | | | | |
| Paid in capital | | | $ | 10,726,154,243 |
| Total accumulated earnings (loss) | | | | 5,973,302,663 |
| Net Assets | | | $ | 16,699,456,906 |
Net Asset Value , offering price and redemption price per share ($16,699,456,906 ÷ 138,878,542 shares) | | | $ | 120.25 |
| Statement of Operations |
| | | | Year ended June 30, 2023 |
| Investment Income | | | | |
| Dividends | | | $ | 210,369,461 |
| Interest | | | | 982,441 |
| Income from Fidelity Central Funds (including $635,260 from security lending) | | | | 6,396,125 |
| Total Income | | | | 217,748,027 |
| Expenses | | | | |
| Custodian fees and expenses | $ | 103,514 | | |
| Independent trustees' fees and expenses | | 84,546 | | |
| Interest | | 45,346 | | |
| Total Expenses | | | | 233,406 |
| Net Investment income (loss) | | | | 217,514,621 |
| Realized and Unrealized Gain (Loss) | | | | |
| Net realized gain (loss) on: | | | | |
| Investment Securities: | | | | |
| Unaffiliated issuers | | 695,098,298 | | |
| Foreign currency transactions | | (264,985) | | |
| Futures contracts | | 5,617,602 | | |
| Total net realized gain (loss) | | | | 700,450,915 |
| Change in net unrealized appreciation (depreciation) on: | | | | |
| Investment Securities: | | | | |
| Unaffiliated issuers | | 2,199,332,881 | | |
| Assets and liabilities in foreign currencies | | 44,651 | | |
| Futures contracts | | 666,082 | | |
| Total change in net unrealized appreciation (depreciation) | | | | 2,200,043,614 |
| Net gain (loss) | | | | 2,900,494,529 |
| Net increase (decrease) in net assets resulting from operations | | | $ | 3,118,009,150 |
| Statement of Changes in Net Assets |
| |
| | Year ended June 30, 2023 | | Year ended June 30, 2022 |
| Increase (Decrease) in Net Assets | | | | |
| Operations | | | | |
| Net investment income (loss) | $ | 217,514,621 | $ | 259,201,447 |
| Net realized gain (loss) | | 700,450,915 | | 4,400,424,206 |
| Change in net unrealized appreciation (depreciation) | | 2,200,043,614 | | (7,653,205,554) |
| Net increase (decrease) in net assets resulting from operations | | 3,118,009,150 | | (2,993,579,901) |
| Distributions to shareholders | | (445,588,465) | | (1,982,604,210) |
| | | | | |
| Affiliated share transactions | | | | |
| Proceeds from sales of shares | | 428,911,043 | | 1,480,601,338 |
| Reinvestment of distributions | | 445,588,465 | | 1,982,604,210 |
| Cost of shares redeemed | | (3,480,179,601) | | (10,094,925,893) |
| | | | | |
Net increase (decrease) in net assets resulting from share transactions | | (2,605,680,093) | | (6,631,720,345) |
| Total increase (decrease) in net assets | | 66,740,592 | | (11,607,904,456) |
| | | | | |
| Net Assets | | | | |
| Beginning of period | | 16,632,716,314 | | 28,240,620,770 |
| End of period | $ | 16,699,456,906 | $ | 16,632,716,314 |
| | | | | |
| Other Information | | | | |
| Shares | | | | |
| Sold | | 3,996,159 | | 11,218,721 |
| Issued in reinvestment of distributions | | 4,154,208 | | 15,351,739 |
| Redeemed | | (31,903,995) | | (76,700,915) |
| Net increase (decrease) | | (23,753,628) | | (50,130,455) |
| | | | | |
| Fidelity® U.S. Equity Central Fund |
| |
| Years ended June 30, | | 2023 | | 2022 | | 2021 A |
Selected Per-Share Data | | | | | | |
| Net asset value, beginning of period | $ | 102.27 | $ | 132.73 | $ | 100.00 |
| Income from Investment Operations | | | | | | |
Net investment income (loss) B,C | | 1.47 | | 1.41 | | 1.05 |
| Net realized and unrealized gain (loss) | | 19.57 | | (19.85) | | 33.21 |
| Total from investment operations | | 21.04 | | (18.44) | | 34.26 |
| Distributions from net investment income | | (1.52) | | (1.38) | | (.87) |
| Distributions from net realized gain | | (1.54) | | (10.64) | | (.66) |
| Total distributions | | (3.06) | | (12.02) | | (1.53) |
| Net asset value, end of period | $ | 120.25 | $ | 102.27 | $ | 132.73 |
Total Return D,E | | 20.95% | | (15.73)% | | 34.47% |
Ratios to Average Net Assets C,F,G | | | | | | |
Expenses before reductions H | | -% | | -% | | -% I |
Expenses net of fee waivers, if any H | | -% | | -% | | -% I |
Expenses net of all reductions H | | -% | | -% | | -% I |
| Net investment income (loss) | | 1.34% | | 1.10% | | 1.12% I |
| Supplemental Data | | | | | | |
| Net assets, end of period (000 omitted) | $ | 16,699,457 | $ | 16,632,716 | $ | 28,240,621 |
Portfolio turnover rate J | | 31% | | 34% K | | 47% I,L |
A For the period September 18, 2020 (commencement of operations) through June 30, 2021.
B Calculated based on average shares outstanding during the period.
C Net investment income (loss) is affected by the timing of the declaration of dividends by any underlying mutual funds or exchange-traded funds (ETFs). Net investment income (loss) of any mutual funds or ETFs is not included in the Fund's net investment income (loss) ratio.
D Total returns for periods of less than one year are not annualized.
E Total returns would have been lower if certain expenses had not been reduced during the applicable periods shown.
F Fees and expenses of any underlying mutual funds or exchange-traded funds (ETFs) are not included in the Fund's expense ratio. The Fund indirectly bears its proportionate share of these expenses. For additional expense information related to investments in Fidelity Central Funds, please refer to the "Investments in Fidelity Central Funds" note found in the Notes to Financial Statements section of the most recent Annual or Semi-Annual report.
G Expense ratios reflect operating expenses of the class. Expenses before reductions do not reflect amounts reimbursed, waived, or reduced through arrangements with the investment adviser, brokerage services, or other offset arrangements, if applicable, and do not represent the amount paid by the class during periods when reimbursements, waivers or reductions occur.
H Amount represents less than .005%.
I Annualized.
J Amount does not include the portfolio activity of any underlying mutual funds or exchange-traded funds (ETFs).
K Portfolio turnover rate excludes securities received or delivered in-kind.
L The portfolio turnover rate does not include the assets acquired in the merger.
For the period ended June 30, 2023
1. Organization.
Fidelity U.S. Equity Central Fund (the Fund) is a fund of Fidelity Central Investment Portfolios LLC (the LLC) and is authorized to issue an unlimited number of shares. Shares of the Fund are only offered to other investment companies and accounts managed by Fidelity Management & Research Company LLC (FMR), or its affiliates (the Investing Funds). The LLC is registered under the Investment Company Act of 1940, as amended (the 1940 Act), as an open-end management investment company organized as a Delaware Limited Liability Company.
2. Investments in Fidelity Central Funds.
Funds may invest in Fidelity Central Funds, which are open-end investment companies generally available only to other investment companies and accounts managed by the investment adviser and its affiliates. The Schedule of Investments lists any Fidelity Central Funds held as an investment as of period end, but does not include the underlying holdings of each Fidelity Central Fund. An investing fund indirectly bears its proportionate share of the expenses of the underlying Fidelity Central Funds.
Based on its investment objective, each Fidelity Central Fund may invest or participate in various investment vehicles or strategies that are similar to those of the investing fund. These strategies are consistent with the investment objectives of the investing fund and may involve certain economic risks which may cause a decline in value of each of the Fidelity Central Funds and thus a decline in the value of the investing fund.
| Fidelity Central Fund | Investment Manager | Investment Objective | Investment Practices | Expense Ratio A |
| Fidelity Money Market Central Funds | Fidelity Management & Research Company LLC (FMR) | Each fund seeks to obtain a high level of current income consistent with the preservation of capital and liquidity. | Short-term Investments | Less than .005% |
A Expenses expressed as a percentage of average net assets and are as of each underlying Central Fund's most recent annual or semi-annual shareholder report.
A complete unaudited list of holdings for each Fidelity Central Fund is available upon request or at the Securities and Exchange Commission website at www.sec.gov. In addition, the financial statements of the Fidelity Central Funds which contain the significant accounting policies (including investment valuation policies) of those funds, and are not covered by the Report of Independent Registered Public Accounting Firm, are available on the Securities and Exchange Commission website or upon request.
3. Significant Accounting Policies.
The Fund is an investment company and applies the accounting and reporting guidance of the Financial Accounting Standards Board (FASB) Accounting Standards Codification Topic 946 Financial Services - Investment Companies . The financial statements have been prepared in conformity with accounting principles generally accepted in the United States of America (GAAP), which require management to make certain estimates and assumptions at the date of the financial statements. Actual results could differ from those estimates. Subsequent events, if any, through the date that the financial statements were issued have been evaluated in the preparation of the financial statements. The Fund's Schedule of Investments lists any underlying mutual funds or exchange-traded funds (ETFs) but does not include the underlying holdings of these funds. The following summarizes the significant accounting policies of the Fund:
Investment Valuation. Investments are valued as of 4:00 p.m. Eastern time on the last calendar day of the period. The Board of Directors (the Board) has designated the Fund's investment adviser as the valuation designee responsible for the fair valuation function and performing fair value determinations as needed. The investment adviser has established a Fair Value Committee (the Committee) to carry out the day-to-day fair valuation responsibilities and has adopted policies and procedures to govern the fair valuation process and the activities of the Committee. In accordance with these fair valuation policies and procedures, which have been approved by the Board, the Fund attempts to obtain prices from one or more third party pricing services or brokers to value its investments. When current market prices, quotations or currency exchange rates are not readily available or reliable, investments will be fair valued in good faith by the Committee, in accordance with the policies and procedures. Factors used in determining fair value vary by investment type and may include market or investment specific events, transaction data, estimated cash flows, and market observations of comparable investments. The frequency that the fair valuation procedures are used cannot be predicted and they may be utilized to a significant extent. The Committee manages the Fund's fair valuation practices and maintains the fair valuation policies and procedures. The Fund's investment adviser reports to the Board information regarding the fair valuation process and related material matters.
The Fund categorizes the inputs to valuation techniques used to value its investments into a disclosure hierarchy consisting of three levels as shown below:
Level 1 - unadjusted quoted prices in active markets for identical investments
Level 2 - other significant observable inputs (including quoted prices for similar investments, interest rates, prepayment speeds, etc.)
Level 3 - unobservable inputs (including the Fund's own assumptions based on the best information available)
Valuation techniques used to value the Fund's investments by major category are as follows:
Equity securities, including restricted securities, for which market quotations are readily available, are valued at the last reported sale price or official closing price as reported by a third party pricing service on the primary market or exchange on which they are traded and are categorized as Level 1 in the hierarchy. In the event there were no sales during the day or closing prices are not available, securities are valued at the last quoted bid price or may be valued using the last available price and are generally categorized as Level 2 in the hierarchy. For foreign equity securities, when market or security specific events arise, comparisons to the valuation of American Depositary Receipts (ADRs), futures contracts, ETFs and certain indexes as well as quoted prices for similar securities may be used and would be categorized as Level 2 in the hierarchy. For equity securities, including restricted securities, where observable inputs are limited, assumptions about market activity and risk are used and these securities may be categorized as Level 3 in the hierarchy.
Debt securities, including restricted securities, are valued based on evaluated prices received from third party pricing services or from brokers who make markets in such securities. Corporate bonds and U.S. government and government agency obligations are valued by pricing services who utilize matrix pricing which considers yield or price of bonds of comparable quality, coupon, maturity and type or by broker-supplied prices. When independent prices are unavailable or unreliable, debt securities may be valued utilizing pricing methodologies which consider similar factors that would be used by third party pricing services. Debt securities are generally categorized as Level 2 in the hierarchy but may be Level 3 depending on the circumstances.
Futures contracts are valued at the settlement price established each day by the board of trade or exchange on which they are traded and are categorized as Level 1 in the hierarchy. Investments in open-end mutual funds, including the Fidelity Central Funds, are valued at their closing net asset value (NAV) each business day and are categorized as Level 1 in the hierarchy.
Changes in valuation techniques may result in transfers in or out of an assigned level within the disclosure hierarchy. The aggregate value of investments by input level as of June 30, 2023 is included at the end of the Fund's Schedule of Investments.
Foreign Currency. Certain Funds may use foreign currency contracts to facilitate transactions in foreign-denominated securities. Gains and losses from these transactions may arise from changes in the value of the foreign currency or if the counterparties do not perform under the contracts' terms.
Foreign-denominated assets, including investment securities, and liabilities are translated into U.S. dollars at the exchange rates at period end. Purchases and sales of investment securities, income and dividends received, and expenses denominated in foreign currencies are translated into U.S. dollars at the exchange rate in effect on the transaction date.
The effects of exchange rate fluctuations on investments are included with the net realized and unrealized gain (loss) on investment securities. Other foreign currency transactions resulting in realized and unrealized gain (loss) are disclosed separately.
Investment Transactions and Income. For financial reporting purposes, the Fund's investment holdings and NAV include trades executed through the end of the last business day of the period. The NAV per share for processing shareholder transactions is calculated as of the close of business of the New York Stock Exchange (NYSE), normally 4:00 p.m. Eastern time and includes trades executed through the end of the prior business day. Gains and losses on securities sold are determined on the basis of identified cost and include proceeds received from litigation. Commissions paid to certain brokers with whom the investment adviser, or its affiliates, places trades on behalf of a fund include an amount in addition to trade execution, which may be rebated back to a fund. Any such rebates are included in net realized gain (loss) on investments in the Statement of Operations. Dividend income is recorded on the ex-dividend date, except for certain dividends from foreign securities where the ex-dividend date may have passed, which are recorded as soon as the Fund is informed of the ex-dividend date. Non-cash dividends included in dividend income, if any, are recorded at the fair market value of the securities received. Income and capital gain distributions from Fidelity Central Funds, if any, are recorded on the ex-dividend date. Certain distributions received by the Fund represent a return of capital or capital gain. The Fund determines the components of these distributions subsequent to the ex-dividend date, based upon receipt of tax filings or other correspondence relating to the underlying investment. These distributions are recorded as a reduction of cost of investments and/or as a realized gain. Interest income is accrued as earned and includes coupon interest and amortization of premium and accretion of discount on debt securities as applicable. Investment income is recorded net of foreign taxes withheld where recovery of such taxes is uncertain. Funds may file withholding tax reclaims in certain jurisdictions to recover a portion of amounts previously withheld. Any withholding tax reclaims income is included in the Statement of Operations in dividends. Any receivables for withholding tax reclaims are included in the Statement of Assets and Liabilities in dividends receivable.
Expenses. Expenses directly attributable to a fund are charged to that fund. Expenses attributable to more than one fund are allocated among the respective funds on the basis of relative net assets or other appropriate methods. Expenses included in the accompanying financial statements reflect the expenses of that fund and do not include any expenses associated with any underlying mutual funds or exchange-traded funds. Although not included in a fund's expenses, a fund indirectly bears its proportionate share of these expenses through the net asset value of each underlying mutual fund or exchange-traded fund. Expense estimates are accrued in the period to which they relate and adjustments are made when actual amounts are known.
Income Tax Information and Distributions to Shareholders. Each year, the Fund intends to qualify as a regulated investment company under Subchapter M of the Internal Revenue Code, including distributing substantially all of its taxable income and realized gains. As a result, no provision for U.S. Federal income taxes is required. As of June 30, 2023, the Fund did not have any unrecognized tax benefits in the financial statements; nor is the Fund aware of any tax positions for which it is reasonably possible that the total amounts of unrecognized tax benefits will significantly change in the next twelve months. The Fund files a U.S. federal tax return, in addition to state and local tax returns as required. The Fund's federal income tax returns are subject to examination by the Internal Revenue Service (IRS) for a period of three fiscal years after they are filed. State and local tax returns may be subject to examination for an additional fiscal year depending on the jurisdiction. Foreign taxes are provided for based on the Fund's understanding of the tax rules and rates that exist in the foreign markets in which it invests.
Distributions are declared and recorded on the ex-dividend date. Income and capital gain distributions are determined in accordance with income tax regulations, which may differ from GAAP. In addition, the Fund claimed a portion of the payment made to redeeming shareholders as a distribution for income tax purposes.
Capital accounts within the financial statements are adjusted for permanent book-tax differences. These adjustments have no impact on net assets or the results of operations. Capital accounts are not adjusted for temporary book-tax differences which will reverse in a subsequent period.
Book-tax differences are primarily due to futures contracts, foreign currency transactions, passive foreign investment companies (PFIC), partnerships and losses deferred due to wash sales.
As of period end, the cost and unrealized appreciation (depreciation) in securities, and derivatives if applicable, for federal income tax purposes were as follows:
| Gross unrealized appreciation | $6,035,442,237 |
| Gross unrealized depreciation | (590,666,394) |
| Net unrealized appreciation (depreciation) | $5,444,775,843 |
| Tax Cost | $11,330,523,091 |
The tax-based components of distributable earnings as of period end were as follows:
| Undistributed ordinary income | $25,291,409 |
| Undistributed long-term capital gain | $502,825,585 |
| Net unrealized appreciation (depreciation) on securities and other investments | $5,445,185,669 |
The tax character of distributions paid was as follows:
| | June 30, 2023 | June 30, 2022 |
| Ordinary Income | $222,295,629 | $470,361,792 |
| Long-term Capital Gains | 223,292,836 | 1,512,242,418 |
| Total | $445,588,465 | $1,982,604,210 |
Restricted Securities (including Private Placements). Funds may invest in securities that are subject to legal or contractual restrictions on resale. These securities generally may be resold in transactions exempt from registration or to the public if the securities are registered. Disposal of these securities may involve time-consuming negotiations and expense, and prompt sale at an acceptable price may be difficult. Information regarding restricted securities held at period end is included at the end of the Schedule of Investments, if applicable.
Consolidated Subsidiary. The Funds included in the table below hold certain investments through a wholly-owned subsidiary ("Subsidiary"), which may be subject to federal and state taxes upon disposition.
As of period end, investments in Subsidiaries were as follows:
| | $ Amount | % of Net Assets |
| Fidelity U.S. Equity Central Fund | 2,046,270 | .01 |
The financial statements have been consolidated to include the Subsidiary accounts where applicable. Accordingly, all inter-company transactions and balances have been eliminated.
At period end, any estimated tax liability for these investments is presented as "Deferred taxes" in the Statement of Assets and Liabilities and included in "Change in net unrealized appreciation (depreciation) on investment securities" in the Statement of Operations. The tax liability incurred may differ materially depending on conditions when these investments are disposed. Any cash held by a Subsidiary is restricted as to its use and is presented as "Restricted cash" in the Statement of Assets and Liabilities, if applicable.
4. Derivative Instruments.
Risk Exposures and the Use of Derivative Instruments. The Fund's investment objectives allow for various types of derivative instruments, including futures contracts. Derivatives are investments whose value is primarily derived from underlying assets, indices or reference rates and may be transacted on an exchange or over-the-counter (OTC). Derivatives may involve a future commitment to buy or sell a specified asset based on specified terms, to exchange future cash flows at periodic intervals based on a notional principal amount, or for one party to make one or more payments upon the occurrence of specified events in exchange for periodic payments from the other party.
Derivatives were used to increase returns and to manage exposure to certain risks as defined below. The success of any strategy involving derivatives depends on analysis of numerous economic factors, and if the strategies for investment do not work as intended, the objectives may not be achieved.
Derivatives were used to increase or decrease exposure to the following risk(s):
| Equity Risk | Equity risk relates to the fluctuations in the value of financial instruments as a result of changes in market prices (other than those arising from interest rate risk or foreign exchange risk), whether caused by factors specific to an individual investment, its issuer, or all factors affecting all instruments traded in a market or market segment. |
Funds are also exposed to additional risks from investing in derivatives, such as liquidity risk and counterparty credit risk. Liquidity risk is the risk that a fund will be unable to close out the derivative in the open market in a timely manner. Counterparty credit risk is the risk that the counterparty will not be able to fulfill its obligation to a fund. Counterparty credit risk related to exchange-traded contracts may be mitigated by the protection provided by the exchange on which they trade.
Investing in derivatives may involve greater risks than investing in the underlying assets directly and, to varying degrees, may involve risk of loss in excess of any initial investment and collateral received and amounts recognized in the Statement of Assets and Liabilities. In addition, there may be the risk that the change in value of the derivative contract does not correspond to the change in value of the underlying instrument.
Futures Contracts. A futures contract is an agreement between two parties to buy or sell a specified underlying instrument for a fixed price at a specified future date. Futures contracts were used to manage exposure to the stock market.
Upon entering into a futures contract, a fund is required to deposit either cash or securities (initial margin) with a clearing broker in an amount equal to a certain percentage of the face value of the contract. Futures contracts are marked-to-market daily and subsequent daily payments are made or received by a fund depending on the daily fluctuations in the value of the futures contracts and are recorded as unrealized appreciation or (depreciation). This receivable and/or payable, if any, is included in daily variation margin on futures contracts in the Statement of Assets and Liabilities. Realized gain or (loss) is recorded upon the expiration or closing of a futures contract. The net realized gain (loss) and change in net unrealized appreciation (depreciation) on futures contracts during the period is presented in the Statement of Operations.
Any open futures contracts at period end are presented in the Schedule of Investments under the caption "Futures Contracts". The notional amount at value reflects each contract's exposure to the underlying instrument or index at period end, and is representative of volume of activity during the period unless an average notional amount is presented. Any securities deposited to meet initial margin requirements are identified in the Schedule of Investments. Any cash deposited to meet initial margin requirements is presented as segregated cash with brokers for derivative instruments in the Statement of Assets and Liabilities.
5. Purchases and Sales of Investments.
Purchases and sales of securities, other than short-term securities and in-kind transactions, as applicable, are noted in the table below.
| | Purchases ($) | Sales ($) |
| Fidelity U.S. Equity Central Fund | 5,051,851,106 | 7,894,759,005 |
6. Fees and Other Transactions with Affiliates.
Management Fee and Expense Contract. Fidelity Management & Research Company LLC (the investment adviser) provides the Fund with investment management services. The Fund does not pay any fees for these services. Pursuant to the Fund's management contract, the investment adviser receives a monthly management fee that represents a portion of the management fees it receives from the Investing Funds. In addition, under an expense contract, the investment adviser also pays all other expenses of the Fund, excluding custody fees, the compensation of the independent Directors, and certain miscellaneous expenses such as proxy and shareholder meeting expenses.
Brokerage Commissions. A portion of portfolio transactions were placed with brokerage firms which are affiliates of the investment adviser. Brokerage commissions are included in net realized gain (loss) and change in net unrealized appreciation (depreciation) in the Statement of Operations. The commissions paid to these affiliated firms were as follows:
| | Amount |
| Fidelity U.S. Equity Central Fund | $110,267 |
Interfund Lending Program. Pursuant to an Exemptive Order issued by the Securities and Exchange Commission (the SEC), the Fund, along with other registered investment companies having management contracts with FMR, or other affiliated entities of FMR, may participate in an interfund lending program. This program provides an alternative credit facility allowing the Fund to borrow from, or lend money to, other participating affiliated funds. At period end, there were no interfund loans outstanding. Activity in this program during the period for which loans were outstanding was as follows:
| | Borrower or Lender | Average Loan Balance | Weighted Average Interest Rate | Interest Expense |
| Fidelity U.S. Equity Central Fund | Borrower | $45,865,917 | 2.97% | $45,346 |
Interfund Trades. Funds may purchase from or sell securities to other Fidelity Funds under procedures adopted by the Board. The procedures have been designed to ensure these interfund trades are executed in accordance with Rule 17a-7 of the 1940 Act. Any interfund trades are included within the respective purchases and sales amounts shown in the Purchases and Sales of Investments note. Interfund trades during the period are noted in the table below.
| | Purchases ($) | Sales ($) | Realized Gain (Loss) ($) |
| Fidelity U.S. Equity Central Fund | 318,313,449 | 561,173,993 | 57,380,060 |
Prior Fiscal Year Affiliated Redemptions In-Kind. Shares that were redeemed in-kind for investments, including accrued interest and cash, if any, are shown in the table below; along with realized gain or loss on investments delivered through in-kind redemptions. The amount of the in-kind redemptions is included in share transactions in the accompanying Statement of Changes in Net Assets. There was no gain or loss for federal income tax purposes.
| | Shares | Total net realized gain or loss ($) | Total Proceeds ($) |
| Fidelity U.S. Equity Central Fund | 42,998,101 | 3,072,585,365 | 6,008,984,643 |
7. Security Lending.
Funds lend portfolio securities from time to time in order to earn additional income. Lending agents are used, including National Financial Services (NFS), an affiliate of the investment adviser. Pursuant to a securities lending agreement, NFS will receive a fee, which is capped at 9.9% of a fund's daily lending revenue, for its services as lending agent. A fund may lend securities to certain qualified borrowers, including NFS. On the settlement date of the loan, a fund receives collateral (in the form of U.S. Treasury obligations, letters of credit and/or cash) against the loaned securities and maintains collateral in an amount not less than 100% of the market value of the loaned securities during the period of the loan. The market value of the loaned securities is determined at the close of business of a fund and any additional required collateral is delivered to a fund on the next business day. A fund or borrower may terminate the loan at any time, and if the borrower defaults on its obligation to return the securities loaned because of insolvency or other reasons, a fund may apply collateral received from the borrower against the obligation. A fund may experience delays and costs in recovering the securities loaned. Any cash collateral received is invested in the Fidelity Securities Lending Cash Central Fund. Any loaned securities are identified as such in the Schedule of Investments, and the value of loaned securities and cash collateral at period end, as applicable, are presented in the Statement of Assets and Liabilities. Security lending income represents the income earned on investing cash collateral, less rebates paid to borrowers and any lending agent fees associated with the loan, plus any premium payments received for lending certain types of securities. Security lending income is presented in the Statement of Operations as a component of income from Fidelity Central Funds. Affiliated security lending activity, if any, was as follows:
| | Total Security Lending Fees Paid to NFS | Security Lending Income From Securities Loaned to NFS | Value of Securities Loaned to NFS at Period End |
| Fidelity U.S. Equity Central Fund | $65,491 | $45,723 | $1,092,900 |
8. Other.
A fund's organizational documents provide former and current directors and officers with a limited indemnification against liabilities arising in connection with the performance of their duties to the fund. In the normal course of business, a fund may also enter into contracts that provide general indemnifications. A fund's maximum exposure under these arrangements is unknown as this would be dependent on future claims that may be made against a fund. The risk of material loss from such claims is considered remote.
At the end of the period, mutual funds managed by the investment adviser or its affiliates were the owners of record of all of the outstanding shares of the Fund.
9. Risk and Uncertainties.
Many factors affect a fund's performance. Developments that disrupt global economies and financial markets, such as pandemics, epidemics, outbreaks of infectious diseases, war, terrorism, and environmental disasters, may significantly affect a fund's investment performance. The effects of these developments to a fund will be impacted by the types of securities in which a fund invests, the financial condition, industry, economic sector, and geographic location of an issuer, and a fund's level of investment in the securities of that issuer. Significant concentrations in security types, issuers, industries, sectors, and geographic locations may magnify the factors that affect a fund's performance.
To the Board of Trustees of Fidelity Central Investment Portfolios LLC and the Shareholders of Fidelity U.S. Equity Central Fund:
Opinion on the Financial Statements and Financial Highlights
We have audited the accompanying statement of assets and liabilities of Fidelity U.S. Equity Central Fund (the "Fund"), a fund of Fidelity Central Investment Portfolios LLC, including the schedule of investments, as of June 30, 2023, the related statement of operations for the year then ended, the statement of changes in net assets for each of the two years in the period then ended, and the financial highlights for each of the two years in the period then ended and for the period from September 18, 2020 (commencement of operations) through June 30, 2021, and the related notes. In our opinion, the financial statements and financial highlights present fairly, in all material respects, the financial position of the Fund as of June 30, 2023, and the results of its operations for the year then ended, the changes in its net assets for each of the two years in the period then ended, and the financial highlights for each of the two years in the period then ended and for the period from September 18, 2020 (commencement of operations) through June 30, 2021, in conformity with accounting principles generally accepted in the United States of America.
Basis for Opinion
These financial statements and financial highlights are the responsibility of the Fund's management. Our responsibility is to express an opinion on the Fund's financial statements and financial highlights based on our audits. We are a public accounting firm registered with the Public Company Accounting Oversight Board (United States) (PCAOB) and are required to be independent with respect to the Fund in accordance with the U.S. federal securities laws and the applicable rules and regulations of the Securities and Exchange Commission and the PCAOB.
We conducted our audits in accordance with the standards of the PCAOB. Those standards require that we plan and perform the audit to obtain reasonable assurance about whether the financial statements and financial highlights are free of material misstatement, whether due to error or fraud. The Fund is not required to have, nor were we engaged to perform, an audit of its internal control over financial reporting. As part of our audits we are required to obtain an understanding of internal control over financial reporting but not for the purpose of expressing an opinion on the effectiveness of the Fund's internal control over financial reporting. Accordingly, we express no such opinion.
Our audits included performing procedures to assess the risks of material misstatement of the financial statements and financial highlights, whether due to error or fraud, and performing procedures that respond to those risks. Such procedures included examining, on a test basis, evidence regarding the amounts and disclosures in the financial statements and financial highlights. Our audits also included evaluating the accounting principles used and significant estimates made by management, as well as evaluating the overall presentation of the financial statements and financial highlights. Our procedures included confirmation of securities owned as of June 30, 2023, by correspondence with the custodian and brokers; when replies were not received from brokers, we performed other auditing procedures. We believe that our audits provide a reasonable basis for our opinion.
/s/ Deloitte & Touche LLP
Boston, Massachusetts
August 14, 2023
We have served as the auditor of one or more of the Fidelity investment companies since 1999.
DIRECTORS AND OFFICERS (TRUSTEES AND OFFICERS)
The Trustees, Members of the Advisory Board (if any), and officers of the Fidelity Central Investment Portfolios LLC and fund, as applicable, are listed below. The Board of Trustees governs the fund and is responsible for protecting the interests of shareholders. The Trustees are experienced executives who meet periodically throughout the year to oversee the fund's activities, review contractual arrangements with companies that provide services to the fund, oversee management of the risks associated with such activities and contractual arrangements, and review the fund's performance. Each of the Trustees oversees 321 funds.
The Trustees hold office without limit in time except that (a) any Trustee may resign; (b) any Trustee may be removed by written instrument, signed by at least two-thirds of the number of Trustees prior to such removal; (c) any Trustee who requests to be retired or who has become incapacitated by illness or injury may be retired by written instrument signed by a majority of the other Trustees; and (d) any Trustee may be removed at any special meeting of shareholders by a two-thirds vote of the outstanding voting securities of the trust. Each Trustee who is not an interested person (as defined in the 1940 Act) of the trust and the fund is referred to herein as an Independent Trustee. Each Independent Trustee shall retire not later than the last day of the calendar year in which his or her 75th birthday occurs. The Independent Trustees may waive this mandatory retirement age policy with respect to individual Trustees. Officers and Advisory Board Members hold office without limit in time, except that any officer or Advisory Board Member may resign or may be removed by a vote of a majority of the Trustees at any regular meeting or any special meeting of the Trustees. Except as indicated, each individual has held the office shown or other offices in the same company for the past five years.
The fund's Statement of Additional Information (SAI) includes more information about the Trustees. To request a free copy, call Fidelity at 1-800-544-8544.
Experience, Skills, Attributes, and Qualifications of the Trustees. The Governance and Nominating Committee has adopted a statement of policy that describes the experience, qualifications, attributes, and skills that are necessary and desirable for potential Independent Trustee candidates (Statement of Policy). The Board believes that each Trustee satisfied at the time he or she was initially elected or appointed a Trustee, and continues to satisfy, the standards contemplated by the Statement of Policy. The Governance and Nominating Committee also engages professional search firms to help identify potential Independent Trustee candidates who have the experience, qualifications, attributes, and skills consistent with the Statement of Policy. From time to time, additional criteria based on the composition and skills of the current Independent Trustees, as well as experience or skills that may be appropriate in light of future changes to board composition, business conditions, and regulatory or other developments, have also been considered by the professional search firms and the Governance and Nominating Committee. In addition, the Board takes into account the Trustees' commitment and participation in Board and committee meetings, as well as their leadership of standing and ad hoc committees throughout their tenure.
In determining that a particular Trustee was and continues to be qualified to serve as a Trustee, the Board has considered a variety of criteria, none of which, in isolation, was controlling. The Board believes that, collectively, the Trustees have balanced and diverse experience, qualifications, attributes, and skills, which allow the Board to operate effectively in governing the fund and protecting the interests of shareholders. Information about the specific experience, skills, attributes, and qualifications of each Trustee, which in each case led to the Board's conclusion that the Trustee should serve (or continue to serve) as a trustee of the fund, is provided below.
Board Structure and Oversight Function. Robert A. Lawrence is an interested person and currently serves as Chair. The Trustees have determined that an interested Chair is appropriate and benefits shareholders because an interested Chair has a personal and professional stake in the quality and continuity of services provided to the fund. Independent Trustees exercise their informed business judgment to appoint an individual of their choosing to serve as Chair, regardless of whether the Trustee happens to be independent or a member of management. The Independent Trustees have determined that they can act independently and effectively without having an Independent Trustee serve as Chair and that a key structural component for assuring that they are in a position to do so is for the Independent Trustees to constitute a substantial majority for the Board. The Independent Trustees also regularly meet in executive session. David M. Thomas serves as Lead Independent Trustee and as such (i) acts as a liaison between the Independent Trustees and management with respect to matters important to the Independent Trustees and (ii) with management prepares agendas for Board meetings.
Fidelity ® funds are overseen by different Boards of Trustees. The fund's Board oversees Fidelity's high income and certain equity funds, and other Boards oversee Fidelity's alternative investment, investment-grade bond, money market, asset allocation, and other equity funds. The asset allocation funds may invest in Fidelity ® funds overseen by the fund's Board. The use of separate Boards, each with its own committee structure, allows the Trustees of each group of Fidelity ® funds to focus on the unique issues of the funds they oversee, including common research, investment, and operational issues. On occasion, the separate Boards establish joint committees to address issues of overlapping consequences for the Fidelity ® funds overseen by each Board.
The Trustees operate using a system of committees to facilitate the timely and efficient consideration of all matters of importance to the Trustees, the fund, and fund shareholders and to facilitate compliance with legal and regulatory requirements and oversight of the fund's activities and associated risks. The Board, acting through its committees, has charged FMR and its affiliates with (i) identifying events or circumstances the occurrence of which could have demonstrably adverse effects on the fund's business and/or reputation; (ii) implementing processes and controls to lessen the possibility that such events or circumstances occur or to mitigate the effects of such events or circumstances if they do occur; and (iii) creating and maintaining a system designed to evaluate continuously business and market conditions in order to facilitate the identification and implementation processes described in (i) and (ii) above. Because the day-to-day operations and activities of the fund are carried out by or through FMR, its affiliates, and other service providers, the fund's exposure to risks is mitigated but not eliminated by the processes overseen by the Trustees. While each of the Board's committees has responsibility for overseeing different aspects of the fund's activities, oversight is exercised primarily through the Operations, Audit, and Compliance Committees. Appropriate personnel, including but not limited to the fund's Chief Compliance Officer (CCO), FMR's internal auditor, the independent accountants, the fund's Treasurer and portfolio management personnel, make periodic reports to the Board's committees, as appropriate, including an annual review of Fidelity's risk management program for the Fidelity ® funds. The responsibilities of each standing committee, including their oversight responsibilities, are described further under "Standing Committees of the Trustees."
Interested Trustees*:
Correspondence intended for a Trustee who is an interested person may be sent to Fidelity Investments, 245 Summer Street, Boston, Massachusetts 02210.
Name, Year of Birth; Principal Occupations and Other Relevant Experience+
Bettina Doulton (1964)
Year of Election or Appointment: 2020
Trustee
Ms. Doulton also serves as Trustee of other Fidelity ® funds. Prior to her retirement, Ms. Doulton served in a variety of positions at Fidelity Investments, including as a managing director of research (2006-2007), portfolio manager to certain Fidelity ® funds (1993-2005), equity analyst and portfolio assistant (1990-1993), and research assistant (1987-1990). Ms. Doulton currently owns and operates Phi Builders + Architects and Cellardoor Winery. Previously, Ms. Doulton served as a member of the Board of Brown Capital Management, LLC (2014-2018).
Robert A. Lawrence (1952)
Year of Election or Appointment: 2020
Trustee
Chair of the Board of Trustees
Mr. Lawrence also serves as Trustee of other funds. Previously, Mr. Lawrence served as a Trustee and Member of the Advisory Board of certain funds. Prior to his retirement in 2008, Mr. Lawrence served as Vice President of certain Fidelity ® funds (2006-2008), Senior Vice President, Head of High Income Division of Fidelity Management & Research Company (investment adviser firm, 2006-2008), and President of Fidelity Strategic Investments (investment adviser firm, 2002-2005).
* Determined to be an "Interested Trustee" by virtue of, among other things, his or her affiliation with the Fidelity Central Investment Portfolios LLC or various entities under common control with FMR.
+ The information includes the Trustee's principal occupation during the last five years and other information relating to the experience, attributes, and skills relevant to the Trustee's qualifications to serve as a Trustee, which led to the conclusion that the Trustee should serve as a Trustee for the fund.
Independent Trustees:
Correspondence intended for an Independent Trustee may be sent to Fidelity Investments, P.O. Box 55235, Boston, Massachusetts 02205-5235.
Name, Year of Birth; Principal Occupations and Other Relevant Experience+
Thomas P. Bostick (1956)
Year of Election or Appointment: 2021
Trustee
Lieutenant General Bostick also serves as Trustee of other Fidelity ® funds. Prior to his retirement, General Bostick (United States Army, Retired) held a variety of positions within the U.S. Army, including Commanding General and Chief of Engineers, U.S. Army Corps of Engineers (2012-2016) and Deputy Chief of Staff and Director of Human Resources, U.S. Army (2009-2012). General Bostick currently serves as a member of the Board and Finance and Governance & Sustainability Committees of CSX Corporation (transportation, 2020-present) and a member of the Board and Corporate Governance and Nominating Committee of Perma-Fix Environmental Services, Inc. (nuclear waste management, 2020-present). General Bostick serves as Chief Executive Officer of Bostick Global Strategies, LLC (consulting, 2016-present), as a member of the Board of HireVue, Inc. (video interview and assessment, 2020-present), as a member of the Board of Allonnia (biotechnology and engineering solutions, 2022-present) and on the Advisory Board of Solugen, Inc. (specialty bio-based chemicals manufacturer, 2022-present). Previously, General Bostick served as a Member of the Advisory Board of certain Fidelity ® funds (2021), President, Intrexon Bioengineering (2018-2020) and Chief Operating Officer (2017-2020) and Senior Vice President of the Environment Sector (2016-2017) of Intrexon Corporation (biopharmaceutical company).
Dennis J. Dirks (1948)
Year of Election or Appointment: 2005
Trustee
Mr. Dirks also serves as Trustee of other Fidelity ® funds. Prior to his retirement in May 2003, Mr. Dirks served as Chief Operating Officer and as a member of the Board of The Depository Trust & Clearing Corporation (financial markets infrastructure), President, Chief Operating Officer and a member of the Board of The Depository Trust Company (DTC), President and a member of the Board of the National Securities Clearing Corporation (NSCC), Chief Executive Officer and a member of the Board of the Government Securities Clearing Corporation and Chief Executive Officer and a member of the Board of the Mortgage-Backed Securities Clearing Corporation. Mr. Dirks currently serves as a member of the Finance Committee (2016-present) and Board (2017-present) and is Treasurer (2018-present) of the Asolo Repertory Theatre.
Donald F. Donahue (1950)
Year of Election or Appointment: 2018
Trustee
Mr. Donahue also serves as Trustee of other Fidelity ® funds. Mr. Donahue serves as President and Chief Executive Officer of Miranda Partners, LLC (risk consulting for the financial services industry, 2012-present). Previously, Mr. Donahue served as Chief Executive Officer (2006-2012), Chief Operating Officer (2003-2006) and Managing Director, Customer Marketing and Development (1999-2003) of The Depository Trust & Clearing Corporation (financial markets infrastructure). Mr. Donahue currently serves as a member (2007-present) and Co-Chairman (2016-present) of the Board of United Way of New York. Mr. Donahue previously served as a member of the Advisory Board of certain Fidelity ® funds (2015-2018) and as a member of the Board of The Leadership Academy (previously NYC Leadership Academy) (2012-2022).
Vicki L. Fuller (1957)
Year of Election or Appointment: 2020
Trustee
Ms. Fuller also serves as Trustee of other Fidelity ® funds. Previously, Ms. Fuller served as a member of the Advisory Board of certain Fidelity ® funds (2018-2020), Chief Investment Officer of the New York State Common Retirement Fund (2012-2018) and held a variety of positions at AllianceBernstein L.P. (global asset management, 1985-2012), including Managing Director (2006-2012) and Senior Vice President and Senior Portfolio Manager (2001-2006). Ms. Fuller currently serves as a member of the Board, Audit Committee and Nominating and Governance Committee of two Blackstone business development companies (2020-present), as a member of the Board of Treliant, LLC (consulting, 2019-present), as a member of the Board of Ariel Alternatives, LLC (private equity, 2022-present) and as a member of the Board and Chair of the Audit Committee of Gusto, Inc. (software, 2021-present). In addition, Ms. Fuller currently serves as a member of the Board of Roosevelt University (2019-present) and as a member of the Executive Board of New York University's Stern School of Business. Ms. Fuller previously served as a member of the Board, Audit Committee and Nominating and Governance Committee of The Williams Companies, Inc. (natural gas infrastructure, 2018-2021).
Patricia L. Kampling (1959)
Year of Election or Appointment: 2020
Trustee
Ms. Kampling also serves as Trustee of other Fidelity ® funds. Prior to her retirement, Ms. Kampling served as Chairman of the Board and Chief Executive Officer (2012-2019), President and Chief Operating Officer (2011-2012) and Executive Vice President and Chief Financial Officer (2010-2011) of Alliant Energy Corporation. Ms. Kampling currently serves as a member of the Board, Finance Committee and Governance, Compensation and Nominating Committee of Xcel Energy Inc. (utilities company, 2020-present) and as a member of the Board, Audit, Finance and Risk Committee and Safety, Environmental, Technology and Operations Committee and Chair of the Executive Development and Compensation Committee of American Water Works Company, Inc. (utilities company, 2019-present). In addition, Ms. Kampling currently serves as a member of the Board of the Nature Conservancy, Wisconsin Chapter (2019-present). Previously, Ms. Kampling served as a Member of the Advisory Board of certain Fidelity® funds (2020), a member of the Board, Compensation Committee and Executive Committee and Chair of the Audit Committee of Briggs & Stratton Corporation (manufacturing, 2011-2021), a member of the Board of Interstate Power and Light Company (2012-2019) and Wisconsin Power and Light Company (2012-2019) (each a subsidiary of Alliant Energy Corporation) and as a member of the Board and Workforce Development Committee of the Business Roundtable (2018-2019).
Thomas A. Kennedy (1955)
Year of Election or Appointment: 2021
Trustee
Mr. Kennedy also serves as Trustee of other Fidelity ® funds. Previously, Mr. Kennedy served as a Member of the Advisory Board of certain Fidelity ® funds (2020) and held a variety of positions at Raytheon Company (aerospace and defense, 1983-2020), including Chairman and Chief Executive Officer (2014-2020) and Executive Vice President and Chief Operating Officer (2013-2014). Mr. Kennedy served as Executive Chairman of the Board of Directors of Raytheon Technologies Corporation (aerospace and defense, 2020-2021). Mr. Kennedy serves as a Director of the Board of Directors of Textron Inc. (aerospace and defense, 2023-present).
Oscar Munoz (1959)
Year of Election or Appointment: 2021
Trustee
Mr. Munoz also serves as Trustee of other Fidelity ® funds. Prior to his retirement, Mr. Munoz served as Executive Chairman (2020-2021), Chief Executive Officer (2015-2020), President (2015-2016) and a member of the Board (2010-2021) of United Airlines Holdings, Inc. Mr. Munoz currently serves as a member of the Board of CBRE Group, Inc. (commercial real estate, 2020-present), a member of the Board of Univision Communications, Inc. (Hispanic media, 2020-present), a member of the Board of Archer Aviation Inc. (2021-present), a member of the Defense Business Board of the United States Department of Defense (2021-present) and a member of the Board of Salesforce.com, Inc. (cloud-based software, 2022-present). Previously, Mr. Munoz served as a Member of the Advisory Board of certain Fidelity ® funds (2021).
David M. Thomas (1949)
Year of Election or Appointment: 2008
Trustee
Lead Independent Trustee
Mr. Thomas also serves as Trustee of other Fidelity ® funds. Previously, Mr. Thomas served as Executive Chairman (2005-2006) and Chairman and Chief Executive Officer (2000-2005) of IMS Health, Inc. (pharmaceutical and healthcare information solutions). Mr. Thomas currently serves as a member of the Board of Fortune Brands Home and Security (home and security products, 2004-present) and as Director (2013-present) and Non-Executive Chairman of the Board (2022-present) of Interpublic Group of Companies, Inc. (marketing communication).
Susan Tomasky (1953)
Year of Election or Appointment: 2020
Trustee
Ms. Tomasky also serves as Trustee of other Fidelity ® funds. Prior to her retirement, Ms. Tomasky served in various executive officer positions at American Electric Power Company, Inc. (1998-2011), including most recently as President of AEP Transmission (2007-2011). Ms. Tomasky currently serves as a member of the Board and Sustainability Committee and as Chair of the Audit Committee of Marathon Petroleum Corporation (2018-present) and as a member of the Board, Executive Committee, Corporate Governance Committee and Organization and Compensation Committee and as Lead Director of the Board of Public Service Enterprise Group, Inc. (utilities company, 2012-present) and as a member of the Board of its subsidiary company, Public Service Electric and Gas Co. (2021-present). In addition, Ms. Tomasky currently serves as a member (2009-present) and President (2020-present) of the Board of the Royal Shakespeare Company - America (2009-present), as a member of the Board of the Columbus Association for the Performing Arts (2011-present) and as a member of the Board and Kenyon in the World Committee of Kenyon College (2016-present). Previously, Ms. Tomasky served as a Member of the Advisory Board of certain Fidelity ® funds (2020), as a member of the Board of the Columbus Regional Airport Authority (2007-2020), as a member of the Board (2011-2018) and Lead Independent Director (2015-2018) of Andeavor Corporation (previously Tesoro Corporation) (independent oil refiner and marketer) and as a member of the Board of Summit Midstream Partners LP (energy, 2012-2018).
Michael E. Wiley (1950)
Year of Election or Appointment: 2018
Trustee
Mr. Wiley also serves as Trustee of other Fidelity ® funds. Previously, Mr. Wiley served as a member of the Advisory Board of certain Fidelity ® funds (2018-2020), Chairman, President and CEO of Baker Hughes, Inc. (oilfield services, 2000-2004). Mr. Wiley also previously served as a member of the Board of Andeavor Corporation (independent oil refiner and marketer, 2005-2018), a member of the Board of Andeavor Logistics LP (natural resources logistics, 2015-2018) and a member of the Board of High Point Resources (exploration and production, 2005-2020).
+ The information includes the Trustee's principal occupation during the last five years and other information relating to the experience, attributes, and skills relevant to the Trustee's qualifications to serve as a Trustee, which led to the conclusion that the Trustee should serve as a Trustee for the fund.
Advisory Board Members and Officers:
Correspondence intended for a Member of the Advisory Board (if any) may be sent to Fidelity Investments, P.O. Box 55235, Boston, Massachusetts 02205-5235. Correspondence intended for an officer or Peter S. Lynch may be sent to Fidelity Investments, 245 Summer Street, Boston, Massachusetts 02210. Officers appear below in alphabetical order.
Name, Year of Birth; Principal Occupation
Peter S. Lynch (1944)
Year of Election or Appointment: 2004
Member of the Advisory Board
Mr. Lynch also serves as a Member of the Advisory Board of other Fidelity ® funds. Mr. Lynch is Vice Chairman and a Director of Fidelity Management & Research Company LLC (investment adviser firm). In addition, Mr. Lynch serves as a Trustee of Boston College and as the Chairman of the Inner-City Scholarship Fund. Previously, Mr. Lynch served as Vice Chairman and a Director of FMR Co., Inc. (investment adviser firm) and on the Special Olympics International Board of Directors (1997-2006).
Heather Bonner (1977)
Year of Election or Appointment: 2023
Assistant Treasurer
Ms. Bonner also serves as an officer of other funds. Ms. Bonner serves as Senior Vice President (2022-present), and is an employee of Fidelity Investments. Ms. Bonner serves as Assistant Treasurer of Fidelity CRET Trustee LLC (2022-present). Prior to joining Fidelity, Ms. Bonner served as Managing Director at AQR Capital Management (2013-2022) and was the Treasurer and Principal Financial Officer of the AQR Funds (2013-2022).
Craig S. Brown (1977)
Year of Election or Appointment: 2022
Deputy Treasurer
Mr. Brown also serves as an officer of other funds. Mr. Brown serves as Assistant Treasurer of FIMM, LLC (2021-present) and is an employee of Fidelity Investments (2013-present). Previously, Mr. Brown served as Assistant Treasurer of certain Fidelity ® funds (2019-2022).
John J. Burke III (1964)
Year of Election or Appointment: 2018
Chief Financial Officer
Mr. Burke also serves as Chief Financial Officer of other funds. Mr. Burke serves as Head of Investment Operations for Fidelity Fund and Investment Operations (2018-present) and is an employee of Fidelity Investments (1998-present). Previously Mr. Burke served as head of Asset Management Investment Operations (2012-2018).
Margaret Carey (1973)
Year of Election or Appointment: 2023
Secretary and Chief Legal Officer (CLO)
Ms. Carey also serves as an officer of other funds and as CLO of certain other Fidelity entities. She is a Senior Vice President and Deputy General Counsel of FMR LLC (diversified financial services company, 2019-present), and is an employee of Fidelity Investments.
William C. Coffey (1969)
Year of Election or Appointment: 2019
Assistant Secretary
Mr. Coffey also serves as Assistant Secretary of other funds. He is Senior Vice President and Deputy General Counsel of FMR LLC (diversified financial services company, 2010-present), and is an employee of Fidelity Investments. Previously, Mr. Coffey served as Secretary and CLO of certain funds (2018-2019); CLO, Secretary, and Senior Vice President of Fidelity Management & Research Company and FMR Co., Inc. (investment adviser firms, 2018-2019); Secretary of Fidelity SelectCo, LLC and Fidelity Investments Money Management, Inc. (investment adviser firms, 2018-2019); CLO of Fidelity Management & Research (Hong Kong) Limited, FMR Investment Management (UK) Limited, and Fidelity Management & Research (Japan) Limited (investment adviser firms, 2018-2019); and Assistant Secretary of certain funds (2009-2018).
Timothy M. Cohen (1969)
Year of Election or Appointment: 2018
Vice President
Mr. Cohen also serves as Vice President of other funds. Mr. Cohen serves as Co-Head of Equity (2018-present), a Director of Fidelity Management & Research (Japan) Limited (investment adviser firm, 2016-present), and is an employee of Fidelity Investments. Previously, Mr. Cohen served as Executive Vice President of Fidelity SelectCo, LLC (2019), Head of Global Equity Research (2016-2018), Chief Investment Officer - Equity and a Director of Fidelity Management & Research (U.K.) Inc. (investment adviser firm, 2013-2015) and as a Director of Fidelity Management & Research (Hong Kong) Limited (investment adviser firm, 2017).
Jonathan Davis (1968)
Year of Election or Appointment: 2010
Assistant Treasurer
Mr. Davis also serves as an officer of other funds. Mr. Davis serves as Vice President Assistant Treasurer and is an employee of Fidelity Investments. Mr. Davis serves as Assistant Treasurer of certain Fidelity entities.
Laura M. Del Prato (1964)
Year of Election or Appointment: 2018
Assistant Treasurer
Ms. Del Prato also serves as an officer of other funds. Ms. Del Prato serves as Assistant Treasurer of FIMM, LLC (2021-present) and is an employee of Fidelity Investments (2017-present). Previously, Ms. Del Prato served as President and Treasurer of The North Carolina Capital Management Trust: Cash Portfolio and Term Portfolio (2018-2020). Prior to joining Fidelity Investments, Ms. Del Prato served as a Managing Director and Treasurer of the JPMorgan Mutual Funds (2014-2017). Prior to JPMorgan, Ms. Del Prato served as a partner at Cohen Fund Audit Services (accounting firm, 2012-2013) and KPMG LLP (accounting firm, 2004-2012).
Colm A. Hogan (1973)
Year of Election or Appointment: 2020
Assistant Treasurer
Mr. Hogan also serves as an officer of other funds. Mr. Hogan serves as Assistant Treasurer of FIMM, LLC (2021-present) and FMR Capital, Inc. (2017-present) and is an employee of Fidelity Investments (2005-present). Previously, Mr. Hogan served as Deputy Treasurer of certain Fidelity ® funds (2016-2020) and Assistant Treasurer of certain Fidelity ® funds (2016-2018).
Pamela R. Holding (1964)
Year of Election or Appointment: 2018
Vice President
Ms. Holding also serves as Vice President of other funds. Ms. Holding serves as Co-Head of Equity (2018-present) and is an employee of Fidelity Investments (2013-present). Previously, Ms. Holding served as Executive Vice President of Fidelity SelectCo, LLC (2019) and as Chief Investment Officer of Fidelity Institutional Asset Management (2013-2018).
Chris Maher (1972)
Year of Election or Appointment: 2020
Deputy Treasurer
Mr. Maher also serves as an officer of other funds. Mr. Maher serves as Assistant Treasurer of FIMM, LLC (2021-present) and FMR Capital, Inc. (2017-present), and is an employee of Fidelity Investments (2008-present). Previously, Mr. Maher served as Assistant Treasurer of certain funds (2013-2020); Vice President of Asset Management Compliance (2013), Vice President of the Program Management Group of FMR (investment adviser firm, 2010-2013), and Vice President of Valuation Oversight (2008-2010).
Jason P. Pogorelec (1975)
Year of Election or Appointment: 2020
Chief Compliance Officer
Mr. Pogorelec also serves as Chief Compliance Officer of other funds. Mr. Pogorelec is a Senior Vice President of Asset Management Compliance for Fidelity Investments and is an employee of Fidelity Investments. Mr. Pogorelec serves as Compliance Officer of Fidelity Management & Research Company LLC (investment adviser firm, 2023-present). Previously, Mr. Pogorelec served as Vice President, Associate General Counsel for Fidelity Investments (2010-2020) and Assistant Secretary of certain Fidelity ® funds (2015-2020).
Brett Segaloff (1972)
Year of Election or Appointment: 2021
Anti-Money Laundering (AML) Officer
Mr. Segaloff also serves as an AML Officer of other funds and other related entities. He is Director, Anti-Money Laundering (2007-present) of FMR LLC (diversified financial services company) and is an employee of Fidelity Investments (1996-present).
Stacie M. Smith (1974)
Year of Election or Appointment: 2016
President and Treasurer
Ms. Smith also serves as an officer of other funds. Ms. Smith serves as Assistant Treasurer of FIMM, LLC (2021-present) and FMR Capital, Inc. (2017-present), is an employee of Fidelity Investments (2009-present), and has served in other fund officer roles. Prior to joining Fidelity Investments, Ms. Smith served as Senior Audit Manager of Ernst & Young LLP (accounting firm, 1996-2009). Previously, Ms. Smith served as Assistant Treasurer (2013-2019) and Deputy Treasurer (2013-2016) of certain Fidelity ® funds.
Jim Wegmann (1979)
Year of Election or Appointment: 2019
Assistant Treasurer
Mr. Wegmann also serves as an officer of other funds. Mr. Wegmann serves as Assistant Treasurer of FIMM, LLC (2021-present) and is an employee of Fidelity Investments (2011-present). Previously, Mr. Wegmann served as Assistant Treasurer of certain Fidelity ® funds (2019-2021).
As a shareholder, you incur two types of costs: (1) transaction costs, which may include sales charges (loads) on purchase payments or redemption proceeds, as applicable and (2) ongoing costs, which generally include management fees, distribution and/or service (12b-1) fees and other Fund expenses. This Example is intended to help you understand your ongoing costs (in dollars) of investing in a fund and to compare these costs with the ongoing costs of investing in other mutual funds.
| The Example is based on an investment of $1,000 invested at the beginning of the period and held for the entire period (January 1, 2023 to June 30, 2023). |
Actual Expenses
The first line of the accompanying table provides information about actual account values and actual expenses. You may use the information in this line, together with the amount you invested, to estimate the expenses that you paid over the period. Simply divide your account value by $1,000.00 (for example, an $8,600 account value divided by $1,000.00 = 8.6), then multiply the result by the number in the first line for a class/Fund under the heading entitled "Expenses Paid During Period" to estimate the expenses you paid on your account during this period. If any fund is a shareholder of any underlying mutual funds or exchange-traded funds (ETFs) (the Underlying Funds), such fund indirectly bears its proportional share of the expenses of the Underlying Funds in addition to the direct expenses incurred presented in the table. These fees and expenses are not included in the annualized expense ratio used to calculate the expense estimate in the table below.
Hypothetical Example for Comparison Purposes
The second line of the accompanying table provides information about hypothetical account values and hypothetical expenses based on the actual expense ratio and an assumed rate of return of 5% per year before expenses, which is not the actual return. The hypothetical account values and expenses may not be used to estimate the actual ending account balance or expenses you paid for the period. You may use this information to compare the ongoing costs of investing in the Fund and other funds. To do so, compare this 5% hypothetical example with the 5% hypothetical examples that appear in the shareholder reports of the other funds. If any fund is a shareholder of any Underlying Funds, such fund indirectly bears its proportional share of the expenses of the Underlying Funds in addition to the direct expenses as presented in the table. These fees and expenses are not included in the annualized expense ratio used to calculate the expense estimate in the table below.
Please note that the expenses shown in the table are meant to highlight your ongoing costs only and do not reflect any transaction costs. Therefore, the second line of the table is useful in comparing ongoing costs only, and will not help you determine the relative total costs of owning different funds. In addition, if these transactional costs were included, your costs would have been higher.
| | | | | Annualized Expense Ratio- A | | Beginning Account Value January 1, 2023 | | Ending Account Value June 30, 2023 | | Expenses Paid During Period- C January 1, 2023 to June 30, 2023 |
| | | | | | | | | | |
| Fidelity® U.S. Equity Central Fund | | | | 0.0016% | | | | | | |
| Actual | | | | | | $ 1,000 | | $ 1,169.30 | | $ .01 |
Hypothetical- B | | | | | | $ 1,000 | | $ 1,024.79 | | $ .01 |
| |
A Annualized expense ratio reflects expenses net of applicable fee waivers.
B 5% return per year before expenses
C Expenses are equal to the annualized expense ratio, multiplied by the average account value over the period, multiplied by 181/ 365 (to reflect the one-half year period). The fees and expenses of any Underlying Funds are not included in each annualized expense ratio.
The dividend and capital gains distributions for the fund(s) are available on Fidelity.com or Institutional.Fidelity.com .
The fund hereby designates as a capital gain dividend with respect to the taxable year ended June 30, 2023, $697,221,681, or, if subsequently determined to be different, the net capital gain of such year.
A total of 0.09% of the dividends distributed during the fiscal year was derived from interest on U.S. Government securities which is generally exempt from state income tax.
The fund designates $6,857,819 of distributions paid during the fiscal year ended 2023 as qualifying to be taxed as section 163(j) interest dividends.
The fund designates 42%, 78%, 98%, and 98% of the dividends distributed in September, December, March, and June, respectively during the fiscal year as qualifying for the dividends-received deduction for corporate shareholders.
The fund designates 67.03%, 84.51%, 100%, and 100% of the dividends distributed in September, December, March, and June, respectively during the fiscal year as amounts which may be taken into account as a dividend for the purposes of the maximum rate under section 1(h)(11) of the Internal Revenue Code.
The fund designates 7.29%, 7.58%, 0%, and 0% of the dividends distributed in September, December, March, and June, respectively during the fiscal year as a section 199A dividend.
The fund will notify shareholders in January 2024 of amounts for use in preparing 2023 income tax returns.
Board Approval of Investment Advisory Contracts
Fidelity U.S. Equity Central Fund
At its May 2023 meeting, the Board of Trustees, including the Independent Trustees (together, the Board), voted to continue the management contract with Fidelity Management & Research Company LLC (FMR), and the sub-advisory agreements and sub-subadvisory agreements, in each case, where applicable (together, the Advisory Contracts) for the fund for two months from June 1, 2023 through July 31, 2023. The Board determined that it will consider the annual renewal of the fund's Advisory Contracts for a full one year period in July 2023, following its review of additional materials provided by FMR.
The Board considered that the approval of the fund's Advisory Contracts will not result in any changes in (i) the investment process or strategies employed in the management of the fund's assets; (ii) the fees and expenses paid by shareholders; (iii) the nature, extent or quality of services provided under the fund's Advisory Contracts; or (iv) the day-to-day management of the fund or the persons primarily responsible for such management. The Board also considered that since its last approval of the fund's Advisory Contracts, FMR had provided additional information on the fund in support of the annual contract renewal process, including competitive analyses on total expenses and management fees and in-depth reviews of fund performance and fund profitability information. The Board concluded that the fund's Advisory Contracts are fair and reasonable, and that the fund's Advisory Contracts should be renewed, without modification, through July 31, 2023, with the understanding that the Board will consider the annual renewal for a full one year period in July 2023.
In connection with its consideration of future renewals of the fund's Advisory Contracts, the Board will consider: (i) the nature, extent and quality of services provided to the fund, including shareholder and administrative services and investment performance; (ii) the competitiveness of the management fee and total expenses for the fund; (iii) the costs of the services and profitability, including the revenues earned and the expenses incurred in conducting the business of developing, marketing, distributing, managing, administering, and servicing the fund and its shareholders, to the extent applicable; and (iv) whether there have been economies of scale in respect of the Fidelity funds, whether the Fidelity funds (including the fund) have appropriately benefited from any such economies of scale, and whether there is the potential for realization of any further economies.
Based on its evaluation of all of the conclusions noted above, and after considering all factors it believed relevant, the Board ultimately concluded that the fund's management fee structure is fair and reasonable, and that the continuation of the fund's Advisory Contracts should be approved for two months from June 1, 2023 through July 31, 2023.
The Securities and Exchange Commission adopted Rule 22e-4 under the Investment Company Act of 1940 (the Liquidity Rule) to promote effective liquidity risk management throughout the open-end investment company industry, thereby reducing the risk that funds will be unable to meet their redemption obligations and mitigating dilution of the interests of fund shareholders.
The Fund has adopted and implemented a liquidity risk management program (the Program) reasonably designed to assess and manage the Fund's liquidity risk and to comply with the requirements of the Liquidity Rule. The Fund's Board of Trustees (the Board) has designated the Fund's investment adviser as administrator of the Program. The Fidelity advisers have established a Liquidity Risk Management Committee (the LRM Committee) to manage the Program for each of the Fidelity Funds. The LRM Committee monitors the adequacy and effectiveness of implementation of the Program and on a periodic basis assesses each Fund's liquidity risk based on a variety of factors including (1) the Fund's investment strategy, (2) portfolio liquidity and cash flow projections during normal and reasonably foreseeable stressed conditions, (3) shareholder redemptions, (4) borrowings and other funding sources and (5) certain factors specific to ETFs including the effect of the Fund's prices and spreads, market participants, and basket compositions on the overall liquidity of the Fund's portfolio, as applicable.
In accordance with the Program, each of the Fund's portfolio investments is classified into one of four defined liquidity categories based on a determination of a reasonable expectation for how long it would take to convert the investment to cash (or sell or dispose of the investment) without significantly changing its market value.
- Highly liquid investments - cash or convertible to cash within three business days or less
- Moderately liquid investments - convertible to cash in three to seven calendar days
- Less liquid investments - can be sold or disposed of, but not settled, within seven calendar days
- Illiquid investments - cannot be sold or disposed of within seven calendar days
Liquidity classification determinations take into account a variety of factors including various market, trading and investment-specific considerations, as well as market depth, and generally utilize analysis from a third-party liquidity metrics service.
The Liquidity Rule places a 15% limit on a fund's illiquid investments and requires funds that do not primarily hold assets that are highly liquid investments to determine and maintain a minimum percentage of the fund's net assets to be invested in highly liquid investments (highly liquid investment minimum or HLIM). The Program includes provisions reasonably designed to comply with the 15% limit on illiquid investments and for determining, periodically reviewing and complying with the HLIM requirement as applicable.
At a recent meeting of the Fund's Board of Trustees, the LRM Committee provided a written report to the Board pertaining to the operation, adequacy, and effectiveness of the Program for the period December 1, 2021 through November 30, 2022. The report concluded that the Program is operating effectively and is reasonably designed to assess and manage the Fund's liquidity risk.
1.9900193.102
USE-ANN-0823
Item 2.
Code of Ethics
As of the end of the period, June 30, 2023, Fidelity Central Investment Portfolios LLC (the trust) has adopted a code of ethics, as defined in Item 2 of Form N-CSR, that applies to its President and Treasurer and its Chief Financial Officer. A copy of the code of ethics is filed as an exhibit to this Form N-CSR.
Item 3.
Audit Committee Financial Expert
The Board of Trustees of the trust has determined that Donald F. Donahue is an audit committee financial expert, as defined in Item 3 of Form N-CSR. Mr. Donahue is independent for purposes of Item 3 of Form N-CSR.
Item 4.
Principal Accountant Fees and Services
Fees and Services
The following table presents fees billed by Deloitte & Touche LLP, the member firms of Deloitte Touche Tohmatsu, and their respective affiliates (collectively, “Deloitte Entities”) in each of the last two fiscal years for services rendered to Fidelity U.S. Equity Central Fund (the “Fund”):
Services Billed by Deloitte Entities
June 30, 2023 FeesA
| | | | |
| Audit Fees | Audit-Related Fees | Tax Fees | All Other Fees |
Fidelity U.S. Equity Central Fund | $50,000 | $- | $8,000 | $1,100 |
| | | | |
| Audit Fees | Audit-Related Fees | Tax Fees | All Other Fees |
Fidelity U.S. Equity Central Fund | $46,700 | $- | $9,900 | $1,000 |
A Amounts may reflect rounding.
The following table(s) present(s) fees billed by Deloitte Entities that were required to be approved by the Audit Committee for services that relate directly to the operations and financial reporting of the Fund(s) and that are rendered on behalf of Fidelity Management
& Research Company LLC ("FMR") and entities controlling, controlled by, or under common control with FMR (not including any sub-adviser whose role is primarily portfolio management and is subcontracted with or overseen by another investment adviser) that provide ongoing services to the Fund(s) (“Fund Service Providers”):
Services Billed by Deloitte Entities
| | |
| June 30, 2023A | June 30, 2022 A |
Audit-Related Fees | $- | $- |
Tax Fees | $- | $- |
All Other Fees | $- | $- |
A Amounts may reflect rounding.
“Audit-Related Fees” represent fees billed for assurance and related services that are reasonably related to the performance of the fund audit or the review of the fund's financial statements and that are not reported under Audit Fees.
“Tax Fees” represent fees billed for tax compliance, tax advice or tax planning that relate directly to the operations and financial reporting of the fund.
“All Other Fees” represent fees billed for services provided to the fund or Fund Service Provider, a significant portion of which are assurance related, that relate directly to the operations and financial reporting of the fund, excluding those services that are reported under Audit Fees, Audit-Related Fees or Tax Fees.
Assurance services must be performed by an independent public accountant.
* * *
The aggregate non-audit fees billed by Deloitte Entities for services rendered to the Fund(s), FMR (not including any sub-adviser whose role is primarily portfolio management and is subcontracted with or overseen by another investment adviser), and any Fund Service Provider for each of the last two fiscal years of the Fund(s) are as follows:
| | |
Billed By | June 30, 2023A | June 30, 2022A |
Deloitte Entities | $251,700 | $468,500 |
|
|
|
A Amounts may reflect rounding.
The trust's Audit Committee has considered non-audit services that were not pre-approved that were provided by Deloitte Entities to Fund Service Providers to be compatible with maintaining the independence of Deloitte Entities in its(their) audit of the Fund(s), taking into account representations from Deloitte Entities, in accordance with Public Company Accounting Oversight Board rules, regarding its independence from the Fund(s) and its(their) related entities and FMR’s review of the appropriateness and permissibility under applicable law of such non-audit services prior to their provision to the Fund(s) Service Providers.
Audit Committee Pre-Approval Policies and Procedures
The trust’s Audit Committee must pre-approve all audit and non-audit services provided by a fund’s independent registered public accounting firm relating to the operations or financial reporting of the fund. Prior to the commencement of any audit or non-audit services to a fund, the Audit Committee reviews the services to determine whether they are appropriate and permissible under applicable law.
The Audit Committee has adopted policies and procedures to, among other purposes, provide a framework for the Committee’s consideration of non-audit services by the audit firms that audit the Fidelity funds. The policies and procedures require that any non-audit service provided by a fund audit firm to a Fidelity fund and any non-audit service provided by a fund auditor to a Fund Service Provider that relates directly to the operations and financial reporting of a Fidelity fund (“Covered Service”) are subject to approval by the Audit Committee before such service is provided.
All Covered Services must be approved in advance of provision of the service either: (i) by formal resolution of the Audit Committee, or (ii) by oral or written approval of the service by the Chair of the Audit Committee (or if the Chair is unavailable, such other member of the Audit Committee as may be designated by the Chair to act in the Chair’s absence). The approval contemplated by (ii) above is permitted where the Treasurer determines that action on such an engagement is necessary before the next meeting of the Audit Committee.
Non-audit services provided by a fund audit firm to a Fund Service Provider that do not relate directly to the operations and financial reporting of a Fidelity fund are reported to the Audit Committee periodically.
Non-Audit Services Approved Pursuant to Rule 2-01(c)(7)(i)(C) and (ii) of Regulation S-X (“De Minimis Exception”)
There were no non-audit services approved or required to be approved by the Audit Committee pursuant to the De Minimis Exception during the Fund’s(s’) last two fiscal years relating to services provided to (i) the Fund(s) or (ii) any Fund Service Provider that relate directly to the operations and financial reporting of the Fund(s).
Item 5.
Audit Committee of Listed Registrants
Not applicable.
Item 6.
Investments
(a)
Not applicable.
(b)
Not applicable.
Item 7.
Disclosure of Proxy Voting Policies and Procedures for Closed-End Management Investment Companies
Not applicable.
Item 8.
Portfolio Managers of Closed-End Management Investment Companies
Not applicable.
Item 9.
Purchase of Equity Securities by Closed-End Management Investment Company and Affiliated Purchasers
Not applicable.
Item 10.
Submission of Matters to a Vote of Security Holders
There were no material changes to the procedures by which shareholders may recommend nominees to the trust’s Board of Trustees.
Item 11.
Controls and Procedures
(a)(i) The President and Treasurer and the Chief Financial Officer have concluded that the trust’s disclosure controls and procedures (as defined in Rule 30a-3(c) under the Investment Company Act) provide reasonable assurances that material information relating to the trust is made known to them by the appropriate persons, based on their evaluation of these controls and procedures as of a date within 90 days of the filing date of this report.
(a)(ii) There was no change in the trust’s internal control over financial reporting (as defined in Rule 30a-3(d) under the Investment Company Act) that occurred during the period covered by this report that has materially affected, or is reasonably likely to materially affect, the trust’s internal control over financial reporting.
Item 12.
Disclosure of Securities Lending Activities for Closed-End Management
Investment Companies
Not applicable.
Item 13.
Exhibits
SIGNATURES
Pursuant to the requirements of the Securities Exchange Act of 1934 and the Investment Company Act of 1940, the registrant has duly caused this report to be signed on its behalf by the undersigned, thereunto duly authorized.
Fidelity Central Investment Portfolios LLC
| |
By: | /s/Stacie M. Smith |
| Stacie M. Smith |
| President and Treasurer |
|
|
Date: | August 22, 2023 |
Pursuant to the requirements of the Securities Exchange Act of 1934 and the Investment Company Act of 1940, this report has been signed below by the following persons on behalf of the registrant and in the capacities and on the dates indicated.
| |
By: | /s/Stacie M. Smith |
| Stacie M. Smith |
| President and Treasurer |
|
|
Date: | August 22, 2023 |
| |
By: | /s/John J. Burke III |
| John J. Burke III |
| Chief Financial Officer |
|
|
Date: | August 22, 2023 |