UNITED STATES
SECURITIES AND EXCHANGE COMMISSION
Washington, D.C. 20549
FORM N-CSR
CERTIFIED SHAREHOLDER REPORT OF REGISTERED
MANAGEMENT INVESTMENT COMPANIES
Investment Company Act file number 811-21667
Fidelity Central Investment Portfolios LLC
(Exact name of registrant as specified in charter)
245 Summer St., Boston, Massachusetts 02210
(Address of principal executive offices) (Zip code)
Cynthia Lo Bessette, Secretary
245 Summer St.
Boston, Massachusetts 02210
(Name and address of agent for service)
Registrant's telephone number, including area code:
617-563-7000
Date of fiscal year end: | September 30 |
Date of reporting period: | September 30, 2022 |
Item 1.
Reports to Stockholders


Contents
| Average Annual Total Returns | |||
Periods ended September 30, 2022 | Past 1 year | Past 5 years | Past 10 years |
| Fidelity® Floating Rate Central Fund | -1.98% | 3.38% | 4.14% |
| $10,000 Over 10 Years |
Let's say hypothetically that $10,000 was invested in Fidelity® Floating Rate Central Fund on September 30, 2012. The chart shows how the value of your investment would have changed, and also shows how the Morningstar® LSTA® US Performing Loans performed over the same period. |
 |
| Top Bond Issuers (% of Fund's net assets) | ||
(with maturities greater than one year) | ||
| Bass Pro Group LLC | 2.8 | |
| Asurion LLC | 1.9 | |
| Caesars Resort Collection LLC | 1.3 | |
| Intelsat Jackson Holdings SA | 1.2 | |
| TransDigm, Inc. | 1.0 | |
| Athenahealth Group, Inc. | 1.0 | |
| Fertitta Entertainment LLC NV | 0.9 | |
| HUB International Ltd. | 0.9 | |
| Ultimate Software Group, Inc. | 0.9 | |
| Peraton Corp. | 0.8 | |
| 12.8 | ||
| Market Sectors (% of Fund's net assets) | ||
| Technology | 15.5 | |
| Services | 8.7 | |
| Telecommunications | 5.2 | |
| Healthcare | 5.0 | |
| Gaming | 4.9 | |
Quality Diversification (% of Fund's net assets) |
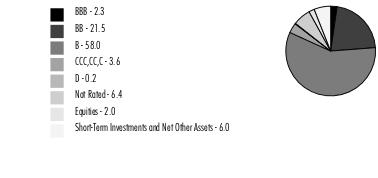 |
| We have used ratings from Moody's Investors Service, Inc. Where Moody's® ratings are not available, we have used S&P® ratings. All ratings are as of the date indicated and do not reflect subsequent changes. |
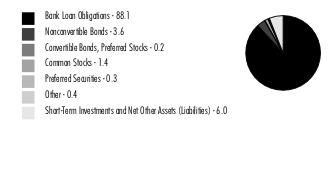
Asset Allocation (% of Fund's net assets) |
 |
Foreign investments - 9% |
| Bank Loan Obligations - 88.1% | |||
Principal Amount (a) | Value ($) | ||
| Aerospace - 1.1% | |||
| ADS Tactical, Inc. Tranche B 1LN, term loan 1 month U.S. LIBOR + 5.750% 8.8019% 3/19/26 (b)(c)(d) | 4,440,000 | 4,054,297 | |
| Gemini HDPE LLC Tranche B 1LN, term loan 1 month U.S. LIBOR + 3.000% 5.81% 12/31/27 (b)(c)(d) | 2,030,966 | 1,939,573 | |
| TransDigm, Inc.: | |||
| Tranche E 1LN, term loan 1 month U.S. LIBOR + 2.250% 5.9241% 5/30/25 (b)(c)(d) | 3,058,823 | 2,930,475 | |
| Tranche F 1LN, term loan 1 month U.S. LIBOR + 2.250% 5.9241% 12/9/25 (b)(c)(d) | 12,181,485 | 11,652,078 | |
| Tranche G 1LN, term loan 1 month U.S. LIBOR + 2.250% 5.9241% 8/22/24 (b)(c)(d) | 8,139,553 | 7,921,983 | |
TOTAL AEROSPACE | 28,498,406 | ||
| Air Transportation - 1.7% | |||
| AAdvantage Loyalty IP Ltd. Tranche B 1LN, term loan 1 month U.S. LIBOR + 4.750% 7.4599% 4/20/28 (b)(c)(d) | 6,475,000 | 6,261,325 | |
| Air Canada Tranche B 1LN, term loan 1 month U.S. LIBOR + 3.500% 6.421% 8/11/28 (b)(c)(d) | 3,491,250 | 3,313,580 | |
| Dynasty Acquisition Co., Inc.: | |||
| Tranche B 1LN, term loan 1 month U.S. LIBOR + 3.500% 6.6153% 4/8/26 (b)(c)(d) | 2,369,401 | 2,180,347 | |
| Tranche B2 1LN, term loan 1 month U.S. LIBOR + 3.500% 6.6153% 4/4/26 (b)(c)(d) | 1,273,872 | 1,172,229 | |
| Echo Global Logistics, Inc.: | |||
| 1LN, term loan 3 month U.S. LIBOR + 4.750% 7.4057% 11/23/28 (b)(c)(d)(e) | 4,800,000 | 4,624,000 | |
| 2LN, term loan 3 month U.S. LIBOR + 8.000% 10.6429% 11/23/29 (b)(c)(d)(e) | 900,000 | 867,000 | |
| Mileage Plus Holdings LLC Tranche B 1LN, term loan 1 month U.S. LIBOR + 5.250% 8.7771% 7/2/27 (b)(c)(d) | 5,301,000 | 5,313,298 | |
| SkyMiles IP Ltd. Tranche B 1LN, term loan 3 month U.S. LIBOR + 3.750% 6.4599% 10/20/27 (b)(c)(d) | 6,705,000 | 6,710,230 | |
| STG Logistics, Inc. 1LN, term loan CME Term SOFR 1 Month Index + 6.000% 9.1341% 3/24/28 (b)(c)(d) | 1,492,500 | 1,425,338 | |
| United Airlines, Inc. Tranche B 1LN, term loan 1 month U.S. LIBOR + 3.750% 6.533% 4/21/28 (b)(c)(d) | 9,879,550 | 9,411,655 | |
| WestJet Airlines Ltd. 1LN, term loan 3 month U.S. LIBOR + 3.000% 5.9934% 12/11/26 (b)(c)(d) | 1,117,004 | 980,450 | |
TOTAL AIR TRANSPORTATION | 42,259,452 | ||
| Automotive & Auto Parts - 1.7% | |||
| Adient U.S. LLC Tranche B 1LN, term loan 1 month U.S. LIBOR + 3.250% 6.3653% 4/8/28 (b)(c)(d) | 2,567,500 | 2,418,277 | |
| American Trailer World Corp. Tranche B 1LN, term loan CME Term SOFR 1 Month Index + 3.750% 6.3053% 3/5/28 (b)(c)(d) | 5,878,792 | 5,317,838 | |
| Avis Budget Car Rental LLC 1LN, term loan CME Term SOFR 1 Month Index + 3.500% 6.6341% 3/16/29 (b)(c)(d) | 1,169,125 | 1,121,390 | |
| Clarios Global LP Tranche B 1LN, term loan 1 month U.S. LIBOR + 3.250% 6.3653% 4/30/26 (b)(c)(d) | 4,562,298 | 4,305,669 | |
| CWGS Group LLC Tranche B 1LN, term loan 1 month U.S. LIBOR + 2.500% 5.3406% 6/3/28 (b)(c)(d) | 9,030,864 | 7,920,790 | |
| Driven Holdings LLC Tranche B 1LN, term loan 1 month U.S. LIBOR + 3.000% 3.5169% 11/17/28 (b)(c)(d)(e) | 1,238,775 | 1,189,224 | |
| Les Schwab Tire Centers Tranche B 1LN, term loan 1 month U.S. LIBOR + 3.250% 6.5799% 11/2/27 (b)(c)(d) | 3,993,863 | 3,810,824 | |
| PECF USS Intermediate Holding III Corp. Tranche B 1LN, term loan 1 month U.S. LIBOR + 4.250% 7.3653% 12/17/28 (b)(c)(d) | 4,118,875 | 3,504,462 | |
| Power Stop LLC 1LN, term loan 1 month U.S. LIBOR + 4.750% 7.8196% 1/26/29 (b)(c)(d) | 3,154,150 | 2,334,071 | |
| Rough Country LLC: | |||
| 2LN, term loan 1 month U.S. LIBOR + 6.500% 10.1741% 7/28/29 (b)(c)(d) | 1,585,000 | 1,499,806 | |
| Tranche B 1LN, term loan 1 month U.S. LIBOR + 3.500% 7.1741% 7/28/28 (b)(c)(d) | 2,693,799 | 2,518,702 | |
| RVR Dealership Holdings LLC Tranche B 1LN, term loan 1 month U.S. LIBOR + 4.000% 6.8684% 2/8/28 (b)(c)(d) | 1,930,000 | 1,695,988 | |
| Thor Industries, Inc. Tranche B 1LN, term loan 1 month U.S. LIBOR + 3.000% 6.125% 2/1/26 (b)(c)(d) | 442,047 | 435,231 | |
| Truck Hero, Inc. Tranche B 1LN, term loan 1 month U.S. LIBOR + 3.500% 6.6153% 1/29/28 (b)(c)(d) | 4,919,729 | 4,276,081 | |
TOTAL AUTOMOTIVE & AUTO PARTS | 42,348,353 | ||
| Banks & Thrifts - 0.8% | |||
| Citadel Securities LP Tranche B 1LN, term loan 1 month U.S. LIBOR + 2.500% 5.6486% 2/27/28 (b)(c)(d) | 6,812,498 | 6,606,420 | |
| Deerfield Dakota Holding LLC Tranche B 1LN, term loan CME Term SOFR 1 Month Index + 3.750% 6.7841% 4/9/27 (b)(c)(d) | 3,072,426 | 2,893,212 | |
| LHS Borrower LLC Tranche B 1LN, term loan CME Term SOFR 1 Month Index + 4.750% 7.8841% 2/18/29 (b)(c)(d) | 5,407,825 | 4,380,338 | |
| Novae LLC 1LN, term loan CME Term SOFR 1 Month Index + 5.000% 7.7267% 12/22/28 (b)(c)(d) | 3,119,325 | 2,885,376 | |
| Superannuation & Investments U.S. LLC 1LN, term loan 1 month U.S. LIBOR + 3.750% 6.8653% 12/1/28 (b)(c)(d) | 1,791,463 | 1,747,572 | |
| Walker & Dunlop, Inc. Tranche B 1LN, term loan CME Term SOFR 1 Month Index + 2.250% 5.3841% 12/16/28 (b)(c)(d)(e) | 1,801,388 | 1,747,346 | |
TOTAL BANKS & THRIFTS | 20,260,264 | ||
| Broadcasting - 2.1% | |||
| AppLovin Corp.: | |||
| Tranche B 1LN, term loan 1 month U.S. LIBOR + 3.000% 6.6741% 10/25/28 (b)(c)(d) | 2,487,500 | 2,384,891 | |
| Tranche B, term loan 1 month U.S. LIBOR + 3.250% 6.3653% 8/15/25 (b)(c)(d) | 8,351,471 | 8,062,677 | |
| Diamond Sports Group LLC: | |||
| 1LN, term loan CME Term SOFR 1 Month Index + 8.000% 10.6955% 5/25/26 (b)(c)(d) | 2,361,194 | 2,257,892 | |
| 2LN, term loan CME Term SOFR 1 Month Index + 3.250% 5.9455% 8/24/26 (b)(c)(d) | 19,373,871 | 3,694,791 | |
| Dotdash Meredith, Inc. Tranche B 1LN, term loan CME Term SOFR 1 Month Index + 4.000% 6.6121% 12/1/28 (b)(c)(d)(e) | 10,058,875 | 8,952,399 | |
| Entercom Media Corp. Tranche B 2LN, term loan 1 month U.S. LIBOR + 2.500% 5.6131% 11/17/24 (b)(c)(d) | 2,395,807 | 1,980,829 | |
| Gray Television, Inc. Tranche D 1LN, term loan 1 month U.S. LIBOR + 3.000% 5.564% 12/1/28 (b)(c)(d) | 3,662,325 | 3,549,196 | |
| Nexstar Broadcasting, Inc. Tranche B, term loan 1 month U.S. LIBOR + 2.500% 5.6153% 9/19/26 (b)(c)(d) | 4,537,309 | 4,467,615 | |
| Sinclair Television Group, Inc. Tranche B 1LN, term loan 1 month U.S. LIBOR + 2.500% 5.62% 9/30/26 (b)(c)(d) | 2,349,515 | 2,220,292 | |
| Springer Nature Deutschland GmbH Tranche B18 1LN, term loan 1 month U.S. LIBOR + 3.500% 5.5239% 8/14/26 (b)(c)(d) | 3,155,852 | 3,056,442 | |
| Univision Communications, Inc. Tranche B 1LN, term loan: | |||
| 1 month U.S. LIBOR + 3.250% 5.7739% 3/24/26 (b)(c)(d) | 4,823,092 | 4,569,108 | |
| 1 month U.S. LIBOR + 3.250% 6.3653% 1/31/29 (b)(c)(d) | 9,339,309 | 8,910,262 | |
TOTAL BROADCASTING | 54,106,394 | ||
| Building Materials - 2.4% | |||
| Acproducts Holdings, Inc. Tranche B 1LN, term loan 1 month U.S. LIBOR + 4.250% 7.3247% 5/17/28 (b)(c)(d) | 6,729,061 | 4,939,333 | |
| APi Group DE, Inc. Tranche B 1LN, term loan: | |||
| 1 month U.S. LIBOR + 2.500% 3.1153% 10/1/26 (b)(c)(d) | 2,250,491 | 2,190,290 | |
| 1 month U.S. LIBOR + 2.750% 5.8653% 1/3/29 (b)(c)(d) | 3,646,792 | 3,544,974 | |
| Beacon Roofing Supply, Inc. Tranche B 1LN, term loan 1 month U.S. LIBOR + 2.250% 5.3653% 5/19/28 (b)(c)(d) | 2,034,250 | 1,957,966 | |
| DiversiTech Holdings, Inc.: | |||
| Tranche B 1LN, term loan 1 month U.S. LIBOR + 3.750% 7.4241% 12/22/28 (b)(c)(d) | 2,168,247 | 2,027,311 | |
| Tranche B-DD 1LN, term loan 1 month U.S. LIBOR + 3.750% 12/22/28 (c)(d)(f) | 450,857 | 421,551 | |
| Hunter Douglas, Inc. Tranche B 1LN, term loan CME Term SOFR 1 Month Index + 3.500% 6.3399% 2/25/29 (b)(c)(d) | 19,745,513 | 16,161,702 | |
| Ingersoll-Rand Services Co. Tranche B 1LN, term loan 1 month U.S. LIBOR + 1.750% 4.8841% 2/28/27 (b)(c)(d) | 3,441,725 | 3,333,449 | |
| Installed Building Products, Inc. Tranche B 1LN, term loan 1 month U.S. LIBOR + 2.250% 5.3653% 12/14/28 (b)(c)(d) | 697,194 | 682,957 | |
| Oscar AcquisitionCo LLC 1LN, term loan CME Term SOFR 1 Month Index + 4.500% 8.1532% 4/29/29 (b)(c)(d) | 4,525,000 | 4,136,619 | |
| Smyrna Ready Mix LLC Tranche B 1lN, term loan CME Term SOFR 1 Month Index + 4.250% 7.3841% 4/1/29 (b)(c)(d)(e) | 1,755,600 | 1,672,209 | |
| SRS Distribution, Inc. Tranche B 1LN, term loan: | |||
| 1 month U.S. LIBOR + 3.500% 6.3059% 6/4/28 (b)(c)(d) | 6,855,550 | 6,312,796 | |
| CME Term SOFR 1 Month Index + 3.500% 6.1767% 6/2/28 (b)(c)(d) | 3,109,375 | 2,851,297 | |
| Standard Industries, Inc./New Jersey Tranche B 1LN, term loan 1 month U.S. LIBOR + 2.500% 6.6751% 9/22/28 (b)(c)(d) | 2,575,816 | 2,494,523 | |
| Traverse Midstream Partners Ll Tranche B, term loan CME Term SOFR 1 Month Index + 4.250% 5.9499% 9/27/24 (b)(c)(d) | 1,652,860 | 1,611,538 | |
| USIC Holdings, Inc. Tranche B 1LN, term loan 1 month U.S. LIBOR + 3.500% 6.6153% 5/7/28 (b)(c)(d) | 2,791,800 | 2,609,160 | |
| White Capital Buyer LLC Tranche B 1LN, term loan 1 month U.S. LIBOR + 4.000% 6.7841% 10/19/27 (b)(c)(d) | 3,669,871 | 3,426,742 | |
TOTAL BUILDING MATERIALS | 60,374,417 | ||
| Cable/Satellite TV - 2.6% | |||
| Charter Communication Operating LLC Tranche B2 1LN, term loan 1 month U.S. LIBOR + 1.750% 4.87% 2/1/27 (b)(c)(d) | 16,860,513 | 16,200,087 | |
| Coral-U.S. Co.-Borrower LLC: | |||
| Tranche B, term loan 1 month U.S. LIBOR + 2.250% 5.0677% 1/31/28 (b)(c)(d) | 7,240,000 | 6,948,590 | |
| Tranche B6 1LN, term loan 1 month U.S. LIBOR + 3.000% 5.8177% 10/15/29 (b)(c)(d) | 1,940,000 | 1,859,975 | |
| CSC Holdings LLC: | |||
| Tranche B 5LN, term loan 1 month U.S. LIBOR + 2.500% 5.3177% 4/15/27 (b)(c)(d) | 8,405,747 | 7,843,655 | |
| Tranche B3 1LN, term loan 3 month U.S. LIBOR + 2.250% 5.0677% 1/15/26 (b)(c)(d) | 1,930,000 | 1,802,138 | |
| DIRECTV Financing LLC 1LN, term loan 1 month U.S. LIBOR + 5.000% 8.1153% 8/2/27 (b)(c)(d) | 8,662,322 | 8,048,423 | |
| LCPR Loan Financing LLC 1LN, term loan 1 month U.S. LIBOR + 3.750% 6.5677% 9/25/28 (b)(c)(d) | 1,910,000 | 1,843,150 | |
| Neptune Finco Corp. Tranche B, term loan 3 month U.S. LIBOR + 2.250% 5.0677% 7/17/25 (b)(c)(d) | 4,691,366 | 4,459,753 | |
| Numericable LLC: | |||
| Tranche B 11LN, term loan 3 month U.S. LIBOR + 2.750% 5.5559% 7/31/25 (b)(c)(d) | 6,006,533 | 5,465,945 | |
| Tranche B 12LN, term loan 3 month U.S. LIBOR + 3.680% 6.1995% 1/31/26 (b)(c)(d) | 1,476,555 | 1,336,282 | |
| Tranche B 13LN, term loan 3 month U.S. LIBOR + 4.000% 6.9051% 8/14/26 (b)(c)(d) | 5,775,000 | 5,226,375 | |
| Virgin Media Bristol LLC Tranche N, term loan 1 month U.S. LIBOR + 2.500% 5.3177% 1/31/28 (b)(c)(d) | 5,373,792 | 5,120,041 | |
TOTAL CABLE/SATELLITE TV | 66,154,414 | ||
| Capital Goods - 0.6% | |||
| Ali Group North America Corp. Tranche B 1LN, term loan 1 month U.S. LIBOR + 2.000% 5.1486% 7/23/29 (b)(c)(d) | 2,160,219 | 2,078,130 | |
| CPM Holdings, Inc.: | |||
| 2LN, term loan 3 month U.S. LIBOR + 8.250% 10.814% 11/15/26 (b)(c)(d) | 514,697 | 488,962 | |
| Tranche B 1LN, term loan 3 month U.S. LIBOR + 3.500% 6.064% 11/15/25 (b)(c)(d) | 2,054,927 | 1,977,867 | |
| Griffon Corp. Tranche B 1LN, term loan CME Term SOFR 1 Month Index + 2.750% 5.4899% 1/24/29 (b)(c)(d) | 5,049,900 | 4,843,713 | |
| MHI Holdings LLC Tranche B 1LN, term loan 3 month U.S. LIBOR + 5.000% 8.1153% 9/20/26 (b)(c)(d) | 3,127,731 | 3,069,086 | |
| TNT Crane & Rigging LLC 2LN, term loan 3 month U.S. LIBOR + 8.750% 11.0271% 4/16/25 (b)(c)(d)(e) | 1,612,880 | 1,520,139 | |
TOTAL CAPITAL GOODS | 13,977,897 | ||
| Chemicals - 2.8% | |||
| ARC Falcon I, Inc.: | |||
| Tranche B 1LN, term loan 1 month U.S. LIBOR + 3.750% 6.8653% 9/30/28 (b)(c)(d) | 5,871,933 | 5,404,645 | |
| Tranche B 2LN, term loan 1 month U.S. LIBOR + 7.000% 10.1153% 9/22/29 (b)(c)(d)(e) | 930,000 | 874,200 | |
| Tranche DD 1LN, term loan 1 month U.S. LIBOR + 3.750% 9/30/28 (c)(d)(f) | 863,694 | 794,961 | |
| Aruba Investment Holdings LLC: | |||
| 2LN, term loan 1 month U.S. LIBOR + 7.750% 10.834% 11/24/28 (b)(c)(d) | 1,575,000 | 1,425,375 | |
| Tranche B 1LN, term loan 1 month U.S. LIBOR + 4.000% 7.084% 11/24/27 (b)(c)(d) | 3,983,389 | 3,659,738 | |
| Avient Corp. Tranche B 1LN, term loan CME Term SOFR 1 Month Index + 3.250% 6.2969% 8/29/29 (b)(c)(d) | 1,925,000 | 1,916,184 | |
| Bakelite U.S. Holding Ltd. 1LN, term loan CME Term SOFR 1 Month Index + 4.000% 7.669% 5/27/29 (b)(c)(d) | 2,763,075 | 2,567,366 | |
| Cimpress U.S.A., Inc. Tranche B 1LN, term loan 1 month U.S. LIBOR + 3.500% 6.6153% 5/17/28 (b)(c)(d) | 993,736 | 909,269 | |
| Consolidated Energy Finance SA: | |||
| Tranche B 1LN, term loan 1 month U.S. LIBOR + 3.500% 6.3633% 5/7/25 (b)(c)(d)(e) | 1,560,100 | 1,489,896 | |
| Tranche B, term loan 3 month U.S. LIBOR + 2.500% 5.2929% 5/7/25 (b)(c)(d) | 2,645,250 | 2,526,214 | |
| Discovery Purchaser Corp. 1LN, term loan CME Term SOFR 1 Month Index + 4.370% 8/3/29 (c)(d) | 5,250,000 | 4,790,625 | |
| Element Solutions, Inc. Tranche B 1LN, term loan 1 month U.S. LIBOR + 2.000% 5.1153% 1/31/26 (b)(c)(d) | 2,378,708 | 2,357,394 | |
| Groupe Solmax, Inc. Tranche B 1LN, term loan 1 month U.S. LIBOR + 4.750% 8.3919% 5/27/28 (b)(c)(d) | 3,912,492 | 3,452,774 | |
| Herens U.S. Holdco Corp. Tranche B 1LN, term loan 1 month U.S. LIBOR + 4.000% 7.6741% 7/3/28 (b)(c)(d) | 2,236,815 | 1,985,173 | |
| Hexion Holdings Corp. 1LN, term loan CME Term SOFR 1 Month Index + 4.500% 7.4125% 3/15/29 (b)(c)(d) | 7,980,000 | 6,775,020 | |
| Hexion, Inc. 2LN, term loan CME Term SOFR 1 Month Index + 7.000% 10.5559% 2/9/30 (b)(c)(d)(e) | 2,105,000 | 1,705,050 | |
| ICP Group Tranche B 1LN, term loan 1 month U.S. LIBOR + 3.750% 7.4241% 12/29/27 (b)(c)(d) | 1,851,800 | 1,436,682 | |
| INEOS U.S. Petrochem LLC Tranche B 1LN, term loan 1 month U.S. LIBOR + 2.750% 5.8653% 1/20/26 (b)(c)(d) | 6,386,033 | 5,941,693 | |
| Manchester Acquisition Sub LLC Tranche B 1LN, term loan CME Term SOFR 1 Month Index + 5.750% 8.8467% 12/1/26 (b)(c)(d) | 3,478,713 | 2,991,693 | |
| Messer Industries U.S.A., Inc. Tranche B 1LN, term loan 3 month U.S. LIBOR + 2.500% 6.1741% 3/1/26 (b)(c)(d) | 1,773,633 | 1,692,720 | |
| Olympus Water U.S. Holding Corp. Tranche B 1LN, term loan 1 month U.S. LIBOR + 3.750% 7.4375% 11/9/28 (b)(c)(d) | 5,478,600 | 4,985,526 | |
| Oxea Corp. Tranche B2, term loan 3 month U.S. LIBOR + 3.250% 5.9375% 10/11/24 (b)(c)(d) | 2,073,157 | 1,871,024 | |
| Starfruit U.S. Holdco LLC Tranche B, term loan 1 month U.S. LIBOR + 3.000% 5.8653% 10/1/25 (b)(c)(d) | 4,602,086 | 4,308,703 | |
| The Chemours Co. LLC Tranche B 1LN, term loan 3 month U.S. LIBOR + 1.750% 4.87% 4/3/25 (b)(c)(d) | 2,262,819 | 2,111,210 | |
| Valcour Packaging LLC Tranche B 1LN, term loan 1 month U.S. LIBOR + 3.750% 5.2199% 10/4/28 (b)(c)(d) | 482,588 | 442,171 | |
| W.R. Grace Holding LLC Tranche B 1LN, term loan 3 month U.S. LIBOR + 3.750% 7.4375% 9/22/28 (b)(c)(d) | 2,230,581 | 2,082,805 | |
TOTAL CHEMICALS | 70,498,111 | ||
| Consumer Products - 2.2% | |||
| 19Th Holdings Golf LLC Tranche B 1LN, term loan CME Term SOFR 1 Month Index + 3.250% 5.6955% 2/7/29 (b)(c)(d)(e) | 4,179,525 | 3,866,061 | |
| BCPE Empire Holdings, Inc.: | |||
| 1LN, term loan: | |||
CME Term SOFR 1 Month Index + 4.000% 7.1153% 6/11/26 (b)(c)(d) | 1,698,574 | 1,610,809 | |
CME Term SOFR 1 Month Index + 4.620% 7.7591% 6/11/26 (b)(c)(d) | 1,467,613 | 1,397,901 | |
| Tranche B 1LN, term loan CME Term SOFR 1 Month Index + 4.000% 7.1153% 6/11/26 (b)(c)(d) | 2,967,525 | 2,836,450 | |
| Bombardier Recreational Products, Inc. Tranche B 1LN, term loan 1 month U.S. LIBOR + 2.000% 5.1153% 5/23/27 (b)(c)(d) | 1,368,939 | 1,307,337 | |
| CNT Holdings I Corp. Tranche B 1LN, term loan 1 month U.S. LIBOR + 3.500% 6.2475% 11/8/27 (b)(c)(d) | 3,989,250 | 3,793,338 | |
| Conair Holdings LLC Tranche B 1LN, term loan 1 month U.S. LIBOR + 3.750% 7.4241% 5/17/28 (b)(c)(d) | 3,054,363 | 2,558,029 | |
| Diamond BC BV Tranche B 1LN, term loan 1 month U.S. LIBOR + 2.750% 5.5552% 9/29/28 (b)(c)(d) | 4,113,913 | 3,782,743 | |
| Gloves Buyer, Inc. Tranche B 1LN, term loan 1 month U.S. LIBOR + 4.000% 7.1153% 1/6/28 (b)(c)(d) | 2,073,302 | 1,948,904 | |
| Knowlton Development Corp., Inc. Tranche B 1LN, term loan 1 month U.S. LIBOR + 3.750% 6.8653% 12/21/25 (b)(c)(d) | 3,695,766 | 3,480,192 | |
| Kronos Acquisition Holdings, Inc. Tranche B 1LN, term loan 1 month U.S. LIBOR + 3.750% 6.8196% 12/22/26 (b)(c)(d) | 5,399,061 | 4,988,138 | |
| Mattress Firm, Inc. Tranche B 1LN, term loan 1 month U.S. LIBOR + 4.250% 8.4327% 9/24/28 (b)(c)(d) | 3,884,428 | 3,394,990 | |
| Michaels Companies, Inc. 1LN, term loan 1 month U.S. LIBOR + 4.250% 7.9241% 4/15/28 (b)(c)(d) | 9,073,355 | 7,276,830 | |
| Petco Health & Wellness Co., Inc. Tranche B 1LN, term loan 1 month U.S. LIBOR + 3.250% 6.9241% 3/4/28 (b)(c)(d) | 2,221,175 | 2,092,769 | |
| Runner Buyer, Inc. Tranche B 1LN, term loan 1 month U.S. LIBOR + 5.500% 8.5696% 10/20/28 (b)(c)(d) | 2,482,525 | 1,655,025 | |
| Sweetwater Borrower LLC Tranche B 1LN, term loan 1 month U.S. LIBOR + 4.250% 7.375% 8/5/28 (b)(c)(d) | 4,470,074 | 4,067,768 | |
| TGP Holdings III LLC: | |||
| Tranche B 1LN, term loan 1 month U.S. LIBOR + 3.250% 6.3653% 6/29/28 (b)(c)(d) | 1,581,129 | 1,238,229 | |
| Tranche DD 1LN, term loan 1 month U.S. LIBOR + 3.250% 4.0288% 6/29/28 (b)(c)(d)(f) | 208,482 | 163,269 | |
| TKC Holdings, Inc. 1LN, term loan 1 month U.S. LIBOR + 5.500% 7% 5/3/28 (b)(c)(d) | 2,312,914 | 1,964,820 | |
| Woof Holdings LLC: | |||
| Tranche B 1LN, term loan 1 month U.S. LIBOR + 3.750% 7.3153% 12/21/27 (b)(c)(d) | 3,220,403 | 3,035,230 | |
| Tranche B 2LN, term loan 1 month U.S. LIBOR + 7.250% 10.8153% 12/21/28 (b)(c)(d) | 605,000 | 577,775 | |
TOTAL CONSUMER PRODUCTS | 57,036,607 | ||
| Containers - 1.8% | |||
| AOT Packaging Products AcquisitionCo LLC 1LN, term loan 1 month U.S. LIBOR + 3.250% 6.3653% 3/3/28 (b)(c)(d) | 5,009,727 | 4,695,367 | |
| Berlin Packaging, LLC Tranche B 1LN, term loan: | |||
| 1 month U.S. LIBOR + 3.250% 5.916% 3/11/28 (b)(c)(d) | 581,168 | 546,008 | |
| 1 month U.S. LIBOR + 3.750% 6.3817% 3/11/28 (b)(c)(d) | 6,870,126 | 6,475,094 | |
| Berry Global, Inc. Tranche Z 1LN, term loan 1 month U.S. LIBOR + 1.750% 4.1776% 7/1/26 (b)(c)(d) | 4,302,210 | 4,160,065 | |
| BWAY Holding Co. Tranche B, term loan 3 month U.S. LIBOR + 3.250% 5.814% 4/3/24 (b)(c)(d) | 1,421,250 | 1,320,881 | |
| Canister International Group, Inc. 1LN, term loan 1 month U.S. LIBOR + 4.750% 7.8653% 12/21/26 (b)(c)(d) | 1,218,750 | 1,194,375 | |
| Charter NEX U.S., Inc. 1LN, term loan 1 month U.S. LIBOR + 3.750% 6.5559% 12/1/27 (b)(c)(d) | 3,852,666 | 3,648,012 | |
| Graham Packaging Co., Inc. Tranche B 1LN, term loan 1 month U.S. LIBOR + 3.000% 6.1153% 8/4/27 (b)(c)(d) | 4,467,793 | 4,246,816 | |
| Kloeckner Pentaplast of America, Inc. Tranche B 1LN, term loan 1 month U.S. LIBOR + 4.750% 8.2592% 2/9/26 (b)(c)(d) | 2,137,450 | 1,806,145 | |
| Pregis TopCo Corp. 1LN, term loan: | |||
| 1 month U.S. LIBOR + 4.000% 6.8059% 7/31/26 (b)(c)(d) | 2,178,040 | 2,069,138 | |
| 1 month U.S. LIBOR + 4.000% 6.8059% 8/1/26 (b)(c)(d) | 495,000 | 469,013 | |
| Proampac PG Borrower LLC Tranche B 1LN, term loan 1 month U.S. LIBOR + 3.750% 6.4591% 11/18/25 (b)(c)(d) | 1,492,174 | 1,392,198 | |
| Reynolds Consumer Products LLC Tranche B 1LN, term loan 1 month U.S. LIBOR + 1.750% 4.8653% 1/30/27 (b)(c)(d) | 5,239,014 | 5,035,164 | |
| Reynolds Group Holdings, Inc. Tranche B 1LN, term loan: | |||
| 1 month U.S. LIBOR + 3.250% 6.3653% 2/5/26 (b)(c)(d) | 3,070,313 | 2,931,596 | |
| 1 month U.S. LIBOR + 3.500% 6.6153% 9/24/28 (b)(c)(d) | 4,113,450 | 3,933,487 | |
| Ring Container Technologies Group LLC Tranche B 1LN, term loan 1 month U.S. LIBOR + 3.750% 6.8653% 8/12/28 (b)(c)(d) | 3,069,269 | 2,951,624 | |
TOTAL CONTAINERS | 46,874,983 | ||
| Diversified Financial Services - 2.2% | |||
| ACNR Holdings, Inc. term loan 19.084% 9/16/25 (b)(d)(e) | 516,616 | 516,616 | |
| AlixPartners LLP Tranche B 1LN, term loan 1 month U.S. LIBOR + 2.750% 5.8653% 2/4/28 (b)(c)(d) | 3,959,700 | 3,795,650 | |
| AVSC Holding Corp.: | |||
| Tranche B 1LN, term loan 3 month U.S. LIBOR + 3.500% 6.6441% 3/1/25 (b)(c)(d) | 1,947,963 | 1,700,416 | |
| Tranche B2 1LN, term loan 3 month U.S. LIBOR + 5.500% 8.6441% 10/15/26 (b)(c)(d) | 2,970,876 | 2,619,956 | |
| BCP Renaissance Parent LLC Tranche B3 1LN, term loan U.S. Secured Overnight Fin. Rate (SOFR) Index + 3.500% 7.0532% 10/31/26 (b)(c)(d) | 3,040,557 | 2,910,238 | |
| Broadstreet Partners, Inc. Tranche B 1LN, term loan 1 month U.S. LIBOR + 3.250% 6.3653% 1/27/27 (b)(c)(d) | 1,782,000 | 1,683,990 | |
| Eagle 4 Ltd. Tranche B 1LN, term loan 1 month U.S. LIBOR + 3.250% 6.9241% 7/12/28 (b)(c)(d) | 1,180,766 | 1,135,897 | |
| Finco I LLC Tranche B 1LN, term loan 1 month U.S. LIBOR + 2.500% 5.6153% 6/27/25 (b)(c)(d) | 1,562,530 | 1,543,982 | |
| Focus Financial Partners LLC: | |||
| Tranche B 1LN, term loan 1 month U.S. LIBOR + 2.500% 5.6153% 6/24/28 (b)(c)(d) | 3,680,166 | 3,555,960 | |
| Tranche B3 1LN, term loan 1 month U.S. LIBOR + 2.000% 5.1153% 7/3/24 (b)(c)(d) | 1,070,365 | 1,042,418 | |
| GT Polaris, Inc. Tranche B 1LN, term loan 1 month U.S. LIBOR + 3.750% 6.5559% 9/24/27 (b)(c)(d) | 2,254,923 | 2,119,628 | |
| HarbourVest Partners LLC Tranche B 1LN, term loan 3 month U.S. LIBOR + 2.250% 4.762% 3/1/25 (b)(c)(d) | 4,418,343 | 4,255,438 | |
| Hightower Holding LLC Tranche B 1LN, term loan 1 month U.S. LIBOR + 4.000% 6.7317% 4/21/28 (b)(c)(d) | 4,930,200 | 4,557,378 | |
| KREF Holdings X LLC Tranche B 1LN, term loan 1 month U.S. LIBOR + 3.500% 6.3125% 9/1/27 (b)(c)(d)(e) | 2,615,324 | 2,523,788 | |
| Nexus Buyer LLC: | |||
| 2LN, term loan 1 month U.S. LIBOR + 6.250% 9.3653% 11/5/29 (b)(c)(d) | 2,500,000 | 2,354,175 | |
| Tranche B 1LN, term loan 1 month U.S. LIBOR + 3.750% 6.8653% 11/8/26 (b)(c)(d) | 2,969,466 | 2,845,134 | |
| Recess Holdings, Inc. Tranche B, term loan 3 month U.S. LIBOR + 3.750% 6.5511% 9/29/24 (b)(c)(d) | 573,455 | 552,909 | |
| TransUnion LLC: | |||
| Tranche B5 1LN, term loan 1 month U.S. LIBOR + 1.750% 4.8653% 11/16/26 (b)(c)(d) | 5,322,791 | 5,125,848 | |
| Tranche B6 1LN, term loan 1 month U.S. LIBOR + 2.250% 4.7739% 12/1/28 (b)(c)(d) | 3,123,691 | 3,020,234 | |
| UFC Holdings LLC Tranche B 1LN, term loan 1 month U.S. LIBOR + 2.750% 5.52% 4/29/26 (b)(c)(d) | 3,856,044 | 3,698,602 | |
| WH Borrower LLC Tranche B 1LN, term loan CME Term SOFR 1 Month Index + 5.500% 8.422% 2/9/27 (b)(c)(d) | 5,855,325 | 5,547,920 | |
TOTAL DIVERSIFIED FINANCIAL SERVICES | 57,106,177 | ||
| Diversified Media - 1.1% | |||
| Advantage Sales & Marketing, Inc. Tranche B 1LN, term loan 1 month U.S. LIBOR + 4.500% 7.0534% 10/28/27 (b)(c)(d) | 6,948,737 | 6,178,609 | |
| Allen Media LLC Tranche B 1LN, term loan 1 month U.S. LIBOR + 5.500% 9.2032% 2/10/27 (b)(c)(d) | 11,433,005 | 9,846,676 | |
| Terrier Media Buyer, Inc. Tranche B 1LN, term loan 1 month U.S. LIBOR + 3.500% 6.6153% 12/17/26 (b)(c)(d) | 14,122,915 | 13,193,203 | |
TOTAL DIVERSIFIED MEDIA | 29,218,488 | ||
| Energy - 2.8% | |||
| Apro LLC Tranche B 1LN, term loan 1 month U.S. LIBOR + 3.750% 6.8949% 11/14/26 (b)(c)(d) | 2,569,315 | 2,440,849 | |
| Array Technologies, Inc. Tranche B 1LN, term loan 1 month U.S. LIBOR + 3.250% 6.2077% 10/14/27 (b)(c)(d) | 7,761,891 | 7,289,735 | |
| Brazos Delaware II LLC Tranche B, term loan 3 month U.S. LIBOR + 4.000% 7.0139% 5/21/25 (b)(c)(d) | 2,664,462 | 2,563,213 | |
| BW Gas & Convenience Holdings LLC Tranche B 1LN, term loan 1 month U.S. LIBOR + 3.500% 6.6153% 3/17/28 (b)(c)(d)(e) | 1,881,188 | 1,787,128 | |
| Citgo Petroleum Corp. Tranche B 1LN, term loan 1 month U.S. LIBOR + 6.250% 9.3653% 3/28/24 (b)(c)(d) | 694,835 | 694,488 | |
| CQP Holdco LP / BIP-V Chinook Holdco LLC Tranche B 1LN, term loan 1 month U.S. LIBOR + 3.750% 7.4241% 6/4/28 (b)(c)(d) | 18,480,863 | 17,803,170 | |
| Delek U.S. Holdings, Inc. Tranche B 1LN, term loan 3 month U.S. LIBOR + 2.250% 5.3653% 3/30/25 (b)(c)(d) | 1,498,207 | 1,446,893 | |
| EG America LLC Tranche B 1LN, term loan: | |||
| 1 month U.S. LIBOR + 4.250% 7.9241% 3/10/26 (b)(c)(d) | 1,326,696 | 1,236,043 | |
| 3 month U.S. LIBOR + 4.000% 7.6741% 2/6/25 (b)(c)(d) | 3,642,578 | 3,389,892 | |
| EG Finco Ltd. Tranche B, term loan 3 month U.S. LIBOR + 4.000% 7.6741% 2/6/25 (b)(c)(d) | 3,131,222 | 2,914,009 | |
| Epic Crude Services LP Tranche B 1LN, term loan 3 month U.S. LIBOR + 5.000% 7.08% 3/1/26 (b)(c)(d) | 1,726,167 | 1,419,772 | |
| Esdec Solar Group BV Tranche B 1LN, term loan 1 month U.S. LIBOR + 4.750% 8.9199% 8/27/28 (b)(c)(d)(e) | 3,198,724 | 2,990,807 | |
| GIP II Blue Holding LP Tranche B 1LN, term loan 1 month U.S. LIBOR + 4.500% 8.1741% 9/29/28 (b)(c)(d) | 7,357,381 | 7,232,305 | |
| GIP III Stetson I LP Tranche B, term loan 3 month U.S. LIBOR + 4.250% 7.3653% 7/18/25 (b)(c)(d) | 6,019,059 | 5,729,422 | |
| Granite Acquisition, Inc. Tranche B 1LN, term loan 1 month U.S. LIBOR + 2.750% 6.4241% 3/25/28 (b)(c)(d) | 3,189,426 | 3,041,117 | |
| Natgasoline LLC Tranche B, term loan 3 month U.S. LIBOR + 3.500% 6.625% 11/14/25 (b)(c)(d)(e) | 4,018,438 | 3,837,608 | |
| Rockwood Service Corp. Tranche B 1LN, term loan 1 month U.S. LIBOR + 4.250% 7.3653% 1/23/27 (b)(c)(d) | 4,197,114 | 4,071,201 | |
| WaterBridge Operating LLC Tranche B 1LN, term loan 3 month U.S. LIBOR + 5.750% 9.1274% 6/21/26 (b)(c)(d) | 915,141 | 881,583 | |
TOTAL ENERGY | 70,769,235 | ||
| Entertainment/Film - 0.2% | |||
| AP Core Holdings II LLC: | |||
| Tranche B1 1LN, term loan 1 month U.S. LIBOR + 5.500% 8.6153% 9/1/27 (b)(c)(d) | 1,090,844 | 1,007,667 | |
| Tranche B2 1LN, term loan 1 month U.S. LIBOR + 5.500% 8.6153% 9/1/27 (b)(c)(d) | 3,430,000 | 3,168,463 | |
| SMG U.S. Midco 2, Inc. 1LN, term loan 1 month U.S. LIBOR + 2.500% 5.6153% 1/23/25 (b)(c)(d) | 1,359,368 | 1,293,669 | |
TOTAL ENTERTAINMENT/FILM | 5,469,799 | ||
| Environmental - 0.7% | |||
| Clean Harbors, Inc. Tranche B 1LN, term loan 1 month U.S. LIBOR + 2.000% 5.1153% 10/8/28 (b)(c)(d) | 1,975,025 | 1,955,690 | |
| Covanta Holding Corp.: | |||
| Tranche B 1LN, term loan 1 month U.S. LIBOR + 2.500% 5.6153% 11/30/28 (b)(c)(d) | 3,938,692 | 3,811,393 | |
| Tranche C 1LN, term loan 1 month U.S. LIBOR + 2.500% 5.0239% 11/30/28 (b)(c)(d) | 296,516 | 286,932 | |
| Madison IAQ LLC Tranche B 1LN, term loan 1 month U.S. LIBOR + 3.250% 6.8153% 6/21/28 (b)(c)(d) | 7,562,714 | 6,972,519 | |
| The Brickman Group, Ltd. Tranche B 1LN, term loan CME Term SOFR 1 Month Index + 3.250% 6.2841% 4/14/29 (b)(c)(d) | 3,280,929 | 3,145,590 | |
| TRC Companies, Inc. Tranche B 1LN, term loan 1 month U.S. LIBOR + 3.750% 6.8653% 11/17/28 (b)(c)(d) | 155,447 | 144,825 | |
| WTG Holdings III Corp. Tranche B 1LN, term loan 1 month U.S. LIBOR + 2.500% 5.625% 4/1/28 (b)(c)(d) | 1,194,875 | 1,163,510 | |
TOTAL ENVIRONMENTAL | 17,480,459 | ||
| Food & Drug Retail - 0.5% | |||
| 8th Avenue Food & Provisions, Inc. Tranche B 1LN, term loan 1 month U.S. LIBOR + 4.750% 7.2739% 10/1/25 (b)(c)(d) | 1,257,300 | 1,104,324 | |
| Cardenas Merger Sub, LLC 1LN, term loan CME Term SOFR 1 Month Index + 6.750% 9.7949% 8/1/29 (b)(c)(d) | 2,335,000 | 2,253,275 | |
| Froneri U.S., Inc. Tranche B 1LN, term loan 1 month U.S. LIBOR + 2.250% 5.3653% 1/29/27 (b)(c)(d) | 3,487,225 | 3,284,094 | |
| GOBP Holdings, Inc. Tranche B 1LN, term loan 1 month U.S. LIBOR + 2.750% 5.8653% 10/22/25 (b)(c)(d) | 1,289,787 | 1,260,766 | |
| JP Intermediate B LLC Tranche B, term loan 3 month U.S. LIBOR + 5.500% 8.3059% 11/20/25 (b)(c)(d) | 5,714,124 | 4,239,880 | |
| PetIQ, Inc. Tranche B 1LN, term loan 1 month U.S. LIBOR + 4.250% 7.0677% 4/13/28 (b)(c)(d)(e) | 1,649,594 | 1,517,627 | |
TOTAL FOOD & DRUG RETAIL | 13,659,966 | ||
| Food/Beverage/Tobacco - 1.4% | |||
| 8th Avenue Food & Provisions, Inc.: | |||
| 2LN, term loan 3 month U.S. LIBOR + 7.750% 10.8653% 10/1/26 (b)(c)(d) | 410,000 | 338,763 | |
| Tranche B 1LN, term loan 3 month U.S. LIBOR + 3.750% 6.8653% 10/1/25 (b)(c)(d) | 1,553,832 | 1,355,237 | |
| Bengal Debt Merger Sub LLC: | |||
| 1LN, term loan CME TERM SOFR 3 MONTH INDEX + 3.250% 6.9032% 1/24/29 (b)(c)(d) | 6,109,675 | 5,587,787 | |
| 2LN, term loan CME Term SOFR 1 Month Index + 6.000% 9.6532% 1/24/30 (b)(c)(d) | 2,185,000 | 1,977,425 | |
| Chobani LLC Tranche B 1LN, term loan 1 month U.S. LIBOR + 3.500% 6.6153% 10/23/27 (b)(c)(d) | 4,772,600 | 4,334,141 | |
| Del Monte Foods, Inc. Tranche B 1LN, term loan CME Term SOFR 1 Month Index + 4.250% 7.3684% 5/16/29 (b)(c)(d) | 7,135,000 | 6,819,847 | |
| Shearer's Foods, Inc. Tranche B 1LN, term loan 1 month U.S. LIBOR + 3.500% 6.6153% 9/23/27 (b)(c)(d) | 3,505,653 | 3,246,480 | |
| Triton Water Holdings, Inc. Tranche B 1LN, term loan 1 month U.S. LIBOR + 3.500% 7.1741% 3/31/28 (b)(c)(d) | 9,060,211 | 8,110,158 | |
| U.S. Foods, Inc. 1LN, term loan 3 month U.S. LIBOR + 2.000% 5.1153% 9/13/26 (b)(c)(d) | 2,778,970 | 2,692,711 | |
TOTAL FOOD/BEVERAGE/TOBACCO | 34,462,549 | ||
| Gaming - 4.4% | |||
| Bally's Corp. Tranche B 1LN, term loan 1 month U.S. LIBOR + 3.250% 5.9349% 10/1/28 (b)(c)(d) | 8,925,038 | 8,038,692 | |
| Caesars Resort Collection LLC: | |||
| Tranche B 1LN, term loan 1 month U.S. LIBOR + 3.500% 6.6153% 7/20/25 (b)(c)(d) | 7,847,778 | 7,721,036 | |
| Tranche B 1LN, term loan 3 month U.S. LIBOR + 2.750% 5.8653% 12/22/24 (b)(c)(d) | 25,190,075 | 24,562,842 | |
| Cypress Intermediate Holdings, Inc. Tranche B 1LN, term loan 3 month U.S. LIBOR + 2.250% 4.3653% 9/21/28 (b)(c)(d) | 1,732,409 | 1,671,774 | |
| Fertitta Entertainment LLC NV Tranche B 1LN, term loan CME Term SOFR 1 Month Index + 4.000% 7.0341% 1/27/29 (b)(c)(d) | 25,745,220 | 23,841,103 | |
| Flutter Financing B.V. Tranche B 1LN, term loan CME Term SOFR 1 Month Index + 3.250% 7/4/28 (c)(d) | 1,360,000 | 1,325,782 | |
| Golden Entertainment, Inc. Tranche B, term loan 3 month U.S. LIBOR + 3.000% 6.09% 10/20/24 (b)(c)(d) | 7,386,160 | 7,297,526 | |
| GVC Holdings Gibraltar Ltd. Tranche B4 1LN, term loan 1 month U.S. LIBOR + 2.250% 6.1741% 3/16/27 (b)(c)(d) | 2,947,576 | 2,862,833 | |
| J&J Ventures Gaming LLC 1LN, term loan 1 month U.S. LIBOR + 4.000% 7.6741% 4/26/28 (b)(c)(d) | 2,796,750 | 2,644,691 | |
| PCI Gaming Authority 1LN, term loan 1 month U.S. LIBOR + 2.500% 5.6153% 5/29/26 (b)(c)(d) | 3,284,152 | 3,185,628 | |
| Playtika Holding Corp. Tranche B 1LN, term loan 1 month U.S. LIBOR + 2.750% 5.8653% 3/11/28 (b)(c)(d) | 1,170,330 | 1,118,730 | |
| Scientific Games Corp. 1LN, term loan CME Term SOFR 1 Month Index + 3.000% 5.9062% 4/7/29 (b)(c)(d) | 5,586,000 | 5,415,627 | |
| Scientific Games Holdings LP term loan CME Term SOFR 1 Month Index + 3.500% 5.6165% 4/4/29 (b)(c)(d) | 6,095,000 | 5,631,536 | |
| Stars Group Holdings BV Tranche B 1LN, term loan 1 month U.S. LIBOR + 2.250% 5.8919% 7/16/26 (b)(c)(d) | 7,856,329 | 7,547,968 | |
| Station Casinos LLC Tranche B 1LN, term loan 1 month U.S. LIBOR + 2.250% 5.37% 2/7/27 (b)(c)(d) | 8,906,573 | 8,503,907 | |
TOTAL GAMING | 111,369,675 | ||
| Healthcare - 5.0% | |||
| Accelerated Health Systems LLC Tranche B1 LN, term loan CME Term SOFR 1 Month Index + 4.250% 7.9532% 2/2/29 (b)(c)(d) | 2,064,825 | 1,842,856 | |
| AHP Health Partners, Inc. Tranche B 1LN, term loan 1 month U.S. LIBOR + 3.500% 6.6153% 8/23/28 (b)(c)(d) | 3,238,460 | 3,079,581 | |
| Avantor Funding, Inc. Tranche B5 1LN, term loan 1 month U.S. LIBOR + 2.250% 5.3653% 11/6/27 (b)(c)(d) | 5,523,712 | 5,365,789 | |
| Charlotte Buyer, Inc. Tranche B 1LN, term loan CME Term SOFR 1 Month Index + 5.250% 7.9803% 2/12/28 (b)(c)(d) | 2,000,000 | 1,870,000 | |
| Da Vinci Purchaser Corp. Tranche B 1LN, term loan 1 month U.S. LIBOR + 4.000% 7.4639% 12/13/26 (b)(c)(d) | 7,252,456 | 6,805,197 | |
| Elanco Animal Health, Inc. Tranche B 1LN, term loan 1 month U.S. LIBOR + 1.750% 4.314% 8/1/27 (b)(c)(d) | 8,848,358 | 8,400,455 | |
| Electron BidCo, Inc. Tranche B 1LN, term loan 1 month U.S. LIBOR + 3.000% 6.1153% 11/1/28 (b)(c)(d) | 3,283,500 | 3,105,830 | |
| Embecta Corp. Tranche B 1LN, term loan CME TERM SOFR 3 MONTH INDEX + 3.000% 6.5532% 3/31/29 (b)(c)(d) | 2,757,664 | 2,674,934 | |
| Gainwell Acquisition Corp. Tranche B 1LN, term loan 1 month U.S. LIBOR + 4.000% 6.2504% 10/1/27 (b)(c)(d) | 16,945,355 | 16,110,796 | |
| HAH Group Holding Co. LLC: | |||
| 1LN, term loan 1 month U.S. LIBOR + 5.000% 8.71% 10/29/27 (b)(c)(d) | 777,841 | 738,949 | |
| Tranche DD 1LN, term loan 1 month U.S. LIBOR + 5.000% 8.71% 10/29/27 (b)(c)(d) | 98,423 | 93,502 | |
| Horizon Pharma U.S.A., Inc. Tranche B 1LN, term loan 1 month U.S. LIBOR + 1.750% 4.875% 3/15/28 (b)(c)(d) | 2,826,950 | 2,708,586 | |
| ICU Medical, Inc. Tranche B 1LN, term loan CME Term SOFR 1 Month Index + 2.500% 5.8859% 1/6/29 (b)(c)(d) | 3,636,725 | 3,538,242 | |
| Insulet Corp. Tranche B 1LN, term loan 1 month U.S. LIBOR + 3.250% 6.3653% 5/4/28 (b)(c)(d) | 7,598,813 | 7,389,845 | |
| Jazz Financing Lux SARL Tranche B 1LN, term loan 1 month U.S. LIBOR + 3.500% 6.6153% 5/5/28 (b)(c)(d) | 8,248,121 | 7,959,437 | |
| Mamba Purchaser, Inc. Tranche B 1LN, term loan 1 month U.S. LIBOR + 3.500% 6.5519% 10/14/28 (b)(c)(d) | 6,901 | 6,530 | |
| Maravai Intermediate Holdings LLC Tranche B 1LN, term loan CME Term SOFR 1 Month Index + 3.000% 5.5532% 10/19/27 (b)(c)(d) | 4,213,012 | 4,073,477 | |
| MED ParentCo LP: | |||
| 1LN, term loan 1 month U.S. LIBOR + 4.250% 7.3653% 8/31/26 (b)(c)(d) | 3,434,834 | 2,879,525 | |
| 2LN, term loan 1 month U.S. LIBOR + 8.250% 11.3653% 8/30/27 (b)(c)(d) | 1,310,000 | 1,110,225 | |
| Mozart Borrower LP Tranche B 1LN, term loan 1 month U.S. LIBOR + 3.250% 6.3653% 10/23/28 (b)(c)(d) | 2,276,031 | 2,088,964 | |
| National Mentor Holdings, Inc. Tranche B 1LN, term loan 1 month U.S. LIBOR + 3.750% 7.1795% 3/2/28 (b)(c)(d) | 1,747,487 | 1,238,531 | |
| Organon & Co. Tranche B 1LN, term loan 1 month U.S. LIBOR + 3.000% 6.1875% 6/2/28 (b)(c)(d) | 8,056,967 | 7,855,542 | |
| Packaging Coordinators Midco, Inc. Tranche B 1LN, term loan 3 month U.S. LIBOR + 3.750% 7.4241% 11/30/27 (b)(c)(d) | 4,060,017 | 3,850,236 | |
| Pathway Vet Alliance LLC Tranche B 1LN, term loan 1 month U.S. LIBOR + 3.750% 7.4241% 3/31/27 (b)(c)(d) | 5,300,723 | 4,644,758 | |
| Phoenix Newco, Inc. Tranche B 1LN, term loan 1 month U.S. LIBOR + 3.250% 5.7739% 11/15/28 (b)(c)(d) | 11,743,469 | 11,185,654 | |
| Pluto Acquisition I, Inc. term loan 1 month U.S. LIBOR + 4.000% 6.0757% 6/20/26 (b)(c)(d) | 3,844,563 | 3,344,770 | |
| PRA Health Sciences, Inc. Tranche B 1LN, term loan 1 month U.S. LIBOR + 2.250% 5.9375% 7/3/28 (b)(c)(d) | 3,021,411 | 2,948,898 | |
| Surgery Center Holdings, Inc. 1LN, term loan 1 month U.S. LIBOR + 3.750% 6.51% 8/31/26 (b)(c)(d) | 540,347 | 511,979 | |
| U.S. Anesthesia Partners, Inc.: | |||
| 2LN, term loan 1 month U.S. LIBOR + 7.500% 10.064% 10/1/29 (b)(c)(d) | 775,000 | 730,438 | |
| Tranche B 1LN, term loan 1 month U.S. LIBOR + 4.250% 6.814% 10/1/28 (b)(c)(d) | 6,138,000 | 5,754,375 | |
| U.S. Radiology Specialists, Inc. Tranche B 1LN, term loan 1 month U.S. LIBOR + 5.250% 8.9241% 12/15/27 (b)(c)(d) | 2,153,675 | 1,893,447 | |
| Upstream Newco, Inc. 1LN, term loan 1 month U.S. LIBOR + 4.250% 8.0648% 11/20/26 (b)(c)(d) | 2,160,773 | 1,998,715 | |
TOTAL HEALTHCARE | 127,800,063 | ||
| Homebuilders/Real Estate - 0.7% | |||
| DTZ U.S. Borrower LLC Tranche B 1LN, term loan 1 month U.S. LIBOR + 2.750% 5.8653% 8/21/25 (b)(c)(d) | 7,440,138 | 7,097,371 | |
| Fluidra Finco SL Tranche B 1LN, term loan CME Term SOFR 1 Month Index + 2.000% 5.1341% 1/27/29 (b)(c)(d) | 3,220,613 | 3,112,497 | |
| Lightstone Holdco LLC: | |||
| Tranche B 1LN, term loan CME Term SOFR 1 Month Index + 5.750% 8.7841% 1/30/27 (b)(c)(d) | 4,226,029 | 3,847,208 | |
| Tranche C 1LN, term loan CME Term SOFR 1 Month Index + 5.750% 8.7841% 1/30/27 (b)(c)(d) | 239,022 | 217,596 | |
| Ryan Specialty Group LLC Tranche B 1LN, term loan 1 month U.S. LIBOR + 3.000% 6.1341% 9/1/27 (b)(c)(d)(e) | 4,527,600 | 4,369,134 | |
TOTAL HOMEBUILDERS/REAL ESTATE | 18,643,806 | ||
| Hotels - 2.2% | |||
| Aimbridge Acquisition Co., Inc.: | |||
| Tranche B 1LN, term loan 1 month U.S. LIBOR + 4.750% 7.7434% 2/1/26 (b)(c)(d) | 936,736 | 833,695 | |
| Tranche B, term loan 3 month U.S. LIBOR + 3.750% 6.8653% 2/1/26 (b)(c)(d) | 2,783,976 | 2,442,939 | |
| ASP LS Acquisition Corp. Tranche B 1LN, term loan 1 month U.S. LIBOR + 4.500% 7.3769% 4/30/28 (b)(c)(d) | 2,018,278 | 1,694,102 | |
| BRE/Everbright M6 Borrower LLC Tranche B 1LN, term loan 1 month U.S. LIBOR + 5.000% 8.0519% 9/9/26 (b)(c)(d) | 2,987,425 | 2,892,813 | |
| Carnival Finance LLC Tranche B 1LN, term loan: | |||
| 1 month U.S. LIBOR + 3.000% 5.8769% 6/30/25 (b)(c)(d) | 3,511,693 | 3,178,082 | |
| 1 month U.S. LIBOR + 3.250% 6.1269% 10/18/28 (b)(c)(d) | 7,198,088 | 6,274,357 | |
| Four Seasons Holdings, Inc. Tranche B, term loan 3 month U.S. LIBOR + 2.000% 5.1206% 11/30/23 (b)(c)(d) | 6,575,981 | 6,537,248 | |
| Hilton Grand Vacations Borrower LLC Tranche B 1LN, term loan 1 month U.S. LIBOR + 3.000% 6.1153% 8/2/28 (b)(c)(d) | 14,978,512 | 14,468,344 | |
| Hilton Worldwide Finance LLC Tranche B 1LN, term loan 1 month U.S. LIBOR + 1.750% 4.834% 6/21/26 (b)(c)(d) | 2,792,849 | 2,697,417 | |
| Marriott Ownership Resorts, Inc. Tranche B 1LN, term loan 1 month U.S. LIBOR + 1.750% 4.8653% 8/31/25 (b)(c)(d) | 3,381,280 | 3,212,216 | |
| Oravel Stays Singapore Pte Ltd. Tranche B 1LN, term loan 1 month U.S. LIBOR + 8.250% 11.86% 6/23/26 (b)(c)(d) | 2,054,000 | 1,810,950 | |
| Travelport Finance Luxembourg SARL 1LN, term loan: | |||
| 1 month U.S. LIBOR + 3.750% 12.4241% 2/28/25 (b)(c)(d) | 3,766,754 | 3,721,251 | |
| 3 month U.S. LIBOR + 6.750% 10.4241% 5/30/26 (b)(c)(d) | 4,646,956 | 3,231,958 | |
| Wyndham Hotels & Resorts, Inc. Tranche B, term loan 3 month U.S. LIBOR + 1.750% 4.8653% 5/30/25 (b)(c)(d) | 2,687,597 | 2,612,721 | |
TOTAL HOTELS | 55,608,093 | ||
| Insurance - 4.6% | |||
| Acrisure LLC: | |||
| Tranche B 1LN, term loan: | |||
1 month U.S. LIBOR + 3.500% 6.6153% 2/13/27 (b)(c)(d) | 13,396,066 | 12,218,284 | |
1 month U.S. LIBOR + 4.250% 7.3653% 2/15/27 (b)(c)(d) | 2,560,650 | 2,400,609 | |
| Tranche B-2 1LN, term loan 1 month U.S. LIBOR + 3.750% 6.8653% 2/15/27 (b)(c)(d) | 831,600 | 759,875 | |
| Alliant Holdings Intermediate LLC: | |||
| Tranche B, term loan 1 month U.S. LIBOR + 3.250% 6.3653% 5/10/25 (b)(c)(d) | 4,573,706 | 4,375,756 | |
| Tranche B-2 1LN, term loan 1 month U.S. LIBOR + 3.250% 6.3653% 5/9/25 (b)(c)(d) | 967,500 | 925,975 | |
| Tranche B3 1LN, term loan 1 month U.S. LIBOR + 3.500% 6.4934% 11/12/27 (b)(c)(d) | 6,172,538 | 5,840,764 | |
| AmWINS Group, Inc. Tranche B 1LN, term loan 1 month U.S. LIBOR + 2.250% 4.7739% 2/19/28 (b)(c)(d) | 6,228,874 | 5,947,142 | |
| AssuredPartners, Inc. Tranche B 1LN, term loan: | |||
| 1 month U.S. LIBOR + 3.500% 6.6153% 2/13/27 (b)(c)(d) | 192,563 | 181,972 | |
| 1 month U.S. LIBOR + 3.500% 6.6153% 2/13/27 (b)(c)(d) | 6,045,432 | 5,712,933 | |
| Asurion LLC: | |||
| Tranche B 7LN, term loan 1 month U.S. LIBOR + 3.000% 6.1153% 11/3/24 (b)(c)(d) | 6,702,500 | 6,256,784 | |
| Tranche B3 2LN, term loan 1 month U.S. LIBOR + 5.250% 8.3653% 1/31/28 (b)(c)(d) | 15,975,000 | 11,981,250 | |
| Tranche B4 2LN, term loan 1 month U.S. LIBOR + 5.250% 8.3653% 1/20/29 (b)(c)(d) | 19,820,000 | 15,063,200 | |
| Tranche B8 1LN, term loan 1 month U.S. LIBOR + 3.250% 6.3653% 12/23/26 (b)(c)(d) | 9,247,572 | 7,820,025 | |
| Tranche B9 1LN, term loan 1 month U.S. LIBOR + 3.250% 6.3653% 7/31/27 (b)(c)(d) | 4,971,184 | 4,183,251 | |
| HUB International Ltd.: | |||
| Tranche B 1LN, term loan 1 month U.S. LIBOR + 3.250% 5.9817% 4/25/25 (b)(c)(d) | 14,480,596 | 13,928,596 | |
| Tranche B, term loan 1 month U.S. LIBOR + 3.000% 5.7663% 4/25/25 (b)(c)(d) | 9,901,928 | 9,507,930 | |
| USI, Inc.: | |||
| 1LN, term loan 1 month U.S. LIBOR + 3.250% 6.9241% 12/2/26 (b)(c)(d) | 2,851,924 | 2,740,214 | |
| Tranche B, term loan 3 month U.S. LIBOR + 3.000% 6.4241% 5/16/24 (b)(c)(d) | 7,048,918 | 6,849,222 | |
TOTAL INSURANCE | 116,693,782 | ||
| Leisure - 3.1% | |||
| Alterra Mountain Co. Tranche B 1LN, term loan 1 month U.S. LIBOR + 3.500% 6.6153% 8/17/28 (b)(c)(d) | 4,344,815 | 4,203,608 | |
| Arcis Golf LLC Tranche B 1LN, term loan 1 month U.S. LIBOR + 4.250% 7.3653% 11/24/28 (b)(c)(d)(e) | 1,865,625 | 1,809,656 | |
| City Football Group Ltd. Tranche B 1LN, term loan 1 month U.S. LIBOR + 3.500% 6.484% 7/21/28 (b)(c)(d) | 11,637,063 | 11,045,551 | |
| Crown Finance U.S., Inc.: | |||
| 1LN, term loan CME Term SOFR 1 Month Index + 10.000% 9/9/23 (c)(d) | 4,080,337 | 4,152,885 | |
| Tranche B 1LN, term loan: | |||
1 month U.S. LIBOR + 2.500% 3.9997% 2/28/25 (b)(c)(d) | 5,645,675 | 2,375,192 | |
1 month U.S. LIBOR + 2.750% 4.2497% 9/30/26 (b)(c)(d) | 2,315,581 | 958,072 | |
1 month U.S. LIBOR + 8.250% 10.0763% 5/23/24 (b)(c)(d) | 731,517 | 780,895 | |
15.25% 5/23/24 (d) | 1,214,798 | 1,439,232 | |
| Tranche DD 1LN, term loan CME Term SOFR 1 Month Index + 10.000% 9/9/23 (c)(d) | 342,885 | 348,982 | |
| Delta 2 SARL Tranche B, term loan 3 month U.S. LIBOR + 2.500% 5.6153% 2/1/24 (b)(c)(d) | 15,394,747 | 15,183,069 | |
| Equinox Holdings, Inc.: | |||
| Tranche 2LN, term loan 3 month U.S. LIBOR + 7.000% 10.6741% 9/8/24 (b)(c)(d) | 1,000,000 | 658,980 | |
| Tranche B-1, term loan 3 month U.S. LIBOR + 3.000% 6.6741% 3/8/24 (b)(c)(d) | 5,640,729 | 4,256,381 | |
| Hayward Industries, Inc. Tranche B 1LN, term loan 1 month U.S. LIBOR + 2.500% 5.6153% 5/28/28 (b)(c)(d) | 2,755,125 | 2,593,261 | |
| Herschend Entertainment Co. LLC Tranche B 1LN, term loan 1 month U.S. LIBOR + 3.750% 6.88% 8/27/28 (b)(c)(d) | 1,816,650 | 1,767,837 | |
| Lids Holdings, Inc. 1LN, term loan CME Term SOFR 1 Month Index + 5.500% 8.9904% 12/14/26 (b)(c)(d)(e) | 6,769,688 | 6,634,294 | |
| MajorDrive Holdings IV LLC 1LN, term loan 1 month U.S. LIBOR + 4.000% 7.125% 5/12/28 (b)(c)(d) | 3,432,110 | 3,157,542 | |
| SeaWorld Parks & Entertainment, Inc. Tranche B 1LN, term loan 1 month U.S. LIBOR + 3.000% 6.125% 8/25/28 (b)(c)(d) | 2,593,576 | 2,484,438 | |
| SP PF Buyer LLC Tranche B 1LN, term loan 3 month U.S. LIBOR + 4.500% 7.6153% 12/21/25 (b)(c)(d) | 4,513,797 | 3,696,799 | |
| Topgolf Callaway Brands Corp. Tranche B, term loan 3 month U.S. LIBOR + 4.500% 7.6153% 1/4/26 (b)(c)(d) | 2,684,938 | 2,663,673 | |
| United PF Holdings LLC: | |||
| 1LN, term loan 1 month U.S. LIBOR + 4.000% 7.6741% 12/30/26 (b)(c)(d) | 7,886,612 | 6,910,644 | |
| 2LN, term loan 3 month U.S. LIBOR + 8.500% 12.1741% 12/30/27 (b)(c)(d) | 750,000 | 716,250 | |
| Tranche B 1LN, term loan 1 month U.S. LIBOR + 8.500% 12.1741% 12/30/26 (b)(c)(d)(e) | 940,800 | 898,464 | |
TOTAL LEISURE | 78,735,705 | ||
| Paper - 0.8% | |||
| Ahlstrom-Munksjo OYJ 1LN, term loan 1 month U.S. LIBOR + 3.750% 7.4241% 2/4/28 (b)(c)(d) | 2,536,616 | 2,335,792 | |
| Clydesdale Acquisition Holdings, Inc. 1LN, term loan CME Term SOFR 1 Month Index + 4.170% 7.3091% 4/13/29 (b)(c)(d) | 18,698,138 | 17,610,093 | |
| Journey Personal Care Corp. Tranche B 1LN, term loan 1 month U.S. LIBOR + 4.250% 7.9241% 3/1/28 (b)(c)(d) | 1,658,208 | 1,041,902 | |
TOTAL PAPER | 20,987,787 | ||
| Publishing/Printing - 0.7% | |||
| Cengage Learning, Inc. Tranche B 1LN, term loan 1 month U.S. LIBOR + 4.750% 7.8144% 7/14/26 (b)(c)(d) | 746,860 | 674,392 | |
| Harland Clarke Holdings Corp.: | |||
| 1LN, term loan 1 month U.S. LIBOR + 7.750% 11.4241% 6/16/26 (b)(c)(d) | 2,945,221 | 2,037,121 | |
| Tranche B 7LN, term loan 3 month U.S. LIBOR + 4.750% 8.4241% 11/3/23 (b)(c)(d) | 482,595 | 333,898 | |
| Learning Care Group (U.S.) No 2, Inc. Tranche B 1LN, term loan: | |||
| 1 month U.S. LIBOR + 8.500% 11.4273% 3/13/25 (b)(c)(d)(e) | 2,380,213 | 2,332,608 | |
| 3 month U.S. LIBOR + 3.250% 6.0698% 3/13/25 (b)(c)(d) | 2,253,188 | 2,126,446 | |
| MJH Healthcare Holdings LLC Tranche B 1LN, term loan CME Term SOFR 1 Month Index + 3.500% 6.6341% 1/28/29 (b)(c)(d) | 2,388,000 | 2,241,735 | |
| Recorded Books, Inc. Tranche B 1LN, term loan 1 month U.S. LIBOR + 4.000% 7.0753% 8/29/25 (b)(c)(d) | 2,288,077 | 2,196,554 | |
| RLG Holdings LLC: | |||
| 2LN, term loan 1 month U.S. LIBOR + 7.500% 10.6153% 7/2/29 (b)(c)(d) | 590,000 | 560,500 | |
| Tranche B 1LN, term loan 1 month U.S. LIBOR + 4.000% 7.1153% 7/8/28 (b)(c)(d) | 2,347,263 | 2,202,507 | |
| Scripps (E.W.) Co. Tranche B 1LN, term loan 1 month U.S. LIBOR + 2.750% 5.8653% 1/7/28 (b)(c)(d) | 2,385,000 | 2,302,384 | |
TOTAL PUBLISHING/PRINTING | 17,008,145 | ||
| Railroad - 0.8% | |||
| AIT Worldwide Logistics Holdings, Inc. 1LN, term loan 1 month U.S. LIBOR + 4.750% 7.0429% 4/6/28 (b)(c)(d) | 4,552,678 | 4,148,628 | |
| Echo Global Logistics, Inc. 1LN, term loan 1 month U.S. LIBOR + 3.500% 6.6153% 11/23/28 (b)(c)(d) | 487,538 | 456,823 | |
| Einstein Merger Sub, Inc. 2LN, term loan 3 month U.S. LIBOR + 7.000% 9.8059% 11/23/29 (b)(c)(d)(e) | 2,095,000 | 2,084,525 | |
| First Student Bidco, Inc.: | |||
| Tranche B 1LN, term loan: | |||
1 month U.S. LIBOR + 3.000% 6.6419% 7/21/28 (b)(c)(d) | 2,989,998 | 2,762,490 | |
CME Term SOFR 1 Month Index + 4.000% 6.1544% 7/21/28 (b)(c)(d) | 1,313,766 | 1,242,337 | |
| Tranche C 1LN, term loan: | |||
1 month U.S. LIBOR + 3.000% 6.6419% 7/21/28 (b)(c)(d) | 1,112,283 | 1,027,650 | |
CME Term SOFR 1 Month Index + 4.000% 6.1544% 7/21/28 (b)(c)(d) | 91,234 | 86,273 | |
| Genesee & Wyoming, Inc. 1LN, term loan 3 month U.S. LIBOR + 2.000% 5.6741% 12/30/26 (b)(c)(d) | 3,443,705 | 3,342,735 | |
| Worldwide Express, Inc.: | |||
| 1LN, term loan 1 month U.S. LIBOR + 4.000% 7.6741% 7/22/28 (b)(c)(d) | 4,629,963 | 4,197,339 | |
| Tranche B 2LN, term loan 1 month U.S. LIBOR + 7.000% 9.2504% 7/22/29 (b)(c)(d) | 1,295,000 | 1,165,500 | |
TOTAL RAILROAD | 20,514,300 | ||
| Restaurants - 0.8% | |||
| Burger King Worldwide, Inc. Tranche B 1LN, term loan 1 month U.S. LIBOR + 1.750% 4.8706% 11/19/26 (b)(c)(d) | 2,906,477 | 2,773,099 | |
| Dave & Buster's, Inc. Tranche B 1LN, term loan CME Term SOFR 1 Month Index + 5.000% 8.1875% 6/29/29 (b)(c)(d) | 2,835,000 | 2,759,391 | |
| Flynn Restaurant Group LP Tranche B 1LN, term loan 1 month U.S. LIBOR + 4.250% 7.3653% 11/22/28 (b)(c)(d) | 1,714,506 | 1,592,776 | |
| KFC Holding Co. Tranche B 1LN, term loan 1 month U.S. LIBOR + 1.750% 4.7434% 3/15/28 (b)(c)(d) | 664,719 | 656,689 | |
| Pacific Bells LLC Tranche B 1LN, term loan 1 month U.S. LIBOR + 4.500% 8.3148% 10/20/28 (b)(c)(d) | 2,074,487 | 1,929,273 | |
| PFC Acquisition Corp. Tranche B 1LN, term loan 3 month U.S. LIBOR + 6.500% 9.5696% 3/1/26 (b)(c)(d) | 3,498,125 | 3,078,350 | |
| Whatabrands LLC Tranche B 1LN, term loan 1 month U.S. LIBOR + 3.250% 6.3653% 7/21/28 (b)(c)(d) | 8,730,839 | 8,060,747 | |
TOTAL RESTAURANTS | 20,850,325 | ||
| Services - 8.5% | |||
| ABG Intermediate Holdings 2 LLC: | |||
| Tranche B 1LN, term loan 1 month U.S. LIBOR + 3.250% 6.3653% 9/27/24 (b)(c)(d) | 2,847,127 | 2,775,237 | |
| Tranche B 2LN, term loan CME Term SOFR 1 Month Index + 6.000% 9.1341% 12/20/29 (b)(c)(d) | 2,355,000 | 2,207,813 | |
| Tranche B1 LN, term loan CME Term SOFR 1 Month Index + 3.500% 6.6341% 12/21/28 (b)(c)(d) | 10,463,775 | 9,988,510 | |
| Adtalem Global Education, Inc. Tranche B 1LN, term loan 1 month U.S. LIBOR + 4.000% 7.0519% 8/12/28 (b)(c)(d) | 2,885,076 | 2,854,436 | |
| AEA International Holdings Luxembourg SARL Tranche B 1LN, term loan 1 month U.S. LIBOR + 3.750% 7.4375% 9/7/28 (b)(c)(d)(e) | 2,106,544 | 2,048,614 | |
| All-Star Bidco AB: | |||
| Tranche B 1LN, term loan 1 month U.S. LIBOR + 4.000% 7.0696% 11/16/28 (b)(c)(d) | 2,481,250 | 2,360,289 | |
| Tranche B1 1LN, term loan 1 month U.S. LIBOR + 3.500% 6.5696% 11/16/28 (b)(c)(d) | 2,427,750 | 2,291,189 | |
| Allied Universal Holdco LLC Tranche B 1LN, term loan 1 month U.S. LIBOR + 3.750% 6.8653% 5/14/28 (b)(c)(d) | 9,444,600 | 8,282,914 | |
| APX Group, Inc. Tranche B 1LN, term loan 1 month U.S. LIBOR + 3.500% 6.2443% 7/9/28 (b)(c)(d) | 4,355,197 | 4,107,865 | |
| Aramark Services, Inc. Tranche B 3LN, term loan 1 month U.S. LIBOR + 1.750% 4.8653% 3/11/25 (b)(c)(d) | 4,726,300 | 4,560,880 | |
| Ascend Learning LLC: | |||
| 2LN, term loan 1 month U.S. LIBOR + 5.750% 8.8653% 12/10/29 (b)(c)(d) | 3,705,000 | 3,207,159 | |
| Tranche B 1LN, term loan 1 month U.S. LIBOR + 3.500% 6.6153% 12/10/28 (b)(c)(d) | 8,838,213 | 8,139,994 | |
| Asurion LLC 1LN, term loan CME Term SOFR 1 Month Index + 4.000% 7.1341% 8/17/28 (b)(c)(d) | 2,055,008 | 1,745,893 | |
| Brand Energy & Infrastructure Services, Inc. Tranche B, term loan 3 month U.S. LIBOR + 4.250% 6.9468% 6/21/24 (b)(c)(d) | 13,534,055 | 11,745,936 | |
| Cast & Crew Payroll LLC Tranche B 1LN, term loan: | |||
| 1 month U.S. LIBOR + 3.500% 6.6153% 2/7/26 (b)(c)(d) | 5,999,586 | 5,834,597 | |
| CME Term SOFR 1 Month Index + 3.750% 6.7841% 12/30/28 (b)(c)(d) | 2,411,775 | 2,330,378 | |
| CHG Healthcare Services, Inc. 1LN, term loan 1 month U.S. LIBOR + 3.250% 6.3653% 9/30/28 (b)(c)(d) | 1,971,518 | 1,889,779 | |
| Citadel Securities LP Tranche B 1LN, term loan CME Term SOFR 1 Month Index + 3.000% 6.1486% 2/2/28 (b)(c)(d) | 1,505,000 | 1,484,306 | |
| CoreLogic, Inc. Tranche B 1LN, term loan 1 month U.S. LIBOR + 3.500% 6.625% 6/2/28 (b)(c)(d) | 10,182,150 | 7,611,157 | |
| EAB Global, Inc. Tranche B 1LN, term loan 1 month U.S. LIBOR + 3.500% 6.3052% 8/16/28 (b)(c)(d) | 2,406,788 | 2,250,346 | |
| EmployBridge LLC Tranche B 1LN, term loan 1 month U.S. LIBOR + 4.750% 8.4241% 7/19/28 (b)(c)(d) | 7,128,000 | 6,330,591 | |
| Ensemble RCM LLC 1LN, term loan 3 month U.S. LIBOR + 3.750% 6.5559% 8/1/26 (b)(c)(d) | 4,140,918 | 4,034,827 | |
| Filtration Group Corp.: | |||
| Tranche B 1LN, term loan 1 month U.S. LIBOR + 3.500% 6.6153% 10/21/28 (b)(c)(d) | 5,222,250 | 4,945,889 | |
| Tranche B, term loan 3 month U.S. LIBOR + 3.000% 6.1153% 3/29/25 (b)(c)(d) | 208,147 | 199,497 | |
| Finastra U.S.A., Inc.: | |||
| Tranche 2LN, term loan 3 month U.S. LIBOR + 7.250% 10.6207% 6/13/25 (b)(c)(d) | 2,340,000 | 1,888,099 | |
| Tranche B 1LN, term loan 3 month U.S. LIBOR + 3.500% 6.8707% 6/13/24 (b)(c)(d) | 2,178,609 | 1,882,318 | |
| Flexera Software LLC Tranche B 1LN, term loan 1 month U.S. LIBOR + 3.750% 6.39% 3/3/28 (b)(c)(d) | 1,835,640 | 1,747,786 | |
| Franchise Group, Inc. Tranche B 1LN, term loan 3 month U.S. LIBOR + 4.750% 7.5625% 3/10/26 (b)(c)(d) | 4,646,789 | 4,329,274 | |
| Galaxy U.S. Opco, Inc. 1LN, term loan CME Term SOFR 1 Month Index + 4.750% 7.7841% 4/29/29 (b)(c)(d) | 3,405,000 | 3,192,188 | |
| Gateway Merger Sub 2021, Inc. Tranche B 1LN, term loan 1 month U.S. LIBOR + 5.250% 8.1699% 6/30/28 (b)(c)(d) | 1,866,150 | 1,707,527 | |
| GEMS MENASA Cayman Ltd. Tranche B 1LN, term loan 1 month U.S. LIBOR + 5.000% 8.5664% 7/30/26 (b)(c)(d) | 5,756,119 | 5,576,240 | |
| Greeneden U.S. Holdings II LLC Tranche B 1LN, term loan 1 month U.S. LIBOR + 4.000% 7.1153% 12/1/27 (b)(c)(d) | 4,319,225 | 4,101,709 | |
| Indy U.S. Bidco LLC Tranche B 1LN, term loan 1 month U.S. LIBOR + 3.750% 6.8653% 3/5/28 (b)(c)(d) | 2,275,465 | 2,035,586 | |
| Ion Trading Finance Ltd. Tranche B 1LN, term loan 1 month U.S. LIBOR + 4.750% 8.4241% 3/26/28 (b)(c)(d) | 8,250,363 | 7,639,836 | |
| KNS Acquisitions, Inc. Tranche B 1LN, term loan 1 month U.S. LIBOR + 6.250% 10.4199% 4/21/27 (b)(c)(d) | 1,798,875 | 1,677,451 | |
| KUEHG Corp.: | |||
| Tranche B 2LN, term loan 3 month U.S. LIBOR + 8.250% 11.3652% 8/22/25 (b)(c)(d) | 1,000,000 | 969,000 | |
| Tranche B, term loan 3 month U.S. LIBOR + 3.750% 6.8653% 2/21/25 (b)(c)(d) | 6,812,039 | 6,423,208 | |
| Lakeshore Intermediate LLC 1LN, term loan 1 month U.S. LIBOR + 3.500% 6.1333% 10/1/28 (b)(c)(d) | 1,447,155 | 1,374,797 | |
| Maverick Purchaser Sub LLC: | |||
| Tranche B 1LN, term loan: | |||
1 month U.S. LIBOR + 4.000% 7.7977% 1/23/27 (b)(c)(d) | 4,655,708 | 4,430,698 | |
CME Term SOFR 1 Month Index + 4.000% 7.3925% 2/16/29 (b)(c)(d) | 4,339,125 | 4,133,017 | |
| Tranche B 2LN, term loan 1 month U.S. LIBOR + 8.750% 12.9199% 1/31/28 (b)(c)(d)(e) | 4,060,000 | 3,694,600 | |
| Pilot Travel Centers LLC Tranche B 1LN, term loan 1 month U.S. LIBOR + 2.000% 5.1341% 8/4/28 (b)(c)(d) | 7,556,107 | 7,217,442 | |
| PowerTeam Services LLC Tranche B 1LN, term loan 1 month U.S. LIBOR + 3.500% 7.1741% 3/6/25 (b)(c)(d) | 2,740,313 | 2,218,283 | |
| Sabert Corp. Tranche B 1LN, term loan 1 month U.S. LIBOR + 4.500% 7.625% 12/10/26 (b)(c)(d)(e) | 4,396,373 | 4,198,536 | |
| Sabre GLBL, Inc.: | |||
| Tranche B-1 1LN, term loan 1 month U.S. LIBOR + 3.500% 6.6153% 12/17/27 (b)(c)(d) | 555,789 | 496,275 | |
| Tranche B-2 1LN, term loan 1 month U.S. LIBOR + 3.500% 6.6153% 12/17/27 (b)(c)(d) | 885,961 | 791,092 | |
| Signal Parent, Inc. Tranche B 1LN, term loan 1 month U.S. LIBOR + 3.500% 6.6153% 4/3/28 (b)(c)(d) | 6,706,929 | 4,921,209 | |
| Sitel Worldwide Corp. Tranche B 1LN, term loan 1 month U.S. LIBOR + 3.750% 6.87% 8/27/28 (b)(c)(d) | 2,427,919 | 2,345,977 | |
| Spin Holdco, Inc. Tranche B 1LN, term loan 1 month U.S. LIBOR + 4.000% 7.1441% 3/4/28 (b)(c)(d) | 15,358,026 | 13,435,048 | |
| SuperMoose Borrower LLC Tranche B 1LN, term loan 3 month U.S. LIBOR + 3.750% 7.4241% 8/29/25 (b)(c)(d) | 2,017,011 | 1,759,842 | |
| The GEO Group, Inc. Tranche 1B 1LN, term loan CME Term SOFR 1 Month Index + 7.120% 10.2403% 3/23/27 (b)(c)(d) | 1,905,463 | 1,875,299 | |
| Uber Technologies, Inc. Tranche B 1LN, term loan: | |||
| 1 month U.S. LIBOR + 3.500% 6.5696% 4/4/25 (b)(c)(d) | 5,907,692 | 5,769,866 | |
| 1 month U.S. LIBOR + 3.500% 6.5696% 2/25/27 (b)(c)(d) | 5,875,159 | 5,715,708 | |
| Vaco Holdings LLC 1LN, term loan CME Term SOFR 1 Month Index + 5.000% 8.7032% 1/21/29 (b)(c)(d) | 3,379,463 | 3,269,630 | |
| WMB Holdings, Inc. Tranche B 1LN, term loan CME Term SOFR 1 Month Index + 3.250% 8/9/29 (c)(d) | 1,750,000 | 1,704,063 | |
TOTAL SERVICES | 215,749,700 | ||
| Specialty Retailing - 0.2% | |||
| New SK Holdco Sub LLC 1LN, term loan CME Term SOFR 1 Month Index + 6.750% 11.1954% 6/30/27 (b)(c)(d) | 4,851,958 | 4,366,762 | |
| Steel - 0.2% | |||
| Atkore International, Inc. Tranche B1LN, term loan 1 month U.S. LIBOR + 2.000% 6.1875% 5/26/28 (b)(c)(d) | 2,079,475 | 2,063,879 | |
| JMC Steel Group, Inc. 1LN, term loan 1 month U.S. LIBOR + 2.000% 5.6039% 1/24/27 (b)(c)(d) | 2,895,578 | 2,773,964 | |
| Tiger Acquisition LLC Tranche B 1LN, term loan 1 month U.S. LIBOR + 3.250% 6.3653% 6/1/28 (b)(c)(d) | 1,465,000 | 1,351,463 | |
TOTAL STEEL | 6,189,306 | ||
| Super Retail - 4.3% | |||
| Academy Ltd. Tranche B 1LN, term loan 1 month U.S. LIBOR + 3.750% 6.314% 11/6/27 (b)(c)(d) | 4,255,429 | 4,156,149 | |
| Ambience Merger Sub, Inc. Tranche B 1LN, term loan 1 month U.S. LIBOR + 4.000% 6.2771% 7/24/28 (b)(c)(d) | 4,080,421 | 3,123,807 | |
| Bass Pro Group LLC Tranche B 1LN, term loan 1 month U.S. LIBOR + 3.750% 6.8653% 3/5/28 (b)(c)(d) | 76,688,871 | 70,668,780 | |
| BJ's Wholesale Club, Inc. Tranche B 1LN, term loan 3 month U.S. LIBOR + 2.000% 4.7731% 2/3/24 (b)(c)(d) | 2,743,975 | 2,740,051 | |
| Empire Today LLC Tranche B 1LN, term loan 1 month U.S. LIBOR + 5.000% 7.6849% 4/1/28 (b)(c)(d) | 4,652,892 | 3,678,112 | |
| Harbor Freight Tools U.S.A., Inc. Tranche B 1LN, term loan 1 month U.S. LIBOR + 2.750% 5.8653% 10/19/27 (b)(c)(d) | 9,586,181 | 8,651,528 | |
| LBM Acquisition LLC Tranche B 1LN, term loan 1 month U.S. LIBOR + 3.750% 7.1207% 12/18/27 (b)(c)(d) | 1,213,612 | 1,056,450 | |
| Red Ventures LLC Tranche B 1LN, term loan 1 month U.S. LIBOR + 2.500% 5.6153% 11/8/24 (b)(c)(d) | 3,328,714 | 3,199,727 | |
| RH: | |||
| Tranche B 1LN, term loan 1 month U.S. LIBOR + 2.500% 5.6153% 10/20/28 (b)(c)(d) | 5,591,192 | 4,941,216 | |
| Tranche B2 1LN, term loan CME Term SOFR 1 Month Index + 3.250% 6.3841% 10/20/28 (b)(c)(d) | 7,940,000 | 7,208,011 | |
TOTAL SUPER RETAIL | 109,423,831 | ||
| Technology - 15.4% | |||
| A&V Holdings Midco LLC Tranche B 1LN, term loan 1 month U.S. LIBOR + 5.370% 9.5378% 3/10/27 (b)(c)(d)(e) | 3,460,879 | 3,374,357 | |
| Acuris Finance U.S., Inc. 1LN, term loan CME Term SOFR 1 Month Index + 4.000% 7.7032% 2/16/28 (b)(c)(d) | 3,631,771 | 3,471,973 | |
| Alliance Laundry Systems LLC Tranche B 1LN, term loan 1 month U.S. LIBOR + 3.500% 5.9551% 10/8/27 (b)(c)(d) | 1,629,046 | 1,559,127 | |
| Anastasia Parent LLC Tranche B, term loan 3 month U.S. LIBOR + 3.750% 7.4241% 8/10/25 (b)(c)(d) | 10,460,730 | 8,266,174 | |
| Applied Systems, Inc. Tranche B, term loan 1 month U.S. LIBOR + 3.000% 6.6741% 9/19/24 (b)(c)(d) | 2,000,000 | 1,947,760 | |
| Aptean, Inc. 1LN, term loan 1 month U.S. LIBOR + 4.250% 7.3196% 4/23/26 (b)(c)(d) | 4,294,444 | 4,093,164 | |
| Arches Buyer, Inc. Tranche B 1LN, term loan 1 month U.S. LIBOR + 3.250% 6.3653% 12/4/27 (b)(c)(d) | 2,599,280 | 2,331,243 | |
| Athenahealth Group, Inc.: | |||
| Tranche B 1LN, term loan CME Term SOFR 1 Month Index + 3.500% 6.5756% 2/15/29 (b)(c)(d) | 24,875,843 | 22,239,004 | |
| Tranche DD 1LN, term loan CME Term SOFR 1 Month Index + 3.500% 2/15/29 (c)(d)(f) | 4,226,812 | 3,778,770 | |
| AZZ, Inc. Tranche B 1LN, term loan CME Term SOFR 1 Month Index + 4.250% 7.085% 5/13/29 (b)(c)(d) | 2,612,380 | 2,538,371 | |
| Camelot Finance SA: | |||
| Tranche B 1LN, term loan 1 month U.S. LIBOR + 3.000% 6.1153% 10/31/26 (b)(c)(d) | 7,054,026 | 6,807,135 | |
| Tranche B, term loan 1 month U.S. LIBOR + 3.000% 6.1153% 10/31/26 (b)(c)(d) | 8,138,118 | 7,860,445 | |
| Central Parent, Inc. 1LN, term loan CME Term SOFR 1 Month Index + 4.500% 6.6095% 7/6/29 (b)(c)(d) | 11,065,000 | 10,638,776 | |
| Ceridian HCM Holding, Inc. Tranche B, term loan 1 month U.S. LIBOR + 2.500% 5.6153% 4/30/25 (b)(c)(d) | 1,648,868 | 1,563,951 | |
| Coherent Corp. Tranche B 1LN, term loan 3 month U.S. LIBOR + 2.750% 5.314% 7/1/29 (b)(c)(d) | 8,805,000 | 8,511,529 | |
| CommScope, Inc. Tranche B 1LN, term loan 3 month U.S. LIBOR + 3.250% 6.3653% 4/4/26 (b)(c)(d) | 9,440,326 | 8,696,901 | |
| ConnectWise LLC Tranche B 1LN, term loan 1 month U.S. LIBOR + 3.500% 7.1741% 9/30/28 (b)(c)(d) | 6,347,038 | 5,918,612 | |
| Constant Contact, Inc. Tranche B 1LN, term loan 1 month U.S. LIBOR + 4.000% 6.423% 2/10/28 (b)(c)(d) | 2,039,703 | 1,800,038 | |
| DCert Buyer, Inc.: | |||
| 1LN, term loan 3 month U.S. LIBOR + 4.000% 6.9027% 10/16/26 (b)(c)(d) | 8,983,060 | 8,548,909 | |
| Tranche B 2LN, term loan 1 month U.S. LIBOR + 7.000% 9.9027% 2/19/29 (b)(c)(d) | 5,713,409 | 5,307,757 | |
| DG Investment Intermediate Holdings, Inc.: | |||
| 2LN, term loan 1 month U.S. LIBOR + 6.750% 9.8653% 3/31/29 (b)(c)(d) | 630,000 | 583,802 | |
| Tranche B 1LN, term loan 1 month U.S. LIBOR + 3.750% 6.8653% 3/31/28 (b)(c)(d) | 2,750,279 | 2,557,759 | |
| Emerald TopCo, Inc. 1LN, term loan 1 month U.S. LIBOR + 3.500% 6.6153% 7/25/26 (b)(c)(d) | 248,993 | 225,961 | |
| Entegris, Inc. Tranche B 1LN, term loan CME Term SOFR 1 Month Index + 3.000% 5.6836% 7/6/29 (b)(c)(d) | 7,680,000 | 7,611,725 | |
| Eos U.S. Finco LLC 1LN, term loan CME Term SOFR 1 Month Index + 6.000% 8/3/29 (c)(d) | 1,500,000 | 1,415,625 | |
| Epicor Software Corp. Tranche B 1LN, term loan 1 month U.S. LIBOR + 3.250% 6.3653% 7/31/27 (b)(c)(d) | 3,518,661 | 3,288,857 | |
| Global IID Parent LLC Tranche B 1LN, term loan 1 month U.S. LIBOR + 4.500% 8.1741% 12/16/28 (b)(c)(d) | 2,059,438 | 1,951,317 | |
| Go Daddy Operating Co. LLC: | |||
| Tranche B 1LN, term loan 1 month U.S. LIBOR + 2.000% 5.1153% 8/10/27 (b)(c)(d) | 3,787,813 | 3,665,504 | |
| Tranche B, term loan 1 month U.S. LIBOR + 1.750% 4.8653% 2/15/24 (b)(c)(d) | 3,684,426 | 3,640,213 | |
| Hunter U.S. Bidco, Inc. Tranche B 1LN, term loan 1 month U.S. LIBOR + 4.250% 7.9241% 8/19/28 (b)(c)(d) | 3,279,431 | 3,090,864 | |
| Hyland Software, Inc.: | |||
| 2LN, term loan 1 month U.S. LIBOR + 6.250% 9.3653% 7/10/25 (b)(c)(d) | 602,800 | 590,744 | |
| Tranche B 1LN, term loan 1 month U.S. LIBOR + 3.500% 6.6153% 7/1/24 (b)(c)(d) | 4,403,512 | 4,254,365 | |
| Icon Luxembourg Sarl Tranche B 1LN, term loan 1 month U.S. LIBOR + 2.250% 5.9375% 7/3/28 (b)(c)(d) | 12,126,847 | 11,835,802 | |
| Imprivata, Inc. Tranche B 1LN, term loan 1 month U.S. LIBOR + 3.750% 6.8653% 12/1/27 (b)(c)(d) | 3,314,525 | 3,190,230 | |
| MA FinanceCo. LLC Tranche B 1LN, term loan 1 month U.S. LIBOR + 4.250% 7.4179% 6/5/25 (b)(c)(d) | 1,195,016 | 1,172,239 | |
| Maxar Technologies, Inc. Tranche B 1LN, term loan CME Term SOFR 1 Month Index + 4.250% 6.8053% 6/9/29 (b)(c)(d) | 1,201,988 | 1,128,366 | |
| McAfee Corp. Tranche B 1LN, term loan CME Term SOFR 1 Month Index + 3.750% 6.3621% 3/1/29 (b)(c)(d) | 1,915,200 | 1,741,798 | |
| MH Sub I LLC: | |||
| 1LN, term loan 1 month U.S. LIBOR + 3.750% 6.8653% 9/15/24 (b)(c)(d) | 5,414,466 | 5,146,450 | |
| Tranche B 2LN, term loan 1 month U.S. LIBOR + 6.250% 8.7053% 2/23/29 (b)(c)(d) | 3,030,000 | 2,830,535 | |
| Tranche B, term loan 3 month U.S. LIBOR + 3.750% 6.8653% 9/15/24 (b)(c)(d) | 9,062,295 | 8,619,058 | |
| MKS Instruments, Inc. Tranche B 1LN, term loan CME Term SOFR 1 Month Index + 2.750% 5.8684% 8/17/29 (b)(c)(d) | 8,400,000 | 8,175,300 | |
| Motus Group LLC Tranche B 1LN, term loan 1 month U.S. LIBOR + 4.000% 7.1153% 12/10/28 (b)(c)(d) | 1,626,825 | 1,508,880 | |
| NAVEX TopCo, Inc.: | |||
| 2LN, term loan 3 month U.S. LIBOR + 7.000% 9.53% 9/4/26 (b)(c)(d) | 415,000 | 398,400 | |
| Tranche B 1LN, term loan 3 month U.S. LIBOR + 3.250% 6.37% 9/5/25 (b)(c)(d) | 1,569,681 | 1,526,515 | |
| NortonLifeLock, Inc. Tranche B 1LN, term loan CME Term SOFR 1 Month Index + 2.000% 4.8475% 9/12/29 (b)(c)(d) | 11,995,000 | 11,509,203 | |
| Osmosis Debt Merger Sub, Inc. Tranche B 1LN, term loan CME Term SOFR 1 Month Index + 4.000% 6.3455% 7/30/28 (b)(c)(d) | 3,261,825 | 3,023,320 | |
| Park Place Technologies LLC 1LN, term loan 1 month U.S. LIBOR + 5.000% 8.1341% 11/10/27 (b)(c)(d) | 4,969,808 | 4,704,768 | |
| Peraton Corp. Tranche B 1LN, term loan 1 month U.S. LIBOR + 3.750% 6.8653% 2/1/28 (b)(c)(d) | 21,107,106 | 19,967,322 | |
| PointClickCare Technologies, Inc. Tranche B 1LN, term loan 1 month U.S. LIBOR + 3.000% 5.9375% 12/29/27 (b)(c)(d) | 1,615,400 | 1,538,669 | |
| Polaris Newco LLC Tranche B 1LN, term loan 1 month U.S. LIBOR + 4.000% 7.6741% 6/2/28 (b)(c)(d) | 9,904,950 | 9,118,101 | |
| Project Boost Purchaser LLC: | |||
| 1LN, term loan 3 month U.S. LIBOR + 3.500% 6.6153% 5/30/26 (b)(c)(d) | 2,187,417 | 2,072,578 | |
| Tranche B 1LN, term loan 1 month U.S. LIBOR + 3.500% 6.6153% 5/30/26 (b)(c)(d) | 2,019,600 | 1,908,522 | |
| Proofpoint, Inc. Tranche B 1LN, term loan 1 month U.S. LIBOR + 3.250% 6.3196% 8/31/28 (b)(c)(d) | 10,484,769 | 9,825,067 | |
| Rackspace Technology Global, Inc. Tranche B 1LN, term loan 1 month U.S. LIBOR + 2.750% 5.6167% 2/15/28 (b)(c)(d) | 9,050,813 | 6,416,664 | |
| RealPage, Inc. Tranche B 1LN, term loan 1 month U.S. LIBOR + 3.000% 6.1153% 4/22/28 (b)(c)(d) | 7,658,635 | 7,162,968 | |
| Red Planet Borrower LLC Tranche B 1LN, term loan 1 month U.S. LIBOR + 3.750% 6.8653% 9/30/28 (b)(c)(d) | 3,605,092 | 2,280,221 | |
| Renaissance Holdings Corp. Tranche B 1LN, term loan 3 month U.S. LIBOR + 3.250% 6.3653% 5/31/25 (b)(c)(d) | 5,330,235 | 5,057,060 | |
| Seattle Spinco, Inc.: | |||
| Tranche B 1LN, term loan CME Term SOFR 1 Month Index + 4.000% 7.1465% 3/1/27 (b)(c)(d)(e) | 10,231,678 | 10,001,466 | |
| Tranche B 3LN, term loan 3 month U.S. LIBOR + 2.750% 5.8653% 6/21/24 (b)(c)(d) | 9,513,033 | 9,275,207 | |
| Sophia LP Tranche B 1LN, term loan 1 month U.S. LIBOR + 3.250% 7.1741% 10/7/27 (b)(c)(d) | 5,256,776 | 5,046,505 | |
| SS&C Technologies, Inc.: | |||
| Tranche B 3LN, term loan 1 month U.S. LIBOR + 1.750% 4.8653% 4/16/25 (b)(c)(d) | 4,849,999 | 4,684,565 | |
| Tranche B 4LN, term loan 1 month U.S. LIBOR + 1.750% 4.8653% 4/16/25 (b)(c)(d) | 3,937,207 | 3,802,909 | |
| Tranche B 5LN, term loan 1 month U.S. LIBOR + 1.750% 4.8653% 4/16/25 (b)(c)(d) | 3,769,508 | 3,651,711 | |
| STG-Fairway Holdings LLC Tranche B 1LN, term loan 1 month U.S. LIBOR + 2.750% 5.8653% 1/31/27 (b)(c)(d) | 2,274,231 | 2,198,431 | |
| Tempo Acquisition LLC: | |||
| 1LN, term loan U.S. Secured Overnight Fin. Rate (SOFR) Index + 3.000% 6.0341% 8/31/28 (b)(c)(d) | 7,239,356 | 7,038,464 | |
| Tranche B, term loan 1 month U.S. LIBOR + 2.750% 5.8653% 5/1/24 (b)(c)(d) | 653,552 | 645,383 | |
| TTM Technologies, Inc. Tranche B, term loan 3 month U.S. LIBOR + 2.500% 5.064% 9/28/24 (b)(c)(d) | 2,662,361 | 2,609,114 | |
| UKG, Inc. 1LN, term loan 3 month U.S. LIBOR + 3.750% 6.8653% 5/4/26 (b)(c)(d) | 6,169,200 | 5,868,452 | |
| Ultimate Software Group, Inc.: | |||
| 1LN, term loan 1 month U.S. LIBOR + 3.250% 5.5351% 5/3/26 (b)(c)(d) | 15,547,691 | 14,757,402 | |
| 2LN, term loan 1 month U.S. LIBOR + 5.250% 7.5351% 5/3/27 (b)(c)(d) | 7,170,000 | 6,739,800 | |
| Verscend Holding Corp. Tranche B 1LN, term loan 1 month U.S. LIBOR + 4.000% 7.1153% 8/27/25 (b)(c)(d) | 6,543,742 | 6,331,070 | |
| VFH Parent LLC Tranche B 1LN, term loan CME Term SOFR 1 Month Index + 3.000% 6.1184% 1/13/29 (b)(c)(d) | 4,785,000 | 4,574,173 | |
| Virgin Pulse, Inc. Tranche B 1LN, term loan 1 month U.S. LIBOR + 4.000% 7.1153% 4/6/28 (b)(c)(d) | 4,026,330 | 3,496,183 | |
| VM Consolidated, Inc. Tranche B 1LN, term loan 1 month U.S. LIBOR + 3.250% 6.1269% 3/27/28 (b)(c)(d) | 5,098,925 | 4,961,254 | |
| VS Buyer LLC Tranche B 1LN, term loan 1 month U.S. LIBOR + 3.000% 6.1153% 2/28/27 (b)(c)(d) | 3,549,000 | 3,429,221 | |
| Weber-Stephen Products LLC Tranche B 1LN, term loan: | |||
| 1 month U.S. LIBOR + 3.250% 6.3653% 10/30/27 (b)(c)(d) | 2,407,164 | 1,944,531 | |
| CME Term SOFR 1 Month Index + 4.250% 6.8053% 10/30/27 (b)(c)(d)(e) | 1,442,750 | 1,154,200 | |
| Zelis Payments Buyer, Inc. Tranche B 1LN, term loan 1 month U.S. LIBOR + 3.500% 6.064% 9/30/26 (b)(c)(d) | 4,846,448 | 4,660,151 | |
TOTAL TECHNOLOGY | 390,858,960 | ||
| Telecommunications - 4.4% | |||
| Altice Financing SA Tranche B, term loan: | |||
| 3 month U.S. LIBOR + 2.750% 5.262% 7/15/25 (b)(c)(d) | 4,247,267 | 3,985,338 | |
| 3 month U.S. LIBOR + 2.750% 5.262% 1/31/26 (b)(c)(d) | 1,590,144 | 1,484,797 | |
| Cablevision Lightpath LLC Tranche B 1LN, term loan 1 month U.S. LIBOR + 3.250% 6.0677% 11/30/27 (b)(c)(d) | 1,506,041 | 1,439,218 | |
| Connect U.S. Finco LLC Tranche B 1LN, term loan 1 month U.S. LIBOR + 3.500% 6.62% 12/12/26 (b)(c)(d) | 1,823,746 | 1,692,673 | |
| Consolidated Communications, Inc. Tranche B 1LN, term loan 1 month U.S. LIBOR + 3.500% 6.625% 10/2/27 (b)(c)(d) | 1,902,823 | 1,638,806 | |
| Crown Subsea Communications Holding, Inc. Tranche B 1LN, term loan 1 month U.S. LIBOR + 4.750% 7.314% 4/27/27 (b)(c)(d) | 1,438,459 | 1,384,517 | |
| Frontier Communications Holdings LLC Tranche B 1LN, term loan 1 month U.S. LIBOR + 3.750% 7.4375% 5/1/28 (b)(c)(d) | 11,659,993 | 10,814,644 | |
| GTT Communications, Inc. Tranche B, term loan 3 month U.S. LIBOR + 4.750% 10% 5/31/25 (b)(c)(d) | 5,343,847 | 3,792,475 | |
| Intelsat Jackson Holdings SA 1LN, term loan CME Term SOFR 1 Month Index + 4.250% 7.4449% 2/1/29 (b)(c)(d) | 26,609,967 | 24,913,582 | |
| Level 3 Financing, Inc. Tranche B 1LN, term loan 1 month U.S. LIBOR + 1.750% 4.8653% 3/1/27 (b)(c)(d) | 3,540,504 | 3,357,389 | |
| Lumen Technologies, Inc. Tranche B 1LN, term loan 1 month U.S. LIBOR + 2.250% 5.3653% 3/15/27 (b)(c)(d) | 2,769,982 | 2,514,202 | |
| Northwest Fiber LLC Tranche B 1LN, term loan 1 month U.S. LIBOR + 3.750% 6.7434% 4/30/27 (b)(c)(d) | 6,748,661 | 6,450,573 | |
| Patagonia Holdco LLC Tranche B 1LN, term loan CME Term SOFR 1 Month Index + 5.750% 8.386% 8/1/29 (b)(c)(d) | 5,220,000 | 4,176,000 | |
| Radiate Holdco LLC Tranche B 1LN, term loan 1 month U.S. LIBOR + 3.250% 6.3653% 9/25/26 (b)(c)(d) | 7,864,082 | 7,257,604 | |
| SBA Senior Finance II, LLC Tranche B, term loan 1 month U.S. LIBOR + 1.750% 4.87% 4/11/25 (b)(c)(d) | 3,329,210 | 3,233,496 | |
| Securus Technologies Holdings Tranche B, term loan: | |||
| 3 month U.S. LIBOR + 4.500% 8.1741% 11/1/24 (b)(c)(d) | 9,338,348 | 8,169,560 | |
| 3 month U.S. LIBOR + 8.250% 11.0559% 11/1/25 (b)(c)(d) | 7,055,000 | 5,820,375 | |
| Windstream Services LLC Tranche B 1LN, term loan 1 month U.S. LIBOR + 6.250% 9.3653% 9/21/27 (b)(c)(d) | 3,684,310 | 3,315,879 | |
| Zayo Group Holdings, Inc. 1LN, term loan 1 month U.S. LIBOR + 3.000% 6.1153% 3/9/27 (b)(c)(d) | 18,838,135 | 15,685,196 | |
TOTAL TELECOMMUNICATIONS | 111,126,324 | ||
| Textiles/Apparel - 1.2% | |||
| Byju's Alpha, Inc. Tranche B 1LN, term loan 1 month U.S. LIBOR + 5.500% 8.9797% 11/24/26 (b)(c)(d) | 5,044,070 | 3,592,084 | |
| Canada Goose, Inc. Tranche B 1LN, term loan 1 month U.S. LIBOR + 3.500% 7.1419% 10/7/27 (b)(c)(d) | 1,753,829 | 1,657,369 | |
| Crocs, Inc. Tranche B1 LN, term loan CME Term SOFR 1 Month Index + 3.500% 7.6511% 2/17/29 (b)(c)(d) | 16,086,375 | 15,101,085 | |
| Fanatics Commerce Intermediate Holdco LLC Tranche B 1LN, term loan 1 month U.S. LIBOR + 3.250% 6.0559% 11/23/28 (b)(c)(d)(e) | 3,161,575 | 3,043,016 | |
| Jo-Ann Stores LLC Tranche B 1LN, term loan 1 month U.S. LIBOR + 4.750% 7.5163% 7/7/28 (b)(c)(d) | 3,644,489 | 2,358,677 | |
| Samsonite IP Holdings SARL Tranche B2 1LN, term loan 1 month U.S. LIBOR + 3.000% 6.1153% 4/25/25 (b)(c)(d) | 979,213 | 955,780 | |
| Tory Burch LLC Tranche B 1LN, term loan 1 month U.S. LIBOR + 3.000% 6.1153% 4/14/28 (b)(c)(d) | 2,913,125 | 2,650,944 | |
| Victoria's Secret & Co. Tranche B 1LN, term loan 1 month U.S. LIBOR + 3.250% 6.3941% 8/2/28 (b)(c)(d) | 1,529,188 | 1,427,880 | |
TOTAL TEXTILES/APPAREL | 30,786,835 | ||
| Transportation Ex Air/Rail - 0.1% | |||
| ASP LS Acquisition Corp. 2LN, term loan 1 month U.S. LIBOR + 7.500% 10.3769% 5/7/29 (b)(c)(d)(e) | 2,500,000 | 1,900,000 | |
| Utilities - 2.0% | |||
| Brookfield WEC Holdings, Inc.: | |||
| 1LN, term loan CME Term SOFR 1 Month Index + 3.750% 6.8653% 8/1/25 (b)(c)(d) | 2,145,000 | 2,087,686 | |
| Tranche B 1LN, term loan 1 month U.S. LIBOR + 2.750% 5.8653% 8/1/25 (b)(c)(d) | 13,990,207 | 13,349,455 | |
| ExGen Renewables IV, LLC Tranche B 1LN, term loan 3 month U.S. LIBOR + 2.500% 5.57% 12/15/27 (b)(c)(d) | 2,359,278 | 2,305,605 | |
| Granite Generation LLC 1LN, term loan 1 month U.S. LIBOR + 3.750% 6.8653% 11/1/26 (b)(c)(d) | 1,761,000 | 1,681,755 | |
| Limetree Bay Terminals LLC Tranche B 1LN, term loan 3 month U.S. LIBOR + 4.000% 8.8148% 2/15/24 (b)(c)(d) | 4,459,914 | 3,005,670 | |
| Luxembourg Investment Co. 428 SARL Tranche B 1LN, term loan CME Term SOFR 1 Month Index + 5.000% 8.5532% 1/3/29 (b)(c)(d)(e) | 2,065,000 | 1,693,300 | |
| Osmose Utilities Services, Inc. Tranche B 1LN, term loan 1 month U.S. LIBOR + 3.250% 6.3653% 6/17/28 (b)(c)(d) | 1,801,688 | 1,648,544 | |
| PG&E Corp. Tranche B 1LN, term loan 1 month U.S. LIBOR + 3.000% 6.125% 6/23/25 (b)(c)(d) | 8,727,130 | 8,330,045 | |
| Pike Corp. Tranche B 1LN, term loan 1 month U.S. LIBOR + 3.000% 6.12% 1/21/28 (b)(c)(d) | 3,598,630 | 3,486,173 | |
| Vertiv Group Corp. Tranche B 1LN, term loan 1 month U.S. LIBOR + 2.750% 5.3034% 3/2/27 (b)(c)(d) | 7,071,698 | 6,715,567 | |
| Vistra Operations Co. LLC Tranche B 3LN, term loan 1 month U.S. LIBOR + 1.750% 4.8411% 12/31/25 (b)(c)(d) | 7,024,556 | 6,773,077 | |
TOTAL UTILITIES | 51,076,877 | ||
| TOTAL BANK LOAN OBLIGATIONS (Cost $2,419,008,982) | 2,240,246,247 | ||
| Nonconvertible Bonds - 3.6% | |||
Principal Amount (a) | Value ($) | ||
| Aerospace - 0.2% | |||
| TransDigm, Inc.: | |||
| 6.25% 3/15/26 (g) | 4,000,000 | 3,880,000 | |
| 8% 12/15/25 (g) | 385,000 | 390,471 | |
TOTAL AEROSPACE | 4,270,471 | ||
| Air Transportation - 0.1% | |||
| American Airlines, Inc. / AAdvantage Loyalty IP Ltd. 5.5% 4/20/26 (g) | 1,105,000 | 1,037,783 | |
| Delta Air Lines, Inc. / SkyMiles IP Ltd. 4.5% 10/20/25 (g) | 815,000 | 791,085 | |
TOTAL AIR TRANSPORTATION | 1,828,868 | ||
| Automotive & Auto Parts - 0.7% | |||
| Rivian Holdco & Rivian LLC & Rivian Automotive LLC 6 month U.S. LIBOR + 5.620% 7.1766% 10/15/26 (b)(c)(g) | 17,605,000 | 16,548,700 | |
| Broadcasting - 0.0% | |||
| Univision Communications, Inc. 6.625% 6/1/27 (g) | 1,205,000 | 1,137,174 | |
| Building Materials - 0.0% | |||
| SRS Distribution, Inc. 4.625% 7/1/28 (g) | 160,000 | 137,438 | |
| Cable/Satellite TV - 0.1% | |||
| Charter Communications Operating LLC/Charter Communications Operating Capital Corp. 3 month U.S. LIBOR + 1.650% 4.4323% 2/1/24 (b)(c) | 1,750,000 | 1,759,273 | |
| Radiate Holdco LLC/Radiate Financial Service Ltd. 4.5% 9/15/26 (g) | 2,130,000 | 1,747,090 | |
TOTAL CABLE/SATELLITE TV | 3,506,363 | ||
| Chemicals - 0.0% | |||
| Kronos Acquisition Holdings, Inc. / KIK Custom Products, Inc. 5% 12/31/26 (g) | 40,000 | 35,102 | |
| Containers - 0.1% | |||
| Ardagh Packaging Finance PLC/Ardagh MP Holdings U.S.A., Inc. 4.125% 8/15/26 (g) | 2,945,000 | 2,429,625 | |
| Trivium Packaging Finance BV 5.5% 8/15/26 (g) | 1,085,000 | 970,453 | |
TOTAL CONTAINERS | 3,400,078 | ||
| Energy - 0.4% | |||
| Citgo Petroleum Corp.: | |||
| 6.375% 6/15/26 (g) | 5,000,000 | 4,667,559 | |
| 7% 6/15/25 (g) | 1,050,000 | 1,003,307 | |
| New Fortress Energy, Inc.: | |||
| 6.5% 9/30/26 (g) | 2,000,000 | 1,847,800 | |
| 6.75% 9/15/25 (g) | 535,000 | 506,752 | |
| Transocean Poseidon Ltd. 6.875% 2/1/27 (g) | 997,500 | 912,713 | |
TOTAL ENERGY | 8,938,131 | ||
| Gaming - 0.5% | |||
| Affinity Gaming LLC 6.875% 12/15/27 (g) | 1,700,000 | 1,385,840 | |
| Fertitta Entertainment LLC / Fertitta Entertainment Finance Co., Inc. 4.625% 1/15/29 (g) | 10,240,000 | 8,473,600 | |
| Golden Entertainment, Inc. 7.625% 4/15/26 (g) | 1,065,000 | 1,050,250 | |
| Sugarhouse HSP Gaming Prop Mezz LP/Sugarhouse HSP Gaming Finance Corp. 5.875% 5/15/25 (g) | 1,367,000 | 1,264,519 | |
| VICI Properties LP / VICI Note Co.: | |||
| 3.5% 2/15/25 (g) | 240,000 | 221,846 | |
| 4.25% 12/1/26 (g) | 345,000 | 311,395 | |
| 4.625% 12/1/29 (g) | 200,000 | 173,508 | |
TOTAL GAMING | 12,880,958 | ||
| Healthcare - 0.0% | |||
| Tenet Healthcare Corp. 4.625% 7/15/24 | 1,028,000 | 994,055 | |
| Hotels - 0.0% | |||
| Marriott Ownership Resorts, Inc. 6.125% 9/15/25 (g) | 933,000 | 912,275 | |
| Leisure - 0.2% | |||
| Royal Caribbean Cruises Ltd.: | |||
| 8.25% 1/15/29 (g)(h) | 1,725,000 | 1,679,719 | |
| 9.125% 6/15/23 (g) | 275,000 | 279,813 | |
| 10.875% 6/1/23 (g) | 1,335,000 | 1,365,038 | |
| 11.625% 8/15/27 (g) | 1,205,000 | 1,096,574 | |
TOTAL LEISURE | 4,421,144 | ||
| Paper - 0.0% | |||
| Ardagh Metal Packaging Finance U.S.A. LLC/Ardagh Metal Packaging Finance PLC 3.25% 9/1/28 (g) | 895,000 | 728,196 | |
| Restaurants - 0.0% | |||
| 1011778 BC Unlimited Liability Co./New Red Finance, Inc. 5.75% 4/15/25 (g) | 160,000 | 158,520 | |
| Services - 0.2% | |||
| Adtalem Global Education, Inc. 5.5% 3/1/28 (g) | 1,139,000 | 1,025,100 | |
| PowerTeam Services LLC 9.033% 12/4/25 (g) | 5,115,000 | 4,117,575 | |
| Sotheby's 7.375% 10/15/27 (g) | 200,000 | 183,698 | |
TOTAL SERVICES | 5,326,373 | ||
| Super Retail - 0.1% | |||
| EG Global Finance PLC: | |||
| 6.75% 2/7/25 (g) | 1,000,000 | 902,020 | |
| 8.5% 10/30/25 (g) | 1,905,000 | 1,666,016 | |
TOTAL SUPER RETAIL | 2,568,036 | ||
| Technology - 0.1% | |||
| CommScope, Inc. 6% 3/1/26 (g) | 1,100,000 | 1,012,792 | |
| Maxar Technologies, Inc. 7.75% 6/15/27 (g) | 1,805,000 | 1,696,447 | |
TOTAL TECHNOLOGY | 2,709,239 | ||
| Telecommunications - 0.8% | |||
| Altice Financing SA 5.75% 8/15/29 (g) | 6,000,000 | 4,591,320 | |
| Altice France SA: | |||
| 5.125% 1/15/29 (g) | 855,000 | 630,764 | |
| 5.125% 7/15/29 (g) | 3,795,000 | 2,835,282 | |
| Frontier Communications Holdings LLC 5% 5/1/28 (g) | 1,160,000 | 995,512 | |
| Intelsat Jackson Holdings SA 6.5% 3/15/30 (g) | 6,905,000 | 5,870,631 | |
| LCPR Senior Secured Financing DAC 5.125% 7/15/29 (g) | 205,000 | 154,379 | |
| Northwest Fiber LLC/Northwest Fiber Finance Sub, Inc. 4.75% 4/30/27 (g) | 195,000 | 169,650 | |
| Windstream Escrow LLC 7.75% 8/15/28 (g) | 5,100,000 | 4,226,059 | |
TOTAL TELECOMMUNICATIONS | 19,473,597 | ||
| Textiles/Apparel - 0.0% | |||
| Victoria's Secret & Co. 4.625% 7/15/29 (g) | 910,000 | 687,871 | |
| Utilities - 0.1% | |||
| Exgen Texas Power LLC 3 month U.S. LIBOR + 6.750% 9.0429% 10/8/26 (b)(c)(e) | 1,396,265 | 1,396,265 | |
| TOTAL NONCONVERTIBLE BONDS (Cost $102,710,102) | 92,058,854 | ||
| Common Stocks - 1.4% | |||
| Shares | Value ($) | ||
| Capital Goods - 0.0% | |||
| TNT Crane & Rigging LLC (e)(i) | 188,360 | 1,098,139 | |
| TNT Crane & Rigging LLC warrants 10/31/25 (e)(i) | 9,492 | 1,898 | |
TOTAL CAPITAL GOODS | 1,100,037 | ||
| Diversified Financial Services - 0.1% | |||
| ACNR Holdings, Inc. (e)(i) | 15,697 | 1,601,094 | |
| Lime Tree Bay Ltd. (e)(i) | 776 | 26,174 | |
TOTAL DIVERSIFIED FINANCIAL SERVICES | 1,627,268 | ||
| Energy - 1.1% | |||
| California Resources Corp. | 254,471 | 9,779,321 | |
| California Resources Corp. warrants 10/27/24 (i) | 7,511 | 78,114 | |
| Chesapeake Energy Corp. (j) | 135,541 | 12,769,318 | |
| Chesapeake Energy Corp. (i)(k) | 928 | 87,427 | |
| Denbury, Inc. (i) | 65,094 | 5,615,008 | |
| EP Energy Corp. (e)(i) | 15,785 | 131,173 | |
TOTAL ENERGY | 28,460,361 | ||
| Entertainment/Film - 0.0% | |||
| Cineworld Group PLC warrants 11/23/25 (e)(i) | 341,212 | 4 | |
| Restaurants - 0.1% | |||
| CEC Entertainment, Inc. (e)(i) | 105,486 | 2,109,720 | |
| Super Retail - 0.0% | |||
| David's Bridal, Inc. rights (e)(i) | 1,346 | 0 | |
| Telecommunications - 0.0% | |||
| GTT Communications, Inc. rights (e)(i) | 80,854 | 80,854 | |
| Utilities - 0.1% | |||
| TexGen Power LLC (e)(i) | 85,051 | 2,228,336 | |
| TOTAL COMMON STOCKS (Cost $15,929,567) | 35,606,580 | ||
| Nonconvertible Preferred Stocks - 0.2% | |||
| Shares | Value ($) | ||
| Diversified Financial Services - 0.2% | |||
ACNR Holdings, Inc. (e)(i) (Cost $1,123,250) | 8,986 | 5,391,600 | |
| Preferred Securities - 0.3% | |||
Principal Amount (a) | Value ($) | ||
| Banks & Thrifts - 0.3% | |||
| Bank of America Corp.: | |||
| 5.125% (b)(l) | 2,956,000 | 2,804,861 | |
| 5.2% (b)(l) | 490,000 | 478,893 | |
| JPMorgan Chase & Co.: | |||
| 3 month U.S. LIBOR + 3.320% 5.5971% (b)(c)(l) | 1,560,000 | 1,582,314 | |
| 3 month U.S. LIBOR + 3.470% 6.2759% (b)(c)(l) | 1,550,000 | 1,567,271 | |
| TOTAL PREFERRED SECURITIES (Cost $6,187,417) | 6,433,339 | ||
| Other - 0.4% | |||
| Shares | Value ($) | ||
| Other - 0.4% | |||
| Fidelity Direct Lending Fund, LP (k)(m) | 11,381,951 | ||
| Tribune Co. Claim (e)(i) | 45,954 | 30,789 | |
| TOTAL OTHER (Cost $11,499,754) | 11,412,740 | ||
| Money Market Funds - 3.1% | |||
| Shares | Value ($) | ||
| Fidelity Cash Central Fund 3.10% (n) | 65,471,895 | 65,484,990 | |
| Fidelity Securities Lending Cash Central Fund 3.10% (n)(o) | 12,972,828 | 12,974,125 | |
| TOTAL MONEY MARKET FUNDS (Cost $78,452,959) | 78,459,115 | ||
| TOTAL INVESTMENT IN SECURITIES - 97.1% (Cost $2,634,912,031) | 2,469,608,475 |
NET OTHER ASSETS (LIABILITIES) - 2.9% | 73,715,297 |
| NET ASSETS - 100.0% | 2,543,323,772 |
| (a) | Amount is stated in United States dollars unless otherwise noted. |
| (b) | Coupon rates for floating and adjustable rate securities reflect the rates in effect at period end. |
| (c) | Coupon is indexed to a floating interest rate which may be multiplied by a specified factor and/or subject to caps or floors. |
| (d) | Remaining maturities of bank loan obligations may be less than the stated maturities shown as a result of contractual or optional prepayments by the borrower. Such prepayments cannot be predicted with certainty. |
| (e) | Level 3 security |
| (f) | Position or a portion of the position represents an unfunded loan commitment. At period end, the total principal amount and market value of unfunded commitments totaled $5,697,725 and $5,117,734, respectively. |
| (g) | Security exempt from registration under Rule 144A of the Securities Act of 1933. These securities may be resold in transactions exempt from registration, normally to qualified institutional buyers. At the end of the period, the value of these securities amounted to $87,909,261 or 3.5% of net assets. |
| (h) | Security or a portion of the security purchased on a delayed delivery or when-issued basis. |
| (i) | Non-income producing |
| (j) | Security or a portion of the security is on loan at period end. |
| (k) | Restricted securities (including private placements) - Investment in securities not registered under the Securities Act of 1933 (excluding 144A issues). At the end of the period, the value of restricted securities (excluding 144A issues) amounted to $11,469,378 or 0.5% of net assets. |
| (l) | Security is perpetual in nature with no stated maturity date. |
| (m) | Affiliated Fund |
| (n) | Affiliated fund that is generally available only to investment companies and other accounts managed by Fidelity Investments. The rate quoted is the annualized seven-day yield of the fund at period end. A complete unaudited listing of the fund's holdings as of its most recent quarter end is available upon request. In addition, each Fidelity Central Fund's financial statements, which are not covered by the Fund's Report of Independent Registered Public Accounting Firm, are available on the SEC's website or upon request. |
| (o) | Investment made with cash collateral received from securities on loan. |
| Additional information on each restricted holding is as follows: | ||
| Security | Acquisition Date | Acquisition Cost ($) |
| Chesapeake Energy Corp. | 2/10/21 | 8,788 |
| Fidelity Direct Lending Fund, LP | 12/09/21 - 9/30/22 | 11,454,348 |
| Affiliate | Value, beginning of period ($) | Purchases ($) | Sales Proceeds ($) | Dividend Income ($) | Realized Gain (loss) ($) | Change in Unrealized appreciation (depreciation) ($) | Value, end of period ($) | %ownership, end of period |
| Fidelity Cash Central Fund 3.10% | 351,292,865 | 1,002,458,938 | 1,288,266,813 | 875,063 | - | - | 65,484,990 | 0.1% |
| Fidelity Securities Lending Cash Central Fund 3.10% | - | 62,342,726 | 49,368,601 | 7,455 | - | - | 12,974,125 | 0.0% |
| Total | 351,292,865 | 1,064,801,664 | 1,337,635,414 | 882,518 | - | - | 78,459,115 | |
| Affiliate | Value, beginning of period ($) | Purchases ($) | Sales Proceeds ($) | Dividend Income ($) | Realized Gain (loss) ($) | Change in Unrealized appreciation (depreciation) ($) | Value, end of period ($) |
| Fidelity Direct Lending Fund, LP | - | 11,454,348 | - | 422,360 | - | (72,397) | 11,381,951 |
| - | 11,454,348 | - | 422,360 | - | (72,397) | 11,381,951 |
| Valuation Inputs at Reporting Date: | ||||
| Description | Total ($) | Level 1 ($) | Level 2 ($) | Level 3 ($) |
Investments in Securities: | ||||
| Equities: | ||||
Communication Services | 4 | - | - | 4 |
Consumer Discretionary | 2,109,720 | - | - | 2,109,720 |
Energy | 28,460,361 | 28,329,188 | - | 131,173 |
Financials | 7,018,868 | - | - | 7,018,868 |
Industrials | 1,100,037 | - | - | 1,100,037 |
Information Technology | 80,854 | - | - | 80,854 |
Utilities | 2,228,336 | - | - | 2,228,336 |
| Bank Loan Obligations | 2,240,246,247 | - | 2,149,328,379 | 90,917,868 |
| Corporate Bonds | 92,058,854 | - | 90,662,589 | 1,396,265 |
| Preferred Securities | 6,433,339 | - | 6,433,339 | - |
| Other | 30,789 | - | - | 30,789 |
| Money Market Funds | 78,459,115 | 78,459,115 | - | - |
| Total Investments in Securities: | 2,458,226,524 | 106,788,303 | 2,246,424,307 | 105,013,914 |
| Investments in Securities: | |||
| Bank Loan Obligations | |||
| Beginning Balance | $ | 33,567,627 | |
| Net Realized Gain (Loss) on Investment Securities | (879,504) | ||
| Net Unrealized Gain (Loss) on Investment Securities | (5,123,064) | ||
| Cost of Purchases | 75,999,343 | ||
| Proceeds of Sales | (31,692,572) | ||
| Amortization/Accretion | 122,733 | ||
| Transfers into Level 3 | 26,589,636 | ||
| Transfers out of Level 3 | (7,666,331) | ||
| Ending Balance | $ | 90,917,868 | |
| The change in unrealized gain (loss) for the period attributable to Level 3 securities held at September 30, 2022 | $ | (5,115,307) | |
| Other Investments in Securities | |||
| Beginning Balance | $ | 12,893,750 | |
| Net Realized Gain (Loss) on Investment Securities | (356,810) | ||
| Net Unrealized Gain (Loss) on Investment Securities | 1,032,656 | ||
| Cost of Purchases | 1,920,974 | ||
| Proceeds of Sales | (1,578,332) | ||
| Amortization/Accretion | - | ||
| Transfers into Level 3 | 183,808 | ||
| Transfers out of Level 3 | - | ||
| Ending Balance | $ | 14,096,046 | |
| The change in unrealized gain (loss) for the period attributable to Level 3 securities held at September 30, 2022 | $ | 704,167 | |
| The information used in the above reconciliation represents fiscal year to date activity for any Investments in Securities identified as using Level 3 inputs at either the beginning or the end of the current fiscal period. Cost of purchases and proceeds of sales may include securities received and/or delivered through in-kind transactions. Transfers into Level 3 were attributable to a lack of observable market data resulting from decreases in market activity, decreases in liquidity, security restructurings or corporate actions. Transfers out of Level 3 were attributable to observable market data becoming available for those securities. Transfers in or out of Level 3 represent the beginning value of any Security or Instrument where a change in the pricing level occurred from the beginning to the end of the period. The cost of purchases and the proceeds of sales may include securities received or delivered through corporate actions or exchanges. Realized and unrealized gains (losses) disclosed in the reconciliation are included in Net Gain (Loss) on the Fund's Statement of Operations. | |||
| Statement of Assets and Liabilities | ||||
| September 30, 2022 | ||||
| Assets | ||||
| Investment in securities, at value (including securities loaned of $12,765,455) - See accompanying schedule: | $ | |||
Unaffiliated issuers (cost $2,545,004,724) | $2,379,767,409 | |||
Fidelity Central Funds (cost $78,452,959) | 78,459,115 | |||
Other affiliated issuers (cost $11,454,348) | 11,381,951 | |||
| Total Investment in Securities (cost $2,634,912,031) | $ | 2,469,608,475 | ||
| Cash | 2,700,588 | |||
| Receivable for investments sold | 138,571,229 | |||
| Dividends receivable | 439,863 | |||
| Interest receivable | 21,498,592 | |||
| Distributions receivable from Fidelity Central Funds | 177,380 | |||
Total assets | 2,632,996,127 | |||
| Liabilities | ||||
| Payable for investments purchased | ||||
Regular delivery | $22,050,833 | |||
Delayed delivery | 1,725,000 | |||
| Payable for fund shares redeemed | 52,918,183 | |||
| Distributions payable | 2,830 | |||
| Other payables and accrued expenses | 1,384 | |||
| Collateral on securities loaned | 12,974,125 | |||
| Total Liabilities | 89,672,355 | |||
| Net Assets | $ | 2,543,323,772 | ||
| Net Assets consist of: | ||||
| Paid in capital | $ | 2,791,032,572 | ||
| Total accumulated earnings (loss) | (247,708,800) | |||
| Net Assets | $ | 2,543,323,772 | ||
Net Asset Value , offering price and redemption price per share ($2,543,323,772 ÷ 26,992,471 shares) | $ | 94.22 | ||
| Statement of Operations | ||||
Year ended September 30, 2022 | ||||
| Investment Income | ||||
| Dividends (including $422,360 earned from affiliated issuers) | $ | 3,334,426 | ||
| Interest | 140,659,220 | |||
| Income from Fidelity Central Funds (including $7,455 from security lending) | 882,518 | |||
| Total Income | 144,876,164 | |||
| Expenses | ||||
| Custodian fees and expenses | 2,324 | |||
| Independent trustees' fees and expenses | 10,021 | |||
| Miscellaneous | 26 | |||
| Total expenses before reductions | 12,371 | |||
| Expense reductions | (1,603) | |||
| Total expenses after reductions | 10,768 | |||
| Net Investment income (loss) | 144,865,396 | |||
| Realized and Unrealized Gain (Loss) | ||||
| Net realized gain (loss) on: | ||||
| Investment Securities: | ||||
| Unaffiliated issuers | (16,547,082) | |||
| Total net realized gain (loss) | (16,547,082) | |||
| Change in net unrealized appreciation (depreciation) on: | ||||
| Investment Securities: | ||||
| Unaffiliated issuers | (186,956,606) | |||
| Fidelity Central Funds | 1 | |||
| Other affiliated issuers | (72,397) | |||
| Total change in net unrealized appreciation (depreciation) | (187,029,002) | |||
| Net gain (loss) | (203,576,084) | |||
| Net increase (decrease) in net assets resulting from operations | $ | (58,710,688) | ||
| Statement of Changes in Net Assets | ||||
Year ended September 30, 2022 | Year ended September 30, 2021 | |||
| Increase (Decrease) in Net Assets | ||||
| Operations | ||||
| Net investment income (loss) | $ | 144,865,396 | $ | 88,209,144 |
| Net realized gain (loss) | (16,547,082) | (29,926,279) | ||
| Change in net unrealized appreciation (depreciation) | (187,029,002) | 119,810,361 | ||
| Net increase (decrease) in net assets resulting from operations | (58,710,688) | 178,093,226 | ||
| Distributions to shareholders | (144,286,030) | (87,902,022) | ||
| Affiliated share transactions | ||||
| Proceeds from sales of shares | 691,985,364 | 921,138,985 | ||
| Reinvestment of distributions | 144,284,576 | 87,902,022 | ||
| Cost of shares redeemed | (863,857,528) | (231,338,785) | ||
Net increase (decrease) in net assets resulting from share transactions | (27,587,588) | 777,702,222 | ||
| Total increase (decrease) in net assets | (230,584,306) | 867,893,426 | ||
| Net Assets | ||||
| Beginning of period | 2,773,908,078 | 1,906,014,652 | ||
| End of period | $ | 2,543,323,772 | $ | 2,773,908,078 |
| Other Information | ||||
| Shares | ||||
| Sold | 6,910,842 | 9,194,003 | ||
| Issued in reinvestment of distributions | 1,474,153 | 881,835 | ||
| Redeemed | (8,882,669) | (2,337,836) | ||
| Net increase (decrease) | (497,674) | 7,738,002 | ||
| Fidelity® Floating Rate Central Fund |
| Years ended September 30, | 2022 | 2021 | 2020 | 2019 | 2018 | |||||
Selected Per-Share Data | ||||||||||
| Net asset value, beginning of period | $ | 100.91 | $ | 96.50 | $ | 101.38 | $ | 103.31 | $ | 103.17 |
| Income from Investment Operations | ||||||||||
Net investment income (loss) A,B | 4.767 | 4.112 | 4.985 | 6.104 | 5.279 | |||||
| Net realized and unrealized gain (loss) | (6.696) | 4.431 | (4.687) | (1.943) | .401 | |||||
| Total from investment operations | (1.929) | 8.543 | .298 | 4.161 | 5.680 | |||||
| Distributions from net investment income | (4.761) | (4.133) | (5.178) | (6.091) | (5.215) | |||||
| Distributions from net realized gain | - | - | - | - | (.325) | |||||
| Total distributions | (4.761) | (4.133) | (5.178) | (6.091) | (5.540) | |||||
| Net asset value, end of period | $ | 94.22 | $ | 100.91 | $ | 96.50 | $ | 101.38 | $ | 103.31 |
Total Return C | (1.98)% | 8.99% | .42% | 4.20% | 5.65% | |||||
Ratios to Average Net Assets B,D,E | ||||||||||
Expenses before reductions F | -% | -% | -% | -% | -% | |||||
Expenses net of fee waivers, if any F | -% | -% | -% | -% | -% | |||||
Expenses net of all reductions F | -% | -% | -% | -% | -% | |||||
| Net investment income (loss) | 4.83% | 4.14% | 5.16% | 6.01% | 5.12% | |||||
| Supplemental Data | ||||||||||
| Net assets, end of period (000 omitted) | $ | 2,543,324 | $ | 2,773,908 | $ | 1,906,015 | $ | 1,946,822 | $ | 2,295,944 |
Portfolio turnover rate G | 39% | 41% | 40% | 29% | 47% |
| Fidelity Central Fund | Investment Manager | Investment Objective | Investment Practices | Expense Ratio A |
| Fidelity Money Market Central Funds | Fidelity Management & Research Company LLC (FMR) | Each fund seeks to obtain a high level of current income consistent with the preservation of capital and liquidity. | Short-term Investments | Less than .005% |
| Asset Type | Fair Value | Valuation Technique(s) | Unobservable Input | Amount or Range/Weighted Average | Impact to Valuation from an Increase in Input A |
| Equities | $12,668,992 | Recovery value | Recovery value | $0.0 - $1.00 / $1.00 | Increase |
| Indicative market price | Evaluated bid | $102.00 - $600.00 / $485.97 | Increase | ||
| Mid price | $20.00 | Increase | |||
| Book value | Book value multiple | 1.0 | Increase | ||
| Market comparable | Enterprise value/EBITDA multiple (EV/EBITDA) | 7.0 - 7.5 / 7.2 | Increase | ||
| Capacity multiple ($/kW) | $225.00 | Increase | |||
| Discounted cash flow | Discount rate | 13.1% | Decrease | ||
| Black scholes | Volatility | 52.5% | Increase | ||
| Corporate Bonds | $1,396,265 | Market approach | Transaction price | $100.00 | Increase |
| Bank Loan Obligations | $90,917,868 | Market approach | Transaction price | $96.33 - $99.50 / $97.20 | Increase |
| Indicative market price | Evaluated bid | $76.00 - $100.00 / $93.91 | Increase | ||
| Discounted cash flow | Yield | 14.4% | Decrease | ||
| Other | $30,789 | Recovery value | Recovery value | $0.67 | Increase |
| Gross unrealized appreciation | $ 33,631,057 |
| Gross unrealized depreciation | (198,816,164) |
| Net unrealized appreciation (depreciation) | $ (165,185,107) |
| Tax Cost | $2,634,793,582 |
| Capital loss carryforward | $ (81,081,428) |
| Net unrealized appreciation (depreciation) on securities and other investments | $ (165,185,107) |
Short-term | $(9,566,939) |
Long-term | (71,514,489) |
| Total capital loss carryforward | $(81,081,428) |
| September 30, 2022 | September 30, 2021 | |
| Ordinary Income | $144,286,030 | $87,902,022 |
| Investment to be Acquired | Commitment Amount | |
| Fidelity Floating Rate Central Fund | Fidelity Direct Lending Fund, LP | $15,845,652 |
| Purchases ($) | Sales ($) | |
| Fidelity Floating Rate Central Fund | 1,120,258,820 | 1,171,011,424 |
| Amount | |
| Fidelity Floating Rate Central Fund | $ 133 |
| Total Security Lending Fees Paid to NFS | Security Lending Income From Securities Loaned to NFS | Value of Securities Loaned to NFS at Period End | |
| Fidelity Floating Rate Central Fund | $ 747 | $ - | $- |
| The Example is based on an investment of $1,000 invested at the beginning of the period and held for the entire period (April 1, 2022 to September 30, 2022). |
Annualized Expense Ratio- A | Beginning Account Value April 1, 2022 | Ending Account Value September 30, 2022 | Expenses Paid During Period- C April 1, 2022 to September 30, 2022 | |||||||
| Fidelity® Floating Rate Central Fund | 0.0004% | |||||||||
| Actual | $ 1,000 | $ 971.30 | $- D | |||||||
Hypothetical- B | $ 1,000 | $ 1,025.07 | $- D | |||||||
|


Contents
| Average Annual Total Returns | |||
Periods ended September 30, 2022 | Past 1 year | Past 5 years | Past 10 years |
| Fidelity® International Equity Central Fund | -27.21% | 1.14% | 4.85% |
| $10,000 Over 10 Years |
Let's say hypothetically that $10,000 was invested in Fidelity® International Equity Central Fund on September 30, 2012. The chart shows how the value of your investment would have changed, and also shows how the MSCI World ex USA Index performed over the same period. |
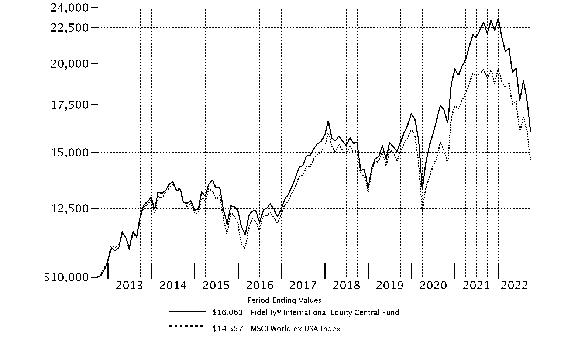 |
Top Holdings (% of Fund's net assets) | ||
| Nestle SA (Reg. S) (Switzerland, Food Products) | 3.4 | |
| Roche Holding AG (participation certificate) (Switzerland, Pharmaceuticals) | 2.5 | |
| LVMH Moet Hennessy Louis Vuitton SE (France, Textiles, Apparel & Luxury Goods) | 2.4 | |
| TotalEnergies SE (France, Oil, Gas & Consumable Fuels) | 2.0 | |
| ASML Holding NV (Netherlands) (Netherlands, Semiconductors & Semiconductor Equipment) | 2.0 | |
| Diageo PLC (United Kingdom, Beverages) | 1.9 | |
| Compass Group PLC (United Kingdom, Hotels, Restaurants & Leisure) | 1.5 | |
| AIA Group Ltd. (Hong Kong, Insurance) | 1.5 | |
| Hoya Corp. (Japan, Health Care Equipment & Supplies) | 1.3 | |
| RELX PLC (London Stock Exchange) (United Kingdom, Professional Services) | 1.3 | |
| 19.8 | ||
| Market Sectors (% of Fund's net assets) | ||
| Financials | 20.5 | |
| Industrials | 17.9 | |
| Health Care | 12.9 | |
| Consumer Discretionary | 11.1 | |
| Information Technology | 10.8 | |
| Consumer Staples | 8.8 | |
| Materials | 6.2 | |
| Energy | 4.8 | |
| Communication Services | 2.2 | |
| Real Estate | 1.7 | |
| Utilities | 1.5 | |
Asset Allocation (% of Fund's net assets) |
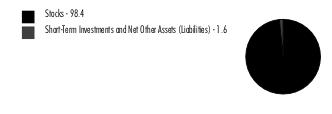 |
Foreign investments - 93.5% |
Geographic Diversification (% of Fund's net assets) |
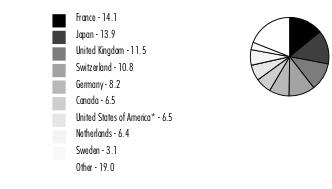 |
* Includes Short-Term investments and Net Other Assets (Liabilities). Percentages are based on country or territory of incorporation and are adjusted for the effect of futures contracts, if applicable. |
| Common Stocks - 98.3% | |||
| Shares | Value ($) | ||
| Australia - 1.1% | |||
| Arena (REIT) unit | 1,648,058 | 3,510,420 | |
| Commonwealth Bank of Australia | 282,164 | 16,370,099 | |
| Macquarie Group Ltd. | 67,508 | 6,595,541 | |
| South32 Ltd. | 1,371,068 | 3,254,792 | |
| Treasury Wine Estates Ltd. | 367,974 | 2,958,658 | |
| Whitehaven Coal Ltd. | 329,435 | 1,898,615 | |
TOTAL AUSTRALIA | 34,588,125 | ||
| Bailiwick of Jersey - 2.1% | |||
| Experian PLC | 830,384 | 24,307,496 | |
| Ferguson PLC (a) | 194,700 | 20,196,081 | |
| Glencore PLC | 4,197,000 | 22,055,307 | |
| WPP PLC | 340,240 | 2,808,747 | |
TOTAL BAILIWICK OF JERSEY | 69,367,631 | ||
| Belgium - 1.1% | |||
| Anheuser-Busch InBev SA NV | 95,200 | 4,312,240 | |
| Azelis Group NV | 209,349 | 4,656,857 | |
| KBC Group NV | 388,762 | 18,448,307 | |
| Kinepolis Group NV (a) | 29,880 | 1,107,389 | |
| UCB SA | 53,300 | 3,698,906 | |
| Warehouses de Pauw | 92,500 | 2,271,856 | |
TOTAL BELGIUM | 34,495,555 | ||
| Bermuda - 0.3% | |||
| Hiscox Ltd. | 1,026,619 | 10,072,435 | |
| Canada - 6.5% | |||
| Aritzia, Inc. (a) | 53,481 | 1,757,341 | |
| Boardwalk (REIT) (b) | 82,200 | 2,752,794 | |
| Brookfield Asset Management, Inc. (Canada) Class A | 121,100 | 4,954,111 | |
| Brookfield Renewable Corp. | 57,080 | 1,865,270 | |
| Cameco Corp. | 55,340 | 1,468,682 | |
| Canadian Natural Resources Ltd. | 330,453 | 15,382,146 | |
| Canadian Pacific Railway Ltd. | 285,100 | 19,031,434 | |
| Constellation Software, Inc. | 23,000 | 32,003,526 | |
| E3 Lithium Ltd. (a) | 121,600 | 199,828 | |
| Emera, Inc. | 67,430 | 2,728,246 | |
| Enbridge, Inc. | 57,693 | 2,139,237 | |
| First Quantum Minerals Ltd. | 772,000 | 13,105,585 | |
| Fortis, Inc. (b) | 67,890 | 2,579,265 | |
| GFL Environmental, Inc. | 33,660 | 850,668 | |
| Gibson Energy, Inc. (b) | 114,911 | 1,827,629 | |
| Hydro One Ltd. (c) | 64,040 | 1,566,056 | |
| Imperial Oil Ltd. | 275,178 | 11,914,718 | |
| Intact Financial Corp. | 95,700 | 13,543,557 | |
| MEG Energy Corp. (a) | 522,548 | 5,848,331 | |
| Methanex Corp. | 60,700 | 1,933,471 | |
| Nutrien Ltd. | 111,600 | 9,307,069 | |
| Royal Bank of Canada (b) | 245,000 | 22,058,602 | |
| Shopify, Inc. Class A (a)(b) | 128,110 | 3,451,283 | |
| The Toronto-Dominion Bank | 234,700 | 14,394,458 | |
| TMX Group Ltd. | 135,100 | 12,426,833 | |
| Topicus.Com, Inc. (a) | 26,781 | 1,287,721 | |
| Tourmaline Oil Corp. | 185,645 | 9,648,137 | |
| Waste Connections, Inc. (United States) (a) | 12,850 | 1,736,421 | |
| Wheaton Precious Metals Corp. | 105,100 | 3,403,282 | |
TOTAL CANADA | 215,165,701 | ||
| Cayman Islands - 0.4% | |||
| CK Asset Holdings Ltd. | 930,588 | 5,586,681 | |
| HKBN Ltd. | 3,452,180 | 2,656,881 | |
| JD.com, Inc. Class A | 3,695 | 93,218 | |
| Sea Ltd. ADR (a) | 52,310 | 2,931,976 | |
| Tencent Holdings Ltd. | 88,410 | 2,986,164 | |
TOTAL CAYMAN ISLANDS | 14,254,920 | ||
| Denmark - 1.9% | |||
| Ascendis Pharma A/S sponsored ADR (a) | 10,500 | 1,084,230 | |
| Carlsberg A/S Series B | 36,100 | 4,221,409 | |
| Chr. Hansen Holding A/S | 84,000 | 4,137,777 | |
| DSV A/S | 326,800 | 38,283,808 | |
| GN Store Nord A/S | 109,600 | 1,919,801 | |
| Novo Nordisk A/S Series B | 32,400 | 3,227,617 | |
| Novozymes A/S Series B | 107,200 | 5,387,027 | |
| ORSTED A/S (c) | 35,370 | 2,819,016 | |
TOTAL DENMARK | 61,080,685 | ||
| Finland - 1.3% | |||
| Elisa Corp. (A Shares) | 96,830 | 4,387,275 | |
| Nordea Bank ABP | 3,116,900 | 26,675,144 | |
| Sampo Oyj (A Shares) | 263,900 | 11,266,321 | |
TOTAL FINLAND | 42,328,740 | ||
| France - 14.1% | |||
| Air Liquide SA | 283,560 | 32,410,657 | |
| ALTEN | 139,400 | 15,318,642 | |
| Antin Infrastructure Partners SA | 196,800 | 4,100,029 | |
| ARGAN SA | 12,216 | 944,874 | |
| AXA SA | 376,400 | 8,217,910 | |
| BNP Paribas SA | 689,400 | 29,119,745 | |
| Capgemini SA | 194,500 | 31,139,557 | |
| Dassault Systemes SA | 111,700 | 3,856,451 | |
| Edenred SA | 543,500 | 25,039,455 | |
| Engie SA | 300,120 | 3,454,348 | |
| EssilorLuxottica SA | 190,982 | 25,958,814 | |
| Hermes International SCA | 6,000 | 7,056,723 | |
| L'Oreal SA | 26,000 | 8,313,294 | |
| Legrand SA | 168,300 | 10,882,126 | |
| LVMH Moet Hennessy Louis Vuitton SE | 136,145 | 80,267,661 | |
| Pernod Ricard SA | 214,200 | 39,295,874 | |
| Safran SA | 223,900 | 20,372,607 | |
| Sanofi SA | 242,655 | 18,477,333 | |
| Sartorius Stedim Biotech | 23,900 | 7,331,009 | |
| Teleperformance | 99,600 | 25,266,909 | |
| TotalEnergies SE (b) | 1,389,179 | 65,172,755 | |
| Veolia Environnement SA | 116,980 | 2,235,743 | |
| Worldline SA (a)(c) | 44,100 | 1,743,084 | |
TOTAL FRANCE | 465,975,600 | ||
| Germany - 8.1% | |||
| Allianz SE | 120,900 | 19,045,906 | |
| Bayer AG | 211,500 | 9,744,766 | |
| Brenntag SE | 335,000 | 20,251,418 | |
| Covestro AG (c) | 72,700 | 2,078,614 | |
| Deutsche Borse AG | 213,000 | 34,916,400 | |
| Deutsche Post AG | 515,831 | 15,546,969 | |
| Deutsche Telekom AG | 602,700 | 10,258,963 | |
| E.ON SE | 186,710 | 1,434,451 | |
| Evonik Industries AG | 144,500 | 2,420,034 | |
| Hannover Reuck SE | 131,200 | 19,667,572 | |
| LEG Immobilien AG | 32,999 | 1,969,698 | |
| Linde PLC (a)(b) | 29,812 | 8,071,081 | |
| Mercedes-Benz Group AG (Germany) | 216,900 | 10,967,987 | |
| Merck KGaA | 233,500 | 37,799,161 | |
| Rheinmetall AG | 85,598 | 13,179,306 | |
| RWE AG | 115,480 | 4,244,584 | |
| SAP SE | 108,059 | 8,806,286 | |
| Siemens AG | 185,250 | 18,106,868 | |
| Siemens Healthineers AG (c) | 578,000 | 24,793,602 | |
| Symrise AG | 35,100 | 3,422,685 | |
TOTAL GERMANY | 266,726,351 | ||
| Hong Kong - 1.9% | |||
| AIA Group Ltd. | 5,764,200 | 47,992,194 | |
| Chervon Holdings Ltd. | 269,100 | 1,020,037 | |
| Hang Seng Bank Ltd. | 240,000 | 3,646,201 | |
| Hong Kong Exchanges and Clearing Ltd. | 202,100 | 6,908,266 | |
| Sino Land Ltd. | 1,432,000 | 1,883,549 | |
TOTAL HONG KONG | 61,450,247 | ||
| Hungary - 0.2% | |||
| Richter Gedeon PLC | 465,700 | 7,983,520 | |
| India - 0.8% | |||
| HDFC Bank Ltd. (a) | 1,558,400 | 26,943,668 | |
| Indonesia - 0.1% | |||
| PT Bank Central Asia Tbk | 4,998,200 | 2,806,410 | |
| Ireland - 2.2% | |||
| Bank of Ireland Group PLC | 1,275,500 | 8,181,039 | |
| Flutter Entertainment PLC (a) | 83,041 | 9,111,907 | |
| ICON PLC (a) | 87,900 | 16,154,262 | |
| Irish Residential Properties REIT PLC | 1,427,785 | 1,602,302 | |
| Kingspan Group PLC (Ireland) | 291,100 | 13,115,387 | |
| Linde PLC | 95,400 | 25,718,886 | |
TOTAL IRELAND | 73,883,783 | ||
| Italy - 1.6% | |||
| Enel SpA | 1,030,856 | 4,227,773 | |
| FinecoBank SpA | 1,280,800 | 15,818,515 | |
| GVS SpA (a)(c) | 115,000 | 671,617 | |
| Moncler SpA | 249,100 | 10,169,390 | |
| Prada SpA | 968,300 | 4,490,387 | |
| Recordati SpA | 453,800 | 16,608,408 | |
TOTAL ITALY | 51,986,090 | ||
| Japan - 13.9% | |||
| Advance Residence Investment Corp. | 1,116 | 2,733,518 | |
| Bandai Namco Holdings, Inc. | 66,800 | 4,353,793 | |
| BayCurrent Consulting, Inc. | 15,900 | 4,136,219 | |
| Capcom Co. Ltd. | 445,600 | 11,206,965 | |
| Credit Saison Co. Ltd. | 150,800 | 1,762,963 | |
| Daiichi Sankyo Kabushiki Kaisha | 384,300 | 10,741,518 | |
| Daiichikosho Co. Ltd. | 112,390 | 3,160,556 | |
| DENSO Corp. | 97,300 | 4,427,678 | |
| Dip Corp. | 106,490 | 2,704,006 | |
| Eisai Co. Ltd. | 95,500 | 5,113,173 | |
| Fast Retailing Co. Ltd. | 10,100 | 5,353,216 | |
| FUJIFILM Holdings Corp. | 386,700 | 17,658,400 | |
| Fujitsu Ltd. | 32,700 | 3,585,621 | |
| Hitachi Ltd. | 526,100 | 22,224,662 | |
| Hoya Corp. | 462,200 | 44,326,235 | |
| Itochu Corp. | 613,200 | 14,833,229 | |
| JEOL Ltd. | 38,400 | 1,261,604 | |
| JTOWER, Inc. (a) | 299,990 | 13,555,825 | |
| Kansai Electric Power Co., Inc. | 225,620 | 1,889,390 | |
| KDDI Corp. | 204,730 | 5,985,543 | |
| Keyence Corp. | 27,200 | 9,002,142 | |
| Lifenet Insurance Co. (a) | 302,100 | 1,886,951 | |
| Minebea Mitsumi, Inc. | 833,100 | 12,312,588 | |
| Misumi Group, Inc. | 349,700 | 7,538,617 | |
| Mitsubishi Estate Co. Ltd. | 419,500 | 5,527,406 | |
| Mitsubishi UFJ Financial Group, Inc. | 1,925,700 | 8,723,667 | |
| Money Forward, Inc. (a) | 162,100 | 3,449,651 | |
| Olympus Corp. | 1,572,200 | 30,182,807 | |
| ORIX Corp. | 568,600 | 7,969,357 | |
| Persol Holdings Co. Ltd. | 1,294,852 | 23,932,351 | |
| Recruit Holdings Co. Ltd. | 76,300 | 2,197,871 | |
| Relo Group, Inc. | 481,400 | 7,324,278 | |
| Renesas Electronics Corp. (a) | 1,000,700 | 8,389,108 | |
| Shin-Etsu Chemical Co. Ltd. | 63,100 | 6,244,175 | |
| SMC Corp. | 39,000 | 15,871,845 | |
| SoftBank Group Corp. | 242,006 | 8,201,853 | |
| Sony Group Corp. | 651,200 | 41,946,700 | |
| Suzuki Motor Corp. | 286,200 | 8,861,067 | |
| TIS, Inc. | 502,300 | 13,309,753 | |
| Tokio Marine Holdings, Inc. | 601,200 | 10,654,861 | |
| Tokyo Electron Ltd. | 78,800 | 19,415,920 | |
| Toyota Motor Corp. | 1,520,500 | 19,873,625 | |
| Z Holdings Corp. | 1,319,590 | 3,497,791 | |
TOTAL JAPAN | 457,328,498 | ||
| Luxembourg - 0.6% | |||
| B&M European Value Retail SA | 1,334,676 | 4,539,549 | |
| Eurofins Scientific SA | 236,300 | 14,027,791 | |
TOTAL LUXEMBOURG | 18,567,340 | ||
| Multi-National - 0.0% | |||
| HK Electric Investments & HK Electric Investments Ltd. unit | 1,169,190 | 819,436 | |
| Netherlands - 6.4% | |||
| Airbus Group NV | 208,100 | 17,938,299 | |
| Argenx SE ADR (a) | 12,900 | 4,554,345 | |
| ASM International NV (Netherlands) | 61,500 | 13,770,286 | |
| ASML Holding NV (Netherlands) | 155,178 | 64,286,997 | |
| Elastic NV (a) | 17,000 | 1,219,580 | |
| Euronext NV (c) | 174,140 | 11,020,663 | |
| Expro Group Holdings NV (a) | 117,400 | 1,495,676 | |
| Ferrari NV (Italy) (a) | 31,400 | 5,814,837 | |
| Heineken NV (Bearer) | 105,700 | 9,230,895 | |
| IMCD NV | 171,300 | 20,309,599 | |
| ING Groep NV (Certificaten Van Aandelen) | 1,302,200 | 11,157,806 | |
| Koninklijke DSM NV | 53,000 | 6,030,900 | |
| NXP Semiconductors NV | 19,400 | 2,861,694 | |
| Prosus NV | 125,000 | 6,503,328 | |
| Universal Music Group NV | 226,040 | 4,233,741 | |
| Wolters Kluwer NV | 329,600 | 32,094,343 | |
TOTAL NETHERLANDS | 212,522,989 | ||
| Norway - 0.5% | |||
| Aker Solutions ASA | 393,478 | 1,368,036 | |
| Equinor ASA | 340,083 | 11,215,506 | |
| Norsk Hydro ASA | 479,400 | 2,572,425 | |
| Schibsted ASA (B Shares) | 177,690 | 2,218,919 | |
TOTAL NORWAY | 17,374,886 | ||
| Singapore - 0.4% | |||
| Parkway Life REIT | 511,848 | 1,511,043 | |
| United Overseas Bank Ltd. | 579,305 | 10,551,519 | |
| Wing Tai Holdings Ltd. | 2,064,300 | 2,184,673 | |
TOTAL SINGAPORE | 14,247,235 | ||
| Spain - 2.0% | |||
| Amadeus IT Holding SA Class A (a) | 532,649 | 24,695,016 | |
| Banco Santander SA (Spain) | 4,436,700 | 10,323,762 | |
| CaixaBank SA | 4,367,500 | 14,067,175 | |
| Cellnex Telecom SA (c) | 198,381 | 6,119,377 | |
| EDP Renovaveis SA | 98,830 | 2,032,950 | |
| Iberdrola SA | 778,521 | 7,259,073 | |
TOTAL SPAIN | 64,497,353 | ||
| Sweden - 3.1% | |||
| AddTech AB (B Shares) | 606,127 | 7,962,483 | |
| ASSA ABLOY AB (B Shares) | 274,695 | 5,146,701 | |
| Atlas Copco AB (A Shares) | 1,982,300 | 18,424,204 | |
| Ericsson (B Shares) | 492,911 | 2,881,288 | |
| Evolution AB (c) | 40,600 | 3,209,331 | |
| Haypp Group (a) | 353,000 | 709,212 | |
| Hexagon AB (B Shares) | 2,490,600 | 23,260,048 | |
| Indutrade AB | 964,189 | 15,639,109 | |
| Investor AB (B Shares) | 81,500 | 1,189,185 | |
| Kry International AB (a)(d)(e) | 527 | 96,965 | |
| Nordnet AB | 334,651 | 3,789,436 | |
| Sandvik AB | 988,500 | 13,474,794 | |
| Swedish Match Co. AB | 647,100 | 6,400,940 | |
TOTAL SWEDEN | 102,183,696 | ||
| Switzerland - 10.8% | |||
| Coca-Cola HBC AG | 278,200 | 5,812,955 | |
| Compagnie Financiere Richemont SA Series A | 354,150 | 33,430,140 | |
| Julius Baer Group Ltd. | 341,600 | 14,907,103 | |
| Lonza Group AG | 25,680 | 12,503,368 | |
| Nestle SA (Reg. S) | 1,022,518 | 110,592,811 | |
| Novartis AG | 38,180 | 2,910,728 | |
| Partners Group Holding AG | 18,820 | 15,146,046 | |
| Roche Holding AG (participation certificate) | 251,590 | 81,900,790 | |
| Sika AG | 120,094 | 24,137,903 | |
| Sonova Holding AG | 81,336 | 17,898,880 | |
| UBS Group AG | 679,050 | 9,851,634 | |
| Zurich Insurance Group Ltd. | 65,350 | 26,051,832 | |
TOTAL SWITZERLAND | 355,144,190 | ||
| Taiwan - 0.5% | |||
| Taiwan Semiconductor Manufacturing Co. Ltd. | 1,246,000 | 16,479,366 | |
| United Kingdom - 11.5% | |||
| Anglo American PLC (United Kingdom) | 287,580 | 8,634,826 | |
| AstraZeneca PLC (United Kingdom) | 254,300 | 27,955,067 | |
| Aviva PLC | 1,382,352 | 5,928,690 | |
| BAE Systems PLC | 1,442,111 | 12,670,999 | |
| Beazley PLC | 1,172,200 | 7,307,040 | |
| BP PLC | 639,800 | 3,057,215 | |
| Bridgepoint Group Holdings Ltd. (c) | 924,956 | 1,918,952 | |
| Compass Group PLC | 2,520,183 | 50,182,950 | |
| Cranswick PLC | 38,778 | 1,151,973 | |
| Croda International PLC | 39,100 | 2,792,679 | |
| Dechra Pharmaceuticals PLC | 371,200 | 10,780,011 | |
| Deliveroo PLC Class A (a)(c) | 2,418,600 | 2,273,672 | |
| Diageo PLC | 1,450,294 | 61,047,991 | |
| Diploma PLC | 183,468 | 4,714,282 | |
| Grainger Trust PLC | 745,207 | 1,898,188 | |
| Hotel Chocolat Group Ltd. (a) | 1,226,271 | 1,638,328 | |
| Informa PLC | 593,910 | 3,394,731 | |
| JD Sports Fashion PLC | 5,123,600 | 5,644,562 | |
| John Wood Group PLC (a) | 8,047,000 | 11,364,129 | |
| Lloyds Banking Group PLC | 30,454,600 | 13,765,112 | |
| Mondi PLC | 159,247 | 2,446,423 | |
| National Grid PLC | 418,610 | 4,309,218 | |
| Prudential PLC | 1,240,360 | 12,140,191 | |
| Reckitt Benckiser Group PLC | 221,180 | 14,660,142 | |
| RELX PLC (London Stock Exchange) | 1,776,309 | 43,405,444 | |
| Rentokil Initial PLC | 3,405,500 | 18,050,776 | |
| Rio Tinto PLC | 106,300 | 5,751,455 | |
| RS GROUP PLC | 1,068,619 | 11,407,385 | |
| SSE PLC | 158,950 | 2,684,030 | |
| St. James's Place PLC | 917,500 | 10,448,668 | |
| Supreme PLC | 2,049,900 | 1,688,698 | |
| Unilever PLC (Netherlands) | 212,362 | 9,347,396 | |
| WH Smith PLC (a) | 424,200 | 5,592,895 | |
TOTAL UNITED KINGDOM | 380,054,118 | ||
| United States of America - 4.9% | |||
| Airbnb, Inc. Class A (a) | 11,300 | 1,186,952 | |
| Ares Management Corp. | 94,500 | 5,854,275 | |
| CBRE Group, Inc. (a) | 217,100 | 14,656,421 | |
| Constellation Brands, Inc. Class A (sub. vtg.) | 21,800 | 5,007,024 | |
| Equifax, Inc. | 58,500 | 10,028,655 | |
| Hess Corp. | 59,993 | 6,538,637 | |
| Intercontinental Exchange, Inc. | 167,000 | 15,088,450 | |
| Kosmos Energy Ltd. (a) | 1,038,534 | 5,369,221 | |
| Marsh & McLennan Companies, Inc. | 181,500 | 27,096,135 | |
| Moody's Corp. | 57,800 | 14,051,758 | |
| NextEra Energy Partners LP | 19,400 | 1,402,814 | |
| NextEra Energy, Inc. | 21,760 | 1,706,202 | |
| NICE Ltd. sponsored ADR (a) | 20,852 | 3,925,180 | |
| Philip Morris International, Inc. | 74,200 | 6,159,342 | |
| Pool Corp. | 10,300 | 3,277,563 | |
| ResMed, Inc. | 28,800 | 6,287,040 | |
| S&P Global, Inc. | 69,366 | 21,180,908 | |
| The AES Corp. | 59,630 | 1,347,638 | |
| Thermo Fisher Scientific, Inc. | 23,400 | 11,868,246 | |
TOTAL UNITED STATES OF AMERICA | 162,032,461 | ||
| TOTAL COMMON STOCKS (Cost $3,387,884,780) | 3,240,361,029 | ||
| Nonconvertible Preferred Stocks - 0.1% | |||
| Shares | Value ($) | ||
| Germany - 0.1% | |||
| Volkswagen AG | 34,400 | 4,203,404 | |
| Sweden - 0.0% | |||
| Kry International AB Series E (a)(d)(e) | 3,043 | 559,896 | |
| TOTAL NONCONVERTIBLE PREFERRED STOCKS (Cost $6,476,389) | 4,763,300 | ||
| Money Market Funds - 2.8% | |||
| Shares | Value ($) | ||
| Fidelity Cash Central Fund 3.10% (f) | 37,274,734 | 37,282,189 | |
| Fidelity Securities Lending Cash Central Fund 3.10% (f)(g) | 55,229,630 | 55,235,153 | |
| TOTAL MONEY MARKET FUNDS (Cost $92,517,341) | 92,517,342 | ||
| TOTAL INVESTMENT IN SECURITIES - 101.2% (Cost $3,486,878,510) | 3,337,641,671 |
NET OTHER ASSETS (LIABILITIES) - (1.2)% | (39,576,948) |
| NET ASSETS - 100.0% | 3,298,064,723 |
| (a) | Non-income producing |
| (b) | Security or a portion of the security is on loan at period end. |
| (c) | Security exempt from registration under Rule 144A of the Securities Act of 1933. These securities may be resold in transactions exempt from registration, normally to qualified institutional buyers. At the end of the period, the value of these securities amounted to $58,213,984 or 1.8% of net assets. |
| (d) | Restricted securities (including private placements) - Investment in securities not registered under the Securities Act of 1933 (excluding 144A issues). At the end of the period, the value of restricted securities (excluding 144A issues) amounted to $656,861 or 0.0% of net assets. |
| (e) | Level 3 security |
| (f) | Affiliated fund that is generally available only to investment companies and other accounts managed by Fidelity Investments. The rate quoted is the annualized seven-day yield of the fund at period end. A complete unaudited listing of the fund's holdings as of its most recent quarter end is available upon request. In addition, each Fidelity Central Fund's financial statements, which are not covered by the Fund's Report of Independent Registered Public Accounting Firm, are available on the SEC's website or upon request. |
| (g) | Investment made with cash collateral received from securities on loan. |
| Additional information on each restricted holding is as follows: | ||
| Security | Acquisition Date | Acquisition Cost ($) |
| Kry International AB | 5/14/21 | 228,879 |
| Kry International AB Series E | 5/14/21 | 1,391,178 |
| Affiliate | Value, beginning of period ($) | Purchases ($) | Sales Proceeds ($) | Dividend Income ($) | Realized Gain (loss) ($) | Change in Unrealized appreciation (depreciation) ($) | Value, end of period ($) | %ownership, end of period |
| Fidelity Cash Central Fund 3.10% | 74,387,739 | 1,808,522,813 | 1,845,628,363 | 708,272 | - | - | 37,282,189 | 0.1% |
| Fidelity Securities Lending Cash Central Fund 3.10% | 39,666,680 | 473,907,964 | 458,339,491 | 291,134 | - | - | 55,235,153 | 0.2% |
| Total | 114,054,419 | 2,282,430,777 | 2,303,967,854 | 999,406 | - | - | 92,517,342 | |
| Valuation Inputs at Reporting Date: | ||||
| Description | Total ($) | Level 1 ($) | Level 2 ($) | Level 3 ($) |
Investments in Securities: | ||||
| Equities: | ||||
Communication Services | 75,156,871 | 17,299,497 | 57,857,374 | - |
Consumer Discretionary | 363,966,637 | 29,217,610 | 334,749,027 | - |
Consumer Staples | 290,151,272 | 14,125,024 | 276,026,248 | - |
Energy | 155,708,670 | 63,531,029 | 92,177,641 | - |
Financials | 678,003,402 | 209,246,788 | 468,756,614 | - |
Health Care | 431,134,218 | 128,815,462 | 302,318,756 | - |
Industrials | 597,030,258 | 132,884,675 | 464,145,583 | - |
Information Technology | 351,492,916 | 88,168,930 | 262,667,125 | 656,861 |
Materials | 195,516,881 | 53,668,121 | 141,848,760 | - |
Real Estate | 56,357,701 | 34,673,147 | 21,684,554 | - |
Utilities | 50,605,503 | 15,084,881 | 35,520,622 | - |
| Money Market Funds | 92,517,342 | 92,517,342 | - | - |
| Total Investments in Securities: | 3,337,641,671 | 879,232,506 | 2,457,752,304 | 656,861 |
| Statement of Assets and Liabilities | ||||
| September 30, 2022 | ||||
| Assets | ||||
| Investment in securities, at value (including securities loaned of $53,079,911) - See accompanying schedule: | $ | |||
Unaffiliated issuers (cost $3,394,361,169) | $3,245,124,329 | |||
Fidelity Central Funds (cost $92,517,341) | 92,517,342 | |||
| Total Investment in Securities (cost $3,486,878,510) | $ | 3,337,641,671 | ||
| Cash | 4,944,525 | |||
| Foreign currency held at value (cost $574,121) | 572,843 | |||
| Receivable for investments sold | 9,360,587 | |||
| Receivable for fund shares sold | 11,735 | |||
| Dividends receivable | 5,740,635 | |||
| Reclaims receivable | 9,293,324 | |||
| Distributions receivable from Fidelity Central Funds | 136,950 | |||
| Other receivables | 1,470 | |||
Total assets | 3,367,703,740 | |||
| Liabilities | ||||
| Payable for investments purchased | $11,376,844 | |||
| Payable for fund shares redeemed | 2,604,103 | |||
| Other payables and accrued expenses | 422,917 | |||
| Collateral on securities loaned | 55,235,153 | |||
| Total Liabilities | 69,639,017 | |||
| Net Assets | $ | 3,298,064,723 | ||
| Net Assets consist of: | ||||
| Paid in capital | $ | 3,573,254,765 | ||
| Total accumulated earnings (loss) | (275,190,042) | |||
| Net Assets | $ | 3,298,064,723 | ||
Net Asset Value , offering price and redemption price per share ($3,298,064,723 ÷ 45,902,946 shares) | $ | 71.85 | ||
| Statement of Operations | ||||
Year ended September 30, 2022 | ||||
| Investment Income | ||||
| Dividends | $ | 93,411,226 | ||
| Foreign Tax Reclaims | 4,808,469 | |||
| Interest | 23,365 | |||
| Income from Fidelity Central Funds (including $291,134 from security lending) | 999,406 | |||
| Income before foreign taxes withheld | 99,242,466 | |||
| Less foreign taxes withheld | (13,951,091) | |||
| Total Income | 85,291,375 | |||
| Expenses | ||||
| Custodian fees and expenses | 177,452 | |||
| Independent trustees' fees and expenses | 12,913 | |||
| Miscellaneous | 33 | |||
| Total Expenses | 190,398 | |||
| Net Investment income (loss) | 85,100,977 | |||
| Realized and Unrealized Gain (Loss) | ||||
| Net realized gain (loss) on: | ||||
| Investment Securities: | ||||
| Unaffiliated issuers(net of foreign taxes of $679,701) | (109,093,632) | |||
| Foreign currency transactions | (1,429,127) | |||
| Futures contracts | (6,620,605) | |||
| Total net realized gain (loss) | (117,143,364) | |||
| Change in net unrealized appreciation (depreciation) on: | ||||
| Investment Securities: | ||||
| Unaffiliated issuers (net of decrease in deferred foreign taxes of $1,083,084) | (1,139,136,179) | |||
| Assets and liabilities in foreign currencies | (1,395,248) | |||
| Futures contracts | 616,166 | |||
| Total change in net unrealized appreciation (depreciation) | (1,139,915,261) | |||
| Net gain (loss) | (1,257,058,625) | |||
| Net increase (decrease) in net assets resulting from operations | $ | (1,171,957,648) | ||
| Statement of Changes in Net Assets | ||||
Year ended September 30, 2022 | Year ended September 30, 2021 | |||
| Increase (Decrease) in Net Assets | ||||
| Operations | ||||
| Net investment income (loss) | $ | 85,100,977 | $ | 62,641,368 |
| Net realized gain (loss) | (117,143,364) | 269,754,017 | ||
| Change in net unrealized appreciation (depreciation) | (1,139,915,261) | 506,860,201 | ||
| Net increase (decrease) in net assets resulting from operations | (1,171,957,648) | 839,255,586 | ||
| Distributions to shareholders | (301,411,089) | (58,312,100) | ||
| Affiliated share transactions | ||||
| Proceeds from sales of shares | 1,136,288,448 | 529,663,856 | ||
| Reinvestment of distributions | 301,411,089 | 58,312,100 | ||
| Cost of shares redeemed | (456,223,837) | (599,890,195) | ||
Net increase (decrease) in net assets resulting from share transactions | 981,475,700 | (11,914,239) | ||
| Total increase (decrease) in net assets | (491,893,037) | 769,029,247 | ||
| Net Assets | ||||
| Beginning of period | 3,789,957,760 | 3,020,928,513 | ||
| End of period | $ | 3,298,064,723 | $ | 3,789,957,760 |
| Other Information | ||||
| Shares | ||||
| Sold | 12,769,516 | 5,192,192 | ||
| Issued in reinvestment of distributions | 3,029,094 | 568,317 | ||
| Redeemed | (5,354,221) | (6,000,356) | ||
| Net increase (decrease) | 10,444,389 | (239,847) | ||
| Fidelity® International Equity Central Fund |
| Years ended September 30, | 2022 | 2021 | 2020 | 2019 | 2018 | |||||
Selected Per-Share Data | ||||||||||
| Net asset value, beginning of period | $ | 106.88 | $ | 84.62 | $ | 77.92 | $ | 84.55 | $ | 87.45 |
| Income from Investment Operations | ||||||||||
Net investment income (loss) A,B | 2.07 | 1.80 | 1.40 | 2.23 | 2.30 | |||||
| Net realized and unrealized gain (loss) | (28.91) | 22.17 | 6.94 | (3.09) | (.27) | |||||
| Total from investment operations | (26.84) | 23.97 | 8.34 | (.86) | 2.03 | |||||
| Distributions from net investment income | (2.25) | (1.71) | (1.39) | (2.12) | (2.34) | |||||
| Distributions from net realized gain | (5.94) | - | (.25) | (3.65) | (2.60) | |||||
| Total distributions | (8.19) | (1.71) | (1.64) | (5.77) | (4.93) C | |||||
| Net asset value, end of period | $ | 71.85 | $ | 106.88 | $ | 84.62 | $ | 77.92 | $ | 84.55 |
Total Return | (27.21)% | 28.42% | 10.91% | (.21)% | 2.30% | |||||
Ratios to Average Net Assets B,D,E | ||||||||||
| Expenses before reductions | .01% | .01% | .01% | .01% | .01% | |||||
| Expenses net of fee waivers, if any | .01% | .01% | .01% | .01% | .01% | |||||
| Expenses net of all reductions | .01% | .01% | .01% | .01% | .01% | |||||
| Net investment income (loss) | 2.25% | 1.79% | 1.77% | 2.93% | 2.63% | |||||
| Supplemental Data | ||||||||||
| Net assets, end of period (000 omitted) | $ | 3,298,065 | $ | 3,789,958 | $ | 3,020,929 | $ | 2,432,786 | $ | 2,645,061 |
Portfolio turnover rate F | 38% | 52% | 81% | 70% | 53% |
| Fidelity Central Fund | Investment Manager | Investment Objective | Investment Practices | Expense Ratio A |
| Fidelity Money Market Central Funds | Fidelity Management & Research Company LLC (FMR) | Each fund seeks to obtain a high level of current income consistent with the preservation of capital and liquidity. | Short-term Investments | Less than .005% |
| Gross unrealized appreciation | $ 335,849,058 |
| Gross unrealized depreciation | (508,769,060) |
| Net unrealized appreciation (depreciation) | $(172,920,002) |
| Tax Cost | $3,510,561,673 |
| Undistributed ordinary income | $7,196,009 |
| Net unrealized appreciation (depreciation) on securities and other investments | $(174,143,125) |
| September 30, 2022 | September 30, 2021 | |
| Ordinary Income | $ 146,442,802 | $ 58,312,100 |
| Long-term Capital Gains | 154,968,287 | - |
| Total | $ 301,411,089 | $58,312,100 |
| Equity Risk | Equity risk relates to the fluctuations in the value of financial instruments as a result of changes in market prices (other than those arising from interest rate risk or foreign exchange risk), whether caused by factors specific to an individual investment, its issuer, or all factors affecting all instruments traded in a market or market segment. |
| Purchases ($) | Sales ($) | |
| Fidelity International Equity Central Fund | 2,168,752,064 | 1,379,339,635 |
| Amount | |
| Fidelity International Equity Central Fund | $2,253 |
| Purchases ($) | Sales ($) | Realized Gain (Loss) ($) | |
| Fidelity International Equity Central Fund | 80,016,049 | 34,918,666 | (5,673,220) |
| Total Security Lending Fees Paid to NFS | Security Lending Income From Securities Loaned to NFS | Value of Securities Loaned to NFS at Period End | |
| Fidelity International Equity Central Fund | $30,638 | $- | $- |
| The Example is based on an investment of $1,000 invested at the beginning of the period and held for the entire period (April 1, 2022 to September 30, 2022). |
Annualized Expense Ratio- A | Beginning Account Value April 1, 2022 | Ending Account Value September 30, 2022 | Expenses Paid During Period- C April 1, 2022 to September 30, 2022 | |||||||
| Fidelity® International Equity Central Fund | .0064% | |||||||||
| Actual | $ 1,000 | $ 764.30 | $ .03 | |||||||
Hypothetical- B | $ 1,000 | $ 1,025.04 | $ .03 | |||||||
|


Contents
| Average Annual Total Returns | |||
Periods ended September 30, 2022 | Past 1 year | Past 5 years | Past 10 years |
| Fidelity® Emerging Markets Equity Central Fund | -32.96% | -1.40% | 2.68% |
| $10,000 Over 10 Years |
Let's say hypothetically that $10,000 was invested in Fidelity® Emerging Markets Equity Central Fund on September 30, 2012. The chart shows how the value of your investment would have changed, and also shows how the MSCI Emerging Markets Index performed over the same period. |
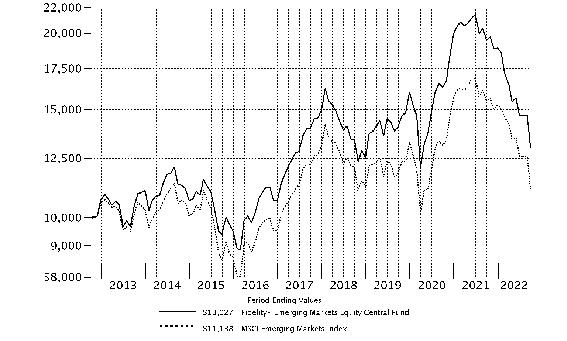 |
Top Holdings (% of Fund's net assets) | ||
| Taiwan Semiconductor Manufacturing Co. Ltd. (Taiwan, Semiconductors & Semiconductor Equipment) | 6.9 | |
| Samsung Electronics Co. Ltd. (Korea (South), Technology Hardware, Storage & Peripherals) | 3.9 | |
| Tencent Holdings Ltd. (Cayman Islands, Interactive Media & Services) | 3.9 | |
| Alibaba Group Holding Ltd. (Cayman Islands, Internet & Direct Marketing Retail) | 2.9 | |
| HDFC Bank Ltd. (India, Banks) | 2.6 | |
| Reliance Industries Ltd. (India, Oil, Gas & Consumable Fuels) | 1.9 | |
| Meituan Class B (Cayman Islands, Internet & Direct Marketing Retail) | 1.8 | |
| China Construction Bank Corp. (H Shares) (China, Banks) | 1.7 | |
| Pinduoduo, Inc. ADR (Cayman Islands, Internet & Direct Marketing Retail) | 1.6 | |
| Infosys Ltd. sponsored ADR (India, IT Services) | 1.3 | |
| 28.5 | ||
| Market Sectors (% of Fund's net assets) | ||
| Financials | 21.7 | |
| Information Technology | 18.9 | |
| Consumer Discretionary | 15.5 | |
| Materials | 8.7 | |
| Communication Services | 8.2 | |
| Consumer Staples | 6.4 | |
| Industrials | 5.7 | |
| Energy | 4.8 | |
| Health Care | 3.5 | |
| Utilities | 3.2 | |
| Real Estate | 1.5 | |
Asset Allocation (% of Fund's net assets) |
 |
Geographic Diversification (% of Fund's net assets) |
 |
* Includes Short-Term investments and Net Other Assets (Liabilities). Percentages are based on country or territory of incorporation and are adjusted for the effect of futures contracts, if applicable. |
| Common Stocks - 94.6% | |||
| Shares | Value ($) | ||
| Belgium - 0.3% | |||
| Titan Cement International Trading SA | 426,700 | 4,535,134 | |
| Bermuda - 1.4% | |||
| China Gas Holdings Ltd. | 3,479,200 | 4,161,317 | |
| Credicorp Ltd. (United States) | 78,909 | 9,690,025 | |
| Huanxi Media Group Ltd. (a) | 9,539,702 | 1,263,246 | |
| Kerry Properties Ltd. | 931,000 | 1,764,775 | |
| Kunlun Energy Co. Ltd. | 5,968,000 | 4,295,321 | |
| Pacific Basin Shipping Ltd. | 4,901,000 | 1,513,352 | |
| Shangri-La Asia Ltd. (a) | 1,970,000 | 1,368,027 | |
TOTAL BERMUDA | 24,056,063 | ||
| Brazil - 4.5% | |||
| Arezzo Industria e Comercio SA | 203,990 | 3,721,423 | |
| Atacadao SA | 2,989,400 | 10,712,153 | |
| Dexco SA | 2,211,480 | 3,833,147 | |
| ENGIE Brasil Energia SA | 540,400 | 3,857,889 | |
| Equatorial Energia SA | 1,041,900 | 5,195,642 | |
| Localiza Rent A Car SA | 1,038,540 | 11,761,270 | |
| Localiza Rent A Car SA rights 10/31/22 (a) | 3,186 | 6,497 | |
| LOG Commercial Properties e Participacoes SA | 411,600 | 1,888,476 | |
| Lojas Renner SA | 889,214 | 4,590,842 | |
| Rede D'Oregon Sao Luiz SA (b) | 683,177 | 3,763,942 | |
| Rumo SA | 1,986,200 | 6,804,337 | |
| Suzano Papel e Celulose SA | 617,700 | 5,095,637 | |
| Transmissora Alianca de Energia Eletrica SA unit | 533,400 | 3,851,424 | |
| Vale SA sponsored ADR | 1,138,815 | 15,169,016 | |
TOTAL BRAZIL | 80,251,695 | ||
| Canada - 0.9% | |||
| Barrick Gold Corp. (a) | 1,011,500 | 15,678,250 | |
| Cayman Islands - 21.8% | |||
| Akeso, Inc. (a)(b) | 436,737 | 1,195,575 | |
| Alibaba Group Holding Ltd. (a) | 5,114,298 | 51,037,313 | |
| Alibaba Group Holding Ltd. sponsored ADR (a) | 22,094 | 1,767,299 | |
| Angelalign Technology, Inc. (b)(c) | 76,878 | 733,529 | |
| Ant International Co. Ltd. Class C (a)(d)(e) | 436,400 | 754,972 | |
| Antengene Corp. (a)(b) | 1,228,860 | 538,345 | |
| Archosaur Games, Inc. (a)(b) | 223,857 | 79,791 | |
| Baidu, Inc. sponsored ADR (a) | 26,732 | 3,140,743 | |
| BeiGene Ltd. ADR (a) | 3,253 | 438,569 | |
| Bilibili, Inc. ADR (a)(c) | 439,663 | 6,735,637 | |
| BizLink Holding, Inc. | 218,000 | 1,921,716 | |
| Chailease Holding Co. Ltd. | 2,551,038 | 14,631,189 | |
| China Resources Land Ltd. | 599,000 | 2,346,215 | |
| CK Asset Holdings Ltd. | 205,500 | 1,233,696 | |
| Daqo New Energy Corp. ADR (a) | 8,261 | 438,494 | |
| ENN Energy Holdings Ltd. | 567,700 | 7,569,247 | |
| ESR Group Ltd. (a)(b) | 581,200 | 1,461,933 | |
| GDS Holdings Ltd.: | |||
| ADR (a)(c) | 37,500 | 662,250 | |
| Class A (a) | 138,576 | 304,890 | |
| GlobalFoundries, Inc. | 24,875 | 1,202,706 | |
| Greentown China Holdings Ltd. | 470,000 | 882,119 | |
| Haitian International Holdings Ltd. | 1,464,000 | 2,770,459 | |
| Hansoh Pharmaceutical Group Co. Ltd. (b) | 1,784,285 | 2,816,715 | |
| Innovent Biologics, Inc. (a)(b) | 717,332 | 2,204,588 | |
| Jacobio Pharmaceuticals Group Co. Ltd. (a)(b) | 1,563,194 | 836,724 | |
| JD Health International, Inc. (a)(b) | 210,384 | 1,198,420 | |
| JD.com, Inc.: | |||
| Class A | 592,358 | 14,944,116 | |
| sponsored ADR | 146,377 | 7,362,763 | |
| KE Holdings, Inc. ADR (a) | 68,700 | 1,203,624 | |
| Kuaishou Technology Class B (a)(b) | 365,060 | 2,341,550 | |
| Li Auto, Inc. Class A (a) | 3 | 35 | |
| Li Ning Co. Ltd. | 2,085,373 | 15,823,568 | |
| Longfor Properties Co. Ltd. (b) | 467,037 | 1,338,785 | |
| Medlive Technology Co. Ltd. (b) | 920,914 | 1,049,298 | |
| Meituan Class B (a)(b) | 1,507,689 | 31,686,284 | |
| NetEase, Inc. ADR | 134,844 | 10,194,206 | |
| NIO, Inc. sponsored ADR (a) | 62,800 | 990,356 | |
| PagSeguro Digital Ltd. (a) | 1,151,227 | 15,230,733 | |
| Parade Technologies Ltd. | 66,146 | 1,230,623 | |
| Pinduoduo, Inc. ADR (a) | 439,685 | 27,515,487 | |
| Sea Ltd. ADR (a) | 293,658 | 16,459,531 | |
| Silergy Corp. | 268,203 | 3,548,506 | |
| StoneCo Ltd. Class A (a) | 442,837 | 4,220,237 | |
| Sunny Optical Technology Group Co. Ltd. | 155,702 | 1,479,733 | |
| Tencent Holdings Ltd. | 2,043,844 | 69,033,527 | |
| Tencent Music Entertainment Group ADR (a) | 187,439 | 761,002 | |
| Tongdao Liepin Group (a) | 719,595 | 666,880 | |
| Trip.com Group Ltd. ADR (a) | 487,414 | 13,311,276 | |
| Uni-President China Holdings Ltd. | 3,829,400 | 3,208,701 | |
| Wuxi Biologics (Cayman), Inc. (a)(b) | 1,534,061 | 9,132,029 | |
| Xiaomi Corp. Class B (a)(b) | 326,598 | 369,830 | |
| Xinyi Solar Holdings Ltd. | 1,883,095 | 1,977,507 | |
| XP, Inc. Class A (a) | 729,783 | 13,873,175 | |
| XPeng, Inc. ADR (a)(c) | 358,605 | 4,285,330 | |
| Zai Lab Ltd. (a) | 946,201 | 3,221,227 | |
| Zai Lab Ltd. ADR (a) | 3,440 | 117,648 | |
TOTAL CAYMAN ISLANDS | 385,480,701 | ||
| Chile - 1.3% | |||
| Banco de Chile | 105,380,200 | 9,271,838 | |
| Sociedad Quimica y Minera de Chile SA (PN-B) sponsored ADR | 151,165 | 13,718,224 | |
TOTAL CHILE | 22,990,062 | ||
| China - 8.0% | |||
| Asymchem Laboratories Tianjin Co. Ltd. (H Shares) (b) | 60,793 | 769,731 | |
| Bafang Electric Suzhou Co. Ltd. (A Shares) | 71,252 | 1,176,119 | |
| Beijing Enlight Media Co. Ltd. (A Shares) | 1,661,299 | 1,657,564 | |
| BYD Co. Ltd. (H Shares) | 125,895 | 3,101,494 | |
| C&S Paper Co. Ltd. (A Shares) | 1,548,400 | 2,215,108 | |
| China Communications Services Corp. Ltd. (H Shares) | 6,452,000 | 2,169,138 | |
| China Construction Bank Corp. (H Shares) | 52,961,000 | 30,569,189 | |
| China Merchants Shekou Industrial Zone Holdings Co. Ltd. (A Shares) (a) | 276,100 | 633,990 | |
| China Petroleum & Chemical Corp. (H Shares) | 20,574,000 | 8,785,654 | |
| China Tourism Group Duty Free Corp. Ltd. (A Shares) | 55,417 | 1,543,904 | |
| China Tower Corp. Ltd. (H Shares) (b) | 13,158,442 | 1,405,873 | |
| Contemporary Amperex Technology Co. Ltd. (a) | 17,948 | 1,011,126 | |
| Daqin Railway Co. Ltd. (A Shares) (a) | 5,499,800 | 5,232,384 | |
| Flat Glass Group Co. Ltd. (a) | 494,934 | 1,197,620 | |
| Gemdale Corp. (A Shares) | 234,977 | 379,411 | |
| Haier Smart Home Co. Ltd. | 1,887,600 | 5,743,930 | |
| Haier Smart Home Co. Ltd. (A Shares) (a) | 211,600 | 736,556 | |
| Hangzhou First Applied Material Co. Ltd. (A Shares) | 85,880 | 642,048 | |
| Hongfa Technology Co. Ltd. (A Shares) (a) | 742,958 | 3,636,485 | |
| LONGi Green Energy Technology Co. Ltd. (a) | 165,240 | 1,112,514 | |
| Pharmaron Beijing Co. Ltd. (H Shares) (b) | 274,675 | 1,328,793 | |
| Ping An Insurance Group Co. of China Ltd. (H Shares) | 4,609,500 | 22,995,850 | |
| Poly Developments & Holdings (A Shares) | 151,215 | 382,500 | |
| Proya Cosmetics Co. Ltd. (A Shares) (a) | 312,760 | 7,161,044 | |
| Shenzhen Mindray Bio-Medical Electronics Co. Ltd. (A Shares) (a) | 171,253 | 7,195,706 | |
| Sinopec Engineering Group Co. Ltd. (H Shares) | 4,269,000 | 1,705,974 | |
| Sinopharm Group Co. Ltd. (H Shares) | 844,109 | 1,684,661 | |
| TravelSky Technology Ltd. (H Shares) | 1,945,000 | 2,976,967 | |
| Tsingtao Brewery Co. Ltd. (H Shares) | 1,599,800 | 15,082,534 | |
| Venus MedTech Hangzhou, Inc. (H Shares) (a)(b) | 522,236 | 608,100 | |
| Will Semiconductor Ltd. (a) | 52,590 | 592,192 | |
| WuXi AppTec Co. Ltd. (H Shares) (b) | 254,983 | 2,036,467 | |
| Zhuzhou CRRC Times Electric Co. Ltd. (H Shares) | 1,229,800 | 5,147,674 | |
TOTAL CHINA | 142,618,300 | ||
| Cyprus - 0.0% | |||
| Fix Price Group Ltd. GDR (Reg. S) (e) | 365,722 | 135,072 | |
| TCS Group Holding PLC GDR (a)(e) | 292,174 | 366,547 | |
TOTAL CYPRUS | 501,619 | ||
| Germany - 0.4% | |||
| Delivery Hero AG (a)(b) | 181,679 | 6,636,220 | |
| Greece - 0.3% | |||
| Alpha Bank SA (a) | 5,620,601 | 4,412,328 | |
| Piraeus Financial Holdings SA (a) | 1,345,300 | 1,356,905 | |
TOTAL GREECE | 5,769,233 | ||
| Hong Kong - 1.8% | |||
| AIA Group Ltd. | 1,120,400 | 9,328,346 | |
| China Merchants Holdings International Co. Ltd. | 1,709,143 | 2,146,703 | |
| China Overseas Land and Investment Ltd. | 832,960 | 2,166,966 | |
| China Resources Beer Holdings Co. Ltd. | 1,930,666 | 13,392,515 | |
| Guangdong Investment Ltd. | 4,890,000 | 3,906,230 | |
| Sino-Ocean Group Holding Ltd. | 2,732,500 | 285,414 | |
TOTAL HONG KONG | 31,226,174 | ||
| Hungary - 0.1% | |||
| Richter Gedeon PLC | 130,548 | 2,237,991 | |
| India - 16.5% | |||
| Adani Ports & Special Economic Zone Ltd. | 840,608 | 8,462,123 | |
| Apollo Hospitals Enterprise Ltd. | 102,862 | 5,530,876 | |
| Bajaj Finance Ltd. | 182,848 | 16,453,662 | |
| Bandhan Bank Ltd. (b) | 1,923,000 | 6,288,793 | |
| Bharat Electronics Ltd. | 5,180,700 | 6,415,383 | |
| CE Info Systems Ltd. | 68,940 | 1,183,257 | |
| Delhivery Private Ltd. | 177,126 | 1,266,497 | |
| Divi's Laboratories Ltd. | 65,399 | 2,972,423 | |
| Embassy Office Parks (REIT) | 210,400 | 892,583 | |
| HDFC Bank Ltd. (a) | 2,701,282 | 46,703,315 | |
| HDFC Standard Life Insurance Co. Ltd. (b) | 1,637,728 | 10,656,487 | |
| Indraprastha Gas Ltd. | 940,520 | 4,577,913 | |
| Indus Towers Ltd. | 182,600 | 442,268 | |
| Infosys Ltd. | 315,659 | 5,399,819 | |
| Infosys Ltd. sponsored ADR | 1,378,629 | 23,395,334 | |
| ITC Ltd. | 2,517,087 | 10,257,126 | |
| JK Cement Ltd. | 377,898 | 12,171,364 | |
| Larsen & Toubro Ltd. | 452,916 | 10,265,426 | |
| Mahanagar Gas Ltd. | 326,590 | 3,333,745 | |
| Manappuram General Finance & Leasing Ltd. | 1,985,357 | 2,373,276 | |
| Maruti Suzuki India Ltd. | 72,844 | 7,888,444 | |
| NTPC Ltd. | 3,812,822 | 7,466,951 | |
| Oberoi Realty Ltd. | 148,766 | 1,674,864 | |
| Oil & Natural Gas Corp. Ltd. | 3,654,100 | 5,683,653 | |
| Petronet LNG Ltd. | 957,568 | 2,348,066 | |
| Power Grid Corp. of India Ltd. | 3,721,074 | 9,685,934 | |
| Reliance Industries Ltd. | 1,138,997 | 33,221,299 | |
| Shree Cement Ltd. | 29,927 | 7,721,369 | |
| Sun Pharmaceutical Industries Ltd. | 138,123 | 1,607,311 | |
| Tata Motors Ltd. (a) | 901,094 | 4,472,227 | |
| Tata Steel Ltd. | 9,722,900 | 11,843,305 | |
| Torrent Pharmaceuticals Ltd. | 130,571 | 2,498,374 | |
| Vijaya Diagnostic Centre Pvt Ltd. | 153,255 | 866,085 | |
| Voltas Ltd. | 255,466 | 2,840,565 | |
| Zomato Ltd. (a) | 17,467,531 | 13,359,673 | |
TOTAL INDIA | 292,219,790 | ||
| Indonesia - 2.5% | |||
| PT Astra International Tbk | 8,221,900 | 3,577,087 | |
| PT Bank Central Asia Tbk | 32,050,824 | 17,996,030 | |
| PT Bank Rakyat Indonesia (Persero) Tbk | 64,499,655 | 19,018,450 | |
| PT Dayamitra Telekomunikasi Tbk | 9,713,600 | 462,476 | |
| PT United Tractors Tbk | 1,365,400 | 2,943,310 | |
TOTAL INDONESIA | 43,997,353 | ||
| Japan - 0.8% | |||
| Capcom Co. Ltd. | 53,450 | 1,344,282 | |
| JTOWER, Inc. (a) | 23,062 | 1,042,116 | |
| Money Forward, Inc. (a) | 46,216 | 983,523 | |
| Renesas Electronics Corp. (a) | 288,118 | 2,415,362 | |
| Sumco Corp. | 121,577 | 1,417,964 | |
| Z Holdings Corp. | 2,305,629 | 6,111,450 | |
TOTAL JAPAN | 13,314,697 | ||
| Korea (South) - 10.6% | |||
| AMOREPACIFIC Group, Inc. | 151,159 | 2,786,665 | |
| Coway Co. Ltd. | 91,610 | 3,398,994 | |
| Hana Financial Group, Inc. | 216,937 | 5,285,069 | |
| Hanon Systems | 307,110 | 1,755,864 | |
| Hyundai Fire & Marine Insurance Co. Ltd. | 199,190 | 4,023,494 | |
| Kakao Corp. | 162,348 | 6,338,156 | |
| Kakao Pay Corp. (a) | 50,524 | 1,694,397 | |
| KB Financial Group, Inc. | 305,312 | 9,147,599 | |
| Kia Corp. | 172,420 | 8,514,322 | |
| Korea Zinc Co. Ltd. | 9,975 | 4,091,945 | |
| L&F Co. Ltd. (a) | 2,600 | 313,687 | |
| LG Chemical Ltd. | 11,510 | 4,216,537 | |
| LG Corp. | 74,792 | 3,806,317 | |
| LG Electronics, Inc. | 19,917 | 1,072,320 | |
| LG Innotek Co. Ltd. | 2,540 | 474,994 | |
| NAVER Corp. | 32,042 | 4,235,006 | |
| NCSOFT Corp. | 11,546 | 2,740,081 | |
| Netmarble Corp. (b) | 12,522 | 440,454 | |
| POSCO | 89,221 | 12,912,299 | |
| S-Oil Corp. | 66,320 | 3,722,055 | |
| Samsung Biologics Co. Ltd. (a)(b) | 15,000 | 8,330,637 | |
| Samsung Electronics Co. Ltd. | 1,911,361 | 69,632,799 | |
| Samsung SDI Co. Ltd. | 21,494 | 8,021,363 | |
| SK Hynix, Inc. | 357,870 | 20,309,550 | |
| Studio Dragon Corp. (a) | 20,323 | 926,393 | |
TOTAL KOREA (SOUTH) | 188,190,997 | ||
| Luxembourg - 0.6% | |||
| Adecoagro SA | 58,504 | 484,998 | |
| Globant SA (a) | 22,840 | 4,272,907 | |
| Tenaris SA sponsored ADR | 198,000 | 5,116,320 | |
TOTAL LUXEMBOURG | 9,874,225 | ||
| Mauritius - 0.0% | |||
| Jumo World Ltd. (a)(e) | 161 | 641,028 | |
| Mexico - 2.9% | |||
| CEMEX S.A.B. de CV sponsored ADR (a) | 4,448,000 | 15,256,640 | |
| Corporacion Inmobiliaria Vesta S.A.B. de CV | 1,686,400 | 3,141,773 | |
| Grupo Aeroportuario del Pacifico S.A.B. de CV Series B | 388,296 | 4,907,805 | |
| Grupo Aeroportuario del Sureste S.A.B. de CV Series B sponsored ADR | 22,941 | 4,500,336 | |
| Grupo Aeroportuario Norte S.A.B. de CV | 347,000 | 2,183,363 | |
| Grupo Financiero Banorte S.A.B. de CV Series O | 2,371,432 | 15,227,468 | |
| Wal-Mart de Mexico SA de CV Series V | 1,609,800 | 5,661,617 | |
TOTAL MEXICO | 50,879,002 | ||
| Netherlands - 0.2% | |||
| ASML Holding NV (Netherlands) | 2,192 | 908,100 | |
| CTP BV (b)(c) | 18,585 | 191,327 | |
| NXP Semiconductors NV | 7,457 | 1,099,982 | |
| X5 Retail Group NV GDR (Reg. S) (e) | 450,200 | 93,997 | |
| Yandex NV Series A (a)(e) | 475,848 | 1,632,083 | |
TOTAL NETHERLANDS | 3,925,489 | ||
| Panama - 0.2% | |||
| Copa Holdings SA Class A (a)(c) | 41,425 | 2,775,889 | |
| Philippines - 0.2% | |||
| Ayala Land, Inc. | 3,825,800 | 1,486,727 | |
| SM Investments Corp. | 202,000 | 2,490,646 | |
TOTAL PHILIPPINES | 3,977,373 | ||
| Poland - 0.1% | |||
| CD Projekt RED SA (c) | 125,741 | 2,518,009 | |
| Russia - 0.0% | |||
| Gazprom OAO sponsored ADR (Reg. S) (a)(e) | 782,800 | 178,823 | |
| LSR Group OJSC (a)(e) | 6,300 | 9,795 | |
| LUKOIL PJSC sponsored ADR (e) | 176,600 | 49,958 | |
| Novatek PJSC GDR (Reg. S) (e) | 46,200 | 11,803 | |
| Sberbank of Russia (a)(e) | 794,750 | 7,553 | |
| Sberbank of Russia sponsored ADR (a)(e) | 1,468,992 | 26,148 | |
| Severstal PAO GDR (Reg. S) (e) | 433,400 | 10,233 | |
TOTAL RUSSIA | 294,313 | ||
| Saudi Arabia - 4.0% | |||
| Al Rajhi Bank (a) | 944,515 | 20,438,933 | |
| Alinma Bank | 1,182,900 | 11,413,395 | |
| Bupa Arabia for Cooperative Insurance Co. | 173,300 | 7,767,825 | |
| Saudi Arabian Oil Co. (b) | 372,440 | 3,553,892 | |
| Saudi Tadawul Group Holding Co. | 157,300 | 8,432,318 | |
| The Saudi National Bank | 1,185,400 | 19,909,167 | |
TOTAL SAUDI ARABIA | 71,515,530 | ||
| Singapore - 0.8% | |||
| CapitaLand Investment Ltd. | 1,167,600 | 2,820,938 | |
| First Resources Ltd. | 5,348,000 | 5,213,020 | |
| United Overseas Bank Ltd. | 384,000 | 6,994,214 | |
TOTAL SINGAPORE | 15,028,172 | ||
| South Africa - 2.8% | |||
| Capitec Bank Holdings Ltd. | 97,799 | 8,378,876 | |
| FirstRand Ltd. | 3,640,728 | 12,153,688 | |
| Impala Platinum Holdings Ltd. | 1,683,200 | 15,649,752 | |
| Naspers Ltd. Class N | 42,952 | 5,327,060 | |
| Pick 'n Pay Stores Ltd. | 2,648,108 | 8,068,261 | |
TOTAL SOUTH AFRICA | 49,577,637 | ||
| Taiwan - 8.6% | |||
| ECLAT Textile Co. Ltd. | 284,000 | 3,498,680 | |
| eMemory Technology, Inc. | 48,020 | 1,727,935 | |
| GlobalWafers Co. Ltd. | 93,178 | 1,073,216 | |
| MediaTek, Inc. | 600,135 | 10,392,030 | |
| Taiwan Semiconductor Manufacturing Co. Ltd. | 9,223,878 | 121,993,310 | |
| Uni-President Enterprises Corp. | 3,038,000 | 6,425,437 | |
| Unimicron Technology Corp. | 590,396 | 2,180,124 | |
| United Microelectronics Corp. | 1,059,207 | 1,182,711 | |
| Wiwynn Corp. | 118,558 | 3,010,524 | |
TOTAL TAIWAN | 151,483,967 | ||
| Thailand - 0.3% | |||
| Land & House PCL (For. Reg.) | 5,107,600 | 1,202,186 | |
| PTT Global Chemical PCL (For. Reg.) | 4,276,400 | 4,693,437 | |
TOTAL THAILAND | 5,895,623 | ||
| Turkey - 0.3% | |||
| Bim Birlesik Magazalar A/S JSC | 958,000 | 5,994,462 | |
| United Kingdom - 0.6% | |||
| Helios Towers PLC (a) | 1,294,703 | 1,627,061 | |
| Prudential PLC | 983,798 | 9,629,056 | |
TOTAL UNITED KINGDOM | 11,256,117 | ||
| United States of America - 1.8% | |||
| Airbnb, Inc. Class A (a) | 14,600 | 1,533,584 | |
| Dlocal Ltd. (a) | 140,268 | 2,878,299 | |
| FirstCash Holdings, Inc. | 125,672 | 9,218,041 | |
| Legend Biotech Corp. ADR (a) | 34,226 | 1,396,421 | |
| Li Auto, Inc. ADR (a) | 358,099 | 8,239,858 | |
| Marvell Technology, Inc. | 31,142 | 1,336,303 | |
| MercadoLibre, Inc. (a) | 2,900 | 2,400,562 | |
| NVIDIA Corp. | 9,344 | 1,134,268 | |
| Snap, Inc. Class A (a) | 307,168 | 3,016,390 | |
TOTAL UNITED STATES OF AMERICA | 31,153,726 | ||
| TOTAL COMMON STOCKS (Cost $1,903,784,749) | 1,676,494,841 | ||
| Preferred Stocks - 3.5% | |||
| Shares | Value ($) | ||
| Convertible Preferred Stocks - 0.5% | |||
| Cayman Islands - 0.1% | |||
| Creditas Financial Solutions Ltd. Series F (d)(e) | 4,374 | 1,433,841 | |
| China - 0.3% | |||
| ByteDance Ltd. Series E1 (a)(d)(e) | 30,246 | 5,045,033 | |
| dMed Biopharmaceutical Co. Ltd. Series C (a)(d)(e) | 52,588 | 471,714 | |
| 5,516,747 | |||
| India - 0.1% | |||
| Meesho Series F (a)(d)(e) | 33,863 | 2,272,207 | |
TOTAL CONVERTIBLE PREFERRED STOCKS | 9,222,795 | ||
| Nonconvertible Preferred Stocks - 3.0% | |||
| Brazil - 2.6% | |||
| Ambev SA sponsored ADR | 5,392,100 | 15,259,643 | |
| Companhia de Transmissao de Energia Eletrica Paulista (PN) | 555,500 | 2,365,407 | |
| Metalurgica Gerdau SA (PN) | 4,547,800 | 8,928,083 | |
| Petroleo Brasileiro SA - Petrobras: | |||
| (PN) sponsored ADR (non-vtg.) | 964,300 | 10,684,444 | |
| sponsored ADR | 761,000 | 9,390,740 | |
| 46,628,317 | |||
| Korea (South) - 0.3% | |||
| Hyundai Motor Co. Series 2 | 81,923 | 4,725,544 | |
| United States of America - 0.1% | |||
| Gupshup, Inc. (a)(d)(e) | 44,950 | 842,363 | |
TOTAL NONCONVERTIBLE PREFERRED STOCKS | 52,196,224 | ||
| TOTAL PREFERRED STOCKS (Cost $57,060,428) | 61,419,019 | ||
| Money Market Funds - 1.8% | |||
| Shares | Value ($) | ||
| Fidelity Cash Central Fund 3.10% (f) | 23,151,395 | 23,156,025 | |
| Fidelity Securities Lending Cash Central Fund 3.10% (f)(g) | 9,614,817 | 9,615,779 | |
| TOTAL MONEY MARKET FUNDS (Cost $32,771,421) | 32,771,804 | ||
| TOTAL INVESTMENT IN SECURITIES - 99.9% (Cost $1,993,616,598) | 1,770,685,664 |
NET OTHER ASSETS (LIABILITIES) - 0.1% | 1,378,312 |
| NET ASSETS - 100.0% | 1,772,063,976 |
| (a) | Non-income producing |
| (b) | Security exempt from registration under Rule 144A of the Securities Act of 1933. These securities may be resold in transactions exempt from registration, normally to qualified institutional buyers. At the end of the period, the value of these securities amounted to $102,994,112 or 5.8% of net assets. |
| (c) | Security or a portion of the security is on loan at period end. |
| (d) | Restricted securities (including private placements) - Investment in securities not registered under the Securities Act of 1933 (excluding 144A issues). At the end of the period, the value of restricted securities (excluding 144A issues) amounted to $10,820,130 or 0.6% of net assets. |
| (e) | Level 3 security |
| (f) | Affiliated fund that is generally available only to investment companies and other accounts managed by Fidelity Investments. The rate quoted is the annualized seven-day yield of the fund at period end. A complete unaudited listing of the fund's holdings as of its most recent quarter end is available upon request. In addition, each Fidelity Central Fund's financial statements, which are not covered by the Fund's Report of Independent Registered Public Accounting Firm, are available on the SEC's website or upon request. |
| (g) | Investment made with cash collateral received from securities on loan. |
| Additional information on each restricted holding is as follows: | ||
| Security | Acquisition Date | Acquisition Cost ($) |
| Ant International Co. Ltd. Class C | 5/16/18 | 1,663,286 |
| ByteDance Ltd. Series E1 | 11/18/20 | 3,314,181 |
| Creditas Financial Solutions Ltd. Series F | 1/28/22 | 1,377,733 |
| dMed Biopharmaceutical Co. Ltd. Series C | 12/01/20 | 746,915 |
| Gupshup, Inc. | 6/08/21 | 1,027,791 |
| Meesho Series F | 9/21/21 | 2,596,355 |
| Affiliate | Value, beginning of period ($) | Purchases ($) | Sales Proceeds ($) | Dividend Income ($) | Realized Gain (loss) ($) | Change in Unrealized appreciation (depreciation) ($) | Value, end of period ($) | %ownership, end of period |
| Fidelity Cash Central Fund 3.10% | 20,872,933 | 1,374,660,995 | 1,372,377,902 | 300,753 | - | (1) | 23,156,025 | 0.0% |
| Fidelity Securities Lending Cash Central Fund 3.10% | 19,520,703 | 248,393,900 | 258,298,824 | 167,099 | - | - | 9,615,779 | 0.0% |
| Total | 40,393,636 | 1,623,054,895 | 1,630,676,726 | 467,852 | - | (1) | 32,771,804 | |
| Valuation Inputs at Reporting Date: | ||||
| Description | Total ($) | Level 1 ($) | Level 2 ($) | Level 3 ($) |
Investments in Securities: | ||||
| Equities: | ||||
Communication Services | 145,573,659 | 44,214,099 | 99,727,477 | 1,632,083 |
Consumer Discretionary | 268,440,053 | 111,971,470 | 156,333,511 | 135,072 |
Consumer Staples | 112,017,281 | 69,384,608 | 42,538,676 | 93,997 |
Energy | 85,690,017 | 72,941,724 | 12,507,709 | 240,584 |
Financials | 386,868,090 | 219,654,286 | 163,983,715 | 3,230,089 |
Health Care | 65,583,479 | 28,625,346 | 36,486,419 | 471,714 |
Industrials | 96,783,581 | 77,523,964 | 19,259,617 | - |
Information Technology | 333,778,211 | 84,965,969 | 240,652,639 | 8,159,603 |
Materials | 155,524,372 | 114,108,472 | 41,405,667 | 10,233 |
Real Estate | 27,388,097 | 15,707,072 | 11,671,230 | 9,795 |
Utilities | 60,267,020 | 40,334,905 | 19,932,115 | - |
| Money Market Funds | 32,771,804 | 32,771,804 | - | - |
| Total Investments in Securities: | 1,770,685,664 | 912,203,719 | 844,498,775 | 13,983,170 |
| Investments in Securities: | |||
| Equities - Communication Services | |||
| Beginning Balance | $ | - | |
| Net Realized Gain (Loss) on Investment Securities | (1,546,774) | ||
| Net Unrealized Gain (Loss) on Investment Securities | (29,080,291) | ||
| Cost of Purchases | 13,220,473 | ||
| Proceeds of Sales | (3,116,261) | ||
| Amortization/Accretion | - | ||
| Transfers into Level 3 | 22,154,936 | ||
| Transfers out of Level 3 | - | ||
| Ending Balance | $ | 1,632,083 | |
| The change in unrealized gain (loss) for the period attributable to Level 3 securities held at September 30, 2022 | $ | (29,080,291) | |
| Equities - Energy | |||
| Beginning Balance | $ | - | |
| Net Realized Gain (Loss) on Investment Securities | (866,663) | ||
| Net Unrealized Gain (Loss) on Investment Securities | (36,603,549) | ||
| Cost of Purchases | 13,011,358 | ||
| Proceeds of Sales | (8,717,898) | ||
| Amortization/Accretion | - | ||
| Transfers into Level 3 | 33,417,336 | ||
| Transfers out of Level 3 | - | ||
| Ending Balance | $ | 240,584 | |
| The change in unrealized gain (loss) for the period attributable to Level 3 securities held at September 30, 2022 | $ | (36,603,549) | |
| Equities - Financials | |||
| Beginning Balance | $ | 2,075,772 | |
| Net Realized Gain (Loss) on Investment Securities | (272,530) | ||
| Net Unrealized Gain (Loss) on Investment Securities | (54,286,722) | ||
| Cost of Purchases | 12,258,558 | ||
| Proceeds of Sales | (1,401,537) | ||
| Amortization/Accretion | - | ||
| Transfers into Level 3 | 44,856,548 | ||
| Transfers out of Level 3 | - | ||
| Ending Balance | $ | 3,230,089 | |
| The change in unrealized gain (loss) for the period attributable to Level 3 securities held at September 30, 2022 | $ | (54,286,722) | |
| Other Investments in Securities | |||
| Beginning Balance | $ | 7,931,354 | |
| Net Realized Gain (Loss) on Investment Securities | (37,970) | ||
| Net Unrealized Gain (Loss) on Investment Securities | (23,576,384) | ||
| Cost of Purchases | 15,682,683 | ||
| Proceeds of Sales | (439,080) | ||
| Amortization/Accretion | - | ||
| Transfers into Level 3 | 9,319,811 | ||
| Transfers out of Level 3 | - | ||
| Ending Balance | $ | 8,880,414 | |
| The change in unrealized gain (loss) for the period attributable to Level 3 securities held at September 30, 2022 | $ | (23,576,384) | |
| The information used in the above reconciliation represents fiscal year to date activity for any Investments in Securities identified as using Level 3 inputs at either the beginning or the end of the current fiscal period. Cost of purchases and proceeds of sales may include securities received and/or delivered through in-kind transactions. Transfers into Level 3 were attributable to a lack of observable market data resulting from decreases in market activity, decreases in liquidity, security restructurings or corporate actions. Transfers out of Level 3 were attributable to observable market data becoming available for those securities. Transfers in or out of Level 3 represent the beginning value of any Security or Instrument where a change in the pricing level occurred from the beginning to the end of the period. The cost of purchases and the proceeds of sales may include securities received or delivered through corporate actions or exchanges. Realized and unrealized gains (losses) disclosed in the reconciliation are included in Net Gain (Loss) on the Fund's Statement of Operations. | |||
| Statement of Assets and Liabilities | ||||
| September 30, 2022 | ||||
| Assets | ||||
| Investment in securities, at value (including securities loaned of $9,304,082) - See accompanying schedule: | $ | |||
Unaffiliated issuers (cost $1,960,845,177) | $1,737,913,860 | |||
Fidelity Central Funds (cost $32,771,421) | 32,771,804 | |||
| Total Investment in Securities (cost $1,993,616,598) | $ | 1,770,685,664 | ||
| Foreign currency held at value (cost $9,160,695) | 8,639,169 | |||
| Receivable for investments sold | 9,356,178 | |||
| Receivable for fund shares sold | 7,280 | |||
| Dividends receivable | 2,860,969 | |||
| Distributions receivable from Fidelity Central Funds | 76,260 | |||
| Other receivables | 157,786 | |||
Total assets | 1,791,783,306 | |||
| Liabilities | ||||
| Payable to custodian bank | $1,243,553 | |||
| Payable for investments purchased | 3,888,204 | |||
| Payable for fund shares redeemed | 1,559,934 | |||
| Deferred taxes | 3,199,596 | |||
| Other payables and accrued expenses | 212,592 | |||
| Collateral on securities loaned | 9,615,451 | |||
| Total Liabilities | 19,719,330 | |||
| Net Assets | $ | 1,772,063,976 | ||
| Net Assets consist of: | ||||
| Paid in capital | $ | 2,082,331,390 | ||
| Total accumulated earnings (loss) | (310,267,414) | |||
| Net Assets | $ | 1,772,063,976 | ||
Net Asset Value , offering price and redemption price per share ($1,772,063,976 ÷ 10,520,598 shares) | $ | 168.44 | ||
| Statement of Operations | ||||
Year ended September 30, 2022 | ||||
| Investment Income | ||||
| Dividends | $ | 51,156,186 | ||
| Non-Cash dividends | 4,859,470 | |||
| Income from Fidelity Central Funds (including $167,099 from security lending) | 467,852 | |||
| Income before foreign taxes withheld | 56,483,508 | |||
| Less foreign taxes withheld | (5,937,574) | |||
| Total Income | 50,545,934 | |||
| Expenses | ||||
| Custodian fees and expenses | 384,418 | |||
| Independent trustees' fees and expenses | 6,553 | |||
| Interest | 1,022 | |||
| Miscellaneous | 15 | |||
| Total Expenses | 392,008 | |||
| Net Investment income (loss) | 50,153,926 | |||
| Realized and Unrealized Gain (Loss) | ||||
| Net realized gain (loss) on: | ||||
| Investment Securities: | ||||
| Unaffiliated issuers(net of foreign taxes of $2,824,524) | (66,845,203) | |||
| Foreign currency transactions | (1,046,235) | |||
| Futures contracts | (2,523,785) | |||
| Total net realized gain (loss) | (70,415,223) | |||
| Change in net unrealized appreciation (depreciation) on: | ||||
| Investment Securities: | ||||
| Unaffiliated issuers (net of decrease in deferred foreign taxes of $6,791,442) | (732,019,116) | |||
| Fidelity Central Funds | (1) | |||
| Assets and liabilities in foreign currencies | (578,438) | |||
| Futures contracts | 255,884 | |||
| Total change in net unrealized appreciation (depreciation) | (732,341,671) | |||
| Net gain (loss) | (802,756,894) | |||
| Net increase (decrease) in net assets resulting from operations | $ | (752,602,968) | ||
| Statement of Changes in Net Assets | ||||
Year ended September 30, 2022 | Year ended September 30, 2021 | |||
| Increase (Decrease) in Net Assets | ||||
| Operations | ||||
| Net investment income (loss) | $ | 50,153,926 | $ | 41,983,936 |
| Net realized gain (loss) | (70,415,223) | 175,236,762 | ||
| Change in net unrealized appreciation (depreciation) | (732,341,671) | 193,320,841 | ||
| Net increase (decrease) in net assets resulting from operations | (752,602,968) | 410,541,539 | ||
| Distributions to shareholders | (175,351,726) | (39,322,546) | ||
| Affiliated share transactions | ||||
| Proceeds from sales of shares | 889,582,434 | 266,859,195 | ||
| Reinvestment of distributions | 175,351,726 | 39,322,546 | ||
| Cost of shares redeemed | (267,629,838) | (761,493,626) | ||
Net increase (decrease) in net assets resulting from share transactions | 797,304,322 | (455,311,885) | ||
| Total increase (decrease) in net assets | (130,650,372) | (84,092,892) | ||
| Net Assets | ||||
| Beginning of period | 1,902,714,348 | 1,986,807,240 | ||
| End of period | $ | 1,772,063,976 | $ | 1,902,714,348 |
| Other Information | ||||
| Shares | ||||
| Sold | 4,216,200 | 918,516 | ||
| Issued in reinvestment of distributions | 743,918 | 136,548 | ||
| Redeemed | (1,290,658) | (2,582,041) | ||
| Net increase (decrease) | 3,669,460 | (1,526,977) | ||
| Fidelity® Emerging Markets Equity Central Fund |
| Years ended September 30, | 2022 | 2021 | 2020 | 2019 | 2018 | |||||
Selected Per-Share Data | ||||||||||
| Net asset value, beginning of period | $ | 277.72 | $ | 237.14 | $ | 210.61 | $ | 220.61 | $ | 246.26 |
| Income from Investment Operations | ||||||||||
Net investment income (loss) A,B | 5.84 | 5.06 | 3.85 | 7.79 C | 5.11 | |||||
| Net realized and unrealized gain (loss) | (90.17) | 40.55 | 28.57 | 1.52 | (14.13) | |||||
| Total from investment operations | (84.33) | 45.61 | 32.42 | 9.31 | (9.02) | |||||
| Distributions from net investment income | (6.45) | (5.03) | (5.52) | (4.54) | (4.95) | |||||
| Distributions from net realized gain | (18.50) | - | (.37) | (14.76) | (11.68) | |||||
| Total distributions | (24.95) | (5.03) | (5.89) | (19.31) D | (16.63) | |||||
| Net asset value, end of period | $ | 168.44 | $ | 277.72 | $ | 237.14 | $ | 210.61 | $ | 220.61 |
Total Return E | (32.96)% | 19.17% | 15.71% | 5.22% | (4.20)% | |||||
Ratios to Average Net Assets B,F,G | ||||||||||
| Expenses before reductions | .02% | .03% | .05% | .06% | .07% | |||||
| Expenses net of fee waivers, if any | .02% | .03% | .05% | .06% | .07% | |||||
| Expenses net of all reductions | .02% | .03% | .05% | .06% | .07% | |||||
| Net investment income (loss) | 2.68% | 1.74% | 1.76% | 3.73% C | 2.07% | |||||
| Supplemental Data | ||||||||||
| Net assets, end of period (000 omitted) | $ | 1,772,064 | $ | 1,902,714 | $ | 1,986,807 | $ | 1,779,865 | $ | 663,813 |
Portfolio turnover rate H | 58% | 68% | 50% | 60% | 65% |
| Fidelity Central Fund | Investment Manager | Investment Objective | Investment Practices | Expense Ratio A |
| Fidelity Money Market Central Funds | Fidelity Management & Research Company LLC (FMR) | Each fund seeks to obtain a high level of current income consistent with the preservation of capital and liquidity. | Short-term Investments | Less than .005% |
| Gross unrealized appreciation | $ 223,669,553 |
| Gross unrealized depreciation | (483,075,234) |
| Net unrealized appreciation (depreciation) | $(259,405,681) |
| Tax Cost | $2,030,091,345 |
| Undistributed ordinary income | $11,946,562 |
| Net unrealized appreciation (depreciation) on securities and other investments | $(260,187,966) |
| September 30, 2022 | September 30, 2021 | |
| Ordinary Income | $ 51,459,061 | $ 39,322,546 |
| Long-term Capital Gains | 123,892,665 | - |
| Total | $ 175,351,726 | $ 39,322,546 |
| Equity Risk | Equity risk relates to the fluctuations in the value of financial instruments as a result of changes in market prices (other than those arising from interest rate risk or foreign exchange risk), whether caused by factors specific to an individual investment, its issuer, or all factors affecting all instruments traded in a market or market segment. |
| Purchases ($) | Sales ($) | |
| Fidelity Emerging Markets Equity Central Fund | 1,725,675,712 | 1,070,772,514 |
| Amount | |
| Fidelity Emerging Markets Equity Central Fund | $ 11,976 |
| Borrower or Lender | Average Loan Balance | Weighted Average Interest Rate | Interest Expense | |
Fidelity Emerging Markets Equity Central Fund | Borrower | $ 10,595,167 | .58% | $ 1,022 |
| Purchases ($) | Sales ($) | Realized Gain (Loss) ($) | |
| Fidelity Emerging Markets Equity Central Fund | 52,544,126 | 19,277,604 | (6,178,245) |
| Amount ($) | |
| Fidelity Emerging Markets Equity Central Fund | 5,370 |
| Total Security Lending Fees Paid to NFS | Security Lending Income From Securities Loaned to NFS | Value of Securities Loaned to NFS at Period End | |
| Fidelity Emerging Markets Equity Central Fund | $ 17,465 | $ 30 | $- |
| The Example is based on an investment of $1,000 invested at the beginning of the period and held for the entire period (April 1, 2022 to September 30, 2022). |
Annualized Expense Ratio- A | Beginning Account Value April 1, 2022 | Ending Account Value September 30, 2022 | Expenses Paid During Period- C April 1, 2022 to September 30, 2022 | |||||||
| Fidelity® Emerging Markets Equity Central Fund | .0194% | |||||||||
| Actual | $ 1,000 | $ 788.90 | $ .09 | |||||||
Hypothetical- B | $ 1,000 | $ 1,024.97 | $ .10 | |||||||
| December | 0% |
| March | - |
| June | - |
| September | 1% |
| December | 29% |
| March | - |
| June | - |
| September | 100% |
|


Contents
| Average Annual Total Returns | |||
Periods ended September 30, 2022 | Past 1 year | Past 5 years | Life of Fund A |
| Fidelity® Real Estate Equity Central Fund | -19.44% | 3.49% | 4.71% |
| $10,000 Over Life of Fund |
Let's say hypothetically that $10,000 was invested in Fidelity® Real Estate Equity Central Fund, on November 03, 2014, when the fund started. The chart shows how the value of your investment would have changed, and also shows how the S&P 500® Index performed over the same period. |
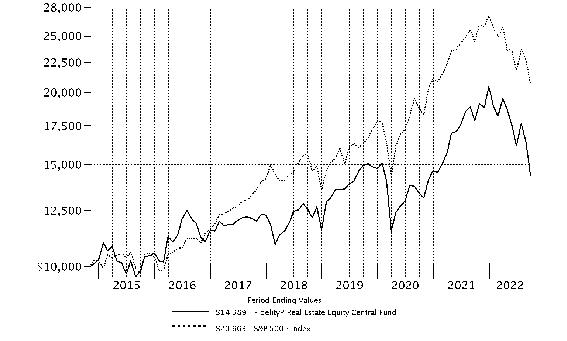 |
Top Holdings (% of Fund's net assets) | ||
| Prologis (REIT), Inc. | 9.0 | |
| Equinix, Inc. | 8.4 | |
| CubeSmart | 7.3 | |
| Mid-America Apartment Communities, Inc. | 5.7 | |
| Ventas, Inc. | 5.2 | |
| Essex Property Trust, Inc. | 5.0 | |
| Equity Lifestyle Properties, Inc. | 4.3 | |
| Invitation Homes, Inc. | 4.0 | |
| Alexandria Real Estate Equities, Inc. | 3.5 | |
| UDR, Inc. | 3.4 | |
| 55.8 | ||
| Market Sectors (% of Fund's net assets) | ||
| REITs - Apartments | 18.1 | |
| REITs - Diversified | 16.9 | |
| REITs - Warehouse/Industrial | 13.2 | |
| REITs - Health Care | 10.8 | |
| REITs - Storage | 10.7 | |
Asset Allocation (% of Fund's net assets) |
 |
| Common Stocks - 98.6% | |||
| Shares | Value ($) | ||
| Commercial Services & Supplies - 0.8% | |||
| REITs - Diversified - 0.8% | |||
| CoreCivic, Inc. (a) | 878,000 | 7,761,520 | |
| Equity Real Estate Investment Trusts (REITs) - 94.5% | |||
| REITs - Apartments - 18.1% | |||
| Essex Property Trust, Inc. | 199,219 | 48,256,818 | |
| Invitation Homes, Inc. | 1,150,204 | 38,842,389 | |
| Mid-America Apartment Communities, Inc. | 359,500 | 55,747,665 | |
| UDR, Inc. | 794,982 | 33,158,699 | |
| 176,005,571 | |||
| REITs - Diversified - 16.1% | |||
| Crown Castle International Corp. | 95,000 | 13,732,250 | |
| Duke Realty Corp. | 605,300 | 29,175,460 | |
| Equinix, Inc. | 143,238 | 81,479,504 | |
| VICI Properties, Inc. | 1,097,331 | 32,755,330 | |
| 157,142,544 | |||
| REITs - Health Care - 10.8% | |||
| CareTrust (REIT), Inc. | 783,600 | 14,190,996 | |
| Healthcare Trust of America, Inc. | 347,100 | 7,237,035 | |
| Ventas, Inc. | 1,262,394 | 50,710,367 | |
| Welltower Op | 508,466 | 32,704,533 | |
| 104,842,931 | |||
| REITs - Hotels - 4.7% | |||
| RLJ Lodging Trust | 1,639,567 | 16,592,418 | |
| Ryman Hospitality Properties, Inc. (a)(b) | 399,200 | 29,377,128 | |
| 45,969,546 | |||
| REITs - Management/Investment - 1.1% | |||
| LXP Industrial Trust (REIT) | 1,183,837 | 10,843,947 | |
| REITs - Manufactured Homes - 4.3% | |||
| Equity Lifestyle Properties, Inc. | 673,900 | 42,347,876 | |
| REITs - Office Property - 4.8% | |||
| Alexandria Real Estate Equities, Inc. | 238,880 | 33,488,587 | |
| Douglas Emmett, Inc. | 722,562 | 12,955,537 | |
| 46,444,124 | |||
| REITs - Shopping Centers - 5.3% | |||
| Phillips Edison & Co., Inc. (b) | 436,400 | 12,241,020 | |
| SITE Centers Corp. | 2,046,600 | 21,919,086 | |
| Urban Edge Properties | 1,319,400 | 17,600,796 | |
| 51,760,902 | |||
| REITs - Single Tenant - 5.4% | |||
| Four Corners Property Trust, Inc. | 1,092,600 | 26,429,994 | |
| Spirit Realty Capital, Inc. | 734,300 | 26,552,288 | |
| 52,982,282 | |||
| REITs - Storage - 10.7% | |||
| CubeSmart | 1,767,619 | 70,810,817 | |
| Public Storage | 112,900 | 33,058,249 | |
| 103,869,066 | |||
| REITs - Warehouse/Industrial - 13.2% | |||
| EastGroup Properties, Inc. | 162,600 | 23,469,684 | |
| Prologis (REIT), Inc. | 858,521 | 87,225,734 | |
| Terreno Realty Corp. (b) | 328,616 | 17,413,362 | |
| 128,108,780 | |||
TOTAL EQUITY REAL ESTATE INVESTMENT TRUSTS (REITS) | 920,317,569 | ||
| Hotels, Restaurants & Leisure - 0.6% | |||
| Casinos & Gaming - 0.6% | |||
| Caesars Entertainment, Inc. (a) | 183,610 | 5,923,259 | |
| IT Services - 0.7% | |||
| Internet Services & Infrastructure - 0.7% | |||
| Cyxtera Technologies, Inc. Class A (a)(b) | 1,602,327 | 6,537,494 | |
| Real Estate Management & Development - 2.0% | |||
| Real Estate Operating Companies - 0.6% | |||
| WeWork, Inc. (a)(b) | 2,132,100 | 5,650,065 | |
| Real Estate Services - 1.4% | |||
| CBRE Group, Inc. (a) | 200,400 | 13,529,004 | |
TOTAL REAL ESTATE MANAGEMENT & DEVELOPMENT | 19,179,069 | ||
| TOTAL COMMON STOCKS (Cost $997,152,843) | 959,718,911 | ||
| Money Market Funds - 3.5% | |||
| Shares | Value ($) | ||
| Fidelity Cash Central Fund 3.10% (c) | 11,881,309 | 11,883,685 | |
| Fidelity Securities Lending Cash Central Fund 3.10% (c)(d) | 21,867,480 | 21,869,667 | |
| TOTAL MONEY MARKET FUNDS (Cost $33,753,352) | 33,753,352 | ||
| TOTAL INVESTMENT IN SECURITIES - 102.1% (Cost $1,030,906,195) | 993,472,263 |
NET OTHER ASSETS (LIABILITIES) - (2.1)% | (20,017,703) |
| NET ASSETS - 100.0% | 973,454,560 |
| (a) | Non-income producing |
| (b) | Security or a portion of the security is on loan at period end. |
| (c) | Affiliated fund that is generally available only to investment companies and other accounts managed by Fidelity Investments. The rate quoted is the annualized seven-day yield of the fund at period end. A complete unaudited listing of the fund's holdings as of its most recent quarter end is available upon request. In addition, each Fidelity Central Fund's financial statements, which are not covered by the Fund's Report of Independent Registered Public Accounting Firm, are available on the SEC's website or upon request. |
| (d) | Investment made with cash collateral received from securities on loan. |
| Affiliate | Value, beginning of period ($) | Purchases ($) | Sales Proceeds ($) | Dividend Income ($) | Realized Gain (loss) ($) | Change in Unrealized appreciation (depreciation) ($) | Value, end of period ($) | %ownership, end of period |
| Fidelity Cash Central Fund 3.10% | 10,552,502 | 483,934,790 | 482,603,607 | 61,288 | - | - | 11,883,685 | 0.0% |
| Fidelity Securities Lending Cash Central Fund 3.10% | 54,870,675 | 347,051,432 | 380,052,440 | 518,489 | - | - | 21,869,667 | 0.1% |
| Total | 65,423,177 | 830,986,222 | 862,656,047 | 579,777 | - | - | 33,753,352 | |
| Valuation Inputs at Reporting Date: | ||||
| Description | Total ($) | Level 1 ($) | Level 2 ($) | Level 3 ($) |
Investments in Securities: | ||||
| Common Stocks | 959,718,911 | 959,718,911 | - | - |
| Money Market Funds | 33,753,352 | 33,753,352 | - | - |
| Total Investments in Securities: | 993,472,263 | 993,472,263 | - | - |
| Statement of Assets and Liabilities | ||||
| September 30, 2022 | ||||
| Assets | ||||
| Investment in securities, at value (including securities loaned of $21,042,674) - See accompanying schedule: | $ | |||
Unaffiliated issuers (cost $997,152,843) | $959,718,911 | |||
Fidelity Central Funds (cost $33,753,352) | 33,753,352 | |||
| Total Investment in Securities (cost $1,030,906,195) | $ | 993,472,263 | ||
| Receivable for fund shares sold | 37,975,839 | |||
| Dividends receivable | 4,703,378 | |||
| Distributions receivable from Fidelity Central Funds | 44,564 | |||
Total assets | 1,036,196,044 | |||
| Liabilities | ||||
| Payable for investments purchased | $40,651,308 | |||
| Payable for fund shares redeemed | 212,998 | |||
| Other payables and accrued expenses | 7,511 | |||
| Collateral on securities loaned | 21,869,667 | |||
| Total Liabilities | 62,741,484 | |||
| Net Assets | $ | 973,454,560 | ||
| Net Assets consist of: | ||||
| Paid in capital | $ | 1,063,122,683 | ||
| Total accumulated earnings (loss) | (89,668,123) | |||
| Net Assets | $ | 973,454,560 | ||
Net Asset Value , offering price and redemption price per share ($973,454,560 ÷ 8,757,850 shares) | $ | 111.15 | ||
| Statement of Operations | ||||
Year ended September 30, 2022 | ||||
| Investment Income | ||||
| Dividends | $ | 35,490,471 | ||
| Income from Fidelity Central Funds (including $518,489 from security lending) | 579,777 | |||
| Total Income | 36,070,248 | |||
| Expenses | ||||
| Custodian fees and expenses | 30,395 | |||
| Independent trustees' fees and expenses | 5,369 | |||
| Interest | 15,307 | |||
| Miscellaneous | 16 | |||
| Total expenses before reductions | 51,087 | |||
| Expense reductions | (207) | |||
| Total expenses after reductions | 50,880 | |||
| Net Investment income (loss) | 36,019,368 | |||
| Realized and Unrealized Gain (Loss) | ||||
| Net realized gain (loss) on: | ||||
| Investment Securities: | ||||
| Unaffiliated issuers | 37,104,328 | |||
| Total net realized gain (loss) | 37,104,328 | |||
| Change in net unrealized appreciation (depreciation) on investment securities | (330,048,765) | |||
| Net gain (loss) | (292,944,437) | |||
| Net increase (decrease) in net assets resulting from operations | $ | (256,925,069) | ||
| Statement of Changes in Net Assets | ||||
Year ended September 30, 2022 | Year ended September 30, 2021 | |||
| Increase (Decrease) in Net Assets | ||||
| Operations | ||||
| Net investment income (loss) | $ | 36,019,368 | $ | 32,492,044 |
| Net realized gain (loss) | 37,104,328 | 23,174,038 | ||
| Change in net unrealized appreciation (depreciation) | (330,048,765) | 289,107,046 | ||
| Net increase (decrease) in net assets resulting from operations | (256,925,069) | 344,773,128 | ||
| Distributions to shareholders | (31,677,620) | (26,089,180) | ||
| Affiliated share transactions | ||||
| Proceeds from sales of shares | 388,385,226 | 702,838,441 | ||
| Reinvestment of distributions | 31,677,620 | 26,089,180 | ||
| Cost of shares redeemed | (790,606,931) | (115,080,816) | ||
Net increase (decrease) in net assets resulting from share transactions | (370,544,085) | 613,846,805 | ||
| Total increase (decrease) in net assets | (659,146,774) | 932,530,753 | ||
| Net Assets | ||||
| Beginning of period | 1,632,601,334 | 700,070,581 | ||
| End of period | $ | 973,454,560 | $ | 1,632,601,334 |
| Other Information | ||||
| Shares | ||||
| Sold | 2,712,126 | 5,716,656 | ||
| Issued in reinvestment of distributions | 225,421 | 197,926 | ||
| Redeemed | (5,758,378) | (812,484) | ||
| Net increase (decrease) | (2,820,831) | 5,102,098 | ||
| Fidelity® Real Estate Equity Central Fund |
| Years ended September 30, | 2022 | 2021 | 2020 | 2019 | 2018 | |||||
Selected Per-Share Data | ||||||||||
| Net asset value, beginning of period | $ | 141.00 | $ | 108.09 | $ | 124.43 | $ | 109.73 | $ | 112.82 |
| Income from Investment Operations | ||||||||||
Net investment income (loss) A,B | 3.36 | 3.33 | 3.43 | 3.92 | 3.84 | |||||
| Net realized and unrealized gain (loss) | (30.20) | 32.42 | (16.47) | 15.85 | .13 | |||||
| Total from investment operations | (26.84) | 35.75 | (13.04) | 19.77 | 3.97 | |||||
| Distributions from net investment income | (3.01) | (2.84) | (3.30) | (3.16) | (3.16) C | |||||
| Distributions from net realized gain | - | - | - | (1.91) | (3.90) C | |||||
| Total distributions | (3.01) | (2.84) | (3.30) | (5.07) | (7.06) | |||||
| Net asset value, end of period | $ | 111.15 | $ | 141.00 | $ | 108.09 | $ | 124.43 | $ | 109.73 |
Total Return D | (19.44)% | 33.38% | (10.48)% | 18.98% | 3.73% | |||||
Ratios to Average Net Assets A,E,F | ||||||||||
| Expenses before reductions | -% G | -% G | -% G | .01% | .01% | |||||
| Expenses net of fee waivers, if any | -% G | -% G | -% G | .01% | .01% | |||||
| Expenses net of all reductions | -% G | -% G | -% G | .01% | .01% | |||||
| Net investment income (loss) | 2.36% | 2.54% | 3.05% | 3.44% | 3.59% | |||||
| Supplemental Data | ||||||||||
| Net assets, end of period (000 omitted) | $ | 973,455 | $ | 1,632,601 | $ | 700,071 | $ | 453,902 | $ | 126,704 |
Portfolio turnover rate H | 56% | 28% | 84% I | 37% | 47% |
| Fidelity Central Fund | Investment Manager | Investment Objective | Investment Practices | Expense Ratio A |
| Fidelity Money Market Central Funds | Fidelity Management & Research Company LLC (FMR) | Each fund seeks to obtain a high level of current income consistent with the preservation of capital and liquidity. | Short-term Investments | Less than .005% |
| Gross unrealized appreciation | $ 74,693,840 |
| Gross unrealized depreciation | (119,220,801) |
| Net unrealized appreciation (depreciation) | $(44,526,961) |
| Tax Cost | $1,037,999,224 |
| Undistributed ordinary income | $5,166,261 |
| Capital loss carryforward | $(50,307,423) |
| Net unrealized appreciation (depreciation) on securities and other investments | $(44,526,961) |
| No expiration | |
| Short-term | $(50,307,423) |
| September 30, 2022 | September 30, 2021 | |
| Ordinary Income | $ 31,677,620 | $ 26,089,180 |
| Purchases ($) | Sales ($) | |
| Fidelity Real Estate Equity Central Fund | 844,947,725 | 1,204,512,025 |
| Amount | |
| Fidelity Real Estate Equity Central Fund | $ 14,854 |
| Borrower or Lender | Average Loan Balance | Weighted Average Interest Rate | Interest Expense | |
| Fidelity Real Estate Equity Central Fund | Borrower | $ 28,679,750 | .96% | $ 15,307 |
| Purchases ($) | Sales ($) | Realized Gain (Loss) ($) | |
| Fidelity Real Estate Equity Central Fund | 67,149,465 | 73,074,389 | (2,839,784) |
| Total Security Lending Fees Paid to NFS | Security Lending Income From Securities Loaned to NFS | Value of Securities Loaned to NFS at Period End | |
| Fidelity Real Estate Equity Central Fund | $ 55,882 | $ 20,326 | $- |
| The Example is based on an investment of $1,000 invested at the beginning of the period and held for the entire period (April 1, 2022 to September 30, 2022). |
Annualized Expense Ratio- A | Beginning Account Value April 1, 2022 | Ending Account Value September 30, 2022 | Expenses Paid During Period- C April 1, 2022 to September 30, 2022 | |||||||
| Fidelity® Real Estate Equity Central Fund | 0.0045% | |||||||||
| Actual | $ 1,000 | $ 738.80 | $ .02 | |||||||
Hypothetical- B | $ 1,000 | $ 1,025.05 | $ .02 | |||||||
|
Item 2.
Code of Ethics
As of the end of the period, September 30, 2022, Fidelity Central Investment Portfolios LLC (the trust) has adopted a code of ethics, as defined in Item 2 of Form N-CSR, that applies to its President and Treasurer and its Chief Financial Officer. A copy of the code of ethics is filed as an exhibit to this Form N-CSR.
Item 3.
Audit Committee Financial Expert
The Board of Trustees of the trust has determined that Donald F. Donahue is an audit committee financial expert, as defined in Item 3 of Form N-CSR. Mr. Donahue is independent for purposes of Item 3 of Form N-CSR.
Item 4.
Principal Accountant Fees and Services
Fees and Services
The following table presents fees billed by Deloitte & Touche LLP, the member firms of Deloitte Touche Tohmatsu, and their respective affiliates (collectively, “Deloitte Entities”) in each of the last two fiscal years for services rendered to Fidelity Emerging Markets Equity Central Fund, Fidelity Floating Rate Central Fund, Fidelity International Equity Central Fund, and Fidelity Real Estate Equity Central Fund (the “Fund(s)”):
Services Billed by Deloitte Entities
September 30, 2022 FeesA
Audit Fees | Audit-Related Fees | Tax Fees | All Other Fees | |
Fidelity Emerging Markets Equity Central Fund | $40,200 | $- | $10,300 | $1,000 |
Fidelity Floating Rate Central Fund | $75,700 | $- | $9,100 | $1,700 |
Fidelity International Equity Central Fund | $45,300 | $- | $10,300 | $1,100 |
Fidelity Real Estate Equity Central Fund | $37,900 | $- | $8,500 | $900 |
September 30, 2021 FeesA
Audit Fees | Audit-Related Fees | Tax Fees | All Other Fees | |
Fidelity Emerging Markets Equity Central Fund | $39,200 | $- | $10,000 | $1,000 |
Fidelity Floating Rate Central Fund | $73,800 | $- | $8,800 | $1,700 |
Fidelity International Equity Central Fund | $44,200 | $- | $10,000 | $1,100 |
Fidelity Real Estate Central Fund | $41,500 | $- | $8,100 | $900 |
A Amounts may reflect rounding.
The following table(s) present(s) fees billed by Deloitte Entities that were required to be approved by the Audit Committee for services that relate directly to the operations and financial reporting of the Fund(s) and that are rendered on behalf of Fidelity Management & Research Company LLC ("FMR") and entities controlling, controlled by, or under common control with FMR (not including any sub-adviser whose role is primarily portfolio management and is subcontracted with or overseen by another investment adviser) that provide ongoing services to the Fund(s) (“Fund Service Providers”):
Services Billed by Deloitte Entities
September 30, 2022A | September 30, 2021A | |
Audit-Related Fees | $- | $- |
Tax Fees | $- | $- |
All Other Fees | $- | $- |
A Amounts may reflect rounding.
“Audit-Related Fees” represent fees billed for assurance and related services that are reasonably related to the performance of the fund audit or the review of the fund's financial statements and that are not reported under Audit Fees.
“Tax Fees” represent fees billed for tax compliance, tax advice or tax planning that relate directly to the operations and financial reporting of the fund.
“All Other Fees” represent fees billed for services provided to the fund or Fund Service Provider, a significant portion of which are assurance related, that relate directly to the operations and financial reporting of the fund, excluding those services that are reported under Audit Fees, Audit-Related Fees or Tax Fees.
Assurance services must be performed by an independent public accountant.
* * *
The aggregate non-audit fees billed by Deloitte Entities for services rendered to the Fund(s), FMR (not including any sub-adviser whose role is primarily portfolio management and is subcontracted with or overseen by another investment adviser), and any Fund Service Provider for each of the last two fiscal years of the Fund(s) are as follows:
Billed By | September 30, 2022A | September 30, 2021A |
Deloitte Entities | $500,500 | $563,200 |
A Amounts may reflect rounding.
The trust's Audit Committee has considered non-audit services that were not pre-approved that were provided by Deloitte Entities to Fund Service Providers to be compatible with maintaining the independence of Deloitte Entities in its(their) audit of the Fund(s), taking into account representations from Deloitte Entities, in accordance with Public Company Accounting Oversight Board rules, regarding its independence from the Fund(s) and its(their) related entities and FMR’s review of the appropriateness and permissibility under applicable law of such non-audit services prior to their provision to the Fund(s) Service Providers.
Audit Committee Pre-Approval Policies and Procedures
The trust’s Audit Committee must pre-approve all audit and non-audit services provided by a fund’s independent registered public accounting firm relating to the operations or financial reporting of the fund. Prior to the commencement of any audit or non-audit services to a fund, the Audit Committee reviews the services to determine whether they are appropriate and permissible under applicable law.
The Audit Committee has adopted policies and procedures to, among other purposes, provide a framework for the Committee’s consideration of non-audit services by the audit firms that audit the Fidelity funds. The policies and procedures require that any non-audit service provided by a fund audit firm to a Fidelity fund and any non-audit service provided by a fund auditor to a Fund Service Provider that relates directly to the operations and financial reporting of a Fidelity fund (“Covered Service”) are subject to approval by the Audit Committee before such service is provided.
All Covered Services must be approved in advance of provision of the service either: (i) by formal resolution of the Audit Committee, or (ii) by oral or written approval of the service by the Chair of the Audit Committee (or if the Chair is unavailable, such other member of the Audit Committee as may be designated by the Chair to act in the Chair’s absence). The approval contemplated by (ii) above is permitted where the Treasurer determines that action on such an engagement is necessary before the next meeting of the Audit Committee.
Non-audit services provided by a fund audit firm to a Fund Service Provider that do not relate directly to the operations and financial reporting of a Fidelity fund are reported to the Audit Committee periodically.
Non-Audit Services Approved Pursuant to Rule 2-01(c)(7)(i)(C) and (ii) of Regulation S-X (“De Minimis Exception”)
There were no non-audit services approved or required to be approved by the Audit Committee pursuant to the De Minimis Exception during the Fund’s(s’) last two fiscal years relating to services provided to (i) the Fund(s) or (ii) any Fund Service Provider that relate directly to the operations and financial reporting of the Fund(s).
Item 5.
Audit Committee of Listed Registrants
Not applicable.
Item 6.
Investments
(a)
Not applicable.
(b)
Not applicable.
Item 7.
Disclosure of Proxy Voting Policies and Procedures for Closed-End Management Investment Companies
Not applicable.
Item 8.
Portfolio Managers of Closed-End Management Investment Companies
Not applicable.
Item 9.
Purchase of Equity Securities by Closed-End Management Investment Company and Affiliated Purchasers
Not applicable.
Item 10.
Submission of Matters to a Vote of Security Holders
There were no material changes to the procedures by which shareholders may recommend nominees to the trust’s Board of Trustees.
Item 11.
Controls and Procedures
(a)(i) The President and Treasurer and the Chief Financial Officer have concluded that the trust’s disclosure controls and procedures (as defined in Rule 30a-3(c) under the
Investment Company Act) provide reasonable assurances that material information relating to the trust is made known to them by the appropriate persons, based on their evaluation of these controls and procedures as of a date within 90 days of the filing date of this report.
(a)(ii) There was no change in the trust’s internal control over financial reporting (as defined in Rule 30a-3(d) under the Investment Company Act) that occurred during the period covered by this report that has materially affected, or is reasonably likely to materially affect, the trust’s internal control over financial reporting.
Item 12.
Disclosure of Securities Lending Activities for Closed-End Management
Investment Companies
Not applicable.
Item 13.
Exhibits
(a) | (1) | Code of Ethics pursuant to Item 2 of Form N-CSR is filed and attached hereto as EX-99.CODE ETH. |
(a) | (2) | |
(a) | (3) | Not applicable. |
(b) |
SIGNATURES
Pursuant to the requirements of the Securities Exchange Act of 1934 and the Investment Company Act of 1940, the registrant has duly caused this report to be signed on its behalf by the undersigned, thereunto duly authorized.
Fidelity Central Investment Portfolios LLC
By: | /s/Stacie M. Smith |
Stacie M. Smith | |
President and Treasurer | |
Date: | November 21, 2022 |
Pursuant to the requirements of the Securities Exchange Act of 1934 and the Investment Company Act of 1940, this report has been signed below by the following persons on behalf of the registrant and in the capacities and on the dates indicated.
By: | /s/Stacie M. Smith |
Stacie M. Smith | |
President and Treasurer | |
Date: | November 21, 2022 |
By: | /s/John J. Burke III |
John J. Burke III | |
Chief Financial Officer | |
Date: | November 21, 2022 |