UNITED STATES
SECURITIES AND EXCHANGE COMMISSION
Washington, D.C. 20549
FORM N-CSR
CERTIFIED SHAREHOLDER REPORT OF REGISTERED MANAGEMENT
INVESTMENT COMPANIES
Investment Company Act file number | 811-21668 |
|
Cohen & Steers Dividend Value Fund, Inc. |
(Exact name of registrant as specified in charter) |
|
280 Park Avenue, New York, NY | | 10017 |
(Address of principal executive offices) | | (Zip code) |
|
Adam M. Derechin
Cohen & Steers Capital Management, Inc.
280 Park Avenue
New York, New York 10017 |
(Name and address of agent for service) |
|
Registrant’s telephone number, including area code: | (212) 832-3232 | |
|
Date of fiscal year end: | February 28 | |
|
Date of reporting period: | February 28, 2006 | |
| | | | | | | | |
Item 1. Reports to Stockholders.
COHEN & STEERS DIVIDEND VALUE FUND, INC.
April 10, 2006
To Our Shareholders:
We are pleased to submit to you our report for Cohen & Steers Dividend Value Fund for the period August 31, 2005 (commencement of operations) through February 28, 2006. The net asset values per share at that date were $12.26, $12.23, and $12.27 for Class A, Class C, and Class I shares, respectively. In addition, dividends were declared for shareholders of record on March 23, 2006 and were paid on March 24, 2006 in the amounts per share for Class A, C and I shares of $0.035, $0.02, and $0.05, respectively.a
Shareholders should be aware that, effective February 1, 2006, Cohen & Steers Capital Management agreed through February 2007 to waive its fee and/or reimburse the fund for expenses incurred to the extent necessary to maintain the fund's operating expenses at 1.00% for Class A shares, 1.65% for Class C shares, and 0.65% for Class I shares. These limitations had previously been set at 1.50% for Class A shares, 2.15% for Class C shares, and 1.15% for Class I shares.
Investment Review
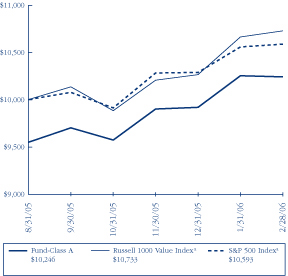
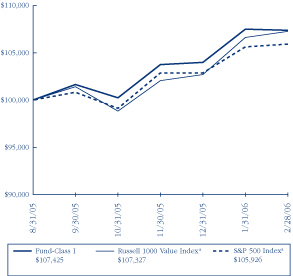
The total return, including income and change in net asset value, for Cohen & Steers Dividend Value Fund and the comparative benchmarks were:
| | | 8/31/05
(commencement
of operations)
through 2/28/06 | |
| Cohen and Steers Dividend Value Fund—Class A | | | 7.29 | % | |
| Cohen and Steers Dividend Value Fund—Class C | | | 6.96 | % | |
| Cohen and Steers Dividend Value Fund—Class I | | | 7.42 | % | |
| Russell 1000 Value Indexb | | | 7.33 | % | |
| S&P 500 Indexb | | | 5.92 | % | |
The performance data quoted represent past performance. Past performance is no guarantee of future results. The investment return and the principal value of an investment will fluctuate and shares, if redeemed, may be worth more or less than their original cost. Current performance may be lower or higher than the performance data quoted. Total returns of the fund current to the most recent month-end can be obtained by visiting our Web site at cohenandsteers.com. Performance does not include the effect of sales charges. If sales charges were included, returns would have been lower.
The asset mix of the fund as of February 28, 2006 consisted of 86.4% common stock (excluding real estate), 6.8% real estate equities and 6.8% cash.
a Please note that distributions paid by the fund to shareholders are subject to recharacterization for tax purposes. The final tax treatment of these distributions is reported to shareholders after the close of each calendar year.
b The Russell 1000 Value Index measures the performance of those Russell 1000 companies with lower price-to-book ratios and lower forecasted growth values. The S&P 500 Index is an unmanaged index of common stocks that is frequently used as a general measure of stock market performance.
1
COHEN & STEERS DIVIDEND VALUE FUND, INC.
Since the Fund's launch exactly six months ago, U.S. equity markets have been anything but placid. Economic, political and corporate events all served to temper share price gains in the broad equity markets. Nevertheless, the S&P 500 Index did finish the six-month period ended February 28, 2006 with a 5.9% total return. Record high oil prices, rising interest rates and an appreciating U.S. dollar over much of the period provided strong headwinds. Thus far in 2006, U.S. equities are up again, and, as in 2005, energy has been a primary driver of share price movements.
The economic sectors that comprise the S&P 500 Index produced widely divergent returns in 2005. Since the Fund's inception on August 31, 2005, the basic materials sector led the pack, climbing 15.5% on a total return basis, amid soaring global demand for raw materials, particularly from China and India. Rising global commodity prices followed this surge in demand, leading to a virtuous cycle of higher volumes, higher prices and higher margins for many companies in this sector.
Financial companies also did well since the Fund's inception, with a total return of 12.4%. Global economic growth coupled with measured increases in interest rates permitted financial companies around the world to boost profitability. Strong capital markets—both developed and emerging—led to an increase in security issuance and merger and acquisition activity, both very positive for a large number of banks, brokerage firms and wealth managers.
Real estate was the third best performing sector since the Fund's inception. The NAREIT Equity REIT Index returned 11.6% over this period in sharp defiance of perceptions among many investors that U.S.REITs had outperformed for too long and that rising interest rates would hurt U.S. REIT returns.
Long a moribund sector, telecommunications (9.6% return) awakened from an extended period of underperformance. Consolidation and services bundling have given some investors new hope for this sector, though competition from wireless and cable remains a concern.
Lagging sectors in the broader market since the Fund's inception include consumer cyclicals (0.7%), resulting from fears that a slowing economic cycle would hurt housing and consumption, and utilities (1.8%), which were chilled by rising interest rates and a correction in natural gas prices. Consumer staples (3.0%) were also left behind as investors turned to "growth" businesses late in 2005.
Of note, despite high volatility and notoriety in 2005, the energy sector posted sub-par returns (3.1%) for the period under review. The sector was battered from profit-taking as the factors that boosted the group earlier in 2005 subsided. Rising global demand, specifically from rapidly developing economics in China and India, continued turmoil in Iraq and new political threats posed by North Korea and Iran were key factors in boosting energy prices. Nevertheless, investors became concerned that current prices may not be sustainable, and many have reduced their holdings of energy companies.
Since inception, leading sectors in the Fund were basic materials (19.3% total return), consumer staples (15.5%) and financials (11.9%). Top-performing holdings included Monsanto (32.1%), up following strong
2
COHEN & STEERS DIVIDEND VALUE FUND, INC.
demand for its genetically modified seeds, Wal-Mart of Mexico (32.0%), posting gains as a result of the company's continuing efforts to consolidate the Mexican retail marketplace, and Cemex (29.6%), producing positive returns as a result of strong global demand for cement used in infrastructure construction. Financial companies Franklin Resources (28.0%) and ACE (26.7%) round out the list of top performers in the period.
Underperforming sectors included telecommunications (-17.6%), healthcare (0.6%) and utilities (1.0%). Specific holdings that detracted from performance included global telecom giant Vodafone (-27.8%), hurt by weak growth in several markets including Japan, chip-maker Intel (-19.3%), which fell due to weaker market share figures, and retail REIT Mills Company (-12.1%), down following concerns over the company's accounting and restructuring due to overly aggressive development plans. Healthcare companies Johnson & Johnson (-8.1%) and Smith & Nephew (-7.8%) declined on news that led investors to lower their growth expectations for most companies in this sector.
Investment Outlook
With little prospect of easing global political tensions, oil prices showing great resilience, and the expectation of two or more interest rate hikes by the Federal Reserve, it seems that equities face significant obstacles in the near-term. Moreover, the U.S. dollar's strength in 2005 only serves to make U.S. exports less competitive abroad.
However, silver linings are evident in these dark clouds. We believe the Fed is nearing the end of its series of interest rate hikes, and oil, even if it were to stabilize at current (lofty) levels, has not proven to be an "economy killer" thus far. Though interest rates are up, they remain at historically low levels. Finally, while the U.S. dollar has strengthened, it ended 2005 only about 3% stronger for the year—far too little to impede the foreign operations of America's largest global companies.
The good news is equity valuations, in general, are attractive. Currently, the S&P 500 trades at just over 15 times expected earnings—among its most attractive level in 10 years. The holdings in the Fund have produced weighted historical five-year growth rate for dividends in the mid-teens, and we forecast strong, double-digit dividend growth for most of these companies in 2006. The fact is, corporate cash flows and cash balances are very strong, suggesting adequate liquidity for investment, dividends, debt reduction, and even share repurchases where it makes economic sense.
3
COHEN & STEERS DIVIDEND VALUE FUND, INC.
Our outlook is premised on moderate global growth, and would change if inflation forced global interest rates sharply higher or global GDP growth were to stall, as such events could have a decidedly negative impact on the Fund's holdings. For now, we continue to find a diversified mix of good, long-term opportunities that meet our value requirements for attractive total returns. We remain fully invested and look forward to satisfactory relative returns in 2006.
Sincerely,
 | |  | |
|
| MARTIN COHEN | | ROBERT H. STEERS | |
|
| Co-chairman | | Co-chairman | |
|

RICHARD E. HELM
Portfolio Manager
The views and opinions in the preceding commentary are as of the date of publication and are subject to change. This material represents an assessment of the market environment at a specific point in time, should not be relied upon as investment advice and is not intended to predict or depict performance of any investment.
Visit Cohen & Steers online at cohenandsteers.com
For more information about any of our funds, visit cohenandsteers.com, where you'll find daily net asset values, fund fact sheets and portfolio highlights. You can also access newsletters, education tools and market updates covering REIT, utility and preferred securities sectors.
In addition, our Web site contains comprehensive information about our firm, including our most recent press releases, profiles of our senior investment professionals, and an overview or our investment approach.
4
COHEN & STEERS DIVIDEND VALUE FUND, INC.
Performance Review
Class A
Growth of a $10,000 Investment
Class C
Growth of a $10,000 Investment

Class I
Growth of a $100,000 Investment
5
COHEN & STEERS DIVIDEND VALUE FUND, INC.
Performance Review—(Continued)
| | | Class A Shares | | Class C Shares | | Class I Shares | |
| Since Inceptiond (with sales charge) | | | 2.46 | %b | | | 5.96 | %c | | | — | | |
| Since Inceptiond (without sales charge) | | | 7.29 | % | | | 6.96 | % | | | 7.42 | % | |
The performance data quoted represent past performance. Past performance is no guarantee of future results. The investment return and principal value of an investment will fluctuate and shares, when redeemed, may be worth more or less than their original cost. Current performance may be lower or higher than the performance data quoted. Performance information current to the most recent month-end can be obtained by visiting our Web site at cohenandsteers.com. The performance graph and table do not reflect the deduction of taxes that a shareholder would pay on fund distributions or the redemption of fund shares.
Through February 28, 2007, the fund's advisor has contractually agreed to waive certain fees and/or reimburse the fund for expenses. Absent such arrangements, returns would have been lower.
a The comparative indexes are not adjusted to reflect expenses or other fees that the SEC requires to be reflected in the fund's performance. The fund's performance assumes the reinvestment of all dividends and distributions. For more information, including charges and expenses, please read the prospectus carefully before you invest.
b Reflects a 4.50% front-end sales charge.
c Reflects a contingent deferred sales charge of 1%.
d Inception date of August 31, 2005.
6
COHEN & STEERS DIVIDEND VALUE FUND, INC.
Expense Example
(Unaudited)
As a shareholder of the fund, you incur two types of costs: (1) transaction costs, including sales charges (loads) on purchase payments and redemption fees; and (2) ongoing costs including management fees; distribution and/or service (12b-1) fees; and other fund expenses. This example is intended to help you understand your ongoing costs (in dollars) of investing in the fund and to compare these costs with the ongoing costs of investing in other mutual funds.
The example is based on an investment of $1,000 invested at the beginning of the period and held for the entire period 09/01/05–02/28/06.
Actual Expenses
The first line of the table on the next page provides information about actual account values and expenses. You may use the information in this line, together with the amount you invested, to estimate the expenses that you paid over the period. Simply divide your account value by $1,000 (for example, an $8,600 account value divided by $1,000 = 8.6), then multiply the result by the number in the first line under the heading entitled "Expenses Paid During Period" to estimate the expenses you paid on your account during this period.
Hypothetical Example for Comparison Purposes
The second line of the table below provides information about hypothetical account values and hypothetical expenses based on the fund's actual expense ratio and an assumed rate of return of 5% per year before expenses, which is not the fund's actual return. The hypothetical account values and expenses may not be used to estimate the actual ending account balance or expenses you paid for the period. You may use this information to compare the ongoing cost of investing in the fund and other funds. To do so, compare this 5% hypothetical example with the 5% hypothetical examples that appear in the shareholder reports of the other funds.
Please note that the expenses shown in the table are meant to highlight your ongoing costs only and do not reflect any transactional costs, such as sales charges (loads) and redemption fees. Therefore, the second line of the table is useful in comparing ongoing costs only, and will not help you determine the relative total costs of owning different funds. In addition, if these transactional costs were included, your costs would have been higher.
7
COHEN & STEERS DIVIDEND VALUE FUND, INC.
Expense Example (Unaudited)—(Continued)
| | | Beginning
Account Value
09/01/05 | | Ending
Account Value
02/28/06 | | Expenses Paid
During Period*
09/01/05–
02/28/06 | |
| Class A | |
| Actual (7.29% return) | | $ | 1,000.00 | | | $ | 1,072.90 | | | $ | 6.58 | | |
| Hypothetical (5% annual return before expenses) | | $ | 1,000.00 | | | $ | 1,018.45 | | | $ | 6.41 | | |
| Class C | |
| Actual (6.96% return) | | $ | 1,000.00 | | | $ | 1,069.60 | | | $ | 9.96 | | |
| Hypothetical (5% annual return before expenses) | | $ | 1,000.00 | | | $ | 1,015.17 | | | $ | 9.69 | | |
| Class I | |
| Actual (7.42% return) | | $ | 1,000.00 | | | $ | 1,074.20 | | | $ | 5.45 | | |
| Hypothetical (5% annual return before expenses) | | $ | 1,000.00 | | | $ | 1,019.54 | | | $ | 5.31 | | |
* Expenses are equal to the fund's Class A, Class C and Class I annualized expense ratio of 1.28%, 1.94% and 1.06%, respectively, multiplied by the average account value over the period, multiplied by 181/365 (to reflect the one-half year period). If the fund had borne all of its expenses that were assumed by the advisor, the annualized expense ratios would have been 7.02%, 7.92% and 11.83%, respectively.
8
COHEN & STEERS DIVIDEND VALUE FUND, INC.
February 28, 2006
Top Ten Long-Term Holdings
(Unaudited)
| Security | | Market
Value | | % of
Net
Assets | |
| 1. Wal-Mart De Mexico SA de CV | | $ | 366,720 | | | | 2.6 | % | |
| 2. Wells Fargo & Co. | | | 365,940 | | | | 2.6 | | |
| 3. HCC Insurance Holdings | | | 344,433 | | | | 2.5 | | |
| 4. Nike | | | 303,730 | | | | 2.2 | | |
| 5. General Electric Co. | | | 299,117 | | | | 2.1 | | |
| 6. Aflac | | | 296,000 | | | | 2.1 | | |
| 7. Bank of America Corp. | | | 293,440 | | | | 2.1 | | |
| 8. Johnson & Johnson | | | 288,250 | | | | 2.1 | | |
| 9. Baker Hughes | | | 271,880 | | | | 1.9 | | |
| 10. GlobalSantaFe Corp. | | | 271,166 | | | | 1.9 | | |
Sector Breakdown
(Based on Net Assets)
(Unaudited)

9
COHEN & STEERS DIVIDEND VALUE FUND, INC.
SCHEDULE OF INVESTMENTS
February 28, 2006
| | | | | Number
of Shares | | Value | |
| COMMON STOCK | | | 93.2 | % | | | | | | | | | |
| BASIC MATERIALS—CHEMICAL | | | 1.5 | % | | | | | | | | | |
| Alcoa | | | | | | | 2,500 | | | $ | 73,300 | | |
| Dow Chemical Co. | | | | | | | 3,200 | | | | 137,696 | | |
| | | | | | | | 210,996 | | |
| COMMERCIAL SERVICES | | | 0.9 | % | | | | | | | | | |
| Paychex | | | | | | | 3,200 | | | | 128,160 | | |
| CONSUMER-CYCLICAL | | | 12.6 | % | | | | | | | | | |
| AIRLINES | | | 0.9 | % | | | | | | | | | |
| Cathay Pacific Airways Ltd. (ADR) | | | | | | | 13,200 | | | | 123,090 | | |
| APPAREL | | | 2.2 | % | | | | | | | | | |
| Nike | | | | | | | 3,500 | | | | 303,730 | | |
| AUTO MANUFACTURERS | | | 1.3 | % | | | | | | | | | |
| PACCAR | | | | | | | 2,600 | | | | 181,662 | | |
| AUTO PARTS EQUIPMENT | | | 1.6 | % | | | | | | | | | |
| Autoliv | | | | | | | 2,200 | | | | 117,810 | | |
| Magna International | | | | | | | 1,500 | | | | 111,630 | | |
| | | | | | | | 229,440 | | |
| HOTEL | | | 1.3 | % | | | | | | | | | |
| Harrah's Entertainment | | | | | | | 1,300 | | | | 93,496 | | |
| InterContinental Hotels Group PLC (ADR) | | | | | | | 5,800 | | | | 89,146 | | |
| | | | | | | | 182,642 | | |
| LEISURE TIME | | | 1.3 | % | | | | | | | | | |
| Carnival Corp. | | | | | | | 3,400 | | | | 175,610 | | |
| RETAIL | | | 3.2 | % | | | | | | | | | |
| Nordstrom | | | | | | | 2,300 | | | | 87,400 | | |
| Wal-Mart de Mexico SA de CV (ADR) | | | | | | | 12,800 | | | | 366,720 | | |
| | | | | | | | 454,120 | | |
| TOYS/GAMES/HOBBIES | | | 0.8 | % | | | | | | | | | |
| Mattel | | | | | | | 6,900 | | | | 116,265 | | |
| TOTAL CONSUMER-CYCLICAL | | | | | | | | | | | 1,766,559 | | |
See accompanying notes to financial statements.
10
COHEN & STEERS DIVIDEND VALUE FUND, INC.
SCHEDULE OF INVESTMENTS—(Continued)
February 28, 2006
| | | | | Number
of Shares | | Value | |
| CONSUMER-NON-CYCLICAL | | | 12.9 | % | | | | | | | | | |
| AGRICULTURE | | | 2.6 | % | | | | | | | | | |
| Altria Group | | | | | | | 3,300 | | | $ | 237,270 | | |
| Monsanto Co. | | | | | | | 1,500 | | | | 125,820 | | |
| | | | | | | | 363,090 | | |
| BEVERAGE | | | 1.2 | % | | | | | | | | | |
| Diageo PLC (ADR) | | | | | | | 2,700 | | | | 166,590 | | |
| COSMETICS/PERSONAL CARE | | | 1.1 | % | | | | | | | | | |
| Procter & Gamble Co. | | | | | | | 2,700 | | | | 161,811 | | |
| HEALTHCARE PRODUCTS | | | 4.0 | % | | | | | | | | | |
| Becton Dickinson & Co. | | | | | | | 1,700 | | | | 108,545 | | |
| Johnson & Johnson | | | | | | | 5,000 | | | | 288,250 | | |
| Smith & Nephew PLC (ADR) | | | | | | | 3,700 | | | | 165,353 | | |
| | | | | | | | 562,148 | | |
| HEALTHCARE SERVICES | | | 0.7 | % | | | | | | | | | |
| HCA | | | | | | | 2,000 | | | | 95,800 | | |
| PHARMACEUTICAL | | | 3.3 | % | | | | | | | | | |
| Abbott Laboratories | | | | | | | 4,400 | | | | 194,392 | | |
| Pfizer | | | | | | | 5,800 | | | | 151,902 | | |
| Teva Pharmaceutical Industries Ltd. (ADR) | | | | | | | 2,900 | | | | 121,771 | | |
| | | | | | | | 468,065 | | |
| TOTAL CONSUMER-NON-CYCLICAL | | | | | | | | | | | 1,817,504 | | |
| ENERGY | | | 9.7 | % | | | | | | | | | |
| OIL & GAS | | | 7.8 | % | | | | | | | | | |
| BP PLC (ADR) | | | | | | | 2,700 | | | | 179,334 | | |
| ChevronTexaco Corp. | | | | | | | 1,500 | | | | 84,720 | | |
| ConocoPhillips | | | | | | | 1,700 | | | | 103,632 | | |
| Exxon Mobil Corp. | | | | | | | 3,300 | | | | 195,921 | | |
| GlobalSantaFe Corp. | | | | | | | 4,900 | | | | 271,166 | | |
| Kinder Morgan | | | | | | | 1,700 | | | | 157,726 | | |
| Valero Energy Corp. | | | | | | | 1,800 | | | | 96,822 | | |
| | | | | | | | 1,089,321 | | |
See accompanying notes to financial statements.
11
COHEN & STEERS DIVIDEND VALUE FUND, INC.
SCHEDULE OF INVESTMENTS—(Continued)
February 28, 2006
| | | | | Number
of Shares | | Value | |
| OIL & GAS SERVICES | | | 1.9 | % | | | | | | | | | |
| Baker Hughes | | | | | | | 4,000 | | | $ | 271,880 | | |
| TOTAL ENERGY | | | | | | | | | | | 1,361,201 | | |
| FINANCIAL | | | 27.5 | % | | | | | | | | | |
| BANK | | | 9.0 | % | | | | | | | | | |
| Bank of America Corp. | | | | | | | 6,400 | | | | 293,440 | | |
| HSBC Holdings PLC (ADR) | | | | | | | 2,200 | | | | 188,518 | | |
| North Fork Bancorporation | | | | | | | 6,800 | | | | 173,672 | | |
| US Bancorp | | | | | | | 7,800 | | | | 241,098 | | |
| Wells Fargo & Co. | | | | | | | 5,700 | | | | 365,940 | | |
| | | | | | | | 1,262,668 | | |
| DIVERSIFIED FINANCIAL SERVICE | | | 7.3 | % | | | | | | | | | |
| Citigroup | | | | | | | 5,100 | | | | 236,487 | | |
| Countrywide Financial Corp. | | | | | | | 5,100 | | | | 175,848 | | |
| Franklin Resources | | | | | | | 1,700 | | | | 174,556 | | |
| Freddie Mac | | | | | | | 1,600 | | | | 107,824 | | |
| JPMorgan Chase & Co. | | | | | | | 5,800 | | | | 238,612 | | |
| Morgan Stanley | | | | | | | 1,700 | | | | 101,422 | | |
| | | | | | | | 1,034,749 | | |
| INSURANCE | | | 11.2 | % | | | | | | | | | |
| ACE Ltd. | | | | | | | 4,800 | | | | 267,504 | | |
| Aflac | | | | | | | 6,400 | | | | 296,000 | | |
| Allstate Corp. | | | | | | | 4,600 | | | | 251,988 | | |
| American International Group | | | | | | | 1,600 | | | | 106,176 | | |
| Fidelity National Financial | | | | | | | 3,900 | | | | 147,264 | | |
| HCC Insurance Holdings | | | | | | | 10,700 | | | | 344,433 | | |
| XL Capital Ltd. | | | | | | | 2,300 | | | | 155,365 | | |
| | | | | | | | 1,568,730 | | |
| TOTAL FINANCIAL | | | | | | | | | | | 3,866,147 | | |
See accompanying notes to financial statements.
12
COHEN & STEERS DIVIDEND VALUE FUND, INC.
SCHEDULE OF INVESTMENTS—(Continued)
February 28, 2006
| | | | | Number
of Shares | | Value | |
| INDUSTRIAL | | | 9.4 | % | | | | | | | | | |
| AEROSPACE & DEFENSE | | | 2.8 | % | | | | | | | | | |
| General Dynamics Corp. | | | | | | | 1,400 | | | $ | 172,578 | | |
| Northrop Grumman Corp. | | | | | | | 3,400 | | | | 217,940 | | |
| | | | | | | | 390,518 | | |
| BUILDING MATERIALS | | | 0.9 | % | | | | | | | | | |
| Cemex SA de CV (ADR) | | | | | | | 2,100 | | | | 129,696 | | |
| COMPUTERS | | | 1.5 | % | | | | | | | | | |
| Hewlett-Packard Co. | | | | | | | 3,100 | | | | 101,711 | | |
| International Business Machines Corp. | | | | | | | 1,300 | | | | 104,312 | | |
| | | | | | | | 206,023 | | |
| DIVERSIFIED MANUFACTURING | | | 2.1 | % | | | | | | | | | |
| General Electric Co. | | | | | | | 9,100 | | | | 299,117 | | |
| ENVIRONMENTAL CONTROL | | | 0.9 | % | | | | | | | | | |
| Waste Management | | | | | | | 3,800 | | | | 126,388 | | |
| TRANSPORTATION | | | 1.2 | % | | | | | | | | | |
| United Parcel Service | | | | | | | 2,200 | | | | 164,362 | | |
| TOTAL INDUSTRIAL | | | | | | | | | | | 1,316,104 | | |
| REAL ESTATE | | | 6.8 | % | | | | | | | | | |
| APARTMENT | | | 0.8 | % | | | | | | | | | |
| AvalonBay Communities | | | | | | | 1,100 | | | | 113,300 | | |
| HOTEL | | | 1.3 | % | | | | | | | | | |
| Hilton Hotels Corp. | | | | | | | 3,200 | | | | 77,440 | | |
| Starwood Hotels & Resorts Worldwide | | | | | | | 1,700 | | | | 107,950 | | |
| | | | | | | | 185,390 | | |
| INDUSTRIAL | | | 1.0 | % | | | | | | | | | |
| ProLogis | | | | | | | 2,500 | | | | 131,300 | | |
| OFFICE | | | 1.7 | % | | | | | | | | | |
| Boston Properties | | | | | | | 1,400 | | | | 118,538 | | |
| Corporate Office Properties Trust | | | | | | | 2,900 | | | | 120,408 | | |
| | | | | | | | 238,946 | | |
See accompanying notes to financial statements.
13
COHEN & STEERS DIVIDEND VALUE FUND, INC.
SCHEDULE OF INVESTMENTS—(Continued)
February 28, 2006
| | | | | Number
of Shares | | Value | |
| REGIONAL MALL | | | 1.2 | % | | | | | | | | | |
| Mills Corp. | | | | | | | 1,400 | | | $ | 55,342 | | |
| Simon Property Group | | | | | | | 1,400 | | | | 116,158 | | |
| | | | | | | | 171,500 | | |
| SELF STORAGE | | | 0.8 | % | | | | | | | | | |
| Public Storage | | | | | | | 1,500 | | | | 117,030 | | |
| TOTAL REAL ESTATE | | | | | | | | | | | 957,466 | | |
| TECHNOLOGY | | | 3.4 | % | | | | | | | | | |
| SEMICONDUCTORS | | | 2.5 | % | | | | | | | | | |
| Intel Corp. | | | | | | | 7,200 | | | | 148,320 | | |
| Microchip Technology | | | | | | | 5,900 | | | | 207,680 | | |
| | | | | | | | 356,000 | | |
| SOFTWARE | | | 0.9 | % | | | | | | | | | |
| Microsoft Corp. | | | | | | | 4,500 | | | | 121,050 | | |
| TOTAL TECHNOLOGY | | | | | | | | | | | 477,050 | | |
| TELECOMMUNICATIONS | | | 3.1 | % | | | | | | | | | |
| Nokia Corp. (ADR) | | | | | | | 5,500 | | | | 102,190 | | |
| Verizon Communications | | | | | | | 3,300 | | | | 111,210 | | |
| Vodafone Group PLC (ADR) | | | | | | | 11,300 | | | | 218,316 | | |
| | | | | | | | 431,716 | | |
| UTILITY | | | 5.4 | % | | | | | | | | | |
| ELECTRIC—DISTRIBUTION | | | 1.6 | % | | | | | | | | | |
| Edison International | | | | | | | 5,000 | | | | 221,800 | | |
| ELECTRIC—INTEGRATED | | | 3.8 | % | | | | | | | | | |
| Exelon Corp. | | | | | | | 4,700 | | | | 268,417 | | |
| FPL Group | | | | | | | 6,300 | | | | 264,159 | | |
| | | | | | | | 532,576 | | |
| TOTAL UTILITY | | | | | | | | | | | 754,376 | | |
TOTAL COMMON STOCK
(Identified cost—$12,743,972) | | | | | | | | | | | 13,087,279 | | |
See accompanying notes to financial statements.
14
COHEN & STEERS DIVIDEND VALUE FUND, INC.
SCHEDULE OF INVESTMENTS—(Continued)
February 28, 2006
| | | | | Principal
Amount | | Value | |
| COMMERCIAL PAPER | | | 2.6 | % | | | | | | | |
San Paolo U.S. Finance Co., 3.46%, due 3/1/06
(Identified cost—$373,000) | | | | | | $ | 373,000 | | | $ | 373,000 | | |
| TOTAL INVESTMENTS (Identified cost—$13,116,972) | | | 95.8 | % | | | | | 13,460,279 | | |
| OTHER ASSETS IN EXCESS OF LIABILITIES | | | 4.2 | % | | | | | 584,995 | | |
| NET ASSETS | | | 100.0 | % | | | | $ | 14,045,274 | | |
Glossary of Portfolio Abbreviation
ADR American Depositary Receipt
Note: Percentages indicated are based on the net assets of the fund.
See accompanying notes to financial statements.
15
COHEN & STEERS DIVIDEND VALUE FUND, INC.
STATEMENT OF ASSETS AND LIABILITIES
February 28, 2006
| ASSETS: | |
| Investments in securities, at value (Identified cost—$13,116,972) | | $ | 13,460,279 | | |
| Receivable for fund shares sold | | | 493,366 | | |
| Receivable due from advisor | | | 242,762 | | |
| Deferred offering costs | | | 68,297 | | |
| Dividends receivable | | | 19,784 | | |
| Other assets | | | 255 | | |
| Total Assets | | | 14,284,743 | | |
| LIABILITIES: | |
| Payable for offering costs | | | 136,221 | | |
| Payable for distribution fees | | | 7,213 | | |
| Payable for directors fees | | | 5,291 | | |
| Payable for investment securities purchased | | | 4,695 | | |
| Payable for shareholder servicing fees | | | 2,569 | | |
| Other liabilities | | | 83,480 | | |
| Total Liabilities | | | 239,469 | | |
| NET ASSETS | | $ | 14,045,274 | | |
| NET ASSETS consist of: | |
| Paid-in capital | | $ | 13,635,072 | | |
| Undistributed net investment income | | | 24,130 | | |
| Undistributed net realized gain on investments | | | 42,765 | | |
| Net unrealized appreciation on investments | | | 343,307 | | |
| | | $ | 14,045,274 | | |
See accompanying notes to financial statements.
16
COHEN & STEERS DIVIDEND VALUE FUND, INC.
STATEMENT OF ASSETS AND LIABILITIES—(Continued)
February 28, 2006
| CLASS A SHARES: | |
| NET ASSETS | | $ | 6,595,062 | | |
| Shares issued and outstanding ($0.001 par value common stock outstanding) | | | 538,089 | | |
| Net asset value and redemption price per share | | $ | 12.26 | | |
| Maximum offering price per share ($12.26 ÷ 0.955)a | | $ | 12.84 | | |
| CLASS C SHARES: | |
| NET ASSETS | | $ | 3,799,769 | | |
| Shares issued and outstanding ($0.001 par value common stock outstanding) | | | 310,658 | | |
| Net asset value and offering price per shareb | | $ | 12.23 | | |
| CLASS I SHARES: | |
| NET ASSETS | | $ | 3,650,443 | | |
| Shares issued and outstanding ($0.001 par value common stock outstanding) | | | 297,392 | | |
| Net asset value, offering and redemption price per share | | $ | 12.27 | | |
a On investments of $100,000 or more, the offering price is reduced.
b Redemption price per share is equal to the net asset value per share less any applicable deferred sales charge which varies with the length of time shares are held.
See accompanying notes to financial statements.
17
COHEN & STEERS DIVIDEND VALUE FUND, INC.
STATEMENT OF OPERATIONS
For the Period August 31, 2005a through February 28, 2006
| Investment Income: | |
| Dividend income (net of $69 of foreign withholding tax) | | $ | 72,242 | | |
| Interest income | | | 7,192 | | |
| Total Income | | | 79,434 | | |
| Expenses: | |
| Professional fees | | | 88,276 | | |
| Offering costs | | | 67,924 | | |
| Directors' fees and expenses | | | 41,384 | | |
| Investment advisory fees | | | 25,796 | | |
| Shareholder reporting expenses | | | 24,934 | | |
| Administration fees | | | 23,695 | | |
| Transfer agent fees | | | 11,102 | | |
| Custodian fees and expenses | | | 9,832 | | |
| Distribution fees—Class A | | | 2,461 | | |
| Distribution fees—Class C | | | 4,752 | | |
| Registration and filing fees | | | 6,258 | | |
| Shareholder servicing fees—Class A | | | 984 | | |
| Shareholder servicing fees—Class C | | | 1,584 | | |
| Miscellaneous | | | 2,912 | | |
| Total Expenses | | | 311,894 | | |
| Reduction of Expenses | | | (269,848 | ) | |
| Net Expenses | | | 42,046 | | |
| Net Investment Income | | | 37,388 | | |
| Net Realized and Unrealized Gain on Investments: | |
| Net realized gain on investments | | | 42,765 | | |
| Net change in unrealized appreciation on investments | | | 343,307 | | |
| Net realized and unrealized gain on investments | | | 386,072 | | |
| Net Increase in Net Assets Resulting from Operations | | $ | 423,460 | | |
a Commencement of operations.
See accompanying notes to financial statements.
18
COHEN & STEERS DIVIDEND VALUE FUND, INC.
STATEMENT OF CHANGES IN NET ASSETS
| | | For the Period
August 31, 2005a
through
February 28, 2006 | |
| Change in Net Assets: | |
| From Operations: | |
| Net investment income | | $ | 37,388 | | |
| Net realized gain on investments | | | 42,765 | | |
| Net change in unrealized appreciation on investments | | | 343,307 | | |
| Net increase in net assets resulting from operations | | | 423,460 | | |
| Dividends to Shareholders from Net Investment Income: | |
| Class A | | | (6,033 | ) | |
| Class C | | | (4,200 | ) | |
| Class I | | | (10,880 | ) | |
| Total dividends to shareholders | | | (21,113 | ) | |
| Capital Stock Transactions: | |
| Increase in net assets from fund share transactions | | | 13,542,652 | | |
| Total increase in net assets | | | 13,944,999 | | |
| Net Assets: | |
| Beginning of period | | | 100,275 | | |
| End of periodb | | $ | 14,045,274 | | |
a Commencement of operations.
b Includes undistributed net investment income of $24,130.
See accompanying notes to financial statements.
19
COHEN & STEERS DIVIDEND VALUE FUND, INC.
FINANCIAL HIGHLIGHTS
The following table includes selected data for a share outstanding throughout the period and other performance information derived from the financial statements. It should be read in conjunction with the financial statements and notes thereto.
| | | For the Period August 31a, 2005 through February 28, 2006 | |
| | | Class A | | Class C | | Class I | |
| Per Share Operating Performance: | |
| Net asset value, beginning of period | | $ | 11.46 | | | $ | 11.46 | | | $ | 11.46 | | |
| Income from investment operations: | |
| Net investment incomeb | | | 0.07 | | | | 0.03 | | | | 0.09 | | |
| Net realized and unrealized gain on investments | | | 0.77 | | | | 0.77 | | | | 0.76 | | |
| Total income from investment operations | | | 0.84 | | | | 0.80 | | | | 0.85 | | |
| Less dividends to shareholders from net investment income | | | (0.04 | ) | | | (0.03 | ) | | | (0.04 | ) | |
| Redemption fees retained by the fund | | | 0.00 | c | | | 0.00 | c | | | 0.00 | c | |
| Net increase in net asset value | | | 0.80 | | | | 0.77 | | | | 0.81 | | |
| Net asset value, end of period | | $ | 12.26 | | | $ | 12.23 | | | $ | 12.27 | | |
| Total investment returne | | | 7.29 | %d | | | 6.96 | %d | | | 7.42 | % | |
| Ratios/Supplemental Data: | |
| Net assets, end of period (in millions) | | $ | 6.6 | | | $ | 3.8 | | | $ | 3.7 | | |
| Ratio of expenses to average daily net assets (before expense reduction)f | | | 7.02 | % | | | 7.93 | % | | | 11.99 | % | |
| Ratio of expenses to average daily net assets (net of expense reduction)f | | | 1.28 | % | | | 1.95 | % | | | 1.07 | % | |
Ratio of net investment loss to average daily net assets
(before expense reduction)f | | | (4.66 | )% | | | (5.53 | )% | | | (9.43 | )% | |
Ratio of net investment income to average daily net assets
(net of expense reduction)f | | | 1.08 | % | | | 0.45 | % | | | 1.49 | % | |
| Portfolio turnover ratee | | | 8 | % | | | 8 | % | | | 8 | % | |
a Commencement of operations.
b Calculated based on the average shares outstanding during the period.
c Less than $0.005 per share.
d Does not reflect sales charges, which would reduce return.
e Not annualized.
f Annualized.
See accompanying notes to financial statements.
20
COHEN & STEERS DIVIDEND VALUE FUND, INC.
NOTES TO FINANCIAL STATEMENTS
Note 1. Significant Accounting Policies
Cohen & Steers Dividend Value Fund, Inc. (the fund) was incorporated under the laws of the State of Maryland on November 9, 2004 and is registered under the Investment Company Act of 1940, as amended, as a nondiversified, open-end management investment company. The fund's investment objectives are to provide a relatively high level of current income and long term growth of income and capital appreciation. The fund had no operations until July 22, 2005 when it sold 100 shares each of Class A and Class C, and 8,550 shares of Class I for $100,275 to Cohen & Steers Capital Management, Inc. (the advisor). Investment operations commenced on August 31, 2005. The authorized shares of the fund are divided into three classes designated Class A, C, and I shares. Each of the fund's shares has equal dividend, liquidation and voting rights (except for matters relating to distributions and shareholder servicing of such shares).
The following is a summary of significant accounting policies consistently followed by the fund in the preparation of its financial statements. The policies are in conformity with accounting principles generally accepted in the United States of America (GAAP). The preparation of the financial statements in accordance with GAAP requires management to make estimates and assumptions that affect the reported amounts of assets and liabilities at the date of the financial statements and the reported amounts of income and expenses during the reporting period. Actual results could differ from those estimates.
Portfolio Valuation: Investments in securities that are listed on the New York Stock Exchange are valued, except as indicated below, at the last sale price reflected at the close of the New York Stock Exchange on the business day as of which such value is being determined. If there has been no sale on such day, the securities are valued at the mean of the closing bid and asked prices for the day or, if no asked price is available, at the bid price.
Securities not listed on the New York Stock Exchange but listed on other domestic or foreign securities exchanges or admitted to trading on the National Association of Securities Dealers Automated Quotations, Inc. (Nasdaq) national market system are valued in a similar manner. Securities traded on more than one securities exchange are valued at the last sale price on the business day as of which such value is being determined as reflected on the tape at the close of the exchange representing the principal market for such securities.
Readily marketable securities traded in the over-the-counter market, including listed securities whose primary market is believed by Cohen & Steers Capital Management, Inc. to be over-the-counter, but excluding securities admitted to trading on the Nasdaq National List, are valued at the official closing prices as reported by Nasdaq, the National Quotation Bureau, or such other comparable sources as the Board of Directors deem appropriate to reflect their fair market value. If there has been no sale on such day, the securities are valued at the mean of the closing bid and asked prices for the day, or if no asked price is available, at the bid price. Where securities are traded on more than one exchange and also over-the-counter, the securities will generally be valued using the quotations the Board of Directors believes most closely reflect the value of such securities.
21
COHEN & STEERS DIVIDEND VALUE FUND, INC.
NOTES TO FINANCIAL STATEMENTS—(Continued)
Securities for which market prices are unavailable will be valued at fair value pursuant to procedures approved by the fund's Board of Directors. Circumstances in which market prices may be unavailable include, but are not limited to, when trading in a security is suspended, the exchange on which the security is traded is subject to an unscheduled close or disruption or material events occur after the close of the exchange on which the security is principally traded. In these circumstances, the fund determines fair value in a manner that fairly reflects the market value of the security on the valuation date based on consideration of any information or factors it deems appropriate. These may include recent transactions in comparable securities, information relating to the specific security and developments in the markets.
The fund's use of fair value pricing may cause the net asset value of fund shares to differ from the net asset value that would be calculated using market quotations. Fair value pricing involves subjective judgments and it is possible that the fair value determined for a security may be materially different than the value that could be realized upon the sale of that security.
To the extent the fund holds securities that are primarily listed on foreign exchanges that trade on weekends or days when the fund does not price its shares, the value of the securities held in the fund may change on days when you will not be able to purchase or redeem fund shares.
Short-term debt securities, which have a maturity date of 60 days or less, are valued at amortized cost, which approximates value.
Security Transactions and Investment Income: Security transactions are recorded on trade date. Realized gains and losses on investments sold are recorded on the basis of identified cost. Interest income is recorded on the accrual basis. Discounts are accreted and premiums are amortized over the life of the respective securities. Dividend income is recorded on the ex-dividend date. The fund records distributions received in excess of income from underlying investments as a reduction of cost of investments and/or realized gain. Such amounts are based on estimates if actual amounts are not available and actual amounts of income, realized gain and return of capital may differ from the estimated amounts. The fund adjusts the estimated amounts of the components of distributions (and consequently its net investment income) as an increase to unrealized appreciation/ (depr eciation) and realized gain/(loss) on investments as necessary once the issuers provide information about the actual composition of the distributions. Income, expenses (other than expenses attributable to a specific class), and realized and unrealized gains or losses on investments are allocated to each class of shares based on its relative net assets.
Dividends and Distributions to Shareholders: Dividends from net investment income and capital gain distributions are determined in accordance with U.S. federal income tax regulations, which may differ from GAAP. Dividends from net investment income are declared and paid quarterly. Net realized capital gains, unless offset by any available capital loss carryforward, are distributed to shareholders annually. Dividends and distributions to shareholders are recorded on the ex-dividend date and are automatically reinvested in full and fractional shares of the fund based on the net asset value per share at the close of business on the ex-dividend date unless the
22
COHEN & STEERS DIVIDEND VALUE FUND, INC.
NOTES TO FINANCIAL STATEMENTS—(Continued)
shareholder has elected to have them paid in cash. Distributions paid by the fund are subject to recharacterization for tax purposes.
Federal Income Taxes: It is the policy of the fund to continue to qualify as a regulated investment company, if such qualification is in the best interest of the shareholders, by complying with the requirements of Subchapter M of the Internal Revenue Code applicable to regulated investment companies, and by distributing substantially all of its taxable earnings to its shareholders. Accordingly, no provision for federal income or excise tax is necessary.
Note 2. Investment Advisory and Administration Fees and Other Transactions with Affiliates
Investment Advisory Fees: Pursuant to an investment advisory agreement (the advisory agreement) with the fund, the advisor provides the fund with the day-to-day investment decisions and generally manages the fund's investments in accordance with the stated policies of the fund, subject to the supervision of the fund's Board of Directors. For the services provided to the fund, the advisor receives a fee, accrued daily and paid monthly at the annual rate of 0.80% of the average daily net assets of the fund up to and including $1.5 billion and 0.70% of the average daily net asset above $1.5 billion.
For the period February 1, 2006 through February 28, 2007, the advisor has contractually agreed to waive its fee and/or reimburse the fund for expenses incurred to the extent necessary to maintain the fund's operating expenses at 1.00% for Class A shares, 1.65% for Class C shares and 0.65% for Class I shares. For the period August 31, 2005 (commencement of operations) through January 31, 2006, the rates were 1.50% for Class A, 2.15% for Class C and 1.15% for Class I.
Administration Fees: The fund has entered into an administration agreement with the advisor under which the advisor performs certain administrative functions for the fund and receives a fee, accrued daily and paid monthly at the annual rate of 0.04% of the fund's average daily net assets. For the period August 31, 2005 (commencement of operations) through February 28, 2006, the fund paid the advisor $1,290 in fees under this administration agreement.
Distribution Fees: Cohen & Steers Securities, LLC (the distributor), an affiliated entity of the advisor, distributes the shares of the fund. The fund has adopted a distribution plan (the plan) pursuant to Rule 12b-1 under the Investment Company Act of 1940. Under the plan, the fund may not incur distribution fees which exceed an annual rate of 0.25% of the average daily net assets attributable to the Class A shares and 0.75% of the average daily net assets attributable to the Class C shares.
For the period August 31, 2005 (commencement of operations) through February 28, 2006, the fund has been advised that the distributor received $3,538 in sales commissions from the sale of Class A shares and that the distributor also received $1,600 of contingent deferred sales charges relating to redemptions of Class C shares. The distributor has advised the fund that proceeds from the contingent deferred sales charge on the Class C shares are paid to the distributor and are used by the distributor to defray its expenses related to providing distribution-related services to the fund in connection with the sale of the Class C shares, including payments to dealers and other financial intermediaries for selling Class C shares and interest and other financing costs associated with Class C shares.
23
COHEN & STEERS DIVIDEND VALUE FUND, INC.
NOTES TO FINANCIAL STATEMENTS—(Continued)
Shareholder Servicing Fees: The fund has adopted a shareholder services plan which provides that the fund may obtain the services of qualified financial institutions to act as shareholder servicing agents for their customers. For these services, the fund may pay the shareholder servicing agent a fee at an annual rate of up to 0.10% of the average daily net asset value of the fund's Class A shares and up to 0.25% of the average daily net asset value of the fund's Class C shares.
Directors' and Officers' Fees: Certain directors and officers of the fund are also directors, officers, and/or employees of the advisor. The fund does not pay compensation to any affiliated directors and officers except for the Chief Compliance Officer, who received $51 from the fund for the period August 31, 2005 (commencement of operations) through February 28, 2006.
Offering Costs: The advisor incurred offering costs on behalf of the fund in the amount of $136,221, which will be reimbursed by the fund net of any operating expense waivers. Such expenses were deferred and are being amortized over a one year period from the commencement of operations.
Note 3. Purchases and Sales of Securities
Purchases and sales of securities, excluding short-term investments, for the period August 31, 2005 (commencement of operations) through February 28, 2006 totaled $13,241,093 and $540,119 respectively.
Note 4. Income Tax Information
The tax character of dividends paid for the period August 31, 2005 (commencement of operations) through February 28, 2006 was as follows:
As of February 28, 2006, the tax-basis components of accumulated earnings and the federal tax cost were as follows:
| Gross unrealized appreciation | | $ | 519,223 | | |
| Gross unrealized depreciation | | | (175,918 | ) | |
| Net unrealized appreciation | | $ | 343,305 | | |
| Undistributed ordinary income | | $ | 64,729 | | |
| Undistributed long-term capital gains | | $ | 2,168 | | |
| Cost for federal income tax purposes | | $ | 13,116,974 | | |
24
COHEN & STEERS DIVIDEND VALUE FUND, INC.
NOTES TO FINANCIAL STATEMENTS—(Continued)
As of February 28, 2006, the fund had permanent book/tax differences primarily attributable to non-deductible offering expenses. To reflect reclassifications arising from these differences, paid-in capital was charged $7,855 and net investment income was credited $7,855.
Note 5. Capital Stock
The fund is authorized to issue 200 million shares of capital stock, at a par value of $0.001 per share. The Board of Directors of the fund may increase or decrease the aggregate number of shares of common stock that the fund has authority to issue. At February 28, 2006, Cohen & Steers Capital Management Inc. owned 271,230 shares of Class I. Transactions in fund shares were as follows:
| | | For the Period
August 31, 2005*
through
February 28, 2006 | |
| | | Shares | | Amount | |
| Class A: | |
| Sold | | | 540,115 | | | $ | 6,510,085 | | |
| Issued as reinvestment of dividends | | | 214 | | | | 2,564 | | |
| Redeemed | | | (2,340 | ) | | | (28,124 | ) | |
| Redemption fees retained by the funda | | | — | | | | 33 | | |
| Net increase | | | 537,989 | | | $ | 6,484,558 | | |
| Class C: | |
| Sold | | | 324,592 | | | $ | 3,898,126 | | |
| Issued as reinvestment of dividends | | | 12 | | | | 139 | | |
| Redeemed | | | (14,046 | ) | | | (168,303 | ) | |
| Redemption fees retained by the funda | | | — | | | | 23 | | |
| Net increase | | | 310,558 | | | $ | 3,729,985 | | |
| Class I: | |
| Sold | | | 287,936 | | | $ | 3,317,186 | | |
| Issued as reinvestment of dividends | | | 906 | | | | 10,880 | | |
| Redemption fees retained by the funda | | | — | | | | 43 | | |
| Net increase | | | 288,842 | | | $ | 3,328,109 | | |
* Commencement of operations
a The fund may charge a 1% redemption fee on shares sold within six months of the time of purchase.
25
COHEN & STEERS DIVIDEND VALUE FUND, INC.
NOTES TO FINANCIAL STATEMENTS—(Continued)
Note 6. Borrowings
The fund, in conjunction with other Cohen & Steers funds, is a party to a $150,000,000 syndicated credit agreement (the credit agreement) with State Street Bank and Trust Company, as administrative agent and operations agent, and the lenders identified in the credit agreement, which expires December 2006. The fund pays a commitment fee of 0.125% per annum on its proportionate share of the unused portion of the credit agreement.
During the period August 31, 2005 (commencement of operations) through February 28, 2006, the fund did not utilize the line of credit.
Note 7. Other
In the normal course of business, the fund enters into contracts that provide general indemnifications. The fund's maximum exposure under these arrangements is dependent on claims that may be made against the fund in the future and, therefore, cannot be estimated; however, based on experience, the risk of material loss from such claims is considered remote.
26
COHEN & STEERS DIVIDEND VALUE FUND, INC.
REPORT OF INDEPENDENT REGISTERED PUBLIC ACCOUNTING FIRM
To the Board of Directors and Shareholders of
Cohen & Steers Dividend Value Fund, Inc.
In our opinion, the accompanying statement of assets and liabilities, including the schedule of investments, and the related statements of operations and of changes in net assets and the financial highlights present fairly, in all material respects, the financial position of Cohen & Steers Dividend Value Fund, Inc. (the "Fund") at February 28, 2006, and the results of its operations, the changes in its net assets and the financial highlights for the period August 31, 2005 (commencement of operations) through February 28, 2006, in conformity with accounting principles generally accepted in the United States of America. These financial statements and financial highlights (hereafter referred to as "financial statements") are the responsibility of the Fund's management. Our responsibility is to express an opinion on these financial statements based on our audit. We conducted our audit of these financial statements in accordance with the stan dards of the Public Company Accounting Oversight Board (United States). Those standards require that we plan and perform the audit to obtain reasonable assurance about whether the financial statements are free of material misstatement. An audit includes examining, on a test basis, evidence supporting the amounts and disclosures in the financial statements, assessing the accounting principles used and significant estimates made by management, and evaluating the overall financial statement presentation. We believe that our audit, which included confirmation of securities at February 28, 2006 by correspondence with the custodian and brokers, provides a reasonable basis for our opinion.
PricewaterhouseCoopers LLP
New York, New York
April 11, 2006
27
COHEN & STEERS DIVIDEND VALUE FUND, INC.
TAX INFORMATION—2006
Pursuant to the Jobs and Growth Relief Reconciliation Act of 2003, the fund designates qualified dividend income of $66,680. Additionally, 77.68% of the ordinary dividends qualified for the dividends received deduction available to corporations.
OTHER INFORMATION
A description of the policies and procedures that the fund uses to determine how to vote proxies relating to portfolio securities is available (i) without charge, upon request, by calling 800-330-7348, (ii) on our Web site at cohenandsteers.com or (iii) on the Securities and Exchange Commission's Web site at http://www.sec.gov. In addition, the fund's proxy voting record for the most recent 12-month period ended June 30 is available (i) without charge, upon request, by calling 800-330-7348 or (ii) on the SEC's Web site at http://www.sec.gov.
The fund files its complete schedule of portfolio holdings with the SEC for the first and third quarters of each fiscal year on Form N-Q. The fund's Forms N-Q are available (i) without charge, upon request by calling 800-330-7348, or (ii) on the SEC's Web site at http://www.sec.gov. In addition, the Forms N-Q may be reviewed and copied at the SEC's Public Reference Room in Washington, DC. Information on the operation of the Public Reference Room may be obtained by calling 800-SEC-0330.
Please note that the distributions paid by the fund to shareholders are subject to recharacterization for tax purposes. The final tax treatment of these distributions is reported to shareholders on their 1099-DIV forms, which are mailed to shareholders after the close of each calender year. The fund may pay distributions in excess of the fund's net investment company taxable income and this excess would be a tax-free return of capital distributed from the fund's assets. To the extent this occurs, the fund's shareholders of record will be notified of the estimated amount of capital returned to shareholders for each such distribution and this information will also be available at cohenandsteers.com. Distributions of capital decrease the fund's total assets and, therefore, could have the effect of increasing the fund's expense ratio. In addition, in order to make these distributions, the fund may have to sell portfolio securities at a less than opportune time.
28
COHEN & STEERS DIVIDEND VALUE FUND, INC.
MANAGEMENT OF THE FUND
The business and affairs of the fund are managed under the direction of the board of directors. The board of directors approves all significant agreements between the fund and persons or companies furnishing services to it, including the fund's agreements with its advisor, administrator, custodian and transfer agent. The management of the fund's day-to-day operations is delegated to its officers, the advisor and the fund's administrator, subject always to the investment objective and policies of the fund and to the general supervision of the board of directors.
The directors and officers of the fund and their principal occupations during the past five years are set forth below. The statement of additional information (SAI) includes additional information about fund directors and is available, without charge, upon request by calling 800-330-7348.
| Name, Address and Age* | | Position(s) Held
with Fund | | Term of
Office | | Principal Occupation
During Past 5 Years
(Including Other
Directorships Held) | | Number of
Funds Within
Fund
Complex
Overseen by
Director
(Including
the Fund) | | Length
of Time
Served** | |
| Interested Directors1 | |
|
Robert H. Steers
Age: 52 | | Director and
Co-Chairman | | | 2006 | | | Co-Chairman and Co-Chief Executive Officer of Cohen & Steers Capital Management, Inc. (CSCM), the fund's investment manager, and its parent company, Cohen & Steers, Inc. (CNS) since 2004. Vice President and Director, Cohen & Steers Securities, LLC (CSSL), the Cohen & Steers open-end funds' distributor. Prior thereto, Chairman of CSCM and the Cohen & Steers funds. | | | 17 | | | 1991 to
present | |
|
Martin Cohen
Age: 56 | | Director and
Co-Chairman | | | 2007 | | | Co-Chairman and Co-Chief Executive Officer of CSCM and CNS. Vice President and Director of CSSL. Prior thereto, President of the CSCM and the Cohen & Steers funds. | | | 17 | | | 1991 to
present | |
|
(table continued on next page)
* The address for each director is 280 Park Avenue, New York, NY 10017.
** The length of time served represents the year in which the director was first elected or appointed to any fund in the Cohen & Steers fund complex.
1 "Interested person", as defined in the 1940 Act, of the fund because of affiliation with CSCM.
29
COHEN & STEERS DIVIDEND VALUE FUND, INC.
(table continued from previous page)
| Name, Address and Age* | | Position(s) Held
with Fund | | Term of
Office | | Principal Occupation
During Past 5 Years
(Including Other
Directorships Held) | | Number of
Funds Within
Fund
Complex
Overseen by
Director
(Including
the Fund) | | Length
of Time
Served** | |
| Disinterested Directors | |
|
Bonnie Cohen2
Age: 63 | | Director | | | 2008 | | | Consultant. Prior thereto, Undersecretary of State, United States Department of State. Director of Wellsford Real Properties, Inc. | | | 17 | | | 2001 to
present | |
|
George Grossman
Age: 52 | | Director | | | 2006 | | | Attorney-at-law | | | 17 | | | 1993 to
present | |
|
Richard E. Kroon
Age: 63 | | Director | | | 2008 | | | Board member of Finlay Enterprises, Inc., (operator of department store fine jewelry leased departments) and several private companies; member of Investment Subcommittee, Monmouth University; retired Chairman and Managing Partner of the Sprout Group venture capital funds, then an affiliate of Donaldson, Lufkin & Jenrette Securities Corporation; and former Chairman of the National Venture Capital Association. | | | 17 | | | 2004 to
present | |
|
Richard J. Norman
Age: 62 | | Director | | | 2007 | | | Private Investor. President of the Board of Directors of Maryland Public Television, Board Member of the Salvation Army. Prior thereto, Investment Representative of Morgan Stanley Dean Witter. | | | 17 | | | 2001 to
present | |
|
(table continued on next page)
* The address for each director is 280 Park Avenue, New York, NY 10017.
** The length of time served represents the year in which the director was first elected or appointed to any fund in the Cohen & Steers fund complex.
2 Martin Cohen and Bonnie Cohen are not related.
30
COHEN & STEERS DIVIDEND VALUE FUND, INC.
(table continued from previous page)
| Name, Address and Age* | | Position(s) Held
with Fund | | Term of
Office | | Principal Occupation
During Past 5 Years
(Including Other
Directorships Held) | | Number of
Funds Within
Fund
Complex
Overseen by
Director
(Including
the Fund) | | Length
of Time
Served** | |
Frank K. Ross
Age: 62 | | Director | | | 2007 | | | Professor of Accounting, Howard University; Board member of NCRIC Group, Inc. (insurance) and Pepco Holdings, Inc. (electric utility). Formerly, Midatlantic Area Managing Partner for Audit and Risk Advisory Services at KPMG LLP and Managing Partner of its Washington, DC office. | | | 17 | | | 2004 to
present | |
|
Willard H. Smith Jr.
Age: 69 | | Director | | | 2008 | | | Board member of Essex Property Trust Inc., Realty Income Corporation and Crest Net Lease, Inc. Managing Director at Merrill Lynch & Co., Equity Capital Markets Division from 1983 to 1995. | | | 17 | | | 1996 to
present | |
|
C. Edward Ward, Jr.
Age: 59 | | Director | | | 2006 | | | Member of the Board of Trustees of Directors Manhattan College, Riverdale, New York. Formerly head of closed-end fund listings for the New York Stock Exchange. | | | 17 | | | 2004 to
present | |
|
* The address for each director is 280 Park Avenue, New York, NY 10017.
** The length of time served represents the year in which the director was first elected or appointed to any fund in the Cohen & Steers fund complex.
31
COHEN & STEERS DIVIDEND VALUE FUND, INC.
The officers of the fund (other than Messrs. Cohen and Steers, whose biographies are provided above), their address, their ages and their principal occupations for at least the past five years are set forth below.
| Name, Address and Age* | | Position(s) Held
with Fund | | Principal Occupation During Past 5 Years | | Length
of Time
Served** | |
Adam M. Derechin
Age: 41 | | President and Chief Executive Officer | | Chief Operating Officer of CSCM (since 2003) and CNS (since 2004). Prior to that, Senior Vice President of CSCM and Vice President and Assistant Treasurer of the Cohen & Steers funds. | | Since 2005 | |
|
Joseph M. Harvey
Age: 42 | | Vice President | | President of CSCM (since 2003) and CNS (since 2004). Prior to that, Senior Vice President and Director of Investment Research of CSCM. | | Since 2004 | |
|
| Richard E. Helm Age: 46 | | Vice President | | Senior Vice President CSCM since 2005. Prior to that, Senior Portfolio Manager of WM Advisors, Inc. since 2001, and Vice President and Senior Portfolio Manager of Northwestern Trust and Investors Advisory Company from 1999 to 2001. | | Since 2005 | |
|
Lawrence B. Stoller
Age: 42 | | Secretary | | Executive Vice President and General Counsel of CSCM and CNS since 2004. Secretary of CSSL since 2006. Prior to that, Senior Vice President and General Counsel of CSCM and Assistant Secretary of the Cohen & Steers funds (since 1999) and Chief Legal Officer of CSSL (since 2002). | | Since 2005 | |
|
Jay J. Chen
Age: 42 | | Treasurer and Chief Financial Officer | | Senior Vice President of CSCM since August 2003, President of CSSL since 2006 and prior to that, Assistant Treasurer of CSSL since 2002. Prior to that, Vice President of CSCM. | | Since 2005 | |
|
| Lisa D. Phelan Age: 37 | | Chief Compliance Officer | | Vice President & Director of Compliance of CSCM since January 2006. Chief Compliance Officer of CSSL since 2004. Prior to that, Compliance Officer of CSCM since 2004. Chief Compliance Officer, Avatar Associates & Overture Asset Managers, 2003-2004. First VP, Risk Management, Prudential Securities, Inc. 2000-20003. | | Since 2006 | |
|
John E. McLean
Age: 34 | | Assistant Secretary | | Vice President and Associate General Counsel of CSCM since September 2003. Prior to that, Vice President, Law and Regulation, J&W Seligman & Co. Incorporated (money manager). | | Since 2004 | |
|
* The address of each officer is 280 Park Avenue, New York, NY 10017
** Officers serve one-year terms. The length of time served represents the year in which the officer was first elected to that position in any fund in the Cohen & Steers fund complex. All of the officers listed above are officers of one or more of the other funds in the complex.
32
COHEN & STEERS DIVIDEND VALUE FUND, INC.
Meet the Cohen & Steers family of open-end funds:

• Designed for investors seeking maximum total return, investing primarily in REITs
• Symbol: CSRSX

• Designed for institutional investors seeking maximum total return, investing primarily in REITs
• Symbol: CSRIX

• Designed for investors seeking high current income, investing primarily in REITs
• Symbols: CSEIX, CSBIX, CSCIX, CSDIX

• Designed for investors seeking maximum capital appreciation, investing in a limited number of REITs and other real estate securities
• Symbols: CSFAX, CSFBX, CSFCX, CSSPX

• Designed for investors seeking maximum total return, investing primarily in international real estate securities
• Symbols: IRFAX, IRFCX, IRFIX

• Designed for investors seeking maximum total return, investing primarily in utilities
• Symbols: CSUAX, CSUBX, CSUCX, CSUIX

• Designed for investors seeking high current income and long-term growth of income and capital appreciation, investing primarily in dividend paying common stocks and preferred stocks.
• Symbols: DVFAX, DVFCX, DVFIX
Please consider the investment objectives, risks, charges and expenses of the fund carefully before investing. A prospectus containing this and other information can be obtained by calling 800-330-7348 or by visiting cohenandsteers.com. Please read the prospectus carefully before investing.
Cohen & Steers Securities, LLC, Distributor
33
COHEN & STEERS DIVIDEND VALUE FUND, INC.
OFFICERS AND DIRECTORS
Robert H. Steers
Director and co-chairman
Martin Cohen
Director and co-chairman
Bonnie Cohen
Director
George Grossman
Director
Richard E. Kroon
Director
Richard J. Norman
Director
Frank K. Ross
Director
Willard H. Smith Jr.
Director
C. Edward Ward, Jr.
Director
Adam M. Derechin
President and chief executive officer
Joseph M. Harvey
Vice president
Richard E. Helm
Vice president
Lawrence B. Stoller
Secretary
Jay J. Chen
Treasurer and chief financial officer
Lisa D. Phelan
Chief compliance officer
John E. McLean
Assistant secretary
KEY INFORMATION
Investment Advisor
Cohen & Steers Capital Management, Inc.
280 Park Avenue
New York, NY 10017
(212) 832-3232
Subadministrator and Custodian
State Street Bank and Trust Company
225 Franklin Street
Boston, MA 02110
Transfer Agent
Boston Financial Data Services, Inc.
66 Brooks Drive
Braintree, MA 02184
(800) 437-9912
Legal Counsel
Stroock & Stroock & Lavan LLP
180 Maiden Lane
New York, NY 10038
Distributor
Cohen & Steers Securities, LLC
280 Park Avenue
New York, NY 10017
Nasdaq Symbol: Class A—DVFAX
Class C—DVFCX
Class I—DVFIX
Web site: cohenandsteers.com
This report is authorized for delivery only to shareholders of Cohen & Steers Dividend Value Fund, Inc. unless accompanied or preceded by the delivery of a currently effective prospectus setting forth details of the fund. Past performance is of course no guarantee of future results and your investment may be worth more or less at the time you sell.
34
COHEN & STEERS
DIVIDEND VALUE FUND
280 PARK AVENUE
NEW YORK, NY 10017

ANNUAL REPORT
FEBRUARY 28, 2006
Item 2. Code of Ethics.
The registrant has adopted a Code of Ethics that applies to its Principal Executive Officer and Principal Financial Officer. The registrant undertakes to provide to any person without charge, upon request, a copy of the Code of Ethics. Such request can be by calling 800-330-7348 or writing to the Secretary of the registrant, 280 Park Avenue, New York, NY 10017.
Item 3. Audit Committee Financial Expert.
The registrant’s board has determined that Frank K. Ross, a member of the registrant’s audit committee, is an “audit committee financial expert” and “independent,” as such terms are defined in this Item.
Item 4. Principal Accountant Fees and Services.
(a) – (d) Aggregate fees billed to the registrant for the last two fiscal years for professional services rendered by the registrant’s principal accountant were as follows:
| | 2005 | | 2004 | |
Audit Fees | | $ | 42,000 | | n/a | |
Audit-Related Fees | | — | | n/a | |
Tax Fees | | $ | 12,600 | | n/a | |
All Other Fees | | — | | n/a | |
Tax fees were billed in connection with the preparation of tax returns, calculation and designation of dividends and other miscellaneous tax services.
Aggregate fees billed by the registrant’s principal accountant for the last two fiscal years for non-audit services provided to the registrant’s investment adviser (not including a sub-adviser whose role is primarily portfolio management and is subcontracted or overseen by another investment adviser) and any entity controlling, controlled by, or under common control with the investment adviser that provides ongoing services to the registered investment company, where the engagement relates directly to the operations and financial reporting of the registrant, were as follows:
| | 2005 | | 2004 | |
Audit-Related Fees | | — | | n/a | |
Tax Fees | | — | | n/a | |
All Other Fees | | $ | 85,000 | | n/a | |
| | | | | | |
These other fees were billed in connection with internal control reviews and AIMR performance reviews.
(e)(1) The audit committee is required to pre-approve audit and non-audit services performed for the registrant by the principal accountant. The audit committee also is required to pre-approve non-audit services performed by the registrant’s principal accountant for the registrant’s investment adviser and any sub-adviser (not including any sub-adviser whose role is primarily portfolio management and is subcontracted with or overseen by another investment adviser) and/or to any entity controlling, controlled by or under common control with the registrant’s investment adviser that provides ongoing services to the registrant, if the engagement for services relates directly to the operations and financial reporting of the registrant.
The audit committee may delegate pre-approval authority to one or more of its members who are independent members of the board of directors of the registrant. The member or members to whom such authority is delegated shall report any pre-approval decisions to the audit committee at its next scheduled meeting. The audit committee may not delegate its responsibility to pre-approve services to be performed by the registrant’s principal accountant for the investment adviser.
(e) (2) No services included in (b) – (d) above were approved by the audit committee pursuant to paragraphs (c)(7)(i)(C) of Rule 2-01 of Regulation S-X.
(f) Not applicable.
(g) For the fiscal year ended February 28, 2006, the aggregate fees billed by the registrant’s principal accountant for non-audit services rendered to the registrant and for non-audit services rendered to the registrant’s investment adviser (not including any sub-adviser whose role is primarily portfolio management and is subcontracted with or overseen by another investment adviser) and/or to any entity controlling, controlled by or under common control with the registrant’s investment adviser that provides ongoing services to the registrant was $97,600.
(h) The registrant’s audit committee considered whether the provision of non-audit services that were rendered to the registrant’s investment adviser (not including any sub-adviser whose role is primarily portfolio management and is subcontracted with or overseen by another investment adviser) and/or to any entity controlling, controlled by or under common control with the registrant’s investment adviser that provides ongoing services to the registrant that were not pre-approved pursuant to paragraph (c)(7)(ii) of Rule 2-01 of Regulation S-X was compatible with maintaining the principal accountant’s independence.
Item 5. Audit Committee of Listed Registrants.
Not applicable.
Item 6. Schedule of Investments.
Included in Item 1 above.
Item 7. Disclosure of Proxy Voting Policies and Procedures for Closed-End Management Investment Companies.
Not applicable.
Item 8. Portfolio Managers of Closed-End Investment Companies.
Not applicable.
Item 9. Purchases of Equity Securities by Closed-End Management Investment Company and Affiliated Purchasers.
Not applicable.
Item 10. Submission of Matters to a Vote of Security Holders.
Not applicable.
Item 11. Controls and Procedures.
(a) The registrant’s principal executive officer and principal financial officer have concluded that the registrant’s disclosure controls and procedures are sufficient to ensure that information required to be disclosed by the registrant in this Form N-CSR was recorded, processed, summarized and reported within the time periods specified in the Securities and Exchange Commission’s rules and forms, based upon such officers’ evaluation of these controls and procedures as of a date within 90 days of the filing date of this report.
(b) There were no changes in the registrant’s internal control over financial reporting that occurred during the registrant’s most recent fiscal half-year (the registrant’s second fiscal half-year in the case of an annual report) that has materially affected, or is reasonably likely to materially affect, the registrant’s internal control over financial reporting.
Item 12. Exhibits.
(a)(1) Not applicable.
(a) (2) Certifications of principal executive officer and principal financial officer as required by Rule 30a-2(a) under the Investment Company Act of 1940.
(b) Certifications of chief executive officer and chief financial officer as required by Rule 30a- 2(b) under the Investment Company Act of 1940.
SIGNATURES
Pursuant to the requirements of the Securities Exchange Act of 1934 and the Investment Company Act of 1940, the registrant has duly caused this report to be signed on its behalf by the undersigned, thereunto duly authorized.
COHEN & STEERS DIVIDEND VALUE FUND, INC.
By: | /s/ Adam M. Derechin | |
| Name: Adam M. Derechin |
| Title: President and Chief Executive Officer |
| | | |
Date: May 3, 2006
Pursuant to the requirements of the Securities Exchange Act of 1934 and the Investment Company Act of 1940, this report has been signed below by the following persons on behalf of the registrant and in the capacities and on the dates indicated.
By: | /s/ Adam M. Derechin | |
| Name: | Adam M. Derechin |
| Title: | President and Chief Executive Officer |
| | (principal executive officer) |
| | | | |
By: | /s/ Jay J. Chen | | |
| Name: | Jay J. Chen |
| Title: | Treasurer |
| | (principal financial officer) |
| |
Date: May 3, 2006 | |
| | | | | |