UNITED STATES
SECURITIES AND EXCHANGE COMMISSION
Washington, D.C. 20549
FORM N-CSR
CERTIFIED SHAREHOLDER REPORT OF REGISTERED
MANAGEMENT INVESTMENT COMPANIES
Investment Company Act file number | 811-21668 |
|
Cohen & Steers Dividend Value Fund, Inc. |
(Exact name of registrant as specified in charter) |
|
280 Park Avenue, New York, NY | | 10017 |
(Address of principal executive offices) | | (Zip code) |
|
Adam M. Derechin Cohen & Steers Capital Management, Inc. 280 Park Avenue New York, New York 10017 |
(Name and address of agent for service) |
|
Registrant’s telephone number, including area code: | (212) 832-3232 | |
|
Date of fiscal year end: | February 28 | |
|
Date of reporting period: | February 28, 2007 | |
| | | | | | | | |
Item 1. Reports to Stockholders.
COHEN & STEERS DIVIDEND VALUE FUND, INC.
April 11, 2007
To Our Shareholders:
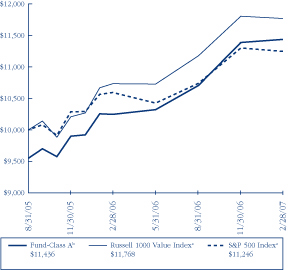
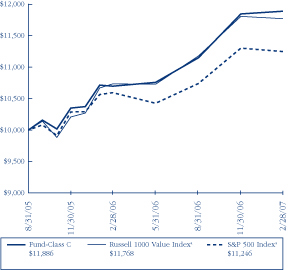
We are pleased to submit to you our report for the year ended February 28, 2007. The net asset values per share at that date were $13.99, $13.94 and $14.00 for Class A, Class C, and Class I shares, respectively. In addition, a dividend was declared for shareholders of record on March 29, 2007 and paid on March 30, 2007 to all three classes of shares. The dividends were as follows: Class A shares—$0.050 per share, Class C shares—$0.032 per share and Class I shares—$0.061 per share.a
The total return, including income and change in net asset value, for Cohen & Steers Dividend Value Fund and the comparative benchmarks were:
| | | Six Months
Ended 2/28/07 | | Year
Ended 2/28/07 | |
| Cohen and Steers Dividend Value Fund—Class A | | | 11.19 | % | | | 17.12 | % | |
| Cohen and Steers Dividend Value Fund—Class C | | | 10.77 | % | | | 16.40 | % | |
| Cohen and Steers Dividend Value Fund—Class I | | | 11.41 | % | | | 17.63 | % | |
| Russell 1000 Value Indexb | | | 9.81 | % | | | 16.62 | % | |
| S&P 500 Indexb | | | 8.93 | % | | | 11.97 | % | |
The performance data quoted represent past performance. Past performance is no guarantee of future results. The investment return and the principal value of an investment will fluctuate and shares, if redeemed, may be worth more or less than their original cost. Current performance may be lower or higher than the performance data quoted. Total returns of the fund current to the most recent month-end can be obtained by visiting our Web site at cohenandsteers.com. Performance quoted does not reflect the deduction of the maximum 4.5% initial sales charge on Class A shares or the 1% maximum contingent deferred sales charge on Class C shares. If such charges were included, returns would have been lower.
a Please note that distributions paid by the fund to shareholders are subject to recharacterization for tax purposes. The final tax treatment of these distributions is reported to shareholders after the close of each fiscal year.
b The Russell 1000 Value Index measures the performance of those Russell 1000 companies with lower price-to-book ratios and lower forecasted growth values. The S&P 500 Index is an unmanaged index of common stocks that is frequently used as a general measure of stock market performance.
1
COHEN & STEERS DIVIDEND VALUE FUND, INC.
Investment Review
The 12-month period ended February 28, 2007, the fiscal year for the fund, was a positive one for U.S. equities, despite occasional volatility. The market struggled early in the period, but then had an extended rally as concerns regarding inflation eased and interest rates steadied following two years of hikes. The economic data seemed to confirm that a mid-cycle economic slowdown—not a recession—was underway. Stocks were also supported by a sharp decline in oil prices from summer highs, solid corporate earnings and the extension of the 15% tax rate on qualified dividends through 2010. However, the period ended on a turbulent note, as investors reexamined risk in the wake of this strong market performance and amid continued evidence of a cooling economy and concerns about the subprime mortgage and housing markets.
Large cap value stocks continued to outperform the broad stock market, generally. All sectors within the Russell 1000 Value Index had positive returns, led by telecommunications (+30%), where M&A activity reignited investor interest after a long period of underperformance. The materials and utilities sectors (up 25% and 23%, respectively) also outperformed, aided by favorable supply/demand fundamentals. Consumer discretionary and consumer staples stocks fared well (both sectors rose 21%), reflecting spending levels that held up better than many expected as the employment picture continued to improve. The health care sector (+6%) was a notable underperformer, as investor concerns centered on potential legislative changes in a shifting political environment.
Aided by industrial and consumer holdings
The fund outperformed its benchmark in the period (except for its Class C shares, which modestly trailed the Russell 1000 Value Index due to the higher expense ratio). Stock selection in the industrials sector was strong, including good showings from the fund's aerospace/defense holdings. Stock selection in both the consumer discretionary and consumer staples sectors was favorable. The fund's utilities stocks outperformed, and its telecommunications holdings collectively rose 42%, countering the effect of our underweighting in the sector. On the negative side, relatively speaking, stock selection in the energy sector detracted from the fund's performance, as did its underweighting in the sector. While telecom and energy stocks often have attractive yields, they tend to be underrepresented by companies showing sustained dividend growth, a key factor in our selection process. Stock selection in the financial services and technology sectors hin dered the fund's performance.
Dividend growth drives our process
Dividend growth, in our view, is associated with healthy balance sheets, solid cash flows and confident managements. We believe that stocks with sustainable dividend growth—supported by relatively low payout ratios—have greater potential to outperform the broad market over time. During the period we were generally able to own companies with historical dividend growth ranging from the high single-digit to low double-digit rates.
We increased our exposure to foreign companies during the period. It is our belief that foreign exchange rates, driven by global interest rates, will keep pressure on the U.S. dollar in the near term, making non-U.S. holdings relatively more attractive. Our foreign allocation is also determined by dividend growth rates in specific companies and the potential benefits of diversifying by economic cycle.
2
COHEN & STEERS DIVIDEND VALUE FUND, INC.
Investment Outlook
Reflective of a typical mid-cycle economic slowdown, we expect growth in the first half of 2007 to be slow before accelerating later in the year. Inflation is likely to moderate, but unit labor costs are a wild card. These conditions will dictate whether the Federal Reserve chooses to cut interest rates—a likely scenario in our view. While the general softness may cause the economy to feel sluggish, related market volatility should provide interesting buying opportunities.
Yet, economic fundamentals remain generally favorable for equities. Valuations are reasonable by historical standards. Corporate earnings are expected to remain strong, though the rate of earnings growth in the U.S. continues to moderate. If low interest rates continue, as we anticipate, the stage should be set for solid overseas performance and strong global earnings growth. Naturally, the ongoing uncertainty in the Middle East as well as the depth of the malaise in the subprime mortgage market remain significant risks.
Quality and income from dividend payers
More than four years into a bull market, the prospects for dividend-paying stocks look strong. This is the point in the equity cycle when long-term investors are most likely to seek quality, stable companies able to produce attractive income. We believe large cap dividend payers can offer these attributes. At this writing, large cap stocks appear attractively priced, trading at around 15 times 2007 operating earnings; we anticipate some market volatility that will present even better buying opportunities.
We believe that dividends and dividend growth are the true indicators of future performance. We will continue to target stable companies with moderate risk, strong cash flow and attractive valuations. Reflecting our view of ample opportunity in a variety of sectors, we remain diversified and fully invested.
Sincerely,
 | |  | |
|
| MARTIN COHEN | | ROBERT H. STEERS | |
|
| Co-chairman | | Co-chairman | |
|

RICHARD E. HELM
Portfolio Manager
3
COHEN & STEERS DIVIDEND VALUE FUND, INC.
The views and opinions in the preceding commentary are as of the date stated and are subject to change. This material represents an assessment of the market environment at a specific point in time, should not be relied upon as investment advice and is not intended to predict or depict performance of any investment.
Visit Cohen & Steers online at cohenandsteers.com
For more information about any of our funds, visit cohenandsteers.com, where you'll find daily net asset values, fund fact sheets and portfolio highlights. You can also access newsletters, education tools and market updates covering REIT, utility and preferred securities sectors.
In addition, our Web site contains comprehensive information about our firm, including our most recent press releases, profiles of our senior investment professionals, and an overview of our investment approach.
4
COHEN & STEERS DIVIDEND VALUE FUND, INC.
Performance Review (Unaudited)
Class A
Growth of a $10,000 Investment
Class C
Growth of a $10,000 Investment
Class I
Growth of a $100,000 Investment

5
COHEN & STEERS DIVIDEND VALUE FUND, INC.
Performance Review (Unaudited)—(Continued)
Average Annual Total Returns — For the Periods Ended February 28, 2007
| | | Class A Shares | | Class C Shares | | Class I Shares | |
| 1 Year (with sales charge) | | | 11.85 | %b | | | 15.40 | %c | | | — | | |
| 1 Year (without sales charge) | | | 17.12 | % | | | 16.40 | % | | | 17.63 | % | |
| Since Inceptiond (with sales charge) | | | 12.97 | %b | | | 15.79 | % | | | — | | |
| Since Inceptiond (without sales charge) | | | 16.51 | % | | | 15.79 | % | | | 16.95 | % | |
The performance data quoted represent past performance. Past performance is no guarantee of future results. The investment return and principal value of an investment will fluctuate and shares, when redeemed, may be worth more or less than their original cost. Current performance may be lower or higher than the performance data quoted. Performance information current to the most recent month-end can be obtained by visiting our Web site at cohenandsteers.com. Fund performance during certain periods reflects strong market performance and/or strong performance of stocks held during those periods. This performance may not be repeated. The performance graph and table do not reflect the deduction of taxes that a shareholder would pay on fund distributions or the redemption of fund shares.
Through February 28, 2008, the fund's advisor has contractually agreed to waive certain fees and/or reimburse the fund for expenses. Absent such arrangements, returns would have been lower.
a The comparative indexes are not adjusted to reflect expenses or other fees that the SEC requires to be reflected in the fund's performance. The fund's performance assumes the reinvestment of all dividends and distributions. For more information, including charges and expenses, please read the prospectus carefully before you invest.
b Reflects a 4.50% front-end sales charge.
c Reflects a contingent deferred sales charge of 1%.
d Inception date of August 31, 2005.
6
COHEN & STEERS DIVIDEND VALUE FUND, INC.
Expense Example
(Unaudited)
As a shareholder of the fund, you incur two types of costs: (1) transaction costs, including sales charges (loads) on purchase payments and redemption fees; and (2) ongoing costs including management fees; distribution and/or service (12b-1) fees; and other fund expenses. This example is intended to help you understand your ongoing costs (in dollars) of investing in the fund and to compare these costs with the ongoing costs of investing in other mutual funds.
The example is based on an investment of $1,000 invested at the beginning of the period and held for the entire period 09/01/06 – 02/28/07.
Actual Expenses
The first line of the table below provides information about actual account values and expenses. You may use the information in this line, together with the amount you invested, to estimate the expenses that you paid over the period. Simply divide your account value by $1,000 (for example, an $8,600 account value divided by $1,000 = 8.6), then multiply the result by the number in the first line under the heading entitled "Expenses Paid During Period" to estimate the expenses you paid on your account during this period.
Hypothetical Example for Comparison Purposes
The second line of the table below provides information about hypothetical account values and hypothetical expenses based on the fund's actual expense ratio and an assumed rate of return of 5% per year before expenses, which is not the fund's actual return. The hypothetical account values and expenses may not be used to estimate the actual ending account balance or expenses you paid for the period. You may use this information to compare the ongoing cost of investing in the fund and other funds. To do so, compare this 5% hypothetical example with the 5% hypothetical examples that appear in the shareholder reports of the other funds.
Please note that the expenses shown in the table are meant to highlight your ongoing costs only and do not reflect any transactional costs, such as sales charges (loads) and redemption fees. Therefore, the second line of the table is useful in comparing ongoing costs only, and will not help you determine the relative total costs of owning different funds. In addition, if these transactional costs were included, your costs would have been higher.
7
COHEN & STEERS DIVIDEND VALUE FUND, INC.
Expense Example (Unaudited)—(Continued)
| | | Beginning
Account Value
09/01/06 | | Ending
Account Value
02/28/07 | | Expenses Paid
During Period*
09/01/06–
02/28/07 | |
| Class A | |
| Actual (11.19% return) | | $ | 1,000.00 | | | $ | 1,111.90 | | | $ | 5.24 | | |
| Hypothetical (5% annual return before expenses) | | $ | 1,000.00 | | | $ | 1,019.84 | | | $ | 5.01 | | |
| Class C | |
| Actual (10.77% return) | | $ | 1,000.00 | | | $ | 1,107.70 | | | $ | 8.62 | | |
| Hypothetical (5% annual return before expenses) | | $ | 1,000.00 | | | $ | 1,016.61 | | | $ | 8.25 | | |
| Class I | |
| Actual (11.41% return) | | $ | 1,000.00 | | | $ | 1,114.10 | | | $ | 3.41 | | |
| Hypothetical (5% annual return before expenses) | | $ | 1,000.00 | | | $ | 1,021.57 | | | $ | 3.26 | | |
* Expenses are equal to the fund's Class A, Class C and Class I annualized expense ratio of 1.00%, 1.65% and 0.65%, respectively, multiplied by the average account value over the period, multiplied by 181/365 (to reflect the one-half year period). If the fund had borne all of its expenses that were assumed by the advisor, the annualized expense ratios would have been 1.69%, 2.37% and 1.35%, respectively.
8
COHEN & STEERS DIVIDEND VALUE FUND, INC.
FEBRUARY 28, 2007
Top Ten Long-Term Holdings
(Unaudited)
| Security | | Market
Value | | % of
Net
Assets | |
| FPL Group | | $ | 1,825,263 | | | | 2.8 | % | |
| Aflac | | | 1,793,600 | | | | 2.7 | | |
| Wells Fargo & Co. | | | 1,613,550 | | | | 2.5 | | |
| Bank of America Corp. | | | 1,561,709 | | | | 2.4 | | |
| AT&T | | | 1,552,960 | | | | 2.4 | | |
| Johnson & Johnson | | | 1,506,895 | | | | 2.3 | | |
| Abbott Laboratories | | | 1,502,050 | | | | 2.3 | | |
| United Parcel Service | | | 1,481,009 | | | | 2.2 | | |
| Procter & Gamble Co. | | | 1,409,478 | | | | 2.1 | | |
| Citigroup | | | 1,365,840 | | | | 2.1 | | |
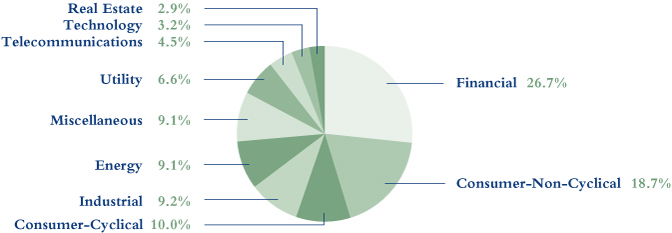
Sector Breakdown
(Based on Net Assets)
(Unaudited)
9
COHEN & STEERS DIVIDEND VALUE FUND, INC.
SCHEDULE OF INVESTMENTS
February 28, 2007
| | | | | Number
of Shares | | Value | |
| COMMON STOCK | | | 95.3 | % | | | | | | | | | |
| BASIC MATERIALS—CHEMICAL | | | 1.2 | % | | | | | | | | | |
| Alcoa | | | | | | | 9,300 | | | $ | 310,713 | | |
| Dow Chemical Co. | | | | | | | 10,400 | | | | 455,520 | | |
| | | | | | | | 766,233 | | |
| COMMERCIAL SERVICES | | | 1.9 | % | | | | | | | | | |
| Fidelity National Information Services | | | | | | | 4,567 | | | | 209,854 | | |
| Paychex | | | | | | | 25,500 | | | | 1,036,065 | | |
| | | | | | | | 1,245,919 | | |
| CONSUMER—CYCLICAL | | | 10.0 | % | | | | | | | | | |
| AIRLINES | | | 0.8 | % | | | | | | | | | |
| Cathay Pacific Airways Ltd. (ADR) (Hong Kong) | | | | | | | 44,000 | | | | 548,900 | | |
| APPAREL | | | 1.3 | % | | | | | | | | | |
| Nike | | | | | | | 8,200 | | | | 856,654 | | |
| AUTO MANUFACTURERS | | | 0.5 | % | | | | | | | | | |
| PACCAR | | | | | | | 5,000 | | | | 347,450 | | |
| AUTO PARTS EQUIPMENT | | | 0.9 | % | | | | | | | | | |
| Johnson Controls | | | | | | | 6,600 | | | | 619,080 | | |
| HOTEL | | | 1.7 | % | | | | | | | | | |
| Harrah's Entertainment | | | | | | | 5,600 | | | | 473,144 | | |
| InterContinental Hotels Group PLC (ADR) (United Kingdom) | | | | | | | 26,012 | | | | 611,022 | | |
| | | | | | | | 1,084,166 | | |
| LEISURE TIME | | | 0.4 | % | | | | | | | | | |
| Carnival Corp. | | | | | | | 5,500 | | | | 255,310 | | |
| RETAIL | | | 4.4 | % | | | | | | | | | |
| Costco Wholesale Corp. | | | | | | | 12,300 | | | | 687,447 | | |
| JC Penney Co. | | | | | | | 7,100 | | | | 575,881 | | |
| Nordstrom | | | | | | | 9,600 | | | | 509,664 | | |
| Wal-Mart de Mexico SA de CV (ADR) (Mexico) | | | | | | | 28,200 | | | | 1,089,930 | | |
| | | | | | | | 2,862,922 | | |
| TOTAL CONSUMER—CYCLICAL | | | | | | | | | | | 6,574,482 | | |
See accompanying notes to financial statements.
10
COHEN & STEERS DIVIDEND VALUE FUND, INC.
SCHEDULE OF INVESTMENTS—(Continued)
February 28, 2007
| | | | | Number
of Shares | | Value | |
| CONSUMER—NON-CYCLICAL | | | 18.7 | % | | | | | | | | | |
| AGRICULTURE | | | 2.5 | % | | | | | | | | | |
| Altria Group | | | | | | | 8,400 | | | $ | 707,952 | | |
| Archer-Daniels-Midland Co. | | | | | | | 4,400 | | | | 151,272 | | |
| Monsanto Co. | | | | | | | 14,400 | | | | 758,736 | | |
| | | | | | | | 1,617,960 | | |
| BEVERAGE | | | 1.7 | % | | | | | | | | | |
| Diageo PLC (ADR) (United Kingdom) | | | | | | | 14,200 | | | | 1,127,338 | | |
| COSMETICS/PERSONAL CARE | | | 2.1 | % | | | | | | | | | |
| Procter & Gamble Co. | | | | | | | 22,200 | | | | 1,409,478 | | |
| FOOD | | | | | | | 1.1 | % | | | | | |
| Hershey Co. | | | | | | | 13,400 | | | | 708,592 | | |
| HEALTHCARE PRODUCTS | | | 4.2 | % | | | | | | | | | |
| Johnson & Johnson | | | | | | | 23,900 | | | | 1,506,895 | | |
| Medtronic | | | | | | | 24,500 | | | | 1,233,820 | | |
| | | | | | | | 2,740,715 | | |
| HEALTHCARE SERVICES | | | 0.3 | % | | | | | | | | | |
| Health Management Associates-Class A | | | | | | | 8,300 | | | | 165,668 | | |
| PHARMACEUTICAL | | | 4.1 | % | | | | | | | | | |
| Abbott Laboratories | | | | | | | 27,500 | | | | 1,502,050 | | |
| Pfizer | | | | | | | 13,800 | | | | 344,448 | | |
| Teva Pharmaceutical Industries Ltd. (ADR) (Israel) | | | | | | | 24,600 | | | | 874,776 | | |
| | | | | | | | 2,721,274 | | |
| RESTAURANT | | | 2.7 | % | | | | | | | | | |
| McDonald's Corp. | | | | | | | 13,500 | | | | 590,220 | | |
| Yum! Brands | | | | | | | 20,700 | | | | 1,199,358 | | |
| | | | | | | | 1,789,578 | | |
| TOTAL CONSUMER—NON-CYCLICAL | | | | | | | | | | | 12,280,603 | | |
See accompanying notes to financial statements.
11
COHEN & STEERS DIVIDEND VALUE FUND, INC.
SCHEDULE OF INVESTMENTS—(Continued)
February 28, 2007
| | | | | Number
of Shares | | Value | |
| ENERGY | | | 9.1 | % | | | | | | | | | |
| OIL & GAS | | | 7.2 | % | | | | | | | | | |
| BP PLC (ADR) (United Kingdom) | | | | | | | 11,500 | | | $ | 708,860 | | |
| ChevronTexaco Corp. | | | | | | | 6,700 | | | | 459,687 | | |
| ConocoPhillips | | | | | | | 7,400 | | | | 484,108 | | |
| Devon Energy Corp. | | | | | | | 11,400 | | | | 749,094 | | |
| Exxon Mobil Corp. | | | | | | | 9,400 | | | | 673,792 | | |
| GlobalSantaFe Corp. | | | | | | | 16,100 | | | | 927,843 | | |
| Petro-Canada (Canada) | | | | | | | 20,100 | | | | 744,504 | | |
| | | | | | | | 4,747,888 | | |
| OIL & GAS SERVICES | | | 1.9 | % | | | | | | | | | |
| Baker Hughes | | | | | | | 10,900 | | | | 709,699 | | |
| Schlumberger Ltd. | | | | | | | 8,700 | | | | 546,360 | | |
| | | | | | | | 1,256,059 | | |
| TOTAL ENERGY | | | | | | | | | | | 6,003,947 | | |
| FINANCIAL | | | 26.7 | % | | | | | | | | | |
| BANK | | | 9.1 | % | | | | | | | | | |
| Bank of America Corp. | | | | | | | 30,700 | | | | 1,561,709 | | |
| HSBC Holdings PLC (ADR) (United Kingdom) | | | | | | | 13,300 | | | | 1,165,080 | | |
| US Bancorp | | | | | | | 33,500 | | | | 1,194,610 | | |
| Washington Mutual | | | | | | | 9,800 | | | | 422,184 | | |
| Wells Fargo & Co. | | | | | | | 46,500 | | | | 1,613,550 | | |
| | | | | | | | 5,957,133 | | |
| DIVERSIFIED FINANCIAL SERVICE | | | 8.0 | % | | | | | | | | | |
| Citigroup | | | | | | | 27,100 | | | | 1,365,840 | | |
| Countrywide Financial Corp. | | | | | | | 9,400 | | | | 359,832 | | |
| Fortress Investment Group LLC | | | | | | | 41,000 | | | | 1,238,200 | | |
| Franklin Resources | | | | | | | 1,700 | | | | 199,563 | | |
| Freddie Mac | | | | | | | 13,100 | | | | 840,758 | | |
| JPMorgan Chase & Co. | | | | | | | 18,400 | | | | 908,960 | | |
| Morgan Stanley | | | | | | | 4,600 | | | | 344,632 | | |
| | | | | | | | 5,257,785 | | |
See accompanying notes to financial statements.
12
COHEN & STEERS DIVIDEND VALUE FUND, INC.
SCHEDULE OF INVESTMENTS—(Continued)
February 28, 2007
| | | | | Number
of Shares | | Value | |
| INSURANCE | | | 9.6 | % | | | | | | | | | |
| ACE Ltd. | | | | | | | 21,400 | | | $ | 1,201,824 | | |
| Aflac | | | | | | | 38,000 | | | | 1,793,600 | | |
| Allstate Corp. | | | | | | | 18,600 | | | | 1,117,116 | | |
| American International Group | | | | | | | 11,300 | | | | 758,230 | | |
| Fidelity National Financial | | | | | | | 11,214 | | | | 269,136 | | |
| HCC Insurance Holdings | | | | | | | 38,100 | | | | 1,194,435 | | |
| | | | | | | | 6,334,341 | | |
| TOTAL FINANCIAL | | | | | | | | | | | 17,549,259 | | |
| INDUSTRIAL | | | 9.2 | % | | | | | | | | | |
| AEROSPACE & DEFENSE | | | 5.1 | % | | | | | | | | | |
| Boeing Co. | | | | | | | 3,400 | | | | 296,718 | | |
| General Dynamics Corp. | | | | | | | 17,500 | | | | 1,338,050 | | |
| Lockheed Martin Corp. | | | | | | | 12,200 | | | | 1,186,816 | | |
| Northrop Grumman Corp. | | | | | | | 7,200 | | | | 517,320 | | |
| | | | | | | | 3,338,904 | | |
| COMPUTERS | | | 0.5 | % | | | | | | | | | |
| International Business Machines Corp. | | | | | | | 3,600 | | | | 334,836 | | |
| DIVERSIFIED MANUFACTURING | | | 1.4 | % | | | | | | | | | |
| General Electric Co. | | | | | | | 26,100 | | | | 911,412 | | |
| TRANSPORTATION | | | 2.2 | % | | | | | | | | | |
| United Parcel Service | | | | | | | 21,100 | | | | 1,481,009 | | |
| TOTAL INDUSTRIAL | | | | | | | | | | | 6,066,161 | | |
| MEDIA | | | 1.3 | % | | | | | | | | | |
| Time Warner | | | | | | | 43,600 | | | | 887,260 | | |
| REAL ESTATE | | | 2.9 | % | | | | | | | | | |
| APARTMENT | | | 0.1 | % | | | | | | | | | |
| AvalonBay Communities | | | | | | | 700 | | | | 96,292 | | |
| DIVERSIFIED | | | 0.2 | % | | | | | | | | | |
| British Land Co., PLC (United Kingdom) | | | | | | | 4,300 | | | | 126,603 | | |
| INDUSTRIAL | | | 0.5 | % | | | | | | | | | |
| ProLogis | | | | | | | 4,500 | | | | 297,585 | | |
See accompanying notes to financial statements.
13
COHEN & STEERS DIVIDEND VALUE FUND, INC.
SCHEDULE OF INVESTMENTS—(Continued)
February 28, 2007
| | | | | Number
of Shares | | Value | |
| OFFICE | | | 1.4 | % | | | | | | | | | |
| Alexandria Real Estate Equities | | | | | | | 3,700 | | | $ | 389,203 | | |
| Corporate Office Properties Trust | | | | | | | 5,700 | | | | 290,814 | | |
| Hongkong Land Holdings Ltd. (USD) (Singapore) | | | | | | | 50,000 | | | | 221,000 | | |
| | | | | | | | 901,017 | | |
| REGIONAL MALL | | | 0.4 | % | | | | | | | | | |
| Simon Property Group | | | | | | | 2,600 | | | | 293,124 | | |
| SELF STORAGE | | | 0.3 | % | | | | | | | | | |
| Public Storage | | | | | | | 1,900 | | | | 192,413 | | |
| TOTAL REAL ESTATE | | | | | | | | | | | 1,907,034 | | |
| TECHNOLOGY | | | 3.2 | % | | | | | | | | | |
| SEMICONDUCTORS | | | 2.1 | % | | | | | | | | | |
| Intel Corp. | | | | | | | 14,400 | | | | 285,840 | | |
| Linear Technology Corp. | | | | | | | 16,000 | | | | 531,040 | | |
| Microchip Technology | | | | | | | 16,800 | | | | 598,080 | | |
| | | | | | | | 1,414,960 | | |
| SOFTWARE | | | 1.1 | % | | | | | | | | | |
| Microsoft Corp. | | | | | | | 25,000 | | | | 704,250 | | |
| TOTAL TECHNOLOGY | | | | | | | | | | | 2,119,210 | | |
| TELECOMMUNICATIONS | | | 4.5 | % | | | | | | | | | |
| AT&T | | | | | | | 42,200 | | | | 1,552,960 | | |
| Nokia Corp. (ADR) (Finland) | | | | | | | 13,200 | | | | 288,156 | | |
| Verizon Communications | | | | | | | 20,800 | | | | 778,544 | | |
| Vodafone Group PLC (ADR) (United Kingdom) | | | | | | | 11,987 | | | | 334,437 | | |
| | | | | | | | 2,954,097 | | |
| UTILITY | | | 6.6 | % | | | | | | | | | |
| ELECTRIC—DISTRIBUTION | | | 0.9 | % | | | | | | | | | |
| Edison International | | | | | | | 12,500 | | | | 586,500 | | |
| ELECTRIC—INTEGRATED | | | 5.7 | % | | | | | | | | | |
| E.ON AG (ADR) (Germany) | | | | | | | 24,200 | | | | 1,055,362 | | |
| Exelon Corp. | | | | | | | 13,500 | | | | 890,055 | | |
| FPL Group | | | | | | | 30,900 | | | | 1,825,263 | | |
| | | | | | | | 3,770,680 | | |
| TOTAL UTILITY | | | | | | | | | | | 4,357,180 | | |
| TOTAL COMMON STOCK (Identified cost—$58,821,641) | | | | | | | | | | | 62,711,385 | | |
See accompanying notes to financial statements.
14
COHEN & STEERS DIVIDEND VALUE FUND, INC.
SCHEDULE OF INVESTMENTS—(Continued)
February 28, 2007
| | | | | Principal
Amount | | Value | |
| COMMERCIAL PAPER | | | 7.8 | % | | | | | | | |
| Citigroup Funding, 4.15%, due 3/1/07 | | | | | | $ | 3,000,000 | | | $ | 3,000,000 | | |
| San Paolo U.S. Finance Co., 4.15%, due 3/1/07 | | | | | | | 2,169,000 | | | | 2,169,000 | | |
TOTAL COMMERCIAL PAPER
(Identified cost—$5,169,000) | | | | | | | | | 5,169,000 | | |
| TOTAL INVESTMENTS (Identified cost—$63,990,641) | | | 103.1 | % | | | | | 67,880,385 | | |
| LIABILITIES IN EXCESS OF OTHER ASSETS | | | (3.1 | )% | | | | | (2,049,399 | ) | |
| NET ASSETS | | | 100.0 | % | | | | $ | 65,830,986 | | |
Glossary of Portfolio Abbreviations
ADR American Depositary Receipt
USD United States Dollar
Note: Percentages indicated are based on the net assets of the fund.
See accompanying notes to financial statements.
15
COHEN & STEERS DIVIDEND VALUE FUND, INC.
STATEMENT OF ASSETS AND LIABILITIES
February 28, 2007
| ASSETS: | |
| Investments in securities, at value (Identified cost—$63,990,641) | | $ | 67,880,385 | | |
| Receivable for fund shares sold | | | 559,637 | | |
| Receivable due from advisor | | | 172,161 | | |
| Dividends receivable | | | 120,232 | | |
| Receivable for investment securities sold | | | 65,451 | | |
| Other assets | | | 1,156 | | |
| Total Assets | | | 68,799,022 | | |
| LIABILITIES: | |
| Payable for investment securities purchased | | | 2,875,265 | | |
| Payable for directors' fees | | | 18,768 | | |
| Payable for administration fees | | | 12,605 | | |
| Payable for distribution fees | | | 1,766 | | |
| Payable for fund shares redeemed | | | 1,522 | | |
| Payable for shareholder servicing fees | | | 645 | | |
| Other liabilities | | | 57,465 | | |
| Total Liabilities | | | 2,968,036 | | |
| NET ASSETS | | $ | 65,830,986 | | |
| NET ASSETS consist of: | |
| Paid-in capital | | $ | 61,425,542 | | |
| Accumulated undistributed net investment income | | | 119,125 | | |
| Accumulated undistributed net realized gain on investments | | | 396,575 | | |
| Net unrealized appreciation on investments | | | 3,889,744 | | |
| | | $ | 65,830,986 | | |
See accompanying notes to financial statements.
16
COHEN & STEERS DIVIDEND VALUE FUND, INC.
STATEMENT OF ASSETS AND LIABILITIES—(Continued)
February 28, 2007
| CLASS A SHARES: | |
| NET ASSETS | | $ | 41,671,470 | | |
| Shares issued and outstanding ($0.001 par value common stock outstanding) | | | 2,978,672 | | |
| Net asset value and redemption price per share | | $ | 13.99 | | |
| Maximum offering price per share ($13.99 ÷ 0.955)a | | $ | 14.65 | | |
| CLASS C SHARES: | |
| NET ASSETS | | $ | 14,728,569 | | |
| Shares issued and outstanding ($0.001 par value common stock outstanding) | | | 1,056,562 | | |
| Net asset value and offering price per shareb | | $ | 13.94 | | |
| CLASS I SHARES: | |
| NET ASSETS | | $ | 9,430,947 | | |
| Shares issued and outstanding ($0.001 par value common stock outstanding) | | | 673,671 | | |
| Net asset value, offering and redemption price per share | | $ | 14.00 | | |
a On investments of $100,000 or more, the offering price is reduced.
b Redemption price per share is equal to the net asset value per share less any applicable deferred sales charge of 1% on shares held for less than one year.
See accompanying notes to financial statements.
17
COHEN & STEERS DIVIDEND VALUE FUND, INC.
STATEMENT OF OPERATIONS
For the Year Ended February 28, 2007
| Investment Income: | |
| Dividend income (net of $2,064 of foreign withholding tax) | | $ | 762,048 | | |
| Interest income | | | 77,090 | | |
| Total Income | | | 839,138 | | |
| Expenses: | |
| Investment advisory fees | | | 252,104 | | |
| Offering costs | | | 68,297 | | |
| Distribution fees—Class A | | | 45,673 | | |
| Distribution fees—Class C | | | 59,340 | | |
| Professional fees | | | 75,791 | | |
| Registration and filing fees | | | 53,456 | | |
| Directors' fees and expenses | | | 51,750 | | |
| Administration fees | | | 49,426 | | |
| Shareholder servicing fees—Class A | | | 18,269 | | |
| Shareholder servicing fees—Class C | | | 19,780 | | |
| Custodian fees and expenses | | | 37,554 | | |
| Shareholder reporting expenses | | | 33,901 | | |
| Transfer agent fees | | | 24,754 | | |
| Line of credit fees and expenses | | | 1,117 | | |
| Miscellaneous | | | 9,923 | | |
| Total Expenses | | | 801,135 | | |
| Reduction of Expenses | | | (453,575 | ) | |
| Net Expenses | | | 347,560 | | |
| Net Investment Income | | | 491,578 | | |
| Net Realized and Unrealized Gain on Investments: | |
| Net realized gain (loss) on: | |
| Investments | | | 949,357 | | |
| Foreign currency transactions | | | (315 | ) | |
| Net realized gain | | | 949,042 | | |
| Net change in unrealized appreciation on investments | | | 3,546,437 | | |
| Net realized and unrealized gain on investments | | | 4,495,479 | | |
| Net Increase in Net Assets Resulting from Operations | | $ | 4,987,057 | | |
See accompanying notes to financial statements.
18
COHEN & STEERS DIVIDEND VALUE FUND, INC.
STATEMENT OF CHANGES IN NET ASSETS
| | | For the
Year Ended
February 28, 2007 | | For the Period
August 31, 2005a
through
February 28, 2006 | |
| Change in Net Assets: | |
| From Operations: | |
| Net investment income | | $ | 491,578 | | | $ | 37,388 | | |
| Net realized gain | | | 949,042 | | | | 42,765 | | |
| Net change in unrealized appreciation on investments | | | 3,546,437 | | | | 343,307 | | |
| Net increase in net assets resulting from operations | | | 4,987,057 | | | | 423,460 | | |
| Dividends and Distributions to Shareholders from: | |
| Net investment income: | |
| Class A | | | (247,489 | ) | | | (6,033 | ) | |
| Class C | | | (69,277 | ) | | | (4,200 | ) | |
| Class I | | | (92,305 | ) | | | (10,880 | ) | |
| Net realized gain on investments: | |
| Class A | | | (374,023 | ) | | | — | | |
| Class C | | | (135,463 | ) | | | — | | |
| Class I | | | (86,033 | ) | | | — | | |
| Total dividends and distributions to shareholders | | | (1,004,590 | ) | | | (21,113 | ) | |
| Capital Stock Transactions: | |
| Increase in net assets from fund share transactions | | | 47,803,245 | | | | 13,542,652 | | |
| Total increase in net assets | | | 51,785,712 | | | | 13,944,999 | | |
| Net Assets: | |
| Beginning of period | | | 14,045,274 | | | | 100,275 | | |
| End of periodb | | $ | 65,830,986 | | | $ | 14,045,274 | | |
a Commencement of operations.
b Includes undistributed net investment income of $119,125 and $24,130, respectively.
See accompanying notes to financial statements.
19
COHEN & STEERS DIVIDEND VALUE FUND, INC.
FINANCIAL HIGHLIGHTS
The following table includes selected data for a share outstanding throughout each period and other performance information derived from the financial statements. It should be read in conjunction with the financial statements and notes thereto.
| | | Class A | |
| Per Share Operating Performance: | | For the
Year Ended
February 28, 2007 | | For the Period
August 31, 2005a
through
February 28, 2006 | |
| Net asset value, beginning of period | | $ | 12.26 | | | $ | 11.46 | | |
| Income from investment operations: | |
| Net investment incomeb | | | 0.22 | | | | 0.07 | | |
| Net realized and unrealized gain on investments | | | 1.86 | | | | 0.77 | | |
| Total income from investment operations | | | 2.08 | | | | 0.84 | | |
| Less dividends and distributions to shareholders from: | |
| Net investment income | | | (0.18 | ) | | | (0.04 | ) | |
| Net realized gain on investments | | | (0.17 | ) | | | — | | |
| Total dividends and distributions to shareholders | | | (0.35 | ) | | | (0.04 | ) | |
| Redemption fees retained by the fund | | | 0.00 | c | | | 0.00 | c | |
| Net increase in net asset value | | | 1.73 | | | | 0.80 | | |
| Net asset value, end of period | | $ | 13.99 | | | $ | 12.26 | | |
| Total investment returnd | | | 17.12 | % | | | 7.29 | %e | |
| Ratios/Supplemental Data: | |
| Net assets, end of period (in millions) | | $ | 41.7 | | | $ | 6.6 | | |
| Ratio of expenses to average daily net assets (before expense reduction) | | | 2.33 | %g | | | 7.02 | %f | |
| Ratio of expenses to average daily net assets (net of expense reduction) | | | 1.00 | % | | | 1.28 | %f | |
| Ratio of net investment income (loss) to average daily net assets (before expense reduction) | | | 0.30 | % | | | (4.66 | )%f | |
| Ratio of net investment income to average daily net assets (net of expense reduction) | | | 1.63 | % | | | 1.08 | %f | |
| Portfolio turnover rate | | | 30 | % | | | 8 | %e | |
a Commencement of operations.
b Calculated based on the average shares outstanding during the period.
c Less than $0.005 per share.
d Does not reflect sales charges, which would reduce return.
e Not annualized.
f Annualized.
g Due to the significant growth of net assets on a small asset base, the expense ratio, when averaged over the year, differs from the fund's other classes by an amount other than the class specific expenses. Typically, the ratios between classes will only differ by the class specific expenses (i.e., distribution fees and shareholder servicing fees).
See accompanying notes to financial statements.
20
COHEN & STEERS DIVIDEND VALUE FUND, INC.
FINANCIAL HIGHLIGHTS—(Continued)
| | | Class C | |
| Per Share Operating Performance: | | For the
Year Ended
February 28, 2007 | | For the Period
August 31, 2005a
through
February 28, 2006 | |
| Net asset value, beginning of period | | $ | 12.23 | | | $ | 11.46 | | |
| Income from investment operations: | |
| Net investment incomeb | | | 0.14 | | | | 0.03 | | |
| Net realized and unrealized gain on investments | | | 1.86 | | | | 0.77 | | |
| Total income from investment operations | | | 2.00 | | | | 0.80 | | |
| Less dividends and distributions to shareholders from: | |
| Net investment income | | | (0.12 | ) | | | (0.03 | ) | |
| Net realized gain on investments | | | (0.17 | ) | | | — | | |
| Total dividends and distributions to shareholders | | | (0.29 | ) | | | (0.03 | ) | |
| Redemption fees retained by the fund | | | 0.00 | c | | | 0.00 | c | |
| Net increase in net asset value | | | 1.71 | | | | 0.77 | | |
| Net asset value, end of period | | $ | 13.94 | | | $ | 12.23 | | |
| Total investment returnd | | | 16.40 | % | | | 6.96 | %e | |
| Ratios/Supplemental Data: | |
| Net assets, end of period (in millions) | | $ | 14.7 | | | $ | 3.8 | | |
| Ratio of expenses to average daily net assets (before expense reduction) | | | 3.21 | %g | | | 7.93 | %f | |
| Ratio of expenses to average daily net assets (net of expense reduction) | | | 1.65 | % | | | 1.95 | %f | |
| Ratio of net investment income (loss) to average daily net assets (before expense reduction) | | | (0.50 | )% | | | (5.53 | )%f | |
| Ratio of net investment income to average daily net assets (net of expense reduction) | | | 1.06 | % | | | 0.45 | %f | |
| Portfolio turnover rate | | | 30 | % | | | 8 | %e | |
a Commencement of operations.
b Calculated based on the average shares outstanding during the period.
c Less than $0.005 per share.
d Does not reflect sales charges, which would reduce return.
e Not annualized.
f Annualized.
g Due to the significant growth of net assets on a small asset base, the expense ratio, when averaged over the year, differs from the fund's other classes by an amount other than the class specific expenses. Typically, the ratios between classes will only differ by the class specific expenses (i.e., distribution fees and shareholder servicing fees).
See accompanying notes to financial statements.
21
COHEN & STEERS DIVIDEND VALUE FUND, INC.
FINANCIAL HIGHLIGHTS—(Continued)
| | | Class I | |
| Per Share Operating Performance: | | For the
Year Ended
February 28, 2007 | | For the Period
August 31, 2005a
through
February 28, 2006 | |
| Net asset value, beginning of period | | $ | 12.27 | | | $ | 11.46 | | |
| Income from investment operations: | |
| Net investment incomeb | | | 0.27 | | | | 0.09 | | |
| Net realized and unrealized gain on investments | | | 1.87 | | | | 0.76 | | |
| Total income from investment operations | | | 2.14 | | | | 0.85 | | |
| Less dividends and distributions to shareholders from: | |
| Net investment income | | | (0.24 | ) | | | (0.04 | ) | |
| Net realized gain on investments | | | (0.17 | ) | | | — | | |
| Total dividends and distributions to shareholders | | | (0.41 | ) | | | (0.04 | ) | |
| Redemption fees retained by the fund | | | 0.00 | c | | | 0.00 | c | |
| Net increase in net asset value | | | 1.73 | | | | 0.81 | | |
| Net asset value, end of period | | $ | 14.00 | | | $ | 12.27 | | |
| Total investment return | | | 17.63 | % | | | 7.42 | %d | |
| Ratios/Supplemental Data: | |
| Net assets, end of period (in millions) | | $ | 9.4 | | | $ | 3.7 | | |
| Ratio of expenses to average daily net assets (before expense reduction) | | | 2.27 | %f | | | 11.99 | %e | |
| Ratio of expenses to average daily net assets (net of expense reduction) | | | 0.65 | % | | | 1.07 | %e | |
| Ratio of net investment income (loss) to average daily net assets (before expense reduction) | | | 0.45 | % | | | (9.43 | )%e | |
| Ratio of net investment income to average daily net assets (net of expense reduction) | | | 2.06 | % | | | 1.49 | %e | |
| Portfolio turnover rate | | | 30 | % | | | 8 | %d | |
a Commencement of operations.
b Calculated based on the average shares outstanding during the period.
c Less than $0.005 per share.
d Not annualized.
e Annualized.
f Due to the significant growth of net assets on a small asset base, the expense ratio, when averaged over the year, differs from the fund's other classes by an amount other than the class specific expenses. Typically, the ratios between classes will only differ by the class specific expenses (i.e., distribution fees and shareholder servicing fees).
See accompanying notes to financial statements.
22
COHEN & STEERS DIVIDEND VALUE FUND, INC.
NOTES TO FINANCIAL STATEMENTS
Note 1. Significant Accounting Policies
Cohen & Steers Dividend Value Fund, Inc. (the fund) was incorporated under the laws of the State of Maryland on November 9, 2004 and is registered under the Investment Company Act of 1940, as amended, as a nondiversified, open-end management investment company. The fund's investment objectives are to provide a relatively high level of current income and long term growth of income and capital appreciation. The fund had no operations until July 22, 2005 when it sold 100 shares each of Class A, C, and 8,550 shares of Class I for $100,275 to Cohen & Steers Capital Management, Inc. (the advisor). Investment operations commenced on August 31, 2005. The authorized shares of the fund are divided into three classes designated Class A, C, and I shares. Each of the fund's shares has equal dividend, liquidation and voting rights (except for matters relating to distributions and shareholder servicing of such shares).
The following is a summary of significant accounting policies consistently followed by the fund in the preparation of its financial statements. The policies are in conformity with accounting principles generally accepted in the United States of America (GAAP). The preparation of the financial statements in accordance with GAAP requires management to make estimates and assumptions that affect the reported amounts of assets and liabilities at the date of the financial statements and the reported amounts of income and expenses during the reporting period. Actual results could differ from those estimates.
Portfolio Valuation: Investments in securities that are listed on the New York Stock Exchange are valued, except as indicated below, at the last sale price reflected at the close of the New York Stock Exchange on the business day as of which such value is being determined. If there has been no sale on such day, the securities are valued at the mean of the closing bid and asked prices for the day or, if no asked price is available, at the bid price.
Securities not listed on the New York Stock Exchange but listed on other domestic or foreign securities exchanges or admitted to trading on the National Association of Securities Dealers Automated Quotations, Inc. (Nasdaq) national market system are valued in a similar manner. Securities traded on more than one securities exchange are valued at the last sale price on the business day as of which such value is being determined as reflected on the tape at the close of the exchange representing the principal market for such securities.
Readily marketable securities traded in the over-the-counter market, including listed securities whose primary market is believed by the advisor to be over-the-counter, but excluding securities admitted to trading on the Nasdaq National List, are valued at the official closing prices as reported by Nasdaq, the National Quotation Bureau, or such other comparable sources as the Board of Directors deem appropriate to reflect their fair market value. If there has been no sale on such day, the securities are valued at the mean of the closing bid and asked prices for the day, or if no asked price is available, at the bid price. Where securities are traded on more than one exchange and also over-the-counter, the securities will generally be valued using the quotations the Board of Directors believes most closely reflect the value of such securities.
23
COHEN & STEERS DIVIDEND VALUE FUND, INC.
NOTES TO FINANCIAL STATEMENTS—(Continued)
Securities for which market prices are unavailable, or securities for which the advisor determines that bid and/or asked price does not reflect market value, will be valued at fair value pursuant to procedures approved by the fund's Board of Directors. Circumstances in which market prices may be unavailable include, but are not limited to, when trading in a security is suspended, the exchange on which the security is traded is subject to an unscheduled close or disruption or material events occur after the close of the exchange on which the security is principally traded. In these circumstances, the fund determines fair value in a manner that fairly reflects the market value of the security on the valuation date based on consideration of any information or factors it deems appropriate. These may include recent transactions in comparable securities, information relating to the specific security and developments in the markets.
The fund's use of fair value pricing may cause the net asset value of fund shares to differ from the net asset value that would be calculated using market quotations. Fair value pricing involves subjective judgments and it is possible that the fair value determined for a security may be materially different than the value that could be realized upon the sale of that security.
Short-term debt securities, which have a maturity date of 60 days or less, are valued at amortized cost, which approximates value.
Security Transactions and Investment Income: Security transactions are recorded on trade date. Realized gains and losses on investments sold are recorded on the basis of identified cost. Interest income is recorded on the accrual basis. Discounts are accreted and premiums are amortized over the life of the respective securities. Dividend income is recorded on the ex-dividend date except for certain dividends on foreign securities, which are recorded as soon as the fund is informed after the ex-dividend date. The fund records distributions received in excess of income from underlying investments as a reduction of cost of investments and/or realized gain. Such amounts are based on estimates if actual amounts are not available and actual amounts of income, realized gain and return of capital may differ from the estimated amounts. The fund adjusts the estimated amount s of the components of distributions (and consequently its net investment income) as an increase to unrealized appreciation/(depreciation) and realized gain/(loss) on investments as necessary once the issuers provide information about the actual composition of the distributions. Income, expenses (other than expenses attributable to a specific class), and realized and unrealized gains or losses on investments are allocated to each class of shares based on its relative net assets.
Foreign Currency Translation and Forward Foreign Currency Contracts: The books and records of the fund are maintained in U.S. dollars as follows: (1) the foreign currency market value of investment securities, other assets and liabilities and forward foreign currency contracts (forward contracts) are translated at the exchange rates prevailing at the end of the period; and (2) purchases, sales, income and expenses are translated at the exchange rates prevailing on the respective dates of such transactions. The resultant exchange gains and losses are recorded as realized and unrealized gain/loss on foreign exchange transactions. Pursuant to U.S. federal income tax
24
COHEN & STEERS DIVIDEND VALUE FUND, INC.
NOTES TO FINANCIAL STATEMENTS—(Continued)
regulations, certain foreign exchange gains/losses included in realized and unrealized gain/loss are included in or are a reduction of ordinary income for federal income tax purposes. The fund does not isolate that portion of the results of operations arising as a result of changes in the foreign exchange rates from the changes in the market prices of the securities. Forward contracts are valued daily at the appropriate exchange rates. The resultant unrealized exchange gains and losses are recorded as unrealized foreign currency gain or loss. The fund records realized gains or losses on delivery of the currency or at the time the forward contract is extinguished (compensated) by entering into a closing transaction prior to delivery.
Foreign Securities: The fund may directly purchase securities of foreign issuers. Investing in securities of foreign issuers involves special risks not typically associated with investing in securities of U.S. issuers. The risks include possible revaluation of currencies, the ability to repatriate funds, less complete financial information about companies and possible future adverse political and economic developments. Moreover, securities of many foreign issuers and their markets may be less liquid and their prices more volatile than those of securities of comparable U.S. issuers.
Dividends and Distributions to Shareholders: Dividends from net investment income and capital gain distributions are determined in accordance with U.S. federal income tax regulations, which may differ from GAAP. Dividends from net investment income are declared and paid quarterly. Net realized capital gains, unless offset by any available capital loss carryforward, are distributed to shareholders annually. Dividends and distributions to shareholders are recorded on the ex-dividend date and are automatically reinvested in full and fractional shares of the fund based on the net asset value per share at the close of business on the ex-dividend date unless the shareholder has elected to have them paid in cash.
Distributions paid by the fund are subject to recharacterization for tax purposes. Based upon the results of operations for the year ended February 28, 2007, a portion of the dividends have been reclassified to distributions of net realized capital gains.
Federal Income Taxes: It is the policy of the fund to continue to qualify as a regulated investment company, if such qualification is in the best interest of the shareholders, by complying with the requirements of Subchapter M of the Internal Revenue Code applicable to regulated investment companies, and by distributing substantially all of its taxable earnings to its shareholders. Accordingly, no provision for federal income or excise tax is necessary.
Note 2. Investment Advisory and Administration Fees and Other Transactions with Affiliates
Investment Advisory Fees: Pursuant to an investment advisory agreement (the advisory agreement) with the fund, the advisor provides the fund with the day-to-day investment decisions and generally manages the fund's investments in accordance with the stated policies of the fund, subject to the supervision of the fund's Board of Directors. For the services provided to the fund, the advisor receives a fee, accrued daily and paid monthly, at the
25
COHEN & STEERS DIVIDEND VALUE FUND, INC.
NOTES TO FINANCIAL STATEMENTS—(Continued)
annual rate of 0.80% of the average daily net assets of the fund up to and including $1.5 billion and 0.70% of the average daily net asset above $1.5 billion.
For the year ended February 28, 2007 and through February 28, 2008, the advisor has contractually agreed to waive its fee and/or reimburse the fund for expenses incurred to the extent necessary to maintain the fund's operating expenses at an annual rate of 1.00% of average daily net assets for Class A shares, 1.65% for Class C shares and 0.65% for Class I shares. During the year ended February 28, 2007, the advisor waived and reimbursed $424,265 in expenses.
Administration Fees: The fund has entered into an administration agreement with the advisor under which the advisor performs certain administrative functions for the fund and receives a fee, accrued daily and paid monthly, at the annual rate of 0.04% of the fund's average daily net assets. For the year ended February 28, 2007, the fund paid the advisor $12,605 in fees under this administration agreement. Additionally, the fund has retained State Street Bank and Trust Company as sub-administrator under a fund accounting and administration agreement.
Distribution Fees: Cohen & Steers Securities, LLC (the distributor), an affiliated entity of the advisor, distributes the shares of the fund. The fund has adopted a distribution plan (the plan) pursuant to Rule 12b-1 under the Investment Company Act of 1940. Under the plan, the fund may not incur distribution fees which exceed an annual rate of 0.25% of the average daily net assets attributable to the Class A shares and 0.75% of the average daily net assets attributable to the Class C shares.
For the year ended February 28, 2007, the fund has been advised that the distributor received $22,615 in sales commissions from the sale of Class A shares and that the distributor also received $1,545 of contingent deferred sales charges relating to redemptions of Class C shares. The distributor has advised the fund that proceeds from the contingent deferred sales charge on the Class C shares are paid to the distributor and are used by the distributor to defray its expenses related to providing distribution-related services to the fund in connection with the sale of the Class C shares, including payments to dealers and other financial intermediaries for selling Class C shares and interest and other financing costs associated with Class C shares.
Shareholder Servicing Fees: The fund has adopted a shareholder services plan which provides that the fund may obtain the services of qualified financial institutions to act as shareholder servicing agents for their customers. For these services, the fund may pay the shareholder servicing agent a fee, accrued daily and paid monthly, at an annual rate of up to 0.10% of the average daily net asset value of the fund's Class A shares and up to 0.25% of the average daily net asset value of the fund's Class C shares.
Directors' and Officers' Fees: Certain directors and officers of the fund are also directors, officers, and/or employees of the advisor. The fund does not pay compensation to any affiliated directors and officers except for the Chief Compliance Officer, who received $386 from the fund for the year ended February 28, 2007.
Offering Costs: The advisor incurred offering costs on behalf of the fund in the amount of $136,221, which were reimbursed by the fund net of any operating expense waivers. Such expenses were fully amortized as of August 31, 2006.
26
COHEN & STEERS DIVIDEND VALUE FUND, INC.
NOTES TO FINANCIAL STATEMENTS—(Continued)
Other: At February 28, 2007, there was one investor owning 5.1% of the fund's outstanding shares. Investment activities of this shareholder could have a significant impact on the fund. Additionally, the advisor owned 274,591 shares or 5.8% of the fund.
Note 3. Purchases and Sales of Securities
Purchases and sales of securities, excluding short-term investments, for the year ended February 28, 2007, totaled $54,479,502 and $9,345,153 respectively.
Note 4. Income Tax Information
The tax character of dividends and distributions paid was as follows:
| | | For the
Year Ended
February 28, 2007 | | For the Period
August 31, 2005a
through
February 28, 2006 | |
| Ordinary income | | $ | 985,256 | | | $ | 21,113 | | |
| Long-term capital gains | | | 19,334 | | | | — | | |
| Total dividends and distributions | | $ | 1,004,590 | | | $ | 21,113 | | |
As of February 28, 2007, the tax-basis components of accumulated earnings and the federal tax cost were as follows:
| Gross unrealized appreciation | | $ | 4,455,060 | | |
| Gross unrealized depreciation | | | (569,104 | ) | |
| Net unrealized appreciation | | $ | 3,885,956 | | |
| Undistributed ordinary income | | $ | 119,125 | | |
| Undistributed long-term capital gains | | $ | 400,363 | | |
| Cost for federal income tax purposes | | $ | 63,994,429 | | |
As of February 28, 2007, the fund had temporary book/tax differences primarily attributable to wash sales on portfolio securities and permanent book/tax differences primarily attributable to offering cost adjustments. To reflect reclassifications arising from the permanent differences, paid-in capital was charged $12,775, accumulated undistributed net realized gain was credited $287 and accumulated net investment income was credited $12,488.
a Commencement of operations.
27
COHEN & STEERS DIVIDEND VALUE FUND, INC.
NOTES TO FINANCIAL STATEMENTS—(Continued)
Note 5. Capital Stock
The fund is authorized to issue 200 million shares of capital stock, at a par value of $0.001 per share. The Board of Directors of the fund may increase or decrease the aggregate number of shares of common stock that the fund has authority to issue. Transactions in fund shares were as follows:
| | | For the
Year Ended
February 28, 2007 | | For the Period
August 31, 2005a
through
February 28, 2006 | |
| | | Shares | | Amount | | Shares | | Amount | |
| Class A: | |
| Sold | | | 2,511,166 | | | $ | 33,709,069 | | | | 540,115 | | | $ | 6,510,085 | | |
Issued as reinvestment of dividends
and distributions | | | 29,444 | | | | 403,136 | | | | 214 | | | | 2,564 | | |
| Redeemed | | | (100,027 | ) | | | (1,335,060 | ) | | | (2,340 | ) | | | (28,124 | ) | |
| Redemption fees retained by the fundb | | | — | | | | 2,831 | | | | — | | | | 33 | | |
| Net increase | | | 2,440,583 | | | $ | 32,779,976 | | | | 537,989 | | | $ | 6,484,558 | | |
| Class C: | |
| Sold | | | 774,135 | | | $ | 10,309,683 | | | | 324,592 | | | $ | 3,898,126 | | |
Issued as reinvestment of dividends
and distributions | | | 2,441 | | | | 33,448 | | | | 12 | | | | 139 | | |
| Redeemed | | | (30,672 | ) | | | (417,666 | ) | | | (14,046 | ) | | | (168,303 | ) | |
| Redemption fees retained by the fundb | | | — | | | | 1,336 | | | | — | | | | 23 | | |
| Net increase | | | 745,904 | | | $ | 9,926,801 | | | | 310,558 | | | $ | 3,729,985 | | |
| Class I: | |
| Sold | | | 391,080 | | | $ | 5,286,416 | | | | 287,936 | | | $ | 3,317,186 | | |
Issued as reinvestment of dividends
and distributions | | | 7,704 | | | | 105,740 | | | | 906 | | | | 10,880 | | |
| Redeemed | | | (22,505 | ) | | | (297,381 | ) | | | — | | | | — | | |
| Redemption fees retained by the fundb | | | — | | | | 1,693 | | | | — | | | | 43 | | |
| Net increase | | | 376,279 | | | $ | 5,096,468 | | | | 288,842 | | | $ | 3,328,109 | | |
a Commencement of operations
b The fund may charge a 1% redemption fee on shares sold within six months of the time of purchase.
28
COHEN & STEERS DIVIDEND VALUE FUND, INC.
NOTES TO FINANCIAL STATEMENTS—(Continued)
Note 6. Borrowings
The fund, in conjunction with other Cohen & Steers funds is a party to a $150,000,000 syndicated credit agreement (the credit agreement) with State Street Bank and Trust Company, as administrative agent and operations agent, and the lenders identified in the credit agreement, which expires December 2007. The Fund pays a commitment fee of 0.10% per annum on its proportionate share of the unused portion of the credit agreement.
During the year ended February 28, 2007, the fund did not utilize the line of credit.
Note 7. Other
In the normal course of business, the fund enters into contracts that provide general indemnifications. The fund's maximum exposure under these arrangements is dependent on claims that may be made against the fund in the future and, therefore, cannot be estimated; however, based on experience, the risk of material loss from such claims is considered remote.
Note 8. New Accounting Pronouncements
In July 2006, the Financial Accounting Standards Board (FASB) issued Interpretation 48, Accounting for Uncertainty in Income Taxes—an interpretation of FASB Statement 109 (FIN 48). FIN 48 clarifies the accounting for income taxes by prescribing the minimum recognition threshold a tax position must meet before being recognized in the financial statements. FIN 48 is effective for fiscal years beginning after December 15, 2006. The fund will adopt FIN 48 no later than August 31, 2007 and the impact to the fund's financial statements, if any, is currently being assessed.
In September 2006, Statement of Financial Accounting Standards No. 157, Fair Value Measurements (SFAS 157), was issued and is effective for fiscal years beginning after November 15, 2007. SFAS 157 defines fair value, establishes a framework for measuring fair value and expands disclosures about fair value measurements. Management is currently evaluating the impact the adoption of SFAS 157 will have on the Fund's financial statements.
29
COHEN & STEERS DIVIDEND VALUE FUND, INC.
REPORT OF INDEPENDENT REGISTERED PUBLIC ACCOUNTING FIRM
To the Board of Directors and Shareholders of
Cohen & Steers Dividend Value Fund, Inc.
In our opinion, the accompanying statement of assets and liabilities, including the schedule of investments, and the related statements of operations and of changes in net assets and the financial highlights present fairly, in all material respects, the financial position of Cohen & Steers Dividend Value Fund, Inc. (the "Fund") at February 28, 2007, and the results of its operations for the year then ended, the changes in its net assets and the financial highlights for the year then ended and the period August 31, 2005 (commencement of operations) through February 28, 2006, in conformity with accounting principles generally accepted in the United States of America. These financial statements and financial highlights (hereafter referred to as "financial statements") are the responsibility of the Fund's management; our responsibility is to express an opinion on these financial statements based on our audits. We conducted our audits of thes e financial statements in accordance with the standards of the Public Company Accounting Oversight Board (United States). Those standards require that we plan and perform the audit to obtain reasonable assurance about whether the financial statements are free of material misstatement. An audit includes examining, on a test basis, evidence supporting the amounts and disclosures in the financial statements, assessing the accounting principles used and significant estimates made by management, and evaluating the overall financial statement presentation. We believe that our audits, which included confirmation of securities at February 28, 2007 by correspondence with the custodian and brokers, provide a reasonable basis for our opinion.
PricewaterhouseCoopers LLP
New York, New York
April 13, 2007
30
COHEN & STEERS DIVIDEND VALUE FUND, INC.
TAX INFORMATION—2007 (Unaudited)
Pursuant to the Jobs and Growth Relief Reconciliation Act of 2003, the fund designates qualified dividend income of $743,038. Additionally, 44.70% of the ordinary dividends qualified for the dividends received deduction available to corporations. Also, the fund designates a long-term capital gain distribution of $18,651 at the 15% rate and $683 at the 25% rate or maximum allowable.
OTHER INFORMATION
A description of the policies and procedures that the fund uses to determine how to vote proxies relating to portfolio securities is available (i) without charge, upon request, by calling 800-330-7348, (ii) on our Web site at cohenandsteers.com or (iii) on the Securities and Exchange Commission's Web site at http://www.sec.gov. In addition, the fund's proxy voting record for the most recent 12-month period ended June 30 is available (i) without charge, upon request, by calling 800-330-7348 or (ii) on the SEC's Web site at http://www.sec.gov.
The fund files its complete schedule of portfolio holdings with the SEC for the first and third quarters of each fiscal year on Form N-Q. The fund's Forms N-Q are available (i) without charge, upon request by calling 800-330-7348, or (ii) on the SEC's Web site at http://www.sec.gov. In addition, the Forms N-Q may be reviewed and copied at the SEC's Public Reference Room in Washington, DC. Information on the operation of the Public Reference Room may be obtained by calling 800-SEC-0330.
Please note that the distributions paid by the fund to shareholders are subject to recharacterization for tax purposes. The final tax treatment of all distributions is reported to shareholders on their 1099-DIV forms, which are mailed after the close of each calendar year. Distributions of capital decrease the fund's total assets and, therefore, could have the effect of increasing the fund's expense ratio. In addition, in order to make these distributions, the fund may have to sell portfolio securities at a less than opportune time.
31
COHEN & STEERS DIVIDEND VALUE FUND, INC.
APPROVAL OF INVESTMENT ADVISORY AGREEMENT
The board of directors of the fund, including a majority of the directors who are not parties to the fund's Investment Advisory Agreement, or interested persons of any such party ("Independent Directors"), has the responsibility under the 1940 Act to approve the fund's Investment Advisory Agreement for its initial two year term and its continuation annually thereafter at a meeting of the board called for the purpose of voting on the approval or continuation. At a meeting held in person on September 19, 2006, the Investment Advisory Agreement was discussed and was unanimously continued for a one-year term by the fund's board, including the Independent Directors. The Independent Directors were represented by independent counsel who assisted them in their deliberations during the board meeting and executive session.
In considering whether to continue the Investment Advisory Agreement, the board reviewed materials provided by the fund's investment advisor (the "Advisor") and fund counsel which included, among other things, fee, expense and performance information compared to peer funds prepared by an independent data provider ("Peer Funds"), supplemental performance and summary information prepared by the Advisor, sales and redemption data for the fund and a legal memorandum outlining the legal duties of the board. The board also spoke directly with representatives of the independent data provider and met with investment advisory personnel from the Advisor. In addition, the board considered information provided from time to time by the Advisor throughout the year at meetings of the board, including presentations by portfolio managers relating to the investment performance of the fund and the investment strategies used in pursuing the fund's investment ob jective. In particular, the board considered the following:
(i) The nature, extent and quality of services to be provided by the Advisor: The directors reviewed the services that the Advisor provides to the fund, including, but not limited to, making the day-to-day investment decisions for the fund, and generally managing the fund's investments in accordance with the stated policies of the fund. The directors also discussed with officers and portfolio managers of the fund the amount of time the Advisor dedicates to the fund and the types of transactions that were being done on behalf of the fund. Additionally, the directors took into account the services provided by the Advisor to its other funds, including those that invest substantially in dividend-paying equity securities and have investment objectives and strategies similar to the fund.
In addition, the board considered the education, background and experience of the Advisor's personnel, noting particularly that the favorable history and reputation of the portfolio managers for the fund had, and would likely continue to have, a favorable impact on the success of the fund. The board further noted the Advisor's ability to attract quality and experienced personnel. The board then considered the administrative services provided by the Advisor, including compliance and accounting services.
After consideration of the above factors, among others, the board concluded that the nature, quality and extent of services provided by the Advisor are adequate and appropriate.
32
COHEN & STEERS DIVIDEND VALUE FUND, INC.
(ii) Investment performance of the fund and the Advisor: The board considered the past investment performance of the fund. The board noted that the independent data provider does not present peer group performance comparisons in their reports for funds with less than one year of operations at the end date of their report. Nonetheless, the board noted that, for the one-year period from the fund's inception, the fund's performance was ranked in the top quintile (top 19%) in its category by the independent data provider.
The board also considered the Advisor's strong performance in managing other funds that invest in dividend-paying equity securities. The board determined that fund performance, in light of all the considerations noted above, was satisfactory.
(iii) Cost of the services to be provided and profits to be realized by the Advisor from the relationship with the fund: Next, the board reviewed the advisory fee rate and administrative fees payable by the fund. As part of their analysis, the board gave substantial consideration to the comparative fee and expense ratio analyses provided by the independent data provider. While acknowledging that the gross fees and expenses were generally above the Peer Funds medians, the board considered that the Advisor continued to waive and/or reimburse certain fees and expenses of the fund so that the net fees and expenses were in-line with the Peer Funds medians. The board also considered the fund's relatively small size, noting that the Advisor expects the expense ratio to decline as the fund grows so that overall expenses would compare more favorably with the Peer Funds, an d concluded that the fund's expense structure is competitive in the peer group.
The board also reviewed information regarding the profitability to the Advisor of its relationship with the fund and noted that the Advisor is waiving fees and/or reimbursing certain expenses of the fund and that the fund is not currently profitable to the Advisor. The board took into consideration other benefits to be derived by the Advisor in connection with the Investment Advisory Agreement, noting particularly the research and related services, within the meaning of Section 28(e) of the Securities Exchange Act of 1934, as amended, that the Advisor receives by allocating the fund's brokerage transactions. The board also considered the fees received by the Advisor under the Administration Agreement, but noted the significant services received, such as operational services and furnishing office space and facilities for the fund, and providing persons satisfactory to the board to serve as officers of the fund, and that these services were be neficial to the fund. The board concluded that the profits realized by the Advisor from its administrative relationship with the fund were reasonable and consistent with fiduciary duties.
(iv) The extent to which economies of scale would be realized as the fund grows and whether fee levels would reflect such economies of scale: The board noted that the fund's advisory fee schedule contained a breakpoint of 10 basis points once the fund's assets reached $1.5 billion. The board considered the fund's asset size and determined that there were not at this time significant economies of scale that were not being shared with shareholders.
(v) Comparison of services rendered and fees paid to those under other investment advisory contracts: As discussed above in (i) and (iii), the board compared both the services rendered and the fees paid under the Investment Advisory Agreement to those under other investment advisory contracts of other investment advisers
33
COHEN & STEERS DIVIDEND VALUE FUND, INC.
managing Peer Funds. The board was provided with an industry study analyzing differences between funds and institutional accounts and the services and fees associated with each and compared both the services rendered and the fees paid under the Investment Advisory Agreement to the Advisor's other advisory contracts with institutional and other clients. The board acknowledged that differences in fees paid by other clients seemed to be consistent with the differences in services provided and determined that on a comparative basis the fees under the Investment Advisory Agreement were reasonable in relation to the services provided.
No single factor was cited as determinative to the decision of the board. Rather, after weighing all of the considerations and conclusions discussed above, the board, including the Independent Directors, unanimously approved the continuation of the Investment Advisory Agreement.
34
COHEN & STEERS DIVIDEND VALUE FUND, INC.
MANAGEMENT OF THE FUND
The business and affairs of the fund are managed under the direction of the board of directors. The board of directors approves all significant agreements between the fund and persons or companies furnishing services to it, including the fund's agreements with its advisor, administrator, custodian and transfer agent. The management of the fund's day-to-day operations is delegated to its officers, the advisor and the fund's administrator, subject always to the investment objective and policies of the fund and to the general supervision of the board of directors.
The directors and officers of the fund and their principal occupations during the past five years are set forth below. The statement of additional information (SAI) includes additional information about fund directors and is available, without charge, upon request by calling 1-800-330-7348.
| Name, Address and Age* | | Position(s) Held
with Fund | | Term of
Office | | Principal Occupation
During Past 5 Years
(Including Other
Directorships Held) | | Number of
Funds Within
Fund
Complex
Overseen by
Director
(Including
the Fund) | | Length
of Time
Served** | |
| Interested Directors1 | |
|
| Robert H. Steers Age: 53 | | Director and
Co-Chairman | | Until next election of directors | | Co-Chairman and Co-Chief Executive Officer of Cohen & Steers Capital Management, Inc. (CSCM), the fund's investment manager, and its parent company, Cohen & Steers, Inc. (CNS) since 2004. Vice President and Director, Cohen & Steers Securities, LLC (CSSL), the Cohen & Steers open-end funds' distributor. Prior thereto, Chairman of CSCM and the Cohen & Steers funds. | | | 21 | | | 1991 to present | |
|
| Martin Cohen Age: 58 | | Director and
Co-Chairman | | Until next election of directors | | Co-Chairman and Co-Chief Executive Officer of CSCM and CNS. Vice President and Director of CSSL. Prior thereto, President of the CSCM and the Cohen & Steers funds. | | | 21 | | | 1991 to present | |
|
(table continued on next page)
* The address for each director is 280 Park Avenue, New York, NY 10017.
** The length of time served represents the year in which the director was first elected or appointed to any fund in the Cohen & Steers fund complex.
1 "Interested person", as defined in the 1940 Act, of the fund because of affiliation with CSCM.
35
COHEN & STEERS DIVIDEND VALUE FUND, INC.
(table continued from previous page)
| Name, Address and Age* | | Position(s) Held
with Fund | | Term of
Office | | Principal Occupation
During Past 5 Years
(Including Other
Directorships Held) | | Number of
Funds Within
Fund
Complex
Overseen by
Director
(Including
the Fund) | | Length
of Time
Served** | |
| Disinterested Directors | |
|
| Bonnie Cohen2 Age: 64 | | Director | | Until next election of directors | | Consultant. Prior thereto, Undersecretary of State, United States Department of State. Director of Wellsford Real Properties, Inc. | | | 21 | | | 2001 to present | |
|
| George Grossman Age: 52 | | Director | | Until next election of directors | | Attorney-at-law | | | 21 | | | 1993 to present | |
|
| Richard E. Kroon Age: 64 | | Director | | Until next election of directors | | Member of Investment Subcommittee, Monmouth University; retired Chairman and Managing Partner of the Sprout Group venture capital funds, then an affiliate of Donaldson, Lufkin & Jenrette Securities Corporation; and former Chairman of the National Venture Capital Association. | | | 21 | | | 2004 to present | |
|
| Richard J. Norman Age: 63 | | Director | | Until next election of directors | | Private Investor. President of the Board of Directors of Maryland Public Television, Board Member of the Salvation Army. Prior thereto, Investment Representative of Morgan Stanley Dean Witter. | | | 21 | | | 2001 to present | |
|
(table continued on next page)
* The address for each director is 280 Park Avenue, New York, NY 10017.
** The length of time served represents the year in which the director was first elected or appointed to any fund in the Cohen & Steers fund complex.
2 Martin Cohen and Bonnie Cohen are not related.
36
COHEN & STEERS DIVIDEND VALUE FUND, INC.
(table continued from previous page)
| Name, Address and Age* | | Position(s) Held
with Fund | | Term of
Office | | Principal Occupation
During Past 5 Years
(Including Other
Directorships Held) | | Number of
Funds Within
Fund
Complex
Overseen by
Director
(Including
the Fund) | | Length
of Time
Served** | |
| Frank K. Ross Age: 63 | | Director | | Until next election of directors | | Professor of Accounting, Howard University; Board member of Pepco Holdings, Inc. (electric utility). Formerly, Midatlantic Area Managing Partner for Audit and Risk Advisory Services at KPMG LLP and Managing Partner of its Washington, DC office. | | | 21 | | | 2004 to present | |
|
| Willard H. Smith Jr. Age: 70 | | Director | | Until next election of directors | | Board member of Essex Property Trust Inc., Realty Income Corporation and Crest Net Lease, Inc. Managing Director at Merrill Lynch & Co., Equity Capital Markets Division from 1983 to 1995. | | | 21 | | | 1996 to present | |
|
| C. Edward Ward, Jr. Age: 60 | | Director | | Until next election of directors | | Member of the Board of Trustees of Directors Manhattan College, Riverdale, New York. Formerly head of closed-end fund listings for the New York Stock Exchange. | | | 21 | | | 2004 to present | |
|
* The address for each director is 280 Park Avenue, New York, NY 10017.
** The length of time served represents the year in which the director was first elected or appointed to any fund in the Cohen & Steers fund complex.
37
COHEN & STEERS DIVIDEND VALUE FUND, INC.
The officers of the fund (other than Messrs. Cohen and Steers, whose biographies are provided above), their address, their ages and their principal occupations for at least the past five years are set forth below.
| Name, Address and Age* | | Position(s) Held
With Fund | | Principal Occupation During Past 5 Years | | Length of
Time Served** | |
Adam M. Derechin
Age: 42 | | President and Chief Executive Officer | | Chief Operating Officer of CSCM (since 2003) and CNS (since 2004). Prior to that, Senior Vice President of CSCM and Vice President and Assistant Treasurer of the Cohen & Steers funds. | | Since 2005 | |
|
Joseph M. Harvey
Age: 43 | | Vice President | | President of CSCM (since 2003) and CNS (since 2004). Prior to that, Senior Vice President and Director of Investment Research of CSCM. | | Since 2004 | |
|
| Richard E. Helm Age: 47 | | Vice President | | Senior Vice President CSCM since 2005. Prior to that, Senior Portfolio Manager of WM Advisors, Inc. since 2001, and Vice President and Senior Portfolio Manager of Northwestern Trust and Investors Advisory Company from 1999 to 2001. | | Since 2005 | |
|
| John E. McLean Age: 35 | | Secretary | | Vice President and Associate General Counsel of CSCM since September 2003. Prior to that, Vice President, Law and Regulation, J&W Seligman & Co. Incorporated (money manager). | | Since 2004 | |
|
James Giallanza
Age: 40 | | Treasurer | | Senior Vice President of CSCM since September 2006. Prior thereto, Deputy Head of the US Funds Administration and Treasurer & CFO of various mutual funds within the Legg Mason (formally Citigroup Asset Management) fund complex from August 2004 to September 2006; Director/Controller of the US wholesale business at UBS Global Asset Management (U.S.) from September 2001 to July 2004. | | Since 2006 | |
|
Lisa D. Phelan
Age: 38 | | Chief Compliance Officer | | Vice President & Director of Compliance of CSCM since January 2006. Chief Compliance Officer of CSSL since 2004. Prior to that, Compliance Officer of CSCM since 2004. Chief Compliance Officer, Avatar Associates & Overture Asset Managers, 2003-2004. First VP, Risk Management, Prudential Securities, Inc. 2000-2003. | | Since 2006 | |
|
* The address of each officer is 280 Park Avenue, New York, NY 10017
** Officers serve one-year terms. The length of time served represents the year in which the officer was first elected to that position in any fund in the Cohen & Steers fund complex. All of the officers listed above are officers of one or more of the other funds in the complex.
38
COHEN & STEERS DIVIDEND VALUE FUND, INC.
Meet the Cohen & Steers family of open-end funds:

• Designed for investors seeking maximum total return, investing primarily in REITs
• Symbol: CSRSX

• Designed for institutional investors seeking maximum total return, investing primarily
in REITs
• Symbol: CSRIX

• Designed for investors seeking high current income, investing primarily in REITs
• Symbols: CSEIX, CSBIX, CSCIX, CSDIX

• Designed for investors seeking maximum capital appreciation, investing in a limited number of REITs and other real estate securities
• Symbols: CSFAX, CSFBX, CSFCX, CSSPX

• Designed for investors seeking maximum total return, investing primarily in international real estate securities
• Symbols: IRFAX, IRFCX, IRFIX

• Designed for investors seeking maximum total return, investing primarily in utilities
• Symbols: CSUAX, CSUBX, CSUCX, CSUIX

• Designed for investors seeking high current income and long-term growth of income and capital appreciation, investing primarily in dividend paying common stocks and
preferred stocks
• Symbols: DVFAX, DVFCX, DVFIX

• Designed for investors seeking maximum total return, investing primarily in real estate securities located in the Asia Pacific region
• Symbols: APFAX, APFCX, APFIX

• Designed for investors seeking maximum
total return, investing primarily in global real
estate securities
• Symbol: GRSIX
Please consider the investment objectives, risks, charges and expenses of the fund carefully before investing. A prospectus containing this and other information can be obtained by calling 800-330-7348 or by visiting cohenandsteers.com. Please read the prospectus carefully before investing.
Cohen & Steers Securities, LLC, Distributor
39
COHEN & STEERS DIVIDEND VALUE FUND, INC.
OFFICERS AND DIRECTORS
Robert H. Steers
Director and co-chairman
Martin Cohen
Director and co-chairman
Bonnie Cohen
Director
George Grossman
Director
Richard E. Kroon
Director
Richard J. Norman
Director
Frank K. Ross
Director
Willard H. Smith Jr.
Director
C. Edward Ward, Jr.
Director
Adam M. Derechin
President and chief executive officer
Joseph M. Harvey
Vice president
Richard E. Helm
Vice president
John E. McLean
Secretary
James Giallanza
Treasurer
Lisa D. Phelan
Chief compliance officer
KEY INFORMATION
Investment Advisor
Cohen & Steers Capital Management, Inc.
280 Park Avenue
New York, NY 10017
(212) 832-3232
Subadministrator and Custodian
State Street Bank and Trust Company
One Lincoln Street
Boston, MA 02111
Transfer Agent
Boston Financial Data Services, Inc.
66 Brooks Drive
Braintree, MA 02184
(800) 437-9912
Legal Counsel
Stroock & Stroock & Lavan LLP
180 Maiden Lane
New York, NY 10038
Distributor
Cohen & Steers Securities, LLC
280 Park Avenue
New York, NY 10017
Nasdaq Symbol: Class A—DVFAX
Class C—DVFCX
Class I— DVFIX
Web site: cohenandsteers.com
This report is authorized for delivery only to shareholders of Cohen & Steers Dividend Value Fund, Inc. unless accompanied or preceded by the delivery of a currently effective prospectus setting forth details of the fund. Past performance is of course no guarantee of future results and your investment may be worth more or less at the time you sell.
40
COHEN & STEERS
DIVIDEND VALUE FUND
280 PARK AVENUE
NEW YORK, NY 10017

ANNUAL REPORT
FEBRUARY 28, 2007
Item 2. Code of Ethics.
The registrant has adopted a Code of Ethics that applies to its Principal Executive Officer and Principal Financial Officer. The registrant undertakes to provide to any person without charge, upon request, a copy of the Code of Ethics. Such request can be by calling 800-330-7348 or writing to the Secretary of the registrant, 280 Park Avenue, New York, NY 10017.
Item 3. Audit Committee Financial Expert.
The registrant’s board has determined that Frank K. Ross, a member of the registrant’s audit committee, is an “audit committee financial expert” and “independent,” as such terms are defined in this Item.
Item 4. Principal Accountant Fees and Services.
(a) – (d) Aggregate fees billed to the registrant for the last two fiscal years for professional services rendered by the registrant’s principal accountant were as follows:
| | 2007 | | 2006 | |
Audit Fees | | $ | 52,400 | | $ | 42,000 | |
Audit-Related Fees | | — | | — | |
Tax Fees | | $ | 13,300 | | $ | 12,600 | |
All Other Fees | | — | | — | |
Tax fees were billed in connection with the preparation of tax returns, calculation and designation of dividends and other miscellaneous tax services.
Aggregate fees billed by the registrant’s principal accountant for the last two fiscal years for non-audit services provided to the registrant’s investment adviser (not including a sub-adviser whose role is primarily portfolio management and is subcontracted or overseen by another investment adviser) and any entity controlling, controlled by, or under common control with the investment adviser that provides ongoing services to the registered investment company, where the engagement relates directly to the operations and financial reporting of the registrant, were as follows:
| | 2007 | | 2006 | |
Audit-Related Fees | | — | | — | |
Tax Fees | | — | | — | |
All Other Fees | | $ | 65,000 | | $ | 85,000 | |
| | | | | | | |
These other fees were billed in connection with internal control reviews and AIMR performance reviews.
(e)(1) The audit committee is required to pre-approve audit and non-audit services performed for the registrant by the principal accountant. The audit committee also is required to pre-approve non-audit services performed by the registrant’s principal accountant for the registrant’s
investment adviser and any sub-adviser (not including any sub-adviser whose role is primarily portfolio management and is subcontracted with or overseen by another investment adviser) and/or to any entity controlling, controlled by or under common control with the registrant’s investment adviser that provides ongoing services to the registrant, if the engagement for services relates directly to the operations and financial reporting of the registrant.
The audit committee may delegate pre-approval authority to one or more of its members who are independent members of the board of directors of the registrant. The member or members to whom such authority is delegated shall report any pre-approval decisions to the audit committee at its next scheduled meeting. The audit committee may not delegate its responsibility to pre-approve services to be performed by the registrant’s principal accountant for the investment adviser.
(e) (2) No services included in (b) – (d) above were approved by the audit committee pursuant to paragraphs (c)(7)(i)(C) of Rule 2-01 of Regulation S-X.
(f) Not applicable.
(g) For the fiscal year ended February 28, 2007, the aggregate fees billed by the registrant’s principal accountant for non-audit services rendered to the registrant and for non-audit services rendered to the registrant’s investment adviser (not including any sub-adviser whose role is primarily portfolio management and is subcontracted with or overseen by another investment adviser) and/or to any entity controlling, controlled by or under common control with the registrant’s investment adviser that provides ongoing services to the registrant was $78,300.
(h) The registrant’s audit committee considered whether the provision of non-audit services that were rendered to the registrant’s investment adviser (not including any sub-adviser whose role is primarily portfolio management and is subcontracted with or overseen by another investment adviser) and/or to any entity controlling, controlled by or under common control with the registrant’s investment adviser that provides ongoing services to the registrant that were not pre-approved pursuant to paragraph (c)(7)(ii) of Rule 2-01 of Regulation S-X was compatible with maintaining the principal accountant’s independence.
Item 5. Audit Committee of Listed Registrants.
Not applicable.
Item 6. Schedule of Investments.
Included in Item 1 above.
Item 7. Disclosure of Proxy Voting Policies and Procedures for Closed-End Management Investment Companies.
Not applicable.
Item 8. Portfolio Managers of Closed-End Investment Companies.
Not applicable.
Item 9. Purchases of Equity Securities by Closed-End Management Investment Company and Affiliated Purchasers.
Not applicable.
Item 10. Submission of Matters to a Vote of Security Holders.
Not applicable.
Item 11. Controls and Procedures.
(a) The registrant’s principal executive officer and principal financial officer have concluded that the registrant’s disclosure controls and procedures are sufficient to ensure that information required to be disclosed by the registrant in this Form N-CSR was recorded, processed, summarized and reported within the time periods specified in the Securities and Exchange Commission’s rules and forms, based upon such officers’ evaluation of these controls and procedures as of a date within 90 days of the filing date of this report.
(b) There were no changes in the registrant’s internal control over financial reporting that occurred during the registrant’s most recent fiscal half-year (the registrant’s second fiscal half-year in the case of an annual report) that has materially affected, or is reasonably likely to materially affect, the registrant’s internal control over financial reporting.
Item 12. Exhibits.
(a)(1) Not applicable.
(a) (2) Certifications of principal executive officer and principal financial officer as required by Rule 30a-2(a) under the Investment Company Act of 1940.
(b) Certifications of chief executive officer and chief financial officer as required by Rule 30a- 2(b) under the Investment Company Act of 1940.
SIGNATURES
Pursuant to the requirements of the Securities Exchange Act of 1934 and the Investment Company Act of 1940, the registrant has duly caused this report to be signed on its behalf by the undersigned, thereunto duly authorized.
COHEN & STEERS DIVIDEND VALUE FUND, INC.
| By: | /s/ Adam M. Derechin | |
| | Name: Adam M. Derechin |
| | Title: President and Chief Executive Officer |
| | |
| Date: April 27, 2007 |
Pursuant to the requirements of the Securities Exchange Act of 1934 and the Investment Company Act of 1940, this report has been signed below by the following persons on behalf of the registrant and in the capacities and on the dates indicated.
| By: | /s/ Adam M. Derechin | | |
| Name: | Adam M. Derechin |
| Title: | President and Chief Executive Officer |
| | (principal executive officer) |
| | |
| By: | /s/ James Giallanza | |
| Name: | James Giallanza |
| Title: | Treasurer |
| | (principal financial officer) |
| | |
| Date: April 27, 2007 |
| | | | | | | | |