UNITED STATES
SECURITIES AND EXCHANGE COMMISSION
Washington, D.C. 20549
FORM N-CSR
CERTIFIED SHAREHOLDER REPORT OF REGISTERED
MANAGEMENT INVESTMENT COMPANIES
Investment Company Act file number | 811-21668 |
|
Cohen & Steers Dividend Value Fund, Inc. |
(Exact name of registrant as specified in charter) |
|
280 Park Avenue, New York, NY | | 10017 |
(Address of principal executive offices) | | (Zip code) |
|
Adam M. Derechin Cohen & Steers Capital Management, Inc. 280 Park Avenue New York, New York 10017 |
(Name and address of agent for service) |
|
Registrant’s telephone number, including area code: | (212) 832-3232 | |
|
Date of fiscal year end: | February 28 | |
|
Date of reporting period: | February 28, 2010 | |
| | | | | | | | |
Item 1. Reports to Stockholders.
COHEN & STEERS DIVIDEND VALUE FUND, INC.
To Our Shareholders:
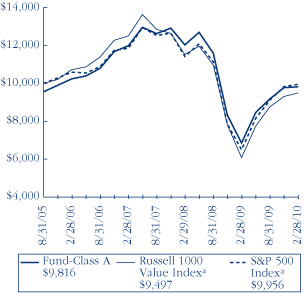
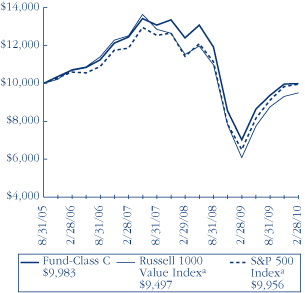
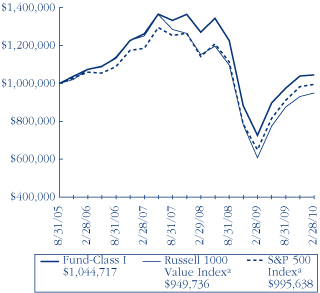
We would like to share with you our report for the year ended February 28, 2010. The net asset values (NAV) per share at that date were $10.72, $10.67 and $10.73 for Class A, Class C and Class I shares, respectively.
The total returns, including income and change in NAV, for the Fund and its comparative benchmarks were:
| | | Six Months Ended
February 28, 2010 | | Year Ended
February 28, 2010 | |
| Cohen & Steers Dividend Value—Class A | | | 6.99 | % | | | 43.41 | % | |
| Cohen & Steers Dividend Value—Class C | | | 6.58 | % | | | 42.43 | % | |
| Cohen & Steers Dividend Value—Class I | | | 7.17 | % | | | 44.03 | % | |
| Russell 1000 Value Indexa | | | 8.52 | % | | | 56.50 | % | |
| S&P 500 Indexa | | | 9.32 | % | | | 53.62 | % | |
The performance data quoted represent past performance. Past performance is no guarantee of future results. The investment return and the principal value of an investment will fluctuate and shares, if redeemed, may be worth more or less than their original cost. Current performance may be lower or higher than the performance data quoted. Current total returns of the Fund can be obtained by visiting our Web site at cohenandsteers.com. Performance quoted does not reflect the deduction of the maximum 4.5% initial sales charge on Class A shares or 1% maximum contingent deferred sales charge on Class C shares. If such charges were included, returns would have been lower.
Please note that the distributions paid by the Fund to shareholders are subject to recharacterization for tax purposes. These recharacterizations could result in the Fund paying distributions in excess of its investment company taxable income and this excess would be a tax-free return of capital distributed from the Fund's assets.
Investment Review
U.S. stocks rebounded from 2008's steep decline, with all sectors delivering positive returns for the 12-month period ended February 28, 2010. The market hovered near its multiyear low at the start of the Fund's fiscal year, but began to show signs of life early in the new period, when the Federal Reserve expanded lending facilities and repurchased bonds.
A broad market rally ensued on March 9 when Citigroup announced that it expected to be profitable for the first two months of 2009. Equities extended their rise into April and May, led by lower-quality small- and mid-cap stocks,
a The Russell 1000 Value Index measures the performance of those Russell 1000 companies with lower price-to-book ratios and lower forecasted growth values. The S&P 500 Index is an unmanaged index of common stocks that is frequently used as a general measure of stock market performance.
1
COHEN & STEERS DIVIDEND VALUE FUND, INC.
which had declined the most during 2008's equity market rout. This would be a theme for the remainder of the year; large, high-quality companies (as measured by balance sheet strength) were less favored in the market rebound.
Following a slowdown in early July, stocks resumed their run mid-month when second-period earnings started to come in above expectations. Merger and acquisition activity also picked up and provided a lift. The pace of the run-up slowed in October amid a pullback in investors' risk appetite and concern about global policy tightening. Although calendar-year third-quarter U.S. gross domestic product was initially announced at 3.5% (and lowered to 2.6% in December), it was at the low end of the range for post-recession U.S. economic expansion. In this environment, large cap, higher-quality stocks began to take more of a leading role in the market's rise.
Equities sold off in January on concerns about the Obama administration's plan for regulating the banking industry, but rallied at the close of the Fund's fiscal year. Investors shook off a mid-February 0.5% increase in the discount rate, to 0.75%, after Fed Chairman Ben Bernanke reassured Congress that the central bank did not intend to start raising short-term interest rates anytime soon.
Materials were lifted by a new inventory cycle
Materials stocks (with a total return of +112.8%)1 were top performers during the fiscal year. The sector is usually quick to decline in a downturn and is often among the first to rise in a recovery. During the year, materials' share prices benefited from the replenishment of depleted inventories, a weak dollar—which increased export opportunities for U.S. manufacturers—stimulus activities in China and a rebound in commodity prices.
Consumer discretionary shares (+97.7%) rallied when investors' risk tolerance increased in March and share prices were bid up in anticipation of a recovery. Financial services companies (+91.1%) benefited from low interest rates, which translated into high net interest margins for banks, and significant fixed income gains for insurers. For major banks with diverse operations, profitability was enhanced by a surge in trading activity and bond deals. The information technology sector (+76.0%) was lifted by several companies that posted better-than-expected earnings, as well as by a lack of regulatory oversight that weighed on other sectors.
Health care stocks (+47.1%) were volatile throughout much of the year as Congress debated health care reform. Shares prices rallied in late 2009 after the House of Representatives and the Senate passed separate versions of health care legislation that were more moderate than anticipated. A pickup in merger activity among biotechnology companies also contributed to the sector's outperformance.
Energy stocks (+29.2%) received a boost in the second half of 2009 from a recovery in crude oil prices (which peaked at $82 a barrel before retreating), reflecting confidence that the global economy was stabilizing. Equally important was the decline in the dollar that began in March, which encouraged investors to exit the currency and move into hard assets.
1 Sector returns as measured by the Russell 1000 Value Index.
2
COHEN & STEERS DIVIDEND VALUE FUND, INC.
The defensive utilities (+21.1%) and telecommunications (+14.0%) sectors lagged the benchmark during the year. These companies, with their relatively stable revenues, underperformed during a recovery rally that favored lower-quality small-cap and mid-cap stocks.
Fund performance
The Fund had a sizable absolute return for the year within an improved environment for equities, but underperformed its benchmark. Our stock selection process historically does well in three of four scenarios: declining markets, choppy or range-bound markets and traditional rising markets. Euphoric or liquidity-driven rallies—as was the case for most of 2009—historically present difficulties to our process, as absolute returns may be strong but relative returns may lag.
Detractors from relative return included our underweight and stock selection in the consumer discretionary, financial services and materials sectors, as well as in industrial companies (which had a total return of +83.4% within the index).
Our underperformance in the consumer discretionary sector reflected our view that U.S. consumers would not be big drivers of an economic recovery, given high unemployment and depressed home prices. In financial services, several of the top performers were second-tier regional banks. We were concerned that many had credit card and commercial real estate risk for which they had not set aside adequate reserves. Within the materials and industrials sectors, the top performers were economically sensitive companies that usually do better at the start of an economic recovery. They typically do not meet our investment criteria, however, due to their uneven earnings and dividend histories.
Factors that contributed to performance included stock selection and our underweight in energy stocks, and our underweight positions in the telecommunications and utilities subsectors. The Fund's beneficial overweight in the information technology group was more than offset by stock selection, as smaller tech stocks handily outperformed our large tech names.
Investment Outlook
Largely favorable economic and earnings data continue to support equities, but returns are likely to be choppy, with moderate, range-bound volatility. Although we expect share prices to move higher, significant risks to economic recovery and earnings growth remain, and 2010 figures to be a year in which stock selection will probably outweigh broad sector bets. The tide could turn back toward larger, higher-quality companies as the year progresses, which has often been the case in a mature market rally.
In this environment, we believe revenue growth, aided by market share gains, will be a key driver of equity performance. Within this scenario, we are finding value among large cap industrial, health care and technology stocks. The strong technology sector performance over the past year was largely driven by mid- and small-cap companies, while health care stocks were hampered by the protracted reform battle in Washington. In our view,
3
COHEN & STEERS DIVIDEND VALUE FUND, INC.
large companies offer compelling long-term value, particularly if they have clean balance sheets, face minimal regulatory risk and can benefit from an improving capital expenditure cycle. Dividend growth among most sectors is likely to continue, and we believe cash-rich U.S. companies are well-positioned to raise payouts modestly this year.
Sincerely,
 | |  | |
|
| MARTIN COHEN | | ROBERT H. STEERS | |
|
| Co-chairman | | Co-chairman | |
|

RICHARD E. HELM
Portfolio Manager
The views and opinions in the preceding commentary are subject to change. This material represents an assessment of the market environment at a specific point in time, should not be relied upon as investment advice and is not intended to predict or depict performance of any investment.
Visit Cohen & Steers online at cohenandsteers.com
For more information about any of our funds, visit cohenandsteers.com, where you will find daily net asset values, fund fact sheets and portfolio highlights. You can also access newsletters, education tools and market updates covering the global real estate, listed infrastructure, utilities, large cap value and preferred securities sectors.
In addition, our Web site contains comprehensive information about our firm, including our most recent press releases, profiles of our senior investment professionals and an overview of our investment approach.
4
COHEN & STEERS DIVIDEND VALUE FUND, INC.
Performance Review (Unaudited)
Cohen & Steers Dividend Value Fund, Inc.—Class A
Growth of a $10,000 Investment
Cohen & Steers Dividend Value Fund, Inc.—Class C
Growth of a $10,000 Investment
Cohen & Steers Dividend Value Fund, Inc.—Class I
Growth of a $1,000,000 Investment
5
COHEN & STEERS DIVIDEND VALUE FUND, INC.
Performance Review (Unaudited)—(Continued)
Average Annual Total Returns—For Periods Ended February 28, 2010.
| | | Class A Shares | | Class C Shares | | Class I Shares | |
| 1 Year (with sales charge) | | | 36.96 | %b | | | 41.43 | %c | | | — | | |
| 1 Year (without sales charge) | | | 43.41 | % | | | 42.43 | % | | | 44.03 | % | |
| Since Inceptiond (with sales charge) | | | –0.41 | %b | | | –0.04 | % | | | — | | |
| Since Inceptiond (without sales charge) | | | 0.61 | % | | | –0.04 | % | | | 0.98 | % | |
The performance data quoted represent past performance. Past performance is no guarantee of future results. The investment return and principal value of an investment will fluctuate and shares, when redeemed, may be worth more or less than their original cost. Current performance may be lower or higher than the performance data quoted. Current total returns of the Fund can be obtained by visiting our Web site at cohenandsteers.com. The performance graph and table do not reflect the deduction of taxes that a shareholder would pay on Fund distributions or the redemption of Fund shares.
The annualized gross and net expense ratios, respectively, for each class of shares as disclosed in the July 1, 2009 prospectuses were as follows: Class A — 1.57% and 1.15%; Class C — 2.22% and 1.80%; and Class I — 1.23% and 0.80%. Through June 30, 2011, the advisor has contractually agreed to waive its fee and/or reimburse the Fund for expenses incurred to the extent necessary to maintain the Fund's annual operating expenses at 1.15% for Class A shares, 1.80% for Class C shares and 0.80% for Class I shares.
a The comparative indices are not adjusted to reflect expenses or other fees that the SEC requires to be reflected in the Fund's performance. The Fund's performance assumes the reinvestment of all dividends and distributions. For more information, including charges and expenses, please read the prospectus carefully before you invest.
b Reflects a 4.50% front-end sales charge.
c Reflects a contingent deferred sales charge of 1%.
d Inception date of August 31, 2005.
6
COHEN & STEERS DIVIDEND VALUE FUND, INC.
Expense Example
(Unaudited)
As a shareholder of the Fund, you incur two types of costs: (1) transaction costs, including sales charges (loads) on purchase payments and redemption fees; and (2) ongoing costs including management fees; distribution and/or service (12b-1) fees and other Fund expenses. This example is intended to help you understand your ongoing costs (in dollars) of investing in the Fund and to compare these costs with the ongoing costs of investing in other mutual funds.
The example is based on an investment of $1,000 invested at the beginning of the period and held for the entire period September 1, 2009—February 28, 2010.
Actual Expenses
The first line of the following table provides information about actual account values and expenses. You may use the information in this line, together with the amount you invested, to estimate the expenses that you paid over the period. Simply divide your account value by $1,000 (for example, an $8,600 account value divided by $1,000 = 8.6), then multiply the result by the number in the first line under the heading entitled "Expenses Paid During Period" to estimate the expenses you paid on your account during this period.
Hypothetical Example for Comparison Purposes
The second line of the following table provides information about hypothetical account values and hypothetical expenses based on the Fund's actual expense ratio and an assumed rate of return of 5% per year before expenses, which is not the Fund's actual return. The hypothetical account values and expenses may not be used to estimate the actual ending account balance or expenses you paid for the period. You may use this information to compare the ongoing cost of investing in the Fund and other funds. To do so, compare this 5% hypothetical example with the 5% hypothetical examples that appear in the shareholder reports of other funds.
Please note that the expenses shown in the table are meant to highlight your ongoing costs only and do not reflect any transactional costs, such as sales charges (loads) and redemption fees. Therefore, the second line of the table is useful in comparing ongoing costs only, and will not help you determine the relative total costs of owning different funds. In addition, if these transactional costs were included, your costs would have been higher.
7
COHEN & STEERS DIVIDEND VALUE FUND, INC.
Expense Example (Unaudited)—(Continued)
| | | Beginning
Account Value
September 1, 2009 | | Ending
Account Value
February 28, 2010 | | Expenses Paid
During Period*
September 1, 2009–
February 28, 2010 | |
| Class A | |
| Actual (6.99% return) | | $ | 1,000.00 | | | $ | 1,069.90 | | | $ | 5.90 | | |
| Hypothetical (5% annual return before expenses) | | $ | 1,000.00 | | | $ | 1,019.09 | | | $ | 5.76 | | |
| Class C | |
| Actual (6.58% return) | | $ | 1,000.00 | | | $ | 1,065.80 | | | $ | 9.22 | | |
| Hypothetical (5% annual return before expenses) | | $ | 1,000.00 | | | $ | 1,015.87 | | | $ | 9.00 | | |
| Class I | |
| Actual (7.17% return) | | $ | 1,000.00 | | | $ | 1,071.70 | | | $ | 4.11 | | |
| Hypothetical (5% annual return before expenses) | | $ | 1,000.00 | | | $ | 1,020.83 | | | $ | 4.01 | | |
* Expenses are equal to the Fund's Class A, Class C and Class I annualized expense ratio of 1.15%, 1.80% and 0.80%, respectively, multiplied by the average account value over the period, multiplied by 181/365 (to reflect the one-half year period). If the Fund had borne all of its expenses that were assumed by the advisor, the annualized expense ratios would have been 1.46%, 2.11%, and 1.11%, respectively.
8
COHEN & STEERS DIVIDEND VALUE FUND, INC.
FEBRUARY 28, 2010
Top Ten Holdings
(Unaudited)
| Security | | Value | | % of
Net
Assets | |
| JPMorgan Chase & Co. | | $ | 6,156,999 | | | | 3.1 | % | |
| Bank of America Corp. | | | 6,055,910 | | | | 3.0 | | |
| Total SA (France) | | | 5,652,583 | | | | 2.8 | | |
| Exxon Mobil Corp. | | | 5,492,500 | | | | 2.7 | | |
| General Electric Co. | | | 5,055,688 | | | | 2.5 | | |
| Chevron Corp. | | | 4,988,700 | | | | 2.5 | | |
| Devon Energy Corp. | | | 4,007,652 | | | | 2.0 | | |
| HCC Insurance Holdings | | | 3,945,060 | | | | 2.0 | | |
| MetLife | | | 3,850,062 | | | | 1.9 | | |
| McDonald's Corp. | | | 3,843,770 | | | | 1.9 | | |
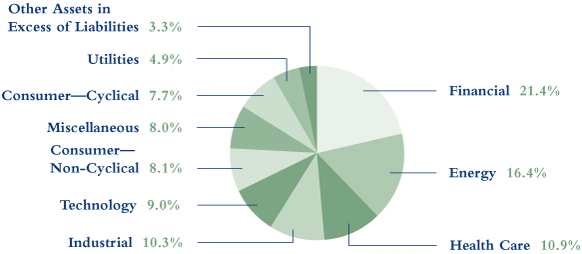
Sector Breakdown
(Based on Net Assets)
(Unaudited)
9
COHEN & STEERS DIVIDEND VALUE FUND, INC.
SCHEDULE OF INVESTMENTS
February 28, 2010
| | | | | Number
of Shares | | Value | |
| COMMON STOCK | | | 96.7 | % | | | | | | | | | |
| BASIC MATERIALS | | | 1.8 | % | | | | | | | | | |
| Allegheny Technologies | | | | | | | 33,600 | | | $ | 1,466,976 | | |
| Archer-Daniels-Midland Co. | | | | | | | 30,100 | | | | 883,736 | | |
| Cameco Corp. | | | | | | | 16,800 | | | | 461,664 | | |
| Praxair | | | | | | | 11,700 | | | | 879,138 | | |
| | | | | | | | 3,691,514 | | |
| CONSUMER—CYCLICAL | | | 7.7 | % | | | | | | | | | |
| APPAREL | | | 1.5 | % | | | | | | | | | |
| NIKE | | | | | | | 44,100 | | | | 2,981,160 | | |
| AUTO PARTS EQUIPMENT | | | 0.5 | % | | | | | | | | | |
| Genuine Parts Co. | | | | | | | 26,400 | | | | 1,065,504 | | |
| MEDIA | | | 1.4 | % | | | | | | | | | |
| Comcast Corp. | | | | | | | 83,900 | | | | 1,379,316 | | |
| The Walt Disney Co. | | | | | | | 45,600 | | | | 1,424,544 | | |
| | | | | | | | 2,803,860 | | |
| RETAIL | | | 3.8 | % | | | | | | | | | |
| Hennes & Mauritz AB (Sweden) | | | | | | | 17,700 | | | | 1,073,698 | | |
| Nordstrom | | | | | | | 25,500 | | | | 941,970 | | |
| Ross Stores | | | | | | | 56,000 | | | | 2,738,960 | | |
| Wal-Mart Stores | | | | | | | 55,600 | | | | 3,006,292 | | |
| | | | | | | | 7,760,920 | | |
| TOYS/GAMES/HOBBIES | | | 0.5 | % | | | | | | | | | |
| Mattel | | | | | | | 43,800 | | | | 963,162 | | |
| TOTAL CONSUMER—CYCLICAL | | | | | | | | | | | 15,574,606 | | |
| CONSUMER—NON-CYCLICAL | | | 8.1 | % | | | | | | | | | |
| AGRICULTURE | | | 1.2 | % | | | | | | | | | |
| Monsanto Co. | | | | | | | 34,200 | | | | 2,416,230 | | |
| APPAREL | | | 1.0 | % | | | | | | | | | |
| VF Corp. | | | | | | | 25,400 | | | | 1,965,452 | | |
See accompanying notes to financial statements.
10
COHEN & STEERS DIVIDEND VALUE FUND, INC.
SCHEDULE OF INVESTMENTS—(Continued)
February 28, 2010
| | | | | Number
of Shares | | Value | |
| BEVERAGE | | | 1.1 | % | | | | | | | | | |
| Diageo PLC (ADR) (United Kingdom) | | | | | | | 12,300 | | | $ | 802,944 | | |
| PepsiCo | | | | | | | 24,000 | | | | 1,499,280 | | |
| | | | | | | | 2,302,224 | | |
| COSMETICS/PERSONAL CARE | | | 1.4 | % | | | | | | | | | |
| Procter & Gamble Co. | | | | | | | 45,100 | | | | 2,853,928 | | |
| RESTAURANT | | | 1.9 | % | | | | | | | | | |
| McDonald's Corp. | | | | | | | 60,200 | | | | 3,843,770 | | |
| RETAIL | | | 1.5 | % | | | | | | | | | |
| Costco Wholesale Corp. | | | | | | | 17,600 | | | | 1,073,072 | | |
| CVS Caremark Corp. | | | | | | | 57,200 | | | | 1,930,500 | | |
| | | | | | | | 3,003,572 | | |
| TOTAL CONSUMER—NON-CYCLICAL | | | | | | | | | | | 16,385,176 | | |
| ENERGY | | | 16.4 | % | | | | | | | | | |
| OIL & GAS | | | 14.4 | % | | | | | | | | | |
| Apache Corp. | | | | | | | 18,600 | | | | 1,927,704 | | |
| Chevron Corp. | | | | | | | 69,000 | | | | 4,988,700 | | |
| CNOOC Ltd. (Hong Kong) | | | | | | | 1,228,800 | | | | 1,928,175 | | |
| Devon Energy Corp. | | | | | | | 58,200 | | | | 4,007,652 | | |
| Exxon Mobil Corp. | | | | | | | 84,500 | | | | 5,492,500 | | |
| Marathon Oil Corp. | | | | | | | 75,000 | | | | 2,171,250 | | |
| Occidental Petroleum Corp. | | | | | | | 36,400 | | | | 2,906,540 | | |
| Total SA (France) | | | | | | | 101,300 | | | | 5,652,583 | | |
| | | | | | | | 29,075,104 | | |
| OIL & GAS SERVICES | | | 2.0 | % | | | | | | | | | |
| Schlumberger Ltd. | | | | | | | 36,000 | | | | 2,199,600 | | |
| Transocean Ltd.a | | | | | | | 21,868 | | | | 1,745,504 | | |
| | | | | | | | 3,945,104 | | |
| TOTAL ENERGY | | | | | | | | | | | 33,020,208 | | |
See accompanying notes to financial statements.
11
COHEN & STEERS DIVIDEND VALUE FUND, INC.
SCHEDULE OF INVESTMENTS—(Continued)
February 28, 2010
| | | | | Number
of Shares | | Value | |
| FINANCIAL | | | 21.4 | % | | | | | | | | | |
| BANK | | | 8.8 | % | | | | | | | | | |
| Bank of America Corp. | | | | | | | 363,500 | | | $ | 6,055,910 | | |
| Bank of New York Mellon Corp. | | | | | | | 34,900 | | | | 995,348 | | |
| BB&T Corp. | | | | | | | 34,500 | | | | 984,285 | | |
| HSBC Holdings PLC (ADR) (United Kingdom) | | | | | | | 16,400 | | | | 900,688 | | |
| Toronto-Dominion Bank (Canada) | | | | | | | 32,000 | | | | 2,044,480 | | |
| US Bancorp | | | | | | | 128,500 | | | | 3,162,385 | | |
| Wells Fargo & Co. | | | | | | | 129,000 | | | | 3,526,860 | | |
| | | | | | | | 17,669,956 | | |
| DIVERSIFIED FINANCIAL SERVICE | | | 6.8 | % | | | | | | | | | |
| BlackRock | | | | | | | 10,000 | | | | 2,188,000 | | |
| Franklin Resources | | | | | | | 9,000 | | | | 915,480 | | |
| Goldman Sachs Group | | | | | | | 17,200 | | | | 2,689,220 | | |
| JPMorgan Chase & Co. | | | | | | | 146,700 | | | | 6,156,999 | | |
| Morgan Stanley | | | | | | | 64,600 | | | | 1,820,428 | | |
| | | | | | | | 13,770,127 | | |
| INSURANCE | | | 5.8 | % | | | | | | | | | |
| ACE Ltd. | | | | | | | 30,200 | | | | 1,509,698 | | |
| Chubb Corp. | | | | | | | 10,000 | | | | 504,600 | | |
| Everest Re Group Ltd. | | | | | | | 22,500 | | | | 1,921,950 | | |
| HCC Insurance Holdings | | | | | | | 141,400 | | | | 3,945,060 | | |
| MetLife | | | | | | | 105,800 | | | | 3,850,062 | | |
| | | | | | | | 11,731,370 | | |
| TOTAL FINANCIAL | | | | | | | | | | | 43,171,453 | | |
| HEALTH CARE | | | 10.9 | % | | | | | | | | | |
| HEALTH CARE PROVIDERS & SERVICES | | | 0.7 | % | | | | | | | | | |
| UnitedHealth Group | | | | | | | 29,100 | | | | 985,326 | | |
| Universal Health Services | | | | | | | 15,600 | | | | 483,912 | | |
| | | | | | | | 1,469,238 | | |
See accompanying notes to financial statements.
12
COHEN & STEERS DIVIDEND VALUE FUND, INC.
SCHEDULE OF INVESTMENTS—(Continued)
February 28, 2010
| | | | | Number
of Shares | | Value | |
| HEALTHCARE PRODUCTS | | | 3.8 | % | | | | | | | | | |
| Becton Dickinson & Co. | | | | | | | 19,200 | | | $ | 1,495,104 | | |
| Covidien Ltd. | | | | | | | 18,500 | | | | 908,720 | | |
| Johnson & Johnson | | | | | | | 50,500 | | | | 3,181,500 | | |
| Medtronic | | | | | | | 45,200 | | | | 1,961,680 | | |
| | | | | | | | 7,547,004 | | |
| PHARMACEUTICAL | | | 6.4 | % | | | | | | | | | |
| Abbott Laboratories | | | | | | | 69,600 | | | | 3,777,888 | | |
| Merck & Co. | | | | | | | 63,100 | | | | 2,327,128 | | |
| Pfizer | | | | | | | 207,100 | | | | 3,634,605 | | |
| Teva Pharmaceutical Industries Ltd. (ADR) (Israel) | | | | | | | 53,200 | | | | 3,192,532 | | |
| | | | | | | | 12,932,153 | | |
| TOTAL HEALTH CARE | | | | | | | | | | | 21,948,395 | | |
| INDUSTRIAL | | | 10.3 | % | | | | | | | | | |
| AEROSPACE & DEFENSE | | | 4.7 | % | | | | | | | | | |
| General Dynamics Corp. | | | | | | | 47,500 | | | | 3,446,125 | | |
| L-3 Communications Holdings | | | | | | | 33,300 | | | | 3,044,286 | | |
| Lockheed Martin Corp. | | | | | | | 38,300 | | | | 2,978,208 | | |
| | | | | | | | 9,468,619 | | |
| DIVERSIFIED MANUFACTURING | | | 3.5 | % | | | | | | | | | |
| 3M Co. | | | | | | | 11,600 | | | | 929,740 | | |
| Caterpillar | | | | | | | 18,100 | | | | 1,032,605 | | |
| General Electric Co. | | | | | | | 314,800 | | | | 5,055,688 | | |
| | | | | | | | 7,018,033 | | |
| ENVIRONMENTAL CONTROL | | | 0.5 | % | | | | | | | | | |
| Waste Management | | | | | | | 28,400 | | | | 937,768 | | |
| TRANSPORTATION | | | 1.6 | % | | | | | | | | | |
| FedEx Corp. | | | | | | | 16,300 | | | | 1,381,588 | | |
| Norfolk Southern Corp. | | | | | | | 17,800 | | | | 915,454 | | |
| United Parcel Service | | | | | | | 17,000 | | | | 998,580 | | |
| | | | | | | | 3,295,622 | | |
| TOTAL INDUSTRIAL | | | | | | | | | | | 20,720,042 | | |
See accompanying notes to financial statements.
13
COHEN & STEERS DIVIDEND VALUE FUND, INC.
SCHEDULE OF INVESTMENTS—(Continued)
February 28, 2010
| | | | | Number
of Shares | | Value | |
| MATERIALS—CHEMICALS | | | 0.7 | % | | | | | | | | | |
| Sigma-Aldrich Corp. | | | | | | | 30,000 | | | $ | 1,430,700 | | |
| REAL ESTATE | | | 2.7 | % | | | | | | | | | |
| OFFICE | | | 1.0 | % | | | | | | | | | |
| Corporate Office Properties Trust | | | | | | | 27,400 | | | | 1,009,142 | | |
| Hongkong Land Holdings Ltd. (USD) (Singapore) | | | | | | | 220,000 | | | | 1,012,000 | | |
| | | | | | | | 2,021,142 | | |
| SELF STORAGE | | | 0.7 | % | | | | | | | | | |
| Public Storage | | | | | | | 17,700 | | | | 1,454,763 | | |
| SHOPPING CENTER—REGIONAL MALL | | | 1.0 | % | | | | | | | | | |
| Simon Property Group | | | | | | | 24,397 | | | | 1,910,041 | | |
| TOTAL REAL ESTATE | | | | | | | | | | | 5,385,946 | | |
| TECHNOLOGY | | | 9.0 | % | | | | | | | | | |
| COMPUTERS | | | 1.0 | % | | | | | | | | | |
| International Business Machines Corp. | | | | | | | 15,000 | | | | 1,907,400 | | |
| IT SERVICES | | | 0.9 | % | | | | | | | | | |
| Automatic Data Processing | | | | | | | 44,000 | | | | 1,830,840 | | |
| SEMICONDUCTORS | | | 2.3 | % | | | | | | | | | |
| Intel Corp. | | | | | | | 119,300 | | | | 2,449,229 | | |
| Texas Instruments | | | | | | | 92,700 | | | | 2,260,026 | | |
| | | | | | | | 4,709,255 | | |
| SOFTWARE | | | 2.1 | % | | | | | | | | | |
| Microsoft Corp. | | | | | | | 66,600 | | | | 1,908,756 | | |
| Oracle Corp. | | | | | | | 93,700 | | | | 2,309,705 | | |
| | | | | | | | 4,218,461 | | |
| TELECOMMUNICATION EQUIPMENT | | | 2.7 | % | | | | | | | | | |
| Corning | | | | | | | 50,000 | | | | 881,500 | | |
| Harris Corp. | | | | | | | 51,900 | | | | 2,346,918 | | |
| QUALCOMM | | | | | | | 62,600 | | | | 2,296,794 | | |
| | | | | | | | 5,525,212 | | |
| TOTAL TECHNOLOGY | | | | | | | | | | | 18,191,168 | | |
See accompanying notes to financial statements.
14
COHEN & STEERS DIVIDEND VALUE FUND, INC.
SCHEDULE OF INVESTMENTS—(Continued)
February 28, 2010
| | | | | Number
of Shares | | Value | |
| TELECOMMUNICATION SERVICES | | | 2.8 | % | | | | | | | | | |
| AT&T | | | | | | | 136,900 | | | $ | 3,396,489 | | |
| China Mobile Ltd. (ADR) (Hong Kong) | | | | | | | 22,000 | | | | 1,087,460 | | |
| Verizon Communications | | | | | | | 42,800 | | | | 1,238,204 | | |
| | | | | | | | 5,722,153 | | |
| UTILITIES | | | 4.9 | % | | | | | | | | | |
| ELECTRIC UTILITIES | | | 2.1 | % | | | | | | | | | |
| E.ON AG (ADR) (Germany) | | | | | | | 23,100 | | | | 823,053 | | |
| FPL Group | | | | | | | 72,700 | | | | 3,371,099 | | |
| | | | | | | | 4,194,152 | | |
| MULTI UTILITIES | | | 2.8 | % | | | | | | | | | |
| Sempra Energy | | | | | | | 56,600 | | | | 2,783,022 | | |
| Wisconsin Energy Corp. | | | | | | | 59,100 | | | | 2,862,213 | | |
| | | | | | | | 5,645,235 | | |
| TOTAL UTILITIES | | | | | | | | | | | 9,839,387 | | |
| TOTAL COMMON STOCK (Identified cost—$187,405,599) | | | | | | | | | | | 195,080,748 | | |
| SHORT-TERM INVESTMENTS | | | 3.0 | % | | | | | | | | | |
| MONEY MARKET FUNDS | |
| Federated Government Obligations Fund, 0.02%b | | | | | | | 2,980,204 | | | | 2,980,204 | | |
| State Street Institutional Liquid Reserves Fund, 0.12%b | | | | | | | 2,980,633 | | | | 2,980,633 | | |
TOTAL SHORT-TERM INVESTMENTS
(Identified cost—$5,960,837) | | | | | | | | | | | 5,960,837 | | |
See accompanying notes to financial statements.
15
COHEN & STEERS DIVIDEND VALUE FUND, INC.
SCHEDULE OF INVESTMENTS—(Continued)
February 28, 2010
| | | | | | | Value | |
| TOTAL INVESTMENTS (Identified cost—$193,366,436) | | | 99.7 | % | | | | $ | 201,041,585 | | |
| OTHER ASSETS IN EXCESS OF LIABILITIES | | | 0.3 | % | | | | | 653,416 | | |
| NET ASSETS | | | 100.0 | % | | | | $ | 201,695,001 | | |
Glossary of Portfolio Abbreviations
ADR American Depositary Receipt
USD United States Dollar
Note: Percentages indicated are based on the net assets of the Fund.
a Non-income producing security.
b Rate quoted represents the seven day yield of the fund.
See accompanying notes to financial statements.
16
COHEN & STEERS DIVIDEND VALUE FUND, INC.
STATEMENT OF ASSETS AND LIABILITIES
February 28, 2010
| ASSETS: | |
| Investments in securities, at value (Identified cost—$193,366,436) | | $ | 201,041,585 | | |
| Cash | | | 8,167 | | |
| Receivable for: | |
| Investment securities sold | | | 969,200 | | |
| Dividends and interest | | | 451,367 | | |
| Fund shares sold | | | 423,428 | | |
| Other assets | | | 5,490 | | |
| Total Assets | | | 202,899,237 | | |
| LIABILITIES: | |
| Payable for: | |
| Investment securities purchased | | | 509,301 | | |
| Fund shares redeemed | | | 460,950 | | |
| Investment advisory fees | | | 95,920 | | |
| Administration fees | | | 6,017 | | |
| Distribution fees | | | 5,310 | | |
| Directors' fees | | | 3,324 | | |
| Shareholder servicing fees | | | 1,900 | | |
| Other liabilities | | | 121,514 | | |
| Total Liabilities | | | 1,204,236 | | |
| NET ASSETS | | $ | 201,695,001 | | |
| NET ASSETS consist of: | |
| Paid-in-capital | | $ | 225,972,943 | | |
| Accumulated undistributed net investment income | | | 202,933 | | |
| Accumulated net realized loss | | | (32,156,036 | ) | |
| Net unrealized appreciation | | | 7,675,161 | | |
| | | $ | 201,695,001 | | |
See accompanying notes to financial statements.
17
COHEN & STEERS DIVIDEND VALUE FUND, INC.
STATEMENT OF ASSETS AND LIABILITIES—(Continued)
February 28, 2010
| CLASS A SHARES: | |
| NET ASSETS | | $ | 71,335,123 | | |
| Shares issued and outstanding ($0.001 par value common stock outstanding) | | | 6,654,916 | | |
| Net asset value and redemption price per share | | $ | 10.72 | | |
| Maximum offering price per share ($10.72 ÷ 0.955)a | | $ | 11.23 | | |
| CLASS C SHARES: | |
| NET ASSETS | | $ | 40,820,501 | | |
| Shares issued and outstanding ($0.001 par value common stock outstanding) | | | 3,827,513 | | |
| Net asset value and offering price per shareb | | $ | 10.67 | | |
| CLASS I SHARES: | |
| NET ASSETS | | $ | 89,539,377 | | |
| Shares issued and outstanding ($0.001 par value common stock outstanding) | | | 8,346,093 | | |
| Net asset value, offering, and redemption price per share | | $ | 10.73 | | |
a On investments of $100,000 or more, the offering price is reduced.
b Redemption price per share is equal to the net asset value per share less any applicable deferred sales charge of 1% on shares held for less than one year.
See accompanying notes to financial statements.
18
COHEN & STEERS DIVIDEND VALUE FUND, INC.
STATEMENT OF OPERATIONS
For the Year Ended February 28, 2010
| Investment Income: | |
| Dividend income (net of $85,349 of foreign withholding tax) | | $ | 4,299,223 | | |
| Interest income | | | 8,075 | | |
| Total Income | | | 4,307,298 | | |
| Expenses: | |
| Investment advisory fees | | | 1,361,227 | | |
| Distribution fees—Class A | | | 151,650 | | |
| Distribution fees—Class C | | | 282,256 | | |
| Administration fees | | | 169,563 | | |
| Shareholder servicing fees—Class A | | | 60,660 | | |
| Shareholder servicing fees—Class C | | | 94,085 | | |
| Transfer agent fees and expenses | | | 122,411 | | |
| Professional fees | | | 85,312 | | |
| Shareholder reporting expenses | | | 63,883 | | |
| Registration and filing fees | | | 54,229 | | |
| Directors' fees and expenses | | | 45,492 | | |
| Custodian fees and expenses | | | 35,738 | | |
| Line of credit fees | | | 12,785 | | |
| Miscellaneous | | | 19,875 | | |
| Total Expenses | | | 2,559,166 | | |
| Reduction of Expenses (See Note 2) | | | (609,289 | ) | |
| Net Expenses | | | 1,949,877 | | |
| Net Investment Income | | | 2,357,421 | | |
| Net Realized and Unrealized Gain (Loss): | |
| Net realized loss on: | |
| Investments | | | (4,596,324 | ) | |
| Foreign currency transactions | | | (12,112 | ) | |
| Net realized loss | | | (4,608,436 | ) | |
| Net change in unrealized depreciation on: | |
| Investments | | | 56,177,469 | | |
| Foreign currency translations | | | 899 | | |
| Net change in unrealized depreciation | | | 56,178,368 | | |
| Net realized and unrealized gain | | | 51,569,932 | | |
| Net Increase in Net Assets Resulting from Operations | | $ | 53,927,353 | | |
See accompanying notes to financial statements.
19
COHEN & STEERS DIVIDEND VALUE FUND, INC.
STATEMENT OF CHANGES IN NET ASSETS
| | | For the
Year Ended
February 28, 2010 | | For the
Year Ended
February 28, 2009 | |
| Change in Net Assets: | |
| From Operations: | |
| Net investment income | | $ | 2,357,421 | | | $ | 2,191,567 | | |
| Net realized loss | | | (4,608,436 | ) | | | (25,405,989 | ) | |
| Net change in unrealized appreciation (depreciation) | | | 56,178,368 | | | | (47,311,971 | ) | |
Net increase (decrease) in net assets resulting from
operations | | | 53,927,353 | | | | (70,526,393 | ) | |
| Dividends to Shareholders from Net Investment Income: | |
| Class A | | | (876,722 | ) | | | (942,177 | ) | |
| Class C | | | (315,583 | ) | | | (395,498 | ) | |
| Class I | | | (1,256,756 | ) | | | (641,852 | ) | |
| Total dividends to shareholders | | | (2,449,061 | ) | | | (1,979,527 | ) | |
| Capital Stock Transactions: | |
| Increase in net assets from Fund share transactions | | | 29,001,166 | | | | 69,414,543 | | |
| Total increase (decrease) in net assets | | | 80,479,458 | | | | (3,091,377 | ) | |
| Net Assets: | |
| Beginning of year | | | 121,215,543 | | | | 124,306,920 | | |
| End of yeara | | $ | 201,695,001 | | | $ | 121,215,543 | | |
a Includes undistributed net investment income of $202,933 and $309,171, respectively.
See accompanying notes to financial statements.
20
COHEN & STEERS DIVIDEND VALUE FUND, INC.
FINANCIAL HIGHLIGHTS
The following table includes selected data for a share outstanding throughout each period and other performance information derived from the financial statements. It should be read in conjunction with the financial statements and notes thereto.
| | | Class A | |
| | | For the Year Ended February 28, | | For the Period
August 31, 2005b
through | |
| Per Share Operating Performance: | | 2010 | | 2009 | | 2008a | | 2007 | | February 28, 2006 | |
| Net asset value, beginning of period | | $ | 7.59 | | | $ | 13.57 | | | $ | 13.99 | | | $ | 12.26 | | | $ | 11.46 | | |
| Income from investment operations: | |
| Net investment incomec | | | 0.14 | | | | 0.20 | | | | 0.23 | | | | 0.22 | | | | 0.07 | | |
| Net realized and unrealized gain (loss) | | | 3.13 | | | | (5.99 | ) | | | (0.17 | ) | | | 1.86 | | | | 0.77 | | |
| Total from investment operations | | | 3.27 | | | | (5.79 | ) | | | 0.06 | | | | 2.08 | | | | 0.84 | | |
| Less dividends and distributions to shareholders from: | |
| Net investment income | | | (0.14 | ) | | | (0.19 | ) | | | (0.21 | ) | | | (0.18 | ) | | | (0.04 | ) | |
| Net realized gain | | | — | | | | — | | | | (0.28 | ) | | | (0.17 | ) | | | — | | |
| Total dividends and distributions to shareholders | | | (0.14 | ) | | | (0.19 | ) | | | (0.49 | ) | | | (0.35 | ) | | | (0.04 | ) | |
| Redemption fees retained by the Fund | | | 0.00 | d | | | 0.00 | d | | | 0.01 | | | | 0.00 | d | | | 0.00 | d | |
| Net increase (decrease) in net asset value | | | 3.13 | | | | (5.98 | ) | | | (0.42 | ) | | | 1.73 | | | | 0.80 | | |
| Net asset value, end of period | | $ | 10.72 | | | $ | 7.59 | | | $ | 13.57 | | | $ | 13.99 | | | $ | 12.26 | | |
| Total investment returne | | | 43.41 | % | | | –43.14 | % | | | 0.33 | % | | | 17.12 | % | | | 7.29 | %f | |
| Ratios/Supplemental Data: | |
| Net assets, end of period (in millions) | | $ | 71.3 | | | $ | 45.2 | | | $ | 61.9 | | | $ | 41.7 | | | $ | 6.6 | | |
Ratio of expenses to average daily net assets
(before expense reduction) | | | 1.51 | %g | | | 1.57 | % | | | 1.63 | % | | | 2.33 | %h | | | 7.02 | %i | |
Ratio of expenses to average daily net assets
(net of expense reduction) | | | 1.15 | %g | | | 1.15 | % | | | 1.00 | % | | | 1.00 | % | | | 1.28 | %i | |
Ratio of net investment income (loss) to average daily net assets
(before expense reduction) | | | 1.02 | % | | | 1.35 | % | | | 0.95 | % | | | 0.30 | % | | | (4.66 | )%i | |
Ratio of net investment income to average daily net assets
(net of expense reduction) | | | 1.38 | % | | | 1.76 | % | | | 1.59 | % | | | 1.63 | % | | | 1.08 | %i | |
| Portfolio turnover rate | | | 37 | % | | | 43 | % | | | 52 | % | | | 30 | % | | | 8 | %f | |
a For the year ended February 29.
b Commencement of operations.
c Calculation based on average shares outstanding.
d Amount is less than $0.005.
e Does not reflect sales charges, which would reduce return.
f Not annualized.
g Reflects Fund level ratio for non-class specific expenses.
h Due to the significant growth of net assets on a small asset base, the expense ratio, when averaged over the year, differs from the Fund's other classes by an amount other than class specific expenses. Typically, the ratios between classes will only differ by the class specific expenses (i.e., distribution fees and shareholder servicing fees).
i Annualized.
See accompanying notes to financial statements.
21
COHEN & STEERS DIVIDEND VALUE FUND, INC.
FINANCIAL HIGHLIGHTS—(Continued)
| | | Class C | |
| | | For the Year Ended February 28, | | For the Period
August 31, 2005b
through | |
| Per Share Operating Performance: | | 2010 | | 2009 | | 2008a | | 2007 | | February 28, 2006 | |
| Net asset value, beginning of period | | $ | 7.55 | | | $ | 13.50 | | | $ | 13.94 | | | $ | 12.23 | | | $ | 11.46 | | |
| Income from investment operations: | |
| Net investment incomec | | | 0.07 | | | | 0.13 | | | | 0.14 | | | | 0.14 | | | | 0.03 | | |
| Net realized and unrealized gain (loss) | | | 3.13 | | | | (5.96 | ) | | | (0.18 | ) | | | 1.86 | | | | 0.77 | | |
| Total from investment operations | | | 3.20 | | | | (5.83 | ) | | | (0.04 | ) | | | 2.00 | | | | 0.80 | | |
| Less dividends and distributions to shareholders from: | |
| Net investment income | | | (0.08 | ) | | | (0.12 | ) | | | (0.14 | ) | | | (0.12 | ) | | | (0.03 | ) | |
| Net realized gain | | | — | | | | — | | | | (0.28 | ) | | | (0.17 | ) | | | — | | |
| Total dividends and distributions to shareholders | | | (0.08 | ) | | | (0.12 | ) | | | (0.42 | ) | | | (0.29 | ) | | | (0.03 | ) | |
| Redemption fees retained by the Fund | | | 0.00 | d | | | 0.00 | d | | | 0.02 | | | | 0.00 | d | | | 0.00 | d | |
| Net increase (decrease) in net asset value | | | 3.12 | | | | (5.95 | ) | | | (0.44 | ) | | | 1.71 | | | | 0.77 | | |
| Net asset value, end of period | | $ | 10.67 | e | | $ | 7.55 | | | $ | 13.50 | | | $ | 13.94 | | | $ | 12.23 | | |
| Total investment returnf | | | 42.43 | %e | | | –43.50 | % | | | –0.35 | % | | | 16.40 | % | | | 6.96 | %g | |
| Ratios/Supplemental Data: | |
| Net assets, end of period (in millions) | | $ | 40.8 | | | $ | 31.4 | | | $ | 41.2 | | | $ | 14.7 | | | $ | 3.8 | | |
Ratio of expenses to average daily net assets
(before expense reduction) | | | 2.16 | %h | | | 2.22 | % | | | 2.27 | % | | | 3.21 | %i | | | 7.93 | %j | |
Ratio of expenses to average daily net assets
(net of expense reduction) | | | 1.80 | %h | | | 1.80 | % | | | 1.65 | % | | | 1.65 | % | | | 1.95 | %j | |
Ratio of net investment income (loss) to average daily net assets
(before expense reduction) | | | 0.39 | % | | | 0.72 | % | | | 0.33 | % | | | (0.50 | )% | | | (5.53 | )%j | |
Ratio of net investment income to average daily net assets
(net of expense reduction) | | | 0.75 | % | | | 1.14 | % | | | 0.96 | % | | | 1.06 | % | | | 0.45 | %j | |
| Portfolio turnover rate | | | 37 | % | | | 43 | % | | | 52 | % | | | 30 | % | | | 8 | %g | |
a For the year ended February 29.
b Commencement of operations.
c Calculation based on average shares outstanding.
d Amount is less than $0.005.
e The February 28, 2010 net asset value reflects adjustments in accordance with accounting principles generally accepted in the United States of America and as such, the net asset value for financial reporting purposes and the returns that would be based upon the net asset value would differ from the net asset value and return reported on February 28, 2010.
f Does not reflect sales charges, which would reduce return.
g Not annualized.
h Reflects Fund level ratio for non-class specific expenses.
i Due to the significant growth of net assets on a small asset base, the expense ratio, when averaged over the year, differs from the Fund's other classes by an amount other than class specific expenses. Typically, the ratios between classes will only differ by the class specific expenses (i.e., distribution fees and shareholder servicing fees).
j Annualized.
See accompanying notes to financial statements.
22
COHEN & STEERS DIVIDEND VALUE FUND, INC.
FINANCIAL HIGHLIGHTS—(Continued)
| | | Class I | |
| | | For the Year Ended February 28, | | For the Period
August 31, 2005b
through | |
| Per Share Operating Performance: | | 2010 | | 2009 | | 2008a | | 2007 | | February 28, 2006 | |
| Net asset value, beginning of period | | $ | 7.59 | | | $ | 13.58 | | | $ | 14.00 | | | $ | 12.27 | | | $ | 11.46 | | |
| Income from investment operations: | |
| Net investment incomec | | | 0.17 | | | | 0.24 | | | | 0.28 | | | | 0.27 | | | | 0.09 | | |
| Net realized and unrealized gain (loss) | | | 3.15 | | | | (5.99 | ) | | | (0.18 | ) | | | 1.87 | | | | 0.76 | | |
| Total from investment operations | | | 3.32 | | | | (5.75 | ) | | | 0.10 | | | | 2.14 | | | | 0.85 | | |
| Less dividends and distributions to shareholders from: | |
| Net investment income | | | (0.18 | ) | | | (0.24 | ) | | | (0.26 | ) | | | (0.24 | ) | | | (0.04 | ) | |
| Net realized gain | | | — | | | | — | | | | (0.28 | ) | | | (0.17 | ) | | | — | | |
| Total dividends and distributions to shareholders | | | (0.18 | ) | | | (0.24 | ) | | | (0.54 | ) | | | (0.41 | ) | | | (0.04 | ) | |
| Redemption fees retained by the Fund | | | 0.00 | d | | | 0.00 | d | | | 0.02 | | | | 0.00 | d | | | 0.00 | d | |
| Net increase (decrease) in net asset value | | | 3.14 | | | | (5.99 | ) | | | (0.42 | ) | | | 1.73 | | | | 0.81 | | |
| Net asset value, end of period | | $ | 10.73 | | | $ | 7.59 | | | $ | 13.58 | | | $ | 14.00 | | | $ | 12.27 | | |
| Total investment return | | | 44.03 | % | | | –42.98 | % | | | 0.65 | % | | | 17.63 | % | | | 7.42 | %e | |
| Ratios/Supplemental Data: | |
| Net assets, end of period (in millions) | | $ | 89.5 | | | $ | 44.6 | | | $ | 21.2 | | | $ | 9.4 | | | $ | 3.7 | | |
Ratio of expenses to average daily net assets
(before expense reduction) | | | 1.16 | %f | | | 1.23 | % | | | 1.28 | % | | | 2.27 | %g | | | 11.99 | %h | |
Ratio of expenses to average daily net assets
(net of expense reduction) | | | 0.80 | %f | | | 0.80 | % | | | 0.65 | % | | | 0.65 | % | | | 1.07 | %h | |
Ratio of net investment income (loss) to average daily net assets
(before expense reduction) | | | 1.36 | % | | | 1.81 | % | | | 1.31 | % | | | 0.45 | % | | | (9.43 | )%h | |
Ratio of net investment income to average daily net assets
(net of expense reduction) | | | 1.72 | % | | | 2.24 | % | | | 1.94 | % | | | 2.06 | % | | | 1.49 | %h | |
| Portfolio turnover rate | | | 37 | % | | | 43 | % | | | 52 | % | | | 30 | % | | | 8 | %e | |
a For the year ended February 29.
b Commencement of operations.
c Calculation based on average shares outstanding.
d Amount is less than $0.005.
e Not annualized.
f Reflects Fund level ratio for non-class specific expenses.
g Due to the significant growth of net assets on a small asset base, the expense ratio, when averaged over the year, differs from the Fund's other classes by an amount other than class specific expenses. Typically, the ratios between classes will only differ by the class specific expenses (i.e., distribution fees and shareholder servicing fees).
h Annualized.
See accompanying notes to financial statements.
23
COHEN & STEERS DIVIDEND VALUE FUND, INC.
NOTES TO FINANCIAL STATEMENTS
Note 1. Significant Accounting Policies
Cohen & Steers Dividend Value Fund, Inc. (the Fund) was incorporated under the laws of the State of Maryland on November 9, 2004 and is registered under the Investment Company Act of 1940, as amended, as a nondiversified, open-end management investment company. The Fund's investment objectives are high level of current income and long term growth of income and capital appreciation. Investment operations commenced on August 31, 2005. The authorized shares of the Fund are divided into three classes designated Class A, C, and I shares. Each of the Fund's shares has equal dividend, liquidation and voting rights (except for matters relating to distributions and shareholder servicing of such shares).
The following is a summary of significant accounting policies consistently followed by the Fund in the preparation of its financial statements. The policies are in conformity with accounting principles generally accepted in the United States of America (GAAP). The preparation of the financial statements in accordance with GAAP requires management to make estimates and assumptions that affect the reported amounts of assets and liabilities at the date of the financial statements and the reported amounts of income and expenses during the reporting period. Actual results could differ from those estimates.
Portfolio Valuation: Investments in securities that are listed on the New York Stock Exchange are valued, except as indicated below, at the last sale price reflected at the close of the New York Stock Exchange on the business day as of which such value is being determined. If there has been no sale on such day, the securities are valued at the mean of the closing bid and asked prices for the day or, if no asked price is available, at the bid price.
Securities not listed on the New York Stock Exchange but listed on other domestic or foreign securities exchanges are valued in a similar manner. Securities traded on more than one securities exchange are valued at the last sale price on the business day as of which such value is being determined as reflected on the tape at the close of the exchange representing the principal market for such securities. If after the close of a foreign market, but prior to the close of business on the day the securities are being valued, market conditions change significantly, certain foreign securities may be fair valued pursuant to procedures established by the Board of Directors.
Readily marketable securities traded in the over-the-counter market, including listed securities whose primary market is believed by Cohen & Steers Capital Management, Inc. (the advisor) to be over-the-counter, are valued at the official closing prices as reported by sources as the Board of Directors deem appropriate to reflect their fair market value. If there has been no sale on such day, the securities are valued at the mean of the closing bid and asked prices for the day, or if no asked price is available, at the bid price. However, certain fixed-income securities may be valued on the basis of prices provided by a pricing service when such prices are believed by the Board of Directors to reflect the fair market value of such securities.
Securities for which market prices are unavailable, or securities for which the advisor determines that bid and/or asked price does not reflect market value, will be valued at fair value pursuant to procedures approved by the Fund's Board of Directors. Circumstances in which market prices may be unavailable include, but are not
24
COHEN & STEERS DIVIDEND VALUE FUND, INC.
NOTES TO FINANCIAL STATEMENTS—(Continued)
limited to, when trading in a security is suspended, the exchange on which the security is traded is subject to an unscheduled close or disruption or material events occur after the close of the exchange on which the security is principally traded. In these circumstances, the Fund determines fair value in a manner that fairly reflects the market value of the security on the valuation date based on consideration of any information or factors it deems appropriate. These may include, but are not limited to, recent transactions in comparable securities, information relating to the specific security and developments in the markets.
The Fund's use of fair value pricing may cause the net asset value of Fund shares to differ from the net asset value that would be calculated using market quotations. Fair value pricing involves subjective judgments and it is possible that the fair value determined for a security may be materially different than the value that could be realized upon the sale of that security.
Short-term debt securities with a maturity date of 60 days or less are valued at amortized cost, which approximates value. Investments in open-end mutual funds are valued at their closing net asset value.
Fair value is defined as the price that the Fund would receive to sell an investment or pay to transfer a liability in an orderly transaction with an independent buyer in the principal market, or in the absence of a principal market the most advantageous market for the investment or liability. The hierarchy of inputs that are used in determining the fair value of the Fund's investments is summarized below.
• Level 1—quoted prices in active markets for identical investments
• Level 2—other significant observable inputs (including quoted prices for similar investments, interest rates, credit risk, etc.)
• Level 3—significant unobservable inputs (including the Fund's own assumptions in determining the fair value of investments)
The inputs or methodology used for valuing securities are not necessarily an indication of the risk associated with investing in those securities.
The following is a summary of the inputs used as of February 28, 2010 in valuing the Fund's investments carried at value:
| | | Total | | Quoted Prices In
Active Market for
Identical Assets
(Level 1) | | Significant
Other Observable
Inputs
(Level 2) | | Significant
Unobservable
Inputs
(Level 3) | |
| Common Stock | | $ | 195,080,748 | | | $ | 195,080,748 | | | $ | — | | | | — | | |
| Money Market Funds | | | 5,960,837 | | | | — | | | | 5,960,837 | | | | — | | |
| Total Investments | | $ | 201,041,585 | | | $ | 195,080,748 | | | $ | 5,960,837 | | | | — | | |
25
COHEN & STEERS DIVIDEND VALUE FUND, INC.
NOTES TO FINANCIAL STATEMENTS—(Continued)
Security Transactions, Investment Income and Expense Allocations: Security transactions are recorded on trade date. Realized gains and losses on investments sold are recorded on the basis of identified cost. Interest income is recorded on the accrual basis. Discounts are accreted and premiums are amortized over the life of the respective securities. Dividend income is recorded on the ex-dividend date, except for certain dividends on foreign securities, which are recorded as soon as the Fund is informed after the ex-dividend date. Income, expenses (other than expenses attributable to a specific class), and realized and unrealized gains or losses on investments are allocated to each class of shares based on its relative net assets.
Foreign Currency Translations: The books and records of the Fund are maintained in U.S. dollars as follows: (1) the foreign currency market value of investment securities, other assets and liabilities and foreign currency contracts are translated at the exchange rates prevailing at the end of the period; and (2) purchases, sales, income and expenses are translated at the exchange rates prevailing on the respective dates of such transactions. The resultant exchange gains and losses are recorded as realized and unrealized gain/loss on foreign exchange transactions. Pursuant to U.S. federal income tax regulations, certain foreign exchange gains/losses included in realized and unrealized gain/loss are included in or are a reduction of ordinary income for federal income tax purposes. The Fund does not isolate that portion of the results of operations arising as a resul t of changes in the foreign exchange rates from the changes in the market prices of the securities.
Foreign Securities: The Fund may directly purchase securities of foreign issuers. Investing in securities of foreign issuers involves special risks not typically associated with investing in securities of U.S. issuers. The risks include possible revaluation of currencies, the ability to repatriate funds, less complete financial information about companies and possible future adverse political and economic developments. Moreover, securities of many foreign issuers and their markets may be less liquid and their prices more volatile than those of securities of comparable U.S. issuers.
Dividends and Distributions to Shareholders: Dividends from net investment income and capital gain distributions are determined in accordance with U.S. federal income tax regulations, which may differ from GAAP. Dividends from net investment income, if any, are declared and paid quarterly. Net realized capital gains, unless offset by any available capital loss carryforward, are typically distributed to shareholders at least annually. Dividends and distributions to shareholders are recorded on the ex-dividend date and are automatically reinvested in full and fractional shares of the Fund based on the net asset value per share at the close of business on the payable date unless the shareholder has elected to have them paid in cash.
Income Taxes: It is the policy of the Fund to continue to qualify as a regulated investment company, if such qualification is in the best interest of the shareholders, by complying with the requirements of Subchapter M of the Internal Revenue Code applicable to regulated investment companies, and by distributing substantially all of its taxable earnings to its shareholders. Accordingly, no provision for federal income or excise tax is necessary. Management has analyzed the Fund's tax positions taken on federal income tax returns as well as its tax positions in non-U.S. jurisdictions where it trades for all open tax years and has concluded that as of February 28, 2010, no
26
COHEN & STEERS DIVIDEND VALUE FUND, INC.
NOTES TO FINANCIAL STATEMENTS—(Continued)
provisions for income tax would be required in the Fund's financial statements. The Fund's tax positions for the tax years for which the applicable statutes of limitations have not expired are subject to examination by the Internal Revenue Service, state departments of revenue and by foreign tax authorities.
Note 2. Investment Advisory and Administration Fees and Other Transactions with Affiliates
Investment Advisory Fees: The advisor serves as the Fund's investment advisor pursuant to an investment advisory agreement (the investment advisory agreement). Under the terms of the investment advisory agreement, the advisor provides the Fund with the day-to-day investment decisions and generally manages the Fund's investments in accordance with the stated policies of the Fund, subject to the supervision of the Fund's Board of Directors.
For the services provided to the Fund, the advisor receives a fee, accrued daily and paid monthly, at the annual rate of 0.80% of the average daily net assets of the Fund for the first $1.5 billion and 0.70% thereafter of the average daily net assets of the Fund.
For the year ended February 28, 2010, and through June 30, 2011, the advisor has contractually agreed to waive its fee and/or reimburse the Fund for expenses incurred to the extent necessary to maintain the Fund's operating expenses at 1.15% for Class A shares, 1.80% for Class C shares and 0.80% for Class I shares.
Administration Fees: The Fund has entered into an administration agreement with the advisor under which the advisor performs certain administrative functions for the Fund and receives a fee, accrued daily and paid monthly, at the annual rate of 0.04% of the Fund's average daily net assets. For the year ended February 28, 2010, the Fund paid the advisor $68,061 in fees under this administration agreement. Additionally, the Fund pays State Street Bank and Trust Company as sub-administrator under a fund accounting and administration agreement.
Distribution Fees: Shares of the Fund are distributed by Cohen & Steers Securities, LLC (the distributor), an affiliated entity of the advisor. The Fund has adopted a distribution plan (the plan) pursuant to Rule 12b-1 under the Investment Company Act of 1940. The plan provides that the Fund will pay the distributor a fee accrued daily and paid monthly at an annual rate of up to 0.25% of the average daily net assets attributable to the Class A shares and up to 0.75% of the average daily net assets attributable to the Class C shares.
For year ended February 28, 2010, the Fund has been advised that the distributor received $15,717 in sales commissions from the sale of Class A shares and that the distributor also received $9,532 of contingent deferred sales charges relating to redemptions of Class C shares. The distributor has advised the Fund that proceeds from the contingent deferred sales charges on these classes are paid to the distributor and are used by the distributor to defray its expenses related to providing distribution related services to the Fund in connection with the sale of these classes, including payments to dealers and other financial intermediaries for selling these classes and interest and other financing costs associated with these classes.
27
COHEN & STEERS DIVIDEND VALUE FUND, INC.
NOTES TO FINANCIAL STATEMENTS—(Continued)
Shareholder Servicing Fees: For shareholder services, the Fund pays the distributor a fee, accrued daily and paid monthly, at an annual rate of up to 0.10% of the average daily net asset value of the Fund's Class A shares and up to 0.25% of the average daily net asset value of the Fund's Class C shares. The distributor is responsible for paying qualified financial institutions for shareholder services.
Directors' and Officers' Fees: Certain directors and officers of the Fund are also directors, officers, and/or employees of the advisor. The Fund does not pay compensation to any affiliated directors and officers except for the Chief Compliance Officer, who received $3,320 from the Fund for the year ended February 28, 2010.
Note 3. Purchases and Sales of Securities
Purchases and sales of securities, excluding short-term investments, for the year ended February 28, 2010, totaled $87,873,434 and $60,480,264, respectively.
Note 4. Income Tax Information
The tax character of dividends paid was as follows:
| | | For the Year Ended
February 28, | |
| | | 2010 | | 2009 | |
| Ordinary income | | $ | 2,449,061 | | | $ | 1,979,527 | | |
As of February 28, 2010, the tax-basis components of accumulated earnings and the federal tax cost were as follows:
| Cost for federal income tax purposes | | $ | 195,295,227 | | |
| Gross unrealized appreciation | | $ | 13,326,713 | | |
| Gross unrealized depreciation | | | (7,580,355 | ) | |
| Net unrealized appreciation | | $ | 5,746,358 | | |
| Undistributed ordinary income | | $ | 202,933 | | |
As of February 28, 2010, the Fund had a net capital loss carryforward of $30,227,246, of which $14,244,984 will expire on February 28, 2017 and $15,982,262 will expire on February 28, 2018. This carryforward may be used to offset future capital gains to the extent provided by regulations.
As of February 28, 2010, the Fund had temporary book/tax differences primarily attributable to wash sales on portfolio securities and permanent book/tax differences primarily attributable to foreign currency transactions.
28
COHEN & STEERS DIVIDEND VALUE FUND, INC.
NOTES TO FINANCIAL STATEMENTS—(Continued)
To reflect reclassifications arising from the permanent differences, paid-in capital was charged $3, accumulated net realized loss was credited $14,601 and accumulated net investment income was charged $14,598. Net assets were not affected by this reclassification.
Note 5. Capital Stock
The Fund is authorized to issue 200 million shares of capital stock, at a par value of $0.001 per share. The Board of Directors of the Fund may increase or decrease the aggregate number of shares of common stock that the Fund has authority to issue. Transactions in Fund shares were as follows:
| | | For the
Year Ended
February 28, 2010 | | For the
Year Ended
February 28, 2009 | |
| | | Shares | | Amount | | Shares | | Amount | |
| CLASS A: | |
| Sold | | | 2,762,197 | | | $ | 26,934,777 | | | | 4,374,278 | | | $ | 49,160,694 | | |
Issued as reinvestment of
dividends | | | 58,131 | | | | 549,795 | | | | 41,690 | | | | 478,532 | | |
| Redeemed | | | (2,122,135 | ) | | | (20,134,990 | ) | | | (3,023,937 | ) | | | (35,115,572 | ) | |
Redemption fees retained by
the Funda | | | — | | | | 6,422 | | | | — | | | | 12,660 | | |
| Net increase | | | 698,193 | | | $ | 7,356,004 | | | | 1,392,031 | | | $ | 14,536,314 | | |
| CLASS C: | |
| Sold | | | 1,210,874 | | | $ | 11,938,110 | | | | 2,370,555 | | | $ | 25,064,620 | | |
Issued as reinvestment of
dividends | | | 10,252 | | | | 95,171 | | | | 8,751 | | | | 97,621 | | |
| Redeemed | | | (1,550,864 | ) | | | (14,764,657 | ) | | | (1,273,616 | ) | | | (14,005,094 | ) | |
Redemption fees retained by
the Funda | | | — | | | | 3,994 | | | | — | | | | 8,208 | | |
| Net increase (decrease) | | | (329,738 | ) | | $ | (2,727,382 | ) | | | 1,105,690 | | | $ | 11,165,355 | | |
29
COHEN & STEERS DIVIDEND VALUE FUND, INC.
NOTES TO FINANCIAL STATEMENTS—(Continued)
| | | For the
Year Ended
February 28, 2010 | | For the
Year Ended
February 28, 2009 | |
| | | Shares | | Amount | | Shares | | Amount | |
| CLASS I: | |
| Sold | | | 3,720,388 | | | $ | 36,284,047 | | | | 5,139,152 | | | $ | 52,628,560 | | |
Issued as reinvestment of
dividends | | | 118,881 | | | | 1,144,167 | | | | 47,911 | | | | 529,342 | | |
| Redeemed | | | (1,375,612 | ) | | | (13,063,821 | ) | | | (862,394 | ) | | | (9,451,574 | ) | |
Redemption fees retained by
the Funda | | | — | | | | 8,151 | | | | — | | | | 6,546 | | |
| Net increase | | | 2,463,657 | | | $ | 24,372,544 | | | | 4,324,669 | | | $ | 43,712,874 | | |
a The Fund may charge a 2% redemption fee on shares sold within 60 days of the time of purchase. Redemption fees are paid directly to the Fund.
Note 6. Borrowings
The Fund, in conjunction with other Cohen & Steers funds, is a party to a $200,000,000 syndicated credit agreement (the credit agreement) with State Street Bank and Trust Company, as administrative agent and operations agent, and the lenders identified in the credit agreement, which expires January 28, 2011. The Fund pays a commitment fee of 0.15% per annum on its proportionate share of the unused portion of the credit agreement.
During the year ended February 28, 2010, the Fund did not borrow under the credit agreement.
Note 7. Other
In the normal course of business, the Fund enters into contracts that provide general indemnifications. The Fund's maximum exposure under these arrangements is dependent on claims that may be made against the Fund in the future and, therefore, cannot be estimated; however, based on experience, the risk of material loss from such claims is considered remote.
30
COHEN & STEERS DIVIDEND VALUE FUND, INC.
REPORT OF INDEPENDENT REGISTERED PUBLIC ACCOUNTING FIRM
To the Board of Directors and Shareholders of
Cohen & Steers Dividend Value Fund, Inc.
In our opinion, the accompanying statement of assets and liabilities, including the schedule of investments, and the related statements of operations and of changes in net assets and the financial highlights present fairly, in all material respects, the financial position of Cohen & Steers Dividend Value Fund, Inc. (the "Fund") at February 28, 2010, and the results of its operations for the year then ended, the changes in its net assets for each of the two years in the period then ended and the financial highlights for each of the periods presented, in conformity with accounting principles generally accepted in the United States of America. These financial statements and financial highlights (hereafter referred to as "financial statements") are the responsibility of the Fund's management. Our responsibility is to express an opinion on these financial statements based on our audits. We conducted our audits of these financial statements in accordance with the standards of the Public Company Accounting Oversight Board (United States). Those standards require that we plan and perform the audit to obtain reasonable assurance about whether the financial statements are free of material misstatement. An audit includes examining, on a test basis, evidence supporting the amounts and disclosures in the financial statements, assessing the accounting principles used and significant estimates made by management, and evaluating the overall financial statement presentation. We believe that our audits, which included confirmation of securities at February 28, 2010 by correspondence with the custodian and brokers, provide a reasonable basis for our opinion.
PricewaterhouseCoopers LLP
New York, New York
April 15, 2010
31
COHEN & STEERS DIVIDEND VALUE FUND, INC.
TAX INFORMATION—2010 (Unaudited)
Pursuant to the Jobs and Growth Relief Reconciliation Act of 2003, the Fund designates qualified dividend income of $2,449,061. Additionally, 100% of the ordinary dividends qualified for the dividends received deduction available to corporations.
OTHER INFORMATION
A description of the policies and procedures that the Fund uses to determine how to vote proxies relating to portfolio securities is available (i) without charge, upon request, by calling 800-330-7348, (ii) on our Web site at cohenandsteers.com or (iii) on the Securities and Exchange Commission's Web site at http://www.sec.gov. In addition, the Fund's proxy voting record for the most recent 12-month period ended June 30 is available (i) without charge, upon request, by calling 800-330-7348 or (ii) on the SEC's Web site at http://www.sec.gov.
The Fund files its complete schedule of portfolio holdings with the SEC for the first and third quarters of each fiscal year on Form N-Q. The Fund's Forms N-Q are available (i) without charge, upon request by calling 800-330-7348, or (ii) on the SEC's Web site at http://www.sec.gov. In addition, the Forms N-Q may be reviewed and copied at the SEC's Public Reference Room in Washington, DC. Information on the operation of the Public Reference Room may be obtained by calling 800-SEC-0330.
Please note that the distributions paid by the Fund to shareholders are subject to recharacterization for tax purposes. The Fund may also pay distributions in excess of the Fund's net investment company taxable income and this excess would be a tax-free return of capital distributed from the Fund's assets. The final tax treatment of all distributions is reported to shareholders on their 1099-DIV forms, which are mailed after the close of each calendar year.
32
COHEN & STEERS DIVIDEND VALUE FUND, INC.
APPROVAL OF INVESTMENT ADVISORY AGREEMENT
The Board of Directors of the Fund, including a majority of the directors who are not parties to the Fund's investment advisory agreement (the "Advisory Agreement"), or interested persons of any such party ("Independent Directors"), has the responsibility under the Investment Company Act of 1940 to approve the Fund's Advisory Agreement for its initial two year term and its continuation annually thereafter at a meeting of the Board of Directors called for the purpose of voting on the approval or continuation. At a meeting held in person on September 22-23, 2009, the Advisory Agreement was discussed and was unanimously continued for a term ending June 30, 2010 by the Fund's Board of Directors, including the Independent Directors. The Independent Directors were represented by independent counsel who assisted them in their deliberations during the meeting and executive session.
In considering whether to continue the Advisory Agreement, the Board of Directors reviewed materials provided by the Fund's investment advisor (the "Investment Advisor") and Fund counsel which included, among other things, fee, expense and performance information compared to peer funds ("Peer Funds"), and performance comparison to a larger category universe, prepared by an independent data provider; supplemental performance and summary information prepared by the Investment Advisor; and memoranda outlining the legal duties of the Board of Directors. The Board of Directors also spoke directly with representatives of the independent data provider and met with investment advisory personnel. In addition, the Board of Directors considered information provided from time to time by the Investment Advisor throughout the year at meetings of the Board of Directors, including presentations by portfolio managers relating to the investment performance of the Fund and the investment strategies used in pursuing the Fund's objective. In particular, the Board of Directors considered the following:
(i) The nature, extent and quality of services provided by the Investment Advisor: The Board of Directors reviewed the services that the Investment Advisor provides to the Fund, including, but not limited to, making the day-to-day investment decisions for the Fund, and generally managing the Fund's investments in accordance with the stated policies of the Fund. The Board of Directors also discussed with officers and portfolio managers of the Fund the types of transactions that were being done on behalf of the Fund. Additionally, the Board of Directors took into account the services provided by the Investment Advisor to its other funds, including those that invest substantially in real estate securities and have investment objectives and strategies similar to the Fund. The Board of Directors next considered the education, background and experience of the Investment Advisor's personnel, noting particularly that the favorable history and reputation of the portfolio managers for the Fund has had, and would likely continue to have, a favorable impact on the Fund. The Board of Directors further noted the Investment Advisor's ability to attract quality and experienced personnel. After consideration of the above factors, among others, the Board of Directors concluded that the nature, quality and extent of services provided by the Investment Advisor are adequate and appropriate.
(ii) Investment performance of the Fund and the Investment Advisor: The Board of Directors considered the investment performance of the Fund compared to Peer Funds and compared to a relevant benchmark. The peer
33
COHEN & STEERS DIVIDEND VALUE FUND, INC.
group selected by the independent data provider included large cap core funds. The Board of Directors noted that the Fund had underperformed the medians of the Peer Funds for the year-to-date and one-year periods ended June 30, 2009, ranking the Fund in the fifth and fourth quintiles, respectively, and outperformed the Peer Funds' median for the three-year period, ranking in the first quintile. The Fund outperformed its benchmark for the year-to-date, and one- and three-year periods ended June 30, 2009. The Board of Directors also considered the Fund's performance versus a peer group comprised of large cap value funds selected by the independent data provider showing the Fund underperformed the peer funds' median year-to-date and outperformed the funds' medians for the one- and three-year periods. The Board of Directors also noted that the Investment Advisor is currently waiving a portion of its advisory fee and/or reimbursing expenses to li mit total expenses of the Fund. The Board of Directors engaged in discussions with the Investment Advisor regarding the contributors and detractors to the Fund's performance during the periods. The Board of Directors also considered supplemental performance data provided by the Investment Advisor, including a narrative summary of various factors affecting performance, and the Investment Advisor's performance in managing other funds that invest in real estate, large cap and dividend paying securities. The Board of Directors determined to closely monitor the Fund's performance and requested that the Investment Advisor provide updates for this purpose.
(iii) Cost of the services provided and profits realized by the Investment Advisor from the relationship with the Fund: Next, the Board of Directors considered the advisory fees and administrative fees payable by the Fund as well as total expense ratios. The Board of Directors noted that the Fund's actual advisory fee was lower than the Peer Funds' median while the Fund's contractual advisory fee was higher than the Peer Funds' median, ranking the Fund in the first and fourth quintiles, respectively. The Board of Directors further noted that the Fund's overall total expense ratio was lower than the Peer Funds' median, ranking the Fund in the first quintile. The Board of Directors considered that the Fund's overall net expense ratio also ranked in the first quintile versus the large cap value peer group. The Board of Directors further considered that the Investment Advisor waives its fee and reimburses expenses to limit total operating expenses of the Fund. The Board of Directors noted that the Fund charges an administration fee payable to the Investment Advisor. In light of the considerations above, the Board of Directors concluded that the Fund's expense structure was satisfactory.
The Board of Directors also reviewed information regarding the profitability to the Investment Advisor of its relationship with the Fund. The Board of Directors considered the level of the Investment Advisor's profits and whether the profits were reasonable for the Investment Advisor. The Board of Directors noted that the Investment Advisor is currently waiving its fee and/or reimbursing expenses of the Fund. The Board of Directors took into consideration other benefits to be derived by the Investment Advisor in connection with the Advisory Agreement, noting particularly the research and related services, within the meaning of Section 28(e) of the Securities Exchange Act of 1934, as amended, that the Investment Advisor receives by allocating the Fund's brokerage transactions. The Board of Directors then considered the administrative services provided by the Investment Advisor, including compliance and accounting services. The Board of Direct ors also considered the fees received by the Investment Advisor under the Administration Agreement, noting the significant services received, such as
34
COHEN & STEERS DIVIDEND VALUE FUND, INC.
operational services and furnishing office space and facilities for the Fund, and providing persons satisfactory to the Board of Directors to serve as officers of the Fund, and that these services were beneficial to the Fund. The Board of Directors noted that because of the Fund's small size, the operating expenses continue to be subsidized, and the Fund is not yet profitable.
(iv) The extent to which economies of scale would be realized as the Fund grows and whether fee levels would reflect such economies of scale: The Board of Directors noted that the Fund's advisory fee schedule contains a breakpoint of 10 basis points once the Fund's assets reached $1.5 billion. The Board of Directors considered the Fund's asset size and determined that there were not at this time significant economies of scale that were not being shared with shareholders.
(v) Comparison of services rendered and fees paid to those under other investment advisory contracts, such as contracts of the same and other investment advisers or other clients: As discussed above in (i) and (iii), the Board of Directors compared both the services rendered and the fees paid under the Advisory Agreement to those under other investment advisory contracts of other investment advisers managing Peer Funds. The Board of Directors also considered the services rendered, fees paid and profitability under the Advisory Agreement to the Investment Advisor's other fund advisory agreements and advisory contracts with institutional and other clients with similar investment mandates, as well as the profitability under the Advisory Agreement to the Investment Advisor's other advisory contracts with institutional and other clients with similar investment mandates . The Board of Directors determined that on a comparative basis the fees under the Advisory Agreement were reasonable in relation to the services provided.
No single factor was cited as determinative to the decision of the Board of Directors. Rather, after weighing all of the considerations and conclusions discussed above, the Board of Directors, including the Independent Directors, unanimously approved the continuation of the Advisory Agreement.
35
COHEN & STEERS DIVIDEND VALUE FUND, INC.
MANAGEMENT OF THE FUND
The business and affairs of the Fund are managed under the direction of the Board of Directors. The Board of Directors approves all significant agreements between the Fund and persons or companies furnishing services to it, including the Fund's agreements with its advisor, administrator, sub-administrator, custodian and transfer agent. The management of the Fund's day-to-day operations is delegated to its officers, the advisor, administrator and sub-administrator, subject always to the investment objective and policies of the Fund and to the general supervision of the Board of Directors.
The Board of Directors and officers of the Fund and their principal occupations during at least the past five years are set forth below. The statement of additional information (SAI) includes additional information about Fund directors and is available, without charge, upon request by calling 800-330-7348.
| Name, Address1 and Age | | Position(s) Held
with Fund | | Term of
Office2 | | Principal Occupation
During At Least
The Past 5 Years
(Including Other
Directorships Held) | | Number of
Funds Within
Fund
Complex
Overseen by
Director
(Including
the Fund) | | Length
of Time
Served3 | |
| Interested Directors4 | |
|
Robert H. Steers
Age: 57 | | Director and Co-Chairman | | Until next election of directors | | Co-Chairman and Co-Chief Executive Officer of Cohen & Steers Capital Management, Inc. (the Advisor) since 2003 and its parent, Cohen & Steers, Inc. since 2004. Vice President of Cohen & Steers Securities, LLC, the Fund's Distributor. | | | 16 | | | 1991 to present | |
|
Martin Cohen
Age: 61 | | Director and Co-Chairman | | Until next election of directors | | Co-Chairman and Co-Chief Executive Officer of the Advisor since 2003 and Cohen & Steers, Inc. since 2004. Prior to that, President of the Advisor; Vice President of the Distributor. | | | 16 | | | 1991 to present | |
|
(table continued on next page)
36
COHEN & STEERS DIVIDEND VALUE FUND, INC.
(table continued from previous page)
| Name, Address1 and Age | | Position(s) Held
with Fund | | Term of
Office2 | | Principal Occupation
During At Least
The Past 5 Years
(Including Other
Directorships Held) | | Number of
Funds Within
Fund
Complex
Overseen by
Director
(Including
the Fund) | | Length
of Time
Served3 | |
| Disinterested Directors | |
|
Bonnie Cohen5
Age: 67 | | Director | | Until next election of directors | | Consultant; Board Member, Global Heritage Fund since 2002; Advisory Board member, Posse Foundation since 2004; President, H. Rubenstein Foundation since 1996; Trustee, District of Columbia Public Libraries since 2004; Board member, U.S. Department of Defense Business Board since 2010; Board member, Washington National Opera since 2007; Former Director, Reis, Inc. (real estate analytics firm) from 2003 to 2009; Former member of the Investment Committee, The Moriah Fund from 2002 to 2008; Former Board member, Foundation for Arts and Preservations in Embassies from 2001 to 2009; Former Under Secretary of State for Management, United States Department of State, 1996-2000. | | | 16 | | | 2001 to present | |
|
George Grossman
Age: 56 | | Director | | Until next election of directors | | Attorney-at-law | | | 16 | | | 1993 to present | |
|
Richard E. Kroon
Age: 67 | | Director | | Until next election of directors | | Member of Investment Committee, Monmouth University since 2004; Former Director, AmComp (workers' compensation insurance company) from 1996 to 2003 and from 2004 to 2005; Former Director, Finlay Enterprises (fine jewelry retailing) from 2003 to 2006; Former Director, Prominence Networks (telecom equipment) from 2003 to 2005; Retired Chairman and Managing Partner of Sprout Group venture capital funds, then an affiliate of Donaldson, Lufkin and Jenrette Securities Corporation from 1982 to 2002. Former chairman of the National Venture Capital Association for the year 2000. | | | 16 | | | 2004 to present | |
|
(table continued on next page)
37
COHEN & STEERS DIVIDEND VALUE FUND, INC.
(table continued from previous page)
| Name, Address1 and Age | | Position(s) Held
with Fund | | Term of
Office2 | | Principal Occupation
During At Least
The Past 5 Years
(Including Other
Directorships Held) | | Number of
Funds Within
Fund
Complex
Overseen by
Director
(Including
the Fund) | | Length
of Time
Served3 | |
Richard J. Norman
Age: 66 | | Director | | Until next election of directors | | Private Investor. Member, District of Columbia Department of Corrections Chaplains Corps since 2008; Member, Montgomery County, Maryland Department of Corrections Chaplains Corp since 2010; Special Representative, Salvation Army World Service Organization (SAWSO) since 2010; Advisory Board Member, The Salvation Army since 1985; Former President, Executive Committee, Chair of Investment Committee, The Foundation Board of Maryland Public Television from 1997 to 2008. Prior thereto, Investment Representative of Morgan Stanley Dean Witter from 1966 to 2000. | | | 16 | | | 2001 to present | |
|
Frank K. Ross
Age: 66 | | Director | | Until next election of directors | | Visiting Professor of Accounting, Howard University School of Business since 2004; Board member and Audit Committee Chair and Human Resources and Compensation Committee Member, Pepco Holdings, Inc. (electric utility) since 2004. Former Board Member of NCRIC, Inc. from 2004 to 2006. Formerly, Midatlantic Area Managing Partner for Assurance Services at KPMG LLP and Managing Partner of its Washington, DC offices from 1977 to 2003. | | | 16 | | | 2004 to present | |
|
(table continued on next page)
38
COHEN & STEERS DIVIDEND VALUE FUND, INC.
(table continued from previous page)
| Name, Address1 and Age | | Position(s) Held
with Fund | | Term of
Office2 | | Principal Occupation
During At Least
The Past 5 Years
(Including Other
Directorships Held) | | Number of
Funds Within
Fund
Complex
Overseen by
Director
(Including
the Fund) | | Length
of Time
Served3 | |
Willard H. Smith Jr.
Age: 73 | | Director | | Until next election of directors | | Board member, Essex Property Trust, Inc. since 1996; Former Board member, Realty Income Corporation from 1996 to 2009; Former Board member, Highwoods Property Trust from 1996 to 2005; Former Board member, Crest Net Lease, Inc. from 1999 to 2009 Formerly, Managing Director at Merrill Lynch & Co., Equity Capital Markets Division, from 1983 to 1995. | | | 16 | | | 1996 to present | |
|
C. Edward Ward Jr.
Age: 63 | | Director | | Until next election of directors | | Member of The Board of Trustees of Manhattan College, Riverdale, New York since 2004. Formerly Director of closed-end fund management for the New York Stock Exchange, where he worked from 1979 to 2004. | | | 16 | | | 2004 to present | |
|
1 The address for each director is 280 Park Avenue, New York, NY 10017.
2 On March 12, 2008, the Board of Directors adopted a mandatory retirement policy stating a Director must retire from the Board on December 31st of the year in which he or she turns 75 years of age.
3 The length of time served represents the year in which the director was first elected or appointed to any fund in the Cohen & Steers fund complex.
4 "Interested person", as defined in the 1940 Act, of the Fund because of affiliation with the Advisor (Interested Directors).
5 Martin Cohen and Bonnie Cohen are not related.
39
COHEN & STEERS DIVIDEND VALUE FUND, INC.
The officers of the Fund (other than Messrs. Cohen and Steers, whose biographies are provided above), their address, their ages and their principal occupations for at least the past five years are set forth below.
| Name, Address1 and Age | | Position(s) Held
with Fund | | Principal Occupation During At Least The Past 5 Years | | Length
of Time
Served2 | |
Adam M. Derechin
Age: 45 | | President and Chief Executive Officer | | Chief Operating Officer of the Advisor (since 2003) and CNS (since 2004). Prior to that, Senior Vice President of the Advisor and Vice President and Assistant Treasurer of the Cohen & Steers funds. | | Since 2005 | |
|
Joseph M. Harvey
Age: 46 | | Vice President | | President and Chief Investment Officer of the Advisor (since 2003) and President of CNS (since 2004). Prior to that, Senior Vice President and Director of Investment Research of the Advisor. | | Since 2004 | |
|
Richard E. Helm
Age: 51 | | Vice President | | Senior Vice President of the Advisor since 2005. Prior to that, VP and senior portfolio manager at WM Advisors, Inc. | | Since 2005 | |
|
Francis C. Poli
Age: 47 | | Secretary | | Executive Vice President, Secretary and General Counsel of the Advisor and CNS since March 2007. Prior thereto, General Counsel of Allianz Global Investors of America LP. | | Since 2007 | |
|
James Giallanza
Age: 44 | | Treasurer and Chief Financial Officer | | Senior Vice President of the Advisor since September 2006. Prior thereto, Deputy Head of the US Funds Administration and Treasurer & CFO of various mutual funds within the Legg Mason (formally Citigroup Asset Management) fund complex from August 2004 to September 2006; Director/Controller of the US wholesale business at UBS Global Asset Management (U.S.) from September 2001 to July 2004. | | Since 2006 | |
|
Lisa D. Phelan
Age: 41 | | Chief Compliance Officer | | Senior Vice President and Director of Compliance of the Advisor since 2007 and prior to that, Vice President since 2006. Chief Compliance Officer of CSSL since 2004. Prior to that, Compliance Officer of the Advisor since 2004. Chief Compliance Officer, Avatar Associates & Overture Asset Managers, 2003-2004. | | Since 2006 | |
|
1 The address of each officer is 280 Park Avenue, New York, NY 10017.
2 Officers serve one-year terms. The length of time served represents the year in which the officer was first elected to that position in any fund in the Cohen & Steers fund complex. All of the officers listed above are officers of one or more of the other funds in the complex.
40
COHEN & STEERS DIVIDEND VALUE FUND, INC.
Meet the Cohen & Steers family of open-end funds:
COHEN & STEERS
GLOBAL REALTY SHARES
• Designed for investors seeking total return, investing primarily in global real estate equity securities
• Symbols: CSFAX, CSFBX, CSFCX, CSSPX
COHEN & STEERS
INSTITUTIONAL GLOBAL REALTY SHARES
• Designed for institutional investors seeking total return, investing primarily in global real estate securities
• Symbol: GRSIX
COHEN & STEERS
REALTY SHARES
• Designed for investors seeking total return, investing primarily in REITs
• Symbol: CSRSX
COHEN & STEERS
INSTITUTIONAL REALTY SHARES
• Designed for institutional investors seeking total return, investing primarily in REITs
• Symbol: CSRIX
COHEN & STEERS
REALTY INCOME FUND
• Designed for investors seeking maximum total return, investing primarily in real estate securities with an emphasis on both income and capital appreciation
• Symbols: CSEIX, CSBIX, CSCIX, CSDIX
COHEN & STEERS
INTERNATIONAL REALTY FUND
• Designed for investors seeking total return, investing primarily in international real estate securities
• Symbols: IRFAX, IRFCX, IRFIX
COHEN & STEERS
ASIA PACIFIC REALTY SHARES
• Designed for investors seeking total return, investing primarily in real estate securities located in the Asia Pacific region
• Symbols: APFAX, APFCX, APFIX
COHEN & STEERS
GLOBAL INFRASTRUCTURE FUND
• Designed for investors seeking total return, investing primarily in global infrastructure securities
• Symbols: CSUAX, CSUBX, CSUCX, CSUIX
COHEN & STEERS
DIVIDEND VALUE FUND
• Designed for investors seeking high current income and long-term growth of income and capital appreciation, investing primarily in dividend paying common stocks and preferred stocks
• Symbols: DVFAX, DVFCX, DVFIX
Please consider the investment objectives, risks, charges and expenses of the fund carefully before investing. A prospectus containing this and other information can be obtained by calling 800-330-7348 or by visiting cohenandsteers.com. Please read the prospectus carefully before investing.
Cohen & Steers Securities, LLC, Distributor
41
COHEN & STEERS DIVIDEND VALUE FUND, INC.
OFFICERS AND DIRECTORS
Robert H. Steers
Director and co-chairman
Martin Cohen
Director and co-chairman
Bonnie Cohen
Director
George Grossman
Director
Richard E. Kroon
Director
Richard J. Norman
Director
Frank K. Ross
Director
Willard H. Smith Jr.
Director
C. Edward Ward, Jr.
Director
Adam M. Derechin
President and chief executive officer
Joseph M. Harvey
Vice president
Richard E. Helm
Vice president
Francis C. Poli
Secretary
James Giallanza
Treasurer and chief financial officer
Lisa D. Phelan
Chief compliance officer
KEY INFORMATION
Investment Advisor
Cohen & Steers Capital Management, Inc.
280 Park Avenue
New York, NY 10017
(212) 832-3232
Subadministrator and Custodian
State Street Bank and Trust Company
One Lincoln Street
Boston, MA 02111
Transfer Agent
Boston Financial Data Services, Inc.
30 Dan Road
Canton, MA 02021
(800) 437-9912
Legal Counsel
Stroock & Stroock & Lavan LLP
180 Maiden Lane
New York, NY 10038
Distributor
Cohen & Steers Securities, LLC
280 Park Avenue
New York, NY 10017
Nasdaq Symbol: Class A—DVFAX
Class C—DVFCX
Class I—DVFIX
Web site: cohenandsteers.com
This report is authorized for delivery only to shareholders of Cohen & Steers Dividend Value Fund, Inc. unless accompanied or preceded by the delivery of a currently effective prospectus setting forth details of the Fund. Past performance is of course no guarantee of future results and your investment may be worth more or less at the time you sell.
42

eDelivery NOW AVAILABLE
Stop traditional mail delivery; receive your shareholder reports and prospectus online.
Sign up at cohenandsteers.com
COHEN & STEERS
DIVIDEND VALUE FUND
280 PARK AVENUE
NEW YORK, NY 10017
ANNUAL REPORT
FEBRUARY 28, 2010
DVFAXAR
Item 2. Code of Ethics.
On October 1, 2009, the registrant has adopted an Amended and Restated Code of Ethics that applies to its Principal Executive Officer and Principal Financial Officer. The material changes to the Code of Ethics that apply to the registrant’s principal executive officer, principal financial officer, principal accounting officer or controller, or persons performing similar functions were (i) a shortened preclearance window, (ii) the implementation of a 30-day holding period to sell securities at a profit, (iii) limitations on the frequency of trading, and (iv) a preclearance requirement for exchange traded funds. The registrant undertakes to provide to any person without charge, upon request, a copy of the Code of Ethics. Such request can be made by calling 800-330-7348 or writing to the Secretary of the registrant, 280 Park Avenue, New York, NY 10017.
Item 3. Audit Committee Financial Expert.
The registrant’s board has determined that Frank K. Ross, a member of the registrant’s audit committee, is an “audit committee financial expert” and “independent,” as such terms are defined in this Item.
Item 4. Principal Accountant Fees and Services.
(a) — (d) Aggregate fees billed to the registrant for the last two fiscal years for professional services rendered by the registrant’s principal accountant were as follows:
| | 2010 | | 2009 | |
Audit Fees | | $ | 39,100 | | $ | 39,100 | |
Audit-Related Fees | | — | | — | |
Tax Fees | | $ | 6,000 | | $ | 19,635 | |
All Other Fees | | — | | — | |
Tax fees were billed in connection with the preparation of tax returns, calculation and designation of dividends and other miscellaneous tax services.
Aggregate fees billed by the registrant’s principal accountant for the last two fiscal years for non-audit services provided to the registrant’s investment adviser (not including a sub-adviser whose role is primarily portfolio management and is subcontracted or overseen by another investment adviser) and any entity controlling, controlled by, or under common control with the investment adviser that provides ongoing services to the registered investment company, where the engagement relates directly to the operations and financial reporting of the registrant, were as follows:
| | 2010 | | 2009 | |
Audit-Related Fees | | — | | — | |
Tax Fees | | — | | — | |
All Other Fees | | $ | 0 | | $ | 110,000 | |
| | | | | | | |
These other fees were billed in connection with internal control reviews and Association for Investment Management and Research (AIMR) performance reviews.
(e)(1) The audit committee is required to pre-approve audit and non-audit services performed for the registrant by the principal accountant. The audit committee also is required to pre-approve non-audit services performed by the registrant’s principal accountant for the registrant’s investment adviser and any sub-adviser (not including any sub-adviser whose role is primarily portfolio management and is subcontracted with or overseen by another investment adviser) and/or to any entity controlling, controlled by or under common control with the registrant’s investment adviser that provides ongoing services to the registrant, if the engagement for services relates directly to the operations and financial reporting of the registrant.
The audit committee may delegate pre-approval authority to one or more of its members who are independent members of the board of directors of the registrant. The member or members to whom such authority is delegated shall report any pre-approval decisions to the audit committee at its next scheduled meeting. The audit committee may not delegate its responsibility to pre-approve services to be performed by the registrant’s principal accountant for the investment adviser.
(e) (2) No services included in (b) — (d) above were approved by the audit committee pursuant to paragraphs (c)(7)(i)(C) of Rule 2-01 of Regulation S-X.
(f) Not applicable.
(g) For the fiscal years ended February 28, 2010 and February 28, 2009, the aggregate fees billed by the registrant’s principal accountant for non-audit services rendered to the registrant and for non-audit services rendered to the registrant’s investment adviser (not including any sub-adviser whose role is primarily portfolio management and is subcontracted with or overseen by another investment adviser) and/or to any entity controlling, controlled by or under common control with the registrant’s investment adviser that provides ongoing services to the registrant was $6,000 and $129,635, respectively.
(h) The registrant’s audit committee considered whether the provision of non-audit services that were rendered to the registrant’s investment adviser (not including any sub-adviser whose role is primarily portfolio management and is subcontracted with or overseen by another investment adviser) and/or to any entity controlling, controlled by or under common control with the registrant’s investment adviser that provides ongoing services to the registrant that were not pre-approved pursuant to paragraph (c)(7)(ii) of Rule 2-01 of Regulation S-X was compatible with maintaining the principal accountant’s independence.
Item 5. Audit Committee of Listed Registrants.
Not applicable.
Item 6. Schedule of Investments.
Included in Item 1 above.
Item 7. Disclosure of Proxy Voting Policies and Procedures for Closed-End Management Investment Companies.
Not applicable.
Item 8. Portfolio Managers of Closed-End Investment Companies.
Not applicable.
Item 9. Purchases of Equity Securities by Closed-End Management Investment Company and Affiliated Purchasers.
Not applicable.
Item 10. Submission of Matters to a Vote of Security Holders.
Not applicable.
Item 11. Controls and Procedures.
(a) The registrant’s principal executive officer and principal financial officer have concluded that the registrant’s disclosure controls and procedures are sufficient to ensure that information required to be disclosed by the registrant in this Form N-CSR was recorded, processed, summarized and reported within the time periods specified in the Securities and Exchange Commission’s rules and forms, based upon such officers’ evaluation of these controls and procedures as of a date within 90 days of the filing date of this report.
(b) There were no changes in the registrant’s internal control over financial reporting that occurred during the registrant’s most recent fiscal half-year (the registrant’s second fiscal half-year in the case of an annual report) that has materially affected, or is reasonably likely to materially affect, the registrant’s internal control over financial reporting.
Item 12. Exhibits.
(a)(1) Amended and Restated Code of Ethics.
(a) (2) Certifications of principal executive officer and principal financial officer as required by Rule 30a-2(a) under the Investment Company Act of 1940.
(b) Certifications of chief executive officer and chief financial officer as required by Rule 30a- 2(b) under the Investment Company Act of 1940.
SIGNATURES
Pursuant to the requirements of the Securities Exchange Act of 1934 and the Investment Company Act of 1940, the registrant has duly caused this report to be signed on its behalf by the undersigned, thereunto duly authorized.
COHEN & STEERS DIVIDEND VALUE FUND, INC.
| By: | /s/ Adam M. Derechin | |
| | Name: Adam M. Derechin | |
| | Title: President and Chief Executive Officer | |
| | |
| Date: April 22, 2010 | |
Pursuant to the requirements of the Securities Exchange Act of 1934 and the Investment Company Act of 1940, this report has been signed below by the following persons on behalf of the registrant and in the capacities and on the dates indicated.
| By: | /s/ Adam M. Derechin | |
| | Name: | Adam M. Derechin | |
| | Title: | President and Chief Executive Officer | |
| | | (principal executive officer) | |
| | | |
| By: | /s/ James Giallanza | |
| | Name: | James Giallanza | |
| | Title: | Treasurer | |
| | | (principal financial officer) | |
| | | |
| Date: April 22, 2010 |