UNITED STATES
SECURITIES AND EXCHANGE COMMISSION
Washington, D.C. 20549
FORM N-CSR
CERTIFIED SHAREHOLDER REPORT OF REGISTERED
MANAGEMENT INVESTMENT COMPANIES
Investment Company Act file number | 811-21668 |
|
Cohen & Steers Dividend Value Fund, Inc. |
(Exact name of registrant as specified in charter) |
|
280 Park Avenue, New York, NY | | 10017 |
(Address of principal executive offices) | | (Zip code) |
|
Adam M. Derechin Cohen & Steers Capital Management, Inc. 280 Park Avenue New York, New York 10017 |
(Name and address of agent for service) |
|
Registrant’s telephone number, including area code: | (212) 832-3232 | |
|
Date of fiscal year end: | February 28 | |
|
Date of reporting period: | August 31, 2007 | |
| | | | | | | | |
Item 1. Reports to Stockholders.
COHEN & STEERS DIVIDEND VALUE FUND, INC.
October 10, 2007
To Our Shareholders:
We are pleased to submit to you our report for the six months ended August 31, 2007. The net asset values per share at that date were $14.65, $14.58, and $14.66 for Class A, Class C and Class I shares, respectively. In addition, a distribution was declared for shareholders of record on September 27, 2007 and paid on September 28, 2007 to all three classes of shares.a The distributions were as follows:
| | | Total
Distribution | | Ordinary
Income | | Short-term
Capital
Gain | | Long-term
Capital
Gain | |
| Class A | | $ | 0.114 | | | $ | 0.056 | | | $ | 0.051 | | | $ | 0.007 | | |
| Class C | | $ | 0.093 | | | $ | 0.035 | | | $ | 0.051 | | | $ | 0.007 | | |
| Class I | | $ | 0.127 | | | $ | 0.069 | | | $ | 0.051 | | | $ | 0.007 | | |
The total return, including income and change in net asset value, for Cohen & Steers Dividend Value Fund and the comparative benchmarks were:
| | | Six Months
Ended 8/31/07 | |
| Cohen and Steers Dividend Value Fund—Class A | | | 5.40 | % | |
| Cohen and Steers Dividend Value Fund—Class C | | | 5.08 | % | |
| Cohen and Steers Dividend Value Fund—Class I | | | 5.57 | % | |
| Russell 1000 Value Indexb | | | 2.76 | % | |
| S&P 500 Indexb | | | 5.70 | % | |
The performance data quoted represent past performance. Past performance is no guarantee of future results. The investment return and the principal value of an investment will fluctuate and shares, if redeemed, may be worth more or less than their original cost. Current performance may be lower or higher than the performance data quoted. Total returns of the fund current to the most recent month-end can be obtained by visiting our Web site at cohenandsteers.com. Performance quoted does not reflect the deduction of the maximum 4.5% initial sales charge on Class A shares or the 1% maximum contingent deferred sales charge on Class C shares. If such charges were included, returns would have been lower.
a Please note that distributions paid by the fund to shareholders are subject to recharacterization for tax purposes. The final tax treatment of these distributions is reported to shareholders after the close of each fiscal year.
b The Russell 1000 Value Index measures the performance of those Russell 1000 companies with lower price-to-book ratios and lower forecasted growth values. The S&P 500 Index is an unmanaged index of common stocks that is frequently used as a general measure of stock market performance.
1
COHEN & STEERS DIVIDEND VALUE FUND, INC.
Investment Review
The six-month period ended August 31, 2007 was a positive but volatile one for the U.S. stock market. The concerns over rising subprime mortgage delinquencies that surfaced early in the period intensified in the summer. Uncertainty regarding the extent of the contagion caused investors to demand higher returns from riskier assets and created a significant backlog in financing for committed leveraged buyouts (LBOs). Credit spreads widened and liquidity conditions deteriorated as banks became reluctant to lend to one another.
Equity markets, which had been rising amid generally favorable earnings reports, declined in June and July. Some stability returned late in the period after the Federal Reserve lowered the discount rate—the rate it charges banks for loans—by 50 basis points, to 5.75%, while central banks worldwide bolstered liquidity by injecting billions of dollars into the banking system. (On September 18, the Fed lowered the discount rate by an additional 50 basis points. The Fed also lowered the federal funds rate by 50 basis points; this was the first reduction in the rate at which banks lend to one another since 2003.)
Financial services stocks struggled
From a sector perspective, financial services stocks had the poorest performance for the period within the Russell 1000 Value Index, falling 6.6% as a group. The selloff in financial companies was broad-based amid the re-pricing of credit risk and a difficult liquidity environment. Even many high-quality companies with conservative balance sheets declined, although such companies outperformed the sector as a whole. Consumer discretionary stocks struggled (–3.9%) amid worries over a slowing economy and declining home equity withdrawals. Energy was the best-performing sector in the period, with a total return of 20.9%, reflecting strong global fundamentals for oil. The industrial sector (+11.9%) also outperformed, aided in part by demand for industrial products from growing foreign economies (a weak dollar has supported this trend). The telecommunications (+9.4%) and consumer staples (+5.6%) sectors benefited from their relatively defensi ve characteristics.
Value stocks underperformed growth stocks in the period (the Russell 1000 Growth Index had a total return of 7.5%) and trailed the broader equity market, as measured by the S&P 500 Index (+5.7%). This was not an indication of investors' style preference per se, but rather reflected the much larger presence of financial services stocks within value-oriented indexes.
A flight to quality aided performance
The fund outperformed the Russell 1000 Value Index for the period. Our emphasis on higher-quality companies met with favorable results in a period characterized by a general flight to quality. We favor companies with a history of increasing their dividend payments and the potential to sustain such increases. In our experience, such companies tend to have stronger balance sheets and cash flows than companies that lack the ability (or desire) to raise their dividends over time.
2
COHEN & STEERS DIVIDEND VALUE FUND, INC.
Stock selection contributed positively to the fund's relative performance in almost all sectors, in particular the financial services, utilities, telecommunications and consumer discretionary sectors. Stock selection in the industrials and consumer staples sectors detracted from relative performance.
On a sector allocation basis, our underweight in financial services was a positive contributor to performance. Financial companies account for 34% of the fund's benchmark; considering our desire for industry diversification, the hurdle to obtain a neutral weighting in financials is quite high. That said, we marginally added to our allocation on a stock-specific basis based on valuations that had become compelling. We were modestly underweight in the energy sector, which detracted from performance—however, this was offset by good energy stock selection.
Investment Outlook
We believe that the economy is in a mature stage of its cycle and that continued moderation in growth is likely. In addition to cyclical factors, the liquidity squeeze could lower growth prospects as risk-averse lenders tighten credit standards; consumers and companies that heretofore qualified for loans may find it difficult to secure credit.
While the return of more normal conditions in credit markets may take some time, we believe the U.S. economy is likely to avoid recession as the global economy remains solid and interest-rate reductions by the Federal Reserve may provide the foundation for a better economy looking a year forward.
Cash flows and dividends
Equities currently trade at 14 times estimated 2008 earnings as measured by S&P 500 Index companies. We view that as reasonable, given projected overall 11% earnings growth in 2008.
Barring a sudden economic reversal, we expect solid cash-flow growth to drive dividend growth, especially should payout ratios (dividends relative to earnings) begin to rise after a long period of decline. Due to strong corporate profits over the past few years, payout ratios have fallen well below their historical averages even as dividend payouts have been increasing.
Amid what we expect to be fairly volatile market conditions as investors react to headline news—including political news as an election season proceeds—we will look for opportunities to purchase high-quality companies at attractive valuations. Our focus is on companies with the potential to increase their dividends payouts, as we believe that dividend initiations and dividend growth have historically been reliable indicators of corporate health.
3
COHEN & STEERS DIVIDEND VALUE FUND, INC.
 | |  | |
|
| MARTIN COHEN | | ROBERT H. STEERS | |
|
| Co-chairman | | Co-chairman | |
|

RICHARD E. HELM
Portfolio Manager
The views and opinions in the preceding commentary are as of the date stated and are subject to change. This material represents an assessment of the market environment at a specific point in time, should not be relied upon as investment advice and is not intended to predict or depict performance of any investment.
Visit Cohen & Steers online at cohenandsteers.com
For more information about any of our funds, visit cohenandsteers.com, where you'll find daily net asset values, fund fact sheets and portfolio highlights. You can also access newsletters, education tools and market updates covering REIT, utility and preferred securities sectors.
In addition, our Web site contains comprehensive information about our firm, including our most recent press releases, profiles of our senior investment professionals, and an overview of our investment approach.
4
COHEN & STEERS DIVIDEND VALUE FUND, INC.
Performance Review (Unaudited)
Average Annual Total Returns—For the Periods Ended August 31, 2007
| | | Class A Shares | | Class C Shares | | Class I Shares | |
| 1 Year (with sales charge) | | | 11.92 | %a | | | 15.39 | %b | | | — | | |
| 1 Year (without sales charge) | | | 17.20 | % | | | 16.39 | % | | | 17.62 | % | |
| Since Inceptionc (with sales charge) | | | 12.48 | %a | | | 14.39 | %b | | | — | | |
| Since Inceptionc (without sales charge) | | | 15.10 | % | | | 14.39 | % | | | 15.51 | % | |
The performance data quoted represent past performance. Past performance is no guarantee of future results. The investment return and principal value of an investment will fluctuate and shares, when redeemed, may be worth more or less than their original cost. Current performance may be lower or higher than the performance data quoted. Performance information current to the most recent month-end can be obtained by visiting our Web site at cohenandsteers.com. The performance table does not reflect the deduction of taxes that a shareholder would pay on fund distributions or the redemption of fund shares.
Through February 28, 2008, the fund's advisor has contractually agreed to waive certain fees and/or reimburse the fund for expenses. Absent such arrangements, returns would have been lower.
a Reflects a 4.50% front-end sales charge.
b Reflects a contingent deferred sales charge of 1%.
c Inception date of August 31, 2005.
5
COHEN & STEERS DIVIDEND VALUE FUND, INC.
Expense Example (Unaudited)
As a shareholder of the fund, you incur two types of costs: (1) transaction costs, including sales charges (loads) on purchase payments and redemption fees; and (2) ongoing costs including management fees; distribution and/or service (12b-1) fees; and other fund expenses. This example is intended to help you understand your ongoing costs (in dollars) of investing in the fund and to compare these costs with the ongoing costs of investing in other mutual funds.
The example is based on an investment of $1,000 invested at the beginning of the period and held for the entire period 03/01/07-08/31/07.
Actual Expenses
The first line of the table below provides information about actual account values and expenses. You may use the information in this line, together with the amount you invested, to estimate the expenses that you paid over the period. Simply divide your account value by $1,000 (for example, an $8,600 account value divided by $1,000 = 8.6), then multiply the result by the number in the first line under the heading entitled "Expenses Paid During Period" to estimate the expenses you paid on your account during this period.
Hypothetical Example for Comparison Purposes
The second line of the table below provides information about hypothetical account values and hypothetical expenses based on the fund's actual expense ratio and an assumed rate of return of 5% per year before expenses, which is not the fund's actual return. The hypothetical account values and expenses may not be used to estimate the actual ending account balance or expenses you paid for the period. You may use this information to compare the ongoing cost of investing in the fund and other funds. To do so, compare this 5% hypothetical example with the 5% hypothetical examples that appear in the shareholder reports of the other funds.
Please note that the expenses shown in the table are meant to highlight your ongoing costs only and do not reflect any transactional costs, such as sales charges (loads) and redemption fees. Therefore, the second line of the table is useful in comparing ongoing costs only, and will not help you determine the relative total costs of owning different funds. In addition, if these transactional costs were included, your costs would have been higher.
6
COHEN & STEERS DIVIDEND VALUE FUND, INC.
Expense Example (Unaudited)—(Continued)
| | | Beginning
Account Value
March 1, 2007 | | Ending
Account Value
August 31, 2007 | | Expenses Paid
During Period*
March 1, 2007–
August 31, 2007 | |
| Class A | |
| Actual (5.40% return) | | $ | 1,000.00 | | | $ | 1,054.00 | | | $ | 5.16 | | |
| Hypothetical (5% annual return before expenses) | | $ | 1,000.00 | | | $ | 1,020.11 | | | $ | 5.08 | | |
| Class C | |
| Actual (5.08% return) | | $ | 1,000.00 | | | $ | 1,050.80 | | | $ | 8.51 | | |
| Hypothetical (5% annual return before expenses) | | $ | 1,000.00 | | | $ | 1,016.84 | | | $ | 8.36 | | |
| Class I | |
| Actual (5.57% return) | | $ | 1,000.00 | | | $ | 1,055.70 | | | $ | 3.36 | | |
| Hypothetical (5% annual return before expenses) | | $ | 1,000.00 | | | $ | 1,021.87 | | | $ | 3.30 | | |
* Expenses are equal to the fund's Class A, Class C and Class I annualized net expense ratio of 1.00%, 1.65%, and 0.65%, respectively, multiplied by the average account value over the period, multiplied by 184/366 (to reflect the one-half year period). If the fund had borne all of its expenses that were assumed by the advisor, the annualized expense ratios would have been 1.78%, 2.43%, and 1.43%, respectively.
7
COHEN & STEERS DIVIDEND VALUE FUND, INC.
AUGUST 31, 2007
Top Ten Long-Term Holdings
(Unaudited)
| Security | | Market
Value | | % of
Net
Assets | |
| Wells Fargo & Co. | | $ | 2,729,538 | | | | 2.7 | % | |
| Bank of America Corp. | | | 2,660,700 | | | | 2.6 | | |
| FPL Group | | | 2,565,424 | | | | 2.5 | | |
| HCC Insurance Holdings | | | 2,150,819 | | | | 2.1 | | |
| Aflac | | | 2,132,400 | | | | 2.1 | | |
| Citigroup | | | 2,114,288 | | | | 2.1 | | |
| Abbott Laboratories | | | 2,076,400 | | | | 2.1 | | |
| Procter & Gamble Co. | | | 1,913,583 | | | | 1.9 | | |
| Medtronic | | | 1,912,808 | | | | 1.9 | | |
| American International Group | | | 1,881,000 | | | | 1.9 | | |
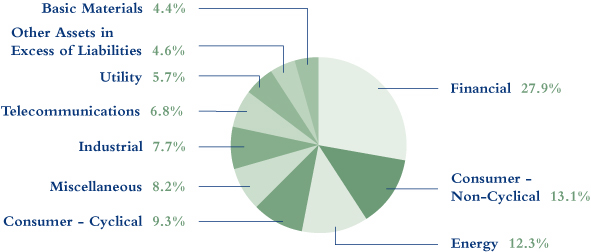
Sector Breakdown
(Based on Net Assets)
(Unaudited)
8
COHEN & STEERS DIVIDEND VALUE FUND, INC.
SCHEDULE OF INVESTMENTS
August 31, 2007 (Unaudited)
| | | | | Number
of Shares | | Value | |
| COMMON STOCK | | | 95.4 | % | | | | | | | | | |
| BASIC MATERIALS | | | 4.4 | % | | | | | | | | | |
| Alcoa | | | | | | | 11,400 | | | $ | 416,442 | | |
| Archer-Daniels-Midland Co. | | | | | | | 34,400 | | | | 1,159,280 | | |
| Dow Chemical Co. | | | | | | | 10,400 | | | | 443,352 | | |
| Holcim Ltd. (Switzerland)a | | | | | | | 11,400 | | | | 1,236,130 | | |
| Monsanto Co. | | | | | | | 17,600 | | | | 1,227,424 | | |
| | | | | | | | 4,482,628 | | |
| CONSUMER—CYCLICAL | | | 9.3 | % | | | | | | | | | |
| AIRLINES | | | 0.9 | % | | | | | | | | | |
| Cathay Pacific Airways Ltd. (ADR) (Hong Kong) | | | | | | | 71,600 | | | | 945,120 | | |
| APPAREL | | | 1.7 | % | | | |
| Nike | | | | | | | 29,700 | | | | 1,673,298 | | |
| AUTO MANUFACTURERS | | | 0.4 | % | | | |
| PACCAR | | | | | | | 5,000 | | | | 427,750 | | |
| AUTO PARTS EQUIPMENT | | | 0.3 | % | | | |
| Johnson Controls | | | | | | | 2,500 | | | | 282,750 | | |
| LEISURE TIME | | | 0.4 | % | | | |
| Carnival Corp. | | | | | | | 8,200 | | | | 373,838 | | |
| RESTAURANT | | | 1.4 | % | | | |
| Yum! Brands | | | | | | | 44,800 | | | | 1,465,856 | | |
| RETAIL | | | 4.2 | % | | | |
| Costco Wholesale Corp. | | | | | | | 9,400 | | | | 580,450 | | |
| Hennes & Mauritz AB (Sweden)a | | | | | | | 15,900 | | | | 898,911 | | |
| JC Penney Co. | | | | | | | 15,400 | | | | 1,058,904 | | |
| Nordstrom | | | | | | | 14,400 | | | | 692,640 | | |
| Wal-Mart de Mexico SA de CV (ADR) (Mexico) | | | | | | | 28,800 | | | | 1,022,400 | | |
| | | | | | | | 4,253,305 | | |
| TOTAL CONSUMER—CYCLICAL | | | | | | | | | | | 9,421,917 | | |
See accompanying notes to financial statements.
9
COHEN & STEERS DIVIDEND VALUE FUND, INC.
SCHEDULE OF INVESTMENTS—(Continued)
August 31, 2007 (Unaudited)
| | | | | Number
of Shares | | Value | |
| CONSUMER—NON-CYCLICAL | | | 13.1 | % | | | | | | | | | |
| AGRICULTURE | | | 1.4 | % | | | | | | | | | |
| Altria Group | | | | | | | 20,100 | | | $ | 1,395,141 | | |
| BEVERAGE | | | 1.4 | % | | | | | | | | | |
| Diageo PLC (ADR) (United Kingdom) | | | | | | | 16,900 | | | | 1,443,598 | | |
| COSMETICS/PERSONAL CARE | | | 1.9 | % | | | | | | | | | |
| Procter & Gamble Co. | | | | | | | 29,300 | | | | 1,913,583 | | |
| FOOD | | | 0.5 | % | | | | | | | | | |
| SUPERVALU | | | | | | | 11,500 | | | | 484,725 | | |
| HEALTHCARE PRODUCTS | | | 3.5 | % | | | | | | | | | |
| Johnson & Johnson | | | | | | | 26,700 | | | | 1,649,793 | | |
| Medtronic | | | | | | | 36,200 | | | | 1,912,808 | | |
| | | | | | | | 3,562,601 | | |
| PHARMACEUTICAL | | | 4.4 | % | | | | | | | | | |
| Abbott Laboratories | | | | | | | 40,000 | | | | 2,076,400 | | |
| Pfizer | | | | | | | 34,900 | | | | 866,916 | | |
| Teva Pharmaceutical Industries Ltd. (ADR) (Israel) | | | | | | | 33,800 | | | | 1,453,400 | | |
| | | | | | | | 4,396,716 | | |
| TOTAL CONSUMER—NON-CYCLICAL | | | | | | | | | | | 13,196,364 | | |
| ENERGY | | | 12.3 | % | | | | | | | | | |
| OIL & GAS | | | 9.6 | % | | | | | | | | | |
| Chevron Corp. | | | | | | | 15,700 | | | | 1,377,832 | | |
| CNOOC Ltd. (Hong Kong)a | | | | | | | 580,000 | | | | 711,682 | | |
| ConocoPhillips | | | | | | | 17,100 | | | | 1,400,319 | | |
| Devon Energy Corp. | | | | | | | 19,100 | | | | 1,438,421 | | |
| Exxon Mobil Corp. | | | | | | | 20,400 | | | | 1,748,892 | | |
| GlobalSantaFe Corp. | | | | | | | 16,900 | | | | 1,192,971 | | |
| Petro-Canada (Canada) | | | | | | | 22,800 | | | | 1,163,940 | | |
| Total SA (France)a | | | | | | | 8,400 | | | | 629,947 | | |
| | | | | | | | 9,664,004 | | |
See accompanying notes to financial statements.
10
COHEN & STEERS DIVIDEND VALUE FUND, INC.
SCHEDULE OF INVESTMENTS—(Continued)
August 31, 2007 (Unaudited)
| | | | | Number
of Shares | | Value | |
| OIL & GAS REFINING & MARKETING | | | 0.4 | % | | | | | | | | | |
| Valero Energy Corp. | | | | | | | 5,800 | | | $ | 397,358 | | |
| OIL & GAS SERVICES | | | 2.3 | % | | | | | | | | | |
| Baker Hughes | | | | | | | 13,300 | | | | 1,115,338 | | |
| Schlumberger Ltd. | | | | | | | 13,000 | | | | 1,254,500 | | |
| | | | | | | | 2,369,838 | | |
| TOTAL ENERGY | | | | | | | | | | | 12,431,200 | | |
| FINANCIAL | | | 27.9 | % | | | | | | | | | |
| BANK | | | 9.2 | % | | | | | | | | | |
| Bank of America Corp. | | | | | | | 52,500 | | | | 2,660,700 | | |
| HSBC Holdings PLC (ADR) (United Kingdom) | | | | | | | 14,800 | | | | 1,336,588 | | |
| US Bancorp | | | | | | | 41,800 | | | | 1,352,230 | | |
| Wachovia Corp. | | | | | | | 24,000 | | | | 1,175,520 | | |
| Wells Fargo & Co. | | | | | | | 74,700 | | | | 2,729,538 | | |
| | | | | | | | 9,254,576 | | |
| DIVERSIFIED FINANCIAL SERVICE | | | 9.0 | % | | | | | | | | | |
| BlackRock | | | | | | | 8,900 | | | | 1,380,390 | | |
| Citigroup | | | | | | | 45,100 | | | | 2,114,288 | | |
| Fortress Investment Group LLC | | | | | | | 52,000 | | | | 911,560 | | |
| Freddie Mac | | | | | | | 17,700 | | | | 1,090,497 | | |
| JPMorgan Chase & Co. | | | | | | | 35,100 | | | | 1,562,652 | | |
| Merrill Lynch & Co. | | | | | | | 12,000 | | | | 884,400 | | |
| Morgan Stanley | | | | | | | 18,000 | | | | 1,122,660 | | |
| | | | | | | | 9,066,447 | | |
| INSURANCE | | | 9.7 | % | | | | | | | | | |
| ACE Ltd. | | | | | | | 30,800 | | | | 1,779,008 | | |
| Aflac | | | | | | | 40,000 | | | | 2,132,400 | | |
| Allstate Corp. | | | | | | | 29,700 | | | | 1,626,075 | | |
| American International Group | | | | | | | 28,500 | | | | 1,881,000 | | |
| HCC Insurance Holdings | | | | | | | 77,900 | | | | 2,150,819 | | |
See accompanying notes to financial statements.
11
COHEN & STEERS DIVIDEND VALUE FUND, INC.
SCHEDULE OF INVESTMENTS—(Continued)
August 31, 2007 (Unaudited)
| | | | | Number
of Shares | | Value | |
| MGIC Investment Corp. | | | | | | | 9,000 | | | $ | 271,440 | | |
| | | | | | | | 9,840,742 | | |
| TOTAL FINANCIAL | | | | | | | | | | | 28,161,765 | | |
| INDUSTRIAL | | | 7.7 | % | | | | | | | | | |
| AEROSPACE & DEFENSE | | | 4.3 | % | | | | | | | | | |
| Boeing Co. | | | | | | | 6,900 | | | | 667,230 | | |
| General Dynamics Corp. | | | | | | | 23,800 | | | | 1,869,728 | | |
| Lockheed Martin Corp. | | | | | | | 18,300 | | | | 1,814,262 | | |
| | | | | | | | 4,351,220 | | |
| DIVERSIFIED MANUFACTURING | | | 1.3 | % | | | | | | | | | |
| General Electric Co. | | | | | | | 35,300 | | | | 1,372,111 | | |
| TRANSPORTATION | | | 2.1 | % | | | | | | | | | |
| Norfolk Southern Corp. | | | | | | | 4,500 | | | | 230,445 | | |
| United Parcel Service | | | | | | | 24,400 | | | | 1,850,984 | | |
| | | | | | | | 2,081,429 | | |
| TOTAL INDUSTRIAL | | | | | | | | | | | 7,804,760 | | |
| MEDIA | | | 1.4 | % | | | | | | | | | |
| Time Warner | | | | | | | 73,200 | | | | 1,389,336 | | |
| REAL ESTATE | | | 3.6 | % | | | | | | | | | |
| DIVERSIFIED | | | 0.3 | % | | | | | | | | | |
| British Land Co., PLC (United Kingdom)a | | | | | | | 12,300 | | | | 321,768 | | |
| HOTEL | | | 0.5 | % | | | | | | | | | |
| Starwood Hotels & Resorts Worldwide | | | | | | | 7,497 | | | | 458,217 | | |
| INDUSTRIAL | | | 0.5 | % | | | | | | | | | |
| ProLogis | | | | | | | 8,200 | | | | 493,312 | | |
| OFFICE | | | 1.5 | % | | | | | | | | | |
| Alexandria Real Estate Equities | | | | | | | 7,000 | | | | 653,310 | | |
| Corporate Office Properties Trust | | | | | | | 14,000 | | | | 602,980 | | |
| Hongkong Land Holdings Ltd. (USD) (Singapore)a | | | | | | | 79,000 | | | | 303,738 | | |
| | | | | | | | 1,560,028 | | |
See accompanying notes to financial statements.
12
COHEN & STEERS DIVIDEND VALUE FUND, INC.
SCHEDULE OF INVESTMENTS—(Continued)
August 31, 2007 (Unaudited)
| | | | | Number
of Shares | | Value | |
| REGIONAL MALL | | | 0.5 | % | | | | | | | | | |
| Simon Property Group | | | | | | | 4,900 | | | $ | 465,108 | | |
| SELF STORAGE | | | 0.3 | % | | | | | | | | | |
| Public Storage | | | | | | | 4,500 | | | | 341,010 | | |
| TOTAL REAL ESTATE | | | | | | | | | | | 3,639,443 | | |
| TECHNOLOGY | | | 3.2 | % | | | | | | | | | |
| SEMICONDUCTORS | | | 1.4 | % | | | | | | | | | |
| Intel Corp. | | | | | | | 18,400 | | | | 473,800 | | |
| Microchip Technology | | | | | | | 23,600 | | | | 909,072 | | |
| | | | | | | | 1,382,872 | | |
| SOFTWARE | | | 1.8 | % | | | | | | | | | |
| International Business Machines Corp. | | | | | | | 4,100 | | | | 478,429 | | |
| Microsoft Corp. | | | | | | | 48,500 | | | | 1,393,405 | | |
| | | | | | | | 1,871,834 | | |
| TOTAL TECHNOLOGY | | | | | | | | | | | 3,254,706 | | |
| TELECOMMUNICATIONS | | | 6.8 | % | | | | | | | | | |
| America Movil SAB de CV (ADR) (Mexico) | | | | | | | 12,000 | | | | 725,520 | | |
| AT&T | | | | | | | 38,700 | | | | 1,542,969 | | |
| Carphone Warehouse Group PLC (United Kingdom)a | | | | | | | 69,300 | | | | 479,518 | | |
| China Mobile Ltd. | | | | | | | 16,700 | | | | 1,132,093 | | |
| Corning | | | | | | | 40,300 | | | | 941,811 | | |
| Nokia Corp. (ADR) (Finland) | | | | | | | 16,900 | | | | 555,672 | | |
| Verizon Communications | | | | | | | 34,900 | | | | 1,461,612 | | |
| | | | | | | | 6,839,195 | | |
| UTILITY | | | 5.7 | % | | | | | | | | | |
| ELECTRIC—DISTRIBUTION | | | 0.9 | % | | | | | | | | | |
| Edison International | | | | | | | 16,500 | | | | 869,715 | | |
See accompanying notes to financial statements.
13
COHEN & STEERS DIVIDEND VALUE FUND, INC.
SCHEDULE OF INVESTMENTS—(Continued)
August 31, 2007 (Unaudited)
| | | | | Number
of Shares | | Value | |
| ELECTRIC—INTEGRATED | | | 4.8 | % | | | |
| E.ON AG (ADR) (Germany) | | | | | | | 24,700 | | | $ | 1,382,706 | | |
| Exelon Corp. | | | | | | | 12,700 | | | | 897,509 | | |
| FPL Group | | | | | | | 43,600 | | | | 2,565,424 | | |
| | | | | | | | 4,845,639 | | |
| TOTAL UTILITY | | | | | | | | | | | 5,715,354 | | |
| TOTAL COMMON STOCK (Identified cost—$90,441,865) | | | | | | | | | | | 96,336,668 | | |
| | | | | Principal
Amount | | | |
| COMMERCIAL PAPER | | | 4.6 | % | | | | | | | | | |
Citigroup Funding, 4.15%, due 9/4/07
(Identified cost—$4,689,378) | | | | | | $ | 4,691,000 | | | | 4,689,378 | | |
| TOTAL INVESTMENTS (Identified cost—$95,131,243) | | | 100.0 | % | | | | | | | 101,026,046 | | |
| OTHER ASSETS IN EXCESS OF LIABILITIES | | | 0.0 | % | | | | | | | 5,041 | | |
| NET ASSETS | | | 100.0 | % | | | | | | $ | 101,031,087 | | |
Glossary of Portfolio Abbreviations
ADR American Depositary Receipt
USD United States Dollar
Note: Percentages indicated are based on the net assets of the fund.
a Holcim Ltd., Carphone Warehouse Group PLC, Hennes & Mauritz AB, CNOOC Ltd., Total SA, British Land Co., PLC and Hongkong Land Holdings Ltd. have been valued at their fair value as determined in good faith under procedures established by and under the general supervision of the fund's Board of Directors. Aggregate fair valued securities represent 4.5% of net assets.
See accompanying notes to financial statements.
14
COHEN & STEERS DIVIDEND VALUE FUND, INC.
STATEMENT OF ASSETS AND LIABILITIES
August 31, 2007 (Unaudited)
| ASSETS: | |
| Investments in securities, at value (Identified cost—$95,131,243) | | $ | 101,026,046 | | |
| Receivable for investment securities sold | | | 242,771 | | |
| Dividends receivable | | | 213,747 | | |
| Receivable for fund shares sold | | | 184,386 | | |
| Receivable due from advisor | | | 22,874 | | |
| Other assets | | | 2,076 | | |
| Total Assets | | | 101,691,900 | | |
| LIABILITIES: | |
| Payable for investment securities purchased | | | 481,157 | | |
| Payable for fund shares redeemed | | | 43,501 | | |
| Payable for directors' fees | | | 17,901 | | |
| Payable for administration fees | | | 3,278 | | |
| Payable for distribution fees | | | 1,976 | | |
| Payable for shareholder servicing fees | | | 709 | | |
| Other liabilities | | | 112,291 | | |
| Total Liabilities | | | 660,813 | | |
| NET ASSETS | | $ | 101,031,087 | | |
| NET ASSESTS consist of: | |
| Paid-in-capital | | $ | 93,489,634 | | |
| Accumulated undistributed net investment income | | | 285,878 | | |
| Accumulated undistributed net realized gain on investments | | | 1,360,743 | | |
| Net unrealized appreciation on investments | | | 5,894,832 | | |
| | | $ | 101,031,087 | | |
See accompanying notes to financial statements.
15
COHEN & STEERS DIVIDEND VALUE FUND, INC.
STATEMENT OF ASSETS AND LIABILITIES—(Continued)
August 31, 2007 (Unaudited)
| CLASS A SHARES: | |
| NET ASSETS | | $ | 55,562,040 | | |
| Shares issued and outstanding ($0.001 par value common stock outstanding) | | | 3,793,544 | | |
| Net asset value and redemption price per share | | $ | 14.65 | | |
| Maximum offering price per share ($14.65 ÷ 0.955)a | | $ | 15.34 | | |
| CLASS C SHARES: | |
| NET ASSETS | | $ | 30,535,925 | | |
| Shares issued and outstanding ($0.001 par value common stock outstanding) | | | 2,093,764 | | |
| Net asset value and offering price per shareb | | $ | 14.58 | | |
| CLASS I SHARES: | |
| NET ASSETS | | $ | 14,933,122 | | |
| Shares issued and outstanding ($0.001 par value common stock outstanding) | | | 1,018,726 | | |
| Net asset value, offering, and redemption price per share | | $ | 14.66 | | |
a On investments of $100,000 or more, the offering price is reduced.
b Redemption price per share is equal to the net asset value per share less any applicable deferred sales charge of 1% on shares held for less than one year.
See accompanying notes to financial statements.
16
COHEN & STEERS DIVIDEND VALUE FUND, INC.
STATEMENT OF OPERATIONS
For the Six Months Ended August 31, 2007 (Unaudited)
| Investment Income: | |
| Dividend income (net of $13,035 of foreign withholding tax) | | $ | 1,133,456 | | |
| Interest income | | | 86,051 | | |
| Total Income | | | 1,219,507 | | |
| Expenses: | |
| Investment advisory fees | | | 344,498 | | |
| Distribution fees—Class A | | | 63,091 | | |
| Distribution fees—Class C | | | 86,571 | | |
| Professional fees | | | 58,492 | | |
| Shareholder servicing fees—Class A | | | 25,236 | | |
| Shareholder servicing fees—Class C | | | 28,857 | | |
| Shareholder reporting expenses | | | 53,746 | | |
| Administration fees | | | 48,551 | | |
| Registration and filing fees | | | 36,790 | | |
| Directors' fees and expenses | | | 26,200 | | |
| Transfer agent fees and expenses | | | 19,918 | | |
| Custodian fees and expenses | | | 18,746 | | |
| Line of credit fees | | | 215 | | |
| Miscellaneous | | | 8,619 | | |
| Total Expenses | | | 819,530 | | |
| Reduction of Expenses | | | (335,871 | ) | |
| Net Expenses | | | 483,659 | | |
| Net Investment Income | | | 735,848 | | |
| Net Realized and Unrealized Gain (Loss) on Investments: | |
| Net realized gain on: | |
| Investments | | | 962,176 | | |
| Foreign currency transactions | | | 1,992 | | |
| Net realized gain | | | 964,168 | | |
| Net change in unrealized appreciation on: | |
| Investments | | | 2,005,059 | | |
| Foreign currency translations | | | 29 | | |
| Net change in unrealized appreciation | | | 2,005,088 | | |
| Net realized and unrealized gain on investments | | | 2,969,256 | | |
| Net Increase in Net Assets Resulting from Operations | | $ | 3,705,104 | | |
See accompanying notes to financial statements.
17
COHEN & STEERS DIVIDEND VALUE FUND, INC.
STATEMENT OF CHANGES IN NET ASSETS (Unaudited)
| | | For the Six
Months Ended
August 31, 2007 | | For the
Year Ended
February 28, 2007 | |
| Change in Net Assets: | |
| From Operations: | |
| Net investment income | | $ | 735,848 | | | $ | 491,578 | | |
| Net realized gain on investments | | | 964,168 | | | | 949,042 | | |
| Net change in unrealized appreciation on investments | | | 2,005,088 | | | | 3,546,437 | | |
| Net increase in net assets resulting from operations | | | 3,705,104 | | | | 4,987,057 | | |
| Dividends and Distributions to Shareholders from: | |
| Net investment income: | |
| Class A | | | (360,256 | ) | | | (247,489 | ) | |
| Class C | | | (100,235 | ) | | | (69,277 | ) | |
| Class I | | | (108,604 | ) | | | (92,305 | ) | |
| Net realized gain on investments: | |
| Class A | | | — | | | | (374,023 | ) | |
| Class C | | | — | | | | (135,463 | ) | |
| Class I | | | — | | | | (86,033 | ) | |
| Total dividends and distributions to shareholders | | | (569,095 | ) | | | (1,004,590 | ) | |
| Capital Stock Transactions: | |
| Increase in net assets from fund share transactions | | | 32,064,092 | | | | 47,803,245 | | |
| Total increase in net assets | | | 35,200,101 | | | | 51,785,712 | | |
| Net Assets: | |
| Beginning of period | | | 65,830,986 | | | | 14,045,274 | | |
| End of perioda | | $ | 101,031,087 | | | $ | 65,830,986 | | |
a Includes undistributed net investment income of $285,878 and $119,125, respectively.
See accompanying notes to financial statements.
18
COHEN & STEERS DIVIDEND VALUE FUND, INC.
FINANCIAL HIGHLIGHTS (Unaudited)
The following table includes selected data for a share outstanding throughout each period and other performance information derived from the financial statements. It should be read in conjunction with the financial statements and notes thereto.
| | | Class A | |
| Per Share Operating Performance: | |
For the Six
Months Ended
August 31, 2007 | | For the
Year Ended
February 28, 2007 | | For the Period
August 31, 2005a
through
February 28, 2006 | |
| Net asset value, beginning of period | | $ | 13.99 | | | $ | 12.26 | | | $ | 11.46 | | |
| Income from investment operations: | |
| Net investment incomeb | | | 0.14 | | | | 0.22 | | | | 0.07 | | |
| Net realized and unrealized gain on investments | | | 0.62 | | | | 1.86 | | | | 0.77 | | |
| Total from investment operations | | | 0.76 | | | | 2.08 | | | | 0.84 | | |
| Less dividends and distributions to shareholders from: | |
| Net investment income | | | (0.10 | ) | | | (0.18 | ) | | | (0.04 | ) | |
| Net realized gain on investments | | | — | | | | (0.17 | ) | | | — | | |
| Total dividends and distributions to shareholders | | | (0.10 | ) | | | (0.35 | ) | | | (0.04 | ) | |
| Redemption fees retained by the fund | | | 0.00 | c | | | 0.00 | c | | | 0.00 | c | |
| Net increase in net asset value | | | 0.66 | | | | 1.73 | | | | 0.80 | | |
| Net asset value, end of period | | $ | 14.65 | | | $ | 13.99 | | | $ | 12.26 | | |
| Total investment returnd | | | 5.40 | %e | | | 17.12 | % | | | 7.29 | %e | |
| Ratios/Supplemental Data: | |
| Net assets, end of period (in millions) | | $ | 55.6 | | | $ | 41.7 | | | $ | 6.6 | | |
| Ratio of expenses to average daily net assets (before expense reduction) | | | 1.78 | %f | | | 2.33 | %g | | | 7.02 | %f | |
| Ratio of expenses to average daily net assets (net of expense reduction) | | | 1.00 | %f | | | 1.00 | % | | | 1.28 | %f | |
Ratio of net investment income (loss) to average daily net assets (before
expense reduction) | | | 1.07 | %f | | | 0.30 | % | | | (4.66 | )%f | |
Ratio of net investment income to average daily net assets (net
of expense reduction) | | | 1.84 | %f | | | 1.63 | % | | | 1.08 | %f | |
| Portfolio turnover rate | | | 22 | %e | | | 30 | % | | | 8 | %e | |
a Commencement of operations.
b Calculation based on average shares outstanding.
c Amount is less than $0.005.
d Does not reflect sales charges, which would reduce return.
e Not annualized.
f Annualized.
g Due to the significant growth of net assets on a small asset base, the expense ratio, when averaged over the year, differs from the fund's other classes by an amount other than class specific expenses. Typically, the ratios between classes will only differ by the class specific expenses (i.e., distribution fees and shareholder servicing fees).
See accompanying notes to financial statements.
19
COHEN & STEERS DIVIDEND VALUE FUND, INC.
FINANCIAL HIGHLIGHTS (Unaudited)—(Continued)
| | | Class C | |
| Per Share Operating Performance: | |
For the Six
Months Ended
August 31, 2007 | |
For the
Year Ended
February 28, 2007 | | For the Period
August 31, 2005a
through
February 28, 2006 | |
| Net asset value, beginning of period | | $ | 13.94 | | | $ | 12.23 | | | $ | 11.46 | | |
| Income from investment operations: | |
| Net investment incomeb | | | 0.09 | | | | 0.14 | | | | 0.03 | | |
| Net realized and unrealized gain on investments | | | 0.62 | | | | 1.86 | | | | 0.77 | | |
| Total from investment operations | | | 0.71 | | | | 2.00 | | | | 0.80 | | |
| Less dividends and distributions to shareholders from: | |
| Net investment income | | | (0.07 | ) | | | (0.12 | ) | | | (0.03 | ) | |
| Net realized gain on investments | | | — | | | | (0.17 | ) | | | — | | |
| Total dividends and distributions to shareholders | | | (0.07 | ) | | | (0.29 | ) | | | (0.03 | ) | |
| Redemption fees retained by the fund | | | 0.00 | c | | | 0.00 | c | | | 0.00 | c | |
| Net increase in net asset value | | | 0.64 | | | | 1.71 | | | | 0.77 | | |
| Net asset value, end of period | | $ | 14.58 | | | $ | 13.94 | | | $ | 12.23 | | |
| Total investment returnd | | | 5.08 | %e | | | 16.40 | % | | | 6.96 | %e | |
| Ratios/Supplemental Data: | |
| Net assets, end of period (in millions) | | $ | 30.5 | | | $ | 14.7 | | | $ | 3.8 | | |
| Ratio of expenses to average daily net assets (before expense reduction) | | | 2.43 | %f | | | 3.21 | %g | | | 7.93 | %f | |
| Ratio of expenses to average daily net assets (net of expense reduction) | | | 1.65 | %f | | | 1.65 | % | | | 1.95 | %f | |
Ratio of net investment income (loss) to average daily net assets (before
expense reduction) | | | 0.38 | %f | | | (0.50 | )% | | | (5.53 | )%f | |
Ratio of net investment income to average daily net assets (net
of expense reduction) | | | 1.16 | %f | | | 1.06 | % | | | 0.45 | %f | |
| Portfolio turnover rate | | | 22 | %e | | | 30 | % | | | 8 | %e | |
a Commencement of operations.
b Calculation based on average shares outstanding.
c Amount is less than $0.005.
d Does not reflect sales charges, which would reduce return.
e Not annualized.
f Annualized.
g Due to the significant growth of net assets on a small asset base, the expense ratio, when averaged over the year, differs from the fund's other classes by an amount other than class specific expenses. Typically, the ratios between classes will only differ by the class specific expenses (i.e., distribution fees and shareholder servicing fees).
See accompanying notes to financial statements.
20
COHEN & STEERS DIVIDEND VALUE FUND, INC.
FINANCIAL HIGHLIGHTS (Unaudited)—(Continued)
| | | Class I | |
| Per Share Operating Performance: | |
For the Six
Months Ended
August 31, 2007 | |
For the
Year Ended
February 28, 2007 | | For the Period
August 31, 2005a
through
February 28, 2006 | |
| Net asset value, beginning of period | | $ | 14.00 | | | $ | 12.27 | | | $ | 11.46 | | |
| Income from investment operations: | |
| Net investment incomeb | | | 0.16 | | | | 0.27 | | | | 0.09 | | |
| Net realized and unrealized gain on investments | | | 0.63 | | | | 1.87 | | | | 0.76 | | |
| Total from investment operations | | | 0.79 | | | | 2.14 | | | | 0.85 | | |
| Less dividends and distributions to shareholders from: | |
| Net investment income | | | (0.13 | ) | | | (0.24 | ) | | | (0.04 | ) | |
| Net realized gain on investments | | | — | | | | (0.17 | ) | | | — | | |
| Total dividends and distributions to shareholders | | | (0.13 | ) | | | (0.41 | ) | | | (0.04 | ) | |
| Redemption fees retained by the fund | | | 0.00 | c | | | 0.00 | c | | | 0.00 | c | |
| Net increase in net asset value | | | 0.66 | | | | 1.73 | | | | 0.81 | | |
| Net asset value, end of period | | $ | 14.66 | | | $ | 14.00 | | | $ | 12.27 | | |
| Total investment return | | | 5.57 | %d | | | 17.63 | % | | | 7.42 | %d | |
| Ratios/Supplemental Data: | |
| Net assets, end of period (in millions) | | $ | 14.9 | | | $ | 9.4 | | | $ | 3.7 | | |
| Ratio of expenses to average daily net assets (before expense reduction) | | | 1.43 | %e | | | 2.27 | %f | | | 11.99 | %e | |
| Ratio of expenses to average daily net assets (net of expense reduction) | | | 0.65 | %e | | | 0.65 | % | | | 1.07 | %e | |
Ratio of net investment income (loss) to average daily net assets (before
expense reduction) | | | 1.39 | %e | | | 0.45 | % | | | (9.43 | )%e | |
Ratio of net investment income to average daily net assets (net
of expense reduction) | | | 2.17 | %e | | | 2.06 | % | | | 1.49 | %e | |
| Portfolio turnover rate | | | 22 | %d | | | 30 | % | | | 8 | %d | |
a Commencement of operations.
b Calculation based on average shares outstanding.
c Amount is less than $0.005.
d Not annualized.
e Annualized.
f Due to the significant growth of net assets on a small asset base, the expense ratio, when averaged over the year, differs from the fund's other classes by an amount other than class specific expenses. Typically, the ratios between classes will only differ by the class specific expenses (i.e., distribution fees and shareholder servicing fees).
See accompanying notes to financial statements.
21
COHEN & STEERS DIVIDEND VALUE FUND, INC.
NOTES TO FINANCIAL STATEMENTS (Unaudited)
Note 1. Significant Accounting Policies
Cohen & Steers Dividend Value Fund, Inc. (the fund) was incorporated under the laws of the State of Maryland on November 9, 2004 and is registered under the Investment Company Act of 1940, as amended, as a nondiversified, open-end management investment company. The fund's investment objectives are to provide a relatively high level of current income and long term growth of income and capital appreciation. Investment operations commenced on August 31, 2005. The authorized shares of the fund are divided into three classes designated Class A, C, and I shares. Each of the fund's shares has equal dividend, liquidation and voting rights (except for matters relating to distributions and shareholder servicing of such shares).
The following is a summary of significant accounting policies consistently followed by the fund in the preparation of its financial statements. The policies are in conformity with accounting principles generally accepted in the United States of America (GAAP). The preparation of the financial statements in accordance with GAAP requires management to make estimates and assumptions that affect the reported amounts of assets and liabilities at the date of the financial statements and the reported amounts of income and expenses during the reporting period. Actual results could differ from those estimates.
Portfolio Valuation: Investments in securities that are listed on the New York Stock Exchange are valued, except as indicated below, at the last sale price reflected at the close of the New York Stock Exchange on the business day as of which such value is being determined. If there has been no sale on such day, the securities are valued at the mean of the closing bid and asked prices for the day or, if no asked price is available, at the bid price.
Securities not listed on the New York Stock Exchange but listed on other domestic or foreign securities exchanges or admitted to trading on the National Association of Securities Dealers Automated Quotations, Inc. (Nasdaq) national market system are valued in a similar manner. Securities traded on more than one securities exchange are valued at the last sale price on the business day as of which such value is being determined as reflected on the tape at the close of the exchange representing the principal market for such securities.
Readily marketable securities traded in the over-the-counter market, including listed securities whose primary market is believed by Cohen & Steers Capital Management, Inc. (the advisor) to be over-the-counter, but excluding securities admitted to trading on the Nasdaq National List, are valued at the official closing prices as reported by Nasdaq, the National Quotation Bureau, or such other comparable sources as the Board of Directors deem appropriate to reflect their fair market value. If there has been no sale on such day, the securities are valued at the mean of the closing bid and asked prices for the day, or if no asked price is available, at the bid price. Where securities are traded on more than one exchange and also over-the-counter, the securities will generally be valued using the quotations the Board of Directors believes most closely reflect the value of such securities.
Securities for which market prices are unavailable, or securities for which the advisor determines that bid and/or asked price does not reflect market value, will be valued at fair value pursuant to procedures approved by
22
COHEN & STEERS DIVIDEND VALUE FUND, INC.
NOTES TO FINANCIAL STATEMENTS (Unaudited)—(Continued)
the fund's Board of Directors. Circumstances in which market prices may be unavailable include, but are not limited to, when trading in a security is suspended, the exchange on which the security is traded is subject to an unscheduled close or disruption or material events occur after the close of the exchange on which the security is principally traded. In these circumstances, the fund determines fair value in a manner that fairly reflects the market value of the security on the valuation date based on consideration of any information or factors it deems appropriate. These may include recent transactions in comparable securities, information relating to the specific security and developments in the markets.
The fund's use of fair value pricing may cause the net asset value of fund shares to differ from the net asset value that would be calculated using market quotations. Fair value pricing involves subjective judgments and it is possible that the fair value determined for a security may be materially different than the value that could be realized upon the sale of that security.
Short-term debt securities, which have a maturity date of 60 days or less, are valued at amortized cost, which approximates value.
Security Transactions and Investment Income: Security transactions are recorded on trade date. Realized gains and losses on investments sold are recorded on the basis of identified cost. Interest income is recorded on the accrual basis. Discounts are accreted and premiums are amortized over the life of the respective securities. Dividend income is recorded on the ex-dividend date. The fund records distributions received in excess of income from underlying investments as a reduction of cost of investments and/or realized gain. Such amounts are based on estimates if actual amounts are not available and actual amounts of income, realized gain and return of capital may differ from the estimated amounts. The fund adjusts the estimated amounts of the components of distributions (and consequently its net investment income) as an increase to unrealized appreciation/(depre ciation) and realized gain/(loss) on investments as necessary once the issuers provide information about the actual composition of the distributions. Income, expenses (other than expenses attributable to a specific class), and realized and unrealized gains or losses on investments are allocated to each class of shares based on its relative net assets.
Foreign Currency: The books and records of the fund are maintained in U.S. dollars as follows: (1) the foreign currency market value of investment securities, other assets and liabilities and foreign currency contracts are translated at the exchange rates prevailing at the end of the period; and (2) purchases, sales, income and expenses are translated at the exchange rates prevailing on the respective dates of such transactions. The resultant exchange gains and losses are recorded as realized and unrealized gain/loss on foreign exchange transactions. Pursuant to U.S. federal income tax regulations, certain foreign exchange gains/losses included in realized and unrealized gain/loss are included in or are a reduction of ordinary income for federal income tax purposes. The fund does not isolate that portion of the results of operations arising as a result of changes in the foreign exchange rates from the changes in the market prices of the securities.
23
COHEN & STEERS DIVIDEND VALUE FUND, INC.
NOTES TO FINANCIAL STATEMENTS (Unaudited)—(Continued)
Foreign Securities: The fund may directly purchase securities of foreign issuers. Investing in securities of foreign issuers involves special risks not typically associated with investing in securities of U.S. issuers. The risks include possible revaluation of currencies, the ability to repatriate funds, less complete financial information about companies and possible future adverse political and economic developments. Moreover, securities of many foreign issuers and their markets may be less liquid and their prices more volatile than those of securities of comparable U.S. issuers.
Dividends and Distributions to Shareholders: Dividends from net investment income and capital gain distributions are determined in accordance with U.S. federal income tax regulations, which may differ from GAAP. Dividends from net investment income are declared and paid quarterly. Net realized capital gains, unless offset by any available capital loss carryforward, are distributed to shareholders annually. Dividends and distributions to shareholders are recorded on the ex-dividend date and are automatically reinvested in full and fractional shares of the fund based on the net asset value per share at the close of business on the payable date unless the shareholder has elected to have them paid in cash.
Distributions paid by the fund are subject to recharacterization for tax purposes. Based upon the results of operations for the six months ended August 31, 2007, the advisor considers it likely that a portion of the dividends will be reclassified to return of capital and distributions of net realized capital gains upon the final determination of the fund's taxable income for the year.
Income Taxes: It is the policy of the fund to continue to qualify as a regulated investment company, if such qualification is in the best interest of the shareholders, by complying with the requirements of Subchapter M of the Internal Revenue Code applicable to regulated investment companies, and by distributing substantially all of its taxable earnings to its shareholders. Accordingly, no provision for federal income or excise tax is necessary.
Note 2. Investment Advisory and Administration Fees and Other Transactions with Affiliates
Investment Advisory Fees: Pursuant to an investment advisory agreement (the advisory agreement) with the fund, the advisor provides the fund with the day-to-day investment decisions and generally manages the fund's investments in accordance with the stated policies of the fund, subject to the supervision of the fund's Board of Directors. For the services provided to the fund, the advisor receives a fee, accrued daily and paid monthly, at the annual rate of 0.80% of the average daily net assets of the fund up to and including $1.5 billion and 0.70% of the average daily net asset above $1.5 billion.
For the six months ended August 31, 2007 and through February 28, 2008, the advisor has contractually agreed to waive its fee and/or reimburse the fund for expenses incurred to the extent necessary to maintain the fund's operating expenses at 1.00% for Class A shares, 1.65% for Class C shares and 0.65% for Class I shares.
24
COHEN & STEERS DIVIDEND VALUE FUND, INC.
NOTES TO FINANCIAL STATEMENTS (Unaudited)—(Continued)
Administration Fees: The fund has entered into an administration agreement with the advisor under which the advisor performs certain administrative functions for the fund and receives a fee, accrued daily and paid monthly, at the annual rate of 0.04% of the fund's average daily net assets. For the six months ended August 31, 2007, the fund paid the advisor $17,225 in fees under this administration agreement. Additionally, the fund has retained State Street Bank and Trust Company as sub-administrator under a fund accounting and administration agreement.
Distribution Fees: Cohen & Steers Securities, LLC (the distributor), an affiliated entity of the advisor, distributes the shares of the fund. The fund has adopted a distribution plan (the plan) pursuant to Rule 12b-1 under the Investment Company Act of 1940. Under the plan, the fund may not incur distribution fees which exceed an annual rate of 0.25% of the average daily net assets attributable to the Class A shares and 0.75% of the average daily net assets attributable to the Class C shares.
For the six months ended August 31, 2007, the fund has been advised that the distributor received $12,217 in sales commissions from the sale of Class A shares and that the distributor also received $2,845 of contingent deferred sales charges relating to redemptions of Class C shares. The distributor has advised the fund that proceeds from the contingent deferred sales charge on the Class C shares are paid to the distributor and are used by the distributor to defray its expenses related to providing distribution-related services to the fund in connection with the sale of the Class C shares, including payments to dealers and other financial intermediaries for selling Class C shares and interest and other financing costs associated with Class C shares.
Shareholder Servicing Fees: The fund has adopted a shareholder services plan which provides that the fund may obtain the services of qualified financial institutions to act as shareholder servicing agents for their customers. For these services, the fund may pay the shareholder servicing agent a fee, accrued daily and paid monthly, at an annual rate of up to 0.10% of the average daily net asset value of the fund's Class A shares and up to 0.25% of the average daily net asset value of the fund's Class C shares.
Directors' and Officers' Fees: Certain directors and officers of the fund are also directors, officers, and/or employees of the advisor. The fund does not pay compensation to any affiliated directors and officers except for the Chief Compliance Officer, who received $454 from the fund for the six months ended August 31, 2007.
Other: At August 31, 2007 there was one investor owning 5.1% of the fund's outstanding shares. Investment activities of this shareholder could have a significant impact on the fund.
Note 3. Purchases and Sales of Securities
Purchases and sales of securities, excluding short-term investments, for the six months ended August 31, 2007, totaled $48,962,709 and $18,304,661, respectively.
25
COHEN & STEERS DIVIDEND VALUE FUND, INC.
NOTES TO FINANCIAL STATEMENTS (Unaudited)—(Continued)
Note 4. Income Tax Information
As of August 31, 2007, the federal tax cost and net unrealized appreciation on securities were as follows:
| Cost for federal income tax purposes | | $ | 95,131,243 | | |
| Gross unrealized appreciation | | $ | 7,562,806 | | |
| Gross unrealized depreciation | | | (1,668,003 | ) | |
| Net unrealized appreciation | | $ | 5,894,803 | | |
Note 5. Capital Stock
The fund is authorized to issue 200 million shares of capital stock, at a par value of $0.001 per share. The Board of Directors of the fund may increase or decrease the aggregate number of shares of common stock that the fund has authority to issue. At August 31, 2007, the advisor owned 274,591 shares or 4.0% of the fund. Transactions in fund shares were as follows:
| | | For the Six
Months Ended
August 31, 2007 | | For the
Year Ended
February 28, 2007 | |
| | | Shares | | Amount | | Shares | | Amount | |
| Class A: | |
| Sold | | | 1,175,171 | | | $ | 17,123,940 | | | | 2,511,166 | | | $ | 33,709,069 | | |
| Issued as reinvestment of dividends | | | 13,732 | | | | 198,246 | | | | 29,444 | | | | 403,136 | | |
| Redeemed | | | (374,031 | ) | | | (5,493,436 | ) | | | (100,027 | ) | | | (1,335,060 | ) | |
| Redemption fees retained by the funda | | | — | | | | 6,689 | | | | — | | | | 2,831 | | |
| Net increase | | | 814,872 | | | $ | 11,835,439 | | | | 2,440,583 | | | $ | 32,779,976 | | |
| Class C: | |
| Sold | | | 1,092,115 | | | $ | 15,907,409 | | | | 774,135 | | | $ | 10,309,683 | | |
| Issued as reinvestment of dividends | | | 1,398 | | | | 20,196 | | | | 2,441 | | | | 33,448 | | |
| Redeemed | | | (56,311 | ) | | | (814,824 | ) | | | (30,672 | ) | | | (417,666 | ) | |
| Redemption fees retained by the funda | | | — | | | | 3,187 | | | | — | | | | 1,336 | | |
| Net increase | | | 1,037,202 | | | $ | 15,115,968 | | | | 745,904 | | | $ | 9,926,801 | | |
26
COHEN & STEERS DIVIDEND VALUE FUND, INC.
NOTES TO FINANCIAL STATEMENTS (Unaudited)—(Continued)
| | | For the Six
Months Ended
August 31, 2007 | | For the
Year Ended
February 28, 2007 | |
| | | Shares | | Amount | | Shares | | Amount | |
| Class I: | |
| Sold | | | 362,132 | | | $ | 5,359,210 | | | | 391,080 | | | $ | 5,286,416 | | |
| Issued as reinvestment of dividends | | | 4,950 | | | | 71,819 | | | | 7,704 | | | | 105,740 | | |
| Redeemed | | | (22,027 | ) | | | (320,085 | ) | | | (22,505 | ) | | | (297,381 | ) | |
| Redemption fees retained by the funda | | | — | | | | 1,741 | | | | — | | | | 1,693 | | |
| Net increase | | | 345,055 | | | $ | 5,112,685 | | | | 376,279 | | | $ | 5,096,468 | | |
a The fund may charge a 1% redemption fee on shares sold within six months of the time of purchase. Effective September 28, 2007, the redemption fee will be charged at the rate of 2% on shares sold within 60 days of the time of purchase.
Note 6. Borrowings
The fund, in conjunction with other Cohen & Steers funds is a party to a $150,000,000 syndicated credit agreement (the credit agreement) with State Street Bank and Trust Company, as administrative agent and operations agent, and the lenders identified in the credit agreement, which expires December 2007. The Fund pays a commitment fee of 0.10% per annum on its proportionate share of the unused portion of the credit agreement.
During the six months ended August 31, 2007, the fund did not utilize the line of credit.
Note 7. Other
In the normal course of business, the fund enters into contracts that provide general indemnifications. The fund's maximum exposure under these arrangements is dependent on claims that may be made against the fund in the future and, therefore, cannot be estimated; however, based on experience, the risk of material loss from such claims is considered remote.
Note 8. New Accounting Pronouncements
In July 2006, the Financial Accounting Standards Board (FASB) issued Interpretation 48, Accounting for Uncertainty in Income Taxes—an interpretation of FASB Statement 109 (FIN 48). FIN 48 clarifies the accounting for income taxes by prescribing the minimum recognition threshold a tax position must meet before being recognized in the financial statements. FIN 48 is effective for fiscal years beginning after December 15, 2006. An assessment of the fund's tax positions has been made and it has been determined that there is no impact to the fund's financial statements.
27
COHEN & STEERS DIVIDEND VALUE FUND, INC.
NOTES TO FINANCIAL STATEMENTS (Unaudited)—(Continued)
In September 2006, Statement of Financial Accounting Standards No. 157, Fair Value Measurements (SFAS 157), was issued and is effective for fiscal years beginning after November 15, 2007. SFAS 157 defines fair value, establishes a framework for measuring fair value and expands disclosures about fair value measurements. Management is currently evaluating the impact the adoption of SFAS 157 will have on the fund's financial statements.
28
COHEN & STEERS DIVIDEND VALUE FUND, INC.
OTHER INFORMATION
A description of the policies and procedures that the fund uses to determine how to vote proxies relating to portfolio securities is available (i) without charge, upon request, by calling 800-330-7348, (ii) on our Web site at cohenandsteers.com or (iii) on the Securities and Exchange Commission's Web site at http://www.sec.gov. In addition, the fund's proxy voting record for the most recent 12-month period ended June 30 is available (i) without charge, upon request, by calling 800-330-7348 or (ii) on the SEC's Web site at http://www.sec.gov.
The fund files its complete schedule of portfolio holdings with the SEC for the first and third quarters of each fiscal year on Form N-Q. The fund's Forms N-Q are available (i) without charge, upon request by calling 800-330-7348, or (ii) on the SEC's Web site at http://www.sec.gov. In addition, the Forms N-Q may be reviewed and copied at the SEC's Public Reference Room in Washington, DC. Information on the operation of the Public Reference Room may be obtained by calling 800-SEC-0330.
Please note that the distributions paid by the fund to shareholders are subject to recharacterization for tax purposes. The fund may also pay distributions in excess of the fund's net investment company taxable income and this excess would be a tax-free return of capital distributed from the fund's assets. The final tax treatment of all distributions is reported to shareholders on their 1099-DIV forms, which are mailed after the close of each calendar year.
29
COHEN & STEERS DIVIDEND VALUE FUND, INC.
Meet the Cohen & Steers family of open-end funds:
COHEN & STEERS
REALTY SHARES
• Designed for investors seeking maximum total return, investing primarily in REITs
• Symbol: CSRSX
COHEN & STEERS
REALTY INCOME FUND
• Designed for investors seeking high current income, investing primarily in REITs
• Symbols: CSEIX, CSBIX, CSCIX, CSDIX
COHEN & STEERS
INTERNATIONAL REALTY FUND
• Designed for investors seeking maximum total return, investing primarily in international real estate securities
• Symbols: IRFAX, IRFCX, IRFIX
COHEN & STEERS
DIVIDEND VALUE FUND
• Designed for investors seeking high current income and long-term growth of income and capital appreciation, investing primarily in dividend paying common stocks and preferred stocks
• Symbols: DVFAX, DVFCX, DVFIX
COHEN & STEERS
INSTITUTIONAL GLOBAL REALTY SHARES
• Designed for investors seeking maximum total return, investing primarily in global real estate securities
• Symbol: GRSIX
COHEN & STEERS
INSTITUTIONAL REALTY SHARES
• Designed for institutional investors seeking maximum total return, investing primarily in REITs
• Symbol: CSRIX
COHEN & STEERS
GLOBAL REALTY SHARES
• Designed for investors seeking maximum total return, investing in global real estate equity securities
• Symbols: CSFAX, CSFBX, CSFCX, CSSPX
COHEN & STEERS
UTILITY FUND
• Designed for investors seeking maximum total return, investing primarily in utilities
• Symbols: CSUAX, CSUBX, CSUCX, CSUIX
COHEN & STEERS
ASIA PACIFIC REALTY SHARES
• Designed for investors seeking maximum total return, investing primarily in real estate securities located in the Asia Pacific region
• Symbols: APFAX, APFCX, APFIX
COHEN & STEERS
EUROPEAN REALTY SHARES
• Designed for investors seeking maximum total return, investing primarily in real estate securities located in Europe
• Symbols: EURAX, EURCX, EURIX
Please consider the investment objectives, risks, charges and expenses of the fund carefully before investing. A prospectus containing this and other information can be obtained by calling 800-330-7348 or by visiting cohenandsteers.com. Please read the prospectus carefully before investing.
Cohen & Steers Securities, LLC, Distributor
30
COHEN & STEERS DIVIDEND VALUE FUND, INC.
OFFICERS AND DIRECTORS
Robert H. Steers
Director and co-chairman
Martin Cohen
Director and co-chairman
Bonnie Cohen
Director
George Grossman
Director
Richard E. Kroon
Director
Richard J. Norman
Director
Frank K. Ross
Director
Willard H. Smith Jr.
Director
C. Edward Ward, Jr.
Director
Adam M. Derechin
President and chief executive officer
Joseph M. Harvey
Vice president
Richard E. Helm
Vice president
Francis C. Poli
Secretary
James Giallanza
Treasurer and chief financial officer
Lisa D. Phelan
Chief compliance officer
KEY INFORMATION
Investment Advisor
Cohen & Steers Capital Management, Inc.
280 Park Avenue
New York, NY 10017
(212) 832-3232
Subadministrator and Custodian
State Street Bank and Trust Company
One Lincoln Street
Boston, MA 02111
Transfer Agent
Boston Financial Data Services, Inc.
66 Brooks Drive
Braintree, MA 02184
(800) 437-9912
Legal Counsel
Stroock & Stroock & Lavan LLP
180 Maiden Lane
New York, NY 10038
Distributor
Cohen & Steers Securities, LLC
280 Park Avenue
New York, NY 10017
Nasdaq Symbol: Class A—DVFAX
Class C—DVFCX
Class I— DVFIX
Web site: cohenandsteers.com
This report is authorized for delivery only to shareholders of Cohen & Steers Dividend Value Fund, Inc. unless accompanied or preceded by the delivery of a currently effective prospectus setting forth details of the fund. Past performance is of course no guarantee of future results and your investment may be worth more or less at the time you sell.
31
COHEN & STEERS
DIVIDEND VALUE FUND
280 PARK AVENUE
NEW YORK, NY 10017

SEMIANNUAL REPORT
AUGUST 31, 2007
Item 2. Code of Ethics.
Not applicable.
Item 3. Audit Committee Financial Expert.
Not applicable.
Item 4. Principal Accountant Fees and Services.
Not applicable.
Item 5. Audit Committee of Listed Registrants.
Not applicable.
Item 6. Schedule of Investments.
Included in Item 1 above.
Item 7. Disclosure of Proxy Voting Policies and Procedures for Closed-End Management Investment Companies.
Not applicable.
Item 8. Portfolio Managers of Closed-End Management Investment Companies.
Not applicable.
Item 9. Purchases of Equity Securities by Closed-End Management Investment Company and Affiliated Purchasers.
Not applicable.
Item 10. Submission of Matters to a Vote of Security Holders.
None.
Item 11. Controls and Procedures.
(a) The registrant’s principal executive officer and principal financial officer have concluded, based upon their evaluation of the registrant’s disclosure controls and procedures as conducted within 90 days of the filing date of this report, that these disclosure controls and procedures provide reasonable assurance that material information required to be disclosed by the registrant in the report it files or submits on Form N-CSR is recorded, processed, summarized and reported within the time periods specified in the Securities and Exchange Commission’s rules and forms
and that such material information is accumulated and communicated to the registrant’s management, including its principal executive officer and principal financial officer, as appropriate, in order to allow timely decisions regarding required disclosure.
(b) There were no changes in the registrant’s internal control over financial reporting that occurred during the second fiscal quarter of the period covered by this report that have materially affected, or are reasonably likely to materially affect, the registrant’s internal control over financial reporting.
Item 12. Exhibits.
(a)(1) Not applicable.
(a) (2) Certifications of principal executive officer and principal financial officer as required by Rule 30a-2(a) under the Investment Company Act of 1940.
(a)(3) Not applicable.
(b) Certifications of principal exe cutive officer and principal financial officer as required by Rule 30a- 2(b) under the Investment Company Act of 1940.
SIGNATURES
Pursuant to the requirements of the Securities Exchange Act of 1934 and the Investment Company Act of 1940, the registrant has duly caused this report to be signed on its behalf by the undersigned, thereunto duly authorized.
COHEN & STEERS DIVIDEND VALUE FUND, INC.
By: | /s/ Adam M. Derechin | |
| Name: Adam M. Derechin |
| Title: President and Chief Executive Officer |
|
Date: October 26, 2007 |
| | | |
Pursuant to the requirements of the Securities Exchange Act of 1934 and the Investment Company Act of 1940, this report has been signed below by the following persons on behalf of the registrant and in the capacities and on the dates indicated.
By: | /s/ Adam M. Derechin | |
| Name: | Adam M. Derechin |
| Title: | President and Chief Executive Officer |
| | (principal executive officer) |
| |
|
By: | /s/ James Giallanza | |
| Name: | James Giallanza |
| Title: | Treasurer |
| | (principal financial officer) |
| |
| |
Date: October 26, 2007 |
| | | | |