UNITED STATES
SECURITIES AND EXCHANGE COMMISSION
Washington, D.C. 20549
FORM N-CSR
CERTIFIED SHAREHOLDER REPORT OF REGISTERED
MANAGEMENT INVESTMENT COMPANIES
Investment Company Act file number | 811-21668 |
|
Cohen & Steers Dividend Value Fund, Inc. |
(Exact name of registrant as specified in charter) |
|
280 Park Avenue, New York, NY | | 10017 |
(Address of principal executive offices) | | (Zip code) |
|
Adam M. Derechin Cohen & Steers Capital Management, Inc. 280 Park Avenue New York, New York 10017 |
(Name and address of agent for service) |
|
Registrant’s telephone number, including area code: | (212) 832-3232 | |
|
Date of fiscal year end: | February 28 | |
|
Date of reporting period: | August 31, 2010 | |
| | | | | | | | |
Item 1. Reports to Stockholders.
COHEN & STEERS DIVIDEND VALUE FUND, INC.
To Our Shareholders:
We would like to share with you our report for the six months ended August 31, 2010. The net asset values (NAV) per share at that date were $10.01, $9.96 and $10.02 for Class A, Class C and Class I shares, respectively.
The total returns, including income and change in NAV, for the Fund and its comparative benchmarks were:
| | | Six Months Ended
August 31, 2010 | |
| Cohen & Steers Dividend Value Fund—Class A | | | –6.13 | % | |
| Cohen & Steers Dividend Value Fund—Class C | | | –6.38 | % | |
| Cohen & Steers Dividend Value Fund—Class I | | | –5.96 | % | |
| Russell 1000 Value Indexa | | | –3.28 | % | |
| S&P 500 Indexa | | | –4.04 | % | |
The performance data quoted represent past performance. Past performance is no guarantee of future results. The investment return and the principal value of an investment will fluctuate and shares, if redeemed, may be worth more or less than their original cost. Current performance may be lower or higher than the performance data quoted. Current total returns of the Fund can be obtained by visiting our Web site at cohenandsteers.com. Performance quoted does not reflect the deduction of the maximum 4.5% initial sales charge on Class A shares or the 1% maximum contingent deferred sales charge on Class C shares. If such charges were included, returns would have been lower.
The Fund implements fair value pricing when the daily change in a specific U.S. market index exceeds a predetermined percentage. Fair value pricing adjusts the valuation of non-U.S. holdings to account for such index change following the close of foreign markets. This standard practice has been adopted by a majority of the fund industry to deter investors from arbitraging funds with a large percentage of non-U.S. holdings. In the event fair value pricing is implemented on the first and/or last day of a performance measurement period, the Fund's return may diverge from the relative performance of its benchmark index, which does not use fair value pricing. An investor cannot invest directly in an index.
Please note that distributions paid by the Fund to shareholders are subject to recharacterization for tax purposes. These recharacterizations could result in the Fund paying distributions in excess of its investment company taxable income and this excess could be a tax free return of capital distributed from the Fund's assets.
a The Russell 1000 Value Index measures the performance of those Russell 1000 companies with lower price-to-book ratios and lower forecasted growth values. The S&P 500 Index is an unmanaged index of common stocks that is frequently used as a general measure of stock market performance.
1
COHEN & STEERS DIVIDEND VALUE FUND, INC.
Investment Review
U.S. equities experienced wide shifts in sentiment and performance in the six-month period ended August 31, 2010. Markets advanced during March, and the second calendar quarter saw a strong start following reports that 79% of S&P 500 companies beat analysts' first-quarter estimates. A declining outlook for growth began to surface in May, amid concerns surrounding European sovereign bank debt, China's efforts to reduce real estate speculation and lower than expected U.S. housing and employment data. Value stocks, which had risen 95% through April from their March 2009 low, retreated about 15% by the end of June, only to rebound again in July, fueled by positive earnings reports, a stronger dollar and low interest rates. Disappointing economic reports in August—including data on housing sales, rekindled concerns of a double-dip recession and news that leading economic indicators in China declined for the fifth month in a row—caus ed U.S. equities to retreat across the board.
Politics were a factor
Government policy had a strong effect on the financial services sector (which had a total return of –6.5%).1 These institutions outperformed in March as the economy improved and the Federal Reserve indicated interest rates would remain low. Sentiment cooled in the second quarter, in part because the Securities & Exchange Commission brought civil charges against Goldman Sachs. June saw more volatility amid concerns about regulatory reform. In July, banks showed improved debt quality and lighter loan loss provisions; regional banks posted improved results and large cap banks by and large beat earnings estimates. Nonetheless, subsequent worries about housing market data—and about the potential for net interest margin compression—caused many of the institutions that rallied in July to give up their gains in August.
Government legislation also had an impact on the health care sector (–8.3%). Insurance companies, generic drug manufacturers and hospitals rallied early in the year when the public option disappeared from the health care reform bill. In the second quarter—after the legislation passed and its impact was assessed—the sector performed in line with its defensive profile. It lost ground as markets rallied and performed comparatively well when more cyclical stocks retreated.
Exuberance gave way to defensiveness
An upturn in consumer spending benefited the consumer discretionary sector (–1.8%) when markets rallied in March. But as growth slowed in June, more volatile names such as Macy's, Sears and Ford were driven down by a more cautious outlook for the consumer, and companies considered more stable, such as McDonald's, became stronger performers. The consumer staples sector (+0.5%) held up better than most; Coca Cola returned nearly 8% during the six-month period. The utilities sector (+8.7%), with its characteristic high yields, also gained as investors became more defensive.
Global events affected investors
Some sectors more acutely felt the repercussion of Europe's sovereign debt crisis and China's efforts to diffuse residential real estate speculation. This was particularly true for the energy sector (–5.5%). Oil prices fell in May on worries about European debt and the construction slowdown in China. A month later, several companies were hurt in connection with the BP oil spill in the Gulf of Mexico. July brought some relief when a stable commodity price environment benefited energy stocks. In August, however, oil and gas prices declined to the lower end of their recent trading range on worries about the economy and demand.
1 Sector returns as measured by the Russell 1000 Value Index.
2
COHEN & STEERS DIVIDEND VALUE FUND, INC.
The telecommunication sector (+12.2%) was the best-performing sector for the six-month period. Telecom carriers rose on the prospect of more profitable tiered pricing systems, rather than the all-inclusive plans currently used by a majority of subscribers. This sector had lost considerable ground earlier in the period; while its customers were becoming more and more dependent on a growing array of personal communication devices, the industry was having difficulty keeping up with expectations for speed and connectivity.
Fund performance
Although total returns for equities and the Fund were negative, the market's strong surge in the first quarter of 2010, and subsequent peak in April, led to the Fund underperforming its benchmark. Factors that detracted from relative performance included stock selection in the consumer staples, industrial (–5.0%), financial services, energy, health care and information technology (–6.8%) sectors.
Within consumer staples, our decision to overweight CVS following poor news hindered Fund performance, as management lowered 2010 earnings and same-store sales guidance. In the financial sector, the Fund had significant holdings in the large banks with greater exposure to capital markets. They sold off more than the sector as a whole, as they were expected to be most affected by the financial regulatory reform bill. Among energy companies, the Fund held Transocean Ltd., the owner of the Deepwater Horizon rig that drilled BP's Macondo well in the Gulf of Mexico; it was a significant factor in our underperformance despite a rally in the stock in August, when the problem appeared to be resolved.
Factors that contributed to relative return included stock selection within the consumer discretionary sector, particularly our out-of-index holdings in McDonald's and H&M. Stock selection in the utilities sector also aided performance, although our underweight lessened the benefit. Utilities often have above-average yields, but generally exhibit below-average dividend growth—a key factor in our selection process.
Stock selection among REITs was beneficial. Our overweight in the Simon Property Group, a regional mall REIT, aided performance, as did our overweight in Public Storage, a company that has historically had a very strong balance sheet.
Investment Outlook
In the face of persistent global economic uncertainty, we are further moderating our estimates on GDP and employment growth for 2010. Although growth will likely be very sluggish, we believe the U.S. economy should avoid a double-dip recession. The Federal Reserve's commitment to maintaining a low interest-rate environment coupled with the desire to raise the rate of inflation is likely to keep the recovery alive, but the pace is subpar and too fragile to withstand much of an external shock.
Overall, we find many large cap companies in good financial health, with substantial cash and liquidity on their balance sheets. While still cautious about expanding their businesses or raising dividends too aggressively in this uncertain environment, many have indicated they plan to increase capital spending this year, which supports our thesis of a gradual economic recovery. In this low-growth environment, we favor companies that generate consistent revenues and earnings, such as those in the consumer staples and health care sectors. At the same time, we own high-value-added cyclicals, such as those in the technology sector, that allow us to participate in the recovery and maintain our high-quality bias.
3
COHEN & STEERS DIVIDEND VALUE FUND, INC.
Sincerely,
 | |  | |
|
| MARTIN COHEN | | ROBERT H. STEERS | |
|
| Co-chairman | | Co-chairman | |
|

RICHARD E. HELM
Portfolio Manager
The views and opinions in the preceding commentary are subject to change. There is no guarantee that any market forecast set forth in the commentary will be realized. This material represents an assessment of the market environment at a specific point in time, should not be relied upon as investment advice and is not intended to predict or depict performance of any investment.
Visit Cohen & Steers online at cohenandsteers.com
For more information about any of our funds, visit cohenandsteers.com, where you will find daily net asset values, fund fact sheets and portfolio highlights. You can also access newsletters, education tools and market updates covering the global real estate, listed infrastructure, utilities, large cap value and preferred securities sectors.
In addition, our Web site contains comprehensive information about our firm, including our most recent press releases, profiles of our senior investment professionals and an overview of our investment approach.
4
COHEN & STEERS DIVIDEND VALUE FUND, INC.
Performance Review (Unaudited)
Average Annual Total Returns—For Periods Ended August 31, 2010
| | | Class A Shares | | Class C Shares | | Class I Shares | |
| 1 Year (with sales charge) | | | –4.10 | %a | | | –1.21 | %b | | | — | | |
| 1 Year (without sales charge) | | | 0.42 | % | | | –0.22 | % | | | 0.79 | % | |
| Since Inceptionc (with sales charge) | | | –1.62 | %a | | | –1.34 | % | | | — | | |
| Since Inceptionc (without sales charge) | | | –0.71 | % | | | –1.34 | % | | | –0.35 | % | |
The performance data quoted represent past performance. Past performance is no guarantee of future results. The investment return and principal value of an investment will fluctuate and shares, when redeemed, may be worth more or less than their original cost. Current performance may be lower or higher than the performance data quoted. Performance information current to the most recent month-end can be obtained by visiting our Web site at cohenandsteers.com. The performance table does not reflect the deduction of taxes that a shareholder would pay on Fund distributions or the redemption of Fund shares. During certain periods presented above, the advisor waived fees and/or reimbursed expenses. Without this arrangement, performance would have been lower.
The annulized gross and net expense ratios, respectively, for each class of shares as disclosed in the July 1, 2010 prospectuses were as follows: Class A—1.51% and 1.15%; Class C—2.16% and 1.80%; and Class I—1.16% and 0.80%. Through June 30, 2011, the advisor has contractually agreed to waive its fee and/or reimburse the Fund for expenses incurred to the extent necessary to maintain the Fund's annual operating expenses at 1.15% for Class A shares, 1.80% for Class C shares and 0.80% for Class I shares.
a Reflects a 4.50% front-end sales charge.
b Reflects a contingent deferred sales charge of 1%.
c Inception date of August 31, 2005.
5
COHEN & STEERS DIVIDEND VALUE FUND, INC.
Expense Example (Unaudited)
As a shareholder of the Fund, you incur two types of costs: (1) transaction costs, including sales charges (loads) on purchase payments and redemption fees; and (2) ongoing costs including management fees; distribution and/or service (12b-1) fees; and other Fund expenses. This example is intended to help you understand your ongoing costs (in dollars) of investing in the Fund and to compare these costs with the ongoing costs of investing in other mutual funds.
The example is based on an investment of $1,000 invested at the beginning of the period and held for the entire period March 1, 2010—August 31, 2010.
Actual Expenses
The first line of the following table provides information about actual account values and expenses. You may use the information in this line, together with the amount you invested, to estimate the expenses that you paid over the period. Simply divide your account value by $1,000 (for example, an $8,600 account value divided by $1,000 = 8.6), then multiply the result by the number in the first line under the heading entitled "Expenses Paid During Period" to estimate the expenses you paid on your account during this period.
Hypothetical Example for Comparison Purposes
The second line of the following table provides information about hypothetical account values and hypothetical expenses based on the Fund's actual expense ratio and an assumed rate of return of 5% per year before expenses, which is not the Fund's actual return. The hypothetical account values and expenses may not be used to estimate the actual ending account balance or expenses you paid for the period. You may use this information to compare the ongoing cost of investing in the Fund and other funds. To do so, compare this 5% hypothetical example with the 5% hypothetical examples that appear in the shareholder reports of other funds.
Please note that the expenses shown in the table are meant to highlight your ongoing costs only and do not reflect any transactional costs, such as sales charges (loads) and redemption fees. Therefore, the second line of the table is useful in comparing ongoing costs only, and will not help you determine the relative total costs of owning different funds. In addition, if these transactional costs were included, your costs would have been higher.
6
COHEN & STEERS DIVIDEND VALUE FUND, INC.
Expense Example (Unaudited)—(Continued)
| | | Beginning
Account Value
March 1, 2010 | | Ending
Account Value
August 31, 2010 | | Expenses Paid
During Perioda
March 1, 2010–
August 31, 2010 | |
| Class A | |
| Actual (–6.13% return) | | $ | 1,000.00 | | | $ | 938.70 | | | $ | 5.62 | | |
| Hypothetical (5% annual return before expenses) | | $ | 1,000.00 | | | $ | 1,019.41 | | | $ | 5.85 | | |
| Class C | |
| Actual (–6.38% return) | | $ | 1,000.00 | | | $ | 936.20 | | | $ | 8.78 | | |
| Hypothetical (5% annual return before expenses) | | $ | 1,000.00 | | | $ | 1,016.13 | | | $ | 9.15 | | |
| Class I | |
| Actual (–5.96% return) | | $ | 1,000.00 | | | $ | 940.40 | | | $ | 3.91 | | |
| Hypothetical (5% annual return before expenses) | | $ | 1,000.00 | | | $ | 1,021.17 | | | $ | 4.08 | | |
a Expenses are equal to the Fund's Class A, Class C and Class I annualized net expense ratios of 1.15%, 1.80%, and 0.80%, respectively, multiplied by the average account value over the period, multiplied by 184/365 (to reflect the one-half year period). If the Fund had borne all of its expenses that were assumed by the advisor, the annualized expense ratios would have been 1.43%, 2.08% and 1.08%, respectively.
7
COHEN & STEERS DIVIDEND VALUE FUND, INC.
AUGUST 31, 2010
Top Ten Holdings
(Unaudited)
| Security | | Value | | % of
Net
Assets | |
| JPMorgan Chase & Co. | | $ | 5,079,492 | | | | 2.7 | % | |
| Pfizer | | | 4,986,090 | | | | 2.7 | | |
| Procter & Gamble Co. | | | 4,952,610 | | | | 2.7 | | |
| Johnson & Johnson | | | 4,652,832 | | | | 2.5 | | |
| Chevron Corp. | | | 4,597,920 | | | | 2.5 | | |
| General Electric Co. | | | 4,569,888 | | | | 2.5 | | |
| Bank of America Corp. | | | 4,525,575 | | | | 2.4 | | |
| Merck & Co. | | | 4,331,712 | | | | 2.3 | | |
| MetLife | | | 4,293,920 | | | | 2.3 | | |
| Wisconsin Energy Corp. | | | 4,035,576 | | | | 2.2 | | |
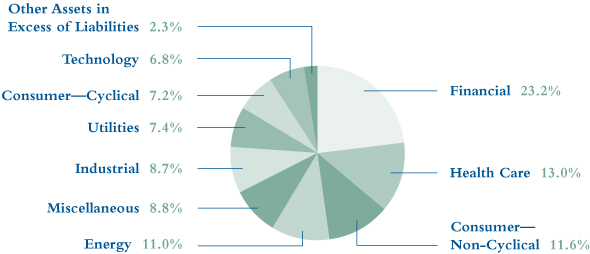
Sector Breakdown
(Based on Net Assets)
(Unaudited)
8
COHEN & STEERS DIVIDEND VALUE FUND, INC.
SCHEDULE OF INVESTMENTS
August 31, 2010 (Unaudited)
| | | | | Number
of Shares | | Value | |
| COMMON STOCK | | | 97.7 | % | | | | | | | | | |
| BASIC MATERIALS | | | 0.9 | % | | | | | | | | | |
| Allegheny Technologies | | | | | | | 19,500 | | | $ | 794,040 | | |
| Dow Chemical Co. | | | | | | | 34,100 | | | | 831,017 | | |
| | | | | | | | 1,625,057 | | |
| CONSUMER—CYCLICAL | | | 7.2 | % | | | | | | | | | |
| APPAREL | | | 1.0 | % | | | | | | | | | |
| NIKE | | | | | | | 26,600 | | | | 1,862,000 | | |
| AUTO PARTS EQUIPMENT | | | 0.5 | % | | | | | | | | | |
| Genuine Parts Co. | | | | | | | 21,400 | | | | 897,302 | | |
| MEDIA | | | 1.7 | % | | | | | | | | | |
| The Walt Disney Co. | | | | | | | 99,600 | | | | 3,245,964 | | |
| RETAIL | | | 4.0 | % | | | | | | | | | |
| Hennes & Mauritz AB (Sweden) | | | | | | | 29,400 | | | | 961,763 | | |
| Nordstrom | | | | | | | 53,200 | | | | 1,538,544 | | |
| Ross Stores | | | | | | | 41,300 | | | | 2,049,719 | | |
| Wal-Mart Stores | | | | | | | 55,600 | | | | 2,787,784 | | |
| | | | | | | | 7,337,810 | | |
| TOTAL CONSUMER—CYCLICAL | | | | | | | | | | | 13,343,076 | | |
| CONSUMER—NON-CYCLICAL | | | 11.6 | % | | | | | | | | | |
| AGRICULTURE | | | 1.4 | % | | | | | | | | | |
| Monsanto Co. | | | | | | | 24,300 | | | | 1,279,395 | | |
| Philip Morris International | | | | | | | 27,100 | | | | 1,394,024 | | |
| | | | | | | | 2,673,419 | | |
| APPAREL | | | 0.5 | % | | | | | | | | | |
| VF Corp. | | | | | | | 12,600 | | | | 889,812 | | |
| BEVERAGE | | | 1.7 | % | | | | | | | | | |
| PepsiCo | | | | | | | 50,800 | | | | 3,260,344 | | |
| COSMETICS/PERSONAL CARE | | | 2.7 | % | | | | | | | | | |
| Procter & Gamble Co. | | | | | | | 83,000 | | | | 4,952,610 | | |
See accompanying notes to financial statements.
9
COHEN & STEERS DIVIDEND VALUE FUND, INC.
SCHEDULE OF INVESTMENTS—(Continued)
August 31, 2010 (Unaudited)
| | | | | Number
of Shares | | Value | |
| FOOD | | | 1.3 | % | | | | | | | | | |
| Kraft Foods-Class A | | | | | | | 81,800 | | | $ | 2,449,910 | | |
| RESTAURANT | | | 1.6 | % | | | | | | | | | |
| McDonald's Corp. | | | | | | | 40,700 | | | | 2,973,542 | | |
| RETAIL | | | 2.4 | % | | | | | | | | | |
| Costco Wholesale Corp. | | | | | | | 33,500 | | | | 1,894,425 | | |
| CVS Caremark Corp. | | | | | | | 93,200 | | | | 2,516,400 | | |
| | | | | | | | 4,410,825 | | |
| TOTAL CONSUMER— NON-CYCLICAL | | | | | | | | | | | 21,610,462 | | |
| ENERGY | | | 11.0 | % | | | | | | | | | |
| OIL & GAS | | | 10.0 | % | | | | | | | | | |
| Apache Corp. | | | | | | | 19,600 | | | | 1,761,060 | | |
| Chevron Corp. | | | | | | | 62,000 | | | | 4,597,920 | | |
| CNOOC Ltd. (Hong Kong) | | | | | | | 788,800 | | | | 1,356,792 | | |
| ConocoPhillips | | | | | | | 33,800 | | | | 1,772,134 | | |
| Devon Energy Corp. | | | | | | | 28,500 | | | | 1,717,980 | | |
| Exxon Mobil Corp. | | | | | | | 49,000 | | | | 2,898,840 | | |
| Occidental Petroleum Corp. | | | | | | | 36,400 | | | | 2,660,112 | | |
| Total SA (France) | | | | | | | 39,600 | | | | 1,850,251 | | |
| | | | | | | | 18,615,089 | | |
| OIL & GAS SERVICES | | | 1.0 | % | | | | | | | | | |
| Schlumberger Ltd. | | | | | | | 32,900 | | | | 1,754,557 | | |
| TOTAL ENERGY | | | | | | | | | | | 20,369,646 | | |
| FINANCIAL | | | 23.2 | % | | | | | | | | | |
| BANK | | | 7.6 | % | | | | | | | | | |
| Bank of America Corp. | | | | | | | 363,500 | | | | 4,525,575 | | |
| Bank of New York Mellon Corp. | | | | | | | 73,500 | | | | 1,783,845 | | |
| SunTrust Banks | | | | | | | 35,600 | | | | 800,644 | | |
| Toronto-Dominion Bank (Canada) | | | | | | | 27,600 | | | | 1,863,276 | | |
| US Bancorp | | | | | | | 66,400 | | | | 1,381,120 | | |
| Wells Fargo & Co. | | | | | | | 158,200 | | | | 3,725,610 | | |
| | | | | | | | 14,080,070 | | |
See accompanying notes to financial statements.
10
COHEN & STEERS DIVIDEND VALUE FUND, INC.
SCHEDULE OF INVESTMENTS—(Continued)
August 31, 2010 (Unaudited)
| | | | | Number
of Shares | | Value | |
| CREDIT CARD | | | 1.7 | % | | | | | | | | | |
| American Express Co. | | | | | | | 32,700 | | | $ | 1,303,749 | | |
| Visa-Class A | | | | | | | 26,500 | | | | 1,827,970 | | |
| | | | | | | | 3,131,719 | | |
| DIVERSIFIED FINANCIAL SERVICE | | | 7.5 | % | | | | | | | | | |
| Citigroupa | | | | | | | 689,100 | | | | 2,563,452 | | |
| Franklin Resources | | | | | | | 19,300 | | | | 1,862,643 | | |
| Goldman Sachs Group | | | | | | | 25,700 | | | | 3,519,358 | | |
| JPMorgan Chase & Co. | | | | | | | 139,700 | | | | 5,079,492 | | |
| Morgan Stanley | | | | | | | 37,900 | | | | 935,751 | | |
| | | | | | | | 13,960,696 | | |
| INSURANCE | | | 6.4 | % | | | | | | | | | |
| Aflac | | | | | | | 62,700 | | | | 2,962,575 | | |
| Chubb Corp. | | | | | | | 46,800 | | | | 2,579,616 | | |
| HCC Insurance Holdings | | | | | | | 76,800 | | | | 1,937,664 | | |
| MetLife | | | | | | | 114,200 | | | | 4,293,920 | | |
| | | | | | | | 11,773,775 | | |
| TOTAL FINANCIAL | | | | | | | | | | | 42,946,260 | | |
| HEALTH CARE | | | 13.0 | % | | | | | | | | | |
| HEALTH CARE PROVIDERS & SERVICES | | | 1.1 | % | | | | | | | | | |
| UnitedHealth Group | | | | | | | 62,400 | | | | 1,979,328 | | |
| HEALTHCARE PRODUCTS | | | 4.6 | % | | | | | | | | | |
| Covidien Ltd. | | | | | | | 66,700 | | | | 2,357,178 | | |
| Johnson & Johnson | | | | | | | 81,600 | | | | 4,652,832 | | |
| Medtronic | | | | | | | 50,600 | | | | 1,592,888 | | |
| | | | | | | | 8,602,898 | | |
| PHARMACEUTICAL | | | 7.3 | % | | | | | | | | | |
| Abbott Laboratories | | | | | | | 45,900 | | | | 2,264,706 | | |
| Merck & Co. | | | | | | | 123,200 | | | | 4,331,712 | | |
| Pfizer | | | | | | | 313,000 | | | | 4,986,090 | | |
| Teva Pharmaceutical Industries Ltd. (ADR) (Israel) | | | | | | | 39,600 | | | | 2,002,968 | | |
| | | | | | | | 13,585,476 | | |
| TOTAL HEALTH CARE | | | | | | | | | | | 24,167,702 | | |
See accompanying notes to financial statements.
11
COHEN & STEERS DIVIDEND VALUE FUND, INC.
SCHEDULE OF INVESTMENTS—(Continued)
August 31, 2010 (Unaudited)
| | | | | Number
of Shares | | Value | |
| INDUSTRIAL | | | 8.7 | % | | | | | | | | | |
| AEROSPACE & DEFENSE | | | 4.0 | % | | | | | | | | | |
| Boeing Co. | | | | | | | 14,400 | | | $ | 880,272 | | |
| General Dynamics Corp. | | | | | | | 38,700 | | | | 2,162,169 | | |
| L-3 Communications Holdings | | | | | | | 25,700 | | | | 1,711,620 | | |
| Lockheed Martin Corp. | | | | | | | 38,300 | | | | 2,662,616 | | |
| | | | | | | | 7,416,677 | | |
| DIVERSIFIED MANUFACTURING | | | 2.9 | % | | | | | | | | | |
| 3M Co. | | | | | | | 11,600 | | | | 911,180 | | |
| General Electric Co. | | | | | | | 315,600 | | | | 4,569,888 | | |
| | | | | | | | 5,481,068 | | |
| ENVIRONMENTAL CONTROL | | | 0.5 | % | | | | | | | | | |
| Waste Management | | | | | | | 28,600 | | | | 946,374 | | |
| TRANSPORTATION | | | 1.3 | % | | | | | | | | | |
| Norfolk Southern Corp. | | | | | | | 17,800 | | | | 955,504 | | |
| United Parcel Service | | | | | | | 22,400 | | | | 1,429,120 | | |
| | | | | | | | 2,384,624 | | |
| TOTAL INDUSTRIAL | | | | | | | | | | | 16,228,743 | | |
| MATERIALS | | | 1.5 | % | | | | | | | | | |
| CHEMICALS | | | 1.0 | % | | | | | | | | | |
| Ecolab | | | | | | | 19,600 | | | | 929,040 | | |
| Sigma-Aldrich Corp. | | | | | | | 18,100 | | | | 962,377 | | |
| | | | | | | | 1,891,417 | | |
| METALS & MINING | | | 0.5 | % | | | | | | | | | |
| Freeport-McMoRan Copper & Gold | | | | | | | 12,700 | | | | 914,146 | | |
| TOTAL MATERIALS | | | | | | | | | | | 2,805,563 | | |
| REAL ESTATE | | | 2.4 | % | | | | | | | | | |
| OFFICE | | | 0.5 | % | | | | | | | | | |
| Corporate Office Properties Trust | | | | | | | 27,400 | | | | 989,140 | | |
| SELF STORAGE | | | 0.8 | % | | | | | | | | | |
| Public Storage | | | | | | | 15,400 | | | | 1,509,508 | | |
See accompanying notes to financial statements.
12
COHEN & STEERS DIVIDEND VALUE FUND, INC.
SCHEDULE OF INVESTMENTS—(Continued)
August 31, 2010 (Unaudited)
| | | | | Number
of Shares | | Value | |
| SHOPPING CENTER—REGIONAL MALL | | | 1.1 | % | | | | | | | | | |
| Simon Property Group | | | | | | | 21,400 | | | $ | 1,935,630 | | |
| TOTAL REAL ESTATE | | | | | | | | | | | 4,434,278 | | |
| TECHNOLOGY | | | 6.8 | % | | | | | | | | | |
| SEMICONDUCTORS | | | 1.7 | % | | | | | | | | | |
| Intel Corp. | | | | | | | 50,400 | | | | 893,088 | | |
| Texas Instruments | | | | | | | 93,300 | | | | 2,148,699 | | |
| | | | | | | | 3,041,787 | | |
| SOFTWARE | | | 2.9 | % | | | | | | | | | |
| Microsoft Corp. | | | | | | | 116,300 | | | | 2,730,724 | | |
| Oracle Corp. | | | | | | | 121,800 | | | | 2,664,984 | | |
| | | | | | | | 5,395,708 | | |
| TELECOMMUNICATION EQUIPMENT | | | 2.2 | % | | | | | | | | | |
| Corning | | | | | | | 147,100 | | | | 2,306,528 | | |
| QUALCOMM | | | | | | | 48,100 | | | | 1,842,711 | | |
| | | | | | | | 4,149,239 | | |
| TOTAL TECHNOLOGY | | | | | | | | | | | 12,586,734 | | |
| TELECOMMUNICATION SERVICES | | | 4.0 | % | | | | | | | | | |
| AT&T | | | | | | | 145,000 | | | | 3,919,350 | | |
| China Mobile Ltd. (ADR) (Hong Kong) | | | | | | | 29,000 | | | | 1,488,280 | | |
| Verizon Communications | | | | | | | 66,500 | | | | 1,962,415 | | |
| | | | | | | | 7,370,045 | | |
| UTILITIES | | | 7.4 | % | | | | | | | | | |
| ELECTRIC UTILITIES | | | 2.1 | % | | | | | | | | | |
| NextEra Energy | | | | | | | 72,700 | | | | 3,906,171 | | |
| MULTI UTILITIES | | | 5.3 | % | | | | | | | | | |
| PG&E Corp. | | | | | | | 55,300 | | | | 2,585,828 | | |
| Sempra Energy | | | | | | | 64,000 | | | | 3,258,880 | | |
| Wisconsin Energy Corp. | | | | | | | 72,400 | | | | 4,035,576 | | |
| | | | | | | | 9,880,284 | | |
| TOTAL UTILITIES | | | | | | | | | | | 13,786,455 | | |
| TOTAL COMMON STOCK (Identified cost—$184,308,187) | | | | | | | | | | | 181,274,021 | | |
See accompanying notes to financial statements.
13
COHEN & STEERS DIVIDEND VALUE FUND, INC.
SCHEDULE OF INVESTMENTS—(Continued)
August 31, 2010 (Unaudited)
| | | | | Number
of Shares | | Value | |
| SHORT-TERM INVESTMENTS | | | 2.2 | % | | | | | | | |
| MONEY MARKET FUNDS | |
| Federated Government Obligation Fund, 0.07%b | | | | | | | 2,030,692 | | | $ | 2,030,692 | | |
| State Street Institutional Liquid Reserves, 0.27%b | | | | | | | 2,032,761 | | | | 2,032,761 | | |
TOTAL SHORT-TERM INVESTMENTS
(Identified cost—$4,063,453) | | | | | | | | | 4,063,453 | | |
| TOTAL INVESTMENTS (Identified cost—$188,371,640) | | | 99.9 | % | | | | | 185,337,474 | | |
| OTHER ASSETS IN EXCESS OF LIABILITIES | | | 0.1 | % | | | | | 119,356 | | |
| NET ASSETS | | | 100.0 | % | | | | $ | 185,456,830 | | |
Glossary of Portfolio Abbreviation
ADR American Depositary Receipt
Note: Percentages indicated are based on the net assets of the Fund.
a Non-income producing security.
b Rate quoted represents the seven day yield of the fund.
See accompanying notes to financial statements.
14
COHEN & STEERS DIVIDEND VALUE FUND, INC.
STATEMENT OF ASSETS AND LIABILITIES
August 31, 2010 (Unaudited)
| ASSETS: | |
| Investments in securities, at value (Identified cost—$188,371,640) | | $ | 185,337,474 | | |
| Cash | | | 40,623 | | |
| Receivable for: | |
| Investment securities sold | | | 908,562 | | |
| Dividends and interest | | | 466,169 | | |
| Fund shares sold | | | 395,537 | | |
| Other assets | | | 6,165 | | |
| Total Assets | | | 187,154,530 | | |
| LIABILITIES: | |
| Payable for: | |
| Investment securities purchased | | | 1,264,754 | | |
| Fund shares redeemed | | | 178,250 | | |
| Investment advisory fees | | | 96,202 | | |
| Administration fees | | | 6,537 | | |
| Directors' fees | | | 2,414 | | |
| Distribution fees | | | 2,340 | | |
| Shareholder servicing fees | | | 835 | | |
| Other liabilities | | | 146,368 | | |
| Total Liabilities | | | 1,697,700 | | |
| NET ASSETS | | $ | 185,456,830 | | |
| NET ASSETS consist of: | |
| Paid-in-capital | | $ | 223,051,253 | | |
| Accumulated undistributed net investment income | | | 338,569 | | |
| Accumulated net realized loss | | | (34,898,978 | ) | |
| Net unrealized depreciation | | | (3,034,014 | ) | |
| | | $ | 185,456,830 | | |
See accompanying notes to financial statements.
15
COHEN & STEERS DIVIDEND VALUE FUND, INC.
STATEMENT OF ASSETS AND LIABILITIES—(Continued)
August 31, 2010 (Unaudited)
| CLASS A SHARES: | |
| NET ASSETS | | $ | 59,679,972 | | |
| Shares issued and outstanding ($0.001 par value common stock outstanding) | | | 5,961,664 | | |
| Net asset value and redemption price per share | | $ | 10.01 | | |
| Maximum offering price per share ($10.01 ÷ 0.955)a | | $ | 10.48 | | |
| CLASS C SHARES: | |
| NET ASSETS | | $ | 36,632,562 | | |
| Shares issued and outstanding ($0.001 par value common stock outstanding) | | | 3,678,109 | | |
| Net asset value and offering price per shareb | | $ | 9.96 | | |
| CLASS I SHARES: | |
| NET ASSETS | | $ | 89,144,296 | | |
| Shares issued and outstanding ($0.001 par value common stock outstanding) | | | 8,897,542 | | |
| Net asset value, offering, and redemption price per share | | $ | 10.02 | | |
a On investments of $100,000 or more, the offering price is reduced.
b Redemption price per share is equal to the net asset value per share less any applicable deferred sales charge of 1% on shares held for less than one year.
See accompanying notes to financial statements.
16
COHEN & STEERS DIVIDEND VALUE FUND, INC.
STATEMENT OF OPERATIONS
For the Six Months Ended August 31, 2010 (Unaudited)
| Investment Income: | |
| Dividend income (net of $29,315 of foreign withholding tax) | | $ | 2,338,855 | | |
| Expenses: | |
| Investment advisory fees | | | 814,700 | | |
| Distribution fees—Class A | | | 85,228 | | |
| Distribution fees—Class C | | | 152,814 | | |
| Administration fees | | | 86,807 | | |
| Shareholder servicing fees—Class A | | | 34,091 | | |
| Shareholder servicing fees—Class C | | | 50,938 | | |
| Transfer agent fees and expenses | | | 57,414 | | |
| Professional fees | | | 38,814 | | |
| Registration and filing fees | | | 30,728 | | |
| Shareholder reporting expenses | | | 26,768 | | |
| Custodian fees and expenses | | | 19,486 | | |
| Directors' fees and expenses | | | 10,892 | | |
| Line of credit fees | | | 1,052 | | |
| Miscellaneous | | | 10,727 | | |
| Total Expenses | | | 1,420,459 | | |
| Reduction of Expenses (See Note 2) | | | (282,757 | ) | |
| Net Expenses | | | 1,137,702 | | |
| Net Investment Income | | | 1,201,153 | | |
| Net Realized and Unrealized Gain (Loss): | |
| Net realized loss on: | |
| Investments | | | (2,737,543 | ) | |
| Foreign currency transactions | | | (5,399 | ) | |
| Net realized loss | | | (2,742,942 | ) | |
| Net change in unrealized appreciation (depreciation) on: | |
| Investments | | | (10,709,315 | ) | |
| Foreign currency translations | | | 140 | | |
| Net change in unrealized appreciation (depreciation) | | | (10,709,175 | ) | |
| Net realized and unrealized loss | | | (13,452,117 | ) | |
| Net Decrease in Net Assets Resulting from Operations | �� | $ | (12,250,964 | ) | |
See accompanying notes to financial statements.
17
COHEN & STEERS DIVIDEND VALUE FUND, INC.
STATEMENT OF CHANGES IN NET ASSETS (Unaudited)
| | | For the
Six Months Ended
August 31, 2010 | | For the
Year Ended
February 28, 2010 | |
| Change in Net Assets: | |
| From Operations: | |
| Net investment income | | $ | 1,201,153 | | | $ | 2,357,421 | | |
| Net realized loss | | | (2,742,942 | ) | | | (4,608,436 | ) | |
| Net change in unrealized appreciation (depreciation) | | | (10,709,175 | ) | | | 56,178,368 | | |
Net increase (decrease) in net assets resulting from
operations | | | (12,250,964 | ) | | | 53,927,353 | | |
| Dividends to Shareholders from Net Investment Income: | |
| Class A | | | (343,248 | ) | | | (876,722 | ) | |
| Class C | | | (75,926 | ) | | | (315,583 | ) | |
| Class I | | | (646,343 | ) | | | (1,256,756 | ) | |
| Total dividends to shareholders | | | (1,065,517 | ) | | | (2,449,061 | ) | |
| Capital Stock Transactions: | |
Increase (decrease) in net assets from Fund share
transactions | | | (2,921,690 | ) | | | 29,001,166 | | |
| Total increase (decrease) in net assets | | | (16,238,171 | ) | | | 80,479,458 | | |
| Net Assets: | |
| Beginning of period | | | 201,695,001 | | | | 121,215,543 | | |
| End of perioda | | $ | 185,456,830 | | | $ | 201,695,001 | | |
a Includes undistributed net investment income of $338,569 and $202,933, respectively.
See accompanying notes to financial statements.
18
COHEN & STEERS DIVIDEND VALUE FUND, INC.
FINANCIAL HIGHLIGHTS (Unaudited)
The following table includes selected data for a share outstanding throughout each period and other performance information derived from the financial statements. It should be read in conjunction with the financial statements and notes thereto.
| | | Class A | |
| | | For the Six
Months Ended | | For the Year Ended February 28, | | For the Period
August 31, 2005b
through | |
| Per Share Operating Performance: | | August 31, 2010 | | 2010 | | 2009 | | 2008a | | 2007 | | February 28, 2006 | |
| Net asset value, beginning of period | | $ | 10.72 | | | $ | 7.59 | | | $ | 13.57 | | | $ | 13.99 | | | $ | 12.26 | | | $ | 11.46 | | |
| Income from investment operations: | |
| Net investment incomec | | | 0.06 | | | | 0.14 | | | | 0.20 | | | | 0.23 | | | | 0.22 | | | | 0.07 | | |
Net realized and unrealized
gain (loss) | | | (0.72 | ) | | | 3.13 | | | | (5.99 | ) | | | (0.17 | ) | | | 1.86 | | | | 0.77 | | |
Total from investment
operations | | | (0.66 | ) | | | 3.27 | | | | (5.79 | ) | | | 0.06 | | | | 2.08 | | | | 0.84 | | |
Less dividends and distributions
to shareholders from: | |
| Net investment income | | | (0.05 | ) | | | (0.14 | ) | | | (0.19 | ) | | | (0.21 | ) | | | (0.18 | ) | | | (0.04 | ) | |
| Net realized gain | | | — | | | | — | | | | — | | | | (0.28 | ) | | | (0.17 | ) | | | — | | |
Total dividends and
distributions
to shareholders | | | (0.05 | ) | | | (0.14 | ) | | | (0.19 | ) | | | (0.49 | ) | | | (0.35 | ) | | | (0.04 | ) | |
| Redemption fees retained by the Fund | | | 0.00 | d | | | 0.00 | d | | | 0.00 | d | | | 0.01 | | | | 0.00 | d | | | 0.00 | d | |
| Net increase (decrease) in net asset value | | | (0.71 | ) | | | 3.13 | | | | (5.98 | ) | | | (0.42 | ) | | | 1.73 | | | | 0.80 | | |
| Net asset value, end of period | | $ | 10.01 | | | $ | 10.72 | | | $ | 7.59 | | | $ | 13.57 | | | $ | 13.99 | | | $ | 12.26 | | |
| Total investment returne | | | –6.13 | %f | | | 43.41 | % | | | –43.14 | % | | | 0.33 | % | | | 17.12 | % | | | 7.29 | %f | |
| Ratios/Supplemental Data: | |
| Net assets, end of period (in millions) | | $ | 59.7 | | | $ | 71.3 | | | $ | 45.2 | | | $ | 61.9 | | | $ | 41.7 | | | $ | 6.6 | | |
Ratio of expenses to average daily net
assets (before expense reduction) | | | 1.43 | %g,h | | | 1.51 | %h | | | 1.57 | % | | | 1.63 | % | | | 2.33 | %i | | | 7.02 | %g | |
Ratio of expenses to average daily net
assets (net of expense reduction) | | | 1.15 | %g,h | | | 1.15 | %h | | | 1.15 | % | | | 1.00 | % | | | 1.00 | % | | | 1.28 | %g | |
Ratio of net investment income (loss)
to average daily net assets (before
expense reduction) | | | 0.86 | %g | | | 1.02 | % | | | 1.35 | % | | | 0.95 | % | | | 0.30 | % | | | (4.66 | )%g | |
Ratio of net investment income to
average daily net assets (net of
expense reduction) | | | 1.14 | %g | | | 1.38 | % | | | 1.76 | % | | | 1.59 | % | | | 1.63 | % | | | 1.08 | %g | |
| Portfolio turnover rate | | | 36 | %f | | | 37 | % | | | 43 | % | | | 52 | % | | | 30 | % | | | 8 | %f | |
a For the year ended February 29.
b Commencement of operations.
c Calculation based on average shares outstanding.
d Amount is less than $0.005.
e Does not reflect sales charges, which would reduce return.
f Not annualized.
g Annualized.
h Consists of class specific expense ratio and Fund level ratio for non-class specific expenses.
i Due to the significant growth of net assets on a small asset base, the expense ratio, when averaged over the year, differs from the Fund's other classes by an amount other than class specific expenses. Typically, the ratios between classes will only differ by the class specific expenses (i.e., distribution fees and shareholder servicing fees).
See accompanying notes to financial statements.
19
COHEN & STEERS DIVIDEND VALUE FUND, INC.
FINANCIAL HIGHLIGHTS (Unaudited)—(Continued)
| | | Class C | |
| | | For the Six
Months Ended | | For the Year Ended February 28, | | For the Period
August 31, 2005b
through | |
| Per Share Operating Performance: | | August 31, 2010 | | 2010 | | 2009 | | 2008a | | 2007 | | February 28, 2006 | |
| Net asset value, beginning of period | | $ | 10.67 | | | $ | 7.55 | | | $ | 13.50 | | | $ | 13.94 | | | $ | 12.23 | | | $ | 11.46 | | |
| Income from investment operations: | |
| Net investment incomec | | | 0.03 | | | | 0.07 | | | | 0.13 | | | | 0.14 | | | | 0.14 | | | | 0.03 | | |
Net realized and unrealized
gain (loss) | | | (0.72 | ) | | | 3.13 | | | | (5.96 | ) | | | (0.18 | ) | | | 1.86 | | | | 0.77 | | |
Total from investment
operations | | | (0.69 | ) | | | 3.20 | | | | (5.83 | ) | | | (0.04 | ) | | | 2.00 | | | | 0.80 | | |
Less dividends and distributions
to shareholders from: | |
| Net investment income | | | (0.02 | ) | | | (0.08 | ) | | | (0.12 | ) | | | (0.14 | ) | | | (0.12 | ) | | | (0.03 | ) | |
| Net realized gain | | | — | | | | — | | | | — | | | | (0.28 | ) | | | (0.17 | ) | | | — | | |
Total dividends and
distributions
to shareholders | | | (0.02 | ) | | | (0.08 | ) | | | (0.12 | ) | | | (0.42 | ) | | | (0.29 | ) | | | (0.03 | ) | |
| Redemption fees retained by the Fund | | | 0.00 | d | | | 0.00 | d | | | 0.00 | d | | | 0.02 | | | | 0.00 | d | | | 0.00 | d | |
| Net increase (decrease) in net asset value | | | (0.71 | ) | | | 3.12 | | | | (5.95 | ) | | | (0.44 | ) | | | 1.71 | | | | 0.77 | | |
| Net asset value, end of period | | $ | 9.96 | | | $ | 10.67 | e | | $ | 7.55 | | | $ | 13.50 | | | $ | 13.94 | | | $ | 12.23 | | |
| Total investment returnf | | | –6.38 | %e,g | | | 42.43 | %e | | | –43.50 | % | | | –0.35 | % | | | 16.40 | % | | | 6.96 | %g | |
| Ratios/Supplemental Data: | |
| Net assets, end of period (in millions) | | $ | 36.6 | | | $ | 40.8 | | | $ | 31.4 | | | $ | 41.2 | | | $ | 14.7 | | | $ | 3.8 | | |
Ratio of expenses to average daily net
assets (before expense reduction) | | | 2.08 | %h,i | | | 2.16 | %i | | | 2.22 | % | | | 2.27 | % | | | 3.21 | %j | | | 7.93 | %h | |
Ratio of expenses to average daily net
assets (net of expense reduction) | | | 1.80 | %h,i | | | 1.80 | %i | | | 1.80 | % | | | 1.65 | % | | | 1.65 | % | | | 1.95 | %h | |
Ratio of net investment income (loss)
to average daily net assets (before
expense reduction) | | | 0.22 | %h | | | 0.39 | % | | | 0.72 | % | | | 0.33 | % | | | (0.50 | )% | | | (5.53 | )%h | |
Ratio of net investment income to
average daily net assets (net of
expense reduction) | | | 0.49 | %h | | | 0.75 | % | | | 1.14 | % | | | 0.96 | % | | | 1.06 | % | | | 0.45 | %h | |
| Portfolio turnover rate | | | 36 | %g | | | 37 | % | | | 43 | % | | | 52 | % | | | 30 | % | | | 8 | %g | |
a For the year ended February 29.
b Commencement of operations.
c Calculation based on average shares outstanding.
d Amount is less than $0.005.
e The February 28, 2010 net asset value reflects adjustments in accordance with accounting principles generally accepted in the United States of America and as such, the net asset value for financial reporting purposes and the returns that would be based upon the net asset value would differ from the net asset value and return reported on February 28, 2010.
f Does not reflect sales charges, which would reduce return.
g Not annualized.
h Annualized.
i Consists of class specific expense ratio and Fund level ratio for non-class specific expenses.
j Due to the significant growth of net assets on a small asset base, the expense ratio, when averaged over the year, differs from the Fund's other classes by an amount other than class specific expenses. Typically, the ratios between classes will only differ by the class specific expenses (i.e., distribution fees and shareholder servicing fees).
See accompanying notes to financial statements.
20
COHEN & STEERS DIVIDEND VALUE FUND, INC.
FINANCIAL HIGHLIGHTS (Unaudited)—(Continued)
| | | Class I | |
| | | For the Six
Months Ended | | For the Year Ended February 28, | | For the Period
August 31, 2005b
through | |
| Per Share Operating Performance: | | August 31, 2010 | | 2010 | | 2009 | | 2008a | | 2007 | | February 28, 2006 | |
| Net asset value, beginning of period | | $ | 10.73 | | | $ | 7.59 | | | $ | 13.58 | | | $ | 14.00 | | | $ | 12.27 | | | $ | 11.46 | | |
| Income from investment operations: | |
| Net investment incomec | | | 0.08 | | | | 0.17 | | | | 0.24 | | | | 0.28 | | | | 0.27 | | | | 0.09 | | |
Net realized and unrealized
gain (loss) | | | (0.72 | ) | | | 3.15 | | | | (5.99 | ) | | | (0.18 | ) | | | 1.87 | | | | 0.76 | | |
Total from investment
operations | | | (0.64 | ) | | | 3.32 | | | | (5.75 | ) | | | 0.10 | | | | 2.14 | | | | 0.85 | | |
Less dividends and distributions
to shareholders from: | |
| Net investment income | | | (0.07 | ) | | | (0.18 | ) | | | (0.24 | ) | | | (0.26 | ) | | | (0.24 | ) | | | (0.04 | ) | |
| Net realized gain | | | — | | | | — | | | | — | | | | (0.28 | ) | | | (0.17 | ) | | | — | | |
Total dividends and
distributions
to shareholders | | | (0.07 | ) | | | (0.18 | ) | | | (0.24 | ) | | | (0.54 | ) | | | (0.41 | ) | | | (0.04 | ) | |
| Redemption fees retained by the Fund | | | 0.00 | d | | | 0.00 | d | | | 0.00 | d | | | 0.02 | | | | 0.00 | d | | | 0.00 | d | |
| Net increase (decrease) in net asset value | | | (0.71 | ) | | | 3.14 | | | | (5.99 | ) | | | (0.42 | ) | | | 1.73 | | | | 0.81 | | |
| Net asset value, end of period | | $ | 10.02 | | | $ | 10.73 | | | $ | 7.59 | | | $ | 13.58 | | | $ | 14.00 | | | $ | 12.27 | | |
| Total investment return | | | –5.96 | %e | | | 44.03 | % | | | –42.98 | % | | | 0.65 | % | | | 17.63 | % | | | 7.42 | %e | |
| Ratios/Supplemental Data: | |
| Net assets, end of period (in millions) | | $ | 89.1 | | | $ | 89.5 | | | $ | 44.6 | | | $ | 21.2 | | | $ | 9.4 | | | $ | 3.7 | | |
Ratio of expenses to average daily net
assets (before expense reduction) | | | 1.08 | %f,g | | | 1.16 | %g | | | 1.23 | % | | | 1.28 | % | | | 2.27 | %h | | | 11.99 | %f | |
Ratio of expenses to average daily net
assets (net of expense reduction) | | | 0.80 | %f,g | | | 0.80 | %g | | | 0.80 | % | | | 0.65 | % | | | 0.65 | % | | | 1.07 | %f | |
Ratio of net investment income (loss)
to average daily net assets (before
expense reduction) | | | 1.23 | %f | | | 1.36 | % | | | 1.81 | % | | | 1.31 | % | | | 0.45 | % | | | (9.43 | )%f | |
Ratio of net investment income to
average daily net assets (net of
expense reduction) | | | 1.50 | %f | | | 1.72 | % | | | 2.24 | % | | | 1.94 | % | | | 2.06 | % | | | 1.49 | %f | |
| Portfolio turnover rate | | | 36 | %e | | | 37 | % | | | 43 | % | | | 52 | % | | | 30 | % | | | 8 | %e | |
a For the year ended February 29.
b Commencement of operations.
c Calculation based on average shares outstanding.
d Amount is less than $0.005.
e Not annualized.
f Annualized.
g Reflects Fund level ratio.
h Due to the significant growth of net assets on a small asset base, the expense ratio, when averaged over the year, differs from the Fund's other classes by an amount other than class specific expenses. Typically, the ratios between classes will only differ by the class specific expenses (i.e., distribution fees and shareholder servicing fees).
See accompanying notes to financial statements.
21
COHEN & STEERS DIVIDEND VALUE FUND, INC.
NOTES TO FINANCIAL STATEMENTS (Unaudited)
Note 1. Significant Accounting Policies
Cohen & Steers Dividend Value Fund, Inc. (the Fund) was incorporated under the laws of the State of Maryland on November 9, 2004 and is registered under the Investment Company Act of 1940, as amended, as a nondiversified, open-end management investment company. The Fund's investment objectives are to provide a relatively high level of current income and long term growth of income and capital appreciation. Investment operations commenced on August 31, 2005. The authorized shares of the Fund are divided into three classes designated Class A, C and I shares. Each of the Fund's shares has equal dividend, liquidation and voting rights (except for matters relating to distributions and shareholder servicing of such shares).
The following is a summary of significant accounting policies consistently followed by the Fund in the preparation of its financial statements. The policies are in conformity with accounting principles generally accepted in the United States of America (GAAP). The preparation of the financial statements in accordance with GAAP requires management to make estimates and assumptions that affect the reported amounts of assets and liabilities at the date of the financial statements and the reported amounts of income and expenses during the reporting period. Actual results could differ from those estimates.
Portfolio Valuation: Investments in securities that are listed on the New York Stock Exchange are valued, except as indicated below, at the last sale price reflected at the close of the New York Stock Exchange on the business day as of which such value is being determined. If there has been no sale on such day, the securities are valued at the mean of the closing bid and asked prices for the day or, if no asked price is available, at the bid price.
Securities not listed on the New York Stock Exchange but listed on other domestic or foreign securities exchanges are valued in a similar manner. Securities traded on more than one securities exchange are valued at the last sale price on the business day as of which such value is being determined as reflected on the tape at the close of the exchange representing the principal market for such securities. If after the close of a foreign market, but prior to the close of business on the day the securities are being valued, market conditions change significantly, certain foreign securities may be fair valued pursuant to procedures established by the Board of Directors.
Readily marketable securities traded in the over-the-counter market, including listed securities whose primary market is believed by Cohen & Steers Capital Management, Inc. (the advisor) to be over-the-counter, are valued at the official closing prices as reported by sources as the Board of Directors deem appropriate to reflect their fair market value. If there has been no sale on such day, the securities are valued at the mean of the closing bid and asked prices for the day, or if no asked price is available, at the bid price. However, certain fixed-income securities may be valued on the basis of prices provided by a pricing service when such prices are believed by the Board of Directors to reflect the fair market value of such securities.
Securities for which market prices are unavailable, or securities for which the advisor determines that the bid and/or asked price does not reflect market value, will be valued at fair value pursuant to procedures approved by
22
COHEN & STEERS DIVIDEND VALUE FUND, INC.
NOTES TO FINANCIAL STATEMENTS (Unaudited)—(Continued)
the Fund's Board of Directors. Circumstances in which market prices may be unavailable include, but are not limited to, when trading in a security is suspended, the exchange on which the security is traded is subject to an unscheduled close or disruption or material events occur after the close of the exchange on which the security is principally traded. In these circumstances, the Fund determines fair value in a manner that fairly reflects the market value of the security on the valuation date based on consideration of any information or factors it deems appropriate. These may include, but are not limited to, recent transactions in comparable securities, information relating to the specific security and developments in the markets.
The Fund's use of fair value pricing may cause the net asset value of Fund shares to differ from the net asset value that would be calculated using market quotations. Fair value pricing involves subjective judgments and it is possible that the fair value determined for a security may be materially different than the value that could be realized upon the sale of that security.
Short-term debt securities with a maturity date of 60 days or less are valued at amortized cost, which approximates value. Investments in open-end mutual funds are valued at their closing net asset value.
Fair value is defined as the price that the Fund would receive to sell an investment or pay to transfer a liability in an orderly transaction with an independent buyer in the principal market, or in the absence of a principal market the most advantageous market for the investment or liability. The hierarchy of inputs that are used in determining the fair value of the Fund's investments is summarized below.
• Level 1—quoted prices in active markets for identical investments
• Level 2—other significant observable inputs (including quoted prices for similar investments, interest rates, credit risk, etc.)
• Level 3—significant unobservable inputs (including the Fund's own assumptions in determining the fair value of investments)
The inputs or methodology used for valuing securities are not necessarily an indication of the risk associated with investing in those securities.
The following is a summary of the inputs used as of August 31, 2010 in valuing the Fund's investments carried at value:
| | | Total | | Quoted Prices In
Active Market for
Identical Assets
(Level 1) | | Significant
Other Observable
Inputs
(Level 2) | | Significant
Unobservable
Inputs
(Level 3) | |
| Common Stock | | $ | 181,274,021 | | | $ | 181,274,021 | | | $ | — | | | | — | | |
| Money Market Funds | | | 4,063,453 | | | | — | | | | 4,063,453 | | | | — | | |
| Total Investments | | $ | 185,337,474 | | | $ | 181,274,021 | | | $ | 4,063,453 | | | | — | | |
23
COHEN & STEERS DIVIDEND VALUE FUND, INC.
NOTES TO FINANCIAL STATEMENTS (Unaudited)—(Continued)
Security Transactions, Investment Income and Expense Allocations: Security transactions are recorded on trade date. Realized gains and losses on investments sold are recorded on the basis of identified cost. Interest income is recorded on the accrual basis. Discounts are accreted and premiums are amortized over the life of the respective securities. Dividend income is recorded on the ex-dividend date, except for certain dividends on foreign securities, which are recorded as soon as the Fund is informed after the ex-dividend date. Income, expenses (other than expenses attributable to a specific class), and realized and unrealized gains or losses on investments are allocated to each class of shares based on its relative net assets.
Foreign Currency Translations: The books and records of the Fund are maintained in U.S. dollars as follows: (1) the foreign currency market value of investment securities, other assets and liabilities and foreign currency contracts are translated at the exchange rates prevailing at the end of the period; and (2) purchases, sales, income and expenses are translated at the exchange rates prevailing on the respective dates of such transactions. The resultant exchange gains and losses are recorded as realized and unrealized gain/loss on foreign exchange transactions. Pursuant to U.S. federal income tax regulations, certain foreign exchange gains/losses included in realized and unrealized gain/loss are included in or are a reduction of ordinary income for federal income tax purposes. The Fund does not isolate that portion of the results of operations arising as a resul t of changes in the foreign exchange rates from the changes in the market prices of the securities.
Foreign Securities: The Fund may directly purchase securities of foreign issuers. Investing in securities of foreign issuers involves special risks not typically associated with investing in securities of U.S. issuers. The risks include possible revaluation of currencies, the ability to repatriate funds, less complete financial information about companies and possible future adverse political and economic developments. Moreover, securities of many foreign issuers and their markets may be less liquid and their prices more volatile than those of securities of comparable U.S. issuers.
Dividends and Distributions to Shareholders: Dividends from net investment income and capital gain distributions are determined in accordance with U.S. federal income tax regulations, which may differ from GAAP. Dividends from net investment income, if any, are declared and paid quarterly. Net realized capital gains, unless offset by any available capital loss carryforward, are typically distributed to shareholders at least annually. Dividends and distributions to shareholders are recorded on the ex-dividend date and are automatically reinvested in full and fractional shares of the Fund based on the net asset value per share at the close of business on the payable date unless the shareholder has elected to have them paid in cash.
Income Taxes: It is the policy of the Fund to continue to qualify as a regulated investment company, if such qualification is in the best interest of the shareholders, by complying with the requirements of Subchapter M of the Internal Revenue Code applicable to regulated investment companies, and by distributing substantially all of its taxable earnings to its shareholders. Accordingly, no provision for federal income or excise tax is necessary.
24
COHEN & STEERS DIVIDEND VALUE FUND, INC.
NOTES TO FINANCIAL STATEMENTS (Unaudited)—(Continued)
Management has analyzed the Fund's tax positions taken on federal income tax returns as well as its tax positions in non-U.S. jurisdictions where it trades for all open tax years and has concluded that as of August 31, 2010, no provisions for income tax would be required in the Fund's financial statements. The Fund's tax positions for the tax years for which the applicable statutes of limitations have not expired are subject to examination by the Internal Revenue Service, state departments of revenue and by foreign tax authorities.
Note 2. Investment Advisory and Administration Fees and Other Transactions with Affiliates
Investment Advisory Fees: The advisor serves as the Fund's investment advisor pursuant to an investment advisory agreement (the investment advisory agreement). Under the terms of the investment advisory agreement, the advisor provides the Fund with day-to-day investment decisions and generally manages the Fund's investments in accordance with the stated policies of the Fund, subject to the supervision of the Board of Directors.
For the services provided to the Fund, the advisor receives a fee, accrued daily and paid monthly, at the annual rate of 0.80% of the average daily net assets of the Fund for the first $1.5 billion and 0.70% thereafter of the average daily net assets of the Fund.
For the six months ended August 31, 2010, and through June 30, 2011, the advisor has contractually agreed to waive its fee and/or reimburse the Fund for expenses incurred to the extent necessary to maintain the Fund's operating expenses at 1.15% for Class A shares, 1.80% for Class C shares and 0.80% for Class I shares.
Administration Fees: The Fund has entered into an administration agreement with the advisor under which the advisor performs certain administrative functions for the Fund and receives a fee, accrued daily and paid monthly, at the annual rate of 0.04% of the Fund's average daily net assets. For the six months ended August 31, 2010, the Fund paid the advisor $40,735 in fees under this administration agreement. Additionally, the Fund pays State Street Bank and Trust Company as sub-administrator under a fund accounting and administration agreement.
Distribution Fees: Shares of the Fund are distributed by Cohen & Steers Securities, LLC (the distributor), an affiliated entity of the advisor. The Fund has adopted a distribution plan (the plan) pursuant to Rule 12b-1 under the Investment Company Act of 1940. The plan provides that the Fund will pay the distributor a fee accrued daily and paid monthly at an annual rate of up to 0.25% of the average daily net assets attributable to the Class A shares and up to 0.75% of the average daily net assets attributable to the Class C shares.
For six months ended August 31, 2010, the Fund has been advised that the distributor received $1,854 in sales commissions from the sale of Class A shares and that the distributor also received $3,736 of contingent deferred sales charges relating to redemptions of Class C shares. The distributor has advised the Fund that proceeds from the contingent deferred sales charges on this class are paid to the distributor and are used by the distributor to defray its expenses related to providing distribution related services to the Fund in connection with the sale of this class,
25
COHEN & STEERS DIVIDEND VALUE FUND, INC.
NOTES TO FINANCIAL STATEMENTS (Unaudited)—(Continued)
including payments to dealers and other financial intermediaries for selling this class and interest and other financing costs associated with this class.
Shareholder Servicing Fees: For shareholder services, the Fund pays the distributor a fee, accrued daily and paid monthly, at an annual rate of up to 0.10% of the average daily net asset value of the Fund's Class A shares and up to 0.25% of the average daily net asset value of the Fund's Class C shares. The distributor is responsible for paying qualified financial institutions for shareholder services.
Directors' and Officers' Fees: Certain directors and officers of the Fund are also directors, officers, and/or employees of the advisor. The Fund does not pay compensation to any affiliated directors and officers except for the Chief Compliance Officer, who received $1,737 from the Fund for the six months ended August 31, 2010.
Note 3. Purchases and Sales of Securities
Purchases and sales of securities, excluding short-term investments, for the six months ended August 31, 2010, totaled $70,832,531 and $71,195,016, respectively.
Note 4. Income Tax Information
As of August 31, 2010, the federal tax cost and net unrealized depreciation on securities were as follows:
| Gross unrealized appreciation | | $ | 8,620,149 | | |
| Gross unrealized depreciation | | | (11,654,315 | ) | |
| Net unrealized depreciation | | $ | (3,034,166 | ) | |
| Cost for federal income tax purposes | | $ | 188,371,640 | | |
As of February 28, 2010, the Fund had a net capital loss carryforward of $30,227,246, of which $14,244,984 will expire on February 28, 2017 and $15,982,262 will expire on February 28, 2018. This carryforward may be used to offset future capital gains to the extent provided by regulations
26
COHEN & STEERS DIVIDEND VALUE FUND, INC.
NOTES TO FINANCIAL STATEMENTS (Unaudited)—(Continued)
Note 5. Capital Stock
The Fund is authorized to issue 200 million shares of capital stock, at a par value of $0.001 per share. The Board of Directors of the Fund may increase or decrease the aggregate number of shares of common stock that the Fund has authority to issue. Transactions in Fund shares were as follows:
| | | For the
Six Months Ended
August 31, 2010 | | For the
Year Ended
February 28, 2010 | |
| | | Shares | | Amount | | Shares | | Amount | |
| CLASS A: | |
| Sold | | | 617,516 | | | $ | 6,603,823 | | | | 2,762,197 | | | $ | 26,934,777 | | |
Issued as reinvestment of
dividends | | | 18,871 | | | | 195,433 | | | | 58,131 | | | | 549,795 | | |
| Redeemed | | | (1,329,639 | ) | | | (14,229,077 | ) | | | (2,122,135 | ) | | | (20,134,990 | ) | |
Redemption fees retained by
the Funda | | | — | | | | 2,021 | | | | — | | | | 6,422 | | |
| Net increase (decrease) | | | (693,252 | ) | | $ | (7,427,800 | ) | | | 698,193 | | | $ | 7,356,004 | | |
| CLASS C: | |
| Sold | | | 382,470 | | | $ | 4,129,421 | | | | 1,210,874 | | | $ | 11,938,110 | | |
Issued as reinvestment of
dividends | | | 2,010 | | | | 20,263 | | | | 10,252 | | | | 95,171 | | |
| Redeemed | | | (533,884 | ) | | | (5,705,486 | ) | | | (1,550,864 | ) | | | (14,764,657 | ) | |
Redemption fees retained by
the Funda | | | — | | | | 1,162 | | | | — | | | | 3,994 | | |
| Net decrease | | | (149,404 | ) | | $ | (1,554,640 | ) | | | (329,738 | ) | | $ | (2,727,382 | ) | |
| CLASS I: | |
| Sold | | | 1,472,448 | | | $ | 15,942,964 | | | | 3,720,388 | | | $ | 36,284,0477 | | |
Issued as reinvestment of
dividends | | | 56,580 | | | | 584,866 | | | | 118,881 | | | | 1,144,167 | | |
| Redeemed | | | (977,579 | ) | | | (10,469,843 | ) | | | (1,375,612 | ) | | | (13,063,821 | ) | |
Redemption fees retained by
the Funda | | | — | | | | 2,763 | | | | — | | | | 8,151 | | |
| Net increase | | | 551,449 | | | $ | 6,060,750 | | | | 2,463,657 | | | $ | 24,372,544 | | |
a The Fund may charge a 2% redemption fee on shares sold within 60 days of the time of purchase. Redemption fees are paid directly to the Fund.
27
COHEN & STEERS DIVIDEND VALUE FUND, INC.
NOTES TO FINANCIAL STATEMENTS (Unaudited)—(Continued)
Note 6. Borrowings
The Fund, in conjunction with other Cohen & Steers funds, is a party to a $200,000,000 syndicated credit agreement (the credit agreement) with State Street Bank and Trust Company, as administrative agent and operations agent, and the lenders identified in the credit agreement, which expires January 28, 2011. The Fund pays a commitment fee of 0.15% per annum on its proportionate share of the unused portion of the credit agreement.
During the six months ended August 31, 2010, the Fund did not borrow under the credit agreement.
Note 7. Other
In the normal course of business, the Fund enters into contracts that provide general indemnifications. The Fund's maximum exposure under these arrangements is dependent on claims that may be made against the Fund in the future and, therefore, cannot be estimated; however, based on experience, the risk of material loss from such claims is considered remote.
28
COHEN & STEERS DIVIDEND VALUE FUND, INC.
OTHER INFORMATION
A description of the policies and procedures that the Fund uses to determine how to vote proxies relating to portfolio securities is available (i) without charge, upon request, by calling 800-330-7348, (ii) on our Web site at cohenandsteers.com or (iii) on the Securities and Exchange Commission's Web site at http://www.sec.gov. In addition, the Fund's proxy voting record for the most recent 12-month period ended June 30 is available (i) without charge, upon request, by calling 800-330-7348 or (ii) on the SEC's Web site at http://www.sec.gov.
The Fund files its complete schedule of portfolio holdings with the SEC for the first and third quarters of each fiscal year on Form N-Q. The Fund's Forms N-Q are available (i) without charge, upon request by calling 800-330-7348, or (ii) on the SEC's Web site at http://www.sec.gov. In addition, the Forms N-Q may be reviewed and copied at the SEC's Public Reference Room in Washington, DC. Information on the operation of the Public Reference Room may be obtained by calling 800-SEC-0330.
Please note that the distributions paid by the Fund to shareholders are subject to recharacterization for tax purposes. The Fund may also pay distributions in excess of the Fund's net investment company taxable income and this excess would be a tax-free return of capital distributed from the Fund's assets. The final tax treatment of all distributions is reported to shareholders on their 1099-DIV forms, which are mailed after the close of each calendar year.
APPROVAL OF INVESTMENT ADVISORY AGREEMENT
The Board of Directors of the Fund, including a majority of the directors who are not parties to the Fund's investment advisory agreement (the "Advisory Agreement"), or interested persons of any such party ("Independent Directors"), has the responsibility under the Investment Company Act of 1940 to approve the Fund's Advisory Agreement for its initial two year term and its continuation annually thereafter at a meeting of the Board of Directors called for the purpose of voting on the approval or continuation. At a meeting held in person on June 22-23, 2010, the Advisory Agreement was discussed and was unanimously continued for a term ending June 30, 2011 by the Fund's Board of Directors, including the Independent Directors. The Independent Directors were represented by independent counsel who assisted them in their deliberations during the meeting and executive session.
In considering whether to continue the Advisory Agreement, the Board of Directors reviewed materials provided by the Fund's investment advisor (the "Investment Advisor") and Fund counsel which included, among other things, fee, expense and performance information compared to peer funds ("Peer Funds") and performance comparison to a larger category universe, prepared by an independent data provider; summary information prepared by the Investment Advisor; and a memorandum outlining the legal duties of the Board of Directors. The Board of Directors also spoke directly with representatives of the independent data provider and met with investment advisory personnel. In addition, the Board of Directors considered information provided from time to time by the Investment Advisor throughout the year at meetings of the Board of Directors, including presentations by portfolio
29
COHEN & STEERS DIVIDEND VALUE FUND, INC.
managers relating to the investment performance of the Fund and the investment strategies used in pursuing the Fund's objective. In particular, the Board of Directors considered the following:
(i) The nature, extent and quality of services provided by the Investment Advisor: The Board of Directors reviewed the services that the Investment Advisor provides to the Fund, including, but not limited to, making the day-to-day investment decisions for the Fund, and generally managing the Fund's investments in accordance with the stated policies of the Fund. The Board of Directors also discussed with officers and portfolio managers of the Fund the types of transactions that were being done on behalf of the Fund. Additionally, the Board of Directors took into account the services provided by the Investment Advisor to its other funds, including those that have investment objectives and strategies similar to the Fund. The Board of Directors next considered the education, background and experience of the Investment Advisor's personnel, noting particularly that the favorable history and reputation of the portfolio managers for the Fund has had, and would likely continue to have, a favorable impact on the Fund. The Board of Directors further noted the Investment Advisor's ability to attract qualified and experienced personnel. After consideration of the above factors, among others, the Board of Directors concluded that the nature, extent and quality of services provided by the Investment Advisor are adequate and appropriate.
(ii) Investment performance of the Fund and the Investment Advisor: The Board of Directors considered the investment performance of the Fund compared to Peer Funds and compared to a relevant benchmark. The peer group selected by the independent data provider included large cap core funds. The Board of Directors noted that the Fund underperformed the medians of the Peer Funds for the year-to-date and one-year periods ended March 31, 2010, ranking in the fifth quintile in each period, and also underperformed the benchmark over such periods. The Board of Directors also noted that Fund outperformed the median of the Peer Funds, ranking in the second quintile, and outperformed the benchmark for the three-year period ended March 31, 2010. The Board of Directors engaged in discussions with the Investment Advisor regarding the contributors and detractors to the Fund's per formance during the periods. The Board of Directors also considered supplemental information provided by the Investment Advisor, including a narrative summary of various factors affecting performance, and the Investment Advisor's performance in managing other funds that invest in real estate, large cap and dividend paying securities. The Board of Directors determined to closely monitor the Fund's performance and requested that the Investment Advisor provide updates for this purpose.
(iii) Cost of the services provided and profits realized by the Investment Advisor from the relationship with the Fund: Next, the Board of Directors considered the advisory fees and administrative fees payable by the Fund as well as total expense ratios. The Board of Directors noted that the Fund's actual advisory fee was lower than the Peer Funds' median while the Fund's contractual advisory fee was higher than the Peer Funds' median, ranking the Fund in the first and fourth quintiles, respectively. The Board of Directors further noted that the Fund's overall total expense ratio was lower than the Peer Funds' median, ranking the Fund in the first quintile. The Board of Directors considered that the Fund's overall net expense ratio also ranked in the first quintile versus the large cap value peer group. The Board of Directors considered that the Investment Advisor continues to waive its fees and reimburse expenses to limit overall operating expenses of the Fund. The Board of Directors then considered the
30
COHEN & STEERS DIVIDEND VALUE FUND, INC.
administrative services provided by the Investment Advisor, including compliance and accounting services, and further noted that the Fund charges an administration fee payable to the Investment Advisor. In light of the considerations above, the Board of Directors concluded that the Fund's expense structure was satisfactory.
The Board of Directors also reviewed information regarding the profitability to the Investment Advisor of its relationship with the Fund. The Board of Directors considered the level of the Investment Advisor's profits and whether the profits were reasonable for the Investment Advisor. The Board of Directors noted that the Investment Advisor is currently waiving its fee and/or reimbursing expenses of the Fund. The Board of Directors took into consideration other benefits to be derived by the Investment Advisor in connection with the Advisory Agreement, noting particularly the research and related services, within the meaning of Section 28(e) of the Securities Exchange Act of 1934, as amended, that the Investment Advisor receives by allocating the Fund's brokerage transactions. The Board of Directors also considered the fees received by the Investment Advisor under the Administration Agreement, and noted the significant services received, such as compliance, accounting and operational services and furnishing office space and facilities for the Fund, and providing persons satisfactory to the Board of Directors to serve as officers of the Fund, and that these services were beneficial to the Fund. The Board of Directors noted that because of the Fund's small size, the operating expenses continue to be subsidized, and the Fund is not yet profitable.
(iv) The extent to which economies of scale would be realized as the Fund grows and whether fee levels would reflect such economies of scale: The Board of Directors noted that the Fund's advisory fee schedule contains a breakpoint of 10 basis points once the Fund's assets reached $1.5 billion. The Board of Directors considered the Fund's asset size and determined that there were not at this time significant economies of scale that were not being shared with shareholders.
(v) Comparison of services rendered and fees paid to those under other investment advisory contracts, such as contracts of the same and other investment advisers or other clients: As discussed above in (iii), the Board of Directors compared the fees paid under the Advisory Agreement to those under other investment advisory contracts of other investment advisers managing Peer Funds. The Board of Directors also considered the services rendered, fees paid and profitability under the Advisory Agreements to the Investment Advisor's other management agreements and advisory contracts with institutional and other clients with similar investment mandates, including subadvised mutual funds and proprietary funds. The Board of Directors also considered the entrepreneurial risk and financial exposure assumed by the Investment Advisor in developing and managing the Fund that th e Investment Advisor does not with institutional and other clients. The Board of Directors determined that on a comparative basis the fees under the Advisory Agreement were reasonable in relation to the services provided.
No single factor was cited as determinative to the decision of the Board of Directors. Rather, after weighing all of the considerations and conclusions discussed above, the Board of Directors, including the Independent Directors, unanimously approved the continuation of the Advisory Agreement.
31
COHEN & STEERS DIVIDEND VALUE FUND, INC.
Meet the Cohen & Steers family of open-end funds:
COHEN & STEERS
GLOBAL REALTY SHARES
• Designed for investors seeking total return, investing primarily in global real estate equity securities
• Symbols: CSFAX, CSFBX*, CSFCX, CSSPX
COHEN & STEERS
INSTITUTIONAL GLOBAL REALTY SHARES
• Designed for institutional investors seeking total return, investing primarily in global real estate securities
• Symbol: GRSIX
COHEN & STEERS
REALTY SHARES
• Designed for investors seeking total return, investing primarily in REITs
• Symbol: CSRSX
COHEN & STEERS
INSTITUTIONAL REALTY SHARES
• Designed for institutional investors seeking total return, investing primarily in REITs
• Symbol: CSRIX
COHEN & STEERS
REALTY INCOME FUND
• Designed for investors seeking maximum total return, investing primarily in real estate securities with an emphasis on both income and capital appreciation
• Symbols: CSEIX, CSBIX*, CSCIX, CSDIX
COHEN & STEERS
INTERNATIONAL REALTY FUND
• Designed for investors seeking total return, investing primarily in international real estate securities
• Symbols: IRFAX, IRFCX, IRFIX
COHEN & STEERS
ASIA PACIFIC REALTY SHARES
• Designed for investors seeking total return, investing primarily in real estate securities located in the Asia Pacific region
• Symbols: APFAX, APFCX, APFIX
COHEN & STEERS
GLOBAL INFRASTRUCTURE FUND
• Designed for investors seeking total return, investing primarily in global infrastructure securities
• Symbols: CSUAX, CSUBX*, CSUCX, CSUIX
COHEN & STEERS
DIVIDEND VALUE FUND
• Designed for investors seeking high current income and long-term growth of income and capital appreciation, investing primarily in dividend paying common stocks and preferred stocks
• Symbols: DVFAX, DVFCX, DVFIX
COHEN & STEERS
PREFERRED SECURITIES AND INCOME FUND
• Designed for investors seeking total return and high current income and capital appreciation, investing primarily in preferred and debt securities
• Symbols: CPXAX, CPXCX, CPXIX
* Class B shares are no longer offered except through dividend reinvestment and permitted exchanges by existing Class B shareholders.
Please consider the investment objectives, risks, charges and expenses of the fund carefully before investing. A prospectus containing this and other information can be obtained by calling 800-330-7348 or by visiting cohenandsteers.com. Please read the prospectus carefully before investing.
Cohen & Steers Securities, LLC, Distributor
32
COHEN & STEERS DIVIDEND VALUE FUND, INC.
OFFICERS AND DIRECTORS
Robert H. Steers
Director and co-chairman
Martin Cohen
Director and co-chairman
Bonnie Cohen
Director
George Grossman
Director
Richard E. Kroon
Director
Richard J. Norman
Director
Frank K. Ross
Director
Willard H. Smith Jr.
Director
C. Edward Ward, Jr.
Director
Adam M. Derechin
President and chief executive officer
Joseph M. Harvey
Vice president
Richard E. Helm
Vice president
Francis C. Poli
Secretary
James Giallanza
Treasurer and chief financial officer
Lisa D. Phelan
Chief compliance officer
KEY INFORMATION
Investment Advisor
Cohen & Steers Capital Management, Inc.
280 Park Avenue
New York, NY 10017
(212) 832-3232
Subadministrator and Custodian
State Street Bank and Trust Company
One Lincoln Street
Boston, MA 02111
Transfer Agent
Boston Financial Data Services, Inc.
30 Dan Road
Canton, MA 02021
(800) 437-9912
Legal Counsel
Stroock & Stroock & Lavan LLP
180 Maiden Lane
New York, NY 10038
Distributor
Cohen & Steers Securities, LLC
280 Park Avenue
New York, NY 10017
Nasdaq Symbol: Class A—DVFAX
Class C—DVFCX
Class I—DVFIX
Web site: cohenandsteers.com
This report is authorized for delivery only to shareholders of Cohen & Steers Dividend Value Fund, Inc. unless accompanied or preceded by the delivery of a currently effective prospectus setting forth details of the Fund. Past performance is of course no guarantee of future results and your investment may be worth more or less at the time you sell.
33
eDelivery NOW AVAILABLE
Stop traditional mail delivery; receive your shareholder reports and prospectus online.
Sign up at cohenandsteers.com
COHEN & STEERS
DIVIDEND VALUE FUND
280 PARK AVENUE
NEW YORK, NY 10017


SEMIANNUAL REPORT
AUGUST 31, 2010
DVFAXSAR
Item 2. Code of Ethics.
Not applicable.
Item 3. Audit Committee Financial Expert.
Not applicable.
Item 4. Principal Accountant Fees and Services.
Not applicable.
Item 5. Audit Committee of Listed Registrants.
Not applicable.
Item 6. Schedule of Investments.
Included in Item 1 above.
Item 7. Disclosure of Proxy Voting Policies and Procedures for Closed-End Management Investment Companies.
Not applicable.
Item 8. Portfolio Managers of Closed-End Management Investment Companies.
Not applicable.
Item 9. Purchases of Equity Securities by Closed-End Management Investment Company and Affiliated Purchasers.
Not applicable.
Item 10. Submission of Matters to a Vote of Security Holders.
None.
Item 11. Controls and Procedures.
(a) The registrant’s principal executive officer and principal financial officer have concluded, based upon their evaluation of the registrant’s disclosure controls and procedures as conducted within 90 days of the filing date of this report, that these disclosure controls and procedures provide reasonable assurance that material information required to be disclosed by the registrant in the report it files or submits on Form N-CSR is recorded, processed, summarized and reported within the time periods specified in the Securities and Exchange Commission’s rules and forms
and that such material information is accumulated and communicated to the registrant’s management, including its principal executive officer and principal financial officer, as appropriate, in order to allow timely decisions regarding required disclosure.
(b) There were no changes in the registrant’s internal control over financial reporting that occurred during the second fiscal quarter of the period covered by this report that have materially affected, or are reasonably likely to materially affect, the registrant’s internal control over financial reporting.
Item 12. Exhibits.
(a)(1) Not applicable.
(a) (2) Certifications of principal executive officer and principal financial officer as required by Rule 30a-2(a) under the Investment Company Act of 1940.
(a)(3) Not applicable.
(b) Certifications of principal executive officer and principal financial officer as required by Rule 30a- 2(b) under the Investment Company Act of 1940.
SIGNATURES
Pursuant to the requirements of the Securities Exchange Act of 1934 and the Investment Company Act of 1940, the registrant has duly caused this report to be signed on its behalf by the undersigned, thereunto duly authorized.
COHEN & STEERS DIVIDEND VALUE FUND, INC. | |
| | | |
| | | |
| By: | s/Adam M. Derechin | | |
| | Name: Adam M. Derechin | | |
| | Title: President and Chief Executive Officer | | |
| | | |
| Date: October 28, 2010 | | |
| | | | | | |
Pursuant to the requirements of the Securities Exchange Act of 1934 and the Investment Company Act of 1940, this report has been signed below by the following persons on behalf of the registrant and in the capacities and on the dates indicated.
| By: | s/Adam M. Derechin | | |
| | Name: | Adam M. Derechin | | |
| | Title: | President and Chief Executive Officer | | |
| | | (principal executive officer) | | |
| By: | s/James Giallanza | | |
| | Name: | James Giallanza | | |
| | Title: | Treasurer | | |
| | | (principal financial officer) | | |
| | | | | |
| | | | | |
| Date: October 28, 2010 | | |