UNITED STATES
SECURITIES AND EXCHANGE COMMISSION
Washington, D.C. 20549
FORM N-CSR
CERTIFIED SHAREHOLDER REPORT OF REGISTERED
MANAGEMENT INVESTMENT COMPANIES
Investment Company Act file number | 811-21668 |
|
Cohen & Steers Dividend Value Fund, Inc. |
(Exact name of registrant as specified in charter) |
|
280 Park Avenue, New York, NY | | 10017 |
(Address of principal executive offices) | | (Zip code) |
|
Adam M. Derechin Cohen & Steers Capital Management, Inc. 280 Park Avenue New York, New York 10017 |
(Name and address of agent for service) |
|
Registrant’s telephone number, including area code: | (212) 832-3232 | |
|
Date of fiscal year end: | February 28 | |
|
Date of reporting period: | August 31, 2011 | |
| | | | | | | | |
Item 1. Reports to Stockholders.
COHEN & STEERS DIVIDEND VALUE FUND, INC.
To Our Shareholders:
We would like to share with you our report for six months ended August 31, 2011. The net asset values (NAV) per share at that date were $11.26, $11.20 and $11.27 for Class A, Class C and Class I shares, respectively.
The total returns, including income and change in NAV, for the Fund and its comparative benchmarks were:
| | | Six Months Ended
August 31, 2011 | |
| Cohen & Steers Dividend Value Fund—Class A | | | –7.41 | % | |
| Cohen & Steers Dividend Value Fund—Class C | | | –7.74 | % | |
| Cohen & Steers Dividend Value Fund—Class I | | | –7.23 | % | |
| Russell 1000 Value Indexa | | | –9.45 | % | |
| S&P 500 Indexa | | | –7.23 | % | |
The performance data quoted represent past performance. Past performance is no guarantee of future results. The investment return and the principal value of an investment will fluctuate and shares, if redeemed, may be worth more or less than their original cost. Current performance may be lower or higher than the performance data quoted. Current total returns of the Fund can be obtained by visiting our Web site at cohenandsteers.com. Performance quoted does not reflect the deduction of the maximum 4.5% initial sales charge on Class A shares or the 1% maximum contingent deferred sales charge on Class C shares. If such charges were included, returns would have been lower.
The Fund implements fair value pricing when the daily change in a specific U.S. market index exceeds a predetermined percentage. Fair value pricing adjusts the valuation of non-U.S. holdings to account for such index change following the close of foreign markets. This standard practice has been adopted by a majority of the fund industry to deter investors from arbitraging funds with a large percentage of non-U.S. holdings. In the event fair value pricing is implemented on the first and/or last day of a performance measurement period, the Fund's return may diverge from the relative performance of its benchmark index, which does not use fair value pricing. An investor cannot invest directly in an index.
Please note that distributions paid by the Fund to shareholders are subject to recharacterization for tax purposes and are taxable up to the amount of the Fund's investment company taxable income and net realized gains. Distributions in excess of the Fund's investment company taxable income and realized gains are a return of capital distributed from the Fund's assets.
a The Russell 1000 Value Index measures the performance of those Russell 1000 companies with lower price-to-book ratios and lower forecasted growth values. The S&P 500 Index is an unmanaged index of common stocks that is frequently used as a general measure of stock market performance.
1
COHEN & STEERS DIVIDEND VALUE FUND, INC.
Investment Review
The market rally that began in 2009 slowed late in the first calendar quarter of 2011, stalled by the effects of unrest in the Middle East, Japan's tsunami and the European sovereign debt crisis. First-quarter earnings were encouraging, with widespread dividend increases and stock buybacks; but optimism was tempered in May by subdued guidance. Second-quarter earnings beat analysts' estimates, but did not prompt many companies to raise their outlook for the rest of the year. In August, weak U.S. economic data and Washington's battle over raising the debt ceiling culminated in a credit downgrade by Standard & Poor's.
Faced with these headwinds, the Russell 1000 Value Index declined 9.45% over the six months ended August 31. On a positive note, however, some data suggest that housing prices may have reached a bottom. And despite the debt downgrade, 10-year U.S. Treasury yields declined.
Financial institutions faced hurdles
Financial institutions (–20.1% in the Russell 1000 Value Index) were the worst performers in the index. The sovereign debt crises in Greece, and later Italy and Spain, were significant overhangs; it will take time for the countries, their creditors, the European Central Bank and the International Monetary Fund to find satisfactory long-term solutions. Slowing economic data and the uncertainty about Basel III surplus capital levels also weighed on banks. By the end of the period, they were seeing improved credit metrics, but loan and revenue growth remained challenging. Insurance companies fared better, with solid earnings and higher premiums.
Defensive sectors outperformed
The positive total returns of utilities (+6.9%), consumer staples (+5.5%) and health care companies (+5.4%) reflected investors' move to perceived relative safety. Among energy stocks (–11.9%), which underperformed as a sector, oil and gas producers benefited from the rise in oil prices and the improved outlook for gas over nuclear power following the Fukushima disaster. Volatile oil prices and instability in the Middle East favored diversified companies with refining and chemical operations over those engaged only in exploration and production of oil and gas.
Information technology companies (–14.8%) underperformed the index, first on fears that Japan's supply chain would be disrupted following the tsunami, then due to slowing demand for personal computers and televisions in a weakening global economy. Among cyclical stocks, the industrials (–14.6%) and consumer discretionary (–11.7%) sectors lagged the index as economic fundamentals weakened.
2
COHEN & STEERS DIVIDEND VALUE FUND, INC.
Fund performance
The fund declined in the six-month period but outperformed its index. Our underweight and stock selection within financial institutions were the biggest contributors. Stock selection in the consumer discretionary, technology and industrials sectors was also beneficial. Specifically, our allocations to Visa Inc. and Abbott Laboratories and our out-of-index investment in McDonald's Corp. generated positive absolute and relative total returns.
Factors that detracted from relative performance included our underweight and stock selection in utilities and consumer staples. Stock selection in the health care sector was also negative. Our allocation to technology glassmaker Corning Inc. had an adverse impact, as the company felt the impact of declining PC and television sales. Our investments in Prudential Financial and Bank of New York Mellon Corp. were also detrimental.
Investment Outlook
Our outlook for the U.S. economy remains cautious but essentially unchanged. Employment numbers are slowly edging up, but we expect more soft economic data and are alert to the possibility of Europe's slide back into recession, which could spread to the United States. That said, we believe the U.S. economy has enough positive drivers to resist another painful recession; but it won't feel particularly robust, and we may be only one economic shock away from falling back into decline.
Lower valuations and improved credit quality among battered financial institutions have made some of the stronger among them more attractive, and we are selectively increasing some positions there. It is our belief that recovery will take far more time, and so we remain watchful. Energy companies are likely to be volatile in the near term due to global economic and geopolitical factors, but we have no material changes to our long-term outlook for the sector despite notable recent price declines. We have been, and will likely remain, significantly underweight in technology hardware companies and overweight in software companies.
We expect more analysts to revise estimated earnings downward, and continually review our holdings with that issue in mind. As we evaluate our stocks on an individual company basis, we are not unduly influenced by the unsettled macroeconomic picture. However, in this volatile environment, it is imperative their secular stories remain intact.
3
COHEN & STEERS DIVIDEND VALUE FUND, INC.
Sincerely,
 | |  | |
|
| MARTIN COHEN | | ROBERT H. STEERS | |
|
| Co-chairman | | Co-chairman | |
|

RICHARD E. HELM
Portfolio Manager
The views and opinions in the preceding commentary are subject to change. There is no guarantee that any market forecast set forth in the commentary will be realized. This material represents an assessment of the market environment at a specific point in time, should not be relied upon as investment advice and is not intended to predict or depict performance of any investment.
Visit Cohen & Steers online at cohenandsteers.com
For more information about any of our funds, visit cohenandsteers.com, where you will find daily net asset values, fund fact sheets and portfolio highlights. You can also access newsletters, education tools and market updates covering the global real estate, listed infrastructure, utilities, large cap value and preferred securities sectors.
In addition, our Web site contains comprehensive information about our firm, including our most recent press releases, profiles of our senior investment professionals and an overview of our investment approach.
4
COHEN & STEERS DIVIDEND VALUE FUND, INC.
Performance Review (Unaudited)
Average Annual Total Returns—For Periods Ended August 31, 2011
| | | Class A Shares | | Class C Shares | | Class I Shares | |
| 1 Year (with sales charge) | | | 8.79 | %a | | | 12.17 | %b | | | — | | |
| 1 Year (without sales charge) | | | 13.91 | % | | | 13.17 | % | | | 14.33 | % | |
| 5 Years (with sales charge) | | | –1.47 | %a | | | –1.21 | % | | | — | | |
| 5 Years (without sales charge) | | | –0.56 | % | | | –1.21 | % | | | –0.20 | % | |
| Since Inceptionc (with sales charge) | | | 0.81 | %a | | | 0.94 | % | | | — | | |
| Since Inceptionc (without sales charge) | | | 1.59 | % | | | 0.94 | % | | | 1.96 | % | |
The performance data quoted represent past performance. Past performance is no guarantee of future results. The investment return and principal value of an investment will fluctuate and shares, if redeemed, may be worth more or less than their original cost. Current performance may be lower or higher than the performance data quoted. Performance information current to the most recent month-end can be obtained by visiting our Web site at cohenandsteers.com. The performance table does not reflect the deduction of taxes that a shareholder would pay on Fund distributions or the redemption of Fund shares. During the periods presented above, the advisor waived fees and/or reimbursed expenses. Without this arrangement, performance would have been lower.
The annualized gross and net expense ratios, respectively, for each class of shares as disclosed in the July 1, 2011 prospectuses were as follows: Class A—1.45% and 1.15%; Class C—2.10% and 1.80%; and Class I—1.10% and 0.80%, respectively. Through June 30, 2012, the advisor has contractually agreed to waive its fee and/or reimburse the Fund for expenses incurred to the extent necessary to maintain the Fund's annual operating expenses at 1.15% for Class A shares, 1.80% for Class C shares and 0.80% for Class I shares.
a Reflects a 4.50% front-end sales charge.
b Reflects a contingent deferred sales charge of 1%.
c Inception date of August 31, 2005.
5
COHEN & STEERS DIVIDEND VALUE FUND, INC.
Expense Example (Unaudited)
As a shareholder of the Fund, you incur two types of costs: (1) transaction costs, including sales charges (loads) on purchase payments and redemption fees; and (2) ongoing costs including management fees; distribution and/or service (12b-1) fees; and other Fund expenses. This example is intended to help you understand your ongoing costs (in dollars) of investing in the Fund and to compare these costs with the ongoing costs of investing in other mutual funds.
The example is based on an investment of $1,000 invested at the beginning of the period and held for the entire period March 1, 2011—August 31, 2011.
Actual Expenses
The first line of the following table provides information about actual account values and expenses. You may use the information in this line, together with the amount you invested, to estimate the expenses that you paid over the period. Simply divide your account value by $1,000 (for example, an $8,600 account value divided by $1,000 = 8.6), then multiply the result by the number in the first line under the heading entitled "Expenses Paid During Period" to estimate the expenses you paid on your account during this period.
Hypothetical Example for Comparison Purposes
The second line of the following table provides information about hypothetical account values and hypothetical expenses based on the Fund's actual expense ratio and an assumed rate of return of 5% per year before expenses, which is not the Fund's actual return. The hypothetical account values and expenses may not be used to estimate the actual ending account balance or expenses you paid for the period. You may use this information to compare the ongoing cost of investing in the Fund and other funds. To do so, compare this 5% hypothetical example with the 5% hypothetical examples that appear in the shareholder reports of other funds.
Please note that the expenses shown in the table are meant to highlight your ongoing costs only and do not reflect any transactional costs, such as sales charges (loads) and redemption fees. Therefore, the second line of the table is useful in comparing ongoing costs only, and will not help you determine the relative total costs of owning different funds. In addition, if these transactional costs were included, your costs would have been higher.
6
COHEN & STEERS DIVIDEND VALUE FUND, INC.
Expense Example (Unaudited)—(Continued)
| | | Beginning
Account Value
March 1, 2011 | | Ending
Account Value
August 31, 2011 | | Expenses Paid
During Perioda
March 1, 2011–
August 31, 2011 | |
| Class A | |
| Actual (–7.41% return) | | $ | 1,000.00 | | | $ | 925.90 | | | $ | 5.57 | | |
| Hypothetical (5% annual return before expenses) | | $ | 1,000.00 | | | $ | 1,019.36 | | | $ | 5.84 | | |
| Class C | |
| Actual (–7.74% return) | | $ | 1,000.00 | | | $ | 922.60 | | | $ | 8.70 | | |
| Hypothetical (5% annual return before expenses) | | $ | 1,000.00 | | | $ | 1,016.09 | | | $ | 9.12 | | |
| Class I | |
| Actual (–7.23% return) | | $ | 1,000.00 | | | $ | 927.70 | | | $ | 3.88 | | |
| Hypothetical (5% annual return before expenses) | | $ | 1,000.00 | | | $ | 1,021.11 | | | $ | 4.06 | | |
a Expenses are equal to the Fund's Class A, Class C and Class I annualized expense ratio of 1.15%, 1.80% and 0.80%, respectively, multiplied by the average account value over the period, multiplied by 184/366 (to reflect the one-half year period). If the Fund had borne all of its expenses that were assumed by the advisor, the annualized expense ratios would have been 1.49%, 2.14% and 1.14%, respectively.
7
COHEN & STEERS DIVIDEND VALUE FUND, INC.
AUGUST 31, 2011
Top Ten Holdings
(Unaudited)
| Security | | Value | | % of
Net
Assets | |
| Chevron Corp. | | $ | 4,272,912 | | | | 3.4 | % | |
| JPMorgan Chase & Co. | | | 3,635,808 | | | | 2.9 | | |
| Exxon Mobil Corp. | | | 3,346,608 | | | | 2.6 | | |
| General Electric Co. | | | 3,206,546 | | | | 2.5 | | |
| Visa, Class A | | | 3,005,496 | | | | 2.4 | | |
| UnitedHealth Group | | | 2,979,504 | | | | 2.3 | | |
| Oracle Corp. | | | 2,795,772 | | | | 2.2 | | |
| The Walt Disney Co. | | | 2,772,484 | | | | 2.2 | | |
| McDonald's Corp. | | | 2,722,846 | | | | 2.1 | | |
| Procter & Gamble Co. | | | 2,700,032 | | | | 2.1 | | |
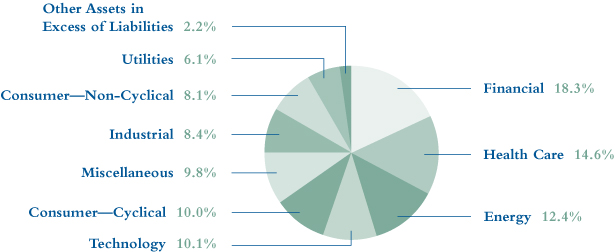
Sector Breakdown
(Based on Net Assets)
(Unaudited)
8
COHEN & STEERS DIVIDEND VALUE FUND, INC.
SCHEDULE OF INVESTMENTS
August 31, 2011 (Unaudited)
| | | | | Number
of Shares | | Value | |
| COMMON STOCK | | 97.8% | | | | | | | | | |
| CONSUMER—CYCLICAL | | 10.0% | | | | | | | | | |
| APPAREL | | 0.4% | | | | | | | | | |
| NIKE | | | | | 6,000 | | | $ | 519,900 | | |
| AUTO PARTS EQUIPMENT | | 0.8% | | | | | | | | | |
| Johnson Controls | | | | | 32,700 | | | | 1,042,476 | | |
| LEISURE TIME | | 0.5% | | | | | | | | | |
| Carnival Corp. | | | | | 20,500 | | | | 677,115 | | |
| MEDIA | | 2.9% | | | | | | | | | |
| The Walt Disney Co. | | | | | 81,400 | | | | 2,772,484 | | |
| Time Warner Cable | | | | | 13,300 | | | | 871,150 | | |
| | | | 3,643,634 | | |
| RESTAURANT | | 2.7% | | | | | | | | | |
| McDonald's Corp. | | | | | 30,100 | | | | 2,722,846 | | |
| Tim Hortons (Canada) | | | | | 15,800 | | | | 752,489 | | |
| | | | 3,475,335 | | |
| RETAIL | | 2.2% | | | | | | | | | |
| Nordstrom | | | | | 29,100 | | | | 1,322,886 | | |
| Ross Stores | | | | | 18,400 | | | | 1,408,060 | | |
| | | | 2,730,946 | | |
| SPECIALTY RETAIL | | 0.5% | | | | | | | | | |
| PetSmart | | | | | 14,900 | | | | 628,482 | | |
| TOTAL CONSUMER—CYCLICAL | | | | | | | | | 12,717,888 | | |
| CONSUMER—NON-CYCLICAL | | 8.1% | | | | | | | | | |
| AGRICULTURE | | 1.3% | | | | | | | | | |
| Philip Morris International | | | | | 22,800 | | | | 1,580,496 | | |
| BASIC MATERIALS | | 1.0% | | | | | | | | | |
| Archer-Daniels-Midland Co. | | | | | 46,500 | | | | 1,324,320 | | |
| BEVERAGE | | 0.5% | | | | | | | | | |
| PepsiCo | | | | | 10,100 | | | | 650,743 | | |
See accompanying notes to financial statements.
9
COHEN & STEERS DIVIDEND VALUE FUND, INC.
SCHEDULE OF INVESTMENTS—(Continued)
August 31, 2011 (Unaudited)
| | | | | Number
of Shares | | Value | |
| COSMETICS/PERSONAL CARE | | 2.1% | | | | | | | | | |
| Procter & Gamble Co. | | | | | 42,400 | | | $ | 2,700,032 | | |
| RETAIL | | 3.2% | | | | | | | | | |
| Costco Wholesale Corp. | | | | | 17,900 | | | | 1,405,866 | | |
| CVS Caremark Corp. | | | | | 73,100 | | | | 2,625,021 | | |
| | | | 4,030,887 | | |
| TOTAL CONSUMER—NON-CYCLICAL | | | | | | | | | 10,286,478 | | |
| ENERGY | | 12.4% | | | | | | | | | |
| OIL & GAS | | 11.4% | | | | | | | | | |
| Apache Corp. | | | | | 16,000 | | | | 1,649,120 | | |
| Chevron Corp. | | | | | 43,200 | | | | 4,272,912 | | |
| Devon Energy Corp. | | | | | 18,000 | | | | 1,220,940 | | |
| Exxon Mobil Corp. | | | | | 45,200 | | | | 3,346,608 | | |
| Marathon Petroleum Corp. | | | | | 27,450 | | | | 1,017,297 | | |
| Occidental Petroleum Corp. | | | | | 26,500 | | | | 2,298,610 | | |
| Peabody Energy Corp. | | | | | 12,800 | | | | 624,640 | | |
| | | | 14,430,127 | | |
| OIL & GAS SERVICES | | 1.0% | | | | | | | | | |
| Halliburton Co. | | | | | 15,300 | | | | 678,861 | | |
| Schlumberger Ltd. | | | | | 8,100 | | | | 632,772 | | |
| | | | 1,311,633 | | |
| TOTAL ENERGY | | | | | | | | | 15,741,760 | | |
| FINANCIAL | | 18.3% | | | | | | | | | |
| BANK | | 6.0% | | | | | | | | | |
| Bank of America Corp. | | | | | 130,600 | | | | 1,067,002 | | |
| Bank of New York Mellon Corp. | | | | | 63,900 | | | | 1,320,813 | | |
| Comerica | | | | | 41,000 | | | | 1,049,190 | | |
| Toronto-Dominion Bank (Canada) (USD) | | | | | 9,700 | | | | 764,845 | | |
| US Bancorp | | | | | 76,300 | | | | 1,770,923 | | |
| Wells Fargo & Co. | | | | | 62,200 | | | | 1,623,420 | | |
| | | | 7,596,193 | | |
See accompanying notes to financial statements.
10
COHEN & STEERS DIVIDEND VALUE FUND, INC.
SCHEDULE OF INVESTMENTS—(Continued)
August 31, 2011 (Unaudited)
| | | | | Number
of Shares | | Value | |
| CREDIT CARD | | 1.5% | | | | | | | | | |
| American Express Co. | | | | | 39,700 | | | $ | 1,973,487 | | |
| DIVERSIFIED FINANCIAL SERVICE | | 6.2% | | | | | | | | | |
| Citigroup | | | | | 32,700 | | | | 1,015,335 | | |
| Franklin Resources | | | | | 15,600 | | | | 1,870,752 | | |
| Goldman Sachs Group | | | | | 12,100 | | | | 1,406,262 | | |
| JPMorgan Chase & Co. | | | | | 96,800 | | | | 3,635,808 | | |
| | | | 7,928,157 | | |
| INSURANCE | | 4.6% | | | | | | | | | |
| Chubb Corp. | | | | | 31,100 | | | | 1,924,779 | | |
| HCC Insurance Holdings | | | | | 45,500 | | | | 1,330,420 | | |
| Prudential Financial | | | | | 50,700 | | | | 2,545,647 | | |
| | | | 5,800,846 | | |
| TOTAL FINANCIAL | | | | | | | | | 23,298,683 | | |
| HEALTH CARE | | 14.6% | | | | | | | | | |
| BIOTECHNOLOGY | | 0.6% | | | | | | | | | |
| Amgen | | | | | 14,700 | | | | 814,453 | | |
| HEALTH CARE PROVIDERS & SERVICES | | 2.4% | | | | | | | | | |
| UnitedHealth Group | | | | | 62,700 | | | | 2,979,504 | | |
| HEALTHCARE PRODUCTS | | 4.7% | | | | | | | | | |
| Covidien PLC | | | | | 44,600 | | | | 2,327,228 | | |
| Johnson & Johnson | | | | | 38,100 | | | | 2,506,980 | | |
| Patterson Cos. | | | | | 41,000 | | | | 1,198,020 | | |
| | | | 6,032,228 | | |
| PHARMACEUTICAL | | 6.9% | | | | | | | | | |
| Abbott Laboratories | | | | | 48,700 | | | | 2,557,237 | | |
| Merck & Co. | | | | | 79,500 | | | | 2,633,040 | | |
| Pfizer | | | | | 125,300 | | | | 2,378,194 | | |
| Teva Pharmaceutical Industries Ltd. (ADR) (Israel) | | �� | | | 29,100 | | | | 1,203,576 | | |
| | | | 8,772,047 | | |
| TOTAL HEALTH CARE | | | | | | | | | 18,598,232 | | |
See accompanying notes to financial statements.
11
COHEN & STEERS DIVIDEND VALUE FUND, INC.
SCHEDULE OF INVESTMENTS—(Continued)
August 31, 2011 (Unaudited)
| | | | | Number
of Shares | | Value | |
| INDUSTRIAL | | 8.4% | | | | | | | | | |
| AEROSPACE & DEFENSE | | 2.4% | | | | | | | | | |
| General Dynamics Corp. | | | | | 18,300 | | | $ | 1,172,664 | | |
| L-3 Communications Holdings | | | | | 8,700 | | | | 590,034 | | |
| Lockheed Martin Corp. | | | | | 16,800 | | | | 1,246,392 | | |
| | | | 3,009,090 | | |
| DIVERSIFIED MANUFACTURING | | 3.0% | | | | | | | | | |
| Eaton Corp. | | | | | 14,500 | | | | 622,775 | | |
| General Electric Co. | | | | | 196,600 | | | | 3,206,546 | | |
| | | | 3,829,321 | | |
| ELECTRICAL EQUIPMENT | | 0.5% | | | | | | | | | |
| Emerson Electric Co. | | | | | 14,700 | | | | 684,285 | | |
| MACHINERY | | 0.6% | | | | | | | | | |
| Finning International (Canada) | | | | | 32,566 | | | | 831,692 | | |
| TRANSPORTATION | | 1.9% | | | | | | | | | |
| Norfolk Southern Corp. | | | | | 14,700 | | | | 994,896 | | |
| United Parcel Service | | | | | 20,300 | | | | 1,368,017 | | |
| | | | 2,362,913 | | |
| TOTAL INDUSTRIAL | | | | | | | | | 10,717,301 | | |
| MATERIALS | | 3.4% | | | | | | | | | |
| CHEMICALS | | 2.2% | | | | | | | | | |
| Dow Chemical Co. | | | | | 30,900 | | | | 879,105 | | |
| Potash Corp. of Saskatchewan (Canada) (USD) | | | | | 5,600 | | | | 324,688 | | |
| Syngenta AG (Switzerland)a | | | | | 5,237 | | | | 1,666,924 | | |
| | | | 2,870,717 | | |
| METALS & MINING | | 1.2% | | | | | | | | | |
| BHP Billiton Ltd. (Australia) | | | | | 15,100 | | | | 641,449 | | |
| Newmont Mining Corp. | | | | | 13,700 | | | | 857,894 | | |
| | | | 1,499,343 | | |
| TOTAL MATERIALS | | | | | | | | | 4,370,060 | | |
See accompanying notes to financial statements.
12
COHEN & STEERS DIVIDEND VALUE FUND, INC.
SCHEDULE OF INVESTMENTS—(Continued)
August 31, 2011 (Unaudited)
| | | | | Number
of Shares | | Value | |
| REAL ESTATE | | 2.1% | | | | | | | | | |
| MORTGAGE | | 0.3% | | | | | | | | | |
| Annaly Capital Management | | | | | 16,800 | | | $ | 304,584 | | |
| RESIDENTIAL—APARTMENT | | 1.0% | | | | | | | | | |
| Equity Residential | | | | | 21,300 | | | | 1,303,134 | | |
| SHOPPING CENTER—REGIONAL MALL | | 0.8% | | | | | | | | | |
| Simon Property Group | | | | | 8,800 | | | | 1,034,000 | | |
| TOTAL REAL ESTATE | | | | | | | | | 2,641,718 | | |
| TECHNOLOGY | | 10.1% | | | | | | | | | |
| SEMICONDUCTORS | | 0.5% | | | | | | | | | |
| Avago Technologies Ltd. (Singapore) (USD) | | | | | 21,000 | | | | 695,310 | | |
| SERVICES | | 2.4% | | | | | | | | | |
| Visa, Class A | | | | | 34,200 | | | | 3,005,496 | | |
| SOFTWARE | | 3.9% | | | | | | | | | |
| Microsoft Corp. | | | | | 20,500 | | | | 545,300 | | |
| Oracle Corp. | | | | | 99,600 | | | | 2,795,772 | | |
| Symantec Corp.a | | | | | 92,100 | | | | 1,579,515 | | |
| | | | 4,920,587 | | |
| TELECOMMUNICATION EQUIPMENT | | 3.3% | | | | | | | | | |
| Corning | | | | | 117,100 | | | | 1,760,013 | | |
| QUALCOMM | | | | | 48,100 | | | | 2,475,226 | | |
| | | | 4,235,239 | | |
| TOTAL TECHNOLOGY | | | | | | | | | 12,856,632 | | |
| TELECOMMUNICATION SERVICES | | 4.3% | | | | | | | | | |
| AT&T | | | | | 84,700 | | | | 2,412,256 | | |
| China Mobile Ltd. (ADR) (Hong Kong) | | | | | 26,400 | | | | 1,350,888 | | |
| Vodafone Group PLC (United Kingdom) | | | | | 635,000 | | | | 1,659,581 | | |
| | | | 5,422,725 | | |
| UTILITIES | | 6.1% | | | | | | | | | |
| ELECTRIC UTILITIES | | 1.7% | | | | | | | | | |
| NextEra Energy | | | | | 38,500 | | | | 2,183,720 | | |
See accompanying notes to financial statements.
13
COHEN & STEERS DIVIDEND VALUE FUND, INC.
SCHEDULE OF INVESTMENTS—(Continued)
August 31, 2011 (Unaudited)
| | | | | Number
of Shares | | Value | |
| MULTI UTILITIES | | | 4.4% | | | | | | | | | | |
| PG&E Corp. | | | | | 57,900 | | | $ | 2,452,065 | | |
| Sempra Energy | | | | | 13,400 | | | | 703,768 | | |
| Wisconsin Energy Corp. | | | | | 74,400 | | | | 2,354,016 | | |
| | | | 5,509,849 | | |
| TOTAL UTILITIES | | | | | | | | | 7,693,569 | | |
| TOTAL COMMON STOCK (Identified cost—$111,928,840) | | | | | | | | | 124,345,046 | | |
| SHORT-TERM INVESTMENTS | | | 2.1% | | | | | | | | | | |
| MONEY MARKET FUNDS | |
| BlackRock Liquidity Funds: FedFund, 0.01%b | | | | | 1,350,000 | | | | 1,350,000 | | |
| Federated Government Obligations Fund, 0.01%b | | | | | 1,350,000 | | | | 1,350,000 | | |
TOTAL SHORT-TERM INVESTMENTS
(Identified cost—$2,700,000) | | | | | | | | | 2,700,000 | | |
| TOTAL INVESTMENTS (Identified cost—$114,628,840) | | | 99.9 | % | | | | | | | 127,045,046 | | |
| OTHER ASSETS IN EXCESS OF LIABILITIES | | | 0.1 | % | | | | | | | 185,642 | | |
| NET ASSETS | | | 100.0 | % | | | | | | $ | 127,230,688 | | |
Glossary of Portfolio Abbreviations
ADR American Depositary Receipt
USD United States Dollar
Note: Percentages indicated are based on the net assets of the Fund.
a Non-income producing security.
b Rate quoted represents the seven day yield of the fund.
See accompanying notes to financial statements.
14
COHEN & STEERS DIVIDEND VALUE FUND, INC.
STATEMENT OF ASSETS AND LIABILITIES
August 31, 2011 (Unaudited)
| ASSETS: | |
| Investments in securities, at value (Identified cost—$114,628,840) | | $ | 127,045,046 | | |
| Cash | | | 71,141 | | |
| Receivable for: | |
| Investment securities sold | | | 395,192 | | |
| Dividends | | | 282,045 | | |
| Fund shares sold | | | 119,535 | | |
| Other assets | | | 4,008 | | |
| Total Assets | | | 127,916,967 | | |
| LIABILITIES: | |
| Payable for: | |
| Investment securities purchased | | | 311,446 | | |
| Fund shares redeemed | | | 146,661 | | |
| Investment advisory fees | | | 53,765 | | |
| Administration fees | | | 4,223 | | |
| Directors' fees | | | 2,333 | | |
| Distribution fees | | | 1,729 | | |
| Shareholder servicing fees | | | 604 | | |
| Other liabilities | | | 165,518 | | |
| Total Liabilities | | | 686,279 | | |
| NET ASSETS | | $ | 127,230,688 | | |
| NET ASSETS consist of: | |
| Paid-in capital | | $ | 137,209,751 | | |
| Accumulated undistributed net investment income | | | 51,319 | | |
| Accumulated net realized loss | | | (22,446,645 | ) | |
| Net unrealized appreciation | | | 12,416,263 | | |
| | | $ | 127,230,688 | | |
See accompanying notes to financial statements.
15
COHEN & STEERS DIVIDEND VALUE FUND, INC.
STATEMENT OF ASSETS AND LIABILITIES—(Continued)
August 31, 2011 (Unaudited)
| CLASS A SHARES: | |
| NET ASSETS | | $ | 30,279,076 | | |
| Shares issued and outstanding ($0.001 par value common stock outstanding) | | | 2,688,318 | | |
| Net asset value and redemption price per share | | $ | 11.26 | | |
| Maximum offering price per share ($11.26 ÷ 0.955)a | | $ | 11.79 | | |
| CLASS C SHARES: | |
| NET ASSETS | | $ | 32,307,713 | | |
| Shares issued and outstanding ($0.001 par value common stock outstanding) | | | 2,884,022 | | |
| Net asset value and offering price per shareb | | $ | 11.20 | | |
| CLASS I SHARES: | |
| NET ASSETS | | $ | 64,643,899 | | |
| Shares issued and outstanding ($0.001 par value common stock outstanding) | | | 5,736,184 | | |
| Net asset value, offering, and redemption price per share | | $ | 11.27 | | |
a On investments of $100,000 or more, the offering price is reduced.
b Redemption price per share is equal to the net asset value per share less any applicable deferred sales charge of 1% on shares held for less than one year.
See accompanying notes to financial statements.
16
COHEN & STEERS DIVIDEND VALUE FUND, INC.
STATEMENT OF OPERATIONS
For the Six Months Ended August 31, 2011 (Unaudited)
| Investment Income: | |
| Dividend income (net of $13,789 of foreign withholding tax) | | $ | 1,657,221 | | |
| Expenses: | |
| Investment advisory fees | | | 599,602 | | |
| Distribution fees—Class A | | | 46,924 | | |
| Distribution fees—Class C | | | 136,570 | | |
| Shareholder servicing fees—Class A | | | 18,769 | | |
| Shareholder servicing fees—Class C | | | 45,523 | | |
| Administration fees | | | 69,092 | | |
| Registration and filing fees | | | 41,228 | | |
| Professional fees | | | 40,808 | | |
| Transfer agent fees and expenses | | | 35,316 | | |
| Shareholder reporting expenses | | | 32,568 | | |
| Custodian fees and expenses | | | 15,942 | | |
| Directors' fees and expenses | | | 6,992 | | |
| Line of credit fees | | | 3,963 | | |
| Miscellaneous | | | 9,597 | | |
| Total Expenses | | | 1,102,894 | | |
| Reduction of Expenses (See Note 2) | | | (255,367 | ) | |
| Net Expenses | | | 847,527 | | |
| Net Investment Income | | | 809,694 | | |
| Net Realized and Unrealized Gain (Loss): | |
| Net realized gain on: | |
| Investments | | | 8,072,490 | | |
| Foreign currency transactions | | | 5,040 | | |
| Net realized gain | | | 8,077,530 | | |
| Net change in unrealized appreciation (depreciation) on: | |
| Investments | | | (19,465,294 | ) | |
| Foreign currency translations | | | (4,996 | ) | |
| Net change in unrealized appreciation (depreciation) | | | (19,470,290 | ) | |
| Net realized and unrealized loss | | | (11,392,760 | ) | |
| Net Decrease in Net Assets Resulting from Operations | | $ | (10,583,066 | ) | |
See accompanying notes to financial statements.
17
COHEN & STEERS DIVIDEND VALUE FUND, INC.
STATEMENT OF CHANGES IN NET ASSETS (Unaudited)
| | | For the
Six Months Ended
August 31, 2011 | | For the
Year Ended
February 28, 2011 | |
| Change in Net Assets: | |
| From Operations: | |
| Net investment income | | $ | 809,694 | | | $ | 2,436,305 | | |
| Net realized gain | | | 8,077,530 | | | | 1,620,262 | | |
| Net change in unrealized appreciation (depreciation) | | | (19,470,290 | ) | | | 24,211,392 | | |
Net increase (decrease) in net assets resulting from
operations | | | (10,583,066 | ) | | | 28,267,959 | | |
| Dividends to Shareholders from Net Investment Income: | |
| Class A | | | (217,735 | ) | | | (701,822 | ) | |
| Class C | | | (91,091 | ) | | | (226,270 | ) | |
| Class I | | | (571,342 | ) | | | (1,577,754 | ) | |
| Total dividends to shareholders | | | (880,168 | ) | | | (2,505,846 | ) | |
| Capital Stock Transactions: | |
| Decrease in net assets from Fund share transactions | | | (38,605,882 | ) | | | (50,157,310 | ) | |
| Total decrease in net assets | | | (50,069,116 | ) | | | (24,395,197 | ) | |
| Net Assets: | |
| Beginning of period | | | 177,299,804 | | | | 201,695,001 | | |
| End of perioda | | $ | 127,230,688 | | | $ | 177,299,804 | | |
a Includes accumulated undistributed net investment income of $51,319 and $121,793, respectively.
See accompanying notes to financial statements.
18
COHEN & STEERS DIVIDEND VALUE FUND, INC.
FINANCIAL HIGHLIGHTS (Unaudited)
The following table includes selected data for a share outstanding throughout each period and other performance information derived from the financial statements. It should be read in conjunction with the financial statements and notes thereto.
| | | Class A | |
| | | For the Six
Months Ended | | For Year Ended February 28, | |
| Per Share Operating Performance: | | August 31, 2011 | | 2011 | | 2010 | | 2009 | | 2008a | | 2007 | |
| Net asset value, beginning of period | | $ | 12.23 | | | $ | 10.72 | | | $ | 7.59 | | | $ | 13.57 | | | $ | 13.99 | | | $ | 12.26 | | |
| Income from investment operations: | |
| Net investment incomeb | | | 0.06 | | | | 0.13 | | | | 0.14 | | | | 0.20 | | | | 0.23 | | | | 0.22 | | |
| Net realized and unrealized gain (loss) | | | (0.96 | ) | | | 1.51 | | | | 3.13 | | | | (5.99 | ) | | | (0.17 | ) | | | 1.86 | | |
Total from income (loss) from
investment operations | | | (0.90 | ) | | | 1.64 | | | | 3.27 | | | | (5.79 | ) | | | 0.06 | | | | 2.08 | | |
Less dividends and distributions to
shareholders from: | |
| Net investment income | | | (0.07 | ) | | | (0.13 | ) | | | (0.14 | ) | | | (0.19 | ) | | | (0.21 | ) | | | (0.18 | ) | |
| Net realized gain | | | — | | | | — | | | | — | | | | — | | | | (0.28 | ) | | | (0.17 | ) | |
Total dividends and distributions to
shareholders | | | (0.07 | ) | | | (0.13 | ) | | | (0.14 | ) | | | (0.19 | ) | | | (0.49 | ) | | | (0.35 | ) | |
| Redemption fees retained by the Fund | | | 0.00 | c | | | 0.00 | c | | | 0.00 | c | | | 0.00 | c | | | 0.01 | | | | 0.00 | c | |
| Net increase (decrease) in net asset value | | | (0.97 | ) | | | 1.51 | | | | 3.13 | | | | (5.98 | ) | | | (0.42 | ) | | | 1.73 | | |
| Net asset value, end of period | | $ | 11.26 | | | $ | 12.23 | | | $ | 10.72 | | | $ | 7.59 | | | $ | 13.57 | | | $ | 13.99 | | |
| Total investment returnd | | | –7.41 | %e | | | 15.48 | % | | | 43.41 | % | | | –43.14 | % | | | 0.33 | % | | | 17.12 | % | |
| Ratios/Supplemental Data: | |
| Net assets, end of period (in millions) | | $ | 30.3 | | | $ | 43.4 | | | $ | 71.3 | | | $ | 45.2 | | | $ | 61.9 | | | $ | 41.7 | | |
Ratio of expenses to average daily net assets
(before expense reduction) | | | 1.49 | %f,g | | | 1.45 | %f | | | 1.51 | %f | | | 1.57 | % | | | 1.63 | % | | | 2.33 | %h | |
Ratio of expenses to average daily net assets
(net of expense reduction) | | | 1.15 | %f,g | | | 1.15 | %f | | | 1.15 | %f | | | 1.15 | % | | | 1.00 | % | | | 1.00 | % | |
Ratio of net investment income to average daily
net assets (before expense reduction) | | | 0.72 | %f,g | | | 0.85 | %f | | | 1.02 | % | | | 1.35 | % | | | 0.95 | % | | | 0.30 | % | |
Ratio of net investment income to average daily
net assets (net of expense reduction) | | | 1.06 | %f,g | | | 1.15 | %f | | | 1.38 | % | | | 1.76 | % | | | 1.59 | % | | | 1.63 | % | |
| Portfolio turnover rate | | | 17 | %e | | | 61 | % | | | 37 | % | | | 43 | % | | | 52 | % | | | 30 | % | |
a For the year ended February 29.
b Calculation based on average shares outstanding.
c Amount is less than $0.005.
d Does not reflect sales charges, which would reduce return.
e Not annualized.
f Reflects Fund level ratio for non-class specific expenses plus class specific expenses.
g Annualized.
h Due to the significant growth of net assets on a small asset base, the expense ratio, when averaged over the year, differs from the Fund's other classes by an amount other than class specific expenses. Typically, the ratios between classes will only differ by the class specific expenses (i.e., distribution fees and shareholder servicing fees).
See accompanying notes to financial statements.
19
COHEN & STEERS DIVIDEND VALUE FUND, INC.
FINANCIAL HIGHLIGHTS (Unaudited)—(Continued)
| | | Class C | |
| | | For the Six
Months Ended | | For Year Ended February 28, | |
| Per Share Operating Performance: | | August 31, 2011 | | 2011 | | 2010 | | 2009 | | 2008a | | 2007 | |
| Net asset value, beginning of period | | $ | 12.17 | | | $ | 10.67 | | | $ | 7.55 | | | $ | 13.50 | | | $ | 13.94 | | | $ | 12.23 | | |
| Income from investment operations: | |
| Net investment incomeb | | | 0.03 | | | | 0.06 | | | | 0.07 | | | | 0.13 | | | | 0.14 | | | | 0.14 | | |
| Net realized and unrealized gain (loss) | | | (0.97 | ) | | | 1.50 | | | | 3.13 | | | | (5.96 | ) | | | (0.18 | ) | | | 1.86 | | |
Total from income (loss) from
investment operations | | | (0.94 | ) | | | 1.56 | | | | 3.20 | | | | (5.83 | ) | | | (0.04 | ) | | | 2.00 | | |
Less dividends and distributions to
shareholders from: | |
| Net investment income | | | (0.03 | ) | | | (0.06 | ) | | | (0.08 | ) | | | (0.12 | ) | | | (0.14 | ) | | | (0.12 | ) | |
| Net realized gain | | | — | | | | — | | | | — | | | | — | | | | (0.28 | ) | | | (0.17 | ) | |
Total dividends and distributions to
shareholders | | | (0.03 | ) | | | (0.06 | ) | | | (0.08 | ) | | | (0.12 | ) | | | (0.42 | ) | | | (0.29 | ) | |
| Redemption fees retained by the Fund | | | 0.00 | c | | | 0.00 | c | | | 0.00 | c | | | 0.00 | c | | | 0.02 | | | | 0.00 | c | |
| Net increase (decrease) in net asset value | | | (0.97 | ) | | | 1.50 | | | | 3.12 | | | | (5.95 | ) | | | (0.44 | ) | | | 1.71 | | |
| Net asset value, end of period | | $ | 11.20 | | | $ | 12.17 | | | $ | 10.67 | d | | $ | 7.55 | | | $ | 13.50 | | | $ | 13.94 | | |
| Total investment returne | | | –7.74 | %f | | | 14.84 | %d | | | 42.43 | %d | | | –43.50 | % | | | –0.35 | % | | | 16.40 | % | |
| Ratios/Supplemental Data: | |
| Net assets, end of period (in millions) | | $ | 32.3 | | | $ | 39.2 | | | $ | 40.8 | | | $ | 31.4 | | | $ | 41.2 | | | $ | 14.7 | | |
Ratio of expenses to average daily net assets
(before expense reduction) | | | 2.14 | %g,h | | | 2.10 | %g | | | 2.16 | %g | | | 2.22 | % | | | 2.27 | % | | | 3.21 | %i | |
Ratio of expenses to average daily net assets
(net of expense reduction) | | | 1.80 | %g,h | | | 1.80 | %g | | | 1.80 | %g | | | 1.80 | % | | | 1.65 | % | | | 1.65 | % | |
Ratio of net investment income (loss) to average
daily net assets (before expense reduction) | | | 0.09 | %g,h | | | 0.23 | %g | | | 0.39 | % | | | 0.72 | % | | | 0.33 | % | | | (0.50 | )% | |
Ratio of net investment income to average daily
net assets (net of expense reduction) | | | 0.43 | %g,h | | | 0.53 | %g | | | 0.75 | % | | | 1.14 | % | | | 0.96 | % | | | 1.06 | % | |
| Portfolio turnover rate | | | 17 | %f | | | 61 | % | | | 37 | % | | | 43 | % | | | 52 | % | | | 30 | % | |
a For the year ended February 29.
b Calculation based on average shares outstanding.
c Amount is less than $0.005.
d The February 28, 2010 net asset value reflects adjustments in accordance with accounting principles generally accepted in the United States of America and as such, the net asset value for financial reporting purposes and the returns that would be based upon the net asset value would differ from the net asset value and return reported on February 28, 2010.
e Does not reflect sales charges, which would reduce return.
f Not annualized.
g Reflects Fund level ratio for non-class specific expenses plus class specific expenses.
h Annualized.
i Due to the significant growth of net assets on a small asset base, the expense ratio, when averaged over the year, differs from the Fund's other classes by an amount other than class specific expenses. Typically, the ratios between classes will only differ by the class specific expenses (i.e., distribution fees and shareholder servicing fees).
See accompanying notes to financial statements.
20
COHEN & STEERS DIVIDEND VALUE FUND, INC.
FINANCIAL HIGHLIGHTS (Unaudited)—(Continued)
| | | Class I | |
| | | For the Six
Months Ended | | For Year Ended February 28, | |
| Per Share Operating Performance: | | August 31, 2011 | | 2011 | | 2010 | | 2009 | | 2008a | | 2007 | |
| Net asset value, beginning of period | | $ | 12.24 | | | $ | 10.73 | | | $ | 7.59 | | | $ | 13.58 | | | $ | 14.00 | | | $ | 12.27 | | |
| Income from investment operations: | |
| Net investment incomeb | | | 0.08 | | | | 0.17 | | | | 0.17 | | | | 0.24 | | | | 0.28 | | | | 0.27 | | |
| Net realized and unrealized gain (loss) | | | (0.96 | ) | | | 1.51 | | | | 3.15 | | | | (5.99 | ) | | | (0.18 | ) | | | 1.87 | | |
Total from income (loss) from
investment operations | | | (0.88 | ) | | | 1.68 | | | | 3.32 | | | | (5.75 | ) | | | 0.10 | | | | 2.14 | | |
Less dividends and distributions to
shareholders from: | |
| Net investment income | | | (0.09 | ) | | | (0.17 | ) | | | (0.18 | ) | | | (0.24 | ) | | | (0.26 | ) | | | (0.24 | ) | |
| Net realized gain | | | — | | | | — | | | | — | | | | — | | | | (0.28 | ) | | | (0.17 | ) | |
Total dividends and distributions to
shareholders | | | (0.09 | ) | | | (0.17 | ) | | | (0.18 | ) | | | (0.24 | ) | | | (0.54 | ) | | | (0.41 | ) | |
| Redemption fees retained by the Fund | | | 0.00 | c | | | 0.00 | c | | | 0.00 | c | | | 0.00 | c | | | 0.02 | | | | 0.00 | c | |
| Net increase (decrease) in net asset value | | | (0.97 | ) | | | 1.51 | | | | 3.14 | | | | (5.99 | ) | | | (0.42 | ) | | | 1.73 | | |
| Net asset value, end of period | | $ | 11.27 | | | $ | 12.24 | | | $ | 10.73 | | | $ | 7.59 | | | $ | 13.58 | | | $ | 14.00 | | |
| Total investment return | | | –7.23 | %d | | | 15.89 | % | | | 44.03 | % | | | –42.98 | % | | | 0.65 | % | | | 17.63 | % | |
| Ratios/Supplemental Data: | |
| Net assets, end of period (in millions) | | $ | 64.6 | | | $ | 94.7 | | | $ | 89.5 | | | $ | 44.6 | | | $ | 21.2 | | | $ | 9.4 | | |
Ratio of expenses to average daily net assets
(before expense reduction) | | | 1.14 | %e,f | | | 1.10 | %e | | | 1.16 | %e | | | 1.23 | % | | | 1.28 | % | | | 2.27 | %g | |
Ratio of expenses to average daily net assets
(net of expense reduction) | | | 0.80 | %e,f | | | 0.80 | %e | | | 0.80 | %e | | | 0.80 | % | | | 0.65 | % | | | 0.65 | % | |
Ratio of net investment income to average daily
net assets (before expense reduction) | | | 1.06 | %e,f | | | 1.24 | %e | | | 1.36 | % | | | 1.81 | % | | | 1.31 | % | | | 0.45 | % | |
Ratio of net investment income to average daily
net assets (net of expense reduction) | | | 1.40 | %e,f | | | 1.54 | %e | | | 1.72 | % | | | 2.24 | % | | | 1.94 | % | | | 2.06 | % | |
| Portfolio turnover rate | | | 17 | %d | | | 61 | % | | | 37 | % | | | 43 | % | | | 52 | % | | | 30 | % | |
a For the year ended February 29.
b Calculation based on average shares outstanding.
c Amount is less than $0.005.
d Not annualized.
e Reflects Fund level ratio for non-class specific expenses.
f Annualized.
g Due to the significant growth of net assets on a small asset base, the expense ratio, when averaged over the year, differs from the Fund's other classes by an amount other than class specific expenses. Typically, the ratios between classes will only differ by the class specific expenses (i.e., distribution fees and shareholder servicing fees).
See accompanying notes to financial statements.
21
COHEN & STEERS DIVIDEND VALUE FUND, INC.
NOTES TO FINANCIAL STATEMENTS (Unaudited)
Note 1. Significant Accounting Policies
Cohen & Steers Dividend Value Fund, Inc. (the Fund) was incorporated under the laws of the State of Maryland on November 9, 2004 and is registered under the Investment Company Act of 1940, as amended, as a diversified, open-end management investment company. The Fund's investment objectives are to provide a relatively high level of current income and long term growth of income and capital appreciation. The authorized shares of the Fund are divided into three classes designated Class A, C, and I shares. Each of the Fund's shares has equal dividend, liquidation and voting rights (except for matters relating to distributions and shareholder servicing of such shares).
The following is a summary of significant accounting policies consistently followed by the Fund in the preparation of its financial statements. The policies are in conformity with accounting principles generally accepted in the United States of America (GAAP). The preparation of the financial statements in accordance with GAAP requires management to make estimates and assumptions that affect the reported amounts of assets and liabilities at the date of the financial statements and the reported amounts of income and expenses during the reporting period. Actual results could differ from those estimates.
Portfolio Valuation: Investments in securities that are listed on the New York Stock Exchange are valued, except as indicated below, at the last sale price reflected at the close of the New York Stock Exchange on the business day as of which such value is being determined. If there has been no sale on such day, the securities are valued at the mean of the closing bid and asked prices on such day or, if no asked price is available, at the bid price.
Securities not listed on the New York Stock Exchange but listed on other domestic or foreign securities exchanges are valued in a similar manner. Securities traded on more than one securities exchange are valued at the last sale price on the business day as of which such value is being determined as reflected on the tape at the close of the exchange representing the principal market for such securities. If after the close of a foreign market, but prior to the close of business on the day the securities are being valued, market conditions change significantly, certain foreign securities may be fair valued pursuant to procedures established by the Board of Directors.
Readily marketable securities traded in the over-the-counter market, including listed securities whose primary market is believed by Cohen & Steers Capital Management, Inc. (the advisor) to be over-the-counter, are valued at the official closing prices as reported by sources as the Board of Directors deem appropriate to reflect their fair market value. If there has been no sale on such day, the securities are valued at the mean of the closing bid and asked prices on such day, or if no asked price is available, at the bid price. However, certain fixed-income securities may be valued on the basis of prices provided by a pricing service when such prices are believed by the advisor, pursuant to delegation by the Board of Directors, to reflect the fair market value of such securities.
Securities for which market prices are unavailable, or securities for which the advisor determines that the bid and/or asked price or a counterparty valuation does not reflect market value, will be valued at fair value pursuant to procedures approved by the Fund's Board of Directors. Circumstances in which market prices may be
22
COHEN & STEERS DIVIDEND VALUE FUND, INC.
NOTES TO FINANCIAL STATEMENTS (Unaudited)—(Continued)
unavailable include, but are not limited to, when trading in a security is suspended, the exchange on which the security is traded is subject to an unscheduled close or disruption or material events occur after the close of the exchange on which the security is principally traded. In these circumstances, the Fund determines fair value in a manner that fairly reflects the market value of the security on the valuation date based on consideration of any information or factors it deems appropriate. These may include, but are not limited to, recent transactions in comparable securities, information relating to the specific security and developments in the markets.
The Fund's use of fair value pricing may cause the net asset value of Fund shares to differ from the net asset value that would be calculated using market quotations. Fair value pricing involves subjective judgments and it is possible that the fair value determined for a security may be materially different than the value that could be realized upon the sale of that security.
Short-term debt securities with a maturity date of 60 days or less are valued at amortized cost, which approximates value. Investments in open-end mutual funds are valued at their closing net asset value.
Fair value is defined as the price that the Fund would receive to sell an investment or pay to transfer a liability in an orderly transaction with an independent buyer in the principal market, or in the absence of a principal market the most advantageous market for the investment or liability. The hierarchy of inputs that are used in determining the fair value of the Fund's investments is summarized below.
• Level 1—quoted prices in active markets for identical investments
• Level 2—other significant observable inputs (including quoted prices for similar investments, interest rates, credit risk, etc.)
• Level 3—significant unobservable inputs (including the Fund's own assumptions in determining the fair value of investments)
The inputs or methodology used for valuing securities are not necessarily an indication of the risk associated with investing in those securities.
The following is a summary of the inputs used as of August 31, 2011 in valuing the Fund's investments carried at value:
| | | Total | | Quoted Prices In
Active Market for
Identical Assets
(Level 1) | | Significant
Other Observable
Inputs
(Level 2) | | Significant
Unobservable
Inputs
(Level 3) | |
| Common Stock | | $ | 124,345,046 | | | $ | 124,345,046 | | | $ | — | | | | — | | |
| Money Market Funds | | | 2,700,000 | | | | — | | | | 2,700,000 | | | | — | | |
| Total Investments | | $ | 127,045,046 | | | $ | 124,345,046 | | | $ | 2,700,000 | | | | — | | |
23
COHEN & STEERS DIVIDEND VALUE FUND, INC.
NOTES TO FINANCIAL STATEMENTS (Unaudited)—(Continued)
Security Transactions, Investment Income and Expense Allocations: Security transactions are recorded on trade date. Realized gains and losses on investments sold are recorded on the basis of identified cost. Interest income is recorded on the accrual basis. Discounts are accreted and premiums are amortized over the life of the respective securities. Dividend income is recorded on the ex-dividend date, except for certain dividends on foreign securities, which are recorded as soon as the Fund is informed after the ex-dividend date. Income, expenses (other than expenses attributable to a specific class), and realized and unrealized gains or losses on investments are allocated to each class of shares based on its relative net assets.
Foreign Currency Translations: The books and records of the Fund are maintained in U.S. dollars as follows: (1) the foreign currency market value of investment securities, other assets and liabilities and foreign currency contracts are translated at the exchange rates prevailing at the end of the period; and (2) purchases, sales, income and expenses are translated at the exchange rates prevailing on the respective dates of such transactions. The resultant exchange gains and losses are recorded as realized and unrealized gain/loss on foreign exchange transactions. Pursuant to U.S. federal income tax regulations, certain foreign exchange gains/losses included in realized and unrealized gain/loss are included in or are a reduction of ordinary income for federal income tax purposes. The Fund does not isolate that portion of the results of operations arising as a result of changes in the foreign exchange rates from the changes in the market prices of the securities.
Foreign Securities: The Fund may directly purchase securities of foreign issuers. Investing in securities of foreign issuers involves special risks not typically associated with investing in securities of U.S. issuers. The risks include possible revaluation of currencies, the ability to repatriate funds, less complete financial information about companies and possible future adverse political and economic developments. Moreover, securities of many foreign issuers and their markets may be less liquid and their prices more volatile than those of securities of comparable U.S. issuers.
Dividends and Distributions to Shareholders: Dividends from net investment income and capital gain distributions are determined in accordance with U.S. federal income tax regulations, which may differ from GAAP. Dividends from net investment income, if any, are declared and paid quarterly. Net realized capital gains, unless offset by any available capital loss carryforward, are typically distributed to shareholders at least annually. Dividends and distributions to shareholders are recorded on the ex-dividend date and are automatically reinvested in full and fractional shares of the Fund based on the net asset value per share at the close of business on the payable date unless the shareholder has elected to have them paid in cash. Distributions paid by the Fund are subject to recharacterization for tax purposes.
Income Taxes: It is the policy of the Fund to continue to qualify as a regulated investment company, if such qualification is in the best interest of the shareholders, by complying with the requirements of Subchapter M of the Internal Revenue Code applicable to regulated investment companies, and by distributing substantially all of its taxable earnings to its shareholders. Accordingly, no provision for federal income or excise tax is necessary.
24
COHEN & STEERS DIVIDEND VALUE FUND, INC.
NOTES TO FINANCIAL STATEMENTS (Unaudited)—(Continued)
Dividend and interest income from holdings in non-U.S. securities is recorded net of non-U.S. taxes paid. Management has analyzed the Fund's tax positions taken on federal income tax returns as well as its tax positions in non-U.S. jurisdictions where it trades for all open tax years and has concluded that as of August 31, 2011, no additional provisions for income tax would be required in the Fund's financial statements. The Fund's tax positions for the tax years for which the applicable statutes of limitations have not expired are subject to examination by the Internal Revenue Service, state departments of revenue and by foreign tax authorities.
Note 2. Investment Advisory and Administration Fees and Other Transactions with Affiliates
Investment Management Fees: The advisor serves as the Fund's advisor pursuant to an investment advisory agreement (the investment advisory agreement). Under the terms of the investment advisory agreement, the advisor provides the Fund with day-to-day investment decisions and generally manages the Fund's investments in accordance with the stated policies of the Fund, subject to the supervision of the Board of Directors.
For the services provided to the Fund, the advisor receives a fee, accrued daily and paid monthly, at the annual rate of 0.80% of the average daily net assets of the Fund for the first $1.5 billion and 0.70% thereafter of the average daily net assets of the Fund.
For the six months ended August 31, 2011, and through June 30, 2012, the advisor has contractually agreed to waive its fee and/or reimburse the Fund for expenses incurred to the extent necessary to maintain the Fund's operating expenses at 1.15% for Class A shares, 1.80% for Class C shares and 0.80% for Class I shares.
Administration Fees: The Fund has entered into an administration agreement with the advisor under which the advisor performs certain administrative functions for the Fund and receives a fee, accrued daily and paid monthly, at the annual rate of 0.04% of the Fund's average daily net assets. For the six months ended August 31, 2011, the Fund paid the advisor $29,980 in fees under this administration agreement. Additionally, the Fund pays State Street Bank and Trust Company as co-administrator under a fund accounting and administration agreement.
Distribution Fees: Shares of the Fund are distributed by Cohen & Steers Securities, LLC (the distributor), an affiliated entity of the advisor. The Fund has adopted a distribution plan (the plan) pursuant to Rule 12b-1 under the Investment Company Act of 1940. The plan provides that the Fund will pay the distributor a fee, accrued daily and paid monthly, at an annual rate of up to 0.25% of the average daily net assets attributable to the Class A shares and up to 0.75% of the average daily net assets attributable to the Class C shares.
For the six months ended August 31, 2011, the Fund has been advised that the distributor received $426 in sales commissions from the sale of Class A shares and that the distributor also received $1,888 of contingent deferred sales charges relating to redemptions of Class C shares. The distributor has advised the Fund that proceeds from the contingent deferred sales charges on this class are paid to the distributor and are used by the distributor to defray its expenses related to providing distribution related services to the Fund in connection with the sale of
25
COHEN & STEERS DIVIDEND VALUE FUND, INC.
NOTES TO FINANCIAL STATEMENTS (Unaudited)—(Continued)
this class, including payments to dealers and other financial intermediaries for selling this class and interest and other financing costs associated with this class.
Shareholder Servicing Fees: For shareholder services, the Fund pays the distributor a fee, accrued daily and paid monthly, at an annual rate of up to 0.10% of the average daily net asset value of the Fund's Class A shares and up to 0.25% of the average daily net asset value of the Fund's Class C shares. The distributor is responsible for paying qualified financial institutions for shareholder services.
Directors' and Officers' Fees: Certain directors and officers of the Fund are also directors, officers, and/or employees of the advisor. The Fund does not pay compensation to any directors and officers affiliated with the advisor except for the Chief Compliance Officer, who received $1,129 from the Fund for the six months ended August 31, 2011.
Other: At August 31, 2011, there was one investor owning 6.8% of the Fund's outstanding shares. Investment activities of this shareholder could have a significant impact on the Fund.
Note 3. Purchases and Sales of Securities
Purchases and sales of securities, excluding short-term investments, for the six months ended August 31, 2011, totaled $25,632,490 and $64,525,880 respectively.
Note 4. Income Tax Information
As of August 31, 2011, the federal tax cost and net unrealized appreciation on securities were as follows:
| Cost for federal income tax purposes | | $ | 114,628,840 | | |
| Gross unrealized appreciation | | $ | 16,665,168 | | |
| Gross unrealized depreciation | | | (4,248,962 | ) | |
| Net unrealized appreciation | | $ | 12,416,206 | | |
As of February 28, 2011, the Fund had a net capital loss carryforward of $29,080,717, of which $13,098,455 will expire on February 28, 2017, and $15,982,262 will expire on February 28, 2018. This carryforward may be used to offset future capital gains to the extent provided by regulations. The Regulated Investment Company Modernization Act of 2010 (the "Act") requires that capital loss carryforwards incurred after the effective date of the Act be used before those previously incurred, thereby increasing the chances that all or a portion of these losses will not be able to be utilized prior to their expiration.
26
COHEN & STEERS DIVIDEND VALUE FUND, INC.
NOTES TO FINANCIAL STATEMENTS (Unaudited)—(Continued)
Note 5. Capital Stock
The Fund is authorized to issue 200 million shares of capital stock, at a par value of $0.001 per share. The Board of Directors of the Fund may increase or decrease the aggregate number of shares of common stock that the Fund has authority to issue. Transactions in Fund shares were as follows:
| | | For the
Six Months Ended
August 31, 2011 | | For the
Year Ended
February 28, 2011 | |
| | | Shares | | Amount | | Shares | | Amount | |
| CLASS A: | |
| Sold | | | 117,017 | | | $ | 1,389,805 | | | | 835,863 | | | $ | 9,051,715 | | |
Issued as reinvestment of
dividends | | | 15,184 | | | | 184,792 | | | | 40,597 | | | | 436,406 | | |
| Redeemed | | | (989,212 | ) | | | (11,864,362 | ) | | | (3,986,047 | ) | | | (43,650,843 | ) | |
Redemption fees retained by
the Funda | | | — | | | | — | | | | — | | | | 2,369 | | |
| Net decrease | | | (857,011 | ) | | $ | (10,289,765 | ) | | | (3,109,587 | ) | | $ | (34,160,353 | ) | |
| CLASS C: | |
| Sold | | | 123,951 | | | $ | 1,488,277 | | | | 549,721 | | | $ | 6,013,856 | | |
Issued as reinvestment of
dividends | | | 2,002 | | | | 24,259 | | | | 5,466 | | | | 58,526 | | |
| Redeemed | | | (465,588 | ) | | | (5,545,080 | ) | | | (1,159,043 | ) | | | (12,791,927 | ) | |
Redemption fees retained by
the Funda | | | — | | | | — | | | | — | | | | 1,451 | | |
| Net decrease | | | (339,635 | ) | | $ | (4,032,544 | ) | | | (603,856 | ) | | $ | (6,718,094 | ) | |
| CLASS I: | |
| Sold | | | 631,251 | | | $ | 7,577,097 | | | | 3,840,724 | | | $ | 42,104,127 | | |
Issued as reinvestment of
dividends | | | 31,542 | | | | 384,021 | | | | 127,934 | | | | 1,377,534 | | |
| Redeemed | | | (2,664,445 | ) | | | (32,244,691 | ) | | | (4,576,915 | ) | | | (52,764,113 | ) | |
Redemption fees retained by
the Funda | | | — | | | | — | | | | — | | | | 3,589 | | |
| Net decrease | | | (2,001,652 | ) | | $ | (24,283,573 | ) | | | (608,257 | ) | | $ | (9,278,863 | ) | |
a A 2% redemption fee may be charged on shares sold within 60 days of the time of purchase. Redemption fees are paid directly to the Fund. Effective March 1, 2011, the Fund no longer charges redemption fees.
27
COHEN & STEERS DIVIDEND VALUE FUND, INC.
NOTES TO FINANCIAL STATEMENTS (Unaudited)—(Continued)
Note 6. Borrowings
The Fund, in conjunction with other Cohen & Steers funds, is a party to a $200,000,000 syndicated credit agreement (the credit agreement) with State Street Bank and Trust Company, as administrative agent and operations agent, and the lenders identified in the credit agreement, which expires January 27, 2012. The Fund pays a commitment fee of 0.125% per annum on its proportionate share of the unused portion of the credit agreement.
During the six months ended August 31, 2011, the Fund did not borrow under the credit agreement.
Note 7. Other
In the normal course of business, the Fund enters into contracts that provide general indemnifications. The Fund's maximum exposure under these arrangements is dependent on claims that may be made against the Fund in the future and, therefore, cannot be estimated; however, based on experience, the risk of material loss from such claims is considered remote.
Note 8. Subsequent Events
Events and transactions occurring after August 31, 2011 and through the date that the financial statements were issued, have been evaluated in the preparation of the financial statements and no additional disclosure is required.
28
COHEN & STEERS DIVIDEND VALUE FUND, INC.
OTHER INFORMATION
A description of the policies and procedures that the Fund uses to determine how to vote proxies relating to portfolio securities is available (i) without charge, upon request, by calling 800-330-7348, (ii) on our Web site at cohenandsteers.com or (iii) on the Securities and Exchange Commission's Web site at http://www.sec.gov. In addition, the Fund's proxy voting record for the most recent 12-month period ended June 30 is available by August 31 of each year (i) without charge, upon request, by calling 800-330-7348 or (ii) on the SEC's Web site at http://www.sec.gov.
The Fund files its complete schedule of portfolio holdings with the SEC for the first and third quarters of each fiscal year on Form N-Q. The Fund's Forms N-Q are available (i) without charge, upon request by calling 800-330-7348, or (ii) on the SEC's Web site at http://www.sec.gov. In addition, the Forms N-Q may be reviewed and copied at the SEC's Public Reference Room in Washington, DC. Information on the operation of the Public Reference Room may be obtained by calling 800-SEC-0330.
Please note that the distributions paid by the Fund to shareholders are subject to recharacterization for tax purposes. The Fund may also pay distributions in excess of the Fund's net investment company taxable income and this excess could be a tax free return of capital distributed from the Fund's assets. The final tax treatment of all distributions is reported to shareholders on their 1099-DIV forms, which are mailed after the close of each calendar year.
APPROVAL OF INVESTMENT ADVISORY AGREEMENT
The Board of Directors of the Fund, including a majority of the directors who are not parties to the Fund's investment advisory agreement (the "Advisory Agreement"), or interested persons of any such party ("Independent Directors"), has the responsibility under the 1940 Act to approve the Fund's Advisory Agreement for its initial two year term and its continuation annually thereafter at a meeting of the Board of Directors called for the purpose of voting on the approval or continuation. At a telephonic meeting held on June 14, 2011 and at a meeting held in person on June 21-22, 2011, the Advisory Agreement was discussed and was unanimously continued for a term ending June 30, 2012 by the Fund's Board of Directors, including the Independent Directors. The Independent Directors were represented by independent counsel who assisted them in their deliberations during the meeting and executive session.
In considering whether to continue the Advisory Agreement, the Board of Directors reviewed materials provided by the Fund's investment advisor (the "Investment Advisor") and Fund counsel which included, among other things, fee, expense and performance information compared to peer funds ("Peer Funds") and performance comparisons to a larger category universe, prepared by an independent data provider; summary information prepared by the Investment Advisor; and a memorandum outlining the legal duties of the Board of Directors. The Board of Directors also spoke directly with representatives of the independent data provider and met with investment advisory personnel. In addition, the Board of Directors considered information provided from time to time by the Investment Advisor throughout the year at meetings of the Board of Directors, including presentations by portfolio
29
COHEN & STEERS DIVIDEND VALUE FUND, INC.
managers relating to the investment performance of the Fund and the investment strategies used in pursuing the Fund's objective. In particular, the Board of Directors considered the following:
(i) The nature, extent and quality of services provided by the Investment Advisor: The Board of Directors reviewed the services that the Investment Advisor provides to the Fund, including, but not limited to, making the day-to-day investment decisions for the Fund, and generally managing the Fund's investments in accordance with the stated policies of the Fund. The Board of Directors also discussed with officers and portfolio managers of the Fund the types of transactions that were being done on behalf of the Fund. Additionally, the Board of Directors took into account the services provided by the Investment Advisor to its other funds, including those that have investment objectives and strategies similar to the Fund. The Board of Directors next considered the education, background and experience of the Investment Advisor's personnel, noting particularly that the favorable history and reputation of the portfolio managers for the Fund has had, and would likely continue to have, a favorable impact on the Fund. The Board of Directors further noted the Investment Advisor's ability to attract qualified and experienced personnel. After consideration of the above factors, among others, the Board of Directors concluded that the nature, extent and quality of services provided by the Investment Advisor are adequate and appropriate.
(ii) Investment performance of the Fund and the Investment Advisor: The Board of Directors considered the investment performance of the Fund compared to Peer Funds and compared to a relevant benchmark. The peer group selected by the independent data provider included large cap core funds. The Board of Directors noted that the Fund underperformed the medians of the Peer Funds and the benchmark for the one- and three-year periods ended March 31, 2011. The Board of Directors also noted that Fund outperformed the median of the Peer Funds and the benchmark for the five-year period ended March 31, 2011. The Board of Directors engaged in discussions with the Investment Advisor regarding the contributors and detractors to the Fund's performance during the periods. The Board of Directors also considered supplemental information provided by the Investment Advisor, including a narrative summary of various factors affecting performance, and the Investment Advisor's performance in managing other funds that invest in real estate, large cap and dividend paying securities. The Board of Directors determined to continue to closely monitor the Fund's performance and requested that the Investment Advisor provide updates for this purpose.
(iii) Cost of the services provided and profits realized by the Investment Advisor from the relationship with the Fund: Next, the Board of Directors considered the advisory fees and administrative fees payable by the Fund as well as the Fund's expense ratio. The Board of Directors noted that the Fund's actual management fee was lower than the Peer Funds' median while the Fund's contractual management fee was higher than the Peer Funds' median. The Board of Directors further noted that the Fund's overall total expense ratio was lower than the Peer Funds' median. The Board of Directors considered that the Investment Advisor continues to waive its fees and/or reimburse expenses to limit overall operating expenses of the Fund. The Board of Directors then considered the administrative services provided by the Investment Advisor, including compliance and accounting services, and further noted that the Fund charges an administration fee payable to the Investment Advisor. In light of the considerations above, the Board of Directors concluded that the Fund's expense structure was satisfactory.
30
COHEN & STEERS DIVIDEND VALUE FUND, INC.
The Board of Directors also reviewed information regarding the profitability to the Investment Advisor of its relationship with the Fund. The Board of Directors considered the level of the Investment Advisor's profits and whether the profits were reasonable for the Investment Advisor. The Board of Directors noted that the Investment Advisor is currently waiving its fee and/or reimbursing expenses of the Fund. The Board of Directors took into consideration other benefits to be derived by the Investment Advisor in connection with the Advisory Agreement, noting particularly the research and related services, within the meaning of Section 28(e) of the Securities Exchange Act of 1934, as amended, that the Investment Advisor receives by allocating the Fund's brokerage transactions. The Board of Directors also considered the fees received by the Investment Advisor under the Administration Agreement, and noted the significant services received, such as compliance, accounting and operational services and furnishing office space and facilities for the Fund, and providing persons satisfactory to the Board of Directors to serve as officers of the Fund, and that these services were beneficial to the Fund. The Board of Directors noted that because of the Fund's small size, the operating expenses continue to be subsidized, and the Fund is not yet profitable.
(iv) The extent to which economies of scale would be realized as the Fund grows and whether fee levels would reflect such economies of scale: The Board of Directors noted that the Fund's advisory fee schedule contains a breakpoint of 10 basis points once the Fund's assets reach $1.5 billion. The Board of Directors considered the Fund's asset size and determined that there were not at this time significant economies of scale that were not being shared with shareholders.
(v) Comparison of services rendered and fees paid to those under other investment advisory contracts, such as contracts of the same and other investment advisers or other clients: As discussed above in (iii), the Board of Directors compared the fees paid under the Advisory Agreement to those under other investment advisory contracts of other investment advisers managing Peer Funds. The Board of Directors also considered the services rendered, fees paid and profitability under the Advisory Agreements to the Investment Advisor's other advisory contracts with institutional and other clients with similar investment mandates, including subadvised mutual funds and proprietary funds. The Board of Directors also considered the entrepreneurial risk and financial exposure assumed by the Investment Advisor in developing and managing the Fund that the Investment Advisor does not have with institutional and other clients. The Board of Directors determined that on a comparative basis the fees under the Advisory Agreement were reasonable in relation to the services provided.
No single factor was cited as determinative to the decision of the Board of Directors. Rather, after weighing all of the considerations and conclusions discussed above, the Board of Directors, including the Independent Directors, unanimously approved the continuation of the Advisory Agreement.
31
COHEN & STEERS DIVIDEND VALUE FUND, INC.
Cohen & Steers Privacy Policy
| Facts | | What Does Cohen & Steers Do With Your Personal Information? | |
|
| Why? | | Financial companies choose how they share your personal information. Federal law gives consumers the right to limit some but not all sharing. Federal law also requires us to tell you how we collect, share, and protect your personal information. Please read this notice carefully to understand what we do. | |
|
| What? | | The types of personal information we collect and share depend on the product or service you have with us. This information can include:
• Social Security number and account balances
• Transaction history and account transactions
• Purchase history and wire transfer instructions | |
|
| How? | | All financial companies need to share customers' personal information to run their everyday business. In the section below, we list the reasons financial companies can share their customers' personal information; the reasons Cohen & Steers chooses to share; and whether you can limit this sharing. | |
|
| Reasons we can share your personal information | | Does Cohen & Steers
share? | | Can you limit this
sharing? | |
For our everyday business purposes—
such as to process your transactions, maintain your account(s), respond to court orders and legal investigations, or reports to credit bureaus | | Yes | | No | |
|
For our marketing purposes—
to offer our products and services to you | | Yes | | No | |
|
| For joint marketing with other financial companies— | | No | | We don't share | |
|
For our affiliates' everyday business purposes—
information about your transactions and experiences | | No | | We don't share | |
|
For our affiliates' everyday business purposes—
information about your creditworthiness | | No | | We don't share | |
|
| For our affiliates to market to you— | | No | | We don't share | |
|
| For non-affiliates to market to you— | | No | | We don't share | |
|
Questions? Call 800.330.7348
32
COHEN & STEERS DIVIDEND VALUE FUND, INC.
Cohen & Steers Privacy Policy—(Continued)
| Who we are | | | |
| Who is providing this notice? | | Cohen & Steers Capital Management, Inc., Cohen & Steers Asia Limited, Cohen & Steers UK Limited, Cohen & Steers Europe SA, Cohen & Steers Securities, LLC, Cohen & Steers Private Funds, and Cohen & Steers Open and Closed-End Funds (collectively, "Cohen & Steers"). | |
|
| What we do | | | |
| How does Cohen & Steers protect my personal information? | | To protect your personal information from unauthorized access and use, we use security measures that comply with federal law. These measures include computer safeguards and secured files and buildings. We restrict access to your information to those employees who need it to perform their jobs, and also require companies that provide services on our behalf to protect your information. | |
|
| How does Cohen & Steers collect my personal information? | | We collect your personal information, for example, when you
• Open an account or buy securities from us
• Provide account information or give us your contact information
• Make deposits or withdrawals from your account
We also collect your personal information from other companies. | |
|
| Why can't I limit all sharing? | | Federal law gives you the right to limit only
• sharing for affiliates' everyday business purposes—information about your creditworthiness
• affiliates from using your information to market to you
• sharing for non-affiliates to market to you
State law and individual companies may give you additional rights to limit sharing. | |
|
| Definitions | | | |
| Affiliates | | Companies related by common ownership or control. They can be financial and nonfinancial companies.
• Cohen & Steers does not share with affiliates. | |
|
| Non-affiliates | | Companies not related by common ownership or control. They can be financial and nonfinancial companies
• Cohen & Steers does not share with non-affiliates so they can market to you. | |
|
| Joint marketing | | A formal agreement between nonaffiliated financial companies that together market financial products or services to you.
• Cohen & Steers does not jointly market. | |
|
33
COHEN & STEERS DIVIDEND VALUE FUND, INC.
Cohen & Steers Investment Solutions
COHEN & STEERS
GLOBAL REALTY SHARES
• Designed for investors seeking total return, investing primarily in global real estate equity securities
• Symbols: CSFAX, CSFBX*, CSFCX, CSSPX
COHEN & STEERS
INSTITUTIONAL GLOBAL REALTY SHARES
• Designed for institutional investors seeking total return, investing primarily in global real estate securities
• Symbol: GRSIX
COHEN & STEERS REALTY INCOME FUND
• Designed for investors seeking total return, investing primarily in real estate securities with an emphasis on both income and capital appreciation
• Symbols: CSEIX, CSBIX*, CSCIX, CSDIX
COHEN & STEERS
INTERNATIONAL REALTY FUND
• Designed for investors seeking total return, investing primarily in international real estate securities
• Symbols: IRFAX, IRFCX, IRFIX
COHEN & STEERS
EMERGING MARKETS REAL ESTATE FUND
• Designed for investors seeking total return, investing primarily in emerging market real estate securities
• Symbols: APFAX, APFCX, APFIX
COHEN & STEERS REALTY SHARES
• Designed for investors seeking total return, investing primarily in REITs
• Symbol: CSRSX
COHEN & STEERS
INSTITUTIONAL REALTY SHARES
• Designed for institutional investors seeking total return, investing primarily in REITs
• Symbol: CSRIX
COHEN & STEERS
GLOBAL INFRASTRUCTURE FUND
• Designed for investors seeking total return, investing primarily in global infrastructure securities
• Symbols: CSUAX, CSUBX*, CSUCX, CSUIX
COHEN & STEERS
DIVIDEND VALUE FUND
• Designed for investors seeking high current income and long-term growth of income and capital appreciation, investing primarily in dividend paying common stocks and preferred stocks
• Symbols: DVFAX, DVFCX, DVFIX
COHEN & STEERS
PREFERRED SECURITIES AND INCOME FUND
• Designed for investors seeking total return (high current income and capital appreciation), investing primarily in preferred and debt securities
• Symbols: CPXAX, CPXCX, CPXIX
Distributed by Cohen & Steers Securities, LLC.
COHEN & STEERS
GLOBAL REALTY MAJORS ETF
• Designed for investors who seek a relatively low-cost "passive" approach for investing in a portfolio of real estate equity securities of companies in a specified index
• Symbol: GRI
Distributed by ALPS Distributors, Inc.
ISHARES COHEN & STEERS
REALTY MAJORS INDEX FUND
• Designed for investors who seek a relatively low-cost "passive" approach for investing in a portfolio of real estate equity securities of companies in a specified index
• Symbol: ICF
Distributed by SEI Investments Distribution Co.
* Class B shares are no longer offered except through dividend reinvestment and permitted exchanges by existing Class B shareholders.
Please consider the investment objectives, risks, charges and expenses of the fund carefully before investing. A prospectus containing this and other information can be obtained by calling 800-330-7348 or by visiting cohenandsteers.com. Please read the prospectus carefully before investing.
34
COHEN & STEERS DIVIDEND VALUE FUND, INC.
OFFICERS AND DIRECTORS
Robert H. Steers
Director and co-chairman
Martin Cohen
Director and co-chairman
Michael G. Clark
Director
Bonnie Cohen
Director
George Grossman
Director
Richard E. Kroon
Director
Richard J. Norman
Director
Frank K. Ross
Director
Willard H. Smith Jr.
Director
C. Edward Ward, Jr.
Director
Adam M. Derechin
President and chief executive officer
Joseph M. Harvey
Vice president
Richard E. Helm
Vice president
Francis C. Poli
Secretary
James Giallanza
Treasurer and chief financial officer
Lisa D. Phelan
Chief compliance officer
KEY INFORMATION
Investment Advisor
Cohen & Steers Capital Management, Inc.
280 Park Avenue
New York, NY 10017
(212) 832-3232
Co-administrator and Custodian
State Street Bank and Trust Company
One Lincoln Street
Boston, MA 02111
Transfer Agent
Boston Financial Data Services, Inc.
30 Dan Road
Canton, MA 02021
(800) 437-9912
Legal Counsel
Ropes & Gray LLP
1211 Avenue of the Americas
New York, NY 10036
Distributor
Cohen & Steers Securities, LLC
280 Park Avenue
New York, NY 10017
Nasdaq Symbol: Class A—DVFAX
Class C—DVFCX
Class I—DVFIX
Web site: cohenandsteers.com
This report is authorized for delivery only to shareholders of Cohen & Steers Dividend Value Fund, Inc. unless accompanied or preceded by the delivery of a currently effective prospectus setting forth details of the Fund. Past performance is of course no guarantee of future results and your investment may be worth more or less at the time you sell.
35
eDelivery NOW AVAILABLE
Stop traditional mail delivery; receive your shareholder reports and prospectus online.
Sign up at cohenandsteers.com
COHEN & STEERS
DIVIDEND VALUE FUND
280 PARK AVENUE
NEW YORK, NY 10017


SEMIANNUAL REPORT
AUGUST 31, 2011
DVFAXSAR
Item 2. Code of Ethics.
Not applicable.
Item 3. Audit Committee Financial Expert.
Not applicable.
Item 4. Principal Accountant Fees and Services.
Not applicable.
Item 5. Audit Committee of Listed Registrants.
Not applicable.
Item 6. Schedule of Investments.
Included in Item 1 above.
Item 7. Disclosure of Proxy Voting Policies and Procedures for Closed-End Management Investment Companies.
Not applicable.
Item 8. Portfolio Managers of Closed-End Investment Companies.
Not applicable.
Item 9. Purchases of Equity Securities by Closed-End Management Investment Company and Affiliated Purchasers.
Not applicable.
Item 10. Submission of Matters to a Vote of Security Holders.
Not applicable.
Item 11. Controls and Procedures.
(a) The registrant’s principal executive officer and principal financial officer have concluded that the registrant’s disclosure controls and procedures are reasonably designed to ensure that information required to be disclosed by the registrant in this Form N-CSR was recorded, processed, summarized and reported within the time periods specified in the Securities and Exchange Commission’s rules and forms, based upon such officers’ evaluation of these controls and procedures as of a date within 90 days of the filing date of this report.
(b) There were no changes in the registrant’s internal control over financial reporting that occurred during the second fiscal quarter of the period covered by this report that have materially affected, or are reasonably likely to materially affect, the registrant’s internal control over financial reporting.
Item 12. Exhibits.
(a)(1) Not applicable.
(a)(2) Certifications of principal executive officer and principal financial officer as required by Rule 30a-2(a) under the Investment Company Act of 1940.
(a)(3) Not applicable.
(b) Certifications of chief executive officer and chief financial officer as required by Rule 30a- 2(b) under the Investment Company Act of 1940.
SIGNATURES
Pursuant to the requirements of the Securities Exchange Act of 1934 and the Investment Company Act of 1940, the registrant has duly caused this report to be signed on its behalf by the undersigned, thereunto duly authorized.
COHEN & STEERS DIVIDEND VALUE FUND, INC.
| By: | /s/ Adam M. Derechin | |
| | Name: Adam M. Derechin | |
| | Title: President and Chief Executive Officer | |
| | | |
| Date: | October 26, 2011 | |
Pursuant to the requirements of the Securities Exchange Act of 1934 and the Investment Company Act of 1940, this report has been signed below by the following persons on behalf of the registrant and in the capacities and on the dates indicated.
| By: | /s/ Adam M. Derechin | |
| | Name: Adam M. Derechin | |
| | Title: President and Chief Executive Officer | |
| | (principal executive officer) | |
| | | |
| By: | /s/ James Giallanza | |
| | Name: James Giallanza | |
| | Title: Treasurer and Chief Financial Officer | |
| | (principal financial officer) | |
| | | |
| | | |
| Date: | October 26, 2011 | |