UNITED STATES
SECURITIES AND EXCHANGE COMMISSION
Washington, D.C. 20549
FORM N-CSR
CERTIFIED SHAREHOLDER REPORT OF REGISTERED
MANAGEMENT INVESTMENT COMPANIES
Investment Company Act file number | 811-21668 |
|
Cohen & Steers Dividend Value Fund, Inc. |
(Exact name of registrant as specified in charter) |
|
280 Park Avenue, New York, NY | | 10017 |
(Address of principal executive offices) | | (Zip code) |
|
Tina M. Payne Cohen & Steers Capital Management, Inc. 280 Park Avenue New York, New York 10017 |
(Name and address of agent for service) |
|
Registrant’s telephone number, including area code: | (212) 832-3232 | |
|
Date of fiscal year end: | February 28 | |
|
Date of reporting period: | August 31, 2014 | |
| | | | | | | | |
Item 1. Reports to Stockholders.
COHEN & STEERS DIVIDEND VALUE FUND, INC.
To Our Shareholders:
We would like to share with you our report for the six months ended August 31, 2014. The net asset values (NAV) per share at that date were $17.17, $17.06 and $17.20 for Class A, Class C and Class I shares, respectively.
The total returns, including income and change in NAV, for the Fund and its comparative benchmarks were:
| | | Six Months Ended
August 31, 2014 | |
| Cohen & Steers Dividend Value Fund—Class A | | | 9.67 | % | |
| Cohen & Steers Dividend Value Fund—Class C | | | 9.33 | % | |
| Cohen & Steers Dividend Value Fund—Class I | | | 9.88 | % | |
| Russell 1000 Value Indexa | | | 9.67 | % | |
| S&P 500 Indexa | | | 8.84 | % | |
The performance data quoted represent past performance. Past performance is no guarantee of future results. The investment return and the principal value of an investment will fluctuate and shares, if redeemed, may be worth more or less than their original cost. Current performance may be lower or higher than the performance data quoted. Current total returns of the Fund can be obtained by visiting our website at cohenandsteers.com. All share class returns assume the reinvestment of all dividends and distributions at NAV. Fund performance figures reflect fee waivers and/or expense reimbursements, without which the performance would have been lower. Performance quoted does not reflect the deduction of the maximum 4.50% initial sales charge on Class A shares or the 1.00% maximum contingent deferred sales charge on Class C shares. The 1.00% maximum contingent deferred sales charge on Class C shares applies if redemption occurs less than one year from purchase. If such charges were included, returns would have been lower. Index performance does not reflect the deduction of any fees, taxes or expenses. An investor cannot invest directly in an index. Performance figures for periods shorter than one year are not annualized.
The Fund implements fair value pricing when the daily change in a specific U.S. market index exceeds a predetermined percentage. Fair value pricing adjusts the valuation of certain non-U.S. equity holdings to account for such index change following the close of foreign markets. This standard practice has been adopted by a majority of the fund industry. In the event fair value pricing is implemented on the first and/or last day of a performance measurement period, the Fund's return may diverge from the relative performance of its benchmark, which does not use fair value pricing.
Please note that distributions paid by the Fund to shareholders are subject to recharacterization for tax purposes and are taxable up to the amount of the Fund's investment company taxable income and net realized gains. Distributions in excess of the Fund's investment company taxable income and realized gains are a return of capital distributed from the Fund's assets.
a The Russell 1000 Value Index measures the performance of those Russell 1000 companies with lower price-to-book ratios and lower forecasted growth values. The Standard and Poor's 500 Composite Stock Index (S&P 500 Index) is an unmanaged index of 500 large capitalization, publicly traded stocks representing a variety of industries that is frequently used as a general measure of stock market performance.
1
COHEN & STEERS DIVIDEND VALUE FUND, INC.
Investment Review
Equities advanced in the six months ended August 31, 2014, despite an unusually harsh U.S. winter, worrying geopolitical events and unsteady global economic progress. The Federal Reserve (the Fed) had begun to trim its bond-buying program, and investors watched to see if interest rates would spike in response. They did not; in fact, the yield on 10-year Treasury notes declined to 2.3% by the end of the period, and inflation remained on hold.
The U.S. gross domestic product (GDP) contracted in the first quarter, due in part to the harsh weather, but second-quarter GDP rebounded. Japan's accommodative monetary policy and infrastructure spending gave the economy an early boost, but in August, the finance minister announced that second-quarter GDP had contracted by 6.8%, widely attributed to April's large increase in the consumption tax. Although China's growth slowed, it remained the fastest-growing big economy. The Eurozone grappled with low inflation and erratic growth, but saw improvement in the economies of the nations on its periphery.
The Russell 1000 Value Index outperformed most of the broader market indexes in the period. Information technology (IT) led the way with a total return of 20.3%.b Increased hiring and high-profile security breaches led to a ramp up in enterprise spending, and hardware manufacturers rallied on the stronger-than-expected demand. Telecommunications services companies (13.3%) were in the news amid contentious merger-and-acquisition activity. Energy (13.0%) reflected concerns that unrest in the Middle East and tensions in the Ukraine would threaten supplies.
In this period of sustained low interest rates, utilities' (9.0%) high income and improving fundamentals appealed to investors, but as the global economy strengthened, investors sought sectors with higher yield potential. Among financial services companies (8.4%), banks waited in vain for interest rates to rise and spreads to widen. The pace of mergers and acquisitions and initial public offerings was good for capital markets firms, but trading activity remained sluggish.
Within health care (7.8%), the increase in patients covered through the Affordable Care Act translated into a drop in uncompensated care. However, investors believed that stronger hospital results meant bad news for managed-care facilities. Pharmaceutical companies latched on to inversion with fervor. "Inversion" is a tax-reduction strategy by which a U.S. company merges with a foreign entity and uses the new foreign address to reduce its overall U.S. tax burden.
Consumer staples (7.3%) lost momentum as the period progressed; there was a falloff in store traffic from a slowdown in consumer spending, higher gasoline prices and online competition. After a slow start, Time Warner injected some air into the consumer discretionary sector (6.8%) when 21st Century Fox made a bid for it in July. The deal later fell apart.
b Sector returns are in U.S. dollars as measured by the Russell 1000 Value Index.
2
COHEN & STEERS DIVIDEND VALUE FUND, INC.
Fund Performance
The Fund advanced in the period and was generally in line with its benchmark. Our overweight and stock selection in the information technology sector were the biggest contributors to relative performance. Stock selection in the health care and financial services sector was favorable as well.
Factors that detracted from relative return included our underweight and stock selection in energy, as well as our stock selection in materials (10.1% total return in the index), industrials (4.1%) and consumer staples.
Investment Outlook
We expect markets to remain choppy as we move into autumn, and note the geopolitical and economic challenges that could trigger volatility. Economic uncertainty in Europe and Japan and the threats posed by Russia in Ukraine and ISIS in the Middle East require careful monitoring.
The mix of low interest rates and solid gains in the U.S. economy, however, lead us to believe investors will be slow to sell equities, and we do not think it is time to become defensive. The pullback in quantitative easing has not triggered a rise in interest rates, as once feared, and U.S. economic data continues to improve. With that said, earnings growth in the third quarter is unlikely to match the second quarter, in our view, as pent-up demand has eased and growth in Europe and Japan has stalled. While inflation remains low, we do not believe the Fed will be quick to raise rates materially given the risks to the global economy.
We still see attractive opportunities. Over the past few months, we have reduced our overweight in information technology, which has had positive returns this year, but have recently stepped back into names that we consider oversold and are now well valued. Within the consumer staples, energy and materials sectors we are similarly rotating out of highly valued names into those with more room to grow.
Market changes, including interest rates, have a disparate impact on sectors and companies, and that often translates into attractive investment opportunities. Modestly higher interest rates, when they come (the Fed now suggests the second quarter of 2015) will put pressure on some of the more-leveraged sectors, but will benefit financial services, particularly banks. Meanwhile, U.S. companies are returning capital to shareholders through increased dividends and stock buybacks—a trend we applaud, and which we expect to continue over the next several quarters.
3
COHEN & STEERS DIVIDEND VALUE FUND, INC.
Sincerely,
 | | 
| |
| ROBERT H. STEERS | | RICHARD E. HELM | |
| Chairman | | Portfolio Manager | |
 | | 
| |
| CHRISTOPHER RHINE | | JAMELAH LEDDY | |
| Portfolio Manager | | Portfolio Manager | |

ANATOLIY CHEREVACH
Portfolio Manager
The views and opinions in the preceding commentary are subject to change without notice and are as of the date of publication. There is no guarantee that any market forecast set forth in the commentary will be realized. This material represents an assessment of the market environment at a specific point in time, should not be relied upon as investment advice and is not intended to predict or depict performance of any investment.
Visit Cohen & Steers online at cohenandsteers.com
For more information about the Cohen & Steers family of mutual funds, visit cohenandsteers.com. Here you will find fund net asset values, fund fact sheets and portfolio highlights, as well as educational resources and timely market updates.
Our website also provides comprehensive information about Cohen & Steers, including our most recent press releases, profiles of our senior investment professionals and their investment approach to each asset class. The Cohen & Steers family of mutual funds invests in major real asset categories focused on global listed real estate, commodities, global listed infrastructure & MLPs, as well as preferred securities and large cap value equities.
4
COHEN & STEERS DIVIDEND VALUE FUND, INC.
Performance Review (Unaudited)
Average Annual Total Returns—For the Periods Ended August 31, 2014
| | Class A Shares | | Class C Shares | | Class I Shares | |
1 Year (with sales charge) | | | 21.71 | %a | | | 25.62 | %b | | | — | | |
1 Year (without sales charge) | | | 27.45 | % | | | 26.62 | % | | | 27.94 | % | |
5 Years (with sales charge) | | | 13.53 | %a | | | 13.83 | % | | | — | | |
5 Years (without sales charge) | | | 14.58 | % | | | 13.83 | % | | | 14.98 | % | |
Since Inceptionc (with sales charge) | | | 6.83 | %a | | | 6.68 | % | | | — | | |
Since Inceptionc (without sales charge) | | | 7.37 | % | | | 6.68 | % | | | 7.76 | % | |
The performance data quoted represent past performance. Past performance is no guarantee of future results. The investment return and principal value of an investment will fluctuate and shares, if redeemed, may be worth more or less than their original cost. Current performance may be lower or higher than the performance data quoted. Performance information current to the most recent month end can be obtained by visiting our website at cohenandsteers.com. All share class returns assume the reinvestment of all dividends and distributions at NAV. The performance table does not reflect the deduction of taxes that a shareholder would pay on Fund distributions or the redemption of Fund shares. During the periods presented above, the investment advisor waived fees and/or reimbursed expenses. Without this arrangement, performance would have been lower.
The annualized gross and net expense ratios, respectively, for each class of shares as disclosed in the July 1, 2014 prospectuses were as follows: Class A—1.34% and 1.00%; Class C—1.99% and 1.65%; and Class I—1.09% and 0.65%. Through June 30, 2016, the investment advisor has contractually agreed to waive its fee and/or reimburse expenses so that the Fund's total annual operating expenses (excluding acquired fund fees and expenses and extraordinary expenses) do not exceed 1.00% for Class A shares, 1.65% for Class C shares and 0.65% for Class I shares. This contractual agreement can be amended at any time by agreement of the Fund and the investment advisor and will terminate automatically in the event of termination of the investment advisory agreement between the investment advisor and the Fund.
a Reflects a 4.50% front-end sales charge.
b Reflects a contingent deferred sales charge of 1.00%.
c Inception date of August 31, 2005.
5
COHEN & STEERS DIVIDEND VALUE FUND, INC.
Expense Example (Unaudited)
As a shareholder of the Fund, you incur two types of costs: (1) transaction costs, including sales charges (loads) on purchase payments and (2) ongoing costs including investment advisory fees; distribution and/or service (12b-1) fees; and other Fund expenses. This example is intended to help you understand your ongoing costs (in dollars) of investing in the Fund and to compare these costs with the ongoing costs of investing in other mutual funds.
The example is based on an investment of $1,000 invested at the beginning of the period and held for the entire period March 1, 2014—August 31, 2014.
Actual Expenses
The first line of the following table provides information about actual account values and expenses. You may use the information in this line, together with the amount you invested, to estimate the expenses that you paid over the period. Simply divide your account value by $1,000 (for example, an $8,600 account value divided by $1,000 = 8.6), then multiply the result by the number in the first line under the heading entitled "Expenses Paid During Period" to estimate the expenses you paid on your account during this period.
Hypothetical Example for Comparison Purposes
The second line of the following table provides information about hypothetical account values and hypothetical expenses based on the Fund's actual expense ratio and an assumed rate of return of 5% per year before expenses, which is not the Fund's actual return. The hypothetical account values and expenses may not be used to estimate the actual ending account balance or expenses you paid for the period. You may use this information to compare the ongoing cost of investing in the Fund and other funds. To do so, compare this 5% hypothetical example with the 5% hypothetical examples that appear in the shareholder reports of other funds.
Please note that the expenses shown in the table are meant to highlight your ongoing costs only and do not reflect any transaction costs, such as sales charges (loads). Therefore, the second line of the table is useful in comparing ongoing costs only, and will not help you determine the relative total costs of owning different funds. In addition, if these transactional costs were included, your costs would have been higher.
6
COHEN & STEERS DIVIDEND VALUE FUND, INC.
Expense Example (Unaudited)—(Continued)
| | | Beginning
Account Value
March 1, 2014 | | Ending
Account Value
August 31, 2014 | | Expenses Paid
During Perioda
March 1, 2014–
August 31, 2014 | |
Class A | |
Actual (9.67% return) | | $ | 1,000.00 | | | $ | 1,096.70 | | | $ | 5.28 | | |
Hypothetical (5% annual return
before expenses) | | $ | 1,000.00 | | | $ | 1,020.16 | | | $ | 5.09 | | |
Class C | |
Actual (9.33% return) | | $ | 1,000.00 | | | $ | 1,093.30 | | | $ | 8.71 | | |
Hypothetical (5% annual return
before expenses) | | $ | 1,000.00 | | | $ | 1,016.89 | | | $ | 8.39 | | |
Class I | |
Actual (9.88% return) | | $ | 1,000.00 | | | $ | 1,098.80 | | | $ | 3.44 | | |
Hypothetical (5% annual return
before expenses) | | $ | 1,000.00 | | | $ | 1,021.93 | | | $ | 3.31 | | |
a Expenses are equal to the Fund's Class A, Class C and Class I annualized expense ratios of 1.00%, 1.65% and 0.65%, respectively, multiplied by the average account value over the period, multiplied by 184/365 (to reflect the one-half year period). If the Fund had borne all of its expenses that were assumed by the investment advisor, the annualized expense ratios would have been 1.33%, 1.98% and 1.05%, respectively.
7
COHEN & STEERS DIVIDEND VALUE FUND, INC.
August 31, 2014
Top Ten Holdings
(Unaudited)
Security | | Value | | % of
Net
Assets | |
Exxon Mobil Corp. | | $ | 13,258,018 | | | | 4.7 | | |
Hewlett-Packard Co. | | | 9,177,000 | | | | 3.2 | | |
JPMorgan Chase & Co. | | | 8,614,305 | | | | 3.0 | | |
Avago Technologies Ltd. (Singapore) | | | 8,364,971 | | | | 3.0 | | |
Tyson Foods, Class A | | | 8,323,722 | | | | 2.9 | | |
Citigroup | | | 7,259,717 | | | | 2.6 | | |
Wells Fargo & Co. | | | 6,790,080 | | | | 2.4 | | |
Bank of America Corp. | | | 6,518,059 | | | | 2.3 | | |
Hartford Financial Services Group | | | 6,313,320 | | | | 2.2 | | |
Devon Energy Corp. | | | 6,124,104 | | | | 2.2 | | |
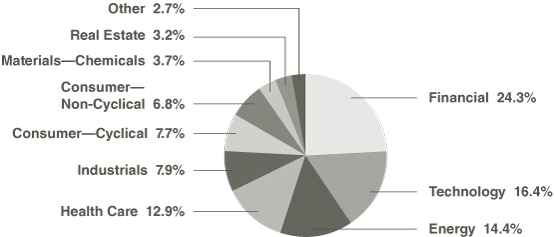
Sector Breakdown
(Based on Net Assets)
(Unaudited)
8
COHEN & STEERS DIVIDEND VALUE FUND, INC.
SCHEDULE OF INVESTMENTS
August 31, 2014 (Unaudited)
| | | | | Number
of Shares | | Value | |
COMMON STOCK | | 99.8% | | | | | | | | | |
COMMUNICATIONS—TOWERS | | 1.3% | | | | | | | | | |
American Tower Corp. | | | | | 37,600 | | | $ | 3,707,360 | | |
CONSUMER—CYCLICAL | | 7.7% | | | | | | | | | |
APPAREL | | 2.0% | | | | | | | | | |
Hanesbrands | | | | | 27,700 | | | | 2,844,236 | | |
VF Corp. | | | | | 44,900 | | | | 2,878,988 | | |
| | | | | | | | 5,723,224 | | |
AUTOMOBILES | | 1.2% | | | | | | | | | |
Ford Motor Co. | | | | | 81,400 | | | | 1,417,174 | | |
Harley-Davidson | | | | | 32,800 | | | | 2,084,768 | | |
| | | | | | | | 3,501,942 | | |
HOME BUILDERS | | 1.0% | | | | | | | | | |
D.R. Horton | | | | | 132,019 | | | | 2,862,172 | | |
HOTELS, RESTAURANTS & LEISURE | | 0.8% | | | | | | | | | |
Las Vegas Sands Corp. | | | | | 31,900 | | | | 2,121,669 | | |
MEDIA | | 2.0% | | | | | | | | | |
The Walt Disney Co. | | | | | 62,500 | | | | 5,617,500 | | |
RETAIL | | 0.7% | | | | | | | | | |
Ross Stores | | | | | 27,400 | | | | 2,066,508 | | |
TOTAL CONSUMER—CYCLICAL | | | | | | | 21,893,015 | | |
CONSUMER—NON-CYCLICAL | | 6.8% | | | | | | | | | |
BEVERAGE | | 1.0% | | | | | | | | | |
Anheuser-Busch InBev NV (ADR) (Belgium) | | | | | 25,700 | | | | 2,872,746 | | |
FOOD PRODUCTS | | 4.5% | |
General Mills | | | | | 53,700 | | | | 2,866,506 | | |
Kroger Co/The | | | | | 28,000 | | | | 1,427,440 | | |
Tyson Foods, Class A | | | | | 218,700 | | | | 8,323,722 | | |
| | | | | | | | 12,617,668 | | |
RETAIL | | 1.3% | | | | | | | | | |
CVS Caremark Corp. | | | | | 45,500 | | | | 3,614,975 | | |
TOTAL CONSUMER—NON-CYCLICAL | | | | | | | 19,105,389 | | |
See accompanying notes to financial statements.
9
COHEN & STEERS DIVIDEND VALUE FUND, INC.
SCHEDULE OF INVESTMENTS—(Continued)
August 31, 2014 (Unaudited)
| | | | | Number
of Shares | | Value | |
ENERGY | | 14.4% | | | | | | | | | |
OIL & GAS | | 12.3% | |
Anadarko Petroleum Corp. | | | | | 25,300 | | | $ | 2,851,057 | | |
BP PLC (ADR) (United Kingdom) | | | | | 54,300 | | | | 2,597,712 | | |
Devon Energy Corp. | | | | | 81,200 | | | | 6,124,104 | | |
Eni S.p.A. (Italy) | | | | | 48,800 | | | | 2,433,168 | | |
EOG Resources | | | | | 36,700 | | | | 4,032,596 | | |
Exxon Mobil Corp. | | | | | 133,300 | | | | 13,258,018 | | |
Kodiak Oil & Gas Corp. (Canada)a | | | | | 229,600 | | | | 3,735,592 | | |
| | | | | | | | 35,032,247 | | |
OIL & GAS SERVICES | | 2.1% | | | | | | | | | |
Baker Hughes | | | | | 54,800 | | | | 3,788,872 | | |
Ensco PLC, Class A (United Kingdom) | | | | | 41,100 | | | | 2,074,728 | | |
| | | | | | | | 5,863,600 | | |
TOTAL ENERGY | | | | | | | 40,895,847 | | |
FINANCIAL | | 24.3% | | | | | | | | | |
BANKS | | 7.1% | | | | | | | | | |
Bank of America Corp. | | | | | 405,100 | | | | 6,518,059 | | |
Capital One Financial Corp. | | | | | 34,000 | | | | 2,790,040 | | |
Comerica | | | | | 25,400 | | | | 1,278,636 | | |
Huntington Bancshares | | | | | 275,300 | | | | 2,710,328 | | |
Wells Fargo & Co. | | | | | 132,000 | | | | 6,790,080 | | |
| | | | | | | | 20,087,143 | | |
CREDIT CARD | | 1.4% | | | | | | | | | |
American Express Co. | | | | | 43,700 | | | | 3,913,335 | | |
DIVERSIFIED FINANCIAL SERVICES | | 10.1% | | | | | | | | | |
Ameriprise Financial | | | | | 44,600 | | | | 5,608,896 | | |
BlackRock | | | | | 12,920 | | | | 4,270,448 | | |
Citigroup | | | | | 140,556 | | | | 7,259,717 | | |
JPMorgan Chase & Co. | | | | | 144,900 | | | | 8,614,305 | | |
Morgan Stanley | | | | | 82,800 | | | | 2,840,868 | | |
| | | | | | | | 28,594,234 | | |
See accompanying notes to financial statements.
10
COHEN & STEERS DIVIDEND VALUE FUND, INC.
SCHEDULE OF INVESTMENTS—(Continued)
August 31, 2014 (Unaudited)
| | | | | Number
of Shares | | Value | |
INSURANCE | | 5.7% | | | | | | | | | |
American International Group | | | | | 98,300 | | | $ | 5,510,698 | | |
Hartford Financial Services Group | | | | | 170,400 | | | | 6,313,320 | | |
Prudential Financial | | | | | 50,500 | | | | 4,529,850 | | |
| | | | | | | | 16,353,868 | | |
TOTAL FINANCIAL | | | | | | | 68,948,580 | | |
HEALTH CARE | | 12.9% | | | | | | | | | |
BIOTECHNOLOGY | | 1.2% | | | | | | | | | |
Gilead Sciencesa | | | | | 31,100 | | | | 3,345,738 | | |
HEALTH CARE EQUIPMENT & SUPPLIES | | 1.4% | | | | | | | | | |
Zimmer Holdings | | | | | 40,300 | | | | 4,002,193 | | |
HEALTH CARE PROVIDERS & SERVICES | | 4.5% | | | | | | | |
Aetna | | | | | 45,800 | | | | 3,761,554 | | |
Cigna Corp. | | | | | 49,100 | | | | 4,644,860 | | |
Universal Health Services, Class B | | | | | 38,800 | | | | 4,440,272 | | |
| | | | | | | | 12,846,686 | | |
HEALTHCARE PRODUCTS | | 1.0% | | | | | | | | | |
Thermo Fisher Scientific | | | | | 23,302 | | | | 2,801,134 | | |
PHARMACEUTICAL | | 4.8% | | | | | | | | | |
Actavis PLC (Ireland)a | | | | | 22,200 | | | | 5,038,956 | | |
Perrigo Co. PLC (Ireland) | | | | | 18,426 | | | | 2,740,683 | | |
Pfizer | | | | | 193,500 | | | | 5,686,965 | | |
| | | | | | | | 13,466,604 | | |
TOTAL HEALTH CARE | | | | | | | 36,462,355 | | |
INDUSTRIALS | | 7.9% | | | | | | | | | |
AEROSPACE & DEFENSE | | 2.4% | | | | | | | | | |
General Dynamics Corp. | | | | | 12,100 | | | | 1,491,325 | | |
L-3 Communications Holdings | | | | | 25,400 | | | | 2,792,730 | | |
Triumph Group | | | | | 37,400 | | | | 2,594,438 | | |
| | | | | | | | 6,878,493 | | |
See accompanying notes to financial statements.
11
COHEN & STEERS DIVIDEND VALUE FUND, INC.
SCHEDULE OF INVESTMENTS—(Continued)
August 31, 2014 (Unaudited)
| | | | | Number
of Shares | | Value | |
AUTO MANUFACTURERS | | 0.9% | | | | | | | | | |
PACCAR | | | | | 41,600 | | | $ | 2,612,896 | | |
BUILDING PRODUCTS | | 0.7% | | | | | | | | | |
Owens Corning | | | | | 53,240 | | | | 1,916,640 | | |
DIVERSIFIED MANUFACTURING | | 0.5% | | | | | | | | | |
General Electric Co. | | | | | 52,900 | | | | 1,374,342 | | |
ELECTRICAL COMPONENT & EQUIPMENT | | 0.5% | | | | | | | | | |
TE Connectivity Ltd. (Switzerland) | | | | | 23,000 | | | | 1,441,640 | | |
MACHINERY | | 1.1% | | | | | | | | | |
SPX Corp. | | | | | 30,948 | | | | 3,220,139 | | |
ROAD & RAIL | | 1.8% | | | | | | | | | |
CSX Corp. | | | | | 162,900 | | | | 5,035,239 | | |
TOTAL INDUSTRIALS | | | | | | | 22,479,389 | | |
MATERIALS—CHEMICALS | | 3.7% | | | | | | | | | |
Eastman Chemical Co. | | | | | 64,159 | | | | 5,291,193 | | |
Ecolab | | | | | 12,600 | | | | 1,446,732 | | |
Monsanto Co. | | | | | 11,700 | | | | 1,353,105 | | |
Potash Corp. of Saskatchewan (Canada) | | | | | 70,500 | | | | 2,478,780 | | |
| | | | | | | | 10,569,810 | | |
REAL ESTATE | | 3.2% | | | | | | | |
OFFICE | | 0.8% | | | | | | | | | |
SL Green Realty Corp. | | | | | 19,800 | | | | 2,165,130 | | |
SELF STORAGE | | 1.2% | | | | | | | | | |
Extra Space Storage | | | | | 63,600 | | | | 3,351,720 | | |
SHOPPING CENTERS—REGIONAL MALL | | 1.2% | | | | | | | | | |
Simon Property Group | | | | | 20,400 | | | | 3,468,612 | | |
TOTAL REAL ESTATE | | | | | | | 8,985,462 | | |
See accompanying notes to financial statements.
12
COHEN & STEERS DIVIDEND VALUE FUND, INC.
SCHEDULE OF INVESTMENTS—(Continued)
August 31, 2014 (Unaudited)
| | | | | Number
of Shares | | Value | |
TECHNOLOGY | | 16.4% | | | | | | | | | |
COMMUNICATIONS EQUIPMENT | | 1.7% | | | | | | | | | |
F5 Networksa | | | | | 38,100 | | | $ | 4,731,639 | | |
COMPUTERS | | 4.5% | | | | | | | | | |
Apple | | | | | 35,400 | | | | 3,628,500 | | |
Hewlett-Packard Co. | | | | | 241,500 | | | | 9,177,000 | | |
| | | | | | | | 12,805,500 | | |
COMPUTERS & PERIPHERALS | | 1.1% | | | | | | | | | |
Western Digital Corp. | | | | | 29,000 | | | | 2,987,290 | | |
INTERNET SERVICE PROVIDER | | 0.5% | | | | | | | | | |
Yahoo!a | | | | | 35,100 | | | | 1,351,701 | | |
SEMICONDUCTORS | | 5.6% | | | | | | | | | |
Avago Technologies Ltd. (Singapore) | | | | | 101,900 | | | | 8,364,971 | | |
SanDisk Corp. | | | | | 21,900 | | | | 2,145,324 | | |
Skyworks Solutions | | | | | 45,100 | | | | 2,555,366 | | |
Xilinx | | | | | 67,200 | | | | 2,839,200 | | |
| | | | | | | | 15,904,861 | | |
SERVICES | | 1.7% | | | | | | | | | |
Citrix Systemsa | | | | | 70,200 | | | | 4,932,252 | | |
SOFTWARE | | 1.3% | | | | | | | | | |
Microsoft Corp. | | | | | 81,000 | | | | 3,679,830 | | |
TOTAL TECHNOLOGY | | | | | | | 46,393,073 | | |
UTILITIES—ELECTRIC UTILITIES | | 1.2% | | | | | | | | | |
NextEra Energy | | | | | 33,000 | | | | 3,248,850 | | |
TOTAL COMMON STOCK
(Identified cost—$218,953,111) | | | | | | | 282,689,130 | | |
See accompanying notes to financial statements.
13
COHEN & STEERS DIVIDEND VALUE FUND, INC.
SCHEDULE OF INVESTMENTS—(Continued)
August 31, 2014 (Unaudited)
| | | | | Number
of Shares | | Value | |
SHORT-TERM INVESTMENTS | | | 0.2% | | | | | | | | | | |
MONEY MARKET FUNDS | |
State Street Institutional Treasury Money
Market Fund, 0.00%b | | | | | 700,000 | | | $ | 700,000 | | |
TOTAL SHORT-TERM INVESTMENTS
(Identified cost—$700,000) | | | | | | | | | 700,000 | | |
TOTAL INVESTMENTS (Identified cost—$219,653,111) | | | 100.0 | % | | | | | | | 283,389,130 | | |
OTHER ASSETS IN EXCESS OF LIABILITIES | | | 0.0 | | | | | | | | 16,887 | | |
NET ASSETS | | | 100.0 | % | | | | | | $ | 283,406,017 | | |
Glossary of Portfolio Abbreviations
ADR American Depositary Receipt
Note: Percentages indicated are based on the net assets of the Fund.
a Non-income producing security.
b Rate quoted represents the annualized seven-day yield of the Fund.
See accompanying notes to financial statements.
14
COHEN & STEERS DIVIDEND VALUE FUND, INC.
STATEMENT OF ASSETS AND LIABILITIES
August 31, 2014 (Unaudited)
ASSETS: | |
Investments in securities, at value (Identified cost—$219,653,111) | | $ | 283,389,130 | | |
Cash | | | 746,766 | | |
Foreign currency, at value (Identified cost—$6,488) | | | 6,489 | | |
Receivable for: | |
Investment securities sold | | | 1,909,508 | | |
Dividends | | | 456,297 | | |
Fund shares sold | | | 141,412 | | |
Other assets | | | 2,556 | | |
Total Assets | | | 286,652,158 | | |
LIABILITIES: | |
Payable for: | |
Investment securities purchased | | | 2,550,401 | | |
Fund shares redeemed | | | 441,891 | | |
Investment advisory fees | | | 110,765 | | |
Shareholder servicing fees | | | 29,642 | | |
Administration fees | | | 9,411 | | |
Directors' fees | | | 4,743 | | |
Distribution fees | | | 3,707 | | |
Other liabilities | | | 95,581 | | |
Total Liabilities | | | 3,246,141 | | |
NET ASSETS | | $ | 283,406,017 | | |
NET ASSETS consist of: | |
Paid-in capital | | $ | 197,451,208 | | |
Accumulated undistributed net investment income | | | 45,754 | | |
Accumulated undistributed net realized gain | | | 22,172,859 | | |
Net unrealized appreciation | | | 63,736,196 | | |
| | | $ | 283,406,017 | | |
See accompanying notes to financial statements.
15
COHEN & STEERS DIVIDEND VALUE FUND, INC.
STATEMENT OF ASSETS AND LIABILITIES—(Continued)
August 31, 2014 (Unaudited)
CLASS A SHARES: | |
NET ASSETS | | $ | 22,073,738 | | |
Shares issued and outstanding ($0.001 par value common stock
outstanding) | | | 1,285,580 | | |
Net asset value and redemption price per share | | $ | 17.17 | | |
Maximum offering price per share ($17.17 ÷ 0.955)a | | $ | 17.98 | | |
CLASS C SHARES: | |
NET ASSETS | | $ | 37,706,172 | | |
Shares issued and outstanding ($0.001 par value common stock
outstanding) | | | 2,209,773 | | |
Net asset value and offering price per shareb | | $ | 17.06 | | |
CLASS I SHARES: | |
NET ASSETS | | $ | 223,626,107 | | |
Shares issued and outstanding ($0.001 par value common stock
outstanding) | | | 13,001,025 | | |
Net asset value, offering and redemption price per share | | $ | 17.20 | | |
a On investments of $100,000 or more, the offering price is reduced.
b Redemption price per share is equal to the net asset value per share less any applicable contingent deferred sales charge of 1.00% on shares held for less than one year.
See accompanying notes to financial statements.
16
COHEN & STEERS DIVIDEND VALUE FUND, INC.
STATEMENT OF OPERATIONS
For the Six Months Ended August 31, 2014 (Unaudited)
Investment Income: | |
Dividend income (net of $15,643 of foreign withholding tax) | | $ | 2,092,489 | | |
Expenses: | |
Investment advisory fees | | | 1,092,670 | | |
Distribution fees—Class A | | | 31,066 | | |
Distribution fees—Class C | | | 140,252 | | |
Shareholder servicing fees—Class A | | | 12,426 | | |
Shareholder servicing fees—Class C | | | 46,751 | | |
Shareholder servicing fees—Class I | | | 83,390 | | |
Administration fees | | | 83,447 | | |
Registration and filing fees | | | 39,911 | | |
Professional fees | | | 37,312 | | |
Shareholder reporting expenses | | | 25,267 | | |
Transfer agent fees and expenses | | | 16,873 | | |
Custodian fees and expenses | | | 14,012 | | |
Directors' fees and expenses | | | 8,516 | | |
| Line of credit fees | | | 2,404 | | |
| Miscellaneous | | | 12,071 | | |
Total Expenses | | | 1,646,368 | | |
Reduction of Expenses (See Note 2) | | | (528,078 | ) | |
Net Expenses | | | 1,118,290 | | |
Net Investment Income | | | 974,199 | | |
Net Realized and Unrealized Gain (Loss): | |
Net realized gain (loss) on: | |
Investments | | | 22,780,356 | | |
Foreign currency transactions | | | (317 | ) | |
Net realized gain | | | 22,780,039 | | |
Net change in unrealized appreciation (depreciation) on: | |
Investments | | | 1,713,484 | | |
Foreign currency translations | | | (319 | ) | |
Net change in unrealized appreciation (depreciation) | | | 1,713,165 | | |
Net realized and unrealized gain | | | 24,493,204 | | |
Net Increase in Net Assets Resulting from Operations | | $ | 25,467,403 | | |
See accompanying notes to financial statements.
17
COHEN & STEERS DIVIDEND VALUE FUND, INC.
STATEMENT OF CHANGES IN NET ASSETS (Unaudited)
| | | For the
Six Months Ended
August 31, 2014 | | For the
Year Ended
February 28, 2014 | |
Change in Net Assets: | |
From Operations: | |
Net investment income | | $ | 974,199 | | | $ | 3,042,177 | | |
Net realized gain | | | 22,780,039 | | | | 40,280,066 | | |
Net change in unrealized appreciation
(depreciation) | | | 1,713,165 | | | | 15,201,227 | | |
Net increase in net assets resulting
from operations | | | 25,467,403 | | | | 58,523,470 | | |
Dividends and Distributions to Shareholders from: | |
Net investment income: | |
Class A | | | (81,070 | ) | | | (337,124 | ) | |
Class C | | | (10,676 | ) | | | (157,615 | ) | |
Class I | | | (972,917 | ) | | | (2,787,834 | ) | |
Net realized gain: | |
Class A | | | (1,678,028 | ) | | | (533,640 | ) | |
Class C | | | (2,568,778 | ) | | | (655,920 | ) | |
Class I | | | (14,273,424 | ) | | | (3,820,512 | ) | |
Total dividends and distributions
to shareholders | | | (19,584,893 | ) | | | (8,292,645 | ) | |
Capital Stock Transactions: | |
Increase (decrease) in net assets from Fund share
transactions | | | 9,381,934 | | | | (31,206,385 | ) | |
Total increase in net assets | | | 15,264,444 | | | | 19,024,440 | | |
Net Assets: | |
Beginning of period | | | 268,141,573 | | | | 249,117,133 | | |
End of perioda | | $ | 283,406,017 | | | $ | 268,141,573 | | |
a Includes accumulated undistributed net investment income of $45,754 and $136,218, respectively.
See accompanying notes to financial statements.
18
COHEN & STEERS DIVIDEND VALUE FUND, INC.
FINANCIAL HIGHLIGHTS (Unaudited)
The following table includes selected data for a share outstanding throughout each period and other performance information derived from the financial statements. It should be read in conjunction with the financial statements and notes thereto.
| | | Class A | |
| | | For the Six | | For the Year Ended February 28, | |
| | | Months Ended | | | |
Per Share Operating Performance: | | August 31, 2014 | | 2014 | | 2013 | | 2012a | | 2011 | | 2010 | |
Net asset value,
beginning of period | | $ | 16.83 | | | $ | 13.92 | | | $ | 12.47 | | | $ | 12.23 | | | $ | 10.72 | | | $ | 7.59 | | |
Income (loss) from investment
operations: | |
Net investment incomeb | | | 0.04 | | | | 0.15 | | | | 0.18 | | | | 0.15 | | | | 0.13 | | | | 0.14 | | |
Net realized and unrealized
gain | | | 1.57 | | | | 3.24 | | | | 1.43 | | | | 0.24 | | | | 1.51 | | | | 3.13 | | |
Total from investment
operations | | | 1.61 | | | | 3.39 | | | | 1.61 | | | | 0.39 | | | | 1.64 | | | | 3.27 | | |
Less dividends and distributions
to shareholders from: | |
Net investment income | | | (0.06 | ) | | | (0.17 | ) | | | (0.16 | ) | | | (0.15 | ) | | | (0.13 | ) | | | (0.14 | ) | |
Net realized gain | | | (1.21 | ) | | | (0.31 | ) | | | — | | | | — | | | | — | | | | — | | |
Total dividends and
distributions to
shareholders | | | (1.27 | ) | | | (0.48 | ) | | | (0.16 | ) | | | (0.15 | ) | | | (0.13 | ) | | | (0.14 | ) | |
Redemption fees retained by
the Fund | | | — | | | | — | | | | — | | | | 0.00 | c | | | 0.00 | c | | | 0.00 | c | |
Net increase in net asset value | | | 0.34 | | | | 2.91 | | | | 1.45 | | | | 0.24 | | | | 1.51 | | | | 3.13 | | |
Net asset value, end of period | | $ | 17.17 | | | $ | 16.83 | | | $ | 13.92 | | | $ | 12.47 | | | $ | 12.23 | | | $ | 10.72 | | |
Total investment returnd,e | | | 9.67 | %f,g | | | 24.77 | %g | | | 13.01 | % | | | 3.34 | % | | | 15.48 | % | | | 43.41 | % | |
See accompanying notes to financial statements.
19
COHEN & STEERS DIVIDEND VALUE FUND, INC.
FINANCIAL HIGHLIGHTS (Unaudited)—(Continued)
| | | Class A | |
| | | For the Six | | For the Year Ended February 28, | |
| | | Months Ended | | | |
Ratios/Supplemental Data: | | August 31, 2014 | | 2014 | | 2013 | | 2012a | | 2011 | | 2010 | |
Net assets, end of period
(in millions) | | $ | 22.1 | | | $ | 27.6 | | | $ | 30.1 | | | $ | 28.1 | | | $ | 43.4 | | | $ | 71.3 | | |
Ratio of expenses to average
daily net assets (before
expense reduction) | | | 1.33 | %h | | | 1.34 | % | | | 1.37 | %i | | | 1.51 | %i | | | 1.45 | %i | | | 1.51 | %i | |
Ratio of expenses to average
daily net assets (net of
expense reduction) | | | 1.00 | %h | | | 1.00 | % | | | 1.01 | %i | | | 1.15 | %i | | | 1.15 | %i | | | 1.15 | %i | |
Ratio of net investment income to
average daily net assets
(before expense reduction) | | | 0.19 | %h | | | 0.64 | % | | | 1.08 | %i | | | 0.91 | %i | | | 0.85 | %i | | | 1.02 | % | |
Ratio of net investment income to
average daily net assets (net of
expense reduction) | | | 0.52 | %h | | | 0.98 | % | | | 1.44 | %i | | | 1.27 | %i | | | 1.15 | %i | | | 1.38 | % | |
Portfolio turnover rate | | | 41 | %f | | | 83 | % | | | 37 | % | | | 33 | % | | | 61 | % | | | 37 | % | |
a For the year ended February 29.
b Calculation based on average shares outstanding.
c Amount is less than $0.005.
d Return assumes the reinvestment of all dividends and distributions at NAV.
e Does not reflect sales charges, which would reduce return.
f Not annualized.
g The February 28, 2014 net asset value reflects adjustments in accordance with accounting principles generally accepted in the United States of America and as such, the net asset value for financial reporting purposes and the returns that would be based upon the net asset value would differ from the net asset value and return reported on February 28, 2014.
h Annualized.
i Non-class specific expenses are calculated at the Fund level and class specific expenses are calculated at the class level.
See accompanying notes to financial statements.
20
COHEN & STEERS DIVIDEND VALUE FUND, INC.
FINANCIAL HIGHLIGHTS (Unaudited)—(Continued)
| | | Class C | |
| | | For the Six | | For the Year Ended February 28, | |
| | | Months Ended | | | |
Per Share Operating Performance: | | August 31, 2014 | | 2014 | | 2013 | | 2012a | | 2011 | | 2010 | |
Net asset value,
beginning of period | | $ | 16.74 | | | $ | 13.85 | | | $ | 12.41 | | | $ | 12.17 | | | $ | 10.67 | | | $ | 7.55 | | |
Income (loss) from investment
operations: | |
Net investment income
(loss)b | | | (0.01 | ) | | | 0.05 | | | | 0.10 | | | | 0.07 | | | | 0.06 | | | | 0.07 | | |
Net realized and unrealized
gain | | | 1.55 | | | | 3.23 | | | | 1.42 | | | | 0.25 | | | | 1.50 | | | | 3.13 | | |
Total from investment
operations | | | 1.54 | | | | 3.28 | | | | 1.52 | | | | 0.32 | | | | 1.56 | | | | 3.20 | | |
Less dividends and distributions
to shareholders from: | |
Net investment income | | | (0.01 | ) | | | (0.08 | ) | | | (0.08 | ) | | | (0.08 | ) | | | (0.06 | ) | | | (0.08 | ) | |
Net realized gain | | | (1.21 | ) | | | (0.31 | ) | | | — | | | | — | | | | — | | | | — | | |
Total dividends and
distributions to
shareholders | | | (1.22 | ) | | | (0.39 | ) | | | (0.08 | ) | | | (0.08 | ) | | | (0.06 | ) | | | (0.08 | ) | |
Redemption fees retained by
the Fund | | | — | | | | — | | | | — | | | | 0.00 | c | | | 0.00 | c | | | 0.00 | c | |
Net increase in net asset value | | | 0.32 | | | | 2.89 | | | | 1.44 | | | | 0.24 | | | | 1.50 | | | | 3.12 | | |
Net asset value, end of period | | $ | 17.06 | | | $ | 16.74 | | | $ | 13.85 | | | $ | 12.41 | | | $ | 12.17 | | | $ | 10.67 | d | |
Total investment returne,f | | | 9.33 | %g | | | 23.91 | % | | | 12.26 | % | | | 2.66 | % | | | 14.84 | %d | | | 42.43 | %d | |
See accompanying notes to financial statements.
21
COHEN & STEERS DIVIDEND VALUE FUND, INC.
FINANCIAL HIGHLIGHTS (Unaudited)—(Continued)
| | | Class C | |
| | | For the Six | | For the Year Ended February 28, | |
| | | Months Ended | | | |
Ratios/Supplemental Data: | | August 31, 2014 | | 2014 | | 2013 | | 2012a | | 2011 | | 2010 | |
Net assets, end of period
(in millions) | | $ | 37.7 | | | $ | 37.0 | | | $ | 28.5 | | | $ | 31.5 | | | $ | 39.2 | | | $ | 40.8 | | |
Ratio of expenses to average
daily net assets (before
expense reduction) | | | 1.98 | %h | | | 1.99 | % | | | 2.02 | %i | | | 2.16 | %i | | | 2.10 | %i | | | 2.16 | %i | |
Ratio of expenses to average
daily net assets (net of
expense reduction) | | | 1.65 | %h | | | 1.65 | % | | | 1.66 | %i | | | 1.80 | %i | | | 1.80 | %i | | | 1.80 | %i | |
Ratio of net investment income
(loss) to average daily
net assets (before expense
reduction) | | | (0.45 | )%h | | | (0.03 | )% | | | 0.42 | %i | | | 0.28 | %i | | | 0.23 | %i | | | 0.39 | % | |
Ratio of net investment income
(loss) to average daily
net assets (net of expense
reduction) | | | (0.12 | )%h | | | 0.31 | % | | | 0.78 | %i | | | 0.64 | %i | | | 0.53 | %i | | | 0.75 | % | |
Portfolio turnover rate | | | 41 | %g | | | 83 | % | | | 37 | % | | | 33 | % | | | 61 | % | | | 37 | % | |
a For the year ended February 29.
b Calculation based on average shares outstanding.
c Amount is less than $0.005.
d The February 28, 2010 net asset value reflects adjustments in accordance with accounting principles generally accepted in the United States of America and as such, the net asset value for financial reporting purposes and the returns that would be based upon the net asset value would differ from the net asset value and return reported on February 28, 2010.
e Return assumes the reinvestment of all dividends and distributions at NAV.
f Does not reflect sales charges, which would reduce return.
g Not annualized.
h Annualized.
i Non-class specific expenses are calculated at the Fund level and class specific expenses are calculated at the class level.
See accompanying notes to financial statements.
22
COHEN & STEERS DIVIDEND VALUE FUND, INC.
FINANCIAL HIGHLIGHTS (Unaudited)—(Continued)
| | | Class I | |
| | | For the Six | | For the Year Ended February 28, | |
| | | Months Ended | | | |
Per Share Operating Performance: | | August 31, 2014 | | 2014 | | 2013 | | 2012a | | 2011 | | 2010 | |
Net asset value,
beginning of period | | $ | 16.86 | | | $ | 13.93 | | | $ | 12.48 | | | $ | 12.24 | | | $ | 10.73 | | | $ | 7.59 | | |
Income (loss) from investment
operations: | |
Net investment incomeb | | | 0.08 | | | | 0.20 | | | | 0.24 | | | | 0.19 | | | | 0.17 | | | | 0.17 | | |
Net realized and unrealized
gain | | | 1.55 | | | | 3.25 | | | | 1.41 | | | | 0.25 | | | | 1.51 | | | | 3.15 | | |
Total from investment
operations | | | 1.63 | | | | 3.45 | | | | 1.65 | | | | 0.44 | | | | 1.68 | | | | 3.32 | | |
Less dividends and distributions
to shareholders from: | |
Net investment income | | | (0.08 | ) | | | (0.21 | ) | | | (0.20 | ) | | | (0.20 | ) | | | (0.17 | ) | | | (0.18 | ) | |
Net realized gain | | | (1.21 | ) | | | (0.31 | ) | | | — | | | | — | | | | — | | | | — | | |
Total dividends and
distributions
to shareholders | | | (1.29 | ) | | | (0.52 | ) | | | (0.20 | ) | | | (0.20 | ) | | | (0.17 | ) | | | (0.18 | ) | |
Redemption fees retained by
the Fund | | | — | | | | — | | | | — | | | | 0.00 | c | | | 0.00 | c | | | 0.00 | c | |
Net increase in net asset value | | | 0.34 | | | | 2.93 | | | | 1.45 | | | | 0.24 | | | | 1.51 | | | | 3.14 | | |
Net asset value, end of period | | $ | 17.20 | | | $ | 16.86 | | | $ | 13.93 | | | $ | 12.48 | | | $ | 12.24 | | | $ | 10.73 | | |
Total investment returnd | | | 9.88 | %e | | | 25.19 | % | | | 13.38 | % | | | 3.72 | % | | | 15.89 | % | | | 44.03 | % | |
See accompanying notes to financial statements.
23
COHEN & STEERS DIVIDEND VALUE FUND, INC.
FINANCIAL HIGHLIGHTS (Unaudited)—(Continued)
| | | Class I | |
| | | For the Six | | For the Year Ended February 28, | |
| | | Months Ended | | | |
Ratios/Supplemental Data: | | August 31, 2014 | | 2014 | | 2013 | | 2012a | | 2011 | | 2010 | |
Net assets, end of period
(in millions) | | $ | 223.6 | | | $ | 203.5 | | | $ | 190.5 | | | $ | 74.6 | | | $ | 94.7 | | | $ | 89.5 | | |
Ratio of expenses to average
daily net assets (before
expense reduction) | | | 1.05 | %f | | | 1.06 | % | | | 1.02 | %g | | | 1.16 | %g | | | 1.10 | %g | | | 1.16 | %g | |
Ratio of expenses to average
daily net assets (net of
expense reduction) | | | 0.65 | %f | | | 0.65 | % | | | 0.68 | %g | | | 0.80 | %g | | | 0.80 | %g | | | 0.80 | %g | |
Ratio of net investment income to
average daily net assets
(before expense reduction) | | | 0.48 | %f | | | 0.91 | % | | | 1.48 | %g | | | 1.27 | %g | | | 1.24 | %g | | | 1.36 | % | |
Ratio of net investment income to
average daily net assets (net of
expense reduction) | | | 0.88 | %f | | | 1.32 | % | | | 1.82 | %g | | | 1.63 | %g | | | 1.54 | %g | | | 1.72 | % | |
Portfolio turnover rate | | | 41 | %e | | | 83 | % | | | 37 | % | | | 33 | % | | | 61 | % | | | 37 | % | |
a For the year ended February 29.
b Calculation based on average shares outstanding.
c Amount is less than $0.005.
d Return assumes the reinvestment of all dividends and distributions at NAV.
e Not annualized.
f Annualized.
g Non-class specific expenses are calculated at the Fund level and class specific expenses are calculated at the class level.
See accompanying notes to financial statements.
24
COHEN & STEERS DIVIDEND VALUE FUND, INC.
NOTES TO FINANCIAL STATEMENTS (Unaudited)
Note 1. Organization and Significant Accounting Policies
Cohen & Steers Dividend Value Fund, Inc. (the Fund) was incorporated under the laws of the State of Maryland on November 9, 2004 and is registered under the Investment Company Act of 1940, as amended (the 1940 Act), as a diversified, open-end management investment company. The Fund applies investment company accounting and reporting guidance of the Financial Accounting Standards Board (FASB) Accounting Standards Codification Topic 946. The Fund's investment objectives are to provide long-term growth of income and capital appreciation. The authorized shares of the Fund are divided into three classes designated Class A, C and I shares. Each of the Fund's shares has equal dividend, liquidation and voting rights (except for matters relating to distributions and shareholder servicing of such shares).
The following is a summary of significant accounting policies consistently followed by the Fund in the preparation of its financial statements. The policies are in conformity with accounting principles generally accepted in the United States of America (GAAP). The preparation of the financial statements in accordance with GAAP requires management to make estimates and assumptions that affect the reported amounts of assets and liabilities at the date of the financial statements and the reported amounts of income and expenses during the reporting period. Actual results could differ from those estimates.
Portfolio Valuation: Investments in securities that are listed on the New York Stock Exchange (NYSE) are valued, except as indicated below, at the last sale price reflected at the close of the NYSE on the business day as of which such value is being determined. If there has been no sale on such day, the securities are valued at the mean of the closing bid and ask prices on such day or, if no ask price is available, at the bid price.
Securities not listed on the NYSE but listed on other domestic or foreign securities exchanges are valued in a similar manner. Securities traded on more than one securities exchange are valued at the last sale price reflected at the close of the exchange representing the principal market for such securities on the business day as of which such value is being determined. If after the close of a foreign market, but prior to the close of business on the day the securities are being valued, market conditions change significantly, certain non-U.S. equity holdings may be fair valued pursuant to procedures established by the Board of Directors.
Readily marketable securities traded in the over-the-counter market, including listed securities whose primary market is believed by Cohen & Steers Capital Management, Inc. (the investment advisor) to be over-the-counter, are valued at the last sale price on the valuation date as reported by sources deemed appropriate by the Board of Directors to reflect their fair market value. If there has been no sale on such day, the securities are valued at the mean of the closing bid and ask prices on such day or, if no ask price is available, at the bid price.
Short-term debt securities with a maturity date of 60 days or less are valued at amortized cost, which approximates fair value. Investments in open-end mutual funds are valued at their closing net asset value.
The policies and procedures approved by the Fund's Board of Directors delegate authority to make fair value determinations to the investment advisor, subject to the oversight of the Board of
25
COHEN & STEERS DIVIDEND VALUE FUND, INC.
NOTES TO FINANCIAL STATEMENTS (Unaudited)—(Continued)
Directors. The investment advisor has established a valuation committee (Valuation Committee) to administer, implement and oversee the fair valuation process according to the policies and procedures approved annually by the Board of Directors. Among other things, these procedures allow the Fund to utilize independent pricing services, quotations from securities and financial instrument dealers and other market sources to determine fair value.
Securities for which market prices are unavailable, or securities for which the investment advisor determines that the bid and/or ask price or a counterparty valuation does not reflect market value, will be valued at fair value, as determined in good faith by the Valuation Committee, pursuant to procedures approved by the Fund's Board of Directors. Circumstances in which market prices may be unavailable include, but are not limited to, when trading in a security is suspended, the exchange on which the security is traded is subject to an unscheduled close or disruption or material events occur after the close of the exchange on which the security is principally traded. In these circumstances, the Fund determines fair value in a manner that fairly reflects the market value of the security on the valuation date based on consideration of any information or factors it deems appropriate. These may include, but are not limited to, recent transactions in comparable securities, information relating to the specific security and developments in the markets.
Foreign equity fair value pricing procedures utilized by the Fund may cause certain non-U.S. equity holdings to be fair valued on the basis of fair value factors provided by a pricing service to reflect any significant market movements between the time the Fund values such securities and the earlier closing of foreign markets.
The Fund's use of fair value pricing may cause the net asset value of Fund shares to differ from the net asset value that would be calculated using market quotations. Fair value pricing involves subjective judgments and it is possible that the fair value determined for a security may be materially different than the value that could be realized upon the sale of that security.
Fair value is defined as the price that the Fund would expect to receive upon the sale of an investment or expect to pay to transfer a liability in an orderly transaction with an independent buyer in the principal market or, in the absence of a principal market, the most advantageous market for the investment or liability. The hierarchy of inputs that are used in determining the fair value of the Fund's investments is summarized below.
• Level 1—quoted prices in active markets for identical investments
• Level 2—other significant observable inputs (including quoted prices for similar investments, interest rates, credit risk, etc.)
• Level 3—significant unobservable inputs (including the Fund's own assumptions in determining the fair value of investments)
The inputs or methodology used for valuing securities are not necessarily an indication of the risk associated with investing in those securities.
For movements between the levels within the fair value hierarchy, the Fund has adopted a policy of recognizing the transfer at the end of the period in which the underlying event causing the movement occurred. Changes in valuation techniques may result in transfers into or out of an assigned level within the disclosure hierarchy. There were no transfers between Level 1 and Level 2 securities as of August 31, 2014.
26
COHEN & STEERS DIVIDEND VALUE FUND, INC.
NOTES TO FINANCIAL STATEMENTS (Unaudited)—(Continued)
The following is a summary of the inputs used as of August 31, 2014 in valuing the Fund's investments carried at value:
| | Total | | Quoted Prices
In Active
Markets for
Identical
Investments
(Level 1) | | Other
Significant
Observable
Inputs
(Level 2) | | Significant
Unobservable
Inputs
(Level 3) | |
Common Stock | | $ | 282,689,130 | | | $ | 282,689,130 | | | $ | — | | | $ | — | | |
Money Market Funds | | | 700,000 | | | | — | | | | 700,000 | | | | — | | |
Total Investmentsa | | $ | 283,389,130 | | | $ | 282,689,130 | | | $ | 700,000 | | | $ | — | | |
a Portfolio holdings are disclosed individually on the Schedule of Investments.
Security Transactions, Investment Income and Expense Allocations: Security transactions are recorded on trade date. Realized gains and losses on investments sold are recorded on the basis of identified cost. Interest income is recorded on the accrual basis. Discounts are accreted and premiums are amortized over the life of the respective securities. Dividend income is recorded on the ex-dividend date, except for certain dividends on foreign securities, which are recorded as soon as the Fund is informed after the ex-dividend date. Distributions from Real Estate Investment Trusts (REITs) are recorded as ordinary income, net realized capital gain or return of capital based on information reported by the REITs and management's estimates of such amounts based on historical information. These estimates are adjusted when the actual source of distributions is disclosed by the REITs and actual amounts may differ from the estimated amounts. Income, expenses (other than expenses attributable to a specific class) and realized and unrealized gains or losses on investments are allocated to each class of shares based on its relative net assets.
Foreign Currency Translation: The books and records of the Fund are maintained in U.S. dollars. Investment securities and other assets and liabilities denominated in foreign currencies are translated into U.S. dollars based upon prevailing exchange rates on the date of valuation. Purchases and sales of investment securities and income and expense items denominated in foreign currencies are translated into U.S. dollars based upon prevailing exchange rates on the respective dates of such transactions. The Fund does not isolate that portion of the results of operations resulting from fluctuations in foreign exchange rates on investments from the fluctuations arising from changes in market prices of securities held. Such fluctuations are included with the net realized and unrealized gain or loss on investments.
Net realized foreign exchange gains or losses arise from sales of foreign currencies, currency gains or losses realized between the trade and settlement dates on securities transactions, and the difference between the amounts of dividends, interest, and foreign withholding taxes recorded on the Fund's books and the U.S. dollar equivalent of the amounts actually received or paid. Net unrealized foreign exchange gains and losses arise from changes in the values of assets and liabilities, other than investments in securities, on the date of valuation, resulting from changes in exchange rates. Pursuant
27
COHEN & STEERS DIVIDEND VALUE FUND, INC.
NOTES TO FINANCIAL STATEMENTS (Unaudited)—(Continued)
to U.S. federal income tax regulations, certain foreign currency gains/losses included in realized and unrealized gains/losses are included in or are a reduction of ordinary income for federal income tax purposes.
Foreign Securities: The Fund may directly purchase securities of foreign issuers. Investing in securities of foreign issuers involves special risks not typically associated with investing in securities of U.S. issuers. The risks include possible revaluation of currencies, the ability to repatriate funds, less complete financial information about companies and possible future adverse political and economic developments. Moreover, securities of many foreign issuers and their markets may be less liquid and their prices more volatile than securities of comparable U.S. issuers.
Dividends and Distributions to Shareholders: Dividends from net investment income and capital gain distributions are determined in accordance with U.S. federal income tax regulations, which may differ from GAAP. Dividends from net investment income, if any, are declared and paid quarterly. Net realized capital gains, unless offset by any available capital loss carryforward, are typically distributed to shareholders at least annually. Dividends and distributions to shareholders are recorded on the ex-dividend date and are automatically reinvested in full and fractional shares of the Fund based on the net asset value per share at the close of business on the payable date, unless the shareholder has elected to have them paid in cash. Distributions paid by the Fund are subject to recharacterization for tax purposes.
Income Taxes: It is the policy of the Fund to continue to qualify as a regulated investment company, if such qualification is in the best interest of the shareholders, by complying with the requirements of Subchapter M of the Internal Revenue Code applicable to regulated investment companies, and by distributing substantially all of its taxable earnings to its shareholders. Accordingly, no provision for federal income or excise tax is necessary. Dividend and interest income from holdings in non-U.S. securities is recorded net of non-U.S. taxes paid. Management has analyzed the Fund's tax positions taken on federal income tax returns as well as its tax positions in non-U.S. jurisdictions in which it trades for all open tax years and has concluded that as of August 31, 2014, no additional provisions for income tax are required in the Fund's financial statements. The Fund's tax positions for the tax years for which the applicable statutes of limitations have not expired are subject to examination by the Internal Revenue Service, state departments of revenue and by foreign tax authorities.
Note 2. Investment Advisory, Administration Fees and Other Transactions with Affiliates
Investment Advisory Fees: The investment advisor serves as the Fund's investment advisor pursuant to an investment advisory agreement (the investment advisory agreement). Under the terms of the investment advisory agreement, the investment advisor provides the Fund with day-to-day investment decisions and generally manages the Fund's investments in accordance with the stated policies of the Fund, subject to the supervision of the Board of Directors.
For the services provided to the Fund, the investment advisor receives a fee, accrued daily and paid monthly, at the annual rate of 0.80% of the average daily net assets of the Fund up to and including $1.5 billion and 0.70% of the average daily net assets above $1.5 billion.
28
COHEN & STEERS DIVIDEND VALUE FUND, INC.
NOTES TO FINANCIAL STATEMENTS (Unaudited)—(Continued)
For the six months ended August 31, 2014, and through June 30, 2016, the investment advisor has contractually agreed to waive its fee and/or reimburse the Fund for expenses incurred so that the Fund's total annual operating expenses (excluding acquired fund fees and expenses and extraordinary expenses) do not exceed 1.00% for Class A shares, 1.65% for Class C shares and 0.65% for Class I shares. This contractual agreement can be amended at any time by agreement of the Fund and the investment advisor and will terminate automatically in the event of termination of the investment advisory agreement between the Fund and the investment advisor. For the six months ended August 31, 2014, fees waived and/or expenses reimbursed totaled $528,078.
Administration Fees: The Fund has entered into an administration agreement with the investment advisor under which the investment advisor performs certain administrative functions for the Fund and receives a fee, accrued daily and paid monthly, at the annual rate of 0.04% of the average daily net assets of the Fund. For the six months ended August 31, 2014, the Fund incurred $54,634 in fees under this administration agreement. Additionally, the Fund pays State Street Bank and Trust Company as co-administrator under a fund accounting and administration agreement.
Distribution Fees: Shares of the Fund are distributed by Cohen & Steers Securities, LLC (the distributor), an affiliated entity of the investment advisor. The Fund has adopted a distribution plan (the plan) pursuant to Rule 12b-1 under the 1940 Act. The plan provides that the Fund will pay the distributor a fee, accrued daily and paid monthly, at an annual rate of up to 0.25% of the average daily net assets attributable to Class A shares and up to 0.75% of the average daily net assets attributable to Class C shares.
There is a maximum initial sales charge of 4.50% for Class A shares. There is a contingent deferred sales charge (CDSC) of 1.00% on purchases of $1 million or more of Class A shares, which applies if redemption occurs within one year from purchase. There is a CDSC of 1.00% on Class C shares, which applies if redemption occurs within one year from purchase. For the six months ended August 31, 2014, the Fund has been advised that the distributor received $3,779 in sales commissions from the sale of Class A shares and $550 and $886 of CDSC relating to redemptions of Class A and Class C shares, respectively. The distributor has advised the Fund that proceeds from the CDSC on this class are used by the distributor to defray its expenses related to providing distribution-related services to the Fund in connection with the sale of this class, including payments to dealers and other financial intermediaries for selling this class.
Shareholder Servicing Fees: For shareholder services, the Fund pays the distributor or its affiliates a fee, accrued daily and paid monthly, at an annual rate of up to 0.10% of the average daily net assets of the Fund's Class A and Class I shares and up to 0.25% of the average daily net assets of the Fund's Class C shares. The distributor is responsible for paying qualified financial institutions for shareholder services.
Directors' and Officers' Fees: Certain directors and officers of the Fund are also directors, officers and/or employees of the investment advisor. The Fund does not pay compensation to directors and officers affiliated with the investment advisor except for the Chief Compliance Officer, who received compensation from the investment advisor, which was reimbursed by the Fund, in the amount of $1,464 for the six months ended August 31, 2014.
Other: At August 31, 2014, approximately 50% of the Fund's outstanding shares were owned by shareholders investing directly and by shareholders investing indirectly through an account, platform or program sponsored by a financial institution.
29
COHEN & STEERS DIVIDEND VALUE FUND, INC.
NOTES TO FINANCIAL STATEMENTS (Unaudited)—(Continued)
Investment and asset allocation decisions by either a direct shareholder or financial institution regarding the account, platform or program through which multiple shareholders invest may result in subscription and redemption decisions that have a significant impact on the assets, expenses and trading activities of the Fund. Such a decision may cause the Fund to sell assets at disadvantageous times or prices, and may negatively affect the Fund's net asset value.
Note 3. Purchases and Sales of Securities
Purchases and sales of securities, excluding short-term investments, for the six months ended August 31, 2014, totaled $111,403,797 and $119,597,392, respectively.
Note 4. Income Tax Information
As of August 31, 2014, the federal tax cost and net unrealized appreciation and depreciation in value of securities held were as follows:
Cost for federal income tax purposes | | $ | 219,653,111 | | |
Gross unrealized appreciation | | $ | 65,125,911 | | |
Gross unrealized depreciation | | | (1,389,892 | ) | |
Net unrealized appreciation | | $ | 63,736,019 | | |
Note 5. Capital Stock
Effective as of July 23, 2014, the Fund is authorized to issue 300 million shares of capital stock, at a par value of $0.001 per share. The Board of Directors of the Fund may increase or decrease the aggregate number of shares of common stock that the Fund has authority to issue. Transactions in Fund shares were as follows:
| | | For the Six Months Ended
August 31, 2014 | | For the Year Ended
February 28, 2014 | |
| | | Shares | | Amount | | Shares | | Amount | |
Class A: | |
Sold | | | 138,917 | | | $ | 2,386,822 | | | | 298,245 | | | $ | 4,631,048 | | |
Issued as reinvestment of
dividends and
distributions | | | 82,809 | | | | 1,387,552 | | | | 42,232 | | | | 649,270 | | |
Redeemed | | | (576,731 | ) | | | (9,739,598 | ) | | | (860,782 | ) | | | (13,651,130 | ) | |
Net decrease | | | (355,005 | ) | | $ | (5,965,224 | ) | | | (520,305 | ) | | $ | (8,370,812 | ) | |
30
COHEN & STEERS DIVIDEND VALUE FUND, INC.
NOTES TO FINANCIAL STATEMENTS (Unaudited)—(Continued)
| | | For the Six Months Ended
August 31, 2014 | | For the Year Ended
February 28, 2014 | |
| | | Shares | | Amount | | Shares | | Amount | |
Class C: | |
Sold | | | 139,601 | | | $ | 2,357,447 | | | | 638,827 | | | $ | 9,900,777 | | |
Issued as reinvestment of
dividends and
distributions | | | 54,382 | | | | 906,547 | | | | 17,399 | | | | 269,213 | | |
Redeemed | | | (193,681 | ) | | | (3,293,729 | ) | | | (505,168 | ) | | | (7,763,514 | ) | |
Net increase (decrease) | | | 302 | | | $ | (29,735 | ) | | | 151,058 | | | $ | 2,406,476 | | |
Class I: | |
Sold | | | 950,205 | | | $ | 16,071,754 | | | | 811,447 | | | $ | 12,566,566 | | |
Issued as reinvestment of
dividends and
distributions | | | 705,938 | | | | 11,843,840 | | | | 321,347 | | | | 4,953,566 | | |
Redeemed | | | (729,885 | ) | | | (12,538,701 | ) | | | (2,736,871 | ) | | | (42,762,181 | ) | |
Net increase (decrease) | | | 926,258 | | | $ | 15,376,893 | | | | (1,604,077 | ) | | $ | (25,242,049 | ) | |
Note 6. Borrowings
The Fund, in conjunction with other Cohen & Steers open-end funds, is a party to a $200,000,000 syndicated credit agreement (the credit agreement) with State Street Bank and Trust Company, as administrative agent and operations agent, and the lenders identified in the credit agreement, which expires January 23, 2015. The Fund pays a commitment fee of 0.10% per annum on its proportionate share of the unused portion of the credit agreement.
During the six months ended August 31, 2014, the Fund did not borrow under the credit agreement.
Note 7. Other
In the normal course of business, the Fund enters into contracts that provide general indemnifications. The Fund's maximum exposure under these arrangements is dependent on claims that may be made against the Fund in the future and, therefore, cannot be estimated; however, based on experience, the risk of material loss from such claims is considered remote.
On July 22, 2014, the Board of Directors of the Fund approved an increase to the Fund's authorized shares of capital stock, which became effective July 23, 2014, in order for the Fund to begin offering Class R and Z shares. The Fund is now authorized to issue 300 million shares of capital stock, at a par value of $0.001 per share. Class R and Z shares became available for investment effective October 1, 2014.
Note 8. Subsequent Events
Management has evaluated events and transactions occurring after August 31, 2014 through the date that the financial statements were issued, and has determined that no additional disclosure in the financial statements is required.
31
COHEN & STEERS DIVIDEND VALUE FUND, INC.
OTHER INFORMATION
A description of the policies and procedures that the Fund uses to determine how to vote proxies relating to portfolio securities is available (i) without charge, upon request, by calling 800-330-7348, (ii) on our website at cohenandsteers.com or (iii) on the Securities and Exchange Commission's (the SEC) website at http://www.sec.gov. In addition, the Fund's proxy voting record for the most recent 12-month period ended June 30 is available by August 31 of each year (i) without charge, upon request, by calling 800-330-7348 or (ii) on the SEC's website at http://www.sec.gov.
The Fund files its complete schedule of portfolio holdings with the SEC for the first and third quarters of each fiscal year on Form N-Q. The Fund's Forms N-Q are available (i) without charge, upon request, by calling 800-330-7348 or (ii) on the SEC's website at http://www.sec.gov. In addition, the Forms N-Q may be reviewed and copied at the SEC's Public Reference Room in Washington, DC. Information on the operation of the Public Reference Room may be obtained by calling 800-SEC-0330.
Please note that distributions paid by the Fund to shareholders are subject to recharacterization for tax purposes. The Fund may also pay distributions in excess of the Fund's net investment company taxable income and this excess could be a tax free return of capital distributed from the Fund's assets. The final tax treatment of all distributions is reported to shareholders on their 1099-DIV forms, which are mailed after the close of each calendar year.
Changes to the Board of Directors
Effective June 30, 2014, Martin Cohen ceased being a Director and officer of the Fund. The Board of Directors has elected Joseph M. Harvey as a Director of the Fund.
Changes to the Portfolio Management Team
On June 17, 2014, the Fund's Board of Directors approved changes to the Fund's portfolio managers. Effective August 1, 2014, Christopher Rhine, Anatoliy Cherevach and Jamelah Leddy were added as portfolio managers of the Fund.
Christopher Rhine is a portfolio manager of the Fund and vice president of the investment manager. He joined the investment advisor in 2012 as an analyst specializing in natural resource equities and large cap value stocks. From 2002 to 2012, Mr. Rhine was an equity analyst with Blackrock, where he primarily covered the global industrials and materials sectors.
Anatoliy Cherevach is a portfolio manager of the Fund. He joined the investment advisor in 2005 as a research analyst for large cap value portfolios specializing in the financial, health care and utilities sectors. Previously, Mr. Cherevach was an analyst at WM Advisors for five years covering the financial, healthcare, utilities, energy and REIT sectors.
Jamelah Leddy is a portfolio manager of the Fund. She joined the investment advisor in 2006 as a research analyst. She specializes in the consumer discretionary, consumer staples and telecommunications sectors. Prior to joining the investment advisor, Ms. Leddy was an analyst at McAdams Wright Ragen covering companies primarily in the consumer and industrial sectors.
32
COHEN & STEERS DIVIDEND VALUE FUND, INC.
APPROVAL OF INVESTMENT ADVISORY AGREEMENT
The Board of Directors of the Fund, including a majority of the directors who are not parties to the Fund's investment advisory agreement (the "Advisory Agreement"), or interested persons of any such party ("Independent Directors"), has the responsibility under the 1940 Act to approve the Fund's Advisory Agreement for its initial two year term and its continuation annually thereafter at a meeting of the Board of Directors called for the purpose of voting on the approval or continuation. At a telephonic meeting of the Board of Directors held on June 11, 2014 and at a meeting held in person on June 17, 2014, the Advisory Agreement was discussed and was unanimously continued for a term ending June 30, 2015 by the Fund's Board of Directors, including the Independent Directors. The Independent Directors were represented by independent counsel who assisted them in their deliberations during the meeting and executive session.
In considering whether to continue the Advisory Agreement, the Board of Directors reviewed materials provided by the Fund's investment advisor (the "Investment Advisor") and Fund counsel which included, among other things, fee, expense and performance information compared to peer funds ("Peer Funds") and performance comparisons to a larger category universe, prepared by an independent data provider; summary information prepared by the Investment Advisor; and a memorandum outlining the legal duties of the Board of Directors. The Board of Directors also spoke directly with representatives of the independent data provider and met with investment advisory personnel. In addition, the Board of Directors considered information provided from time to time by the Investment Advisor throughout the year at meetings of the Board of Directors, including presentations by portfolio managers relating to the investment performance of the Fund and the investment strategies used in pursuing the Fund's objective. In particular, the Board of Directors considered the following:
(i) The nature, extent and quality of services provided by the Investment Advisor: The Board of Directors reviewed the services that the Investment Advisor provides to the Fund, including, but not limited to, making the day-to-day investment decisions for the Fund, and generally managing the Fund's investments in accordance with the stated policies of the Fund. The Board of Directors also discussed with officers and portfolio managers of the Fund the types of transactions that were being done on behalf of the Fund. Additionally, the Board of Directors took into account the services provided by the Investment Advisor to its other funds, including those that have investment objectives and strategies similar to the Fund. The Board of Directors next considered the education, background and experience of the Investment Advisor's personnel, noting particularly, the leadership changes to the large cap value investment team, effective August 1, 2014. The Board of Directors further noted the Investment Advisor's ability to attract qualified and experienced personnel. The Board of Directors also considered the administrative services provided by the Investment Advisor, including compliance and accounting services. After consideration of the above factors, among others, the Board of Directors concluded that the nature, extent and quality of services provided by the Investment Advisor are adequate and appropriate.
(ii) Investment performance of the Fund and the Investment Advisor: The Board of Directors considered the investment performance of the Fund compared to Peer Funds and compared to a relevant benchmark. The peer group selected by the independent data provider included large cap core funds. The Board of Directors noted that the Fund outperformed the median for the one-year period, ranking in the third quintile, and underperformed the median for the three- and five-year periods ended March 31, 2014, ranking in the third quintile for the three-year period and the fifth quintile for the five-year
33
COHEN & STEERS DIVIDEND VALUE FUND, INC.
period. The Board of Directors further noted that the Fund underperformed its benchmark for the three- and five-year periods and outperformed its benchmark for the one-year period ended March 31, 2014. The Board of Directors engaged in discussions with the Investment Advisor regarding the contributors and detractors to the Fund's performance during the periods. The Board of Directors also considered supplemental information provided by the Investment Advisor, including a narrative summary of various factors affecting performance, the upcoming changes to the large cap value investment team and the Investment Advisor's performance in managing other funds that invest in real estate, large cap and dividend paying securities. The Board of Directors then determined that Fund performance, in light of all considerations noted above, was satisfactory.
(iii) Cost of the services provided and profits realized by the Investment Advisor from the relationship with the Fund: Next, the Board of Directors considered the advisory fees and administrative fees payable by the Fund as well as the Fund's expense ratio. As part of its analysis, the Board of Directors gave consideration to the fee and expense analyses provided by the independent data provider. The Board of Directors noted that the Fund's actual management fee was lower than the Peer Funds' median ranking in the second quintile while the Fund's contractual management fee was higher than the Peer Funds' median ranking in the fifth quintile. The Board of Directors further noted that the Fund's overall total expense ratio was lower than the Peer Funds' median ranking in the first quintile. The Board of Directors considered that the Investment Advisor continues to waive its fees and/or reimburse expenses to limit overall operating expenses of the Fund. The Board of Directors then considered the administrative services provided by the Investment Advisor, including compliance and accounting services, and further noted that the Fund charges an administration fee payable to the Investment Advisor. In light of the considerations above, the Board of Directors concluded that the Fund's expense structure was satisfactory.
The Board of Directors also reviewed information regarding the profitability to the Investment Advisor of its relationship with the Fund. The Board of Directors considered the level of the Investment Advisor's profits and whether the profits were reasonable for the Investment Advisor. The Board of Directors noted that the Investment Advisor is currently waiving its fee and/or reimbursing expenses of the Fund. The Board of Directors took into consideration other benefits to be derived by the Investment Advisor in connection with the Advisory Agreement, noting particularly the research and related services, within the meaning of Section 28(e) of the Securities Exchange Act of 1934, as amended, that the Investment Advisor receives by allocating the Fund's brokerage transactions. The Board of Directors also considered the fees received by the Investment Advisor under the Administration Agreement, and noted the significant services received, such as compliance, accounting and operational services and furnishing office space and facilities for the Fund, and providing persons satisfactory to the Board of Directors to serve as officers of the Fund, and that these services were beneficial to the Fund. The Board of Directors noted that because of the Fund's small size, the operating expenses continue to be subsidized, and the Fund is only slightly profitable.
(iv) The extent to which economies of scale would be realized as the Fund grows and whether fee levels would reflect such economies of scale: The Board of Directors noted that the Fund's advisory fee schedule contains a breakpoint of 10 basis points once the Fund's assets reach $1.5 billion. The Board of Directors considered the Fund's asset size and determined that there were not at this time significant economies of scale that were not being shared with shareholders.
34
COHEN & STEERS DIVIDEND VALUE FUND, INC.
(v) Comparison of services rendered and fees paid to those under other investment advisory contracts, such as contracts of the same and other investment advisors or other clients: As discussed above in (iii), the Board of Directors compared the fees paid under the Advisory Agreement to those under other investment advisory contracts of other investment advisors managing Peer Funds. The Board of Directors also considered the services rendered, fees paid and profitability under the Advisory Agreements to those under the Investment Advisor's other advisory contracts with institutional and other clients with similar investment mandates, including subadvised mutual funds and proprietary funds. The Board of Directors also considered the entrepreneurial risk and financial exposure assumed by the Investment Advisor in developing and managing the Fund that the Investment Advisor does not have with institutional and other clients. The Board of Directors determined that on a comparative basis the fees under the Advisory Agreement were reasonable in relation to the services provided.
No single factor was cited as determinative to the decision of the Board of Directors. Rather, after weighing all of the considerations and conclusions discussed above, the Board of Directors, including the Independent Directors, unanimously approved the continuation of the Advisory Agreement.
35
COHEN & STEERS DIVIDEND VALUE FUND, INC.
Cohen & Steers Privacy Policy
Facts | | What Does Cohen & Steers Do With Your Personal Information? | |
Why? | | Financial companies choose how they share your personal information. Federal law gives consumers the right to limit some but not all sharing. Federal law also requires us to tell you how we collect, share, and protect your personal information. Please read this notice carefully to understand what we do. | |
What? | | The types of personal information we collect and share depend on the product or service you have with us. This information can include:
• Social Security number and account balances
• Transaction history and account transactions
• Purchase history and wire transfer instructions | |
How? | | All financial companies need to share customers' personal information to run their everyday business. In the section below, we list the reasons financial companies can share their customers' personal information; the reasons Cohen & Steers chooses to share; and whether you can limit this sharing. | |
Reasons we can share your personal information | | Does Cohen & Steers
share? | | Can you limit this
sharing? | |
For our everyday business purposes—
such as to process your transactions, maintain your account(s), respond to court orders and legal investigations, or reports to credit bureaus | | Yes | | No | |
For our marketing purposes—
to offer our products and services to you | | Yes | | No | |
For joint marketing with other financial companies— | | No | | We don't share | |
For our affiliates' everyday business purposes—
information about your transactions and experiences | | No | | We don't share | |
For our affiliates' everyday business purposes—
information about your creditworthiness | | No | | We don't share | |
For our affiliates to market to you— | | No | | We don't share | |
For non-affiliates to market to you— | | No | | We don't share | |
Questions? Call 800-330-7348
36
COHEN & STEERS DIVIDEND VALUE FUND, INC.
Cohen & Steers Privacy Policy—(Continued)
Who we are | | | |
Who is providing this notice? | | Cohen & Steers Capital Management, Inc., Cohen & Steers Asia Limited, Cohen & Steers UK Limited, Cohen & Steers Securities, LLC, Cohen & Steers Private Funds and Cohen & Steers Open- and Closed-End Funds (collectively, Cohen & Steers). | |
What we do | | | |
How does Cohen & Steers protect my personal information? | | To protect your personal information from unauthorized access and use, we use security measures that comply with federal law. These measures include computer safeguards and secured files and buildings. We restrict access to your information to those employees who need it to perform their jobs, and also require companies that provide services on our behalf to protect your information. | |
How does Cohen & Steers collect my personal information? | | We collect your personal information, for example, when you:
• Open an account or buy securities from us
• Provide account information or give us your contact information
• Make deposits or withdrawals from your account
We also collect your personal information from other companies. | |
Why can't I limit all sharing? | | Federal law gives you the right to limit only:
• sharing for affiliates' everyday business purposes—information about your creditworthiness
• affiliates from using your information to market to you
• sharing for non-affiliates to market to you
State law and individual companies may give you additional rights to limit sharing. | |
Definitions | | | |
Affiliates | | Companies related by common ownership or control. They can be financial and nonfinancial companies.
• Cohen & Steers does not share with affiliates. | |
Non-affiliates | | Companies not related by common ownership or control. They can be financial and nonfinancial companies.
• Cohen & Steers does not share with non-affiliates. | |
Joint marketing | | A formal agreement between non-affiliated financial companies that together market financial products or services to you.
• Cohen & Steers does not jointly market. | |
37
COHEN & STEERS DIVIDEND VALUE FUND, INC.
Cohen & Steers Investment Solutions
COHEN & STEERS GLOBAL REALTY SHARES
• Designed for investors seeking total return, investing primarily in global real estate equity securities
• Symbols: CSFAX, CSFBX*, CSFCX, CSSPX, GRSRX, CSFZX
COHEN & STEERS INSTITUTIONAL REALTY SHARES
• Designed for institutional investors seeking total return, investing primarily in REITs
• Symbol: CSRIX
COHEN & STEERS REAL ESTATE SECURITIES FUND
(FORMERLY KNOWN AS "COHEN & STEERS
REALTY INCOME FUND")
• Designed for investors seeking total return, investing primarily in real estate securities with an emphasis on both income and capital appreciation
• Symbols: CSEIX, CSBIX*, CSCIX, CSDIX, CIRRX, CSZIX
COHEN & STEERS INTERNATIONAL REALTY FUND
• Designed for investors seeking total return, investing primarily in international real estate securities
• Symbols: IRFAX, IRFCX, IRFIX
COHEN & STEERS REALTY SHARES
• Designed for investors seeking total return, investing primarily in REITs
• Symbol: CSRSX
COHEN & STEERS
INSTITUTIONAL GLOBAL REALTY SHARES
• Designed for institutional investors seeking total return, investing primarily in global real estate securities
• Symbol: GRSIX
COHEN & STEERS GLOBAL INFRASTRUCTURE FUND
• Designed for investors seeking total return, investing primarily in global infrastructure securities
• Symbols: CSUAX, CSUBX*, CSUCX, CSUIX, CSURX, CSUZX
COHEN & STEERS DIVIDEND VALUE FUND
• Designed for investors seeking long-term growth of income and capital appreciation, investing primarily in dividend paying common stocks and preferred stocks
• Symbols: DVFAX, DVFCX, DVFIX, DVFRX, DVFZX
COHEN & STEERS
PREFERRED SECURITIES AND INCOME FUND
• Designed for investors seeking total return (high current income and capital appreciation), investing primarily in preferred and debt securities
• Symbols: CPXAX, CPXCX, CPXIX, CPRRX, CPXZX
COHEN & STEERS REAL ASSETS FUND
• Designed for investors seeking total return and the maximization of real returns during inflationary environments by investing primarily in real assets
• Symbols: RAPAX, RAPCX, RAPIX, RAPRX, RAPZX
COHEN & STEERS
MLP & ENERGY OPPORTUNITY FUND
• Designed for investors seeking total return, investing primarily in midstream energy master limited partnership (MLP) units and related stocks
• Symbols: MLOAX, MLOCX, MLOIX, MLORX, MLOZX
COHEN & STEERS
ACTIVE COMMODITIES STRATEGY FUND
• Designed for investors seeking total return, investing primarily in a diversified portfolio of exchange-traded commodity future contracts and other commodity-related derivative instruments
• Symbols: CDFAX, CDFCX, CDFIX, CDFRX, CDFZX
Distributed by Cohen & Steers Securities, LLC.
COHEN & STEERS GLOBAL REALTY MAJORS ETF
• Designed for investors who seek a relatively low-cost "passive" approach for investing in a portfolio of real estate equity securities of companies in a specified index
• Symbol: GRI
Distributed by ALPS Distributors, Inc.
ISHARES COHEN & STEERS
REALTY MAJORS INDEX FUND
• Designed for investors who seek a relatively low-cost "passive" approach for investing in a portfolio of real estate equity securities of companies in a specified index
• Symbol: ICF
Distributed by SEI Investments Distribution Co.
* Class B shares are no longer offered except through dividend reinvestment and permitted exchanges by existing Class B shareholders.
Please consider the investment objectives, risks, charges and expenses of the fund carefully before investing. A summary prospectus and prospectus containing this and other information can be obtained by calling 800-330-7348 or by visiting cohenandsteers.com. Please read the summary prospectus and prospectus carefully before investing.
38
COHEN & STEERS DIVIDEND VALUE FUND, INC.
OFFICERS AND DIRECTORS
Robert H. Steers
Director and Chairman
Joseph M. Harvey
Director
Michael G. Clark
Director
Bonnie Cohen
Director
George Grossman
Director
Richard E. Kroon
Director
Richard J. Norman
Director
Frank K. Ross
Director
C. Edward Ward, Jr.
Director
Adam M. Derechin
President and Chief Executive Officer
Richard E. Helm
Vice President
Francis C. Poli
Secretary
James Giallanza
Treasurer and Chief Financial Officer
Lisa D. Phelan
Chief Compliance Officer
Tina M. Payne
Assistant Secretary
Neil Bloom
Assistant Treasurer
KEY INFORMATION
Investment Advisor
Cohen & Steers Capital Management, Inc.
280 Park Avenue
New York, NY 10017
(212) 832-3232
Co-administrator and Custodian
State Street Bank and Trust Company
One Lincoln Street
Boston, MA 02111
Transfer Agent
Boston Financial Data Services, Inc.
30 Dan Road
Canton, MA 02021
(800) 437-9912
Legal Counsel
Ropes & Gray LLP
1211 Avenue of the Americas
New York, NY 10036
Distributor
Cohen & Steers Securities, LLC
280 Park Avenue
New York, NY 10017
Nasdaq Symbol: Class A—DVFAX
Class C—DVFCX
Class I—DVFIX
Class R—DVFRX
Class Z—DVFZX
website: cohenandsteers.com
This report is authorized for delivery only to shareholders of Cohen & Steers Dividend Value Fund, Inc. unless accompanied or preceded by the delivery of a currently effective prospectus setting forth details of the Fund. Performance data quoted represent past performance which is no guarantee of future results and your investment may be worth more or less at the time you sell your shares.
39
COHEN & STEERS
DIVIDEND VALUE FUND
280 PARK AVENUE
NEW YORK, NY 10017
eDelivery NOW AVAILABLE
Stop traditional mail delivery; receive your shareholder reports and prospectus online.
Sign up at cohenandsteers.com
DVFAXSAR

Semiannual Report August 31, 2014
Cohen & Steers Dividend Value Fund
Item 2. Code of Ethics.
Not applicable.
Item 3. Audit Committee Financial Expert.
Not applicable.
Item 4. Principal Accountant Fees and Services.
Not applicable.
Item 5. Audit Committee of Listed Registrants.
Not applicable.
Item 6. Schedule of Investments.
Included in Item 1 above.
Item 7. Disclosure of Proxy Voting Policies and Procedures for Closed-End Management Investment Companies.
Not applicable.
Item 8. Portfolio Managers of Closed-End Investment Companies.
Not applicable.
Item 9. Purchases of Equity Securities by Closed-End Management Investment Company and Affiliated Purchasers.
Not applicable.
Item 10. Submission of Matters to a Vote of Security Holders.
None.
Item 11. Controls and Procedures.
(a) The registrant’s principal executive officer and principal financial officer have concluded, based upon their evaluation of the registrant’s disclosure controls and procedures as conducted within 90 days of the filing date of this report, that these disclosure controls and procedures provide reasonable assurance that material information required to be disclosed by the registrant in the report it files or submits on Form N-CSR is recorded, processed, summarized and reported within the time periods specified in the Securities and Exchange Commission’s rules and forms
and that such material information is accumulated and communicated to the registrant’s management, including its principal executive officer and principal financial officer, as appropriate, in order to allow timely decisions regarding required disclosure.
(b) There were no changes in the registrant’s internal control over financial reporting that occurred during the second fiscal quarter of the period covered by this report that have materially affected, or are reasonably likely to materially affect, the registrant’s internal control over financial reporting.
Item 12. Exhibits.
(a)(1) Not applicable.
(a)(2) Certifications of principal executive officer and principal financial officer as required by Rule 30a-2(a) under the Investment Company Act of 1940.
(a)(3) Not applicable.
(b) Certifications of chief executive officer and chief financial officer as required by Rule 30a- 2(b) under the Investment Company Act of 1940.
SIGNATURES
Pursuant to the requirements of the Securities Exchange Act of 1934 and the Investment Company Act of 1940, the registrant has duly caused this report to be signed on its behalf by the undersigned, thereunto duly authorized.
COHEN & STEERS DIVIDEND VALUE FUND, INC.
By: | /s/ Adam M. Derechin | |
| Name: Adam M. Derechin |
| Title: President and Chief Executive Officer |
| |
Date: November 3, 2014 |
Pursuant to the requirements of the Securities Exchange Act of 1934 and the Investment Company Act of 1940, this report has been signed below by the following persons on behalf of the registrant and in the capacities and on the dates indicated.
By: | /s/ Adam M. Derechin | |
| Name: | Adam M. Derechin |
| Title: | President and Chief Executive Officer |
| | (Principal Executive Officer) |
| | |
By: | /s/ James Giallanza | |
| Name: | James Giallanza |
| Title: | Treasurer and Chief Financial Officer |
| | (Principal Financial Officer) |
| | |
Date: November 3, 2014 | |
| | | |