UNITED STATES
SECURITIES AND EXCHANGE COMMISSION
Washington, D.C. 20549
FORM N-CSR
Certified Shareholder Report of
Registered Management Investment Companies
Investment Company Act File Number: 811-02444
The Bond Fund of America
(Exact Name of Registrant as Specified in Charter)
333 South Hope Street
Los Angeles, California 90071
(Address of Principal Executive Offices)
Registrant's telephone number, including area code: (949) 975-5000
Date of fiscal year end: December 31
Date of reporting period: December 31, 2019
Brian C. Janssen
The Bond Fund of America
6455 Irvine Center Drive
Irvine, California 92618
(Name and Address of Agent for Service)
ITEM 1 – Reports to Stockholders
The Bond Fund of America® Annual report
for the year ended
December 31, 2019 |  |

Invest with a stable,
long-term approach
Beginning January 1, 2021, as permitted by regulations adopted by the U.S. Securities and Exchange Commission, we intend to no longer mail paper copies of the fund’s shareholder reports, unless specifically requested from American Funds or your financial intermediary, such as a broker-dealer or bank. Instead, the reports will be made available on the Capital Group website (capitalgroup.com); you will be notified by mail and provided with a website link to access the report each time a report is posted. If you have already elected to receive shareholder reports electronically, you will not be affected by this change and do not need to take any action. If you prefer to receive shareholder reports and other communications electronically, you may update your mailing preferences with your financial intermediary, or enroll in e-delivery at capitalgroup.com (for accounts held directly with the fund).
You may elect to receive paper copies of all future reports free of charge. If you invest through a financial intermediary, you may contact your financial intermediary to request that you continue to receive paper copies of your shareholder reports. If you invest directly with the fund, you may inform American Funds that you wish to continue receiving paper copies of your shareholder reports by contacting us at (800) 421-4225. Your election to receive paper reports will apply to all funds held with American Funds or through your financial intermediary.
The Bond Fund of America seeks as high a level of current income as is consistent with the preservation of capital.
This fund is one of more than 40 offered by Capital Group, home of American Funds, one of the nation’s largest mutual fund families. For nearly 90 years, Capital Group has invested with a long-term focus based on thorough research and attention to risk.
Fund results shown in this report, unless otherwise indicated, are for Class A shares at net asset value. If a sales charge (maximum 3.75%) had been deducted, the results would have been lower. Results are for past periods and are not predictive of results for future periods. Current and future results may be lower or higher than those shown. Share prices and returns will vary, so investors may lose money. Investing for short periods makes losses more likely. For current information and month-end results, visit capitalgroup.com.
See page 4 for Class A share results with relevant sales charges deducted. For other share class results, visit capitalgroup.com and americanfundsretirement.com.
Investment results assume all distributions are reinvested and reflect applicable fees and expenses. When applicable, investment results reflect fee waivers, without which results would have been lower. Visit capitalgroup.com for more information.
The fund’s 30-day yield for Class A shares as of January 31, 2020, calculated in accordance with the U.S. Securities and Exchange Commission (SEC) formula, was 1.53%. The fund’s 12-month distribution rate for Class A shares as of that date was 2.14%. Both reflect the 3.75% maximum sales charge. The SEC yield reflects the rate at which the fund is earning income on its current portfolio of securities while the distribution rate reflects the fund’s past dividends paid to shareholders. Accordingly, the fund’s SEC yield and distribution rate may differ.
The return of principal for bond funds and for funds with significant underlying bond holdings is not guaranteed. Fund shares are subject to the same interest rate, inflation and credit risks associated with the underlying bond holdings. High-yield bonds are subject to greater fluctuations in value and risk of loss of income and principal than investment-grade bonds. Investing in bonds issued outside the U.S. may be subject to additional risks. They include currency fluctuations, political and social instability, differing securities regulations and accounting standards, higher transaction costs, possible changes in taxation, illiquidity and price volatility. These risks may be heightened in connection with investments in developing countries. Refer to the fund prospectus and the Risk Factors section of this report for more information on these and other risks associated with investing in the fund.
Investments are not FDIC-insured, nor are they deposits of or guaranteed by a bank or any other entity, so they may lose value.
Contents
Fellow investors:
As the Federal Reserve (“the Fed”) and other central banks around the world loosened policy, assets rallied broadly in 2019. Fixed income returns were strong across bond sectors as yields fell. For the 12-month period ended December 31, The Bond Fund of America returned 8.02%.
By way of comparison, the Bloomberg Barclays U.S. Aggregate Index — a measure of the investment-grade (BBB/Baa and above) bond market — returned 8.72%. The fund’s peer group, as measured by the Lipper Core Bond Funds Average, gained 8.70%.
The fund paid dividends totaling 30 cents per share during the period. For investors, this amounted to an income return of 2.43% with dividends reinvested, or 2.41% if taken in cash.
Bond market overview
Virtually every corner of financial markets saw solid returns in 2019, with both equities and fixed income up sharply as investors looked past trade disputes and other geopolitical uncertainty such as the U.K.’s exit from the European Union. The Fed began the year by pausing its rate hike campaign in response to market turbulence at the end of 2018. It then began tocut the federal funds rate over the summer. It reduced the rate by 25 basis points three times to end the year with the target in a range of 1.50% to 1.75%.
Longer term yields also declined over the course of the year, with the benchmark 10-year Treasury falling by 77 basis points to end the year at 1.92%. Although yields were lower for all maturities, shorter term Treasury yields fell by a greater magnitude than longer term yields, leading to a modest steepening of the yield curve.
Bond sectors rallied across the board. Corporate bonds saw particularly significant gains, with returns exceeding 14% for both investment-grade and high-yield corporates. These strong results were due in part to strong investor demand that overcame increased supply as corporate issuance rose 6% from 2018 levels. The spread between investment-grade corporate bonds and Treasuries — the premium investors receive for taking credit risk — tightened by 60 basis points to end the year at 93 basis points on an option-adjusted basis. Modestly higher inflation expectations led Treasury Inflation-Protected Securities (TIPS) to gain 8.43%, outpacing nominal Treasuries.
Fixed income’s strong results came amid a backdrop of a U.S. economy sending
Results at a glance
For periods ended December 31, 2019, with all distributions reinvested
| | | Cumulative
total return | | Average annual total returns |
| | | 1 year | | 3 years | | 5 years | | 10 years | | Lifetime
(since 5/28/74) |
| | | | | | | | | | | | | | | | |
| The Bond Fund of America (Class A shares) | | | 8.02 | % | | | 3.65 | % | | | 2.78 | % | | | 3.68 | % | | | 7.39 | % |
| Bloomberg Barclays U.S. Aggregate Index1 | | | 8.72 | | | | 4.03 | | | | 3.05 | | | | 3.75 | | | | 7.39 | |
| Lipper Core Bond Funds Average2 | | | 8.70 | | | | 3.80 | | | | 2.86 | | | | 3.79 | | | | 7.24 | |
| 1 | Bloomberg Index Services Ltd. The Bloomberg Barclays U.S. Aggregate Index began on January 1, 1976. From May 28, 1974, through December 31, 1975, the Barclays U.S. Government/Credit Index was used. The indexes are unmanaged and, therefore, have no expenses. Investors cannot invest directly in an index. |
| 2 | Source: Lipper, Refinitiv Datastream. Results for the Lipper averages do not reflect sales charges. Lipper averages reflect the current composition of all eligible mutual funds (all share classes) within a given category. To see the number of funds included in the Lipper category for each fund’s lifetime, please view the Quarterly Statistical Update, at capitalgroup.com. |
| The Bond Fund of America | 1 |
mixed signals. Industrial and trade-related sectors showed weakness in 2019, while services and consumer-related sectors were steady. Consumer confidence remained high and employment growth in the U.S. showed remarkable resilience, which pushed the unemployment rate down to near historic lows — at just 3.5% at the end of 2019.
Inside the portfolio
The fund continued to invest in high-quality fixed income assets, consisting largely of U.S. Treasuries, investment-grade corporate bonds and mortgage-backed securities. In an environment of heightened uncertainty starting the year, managers were defensively positioned. This provided an opportunity to selectively add credit exposure as valuations became more attractive. However, as markets stabilized and asset prices rose, managers reduced credit exposure where valuations looked full.
The portfolio’s duration — a measure of interest rate risk exposure — was lower than the benchmark’s when rates were falling. This was a modest headwind to returns relative to the index. The portfolio also positioned for a steepening of the Treasury yield curve, meaning that the difference between the yield of bonds with longer and shorter maturities would increase. For much of the year the opposite outcome occurred: the spread between yields of Treasuries with longer and shorter maturities tightened. However, toward the end of the year, the curve steepened and the position ultimately had a roughly neutral impact on returns relative to the index. The portfolio had a smaller concentration of mortgage bonds than its benchmark. This detracted from results when this sector benefited amid the broader rally in riskier assets.
To manage duration and curve positioning, the fund held both cash bonds and derivatives, such as interest rate swaps and futures. The fund primarily used these derivatives to express views about the relationship between shorter and longer dated Treasury yields, as well as to limit interest rate risk. On balance, these swaps had a negative impact on results relative to the index. Credit default swaps were also used to reduce the portfolio’s exposure to credit. Because credit flourished in 2019, this protection detracted from results.
On the positive side, an overweight position in TIPS helped results, as rising inflation expectations lifted the value of these securities.
The portfolio also benefited from security selection within investment-grade corporate bonds. For example, Italian bank debt had suffered mostly due to pessimism about Italy’s prospects based on political risk. Our analysts’ research indicated strong fundamentals for these banks along with a view that the impact of Italian politics would diminish in time. As investor fears subsided and the country’s credit risk improved, these bonds rose in value and provided a positive contribution to results.
A modest exposure to select high-yield corporate bonds for which our analysts expressed strong conviction also helped results. One example of this was a notable investment in high-yield issuer Teva Pharmaceutical. A few troubling headlines over the past couple of years led these bonds to decline in value. But our analyst research provided a high level of confidence that the company would weather these storms. In the fourth quarter of 2019, its debt rose sharply in value as worries about the company’s future faded.
| 2 | The Bond Fund of America |
Looking ahead
Although some indicators remain mixed, we believe the U.S. economy is likely to maintain its current path of modest growth, absent any major unexpected shocks. Persistent risks, such as geopolitics, trade disputes and a slowing Chinese economy, remain a concern. However, resilient employment growth, consumer spending and accommodative monetary policy should be enough to extend the current economic cycle.
We believe that positive U.S. growth in combination with a Fed on hold will support both credit spreads and interest rates. But investors should not expect gains in 2020 to match the lofty levels of 2019. The economic environment remains conducive to positive results in fixed income, but upside potential is also limited: Markets have already priced in those positive factors such as easy central bank policy and positive economic growth. Moreover, valuations for corporate bonds and other risk assets appear very high from a historical perspective. Finally, the tailwind of lower interest rates from a rate-cutting Fed is unlikely to help in 2020, as the Fed appears to be on hold unless conditions begin to deteriorate materially.
With this economic environment in mind, managers are not extremely bearish on credit risk, but they are concerned at how expensive it has become. As a result, we will rely on our research analysts to shine a light on securities or sectors that appear to provide better relative value. We will also continue to reduce exposure to sectors that we believe have become overvalued. In this market we view occasional bouts of volatility that may occur as opportunities to add to our credit exposure. Such short-term episodes will cheapen some bonds relative to what we see as their fair value over the longer run.
With the current economic expansion now more than 10 years old, it is the longest in the post-war period. While we expect the expansion to continue in 2020, late cycle economies may be susceptible to risks or idiosyncratic problems throwing it off balance. For that reason, we feel strongly that a core bond fund like The Bond Fund of America should remain conservatively positioned with a long-term focus. Managers remain committed to pursuing all four roles of fixed income: income, diversification from equities, capital preservation and inflation protection. We aim to manage a fund that will help to provide stability for your portfolio in any market environment.
Thank you for your trust in our portfolio management team. We look forward to reporting to you again in six months.
Cordially,

Pramod Atluri
President
February 11, 2020
For current information about the fund, visit capitalgroup.com.
| The Bond Fund of America | 3 |
The value of a long-term perspective
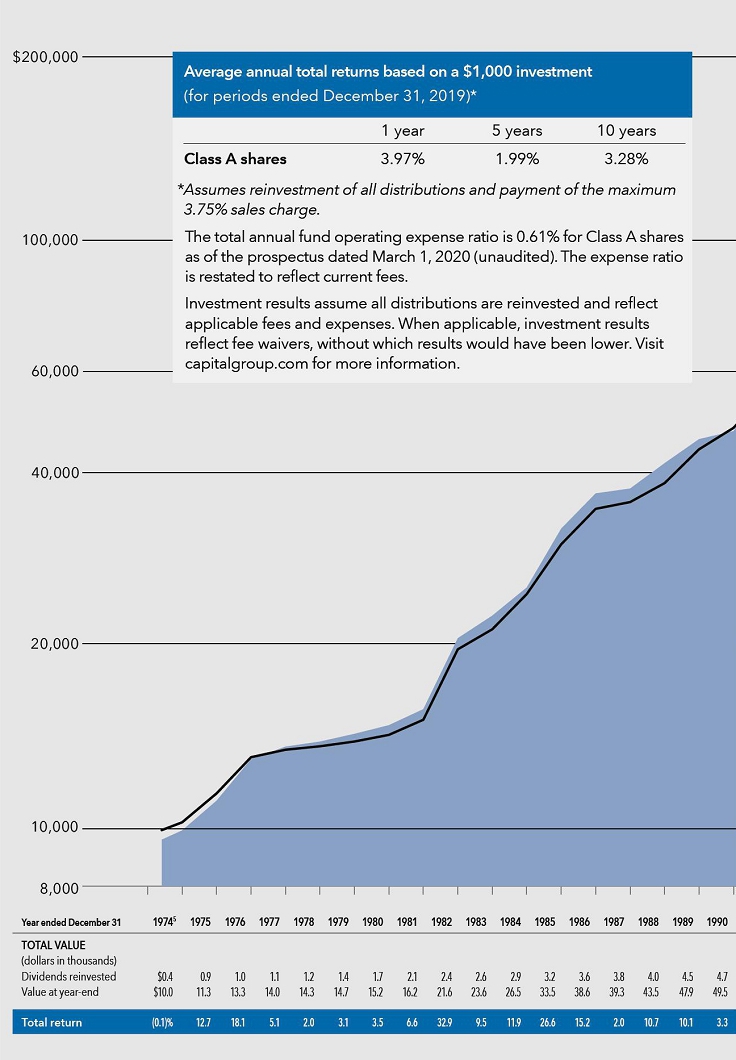
Fund results shown are for Class A shares and reflect deduction of the maximum sales charge of 3.75% on the $10,000 investment.1 Thus, the net amount invested was $9,625.2 Results are for past periods and are not predictive of results for future periods. Current and future results may be lower or higher than those shown. Share prices and returns will vary, so investors may lose money. Investing for short periods makes losses more likely. For current information and month-end results, visit capitalgroup.com.
The results shown are before taxes on fund distributions and sale of fund shares.
| 1 | As outlined in the prospectus, the sales charge is reduced for accounts (and aggregated investments) of $100,000 or more and is eliminated for purchases of $1 million or more. There is no sales charge on dividends or capital gain distributions that are reinvested in additional shares. |
| 2 | The maximum initial sales charge was 8.5% prior to December 15, 1986, when it became 4.75% until January 9, 2000. |
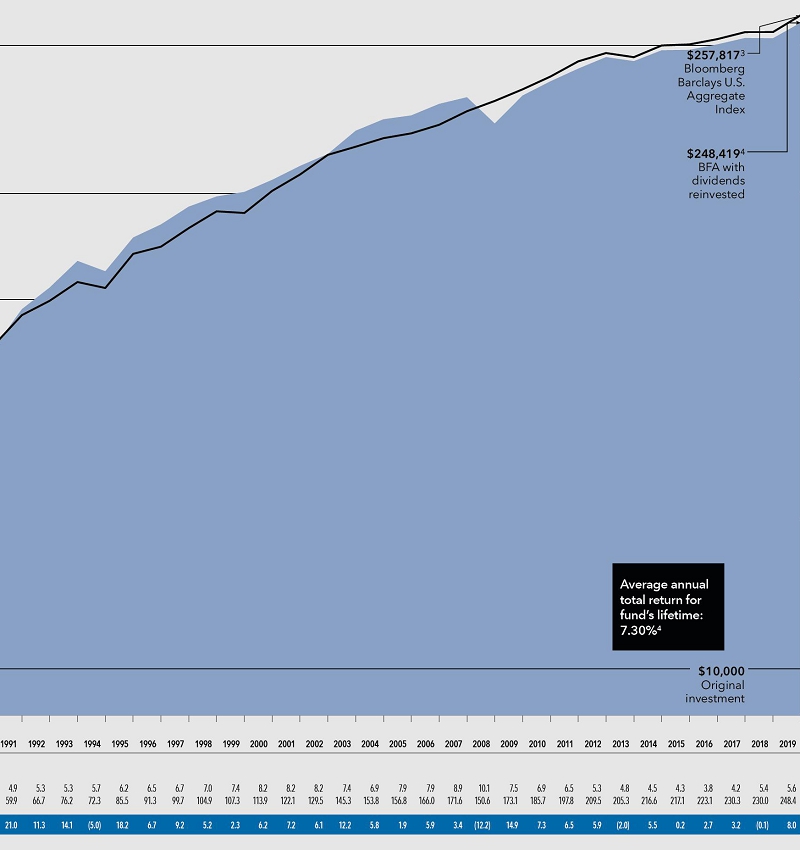
| 3 | Source: Bloomberg Index Services Ltd. Bloomberg Barclays U.S. Aggregate Index represents the U.S. investment-grade fixed-rate bond market. From May 28, 1974, through December 31, 1975, Bloomberg Barclays U.S. Government/Credit Index was used because Bloomberg Barclays U.S. Aggregate Index did not yet exist. Since January 1, 1976, the Bloomberg Barclays U.S. Aggregate Index has been used. These indexes are unmanaged and, therefore, have no expenses. Investors cannot invest directly in an index. |
| 4 | Includes reinvested dividends of $229,141 and reinvested capital gain distributions of $7,881. |
| 5 | For the period May 28, 1974, commencement of operations, through December 31, 1974. |
| 4 | The Bond Fund of America |
How a hypothetical $10,000 investment has grown
There have always been reasons not to invest. You will find, however, that despite occasional stumbles, financial markets have tended to reward investors over the long term. Dividends, particularly when reinvested, have accounted for a large portion of the fund’s overall results.
| The Bond Fund of America | 5 |
Summary investment portfolio December 31, 2019
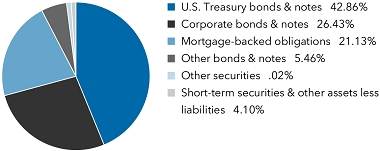
| Portfolio quality summary* | | Percent of
net assets |
| U.S. Treasury and agency† | | | 42.86 | % |
| AAA/Aaa | | | 23.42 | |
| AA/Aa | | | 3.24 | |
| A/A | | | 9.70 | |
| BBB/Baa | | | 13.66 | |
| Below investment grade | | | 3.01 | |
| Unrated | | | .01 | |
| Short-term securities & other assets less liabilities | | | 4.10 | |
| * | Bond ratings, which typically range from AAA/Aaa (highest) to D (lowest), are assigned by credit rating agencies such as Standard & Poor’s, Moody’s and/or Fitch as an indication of an issuer’s creditworthiness. In assigning a credit rating to a security, the fund looks specifically to the ratings assigned to the issuer of the security by Standard & Poor’s, Moody’s and/or Fitch. If agency ratings differ, the security will be considered to have received the highest of those ratings, consistent with the fund’s investment policies. Securities in the “unrated” category (above) have not been rated by a rating agency; however, the investment adviser performs its own credit analysis and assigns comparable ratings that are used for compliance with the fund’s investment policies. The ratings are not covered by the Report of Independent Registered Public Accounting Firm. |
| † | These securities are guaranteed by the full faith and credit of the U.S. government. |
| Bonds, notes & other debt instruments 95.88% | | Principal amount
(000) | | | Value
(000) | |
| U.S. Treasury bonds & notes 42.86% | | | | | | | | |
| U.S. Treasury 39.79% | | | | | | | | |
| U.S. Treasury 1.625% 2021 | | $ | 232,662 | | | $ | 232,759 | |
| U.S. Treasury (3-month U.S. Treasury Bill Yield + 0.30%) 1.826% 20211 | | | 515,888 | | | | 516,708 | |
| U.S. Treasury 2.125% 2021 | | | 250,000 | | | | 251,832 | |
| U.S. Treasury 2.50% 20212 | | | 1,245,000 | | | | 1,257,550 | |
| U.S. Treasury 1.50% 2022 | | | 255,000 | | | | 254,355 | |
| U.S. Treasury 1.625% 2022 | | | 252,000 | | | | 252,081 | |
| U.S. Treasury 1.875% 20222 | | | 371,200 | | | | 373,902 | |
| U.S. Treasury 1.875% 2022 | | | 281,500 | | | | 283,245 | |
| U.S. Treasury 2.00% 2022 | | | 399,550 | | | | 403,793 | |
| U.S. Treasury 2.00% 2022 | | | 220,460 | | | | 222,876 | |
| U.S. Treasury 2.125% 20222 | | | 460,830 | | | | 467,673 | |
| U.S. Treasury 1.50% 20232 | | | 417,860 | | | | 416,251 | |
| U.S. Treasury 2.50% 2023 | | | 205,735 | | | | 211,971 | |
| U.S. Treasury 2.625% 2023 | | | 438,800 | | | | 452,236 | |
| U.S. Treasury 2.625% 2023 | | | 211,578 | | | | 219,512 | |
| U.S. Treasury 2.75% 2023 | | | 270,000 | | | | 279,898 | |
| U.S. Treasury 2.875% 2023 | | | 396,200 | | | | 414,184 | |
| U.S. Treasury 2.875% 2023 | | | 242,729 | | | | 253,567 | |
| U.S. Treasury 1.50% 2024 | | | 436,720 | | | | 433,121 | |
| U.S. Treasury 1.50% 2024 | | | 268,281 | | | | 266,070 | |
| U.S. Treasury 1.75% 2024 | | | 320,202 | | | | 321,252 | |
| U.S. Treasury 1.75% 2024 | | | 209,857 | | | | 210,554 | |
| U.S. Treasury 2.00% 2024 | | | 723,650 | | | | 733,745 | |
| U.S. Treasury 2.125% 2024 | | | 550,850 | | | | 561,955 | |
| U.S. Treasury 2.375% 2024 | | | 230,233 | | | | 236,825 | |
| U.S. Treasury 2.75% 20252 | | | 992,493 | | | | 1,043,944 | |
| U.S. Treasury 2.875% 2025 | | | 287,175 | | | | 304,248 | |
| U.S. Treasury 1.625% 2026 | | | 227,900 | | | | 225,097 | |
| U.S. Treasury 1.75% 2026 | | | 215,000 | | | | 213,807 | |
| U.S. Treasury 1.875% 2026 | | | 442,000 | | | | 444,020 | |
| U.S. Treasury 1.875% 2026 | | | 315,013 | | | | 316,588 | |
| 6 | The Bond Fund of America |
| | | Principal amount
(000) | | | Value
(000) | |
| U.S. Treasury 2.25% 2027 | | $ | 220,486 | | | $ | 226,805 | |
| U.S. Treasury 1.625% 2029 | | | 391,863 | | | | 381,718 | |
| U.S. Treasury 1.75% 2029 | | | 585,353 | | | | 576,438 | |
| U.S. Treasury 2.25% 2049 | | | 909,217 | | | | 882,213 | |
| U.S. Treasury 2.375% 20492 | | | 259,800 | | | | 258,948 | |
| U.S. Treasury 2.875% 20492 | | | 263,569 | | | | 290,564 | |
| U.S. Treasury 1.13%–4.63% 2020–20492 | | | 5,234,400 | | | | 5,379,124 | |
| | | | | | | | 20,071,429 | |
| | | | | | | | | |
| U.S. Treasury inflation-protected securities 3.07% | | | | | | | | |
| U.S. Treasury Inflation-Protected Security 0.625% 20233 | | | 230,711 | | | | 234,379 | |
| U.S. Treasury Inflation-Protected Security 0.50% 20243 | | | 290,375 | | | | 295,214 | |
| U.S. Treasury Inflation-Protected Security 0.25% 20293 | | | 294,654 | | | | 297,918 | |
| U.S. Treasury Inflation-Protected Security 1.00% 20492,3 | | | 269,614 | | | | 300,088 | |
| U.S. Treasury Inflation-Protected Securities 0.13%–2.13% 2024–20472,3 | | | 403,518 | | | | 422,052 | |
| | | | | | | | 1,549,651 | |
| | | | | | | | | |
| Total U.S. Treasury bonds & notes | | | | | | | 21,621,080 | |
| | | | | | | | | |
| Corporate bonds & notes 26.43% | | | | | | | | |
| Financials 5.98% | | | | | | | | |
| Other securities | | | | | | | 3,014,536 | |
| | | | | | | | | |
| Health care 4.43% | | | | | | | | |
| Teva Pharmaceutical Finance Co. BV 2.80% 2023 | | | 235,098 | | | | 218,544 | |
| Teva Pharmaceutical Finance Co. BV 2.20%–7.13% 2021–20464 | | | 419,771 | | | | 376,724 | |
| Other securities | | | | | | | 1,640,607 | |
| | | | | | | | 2,235,875 | |
| | | | | | | | | |
| Energy 3.35% | | | | | | | | |
| Other securities | | | | | | | 1,690,523 | |
| | | | | | | | | |
| Utilities 2.63% | | | | | | | | |
| Other securities | | | | | | | 1,328,643 | |
| | | | | | | | | |
| Consumer staples 2.45% | | | | | | | | |
| Other securities | | | | | | | 1,236,564 | |
| | | | | | | | | |
| Consumer discretionary 2.27% | | | | | | | | |
| Other securities | | | | | | | 1,143,695 | |
| | | | | | | | | |
| Information technology 1.47% | | | | | | | | |
| Other securities | | | | | | | 739,968 | |
| | | | | | | | | |
| Industrials 1.41% | | | | | | | | |
| Other securities | | | | | | | 711,889 | |
| | | | | | | | | |
| Other 2.44% | | | | | | | | |
| Other securities | | | | | | | 1,229,636 | |
| | | | | | | | | |
| Total corporate bonds & notes | | | | | | | 13,331,329 | |
| | | | | | | | | |
| Mortgage-backed obligations 21.13% | | | | | | | | |
| Federal agency mortgage-backed obligations 20.20% | | | | | | | | |
| Fannie Mae Pool #CA4858 3.00% 20495 | | | 288,941 | | | | 295,251 | |
| Fannie Mae Pool #MA3905 3.00% 20505 | | | 207,487 | | | | 210,387 | |
| Fannie Mae 0%–9.50% 2022–20581,4,5 | | | 2,608,363 | | | | 2,701,091 | |
| Freddie Mac Pool #SD7507 3.00% 20495 | | | 418,035 | | | | 430,200 | |
| Freddie Mac Pool #SD8005 3.50% 20495 | | | 303,532 | | | | 311,878 | |
| Freddie Mac 0%–7.50% 2023–20501,5 | | | 2,436,865 | | | | 2,517,604 | |
| Government National Mortgage Assn. Pool #MA6339 3.50% 20495 | | | 197,169 | | | | 204,301 | |
| Government National Mortgage Assn. Pool #MA5987 4.50% 20495 | | | 199,495 | | | | 209,211 | |
| The Bond Fund of America | 7 |
| Bonds, notes & other debt instruments (continued) | | Principal amount
(000) | | | Value
(000) | |
| Mortgage-backed obligations (continued) | | | | | | | | |
| Federal agency mortgage-backed obligations (continued) | | | | | | | | |
| Government National Mortgage Assn. 2.50%–6.64% 2028–20655,6 | | $ | 1,292,099 | | | $ | 1,344,542 | |
| Uniform Mortgage-Backed Security 3.00% 20355,6 | | | 871,005 | | | | 891,902 | |
| Uniform Mortgage-Backed Securities 2.50%–4.50% 2035–20505,6 | | | 83,481 | | | | 84,760 | |
| Other securities | | | | | | | 989,940 | |
| | | | | | | | 10,191,067 | |
| | | | | | | | | |
| Other 0.93% | | | | | | | | |
| Other securities | | | | | | | 468,734 | |
| | | | | | | | | |
| Total mortgage-backed obligations | | | | | | | 10,659,801 | |
| | | | | | | | | |
| Other 5.46% | | | | | | | | |
| Other securities | | | | | | | 2,756,966 | |
| | | | | | | | | |
| Total bonds, notes & other debt instruments (cost: $47,187,947,000) | | | | | | | 48,369,176 | |
| | | | | | | | | |
| Preferred securities 0.01% | | | Shares | | | | | |
| Financials 0.01% | | | | | | | | |
| Other securities | | | | | | | 4,219 | |
| | | | | | | | | |
| Total preferred securities (cost: $5,820,000) | | | | | | | 4,219 | |
| | | | | | | | | |
| Common stocks 0.01% | | | | | | | | |
| Other 0.01% | | | | | | | | |
| Other securities | | | | | | | 6,863 | |
| | | | | | | | | |
| Total common stocks (cost: $12,646,000) | | | | | | | 6,863 | |
| | | | | | | | | |
| Short-term securities 5.75% | | | | | | | | |
| Money market investments 5.70% | | | | | | | | |
| Capital Group Central Cash Fund 1.73%7 | | | 28,748,660 | | | | 2,874,866 | |
| | | | | | | | | |
| | | Principal amount
(000) | | | | | |
| Other short-term securities 0.05% | | | | | | | | |
| Other securities | | | | | | | 25,918 | |
| | | | | | | | | |
| Total short-term securities (cost: $2,898,112,000) | | | | | | | 2,900,784 | |
| Total investment securities 101.65% (cost: $50,104,525,000) | | | | | | | 51,281,042 | |
| Other assets less liabilities (1.65)% | | | | | | | (833,950 | ) |
| | | | | | | | | |
| Net assets 100.00% | | | | | | $ | 50,447,092 | |
This summary investment portfolio is designed to streamline the report and help investors better focus on the fund’s principal holdings. See the inside back cover for details on how to obtain a complete schedule of portfolio holdings.
“Other securities” includes all issues that are not disclosed separately in the summary investment portfolio. “Other securities” includes securities that were valued under fair value procedures adopted by authority of the board of trustees. The total value of securities that were valued under fair value procedures was $32,455,000, which represented .06% of the net assets of the fund. “Other securities” also includes loan participations and assignments, which may be subject to legal or contractual restrictions on resale. The total value of all such loans was $16,533,000, which represented .03% of the net assets of the fund. One security in “Other securities” (with a value of $6,841,000, an aggregate cost of $12,646,000, and which represented .01% of the net assets of the fund) was acquired on 9/26/2013 through private placement transactions exempt from registration under the Securities Act of 1933, which may subject it to legal or contractual restrictions on resale.
| 8 | The Bond Fund of America |
Futures contracts
| Contracts | | Type | | Number of
contracts | | | Expiration | | Notional
amount
(000) | 8
| Value at
12/31/2019
(000) | 9
| | Unrealized
(depreciation)
appreciation
at 12/31/2019
(000) | |
| 30 Day Federal Funds Futures | | Long | | 2,048 | | | January 2020 | | | $ | 853,402 | | | $ | 840,153 | | | $ | (537 | ) |
| 90 Day Euro Dollar Futures | | Long | | 746 | | | March 2020 | | | | 186,500 | | | | 183,264 | | | | (270 | ) |
| 90 Day Euro Dollar Futures | | Long | | 2,697 | | | March 2021 | | | | 674,250 | | | | 663,732 | | | | (461 | ) |
| 2 Year U.S. Treasury Note Futures | | Long | | 41,046 | | | April 2020 | | | | 8,209,200 | | | | 8,845,413 | | | | (1,825 | ) |
| 5 Year Euro-Bobl Futures | | Long | | 1,575 | | | March 2020 | | | € | 157,500 | | | | 236,081 | | | | (639 | ) |
| 5 Year U.S. Treasury Note Futures | | Long | | 65,414 | | | April 2020 | | | $ | 6,541,400 | | | | 7,758,714 | | | | (26,569 | ) |
| 10 Year Euro-Bund Futures | | Long | | 182 | | | March 2020 | | | € | 18,200 | | | | 34,805 | | | | (321 | ) |
| 10 Year U.S. Treasury Note Futures | | Long | | 12,816 | | | March 2020 | | | $ | 1,281,600 | | | | 1,645,855 | | | | (10,353 | ) |
| 10 Year Ultra U.S. Treasury Note Futures | | Short | | 10,528 | | | March 2020 | | | | (1,052,800 | ) | | | (1,481,323 | ) | | | 15,245 | |
| 20 Year U.S. Treasury Bond Futures | | Long | | 2,500 | | | March 2020 | | | | 250,000 | | | | 389,766 | | | | (6,924 | ) |
| 30 Year Euro-Buxl Futures | | Long | | 277 | | | March 2020 | | | € | 27,700 | | | | 61,639 | | | | (1,715 | ) |
| 30 Year Ultra U.S. Treasury Bond Futures | | Long | | 3,493 | | | March 2020 | | | $ | 349,300 | | | | 634,525 | | | | (17,963 | ) |
| | | | | | | | | | | | | | | | | | | $ | (52,332 | ) |
Forward currency contracts
| Contract amount | | | | | | | Unrealized
appreciation
(depreciation) | |
Purchases
(000) | | Sales
(000) | | Counterparty | | Settlement
date | | at 12/31/2019
(000) | |
| EUR109,690 | | USD122,168 | | Citibank | | | 1/6/2020 | | | $ | 917 | |
| EUR5,310 | | USD5,912 | | Bank of New York Mellon | | | 1/6/2020 | | | | 47 | |
| EUR500 | | USD555 | | Standard Chartered Bank | | | 1/6/2020 | | | | 6 | |
| USD5,724 | | EUR5,156 | | JPMorgan Chase | | | 1/6/2020 | | | | (62 | ) |
| JPY3,381,918 | | USD31,230 | | UBS AG | | | 1/6/2020 | | | | (94 | ) |
| USD25,803 | | MXN504,000 | | Goldman Sachs | | | 1/6/2020 | | | | (832 | ) |
| USD127,270 | | EUR115,000 | | Morgan Stanley | | | 1/6/2020 | | | | (1,774 | ) |
| CAD5,432 | | USD4,087 | | HSBC Bank | | | 1/7/2020 | | | | 96 | |
| USD636 | | EUR575 | | HSBC Bank | | | 1/7/2020 | | | | (10 | ) |
| USD35,423 | | MXN691,600 | | Barclays Bank PLC | | | 1/7/2020 | | | | (1,121 | ) |
| KRW161,956,500 | | USD138,572 | | Citibank | | | 1/9/2020 | | | | 1,505 | |
| KRW161,956,500 | | USD138,608 | | JPMorgan Chase | | | 1/9/2020 | | | | 1,470 | |
| COP80,099,000 | | USD23,186 | | Citibank | | | 1/9/2020 | | | | 1,171 | |
| USD2,107 | | EUR1,895 | | Morgan Stanley | | | 1/9/2020 | | | | (20 | ) |
| USD3,849 | | INR277,800 | | JPMorgan Chase | | | 1/9/2020 | | | | (40 | ) |
| USD3,367 | | BRL14,170 | | Goldman Sachs | | | 1/9/2020 | | | | (154 | ) |
| USD27,615 | | KRW32,275,000 | | Citibank | | | 1/9/2020 | | | | (300 | ) |
| USD19,226 | | BRL81,100 | | JPMorgan Chase | | | 1/9/2020 | | | | (927 | ) |
| USD66,640 | | INR4,797,850 | | JPMorgan Chase | | | 1/10/2020 | | | | (513 | ) |
| MXN59,800 | | USD3,098 | | HSBC Bank | | | 1/13/2020 | | | | 58 | |
| GBP2,060 | | USD2,713 | | Bank of America | | | 1/13/2020 | | | | 17 | |
| USD645 | | GBP490 | | Bank of America | | | 1/13/2020 | | | | (4 | ) |
| USD1,832 | | EUR1,650 | | HSBC Bank | | | 1/13/2020 | | | | (20 | ) |
| USD4,293 | | CAD5,682 | | JPMorgan Chase | | | 1/13/2020 | | | | (83 | ) |
| USD11,794 | | SEK112,000 | | UBS AG | | | 1/13/2020 | | | | (171 | ) |
| USD19,644 | | SGD26,700 | | Standard Chartered Bank | | | 1/13/2020 | | | | (210 | ) |
| USD40,806 | | MXN788,295 | | Barclays Bank PLC | | | 1/13/2020 | | | | (805 | ) |
| NZD21,970 | | USD14,381 | | Citibank | | | 1/14/2020 | | | | 413 | |
| USD26,712 | | JPY2,891,581 | | Bank of New York Mellon | | | 1/14/2020 | | | | 78 | |
| USD14,722 | | NZD21,970 | | Goldman Sachs | | | 1/14/2020 | | | | (71 | ) |
| USD19,753 | | JPY2,137,809 | | Goldman Sachs | | | 1/15/2020 | | | | 61 | |
| CAD250 | | USD190 | | Bank of America | | | 1/15/2020 | | | | 3 | |
| USD13,817 | | MXN262,000 | | Goldman Sachs | | | 1/15/2020 | | | | (8 | ) |
| USD3,779 | | EUR3,385 | | Bank of New York Mellon | | | 1/15/2020 | | | | (21 | ) |
| USD11,593 | | MXN222,520 | | Citibank | | | 1/15/2020 | | | | (149 | ) |
| GBP17,500 | | USD22,928 | | Barclays Bank PLC | | | 1/16/2020 | | | | 264 | |
| USD28,072 | | GBP21,000 | | Goldman Sachs | | | 1/16/2020 | | | | 242 | |
| JPY1,769,000 | | USD16,259 | | Citibank | | | 1/16/2020 | | | | 37 | |
| USD2,150 | | MXN41,200 | | Citibank | | | 1/16/2020 | | | | (24 | ) |
| The Bond Fund of America | 9 |
Forward currency contracts(continued)
| Contract amount | | | | | | | Unrealized
appreciation
(depreciation) | |
Purchases
(000) | | Sales
(000) | | Counterparty | | Settlement
date | | at 12/31/2019
(000) | |
| USD20,182 | | GBP15,330 | | Barclays Bank PLC | | | 1/16/2020 | | | $ | (134 | ) |
| AUD17,424 | | USD12,006 | | Citibank | | | 1/17/2020 | | | | 227 | |
| USD4,842 | | EUR4,326 | | Morgan Stanley | | | 1/17/2020 | | | | (16 | ) |
| EUR23,410 | | MXN500,000 | | Goldman Sachs | | | 1/17/2020 | | | | (89 | ) |
| EUR66,325 | | USD74,196 | | Goldman Sachs | | | 1/23/2020 | | | | 311 | |
| EUR205 | | USD229 | | Citibank | | | 1/23/2020 | | | | 1 | |
| AUD23,900 | | USD16,404 | | Citibank | | | 1/24/2020 | | | | 378 | |
| EUR53,409 | | USD59,569 | | UBS AG | | | 1/27/2020 | | | | 444 | |
| USD152,634 | | EUR136,861 | | JPMorgan Chase | | | 1/27/2020 | | | | (1,149 | ) |
| USD3,440 | | INR245,150 | | Standard Chartered Bank | | | 1/28/2020 | | | | 15 | |
| | | | | | | | | | | $ | (1,040 | ) |
Swap contracts
Interest rate swaps
| Receive | | Pay | | Expiration
date | | Notional
(000) | | | Value at
12/31/2019 (000) | | Upfront
payments/
receipts
(000) | | Unrealized
appreciation
(depreciation)
at 12/31/2019
(000) | |
| 1.555% | | U.S. EFFR | | 1/29/2020 | | $ | 12,969,200 | | | $ | 27 | | | $ | — | | | $ | 27 | |
| 1.553% | | U.S. EFFR | | 1/29/2020 | | | 8,686,900 | | | | 5 | | | | — | | | | 5 | |
| 1.538% | | U.S. EFFR | | 1/29/2020 | | | 12,696,600 | | | | (141 | ) | | | — | | | | (141 | ) |
| 1.5365% | | U.S. EFFR | | 1/29/2020 | | | 15,449,600 | | | | (189 | ) | | | — | | | | (189 | ) |
| 1.535% | | U.S. EFFR | | 1/29/2020 | | | 16,208,200 | | | | (218 | ) | | | — | | | | (218 | ) |
| U.S. EFFR | | 1.558% | | 3/18/2020 | | | 5,375,000 | | | | 44 | | | | — | | | | 44 | |
| U.S. EFFR | | 1.56% | | 3/18/2020 | | | 5,375,000 | | | | 29 | | | | — | | | | 29 | |
| 1.515% | | U.S. EFFR | | 3/18/2020 | | | 3,631,900 | | | | (241 | ) | | | — | | | | (241 | ) |
| 1.531% | | U.S. EFFR | | 3/18/2020 | | | 7,562,300 | | | | (338 | ) | | | — | | | | (338 | ) |
| 1.5305% | | U.S. EFFR | | 3/18/2020 | | | 8,188,200 | | | | (372 | ) | | | — | | | | (372 | ) |
| 1.5155% | | U.S. EFFR | | 3/18/2020 | | | 7,679,000 | | | | (505 | ) | | | — | | | | (505 | ) |
| 1.5135% | | U.S. EFFR | | 3/18/2020 | | | 7,677,700 | | | | (526 | ) | | | — | | | | (526 | ) |
| 1.5435% | | U.S. EFFR | | 4/29/2020 | | | 18,003,900 | | | | (202 | ) | | | — | | | | (202 | ) |
| 1.535% | | U.S. EFFR | | 4/29/2020 | | | 14,249,900 | | | | (300 | ) | | | — | | | | (300 | ) |
| 2.898% | | 3-month USD-LIBOR | | 8/3/2020 | | | 155,000 | | | | 977 | | | | — | | | | 977 | |
| 3-month USD-LIBOR | | 2.806% | | 8/29/2020 | | | 194,600 | | | | (1,268 | ) | | | — | | | | (1,268 | ) |
| 1.4555% | | U.S. EFFR | | 12/10/2020 | | | 705,400 | | | | (422 | ) | | | — | | | | (422 | ) |
| 1.454% | | U.S. EFFR | | 12/10/2020 | | | 834,600 | | | | (511 | ) | | | — | | | | (511 | ) |
| 1.491% | | U.S. EFFR | | 12/16/2020 | | | 770,100 | | | | (191 | ) | | | — | | | | (191 | ) |
| 1.487% | | U.S. EFFR | | 12/16/2020 | | | 759,900 | | | | (218 | ) | | | — | | | | (218 | ) |
| 1.4995% | | U.S. EFFR | | 12/20/2020 | | | 1,540,000 | | | | (232 | ) | | | — | | | | (232 | ) |
| 2.346% | | U.S. EFFR | | 2/26/2021 | | | 118,000 | | | | 1,074 | | | | — | | | | 1,074 | |
| 2.1125% | | U.S. EFFR | | 3/28/2021 | | | 382,000 | | | | 2,592 | | | | — | | | | 2,592 | |
| 2.103% | | U.S. EFFR | | 3/28/2021 | | | 297,000 | | | | 1,980 | | | | — | | | | 1,980 | |
| 3-month USD-LIBOR | | 2.367% | | 3/28/2021 | | | 1,386,800 | | | | (10,627 | ) | | | — | | | | (10,627 | ) |
| 2.19875% | | U.S. EFFR | | 5/7/2021 | | | 367,600 | | | | 3,174 | | | | — | | | | 3,174 | |
| 3-month USD-LIBOR | | 2.312% | | 5/23/2021 | | | 318,000 | | | | (2,607 | ) | | | — | | | | (2,607 | ) |
| 1.355% | | U.S. EFFR | | 10/24/2021 | | | 243,600 | | | | (409 | ) | | | — | | | | (409 | ) |
| 1.339% | | U.S. EFFR | | 10/24/2021 | | | 443,000 | | | | (871 | ) | | | — | | | | (871 | ) |
| 1.3065% | | U.S. EFFR | | 10/25/2021 | | | 315,500 | | | | (803 | ) | | | — | | | | (803 | ) |
| 1.305% | | U.S. EFFR | | 10/25/2021 | | | 343,900 | | | | (884 | ) | | | — | | | | (884 | ) |
| 1.39% | | U.S. EFFR | | 10/31/2021 | | | 700,800 | | | | (701 | ) | | | — | | | | (701 | ) |
| 1.3615% | | U.S. EFFR | | 11/1/2021 | | | 2,832,100 | | | | (4,300 | ) | | | — | | | | (4,300 | ) |
| 1.332% | | U.S. EFFR | | 11/4/2021 | | | 181,000 | | | | (372 | ) | | | — | | | | (372 | ) |
| 1.281% | | U.S. EFFR | | 11/4/2021 | | | 2,835,800 | | | | (8,482 | ) | | | — | | | | (8,482 | ) |
| 1.4025% | | U.S. EFFR | | 11/7/2021 | | | 351,000 | | | | (269 | ) | | | — | | | | (269 | ) |
| U.S. EFFR | | 1.335% | | 11/26/2021 | | | 1,463,000 | | | | 2,971 | | | | — | | | | 2,971 | |
| 2.326% | | U.S. EFFR | | 1/2/2022 | | | 1,450,000 | | | | 25,566 | | | | — | | | | 25,566 | |
| 8.54% | | 28-day MXN-TIIE | | 1/6/2022 | | | MXN884,158 | | | | 1,667 | | | | — | | | | 1,667 | |
| 8.44% | | 28-day MXN-TIIE | | 1/7/2022 | | | 995,842 | | | | 1,780 | | | | — | | | | 1,780 | |
| 10 | The Bond Fund of America |
| Receive | | Pay | | Expiration
date | | Notional
(000) | | | Value at
12/31/2019
(000) | | Upfront
payments/
receipts
(000) | | Unrealized
appreciation
(depreciation)
at 12/31/2019
(000) | |
| 2.197% | | U.S. EFFR | | 4/18/2022 | | $ | 369,200 | | | $ | 5,983 | | | $ | — | | | $ | 5,983 | |
| 3-month USD-LIBOR | | 2.321% | | 5/2/2022 | | | 469,700 | | | | (6,962 | ) | | | — | | | | (6,962 | ) |
| 6.99% | | 28-day MXN-TIIE | | 6/17/2022 | | MXN | 655,000 | | | | 301 | | | | — | | | | 301 | |
| 1.8475% | | 3-month USD-LIBOR | | 7/11/2022 | | $ | 210,200 | | | | 905 | | | | — | | | | 905 | |
| 2.5775% | | U.S. EFFR | | 7/16/2022 | | | 1,001,820 | | | | 11,622 | | | | — | | | | 11,622 | |
| 3-month USD-LIBOR | | 1.948% | | 7/28/2022 | | | 630,000 | | | | (4,365 | ) | | | — | | | | (4,365 | ) |
| 2.80% | | 3-month USD-LIBOR | | 9/2/2022 | | | 785,000 | | | | 17,884 | | | | — | | | | 17,884 | |
| 2.009% | | 3-month USD-LIBOR | | 10/4/2022 | | | 272,000 | | | | 2,446 | | | | — | | | | 2,446 | |
| 2.1045% | | 3-month USD-LIBOR | | 10/31/2022 | | | 110,000 | | | | 1,308 | | | | — | | | | 1,308 | |
| 3-month USD-LIBOR | | 2.7454% | | 3/8/2023 | | | 417,000 | | | | (13,817 | ) | | | — | | | | (13,817 | ) |
| 3-month USD-LIBOR | | 2.733% | | 3/8/2023 | | | 775,000 | | | | (25,381 | ) | | | — | | | | (25,381 | ) |
| 3-month USD-LIBOR | | 2.9415% | | 5/14/2023 | | | 22,700 | | | | (938 | ) | | | — | | | | (938 | ) |
| 2.5815% | | U.S. EFFR | | 5/25/2023 | | | 459,000 | | | | 16,984 | | | | — | | | | 16,984 | |
| 1.615% | | 3-month USD-LIBOR | | 8/18/2023 | | | 270,000 | | | | (283 | ) | | | — | | | | (283 | ) |
| U.S. EFFR | | 2.4435% | | 12/20/2023 | | | 62,076 | | | | (2,388 | ) | | | — | | | | (2,388 | ) |
| U.S. EFFR | | 2.45375% | | 12/20/2023 | | | 556,063 | | | | (21,610 | ) | | | — | | | | (21,610 | ) |
| U.S. EFFR | | 2.4325% | | 12/21/2023 | | | 138,000 | | | | (5,252 | ) | | | — | | | | (5,252 | ) |
| 2.21875% | | U.S. EFFR | | 3/14/2024 | | | 349,000 | | | | 10,516 | | | | — | | | | 10,516 | |
| 3-month USD-LIBOR | | 2.18075% | | 3/29/2024 | | | 74,400 | | | | (1,461 | ) | | | — | | | | (1,461 | ) |
| 3-month USD-LIBOR | | 2.194% | | 3/29/2024 | | | 74,900 | | | | (1,511 | ) | | | — | | | | (1,511 | ) |
| 3-month USD-LIBOR | | 2.21875% | | 3/29/2024 | | | 78,700 | | | | (1,668 | ) | | | — | | | | (1,668 | ) |
| 3-month USD-LIBOR | | 2.221% | | 4/1/2024 | | | 63,000 | | | | (1,348 | ) | | | — | | | | (1,348 | ) |
| 3-month USD-LIBOR | | 2.30% | | 4/2/2024 | | | 50,000 | | | | (1,232 | ) | | | — | | | | (1,232 | ) |
| 2.314% | | 3-month USD-LIBOR | | 5/9/2024 | | | 571,400 | | | | 14,659 | | | | — | | | | 14,659 | |
| 3-month USD-LIBOR | | 2.293% | | 5/10/2024 | | | 73,450 | | | | (1,820 | ) | | | — | | | | (1,820 | ) |
| 7.79% | | 28-day MXN-TIIE | | 5/31/2024 | | MXN | 1,150,000 | | | | 2,839 | | | | — | | | | 2,839 | |
| 3-month USD-LIBOR | | 1.93% | | 6/12/2024 | | $ | 22,250 | | | | (212 | ) | | | — | | | | (212 | ) |
| 3-month USD-LIBOR | | 1.7935% | | 7/12/2024 | | | 135,000 | | | | (474 | ) | | | — | | | | (474 | ) |
| 3-month USD-LIBOR | | 1.556% | | 11/27/2024 | | | 261,800 | | | | 2,153 | | | | — | | | | 2,153 | |
| 3-month USD-LIBOR | | 1.561% | | 11/27/2024 | | | 261,700 | | | | 2,090 | | | | — | | | | 2,090 | |
| 3-month USD-LIBOR | | 1.554% | | 11/27/2024 | | | 222,600 | | | | 1,851 | | | | — | | | | 1,851 | |
| 3-month USD-LIBOR | | 1.5335% | | 11/29/2024 | | | 261,900 | | | | 2,421 | | | | — | | | | 2,421 | |
| 2.768% | | 3-month USD-LIBOR | | 1/29/2025 | | | 230,000 | | | | 4,051 | | | | — | | | | 4,051 | |
| 6-month JPY-LIBOR | | 0.5327% | | 3/4/2025 | | ¥ | 6,100,000 | | | | (1,448 | ) | | | — | | | | (1,448 | ) |
| 2.524% | | 3-month USD-LIBOR | | 4/14/2025 | | $ | 123,000 | | | | 4,672 | | | | — | | | | 4,672 | |
| 3-month USD-LIBOR | | 1.867% | | 7/11/2025 | | | 297,400 | | | | (505 | ) | | | — | | | | (505 | ) |
| 2.354% | | 3-month USD-LIBOR | | 9/25/2025 | | | 420,000 | | | | 12,229 | | | | — | | | | 12,229 | |
| 6-month JPY-LIBOR | | 0.46995% | | 11/17/2025 | | ¥ | 6,250,000 | | | | (1,435 | ) | | | — | | | | (1,435 | ) |
| 6-month JPY-LIBOR | | 0.3822% | | 1/15/2026 | | | 5,100,000 | | | | (941 | ) | | | — | | | | (941 | ) |
| 6-month JPY-LIBOR | | 0.228% | | 2/8/2026 | | | 8,500,000 | | | | (846 | ) | | | — | | | | (846 | ) |
| 6-month JPY-LIBOR | | 0.20125% | | 2/18/2026 | | | 8,240,000 | | | | (700 | ) | | | — | | | | (700 | ) |
| 0.1223% | | 6-month JPY-LIBOR | | 5/11/2026 | | | 2,000,000 | | | | 79 | | | | — | | | | 79 | |
| 0.1173% | | 6-month JPY-LIBOR | | 5/13/2026 | | | 1,000,000 | | | | 37 | | | | — | | | | 37 | |
| 0.10855% | | 6-month JPY-LIBOR | | 5/16/2026 | | | 2,000,000 | | | | 63 | | | | — | | | | 63 | |
| 0.0188% | | 6-month JPY-LIBOR | | 6/16/2026 | | | 1,000,000 | | | | (23 | ) | | | — | | | | (23 | ) |
| (0.00395)% | | 6-month JPY-LIBOR | | 6/17/2026 | | | 2,000,000 | | | | (73 | ) | | | — | | | | (73 | ) |
| 28-day MXN-TIIE | | 8.07% | | 1/1/2027 | | MXN | 910,000 | | | | (3,837 | ) | | | — | | | | (3,837 | ) |
| 0.22855% | | 6-month JPY-LIBOR | | 1/12/2027 | | ¥ | 7,700,000 | | | | 802 | | | | — | | | | 802 | |
| 28-day MXN-TIIE | | 8.135% | | 1/14/2027 | | MXN | 515,000 | | | | (2,280 | ) | | | — | | | | (2,280 | ) |
| 28-day MXN-TIIE | | 7.47% | | 4/5/2027 | | | 290,000 | | | | (702 | ) | | | — | | | | (702 | ) |
| 28-day MXN-TIIE | | 7.625% | | 5/20/2027 | | | 410,000 | | | | (1,200 | ) | | | — | | | | (1,200 | ) |
| 28-day MXN-TIIE | | 7.865% | | 12/8/2027 | | | 189,000 | | | | (723 | ) | | | — | | | | (723 | ) |
| 3-month USD-LIBOR | | 2.446% | | 1/8/2028 | | $ | 42,000 | | | | (1,965 | ) | | | — | | | | (1,965 | ) |
| 2.91% | | 3-month USD-LIBOR | | 2/1/2028 | | | 88,800 | | | | 4,010 | | | | — | | | | 4,010 | |
| 2.908% | | 3-month USD-LIBOR | | 2/1/2028 | | | 88,900 | | | | 4,007 | | | | — | | | | 4,007 | |
| 2.925% | | 3-month USD-LIBOR | | 2/1/2028 | | | 71,100 | | | | 3,260 | | | | — | | | | 3,260 | |
| 2.92% | | 3-month USD-LIBOR | | 2/2/2028 | | | 67,200 | | | | 3,065 | | | | — | | | | 3,065 | |
| 3-month USD-LIBOR | | 2.891% | | 3/9/2028 | | | 45,000 | | | | (3,669 | ) | | | — | | | | (3,669 | ) |
| U.S. EFFR | | 2.471% | | 3/27/2028 | | | 190,100 | | | | (12,803 | ) | | | — | | | | (12,803 | ) |
| U.S. EFFR | | 2.4575% | | 3/29/2028 | | | 224,497 | | | | (14,886 | ) | | | — | | | | (14,886 | ) |
| U.S. EFFR | �� | 2.424% | | 3/30/2028 | | | 189,960 | | | | (12,102 | ) | | | — | | | | (12,102 | ) |
| The Bond Fund of America | 11 |
Swap contracts(continued)
Interest rate swaps (continued)
| Receive | | Pay | | Expiration
date | | Notional
(000) | | | Value at
12/31/2019
(000) | | Upfront
payments/
receipts
(000) | | Unrealized
appreciation
(depreciation)
at 12/31/2019
(000) | |
| 2.919% | | 3-month USD-LIBOR | | 7/16/2028 | | $ | 89,800 | | | $ | 7,736 | | | $ | — | | | $ | 7,736 | |
| 6-month GBP-LIBOR | | 1.6567% | | 9/28/2028 | | £ | 53,200 | | | | (4,018 | ) | | | — | | | | (4,018 | ) |
| 3-month USD-LIBOR | | 2.724% | | 2/5/2029 | | $ | 301,173 | | | | (22,026 | ) | | | — | | | | (22,026 | ) |
| 3-month USD-LIBOR | | 2.7435% | | 2/6/2029 | | | 301,183 | | | | (22,523 | ) | | | — | | | | (22,523 | ) |
| 3-month USD-LIBOR | | 2.3665% | | 3/27/2029 | | | 65,000 | | | | (2,801 | ) | | | — | | | | (2,801 | ) |
| 3-month USD-LIBOR | | 2.4775% | | 4/4/2029 | | | 24,000 | | | | (1,264 | ) | | | — | | | | (1,264 | ) |
| 3-month USD-LIBOR | | 2.493% | | 4/8/2029 | | | 27,500 | | | | (1,486 | ) | | | — | | | | (1,486 | ) |
| 3-month USD-LIBOR | | 2.566% | | 4/24/2029 | | | 45,000 | | | | (2,719 | ) | | | — | | | | (2,719 | ) |
| 3-month USD-LIBOR | | 2.5525% | | 4/25/2029 | | | 36,400 | | | | (2,157 | ) | | | — | | | | (2,157 | ) |
| 3-month USD-LIBOR | | 1.9675% | | 6/21/2029 | | | 12,000 | | | | (99 | ) | | | — | | | | (99 | ) |
| 3-month USD-LIBOR | | 1.995% | | 7/19/2029 | | | 27,500 | | | | (288 | ) | | | — | | | | (288 | ) |
| 3-month USD-LIBOR | | 1.62105% | | 8/7/2029 | | | 169,000 | | | | 3,865 | | | | — | | | | 3,865 | |
| 1.63521% | | 3-month USD-LIBOR | | 8/8/2029 | | | 77,090 | | | | (1,668 | ) | | | — | | | | (1,668 | ) |
| 6.89% | | 28-day MXN-TIIE | | 8/9/2029 | | MXN | 94,700 | | | | 32 | | | | — | | | | 32 | |
| U.S. EFFR | | 1.485% | | 10/23/2029 | | $ | 73,400 | | | | 1,117 | | | | — | | | | 1,117 | |
| U.S. EFFR | | 1.4869% | | 10/23/2029 | | | 67,000 | | | | 1,008 | | | | — | | | | 1,008 | |
| U.S. EFFR | | 1.453% | | 10/24/2029 | | | 85,100 | | | | 1,545 | | | | — | | | | 1,545 | |
| U.S. EFFR | | 1.4741% | | 10/24/2029 | | | 85,300 | | | | 1,384 | | | | — | | | | 1,384 | |
| U.S. EFFR | | 1.4495% | | 10/24/2029 | | | 63,000 | | | | 1,164 | | | | — | | | | 1,164 | |
| U.S. EFFR | | 1.446% | | 10/24/2029 | | | 8,200 | | | | 154 | | | | — | | | | 154 | |
| 1.419% | | U.S. EFFR | | 11/26/2029 | | | 310,000 | | | | (6,735 | ) | | | — | | | | (6,735 | ) |
| 3-month USD-LIBOR | | 2.679% | | 4/14/2030 | | | 65,500 | | | | (4,659 | ) | | | — | | | | (4,659 | ) |
| 3-month USD-LIBOR | | 3.005% | | 9/2/2030 | | | 160,300 | | | | (15,808 | ) | | | — | | | | (15,808 | ) |
| 3-month USD-LIBOR | | 2.514% | | 9/25/2030 | | | 223,000 | | | | (11,925 | ) | | | — | | | | (11,925 | ) |
| 3-month USD-LIBOR | | 1.87% | | 8/18/2031 | | | 57,000 | | | | 558 | | | | — | | | | 558 | |
| 3-month USD-LIBOR | | 2.8672% | | 1/29/2033 | | | 50,700 | | | | (3,552 | ) | | | — | | | | (3,552 | ) |
| 2.523% | | 3-month USD-LIBOR | | 12/8/2035 | | | 5,000 | | | | 352 | | | | — | | | | 352 | |
| 2.432% | | 3-month USD-LIBOR | | 9/21/2037 | | | 2,000 | | | | 118 | | | | — | | | | 118 | |
| 3-month USD-LIBOR | | 2.986% | | 2/1/2038 | | | 43,100 | | | | (2,479 | ) | | | — | | | | (2,479 | ) |
| 3-month USD-LIBOR | | 2.963% | | 2/1/2038 | | | 53,100 | | | | (2,958 | ) | | | — | | | | (2,958 | ) |
| 3-month USD-LIBOR | | 2.9625% | | 2/1/2038 | | | 53,300 | | | | (2,967 | ) | | | — | | | | (2,967 | ) |
| 3-month USD-LIBOR | | 2.967% | | 2/2/2038 | | | 41,500 | | | | (2,324 | ) | | | — | | | | (2,324 | ) |
| 2.987% | | 3-month USD-LIBOR | | 2/7/2038 | | | 37,000 | | | | 5,389 | | | | — | | | | 5,389 | |
| 3.193% | | 3-month USD-LIBOR | | 5/21/2038 | | | 45,000 | | | | 8,081 | | | | — | | | | 8,081 | |
| 3.062% | | 3-month USD-LIBOR | | 7/31/2038 | | | 23,500 | | | | 3,764 | | | | — | | | | 3,764 | |
| 2.835% | | 3-month USD-LIBOR | | 1/10/2039 | | | 21,500 | | | | 2,703 | | | | — | | | | 2,703 | |
| 6-month GBP-LIBOR | | 1.5872% | | 2/5/2039 | | £ | 4,250 | | | | (464 | ) | | | — | | | | (464 | ) |
| 6-month GBP-LIBOR | | 1.5877% | | 2/5/2039 | | | 7,300 | | | | (797 | ) | | | — | | | | (797 | ) |
| 2.874% | | 3-month USD-LIBOR | | 2/6/2039 | | $ | 13,900 | | | | 1,839 | | | | — | | | | 1,839 | |
| 2.7055% | | 3-month USD-LIBOR | | 4/17/2039 | | | 41,900 | | | | 4,426 | | | | — | | | | 4,426 | |
| 3-month USD-LIBOR | | 2.6785% | | 9/4/2045 | | | 45,000 | | | | (5,447 | ) | | | — | | | | (5,447 | ) |
| 3-month USD-LIBOR | | 2.525% | | 10/20/2045 | | | 28,000 | | | | (2,515 | ) | | | — | | | | (2,515 | ) |
| 3-month USD-LIBOR | | 2.516% | | 10/20/2045 | | | 42,000 | | | | (3,694 | ) | | | — | | | | (3,694 | ) |
| 3-month USD-LIBOR | | 2.5315% | | 10/26/2045 | | | 40,000 | | | | (3,648 | ) | | | — | | | | (3,648 | ) |
| 3-month USD-LIBOR | | 2.57082% | | 11/6/2045 | | | 123,000 | | | | (12,221 | ) | | | — | | | | (12,221 | ) |
| 3-month USD-LIBOR | | 2.57067% | | 11/9/2045 | | | 13,200 | | | | (1,312 | ) | | | — | | | | (1,312 | ) |
| 3-month USD-LIBOR | | 2.6485% | | 11/16/2045 | | | 13,050 | | | | (1,507 | ) | | | — | | | | (1,507 | ) |
| 3-month USD-LIBOR | | 2.59125% | | 12/16/2045 | | | 45,000 | | | | (4,677 | ) | | | — | | | | (4,677 | ) |
| 3-month USD-LIBOR | | 2.4095% | | 1/14/2046 | | | 15,000 | | | | (995 | ) | | | — | | | | (995 | ) |
| 2.5095% | | 3-month USD-LIBOR | | 7/24/2047 | | | 3,000 | | | | 272 | | | | — | | | | 272 | |
| U.S. EFFR | | 2.172% | | 11/8/2047 | | | 30,000 | | | | (2,126 | ) | | | — | | | | (2,126 | ) |
| U.S. EFFR | | 2.155% | | 11/10/2047 | | | 18,850 | | | | (1,266 | ) | | | — | | | | (1,266 | ) |
| U.S. EFFR | | 2.5635% | | 2/12/2048 | | | 135,836 | | | | (21,414 | ) | | | — | | | | (21,414 | ) |
| 2.98% | | 3-month USD-LIBOR | | 3/15/2048 | | | 8,400 | | | | 1,644 | | | | — | | | | 1,644 | |
| 2.9625% | | 3-month USD-LIBOR | | 3/15/2048 | | | 8,400 | | | | 1,612 | | | | — | | | | 1,612 | |
| 2.917% | | 3-month USD-LIBOR | | 3/16/2048 | | | 16,700 | | | | 3,036 | | | | — | | | | 3,036 | |
| 2.9075% | | 3-month USD-LIBOR | | 4/16/2048 | | | 7,000 | | | | 1,260 | | | | — | | | | 1,260 | |
| 3.22859% | | 3-month USD-LIBOR | | 10/31/2048 | | | 60,560 | | | | 15,445 | | | | — | | | | 15,445 | |
| 3.236% | | 3-month USD-LIBOR | | 10/31/2048 | | | 16,250 | | | | 4,171 | | | | — | | | | 4,171 | |
| 3-month USD-LIBOR | | 2.8755% | | 1/31/2049 | | | 157,500 | | | | (27,829 | ) | | | — | | | | (27,829 | ) |
| 2.7065% | | 3-month USD-LIBOR | | 5/2/2049 | | | 63,800 | | | | 8,890 | | | | — | | | | 8,890 | |
| 12 | The Bond Fund of America |
| Receive | | Pay | | Expiration
date | | Notional
(000) | | | Value at
12/31/2019
(000) | | Upfront
payments/
receipts
(000) | | Unrealized
appreciation
(depreciation)
at 12/31/2019
(000) | |
| 3-month USD-LIBOR | | 2.641% | | 5/9/2049 | | $ | 127,500 | | | $ | (15,879 | ) | | $ | — | | | $ | (15,879 | ) |
| 2.5625% | | 3-month USD-LIBOR | | 5/15/2049 | | | 125,200 | | | | 13,368 | | | | — | | | | 13,368 | |
| 3-month USD-LIBOR | | 2.381% | | 5/31/2049 | | | 14,500 | | | | (951 | ) | | | — | | | | (951 | ) |
| 3-month USD-LIBOR | | 1.934% | | 12/12/2049 | | | 47,520 | | | | 1,733 | | | | — | | | | 1,733 | |
| 3-month USD-LIBOR | | 1.935% | | 12/17/2049 | | | 104,310 | | | | 3,783 | | | | — | | | | 3,783 | |
| 3-month USD-LIBOR | | 2.007% | | 12/19/2049 | | | 43,400 | | | | 854 | | | | — | | | | 854 | |
| 3-month USD-LIBOR | | 2.068% | | 12/24/2049 | | | 87,140 | | | | 495 | | | | — | | | | 495 | |
| 3-month USD-LIBOR | | 2.045% | | 12/27/2049 | | | 96,900 | | | | 1,068 | | | | — | | | | 1,068 | |
| | | | | | | | | | | | | | | $ | — | | | $ | (133,268 | ) |
Credit default swaps
Centrally cleared credit default swaps on credit indices — buy protection
| Receive | | Pay/
Payment frequency | | Expiration
date | | Notional
(000) | | | Value at
12/31/2019
(000) | | Upfront
payments
(000) | | Unrealized
depreciation
at 12/31/2019
(000) | |
| CDX.NA.IG.33 | | 1.00%/Quarterly | | 12/20/2024 | | $ | 1,574,885 | | | $ | (40,830 | ) | | $ | (33,522 | ) | | $ | (7,308 | ) |
| CDX.NA.HY.33 | | 5.00%/Quarterly | | 12/20/2024 | | | 421,402 | | | | (40,596 | ) | | | (29,257 | ) | | | (11,339 | ) |
| | | | | | | | | | | | | | | $ | (62,779 | ) | | $ | (18,647 | ) |
The following footnotes apply to either the individual securities noted or one or more of the securities aggregated and listed as a single line item.
| 1 | Coupon rate may change periodically. Reference rate and spread are as of the most recent information available. Some coupon rates are determined by the issuer or agent based on current market conditions; therefore, the reference rate and spread are not available. |
| 2 | All or a portion of this security was pledged as collateral. The total value of pledged collateral was $308,172,000, which represented .61% of the net assets of the fund. |
| 3 | Index-linked bond whose principal amount moves with a government price index. |
| 4 | Acquired in a transaction exempt from registration under Rule 144A of the Securities Act of 1933. May be resold in the U.S. in transactions exempt from registration, normally to qualified institutional buyers. The total value of all such securities, including those in “Other securities,” was $4,914,562,000, which represented 9.74% of the net assets of the fund. |
| 5 | Principal payments may be made periodically. Therefore, the effective maturity date may be earlier than the stated maturity date. |
| 6 | Purchased on a TBA basis. |
| 7 | Rate represents the seven-day yield at 12/31/2019. |
| 8 | Notional amount is calculated based on the number of contracts and notional contract size. |
| 9 | Value is calculated based on the notional amount and current market price. |
Key to abbreviations and symbols
AUD = Australian dollars
BRL = Brazilian reais
CAD = Canadian dollars
COP = Colombian pesos
EFFR = Effective Federal Funds Rate
EUR/€ = Euros
GBP/£ = British pounds
INR = Indian rupees
JPY/¥ = Japanese yen
KRW = South Korean won
LIBOR = London Interbank Offered Rate
MXN = Mexican pesos
NZD = New Zealand dollars
SEK = Swedish kronor
SGD = Singapore dollars
TBA = To-be-announced
TIIE = Equilibrium Interbank Interest Rate
USD/$ = U.S. dollars
See notes to financial statements.
| The Bond Fund of America | 13 |
| Financial statements | | | | | | |
| | | | | | | |
Statement of assets and liabilities
at December 31, 2019 | | (dollars in thousands) |
| | | | | | | |
| Assets: | | | | | | | | |
| Investment securities in unaffiliated issuers, at value (cost: $50,104,525) | | | | | | $ | 51,281,042 | |
| Cash | | | | | | | 4,315 | |
| Cash denominated in currencies other than U.S. dollars (cost: $452) | | | | | | | 470 | |
| Unrealized appreciation on open forward currency contracts | | | | | | | 7,761 | |
| Receivables for: | | | | | | | | |
| Sales of investments | | $ | 3,163,610 | | | | | |
| Sales of fund’s shares | | | 122,226 | | | | | |
| Dividends and interest | | | 281,088 | | | | | |
| Variation margin on futures contracts | | | 3,446 | | | | | |
| Variation margin on swap contracts | | | 29,840 | | | | | |
| Other | | | 69 | | | | 3,600,279 | |
| | | | | | | | 54,893,867 | |
| Liabilities: | | | | | | | | |
| Unrealized depreciation on open forward currency contracts | | | | | | | 8,801 | |
| Payables for: | | | | | | | | |
| Purchases of investments | | | 4,290,504 | | | | | |
| Repurchases of fund’s shares | | | 85,762 | | | | | |
| Dividends on fund’s shares | | | 15,374 | | | | | |
| Investment advisory services | | | 7,649 | | | | | |
| Services provided by related parties | | | 10,164 | | | | | |
| Trustees’ deferred compensation | | | 778 | | | | | |
| Variation margin on futures contracts | | | 9,983 | | | | | |
| Variation margin on swap contracts | | | 16,948 | | | | | |
| Other | | | 812 | | | | 4,437,974 | |
| Net assets at December 31, 2019 | | | | | | $ | 50,447,092 | |
| | | | | | | | | |
| Net assets consist of: | | | | | | | | |
| Capital paid in on shares of beneficial interest | | | | | | $ | 49,709,752 | |
| Total distributable earnings | | | | | | | 737,340 | |
| Net assets at December 31, 2019 | | | | | | $ | 50,447,092 | |
See notes to financial statements.
| 14 | The Bond Fund of America |
(dollars and shares in thousands, except per-share amounts)
Shares of beneficial interest issued and outstanding (no stated par value) —
unlimited shares authorized (3,855,282 total shares outstanding)
| | | Net assets | | | Shares
outstanding | | | Net asset value
per share | |
| Class A | | $ | 23,197,456 | | | | 1,772,803 | | | $ | 13.09 | |
| Class C | | | 785,815 | | | | 60,054 | | | | 13.09 | |
| Class T | | | 10 | | | | 1 | | | | 13.09 | |
| Class F-1 | | | 976,729 | | | | 74,644 | | | | 13.09 | |
| Class F-2 | | | 9,415,317 | | | | 719,540 | | | | 13.09 | |
| Class F-3 | | | 2,211,948 | | | | 169,042 | | | | 13.09 | |
| Class 529-A | | | 1,173,469 | | | | 89,679 | | | | 13.09 | |
| Class 529-C | | | 179,925 | | | | 13,750 | | | | 13.09 | |
| Class 529-E | | | 46,406 | | | | 3,546 | | | | 13.09 | |
| Class 529-T | | | 11 | | | | 1 | | | | 13.09 | |
| Class 529-F-1 | | | 127,724 | | | | 9,761 | | | | 13.09 | |
| Class R-1 | | | 39,072 | | | | 2,986 | | | | 13.09 | |
| Class R-2 | | | 409,630 | | | | 31,305 | | | | 13.09 | |
| Class R-2E | | | 33,065 | | | | 2,527 | | | | 13.09 | |
| Class R-3 | | | 633,088 | | | | 48,382 | | | | 13.09 | |
| Class R-4 | | | 567,087 | | | | 43,338 | | | | 13.09 | |
| Class R-5E | | | 43,343 | | | | 3,312 | | | | 13.09 | |
| Class R-5 | | | 173,191 | | | | 13,236 | | | | 13.09 | |
| Class R-6 | | | 10,433,806 | | | | 797,375 | | | | 13.09 | |
See notes to financial statements.
| The Bond Fund of America | 15 |
Statement of operations
for the year ended December 31, 2019 | | (dollars in thousands) |
| | | | | | | |
| Investment income: | | | | | | | | |
| Income: | | | | | | | | |
| Interest (net of non-U.S. taxes of $420) | | $ | 1,247,571 | | | | | |
| Dividends | | | 73,214 | | | $ | 1,320,785 | |
| Fees and expenses*: | | | | | | | | |
| Investment advisory services | | | 83,255 | | | | | |
| Distribution services | | | 75,580 | | | | | |
| Transfer agent services | | | 43,967 | | | | | |
| Administrative services | | | 13,600 | | | | | |
| Reports to shareholders | | | 1,763 | | | | | |
| Registration statement and prospectus | | | 1,534 | | | | | |
| Trustees’ compensation | | | 291 | | | | | |
| Auditing and legal | | | 241 | | | | | |
| Custodian | | | 379 | | | | | |
| Other | | | 1,106 | | | | | |
| Total fees and expenses before waiver | | | 221,716 | | | | | |
| Less transfer agent services waiver | | | 61 | | | | | |
| Total fees and expenses after waiver | | | | | | | 221,655 | |
| Net investment income | | | | | | | 1,099,130 | |
| | | | | | | | | |
| Net realized gain and unrealized appreciation: | | | | | | | | |
| Net realized gain (loss) on: | | | | | | | | |
| Investments in unaffiliated issuers | | | 709,432 | | | | | |
| Futures contracts | | | 642,940 | | | | | |
| Forward currency contracts | | | 4,313 | | | | | |
| Swap contracts | | | (162,621 | ) | | | | |
| Currency transactions | | | (542 | ) | | | 1,193,522 | |
| Net unrealized appreciation (depreciation) on: | | | | | | | | |
| Investments in unaffiliated issuers (net of non-U.S. taxes of $528) | | | 1,576,759 | | | | | |
| Futures contracts | | | (230,614 | ) | | | | |
| Forward currency contracts | | | 2,194 | | | | | |
| Swap contracts | | | (275,639 | ) | | | | |
| Currency translations | | | 118 | | | | 1,072,818 | |
| Net realized gain and unrealized appreciation | | | | | | | 2,266,340 | |
| | | | | | | | | |
| Net increase in net assets resulting from operations | | | | | | $ | 3,365,470 | |
| * | Additional information related to class-specific fees and expenses is included in the notes to financial statements. |
| Statements of changes in net assets | | | | | | |
| | | (dollars in thousands) |
| | | | | | | |
| | | Year ended December 31, | |
| | | 2019 | | | 2018 | |
| Operations: | | | | | | |
| Net investment income | | $ | 1,099,130 | | | $ | 939,428 | |
| Net realized gain (loss) | | | 1,193,522 | | | | (737,203 | ) |
| Net unrealized appreciation (depreciation) | | | 1,072,818 | | | | (204,948 | ) |
| Net increase (decrease) in net assets resulting from operations | | | 3,365,470 | | | | (2,723 | ) |
| | | | | | | | | |
| Distributions paid or accrued to shareholders | | | (1,755,900 | ) | | | (946,550 | ) |
| | | | | | | | | |
| Net capital share transactions | | | 9,522,208 | | | | 2,724,691 | |
| | | | | | | | | |
| Total increase in net assets | | | 11,131,778 | | | | 1,775,418 | |
| | | | | | | | | |
| Net assets: | | | | | | | | |
| Beginning of year | | | 39,315,314 | | | | 37,539,896 | |
| End of year | | $ | 50,447,092 | | | $ | 39,315,314 | |
See notes to financial statements.
| 16 | The Bond Fund of America |
Notes to financial statements
1. Organization
The Bond Fund of America (the “fund”) is registered under the Investment Company Act of 1940 as an open-end, diversified management investment company. The fund seeks as high a level of current income as is consistent with the preservation of capital.
The fund has 19 share classes consisting of six retail share classes (Classes A, C, T, F-1, F-2 and F-3), five 529 college savings plan share classes (Classes 529-A, 529-C, 529-E, 529-T and 529-F-1) and eight retirement plan share classes (Classes R-1, R-2, R-2E, R-3, R-4, R-5E, R-5 and R-6). The 529 college savings plan share classes can be used to save for college education. The retirement plan share classes are generally offered only through eligible employer-sponsored retirement plans. The fund’s share classes are described further in the following table:
| Share class | | Initial sales
charge | | Contingent deferred sales
charge upon redemption | | Conversion feature | |
| Classes A and 529-A | | Up to 3.75% | | None (except 1% for certain redemptions within 18 months of purchase without an initial sales charge) | | None | |
| Class C | | None | | 1% for redemptions within one year of purchase | | Class C converts to Class F-1 after 10 years | |
| Class 529-C | | None | | 1% for redemptions within one year of purchase | | Class 529-C converts to Class 529-A after 10 years | |
| Class 529-E | | None | | None | | None | |
| Classes T and 529-T* | | Up to 2.50% | | None | | None | |
| Classes F-1, F-2, F-3 and 529-F-1 | | None | | None | | None | |
| Classes R-1, R-2, R-2E, R-3, R-4, R-5E, R-5 and R-6 | | None | | None | | None | |
| * | Class T and 529-T shares are not available for purchase. |
Holders of all share classes have equal pro rata rights to the assets, dividends and liquidation proceeds of the fund. Each share class has identical voting rights, except for the exclusive right to vote on matters affecting only its class. Share classes have different fees and expenses (“class-specific fees and expenses”), primarily due to different arrangements for distribution, transfer agent and administrative services. Differences in class-specific fees and expenses will result in differences in net investment income and, therefore, the payment of different per-share dividends by each share class.
2. Significant accounting policies
The fund is an investment company that applies the accounting and reporting guidance issued in Topic 946 by the U.S. Financial Accounting Standards Board. The fund’s financial statements have been prepared to comply with U.S. generally accepted accounting principles (“U.S. GAAP”). These principles require the fund’s investment adviser to make estimates and assumptions that affect reported amounts and disclosures. Actual results could differ from those estimates. Subsequent events, if any, have been evaluated through the date of issuance in the preparation of the financial statements. The fund follows the significant accounting policies described in this section, as well as the valuation policies described in the next section on valuation.
Security transactions and related investment income— Security transactions are recorded by the fund as of the date the trades are executed with brokers. Realized gains and losses from security transactions are determined based on the specific identified cost of the securities. In the event a security is purchased with a delayed payment date, the fund will segregate liquid assets sufficient to meet its payment obligations. Dividend income is recognized on the ex-dividend date and interest income is recognized on an accrual basis. Market discounts, premiums and original issue discounts on fixed-income securities are amortized daily over the expected life of the security.
Class allocations— Income, fees and expenses (other than class-specific fees and expenses) are allocated daily among the various share classes based on the relative value of their settled shares. Realized and unrealized gains and losses are allocated daily among the various share classes based on their relative net assets. Class-specific fees and expenses, such as distribution, transfer agent and administrative services, are charged directly to the respective share class.
Distributions paid or accrued to shareholders— Income dividends are declared daily after the determination of the fund’s net investment income and are paid to shareholders monthly. Capital gain distributions are recorded on the ex-dividend date.
| The Bond Fund of America | 17 |
Currency translation— Assets and liabilities, including investment securities, denominated in currencies other than U.S. dollars are translated into U.S. dollars at the exchange rates supplied by one or more pricing vendors on the valuation date. Purchases and sales of investment securities and income and expenses are translated into U.S. dollars at the exchange rates on the dates of such transactions. The effects of changes in exchange rates on investment securities are included with the net realized gain or loss and net unrealized appreciation or depreciation on investments in the fund’s statement of operations. The realized gain or loss and unrealized appreciation or depreciation resulting from all other transactions denominated in currencies other than U.S. dollars are disclosed separately.
3. Valuation
Capital Research and Management Company (“CRMC”), the fund’s investment adviser, values the fund’s investments at fair value as defined by U.S. GAAP. The net asset value of each share class of the fund is generally determined as of approximately 4:00 p.m. New York time each day the New York Stock Exchange is open.
Methods and inputs— The fund’s investment adviser uses the following methods and inputs to establish the fair value of the fund’s assets and liabilities. Use of particular methods and inputs may vary over time based on availability and relevance as market and economic conditions evolve.
Equity securities are generally valued at the official closing price of, or the last reported sale price on, the exchange or market on which such securities are traded, as of the close of business on the day the securities are being valued or, lacking any sales, at the last available bid price. Prices for each security are taken from the principal exchange or market on which the security trades.
Fixed-income securities, including short-term securities, are generally valued at prices obtained from one or more pricing vendors. Vendors value such securities based on one or more of the inputs described in the following table. The table provides examples of inputs that are commonly relevant for valuing particular classes of fixed-income securities in which the fund is authorized to invest. However, these classifications are not exclusive, and any of the inputs may be used to value any other class of fixed-income security.
| Fixed-income class | Examples of standard inputs |
| All | Benchmark yields, transactions, bids, offers, quotations from dealers andtrading systems, new issues, spreads and other relationships observed inthe markets among comparable securities; and proprietary pricing modelssuch as yield measures calculated using factors such as cash flows, financialor collateral performance and other reference data (collectively referred toas “standard inputs”) |
| Corporate bonds & notes; convertible securities | Standard inputs and underlying equity of the issuer |
| Bonds & notes of governments & government agencies | Standard inputs and interest rate volatilities |
| Mortgage-backed; asset-backed obligations | Standard inputs and cash flows, prepayment information, default rates,delinquency and loss assumptions, collateral characteristics, creditenhancements and specific deal information |
| Municipal securities | Standard inputs and, for certain distressed securities, cash flows orliquidation values using a net present value calculation based on inputs thatinclude, but are not limited to, financial statements and debt contracts |
When the fund’s investment adviser deems it appropriate to do so (such as when vendor prices are unavailable or deemed to be not representative), fixed-income securities will be valued in good faith at the mean quoted bid and ask prices that are reasonably and timely available (or bid prices, if ask prices are not available) or at prices for securities of comparable maturity, quality and type.
Securities with both fixed-income and equity characteristics, or equity securities traded principally among fixed-income dealers, are generally valued in the manner described for either equity or fixed-income securities, depending on which method is deemed most appropriate by the fund’s investment adviser. The Capital Group Central Cash Fund (“CCF”), a fund within the Capital Group Central Fund Series (“Central Funds”), is valued based upon a floating net asset value, which fluctuates with changes in the value of CCF’s portfolio securities. The underlying securities are valued based on the policies and procedures in CCF’s statement of additional information. Exchange-traded futures are generally valued at the official settlement price of the exchange or market on which such instruments are traded, as of the close of business on the day the futures are being valued. Forward currency contracts are valued at the mean of representative quoted bid and ask prices, generally based on prices supplied by one or more pricing vendors. Interest rate swaps and credit default swaps are generally valued by pricing vendors based on market inputs that include the index and term of index, reset frequency, payer/receiver, currency and pay frequency.
| 18 | The Bond Fund of America |
Securities and other assets for which representative market quotations are not readily available or are considered unreliable by the fund’s investment adviser are fair valued as determined in good faith under fair valuation guidelines adopted by authority of the fund’s board of trustees as further described. The investment adviser follows fair valuation guidelines, consistent with U.S. Securities and Exchange Commission rules and guidance, to consider relevant principles and factors when making fair value determinations. The investment adviser considers relevant indications of value that are reasonably and timely available to it in determining the fair value to be assigned to a particular security, such as the type and cost of the security; contractual or legal restrictions on resale of the security; relevant financial or business developments of the issuer; actively traded similar or related securities; conversion or exchange rights on the security; related corporate actions; significant events occurring after the close of trading in the security; and changes in overall market conditions. In addition, the closing prices of equity securities that trade in markets outside U.S. time zones may be adjusted to reflect significant events that occur after the close of local trading but before the net asset value of each share class of the fund is determined. Fair valuations and valuations of investments that are not actively trading involve judgment and may differ materially from valuations that would have been used had greater market activity occurred.
Processes and structure— The fund’s board of trustees has delegated authority to the fund’s investment adviser to make fair value determinations, subject to board oversight. The investment adviser has established a Joint Fair Valuation Committee (the “Fair Valuation Committee”) to administer, implement and oversee the fair valuation process, and to make fair value decisions. The Fair Valuation Committee regularly reviews its own fair value decisions, as well as decisions made under its standing instructions to the investment adviser’s valuation teams. The Fair Valuation Committee reviews changes in fair value measurements from period to period and may, as deemed appropriate, update the fair valuation guidelines to better reflect the results of back testing and address new or evolving issues. The Fair Valuation Committee reports any changes to the fair valuation guidelines to the board of trustees. The fund’s board and audit committee also regularly review reports that describe fair value determinations and methods.
The fund’s investment adviser has also established a Fixed-Income Pricing Review Group to administer and oversee the fixed-income valuation process, including the use of fixed-income pricing vendors. This group regularly reviews pricing vendor information and market data. Pricing decisions, processes and controls over security valuation are also subject to additional internal reviews, including an annual control self-evaluation program facilitated by the investment adviser’s compliance group.
Classifications— The fund’s investment adviser classifies the fund’s assets and liabilities into three levels based on the inputs used to value the assets or liabilities. Level 1 values are based on quoted prices in active markets for identical securities. Level 2 values are based on significant observable market inputs, such as quoted prices for similar securities and quoted prices in inactive markets. Certain securities trading outside the U.S. may transfer between Level 1 and Level 2 due to valuation adjustments resulting from significant market movements following the close of local trading. Level 3 values are based on significant unobservable inputs that reflect the investment adviser’s determination of assumptions that market participants might reasonably use in valuing the securities. The valuation levels are not necessarily an indication of the risk or liquidity associated with the underlying investment. For example, U.S. government securities are reflected as Level 2 because the inputs used to determine fair value may not always be quoted prices in an active market. The following tables present the fund’s valuation levels as of December 31, 2019 (dollars in thousands):
| | | Investment securities | |
| | | Level 1 | | | Level 2 | | | Level 3 | | | Total | |
| Assets: | | | | | | | | | | | | | | | | |
| Bonds, notes & other debt instruments: | | | | | | | | | | | | | | | | |
| U.S. Treasury bonds & notes | | $ | — | | | $ | 21,621,080 | | | $ | — | | | $ | 21,621,080 | |
| Corporate bonds & notes | | | — | | | | 13,322,884 | | | | 8,445 | | | | 13,331,329 | |
| Mortgage-backed obligations | | | — | | | | 10,659,801 | | | | — | | | | 10,659,801 | |
| Other | | | — | | | | 2,756,966 | | | | — | | | | 2,756,966 | |
| Preferred securities | | | — | | | | 4,219 | | | | — | | | | 4,219 | |
| Common stocks | | | — | | | | — | | | | 6,863 | | | | 6,863 | |
| Short-term securities | | | 2,874,866 | | | | 25,918 | | | | — | | | | 2,900,784 | |
| Total | | $ | 2,874,866 | | | $ | 48,390,868 | | | $ | 15,308 | | | $ | 51,281,042 | |
| | |
| The Bond Fund of America | 19 |
| | | Other investments* | |
| | | Level 1 | | | Level 2 | | | Level 3 | | | Total | |
| Assets: | | | | | | | | | | | | | | | | |
| Unrealized appreciation on futures contracts | | $ | 15,245 | | | $ | — | | | $ | — | | | $ | 15,245 | |
| Unrealized appreciation on open forward currency contracts | | | — | | | | 7,761 | | | | — | | | | 7,761 | |
| Unrealized appreciation on interest rate swaps | | | — | | | | 274,989 | | | | — | | | | 274,989 | |
| Liabilities: | | | | | | | | | | | | | | | | |
| Unrealized depreciation on futures contracts | | | (67,577 | ) | | | — | | | | — | | | | (67,577 | ) |
| Unrealized depreciation on open forward currency contracts | | | — | | | | (8,801 | ) | | | — | | | | (8,801 | ) |
| Unrealized depreciation on interest rate swaps | | | — | | | | (408,257 | ) | | | — | | | | (408,257 | ) |
| Unrealized depreciation on credit default swaps | | | — | | | | (18,647 | ) | | | — | | | | (18,647 | ) |
| Total | | $ | (52,332 | ) | | $ | (152,955 | ) | | $ | — | | | $ | (205,287 | ) |
| | |
| * | Futures contracts, forward currency contracts, interest rate swaps and credit default swaps are not included in the investment portfolio. |
4. Risk factors
Investing in the fund may involve certain risks including, but not limited to, those described below.
Market conditions— The prices of, and the income generated by, the securities held by the fund may decline — sometimes rapidly or unpredictably — due to various factors, including events or conditions affecting the general economy or particular industries; overall market changes; local, regional or global political, social or economic instability; governmental, governmental agency or central bank responses to economic conditions; and currency exchange rate, interest rate and commodity price fluctuations.
Issuer risks— The prices of, and the income generated by, securities held by the fund may decline in response to various factors directly related to the issuers of such securities, including reduced demand for an issuer’s goods or services, poor management performance, major litigation related to the issuer, changes in government regulations affecting the issuer or its competitive environment and strategic initiatives such as mergers, acquisitions or dispositions and the market response to any such initiatives.
Investing in debt instruments— The prices of, and the income generated by, bonds and other debt securities held by the fund may be affected by changing interest rates and by changes in the effective maturities and credit ratings of these securities.
Rising interest rates will generally cause the prices of bonds and other debt securities to fall. A general rise in interest rates may cause investors to sell debt securities on a large scale, which could also adversely affect the price and liquidity of debt securities and could also result in increased redemptions from the fund. Falling interest rates may cause an issuer to redeem, call or refinance a debt security before its stated maturity, which may result in the fund failing to recoup the full amount of its initial investment and having to reinvest the proceeds in lower yielding securities. Longer maturity debt securities generally have greater sensitivity to changes in interest rates and may be subject to greater price fluctuations than shorter maturity debt securities.
Bonds and other debt securities are also subject to credit risk, which is the possibility that the credit strength of an issuer or guarantor will weaken or be perceived to be weaker, and/or an issuer of a debt security will fail to make timely payments of principal or interest and the security will go into default. A downgrade or default affecting any of the fund’s securities could cause the value of the fund’s shares to decrease. Lower quality debt securities generally have higher rates of interest and may be subject to greater price fluctuations than higher quality debt securities. Credit risk is gauged, in part, by the credit ratings of the debt securities in which the fund invests. However, ratings are only the opinions of the rating agencies issuing them and are not guarantees as to credit quality or an evaluation of market risk. The fund’s investment adviser relies on its own credit analysts to research issuers and issues in seeking to assess credit and default risks.
| 20 | The Bond Fund of America |
Investing in mortgage-related and other asset-backed securities — Mortgage-related securities, such as mortgage-backed securities, and other asset-backed securities, include debt obligations that represent interests in pools of mortgages or other income-bearing assets, such as consumer loans or receivables. Such securities often involve risks that are different from or more acute than the risks associated with investing in other types of debt securities. Mortgage-backed and other asset-backed securities are subject to changes in the payment patterns of borrowers of the underlying debt, potentially increasing the volatility of the securities and the fund’s net asset value. When interest rates fall, borrowers are more likely to refinance or prepay their debt before its stated maturity. This may result in the fund having to reinvest the proceeds in lower yielding securities, effectively reducing the fund’s income. Conversely, if interest rates rise and borrowers repay their debt more slowly than expected, the time in which the mortgage-backed and other asset-backed securities are paid off could be extended, reducing the fund’s cash available for reinvestment in higher yielding securities. Mortgage-backed securities are also subject to the risk that underlying borrowers will be unable to meet their obligations and the value of property that secures the mortgages may decline in value and be insufficient, upon foreclosure, to repay the associated loans. Investments in asset-backed securities are subject to similar risks.
Investing in securities backed by the U.S. government — Securities backed by the U.S. Treasury or the full faith and credit of the U.S. government are guaranteed only as to the timely payment of interest and principal when held to maturity. Accordingly, the current market values for these securities will fluctuate with changes in interest rates and the credit rating of the U.S. government. Securities issued by government-sponsored entities and federal agencies and instrumentalities that are not backed by the full faith and credit of the U.S. government are neither issued nor guaranteed by the U.S. government.
Liquidity risk — Certain fund holdings may be or may become difficult or impossible to sell, particularly during times of market turmoil. Liquidity may be impacted by the lack of an active market for a holding, legal or contractual restrictions on resale, or the reduced number and capacity of market participants to make a market in such holding. Market prices for less liquid or illiquid holdings may be volatile, and reduced liquidity may have an adverse impact on the market price of such holdings. Additionally, the sale of less liquid or illiquid holdings may involve substantial delays (including delays in settlement) and additional costs and the fund may be unable to sell such holdings when necessary to meet its liquidity needs or may be forced to sell at a loss.
Investing outside the U.S. — Securities of issuers domiciled outside the U.S., or with significant operations or revenues outside the U.S., may lose value because of adverse political, social, economic or market developments (including social instability, regional conflicts, terrorism and war) in the countries or regions in which the issuers operate or generate revenue. These securities may also lose value due to changes in foreign currency exchange rates against the U.S. dollar and/or currencies of other countries. Issuers of these securities may be more susceptible to actions of foreign governments, such as nationalization, currency blockage or the imposition of price controls or punitive taxes, each of which could adversely impact the value of these securities. Securities markets in certain countries may be more volatile and/or less liquid than those in the U.S. Investments outside the U.S. may also be subject to different accounting practices and different regulatory, legal and reporting standards and practices, and may be more difficult to value, than those in the U.S. In addition, the value of investments outside the U.S. may be reduced by foreign taxes, including foreign withholding taxes on interest and dividends. Further, there may be increased risks of delayed settlement of securities purchased or sold by the fund. The risks of investing outside the U.S. may be heightened in connection with investments in emerging markets.
Investing in future delivery contracts — The fund may enter into contracts, such as to-be-announced contracts and mortgage dollar rolls, that involve the fund selling mortgage-related securities and simultaneously contracting to repurchase similar securities for delivery at a future date at a predetermined price. This can increase the fund’s market exposure, and the market price of the securities that the fund contracts to repurchase could drop below their purchase price. While the fund can preserve and generate capital through the use of such contracts by, for example, realizing the difference between the sale price and the future purchase price, the income generated by the fund may be reduced by engaging in such transactions. In addition, these transactions may increase the turnover rate of the fund.
Investing in inflation-linked bonds — The values of inflation-linked bonds generally fluctuate in response to changes in real interest rates — i.e., rates of interest after factoring in inflation. A rise in real interest rates may cause the prices of inflation-linked securities to fall, while a decline in real interest rates may cause the prices to increase. Inflation-linked bonds may experience greater losses than other debt securities with similar durations when real interest rates rise faster than nominal interest rates. There can be no assurance that the value of an inflation-linked security will be directly correlated to changes in interest rates; for example, if interest rates rise for reasons other than inflation, the increase may not be reflected in the security’s inflation measure.
Investing in inflation-linked bonds may also reduce the fund’s distributable income during periods of deflation. If prices for goods and services decline throughout the economy, the principal and income on inflation-linked securities may decline and result in losses to the fund.
| The Bond Fund of America | 21 |
Investing in derivatives— The use of derivatives involves a variety of risks, which may be different from, or greater than, the risks associated with investing in traditional securities, such as stocks and bonds. Changes in the value of a derivative may not correlate perfectly with, and may be more sensitive to market events than, the underlying asset, rate or index, and a derivative instrument may expose the fund to losses in excess of its initial investment. Derivatives may be difficult to value, difficult for the fund to buy or sell at an opportune time or price and difficult, or even impossible, to terminate or otherwise offset. The fund’s use of derivatives may result in losses to the fund, and investing in derivatives may reduce the fund’s returns and increase the fund’s price volatility. The fund’s counterparty to a derivative transaction (including, if applicable, the fund’s clearing broker, the derivatives exchange or the clearinghouse) may be unable or unwilling to honor its financial obligations in respect of the transaction. In certain cases, the fund may be hindered or delayed in exercising remedies against or closing out derivative instruments with a counterparty, which may result in additional losses
Management— The investment adviser to the fund actively manages the fund’s investments. Consequently, the fund is subject to the risk that the methods and analyses, including models, tools and data, employed by the investment adviser in this process may be flawed or incorrect and may not produce the desired results. This could cause the fund to lose value or its investment results to lag relevant benchmarks or other funds with similar objectives.
5. Certain investment techniques
Index-linked bonds— The fund has invested in index-linked bonds, which are fixed-income securities whose principal value is periodically adjusted to a government price index. Over the life of an index-linked bond, interest is paid on the adjusted principal value. Increases or decreases in the principal value of index-linked bonds are recorded as interest income in the fund’s statement of operations.
Mortgage dollar rolls— The fund has entered into mortgage dollar roll transactions in which the fund sells a mortgage-backed security to a counterparty and simultaneously enters into an agreement with the same counterparty to buy back a similar security on a specific future date at a predetermined price. Mortgage dollar rolls are accounted for as purchase and sale transactions. Portfolio turnover rates excluding and including mortgage dollar rolls are presented at the end of the fund’s financial highlights table.
Loan transactions— The fund has entered into loan transactions in which the fund acquires a loan either through an agent, by assignment from another holder, or as a participation interest in another holder’s portion of a loan. The loan is often administered by a financial institution that acts as agent for the holders of the loan, and the fund may be required to receive approval from the agent and/or borrower prior to the sale of the investment. The loan’s interest rate and maturity date may change based on the terms of the loan, including potential early payments of principal.
Futures contracts— The fund has entered into futures contracts, which provide for the future sale by one party and purchase by another party of a specified amount of a specific financial instrument for a specified price, date, time and place designated at the time the contract is made. Futures contracts are used to strategically manage the fund’s interest rate sensitivity by increasing or decreasing the duration of the fund or a portion of the fund’s portfolio.
Upon entering into futures contracts, and to maintain the fund’s open positions in futures contracts, the fund is required to deposit with a futures broker, known as a futures commission merchant (“FCM”), in a segregated account in the name of the FCM an amount of cash, U.S. government securities or other liquid securities, known as initial margin. The margin required for a particular futures contract is set by the exchange on which the contract is traded to serve as collateral, and may be significantly modified from time to time by the exchange during the term of the contract. Securities deposited as initial margin, if any, are disclosed in the investment portfolio and cash deposited as initial margin, if any, is reflected as cash pledged for futures contracts in the fund’s statement of assets and liabilities.
On a daily basis, the fund pays or receives variation margin based on the increase or decrease in the value of the futures contracts and records variation margin on futures contracts in the statement of assets and liabilities. In addition, the fund segregates liquid assets equivalent to the fund’s outstanding obligations under the contract in excess of the initial margin and variation margin, if any. Futures contracts may involve a risk of loss in excess of the variation margin shown on the fund’s statement of assets and liabilities. The fund records realized gains or losses at the time the futures contract is closed or expires. Net realized gains or losses and net unrealized appreciation or depreciation from futures contracts are recorded in the fund’s statement of operations. The average month-end notional amount of futures contracts while held was $27,729,245,000.
Forward currency contracts— The fund has entered into forward currency contracts, which represent agreements to exchange currencies on specific future dates at predetermined rates. The fund’s investment adviser uses forward currency contracts to manage the fund’s exposure to changes in exchange rates. Upon entering into these contracts, risks may arise from the potential inability of counterparties to meet the terms of their contracts and from possible movements in exchange rates.
| 22 | The Bond Fund of America |
On a daily basis, the fund’s investment adviser values forward currency contracts based on the applicable exchange rates and records unrealized appreciation or depreciation for open forward currency contracts in the fund’s statement of assets and liabilities. Realized gains or losses are recorded at the time the forward currency contract is closed or offset by another contract with the same broker for the same settlement date and currency. The average month-end notional amount of open forward currency contracts while held was $1,253,430,000.
Interest rate swaps— The fund has entered into interest rate swap contracts, which are agreements to exchange one stream of future interest payments for another based on a specified notional amount. Typically, interest rate swaps exchange a fixed interest rate for a payment that floats relative to a benchmark or vice versa. The fund’s investment adviser uses interest rate swaps to seek to manage the interest rate sensitivity of the fund by increasing or decreasing the duration of the fund or a portion of the fund’s portfolio. Risks may arise as a result of the fund’s investment adviser incorrectly anticipating changes in interest rates, increased volatility, reduced liquidity and the potential inability of counterparties to meet the terms of their agreements.
Upon entering into an interest rate swap contract, the fund is required to deposit cash, U.S. government securities or other liquid securities, which is known as initial margin. Generally, the initial margin required for a particular interest rate swap is set and held as collateral by the clearinghouse on which the contract is cleared. The amount of initial margin required may be significantly modified from time to time by the clearinghouse during the term of the contract.
On a daily basis, the fund’s investment adviser records daily interest accruals related to the exchange of future payments as a receivable and payable in the fund’s statement of assets and liabilities. The fund also pays or receives a variation margin based on the increase or decrease in the value of the interest rate swaps, including accrued interest, and records variation margin on interest rate swaps in the statement of assets and liabilities. The fund records realized gains and losses on both the net accrued interest and any gain or loss recognized at the time the interest rate swap is closed or expires. Net realized gains or losses, as well as any net unrealized appreciation or depreciation, from interest rate swaps are recorded in the fund’s statement of operations. The average month-end notional amount of interest rate swaps while held was $159,470,605,000.
Credit default swap indices— The fund has entered into centrally cleared credit default swap agreements on credit indices (“CDSI”) that involve one party (the protection buyer) making a stream of payments to another party (the protection seller) in exchange for the right to receive a specified return upon the occurrence of a credit event, such as a default or restructuring, with respect to any of the underlying issuers (reference obligations) in the referenced index. The fund’s investment adviser uses credit default swaps to assume exposure to a diversified portfolio of credits or to hedge against existing credit risks.
CDSI are portfolios of credit instruments or exposures designed to be representative of some part of the credit market, such as the high-yield or investment-grade credit market. CDSI are generally traded using standardized terms, including a fixed spread and standard maturity dates, and reference all the names in the index. If there is a credit event, it is settled based on that name’s weight in the index. The composition of the underlying issuers or obligations within a particular index may change periodically, usually every six months. A specified credit event may affect all or individual underlying reference obligations included in the index, and will be settled based upon the relative weighting of the affected obligation(s) within the index. The value of each CDSI can be used as a measure of the current payment/performance risk of the CDSI and represents the likelihood of an expected liability or profit should the notional amount of the CDSI be closed or sold as of the period end. An increasing value, as compared to the notional amount of the CDSI, represents a deterioration of the referenced indices’ credit soundness and a greater likelihood of risk of default or other credit event occurring as defined under the terms of the agreement. When the fund provides sell protection, its maximum exposure is the notional amount of the credit default swap agreement.
Upon entering into a centrally cleared CDSI contract, the fund is required to deposit with a derivatives clearing member (“DCM”) in a segregated account in the name of the DCM an amount of cash, U.S. government securities or other liquid securities, which is known as initial margin. Generally, the initial margin required for a particular credit default swap is set and held as collateral by the clearinghouse on which the contract is cleared. The amount of initial margin required may be significantly modified from time to time by the clearinghouse during the term of the contract. Securities deposited as initial margin are designated on the investment portfolio.
On a daily basis, interest accruals related to the exchange of future payments are recorded as a receivable and payable in the fund’s statement of assets and liabilities. The fund also pays or receives a variation margin based on the increase or decrease in the value of the CDSI, and records variation margin in the statement of assets and liabilities. The fund records realized gains and losses on both the net accrued interest and any gain or loss recognized at the time the swap is closed or expires. Net realized gains or losses, as well as any net unrealized appreciation or depreciation, from credit default swaps are recorded in the fund’s statement of operations. The average month-end notional amount of credit default swaps while held was $1,923,190,000.
| The Bond Fund of America | 23 |
The following tables identify the location and fair value amounts on the fund’s statement of assets and liabilities and the effect on the fund’s statement of operations resulting from the fund’s use of futures contracts, forward currency contracts, interest rate swaps and credit default swaps as of, or for the year ended, December 31, 2019 (dollars in thousands):
| | | | | Assets | | | Liabilities | |
| Contracts | | Risk type | | Location on statement of
assets and liabilities | | Value | | | Location on statement of
assets and liabilities | | Value | |
| Futures | | Interest | | Unrealized appreciation* | | $ | 15,245 | | | Unrealized depreciation* | | $ | 67,577 | |
| Forward currency | | Currency | | Unrealized appreciation on open forward currency contracts | | | 7,761 | | | Unrealized depreciation on open forward currency contracts | | | 8,801 | |
| Swap | | Interest | | Unrealized appreciation* | | | 274,989 | | | Unrealized depreciation* | | | 408,257 | |
| Swap | | Credit | | Unrealized appreciation* | | | — | | | Unrealized depreciation* | | | 18,647 | |
| | | | | | | $ | 297,995 | | | | | $ | 503,282 | |
| | | | | | | | | | | | | | | |
| | | | | Net realized gain (loss) | | | Net unrealized (depreciation) appreciation | |
| Contracts | | Risk type | | Location on statement of
operations | | Value | | | Location on statement of
operations | | Value | |
| Futures | | Interest | | Net realized gain on futures contracts | | $ | 642,940 | | | Net unrealized depreciation on futures contracts | | $ | (230,614 | ) |
| Forward currency | | Currency | | Net realized gain on forward currency contracts | | | 4,313 | | | Net unrealized appreciation on forward currency contracts | | | 2,194 | |
| Swap | | Interest | | Net realized loss on swap contracts | | | (116,942 | ) | | Net unrealized depreciation on swap contracts | | | (234,905 | ) |
| Swap | | Credit | | Net realized loss on swap contracts | | | (45,679 | ) | | Net unrealized depreciation on swap contracts | | | (40,734 | ) |
| | | | | | | $ | 484,632 | | | | | $ | (504,059 | ) |
| | |
| * | Includes cumulative appreciation/depreciation on futures contracts, interest rate swaps and credit default swaps as reported in the applicable tables following the fund’s investment portfolio. Only current day’s variation margin is reported within the statement of assets and liabilities. |
Collateral— The fund participates in a collateral program that calls for the fund to either receive or pledge highly liquid assets, such as cash or U.S. government securities, as collateral due to its use of futures contracts, forward currency contracts, interest rate swaps, credit default swaps and future delivery contracts. For futures contracts, interest rate swaps and credit default swaps, the program calls for the fund to pledge collateral for initial and variation margin by contract. For forward currency contracts, the program calls for the fund to either receive or pledge collateral based on the net gain or loss on unsettled forward currency contracts by counterparty. For future delivery contracts, the program calls for the fund to either receive or pledge collateral based on the net gain or loss on unsettled contracts by certain counterparties. The purpose of the collateral is to cover potential losses that could occur in the event that either party cannot meet its contractual obligation. Non-cash collateral pledged by the fund, if any, is disclosed in the fund’s investment portfolio, and cash collateral pledged by the fund, if any, is held in a segregated account with the fund’s custodian, which is reflected as pledged cash in the fund’s statement of assets and liabilities.
Rights of offset— The fund has entered into enforceable master netting agreements with certain counterparties for forward currency contracts, where on any date amounts payable by each party to the other (in the same currency with respect to the same transaction) may be closed or offset by each party’s payment obligation. If an early termination date occurs under these agreements following an event of default or termination event, all obligations of each party to its counterparty are settled net through a single payment in a single currency (“close-out netting”). For financial reporting purposes, the fund does not offset financial assets and financial liabilities that are subject to these master netting arrangements in the statement of assets and liabilities.
| 24 | The Bond Fund of America |
The following table presents the fund’s forward currency contracts by counterparty that are subject to master netting agreements but that are not offset in the fund’s statement of assets and liabilities. The net amount column shows the impact of offsetting on the fund’s statement of assets and liabilities as of December 31, 2019, if close-out netting was exercised (dollars in thousands):
| | | Gross amounts
recognized in the | | | Gross amounts not offset in the
statement of assets and liabilities and
subject to a master netting agreement | | | | |
| Counterparty | | statement of assets
and liabilities | | | Available
to offset | | | Non-cash
collateral* | | | Cash
collateral* | | | Net
amount | |
| Assets: | | | | | | | | | | | | | | | | | | | | |
| Bank of America | | $ | 20 | | | $ | (4 | ) | | $ | — | | | $ | — | | | $ | 16 | |
| Bank of New York Mellon | | | 125 | | | | (21 | ) | | | (104 | ) | | | — | | | | — | |
| Barclays Bank PLC | | | 264 | | | | (264 | ) | | | — | | | | — | | | | — | |
| Citibank | | | 4,649 | | | | (473 | ) | | | — | | | | (3,831 | ) | | | 345 | |
| Goldman Sachs | | | 614 | | | | (614 | ) | | | — | | | | — | | | | — | |
| HSBC Bank | | | 154 | | | | (30 | ) | | | — | | | | — | | | | 124 | |
| JPMorgan Chase | | | 1,470 | | | | (1,470 | ) | | | — | | | | — | | | | — | |
| Standard Chartered Bank | | | 21 | | | | (21 | ) | | | — | | | | — | | | | — | |
| UBS AG | | | 444 | | | | (265 | ) | | | — | | | | — | | | | 179 | |
| Total | | $ | 7,761 | | | $ | (3,162 | ) | | $ | (104 | ) | | $ | (3,831 | ) | | $ | 664 | |
| Liabilities: | | | | | | | | | | | | | | | | | | | | |
| Bank of America | | $ | 4 | | | $ | (4 | ) | | $ | — | | | $ | — | | | $ | — | |
| Bank of New York Mellon | | | 21 | | | | (21 | ) | | | — | | | | — | | | | — | |
| Barclays Bank PLC | | | 2,060 | | | | (264 | ) | | | (1,796 | ) | | | — | | | | — | |
| Citibank | | | 473 | | | | (473 | ) | | | — | | | | — | | | | — | |
| Goldman Sachs | | | 1,154 | | | | (614 | ) | | | (540 | ) | | | — | | | | — | |
| HSBC Bank | | | 30 | | | | (30 | ) | | | — | | | | — | | | | — | |
| JPMorgan Chase | | | 2,774 | | | | (1,470 | ) | | | (1,149 | ) | | | — | | | | 155 | |
| Morgan Stanley | | | 1,810 | | | | — | | | | (1,629 | ) | | | — | | | | 181 | |
| Standard Chartered Bank | | | 210 | | | | (21 | ) | | | — | | | | — | | | | 189 | |
| UBS AG | | | 265 | | | | (265 | ) | | | — | | | | — | | | | — | |
| Total | | $ | 8,801 | | | $ | (3,162 | ) | | $ | (5,114 | ) | | $ | — | | | $ | 525 | |
| | |
| * | Collateral is shown on a settlement basis. |
6. Taxation and distributions
Federal income taxation — The fund complies with the requirements under Subchapter M of the Internal Revenue Code applicable to mutual funds and intends to distribute substantially all of its net taxable income and net capital gains each year. The fund is not subject to income taxes to the extent such distributions are made. Therefore, no federal income tax provision is required.
As of and during the period ended December 31, 2019, the fund did not have a liability for any unrecognized tax benefits. The fund recognizes interest and penalties, if any, related to unrecognized tax benefits as income tax expense in the statement of operations. During the period, the fund did not incur any significant interest or penalties.
The fund’s tax returns are not subject to examination by federal, state and, if applicable, non-U.S. tax authorities after the expiration of each jurisdiction’s statute of limitations, which is generally three years after the date of filing but can be extended in certain jurisdictions.
Non-U.S. taxation— Dividend and interest income are recorded net of non-U.S. taxes paid. The fund may file withholding tax reclaims in certain jurisdictions to recover a portion of amounts previously withheld. These reclaims are recorded when the amount is known and there are no significant uncertainties on collectability. Gains realized by the fund on the sale of securities in certain countries, if any, may be subject to non-U.S. taxes. If applicable, the fund records an estimated deferred tax liability based on unrealized gains to provide for potential non-U.S. taxes payable upon the sale of these securities.
Distributions— Distributions paid to shareholders are based on net investment income and net realized gains determined on a tax basis, which may differ from net investment income and net realized gains for financial reporting purposes. These differences are due primarily to different treatment for items such as currency gains and losses; short-term capital gains and losses; capital losses related to sales of certain securities within 30 days of purchase; deferred expenses; cost of investments sold; paydowns on fixed-income securities; net capital losses; amortization of premiums and discounts and income on certain investments. The fiscal year in which amounts are distributed may differ from the year in which the net investment income and net realized gains are recorded by the fund for financial reporting purposes.
| The Bond Fund of America | 25 |
During the year ended December 31, 2019, the fund reclassified $750,000 from total distributable earnings to capital paid in on shares of beneficial interest to align financial reporting with tax reporting. The fund also utilized capital loss carryforward of $472,685,000.
As of December 31, 2019, the tax basis components of distributable earnings, unrealized appreciation (depreciation) and cost of investments were as follows (dollars in thousands):
| Undistributed ordinary income | | $ | 14,800 | |
| Post-October capital loss deferral* | | | (100,857 | ) |
| Gross unrealized appreciation on investments | | | 1,658,383 | |
| Gross unrealized depreciation on investments | | | (627,044 | ) |
| Net unrealized appreciation on investments | | | 1,031,339 | |
| Cost of investments | | | 50,107,195 | |
| * | This deferral is considered incurred in the subsequent year. |
Distributions paid or accrued were characterized for tax purposes as follows (dollars in thousands):
| | | Year ended December 31, 2019 | | | Year ended December 31, 2018 | |
| Share class | | Ordinary
income | | | Long-term
capital gains | | | Total
distributions
paid or
accrued | | | Ordinary
income | | | Long-term
capital gains | | | Total
distributions
paid or
accrued | |
| Class A | | $ | 632,256 | | | $ | 167,895 | | | $ | 800,151 | | | $ | 464,021 | | | $ | — | | | $ | 464,021 | |
| Class C | | | 17,166 | | | | 5,689 | | | | 22,855 | | | | 14,290 | | | | — | | | | 14,290 | |
| Class T | | | — | * | | | — | * | | | — | * | | | — | * | | | — | | | | — | * |
| Class F-1 | | | 25,778 | | | | 7,064 | | | | 32,842 | | | | 17,860 | | | | — | | | | 17,860 | |
| Class F-2 | | | 249,463 | | | | 68,160 | | | | 317,623 | | | | 134,102 | | | | — | | | | 134,102 | |
| Class F-3 | | | 62,414 | | | | 16,004 | | | | 78,418 | | | | 49,253 | | | | — | | | | 49,253 | |
| Class 529-A | | | 31,813 | | | | 8,485 | | | | 40,298 | | | | 23,226 | | | | — | | | | 23,226 | |
| Class 529-C | | | 3,956 | | | | 1,302 | | | | 5,258 | | | | 3,242 | | | | — | | | | 3,242 | |
| Class 529-E | | | 1,217 | | | | 336 | | | | 1,553 | | | | 939 | | | | — | | | | 939 | |
| Class 529-T | | | — | * | | | — | * | | | — | * | | | — | * | | | — | | | | — | * |
| Class 529-F-1 | | | 3,663 | | | | 923 | | | | 4,586 | | | | 2,415 | | | | — | | | | 2,415 | |
| Class R-1 | | | 733 | | | | 282 | | | | 1,015 | | | | 498 | | | | — | | | | 498 | |
| Class R-2 | | | 8,916 | | | | 2,975 | | | | 11,891 | | | | 6,767 | | | | — | | | | 6,767 | |
| Class R-2E | | | 772 | | | | 238 | | | | 1,010 | | | | 441 | | | | — | | | | 441 | |
| Class R-3 | | | 16,313 | | | | 4,599 | | | | 20,912 | | | | 12,339 | | | | — | | | | 12,339 | |
| Class R-4 | | | 16,214 | | | | 4,131 | | | | 20,345 | | | | 12,839 | | | | — | | | | 12,839 | |
| Class R-5E | | | 880 | | | | 317 | | | | 1,197 | | | | 128 | | | | — | | | | 128 | |
| Class R-5 | | | 5,548 | | | | 1,252 | | | | 6,800 | | | | 4,514 | | | | — | | | | 4,514 | |
| Class R-6 | | | 313,911 | | | | 75,235 | | | | 389,146 | | | | 199,676 | | | | — | | | | 199,676 | |
| Total | | $ | 1,391,013 | | | $ | 364,887 | | | $ | 1,755,900 | | | $ | 946,550 | | | $ | — | | | $ | 946,550 | |
| | |
| * | Amount less than one thousand. |
7. Fees and transactions with related parties
CRMC, the fund’s investment adviser, is the parent company of American Funds Distributors®, Inc. (“AFD”), the principal underwriter of the fund’s shares, and American Funds Service Company® (“AFS”), the fund’s transfer agent. CRMC, AFD and AFS are considered related parties to the fund.
Investment advisory services — The fund has an investment advisory and service agreement with CRMC that provides for monthly fees accrued daily. These fees are based on a series of decreasing annual rates beginning with 0.300% on the first $60 million of daily net assets and decreasing to 0.110% on such assets in excess of $36 billion. The agreement also provides for monthly fees, accrued daily, based on a series of decreasing rates beginning with 2.25% on the first $8,333,333 of the fund’s monthly gross income and decreasing to 1.75% on such income in excess of $41,666,667. For the year ended December 31, 2019, the investment advisory services fee was $83,255,000, which was equivalent to an annualized rate of 0.186% of average daily net assets.
| 26 | The Bond Fund of America |
Class-specific fees and expenses— Expenses that are specific to individual share classes are accrued directly to the respective share class. The principal class-specific fees and expenses are further described below:
Distribution services— The fund has plans of distribution for all share classes, except Class F-2, F-3, R-5E, R-5 and R-6 shares. Under the plans, the board of trustees approves certain categories of expenses that are used to finance activities primarily intended to sell fund shares and service existing accounts. The plans provide for payments, based on an annualized percentage of average daily net assets, ranging from 0.25% to 1.00% as noted in this section. In some cases, the board of trustees has limited the amounts that may be paid to less than the maximum allowed by the plans. All share classes with a plan may use up to 0.25% of average daily net assets to pay service fees, or to compensate AFD for paying service fees, to firms that have entered into agreements with AFD to provide certain shareholder services. The remaining amounts available to be paid under each plan are paid to dealers to compensate them for their sales activities.
| | Share class | | Currently approved limits | | Plan limits |
| | Class A | | | 0.25 | % | | | 0.25 | % |
| | Class 529-A | | | 0.25 | | | | 0.50 | |
| | Classes C, 529-C and R-1 | | | 1.00 | | | | 1.00 | |
| | Class R-2 | | | 0.75 | | | | 1.00 | |
| | Class R-2E | | | 0.60 | | | | 0.85 | |
| | Classes 529-E and R-3 | | | 0.50 | | | | 0.75 | |
| | Classes T, F-1, 529-T, 529-F-1 and R-4 | | | 0.25 | | | | 0.50 | |
For Class A and 529-A shares, distribution-related expenses include the reimbursement of dealer and wholesaler commissions paid by AFD for certain shares sold without a sales charge. These share classes reimburse AFD for amounts billed within the prior 15 months but only to the extent that the overall annual expense limits are not exceeded. As of December 31, 2019, unreimbursed expenses subject to reimbursement totaled $6,714,000 for Class A shares. There were no unreimbursed expenses subject to reimbursement for Class 529-A shares.
Transfer agent services — The fund has a shareholder services agreement with AFS under which the fund compensates AFS for providing transfer agent services to each of the fund’s share classes. These services include recordkeeping, shareholder communications and transaction processing. In addition, the fund reimburses AFS for amounts paid to third parties for performing transfer agent services on behalf of fund shareholders. For the year ended December 31, 2019, AFS voluntarily waived transfer agent services fees of $61,000 for Class F-3 shares.
Administrative services — The fund has an administrative services agreement with CRMC under which the fund compensates CRMC for providing administrative services to all share classes. Administrative services are provided by CRMC and its affiliates to help assist third parties providing non-distribution services to fund shareholders. These services include providing in depth information on the fund and market developments that impact fund investments. Administrative services also include, but are not limited to, coordinating, monitoring and overseeing third parties that provide services to fund shareholders. The agreement provides the fund the ability to charge an administrative services fee at the annual rate of 0.05% of the daily net assets attributable to each share class of the fund. Prior to July 1, 2019, Class A shares paid CRMC an administrative services fee at the annual rate of 0.01% of daily net assets and all other share classes paid a fee at the annual rate of 0.05% of their respective daily net assets. The fund’s board of trustees authorized the fund to pay CRMC effective July 1, 2019, an administrative services fee at the annual rate of 0.03% of the average daily net assets attributable to each share class of the fund (which could increase as noted above) for CRMC’s provision of administrative services.
529 plan services — Each 529 share class is subject to service fees to compensate the Virginia College Savings Plan (“Virginia529”) for its oversight and administration of the CollegeAmerica 529 college savings plan. The fee is based on the combined net assets invested in Class 529 and ABLE shares of the American Funds. Class ABLE shares are offered on other American Funds by Virginia529 through ABLEAmerica®, a tax-advantaged savings program for individuals with disabilities. The quarterly fee is based on a series of decreasing annual rates beginning with 0.10% on the first $20 billion of the combined net assets invested in the American Funds and decreasing to 0.03% on such assets in excess of $100 billion. Effective January 1, 2020, the quarterly fee will be amended to a series of decreasing annual rates beginning with 0.09% on the first $20 billion of the combined net assets invested in the American Funds and decreasing to 0.03% on such assets in excess of $100 billion. The fee for any given calendar quarter is accrued and calculated on the basis of the average net assets of Class 529 and ABLE shares of the American Funds for the last month of the prior calendar quarter. The fee is included in other expenses in the fund’s statement of operations. Virginia529 is not considered a related party to the fund.
| The Bond Fund of America | 27 |
For the year ended December 31, 2019, class-specific expenses under the agreements were as follows (dollars in thousands):
| | Share class | | Distribution
services | | | Transfer agent
services | | | Administrative
services | | | 529 plan
services | |
| | Class A | | | $52,950 | | | | $27,832 | | | | $4,366 | | | Not applicable | |
| | Class C | | | 7,827 | | | | 1,056 | | | | 316 | | | Not applicable | |
| | Class T | | | — | | | | — | * | | | — | * | | Not applicable | |
| | Class F-1 | | | 2,169 | | | | 1,334 | | | | 341 | | | Not applicable | |
| | Class F-2 | | | Not applicable | | | | 8,577 | | | | 2,895 | | | Not applicable | |
| | Class F-3 | | | Not applicable | | | | 241 | | | | 714 | | | Not applicable | |
| | Class 529-A | | | 2,616 | | | | 1,311 | | | | 431 | | | $717 | |
| | Class 529-C | | | 1,821 | | | | 229 | | | | 75 | | | 123 | |
| | Class 529-E | | | 221 | | | | 24 | | | | 18 | | | 29 | |
| | Class 529-T | | | — | | | | — | * | | | — | * | | — | * |
| | Class 529-F-1 | | | — | | | | 138 | | | | 45 | | | 76 | |
| | Class R-1 | | | 314 | | | | 36 | | | | 13 | | | Not applicable | |
| | Class R-2 | | | 3,045 | | | | 1,452 | | | | 162 | | | Not applicable | |
| | Class R-2E | | | 183 | | | | 65 | | | | 12 | | | Not applicable | |
| | Class R-3 | | | 3,070 | | | | 966 | | | | 243 | | | Not applicable | |
| | Class R-4 | | | 1,364 | | | | 556 | | | | 216 | | | Not applicable | |
| | Class R-5E | | | Not applicable | | | | 34 | | | | 9 | | | Not applicable | |
| | Class R-5 | | | Not applicable | | | | 89 | | | | 68 | | | Not applicable | |
| | Class R-6 | | | Not applicable | | | | 27 | | | | 3,676 | | | Not applicable | |
| | Total class-specific expenses | | | $75,580 | | | | $43,967 | | | | $13,600 | | | $945 | |
| | | |
| | * | Amount less than one thousand. |
Trustees’ deferred compensation— Trustees who are unaffiliated with CRMC may elect to defer the cash payment of part or all of their compensation. These deferred amounts, which remain as liabilities of the fund, are treated as if invested in shares of the fund or other American Funds. These amounts represent general, unsecured liabilities of the fund and vary according to the total returns of the selected funds. Trustees’ compensation of $291,000 in the fund’s statement of operations reflects $205,000 in current fees (either paid in cash or deferred) and a net increase of $86,000 in the value of the deferred amounts.
Affiliated officers and trustees— Officers and certain trustees of the fund are or may be considered to be affiliated with CRMC, AFD and AFS. No affiliated officers or trustees received any compensation directly from the fund.
Investment in CCF— The fund holds shares of CCF, an institutional prime money market fund managed by CRMC. CCF invests in high-quality, short-term money market instruments. CCF is used as the primary investment vehicle for the fund’s short-term investments. CCF shares are only available for purchase by CRMC, its affiliates, and other funds managed by CRMC or its affiliates, and are not available to the public. CRMC does not receive an investment advisory services fee from CCF.
Security transactions with related funds— The fund may purchase securities from, or sell securities to, other funds managed by CRMC (or funds managed by certain affiliates of CRMC) under procedures adopted by the fund’s board of trustees. The funds involved in such transactions are considered related by virtue of having a common investment adviser (or affiliated investment advisers), common trustees and/or common officers. When such transactions occur, each transaction is executed at the current market price of the security and no brokerage commissions or fees are paid in accordance with Rule 17a-7 of the 1940 Act.
Interfund lending— Pursuant to an exemptive order issued by the SEC, the fund, along with other CRMC-managed funds (or funds managed by certain affiliates of CRMC), may participate in an interfund lending program. The program provides an alternate credit facility that permits the funds to lend or borrow cash for temporary purposes directly to or from one another, subject to the conditions of the exemptive order. The fund did not lend or borrow cash through the interfund lending program at any time during the year ended December 31, 2019.
| 28 | The Bond Fund of America |
8. Capital share transactions
Capital share transactions in the fund were as follows (dollars and shares in thousands):
| | | | | | | | | Reinvestments of | | | | | | | | | Net increase | |
| | | Sales* | | | distributions | | | Repurchases* | | | (decrease) | |
| Share class | | Amount | | | Shares | | | Amount | | | Shares | | | Amount | | | Shares | | | Amount | | | Shares | |
| | | | | | | | | | | | | | | | | | | | | | | | | | | | | | | | | |
| Year ended December 31, 2019 | | | | | | | | | | | | | | | |
| | | | | | | | | | | | | | | | | | | | | | | | | | | | | | | | | |
| Class A | | $ | 4,797,105 | | | | 366,940 | | | $ | 786,442 | | | | 60,160 | | | $ | (2,517,994 | ) | | | (193,496 | ) | | $ | 3,065,553 | | | | 233,604 | |
| Class C | | | 202,675 | | | | 15,512 | | | | 22,117 | | | | 1,693 | | | | (295,471 | ) | | | (22,768 | ) | | | (70,679 | ) | | | (5,563 | ) |
| Class T | | | — | | | | — | | | | — | | | | — | | | | — | | | | — | | | | — | | | | — | |
| Class F-1 | | | 338,338 | | | | 25,992 | | | | 31,497 | | | | 2,409 | | | | (168,855 | ) | | | (12,993 | ) | | | 200,980 | | | | 15,408 | |
| Class F-2 | | | 4,586,576 | | | | 350,987 | | | | 307,948 | | | | 23,534 | | | | (1,440,771 | ) | | | (110,563 | ) | | | 3,453,753 | | | | 263,958 | |
| Class F-3 | | | 1,004,030 | | | | 76,983 | | | | 77,435 | | | | 5,919 | | | | (414,597 | ) | | | (31,832 | ) | | | 666,868 | | | | 51,070 | |
| Class 529-A | | | 287,536 | | | | 22,034 | | | | 39,969 | | | | 3,057 | | | | (198,383 | ) | | | (15,204 | ) | | | 129,122 | | | | 9,887 | |
| Class 529-C | | | 48,225 | | | | 3,702 | | | | 5,190 | | | | 397 | | | | (72,148 | ) | | | (5,541 | ) | | | (18,733 | ) | | | (1,442 | ) |
| Class 529-E | | | 12,228 | | | | 938 | | | | 1,543 | | | | 118 | | | | (11,992 | ) | | | (920 | ) | | | 1,779 | | | | 136 | |
| Class 529-T | | | — | | | | — | | | | — | † | | | — | † | | | — | | | | — | | | | — | † | | | — | † |
| Class 529-F-1 | | | 40,918 | | | | 3,137 | | | | 4,576 | | | | 350 | | | | (23,833 | ) | | | (1,825 | ) | | | 21,661 | | | | 1,662 | |
| Class R-1 | | | 16,870 | | | | 1,285 | | | | 1,012 | | | | 78 | | | | (9,765 | ) | | | (747 | ) | | | 8,117 | | | | 616 | |
| Class R-2 | | | 105,968 | | | | 8,141 | | | | 11,808 | | | | 904 | | | | (124,454 | ) | | | (9,575 | ) | | | (6,678 | ) | | | (530 | ) |
| Class R-2E | | | 11,211 | | | | 861 | | | | 1,011 | | | | 77 | | | | (6,248 | ) | | | (476 | ) | | | 5,974 | | | | 462 | |
| Class R-3 | | | 180,819 | | | | 13,861 | | | | 20,778 | | | | 1,590 | | | | (174,209 | ) | | | (13,372 | ) | | | 27,388 | | | | 2,079 | |
| Class R-4 | | | 151,765 | | | | 11,648 | | | | 20,236 | | | | 1,548 | | | | (144,314 | ) | | | (11,094 | ) | | | 27,687 | | | | 2,102 | |
| Class R-5E | | | 39,735 | | | | 3,031 | | | | 1,185 | | | | 90 | | | | (5,989 | ) | | | (457 | ) | | | 34,931 | | | | 2,664 | |
| Class R-5 | | | 40,751 | | | | 3,129 | | | | 6,677 | | | | 511 | | | | (43,889 | ) | | | (3,367 | ) | | | 3,539 | | | | 273 | |
| Class R-6 | | | 2,229,367 | | | | 171,665 | | | | 388,656 | | | | 29,727 | | | | (647,077 | ) | | | (49,572 | ) | | | 1,970,946 | | | | 151,820 | |
| Total net increase (decrease) | | $ | 14,094,117 | | | | 1,079,846 | | | $ | 1,728,080 | | | | 132,162 | | | $ | (6,299,989 | ) | | | (483,802 | ) | | $ | 9,522,208 | | | | 728,206 | |
| | | | | | | | | | | | | | | | | | | | | | | | | | | | | | | | | |
| Year ended December 31, 2018 | | | | | | | | | | |
| | | | | | | | | | | | | | | | | | | | | | | | | | | | | | | | | |
| Class A | | $ | 2,861,188 | | | | 227,840 | | | $ | 454,806 | | | | 36,286 | | | $ | (3,403,409 | ) | | | (271,481 | ) | | $ | (87,415 | ) | | | (7,355 | ) |
| Class C | | | 121,642 | | | | 9,691 | | | | 13,893 | | | | 1,108 | | | | (325,669 | ) | | | (25,944 | ) | | | (190,134 | ) | | | (15,145 | ) |
| Class T | | | — | | | | — | | | | — | | | | — | | | | — | | | | — | | | | — | | | | — | |
| Class F-1 | | | 191,259 | | | | 15,227 | | | | 17,254 | | | | 1,376 | | | | (244,849 | ) | | | (19,518 | ) | | | (36,336 | ) | | | (2,915 | ) |
| Class F-2 | | | 2,836,748 | | | | 225,999 | | | | 130,536 | | | | 10,420 | | | | (1,204,214 | ) | | | (96,250 | ) | | | 1,763,070 | | | | 140,169 | |
| Class F-3 | | | 1,006,268 | | | | 80,033 | | | | 48,955 | | | | 3,902 | | | | (1,577,549 | ) | | | (125,862 | ) | | | (522,326 | ) | | | (41,927 | ) |
| Class 529-A | | | 188,116 | | | | 14,979 | | | | 23,101 | | | | 1,843 | | | | (204,209 | ) | | | (16,269 | ) | | | 7,008 | | | | 553 | |
| Class 529-C | | | 35,902 | | | | 2,859 | | | | 3,216 | | | | 257 | | | | (74,085 | ) | | | (5,903 | ) | | | (34,967 | ) | | | (2,787 | ) |
| Class 529-E | | | 6,700 | | | | 533 | | | | 933 | | | | 74 | | | | (10,664 | ) | | | (849 | ) | | | (3,031 | ) | | | (242 | ) |
| Class 529-T | | | — | | | | — | | | | — | † | | | — | † | | | — | | | | — | | | | — | † | | | — | † |
| Class 529-F-1 | | | 35,211 | | | | 2,810 | | | | 2,401 | | | | 192 | | | | (21,209 | ) | | | (1,694 | ) | | | 16,403 | | | | 1,308 | |
| Class R-1 | | | 7,103 | | | | 566 | | | | 495 | | | | 40 | | | | (10,597 | ) | | | (845 | ) | | | (2,999 | ) | | | (239 | ) |
| Class R-2 | | | 102,556 | | | | 8,166 | | | | 6,686 | | | | 534 | | | | (153,694 | ) | | | (12,226 | ) | | | (44,452 | ) | | | (3,526 | ) |
| Class R-2E | | | 11,971 | | | | 953 | | | | 439 | | | | 35 | | | | (6,077 | ) | | | (484 | ) | | | 6,333 | | | | 504 | |
| Class R-3 | | | 156,978 | | | | 12,483 | | | | 12,228 | | | | 976 | | | | (193,761 | ) | | | (15,424 | ) | | | (24,555 | ) | | | (1,965 | ) |
| Class R-4 | | | 125,336 | | | | 9,970 | | | | 12,758 | | | | 1,018 | | | | (187,775 | ) | | | (14,942 | ) | | | (49,681 | ) | | | (3,954 | ) |
| Class R-5E | | | 9,224 | | | | 732 | | | | 127 | | | | 10 | | | | (1,259 | ) | | | (100 | ) | | | 8,092 | | | | 642 | |
| Class R-5 | | | 36,921 | | | | 2,937 | | | | 4,464 | | | | 356 | | | | (49,926 | ) | | | (3,976 | ) | | | (8,541 | ) | | | (683 | ) |
| Class R-6 | | | 2,314,983 | | | | 183,807 | | | | 199,539 | | | | 15,927 | | | | (586,300 | ) | | | (46,798 | ) | | | 1,928,222 | | | | 152,936 | |
| Total net increase (decrease) | | $ | 10,048,106 | | | | 799,585 | | | $ | 931,831 | | | | 74,354 | | | $ | (8,255,246 | ) | | | (658,565 | ) | | $ | 2,724,691 | | | | 215,374 | |
| | |
| * | Includes exchanges between share classes of the fund. |
| † | Amount less than one thousand. |
9. Investment transactions
The fund made purchases and sales of investment securities, excluding short-term securities and U.S. government obligations, if any, of $93,209,614,000 and $96,197,824,000, respectively, during the year ended December 31, 2019.
| The Bond Fund of America | 29 |
Financial highlights
| | | | | | Income (loss) from
investment operations1 | | | Dividends and distributions | | | | | | | | | | | | | | | | | | | |
| Period ended | | Net asset
value,
beginning
of period | | | Net
investment
income | | | Net gains
(losses) on
securities
(both
realized and
unrealized) | | | Total from
investment
operations | | | Dividends
(from net
investment
income) | | | Distributions
(from capital
gains) | | | Total
dividends
and
distributions | | | Net asset
value,
end
of period | | | Total
return2,3 | | | Net assets,
end of period
(in millions) | | | Ratio of
expenses to
average net
assets before
reimbursements/
waivers4 | | | Ratio of
expenses to
average net
assets after
reimbursements/
waivers3,4 | | | Ratio of
net income
to average
net assets3 | |
| Class A: | | | | | | | | | | | | | | | | | | | | | | | | | | | | | | | | | | | | | | | | | | | | | | | | | | | | |
| 12/31/2019 | | $ | 12.57 | | | $ | .31 | | | $ | .69 | | | $ | 1.00 | | | $ | (.30 | ) | | $ | (.18 | ) | | $ | (.48 | ) | | $ | 13.09 | | | | 8.02 | % | | $ | 23,197 | | | | .60 | % | | | .60 | % | | | 2.35 | % |
| 12/31/2018 | | | 12.89 | | | | .30 | | | | (.32 | ) | | | (.02 | ) | | | (.30 | ) | | | — | | | | (.30 | ) | | | 12.57 | | | | (.13 | ) | | | 19,352 | | | | .60 | | | | .60 | | | | 2.37 | |
| 12/31/2017 | | | 12.72 | | | | .25 | | | | .16 | | | | .41 | | | | (.24 | ) | | | — | | | | (.24 | ) | | | 12.89 | | | | 3.21 | | | | 19,939 | | | | .60 | | | | .60 | | | | 1.91 | |
| 12/31/2016 | | | 12.59 | | | | .23 | | | | .12 | | | | .35 | | | | (.22 | ) | | | — | | | | (.22 | ) | | | 12.72 | | | | 2.74 | | | | 19,437 | | | | .61 | | | | .61 | | | | 1.79 | |
| 12/31/2015 | | | 12.81 | | | | .23 | | | | (.20 | ) | | | .03 | | | | (.25 | ) | | | — | | | | (.25 | ) | | | 12.59 | | | | .23 | | | | 18,580 | | | | .60 | | | | .60 | | | | 1.81 | |
| Class C: | | | | | | | | | | | | | | | | | | | | | | | | | | | | | | | | | | | | | | | | | | | | | | | | | | | | |
| 12/31/2019 | | | 12.57 | | | | .21 | | | | .69 | | | | .90 | | | | (.20 | ) | | | (.18 | ) | | | (.38 | ) | | | 13.09 | | | | 7.20 | | | | 786 | | | | 1.36 | | | | 1.36 | | | | 1.60 | |
| 12/31/2018 | | | 12.89 | | | | .20 | | | | (.32 | ) | | | (.12 | ) | | | (.20 | ) | | | — | | | | (.20 | ) | | | 12.57 | | | | (.91 | ) | | | 825 | | | | 1.39 | | | | 1.39 | | | | 1.58 | |
| 12/31/2017 | | | 12.72 | | | | .15 | | | | .16 | | | | .31 | | | | (.14 | ) | | | — | | | | (.14 | ) | | | 12.89 | | | | 2.40 | | | | 1,041 | | | | 1.40 | | | | 1.40 | | | | 1.11 | |
| 12/31/2016 | | | 12.59 | | | | .12 | | | | .12 | | | | .24 | | | | (.11 | ) | | | — | | | | (.11 | ) | | | 12.72 | | | | 1.94 | | | | 1,276 | | | | 1.40 | | | | 1.40 | | | | 1.00 | |
| 12/31/2015 | | | 12.81 | | | | .13 | | | | (.20 | ) | | | (.07 | ) | | | (.15 | ) | | | — | | | | (.15 | ) | | | 12.59 | | | | (.56 | ) | | | 1,361 | | | | 1.40 | | | | 1.40 | | | | 1.01 | |
| Class T: | | | | | | | | | | | | | | | | | | | | | | | | | | | | | | | | | | | | | | | | | | | | | | | | | | | | |
| 12/31/2019 | | | 12.57 | | | | .34 | | | | .69 | | | | 1.03 | | | | (.33 | ) | | | (.18 | ) | | | (.51 | ) | | | 13.09 | | | | 8.24 | 5 | | | — | 6 | | | .37 | 5 | | | .37 | 5 | | | 2.56 | 5 |
| 12/31/2018 | | | 12.89 | | | | .33 | | | | (.32 | ) | | | .01 | | | | (.33 | ) | | | — | | | | (.33 | ) | | | 12.57 | | | | .09 | 5 | | | — | 6 | | | .39 | 5 | | | .39 | 5 | | | 2.58 | 5 |
| 12/31/20177,8 | | | 12.81 | | | | .20 | | | | .07 | | | | .27 | | | | (.19 | ) | | | — | | | | (.19 | ) | | | 12.89 | | | | 2.15 | 5,9 | | | — | 6 | | | .38 | 5,10 | | | .38 | 5,10 | | | 2.15 | 5,10 |
| Class F-1: | | | | | | | | | | | | | | | | | | | | | | | | | | | | | | | | | | | | | | | | | | | | | | | | | | | | |
| 12/31/2019 | | | 12.57 | | | | .31 | | | | .69 | | | | 1.00 | | | | (.30 | ) | | | (.18 | ) | | | (.48 | ) | | | 13.09 | | | | 7.97 | | | | 977 | | | | .64 | | | | .64 | | | | 2.31 | |
| 12/31/2018 | | | 12.89 | | | | .29 | | | | (.32 | ) | | | (.03 | ) | | | (.29 | ) | | | — | | | | (.29 | ) | | | 12.57 | | | | (.18 | ) | | | 745 | | | | .66 | | | | .66 | | | | 2.32 | |
| 12/31/2017 | | | 12.72 | | | | .24 | | | | .16 | | | | .40 | | | | (.23 | ) | | | — | | | | (.23 | ) | | | 12.89 | | | | 3.17 | | | | 801 | | | | .65 | | | | .65 | | | | 1.86 | |
| 12/31/2016 | | | 12.59 | | | | .22 | | | | .12 | | | | .34 | | | | (.21 | ) | | | — | | | | (.21 | ) | | | 12.72 | | | | 2.71 | | | | 757 | | | | .64 | | | | .64 | | | | 1.76 | |
| 12/31/2015 | | | 12.81 | | | | .23 | | | | (.20 | ) | | | .03 | | | | (.25 | ) | | | — | | | | (.25 | ) | | | 12.59 | | | | .21 | | | | 673 | | | | .63 | | | | .63 | | | | 1.78 | |
| Class F-2: | | | | | | | | | | | | | | | | | | | | | | | | | | | | | | | | | | | | | | | | | | | | | | | | | | | | |
| 12/31/2019 | | | 12.57 | | | | .35 | | | | .69 | | | | 1.04 | | | | (.34 | ) | | | (.18 | ) | | | (.52 | ) | | | 13.09 | | | | 8.28 | | | | 9,415 | | | | .35 | | | | .35 | | | | 2.59 | |
| 12/31/2018 | | | 12.89 | | | | .33 | | | | (.32 | ) | | | .01 | | | | (.33 | ) | | | — | | | | (.33 | ) | | | 12.57 | | | | .14 | | | | 5,728 | | | | .34 | | | | .34 | | | | 2.65 | |
| 12/31/2017 | | | 12.72 | | | | .28 | | | | .16 | | | | .44 | | | | (.27 | ) | | | — | | | | (.27 | ) | | | 12.89 | | | | 3.47 | | | | 4,067 | | | | .35 | | | | .35 | | | | 2.16 | |
| 12/31/2016 | | | 12.59 | | | | .26 | | | | .12 | | | | .38 | | | | (.25 | ) | | | — | | | | (.25 | ) | | | 12.72 | | | | 3.00 | | | | 3,338 | | | | .36 | | | | .36 | | | | 2.03 | |
| 12/31/2015 | | | 12.81 | | | | .26 | | | | (.20 | ) | | | .06 | | | | (.28 | ) | | | — | | | | (.28 | ) | | | 12.59 | | | | .47 | | | | 1,521 | | | | .37 | | | | .37 | | | | 2.05 | |
| Class F-3: | | | | | | | | | | | | | | | | | | | | | | | | | | | | | | | | | | | | | | | | | | | | | | | | | | | | |
| 12/31/2019 | | | 12.57 | | | | .36 | | | | .69 | | | | 1.05 | | | | (.35 | ) | | | (.18 | ) | | | (.53 | ) | | | 13.09 | | | | 8.40 | | | | 2,212 | | | | .25 | | | | .24 | | | | 2.70 | |
| 12/31/2018 | | | 12.89 | | | | .34 | | | | (.32 | ) | | | .02 | | | | (.34 | ) | | | — | | | | (.34 | ) | | | 12.57 | | | | .21 | | | | 1,483 | | | | .27 | | | | .27 | | | | 2.70 | |
| 12/31/20177,11 | | | 12.74 | | | | .27 | | | | .14 | | | | .41 | | | | (.26 | ) | | | — | | | | (.26 | ) | | | 12.89 | | | | 3.25 | 9 | | | 2,061 | | | | .26 | 10 | | | .26 | 10 | | | 2.29 | 10 |
| Class 529-A: | | | | | | | | | | | | | | | | | | | | | | | | | | | | | | | | | | | | | | | | | | | | | | | | | | | | |
| 12/31/2019 | | | 12.57 | | | | .30 | | | | .69 | | | | .99 | | | | (.29 | ) | | | (.18 | ) | | | (.47 | ) | | | 13.09 | | | | 7.95 | | | | 1,174 | | | | .66 | | | | .66 | | | | 2.29 | |
| 12/31/2018 | | | 12.89 | | | | .29 | | | | (.32 | ) | | | (.03 | ) | | | (.29 | ) | | | — | | | | (.29 | ) | | | 12.57 | | | | (.21 | ) | | | 1,003 | | | | .69 | | | | .69 | | | | 2.29 | |
| 12/31/2017 | | | 12.72 | | | | .24 | | | | .16 | | | | .40 | | | | (.23 | ) | | | — | | | | (.23 | ) | | | 12.89 | | | | 3.14 | | | | 1,022 | | | | .68 | | | | .68 | | | | 1.84 | |
| 12/31/2016 | | | 12.59 | | | | .22 | | | | .12 | | | | .34 | | | | (.21 | ) | | | — | | | | (.21 | ) | | | 12.72 | | | | 2.66 | | | | 917 | | | | .69 | | | | .69 | | | | 1.71 | |
| 12/31/2015 | | | 12.81 | | | | .22 | | | | (.20 | ) | | | .02 | | | | (.24 | ) | | | — | | | | (.24 | ) | | | 12.59 | | | | .13 | | | | 898 | | | | .70 | | | | .70 | | | | 1.71 | |
| 30 | The Bond Fund of America |
| | | | | | Income (loss) from
investment operations1 | | | Dividends and distributions | | | | | | | | | | | | | | | | | | | |
| Period ended | | Net asset
value,
beginning
of period | | | Net
investment
income | | | Net gains
(losses) on
securities
(both
realized and
unrealized) | | | Total from
investment
operations | | | Dividends
(from net
investment
income) | | | Distributions
(from capital
gains) | | | Total
dividends
and
distributions | | | Net asset
value,
end
of period | | | Total
return2,3 | | | Net assets,
end of period
(in millions) | | | Ratio of
expenses to
average net
assets before
reimbursements/
waivers4 | | | Ratio of
expenses to
average net
assets after
reimbursements/
waivers3,4 | | | Ratio of
net income
to average
net assets3 | |
| Class 529-C: | | | | | | | | | | | | | | | | | | | | | | | | | | | | | | | | | | | | | | | |
| 12/31/2019 | | $ | 12.57 | | | $ | .21 | | | $ | .69 | | | $ | .90 | | | $ | (.20 | ) | | $ | (.18 | ) | | $ | (.38 | ) | | $ | 13.09 | | | | 7.16 | % | | $ | 180 | | | | 1.40 | % | | | 1.40 | % | | | 1.56 | % |
| 12/31/2018 | | | 12.89 | | | | .20 | | | | (.32 | ) | | | (.12 | ) | | | (.20 | ) | | | — | | | | (.20 | ) | | | 12.57 | | | | (.94 | ) | | | 191 | | | | 1.43 | | | | 1.43 | | | | 1.55 | |
| 12/31/2017 | | | 12.72 | | | | .14 | | | | .16 | | | | .30 | | | | (.13 | ) | | | — | | | | (.13 | ) | | | 12.89 | | | | 2.35 | | | | 232 | | | | 1.44 | | | | 1.44 | | | | 1.07 | |
| 12/31/2016 | | | 12.59 | | | | .12 | | | | .12 | | | | .24 | | | | (.11 | ) | | | — | | | | (.11 | ) | | | 12.72 | | | | 1.88 | | | | 322 | | | | 1.45 | | | | 1.45 | | | | .95 | |
| 12/31/2015 | | | 12.81 | | | | .12 | | | | (.20 | ) | | | (.08 | ) | | | (.14 | ) | | | — | | | | (.14 | ) | | | 12.59 | | | | (.63 | ) | | | 337 | | | | 1.46 | | | | 1.46 | | | | .95 | |
| Class 529-E: | | | | | | | | | | | | | | | | | | | | | | | | | | | | | | | | | | | | | | | | | | | | | | | | | | | | |
| 12/31/2019 | | | 12.57 | | | | .28 | | | | .69 | | | | .97 | | | | (.27 | ) | | | (.18 | ) | | | (.45 | ) | | | 13.09 | | | | 7.75 | | | | 46 | | | | .85 | | | | .85 | | | | 2.11 | |
| 12/31/2018 | | | 12.89 | | | | .27 | | | | (.32 | ) | | | (.05 | ) | | | (.27 | ) | | | — | | | | (.27 | ) | | | 12.57 | | | | (.40 | ) | | | 43 | | | | .88 | | | | .88 | | | | 2.10 | |
| 12/31/2017 | | | 12.72 | | | | .21 | | | | .16 | | | | .37 | | | | (.20 | ) | | | — | | | | (.20 | ) | | | 12.89 | | | | 2.93 | | | | 47 | | | | .88 | | | | .88 | | | | 1.63 | |
| 12/31/2016 | | | 12.59 | | | | .19 | | | | .12 | | | | .31 | | | | (.18 | ) | | | — | | | | (.18 | ) | | | 12.72 | | | | 2.45 | | | | 48 | | | | .90 | | | | .90 | | | | 1.50 | |
| 12/31/2015 | | | 12.81 | | | | .19 | | | | (.20 | ) | | | (.01 | ) | | | (.21 | ) | | | — | | | | (.21 | ) | | | 12.59 | | | | (.08 | ) | | | 48 | | | | .91 | | | | .91 | | | | 1.50 | |
| Class 529-T: | | | | | | | | | | | | | | | | | | | | | | | | | | | | | | | | | | | | | | | | | | | | | | | | | | | | |
| 12/31/2019 | | | 12.57 | | | | .33 | | | | .69 | | | | 1.02 | | | | (.32 | ) | | | (.18 | ) | | | (.50 | ) | | | 13.09 | | | | 8.20 | 5 | | | — | 6 | | | .42 | 5 | | | .42 | 5 | | | 2.51 | 5 |
| 12/31/2018 | | | 12.89 | | | | .32 | | | | (.32 | ) | | | — | 12 | | | (.32 | ) | | | — | | | | (.32 | ) | | | 12.57 | | | | .04 | 5 | | | — | 6 | | | .44 | 5 | | | .44 | 5 | | | 2.54 | 5 |
| 12/31/20177,8 | | | 12.81 | | | | .20 | | | | .07 | | | | .27 | | | | (.19 | ) | | | — | | | | (.19 | ) | | | 12.89 | | | | 2.10 | 5,9 | | | — | 6 | | | .45 | 5,10 | | | .45 | 5,10 | | | 2.08 | 5,10 |
| Class 529-F-1: | | | | | | | | | | | | | | | | | | | | | | | | | | | | | | | | | | | | | | | | | | | | | | | | | | | | |
| 12/31/2019 | | | 12.57 | | | | .34 | | | | .69 | | | | 1.03 | | | | (.33 | ) | | | (.18 | ) | | | (.51 | ) | | | 13.09 | | | | 8.20 | | | | 128 | | | | .42 | | | | .42 | | | | 2.53 | |
| 12/31/2018 | | | 12.89 | | | | .32 | | | | (.32 | ) | | | — | 12 | | | (.32 | ) | | | — | | | | (.32 | ) | | | 12.57 | | | | .03 | | | | 102 | | | | .44 | | | | .44 | | | | 2.54 | |
| 12/31/2017 | | | 12.72 | | | | .27 | | | | .16 | | | | .43 | | | | (.26 | ) | | | — | | | | (.26 | ) | | | 12.89 | | | | 3.37 | | | | 88 | | | | .45 | | | | .45 | | | | 2.06 | |
| 12/31/2016 | | | 12.59 | | | | .25 | | | | .12 | | | | .37 | | | | (.24 | ) | | | — | | | | (.24 | ) | | | 12.72 | | | | 2.89 | | | | 77 | | | | .46 | | | | .46 | | | | 1.94 | |
| 12/31/2015 | | | 12.81 | | | | .25 | | | | (.20 | ) | | | .05 | | | | (.27 | ) | | | — | | | | (.27 | ) | | | 12.59 | | | | .36 | | | | 71 | | | | .47 | | | | .47 | | | | 1.94 | |
| Class R-1: | | | | | | | | | | | | | | | | | | | | | | | | | | | | | | | | | | | | | | | | | | | | | | | | | | | | |
| 12/31/2019 | | | 12.57 | | | | .21 | | | | .69 | | | | .90 | | | | (.20 | ) | | | (.18 | ) | | | (.38 | ) | | | 13.09 | | | | 7.21 | | | | 39 | | | | 1.35 | | | | 1.35 | | | | 1.61 | |
| 12/31/2018 | | | 12.89 | | | | .20 | | | | (.32 | ) | | | (.12 | ) | | | (.20 | ) | | | — | | | | (.20 | ) | | | 12.57 | | | | (.89 | ) | | | 30 | | | | 1.37 | | | | 1.37 | | | | 1.60 | |
| 12/31/2017 | | | 12.72 | | | | .15 | | | | .16 | | | | .31 | | | | (.14 | ) | | | — | | | | (.14 | ) | | | 12.89 | | | | 2.43 | | | | 34 | | | | 1.37 | | | | 1.37 | | | | 1.14 | |
| 12/31/2016 | | | 12.59 | | | | .13 | | | | .12 | | | | .25 | | | | (.12 | ) | | | — | | | | (.12 | ) | | | 12.72 | | | | 1.97 | | | | 42 | | | | 1.37 | | | | 1.37 | | | | 1.03 | |
| 12/31/2015 | | | 12.81 | | | | .13 | | | | (.20 | ) | | | (.07 | ) | | | (.15 | ) | | | — | | | | (.15 | ) | | | 12.59 | | | | (.53 | ) | | | 47 | | | | 1.36 | | | | 1.36 | | | | 1.05 | |
| Class R-2: | | | | | | | | | | | | | | | | | | | | | | | | | | | | | | | | | | | | | | | | | | | | | | | | | | | | |
| 12/31/2019 | | | 12.57 | | | | .22 | | | | .69 | | | | .91 | | | | (.21 | ) | | | (.18 | ) | | | (.39 | ) | | | 13.09 | | | | 7.22 | | | | 410 | | | | 1.34 | | | | 1.34 | | | | 1.61 | |
| 12/31/2018 | | | 12.89 | | | | .20 | | | | (.32 | ) | | | (.12 | ) | | | (.20 | ) | | | — | | | | (.20 | ) | | | 12.57 | | | | (.88 | ) | | | 400 | | | | 1.36 | | | | 1.36 | | | | 1.61 | |
| 12/31/2017 | | | 12.72 | | | | .15 | | | | .16 | | | | .31 | | | | (.14 | ) | | | — | | | | (.14 | ) | | | 12.89 | | | | 2.44 | | | | 456 | | | | 1.36 | | | | 1.36 | | | | 1.15 | |
| 12/31/2016 | | | 12.59 | | | | .13 | | | | .12 | | | | .25 | | | | (.12 | ) | | | — | | | | (.12 | ) | | | 12.72 | | | | 1.98 | | | | 514 | | | | 1.35 | | | | 1.35 | | | | 1.05 | |
| 12/31/2015 | | | 12.81 | | | | .14 | | | | (.20 | ) | | | (.06 | ) | | | (.16 | ) | | | — | | | | (.16 | ) | | | 12.59 | | | | (.51 | ) | | | 545 | | | | 1.34 | | | | 1.34 | | | | 1.07 | |
| Class R-2E: | | | | | | | | | | | | | | | | | | | | | | | | | | | | | | | | | | | | | | | | | | | | | | | | | | | | |
| 12/31/2019 | | | 12.57 | | | | .25 | | | | .69 | | | | .94 | | | | (.24 | ) | | | (.18 | ) | | | (.42 | ) | | | 13.09 | | | | 7.53 | | | | 33 | | | | 1.05 | | | | 1.05 | | | | 1.90 | |
| 12/31/2018 | | | 12.89 | | | | .24 | | | | (.32 | ) | | | (.08 | ) | | | (.24 | ) | | | — | | | | (.24 | ) | | | 12.57 | | | | (.59 | ) | | | 26 | | | | 1.07 | | | | 1.07 | | | | 1.92 | |
| 12/31/2017 | | | 12.72 | | | | .19 | | | | .16 | | | | .35 | | | | (.18 | ) | | | — | | | | (.18 | ) | | | 12.89 | | | | 2.75 | | | | 20 | | | | 1.06 | | | | 1.06 | | | | 1.48 | |
| 12/31/2016 | | | 12.59 | | | | .17 | | | | .12 | | | | .29 | | | | (.16 | ) | | | — | | | | (.16 | ) | | | 12.72 | | | | 2.31 | | | | 9 | | | | 1.05 | | | | 1.05 | | | | 1.36 | |
| 12/31/2015 | | | 12.81 | | | | .18 | | | | (.19 | ) | | | (.01 | ) | | | (.21 | ) | | | — | | | | (.21 | ) | | | 12.59 | | | | (.07 | ) | | | 1 | | | | .96 | | | | .96 | | | | 1.41 | |
See end of table for footnotes.
| The Bond Fund of America | 31 |
Financial highlights(continued)
| | | | | | Income (loss) from
investment operations1 | | | Dividends and distributions | | | | | | | | | | | | | | | | | | | |
| Period ended | | Net asset
value,
beginning
of period | | | Net
investment
income | | | Net gains
(losses) on
securities
(both
realized and
unrealized) | | | Total from
investment
operations | | | Dividends
(from net
investment
income) | | | Distributions
(from capital
gains) | | | Total
dividends
and
distributions | | | Net asset
value,
end
of period | | | Total
return2,3 | | | Net assets,
end of period
(in millions) | | | Ratio of
expenses to
average net
assets before
reimbursements/
waivers4 | | | Ratio of
expenses to
average net
assets after
reimbursements/
waivers3,4 | | | Ratio of
net income
to average
net assets3 | |
| Class R-3: | | | | | | | | | | | | | | | | | | | | | | | | | | | | | | | | | | | | | | | |
| 12/31/2019 | | $ | 12.57 | | | $ | .27 | | | $ | .69 | | | $ | .96 | | | $ | (.26 | ) | | $ | (.18 | ) | | $ | (.44 | ) | | $ | 13.09 | | | | 7.70 | % | | $ | 633 | | | | .89 | % | | | .89 | % | | | 2.06 | % |
| 12/31/2018 | | | 12.89 | | | | .26 | | | | (.32 | ) | | | (.06 | ) | | | (.26 | ) | | | — | | | | (.26 | ) | | | 12.57 | | | | (.43 | ) | | | 582 | | | | .91 | | | | .91 | | | | 2.06 | |
| 12/31/2017 | | | 12.72 | | | | .21 | | | | .16 | | | | .37 | | | | (.20 | ) | �� | | — | | | | (.20 | ) | | | 12.89 | | | | 2.90 | | | | 622 | | | | .91 | | | | .91 | | | | 1.61 | |
| 12/31/2016 | | | 12.59 | | | | .19 | | | | .12 | | | | .31 | | | | (.18 | ) | | | — | | | | (.18 | ) | | | 12.72 | | | | 2.43 | | | | 651 | | | | .91 | | | | .91 | | | | 1.49 | |
| 12/31/2015 | | | 12.81 | | | | .19 | | | | (.20 | ) | | | (.01 | ) | | | (.21 | ) | | | — | | | | (.21 | ) | | | 12.59 | | | | (.08 | ) | | | 662 | | | | .91 | | | | .91 | | | | 1.50 | |
| Class R-4: | | | | | | | | | | | | | | | | | | | | | | | | | | | | | | | | | | | | | | | | | | | | | | | | | | | | |
| 12/31/2019 | | | 12.57 | | | | .31 | | | | .69 | | | | 1.00 | | | | (.30 | ) | | | (.18 | ) | | | (.48 | ) | | | 13.09 | | | | 8.03 | | | | 567 | | | | .59 | | | | .59 | | | | 2.37 | |
| 12/31/2018 | | | 12.89 | | | | .30 | | | | (.32 | ) | | | (.02 | ) | | | (.30 | ) | | | — | | | | (.30 | ) | | | 12.57 | | | | (.13 | ) | | | 518 | | | | .61 | | | | .61 | | | | 2.37 | |
| 12/31/2017 | | | 12.72 | | | | .25 | | | | .16 | | | | .41 | | | | (.24 | ) | | | — | | | | (.24 | ) | | | 12.89 | | | | 3.22 | | | | 583 | | | | .60 | | | | .60 | | | | 1.91 | |
| 12/31/2016 | | | 12.59 | | | | .23 | | | | .12 | | | | .35 | | | | (.22 | ) | | | — | | | | (.22 | ) | | | 12.72 | | | | 2.75 | | | | 556 | | | | .60 | | | | .60 | | | | 1.80 | |
| 12/31/2015 | | | 12.81 | | | | .23 | | | | (.20 | ) | | | .03 | | | | (.25 | ) | | | — | | | | (.25 | ) | | | 12.59 | | | | .24 | | | | 512 | | | | .59 | | | | .59 | | | | 1.82 | |
| Class R-5E: | | | | | | | | | | | | | | | | | | | | | | | | | | | | | | | | | | | | | | | | | | | | | | | | | | | | |
| 12/31/2019 | | | 12.57 | | | | .34 | | | | .69 | | | | 1.03 | | | | (.33 | ) | | | (.18 | ) | | | (.51 | ) | | | 13.09 | | | | 8.25 | | | | 43 | | | | .37 | | | | .37 | | | | 2.53 | |
| 12/31/2018 | | | 12.89 | | | | .33 | | | | (.32 | ) | | | .01 | | | | (.33 | ) | | | — | | | | (.33 | ) | | | 12.57 | | | | .09 | | | | 8 | | | | .40 | | | | .40 | | | | 2.63 | |
| 12/31/2017 | | | 12.72 | | | | .27 | | | | .16 | | | | .43 | | | | (.26 | ) | | | — | | | | (.26 | ) | | | 12.89 | | | | 3.39 | | | | — | 6 | | | .42 | | | | .40 | | | | 2.11 | |
| 12/31/2016 | | | 12.59 | | | | .25 | | | | .12 | | | | .37 | | | | (.24 | ) | | | — | | | | (.24 | ) | | | 12.72 | | | | 2.89 | | | | — | 6 | | | .47 | | | | .47 | | | | 1.91 | |
| 12/31/20157,13 | | | 12.66 | | | | .03 | | | | (.06 | ) | | | (.03 | ) | | | (.04 | ) | | | — | | | | (.04 | ) | | | 12.59 | | | | (.24 | )9 | | | — | 6 | | | .05 | 9 | | | .05 | 9 | | | .22 | 9 |
| Class R-5: | | | | | | | | | | | | | | | | | | | | | | | | | | | | | | | | | | | | | | | | | | | | | | | | | | | | |
| 12/31/2019 | | | 12.57 | | | | .35 | | | | .69 | | | | 1.04 | | | | (.34 | ) | | | (.18 | ) | | | (.52 | ) | | | 13.09 | | | | 8.35 | | | | 173 | | | | .29 | | | | .29 | | | | 2.67 | |
| 12/31/2018 | | | 12.89 | | | | .34 | | | | (.32 | ) | | | .02 | | | | (.34 | ) | | | — | | | | (.34 | ) | | | 12.57 | | | | .17 | | | | 163 | | | | .31 | | | | .31 | | | | 2.67 | |
| 12/31/2017 | | | 12.72 | | | | .29 | | | | .16 | | | | .45 | | | | (.28 | ) | | | — | | | | (.28 | ) | | | 12.89 | | | | 3.52 | | | | 176 | | | | .30 | | | | .30 | | | | 2.21 | |
| 12/31/2016 | | | 12.59 | | | | .27 | | | | .12 | | | | .39 | | | | (.26 | ) | | | — | | | | (.26 | ) | | | 12.72 | | | | 3.05 | | | | 149 | | | | .31 | | | | .31 | | | | 2.13 | |
| 12/31/2015 | | | 12.81 | | | | .27 | | | | (.20 | ) | | | .07 | | | | (.29 | ) | | | — | | | | (.29 | ) | | | 12.59 | | | | .54 | | | | 206 | | | | .30 | | | | .30 | | | | 2.11 | |
| Class R-6: | | | | | | | | | | | | | | | | | | | | | | | | | | | | | | | | | | | | | | | | | | | | | | | | | | | | |
| 12/31/2019 | | | 12.57 | | | | .36 | | | | .69 | | | | 1.05 | | | | (.35 | ) | | | (.18 | ) | | | (.53 | ) | | | 13.09 | | | | 8.40 | | | | 10,434 | | | | .24 | | | | .24 | | | | 2.72 | |
| 12/31/2018 | | | 12.89 | | | | .34 | | | | (.32 | ) | | | .02 | | | | (.34 | ) | | | — | | | | (.34 | ) | | | 12.57 | | | | .22 | | | | 8,116 | | | | .26 | | | | .26 | | | | 2.73 | |
| 12/31/2017 | | | 12.72 | | | | .29 | | | | .16 | | | | .45 | | | | (.28 | ) | | | — | | | | (.28 | ) | | | 12.89 | | | | 3.58 | | | | 6,351 | | | | .25 | | | | .25 | | | | 2.27 | |
| 12/31/2016 | | | 12.59 | | | | .27 | | | | .12 | | | | .39 | | | | (.26 | ) | | | — | | | | (.26 | ) | | | 12.72 | | | | 3.11 | | | | 3,849 | | | | .25 | | | | .25 | | | | 2.15 | |
| 12/31/2015 | | | 12.81 | | | | .28 | | | | (.20 | ) | | | .08 | | | | (.30 | ) | | | — | | | | (.30 | ) | | | 12.59 | | | | .58 | | | | 2,710 | | | | .25 | | | | .25 | | | | 2.16 | |
| | | Year ended December 31, |
| Portfolio turnover rate for all share classes14,15 | | 2019 | | 2018 | | 2017 | | 2016 | | 2015 |
| Excluding mortgage dollar roll transactions | | 127% | | 121% | | 170% | | 168% | | 151% |
| Including mortgage dollar roll transactions | | 286% | | 356% | | 379% | | 363% | | 401% |
| 1 | Based on average shares outstanding. |
| 2 | Total returns exclude any applicable sales charges, including contingent deferred sales charges. |
| 3 | This column reflects the impact, if any, of certain reimbursements/waivers from CRMC and/or the fund’s transfer agent. During some of the periods shown, CRMC reimbursed a portion of the fund’s transfer agent services fees for certain share classes. In addition, during one of the years shown, the fund’s transfer agent waived a portion of the fund’s transfer agent services fees for Class F-3 shares. |
| 4 | Ratios do not include expenses of any Central Funds. The fund indirectly bears its proportionate share of the expenses of any Central Funds. |
| 5 | All or a significant portion of assets in this class consisted of seed capital invested by CRMC and/or its affiliates. Fees for distribution services are not charged or accrued on these seed capital assets. If such fees were paid by the fund on seed capital assets, fund expenses would have been higher and net income and total return would have been lower. |
| 6 | Amount less than $1 million. |
| 7 | Based on operations for a period that is less than a full year. |
| 8 | Class T and 529-T shares began investment operations on April 7, 2017. |
| 9 | Not annualized. |
| 10 | Annualized. |
| 11 | Class F-3 shares began investment operations on January 27, 2017. |
| 12 | Amount less than $.01. |
| 13 | Class R-5E shares began investment operations on November 20, 2015. |
| 14 | Rates do not include the fund’s portfolio activity with respect to any Central Funds. |
| 15 | Refer to Note 5 for more information on mortgage dollar rolls. |
See notes to financial statements.
| 32 | The Bond Fund of America |
Report of Independent Registered Public Accounting Firm
To the Shareholders and Board of Trustees of The Bond Fund of America:
Opinion on the Financial Statements and Financial Highlights
We have audited the accompanying statement of assets and liabilities of The Bond Fund of America (the “Fund”), including the summary investment portfolio, as of December 31, 2019, the related statement of operations for the year then ended, the statements of changes in net assets for each of the two years in the period then ended, the financial highlights for each of the five years in the period then ended, and the related notes. In our opinion, the financial statements and financial highlights present fairly, in all material respects, the financial position of the Fund as of December 31, 2019, and the results of its operations for the year then ended, the changes in its net assets for each of the two years in the period then ended, and the financial highlights for each of the five years in the period then ended, in conformity with accounting principles generally accepted in the United States of America.
Basis for Opinion
These financial statements and financial highlights are the responsibility of the Fund’s management. Our responsibility is to express an opinion on the Fund’s financial statements and financial highlights based on our audits. We are a public accounting firm registered with the Public Company Accounting Oversight Board (United States) (PCAOB) and are required to be independent with respect to the Fund in accordance with the U.S. federal securities laws and the applicable rules and regulations of the Securities and Exchange Commission and the PCAOB.
We conducted our audits in accordance with the standards of the PCAOB. Those standards require that we plan and perform the audit to obtain reasonable assurance about whether the financial statements and financial highlights are free of material misstatement, whether due to error or fraud. The Fund is not required to have, nor were we engaged to perform, an audit of its internal control over financial reporting. As part of our audits we are required to obtain an understanding of internal control over financial reporting but not for the purpose of expressing an opinion on the effectiveness of the Fund’s internal control over financial reporting. Accordingly, we express no such opinion.
Our audits included performing procedures to assess the risks of material misstatement of the financial statements and financial highlights, whether due to error or fraud, and performing procedures that respond to those risks. Such procedures included examining, on a test basis, evidence regarding the amounts and disclosures in the financial statements and financial highlights. Our audits also included evaluating the accounting principles used and significant estimates made by management, as well as evaluating the overall presentation of the financial statements and financial highlights. Our procedures included confirmation of securities owned as of December 31, 2019, by correspondence with the custodian and brokers; when replies were not received from brokers, we performed other auditing procedures. We believe that our audits provide a reasonable basis for our opinion.
Deloitte & Touche LLP
Costa Mesa, California
February 11, 2020
We have served as the auditor of one or more American Funds investment companies since 1956.
| The Bond Fund of America | 33 |
As a fund shareholder, you incur two types of costs: (1) transaction costs, such as initial sales charges on purchase payments and contingent deferred sales charges on redemptions (loads), and (2) ongoing costs, including management fees, distribution and service (12b-1) fees, and other expenses. This example is intended to help you understand your ongoing costs (in dollars) of investing in the fund so you can compare these costs with the ongoing costs of investing in other mutual funds. The example is based on an investment of $1,000 invested at the beginning of the period and held for the entire six-month period (July 1, 2019, through December 31, 2019).
Actual expenses:
The first line of each share class in the table on the following page provides information about actual account values and actual expenses. You may use the information in this line, together with the amount you invested, to estimate the expenses that you paid over the period. Simply divide your account value by $1,000 (for example, an $8,600 account value divided by $1,000 = 8.6), then multiply the result by the number in the first line under the heading titled “Expenses paid during period” to estimate the expenses you paid on your account during this period.
Hypothetical example for comparison purposes:
The second line of each share class in the table on the following page provides information about hypothetical account values and hypothetical expenses based on the actual expense ratio for the share class and an assumed rate of return of 5.00% per year before expenses, which is not the actual return of the share class. The hypothetical account values and expenses may not be used to estimate the actual ending account balance or expenses you paid for the period. You may use this information to compare the ongoing costs of investing in the fund and other funds. To do so, compare this 5.00% hypothetical example with the 5.00% hypothetical examples that appear in the shareholder reports of the other funds.
Notes:
Retirement plan participants may be subject to certain fees charged by the plan sponsor, and Class F-1, F-2, F-3 and 529-F-1 shareholders may be subject to fees charged by financial intermediaries, typically ranging from 0.75% to 1.50% of assets annually depending on services offered. You can estimate the impact of these fees by adding the amount of the fees to the total estimated expenses you paid on your account during the period as calculated above. In addition, your ending account value would be lower by the amount of these fees.
Note that the expenses shown in the table on the following page are meant to highlight your ongoing costs only and do not reflect any transactional costs, such as sales charges (loads). Therefore, the second line of each share class in the table is useful in comparing ongoing costs only and will not help you determine the relative total costs of owning different funds. In addition, if these transactional costs were included, your costs would have been higher.
| 34 | The Bond Fund of America |
| | | Beginning
account value
7/1/2019 | | | Ending
account value
12/31/2019 | | | Expenses paid
during period* | | | Annualized
expense ratio | |
| Class A – actual return | | $ | 1,000.00 | | | $ | 1,019.23 | | | $ | 3.05 | | | | .60 | % |
| Class A – assumed 5% return | | | 1,000.00 | | | | 1,022.18 | | | | 3.06 | | | | .60 | |
| Class C – actual return | | | 1,000.00 | | | | 1,015.42 | | | | 6.81 | | | | 1.34 | |
| Class C – assumed 5% return | | | 1,000.00 | | | | 1,018.45 | | | | 6.82 | | | | 1.34 | |
| Class T – actual return | | | 1,000.00 | | | | 1,020.42 | | | | 1.83 | | | | .36 | |
| Class T – assumed 5% return | | | 1,000.00 | | | | 1,023.39 | | | | 1.84 | | | | .36 | |
| Class F-1 – actual return | | | 1,000.00 | | | | 1,019.12 | | | | 3.16 | | | | .62 | |
| Class F-1 – assumed 5% return | | | 1,000.00 | | | | 1,022.08 | | | | 3.16 | | | | .62 | |
| Class F-2 – actual return | | | 1,000.00 | | | | 1,020.52 | | | | 1.73 | | | | .34 | |
| Class F-2 – assumed 5% return | | | 1,000.00 | | | | 1,023.49 | | | | 1.73 | | | | .34 | |
| Class F-3 – actual return | | | 1,000.00 | | | | 1,021.10 | | | | 1.17 | | | | .23 | |
| Class F-3 – assumed 5% return | | | 1,000.00 | | | | 1,024.05 | | | | 1.17 | | | | .23 | |
| Class 529-A – actual return | | | 1,000.00 | | | | 1,018.98 | | | | 3.26 | | | | .64 | |
| Class 529-A – assumed 5% return | | | 1,000.00 | | | | 1,021.98 | | | | 3.26 | | | | .64 | |
| Class 529-C – actual return | | | 1,000.00 | | | | 1,015.22 | | | | 7.01 | | | | 1.38 | |
| Class 529-C – assumed 5% return | | | 1,000.00 | | | | 1,018.25 | | | | 7.02 | | | | 1.38 | |
| Class 529-E – actual return | | | 1,000.00 | | | | 1,018.04 | | | | 4.22 | | | | .83 | |
| Class 529-E – assumed 5% return | | | 1,000.00 | | | | 1,021.02 | | | | 4.23 | | | | .83 | |
| Class 529-T – actual return | | | 1,000.00 | | | | 1,020.12 | | | | 2.09 | | | | .41 | |
| Class 529-T – assumed 5% return | | | 1,000.00 | | | | 1,023.14 | | | | 2.09 | | | | .41 | |
| Class 529-F-1 – actual return | | | 1,000.00 | | | | 1,020.23 | | | | 2.04 | | | | .40 | |
| Class 529-F-1 – assumed 5% return | | | 1,000.00 | | | | 1,023.19 | | | | 2.04 | | | | .40 | |
| Class R-1 – actual return | | | 1,000.00 | | | | 1,015.44 | | | | 6.81 | | | | 1.34 | |
| Class R-1 – assumed 5% return | | | 1,000.00 | | | | 1,018.45 | | | | 6.82 | | | | 1.34 | |
| Class R-2 – actual return | | | 1,000.00 | | | | 1,015.42 | | | | 6.81 | | | | 1.34 | |
| Class R-2 – assumed 5% return | | | 1,000.00 | | | | 1,018.45 | | | | 6.82 | | | | 1.34 | |
| Class R-2E – actual return | | | 1,000.00 | | | | 1,016.96 | | | | 5.29 | | | | 1.04 | |
| Class R-2E – assumed 5% return | | | 1,000.00 | | | | 1,019.96 | | | | 5.30 | | | | 1.04 | |
| Class R-3 – actual return | | | 1,000.00 | | | | 1,017.76 | | | | 4.48 | | | | .88 | |
| Class R-3 – assumed 5% return | | | 1,000.00 | | | | 1,020.77 | | | | 4.48 | | | | .88 | |
| Class R-4 – actual return | | | 1,000.00 | | | | 1,019.31 | | | | 2.95 | | | | .58 | |
| Class R-4 – assumed 5% return | | | 1,000.00 | | | | 1,022.28 | | | | 2.96 | | | | .58 | |
| Class R-5E – actual return | | | 1,000.00 | | | | 1,020.40 | | | | 1.83 | | | | .36 | |
| Class R-5E – assumed 5% return | | | 1,000.00 | | | | 1,023.39 | | | | 1.84 | | | | .36 | |
| Class R-5 – actual return | | | 1,000.00 | | | | 1,020.86 | | | | 1.43 | | | | .28 | |
| Class R-5 – assumed 5% return | | | 1,000.00 | | | | 1,023.79 | | | | 1.43 | | | | .28 | |
| Class R-6 – actual return | | | 1,000.00 | | | | 1,021.14 | | | | 1.12 | | | | .22 | |
| Class R-6 – assumed 5% return | | | 1,000.00 | | | | 1,024.10 | | | | 1.12 | | | | .22 | |
| | |
| * | The “expenses paid during period” are equal to the “annualized expense ratio,” multiplied by the average account value over the period, multiplied by the number of days in the period, and divided by 365 (to reflect the one-half year period). |
| | |
| The Bond Fund of America | 35 |
We are required to advise you of the federal tax status of certain distributions received by shareholders during the fiscal year. The fund hereby designates the following amounts for the fund’s fiscal year ended December 31, 2019:
| Long-term capital gains | | | $364,582,000 |
| Qualified dividend income | | | $2,739,000 |
| Corporate dividends received deduction | | | $1,658,000 |
| U.S. government income that may be exempt from state taxation | | | $376,451,000 |
Individual shareholders should refer to their Form 1099 or other tax information, which was mailed in January 2020, to determine thecalendar yearamounts to be included on their 2019 tax returns. Shareholders should consult their tax advisors.
| 36 | The Bond Fund of America |
Liquidity Risk Management Program
The fund has adopted a liquidity risk management program (the “program”). The fund’s board has designated Capital Research and Management Company (“CRMC”) as the administrator of the program. Personnel of CRMC or its affiliates conduct the day-to-day operation of the program pursuant to policies and procedures administered by the Capital Group Liquidity Risk Management Committee.
Under the program, CRMC manages the fund’s liquidity risk, which is the risk that the fund could not meet shareholder redemption requests without significant dilution of remaining shareholders’ interests in the fund. This risk is managed by monitoring the degree of liquidity of the fund’s investments, limiting the amount of the fund’s illiquid investments, and utilizing various risk management tools and facilities available to the fund for meeting shareholder redemptions, among other means. CRMC’s process of determining the degree of liquidity of the fund’s investments is supported by one or more third-party liquidity assessment vendors.
The fund’s board reviewed a report prepared by CRMC regarding the operation and effectiveness of the program for the periodDecember 1, 2018, through September 30, 2019. No significant liquidity events impacting the fund were noted in the report. In addition, CRMC provided its assessment that the program had been effective in managing the fund’s liquidity risk.
| The Bond Fund of America | 37 |
This page was intentionally left blank.
| 38 | The Bond Fund of America |
This page was intentionally left blank.
| The Bond Fund of America | 39 |
This page was intentionally left blank.
| 40 | The Bond Fund of America |
This page was intentionally left blank.
| The Bond Fund of America | 41 |
This page was intentionally left blank.
| 42 | The Bond Fund of America |
Board of trustees and other officers
Independent trustees1
Name, Date of Birth and Position
with Fund | | Year First
Elected as
a Director/
Trustee2 | | Principal Occupation(s) During the Past Five Years | | Number of
Portfolios
Overseen by
Trustee | | Other Directorships3Held
by Trustee During the Past
Five Years |
| William H. Baribault, 1945 | | 2010 | | Chairman of the Board and CEO, Oakwood Advisors (private investment and consulting); former CEO and President, Richard Nixon Foundation | | 89 | | General Finance Corporation |
| James G. Ellis, 1947 | | 2006 | | Professor of Marketing and former Dean, Marshall School of Business, University of Southern California | | 99 | | Mercury General Corporation |
| Nariman Farvardin, 1956 | | 2018 | | President, Stevens Institute of Technology | | 86 | | None |
| Mary Davis Holt, 1950 | | 2015-2016;
2017 | | Principal, Mary Davis Holt Enterprises, LLC (leadership development consulting); former Partner, Flynn Heath Holt Leadership, LLC (leadership consulting); former COO, Time Life Inc. (1993–2003) | | 86 | | None |
| R. Clark Hooper, 1946 | | 2005 | | Private investor | | 89 | | None |
| Merit E. Janow, 1958 | | 2010 | | Dean and Professor, Columbia University, School of International and Public Affairs | | 88 | | Mastercard Incorporated; Trimble Inc. |
Margaret Spellings, 1957
Chairman of the Board
(Independent and Non-Executive) |
| 2010 |
| CEO, Texas 2036; former President, Margaret Spellings & Company(public policy and strategic consulting); former President, The University of North Carolina; former President, George W. Bush Foundation |
| 90 |
| None |
| Alexandra Trower, 1964 | | 2019 | | Executive Vice President, Global Communications and Corporate Officer, The Estée Lauder Companies | | 85 | | None |
Interested trustees4,5
Name, Date of Birth and Position
with Fund | | Year First
Elected as
a Director/
Trustee/
Officer2 | | Principal Occupation(s) During the Past Five Years and
Positions Held with Affiliated Entities or the Principal
Underwriter of the Fund | | Number of
Portfolios
Overseen by
Trustee | | Other Directorships3Held
by Trustee During the Past
Five Years |
| Michael C. Gitlin, 1970 | | 2015 | | Vice Chairman and Director, Capital Research and Management Company; Partner — Capital Fixed Income Investors, Capital Research and Management Company; Director, The Capital Group Companies, Inc.; served as Head of Fixed Income at a large investment management firm prior to joining Capital Research and Management Company in 2015 | | 85 | | None |
| Karl J. Zeile, 1966 | | 2019 | | Partner — Capital Fixed Income Investors, Capital Research and Management Company | | 20 | | None |
The fund’s statement of additional information includes further details about fund trustees and is available without charge upon request by calling American Funds Service Company at (800) 421-4225 or by visiting the Capital Group website at capitalgroup.com. The address for all trustees and officers of the fund is 333 South Hope Street, Los Angeles, CA 90071, Attention: Secretary.
See page 44 for footnotes.
| The Bond Fund of America | 43 |
Other officers5
Name, year of birth and
position with fund | | Year first elected
an officer of the
fund2 | | Principal occupation(s) during past five years and positions held with affiliated entities or the Principal
Underwriter of the fund |
Pramod Atluri, 1976
President | | 2016 | | Partner — Capital Fixed Income Investors, Capital Research and Management Company; Vice President — Capital Fixed Income Investors, Capital Bank and Trust Company6 |
Kristine M. Nishiyama, 1970
Executive Vice President | | 2003 | | Senior Vice President and Senior Counsel — Fund Business Management Group, Capital Research and Management Company; Chair, Senior Vice President, General Counsel and Director, Capital Bank and Trust Company6 |
David J. Betanzos, 1974
Senior Vice President | | 2016 | | Partner — Capital Fixed Income Investors, Capital Research and Management Company; Director, Capital Research and Management Company |
David A. Hoag, 1965
Senior Vice President | | 2015 | | Partner — Capital Fixed Income Investors, Capital Bank and Trust Company6; Partner — Capital Fixed Income Investors, Capital Research and Management Company |
David S. Lee, 1972
Senior Vice President | | 2018 | | Partner — Capital Fixed Income Investors, Capital Research and Management Company; Partner — Capital Fixed Income Investors, Capital Bank and Trust Company6 |
Fergus N. MacDonald, 1969
Senior Vice President | | 2015 | | Partner — Capital Fixed Income Investors, Capital Research and Management Company; Director, The Capital Group Companies, Inc.6 |
Robert H. Neithart, 1965
Senior Vice President | | 2011 | | Partner — Capital Fixed Income Investors, Capital Research and Management Company; Partner — Capital Fixed Income Investors, Capital Bank and Trust Company6; Chairman of the Board, Capital Strategy Research, Inc.6 |
Steven I. Koszalka, 1964
Secretary | | 2010 | | Vice President — Fund Business Management Group, Capital Research and Management Company |
Brian C. Janssen, 1972
Treasurer | | 2011 | | Vice President — Investment Operations, Capital Research and Management Company |
Jane Y. Chung, 1974
Assistant Secretary | | 2014 | | Associate — Fund Business Management Group, Capital Research and Management Company |
Sandra Chuon, 1972
Assistant Treasurer | | 2019 | | Assistant Vice President — Investment Operations, Capital Research and Management Company |
Gregory F. Niland, 1971
Assistant Treasurer | | 2015 | | Vice President — Investment Operations, Capital Research and Management Company |
| | |
| 1 | The term independent trustee refers to a trustee who is not an “interested person” of the fund within the meaning of the Investment Company Act of 1940. |
| 2 | Trustees and officers of the fund serve until their resignation, removal or retirement. |
| 3 | This includes all directorships/trusteeships (other than those in the American Funds or other funds managed by Capital Research and Management Company or its affiliates) that are held by each trustee as a trustee or director of a public company or a registered investment company. |
| 4 | The term interested trustee refers to a trustee who is an “interested person” within the meaning of the Investment Company Act of 1940, on the basis of their affiliation with the fund’s investment adviser, Capital Research and Management Company, or affiliated entities (including the fund’s principal underwriter). |
| 5 | All of the trustees and/or officers listed are officers and/or directors/trustees of one or more of the other funds for which Capital Research and Management Company serves as investment adviser. |
| 6 | Company affiliated with Capital Research and Management Company. |
| | |
| 44 | The Bond Fund of America |
Office of the fund
333 South Hope Street
Los Angeles, CA 90071-1406
Investment adviser
Capital Research and Management Company
333 South Hope Street
Los Angeles, CA 90071-1406
Transfer agent for shareholder accounts
American Funds Service Company
(Write to the address near you.)
P.O. Box 6007
Indianapolis, IN 46206-6007
P.O. Box 2280
Norfolk, VA 23501-2280
Custodian of assets
JPMorgan Chase Bank
270 Park Avenue
New York, NY 10017-2070
Counsel
Morgan, Lewis & Bockius LLP
One Federal Street
Boston, MA 02110-1726
Independent registered public accounting firm
Deloitte & Touche LLP
695 Town Center Drive
Suite 1000
Costa Mesa, CA 92626-7188
Principal underwriter
American Funds Distributors, Inc.
333 South Hope Street
Los Angeles, CA 90071-1406
Investors should carefully consider investment objectives, risks, charges and expenses. This and other important information is contained in the fund prospectus and summary prospectus, which can be obtained from your financial professional and should be read carefully before investing. You may also call American Funds Service Company (AFS) at (800) 421-4225 or visit the Capital Group website at capitalgroup.com.
“American Funds Proxy Voting Procedures and Principles” — which describes how we vote proxies relating to portfolio securities — is available on the American Funds website or upon request by calling AFS. The fund files its proxy voting record with the U.S. Securities and Exchange Commission (SEC) for the 12 months ended June 30 by August 31. The proxy voting record is available free of charge on the SEC website at sec.gov or our website.
A complete December 31, 2019, portfolio of The Bond Fund of America’s investments is available free of charge by calling AFS or visiting the SEC website (where it is part of Form N-CSR).
The Bond Fund of America files a complete list of its portfolio holdings with the SEC for the first and third quarters of each fiscal year on NPORT-P. This filing is available free of charge on the SEC website. Additionally, the list of portfolio holdings is available by calling AFS.
This report is for the information of shareholders of The Bond Fund of America, but it also may be used as sales literature when preceded or accompanied by the current prospectus or summary prospectus, which gives details about charges, expenses, investment objectives and operating policies of the fund. If used as sales material after March 31, 2020, this report must be accompanied by an American Funds statistical update for the most recently completed calendar quarter.
Bloomberg® is a trademark of Bloomberg Finance L.P. (collectively with its affiliates, “Bloomberg”). Barclays® is a trademark of Barclays Bank Plc (collectively with its affiliates, “Barclays”), used under license. Neither Bloomberg nor Barclays approves or endorses this material, guarantees the accuracy or completeness of any information herein and, to the maximum extent allowed by law, neither shall have any liability or responsibility for injury or damages arising in connection therewith.
American Funds Distributors, Inc., member FINRA.
The Capital Advantage®
Since 1931, Capital Group, home of American Funds, has helped investors pursue long-term investment success. Our consistent approach — in combination with The Capital SystemSM— has resulted in superior outcomes.
Aligned with investor success
We base our decisions on a long-term perspective, which we believe aligns our goals with the interests of our clients. Our portfolio managers average 27 years of investment experience, including 20 years at our company, reflecting a career commitment to our long-term approach.1
The Capital System
The Capital System combines individual accountability with teamwork. Funds using The Capital System are divided into portions that are managed independently by investment professionals with diverse backgrounds, ages and investment approaches. An extensive global research effort is the backbone of our system.
American Funds’ superior outcomes
Equity funds have beaten their Lipper peer indexes in 92% of 10-year periods and 99% of 20-year periods.2Fixed income funds have helped investors achieve diversification through attention to correlation between bonds and equities.3Fund management fees have been among the lowest in the industry.4
| | 1 | Portfolio manager experience as of December 31, 2018. |
| | 2 | Based on Class F-2 share results for rolling periods through December 31, 2018. Periods covered are the shorter of the fund’s lifetime or since the comparable Lipper index inception date (except Capital Income Builder and SMALLCAP World Fund, for which the Lipper average was used). Expenses differ for each share class, so results will vary. |
| | 3 | Based on Class F-2 share results, as of December 31, 2018. Fourteen of our 15 American Funds fixed income funds that have been in existence for the three-year period showed a three-year correlation below 0.2. Standard & Poor’s 500 Composite Index was used as an equity market proxy. Correlation based on monthly total returns. Correlation is a statistical measure of how two securities move in relation to each other. A correlation ranges from –1 to 1. A positive correlation close to 1 implies that as one security moves, either up or down, the other security will move in “lockstep,” in the same direction. A negative correlation close to –1 indicates that the securities have moved in the opposite direction. |
| | 4 | On average, our management fees were in the lowest quintile 70% of the time, based on the 20-year period ended December 31, 2018, versus comparable Lipper categories, excluding funds of funds. |
Class F-2 shares were first offered on August 1, 2008. Class F-2 share results prior to the date of first sale are hypothetical based on the results of the original share class of the fund without a sales charge, adjusted for typical estimated expenses. Results for certain funds with an inception date after August 1, 2008, also include hypothetical returns because those funds’ Class F-2 shares sold after the funds’ date of first offering. Please see capitalgroup.com for more information on specific expense adjustments and the actual dates of first sale.
All Capital Group trademarks mentioned are owned by The Capital Group Companies, Inc., an affiliated company or fund. All other company and product names mentioned are the property of their respective companies.

ITEM 2 – Code of Ethics
The Registrant has adopted a Code of Ethics that applies to its Principal Executive Officer and Principal Financial Officer. The Registrant undertakes to provide to any person without charge, upon request, a copy of the Code of Ethics. Such request can be made by calling 800/421-4225 or to the Secretary of the Registrant, 333 South Hope Street, Los Angeles, California 90071.
ITEM 3 – Audit Committee Financial Expert
The Registrant’s board has determined that James G. Ellis, a member of the Registrant’s audit committee, is an “audit committee financial expert” and "independent," as such terms are defined in this Item. This designation will not increase the designee’s duties, obligations or liability as compared to his or her duties, obligations and liability as a member of the audit committee and of the board, nor will it reduce the responsibility of the other audit committee members. There may be other individuals who, through education or experience, would qualify as "audit committee financial experts" if the board had designated them as such. Most importantly, the board believes each member of the audit committee contributes significantly to the effective oversight of the Registrant’s financial statements and condition.
ITEM 4 – Principal Accountant Fees and Services
| a) Audit Fees: | | |
| Audit | 2018 | 31,000 |
| | 2019 | 198,000 |
| | | |
| b) Audit-Related Fees: | | |
| | 2018 | 10,000 |
| | 2019 | 9,000 |
| | | |
| c) Tax Fees: | | |
| | 2018 | 8,000 |
| | 2019 | 13,000 |
| | The tax fees consist of professional services relating to the preparation of the Registrant’s tax returns. | |
| | | |
| d) All Other Fees: | | |
| | 2018 | None |
| | 2019 | None |
| | | |
| | Adviser and affiliates (includes only fees for non-audit services billed to the adviser and affiliates for engagements that relate directly to the operations and financial reporting of the Registrant and were subject to the pre-approval policies described below): | |
| a) Audit Fees: | | |
| | Not Applicable | |
| | | |
| b) Audit-Related Fees: | | |
| | 2018 | 1,117,000 |
| | 2019 | 1,812,000 |
| | The audit-related fees consist of assurance and related services relating to the examination of the Registrant’s transfer agent, principal underwriter and investment adviser conducted in accordance with Statement on Standards for Attestation Engagements Number 18 issued by the American Institute of Certified Public Accountants. | |
| | | |
| c) Tax Fees: | | |
| | 2018 | 8,000 |
| | 2019 | 46,000 |
| | The tax fees consist of consulting services relating to the Registrant’s investments. | |
| | | |
| | | |
| d) All Other Fees: | | |
| | 2018 | None |
| | 2019 | 2,000 |
| | The other fees consist of subscription services related to an accounting research tool. | |
| | | |
| | | |
| | All audit and permissible non-audit services that the Registrant’s audit committee considers compatible with maintaining the independent registered public accounting firm’s independence are required to be pre-approved by the committee. The pre-approval requirement will extend to all non-audit services provided to the Registrant, the investment adviser, and any entity controlling, controlled by, or under common control with the investment adviser that provides ongoing services to the Registrant, if the engagement relates directly to the operations and financial reporting of the Registrant. The committee will not delegate its responsibility to pre-approve these services to the investment adviser. The committee may delegate to one or more committee members the authority to review and pre-approve audit and permissible non-audit services. Actions taken under any such delegation will be reported to the full committee at its next meeting. The pre-approval requirement is waived with respect to non-audit services if certain conditions are met. The pre-approval requirement was not waived for any of the non-audit services listed above provided to the Registrant, adviser and affiliates. | |
| | | |
| Aggregate non-audit fees paid to the Registrant’s auditors, including fees for all services billed to the Registrant, adviser and affiliates that provide ongoing services to the Registrant, were $1,196,000 for fiscal year 2018 and $1,882,000 for fiscal year 2019. The non-audit services represented by these amounts were brought to the attention of the committee and considered to be compatible with maintaining the auditors’ independence. | |
ITEM 5 – Audit Committee of Listed Registrants
Not applicable to this Registrant, insofar as the Registrant is not a listed issuer as defined in Rule 10A-3 under the Securities Exchange Act of 1934.
ITEM 6 – Schedule of Investments
The Bond Fund of America®
Investment portfolio
December 31, 2019
Bonds, notes & other debt instruments 95.88%
U.S. Treasury bonds & notes 42.86%
U.S. Treasury 39.79% | Principal amount
(000) | Value
(000) |
| U.S. Treasury 2.25% 2020 | $2,250 | $2,253 |
| U.S. Treasury 2.50% 2020 | 50,000 | 50,426 |
| U.S. Treasury 2.75% 2020 | 182,000 | 183,514 |
| U.S. Treasury 1.125% 2021 | 500 | 496 |
| U.S. Treasury 1.125% 2021 | —1 | —1 |
| U.S. Treasury 1.50% 2021 | 102,340 | 102,181 |
| U.S. Treasury 1.50% 2021 | 40,000 | 39,945 |
| U.S. Treasury 1.625% 2021 | 232,662 | 232,759 |
| U.S. Treasury 1.625% 2021 | 13,360 | 13,377 |
| U.S. Treasury 1.75% 2021 | 25,177 | 25,253 |
| U.S. Treasury (3-month U.S. Treasury Bill Yield + 0.30%) 1.826% 20212 | 515,888 | 516,708 |
| U.S. Treasury 2.00% 2021 | 3,000 | 3,020 |
| U.S. Treasury 2.00% 2021 | 1,000 | 1,007 |
| U.S. Treasury 2.125% 2021 | 250,000 | 251,832 |
| U.S. Treasury 2.125% 2021 | 93,000 | 93,973 |
| U.S. Treasury 2.50% 20213 | 1,245,000 | 1,257,550 |
| U.S. Treasury 2.50% 2021 | 62,500 | 63,084 |
| U.S. Treasury 1.375% 2022 | 157,000 | 155,964 |
| U.S. Treasury 1.50% 2022 | 255,000 | 254,355 |
| U.S. Treasury 1.625% 2022 | 252,000 | 252,081 |
| U.S. Treasury 1.625% 2022 | 121,757 | 121,819 |
| U.S. Treasury 1.625% 2022 | 91,000 | 91,043 |
| U.S. Treasury 1.75% 2022 | 60,000 | 60,217 |
| U.S. Treasury 1.75% 2022 | 57,000 | 57,201 |
| U.S. Treasury 1.875% 20223 | 371,200 | 373,902 |
| U.S. Treasury 1.875% 2022 | 281,500 | 283,245 |
| U.S. Treasury 1.875% 2022 | 70,000 | 70,423 |
| U.S. Treasury 1.875% 2022 | 50,000 | 50,339 |
| U.S. Treasury 2.00% 2022 | 399,550 | 403,793 |
| U.S. Treasury 2.00% 2022 | 220,460 | 222,876 |
| U.S. Treasury 2.125% 20223 | 460,830 | 467,673 |
| U.S. Treasury 2.125% 2022 | 85,340 | 86,436 |
| U.S. Treasury 1.25% 2023 | 34,400 | 33,947 |
| U.S. Treasury 1.375% 2023 | 72,000 | 71,357 |
| U.S. Treasury 1.375% 2023 | 13,000 | 12,876 |
| U.S. Treasury 1.50% 20233 | 417,860 | 416,251 |
| U.S. Treasury 1.50% 2023 | 44,500 | 44,325 |
| U.S. Treasury 1.625% 2023 | 163,015 | 162,972 |
| U.S. Treasury 1.625% 2023 | 15,000 | 14,995 |
| U.S. Treasury 1.75% 2023 | 47,600 | 47,775 |
| U.S. Treasury 2.125% 2023 | 81,263 | 82,729 |
| U.S. Treasury 2.50% 2023 | 205,735 | 211,971 |
| U.S. Treasury 2.50% 2023 | 57,100 | 58,672 |
| U.S. Treasury 2.625% 2023 | 438,800 | 452,236 |
| U.S. Treasury 2.625% 2023 | 211,578 | 219,512 |
| U.S. Treasury 2.625% 2023 | 15,000 | 15,502 |
The Bond Fund of America — Page 1 of 49
Bonds, notes & other debt instruments (continued)
U.S. Treasury bonds & notes (continued)
U.S. Treasury (continued) | Principal amount
(000) | Value
(000) |
| U.S. Treasury 2.75% 2023 | $270,000 | $279,898 |
| U.S. Treasury 2.75% 2023 | 1,367 | 1,420 |
| U.S. Treasury 2.875% 2023 | 396,200 | 414,184 |
| U.S. Treasury 2.875% 2023 | 242,729 | 253,567 |
| U.S. Treasury 2.875% 2023 | 129,400 | 135,369 |
| U.S. Treasury 1.25% 2024 | 181,500 | 178,061 |
| U.S. Treasury 1.50% 2024 | 436,720 | 433,121 |
| U.S. Treasury 1.50% 2024 | 268,281 | 266,070 |
| U.S. Treasury 1.50% 2024 | 24,235 | 24,041 |
| U.S. Treasury 1.75% 2024 | 320,202 | 321,252 |
| U.S. Treasury 1.75% 2024 | 209,857 | 210,554 |
| U.S. Treasury 1.75% 2024 | 147,483 | 147,967 |
| U.S. Treasury 2.00% 2024 | 723,650 | 733,745 |
| U.S. Treasury 2.00% 2024 | 183,000 | 185,546 |
| U.S. Treasury 2.00% 2024 | 180,000 | 182,524 |
| U.S. Treasury 2.125% 2024 | 550,850 | 561,955 |
| U.S. Treasury 2.125% 2024 | 115,265 | 117,426 |
| U.S. Treasury 2.125% 2024 | 18,000 | 18,371 |
| U.S. Treasury 2.25% 2024 | 172,750 | 177,324 |
| U.S. Treasury 2.25% 2024 | 55,825 | 57,131 |
| U.S. Treasury 2.25% 2024 | 50,633 | 51,859 |
| U.S. Treasury 2.25% 2024 | 33,000 | 33,886 |
| U.S. Treasury 2.375% 2024 | 230,233 | 236,825 |
| U.S. Treasury 2.50% 2024 | 84,000 | 86,940 |
| U.S. Treasury 2.75% 2024 | 50,000 | 52,168 |
| U.S. Treasury 2.00% 2025 | 97,000 | 98,433 |
| U.S. Treasury 2.125% 2025 | 61,750 | 63,041 |
| U.S. Treasury 2.25% 2025 | 35,000 | 35,963 |
| U.S. Treasury 2.50% 2025 | 14,000 | 14,551 |
| U.S. Treasury 2.625% 2025 | 192,822 | 202,253 |
| U.S. Treasury 2.625% 2025 | 146,324 | 153,068 |
| U.S. Treasury 2.75% 20253 | 992,493 | 1,043,944 |
| U.S. Treasury 2.75% 2025 | 31,813 | 33,518 |
| U.S. Treasury 2.875% 2025 | 287,175 | 304,248 |
| U.S. Treasury 1.375% 2026 | 55,000 | 53,511 |
| U.S. Treasury 1.625% 2026 | 227,900 | 225,097 |
| U.S. Treasury 1.625% 2026 | 147,850 | 146,111 |
| U.S. Treasury 1.625% 2026 | 8,466 | 8,360 |
| U.S. Treasury 1.75% 2026 | 215,000 | 213,807 |
| U.S. Treasury 1.875% 2026 | 442,000 | 444,020 |
| U.S. Treasury 1.875% 2026 | 315,013 | 316,588 |
| U.S. Treasury 2.00% 2026 | 15,600 | 15,782 |
| U.S. Treasury 2.125% 2026 | 54,000 | 55,095 |
| U.S. Treasury 2.25% 2026 | 64,385 | 66,173 |
| U.S. Treasury 2.50% 2026 | 24,000 | 25,012 |
| U.S. Treasury 2.625% 2026 | 142,585 | 149,581 |
| U.S. Treasury 2.25% 2027 | 220,486 | 226,805 |
| U.S. Treasury 2.25% 2027 | 68,000 | 69,952 |
| U.S. Treasury 2.25% 2027 | 5,000 | 5,142 |
| U.S. Treasury 2.375% 2027 | 30,000 | 31,125 |
| U.S. Treasury 2.75% 2028 | 25,451 | 27,107 |
| U.S. Treasury 2.875% 2028 | 61,335 | 65,994 |
| U.S. Treasury 2.875% 2028 | 3,760 | 4,051 |
| U.S. Treasury 1.625% 2029 | 391,863 | 381,718 |
The Bond Fund of America — Page 2 of 49
Bonds, notes & other debt instruments (continued)
U.S. Treasury bonds & notes (continued)
U.S. Treasury (continued) | Principal amount
(000) | Value
(000) |
| U.S. Treasury 1.75% 2029 | $585,353 | $576,438 |
| U.S. Treasury 2.375% 2029 | 52,349 | 54,410 |
| U.S. Treasury 2.625% 2029 | 44,500 | 47,198 |
| U.S. Treasury 4.375% 2040 | 22,000 | 29,554 |
| U.S. Treasury 4.625% 2040 | 17,000 | 23,513 |
| U.S. Treasury 4.375% 2041 | 16,000 | 21,581 |
| U.S. Treasury 2.875% 2043 | 3,750 | 4,089 |
| U.S. Treasury 3.00% 20453 | 14,850 | 16,625 |
| U.S. Treasury 2.50% 20463 | 174,762 | 178,578 |
| U.S. Treasury 2.875% 20463 | 19,354 | 21,248 |
| U.S. Treasury 2.75% 20473 | 39,500 | 42,403 |
| U.S. Treasury 3.00% 20473 | 86,916 | 97,742 |
| U.S. Treasury 3.00% 2047 | 13,950 | 15,689 |
| U.S. Treasury 3.00% 20483 | 179,901 | 202,286 |
| U.S. Treasury 3.125% 2048 | 9,510 | 10,951 |
| U.S. Treasury 3.375% 2048 | 5,648 | 6,815 |
| U.S. Treasury 2.25% 2049 | 909,217 | 882,213 |
| U.S. Treasury 2.375% 20493 | 259,800 | 258,948 |
| U.S. Treasury 2.875% 20493 | 263,569 | 290,564 |
| U.S. Treasury 3.00% 20493 | 13,709 | 15,465 |
| | | 20,071,429 |
| U.S. Treasury inflation-protected securities 3.07% | | |
| U.S. Treasury Inflation-Protected Security 0.625% 20234 | 230,711 | 234,379 |
| U.S. Treasury Inflation-Protected Security 0.125% 20244 | 44,732 | 45,020 |
| U.S. Treasury Inflation-Protected Security 0.50% 20244 | 290,375 | 295,214 |
| U.S. Treasury Inflation-Protected Security 0.25% 20254 | 24,662 | 24,898 |
| U.S. Treasury Inflation-Protected Security 0.625% 20264 | 8,447 | 8,709 |
| U.S. Treasury Inflation-Protected Security 0.375% 20274 | 28,192 | 28,768 |
| U.S. Treasury Inflation-Protected Security 0.375% 20274 | 21,732 | 22,074 |
| U.S. Treasury Inflation-Protected Security 0.75% 20284 | 45,106 | 47,479 |
| U.S. Treasury Inflation-Protected Security 1.75% 20284 | 5,159 | 5,799 |
| U.S. Treasury Inflation-Protected Security 0.25% 20294 | 294,654 | 297,918 |
| U.S. Treasury Inflation-Protected Security 2.125% 20413,4 | 14,477 | 19,106 |
| U.S. Treasury Inflation-Protected Security 0.75% 20423,4 | 195,021 | 203,026 |
| U.S. Treasury Inflation-Protected Security 0.875% 20473,4 | 15,990 | 17,173 |
| U.S. Treasury Inflation-Protected Security 1.00% 20493,4 | 269,614 | 300,088 |
| | | 1,549,651 |
| Total U.S. Treasury bonds & notes | | 21,621,080 |
Corporate bonds & notes 26.43%
Financials 5.98% | | |
| ACE INA Holdings Inc. 2.30% 2020 | 13,345 | 13,393 |
| ACE INA Holdings Inc. 2.875% 2022 | 1,585 | 1,626 |
| ACE INA Holdings Inc. 3.35% 2026 | 1,885 | 2,004 |
| ACE INA Holdings Inc. 4.35% 2045 | 1,465 | 1,772 |
| Allstate Corp. 3.85% 2049 | 9,000 | 9,979 |
| Ally Financial Inc. 5.75% 2025 | 8,000 | 8,970 |
| Ally Financial Inc. 8.00% 2031 | 18,050 | 24,777 |
| Ally Financial Inc. 8.00% 2031 | 5,630 | 7,825 |
| American Express Co. 3.00% 2024 | 20,000 | 20,673 |
| American International Group, Inc. 3.90% 2026 | 2,625 | 2,813 |
| American International Group, Inc. 4.80% 2045 | 1,150 | 1,378 |
The Bond Fund of America — Page 3 of 49
Bonds, notes & other debt instruments (continued)
Corporate bonds & notes (continued)
Financials (continued) | Principal amount
(000) | Value
(000) |
| AON Corp. 2.20% 2022 | $1,195 | $1,201 |
| Australia & New Zealand Banking Group Ltd. 2.625% 2022 | 15,000 | 15,234 |
| AXA Equitable Holdings, Inc. 3.90% 2023 | 5,575 | 5,842 |
| AXA Equitable Holdings, Inc. 4.35% 2028 | 4,000 | 4,342 |
| AXA Equitable Holdings, Inc. 5.00% 2048 | 13,935 | 14,978 |
| Banco Nacional de Comercio Exterior SNC 3.80% 2026 (UST Yield Curve Rate T Note Constant Maturity 5-year + 3.00% on 8/11/2021)5,6 | 1,850 | 1,876 |
| Bank of America Corp. 2.738% 2022 (3-month USD-LIBOR + 0.37% on 1/23/2021)6 | 21,000 | 21,160 |
| Bank of America Corp. 3.55% 2024 (3-month USD-LIBOR + 0.78% on 3/5/2023)6 | 36,500 | 37,899 |
| Bank of America Corp. 3.458% 2025 (3-month USD-LIBOR + 0.97% on 3/15/2024)6 | 30,460 | 31,813 |
| Bank of America Corp. 2.88% 2030 (3-month USD-LIBOR + 1.19% on 10/22/2029)6 | 19,780 | 19,948 |
Bank of Montreal 4.338% 2028
(USD Semi Annual 30/360 (vs. 3-month LIBOR) 5-year + 1.28% on 10/5/2023)6 | 13,234 | 13,962 |
| Bank of Nova Scotia 2.50% 2021 | 17,500 | 17,601 |
| Bank of Nova Scotia 2.70% 2026 | 19,000 | 19,335 |
| Barclays Bank PLC 3.65% 2025 | 2,000 | 2,088 |
| Barclays Bank PLC 4.95% 2047 | 9,900 | 11,648 |
| BBVA Bancomer SA 6.50% 20215 | 241 | 252 |
| Berkshire Hathaway Finance Corp. 4.20% 2048 | 21,490 | 25,397 |
| Berkshire Hathaway Finance Corp. 4.25% 2049 | 3,000 | 3,553 |
| Berkshire Hathaway Inc. 3.125% 2026 | 4,100 | 4,321 |
| Berkshire Hathaway Inc. 4.50% 2043 | 1,500 | 1,817 |
| BNP Paribas 3.50% 20235 | 47,425 | 49,078 |
| BNP Paribas 3.80% 20245 | 39,000 | 40,963 |
| BNP Paribas 2.819% 20255,6 | 5,050 | 5,109 |
| BNP Paribas 3.375% 20255 | 25,675 | 26,659 |
| Capital One Financial Corp. 2.15% 2022 | 13,625 | 13,651 |
| Capital One Financial Corp. 4.25% 2025 | 23,912 | 26,029 |
| Citigroup Inc. 2.35% 2021 | 16,500 | 16,602 |
| Citigroup Inc. 2.70% 2021 | 13,500 | 13,628 |
| Citigroup Inc. 2.90% 2021 | 13,500 | 13,723 |
| Citigroup Inc. 4.044% 2024 (3-month USD-LIBOR + 1.023% on 6/1/2023)6 | 12,000 | 12,694 |
| Citigroup Inc. 2.976% 2030 (USD-SOFR + 1.422% on 11/5/2029)6 | 4,000 | 4,061 |
| Citigroup Inc. 3.98% 2030 (3-month USD-LIBOR + 1.023% on 3/20/2029)6 | 11,100 | 12,144 |
| Cooperatieve Rabobank UA 2.75% 2023 | 17,000 | 17,334 |
| Cooperatieve Rabobank UA 2.625% 20245 | 10,900 | 11,027 |
| Crédit Agricole SA 3.375% 20225 | 10,250 | 10,488 |
| Crédit Agricole SA 3.75% 20235 | 21,000 | 21,967 |
| Crédit Agricole SA 3.25% 20245 | 6,200 | 6,425 |
| Crédit Agricole SA 4.375% 20255 | 11,130 | 11,968 |
| Credit Suisse Group AG 3.45% 2021 | 11,250 | 11,443 |
| Credit Suisse Group AG 2.997% 2023 (3-month USD-LIBOR + 1.20% on 12/14/2022)5,6 | 32,850 | 33,460 |
| Credit Suisse Group AG 3.80% 2023 | 29,264 | 30,637 |
| Credit Suisse Group AG 2.593% 2025 (USD-SOFR + 1.56% on 9/11/2024)5,6 | 15,200 | 15,253 |
| Credit Suisse Group AG 3.75% 2025 | 7,600 | 8,042 |
| Credit Suisse Group AG 4.55% 2026 | 11,000 | 12,210 |
| Credit Suisse Group AG 4.282% 20285 | 4,286 | 4,662 |
| Credit Suisse Group AG 3.869% 2029 (3-month USD-LIBOR + 1.41% on 1/12/2028)5,6 | 13,185 | 14,045 |
| Danske Bank AS 2.00% 20215 | 20,260 | 20,175 |
| Danske Bank AS 2.70% 20225 | 13,475 | 13,576 |
| Danske Bank AS 3.875% 20235 | 31,840 | 33,062 |
| Deutsche Bank AG 2.70% 2020 | 13,000 | 13,010 |
| Deutsche Bank AG 3.15% 2021 | 32,737 | 32,888 |
| Deutsche Bank AG 3.375% 2021 | 2,100 | 2,122 |
The Bond Fund of America — Page 4 of 49
Bonds, notes & other debt instruments (continued)
Corporate bonds & notes (continued)
Financials (continued) | Principal amount
(000) | Value
(000) |
| Deutsche Bank AG 4.25% 2021 | $36,725 | $37,314 |
| Deutsche Bank AG 4.25% 2021 | 850 | 874 |
| Deutsche Bank AG 3.30% 2022 | 4,055 | 4,097 |
| Deutsche Bank AG 5.00% 2022 | 4,675 | 4,883 |
| Deutsche Bank AG 3.95% 2023 | 11,197 | 11,483 |
| Deutsche Bank AG 3.70% 2024 | 10,125 | 10,275 |
| Deutsche Bank AG 3.70% 2024 | 6,250 | 6,360 |
| Deutsche Bank AG 3.961% 2025 (USD-SOFR + 2.581% on 11/26/2024)6 | 29,275 | 29,919 |
| Deutsche Bank AG 4.10% 2026 | 13,950 | 14,151 |
| DNB Bank ASA 2.375% 20215 | 22,700 | 22,852 |
| Ford Motor Credit Co. 3.35% 2022 | 9,000 | 9,093 |
| Ford Motor Credit Co. 3.81% 2024 | 5,242 | 5,321 |
| Ford Motor Credit Co. 4.063% 2024 | 9,000 | 9,189 |
| Ford Motor Credit Co. 5.584% 2024 | 9,196 | 9,953 |
| Ford Motor Credit Co. 4.542% 2026 | 26,034 | 26,650 |
| FS Energy and Power Fund 7.50% 20235 | 7,755 | 7,965 |
| Goldman Sachs Group, Inc. 2.905% 2023 (3-month USD-LIBOR + 0.99% on 7/24/2022)6 | 41,000 | 41,744 |
| Goldman Sachs Group, Inc. (3-month USD-LIBOR + 1.17%) 3.08% 20262 | 5,975 | 6,041 |
| Goldman Sachs Group, Inc. 3.814% 2029 (3-month USD-LIBOR + 1.158% on 4/23/2028)6 | 10,080 | 10,806 |
| Groupe BPCE SA 2.75% 20235 | 8,600 | 8,740 |
| Groupe BPCE SA 5.70% 20235 | 30,476 | 33,746 |
| Groupe BPCE SA 5.15% 20245 | 25,098 | 27,543 |
| Groupe BPCE SA 4.50% 20255 | 7,795 | 8,400 |
| Guardian Life Global Funding 2.90% 20245 | 2,420 | 2,487 |
| Hartford Financial Services Group, Inc. 2.80% 2029 | 13,850 | 14,020 |
| Hartford Financial Services Group, Inc. 3.60% 2049 | 3,250 | 3,350 |
| HSBC Holdings PLC 4.125% 20205 | 9,453 | 9,575 |
| HSBC Holdings PLC 2.633% 2025 (3-month USD-LIBOR + 1.14% on 11/7/2024)6 | 18,500 | 18,569 |
| HSBC Holdings PLC 3.973% 2030 (3-month USD-LIBOR + 1.61% on 5/22/2029)6 | 37,900 | 40,845 |
| HSBK (Europe) BV 7.25% 20215 | 3,710 | 3,896 |
| Intesa Sanpaolo SpA 3.125% 20225 | 17,025 | 17,250 |
| Intesa Sanpaolo SpA 3.375% 20235 | 39,966 | 40,641 |
| Intesa Sanpaolo SpA 3.25% 20245 | 1,475 | 1,483 |
| Intesa Sanpaolo SpA 5.017% 20245 | 112,000 | 117,671 |
| Intesa Sanpaolo SpA 5.71% 20265 | 21,955 | 23,762 |
| Intesa Sanpaolo SpA 3.875% 20275 | 7,375 | 7,382 |
| Intesa Sanpaolo SpA 3.875% 20285 | 5,997 | 6,022 |
| Intesa Sanpaolo SpA 4.00% 20295 | 1,225 | 1,244 |
| Jefferies Financial Group Inc. 5.50% 2023 | 4,695 | 5,105 |
| JPMorgan Chase & Co. 2.40% 2021 | 17,500 | 17,616 |
| JPMorgan Chase & Co. 2.55% 2021 | 26,400 | 26,605 |
| JPMorgan Chase & Co. 3.559% 2024 (3-month USD-LIBOR + 0.73% on 4/23/2023)6 | 20,134 | 20,980 |
| JPMorgan Chase & Co. 4.023% 2024 (3-month USD-LIBOR + 1.00% on 12/5/2023)6 | 6,115 | 6,521 |
| JPMorgan Chase & Co. 2.301% 2025 (USD-SOFR + 1.16% on 10/15/2024)6 | 54,850 | 54,782 |
| JPMorgan Chase & Co. 2.739% 2030 (USD-SOFR + 1.51% on 10/15/2029)6 | 27,439 | 27,435 |
| Lloyds Banking Group PLC 2.907% 2023 (3-month USD-LIBOR + 0.81% on 11/7/2022)6 | 16,500 | 16,747 |
| Lloyds Banking Group PLC 4.05% 2023 | 14,200 | 15,056 |
| Lloyds Banking Group PLC 4.582% 2025 | 5,143 | 5,569 |
| Lloyds Banking Group PLC 4.375% 2028 | 2,560 | 2,822 |
| LPL Financial Holdings Inc. 4.625% 20275 | 4,395 | 4,494 |
| Marsh & McLennan Cos., Inc. 3.875% 2024 | 17,120 | 18,260 |
| Marsh & McLennan Cos., Inc. 4.375% 2029 | 2,460 | 2,803 |
| Marsh & McLennan Cos., Inc. 4.75% 2039 | 750 | 906 |
| Marsh & McLennan Cos., Inc. 4.90% 2049 | 1,200 | 1,521 |
The Bond Fund of America — Page 5 of 49
Bonds, notes & other debt instruments (continued)
Corporate bonds & notes (continued)
Financials (continued) | Principal amount
(000) | Value
(000) |
| MetLife Capital Trust IV, junior subordinated, 7.875% 2067 (3-month USD-LIBOR + 3.96% on 12/1/2037)5,6 | $100 | $134 |
| MetLife, Inc. 3.60% 2025 | 100 | 107 |
| MetLife, Inc. 4.60% 2046 | 800 | 984 |
| Metropolitan Life Global Funding I 2.50% 20205 | 7,500 | 7,538 |
| Metropolitan Life Global Funding I 2.40% 20215 | 19,975 | 20,074 |
| Metropolitan Life Global Funding I 3.45% 20215 | 1,500 | 1,542 |
| Metropolitan Life Global Funding I 2.40% 20225 | 5,965 | 6,027 |
| Metropolitan Life Global Funding I 3.375% 20225 | 3,000 | 3,084 |
| Metropolitan Life Global Funding I 3.60% 20245 | 3,000 | 3,174 |
| Metropolitan Life Global Funding I 3.45% 20265 | 2,315 | 2,484 |
| Metropolitan Life Global Funding I 3.00% 20275 | 2,500 | 2,593 |
| Metropolitan Life Global Funding I 3.05% 20295 | 5,000 | 5,216 |
| Mitsubishi UFJ Financial Group, Inc. 2.19% 2021 | 13,500 | 13,540 |
| Mitsubishi UFJ Financial Group, Inc. 2.665% 2022 | 16,000 | 16,234 |
| Mitsubishi UFJ Financial Group, Inc. 2.998% 2022 | 9,825 | 10,012 |
| Mitsubishi UFJ Financial Group, Inc. 2.801% 2024 | 4,600 | 4,692 |
| Mizuho Financial Group, Ltd. 3.549% 2023 | 17,000 | 17,710 |
| Morgan Stanley 2.50% 2021 | 14,300 | 14,412 |
| Morgan Stanley 5.75% 2021 | 15,605 | 16,210 |
| Morgan Stanley 2.75% 2022 | 13,054 | 13,293 |
| Morgan Stanley 3.125% 2023 | 10,000 | 10,285 |
| Morgan Stanley 3.737% 2024 (3-month USD-LIBOR + 0.847% on 4/24/2023)6 | 57,500 | 60,094 |
| Morgan Stanley 2.72% 2025 (USD-SOFR + 1.152% on 7/22/2024)6 | 31,350 | 31,750 |
| National Australia Bank Ltd. 2.50% 2022 | 15,500 | 15,681 |
| National Australia Bank Ltd. 2.875% 2023 | 13,200 | 13,531 |
| Nationwide Building Society 3.766% 2024 (3-month USD-LIBOR + 1.064% on 3/8/2023)5,6 | 5,000 | 5,176 |
| Nationwide Building Society 4.363% 2024 (3-month USD-LIBOR + 1.392% on 8/1/2023)5,6 | 33,400 | 35,429 |
| Nationwide Building Society 4.125% 2032 (5-year USD ICE Swap + 1.849% on 10/18/2027)5,6 | 3,000 | 3,123 |
| New York Life Global Funding 1.95% 20205 | 3,625 | 3,627 |
| New York Life Global Funding 1.95% 20205 | 2,190 | 2,190 |
| New York Life Global Funding 1.70% 20215 | 30,500 | 30,468 |
| New York Life Global Funding 2.00% 20215 | 700 | 702 |
| New York Life Global Funding 2.25% 20225 | 10,195 | 10,294 |
| New York Life Global Funding 2.875% 20245 | 2,500 | 2,579 |
| New York Life Global Funding 3.00% 20285 | 2,500 | 2,591 |
| Nuveen, LLC 4.00% 20285 | 1,515 | 1,686 |
| PNC Bank 3.50% 2023 | 17,840 | 18,715 |
| PNC Financial Services Group, Inc. 3.50% 2024 | 11,700 | 12,320 |
| PRICOA Global Funding I 2.45% 20225 | 3,090 | 3,127 |
| PRICOA Global Funding I 3.45% 20235 | 11,525 | 12,083 |
| Principal Financial Group, Inc. 4.111% 20285 | 3,500 | 3,775 |
| Principal Financial Group, Inc. 3.70% 2029 | 1,765 | 1,924 |
| Progressive Corp. 4.00% 2029 | 3,000 | 3,353 |
| Prudential Financial, Inc. 3.905% 2047 | 850 | 914 |
| Prudential Financial, Inc. 4.418% 2048 | 1,000 | 1,161 |
| Prudential Financial, Inc. 4.35% 2050 | 5,000 | 5,754 |
| Prudential Financial, Inc. 3.70% 2051 | 21,150 | 22,249 |
| Prudential Financial, Inc., junior subordinated, 5.70% 2048 (3-month USD-LIBOR + 2.665% on 9/15/2028)6 | 3,500 | 4,004 |
| Rabobank Nederland 2.50% 2021 | 8,500 | 8,551 |
| Rabobank Nederland 4.375% 2025 | 5,945 | 6,450 |
| Royal Bank of Canada 3.20% 2021 | 20,000 | 20,358 |
| Royal Bank of Canada 2.80% 2022 | 23,825 | 24,312 |
| Royal Bank of Scotland PLC 4.519% 2024 (3-month USD-LIBOR + 1.55% on 6/25/2023)6 | 14,130 | 15,009 |
| Royal Bank of Scotland PLC 4.445% 2030 (3-month USD-LIBOR + 1.871% on 5/5/2029)6 | 22,200 | 24,517 |
The Bond Fund of America — Page 6 of 49
Bonds, notes & other debt instruments (continued)
Corporate bonds & notes (continued)
Financials (continued) | Principal amount
(000) | Value
(000) |
| Royal Bank of Scotland PLC 5.076% 2030 (3-month USD-LIBOR + 1.905% on 1/27/2029)6 | $5,300 | $6,094 |
| Santander Holdings USA, Inc. 3.40% 2023 | 17,000 | 17,431 |
| Santander Holdings USA, Inc. 3.50% 2024 | 13,325 | 13,707 |
| Santander Holdings USA, Inc. 3.244% 20265 | 15,000 | 15,171 |
| Skandinaviska Enskilda Banken AB 1.875% 2021 | 13,500 | 13,464 |
| Skandinaviska Enskilda Banken AB 2.625% 2021 | 15,275 | 15,373 |
| Sumitomo Mitsui Banking Corp. 3.102% 2023 | 28,940 | 29,684 |
| Svenska Handelsbanken AB 1.875% 2021 | 8,920 | 8,907 |
| Synchrony Bank 3.65% 2021 | 12,975 | 13,249 |
| Synchrony Financial 2.85% 2022 | 8,750 | 8,857 |
| Synchrony Financial 4.375% 2024 | 5,825 | 6,214 |
| Toronto-Dominion Bank 2.65% 2024 | 41,125 | 42,118 |
| Travelers Cos., Inc. 4.00% 2047 | 2,250 | 2,546 |
| Travelers Cos., Inc. 4.05% 2048 | 2,500 | 2,847 |
| Travelers Cos., Inc. 4.10% 2049 | 1,500 | 1,725 |
| U.S. Bancorp 2.85% 2023 | 21,000 | 21,506 |
| U.S. Bancorp 3.40% 2023 | 13,125 | 13,711 |
| U.S. Bancorp 2.40% 2024 | 59,000 | 59,790 |
| UBS Group AG 3.126% 2030 (3-month USD-LIBOR + 1.468% on 8/13/2029)5,6 | 19,100 | 19,454 |
| UniCredit SpA 3.75% 20225 | 14,975 | 15,345 |
| UniCredit SpA 6.572% 20225 | 22,250 | 23,895 |
| UniCredit SpA 4.625% 20275 | 27,550 | 29,189 |
| UniCredit SpA 5.861% 20325,6 | 53,810 | 56,225 |
| UniCredit SpA 7.296% 2034 (5-year USD-ICE Swap + 4.914% on 4/2/2029)5,6 | 35,184 | 40,478 |
| Unum Group 5.625% 2020 | 345 | 354 |
| VEB Finance Ltd. 6.902% 20205 | 4,600 | 4,707 |
| VEB Finance Ltd. 6.80% 20255 | 500 | 598 |
| Wells Fargo & Co. 2.10% 2021 | 41,300 | 41,369 |
| Wells Fargo & Co. 2.50% 2021 | 13,500 | 13,598 |
| Wells Fargo & Co. 2.625% 2022 | 16,000 | 16,236 |
| Wells Fargo & Co. 3.55% 2023 | 5,000 | 5,242 |
| Wells Fargo & Co. 2.406% 2025 (3-month USD-LIBOR + 0.82% on 10/30/2024)6 | 49,525 | 49,559 |
| Wells Fargo & Co. 3.196% 2027 (3-month USD-LIBOR + 1.17% on 4/17/2027)6 | 24,675 | 25,599 |
| Wells Fargo & Co. 2.879% 2030 (3-month USD-LIBOR + 1.17% on 10/30/2029)6 | 9,860 | 9,926 |
| Willis North America Inc. 3.875% 2049 | 3,100 | 3,096 |
| | | 3,014,536 |
| Health care 4.43% | | |
| Abbott Laboratories 3.40% 2023 | 6,785 | 7,136 |
| Abbott Laboratories 3.75% 2026 | 1,023 | 1,118 |
| Abbott Laboratories 4.75% 2036 | 200 | 250 |
| AbbVie Inc. 2.50% 2020 | 12,435 | 12,454 |
| AbbVie Inc. 2.30% 2021 | 14,335 | 14,400 |
| AbbVie Inc. 3.20% 2022 | 3,040 | 3,120 |
| AbbVie Inc. 2.85% 2023 | 8,367 | 8,534 |
| AbbVie Inc. 3.75% 2023 | 5,333 | 5,613 |
| AbbVie Inc. 2.60% 20245 | 33,935 | 34,168 |
| AbbVie Inc. 2.95% 20265 | 24,496 | 24,900 |
| AbbVie Inc. 3.20% 20295 | 49,815 | 50,708 |
| AbbVie Inc. 4.05% 20395 | 20,554 | 21,795 |
| AbbVie Inc. 4.45% 2046 | 15,563 | 16,649 |
| AbbVie Inc. 4.875% 2048 | 13,000 | 14,911 |
| AbbVie Inc. 4.25% 20495 | 30,658 | 32,404 |
| Allergan PLC 3.00% 2020 | 20,010 | 20,025 |
The Bond Fund of America — Page 7 of 49
Bonds, notes & other debt instruments (continued)
Corporate bonds & notes (continued)
Health care (continued) | Principal amount
(000) | Value
(000) |
| Allergan PLC 3.45% 2022 | $43,067 | $44,052 |
| Allergan PLC 3.80% 2025 | 3,803 | 3,995 |
| Allergan PLC 4.75% 2045 | 5,024 | 5,465 |
| Allergan, Inc. 5.00% 20215 | 12,457 | 13,029 |
| Amgen Inc. 1.85% 2021 | 7,340 | 7,327 |
| Anthem, Inc. 2.95% 2022 | 22,000 | 22,507 |
| Anthem, Inc. 2.375% 2025 | 1,534 | 1,537 |
| Anthem, Inc. 4.101% 2028 | 7,000 | 7,603 |
| Anthem, Inc. 2.875% 2029 | 5,685 | 5,665 |
| AstraZeneca PLC 2.375% 2022 | 14,650 | 14,818 |
| AstraZeneca PLC 3.50% 2023 | 15,207 | 15,913 |
| AstraZeneca PLC 3.375% 2025 | 21,116 | 22,438 |
| AstraZeneca PLC 4.00% 2029 | 10,009 | 11,115 |
| Baxalta Inc. 4.00% 2025 | 622 | 670 |
| Bayer US Finance II LLC 3.875% 20235 | 44,750 | 46,971 |
| Bayer US Finance II LLC 4.25% 20255 | 47,849 | 51,624 |
| Bayer US Finance II LLC 4.375% 20285 | 31,650 | 34,533 |
| Bayer US Finance II LLC 4.875% 20485 | 5,376 | 6,156 |
| Becton, Dickinson and Co. 2.404% 2020 | 19,675 | 19,697 |
| Becton, Dickinson and Co. 2.894% 2022 | 22,730 | 23,105 |
| Becton, Dickinson and Co. 3.363% 2024 | 41,795 | 43,537 |
| Becton, Dickinson and Co. 3.734% 2024 | 5,000 | 5,299 |
| Becton, Dickinson and Co. 3.70% 2027 | 5,356 | 5,706 |
| Boston Scientific Corp. 3.375% 2022 | 5,000 | 5,163 |
| Boston Scientific Corp. 3.45% 2024 | 1,985 | 2,077 |
| Boston Scientific Corp. 3.75% 2026 | 11,325 | 12,137 |
| Boston Scientific Corp. 4.70% 2049 | 1,025 | 1,245 |
| Bristol-Myers Squibb Co. 2.60% 20225 | 6,623 | 6,732 |
| Bristol-Myers Squibb Co. 2.90% 20245 | 21,114 | 21,798 |
| Bristol-Myers Squibb Co. 3.20% 20265 | 15,681 | 16,457 |
| Bristol-Myers Squibb Co. 3.40% 20295 | 43,225 | 46,231 |
| Bristol-Myers Squibb Co. 4.25% 20495 | 6,867 | 8,138 |
| Centene Corp. 4.75% 20255 | 15,000 | 15,612 |
| Centene Corp. 5.375% 20265 | 10,415 | 11,072 |
| Centene Corp. 4.25% 20275 | 8,090 | 8,338 |
| Centene Corp. 4.625% 20295 | 7,255 | 7,659 |
| Cigna Corp. 3.75% 2023 | 21,493 | 22,545 |
| Cigna Corp. 4.375% 2028 | 21,465 | 23,793 |
| Cigna Corp. 4.80% 2038 | 2,020 | 2,358 |
| Cigna Corp. 4.90% 2048 | 14,945 | 17,870 |
| Concordia International Corp. 8.00% 2024 | 1,308 | 1,243 |
| CVS Health Corp. 3.35% 2021 | 2,571 | 2,614 |
| CVS Health Corp. 4.30% 2028 | 6,090 | 6,651 |
| CVS Health Corp. 5.05% 2048 | 12,004 | 14,205 |
| Eagle Holding Co. II, LLC 7.75% 20225,7 | 2,630 | 2,675 |
| Eli Lilly and Co. 2.35% 2022 | 3,816 | 3,864 |
| Eli Lilly and Co. 3.375% 2029 | 6,266 | 6,756 |
| EMD Finance LLC 2.40% 20205 | 17,985 | 17,991 |
| EMD Finance LLC 2.95% 20225 | 9,600 | 9,729 |
| EMD Finance LLC 3.25% 20255 | 36,850 | 37,942 |
| Endo International PLC 5.875% 20245 | 625 | 608 |
| GlaxoSmithKline PLC 2.875% 2022 | 6,417 | 6,556 |
| GlaxoSmithKline PLC 3.375% 2023 | 41,545 | 43,328 |
| GlaxoSmithKline PLC 3.00% 2024 | 14,515 | 15,137 |
The Bond Fund of America — Page 8 of 49
Bonds, notes & other debt instruments (continued)
Corporate bonds & notes (continued)
Health care (continued) | Principal amount
(000) | Value
(000) |
| GlaxoSmithKline PLC 3.625% 2025 | $14,585 | $15,657 |
| HCA Inc. 4.125% 2029 | 2,825 | 2,999 |
| HCA Inc. 5.875% 2029 | 7,130 | 8,253 |
| HCA Inc. 5.25% 2049 | 8,300 | 9,280 |
| Humana Inc. 2.50% 2020 | 15,000 | 15,066 |
| Johnson & Johnson 2.25% 2022 | 12,240 | 12,375 |
| Kinetic Concepts, Inc. 12.50% 20215 | 5,955 | 6,144 |
| Laboratory Corp. of America Holdings 4.70% 2045 | 1,310 | 1,473 |
| Medtronic, Inc. 3.50% 2025 | 890 | 954 |
| Merck & Co., Inc. 2.80% 2023 | 5,773 | 5,952 |
| Merck & Co., Inc. 2.90% 2024 | 5,655 | 5,886 |
| Merck & Co., Inc. 2.75% 2025 | 9,550 | 9,890 |
| Merck & Co., Inc. 3.40% 2029 | 1,672 | 1,810 |
| Molina Healthcare, Inc. 4.875% 20255 | 10,115 | 10,423 |
| Mylan Laboratories Inc. 3.15% 2021 | 14,800 | 14,995 |
| Pfizer Inc. 2.80% 2022 | 3,707 | 3,785 |
| Pfizer Inc. 3.20% 2023 | 37,100 | 38,696 |
| Pfizer Inc. 2.95% 2024 | 2,297 | 2,385 |
| Pfizer Inc. 3.60% 2028 | 3,772 | 4,136 |
Rotech Healthcare Inc., Term Loan,
(3-month USD-LIBOR + 11.00%) 13.31% 2023 (100% PIK)2,7,8,9,10 | 6,845 | 6,913 |
| Shire PLC 2.40% 2021 | 51,117 | 51,408 |
| Shire PLC 2.875% 2023 | 36,035 | 36,717 |
| Shire PLC 3.20% 2026 | 43,426 | 44,743 |
| Takeda Pharmaceutical Co., Ltd. 4.40% 2023 | 33,600 | 36,078 |
| Takeda Pharmaceutical Co., Ltd. 5.00% 2028 | 68,368 | 79,613 |
| Team Health Holdings, Inc. 6.375% 20255 | 5,240 | 3,513 |
| Teva Pharmaceutical Finance Co. BV 2.20% 2021 | 3,886 | 3,771 |
| Teva Pharmaceutical Finance Co. BV 2.80% 2023 | 235,098 | 218,544 |
| Teva Pharmaceutical Finance Co. BV 6.00% 2024 | 92,316 | 93,616 |
| Teva Pharmaceutical Finance Co. BV 7.125% 20255 | 30,000 | 30,879 |
| Teva Pharmaceutical Finance Co. BV 3.15% 2026 | 95,825 | 80,016 |
| Teva Pharmaceutical Finance Co. BV 6.75% 2028 | 86,779 | 88,259 |
| Teva Pharmaceutical Finance Co. BV 4.10% 2046 | 110,965 | 80,183 |
| UnitedHealth Group Inc. 3.35% 2022 | 200 | 207 |
| UnitedHealth Group Inc. 2.375% 2024 | 11,540 | 11,690 |
| UnitedHealth Group Inc. 3.50% 2024 | 21,200 | 22,377 |
| UnitedHealth Group Inc. 3.70% 2025 | 15,430 | 16,695 |
| UnitedHealth Group Inc. 3.75% 2025 | 5,880 | 6,350 |
| UnitedHealth Group Inc. 2.875% 2029 | 16,410 | 16,887 |
| UnitedHealth Group Inc. 4.45% 2048 | 2,000 | 2,388 |
| UnitedHealth Group Inc. 3.70% 2049 | 6,795 | 7,299 |
| Valeant Pharmaceuticals International, Inc. 9.25% 20265 | 9,160 | 10,538 |
| WellCare Health Plans, Inc. 5.375% 20265 | 3,175 | 3,387 |
| WellPoint, Inc. 3.50% 2024 | 18,698 | 19,600 |
| Zimmer Holdings, Inc. 3.15% 2022 | 14,276 | 14,574 |
| | | 2,235,875 |
| Energy 3.35% | | |
| Apache Corp. 4.25% 2030 | 29,770 | 30,875 |
| Apache Corp. 5.35% 2049 | 33,485 | 35,041 |
| Baker Hughes, a GE Co. 4.08% 2047 | 4,040 | 4,137 |
| BP Capital Markets PLC 2.315% 2020 | 4,495 | 4,496 |
| BP Capital Markets PLC 3.062% 2022 | 13,481 | 13,823 |
The Bond Fund of America — Page 9 of 49
Bonds, notes & other debt instruments (continued)
Corporate bonds & notes (continued)
Energy (continued) | Principal amount
(000) | Value
(000) |
| BP Capital Markets PLC 3.79% 2024 | $47,280 | $50,311 |
| BP Capital Markets PLC 3.41% 2026 | 17,500 | 18,642 |
| BP Capital Markets PLC 4.234% 2028 | 17,000 | 19,218 |
| Canadian Natural Resources Ltd. 3.45% 2021 | 1,600 | 1,640 |
| Canadian Natural Resources Ltd. 2.95% 2023 | 14,820 | 15,119 |
| Canadian Natural Resources Ltd. 3.80% 2024 | 10,500 | 11,100 |
| Canadian Natural Resources Ltd. 3.85% 2027 | 23,910 | 25,500 |
| Cenovus Energy Inc. 3.80% 2023 | 3,940 | 4,076 |
| Cenovus Energy Inc. 4.25% 2027 | 16,800 | 17,794 |
| Cenovus Energy Inc. 5.25% 2037 | 2,189 | 2,425 |
| Cenovus Energy Inc. 5.40% 2047 | 47,923 | 55,922 |
| Cheniere Energy, Inc. 3.70% 20295 | 62,925 | 64,246 |
| Chevron Corp. 2.10% 2021 | 10,000 | 10,048 |
| Chevron Corp. 2.498% 2022 | 9,675 | 9,833 |
| Chevron Corp. 2.954% 2026 | 11,980 | 12,522 |
| Columbia Pipeline Partners LP 5.80% 2045 | 2,635 | 3,335 |
| Concho Resources Inc. 4.30% 2028 | 18,500 | 20,163 |
| Concho Resources Inc. 4.85% 2048 | 5,402 | 6,297 |
| Constellation Oil Services Holding SA 10.00% 20245,7,8,9 | 3,225 | 1,532 |
| DCP Midstream Operating LP 4.95% 2022 | 1,495 | 1,555 |
| Diamond Offshore Drilling, Inc. 4.875% 2043 | 13,470 | 7,387 |
| Diamondback Energy, Inc. 3.25% 2026 | 15,071 | 15,261 |
| Enbridge Energy Partners, LP 5.875% 2025 | 21,905 | 25,544 |
| Enbridge Energy Partners, LP 7.375% 2045 | 39,195 | 58,469 |
| Enbridge Inc. 4.00% 2023 | 30,600 | 32,329 |
| Enbridge Inc. 3.50% 2024 | 4,582 | 4,798 |
| Enbridge Inc. 2.50% 2025 | 17,500 | 17,623 |
| Energy Transfer Operating, LP 5.875% 2024 | 1,375 | 1,522 |
| Energy Transfer Operating, LP 5.50% 2027 | 10,000 | 11,247 |
| Energy Transfer Partners, LP 4.15% 2020 | 3,000 | 3,032 |
| Energy Transfer Partners, LP 4.20% 2023 | 5,725 | 6,011 |
| Energy Transfer Partners, LP 4.50% 2024 | 2,975 | 3,167 |
| Energy Transfer Partners, LP 4.95% 2028 | 7,500 | 8,215 |
| Energy Transfer Partners, LP 6.125% 2045 | 19,678 | 22,797 |
| Energy Transfer Partners, LP 5.30% 2047 | 32,111 | 34,243 |
| Energy Transfer Partners, LP 5.40% 2047 | 37,806 | 41,059 |
| Energy Transfer Partners, LP 6.00% 2048 | 17,891 | 20,849 |
| Energy Transfer Partners, LP 6.25% 2049 | 20,998 | 25,306 |
| Energy Transfer Partners, LP, junior subordinated, 6.625% (3-month USD-LIBOR + 4.155% on 12/31/2049)6 | 22,000 | 20,823 |
| EQT Corp. 2.50% 2020 | 14,660 | 14,659 |
| EQT Corp. 3.00% 2022 | 9,135 | 8,976 |
| EQT Corp. 3.90% 2027 | 11,000 | 10,298 |
| Equinor ASA 3.625% 2028 | 15,625 | 17,149 |
| Equinor ASA 3.25% 2049 | 10,077 | 10,154 |
| Exxon Mobil Corp. 2.222% 2021 | 7,330 | 7,377 |
| Exxon Mobil Corp. 1.902% 2022 | 6,460 | 6,498 |
| Exxon Mobil Corp. 2.019% 2024 | 47,400 | 47,549 |
| Exxon Mobil Corp. 2.44% 2029 | 17,747 | 17,863 |
| Exxon Mobil Corp. 2.995% 2039 | 1,230 | 1,233 |
| Exxon Mobil Corp. 3.095% 2049 | 980 | 978 |
| Gazprom OJSC 6.51% 20225 | 8,350 | 9,078 |
| Kinder Morgan, Inc. 3.15% 2023 | 1,280 | 1,311 |
| Kinder Morgan, Inc. 4.30% 2028 | 10,000 | 10,906 |
| Kinder Morgan, Inc. 5.05% 2046 | 7,500 | 8,442 |
The Bond Fund of America — Page 10 of 49
Bonds, notes & other debt instruments (continued)
Corporate bonds & notes (continued)
Energy (continued) | Principal amount
(000) | Value
(000) |
| Kinder Morgan, Inc. 5.20% 2048 | $5,000 | $5,798 |
| Marathon Oil Corp. 3.85% 2025 | 5,000 | 5,294 |
| Marathon Oil Corp. 4.40% 2027 | 5,755 | 6,257 |
| MPLX LP 3.50% 20225 | 8,500 | 8,752 |
| Murphy Oil Corp. 5.875% 2027 | 2,775 | 2,917 |
| MV24 Capital BV 6.748% 20345 | 7,005 | 7,412 |
| Neptune Energy Group Holdings Ltd. 6.625% 20255 | 6,445 | 6,457 |
| Noble Energy, Inc. 3.25% 2029 | 16,390 | 16,540 |
| Noble Energy, Inc. 4.95% 2047 | 22,695 | 25,125 |
| Noble Energy, Inc. 4.20% 2049 | 14,250 | 14,339 |
| Occidental Petroleum Corp. 2.70% 2022 | 6,000 | 6,063 |
| Occidental Petroleum Corp. 2.90% 2024 | 28,085 | 28,549 |
| Occidental Petroleum Corp. 3.20% 2026 | 10,741 | 10,877 |
| Occidental Petroleum Corp. 5.55% 2026 | 400 | 454 |
| Occidental Petroleum Corp. 3.50% 2029 | 47,335 | 48,293 |
| Occidental Petroleum Corp. 4.40% 2049 | 17,010 | 17,538 |
| Odebrecht Drilling Norbe 6.72% 20225 | 1,718 | 1,692 |
| Odebrecht Drilling Norbe 7.63% 2026 (86.90% PIK)5,7 | 7,624 | 1,906 |
| Odebrecht Drilling Norbe 0%5 | 1,072 | 11 |
| Petrobras Global Finance Co. 8.75% 2026 | 2,600 | 3,343 |
| Petrobras Global Finance Co. 7.375% 2027 | 4,380 | 5,352 |
| Petrobras Global Finance Co. 5.093% 20305 | 5,233 | 5,614 |
| Petrobras Global Finance Co. 7.25% 2044 | 1,375 | 1,673 |
| Petróleos Mexicanos 4.50% 2026 | 12,700 | 12,683 |
| Petróleos Mexicanos 6.875% 2026 | 85,066 | 93,649 |
| Petróleos Mexicanos 6.50% 2027 | 35,797 | 38,108 |
| Petróleos Mexicanos 6.84% 20305 | 1,447 | 1,546 |
| Petróleos Mexicanos 7.69% 20505 | 5,700 | 6,240 |
| QEP Resources, Inc. 5.625% 2026 | 1,625 | 1,589 |
| Sabine Pass Liquefaction, LLC 5.625% 20216 | 925 | 951 |
| Sabine Pass Liquefaction, LLC 6.25% 2022 | 4,700 | 5,049 |
| Sabine Pass Liquefaction, LLC 5.625% 20236 | 14,000 | 15,237 |
| Sabine Pass Liquefaction, LLC 5.75% 2024 | 13,100 | 14,613 |
| Sabine Pass Liquefaction, LLC 5.625% 2025 | 21,015 | 23,661 |
| Sabine Pass Liquefaction, LLC 5.875% 2026 | 33,750 | 38,752 |
| Saudi Arabian Oil Co. 2.875% 20245 | 8,448 | 8,574 |
| Saudi Arabian Oil Co. 3.50% 20295 | 41,685 | 43,195 |
| Saudi Arabian Oil Co. 4.375% 20495 | 1,325 | 1,447 |
| Shell International Finance BV 3.50% 2023 | 22,808 | 24,019 |
| Shell International Finance BV 2.00% 2024 | 6,500 | 6,487 |
| Shell International Finance BV 3.875% 2028 | 8,780 | 9,735 |
| Shell International Finance BV 2.375% 2029 | 3,500 | 3,467 |
| Shell International Finance BV 3.75% 2046 | 4,110 | 4,512 |
| Shell International Finance BV 4.00% 2046 | 4,280 | 4,877 |
| Shell International Finance BV 3.125% 2049 | 16,450 | 16,237 |
| Targa Resources Partners LP 5.50% 20305 | 4,190 | 4,310 |
| Teekay Corp. 9.25% 20225 | 3,745 | 3,952 |
| Total Capital International 2.434% 2025 | 27,975 | 28,323 |
| Total Capital International 3.455% 2029 | 17,815 | 19,305 |
| Total Capital International 3.461% 2049 | 3,380 | 3,554 |
| Total Capital SA 3.883% 2028 | 5,100 | 5,709 |
| TransCanada PipeLines Ltd. 4.875% 2048 | 12,500 | 14,754 |
| TransCanada PipeLines Ltd. 5.10% 2049 | 13,500 | 16,450 |
| Transocean Inc. 5.80% 20226 | 5,135 | 4,970 |
The Bond Fund of America — Page 11 of 49
Bonds, notes & other debt instruments (continued)
Corporate bonds & notes (continued)
Energy (continued) | Principal amount
(000) | Value
(000) |
| Transportadora de Gas Peru SA 4.25% 20285 | $2,535 | $2,717 |
| Woodside Finance Ltd. 4.60% 20215 | 9,565 | 9,792 |
| | | 1,690,523 |
| Utilities 2.63% | | |
| Abu Dhabi National Energy Co. PJSC (TAQA) 5.875% 20215 | 1,055 | 1,125 |
| Abu Dhabi National Energy Co. PJSC (TAQA) 3.625% 20235 | 2,110 | 2,171 |
| Abu Dhabi National Energy Co. PJSC (TAQA) 4.375% 20255 | 20,500 | 22,138 |
| Abu Dhabi National Energy Co. PJSC (TAQA) 4.375% 20265 | 600 | 653 |
| Abu Dhabi National Energy Co. PJSC (TAQA) 4.875% 20305 | 440 | 504 |
| Alliant Energy Finance LLC 4.25% 20285 | 3,804 | 4,091 |
| Ameren Corp. 2.50% 2024 | 3,297 | 3,326 |
| American Electric Power Co., Inc. 4.30% 2028 | 10,000 | 11,124 |
| Avangrid, Inc. 3.80% 2029 | 18,325 | 19,436 |
| Berkshire Hathaway Energy Co. 2.80% 2023 | 8,650 | 8,853 |
| Berkshire Hathaway Energy Co. 4.50% 2045 | 200 | 235 |
| Cemig Geração e Transmissão SA 9.25% 2024 | 700 | 807 |
| CenterPoint Energy, Inc. 3.85% 2024 | 36,462 | 38,460 |
| CenterPoint Energy, Inc. 2.95% 2030 | 11,350 | 11,198 |
| CenterPoint Energy, Inc. 3.70% 2049 | 2,775 | 2,735 |
| CMS Energy Corp. 3.875% 2024 | 5,000 | 5,263 |
| CMS Energy Corp. 3.00% 2026 | 9,342 | 9,598 |
| CMS Energy Corp. 4.875% 2044 | 1,341 | 1,599 |
| Colbun SA 4.50% 2024 | 7,500 | 7,965 |
| Colbun SA 4.50% 20245 | 1,200 | 1,274 |
| Colbun SA 3.95% 20275 | 5,225 | 5,450 |
| Comision Federal de Electricidad 4.875% 20245 | 2,500 | 2,695 |
| Comision Federal de Electricidad 4.75% 20275 | 370 | 391 |
| Consolidated Edison Co. of New York, Inc. 3.125% 2027 | 1,771 | 1,852 |
| Consumers Energy Co. 3.10% 2050 | 11,000 | 10,972 |
| Consumers Energy Co. 3.75% 2050 | 5,000 | 5,524 |
| Dominion Resources, Inc., junior subordinated, 2.715% 20216 | 4,025 | 4,056 |
| Dominion Resources, Inc., junior subordinated, 3.071% 20246 | 19,975 | 20,581 |
| DTE Electric Co. 3.75% 2047 | 6,000 | 6,555 |
| DTE Energy Co. 3.70% 2023 | 5,000 | 5,219 |
| DTE Energy Co. 3.40% 2029 | 16,850 | 17,383 |
| DTE Energy Co., Series C, 2.529% 20242 | 8,925 | 8,970 |
| Duke Energy Carolinas, LLC 2.95% 2026 | 1,771 | 1,829 |
| Duke Energy Carolinas, LLC 2.45% 2029 | 32,180 | 31,956 |
| Duke Energy Carolinas, LLC 3.20% 2049 | 552 | 550 |
| Duke Energy Corp. 3.40% 2029 | 29,000 | 30,331 |
| Duke Energy Florida, LLC 2.50% 2029 | 10,976 | 10,975 |
| Duke Energy Indiana, Inc. 3.25% 2049 | 3,875 | 3,873 |
| Duke Energy Progress, LLC 3.60% 2047 | 4,202 | 4,400 |
| Edison International 3.125% 2022 | 13,250 | 13,460 |
| Edison International 3.55% 2024 | 33,995 | 34,830 |
| Edison International 5.75% 2027 | 9,668 | 10,860 |
| Edison International 4.125% 2028 | 27,306 | 28,010 |
| EDP Finance BV 4.125% 20205 | 22,061 | 22,064 |
| EDP Finance BV 5.25% 20215 | 3,500 | 3,609 |
| EDP Finance BV 3.625% 20245 | 14,025 | 14,601 |
| Electricité de France SA 4.50% 20285 | 762 | 847 |
| Electricité de France SA 4.75% 20355 | 2,001 | 2,289 |
| Electricité de France SA 4.875% 20385 | 1,900 | 2,232 |
The Bond Fund of America — Page 12 of 49
Bonds, notes & other debt instruments (continued)
Corporate bonds & notes (continued)
Utilities (continued) | Principal amount
(000) | Value
(000) |
| Electricité de France SA 4.95% 20455 | $711 | $839 |
| Electricité de France SA 5.00% 20485 | 305 | 363 |
| Electricité de France SA 6.00% 2114 | £300 | 658 |
| Emera Inc. 6.75% 2076 (3-month USD-LIBOR + 5.44% on 6/15/2026)6 | $17,204 | 19,467 |
| Emera US Finance LP 2.70% 2021 | 3,085 | 3,114 |
| Emera US Finance LP 3.55% 2026 | 7,227 | 7,506 |
| Empresa Nacional de Electricidad SA 4.25% 2024 | 1,500 | 1,582 |
| Empresas Publicas de Medellin E.S.P. 4.25% 20295 | 2,010 | 2,095 |
| Enel Chile SA 4.875% 2028 | 4,000 | 4,431 |
| Enel Finance International SA 4.625% 20255 | 29,000 | 31,638 |
| Enel Finance International SA 3.50% 20285 | 8,724 | 8,928 |
| Enel Finance International SA 6.00% 20395 | 2,210 | 2,783 |
| Enel Società per Azioni 8.75% 20735,6 | 9,500 | 11,175 |
| Entergy Corp. 2.95% 2026 | 16,681 | 16,946 |
| Eversource Energy 3.30% 2028 | 573 | 590 |
| Eversource Energy 4.25% 2029 | 4,458 | 4,959 |
| Exelon Corp., junior subordinated, 3.497% 20226 | 21,000 | 21,565 |
| FirstEnergy Corp. 2.85% 2022 | 13,402 | 13,619 |
| FirstEnergy Corp. 3.90% 2027 | 45,430 | 48,580 |
| FirstEnergy Corp. 3.50% 20285 | 8,321 | 8,663 |
| FirstEnergy Corp. 7.375% 2031 | 8,895 | 12,550 |
| FirstEnergy Corp., Series B, 4.25% 2023 | 23,224 | 24,485 |
| Florida Power & Light Co. 3.15% 2049 | 9,375 | 9,476 |
| Gulf Power Co. 3.30% 2027 | 1,831 | 1,907 |
| Interstate Power and Light Co. 3.25% 2024 | 9,628 | 10,024 |
| IPALCO Enterprises, Inc. 3.70% 2024 | 1,325 | 1,371 |
| Israel Electric Corp. Ltd. 8.10% 20965 | 6,250 | 8,906 |
| Jersey Central Power & Light Co. 4.30% 20265 | 4,480 | 4,877 |
| Metropolitan Edison Co. 4.30% 20295 | 3,000 | 3,343 |
| MidAmerican Energy Holdings Co. 3.65% 2029 | 6,000 | 6,558 |
| MidAmerican Energy Holdings Co. 3.15% 2050 | 6,000 | 5,923 |
| Mississippi Power Co. 3.95% 2028 | 6,400 | 6,970 |
| Mississippi Power Co. 4.25% 2042 | 15,576 | 16,734 |
| National Grid PLC 3.15% 20275 | 1,105 | 1,145 |
| New York State Electric & Gas Corp. 3.25% 20265 | 2,000 | 2,074 |
| NextEra Energy Capital Holdings, Inc. 2.403% 2021 | 10,000 | 10,074 |
| NextEra Energy Capital Holdings, Inc. 3.15% 2024 | 3,760 | 3,899 |
| Niagara Mohawk Power Corp. 3.508% 20245 | 2,050 | 2,156 |
| Niagara Mohawk Power Corp. 4.278% 20345 | 3,000 | 3,403 |
| NiSource Finance Corp. 2.65% 2022 | 2,875 | 2,910 |
| Northern States Power Co. 2.20% 2020 | 21 | 21 |
| Northern States Power Co. 2.90% 2050 | 9,200 | 8,789 |
| NV Energy, Inc. 6.25% 2020 | 3,100 | 3,209 |
| Pacific Gas and Electric Co. 3.50% 202011 | 711 | 714 |
| Pacific Gas and Electric Co. 2.45% 202211 | 803 | 805 |
| Pacific Gas and Electric Co. 4.25% 20235,11 | 45,575 | 46,847 |
| Pacific Gas and Electric Co. 3.75% 202411 | 7,957 | 8,100 |
| Pacific Gas and Electric Co. 3.50% 202511 | 3,266 | 3,274 |
| Pacific Gas and Electric Co. 2.95% 202611 | 3,134 | 3,149 |
| Pacific Gas and Electric Co. 3.30% 202711 | 1,429 | 1,433 |
| Pacific Gas and Electric Co. 3.30% 202711 | 1,158 | 1,161 |
| Pacific Gas and Electric Co. 4.65% 20285,11 | 4,375 | 4,530 |
| Pacific Gas and Electric Co. 6.05% 203411 | 18,823 | 19,752 |
| Public Service Co. of Colorado 2.50% 2023 | 1,430 | 1,447 |
The Bond Fund of America — Page 13 of 49
Bonds, notes & other debt instruments (continued)
Corporate bonds & notes (continued)
Utilities (continued) | Principal amount
(000) | Value
(000) |
| Public Service Co. of Colorado 3.20% 2050 | $1,475 | $1,482 |
| Public Service Electric and Gas Co. 3.20% 2029 | 5,000 | 5,272 |
| Public Service Enterprise Group Inc. 2.65% 2022 | 6,225 | 6,324 |
| Public Service Enterprise Group Inc. 3.20% 2049 | 8,475 | 8,558 |
| Puget Energy, Inc. 6.50% 2020 | 8,603 | 8,949 |
| Puget Energy, Inc. 6.00% 2021 | 8,921 | 9,474 |
| Puget Energy, Inc. 5.625% 2022 | 20,491 | 21,981 |
| Puget Energy, Inc. 3.65% 2025 | 1,911 | 1,979 |
| San Diego Gas & Electric Co. 3.75% 2047 | 6,000 | 6,234 |
| San Diego Gas & Electric Co. 4.10% 2049 | 11,704 | 12,948 |
| SCANA Corp. 4.75% 2021 | 5,980 | 6,114 |
| SCANA Corp. 4.125% 2022 | 12,513 | 12,859 |
| Southern California Edison Co. 2.90% 2021 | 17,301 | 17,484 |
| Southern California Edison Co. 1.845% 2022 | 4,527 | 4,472 |
| Southern California Edison Co. 3.40% 2023 | 3,200 | 3,320 |
| Southern California Edison Co. 3.50% 2023 | 29,819 | 31,081 |
| Southern California Edison Co. 3.70% 2025 | 4,990 | 5,288 |
| Southern California Edison Co. 3.65% 2028 | 7,725 | 8,281 |
| Southern California Edison Co. 2.85% 2029 | 21,347 | 21,340 |
| Southern California Edison Co. 4.20% 2029 | 38,765 | 42,922 |
| Southern California Edison Co. 6.00% 2034 | 12,574 | 15,480 |
| Southern California Edison Co. 5.35% 2035 | 21,200 | 24,841 |
| Southern California Edison Co. 5.75% 2035 | 6,394 | 7,798 |
| Southern California Edison Co. 5.625% 2036 | 3,850 | 4,690 |
| Southern California Edison Co. 5.55% 2037 | 2,325 | 2,808 |
| Southern California Edison Co. 5.95% 2038 | 17,700 | 22,435 |
| Southern California Edison Co. 6.05% 2039 | 5,593 | 7,292 |
| Southern California Edison Co. 4.50% 2040 | 7,325 | 8,042 |
| Southern California Edison Co. 4.00% 2047 | 11,828 | 12,435 |
| Southern California Edison Co. 4.125% 2048 | 10,017 | 10,687 |
| Southern California Edison Co. 4.875% 2049 | 4,175 | 4,945 |
| Southern California Edison Co., Series C, 3.60% 2045 | 19,475 | 19,251 |
| Southern California Gas Co. 3.95% 2050 | 6,000 | 6,714 |
| State Grid Overseas Investment Ltd. 3.50% 20275 | 2,000 | 2,095 |
| Talen Energy Corp. 7.25% 20275 | 3,875 | 4,084 |
| Virginia Electric and Power Co. 2.875% 2029 | 1,425 | 1,461 |
| Virginia Electric and Power Co. 4.00% 2043 | 1,508 | 1,666 |
| Virginia Electric and Power Co. 3.30% 2049 | 9,250 | 9,351 |
| Xcel Energy Inc. 3.30% 2025 | 3,294 | 3,439 |
| Xcel Energy Inc. 2.60% 2029 | 5,821 | 5,766 |
| Xcel Energy Inc. 3.50% 2049 | 6,450 | 6,565 |
| | | 1,328,643 |
| Consumer staples 2.45% | | |
| Altria Group, Inc. 2.85% 2022 | 200 | 204 |
| Altria Group, Inc. 3.80% 2024 | 7,100 | 7,472 |
| Altria Group, Inc. 4.40% 2026 | 27,923 | 30,335 |
| Altria Group, Inc. 4.80% 2029 | 61,140 | 68,117 |
| Altria Group, Inc. 5.80% 2039 | 900 | 1,058 |
| Altria Group, Inc. 4.50% 2043 | 100 | 102 |
| Altria Group, Inc. 5.95% 2049 | 61,573 | 74,551 |
| Anheuser-Busch Co./InBev Worldwide 4.90% 2046 | 32,310 | 38,270 |
| Anheuser-Busch InBev NV 4.00% 2028 | 2,000 | 2,200 |
| Anheuser-Busch InBev NV 4.75% 2029 | 21,001 | 24,331 |
The Bond Fund of America — Page 14 of 49
Bonds, notes & other debt instruments (continued)
Corporate bonds & notes (continued)
Consumer staples (continued) | Principal amount
(000) | Value
(000) |
| Anheuser-Busch InBev NV 4.90% 2031 | $3,000 | $3,572 |
| Anheuser-Busch InBev NV 4.60% 2048 | 14,275 | 16,268 |
| Anheuser-Busch InBev NV 5.55% 2049 | 43,981 | 57,055 |
| British American Tobacco International Finance PLC 3.50% 20225 | 216 | 222 |
| British American Tobacco International Finance PLC 3.95% 20255 | 20,022 | 21,176 |
| British American Tobacco PLC 2.764% 2022 | 21,380 | 21,691 |
| British American Tobacco PLC 3.222% 2024 | 56,306 | 57,582 |
| British American Tobacco PLC 3.215% 2026 | 17,500 | 17,640 |
| British American Tobacco PLC 3.557% 2027 | 107,870 | 110,101 |
| British American Tobacco PLC 4.39% 2037 | 20,000 | 20,246 |
| British American Tobacco PLC 4.54% 2047 | 38,451 | 38,627 |
| British American Tobacco PLC 4.758% 2049 | 44,969 | 46,542 |
| Coca-Cola Co. 1.75% 2024 | 36,000 | 35,881 |
| Conagra Brands, Inc. 4.30% 2024 | 20,146 | 21,694 |
| Conagra Brands, Inc. 4.60% 2025 | 14,695 | 16,230 |
| Conagra Brands, Inc. 5.30% 2038 | 3,867 | 4,590 |
| Conagra Brands, Inc. 5.40% 2048 | 20,328 | 24,794 |
| Constellation Brands, Inc. 2.65% 2022 | 14,125 | 14,325 |
| Constellation Brands, Inc. 2.70% 2022 | 1,995 | 2,020 |
| Constellation Brands, Inc. 3.20% 2023 | 10,638 | 10,930 |
| Constellation Brands, Inc. 4.25% 2023 | 8,588 | 9,128 |
| Constellation Brands, Inc. 3.70% 2026 | 3,350 | 3,556 |
| Constellation Brands, Inc. 3.60% 2028 | 1,650 | 1,745 |
| Constellation Brands, Inc. 4.10% 2048 | 1,000 | 1,045 |
| Costco Wholesale Corp. 2.30% 2022 | 3,500 | 3,544 |
| Costco Wholesale Corp. 2.75% 2024 | 14,500 | 15,011 |
| Imperial Tobacco Finance PLC 3.50% 20235 | 3,173 | 3,248 |
| JBS Investments GmbH II 5.75% 20285 | 8,057 | 8,511 |
| Keurig Dr Pepper Inc. 3.551% 2021 | 8,500 | 8,683 |
| Keurig Dr Pepper Inc. 4.057% 2023 | 36,670 | 38,674 |
| Keurig Dr Pepper Inc. 4.417% 2025 | 9,925 | 10,842 |
| Keurig Dr Pepper Inc. 4.597% 2028 | 22,033 | 24,754 |
| Keurig Dr Pepper Inc. 5.085% 2048 | 19,000 | 22,915 |
| Kraft Heinz Co. 3.50% 2022 | 25 | 26 |
| Kraft Heinz Co. 4.875% 20495 | 3,200 | 3,373 |
| Kroger Co. 2.60% 2021 | 1,500 | 1,509 |
| Molson Coors Brewing Co. 2.25% 2020 | 9,925 | 9,921 |
| Molson Coors Brewing Co. 2.10% 2021 | 6,190 | 6,195 |
| Molson Coors Brewing Co. 4.20% 2046 | 7,050 | 7,028 |
| Nestlé Holdings, Inc. 3.35% 20235 | 26,000 | 27,196 |
| Philip Morris International Inc. 2.50% 2022 | 16,500 | 16,741 |
| Philip Morris International Inc. 2.875% 2024 | 11,985 | 12,334 |
| Philip Morris International Inc. 3.375% 2029 | 13,550 | 14,221 |
| Reckitt Benckiser Group PLC 2.375% 20225 | 10,935 | 11,015 |
| Reckitt Benckiser Treasury Services PLC 2.75% 20245 | 4,305 | 4,390 |
| Reynolds American Inc. 3.25% 2020 | 3,000 | 3,014 |
| Reynolds American Inc. 3.25% 2022 | 17,491 | 17,843 |
| Reynolds American Inc. 4.45% 2025 | 10,635 | 11,450 |
| Reynolds American Inc. 4.75% 2042 | 2,500 | 2,469 |
| Reynolds American Inc. 5.85% 2045 | 7,195 | 8,249 |
| Wal-Mart Stores, Inc. 3.125% 2021 | 7,500 | 7,661 |
| Wal-Mart Stores, Inc. 2.35% 2022 | 4,000 | 4,070 |
| Wal-Mart Stores, Inc. 3.40% 2023 | 2,975 | 3,128 |
| Wal-Mart Stores, Inc. 2.85% 2024 | 57,435 | 59,576 |
The Bond Fund of America — Page 15 of 49
Bonds, notes & other debt instruments (continued)
Corporate bonds & notes (continued)
Consumer staples (continued) | Principal amount
(000) | Value
(000) |
| Wal-Mart Stores, Inc. 3.05% 2026 | $16,440 | $17,335 |
| Wal-Mart Stores, Inc. 3.70% 2028 | 5,694 | 6,279 |
| WM. Wrigley Jr. Co. 3.375% 20205 | 41,650 | 42,059 |
| | | 1,236,564 |
| Consumer discretionary 2.27% | | |
| Amazon.com, Inc. 2.40% 2023 | 10,603 | 10,792 |
| Amazon.com, Inc. 3.15% 2027 | 4,460 | 4,720 |
| Amazon.com, Inc. 3.875% 2037 | 550 | 625 |
| Amazon.com, Inc. 4.05% 2047 | 503 | 591 |
| American Honda Finance Corp. 1.65% 2021 | 9,565 | 9,546 |
| American Honda Finance Corp. 2.60% 2022 | 3,000 | 3,061 |
| American Honda Finance Corp. 3.50% 2028 | 2,035 | 2,192 |
| Bayerische Motoren Werke AG 2.15% 20205 | 2,000 | 2,001 |
| Bayerische Motoren Werke AG 1.85% 20215 | 1,500 | 1,497 |
| Bayerische Motoren Werke AG 2.00% 20215 | 2,000 | 2,003 |
| Bayerische Motoren Werke AG 2.95% 20225 | 5,000 | 5,095 |
| Bayerische Motoren Werke AG 3.45% 20235 | 19,534 | 20,268 |
| Bayerische Motoren Werke AG 3.15% 20245 | 17,616 | 18,220 |
| BMW Finance NV 2.25% 20225 | 7,500 | 7,534 |
| DaimlerChrysler North America Holding Corp. 2.00% 20215 | 11,925 | 11,902 |
| DaimlerChrysler North America Holding Corp. 2.55% 20225 | 12,750 | 12,844 |
| DaimlerChrysler North America Holding Corp. 2.70% 20245 | 7,500 | 7,565 |
| DaimlerChrysler North America Holding Corp. 3.65% 20245 | 38,644 | 40,426 |
| DaimlerChrysler North America Holding Corp. 3.30% 20255 | 200 | 206 |
| Ford Motor Credit Co. 2.343% 2020 | 25,295 | 25,251 |
| Ford Motor Credit Co. 3.157% 2020 | 18,661 | 18,737 |
| Ford Motor Credit Co. 3.20% 2021 | 9,415 | 9,468 |
| Ford Motor Credit Co. 3.336% 2021 | 4,500 | 4,534 |
| Ford Motor Credit Co. 3.47% 2021 | 15,066 | 15,206 |
| Ford Motor Credit Co. 3.813% 2021 | 30,785 | 31,355 |
| Ford Motor Credit Co. 3.219% 2022 | 1,427 | 1,437 |
| Ford Motor Credit Co. 3.339% 2022 | 24,608 | 24,852 |
| Ford Motor Credit Co. 5.596% 2022 | 19,250 | 20,285 |
| Ford Motor Credit Co. 3.096% 2023 | 18,127 | 18,114 |
| Ford Motor Credit Co. 4.14% 2023 | 22,000 | 22,635 |
| Ford Motor Credit Co. 4.375% 2023 | 14,367 | 14,939 |
| Ford Motor Credit Co. 3.664% 2024 | 20,763 | 20,873 |
| Ford Motor Credit Co. 4.134% 2025 | 400 | 406 |
| General Motors Co. 4.35% 2025 | 10,410 | 11,155 |
| General Motors Co. 6.25% 2043 | 3,959 | 4,444 |
| General Motors Co. 6.75% 2046 | 3,193 | 3,753 |
| General Motors Co. 5.40% 2048 | 13,000 | 13,450 |
| General Motors Co. 5.95% 2049 | 10,193 | 11,287 |
| General Motors Financial Co. 3.20% 2021 | 13,200 | 13,382 |
| General Motors Financial Co. 3.55% 2021 | 1,400 | 1,427 |
| General Motors Financial Co. 4.20% 2021 | 5,674 | 5,883 |
| General Motors Financial Co. 3.15% 2022 | 42,311 | 43,121 |
| General Motors Financial Co. 3.45% 2022 | 14,955 | 15,296 |
| General Motors Financial Co. 3.55% 2022 | 1,850 | 1,905 |
| General Motors Financial Co. 3.25% 2023 | 47,908 | 48,979 |
| General Motors Financial Co. 3.70% 2023 | 16,000 | 16,499 |
| General Motors Financial Co. 4.15% 2023 | 14,010 | 14,742 |
| General Motors Financial Co. 3.50% 2024 | 4,470 | 4,606 |
The Bond Fund of America — Page 16 of 49
Bonds, notes & other debt instruments (continued)
Corporate bonds & notes (continued)
Consumer discretionary (continued) | Principal amount
(000) | Value
(000) |
| General Motors Financial Co. 3.95% 2024 | $15,500 | $16,205 |
| General Motors Financial Co. 5.10% 2024 | 11,546 | 12,536 |
| General Motors Financial Co. 4.00% 2026 | 2,000 | 2,097 |
| General Motors Financial Co. 5.25% 2026 | 3,100 | 3,443 |
| Home Depot, Inc. 3.90% 2028 | 825 | 926 |
| Home Depot, Inc. 2.95% 2029 | 21,294 | 22,151 |
| Home Depot, Inc. 4.50% 2048 | 863 | 1,064 |
| Hyundai Capital America 2.55% 20205 | 11,500 | 11,505 |
| Hyundai Capital America 2.75% 20205 | 11,406 | 11,447 |
| Hyundai Capital America 3.45% 20215 | 33,735 | 34,153 |
| Hyundai Capital America 3.75% 20215 | 21,500 | 21,931 |
| Hyundai Capital America 2.85% 20225 | 7,412 | 7,496 |
| Hyundai Capital America 3.10% 20225 | 13,890 | 14,069 |
| Hyundai Capital America 3.25% 20225 | 24,685 | 25,157 |
| Hyundai Capital America 3.95% 20225 | 15,000 | 15,423 |
| Las Vegas Sands Corp. 3.90% 2029 | 7,855 | 8,209 |
| Lowe’s Cos., Inc. 3.65% 2029 | 13,007 | 13,904 |
| Lowe’s Cos., Inc. 4.05% 2047 | 2,425 | 2,616 |
| Lowe’s Cos., Inc. 4.55% 2049 | 24,249 | 28,585 |
| McDonald’s Corp. 4.45% 2047 | 4,000 | 4,591 |
| McDonald’s Corp. 4.45% 2048 | 3,500 | 4,005 |
| Melco International Development Ltd. 5.375% 20295 | 885 | 910 |
| MGM Resorts International 5.50% 2027 | 5,255 | 5,843 |
| Morongo Band of Mission Indians 7.00% 20395 | 11,225 | 13,010 |
| Neiman Marcus Group Ltd. LLC 8.75% 20245 | 5,202 | 1,717 |
| Neiman Marcus Group Ltd. LLC 14.00% 2024 (42.86% PIK)5,7 | 3,266 | 1,698 |
| Newell Rubbermaid Inc. 3.85% 2023 | 16,509 | 17,156 |
| Newell Rubbermaid Inc. 4.20% 2026 | 18,569 | 19,360 |
| Newell Rubbermaid Inc. 5.50% 2046 | 1,630 | 1,746 |
| Nissan Motor Co., Ltd. 2.60% 20225 | 15,570 | 15,589 |
| Panther BF Aggregator 2, LP 6.25% 20265 | 775 | 837 |
| Party City Holdings Inc. 6.625% 20265 | 2,640 | 1,867 |
| PetSmart, Inc. 7.125% 20235 | 4,900 | 4,814 |
| PetSmart, Inc. 5.875% 20255 | 3,975 | 4,059 |
| PetSmart, Inc. 8.875% 20255 | 2,650 | 2,624 |
| S.A.C.I. Falabella 3.75% 20275 | 8,295 | 8,476 |
| Sands China Ltd. 4.60% 2023 | 9,091 | 9,612 |
| Sands China Ltd. 5.40% 2028 | 45,000 | 50,851 |
| Scientific Games Corp. 8.25% 20265 | 10,165 | 11,226 |
| Starbucks Corp. 3.10% 2023 | 15,237 | 15,734 |
| Starbucks Corp. 3.80% 2025 | 14,000 | 15,082 |
| Starbucks Corp. 4.50% 2048 | 6,150 | 7,154 |
| Toyota Motor Credit Corp. 2.15% 2022 | 2,000 | 2,015 |
| Toyota Motor Credit Corp. 2.60% 2022 | 9,860 | 10,008 |
| Toyota Motor Credit Corp. 2.70% 2023 | 5,300 | 5,408 |
| Toyota Motor Credit Corp. 3.20% 2027 | 1,330 | 1,407 |
| Toyota Motor Credit Corp. 3.05% 2028 | 2,589 | 2,729 |
| Volkswagen Group of America Finance, LLC 4.00% 20215 | 8,028 | 8,303 |
| Volkswagen Group of America Finance, LLC 2.70% 20225 | 11,831 | 11,968 |
| Volkswagen Group of America Finance, LLC 4.25% 20235 | 3,000 | 3,197 |
| Volkswagen Group of America Finance, LLC 2.85% 20245 | 22,214 | 22,571 |
The Bond Fund of America — Page 17 of 49
Bonds, notes & other debt instruments (continued)
Corporate bonds & notes (continued)
Consumer discretionary (continued) | Principal amount
(000) | Value
(000) |
| Volkswagen Group of America Finance, LLC 4.625% 20255 | $3,477 | $3,849 |
| Volkswagen Group of America Finance, LLC 4.75% 20285 | 2,000 | 2,253 |
| | | 1,143,695 |
| Information technology 1.47% | | |
| Broadcom Inc. 4.25% 20265 | 100,225 | 106,571 |
| Broadcom Inc. 4.75% 20295 | 175,929 | 192,535 |
| Broadcom Ltd. 3.00% 2022 | 40,500 | 41,096 |
| Broadcom Ltd. 2.65% 2023 | 16,500 | 16,595 |
| Broadcom Ltd. 3.625% 2024 | 36,609 | 37,937 |
| Broadcom Ltd. 3.875% 2027 | 48,250 | 50,110 |
| Broadcom Ltd. 3.50% 2028 | 27,782 | 27,974 |
| CCC Information Services Inc., Term Loan, (3-month USD-LIBOR + 6.75%) 8.549% 20252,10 | 1,225 | 1,236 |
| Fidelity National Information Services, Inc. 3.75% 2029 | 2,365 | 2,588 |
| Financial & Risk US Holdings, Inc. 6.25% 20265 | 10,100 | 11,040 |
| Financial & Risk US Holdings, Inc. 8.25% 20265 | 2,150 | 2,425 |
| Fiserv, Inc. 2.75% 2024 | 19,000 | 19,341 |
| Fiserv, Inc. 3.50% 2029 | 44,285 | 46,573 |
| Fiserv, Inc. 4.40% 2049 | 13,825 | 15,712 |
| International Business Machines Corp. 3.00% 2024 | 32,750 | 33,934 |
| Kronos Inc., Term Loan B, (3-month USD-LIBOR + 8.25%) 10.159% 20242,10 | 1,475 | 1,515 |
| Microsoft Corp. 1.55% 2021 | 3,975 | 3,970 |
| Microsoft Corp. 3.125% 2025 | 5,750 | 6,086 |
| Microsoft Corp. 3.30% 2027 | 20,030 | 21,410 |
| Microsoft Corp. 3.70% 2046 | 3,250 | 3,670 |
| Microsoft Corp. 4.25% 2047 | 2,125 | 2,603 |
MoneyGram International Inc., Term Loan B,
(3-month USD-LIBOR + 6.00%) 7.799% 20232,8,10 | 5,970 | 5,418 |
| Oracle Corp. 1.90% 2021 | 12,250 | 12,276 |
| PayPal Holdings, Inc. 2.40% 2024 | 43,150 | 43,599 |
| PayPal Holdings, Inc. 2.65% 2026 | 12,234 | 12,410 |
| PayPal Holdings, Inc. 2.85% 2029 | 12,580 | 12,669 |
| Unisys Corp. 10.75% 20225 | 3,325 | 3,584 |
| Visa Inc. 2.15% 2022 | 4,535 | 4,586 |
| Xerox Corp. 3.50% 2020 | 500 | 505 |
| | | 739,968 |
| Industrials 1.41% | | |
| 3M Co. 2.25% 2023 | 10,722 | 10,812 |
| 3M Co. 3.25% 2024 | 9,872 | 10,331 |
| ABB Finance (USA) Inc. 2.875% 2022 | 1,000 | 1,021 |
| Air Lease Corp. 2.25% 2023 | 5,226 | 5,231 |
| Airbus Group SE 2.70% 20235 | 985 | 1,002 |
| Ashtead Group PLC 4.00% 20285 | 11,531 | 11,675 |
| Avolon Holdings Funding Ltd. 3.625% 20225 | 4,500 | 4,616 |
| Avolon Holdings Funding Ltd. 3.95% 20245 | 51,833 | 54,080 |
| Beacon Roofing Supply, Inc. 4.875% 20255 | 11,000 | 11,078 |
| Boeing Co. 2.80% 2024 | 3,485 | 3,564 |
| Boeing Co. 3.10% 2026 | 26,350 | 27,189 |
| Boeing Co. 2.70% 2027 | 11,740 | 11,901 |
| Boeing Co. 3.20% 2029 | 13,845 | 14,432 |
| Boeing Co. 2.95% 2030 | 12,617 | 12,912 |
| Boeing Co. 3.60% 2034 | 6,790 | 7,273 |
| Boeing Co. 3.90% 2049 | 5,430 | 5,885 |
The Bond Fund of America — Page 18 of 49
Bonds, notes & other debt instruments (continued)
Corporate bonds & notes (continued)
Industrials (continued) | Principal amount
(000) | Value
(000) |
| Bohai Financial Investment Holding Co., Ltd. 5.25% 20225 | $3,242 | $3,463 |
| Continental Airlines, Inc., Series 1999-2, Class A1, 7.256% 2021 | 13 | 13 |
| Continental Airlines, Inc., Series 2001-1, Class A1, 6.703% 2022 | 1,810 | 1,903 |
| Continental Airlines, Inc., Series 2000-2, Class A1, 7.707% 2022 | 1,660 | 1,720 |
| Continental Airlines, Inc., Series 2000-1, Class A1, 8.048% 2022 | 1,768 | 1,800 |
| CSX Corp. 3.80% 2028 | 9,435 | 10,292 |
| CSX Corp. 4.25% 2029 | 7,502 | 8,446 |
| CSX Corp. 2.40% 2030 | 17,855 | 17,486 |
| CSX Corp. 3.35% 2049 | 3,475 | 3,432 |
| Delta Air Lines, Inc., Series 2002-1, Class G-1, MBIA insured, 6.718% 2024 | 888 | 934 |
| DP World Crescent 4.848% 20285 | 3,180 | 3,494 |
| Dun & Bradstreet Corp. 6.875% 20265 | 5,395 | 5,965 |
| Dun & Bradstreet Corp. 10.25% 20275 | 3,535 | 4,072 |
| ENA Norte Trust 4.95% 20285 | 2,069 | 2,142 |
| ENA Norte Trust 4.95% 2028 | 545 | 564 |
| Euramax International, Inc. 12.00% 20205 | 2,075 | 2,060 |
| F-Brasile SpA 7.375% 20265 | 1,790 | 1,897 |
| Fortive Corp. 2.35% 2021 | 3,550 | 3,565 |
| FXI Holdings, Inc. 12.25% 20265 | 8,300 | 8,658 |
| GE Capital International Funding Co. 4.418% 2035 | 2,500 | 2,666 |
| General Dynamics Corp. 3.375% 2023 | 6,645 | 6,943 |
| General Dynamics Corp. 3.50% 2025 | 8,025 | 8,598 |
| General Dynamics Corp. 3.75% 2028 | 7,570 | 8,331 |
| General Electric Capital Corp. 3.373% 2025 | 32,950 | 34,323 |
| General Electric Co. 2.70% 2022 | 1,000 | 1,014 |
| General Electric Co. 4.125% 2042 | 40 | 41 |
| Hardwoods Acquisition Inc. 7.50% 20215 | 5,780 | 2,948 |
| Harris Corp. 3.832% 2025 | 885 | 944 |
| Honeywell International Inc. 2.30% 2024 | 22,497 | 22,804 |
| Honeywell International Inc. 2.70% 2029 | 9,333 | 9,556 |
| IHS Markit Ltd. 4.25% 2029 | 8,000 | 8,631 |
| Lima Metro Line 2 Finance Ltd. 5.875% 20345 | 3,167 | 3,675 |
| Lima Metro Line 2 Finance Ltd. 4.35% 20365 | 465 | 494 |
| Lockheed Martin Corp. 2.50% 2020 | 2,805 | 2,820 |
| Lockheed Martin Corp. 4.50% 2036 | 815 | 966 |
| Lockheed Martin Corp. 4.70% 2046 | 5,635 | 7,184 |
| Mexico City Airport Trust 5.50% 2046 | 3,369 | 3,486 |
| Mexico City Airport Trust 5.50% 2047 | 7,316 | 7,570 |
| Mexico City Airport Trust 5.50% 20475 | 1,513 | 1,566 |
| Norfolk Southern Corp. 2.55% 2029 | 4,712 | 4,703 |
| Norfolk Southern Corp. 3.40% 2049 | 1,623 | 1,614 |
| Northrop Grumman Corp. 2.55% 2022 | 8,955 | 9,089 |
| Northrop Grumman Corp. 2.93% 2025 | 25,040 | 25,813 |
| Northrop Grumman Corp. 3.25% 2028 | 6,985 | 7,287 |
| Parker-Hannifin Corp. 2.70% 2024 | 3,770 | 3,852 |
| Parker-Hannifin Corp. 3.25% 2029 | 7,835 | 8,190 |
| Parker-Hannifin Corp. 4.00% 2049 | 600 | 650 |
| Pisces Parent LLC 8.00% 20265 | 5,651 | 5,905 |
| Republic Services, Inc. 2.50% 2024 | 7,000 | 7,081 |
| Rockwell Collins, Inc. 2.80% 2022 | 9,010 | 9,168 |
| Rockwell Collins, Inc. 3.20% 2024 | 10,105 | 10,516 |
| Roper Technologies, Inc. 2.80% 2021 | 860 | 873 |
| Rutas 2 and 7 Finance Ltd. 0% 20365 | 1,795 | 1,168 |
| Siemens AG 1.70% 20215 | 13,500 | 13,480 |
The Bond Fund of America — Page 19 of 49
Bonds, notes & other debt instruments (continued)
Corporate bonds & notes (continued)
Industrials (continued) | Principal amount
(000) | Value
(000) |
| Siemens AG 2.70% 20225 | $29,620 | $30,141 |
| Siemens AG 2.90% 20225 | 10,000 | 10,227 |
| Siemens AG 2.35% 20265 | 6,430 | 6,394 |
| Uber Technologies, Inc. 7.50% 20235 | 5,200 | 5,447 |
| Uber Technologies, Inc. 8.00% 20265 | 4,200 | 4,388 |
| Union Pacific Corp. 3.15% 2024 | 5,705 | 5,939 |
| Union Pacific Corp. 3.95% 2028 | 9,350 | 10,326 |
| Union Pacific Corp. 3.70% 2029 | 18,955 | 20,711 |
| Union Pacific Corp. 4.30% 2049 | 4,550 | 5,248 |
| Union Pacific Corp. 3.95% 2059 | 11,880 | 12,476 |
| United Technologies Corp. 3.65% 2023 | 13,000 | 13,703 |
| United Technologies Corp. 3.95% 2025 | 17,415 | 18,996 |
| United Technologies Corp. 2.65% 2026 | 500 | 512 |
| United Technologies Corp. 3.125% 2027 | 1,000 | 1,050 |
| United Technologies Corp. 4.125% 2028 | 6,320 | 7,119 |
| United Technologies Corp. 4.50% 2042 | 1,000 | 1,198 |
| United Technologies Corp. 4.625% 2048 | 500 | 626 |
| Vinci SA 3.75% 20295 | 7,514 | 8,197 |
| Waste Management, Inc. 2.95% 2024 | 10,000 | 10,332 |
| Wesco Aircraft Holdings, Inc. 8.50% 20245 | 7,000 | 7,260 |
| Westinghouse Air Brake Technologies Corp. 4.40% 20246 | 11,994 | 12,742 |
| | | 711,889 |
| Communication services 0.93% | | |
| América Móvil, SAB de CV 8.46% 2036 | MXN27,000 | 1,410 |
| AT&T Inc. 4.35% 2029 | $5,050 | 5,615 |
| CCO Holdings LLC and CCO Holdings Capital Corp. 3.579% 2020 | 300 | 302 |
| CCO Holdings LLC and CCO Holdings Capital Corp. 4.908% 2025 | 3,540 | 3,900 |
| CCO Holdings LLC and CCO Holdings Capital Corp. 3.75% 2028 | 5,990 | 6,211 |
| CCO Holdings LLC and CCO Holdings Capital Corp. 4.20% 2028 | 9,335 | 9,948 |
| CCO Holdings LLC and CCO Holdings Capital Corp. 5.05% 2029 | 4,000 | 4,536 |
| CCO Holdings LLC and CCO Holdings Capital Corp. 4.75% 20305 | 6,865 | 7,015 |
| CCO Holdings LLC and CCO Holdings Capital Corp. 6.484% 2045 | 6,850 | 8,555 |
| CCO Holdings LLC and CCO Holdings Capital Corp. 5.375% 2047 | 8,300 | 9,301 |
| CCO Holdings LLC and CCO Holdings Capital Corp. 5.75% 2048 | 19,618 | 22,884 |
| CCO Holdings LLC and CCO Holdings Capital Corp. 5.125% 2049 | 19,883 | 21,612 |
| CCO Holdings LLC and CCO Holdings Capital Corp. 4.80% 2050 | 10,500 | 11,052 |
| CenturyLink, Inc. 5.125% 20265 | 6,800 | 6,937 |
| Comcast Corp. 3.95% 2025 | 10,500 | 11,459 |
| Comcast Corp. 3.30% 2027 | 5,075 | 5,375 |
| Comcast Corp. 4.15% 2028 | 4,000 | 4,503 |
| Comcast Corp. 2.65% 2030 | 61,390 | 61,638 |
| Comcast Corp. 4.60% 2038 | 2,500 | 2,979 |
| Comcast Corp. 3.25% 2039 | 2,120 | 2,152 |
| Comcast Corp. 4.00% 2047 | 2,330 | 2,565 |
| Comcast Corp. 4.00% 2048 | 1,580 | 1,754 |
| Comcast Corp. 4.70% 2048 | 3,970 | 4,893 |
| Comcast Corp. 3.45% 2050 | 8,600 | 8,810 |
| Digicel Group Ltd. 6.00% 20215 | 765 | 599 |
| Fox Corp. 4.03% 20245 | 4,090 | 4,360 |
| Fox Corp. 5.576% 20495 | 8,355 | 10,627 |
| France Télécom 9.00% 20316 | 2,300 | 3,560 |
| Frontier Communications Corp. 8.00% 20275 | 6,660 | 6,972 |
| Grupo Televisa, SAB 7.25% 2043 | MXN25,290 | 1,006 |
The Bond Fund of America — Page 20 of 49
Bonds, notes & other debt instruments (continued)
Corporate bonds & notes (continued)
Communication services (continued) | Principal amount
(000) | Value
(000) |
| Level 3 Communications, Inc. 4.625% 20275 | $16,300 | $16,718 |
| Level 3 Communications, Inc. 3.875% 20295 | 6,900 | 6,965 |
| Ligado Networks, Term Loan, (3-month USD-LIBOR + 8.75%) 10.85% 2020 (100% PIK)2,7,10 | 2,275 | 1,451 |
| NBCUniversal Enterprise, Inc., junior subordinated, 5.25%5 | 29,045 | 29,999 |
| Netflix, Inc. 5.875% 2028 | 18,500 | 20,543 |
| Netflix, Inc. 5.375% 20295 | 6,440 | 6,870 |
| Netflix, Inc. 4.875% 20305 | 50,941 | 51,831 |
| SoftBank Group Corp. 3.36% 20235 | 10,041 | 10,143 |
| Sprint Corp. 6.875% 2028 | 5,200 | 5,613 |
| Tencent Holdings Ltd. 3.28% 20245 | 23,000 | 23,673 |
| Tencent Holdings Ltd. 3.595% 2028 | 5,000 | 5,222 |
| Verizon Communications Inc. 4.40% 2034 | 10,000 | 11,587 |
| Vodafone Group PLC 5.25% 2048 | 13,985 | 16,836 |
| Vodafone Group PLC 4.25% 2050 | 7,475 | 7,811 |
| WPP Finance 2010 3.75% 2024 | 1,000 | 1,055 |
| | | 468,847 |
| Real estate 0.92% | | |
| Alexandria Real Estate Equities, Inc. 3.80% 2026 | 4,085 | 4,366 |
| Alexandria Real Estate Equities, Inc. 4.30% 2026 | 1,440 | 1,580 |
| Alexandria Real Estate Equities, Inc. 3.95% 2028 | 1,070 | 1,149 |
| Alexandria Real Estate Equities, Inc. 2.75% 2029 | 1,213 | 1,198 |
| Alexandria Real Estate Equities, Inc. 4.50% 2029 | 2,110 | 2,378 |
| Alexandria Real Estate Equities, Inc. 3.375% 2031 | 2,615 | 2,729 |
| American Campus Communities, Inc. 3.35% 2020 | 11,210 | 11,304 |
| American Campus Communities, Inc. 3.75% 2023 | 15,160 | 15,798 |
| American Campus Communities, Inc. 4.125% 2024 | 11,740 | 12,519 |
| American Campus Communities, Inc. 3.30% 2026 | 18,950 | 19,638 |
| American Campus Communities, Inc. 3.625% 2027 | 20,865 | 22,002 |
| EPR Properties 3.75% 2029 | 11,000 | 11,149 |
| Equinix, Inc. 2.625% 2024 | 48,182 | 48,372 |
| Equinix, Inc. 2.90% 2026 | 24,462 | 24,551 |
| Equinix, Inc. 3.20% 2029 | 22,854 | 22,981 |
| Essex Portfolio LP 3.625% 2022 | 4,370 | 4,520 |
| Essex Portfolio LP 3.25% 2023 | 4,935 | 5,071 |
| Essex Portfolio LP 3.875% 2024 | 5,500 | 5,814 |
| Essex Portfolio LP 3.50% 2025 | 4,800 | 5,038 |
| Essex Portfolio LP 3.375% 2026 | 1,070 | 1,112 |
| Essex Portfolio LP 4.00% 2029 | 1,960 | 2,129 |
| Gaming and Leisure Properties, Inc. 3.35% 2024 | 2,333 | 2,388 |
| Gaming and Leisure Properties, Inc. 4.00% 2030 | 9,314 | 9,528 |
| Hospitality Properties Trust 4.25% 2021 | 20,250 | 20,542 |
| Hospitality Properties Trust 5.00% 2022 | 14,650 | 15,410 |
| Hospitality Properties Trust 4.50% 2023 | 9,680 | 10,063 |
| Hospitality Properties Trust 4.50% 2025 | 6,875 | 7,072 |
| Hospitality Properties Trust 3.95% 2028 | 100 | 98 |
| Howard Hughes Corp. 5.375% 20255 | 6,200 | 6,479 |
| Iron Mountain Inc. 5.25% 20285 | 6,750 | 7,033 |
| Kimco Realty Corp. 3.40% 2022 | 8,655 | 8,941 |
| Kimco Realty Corp. 3.125% 2023 | 3,175 | 3,253 |
| Kimco Realty Corp. 2.70% 2024 | 16,980 | 17,182 |
| Kimco Realty Corp. 3.30% 2025 | 5,000 | 5,203 |
| Omega Healthcare Investors, Inc. 4.375% 2023 | 2,100 | 2,228 |
| Piedmont Operating Partnership LP 3.40% 2023 | 2,800 | 2,868 |
The Bond Fund of America — Page 21 of 49
Bonds, notes & other debt instruments (continued)
Corporate bonds & notes (continued)
Real estate (continued) | Principal amount
(000) | Value
(000) |
| Piedmont Operating Partnership LP 4.45% 2024 | $3,000 | $3,199 |
| Scentre Group 2.375% 20215 | 11,410 | 11,430 |
| Scentre Group 3.25% 20255 | 10,655 | 10,900 |
| Scentre Group 3.50% 20255 | 7,550 | 7,835 |
| WEA Finance LLC 3.25% 20205 | 11,935 | 12,032 |
| WEA Finance LLC 3.75% 20245 | 2,480 | 2,611 |
| Westfield Corp. Ltd. 3.15% 20225 | 32,440 | 33,160 |
| Westfield Corp. Ltd. 3.50% 20295 | 35,200 | 36,478 |
| | | 461,331 |
| Materials 0.59% | | |
| Air Liquide SA 2.25% 20295 | 3,643 | 3,574 |
| ArcelorMittal 3.60% 2024 | 30,625 | 31,443 |
BHP Billiton Finance Ltd. 6.25% 2075
(USD Semi Annual 30/360 (vs. 3-month USD-LIBOR) 5-year + 4.971% on 10/19/2020)5,6 | 6,440 | 6,649 |
| Braskem Idesa Sapi 7.45% 20295 | 5,946 | 6,346 |
| Braskem SA 4.50% 20305 | 29,325 | 29,222 |
| Chevron Phillips Chemical Co. LLC 3.30% 20235 | 9,250 | 9,526 |
| Chevron Phillips Chemical Co. LLC 3.70% 20285 | 3,000 | 3,176 |
| Consolidated Energy Finance SA 6.50% 20265 | 7,960 | 7,485 |
| CRH America, Inc. 3.875% 20255 | 2,000 | 2,137 |
| CRH America, Inc. 5.125% 20455 | 2,000 | 2,333 |
| Cydsa SAB de CV 6.25% 20275 | 2,530 | 2,607 |
| Cydsa SAB de CV 6.25% 2027 | 1,500 | 1,546 |
| Dow Chemical Co. 3.15% 2024 | 1,645 | 1,706 |
| Dow Chemical Co. 3.625% 2026 | 14,418 | 15,169 |
| Dow Chemical Co. 4.80% 2028 | 4,000 | 4,578 |
| Dow Chemical Co. 4.625% 2044 | 1,100 | 1,217 |
| Dow Chemical Co. 5.55% 2048 | 8,600 | 10,737 |
| Dow Chemical Co. 4.80% 2049 | 9,727 | 11,264 |
| DowDuPont Inc. 4.493% 2025 | 3,210 | 3,534 |
| DowDuPont Inc. 5.419% 2048 | 12,159 | 15,031 |
| First Quantum Minerals Ltd. 6.50% 20245 | 11,500 | 11,553 |
| First Quantum Minerals Ltd. 7.50% 20255 | 3,000 | 3,074 |
| First Quantum Minerals Ltd. 6.875% 20265 | 3,600 | 3,652 |
| Glencore Funding LLC 4.125% 20245 | 25,850 | 27,071 |
| Hexion Inc. 7.875% 20275 | 10,000 | 10,425 |
| Holcim Ltd. 5.15% 20235 | 3,515 | 3,776 |
| LSB Industries, Inc. 9.625% 20235 | 4,025 | 4,145 |
| LYB International Finance III, LLC 4.20% 2049 | 1,740 | 1,818 |
| LyondellBasell Industries NV 6.00% 2021 | 900 | 956 |
| Mosaic Co. 4.05% 2027 | 1,000 | 1,038 |
| Nova Chemicals Corp. 5.25% 20275 | 7,500 | 7,720 |
| Nutrien Ltd. 4.20% 2029 | 500 | 551 |
| Nutrien Ltd. 5.00% 2049 | 7,500 | 8,931 |
| Praxair, Inc. 3.00% 2021 | 2,000 | 2,041 |
| Sherwin-Williams Co. 2.75% 2022 | 1,958 | 1,992 |
| Sherwin-Williams Co. 3.125% 2024 | 6,500 | 6,718 |
| Sherwin-Williams Co. 3.45% 2027 | 112 | 119 |
| Sherwin-Williams Co. 2.95% 2029 | 7,250 | 7,349 |
| Sherwin-Williams Co. 4.50% 2047 | 2,601 | 2,951 |
| Sherwin-Williams Co. 3.80% 2049 | 5,038 | 5,142 |
| TPC Group Inc. 10.50% 20245 | 3,629 | 3,664 |
| Tronox Ltd. 6.50% 20265 | 3,900 | 4,028 |
The Bond Fund of America — Page 22 of 49
Bonds, notes & other debt instruments (continued)
Corporate bonds & notes (continued)
Materials (continued) | Principal amount
(000) | Value
(000) |
| Warrior Met Coal, Inc. 8.00% 20245 | $1,865 | $1,894 |
| Westlake Chemical Corp. 5.00% 2046 | 7,090 | 7,589 |
| Westlake Chemical Corp. 4.375% 2047 | 1,960 | 1,981 |
| | | 299,458 |
| Total corporate bonds & notes | | 13,331,329 |
Mortgage-backed obligations 21.13%
Federal agency mortgage-backed obligations 20.20% | | |
| Bunker Hill Loan Depositary Trust, Series 2019-1, Class A1, 3.613% 20482,5,12 | 2,312 | 2,342 |
| Bunker Hill Loan Depositary Trust, Series 2019-1, Class A3, 3.919% 20482,5,12 | 3,444 | 3,454 |
| Fannie Mae 7.00% 203612 | 127 | 134 |
| Fannie Mae 6.00% 203712 | 4 | 4 |
| Fannie Mae 7.00% 203712 | 156 | 167 |
| Fannie Mae 7.00% 203712 | 108 | 114 |
| Fannie Mae 7.00% 203712 | 88 | 91 |
| Fannie Mae 7.50% 203712 | 107 | 113 |
| Fannie Mae 7.50% 203712 | 59 | 68 |
| Fannie Mae 7.50% 203712 | 47 | 53 |
| Fannie Mae 4.50% 204612 | 1,317 | 1,370 |
| Fannie Mae 4.50% 204612 | 840 | 873 |
| Fannie Mae 4.50% 204712 | 3,011 | 3,130 |
| Fannie Mae 7.00% 204712 | 12 | 14 |
| Fannie Mae Pool #MA1079 2.50% 202212 | 1,000 | 1,008 |
| Fannie Mae Pool #MA1104 2.50% 202212 | 1,000 | 1,008 |
| Fannie Mae Pool #FM1004 2.50% 202312 | 4,000 | 4,034 |
| Fannie Mae Pool #MA1370 2.50% 202312 | 1,000 | 1,008 |
| Fannie Mae Pool #MA1721 2.50% 202312 | 9 | 9 |
| Fannie Mae Pool #993733 5.50% 202312 | 1,567 | 1,621 |
| Fannie Mae Pool #976945 5.50% 202312 | 8 | 9 |
| Fannie Mae Pool #976948 6.00% 202312 | 49 | 50 |
| Fannie Mae Pool #FM0000 2.50% 202412 | 1,000 | 1,008 |
| Fannie Mae Pool #932119 4.50% 202412 | 1,477 | 1,541 |
| Fannie Mae Pool #AD6392 4.50% 202512 | 1,584 | 1,665 |
| Fannie Mae Pool #AD3149 4.50% 202512 | 884 | 929 |
| Fannie Mae Pool #AD5692 4.50% 202512 | 840 | 884 |
| Fannie Mae Pool #AB1068 4.50% 202512 | 6 | 7 |
| Fannie Mae Pool #MA2776 2.50% 202612 | 9,455 | 9,538 |
| Fannie Mae Pool #AJ5673 3.00% 202612 | 1,275 | 1,313 |
| Fannie Mae Pool #AJ5476 3.00% 202612 | 260 | 267 |
| Fannie Mae Pool #AR8558 3.00% 202712 | 811 | 837 |
| Fannie Mae Pool #MA2973 3.00% 202712 | 518 | 531 |
| Fannie Mae Pool #MA3131 3.00% 202712 | 317 | 326 |
| Fannie Mae Pool #AK3260 3.00% 202712 | 312 | 322 |
| Fannie Mae Pool #AK0490 3.00% 202712 | 192 | 197 |
| Fannie Mae Pool #AB5095 3.00% 202712 | 60 | 62 |
| Fannie Mae Pool #AX5306 3.50% 202712 | 20,434 | 21,175 |
| Fannie Mae Pool #AS3604 3.00% 202912 | 129 | 132 |
| Fannie Mae Pool #BM4299 3.00% 203012 | 198 | 203 |
| Fannie Mae Pool #CA3178 3.00% 203112 | 1,326 | 1,365 |
| Fannie Mae Pool #890710 3.00% 203112 | 28 | 28 |
| Fannie Mae Pool #BM4151 2.50% 203212 | 42,155 | 42,645 |
| Fannie Mae Pool #BH7659 3.00% 203212 | 19,869 | 20,422 |
| Fannie Mae Pool #CA3274 3.00% 203212 | 950 | 978 |
The Bond Fund of America — Page 23 of 49
Bonds, notes & other debt instruments (continued)
Mortgage-backed obligations (continued)
Federal agency mortgage-backed obligations (continued) | Principal amount
(000) | Value
(000) |
| Fannie Mae Pool #BE3641 3.00% 203212 | $29 | $30 |
| Fannie Mae Pool #BK1209 3.00% 203312 | 7,146 | 7,345 |
| Fannie Mae Pool #BH9235 3.00% 203312 | 1,752 | 1,807 |
| Fannie Mae Pool #MA3409 3.00% 203312 | 1,741 | 1,785 |
| Fannie Mae Pool #BJ4890 3.00% 203312 | 844 | 871 |
| Fannie Mae Pool #BK1112 3.00% 203312 | 846 | 869 |
| Fannie Mae Pool #BK5161 3.00% 203312 | 828 | 851 |
| Fannie Mae Pool #BJ4685 3.00% 203312 | 736 | 756 |
| Fannie Mae Pool #MA3461 3.00% 203312 | 646 | 662 |
| Fannie Mae Pool #MA3247 3.00% 203312 | 619 | 636 |
| Fannie Mae Pool #BM5111 3.00% 203312 | 541 | 558 |
| Fannie Mae Pool #BK5466 3.00% 203312 | 536 | 551 |
| Fannie Mae Pool #BJ4856 3.00% 203312 | 526 | 543 |
| Fannie Mae Pool #BK6720 3.00% 203312 | 527 | 542 |
| Fannie Mae Pool #BK7453 3.00% 203312 | 513 | 527 |
| Fannie Mae Pool #MA3516 3.00% 203312 | 508 | 521 |
| Fannie Mae Pool #MA3283 3.00% 203312 | 366 | 377 |
| Fannie Mae Pool #BK7123 3.00% 203312 | 362 | 371 |
| Fannie Mae Pool #MA3339 3.00% 203312 | 338 | 348 |
| Fannie Mae Pool #BJ5705 3.00% 203312 | 330 | 338 |
| Fannie Mae Pool #BK9015 3.00% 203312 | 291 | 299 |
| Fannie Mae Pool #BK4146 3.00% 203312 | 163 | 168 |
| Fannie Mae Pool #BK5472 3.00% 203312 | 37 | 38 |
| Fannie Mae Pool #CA2106 3.50% 203312 | 409 | 424 |
| Fannie Mae Pool #MA3518 4.00% 203312 | 76 | 79 |
| Fannie Mae Pool #MA3764 2.50% 203412 | 132,955 | 134,124 |
| Fannie Mae Pool #MA3827 2.50% 203412 | 117,582 | 118,616 |
| Fannie Mae Pool #MA3797 2.50% 203412 | 7,999 | 8,070 |
| Fannie Mae Pool #FM2057 2.50% 203412 | 7,999 | 8,070 |
| Fannie Mae Pool #BJ9733 2.50% 203412 | 7,999 | 8,069 |
| Fannie Mae Pool #CA4453 2.50% 203412 | 7,990 | 8,061 |
| Fannie Mae Pool #BO1359 2.50% 203412 | 4,000 | 4,038 |
| Fannie Mae Pool #MA3674 2.50% 203412 | 1,000 | 1,009 |
| Fannie Mae Pool #CA4922 3.00% 203412 | 10,611 | 10,882 |
| Fannie Mae Pool #BN4889 3.00% 203412 | 2,177 | 2,232 |
| Fannie Mae Pool #BJ7631 3.00% 203412 | 796 | 816 |
| Fannie Mae Pool #BK9093 3.00% 203412 | 529 | 543 |
| Fannie Mae Pool #FM1776 3.00% 203412 | 430 | 441 |
| Fannie Mae Pool #BN3975 3.00% 203412 | 411 | 421 |
| Fannie Mae Pool #BN8602 3.00% 203412 | 395 | 405 |
| Fannie Mae Pool #BN6313 3.00% 203412 | 370 | 380 |
| Fannie Mae Pool #BN9743 3.00% 203412 | 369 | 378 |
| Fannie Mae Pool #MA3896 2.50% 203512 | 15,658 | 15,796 |
| Fannie Mae Pool #MA3897 3.00% 203512 | 27,143 | 27,819 |
| Fannie Mae Pool #AS8355 3.00% 203612 | 22,318 | 22,905 |
| Fannie Mae Pool #AS8554 3.00% 203612 | 2,585 | 2,653 |
| Fannie Mae Pool #MA2746 4.00% 203612 | 4,669 | 4,975 |
| Fannie Mae Pool #MA2588 4.00% 203612 | 3,632 | 3,869 |
| Fannie Mae Pool #MA2787 4.00% 203612 | 2,419 | 2,577 |
| Fannie Mae Pool #MA2717 4.00% 203612 | 2,291 | 2,441 |
| Fannie Mae Pool #AS6870 4.00% 203612 | 1,012 | 1,078 |
| Fannie Mae Pool #MA2897 3.00% 203712 | 48,808 | 50,090 |
| Fannie Mae Pool #MA2866 3.00% 203712 | 27,840 | 28,571 |
| Fannie Mae Pool #924866 3.64% 20372,12 | 29 | 30 |
The Bond Fund of America — Page 24 of 49
Bonds, notes & other debt instruments (continued)
Mortgage-backed obligations (continued)
Federal agency mortgage-backed obligations (continued) | Principal amount
(000) | Value
(000) |
| Fannie Mae Pool #945680 6.00% 203712 | $38 | $43 |
| Fannie Mae Pool #954936 7.00% 203712 | 41 | 44 |
| Fannie Mae Pool #889982 5.50% 203812 | 36 | 41 |
| Fannie Mae Pool #988588 5.50% 203812 | 6 | 7 |
| Fannie Mae Pool #AC2641 4.50% 203912 | 6,755 | 7,333 |
| Fannie Mae Pool #AE7567 4.00% 204012 | 5,385 | 5,777 |
| Fannie Mae Pool #AE1761 4.00% 204012 | 4,881 | 5,237 |
| Fannie Mae Pool #AH0007 4.00% 204012 | 4,586 | 4,920 |
| Fannie Mae Pool #AH0539 4.00% 204012 | 1,017 | 1,091 |
| Fannie Mae Pool #AE8073 4.00% 204012 | 795 | 854 |
| Fannie Mae Pool #AD8522 4.00% 204012 | 255 | 274 |
| Fannie Mae Pool #AE5471 4.50% 204012 | 1,423 | 1,546 |
| Fannie Mae Pool #AB1297 5.00% 204012 | 579 | 639 |
| Fannie Mae Pool #AJ7471 4.00% 204112 | 1,590 | 1,701 |
| Fannie Mae Pool #AB4050 4.00% 204112 | 1,269 | 1,365 |
| Fannie Mae Pool #AI5172 4.00% 204112 | 1,012 | 1,072 |
| Fannie Mae Pool #AJ4189 4.00% 204112 | 829 | 893 |
| Fannie Mae Pool #AJ4154 4.00% 204112 | 757 | 814 |
| Fannie Mae Pool #AJ0257 4.00% 204112 | 330 | 356 |
| Fannie Mae Pool #AL0658 4.50% 204112 | 1,552 | 1,686 |
| Fannie Mae Pool #AI1862 5.00% 204112 | 2,640 | 2,942 |
| Fannie Mae Pool #AH6099 5.00% 204112 | 2,669 | 2,886 |
| Fannie Mae Pool #AI3510 5.00% 204112 | 1,685 | 1,877 |
| Fannie Mae Pool #AJ0704 5.00% 204112 | 1,395 | 1,555 |
| Fannie Mae Pool #AJ5391 5.00% 204112 | 932 | 1,039 |
| Fannie Mae Pool #AH9479 5.00% 204112 | 96 | 106 |
| Fannie Mae Pool #AH8144 5.00% 204112 | 89 | 98 |
| Fannie Mae Pool #AX3703 4.00% 204212 | 8,482 | 9,096 |
| Fannie Mae Pool #AK6740 4.00% 204212 | 7,575 | 8,127 |
| Fannie Mae Pool #AL2745 4.00% 204212 | 6,461 | 6,954 |
| Fannie Mae Pool #890407 4.00% 204212 | 2,117 | 2,272 |
| Fannie Mae Pool #AK4949 4.00% 204212 | 596 | 638 |
| Fannie Mae Pool #AV0786 4.00% 204312 | 6,390 | 6,848 |
| Fannie Mae Pool #AT2683 4.00% 204312 | 6,014 | 6,424 |
| Fannie Mae Pool #AL8421 3.50% 204412 | 32,182 | 33,910 |
| Fannie Mae Pool #AX0817 4.00% 204412 | 630 | 666 |
| Fannie Mae Pool #AZ7366 4.00% 204512 | 43,207 | 46,448 |
| Fannie Mae Pool #AS6348 4.00% 204512 | 7,155 | 7,677 |
| Fannie Mae Pool #BC4764 3.00% 204612 | 6,657 | 6,816 |
| Fannie Mae Pool #MA2833 3.00% 204612 | 109 | 111 |
| Fannie Mae Pool #BC9077 3.50% 204612 | 37,065 | 38,863 |
| Fannie Mae Pool #BD9236 3.50% 204612 | 876 | 917 |
| Fannie Mae Pool #AL8522 3.50% 204612 | 68 | 72 |
| Fannie Mae Pool #AL8387 4.00% 204612 | 34,741 | 36,816 |
| Fannie Mae Pool #AS6839 4.00% 204612 | 11,280 | 12,082 |
| Fannie Mae Pool #BC1352 4.00% 204612 | 3,970 | 4,156 |
| Fannie Mae Pool #BD1968 4.00% 204612 | 118 | 126 |
| Fannie Mae Pool #BC8647 4.50% 204612 | 1,421 | 1,502 |
| Fannie Mae Pool #BD9248 4.50% 204612 | 760 | 802 |
| Fannie Mae Pool #BD1550 4.50% 204612 | 730 | 778 |
| Fannie Mae Pool #BD7529 4.50% 204612 | 650 | 696 |
| Fannie Mae Pool #BD7600 4.50% 204612 | 382 | 402 |
| Fannie Mae Pool #BM5632 3.00% 204712 | 59,106 | 60,465 |
| Fannie Mae Pool #MA3147 3.00% 204712 | 15,399 | 15,712 |
The Bond Fund of America — Page 25 of 49
Bonds, notes & other debt instruments (continued)
Mortgage-backed obligations (continued)
Federal agency mortgage-backed obligations (continued) | Principal amount
(000) | Value
(000) |
| Fannie Mae Pool #CA0377 3.00% 204712 | $3,196 | $3,266 |
| Fannie Mae Pool #BD2440 3.50% 204712 | 5,786 | 6,008 |
| Fannie Mae Pool #BJ2524 3.50% 204712 | 1,639 | 1,704 |
| Fannie Mae Pool #CA0770 3.50% 204712 | 634 | 659 |
| Fannie Mae Pool #BJ1910 3.50% 204712 | 333 | 346 |
| Fannie Mae Pool #CA0453 4.00% 204712 | 24,608 | 25,770 |
| Fannie Mae Pool #MA3211 4.00% 204712 | 15,481 | 16,249 |
| Fannie Mae Pool #BD3554 4.00% 204712 | 3,140 | 3,281 |
| Fannie Mae Pool #BM4413 4.50% 204712 | 20,225 | 21,394 |
| Fannie Mae Pool #BH0876 4.50% 204712 | 6,688 | 7,089 |
| Fannie Mae Pool #BJ3525 4.50% 204712 | 4,512 | 4,756 |
| Fannie Mae Pool #BJ3558 4.50% 204712 | 3,540 | 3,740 |
| Fannie Mae Pool #BJ3581 4.50% 204712 | 2,110 | 2,229 |
| Fannie Mae Pool #257063 7.00% 204712 | 48 | 54 |
| Fannie Mae Pool #BF0293 3.00% 204812 | 27,053 | 27,698 |
| Fannie Mae Pool #CA2690 3.00% 204812 | 13,783 | 14,079 |
| Fannie Mae Pool #BJ7445 3.00% 204812 | 835 | 846 |
| Fannie Mae Pool #BM4488 3.435% 20482,12 | 26,830 | 27,464 |
| Fannie Mae Pool #BF0318 3.50% 204812 | 102,346 | 107,192 |
| Fannie Mae Pool #CA1532 3.50% 204812 | 20,502 | 21,297 |
| Fannie Mae Pool #CA2452 3.50% 204812 | 13,206 | 13,618 |
| Fannie Mae Pool #BJ3790 3.50% 204812 | 5,249 | 5,454 |
| Fannie Mae Pool #CA1189 3.50% 204812 | 4,987 | 5,175 |
| Fannie Mae Pool #BJ4154 3.50% 204812 | 85 | 89 |
| Fannie Mae Pool #BK7608 4.00% 204812 | 108,960 | 113,403 |
| Fannie Mae Pool #MA3467 4.00% 204812 | 19,134 | 19,935 |
| Fannie Mae Pool #MA3443 4.00% 204812 | 18,434 | 19,160 |
| Fannie Mae Pool #BK7274 4.00% 204812 | 2,890 | 3,018 |
| Fannie Mae Pool #MA3384 4.00% 204812 | 2,441 | 2,548 |
| Fannie Mae Pool #BK8819 4.00% 204812 | 1,357 | 1,410 |
| Fannie Mae Pool #FM1437 4.00% 204812 | 983 | 1,025 |
| Fannie Mae Pool #MA3521 4.00% 204812 | 267 | 278 |
| Fannie Mae Pool #BK0163 4.50% 204812 | 6,759 | 7,141 |
| Fannie Mae Pool #BN1576 4.50% 204812 | 4,230 | 4,465 |
| Fannie Mae Pool #CA2056 4.50% 204812 | 3,036 | 3,208 |
| Fannie Mae Pool #BN3309 4.50% 204812 | 1,474 | 1,551 |
| Fannie Mae Pool #CA3099 4.50% 204812 | 373 | 393 |
| Fannie Mae Pool #CA2484 4.50% 204812 | 296 | 312 |
| Fannie Mae Pool #MA3496 4.50% 204812 | 211 | 223 |
| Fannie Mae Pool #BN2000 4.50% 204812 | 175 | 184 |
| Fannie Mae Pool #CA2166 4.50% 204812 | 55 | 59 |
| Fannie Mae Pool #MA3385 4.50% 204812 | 34 | 36 |
| Fannie Mae Pool #CA1574 5.00% 204812 | 19,018 | 20,409 |
| Fannie Mae Pool #MA3833 2.50% 204912 | 50,000 | 49,435 |
| Fannie Mae Pool #CA4858 3.00% 204912 | 288,941 | 295,251 |
| Fannie Mae Pool #CA4299 3.00% 204912 | 6,200 | 6,294 |
| Fannie Mae Pool #CA3807 3.00% 204912 | 4,648 | 4,783 |
| Fannie Mae Pool #CA4534 3.00% 204912 | 3,242 | 3,326 |
| Fannie Mae Pool #CA3806 3.00% 204912 | 2,351 | 2,422 |
| Fannie Mae Pool #BO0348 3.00% 204912 | 482 | 489 |
| Fannie Mae Pool #MA3803 3.50% 204912 | 172,169 | 177,157 |
| Fannie Mae Pool #MA3775 3.50% 204912 | 131,929 | 135,675 |
| Fannie Mae Pool #MA3692 3.50% 204912 | 101,594 | 104,406 |
| Fannie Mae Pool #CA4021 3.50% 204912 | 91,492 | 95,237 |
The Bond Fund of America — Page 26 of 49
Bonds, notes & other debt instruments (continued)
Mortgage-backed obligations (continued)
Federal agency mortgage-backed obligations (continued) | Principal amount
(000) | Value
(000) |
| Fannie Mae Pool #CA4358 3.50% 204912 | $56,129 | $57,671 |
| Fannie Mae Pool #CA4802 3.50% 204912 | 53,325 | 56,129 |
| Fannie Mae Pool #CA3309 3.50% 204912 | 41,980 | 43,337 |
| Fannie Mae Pool #CA4566 3.50% 204912 | 38,304 | 39,391 |
| Fannie Mae Pool #FM1886 3.50% 204912 | 26,727 | 27,590 |
| Fannie Mae Pool #MA3686 3.50% 204912 | 20,361 | 20,925 |
| Fannie Mae Pool #CA4026 3.50% 204912 | 12,393 | 12,775 |
| Fannie Mae Pool #BN7588 3.50% 204912 | 11,028 | 11,367 |
| Fannie Mae Pool #BO1588 3.50% 204912 | 9,974 | 10,440 |
| Fannie Mae Pool #FM0020 3.50% 204912 | 900 | 928 |
| Fannie Mae Pool #BN6683 3.50% 204912 | 646 | 665 |
| Fannie Mae Pool #BN3448 3.50% 204912 | 496 | 510 |
| Fannie Mae Pool #CA3663 3.50% 204912 | 194 | 200 |
| Fannie Mae Pool #FM1596 3.50% 204912 | 68 | 70 |
| Fannie Mae Pool #MA3614 3.50% 204912 | 54 | 55 |
| Fannie Mae Pool #BJ8402 3.549% 20492,12 | 4,721 | 4,858 |
| Fannie Mae Pool #FM1963 4.00% 204912 | 81,633 | 87,350 |
| Fannie Mae Pool #MA3776 4.00% 204912 | 27,072 | 28,256 |
| Fannie Mae Pool #BO2995 4.00% 204912 | 18,267 | 19,242 |
| Fannie Mae Pool #FM0021 4.00% 204912 | 18,086 | 18,866 |
| Fannie Mae Pool #FM1913 4.00% 204912 | 6,547 | 6,912 |
| Fannie Mae Pool #MA3804 4.00% 204912 | 2,915 | 3,045 |
| Fannie Mae Pool #BO2188 4.00% 204912 | 2,813 | 2,933 |
| Fannie Mae Pool #CA4574 4.00% 204912 | 871 | 908 |
| Fannie Mae Pool #MA3639 4.50% 204912 | 71,418 | 75,115 |
| Fannie Mae Pool #CA2963 4.50% 204912 | 7,193 | 7,567 |
| Fannie Mae Pool #FM1389 4.50% 204912 | 5,975 | 6,280 |
| Fannie Mae Pool #BN5444 4.50% 204912 | 3,552 | 3,742 |
| Fannie Mae Pool #MA3616 4.50% 204912 | 2,809 | 2,956 |
| Fannie Mae Pool #MA3593 4.50% 204912 | 2,586 | 2,721 |
| Fannie Mae Pool #MA3564 4.50% 204912 | 21 | 22 |
| Fannie Mae Pool #BN6006 4.50% 204912 | 11 | 11 |
| Fannie Mae Pool #MA3905 3.00% 205012 | 207,487 | 210,387 |
| Fannie Mae Pool #MA3906 3.50% 205012 | 46,349 | 47,806 |
| Fannie Mae Pool #BF0264 3.50% 205812 | 27,084 | 28,439 |
| Fannie Mae, Series 2001-4, Class NA, 9.013% 20252,12 | 3 | 4 |
| Fannie Mae, Series 2001-4, Class GA, 9.16% 20252,12 | 3 | 4 |
| Fannie Mae, Series 1998-W5, Class B3, 6.50% 20285,12 | 460 | 460 |
| Fannie Mae, Series 2002-W7, Class A5, 7.50% 202912 | 89 | 106 |
| Fannie Mae, Series 2001-25, Class ZA, 6.50% 203112 | 839 | 906 |
| Fannie Mae, Series 2001-20, Class E, 9.50% 20312,12 | 1 | 1 |
| Fannie Mae, Series 2001-T10, Class A1, 7.00% 204112 | 1,465 | 1,676 |
| Fannie Mae, Series 2001-50, Class BA, 7.00% 204112 | 266 | 299 |
| Fannie Mae, Series 2002-W3, Class A5, 7.50% 204112 | 741 | 875 |
| Fannie Mae, Series 2002-W1, Class 2A, 5.638% 20422,12 | 1,078 | 1,169 |
| Fannie Mae, Series 2017-M3, Class A2, Multi Family, 2.483% 20262,12 | 10 | 10 |
| Fannie Mae, Series 2017-M15, Class A2, Multi Family, 2.959% 20272,12 | 3,700 | 3,859 |
| Fannie Mae, Series 2017-M12, Class A2, Multi Family, 3.079% 20272,12 | 5,000 | 5,240 |
| Fannie Mae, Series 2006-51, Class PO, principal only, 0% 203612 | 751 | 684 |
| Fannie Mae, Series 2006-32, Class OA, principal only, 0% 203612 | 750 | 665 |
| Fannie Mae, Series 2006-96, Class OP, principal only, 0% 203612 | 257 | 231 |
| Freddie Mac 4.50% 203012 | 425 | 448 |
| Freddie Mac 5.50% 203312 | 3 | 4 |
| Freddie Mac 4.00% 203612 | 28,097 | 29,949 |
The Bond Fund of America — Page 27 of 49
Bonds, notes & other debt instruments (continued)
Mortgage-backed obligations (continued)
Federal agency mortgage-backed obligations (continued) | Principal amount
(000) | Value
(000) |
| Freddie Mac 4.00% 203612 | $6,792 | $7,240 |
| Freddie Mac 4.00% 203612 | 2,679 | 2,855 |
| Freddie Mac 4.00% 203612 | 2,448 | 2,609 |
| Freddie Mac 4.00% 203612 | 1,002 | 1,068 |
| Freddie Mac 3.00% 203712 | 1,357 | 1,394 |
| Freddie Mac 4.00% 203712 | 8,310 | 8,811 |
| Freddie Mac 4.50% 203712 | 2,673 | 2,904 |
| Freddie Mac 5.50% 203712 | 24 | 27 |
| Freddie Mac 5.50% 203712 | 5 | 6 |
| Freddie Mac 7.50% 203712 | 105 | 117 |
| Freddie Mac 5.50% 203812 | 736 | 827 |
| Freddie Mac 5.50% 203812 | 280 | 315 |
| Freddie Mac 5.50% 203812 | 119 | 134 |
| Freddie Mac 5.50% 203812 | 75 | 84 |
| Freddie Mac 5.50% 203812 | 4 | 4 |
| Freddie Mac 3.50% 203912 | 81,910 | 84,955 |
| Freddie Mac 3.50% 203912 | 35,374 | 36,612 |
| Freddie Mac 3.50% 203912 | 4,937 | 5,128 |
| Freddie Mac 4.50% 203912 | 693 | 753 |
| Freddie Mac 5.00% 203912 | 5,209 | 5,751 |
| Freddie Mac 5.50% 203912 | 1,733 | 1,953 |
| Freddie Mac 4.50% 204012 | 12,704 | 13,807 |
| Freddie Mac 4.50% 204012 | 14 | 15 |
| Freddie Mac 5.50% 204012 | 28 | 31 |
| Freddie Mac 4.50% 204112 | 5,380 | 5,849 |
| Freddie Mac 4.50% 204112 | 1,346 | 1,463 |
| Freddie Mac 4.50% 204112 | 740 | 804 |
| Freddie Mac 4.50% 204112 | 261 | 280 |
| Freddie Mac 4.50% 204112 | 12 | 13 |
| Freddie Mac 5.00% 204112 | 4,013 | 4,423 |
| Freddie Mac 5.00% 204112 | 1,547 | 1,682 |
| Freddie Mac 5.50% 204112 | 34 | 38 |
| Freddie Mac 4.00% 204312 | 10,493 | 11,239 |
| Freddie Mac 3.50% 204512 | 1,176 | 1,254 |
| Freddie Mac 4.00% 204512 | 1,809 | 1,919 |
| Freddie Mac 3.00% 204612 | 110,002 | 113,535 |
| Freddie Mac 3.50% 204612 | 629 | 648 |
| Freddie Mac 4.50% 204612 | 1,620 | 1,717 |
| Freddie Mac 4.50% 204612 | 890 | 959 |
| Freddie Mac 4.50% 204612 | 868 | 934 |
| Freddie Mac 4.50% 204612 | 661 | 710 |
| Freddie Mac 4.50% 204612 | 439 | 465 |
| Freddie Mac 3.50% 204712 | 65,902 | 68,542 |
| Freddie Mac 3.50% 204712 | 36,735 | 38,208 |
| Freddie Mac 3.50% 204712 | 24,180 | 25,142 |
| Freddie Mac 3.50% 204712 | 20,307 | 21,054 |
| Freddie Mac 3.50% 204712 | 7,055 | 7,348 |
| Freddie Mac 4.00% 204712 | 15,308 | 16,141 |
| Freddie Mac 4.00% 204712 | 13,692 | 14,396 |
| Freddie Mac 4.00% 204712 | 1,464 | 1,542 |
| Freddie Mac 4.50% 204712 | 4,744 | 5,006 |
| Freddie Mac 4.50% 204712 | 3,974 | 4,203 |
| Freddie Mac 4.50% 204712 | 2,905 | 3,071 |
| Freddie Mac 4.50% 204712 | 2,205 | 2,331 |
The Bond Fund of America — Page 28 of 49
Bonds, notes & other debt instruments (continued)
Mortgage-backed obligations (continued)
Federal agency mortgage-backed obligations (continued) | Principal amount
(000) | Value
(000) |
| Freddie Mac 6.50% 204712 | $194 | $208 |
| Freddie Mac 3.50% 204812 | 71,890 | 75,310 |
| Freddie Mac 3.50% 204812 | 57,388 | 60,593 |
| Freddie Mac 3.50% 204812 | 50,646 | 52,208 |
| Freddie Mac 3.50% 204812 | 43,921 | 45,286 |
| Freddie Mac 3.50% 204812 | 416 | 437 |
| Freddie Mac 4.00% 204812 | 15,462 | 16,252 |
| Freddie Mac 4.00% 204812 | 5,091 | 5,360 |
| Freddie Mac Pool #ZK7582 3.00% 202712 | 4,655 | 4,807 |
| Freddie Mac Pool #ZK7581 3.00% 202712 | 3,345 | 3,446 |
| Freddie Mac Pool #ZK3817 3.00% 202712 | 391 | 403 |
| Freddie Mac Pool #ZK3848 3.00% 202712 | 137 | 141 |
| Freddie Mac Pool #G15537 2.50% 202812 | 6,505 | 6,593 |
| Freddie Mac Pool #G15975 2.50% 202912 | 11,917 | 12,078 |
| Freddie Mac Pool #G15732 3.00% 203012 | 13,295 | 13,766 |
| Freddie Mac Pool #V61295 2.50% 203112 | 12,941 | 13,128 |
| Freddie Mac Pool #G18652 3.00% 203212 | 25,290 | 26,008 |
| Freddie Mac Pool #G18655 3.00% 203212 | 15,739 | 16,186 |
| Freddie Mac Pool #SB0032 3.50% 203212 | 22,590 | 23,410 |
| Freddie Mac Pool #ZT0716 3.00% 203312 | 28,476 | 29,214 |
| Freddie Mac Pool #ZS8715 3.00% 203312 | 12,456 | 12,772 |
| Freddie Mac Pool #ZT1931 3.00% 203312 | 217 | 222 |
| Freddie Mac Pool #SB8015 2.50% 203412 | 176,155 | 177,704 |
| Freddie Mac Pool #SB8010 2.50% 203412 | 24,451 | 24,666 |
| Freddie Mac Pool #SB8020 2.50% 203412 | 7,999 | 8,070 |
| Freddie Mac Pool #SB8013 2.50% 203412 | 7,999 | 8,070 |
| Freddie Mac Pool #SB0105 2.50% 203412 | 5,999 | 6,052 |
| Freddie Mac Pool #ZT2094 2.50% 203412 | 4,000 | 4,035 |
| Freddie Mac Pool #QN1174 2.50% 203412 | 3,000 | 3,026 |
| Freddie Mac Pool #SB8002 3.00% 203412 | 3,552 | 3,641 |
| Freddie Mac Pool #ZT2019 3.00% 203412 | 1,595 | 1,635 |
| Freddie Mac Pool #ZT2091 3.00% 203412 | 1,470 | 1,507 |
| Freddie Mac Pool #SB8021 3.00% 203412 | 1,000 | 1,026 |
| Freddie Mac Pool #ZT1731 3.00% 203412 | 115 | 118 |
| Freddie Mac Pool #SB8027 3.00% 203512 | 758 | 779 |
| Freddie Mac Pool #C92056 3.00% 203912 | 21,479 | 21,990 |
| Freddie Mac Pool #C92053 3.00% 203912 | 6,620 | 6,777 |
| Freddie Mac Pool #760012 3.01% 20452,12 | 2,111 | 2,126 |
| Freddie Mac Pool #760013 3.009% 20452,12 | 1,648 | 1,663 |
| Freddie Mac Pool #760014 3.486% 20452,12 | 8,476 | 8,649 |
| Freddie Mac Pool #G60344 4.00% 204512 | 25,672 | 27,615 |
| Freddie Mac Pool #G67701 3.00% 204612 | 78,805 | 81,147 |
| Freddie Mac Pool #G08791 3.00% 204712 | 20,222 | 20,618 |
| Freddie Mac Pool #G61733 3.00% 204712 | 14,418 | 14,846 |
| Freddie Mac Pool #760015 3.238% 20472,12 | 7,284 | 7,337 |
| Freddie Mac Pool #V84817 3.50% 204712 | 331 | 341 |
| Freddie Mac Pool #ZT2102 3.00% 204812 | 170,902 | 173,454 |
| Freddie Mac Pool #G08799 3.00% 204812 | 27,596 | 28,108 |
| Freddie Mac Pool #ZS4754 3.00% 204812 | 12,521 | 12,746 |
| Freddie Mac Pool #ZT1544 3.50% 204812 | 71,731 | 73,916 |
| Freddie Mac Pool #ZA5447 3.50% 204812 | 29,145 | 30,054 |
| Freddie Mac Pool #V84872 3.50% 204812 | 1,793 | 1,854 |
| Freddie Mac Pool #ZS4777 3.50% 204812 | 171 | 176 |
| Freddie Mac Pool #ZA5889 4.00% 204812 | 9,379 | 9,898 |
The Bond Fund of America — Page 29 of 49
Bonds, notes & other debt instruments (continued)
Mortgage-backed obligations (continued)
Federal agency mortgage-backed obligations (continued) | Principal amount
(000) | Value
(000) |
| Freddie Mac Pool #ZT1545 4.00% 204812 | $6,031 | $6,280 |
| Freddie Mac Pool #SI2002 4.00% 204812 | 4,330 | 4,541 |
| Freddie Mac Pool #ZT1546 4.50% 204812 | 683 | 719 |
| Freddie Mac Pool #SD7507 3.00% 204912 | 418,035 | 430,200 |
| Freddie Mac Pool #QA4692 3.00% 204912 | 54,300 | 55,712 |
| Freddie Mac Pool #SD7509 3.00% 204912 | 39,428 | 40,454 |
| Freddie Mac Pool #QA4673 3.00% 204912 | 13,143 | 13,526 |
| Freddie Mac Pool #SD8005 3.50% 204912 | 303,532 | 311,878 |
| Freddie Mac Pool #SD7508 3.50% 204912 | 146,448 | 154,148 |
| Freddie Mac Pool #SD8011 3.50% 204912 | 141,138 | 145,061 |
| Freddie Mac Pool #SD8001 3.50% 204912 | 54,201 | 55,708 |
| Freddie Mac Pool #QA5125 3.50% 204912 | 47,931 | 50,452 |
| Freddie Mac Pool #V85471 3.50% 204912 | 40,070 | 41,396 |
| Freddie Mac Pool #ZT1951 3.50% 204912 | 35,359 | 36,338 |
| Freddie Mac Pool #ZT2086 3.50% 204912 | 34,056 | 35,006 |
| Freddie Mac Pool #G08856 3.50% 204912 | 10,165 | 10,457 |
| Freddie Mac Pool #ZT1776 3.50% 204912 | 7,783 | 8,001 |
| Freddie Mac Pool #ZA7047 3.50% 204912 | 5,830 | 6,011 |
| Freddie Mac Pool #V85284 3.50% 204912 | 4,314 | 4,448 |
| Freddie Mac Pool #ZT1863 3.50% 204912 | 3,015 | 3,099 |
| Freddie Mac Pool #ZT1709 3.50% 204912 | 1,342 | 1,380 |
| Freddie Mac Pool #SD8003 4.00% 204912 | 2,000 | 2,079 |
| Freddie Mac Pool #ZA7009 4.50% 204912 | 2,786 | 2,941 |
| Freddie Mac Pool #ZA6269 4.50% 204912 | 2,516 | 2,649 |
| Freddie Mac Pool #RA1914 3.00% 205012 | 73,110 | 74,764 |
| Freddie Mac, Series 2122, Class QM, 6.25% 202912 | 497 | 539 |
| Freddie Mac, Series 3257, Class PA, 5.50% 203612 | 4,533 | 5,170 |
| Freddie Mac, Series 3286, Class JN, 5.50% 203712 | 3,465 | 3,755 |
| Freddie Mac, Series 3318, Class JT, 5.50% 203712 | 2,052 | 2,251 |
| Freddie Mac, Series 4582, Class GA, 3.75% 20522,12 | 8,252 | 8,487 |
| Freddie Mac, Series KS01, Class A2, Multi Family, 2.522% 202312 | 3,325 | 3,354 |
| Freddie Mac, Series K734, Class A2, Multi Family, 3.208% 202612 | 5,065 | 5,331 |
| Freddie Mac, Series K070, Class A2, Multi Family, 3.303% 20272,12 | 6,940 | 7,397 |
| Freddie Mac, Series K084, Class A2, Multi Family, 3.78% 20282,12 | 5,250 | 5,769 |
| Freddie Mac, Series K078, Class A2, Multi Family, 3.854% 202812 | 4,000 | 4,414 |
| Freddie Mac, Series K076, Class A2, Multi Family, 3.90% 202812 | 3,965 | 4,387 |
| Freddie Mac, Series K083, Class A2, Multi Family, 4.05% 20282,12 | 1,500 | 1,680 |
| Freddie Mac, Series K090, Class A2, Multi Family, 3.422% 202912 | 5,000 | 5,383 |
| Freddie Mac, Series K089, Class A2, Multi Family, 3.563% 202912 | 4,060 | 4,406 |
| Freddie Mac, Series 3156, Class PO, principal only, 0% 203612 | 1,788 | 1,591 |
| Freddie Mac, Series 3147, Class OD, principal only, 0% 203612 | 517 | 467 |
| Freddie Mac, Series 3136, Class OP, principal only, 0% 203612 | 510 | 464 |
| Freddie Mac, Series 3149, Class MO, principal only, 0% 203612 | 412 | 381 |
| Freddie Mac, Series 3149, Class AO, principal only, 0% 203612 | 301 | 273 |
| Freddie Mac Seasoned Credit Risk Transfer Trust, Series 2017-2, Class HA, 3.00% 20566,12 | 58,054 | 59,008 |
| Freddie Mac Seasoned Credit Risk Transfer Trust, Series 2017-2, Class MA, 3.00% 205612 | 57,256 | 58,319 |
| Freddie Mac Seasoned Credit Risk Transfer Trust, Series 2017-1, Class HA, 3.00% 20562,12 | 50,254 | 51,260 |
| Freddie Mac Seasoned Credit Risk Transfer Trust, Series 2017-1, Class MA, 3.00% 205612 | 5,785 | 5,885 |
| Freddie Mac Seasoned Credit Risk Transfer Trust, Series 2017-3, Class HA, 3.25% 20566,12 | 20,580 | 21,157 |
| Freddie Mac Seasoned Credit Risk Transfer Trust, Series 2017-4, Class HT, 3.25% 20576,12 | 16,205 | 16,701 |
| Freddie Mac Seasoned Credit Risk Transfer Trust, Series 2018-2, Class MT, 3.50% 205712 | 81,491 | 85,937 |
| Freddie Mac Seasoned Credit Risk Transfer Trust, Series 2018-3, Class MA, 3.50% 205712 | 20,695 | 21,399 |
| Freddie Mac Seasoned Credit Risk Transfer Trust, Series 2017-4, Class MT, 3.50% 205712 | 12,972 | 13,468 |
| Freddie Mac Seasoned Credit Risk Transfer Trust, Series 2017-4, Class M45T, 4.50% 205712 | 11,502 | 12,297 |
The Bond Fund of America — Page 30 of 49
Bonds, notes & other debt instruments (continued)
Mortgage-backed obligations (continued)
Federal agency mortgage-backed obligations (continued) | Principal amount
(000) | Value
(000) |
| Freddie Mac Seasoned Credit Risk Transfer Trust, Series 2019-2, Class MA, 3.50% 205812 | $42,729 | $44,397 |
| Freddie Mac Seasoned Credit Risk Transfer Trust, Series 2019-4, Class MA, 3.00% 205912 | 128,734 | 131,186 |
| Freddie Mac Seasoned Loan Structured Transaction Trust, Series 2018-2, Class A1, 3.50% 202812 | 58,200 | 60,267 |
| Freddie Mac Seasoned Loan Structured Transaction Trust, Series 2018-1, Class A1, 3.50% 202812 | 35,927 | 37,107 |
| Freddie Mac Seasoned Loan Structured Transaction Trust, Series 2019-3, Class A1C, 2.75% 202912 | 180,989 | 183,485 |
| Freddie Mac Seasoned Loan Structured Transaction Trust, Series 2019-2, Class A1C, 2.75% 202912 | 96,285 | 96,950 |
| Freddie Mac Seasoned Loan Structured Transaction Trust, Series 2019-1, Class A1, 3.50% 202912 | 26,831 | 27,856 |
| Government National Mortgage Assn. 2.50% 202812 | 1,605 | 1,630 |
| Government National Mortgage Assn. 5.00% 203512 | 369 | 391 |
| Government National Mortgage Assn. 6.50% 203812 | 189 | 214 |
| Government National Mortgage Assn. 5.00% 203912 | 547 | 578 |
| Government National Mortgage Assn. 4.50% 204012 | 2,065 | 2,232 |
| Government National Mortgage Assn. 5.50% 204012 | 3,170 | 3,540 |
| Government National Mortgage Assn. 4.50% 204112 | 7,664 | 8,098 |
| Government National Mortgage Assn. 4.50% 204112 | 1,033 | 1,091 |
| Government National Mortgage Assn. 4.50% 204112 | 482 | 511 |
| Government National Mortgage Assn. 4.50% 204112 | 460 | 487 |
| Government National Mortgage Assn. 5.00% 204112 | 2,874 | 3,133 |
| Government National Mortgage Assn. 3.50% 204212 | 648 | 660 |
| Government National Mortgage Assn. 3.50% 204312 | 1,810 | 1,901 |
| Government National Mortgage Assn. 4.00% 204512 | 235 | 249 |
| Government National Mortgage Assn. 3.00% 204712 | 33,367 | 34,258 |
| Government National Mortgage Assn. 3.00% 204712 | 16,271 | 16,706 |
| Government National Mortgage Assn. 4.00% 204712 | 52,472 | 54,909 |
| Government National Mortgage Assn. 3.50% 204812 | 13,114 | 13,524 |
| Government National Mortgage Assn. 3.50% 204812 | 798 | 823 |
| Government National Mortgage Assn. 3.50% 204812 | 320 | 331 |
| Government National Mortgage Assn. 4.00% 204812 | 24,318 | 25,405 |
| Government National Mortgage Assn. 4.50% 204912 | 19,430 | 20,303 |
| Government National Mortgage Assn. 4.50% 204912 | 274 | 284 |
| Government National Mortgage Assn. 5.00% 204912 | 1,976 | 2,064 |
| Government National Mortgage Assn. 3.50% 205012,13 | 136,138 | 140,292 |
| Government National Mortgage Assn. 4.00% 205012,13 | 85,503 | 88,500 |
| Government National Mortgage Assn. 4.50% 205012,13 | 71,520 | 74,786 |
| Government National Mortgage Assn. Pool #MA5527 3.50% 204812 | 12,391 | 12,778 |
| Government National Mortgage Assn. Pool #MA5263 3.50% 204812 | 10,374 | 10,701 |
| Government National Mortgage Assn. Pool #MA5019 3.50% 204812 | 1,083 | 1,125 |
| Government National Mortgage Assn. Pool #MA5332 5.00% 204812 | 215 | 229 |
| Government National Mortgage Assn. Pool #MA6339 3.50% 204912 | 197,169 | 204,301 |
| Government National Mortgage Assn. Pool #MA6284 3.50% 204912 | 31,372 | 32,507 |
| Government National Mortgage Assn. Pool #MA5986 4.00% 204912 | 195,799 | 202,926 |
| Government National Mortgage Assn. Pool #MA6340 4.00% 204912 | 107,000 | 111,805 |
| Government National Mortgage Assn. Pool #MA5817 4.00% 204912 | 75,242 | 77,946 |
| Government National Mortgage Assn. Pool #MA6220 4.00% 204912 | 54,792 | 57,144 |
| Government National Mortgage Assn. Pool #MA5931 4.00% 204912 | 30,812 | 31,958 |
| Government National Mortgage Assn. Pool #MA6155 4.00% 204912 | 30,485 | 31,744 |
| Government National Mortgage Assn. Pool #MA5987 4.50% 204912 | 199,495 | 209,211 |
| Government National Mortgage Assn. Pool #MA5877 4.50% 204912 | 107,927 | 112,769 |
| Government National Mortgage Assn. Pool #MA6041 4.50% 204912 | 103,690 | 108,969 |
| Government National Mortgage Assn. Pool #MA6156 4.50% 204912 | 20,706 | 21,770 |
| Government National Mortgage Assn. Pool #MA6092 4.50% 204912 | 16,819 | 17,695 |
| Government National Mortgage Assn. Pool #MA5933 5.00% 204912 | 9,237 | 9,769 |
| Government National Mortgage Assn. Pool #MA5988 5.00% 204912 | 4,783 | 5,049 |
| Government National Mortgage Assn. Pool #MA6042 5.00% 204912 | 596 | 630 |
The Bond Fund of America — Page 31 of 49
Bonds, notes & other debt instruments (continued)
Mortgage-backed obligations (continued)
Federal agency mortgage-backed obligations (continued) | Principal amount
(000) | Value
(000) |
| Government National Mortgage Assn. Pool #694836 5.644% 205912 | $1 | $1 |
| Government National Mortgage Assn. Pool #721648 4.874% 206112 | 10 | 10 |
| Government National Mortgage Assn. Pool #725879 4.901% 206112 | 7 | 7 |
| Government National Mortgage Assn. Pool #725876 4.909% 206112 | 6 | 6 |
| Government National Mortgage Assn. Pool #765136 4.906% 206112 | 3 | 3 |
| Government National Mortgage Assn. Pool #710085 5.073% 206112 | 24 | 25 |
| Government National Mortgage Assn. Pool #AC1008 4.437% 206312 | 9 | 10 |
| Government National Mortgage Assn. Pool #AG8238 4.926% 206412 | 25 | 26 |
| Government National Mortgage Assn. Pool #725893 5.20% 206412 | 2 | 2 |
| Government National Mortgage Assn. Pool #AA7554 6.64% 206412 | 4 | 4 |
| Government National Mortgage Assn. Pool #AE9612 4.999% 206512 | 33 | 34 |
National Credit Union Administration, Series 2011-R3, Class 1A,
(1-month USD-LIBOR + 0.40%) 2.118% 20202,12 | 293 | 293 |
National Credit Union Administration, Series 2011-R1, Class 1A,
(1-month USD-LIBOR + 0.45%) 2.144% 20202,12 | 305 | 305 |
| Uniform Mortgage-Backed Security 2.50% 203512,13 | 67,894 | 68,473 |
| Uniform Mortgage-Backed Security 3.00% 203512,13 | 871,005 | 891,902 |
| Uniform Mortgage-Backed Security 3.50% 205012,13 | 5,000 | 5,141 |
| Uniform Mortgage-Backed Security 4.50% 205012,13 | 10,587 | 11,146 |
| WF-RBS Commercial Mortgage Trust, Series 2013-C13, Class B, 3.553% 204512 | 500 | 514 |
| | | 10,191,067 |
| Collateralized mortgage-backed obligations (privately originated) 0.78% | | |
| Arroyo Mortgage Trust, Series 2018-1, Class A1, 3.763% 20482,5,12 | 20,518 | 20,811 |
Bellemeade Re Ltd., Series 2019-3A, Class M1B,
(1-month USD-LIBOR + 1.60%) 3.392% 20292,5,12 | 5,715 | 5,728 |
| Cascade Funding Mortgage Trust, Series 2019-HB1, Class A, 2.386% 20292,5,12 | 7,864 | 7,883 |
| Cascade Funding Mortgage Trust, Series 2019-HB1, Class M1, 2.572% 20292,5,12 | 3,590 | 3,618 |
| Cascade Funding Mortgage Trust, Series 2019-HB1, Class M2, 2.863% 20292,5,12 | 874 | 881 |
| Cascade Funding Mortgage Trust, Series 2019-HB1, Class M3, 3.257% 20292,5,12 | 448 | 449 |
| Commercial Mortgage Trust, Series 2012-CR5, Class D, 4.318% 20452,5,12 | 2,000 | 2,025 |
| Commercial Mortgage Trust, Series 2012-CR3, Class C, 4.584% 20452,5,12 | 500 | 508 |
| Commercial Mortgage Trust, Series 2013-CR6, Class B, 3.397% 20465,12 | 1,000 | 1,021 |
| Commercial Mortgage Trust, Series 2013-CR7, Class C, 4.041% 20462,5,12 | 2,743 | 2,714 |
| Commercial Mortgage Trust, Series 2013-LC13, Class B, 5.009% 20462,5,12 | 170 | 182 |
| CS First Boston Mortgage Securities Corp., Series 2002-30, Class IA1, 7.50% 203212 | 237 | 247 |
| CS First Boston Mortgage Securities Corp., Series 2002-34, Class IA1, 7.50% 203212 | 81 | 85 |
| CS First Boston Mortgage Securities Corp., Series 2003-21, Class VA1, 6.50% 203312 | 1,128 | 1,165 |
| CS First Boston Mortgage Securities Corp., Series 2003-29, Class VA1, 7.00% 203312 | 501 | 522 |
| Finance of America HECM Buyout, Series 2019-AB1, Class A, 2.656% 20495,8,12 | 8,898 | 8,893 |
| Finance of America HECM Buyout, Series 2019-AB1, Class M1, 3.50% 20495,8,12 | 2,862 | 2,836 |
| Finance of America Structured Securities Trust, Series 2018-HB1, Class A, 3.375% 20282,5,12 | 7,471 | 7,480 |
| Finance of America Structured Securities Trust, Series 2019-JR1, Class A, 2.00% 20695,12 | 23,009 | 23,873 |
| Finance of America Structured Securities Trust, Series 2019-JR2, Class A1, 2.00% 20695,12 | 22,528 | 23,490 |
| Freddie Mac, Series 2014-DN2, Class M2, (1-month USD-LIBOR + 1.65%) 3.442% 20242,12 | 470 | 471 |
| Freddie Mac, Series 2014-HQ2, Class M2, (1-month USD-LIBOR + 2.20%) 3.992% 20242,12 | 3,748 | 3,793 |
| Freddie Mac, Series 2015-HQ2, Class M2, (1-month USD-LIBOR + 1.95%) 3.742% 20252,12 | 3,460 | 3,496 |
| Homeward Opportunities Fund Trust, Series 2018-1, 3.766% 20482,5,12 | 18,065 | 18,224 |
| JPMorgan Mortgage Trust, Series 2019-INV3, Class A13, 3.50% 20502,5,12 | 2,074 | 2,119 |
| JPMorgan Mortgage Trust, Series 2019-INV3, Class A3, 3.50% 20502,5,12 | 1,979 | 2,022 |
| Legacy Mortgage Asset Trust, Series 2019-GS5, Class A1, 3.20% 20592,5,12 | 7,029 | 7,052 |
| Legacy Mortgage Asset Trust, Series 2019-GS2, Class A1, 3.75% 20592,5,12 | 9,080 | 9,169 |
Mello Warehouse Securitization Trust, Series 2019-2, Class A,
(1-month USD-LIBOR + 0.75%) 2.573% 20522,5,12 | 62,022 | 62,018 |
The Bond Fund of America — Page 32 of 49
Bonds, notes & other debt instruments (continued)
Mortgage-backed obligations (continued)
Collateralized mortgage-backed obligations (privately originated) (continued) | Principal amount
(000) | Value
(000) |
| Mello Warehouse Securitization Trust, Series 2019-1, Class A, 2.592% 20522,5,12 | $8,945 | $8,970 |
| Nationstar HECM Loan Trust, Series 2018-2, Class A, 3.188% 20282,5,12 | 2,636 | 2,642 |
| Nationstar HECM Loan Trust, Series 2018-3A, Class A, 3.555% 20282,5,12 | 8,544 | 8,625 |
| Nationstar HECM Loan Trust, Series 2019-2A, Class A, 2.575% 20292,5,12 | 8,248 | 8,267 |
| Nationstar HECM Loan Trust, Series 2019-1A, Class A, 2.651% 20292,5,12 | 3,512 | 3,517 |
| Reverse Mortgage Investment Trust, Series 2018-1, Class A, 3.436% 20282,5,12 | 2,674 | 2,678 |
| RMF Proprietary Issuance Trust, Series 2019-1, Class A, 2.75% 20632,5,12 | 8,322 | 8,244 |
| Sequoia Mortgage Trust, Series 2018-CH1, Class A1, 4.00% 20482,5,12 | 4,379 | 4,459 |
| Starwood Mortgage Residential Trust, Series 2018-IMC1, Class A1, 3.793% 20482,5,12 | 27,286 | 27,543 |
| Starwood Mortgage Residential Trust, Series 2019-IMC1, Class A1, 3.468% 20492,5,12 | 4,719 | 4,760 |
Station Place Securitization Trust, Series 2019-WL1, Class A,
(1-month USD-LIBOR + 0.65%) 2.442% 20522,5,12 | 78,659 | 78,867 |
| TBW Mortgage-backed Trust, Series 2007-2, Class A4B, (1-month USD-LIBOR + 0.42%) 2.212% 20372,12 | 9,432 | 8,885 |
| Towd Point Mortgage Trust, Series 2017-5, Class A1, 2.392% 20572,5,12 | 1,362 | 1,362 |
| | | 391,594 |
| Commercial mortgage-backed securities 0.15% | | |
| Commercial Mortgage Trust, Series 2014-CR19, Class C, 4.747% 20472,12 | 600 | 633 |
| Commercial Mortgage Trust, Series 2015-CR22, Class B, 3.926% 20482,12 | 5,250 | 5,483 |
| Commercial Mortgage Trust, Series 2016-COR1, Class A4, 3.091% 204912 | 4,000 | 4,131 |
| DBUBS Mortgage Trust, Series 2011-LC2A, Class A1, 4.537% 20445,12 | 9,991 | 10,204 |
| DBUBS Mortgage Trust, Series 2011-LC3A, Class B, 5.334% 20442,5,12 | 2,500 | 2,588 |
| GS Mortgage Securities Corp., Series 2013-GC14, Class D, 4.741% 20462,5,12 | 1,600 | 1,647 |
| GS Mortgage Securities Corp. II, Series 2010-C2, Class A2, 5.162% 20432,5,12 | 4,000 | 4,085 |
| JPMBB Commercial Mortgage Securities Trust, Series 2014-C19, Class D, 4.679% 20472,5,12 | 2,500 | 2,531 |
| JPMBB Commercial Mortgage Securities Trust, Series 2014-C26, Class B, 3.9508% 204812 | 3,500 | 3,662 |
| JPMBB Commercial Mortgage Securities Trust, Series 2015-C31, Class C, 4.616% 20482,12 | 600 | 629 |
| L.A. Arena Funding, LLC, Series 1, Class A, 7.656% 20265,12 | 9,296 | 9,818 |
| Morgan Stanley Bank of America Merrill Lynch Trust, Series 2013-C9, Class B, 3.708% 20462,12 | 1,511 | 1,561 |
Morgan Stanley Bank of America Merrill Lynch Trust, Series 2013-C7, Class D,
4.239% 20462,5,12 | 2,700 | 2,617 |
| Morgan Stanley Bank of America Merrill Lynch Trust, Series 2013-C13, Class B, 4.755% 20462,12 | 1,000 | 1,061 |
Morgan Stanley Bank of America Merrill Lynch Trust, Series 2014-C19, Class B,
4.00% 20472,12 | 2,000 | 2,107 |
| Morgan Stanley Capital I Trust, Series 2014-CPT, Class A, 3.35% 20295,12 | 6,885 | 6,986 |
| Morgan Stanley Capital I Trust, Series 2011-C2, Class A4, 4.661% 20445,12 | 4,950 | 5,061 |
| Morgan Stanley Capital I Trust, Series 2011-C1, Class A4, 5.033% 20472,5,12 | 1,298 | 1,323 |
| Wells Fargo Commercial Mortgage Trust, Series 2016-C34, Class A4, 3.096% 204912 | 6,190 | 6,377 |
| Wells Fargo Commercial Mortgage Trust, Series 2015-LC22, Class C, 4.534% 20582,12 | 1,000 | 1,053 |
| WF-RBS Commercial Mortgage Trust, Series 2013-C11, Class B, 3.714% 20452,12 | 1,000 | 1,031 |
| WF-RBS Commercial Mortgage Trust, Series 2013-C14, Class B, 3.841% 20462,12 | 2,500 | 2,552 |
| | | 77,140 |
| Total mortgage-backed obligations | | 10,659,801 |
| Asset-backed obligations 2.33% | | |
| Aesop Funding LLC, Series 2015-1A, Class A, 2.50% 20215,12 | 5,445 | 5,452 |
| Aesop Funding LLC, Series 2014-2A, Class A, 2.50% 20215,12 | 4,692 | 4,692 |
| Aesop Funding LLC, Series 2015-2A, Class A, 2.63% 20215,12 | 9,175 | 9,205 |
| Aesop Funding LLC, Series 2019-1A, Class A, 3.45% 20235,12 | 4,460 | 4,567 |
| Aesop Funding LLC, Series 2017-2A, Class A, 2.97% 20245,12 | 2,210 | 2,249 |
| AmeriCredit Automobile Receivables Trust, Series 2018-1, Class A2A, 2.71% 202112 | 166 | 167 |
| AmeriCredit Automobile Receivables Trust, Series 2016-2, Class C, 2.87% 202112 | 569 | 570 |
| AmeriCredit Automobile Receivables Trust, Series 2016-3, Class C, 2.24% 202212 | 5,000 | 5,002 |
The Bond Fund of America — Page 33 of 49
Bonds, notes & other debt instruments (continued)
Asset-backed obligations (continued) | Principal amount
(000) | Value
(000) |
| AmeriCredit Automobile Receivables Trust, Series 2017-1, Class C, 2.71% 202212 | $6,030 | $6,067 |
| AmeriCredit Automobile Receivables Trust, Series 2016-1, Class C, 2.89% 202212 | 2,752 | 2,757 |
Angel Oak Capital Advisors LLC, CLO, Series 2013-9A, Class A1R,
(3-month USD-LIBOR + 1.01%) 2.976% 20252,5,12 | 2,097 | 2,097 |
| CarMaxAuto Owner Trust, Series 2019-2, Class A2A, 2.69% 202212 | 844 | 848 |
| CarMaxAuto Owner Trust, Series 2019-2, Class A3, 2.68% 202412 | 1,160 | 1,176 |
| CarMaxAuto Owner Trust, Series 2019-2, Class A4, 2.77% 202412 | 1,245 | 1,268 |
| CarMaxAuto Owner Trust, Series 2019-2, Class C, 3.16% 202512 | 650 | 665 |
| Cloud Pass-Through Trust, Series 2019-1A, Class CLOU, 3.554% 20222,5,12 | 19,827 | 20,060 |
| CPS Auto Receivables Trust, Series 2018-B, Class A, 2.72% 20215,12 | 415 | 415 |
| CPS Auto Receivables Trust, Series 2018-C, Class A, 2.87% 20215,12 | 60 | 60 |
| CPS Auto Receivables Trust, Series 2016-A, Class C, 3.80% 20215,12 | 243 | 243 |
| CPS Auto Receivables Trust, Series 2015-A, Class C, 4.00% 20215,12 | 719 | 720 |
| CPS Auto Receivables Trust, Series 2019-D, Class A, 2.17% 20225,12 | 18,431 | 18,428 |
| CPS Auto Receivables Trust, Series 2019-B, Class A, 2.89% 20225,12 | 1,106 | 1,109 |
| CPS Auto Receivables Trust, Series 2017-B, Class C, 2.92% 20225,12 | 5,143 | 5,153 |
| CPS Auto Receivables Trust, Series 2018-D, Class A, 3.06% 20225,12 | 500 | 501 |
| CPS Auto Receivables Trust, Series 2018-A, Class C, 3.05% 20235,12 | 1,240 | 1,247 |
| CPS Auto Receivables Trust, Series 2019-B, Class B, 3.09% 20235,12 | 2,000 | 2,021 |
| CPS Auto Receivables Trust, Series 2019-B, Class C, 3.35% 20245,12 | 2,570 | 2,607 |
| CPS Auto Receivables Trust, Series 2019-C, Class C, 2.84% 20255,12 | 2,169 | 2,179 |
| CPS Auto Receivables Trust, Series 2019-C, Class D, 3.17% 20255,12 | 2,025 | 2,038 |
| CPS Auto Receivables Trust, Series 2019-B, Class D, 3.69% 20255,12 | 5,325 | 5,408 |
CWHEQ Revolving Home Equity Loan Trust, Series 2005-C, Class 2A, FSA insured,
(1-month USD-LIBOR + 0.18%) 1.92% 20352,12 | 1,762 | 1,717 |
CWHEQ Revolving Home Equity Loan Trust, Series 2006-I, Class 2A, FSA insured,
(1-month USD-LIBOR + 0.14%) 1.88% 20372,12 | 2,786 | 2,684 |
CWHEQ Revolving Home Equity Loan Trust, Series 2007-B, Class A, FSA insured,
(1-month USD-LIBOR + 0.15%) 1.89% 20372,12 | 4,332 | 4,193 |
| DRB Prime Student Loan Trust, Series 2015-D, Class A3, 2.50% 20365,12 | 93 | 93 |
| Drive Auto Receivables Trust, Series 2017-1, Class C, 2.84% 202212 | 571 | 572 |
| Drive Auto Receivables Trust, Series 2019-2, Class A2A, 2.93% 202212 | 158 | 158 |
| Drive Auto Receivables Trust, Series 2017-AA, Class C, 2.98% 20225,12 | 899 | 899 |
| Drive Auto Receivables Trust, Series 2017-2, Class C, 2.75% 202312 | 436 | 436 |
| Drive Auto Receivables Trust, Series 2019-2, Class B, 3.17% 202312 | 4,660 | 4,708 |
| Drive Auto Receivables Trust, Series 2019-3, Class B, 2.65% 202412 | 3,970 | 3,999 |
| Drive Auto Receivables Trust, Series 2018-2, Class C, 3.63% 202412 | 1,643 | 1,651 |
| Drive Auto Receivables Trust, Series 2018-3, Class C, 3.72% 202412 | 134 | 135 |
| Drive Auto Receivables Trust, Series 2018-1 Class D, 3.81% 202412 | 70 | 71 |
| Drive Auto Receivables Trust, Series 2019-3, Class C, 2.90% 202512 | 12,690 | 12,829 |
| Drive Auto Receivables Trust, Series 2019-2, Class C, 3.42% 202512 | 8,760 | 8,908 |
| Drive Auto Receivables Trust, Series 2019-3, Class D, 3.18% 202612 | 6,030 | 6,119 |
| Drivetime Auto Owner Trust, Series 2019-3, Class A, 2.55% 20225,12 | 8,766 | 8,788 |
| Drivetime Auto Owner Trust, Series 2019-2A, Class A, 2.85% 20225,12 | 2,980 | 2,990 |
| Drivetime Auto Owner Trust, Series 2018-3A, Class A, 3.26% 20225,12 | 4,004 | 4,017 |
| Drivetime Auto Owner Trust, Series 2018-3A, Class B, 3.56% 20225,12 | 415 | 419 |
| Drivetime Auto Owner Trust, Series 2019-4A, Class A, 2.17% 20235,12 | 26,903 | 26,916 |
| Drivetime Auto Owner Trust, Series 2019-3, Class B, 2.60% 20235,12 | 1,570 | 1,575 |
| Drivetime Auto Owner Trust, Series 2017-4A, Class C, 2.86% 20235,12 | 812 | 812 |
| Drivetime Auto Owner Trust, Series 2019-2A Class B, 2.99% 20235,12 | 3,240 | 3,263 |
| Drivetime Auto Owner Trust, Series 2017-3A, Class C, 3.01% 20235,12 | 2,156 | 2,158 |
| Drivetime Auto Owner Trust, Series 2018-1A, Class C, 3.47% 20235,12 | 7,586 | 7,613 |
| Drivetime Auto Owner Trust, Series 2018-2A, Class C, 3.67% 20245,12 | 135 | 136 |
| Drivetime Auto Owner Trust, Series 2019-3, Class C, 2.74% 20255,12 | 1,925 | 1,935 |
| Drivetime Auto Owner Trust, Series 2019-3, Class D, 2.96% 20255,12 | 2,870 | 2,872 |
The Bond Fund of America — Page 34 of 49
Bonds, notes & other debt instruments (continued)
Asset-backed obligations (continued) | Principal amount
(000) | Value
(000) |
| Drivetime Auto Owner Trust, Series 2019-2A Class C, 3.18% 20255,12 | $5,765 | $5,837 |
| Drivetime Auto Owner Trust, Series 2019-2A Class D, 3.48% 20255,12 | 6,800 | 6,897 |
| Enterprise Fleet Financing LLC, Series 2017-1, Class A2, 2.13% 20225,12 | 750 | 750 |
| Exeter Automobile Receivables Trust, Series 2016-3A, Class B, 2.84% 20215,12 | 35 | 35 |
| Exeter Automobile Receivables Trust, Series 2018-4A, Class A, 3.05% 20215,12 | 179 | 179 |
| Exeter Automobile Receivables Trust, Series 2015-3A, Class C, 4.83% 20215,12 | 87 | 87 |
| Exeter Automobile Receivables Trust, Series 2017-3A, Class B, 2.81% 20225,12 | 10,674 | 10,704 |
| Exeter Automobile Receivables Trust, Series 2019-2A, Class A, 2.93% 20225,12 | 4,341 | 4,355 |
| Exeter Automobile Receivables Trust, Series 2019-4A, Class A, 2.18% 20235,12 | 27,045 | 27,087 |
| Exeter Automobile Receivables Trust, Series 2019-3A, Class B, 2.58% 20235,12 | 8,200 | 8,234 |
| Exeter Automobile Receivables Trust, Series 2019-2A, Class B, 3.06% 20235,12 | 9,875 | 9,957 |
| Exeter Automobile Receivables Trust, Series 2019-3A, Class C, 2.79% 20245,12 | 15,200 | 15,293 |
| Exeter Automobile Receivables Trust, Series 2019-2A, Class C, 3.30% 20245,12 | 7,850 | 7,968 |
| Exeter Automobile Receivables Trust, Series 2019-1A, Class C, 3.82% 20245,12 | 4,150 | 4,241 |
| Exeter Automobile Receivables Trust, Series 2019-3A, Class D, 3.11% 20255,12 | 9,000 | 9,071 |
| Exeter Automobile Receivables Trust, Series 2019-2A, Class D, 3.71% 20255,12 | 10,000 | 10,250 |
| First Investors Auto Owner Trust, Series 2019-1A, Class A, 2.89% 20245,12 | 1,344 | 1,354 |
| Ford Credit Auto Owner Trust, Series 2016-2, Class A, 2.03% 20275,12 | 33,660 | 33,670 |
| Ford Credit Auto Owner Trust, Series 2018-1, Class A, 3.52% 20305,12 | 108,460 | 113,901 |
| Ford Credit Auto Owner Trust, Series 2018-1, Class A, 3.19% 20315,12 | 38,760 | 40,316 |
| Ford Credit Floorplan Master Owner Trust, Series 2019-3, Class A1, 2.23% 202412 | 119,060 | 119,376 |
| Ford Credit Floorplan Master Owner Trust, Series 2019-4, Class A, 2.44% 202612 | 4,501 | 4,516 |
| Global SC Finance II SRL, Series 2017-1A, Class A, 3.85% 20375,12 | 5,604 | 5,693 |
| Global SC Finance V SRL, Series 2019-1A, Class B, 4.81% 20395,12 | 11,865 | 11,706 |
| GM Financial Automobile Leasing Trust, Series 2019-4, Class B, 2.04% 202512 | 1,052 | 1,042 |
| GM Financial Automobile Leasing Trust, Series 2019-4, Class C, 2.24% 202512 | 1,521 | 1,507 |
| GM Financial Automobile Leasing Trust, Series 2019-2, Class A4, 2.72% 202312 | 2,633 | 2,660 |
| GM Financial Consumer Automobile Receivables Trust, Series 2018-1, Class B, 2.57% 202312 | 765 | 771 |
| GM Financial Consumer Automobile Receivables Trust, Series 2018-1, Class C, 2.77% 202312 | 530 | 532 |
| GM Financial Consumer Automobile Receivables Trust, Series 2019-2, Class B, 2.87% 202412 | 1,815 | 1,845 |
| GM Financial Consumer Automobile Receivables Trust, Series 2019-2, Class C, 3.07% 202412 | 4,285 | 4,360 |
| GMF Floorplan Owner Revolving Trust, Series 2017-1, Class A1, 2.22% 20225,12 | 17,000 | 17,000 |
| GMF Floorplan Owner Revolving Trust, Series 2017-1, Class B, 2.58% 20225,12 | 3,500 | 3,500 |
| Henderson Receivables LLC, Series 2006-3A, Class A1, (1-month USD-LIBOR + 0.20%) 1.94% 20412,5,12 | 930 | 905 |
| Henderson Receivables LLC, Series 2006-4A, Class A1, (1-month USD-LIBOR + 0.20%) 1.94% 20412,5,12 | 795 | 788 |
| Hertz Vehicle Financing LLC, Rental Car Asset-backed Notes, Series 2016-4A, Class A, 2.65% 20225,12 | 4,015 | 4,037 |
| Hertz Vehicle Financing LLC, Rental Car Asset-Backed Notes, Series 2018-1A, Class A, 3.29% 20245,12 | 13,235 | 13,549 |
| Hertz Vehicle Financing LLC, Rental Car Asset-Backed Notes, Series 2019-3A, Class A, 2.67% 20255,12 | 13,999 | 13,967 |
| Hertz Vehicle Financing LLC, Rental Car Asset-Backed Notes, Series 2019-2A, Class A, 3.42% 20255,12 | 9,194 | 9,481 |
| Home Equity Asset Trust, Series 2004-7, Class M1, (1-month USD-LIBOR + 0.62%) 2.722% 20352,12 | 2,045 | 2,054 |
| OneMain Direct Auto Receivables Trust, Series 2018-1, Class A, 3.43% 20245,12 | 8,335 | 8,447 |
| Palmer Square Loan Funding, CLO, Series 2019-2, Class A1, (3-month USD-LIBOR + 0.97%) 2.936% 20272,5,12 | 17,779 | 17,782 |
Palmer Square Loan Funding, CLO, Series 2019-1A, Class A1,
(3-month USD-LIBOR + 1.05%) 3.016% 20272,5,12 | 31,602 | 31,610 |
| Prestige Auto Receivables Trust, Series 2019-1A, Class C, 2.70% 20245,12 | 3,940 | 3,964 |
| Prestige Auto Receivables Trust, Series 2019-1A, Class D, 3.01% 20255,12 | 2,435 | 2,453 |
Residential Funding Mortgage Securities II, Inc., Series 2006-HSA3, Class A, FSA insured,
(1-month USD-LIBOR + 0.13%) 1.922% 20362,12 | 294 | 287 |
| Santander Drive Auto Receivables Trust, Series 2016-2, Class C, 2.66% 202112 | 918 | 918 |
| Santander Drive Auto Receivables Trust, Series 2016-3, Class C, 2.46% 202212 | 780 | 781 |
| Santander Drive Auto Receivables Trust, Series 2017-1, Class C, 2.58% 202212 | 7,510 | 7,516 |
| Santander Drive Auto Receivables Trust, Series 2017-3, Class C, 2.76% 202212 | 5,820 | 5,839 |
| Santander Drive Auto Receivables Trust, Series 2016-1, Class C, 3.09% 202212 | 266 | 267 |
| Santander Drive Auto Receivables Trust, Series 2019-2, Class B, 2.79% 202412 | 4,880 | 4,926 |
| Santander Drive Auto Receivables Trust, Series 2019-2, Class D, 3.22% 202512 | 4,975 | 5,076 |
The Bond Fund of America — Page 35 of 49
Bonds, notes & other debt instruments (continued)
Asset-backed obligations (continued) | Principal amount
(000) | Value
(000) |
| Santander Retail Auto Lease Trust, Series 2019-A, Class A2A, 2.72% 20225,12 | $2,505 | $2,521 |
| Santander Retail Auto Lease Trust, Series 2019-A, Class 4, 2.82% 20235,12 | 2,800 | 2,832 |
SLM Private Credit Student Loan Trust, Series 2008-7, Class A4,
(3-month USD-LIBOR + 0.90%) 3.176% 20232,12 | —1 | —1 |
SLM Private Credit Student Loan Trust, Series 2008-9, Class A,
(3-month USD-LIBOR + 1.50%) 3.776% 20232,12 | 576 | 578 |
| Social Professional Loan Program LLC, Series 2015-C, Class A2, 2.51% 20335,12 | 1,374 | 1,375 |
| Symphony Ltd., CLO, Series 2013-12A, Class AR, (3-month USD-LIBOR + 1.03%) 3.031% 20252,5,12 | 25,195 | 25,197 |
| Synchrony Credit Card Master Note Trust, Series 2019-1, Class A, 2.95% 202512 | 3,231 | 3,295 |
| TAL Advantage V LLC, Series 2013-2A, Class A, 3.55% 20385,12 | 2,587 | 2,583 |
| TAL Advantage V LLC, Series 2014-1A, Class A, 3.51% 20395,12 | 1,704 | 1,700 |
| TAL Advantage V LLC, Series 2017-1A, Class A, 4.50% 20425,12 | 5,569 | 5,653 |
| Toyota Auto Loan Extended Note Trust, Series 2019-1, Class A, 2.56% 20315,12 | 17,675 | 17,957 |
| Toyota Auto Receivables Owner Trust, Series 2018-B, Class A2A, 2.64% 202112 | 9,113 | 9,119 |
| Toyota Auto Receivables Owner Trust, Series 2019-B, Class A2A, 2.59% 202212 | 10,000 | 10,026 |
| Toyota Auto Receivables Owner Trust, Series 2019-B, Class A3, 2.57% 202312 | 9,946 | 10,063 |
| Triton Container Finance LLC, Series 2017-1A, Class A, 3.52% 20425,12 | 5,689 | 5,670 |
| Verizon Owner Trust, Series 2017-1A, Class B, 2.45% 20215,12 | 2,500 | 2,504 |
| Verizon Owner Trust, Series 2017-1A, Class C, 2.65% 20215,12 | 3,000 | 3,006 |
| Verizon Owner Trust, Series 2017-3A, Class A1A, 2.06% 20225,12 | 6,559 | 6,570 |
| Verizon Owner Trust, Series 2017-3A, Class B, 2.38% 20225,12 | 4,950 | 4,970 |
| Verizon Owner Trust, Series 2019-C, Class A1A, 1.94% 202412 | 972 | 971 |
| Volkswagen Auto Lease Trust, Series 2019-A, Class A2A, 2.00% 202212 | 51,381 | 51,435 |
| Voya Ltd., CLO, Series 2014-3A, Class A1R, (3-month USD-LIBOR + 0.72%) 2.66% 20262,5,12 | 4,109 | 4,110 |
| Westlake Automobile Receivables Trust, Series 2018-2A, Class A2A, 2.84% 20215,12 | 5,304 | 5,307 |
| Westlake Automobile Receivables Trust, Series 2017-1A, Class C, 2.70% 20225,12 | 690 | 691 |
| Westlake Automobile Receivables Trust, Series 2018-3A, Class A2A, 2.98% 20225,12 | 14,233 | 14,258 |
| Westlake Automobile Receivables Trust, Series 2019-3A, Class A2, 2.15% 20235,12 | 64,874 | 64,955 |
| Westlake Automobile Receivables Trust, Series 2019-2A, Class A2, 2.57% 20235,12 | 7,010 | 7,030 |
| Westlake Automobile Receivables Trust, Series 2018-1A, Class C, 2.92% 20235,12 | 4,950 | 4,963 |
| Westlake Automobile Receivables Trust, Series 2019-2A, Class B, 2.62% 20245,12 | 1,040 | 1,044 |
| Westlake Automobile Receivables Trust, Series 2019-2A, Class C, 2.84% 20245,12 | 3,705 | 3,730 |
| Westlake Automobile Receivables Trust, Series 2018-2A, Class C 3.50% 20245,12 | 400 | 404 |
| World Financial Network Credit Card Master Note Trust, Series 2019-A, Class A, 3.14% 202512 | 19,195 | 19,625 |
| World Financial Network Credit Card Master Note Trust, Series 2019-C, Class A, 2.21% 202612 | 38,700 | 38,763 |
| | | 1,173,883 |
Municipals 1.60%
Illinois 0.70% | | |
| City of Chicago, Board of Education, Unlimited Tax G.O. Bonds (Dedicated Rev.), Series 2009-E, 6.138% 2039 | 54,315 | 59,120 |
| City of Chicago, Board of Education, Unlimited Tax G.O. Bonds (Dedicated Rev.), Series 2010-C, 6.319% 2029 | 14,345 | 16,023 |
| City of Chicago, Board of Education, Unlimited Tax G.O. Bonds (Dedicated Rev.), Series 2010-D, 6.519% 2040 | 5,460 | 6,234 |
| City of Chicago, Board of Education, Unlimited Tax G.O. Bonds (Dedicated Rev.), Series 2017-A, 7.00% 20465 | 7,760 | 9,882 |
| G.O. Bonds, Pension Funding, Series 2003, 4.95% 2023 | 46,032 | 48,048 |
| G.O. Bonds, Pension Funding, Series 2003, 5.10% 2033 | 143,390 | 154,698 |
| G.O. Bonds, Series 2013-B, 3.65% 2020 | 4,745 | 4,759 |
| G.O. Bonds, Series 2013-B, 4.11% 2022 | 2,280 | 2,316 |
| G.O. Bonds, Series 2013-B, 4.31% 2023 | 7,325 | 7,471 |
| G.O. Bonds, Series 2013-B, 4.91% 2027 | 3,250 | 3,396 |
| G.O. Bonds, Taxable Build America Bonds, Series 2010-1, 6.63% 2035 | 6,960 | 8,167 |
| G.O. Bonds, Taxable Build America Bonds, Series 2010-2, 5.65% 2020 | 820 | 824 |
| G.O. Bonds, Taxable Build America Bonds, Series 2010-2, 5.85% 2022 | 3,155 | 3,334 |
| G.O. Bonds, Taxable Build America Bonds, Series 2010-2, 5.95% 2023 | 6,495 | 6,973 |
| G.O. Bonds, Taxable Build America Bonds, Series 2010-2, 6.05% 2024 | 1,905 | 2,071 |
| G.O. Bonds, Taxable Build America Bonds, Series 2010-2, 6.15% 2025 | 6,205 | 6,859 |
The Bond Fund of America — Page 36 of 49
Bonds, notes & other debt instruments (continued)
Municipals (continued)
Illinois (continued) | Principal amount
(000) | Value
(000) |
| G.O. Bonds, Taxable Build America Bonds, Series 2010-3, 5.727% 2020 | $1,230 | $1,240 |
| G.O. Bonds, Taxable Build America Bonds, Series 2010-3, 5.827% 2021 | 2,065 | 2,136 |
| G.O. Bonds, Taxable Build America Bonds, Series 2010-5, 6.20% 2021 | 436 | 452 |
| Housing Dev. Auth., Multi Family Housing Rev. Notes (Marshall Field Garden Apartment Homes), Series 2015, (SIFMA Municipal Swap Index + 1.00%) 2.61% 2050 (put 2025)2 | 6,275 | 6,319 |
| Housing Dev. Auth., Rev. Bonds, Series 2016-A, 4.00% 2046 | 1,120 | 1,193 |
Metropolitan Pier and Exposition Auth., McCormick Place Expansion Project Rev. Ref. Bonds,
Capital Appreciation Bonds, Series 2017-B, Assured Guaranty Municipal insured, 0% 2056 | 6,000 | 1,599 |
| Taxable G.O. Bonds, Series 2012-B, 4.85% 2022 | 2,305 | 2,391 |
| | | 355,505 |
| New York 0.26% | | |
| Dormitory Auth., State Personal Income Tax Rev. Bonds (General Purpose), Series 2019-A, 5.00% 2044 | 8,755 | 10,706 |
| Dormitory Auth., State Personal Income Tax Rev. Bonds (General Purpose), Series 2019-A, 5.00% 2047 | 17,690 | 21,528 |
| Mortgage Agcy., Homeowner Mortgage Rev. Bonds, Series 52, AMT, 3.50% 2030 | 1,770 | 1,840 |
| New York City G.O. Bonds, Fiscal 2020, Series 2019-B-1, 4.00% 2035 | 3,000 | 3,472 |
| New York City G.O. Bonds, Fiscal 2020, Series 2019-B-1, 4.00% 2037 | 7,000 | 8,036 |
| New York City G.O. Bonds, Fiscal 2020, Series 2019-B-1, 4.00% 2039 | 2,000 | 2,278 |
| New York City G.O. Bonds, Fiscal 2020, Series 2019-B-1, 5.00% 2038 | 7,500 | 9,410 |
| New York City Transitional Fin. Auth., Future Tax Secured Bonds, Fiscal 2019, Series 2019-C-1, 4.00% 2040 | 10,840 | 12,244 |
| New York City Transitional Fin. Auth., Future Tax Secured Bonds, Fiscal 2020, Series 2019-A-3, 4.00% 2043 | 10,000 | 11,227 |
| Thruway Auth., General Rev. Indebtedness Obligations, Series 2019-B, 4.00% 2050 | 25,000 | 27,826 |
| Urban Dev. Corp., State Sales Tax Rev. Bonds, Series 2019-A, 4.00% 2042 | 21,540 | 24,356 |
| | | 132,923 |
| Texas 0.14% | | |
| Clifton Higher Education Fin. Corp., Education Rev. Bonds (Idea Public Schools), Series 2019, 4.00% 2044 | 8,250 | 9,334 |
| Mansfield Independent School Dist., Unlimited Tax School Building Bonds, Series 2019-A, 4.00% 2049 | 20,500 | 22,575 |
| SA Energy Acquisition Public Fac. Corp., Gas Supply Rev. Bonds, Series 2007, 5.50% 2023 | 6,000 | 6,784 |
| Spring Branch Independent School Dist., Unlimited Tax Schoolhouse Bonds, Series 2019, 4.00% 2035 | 6,130 | 7,099 |
| Spring Branch Independent School Dist., Unlimited Tax Schoolhouse Bonds, Series 2019, 4.00% 2036 | 9,000 | 10,375 |
Water Dev. Board, State Water Implementation Rev. Fund, Rev. Bonds (Master Trust), Series 2019-A,
4.00% 2054 | 15,000 | 16,790 |
| | | 72,957 |
| Washington 0.13% | | |
| G.O. Bonds, Series 2020-A, 5.00% 2042 | 32,595 | 40,484 |
| G.O. Bonds, Series 2020-A, 5.00% 2043 | 20,000 | 24,787 |
| | | 65,271 |
| California 0.09% | | |
City and County of San Francisco, Airport Commission, San Francisco International Airport,
Second Series Rev. Bonds, Series 2019-E, AMT, 5.00% 2050 | 37,100 | 44,550 |
| Dept. of Veterans Affairs, Veterans G.O. Rev. Ref. Bonds, Series 2015-CM, AMT, 2.45% 2031 | 670 | 677 |
| | | 45,227 |
| Florida 0.07% | | |
| County of Miami-Dade, Water and Sewer System Rev. Ref. Bonds, Series 2019-B, 4.00% 2049 | 30,000 | 33,297 |
The Bond Fund of America — Page 37 of 49
Bonds, notes & other debt instruments (continued)
Municipals (continued)
Michigan 0.03% | Principal amount
(000) | Value
(000) |
| Fin. Auth., Local Government Loan Program Rev. Bonds (Detroit Fin. Recovery Income Tax Local Project Bonds), Series 2014-F-2, 4.60% 2022 | $3,860 | $3,929 |
| Housing Dev. Auth., Single Family Mortgage Rev. Bonds, Series 2016-B, 3.50% 2047 | 13,270 | 13,999 |
| | | 17,928 |
| New Jersey 0.03% | | |
| Econ. Dev. Auth., School Facs. Construction Rev. Ref. Bonds, Series 2015-YY, 4.447% 2020 | 7,500 | 7,581 |
| Econ. Dev. Auth., State Pension Funding Bonds, Series 1997-A, National insured, 7.425% 2029 | 4,400 | 5,520 |
| | | 13,101 |
| Hawaii 0.02% | | |
City and County of Honolulu, Wastewater System Rev. Bonds (First Bond Resolution), Series 2019-A,
4.00% 2044 | 4,000 | 4,513 |
City and County of Honolulu, Wastewater System Rev. Bonds (First Bond Resolution), Series 2019-A,
4.00% 2049 | 5,500 | 6,161 |
| | | 10,674 |
| Louisiana 0.02% | | |
| East Baton Rouge Sewerage Commission Rev. Ref. Bonds, Series 2019, 4.00% 2045 | 9,500 | 10,532 |
| Tennessee 0.02% | | |
| Housing Dev. Agcy., Homeownership Program Bonds, Series 2015-A, 3.50% 2045 | 1,120 | 1,178 |
| Housing Dev. Agcy., Residential Fin. Program Bonds, Series 2013-2-A, AMT, 4.00% 2043 | 695 | 721 |
| Housing Dev. Agcy., Residential Fin. Program Bonds, Series 2015-1-A, AMT, 4.00% 2045 | 2,945 | 3,093 |
| Housing Dev. Agcy., Residential Fin. Program Bonds, Series 2015-2-A, AMT, 4.00% 2046 | 3,680 | 3,882 |
| | | 8,874 |
| Minnesota 0.02% | | |
| Housing Fin. Agcy., Residential Housing Fin. Bonds, Series 2014-C, AMT, 4.00% 2045 | 4,525 | 4,772 |
| Housing Fin. Agcy., Residential Housing Fin. Bonds, Series 2015-A, AMT, 4.00% 2041 | 580 | 608 |
| Housing Fin. Agcy., Residential Housing Fin. Bonds, Series 2015-E, AMT, 3.50% 2046 | 2,830 | 2,961 |
| | | 8,341 |
| South Carolina 0.01% | | |
| Housing Fin. and Dev. Auth., Mortgage Rev. Ref. Bonds, Series 2016-A, 4.00% 2036 | 840 | 895 |
| Housing Fin. Auth., Mortgage Rev. Ref. Bonds, Series 2014, AMT, 4.00% 2041 | 3,635 | 3,808 |
| | | 4,703 |
| Puerto Rico 0.01% | | |
| Aqueduct and Sewer Auth., Rev. Bonds, Series 2012-B, 5.35% 2027 | 4,805 | 4,697 |
| Wisconsin 0.01% | | |
| Housing and Econ. Dev. Auth., Home Ownership Rev. Bonds, Series 2015-A, AMT, 4.00% 2045 | 1,860 | 1,952 |
| Housing and Econ. Dev. Auth., Home Ownership Rev. Bonds, Series 2016-A, AMT, 3.50% 2046 | 2,525 | 2,630 |
| | | 4,582 |
| Nebraska 0.01% | | |
| Investment Fin. Auth., Single Family Housing Rev. Bonds, Series 2015-C, 3.50% 2045 | 1,020 | 1,058 |
| Investment Fin. Auth., Single Family Housing Rev. Bonds, Series 2016-A, 3.50% 2046 | 3,215 | 3,376 |
| | | 4,434 |
The Bond Fund of America — Page 38 of 49
Bonds, notes & other debt instruments (continued)
Municipals (continued)
Maine 0.01% | Principal amount
(000) | Value
(000) |
| Housing Auth., Mortgage Purchase Rev. Ref. Bonds, Series 2015-E-1, AMT, 3.50% 2035 | $3,520 | $3,662 |
| Connecticut 0.01% | | |
| Housing Fin. Auth., Housing Mortgage Fin. Program Rev. Ref. Bonds, Series 2015-C-1, 3.50% 2045 | 3,220 | 3,359 |
| Maryland 0.01% | | |
Community Dev. Administration, Dept. of Housing and Community Dev., Residential Rev. Bonds,
Series 2014-B, AMT, 3.25% 2044 | 2,910 | 2,990 |
| Kentucky 0.00% | | |
| Housing Corp., Housing Rev. Bonds, Series 2013-D, 3.50% 2033 | 1,280 | 1,339 |
| Missouri 0.00% | | |
| Housing Dev. Commission, Single Family Mortgage Rev. Bonds (Special Homeownership Loan Program), Series 2015-A, 3.75% 2038 | 1,105 | 1,157 |
| Iowa 0.00% | | |
| Fin. Auth., Single Family Mortgage Bonds, Series 2016-A, 4.00% 2046 | 1,080 | 1,134 |
| Utah 0.00% | | |
| Housing Corp., Single Family Mortgage Bonds, Class III, Series 2015-D-2, 4.00% 2045 | 930 | 993 |
| Massachusetts 0.00% | | |
| Housing Fin. Agcy., Single Family Housing Rev. Bonds, Series 178, 3.50% 2042 | 745 | 780 |
| Wyoming 0.00% | | |
| Community Dev. Auth., Housing Rev. Bonds, Series 2015-6, 4.00% 2045 | 720 | 755 |
| Total municipals | | 809,215 |
| Bonds & notes of governments & government agencies outside the U.S. 1.53% | | |
| Abu Dhabi (Emirate of) 2.50% 2029 | 1,800 | 1,797 |
| Angola (Republic of) 8.00% 20295 | 5,000 | 5,349 |
| Argentine Republic 6.875% 2021 | 3,075 | 1,669 |
| Argentine Republic 7.50% 2026 | 5,625 | 2,941 |
| Argentine Republic 6.875% 2027 | 2,200 | 1,101 |
| Argentine Republic 8.28% 20337 | 4,984 | 3,081 |
| Argentine Republic 0% 2035 | 25,700 | 629 |
| Argentine Republic 6.875% 2048 | 13,230 | 6,379 |
| Banque Centrale de Tunisie 5.625% 2024 | €3,000 | 3,355 |
| Benin (Republic of) 5.75% 2026 | 1,200 | 1,406 |
| Brazil (Federative Republic of) 10.00% 2025 | BRL12,016 | 3,435 |
| Brazil (Federative Republic of) 6.00% 20454 | 56,139 | 19,368 |
| Buenos Aires (City of) 8.95% 2021 | $670 | 697 |
| Cameroon (Republic of) 9.50% 2025 | 1,500 | 1,687 |
| Costa Rica (Republic of) 7.00% 2044 | 2,178 | 2,300 |
| Cote d’Ivoire (Republic of) 6.375% 20285 | 7,275 | 7,694 |
The Bond Fund of America — Page 39 of 49
Bonds, notes & other debt instruments (continued)
Bonds & notes of governments & government agencies outside the U.S. (continued) | Principal amount
(000) | Value
(000) |
| Cote d’Ivoire (Republic of) 5.25% 2030 | €950 | $1,089 |
| Dominican Republic 7.50% 2021 | $633 | 659 |
| Dominican Republic 5.50% 20255 | 10,380 | 11,202 |
| Dominican Republic 5.50% 2025 | 1,640 | 1,770 |
| Dominican Republic 6.875% 20265 | 4,300 | 4,920 |
| Dominican Republic 6.40% 20495 | 1,648 | 1,812 |
| Egypt (Arab Republic of) 4.55% 20235 | 5,100 | 5,218 |
| Egypt (Arab Republic of) 5.577% 20235 | 1,690 | 1,771 |
| Egypt (Arab Republic of) 4.75% 2026 | €3,000 | 3,550 |
| Egypt (Arab Republic of) 6.588% 20285 | $1,610 | 1,683 |
| Egypt (Arab Republic of) 5.625% 2030 | €1,060 | 1,229 |
| Egypt (Arab Republic of) 7.50% 20325 | $5,100 | 5,355 |
| Egypt (Arab Republic of) 8.50% 20475 | 2,245 | 2,500 |
| Gabonese Republic 6.375% 2024 | 2,010 | 2,104 |
| Gabonese Republic 6.95% 2025 | 700 | 739 |
| Greece (Hellenic Republic of) 3.45% 2024 | €5,180 | 6,526 |
| Greece (Hellenic Republic of) 3.375% 2025 | 6,145 | 7,847 |
| Guatemala (Republic of) 4.50% 2026 | $1,700 | 1,790 |
| Guatemala (Republic of) 4.375% 2027 | 3,975 | 4,125 |
| Honduras (Republic of) 8.75% 2020 | 15,197 | 16,039 |
| Honduras (Republic of) 7.50% 2024 | 3,330 | 3,714 |
| Honduras (Republic of) 6.25% 20275 | 1,400 | 1,532 |
| Honduras (Republic of) 6.25% 2027 | 968 | 1,059 |
| India (Republic of) 8.60% 2028 | INR1,015,200 | 15,905 |
| India (Republic of) 7.61% 2030 | 2,386,030 | 35,016 |
| India (Republic of) 7.88% 2030 | 1,667,000 | 24,943 |
| Indonesia (Republic of) 3.75% 2022 | $4,255 | 4,400 |
| Indonesia (Republic of) 3.375% 2023 | 9,350 | 9,641 |
| Iraq (Republic of) 5.80% 2028 | 5,150 | 5,054 |
| Japan, Series 20, 0.10% 20254 | ¥8,670,000 | 81,270 |
| Japan, Series 21, 0.10% 20264 | 1,528,035 | 14,373 |
| Japan, Series 22, 0.10% 20274 | 2,247,630 | 21,234 |
| Japan Bank for International Cooperation 2.125% 2020 | $21,400 | 21,431 |
| Japan Bank for International Cooperation (3-month USD-LIBOR + 0.48%) 2.387% 20202 | 23,448 | 23,470 |
| Japan Bank for International Cooperation 3.125% 2021 | 76,664 | 78,198 |
| Jordan (Hashemite Kingdom of) 6.125% 20265 | 2,890 | 3,101 |
| Jordan (Hashemite Kingdom of) 5.75% 20275 | 615 | 650 |
| Kazakhstan (Republic of) 6.50% 20455 | 2,250 | 3,325 |
| Kenya (Republic of) 6.875% 20245 | 6,425 | 6,971 |
| Kenya (Republic of) 8.00% 20325 | 800 | 874 |
| Kenya (Republic of) 8.25% 20485 | 330 | 355 |
| Kuwait (State of) 2.75% 20225 | 2,150 | 2,186 |
| Morocco (Kingdom of) 4.25% 2022 | 5,400 | 5,702 |
| Morocco (Kingdom of) 5.50% 2042 | 7,200 | 8,846 |
| Pakistan (Islamic Republic of) 5.50% 20215 | 2,335 | 2,392 |
| Pakistan (Islamic Republic of) 8.25% 2024 | 2,220 | 2,479 |
| Pakistan (Islamic Republic of) 6.875% 2027 | 1,200 | 1,253 |
| Pakistan (Islamic Republic of) 6.875% 20275 | 1,100 | 1,149 |
| Panama (Republic of) 3.75% 20265 | 1,585 | 1,672 |
| Panama (Republic of) 3.16% 2030 | 3,585 | 3,698 |
| Panama (Republic of) 4.50% 2047 | 1,290 | 1,538 |
| Paraguay (Republic of) 4.625% 2023 | 1,500 | 1,588 |
| Paraguay (Republic of) 5.00% 2026 | 4,485 | 4,969 |
| Paraguay (Republic of) 5.00% 20265 | 1,575 | 1,745 |
| Paraguay (Republic of) 4.70% 20275 | 850 | 937 |
The Bond Fund of America — Page 40 of 49
Bonds, notes & other debt instruments (continued)
Bonds & notes of governments & government agencies outside the U.S. (continued) | Principal amount
(000) | Value
(000) |
| Paraguay (Republic of) 5.60% 20485 | $1,980 | $2,323 |
| Poland (Republic of) 3.25% 2026 | 6,600 | 7,011 |
| Portuguese Republic 5.125% 2024 | 1,725 | 1,941 |
| PT Indonesia Asahan Aluminium Tbk 5.23% 20215 | 3,719 | 3,905 |
| PT Indonesia Asahan Aluminium Tbk 5.71% 20235 | 2,050 | 2,264 |
| PT Indonesia Asahan Aluminium Tbk 6.53% 20285 | 685 | 842 |
| PT Indonesia Asahan Aluminium Tbk 6.757% 20485 | 655 | 846 |
| Qatar (State of) 3.875% 20235 | 10,830 | 11,450 |
| Qatar (State of) 4.50% 20285 | 5,115 | 5,870 |
| Romania 2.875% 2029 | €1,400 | 1,777 |
| Romania 3.50% 2034 | 6,485 | 8,207 |
| Romania 3.375% 2038 | 2,200 | 2,691 |
| Romania 4.625% 2049 | 2,900 | 4,025 |
| Russian Federation 7.00% 2023 | RUB111,000 | 1,860 |
| Russian Federation 4.375% 2029 | $4,000 | 4,455 |
| Russian Federation 8.50% 2031 | RUB37,360 | 712 |
| Russian Federation 7.70% 2033 | 10,350 | 186 |
| Russian Federation 7.25% 2034 | 55,290 | 961 |
| Russian Federation 5.10% 20355 | $800 | 960 |
| Saudi Arabia (Kingdom of) 2.375% 20215 | 750 | 754 |
| Saudi Arabia (Kingdom of) 3.25% 20265 | 4,170 | 4,326 |
| Saudi Arabia (Kingdom of) 3.625% 20285 | 3,110 | 3,290 |
| Saudi Arabia (Kingdom of) 3.625% 2028 | 1,800 | 1,904 |
| Senegal (Republic of) 4.75% 2028 | €4,000 | 4,744 |
| Sri Lanka (Democratic Socialist Republic of) 6.125% 2025 | $700 | 682 |
| Sri Lanka (Democratic Socialist Republic of) 6.85% 2025 | 800 | 804 |
| Sri Lanka (Democratic Socialist Republic of) 6.825% 2026 | 6,000 | 5,937 |
| Sri Lanka (Democratic Socialist Republic of) 6.20% 20275 | 955 | 898 |
| Sri Lanka (Democratic Socialist Republic of) 6.75% 20285 | 320 | 307 |
| Turkey (Republic of) 4.25% 2026 | 9,300 | 8,699 |
| Turkey (Republic of) 4.875% 2026 | 2,380 | 2,279 |
| Ukraine Government 7.75% 2021 | 7,900 | 8,376 |
| Ukraine Government 6.75% 2026 | €3,905 | 4,929 |
| Ukraine Government 7.75% 2026 | $3,500 | 3,835 |
| United Kingdom 0.125% 20414 | £11,065 | 22,671 |
| United Mexican States 5.75% 2110 | $4,700 | 5,576 |
| United Mexican States, Series M, 8.00% 2023 | MXN1,540,000 | 84,918 |
| Uruguay (Oriental Republic of) 8.50% 2028 | UYU224,725 | 5,167 |
| | | 773,868 |
| Total bonds, notes & other debt instruments (cost: $47,187,947,000) | | 48,369,176 |
Preferred securities 0.01%
Financials 0.01% | Shares | |
| CoBank, ACB, Class E, noncumulative, preferred shares5 | 6,250 | 4,219 |
| Total preferred securities (cost: $5,820,000) | | 4,219 |
Common stocks 0.01%
Health care 0.01% | | |
| Rotech Healthcare Inc.8,9,14,15 | 342,069 | 6,841 |
The Bond Fund of America — Page 41 of 49
Common stocks (continued)
Information technology 0.00% | Shares | Value
(000) |
| Corporate Risk Holdings I, Inc.8,9,14 | 188,850 | $22 |
| Total common stocks (cost: $12,646,000) | | 6,863 |
Short-term securities 5.75%
Money market investments 5.70% | | |
| Capital Group Central Cash Fund 1.73%16 | 28,748,660 | 2,874,866 |
| Other short-term securities 0.05% | Principal amount
(000) | |
| Nigerian Treasury Bill 12.14%due 2/27/2020 | NGN9,545,000 | 25,918 |
| Total short-term securities (cost: $2,898,112,000) | | 2,900,784 |
| Total investment securities101.65% (cost: $50,104,525,000) | | 51,281,042 |
| Other assets less liabilities (1.65)% | | (833,950) |
| Net assets100.00% | | $50,447,092 |
Futures contracts
| Contracts | Type | Number of
contracts | Expiration | Notional
amount17
(000) | Value at
12/31/201918
(000) | Unrealized
(depreciation)
appreciation
at 12/31/2019
(000) |
| 30 Day Federal Funds Futures | Long | 2,048 | January 2020 | $853,402 | $840,153 | $(537) |
| 90 Day Euro Dollar Futures | Long | 746 | March 2020 | 186,500 | 183,264 | (270) |
| 90 Day Euro Dollar Futures | Long | 2,697 | March 2021 | 674,250 | 663,732 | (461) |
| 2 Year U.S. Treasury Note Futures | Long | 41,046 | April 2020 | 8,209,200 | 8,845,413 | (1,825) |
| 5 Year Euro-Bobl Futures | Long | 1,575 | March 2020 | €157,500 | 236,081 | (639) |
| 5 Year U.S. Treasury Note Futures | Long | 65,414 | April 2020 | $6,541,400 | 7,758,714 | (26,569) |
| 10 Year Euro-Bund Futures | Long | 182 | March 2020 | €18,200 | 34,805 | (321) |
| 10 Year U.S. Treasury Note Futures | Long | 12,816 | March 2020 | $1,281,600 | 1,645,855 | (10,353) |
| 10 Year Ultra U.S. Treasury Note Futures | Short | 10,528 | March 2020 | (1,052,800) | (1,481,323) | 15,245 |
| 20 Year U.S. Treasury Bond Futures | Long | 2,500 | March 2020 | 250,000 | 389,766 | (6,924) |
| 30 Year Euro-Buxl Futures | Long | 277 | March 2020 | €27,700 | 61,639 | (1,715) |
| 30 Year Ultra U.S. Treasury Bond Futures | Long | 3,493 | March 2020 | $349,300 | 634,525 | (17,963) |
| | | | | | | $(52,332) |
Forward currency contracts
| Contract amount | Counterparty | Settlement
date | Unrealized
appreciation
(depreciation)
at 12/31/2019
(000) |
Purchases
(000) | Sales
(000) |
| EUR109,690 | USD122,168 | Citibank | 1/6/2020 | $917 |
| EUR5,310 | USD5,912 | Bank of New York Mellon | 1/6/2020 | 47 |
| EUR500 | USD555 | Standard Chartered Bank | 1/6/2020 | 6 |
| USD5,724 | EUR5,156 | JPMorgan Chase | 1/6/2020 | (62) |
| JPY3,381,918 | USD31,230 | UBS AG | 1/6/2020 | (94) |
| USD25,803 | MXN504,000 | Goldman Sachs | 1/6/2020 | (832) |
| USD127,270 | EUR115,000 | Morgan Stanley | 1/6/2020 | (1,774) |
The Bond Fund of America — Page 42 of 49
Forward currency contracts (continued)
| Contract amount | Counterparty | Settlement
date | Unrealized
appreciation
(depreciation)
at 12/31/2019
(000) |
Purchases
(000) | Sales
(000) |
| CAD5,432 | USD4,087 | HSBC Bank | 1/7/2020 | $96 |
| USD636 | EUR575 | HSBC Bank | 1/7/2020 | (10) |
| USD35,423 | MXN691,600 | Barclays Bank PLC | 1/7/2020 | (1,121) |
| KRW161,956,500 | USD138,572 | Citibank | 1/9/2020 | 1,505 |
| KRW161,956,500 | USD138,608 | JPMorgan Chase | 1/9/2020 | 1,470 |
| COP80,099,000 | USD23,186 | Citibank | 1/9/2020 | 1,171 |
| USD2,107 | EUR1,895 | Morgan Stanley | 1/9/2020 | (20) |
| USD3,849 | INR277,800 | JPMorgan Chase | 1/9/2020 | (40) |
| USD3,367 | BRL14,170 | Goldman Sachs | 1/9/2020 | (154) |
| USD27,615 | KRW32,275,000 | Citibank | 1/9/2020 | (300) |
| USD19,226 | BRL81,100 | JPMorgan Chase | 1/9/2020 | (927) |
| USD66,640 | INR4,797,850 | JPMorgan Chase | 1/10/2020 | (513) |
| MXN59,800 | USD3,098 | HSBC Bank | 1/13/2020 | 58 |
| GBP2,060 | USD2,713 | Bank of America | 1/13/2020 | 17 |
| USD645 | GBP490 | Bank of America | 1/13/2020 | (4) |
| USD1,832 | EUR1,650 | HSBC Bank | 1/13/2020 | (20) |
| USD4,293 | CAD5,682 | JPMorgan Chase | 1/13/2020 | (83) |
| USD11,794 | SEK112,000 | UBS AG | 1/13/2020 | (171) |
| USD19,644 | SGD26,700 | Standard Chartered Bank | 1/13/2020 | (210) |
| USD40,806 | MXN788,295 | Barclays Bank PLC | 1/13/2020 | (805) |
| NZD21,970 | USD14,381 | Citibank | 1/14/2020 | 413 |
| USD26,712 | JPY2,891,581 | Bank of New York Mellon | 1/14/2020 | 78 |
| USD14,722 | NZD21,970 | Goldman Sachs | 1/14/2020 | (71) |
| USD19,753 | JPY2,137,809 | Goldman Sachs | 1/15/2020 | 61 |
| CAD250 | USD190 | Bank of America | 1/15/2020 | 3 |
| USD13,817 | MXN262,000 | Goldman Sachs | 1/15/2020 | (8) |
| USD3,779 | EUR3,385 | Bank of New York Mellon | 1/15/2020 | (21) |
| USD11,593 | MXN222,520 | Citibank | 1/15/2020 | (149) |
| GBP17,500 | USD22,928 | Barclays Bank PLC | 1/16/2020 | 264 |
| USD28,072 | GBP21,000 | Goldman Sachs | 1/16/2020 | 242 |
| JPY1,769,000 | USD16,259 | Citibank | 1/16/2020 | 37 |
| USD2,150 | MXN41,200 | Citibank | 1/16/2020 | (24) |
| USD20,182 | GBP15,330 | Barclays Bank PLC | 1/16/2020 | (134) |
| AUD17,424 | USD12,006 | Citibank | 1/17/2020 | 227 |
| USD4,842 | EUR4,326 | Morgan Stanley | 1/17/2020 | (16) |
| EUR23,410 | MXN500,000 | Goldman Sachs | 1/17/2020 | (89) |
| EUR66,325 | USD74,196 | Goldman Sachs | 1/23/2020 | 311 |
| EUR205 | USD229 | Citibank | 1/23/2020 | 1 |
| AUD23,900 | USD16,404 | Citibank | 1/24/2020 | 378 |
| EUR53,409 | USD59,569 | UBS AG | 1/27/2020 | 444 |
| USD152,634 | EUR136,861 | JPMorgan Chase | 1/27/2020 | (1,149) |
| USD3,440 | INR245,150 | Standard Chartered Bank | 1/28/2020 | 15 |
| | | | | $(1,040) |
The Bond Fund of America — Page 43 of 49
Swap contracts
Interest rate swaps
| Receive | Pay | Expiration
date | Notional
(000) | Value at
12/31/2019
(000) | Upfront
payments/
receipts
(000) | Unrealized
appreciation
(depreciation)
at 12/31/2019
(000) |
| 1.555% | U.S. EFFR | 1/29/2020 | $12,969,200 | $27 | $— | $27 |
| 1.553% | U.S. EFFR | 1/29/2020 | 8,686,900 | 5 | — | 5 |
| 1.538% | U.S. EFFR | 1/29/2020 | 12,696,600 | (141) | — | (141) |
| 1.5365% | U.S. EFFR | 1/29/2020 | 15,449,600 | (189) | — | (189) |
| 1.535% | U.S. EFFR | 1/29/2020 | 16,208,200 | (218) | — | (218) |
| U.S. EFFR | 1.558% | 3/18/2020 | 5,375,000 | 44 | — | 44 |
| U.S. EFFR | 1.56% | 3/18/2020 | 5,375,000 | 29 | — | 29 |
| 1.515% | U.S. EFFR | 3/18/2020 | 3,631,900 | (241) | — | (241) |
| 1.531% | U.S. EFFR | 3/18/2020 | 7,562,300 | (338) | — | (338) |
| 1.5305% | U.S. EFFR | 3/18/2020 | 8,188,200 | (372) | — | (372) |
| 1.5155% | U.S. EFFR | 3/18/2020 | 7,679,000 | (505) | — | (505) |
| 1.5135% | U.S. EFFR | 3/18/2020 | 7,677,700 | (526) | — | (526) |
| 1.5435% | U.S. EFFR | 4/29/2020 | 18,003,900 | (202) | — | (202) |
| 1.535% | U.S. EFFR | 4/29/2020 | 14,249,900 | (300) | — | (300) |
| 2.898% | 3-month USD-LIBOR | 8/3/2020 | 155,000 | 977 | — | 977 |
| 3-month USD-LIBOR | 2.806% | 8/29/2020 | 194,600 | (1,268) | — | (1,268) |
| 1.4555% | U.S. EFFR | 12/10/2020 | 705,400 | (422) | — | (422) |
| 1.454% | U.S. EFFR | 12/10/2020 | 834,600 | (511) | — | (511) |
| 1.491% | U.S. EFFR | 12/16/2020 | 770,100 | (191) | — | (191) |
| 1.487% | U.S. EFFR | 12/16/2020 | 759,900 | (218) | — | (218) |
| 1.4995% | U.S. EFFR | 12/20/2020 | 1,540,000 | (232) | — | (232) |
| 2.346% | U.S. EFFR | 2/26/2021 | 118,000 | 1,074 | — | 1,074 |
| 2.1125% | U.S. EFFR | 3/28/2021 | 382,000 | 2,592 | — | 2,592 |
| 2.103% | U.S. EFFR | 3/28/2021 | 297,000 | 1,980 | — | 1,980 |
| 3-month USD-LIBOR | 2.367% | 3/28/2021 | 1,386,800 | (10,627) | — | (10,627) |
| 2.19875% | U.S. EFFR | 5/7/2021 | 367,600 | 3,174 | — | 3,174 |
| 3-month USD-LIBOR | 2.312% | 5/23/2021 | 318,000 | (2,607) | — | (2,607) |
| 1.355% | U.S. EFFR | 10/24/2021 | 243,600 | (409) | — | (409) |
| 1.339% | U.S. EFFR | 10/24/2021 | 443,000 | (871) | — | (871) |
| 1.3065% | U.S. EFFR | 10/25/2021 | 315,500 | (803) | — | (803) |
| 1.305% | U.S. EFFR | 10/25/2021 | 343,900 | (884) | — | (884) |
| 1.39% | U.S. EFFR | 10/31/2021 | 700,800 | (701) | — | (701) |
| 1.3615% | U.S. EFFR | 11/1/2021 | 2,832,100 | (4,300) | — | (4,300) |
| 1.332% | U.S. EFFR | 11/4/2021 | 181,000 | (372) | — | (372) |
| 1.281% | U.S. EFFR | 11/4/2021 | 2,835,800 | (8,482) | — | (8,482) |
| 1.4025% | U.S. EFFR | 11/7/2021 | 351,000 | (269) | — | (269) |
| U.S. EFFR | 1.335% | 11/26/2021 | 1,463,000 | 2,971 | — | 2,971 |
| 2.326% | U.S. EFFR | 1/2/2022 | 1,450,000 | 25,566 | — | 25,566 |
| 8.54% | 28-day MXN-TIIE | 1/6/2022 | MXN884,158 | 1,667 | — | 1,667 |
| 8.44% | 28-day MXN-TIIE | 1/7/2022 | 995,842 | 1,780 | — | 1,780 |
| 2.197% | U.S. EFFR | 4/18/2022 | $369,200 | 5,983 | — | 5,983 |
| 3-month USD-LIBOR | 2.321% | 5/2/2022 | 469,700 | (6,962) | — | (6,962) |
| 6.99% | 28-day MXN-TIIE | 6/17/2022 | MXN655,000 | 301 | — | 301 |
| 1.8475% | 3-month USD-LIBOR | 7/11/2022 | $210,200 | 905 | — | 905 |
| 2.5775% | U.S. EFFR | 7/16/2022 | 1,001,820 | 11,622 | — | 11,622 |
| 3-month USD-LIBOR | 1.948% | 7/28/2022 | 630,000 | (4,365) | — | (4,365) |
| 2.80% | 3-month USD-LIBOR | 9/2/2022 | 785,000 | 17,884 | — | 17,884 |
| 2.009% | 3-month USD-LIBOR | 10/4/2022 | 272,000 | 2,446 | — | 2,446 |
| 2.1045% | 3-month USD-LIBOR | 10/31/2022 | 110,000 | 1,308 | — | 1,308 |
| 3-month USD-LIBOR | 2.7454% | 3/8/2023 | 417,000 | (13,817) | — | (13,817) |
The Bond Fund of America — Page 44 of 49
Swap contracts (continued)
Interest rate swaps (continued)
| Receive | Pay | Expiration
date | Notional
(000) | Value at
12/31/2019
(000) | Upfront
payments/
receipts
(000) | Unrealized
appreciation
(depreciation)
at 12/31/2019
(000) |
| 3-month USD-LIBOR | 2.733% | 3/8/2023 | $775,000 | $(25,381) | $— | $(25,381) |
| 3-month USD-LIBOR | 2.9415% | 5/14/2023 | 22,700 | (938) | — | (938) |
| 2.5815% | U.S. EFFR | 5/25/2023 | 459,000 | 16,984 | — | 16,984 |
| 1.615% | 3-month USD-LIBOR | 8/18/2023 | 270,000 | (283) | — | (283) |
| U.S. EFFR | 2.4435% | 12/20/2023 | 62,076 | (2,388) | — | (2,388) |
| U.S. EFFR | 2.45375% | 12/20/2023 | 556,063 | (21,610) | — | (21,610) |
| U.S. EFFR | 2.4325% | 12/21/2023 | 138,000 | (5,252) | — | (5,252) |
| 2.21875% | U.S. EFFR | 3/14/2024 | 349,000 | 10,516 | — | 10,516 |
| 3-month USD-LIBOR | 2.18075% | 3/29/2024 | 74,400 | (1,461) | — | (1,461) |
| 3-month USD-LIBOR | 2.194% | 3/29/2024 | 74,900 | (1,511) | — | (1,511) |
| 3-month USD-LIBOR | 2.21875% | 3/29/2024 | 78,700 | (1,668) | — | (1,668) |
| 3-month USD-LIBOR | 2.221% | 4/1/2024 | 63,000 | (1,348) | — | (1,348) |
| 3-month USD-LIBOR | 2.30% | 4/2/2024 | 50,000 | (1,232) | — | (1,232) |
| 2.314% | 3-month USD-LIBOR | 5/9/2024 | 571,400 | 14,659 | — | 14,659 |
| 3-month USD-LIBOR | 2.293% | 5/10/2024 | 73,450 | (1,820) | — | (1,820) |
| 7.79% | 28-day MXN-TIIE | 5/31/2024 | MXN1,150,000 | 2,839 | — | 2,839 |
| 3-month USD-LIBOR | 1.93% | 6/12/2024 | $22,250 | (212) | — | (212) |
| 3-month USD-LIBOR | 1.7935% | 7/12/2024 | 135,000 | (474) | — | (474) |
| 3-month USD-LIBOR | 1.556% | 11/27/2024 | 261,800 | 2,153 | — | 2,153 |
| 3-month USD-LIBOR | 1.561% | 11/27/2024 | 261,700 | 2,090 | — | 2,090 |
| 3-month USD-LIBOR | 1.554% | 11/27/2024 | 222,600 | 1,851 | — | 1,851 |
| 3-month USD-LIBOR | 1.5335% | 11/29/2024 | 261,900 | 2,421 | — | 2,421 |
| 2.768% | 3-month USD-LIBOR | 1/29/2025 | 230,000 | 4,051 | — | 4,051 |
| 6-month JPY-LIBOR | 0.5327% | 3/4/2025 | ¥6,100,000 | (1,448) | — | (1,448) |
| 2.524% | 3-month USD-LIBOR | 4/14/2025 | $123,000 | 4,672 | — | 4,672 |
| 3-month USD-LIBOR | 1.867% | 7/11/2025 | 297,400 | (505) | — | (505) |
| 2.354% | 3-month USD-LIBOR | 9/25/2025 | 420,000 | 12,229 | — | 12,229 |
| 6-month JPY-LIBOR | 0.46995% | 11/17/2025 | ¥6,250,000 | (1,435) | — | (1,435) |
| 6-month JPY-LIBOR | 0.3822% | 1/15/2026 | 5,100,000 | (941) | — | (941) |
| 6-month JPY-LIBOR | 0.228% | 2/8/2026 | 8,500,000 | (846) | — | (846) |
| 6-month JPY-LIBOR | 0.20125% | 2/18/2026 | 8,240,000 | (700) | — | (700) |
| 0.1223% | 6-month JPY-LIBOR | 5/11/2026 | 2,000,000 | 79 | — | 79 |
| 0.1173% | 6-month JPY-LIBOR | 5/13/2026 | 1,000,000 | 37 | — | 37 |
| 0.10855% | 6-month JPY-LIBOR | 5/16/2026 | 2,000,000 | 63 | — | 63 |
| 0.0188% | 6-month JPY-LIBOR | 6/16/2026 | 1,000,000 | (23) | — | (23) |
| (0.00395)% | 6-month JPY-LIBOR | 6/17/2026 | 2,000,000 | (73) | — | (73) |
| 28-day MXN-TIIE | 8.07% | 1/1/2027 | MXN910,000 | (3,837) | — | (3,837) |
| 0.22855% | 6-month JPY-LIBOR | 1/12/2027 | ¥7,700,000 | 802 | — | 802 |
| 28-day MXN-TIIE | 8.135% | 1/14/2027 | MXN515,000 | (2,280) | — | (2,280) |
| 28-day MXN-TIIE | 7.47% | 4/5/2027 | 290,000 | (702) | — | (702) |
| 28-day MXN-TIIE | 7.625% | 5/20/2027 | 410,000 | (1,200) | — | (1,200) |
| 28-day MXN-TIIE | 7.865% | 12/8/2027 | 189,000 | (723) | — | (723) |
| 3-month USD-LIBOR | 2.446% | 1/8/2028 | $42,000 | (1,965) | — | (1,965) |
| 2.91% | 3-month USD-LIBOR | 2/1/2028 | 88,800 | 4,010 | — | 4,010 |
| 2.908% | 3-month USD-LIBOR | 2/1/2028 | 88,900 | 4,007 | — | 4,007 |
| 2.925% | 3-month USD-LIBOR | 2/1/2028 | 71,100 | 3,260 | — | 3,260 |
| 2.92% | 3-month USD-LIBOR | 2/2/2028 | 67,200 | 3,065 | — | 3,065 |
| 3-month USD-LIBOR | 2.891% | 3/9/2028 | 45,000 | (3,669) | — | (3,669) |
| U.S. EFFR | 2.471% | 3/27/2028 | 190,100 | (12,803) | — | (12,803) |
| U.S. EFFR | 2.4575% | 3/29/2028 | 224,497 | (14,886) | — | (14,886) |
The Bond Fund of America — Page 45 of 49
Swap contracts (continued)
Interest rate swaps (continued)
| Receive | Pay | Expiration
date | Notional
(000) | Value at
12/31/2019
(000) | Upfront
payments/
receipts
(000) | Unrealized
appreciation
(depreciation)
at 12/31/2019
(000) |
| U.S. EFFR | 2.424% | 3/30/2028 | $189,960 | $(12,102) | $— | $(12,102) |
| 2.919% | 3-month USD-LIBOR | 7/16/2028 | 89,800 | 7,736 | — | 7,736 |
| 6-month GBP-LIBOR | 1.6567% | 9/28/2028 | £53,200 | (4,018) | — | (4,018) |
| 3-month USD-LIBOR | 2.724% | 2/5/2029 | $301,173 | (22,026) | — | (22,026) |
| 3-month USD-LIBOR | 2.7435% | 2/6/2029 | 301,183 | (22,523) | — | (22,523) |
| 3-month USD-LIBOR | 2.3665% | 3/27/2029 | 65,000 | (2,801) | — | (2,801) |
| 3-month USD-LIBOR | 2.4775% | 4/4/2029 | 24,000 | (1,264) | — | (1,264) |
| 3-month USD-LIBOR | 2.493% | 4/8/2029 | 27,500 | (1,486) | — | (1,486) |
| 3-month USD-LIBOR | 2.566% | 4/24/2029 | 45,000 | (2,719) | — | (2,719) |
| 3-month USD-LIBOR | 2.5525% | 4/25/2029 | 36,400 | (2,157) | — | (2,157) |
| 3-month USD-LIBOR | 1.9675% | 6/21/2029 | 12,000 | (99) | — | (99) |
| 3-month USD-LIBOR | 1.995% | 7/19/2029 | 27,500 | (288) | — | (288) |
| 3-month USD-LIBOR | 1.62105% | 8/7/2029 | 169,000 | 3,865 | — | 3,865 |
| 1.63521% | 3-month USD-LIBOR | 8/8/2029 | 77,090 | (1,668) | — | (1,668) |
| 6.89% | 28-day MXN-TIIE | 8/9/2029 | MXN94,700 | 32 | — | 32 |
| U.S. EFFR | 1.485% | 10/23/2029 | $73,400 | 1,117 | — | 1,117 |
| U.S. EFFR | 1.4869% | 10/23/2029 | 67,000 | 1,008 | — | 1,008 |
| U.S. EFFR | 1.453% | 10/24/2029 | 85,100 | 1,545 | — | 1,545 |
| U.S. EFFR | 1.4741% | 10/24/2029 | 85,300 | 1,384 | — | 1,384 |
| U.S. EFFR | 1.4495% | 10/24/2029 | 63,000 | 1,164 | — | 1,164 |
| U.S. EFFR | 1.446% | 10/24/2029 | 8,200 | 154 | — | 154 |
| 1.419% | U.S. EFFR | 11/26/2029 | 310,000 | (6,735) | — | (6,735) |
| 3-month USD-LIBOR | 2.679% | 4/14/2030 | 65,500 | (4,659) | — | (4,659) |
| 3-month USD-LIBOR | 3.005% | 9/2/2030 | 160,300 | (15,808) | — | (15,808) |
| 3-month USD-LIBOR | 2.514% | 9/25/2030 | 223,000 | (11,925) | — | (11,925) |
| 3-month USD-LIBOR | 1.87% | 8/18/2031 | 57,000 | 558 | — | 558 |
| 3-month USD-LIBOR | 2.8672% | 1/29/2033 | 50,700 | (3,552) | — | (3,552) |
| 2.523% | 3-month USD-LIBOR | 12/8/2035 | 5,000 | 352 | — | 352 |
| 2.432% | 3-month USD-LIBOR | 9/21/2037 | 2,000 | 118 | — | 118 |
| 3-month USD-LIBOR | 2.986% | 2/1/2038 | 43,100 | (2,479) | — | (2,479) |
| 3-month USD-LIBOR | 2.963% | 2/1/2038 | 53,100 | (2,958) | — | (2,958) |
| 3-month USD-LIBOR | 2.9625% | 2/1/2038 | 53,300 | (2,967) | — | (2,967) |
| 3-month USD-LIBOR | 2.967% | 2/2/2038 | 41,500 | (2,324) | — | (2,324) |
| 2.987% | 3-month USD-LIBOR | 2/7/2038 | 37,000 | 5,389 | — | 5,389 |
| 3.193% | 3-month USD-LIBOR | 5/21/2038 | 45,000 | 8,081 | — | 8,081 |
| 3.062% | 3-month USD-LIBOR | 7/31/2038 | 23,500 | 3,764 | — | 3,764 |
| 2.835% | 3-month USD-LIBOR | 1/10/2039 | 21,500 | 2,703 | — | 2,703 |
| 6-month GBP-LIBOR | 1.5872% | 2/5/2039 | £4,250 | (464) | — | (464) |
| 6-month GBP-LIBOR | 1.5877% | 2/5/2039 | 7,300 | (797) | — | (797) |
| 2.874% | 3-month USD-LIBOR | 2/6/2039 | $13,900 | 1,839 | — | 1,839 |
| 2.7055% | 3-month USD-LIBOR | 4/17/2039 | 41,900 | 4,426 | — | 4,426 |
| 3-month USD-LIBOR | 2.6785% | 9/4/2045 | 45,000 | (5,447) | — | (5,447) |
| 3-month USD-LIBOR | 2.525% | 10/20/2045 | 28,000 | (2,515) | — | (2,515) |
| 3-month USD-LIBOR | 2.516% | 10/20/2045 | 42,000 | (3,694) | — | (3,694) |
| 3-month USD-LIBOR | 2.5315% | 10/26/2045 | 40,000 | (3,648) | — | (3,648) |
| 3-month USD-LIBOR | 2.57082% | 11/6/2045 | 123,000 | (12,221) | — | (12,221) |
| 3-month USD-LIBOR | 2.57067% | 11/9/2045 | 13,200 | (1,312) | — | (1,312) |
| 3-month USD-LIBOR | 2.6485% | 11/16/2045 | 13,050 | (1,507) | — | (1,507) |
| 3-month USD-LIBOR | 2.59125% | 12/16/2045 | 45,000 | (4,677) | — | (4,677) |
| 3-month USD-LIBOR | 2.4095% | 1/14/2046 | 15,000 | (995) | — | (995) |
The Bond Fund of America — Page 46 of 49
Swap contracts (continued)
Interest rate swaps (continued)
| Receive | Pay | Expiration
date | Notional
(000) | Value at
12/31/2019
(000) | Upfront
payments/
receipts
(000) | Unrealized
appreciation
(depreciation)
at 12/31/2019
(000) |
| 2.5095% | 3-month USD-LIBOR | 7/24/2047 | $3,000 | $272 | $— | $272 |
| U.S. EFFR | 2.172% | 11/8/2047 | 30,000 | (2,126) | — | (2,126) |
| U.S. EFFR | 2.155% | 11/10/2047 | 18,850 | (1,266) | — | (1,266) |
| U.S. EFFR | 2.5635% | 2/12/2048 | 135,836 | (21,414) | — | (21,414) |
| 2.98% | 3-month USD-LIBOR | 3/15/2048 | 8,400 | 1,644 | — | 1,644 |
| 2.9625% | 3-month USD-LIBOR | 3/15/2048 | 8,400 | 1,612 | — | 1,612 |
| 2.917% | 3-month USD-LIBOR | 3/16/2048 | 16,700 | 3,036 | — | 3,036 |
| 2.9075% | 3-month USD-LIBOR | 4/16/2048 | 7,000 | 1,260 | — | 1,260 |
| 3.22859% | 3-month USD-LIBOR | 10/31/2048 | 60,560 | 15,445 | — | 15,445 |
| 3.236% | 3-month USD-LIBOR | 10/31/2048 | 16,250 | 4,171 | — | 4,171 |
| 3-month USD-LIBOR | 2.8755% | 1/31/2049 | 157,500 | (27,829) | — | (27,829) |
| 2.7065% | 3-month USD-LIBOR | 5/2/2049 | 63,800 | 8,890 | — | 8,890 |
| 3-month USD-LIBOR | 2.641% | 5/9/2049 | 127,500 | (15,879) | — | (15,879) |
| 2.5625% | 3-month USD-LIBOR | 5/15/2049 | 125,200 | 13,368 | — | 13,368 |
| 3-month USD-LIBOR | 2.381% | 5/31/2049 | 14,500 | (951) | — | (951) |
| 3-month USD-LIBOR | 1.934% | 12/12/2049 | 47,520 | 1,733 | — | 1,733 |
| 3-month USD-LIBOR | 1.935% | 12/17/2049 | 104,310 | 3,783 | — | 3,783 |
| 3-month USD-LIBOR | 2.007% | 12/19/2049 | 43,400 | 854 | — | 854 |
| 3-month USD-LIBOR | 2.068% | 12/24/2049 | 87,140 | 495 | — | 495 |
| 3-month USD-LIBOR | 2.045% | 12/27/2049 | 96,900 | 1,068 | — | 1,068 |
| | | | | | $— | $(133,268) |
Credit default swaps
Centrally cleared credit default swaps on credit indices — buy protection
| Receive | Pay/
Payment frequency | Expiration
date | Notional
(000) | Value at
12/31/2019
(000) | Upfront
payments
(000) | Unrealized
depreciation
at 12/31/2019
(000) |
| CDX.NA.IG.33 | 1.00%/Quarterly | 12/20/2024 | $1,574,885 | $(40,830) | $(33,522) | $(7,308) |
| CDX.NA.HY.33 | 5.00%/Quarterly | 12/20/2024 | 421,402 | (40,596) | (29,257) | (11,339) |
| | | | | | $(62,779) | $(18,647) |
The Bond Fund of America — Page 47 of 49
| 1 | Amount less than one thousand. |
| 2 | Coupon rate may change periodically. Reference rate and spread are as of the most recent information available. Some coupon rates are determined by the issuer or agent based on current market conditions; therefore, the reference rate and spread are not available. |
| 3 | All or a portion of this security was pledged as collateral. The total value of pledged collateral was $308,172,000, which represented .61% of the net assets of the fund. |
| 4 | Index-linked bond whose principal amount moves with a government price index. |
| 5 | Acquired in a transaction exempt from registration under Rule 144A of the Securities Act of 1933. May be resold in the U.S. in transactions exempt from registration, normally to qualified institutional buyers. The total value of all such securities was $4,914,562,000, which represented 9.74% of the net assets of the fund. |
| 6 | Step bond; coupon rate may change at a later date. |
| 7 | Payment in kind; the issuer has the option of paying additional securities in lieu of cash. Most recent payment was 100% cash unless otherwise noted. |
| 8 | Valued under fair value procedures adopted by authority of the board of trustees. The total value of all such securities was $32,455,000, which represented .06% of the net assets of the fund. |
| 9 | Value determined using significant unobservable inputs. |
| 10 | Loan participations and assignments; may be subject to legal or contractual restrictions on resale. The total value of all such loans was $16,533,000, which represented .03% of the net assets of the fund. |
| 11 | Scheduled interest and/or principal payment was not received. |
| 12 | Principal payments may be made periodically. Therefore, the effective maturity date may be earlier than the stated maturity date. |
| 13 | Purchased on a TBA basis. |
| 14 | Security did not produce income during the last 12 months. |
| 15 | Acquired through a private placement transaction exempt from registration under the Securities Act of 1933. May be subject to legal or contractual restrictions on resale. Further details on this holding appear below. |
| 16 | Rate represents the seven-day yield at 12/31/2019. |
| 17 | Notional amount is calculated based on the number of contracts and notional contract size. |
| 18 | Value is calculated based on the notional amount and current market price. |
| Private placement security | Acquisition
date | Cost
(000) | Value
(000) | Percent
of net
assets |
| Rotech Healthcare Inc. | 9/26/2013 | $12,646 | $6,841 | .01% |
| Key to abbreviations and symbols | | |
| Agcy. = Agency | ICE = Intercontinental Exchange, Inc. | |
| AMT = Alternative Minimum Tax | INR = Indian rupees | |
| AUD = Australian dollars | JPY/¥ = Japanese yen | |
| Auth. = Authority | KRW = South Korean won | |
| BRL = Brazilian reais | LIBOR = London Interbank Offered Rate | |
| CAD = Canadian dollars | MXN = Mexican pesos | |
| CLO = Collateralized Loan Obligations | NGN = Nigerian naira | |
| COP = Colombian pesos | NZD = New Zealand dollars | |
| Dept. = Department | Ref. = Refunding | |
| Dev. = Development | Rev. = Revenue | |
| Dist. = District | RUB = Russian rubles | |
| Econ. = Economic | SEK = Swedish kronor | |
| EFFR = Effective Federal Funds Rate | SGD = Singapore dollars | |
| EUR/€ = Euros | SIFMA = Securities Industry and Financial Markets Association | |
| Fac. = Facility | SOFR = Secured Overnight Financing Rate | |
| Facs. = Facilities | TBA = To-be-announced | |
| Fin. = Finance | TIIE = Equilibrium Interbank Interest Rate | |
| G.O. = General Obligation | USD/$ = U.S. dollars | |
| GBP/£ = British pounds | UYU = Uruguayan pesos | |
The Bond Fund of America — Page 48 of 49
Additional financial disclosures are included in the fund’s current shareholder report and should be read in conjunction with this report.
Investments are not FDIC-insured, nor are they deposits of or guaranteed by a bank or any other entity, so they may lose value.
Investors should carefully consider investment objectives, risks, charges and expenses. This and other important information is contained in the fund prospectus and summary prospectus, which can be obtained from your financial professional and should be read carefully before investing. You may also call American Funds Service Company (AFS) at (800) 421-4225 or visit the Capital Group website at capitalgroup.com.
All Capital Group trademarks mentioned are owned by The Capital Group Companies, Inc., an affiliated company or fund. All other company and product names mentioned are the property of their respective companies.
American Funds Distributors, Inc., member FINRA.
© 2020 Capital Group. All rights reserved.
| MFGEFPX-008-0220O-S73177 | The Bond Fund of America — Page 49 of 49 |
REPORT OF INDEPENDENT REGISTERED PUBLIC ACCOUNTING FIRM ON INVESTMENT PORTFOLIO
To the Shareholders and Board of Trustees of The Bond Fund of America:
Opinion on the Investment Portfolio
We have audited the accompanying investment portfolio of The Bond Fund of America (the “Fund”), as of December 31, 2019, and the related notes (“investment portfolio”) (included in Item 6 of this Form N-CSR). In our opinion, the investment portfolio presents fairly, in all material respects, the investments in securities of the Fund as of December 31, 2019, in conformity with accounting principles generally accepted in the United States of America.
Basis for Opinion
The investment portfolio is the responsibility of the Fund’s management. Our responsibility is to express an opinion on the investment portfolio based on our audit. We are a public accounting firm registered with the Public Company Accounting Oversight Board (United States) (PCAOB) and are required to be independent with respect to the Fund in accordance with the U.S. federal securities laws and the applicable rules and regulations of the Securities and Exchange Commission and the PCAOB.
We conducted our audit in accordance with the standards of the PCAOB. Those standards require that we plan and perform the audit to obtain reasonable assurance about whether the investment portfolio is free of material misstatement, whether due to error or fraud. The Fund is not required to have, nor were we engaged to perform, an audit of its internal control over financial reporting. As part of our audit we are required to obtain an understanding of internal control over financial reporting but not for the purpose of expressing an opinion on the effectiveness of the Fund's internal control over financial reporting. Accordingly, we express no such opinion.
Our audit included performing procedures to assess the risks of material misstatement of the investment portfolio, whether due to error or fraud, and performing procedures that respond to those risks. Such procedures included examining, on a test basis, evidence regarding the amounts and disclosures in the investment portfolio. Our audit also included evaluating the accounting principles used and significant estimates made by management, as well as evaluating the overall presentation of the investment portfolio. We believe that our audit provides a reasonable basis for our opinion.

Costa Mesa, California
February 11, 2020
We have served as the auditor of one or more American Funds investment companies since 1956.
ITEM 7 – Disclosure of Proxy Voting Policies and Procedures for Closed-End Management Investment Companies
Not applicable to this Registrant, insofar as the Registrant is not a closed-end management investment company.
ITEM 8 – Portfolio Managers of Closed-End Management Investment Companies
Not applicable to this Registrant, insofar as the Registrant is not a closed-end management investment company.
ITEM 9 – Purchases of Equity Securities by Closed-End Management Investment Company and Affiliated Purchasers
Not applicable to this Registrant, insofar as the Registrant is not a closed-end management investment company.
ITEM 10 – Submission of Matters to a Vote of Security Holders
There have been no material changes to the procedures by which shareholders may recommend nominees to the Registrant’s board of trustees since the Registrant last submitted a proxy statement to its shareholders. The procedures are as follows. The Registrant has a nominating and governance committee comprised solely of persons who are not considered ‘‘interested persons’’ of the Registrant within the meaning of the Investment Company Act of 1940, as amended. The committee periodically reviews such issues as the board’s composition, responsibilities, committees, compensation and other relevant issues, and recommends any appropriate changes to the full board of trustees. While the committee normally is able to identify from its own resources an ample number of qualified candidates, it will consider shareholder suggestions of persons to be considered as nominees to fill future vacancies on the board. Such suggestions must be sent in writing to the nominating and governance committee of the Registrant, c/o the Registrant’s Secretary, and must be accompanied by complete biographical and occupational data on the prospective nominee, along with a written consent of the prospective nominee for consideration of his or her name by the nominating and governance committee.
ITEM 11 – Controls and Procedures
| (a) | The Registrant’s Principal Executive Officer and Principal Financial Officer have concluded, based on their evaluation of the Registrant’s disclosure controls and procedures (as such term is defined in Rule 30a-3 under the Investment Company Act of 1940), that such controls and procedures are adequate and reasonably designed to achieve the purposes described in paragraph (c) of such rule. |
| | |
| (b) | There were no changes in the Registrant’s internal controls over financial reporting (as defined in Rule 30a-3(d) under the Investment Company Act of 1940) that occurred during the Registrant’s semi-annual period covered by this report that has materially affected, or is reasonably likely to materially affect, the Registrant’s internal control over financial reporting. |
ITEM 12 – Exhibits
| (a)(1) | The Code of Ethics that is the subject of the disclosure required by Item 2 is attached as an exhibit hereto. |
| | |
| (a)(2) | The certifications required by Rule 30a-2 of the Investment Company Act of 1940 and Sections 302 and 906 of the Sarbanes-Oxley Act of 2002 are attached as exhibits hereto. |
SIGNATURES
Pursuant to the requirements of the Securities Exchange Act of 1934 and the Investment Company Act of 1940, the Registrant has duly caused this report to be signed on its behalf by the undersigned, thereunto duly authorized.
| | THE BOND FUND OF AMERICA |
| | |
| | By __/s/ Kristine M. Nishiyama________________ |
| | Kristine M. Nishiyama, Executive Vice President and Principal Executive Officer |
| | |
| | Date: February 28, 2020 |
Pursuant to the requirements of the Securities Exchange Act of 1934 and the Investment Company Act of 1940, this report has been signed below by the following persons on behalf of the Registrant and in the capacities and on the dates indicated.
| By _/s/ Kristine M. Nishiyama_____________ |
Kristine M. Nishiyama, Executive Vice President and Principal Executive Officer |
| |
| Date: February 28, 2020 |
| By___/s/ Brian C. Janssen__________________ |
Brian C. Janssen, Treasurer and Principal Financial Officer |
| |
| Date: February 28, 2020 |