UNITED STATES
SECURITIES AND EXCHANGE COMMISSION
Washington, D.C. 20549
FORM N-CSR
Certified Shareholder Report of
Registered Management Investment Companies
Investment Company Act File Number: 811-02444
The Bond Fund of America
(Exact Name of Registrant as Specified in Charter)
333 South Hope Street
Los Angeles, California 90071
(Address of Principal Executive Offices)
Registrant's telephone number, including area code: (213) 486-9200
Date of fiscal year end: December 31
Date of reporting period: December 31, 2016
Steven I. Koszalka
The Bond Fund of America
333 South Hope Street
Los Angeles, California 90071
(Name and Address of Agent for Service)
ITEM 1 – Reports to Stockholders

Invest with a stable,
long-term approach.
Special feature page 6
| | | |
 | | The Bond Fund of America®
Annual report
for the year ended
December 31, 2016 |
The Bond Fund of America seeks as high a level of current income as is consistent with the preservation of capital.
This fund is one of more than 40 offered by one of the nation’s largest mutual fund families, American Funds, from Capital Group. For more than 85 years, Capital has invested with a long-term focus based on thorough research and attention to risk.
Fund results shown in this report, unless otherwise indicated, are for Class A shares at net asset value. If a sales charge (maximum 3.75%) had been deducted, the results would have been lower. Results are for past periods and are not predictive of results for future periods. Current and future results may be lower or higher than those shown. Share prices and returns will vary, so investors may lose money. Investing for short periods makes losses more likely. Investments are not FDIC-insured, nor are they deposits of or guaranteed by a bank or any other entity, so they may lose value. For current information and month-end results, visit americanfunds.com.
See page 4 for Class A share results with relevant sales charges deducted. For other share class results, visit americanfunds.com and americanfundsretirement.com.
Investment results assume all distributions are reinvested and reflect applicable fees and expenses. When applicable, investment results reflect fee waivers, without which results would have been lower. Visit americanfunds.com for more information.
The fund’s 30-day yield for Class A shares as of January 31, 2017, calculated in accordance with the U.S. Securities and Exchange Commission (SEC) formula, was 1.68%. The fund’s 12-month distribution rate for Class A shares as of that date was 1.60%. Both reflect the 3.75% maximum sales charge. The SEC yield reflects the rate at which the fund is earning income on its current portfolio of securities while the distribution rate reflects the fund’s past dividends paid to shareholders. Accordingly, the fund’s SEC yield and distribution rate may differ.
The return of principal for bond funds and for funds with significant underlying bond holdings is not guaranteed. Fund shares are subject to the same interest rate, inflation and credit risks associated with the underlying bond holdings. High-yield bonds are subject to greater fluctuations in value and risk of loss of income and principal than investment-grade bonds. Investing in bonds issued outside the U.S. may be subject to additional risks. They include currency fluctuations, political and social instability, differing securities regulations and accounting standards, higher transaction costs, possible changes in taxation, illiquidity and price volatility. These risks may be heightened in connection with investments in developing countries. Refer to the fund prospectus and the Risk Factors section of this report for more information on these and other risks associated with investing in the fund.

Fellow investors:
In a year marked by volatility and political upheaval, the U.S. bond market generated modest returns. Investment-grade bonds advanced for most of the year despite signs of higher inflation and a substantial rise in interest rates during the fourth quarter. For the 12-month period ended December 31, The Bond Fund of America (BFA) gained 2.74%.
By way of comparison, the unmanaged Bloomberg Barclays U.S. Aggregate Index — a measure of the investment-grade (BBB/Baa and above) bond market — returned 2.65%. The fund’s peer group, as measured by the Lipper Core Bond Funds Average, rose 3%. BFA has generally kept pace with these benchmarks over longer periods, as shown in the chart below.
During the 12-month period, the fund paid dividends totaling 22 cents a share. For investors, this amounted to an income return of 1.74% with dividends reinvested, or 1.72% if taken in cash.
Bond market overview
Bonds rallied during much of the year as economic and political turmoil around the world drove investor demand for perceived safe-haven assets, including U.S. Treasuries. China’s slowing economy, negative interest rates in Europe and Japan, and the United Kingdom’s June 23 vote to leave the European Union (EU) added to market uncertainty, driving global bond yields to record lows. The yield on the benchmark 10-year Treasury note fell to 1.37% in July, its lowest level in history, as bond prices soared. Meanwhile, 10-year German, Japanese and Swiss bonds traded at negative yields.
This powerful flight-to-safety trend was driven largely by investor worries about EU stability. The so-called “Brexit” vote in the U.K. raised recession fears in Europe and prompted longer term concerns that other EU members might also attempt to leave the 28-nation bloc. Central banks around the world reacted to the global turmoil with consistent messages that
Results at a glance
For periods ended December 31, 2016, with all distributions reinvested
| | | Cumulative
total return | | Average annual total returns |
| | | 1 year | | 3 years | | 5 years | | 10 years | | Lifetime
(since 5/28/74) |
| The Bond Fund of America (Class A shares) | | | 2.74 | % | | | 2.81 | % | | | 2.44 | % | | | 3.00 | % | | | 7.66 | % |
| Bloomberg Barclays U.S. Aggregate Index1 | | | 2.65 | | | | 3.03 | | | | 2.23 | | | | 4.34 | | | | 7.63 | |
| Lipper Core Bond Funds Average2 | | | 3.00 | | | | 2.70 | | | | 2.41 | | | | 3.94 | | | | 7.44 | |
| 1 | Source: Bloomberg Index Services Ltd. The Bloomberg Barclays U.S. Aggregate Index began on January 1, 1976. From May 28, 1974, through December 31, 1975, the Bloomberg Barclays U.S. Government/Credit Index was used. The indexes are unmanaged and, therefore, have no expenses. Investors cannot invest directly in an index. |
| 2 | Source: Thomson Reuters Lipper. Lipper indexes track the largest mutual funds (no more than 30), represented by one share class per fund, in the corresponding Lipper category. |
| The Bond Fund of America | 1 |
long-standing easy monetary policies would continue. U.S. Federal Reserve officials, who had previously hinted at a summer interest rate hike, indicated that they would wait until later in the year to make that determination.
Market sentiment shifted in the fall, boosted by improving U.S. economic data and Donald Trump’s victory over Hillary Clinton in the U.S. presidential election. Bond yields moved sharply higher in November and December amid expectations for tax cuts, greater infrastructure spending and widespread regulatory reductions under a Trump administration. Inflation expectations also rose significantly as investors anticipated stronger economic growth. In December, U.S. consumer prices rose 2.1% on a year-over-year basis, the largest inflation bump since June 2014.
As the year came to a close, the Fed delivered a highly telegraphed interest rate hike in mid-December. For just the second time in a decade, the Fed raised the federal funds target rate by 25 basis points to a range of 0.50%–0.75%. Fed officials attributed the move to better U.S. economic growth, a tight labor market and signs of higher inflation. Longer term, market-driven rates also moved up. For the full year, the yield on the benchmark 10-year Treasury note increased 18 basis points to 2.45%, a modest move that masked the reality of a highly volatile period.
Inside the portfolio
The fund continued to favor high-quality, liquid securities, including substantial holdings of U.S. Treasury bonds. This positioning reflects the portfolio managers’ view that volatile markets and global uncertainty are on the rise, and therefore a defensive posture is appropriate. Among Treasuries, the fund has a relatively large exposure to Treasury Inflation Protected Securities, or TIPS, resulting from the managers’ belief that inflationary pressures are mounting in the U.S. economy. That conviction proved correct in 2016. As TIPS rallied on higher inflation data, some managers decided to collect profits and trim their holdings.
As a result, the fund’s investments in U.S. Treasury securities declined modestly from about 40% of the portfolio in December 2015 to approximately 36% in December 2016. Some of those assets were shifted into high-quality U.S. corporate bonds amid managers’ expectations of an improving U.S. economy. During the 12-month period, the fund’s exposure to corporate bonds rose from about 28% of the portfolio to roughly 30%. Within the corporate bond market, managers increased their holdings in the energy sector due to attractive valuations, particularly among oil pipeline companies.
Mortgage-backed securities (MBS) remained underweight in the portfolio, compared to the index. Managers reduced their exposure to the MBS market even further due to perceived high valuations. The fund’s mortgage-related holdings were reduced from approximately 21% of the portfolio at the end of 2015, to about 18% at the end of 2016. Elsewhere in the portfolio, investments in asset-backed securities (ABS) were increased slightly based on attractive valuations and the high-quality characteristics of ABS debt, which is backed by auto loans and credit card receivables.
The fund’s managers also found attractive opportunities in the new-issue market, as many U.S. corporations sought to issue bonds ahead of the Fed’s December rate increase. Amid historically low rates, U.S. corporate bond issuance surpassed $1.5 trillion in 2016. Among the largest deals of the year, Anheuser-Busch InBev sold $46

| 2 | The Bond Fund of America |
billion of high-grade bonds to help finance its acquisition of SABMiller; Dell Technologies Inc brought a $20 billion offering to market in connection with its takeover of EMC Corp; and Microsoft raised $19.75 billion to help fund its purchase of LinkedIn.
Looking ahead
We maintain a positive outlook for the U.S. economy, given remarkable strength in the labor market, steadily rising home prices, and modest growth in consumer spending. With the unemployment rate at a nearly nine-year low of 4.7%, the U.S. economy is essentially at full employment and wages are starting to rise at a respectable pace. That is quite a contrast from the depths of the 2008-2009 financial crisis, when the U.S. unemployment rate soared to 10% and the global economy teetered on the brink of collapse.
As we look ahead into 2017, the United States is likely to remain one of the few reliable engines driving global economic growth. Europe continues to struggle with weak economic growth and rising political risk. China’s once fast-growing economy is slowing down, dimming the prospects for some emerging markets that depend on China as a source of demand for various commodities. While U.S. GDP growth has averaged just 2% on an annualized basis over the past decade, there is reason to be optimistic that more robust growth of 3% to 3.5% may be on the horizon.
The outcome of the U.S. presidential election has raised market expectations for a pro-growth agenda in Washington. With Trump in the White House and Republicans controlling both houses of Congress, the stage is set for potentially transformative change across a number of areas, from health care to the banking industry to global trade. Many asset markets — including rates, commodities and equities — have started to price in this pro-growth agenda. However, it is important to note that policy details and their implications remain unclear at this early stage.
Moreover, it is unlikely that such dramatic change will happen without encountering a few bumps in the road ahead. Higher inflation and higher interest rates are two of those potential bumps. With the U.S. economy heating up, Fed officials have indicated that they would like to raise rates three times in 2017. While that may be a tad too aggressive, in our view, we do believe the U.S. economy is strong enough to handle higher rates and, indeed, a healthy economy requires rates to eventually move back toward more normalized levels.
Over the long term, higher rates are beneficial for fixed income investors who have been struggling with ultra-low bond yields for the better part of a decade. We believe it will take time, perhaps a long time, to return to historical norms, but it does appear that the process has finally begun. We remain confident in our ability to help our shareholders navigate this period, while seeking to provide reliable income and capital preservation, as we have for the last 43 years.
Thank you for your interest in the fund. We look forward to reporting to you again in six months.
Cordially,

John H. Smet
President
February 10, 2017
For current information about the fund, visit americanfunds.com.

| The Bond Fund of America | 3 |
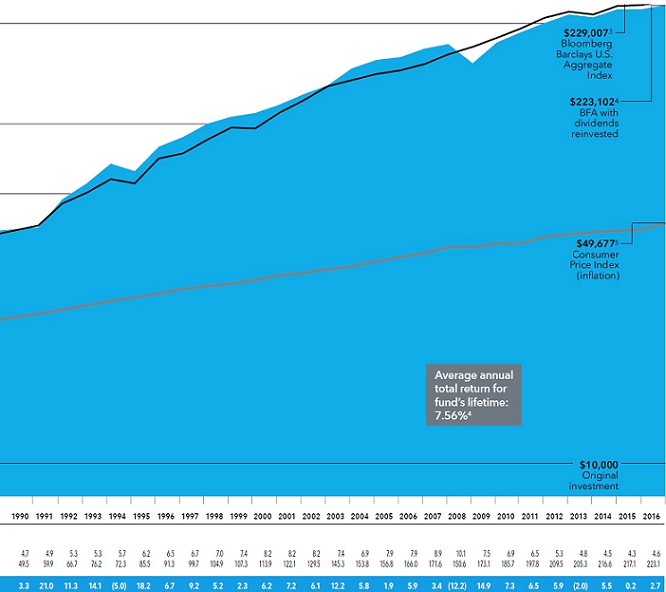
The value of a long-term perspective
Fund results shown are for Class A shares and reflect deduction of the maximum sales charge of 3.75% on the $10,000 investment.1 Thus, the net amount invested was $9,625.2 Results are for past periods and are not predictive of results for future periods. Current and future results may be lower or higher than those shown. Share prices and returns will vary, so investors may lose money. For current information and month-end results, visit americanfunds.com.
The results shown are before taxes on fund distributions and sale of fund shares.
| 1 | As outlined in the prospectus, the sales charge is reduced for accounts (and aggregated investments) of $100,000 or more and is eliminated for purchases of $1 million or more. There is no sales charge on dividends or capital gain distributions that are reinvested in additional shares. |
| 2 | The maximum initial sales charge was 8.5% prior to December 15, 1986, when it became 4.75% until January 9, 2000. |
| 3 | Source: Bloomberg Index Services Ltd. Bloomberg Barclays U.S. Aggregate Index represents the U.S. investment-grade fixed-rate bond market. From May 28, 1974, through December 31, 1975, Bloomberg Barclays U.S. Government/Credit Index was used because Bloomberg Barclays U.S. Aggregate Index did not yet exist. Since January 1, 1976, the Bloomberg Barclays U.S. Aggregate Index has been used. These indexes are unmanaged and, therefore, have no expenses. Investors cannot invest directly in an index. |
| 4 | Includes reinvested dividends of $213,938 and reinvested captital gain distributions of $4,573. |
| 5 | Computed from data supplied by the U.S. Department of Labor, Bureau of Labor Statistics. |
| 6 | For the period May 28, 1974, commencement of operations, through December 31, 1974. |

| 4 | The Bond Fund of America |
How a $10,000 investment has grown
There always have been reasons not to invest. You will find, however, that despite occasional stumbles, financial markets have tended to reward investors over the long term. Dividends, particularly when reinvested, have accounted for virtually all of the fund’s overall results. The table beneath the chart details the fund’s annual dividends and the cumulative value of the original investment.
| The Bond Fund of America | 5 |
Invest with a stable, long-term approach.
Bonds can help investors navigate volatile markets at a time of profound change around the world.

| 6 | The Bond Fund of America |

In many ways, 2016 provided a perfect platform for the rise of market volatility. The year started with the worst stock market decline in history, measured by market capitalization. Investor fears were stoked by China’s slowing economy, sharply falling oil prices and uncertainty over the health of the U.S. economy.
Next came Brexit and worries about the future of the European Union. As the year marched on, the rise of populism, protectionism and anti-establishment fervor reached a peak in the bitter and fractious U.S. presidential election. By December, however, stock markets were hitting a series of record highs fueled by optimism for the U.S. economy — quite a turnaround from the dark days of January.
For fixed income investors, the turbulent year served as a reminder that planning for market volatility remains a crucial element of a prudent, long-term investment strategy. High-grade bonds, in particular, can provide a cushion against wild swings in the equity markets and smooth out returns in a well-diversified portfolio.
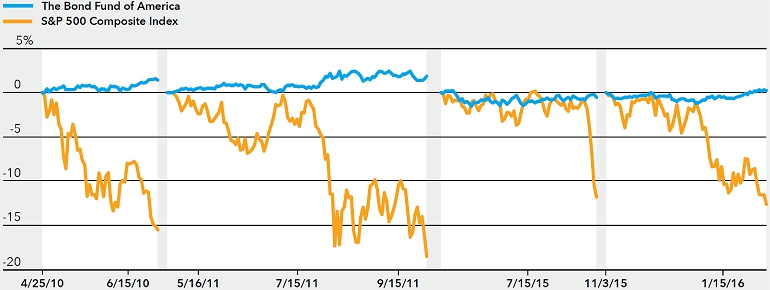
That was indeed the case in 2016. Bonds served a valuable purpose during the China scare from January to mid-February, and also during the Brexit-related decline in June, after U.K. residents shocked the world by voting to leave the European Union. The chart on the next page shows how The Bond Fund of America (BFA) fared during several volatile time periods in recent years.
“High-quality bonds or bond funds are often a good counterweight to equities,” notes John Smet, portfolio manager with The Bond Fund of America. “While it’s not always the case, bonds will generally do better when stocks decline. That’s why, when it looks like the world is falling apart, the highest quality bonds will usually provide the best downside protection.”
Indeed, demand for U.S. Treasury bonds — widely regarded as the safest investment in the world — spiked in 2016 as investors fretted over China’s economic woes and Great Britain’s bold move to break away from its neighbors on the European continent. Reflecting this high level of demand, the yield on the benchmark 10-year Treasury note fell to 1.37% in July, its lowest level in history.
| The Bond Fund of America | 7 |
Why Own Bonds?
During recent stock market downturns, The Bond Fund of America has held up well.
Capital preservation and diversification are two of the most important reasons to own investment-grade bonds in a well-balanced portfolio.
Source: Capital Group, Standard & Poor’s
| CUMULATIVE TOTAL RETURN |
| |
| | | Correction | | Correction | | Correction | | Correction |
| | | 4/23/10 - | | 4/29/11 - | | 5/21/15 - | | 11/03/15 - |
| | | 7/02/10 | | 10/03/11 | | 8/25/15 | | 02/11/16 |
| The Bond Fund of America (Class A shares) | | 2.14% | | 3.30% | | -0.06% | | 0.86% |
| S&P 500 Composite Index | | -15.63% | | -18.64% | | -11.89% | | -12.71% |
Source: Capital Group, Standard & Poor’s
Global hunt for yield
Investor demand for Treasuries is often interpreted as a flight-to-safety trend. But there is another element to consider these days, and that is the global hunt for yield. Negative interest rates in Europe and Japan have made even historically low U.S. Treasury yields look attractive by comparison. In July, for instance, when the 10-year Treasury traded at 1.37%, government bonds with similar maturities in Germany and Japan carried negative yields, largely due to aggressive bond-buying programs employed by various central banks around the world.
These bond-buying programs, known as quantitative easing (or QE), are intended to encourage lending and provide a boost to struggling economies. At the same time, QE places enormous pressure on global bond yields, making it difficult for interest rates to rise much in other developed countries, including the United States.
This is one reason why BFA portfolio managers believe U.S. interest rates will stay relatively low, from a historical perspective, for many years to come. While they may rise somewhat as the U.S. economy improves, the global pressure on bond yields is likely to remain for the foreseeable future.
| 8 | The Bond Fund of America |
Interest rate anchor
“We continue to have strong conviction in the ‘lower for longer’ interest rate scenario,” says David Hoag, a portfolio manager with The Bond Fund of America. “The global economy and financial markets are highly integrated. As such, ultra-low rates in Europe and Japan tend to have an anchor effect, so to speak, keeping U.S. rates from rising too fast or too far.”
In fact, about 75% of the world’s developed-market sovereign debt yielded less than U.S. Treasuries, for the year ended December 31, 2016. Moreover, in the summer of 2016, about $8.8 trillion of bonds in the J.P. Morgan Global Government Bond Index carried negative yields.
“Simply put, the U.S. cannot decouple from the rest of the world,” Hoag adds. “The Fed may want to raise rates faster, but that will be difficult unless global economic growth picks up materially from the lackluster pace of 2016.”
Investing in the post-post-crisis period
The global forces keeping interest rates “lower for longer” have largely resulted from the financial crisis of 2008-09. While eight years have passed since the depths of the crisis, in many ways, the impact is still being felt today — in lackluster economic growth around the world, in negative interest rates, and in muted inflationary pressures.
Here’s some historical context. Over the past decade, there have been three distinct periods in financial markets: the global financial crisis (2008-2009), the post-crisis period (roughly 2010 to 2014) and the post-post-crisis period (late 2014 to present).
The crisis period was characterized by severe losses in financial markets, a sharp decline in lending, and heavy doses of monetary stimulus by central banks in an attempt to rescue the global economy. The Fed led the way by aggressively cutting interest rates essentially to zero, a policy known as the “zero bound.” U.S. rates have stayed low ever since.
A world awash in liquidity
In the post-crisis period that followed, central banks around the world pumped an incredible amount of money into their financial systems in an attempt to lift economic growth and boost inflation. The European Central Bank, Bank of Japan, Bank of England and Federal Reserve injected a combined $13 trillion into their respective economies. While asset prices

| The Bond Fund of America | 9 |
Global Pressure:
Negative-Yielding Bonds
Over the past 30 months, the amount of bonds carrying negative yields has soared as central banks in Europe, Japan and elsewhere have pursued negative interest rate policies. This enormous pressure on global interest rates places an effective cap on U.S. bond yields, keeping them from rising too fast or too far.
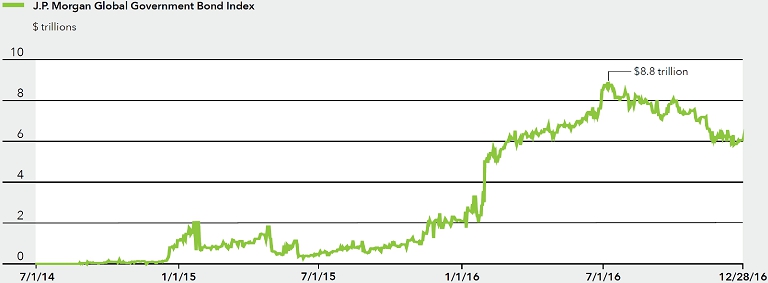
Source: J.P. Morgan. As of December 28, 2016.
Note: Data represents the value of negative yielding debt within the J.P. Morgan Global Government Bond Index, converted to U.S. dollars. This report, and any product, index or fund referred to herein, is not sponsored, endorsed or promoted in any way by J.P. Morgan or any of its affiliates who provide no warranties whatsoever, expressed or implied, and shall have no liability to any prospective investor, in connection with this report.
responded favorably with significant price appreciation, global economic growth and inflation remain subdued.
The post-post-crisis period started in late 2014 when the Fed ended its bond-buying (QE) program amid the view that the U.S. economy was past the point of danger. This was the point where U.S. monetary policy diverged from the path of other major central banks, particularly in Europe and Japan, where QE continues in earnest.
As the Fed has moved toward normalization — hiking the federal funds rate in December 2015 and December 2016 — central banks in the other major developed countries have continued to buy bonds and other assets at an unprecedented rate. These ongoing efforts, however, have so far proven ineffective at boosting growth and inflation globally.
In fact, any benefits that may have been gained appear to be diminishing. Asset returns are generally lower than they were during the post-crisis period, and these diminished returns are being produced in the context of heightened global uncertainty and volatility.
How to navigate this period
Given the uncertainty related to macroeconomic policies and their potential impact on economies and markets, BFA managers hold the view that fixed income investors should proceed with caution.
The “hunt for yield” has caused distortions in the bond market, explains John Smet. Specifically, some investors have been paid, via hefty returns, to take equity-like risk in the fixed income portion of their portfolios. That includes buying lower quality bonds in order to boost fund yields. “This invest-
| 10 | The Bond Fund of America |
ment approach works, until it doesn’t,” John notes.
Not all bond funds are created equal in terms of the downside protection they provide against equity market volatility. Bracing for higher volatility seems necessary given the uncertain macroeconomic backdrop, and to do so, it’s important to know how the fixed income portion of a given portfolio correlates with equity market returns.
We believe, in this environment, a fixed income portfolio that provides a modest yield, capital preservation and broad diversification away from equity risk is a winning scenario. High portfolio yields require taking more equity-like risk, and if the tide turns on stocks, fixed income strategies that rely heavily on equity-correlated assets could face significant losses.
“A focus on capital preservation is as important as it has ever been in fixed income,” John says. “By relying on bond funds that behave like bond funds to anchor a portfolio, we think investors can better weather the next storm.”
U.S. bond market outlook:
| • | Interest rates may rise modestly as the Fed seeks to normalize U.S. monetary policy, but the “lower for longer” rate scenario remains intact. We believe rate hikes will be slow, measured and increasingly influenced by global events. |
| • | While the U.S. economy is clearly improving, signs of slowing economic growth in Asia and Europe will likely combine to keep rates from climbing too far or too fast. |
| |
| • | In particular, negative interest rate policies at the European Central Bank and the Bank of Japan should act as an anchor, effectively keeping a lid on global rates. The U.S. cannot decouple from the rest of the world. |
The impact on investors:
| • | Expect muted bond returns if rates move higher, but there also may be periods of global economic weakness, geopolitical conflict or other unexpected events when bond prices will rally. |
| • | We believe with fewer attractive investment opportunities, security selection and downside protection will be paramount. Opportunities may arise in lesser known areas of the bond market, such as asset-backed securities. |
| |
| • | Inflation expectations moved higher in 2016 and that trend is likely to continue. Therefore, inflation-linked investments, such as Treasury Inflation Protected Securities (TIPS), remain attractive. |
| |
| • | Rising interest rates should not dissuade investors from participating in the fixed income markets. Bonds are an important diversification tool that can help mitigate losses during stock market downturns and periods of economic uncertainty. |

| The Bond Fund of America | 11 |
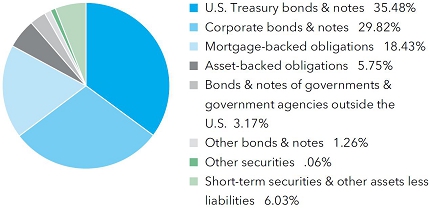
Summary investment portfolio December 31, 2016
| Portfolio quality summary* | | Percent of
net assets |
| U.S. Treasury and agency† | | | 35.94 | % |
| AAA/Aaa | | | 22.68 | |
| AA/Aa | | | 4.00 | |
| A/A | | | 15.32 | |
| BBB/Baa | | | 13.27 | |
| Below investment grade | | | 2.05 | |
| Unrated | | | .65 | |
| Other | | | .06 | |
| Short-term securities & other assets less liabilities | | | 6.03 | |
| | |
| * | Bond ratings, which typically range from AAA/Aaa (highest) to D (lowest), are assigned by credit rating agencies such as Standard & Poor’s, Moody’s and/or Fitch as an indication of an issuer’s creditworthiness. In assigning a credit rating to a security, the fund looks specifically to the ratings assigned to the issuer of the security by Standard & Poor’s, Moody’s and/or Fitch. If agency ratings differ, the security will be considered to have received the highest of those ratings, consistent with the fund’s investment policies. The ratings are not covered by the Report of Independent Registered Public Accounting Firm. |
| † | These securities are guaranteed by the full faith and credit of the U.S. government. |
| Bonds, notes & other debt instruments 93.91% | Principal amount
(000) | | | Value
(000) | |
| U.S. Treasury bonds & notes 35.48% | | | | | | | | |
| U.S. Treasury 29.16% | | | | | | | | |
| U.S. Treasury 0.75% 2018 | | $ | 210,300 | | | $ | 209,053 | |
| U.S. Treasury 1.625% 2019 | | | 207,500 | | | | 208,538 | |
| U.S. Treasury 1.625% 2019 | | | 157,950 | | | | 159,060 | |
| U.S. Treasury 1.625% 2019 | | | 124,400 | | | | 125,265 | |
| U.S. Treasury 1.25% 20201 | | | 296,675 | | | | 294,311 | |
| U.S. Treasury 1.625% 20201 | | | 374,500 | | | | 374,268 | |
| U.S. Treasury 1.75% 2020 | | | 206,610 | | | | 206,563 | |
| U.S. Treasury 1.75% 2020 | | | 142,270 | | | | 142,570 | |
| U.S. Treasury 2.00% 2020 | | | 137,810 | | | | 139,247 | |
| U.S. Treasury 1.125% 20211 | | | 179,375 | | | | 174,555 | |
| U.S. Treasury 1.375% 20211 | | | 417,550 | | | | 410,944 | |
| U.S. Treasury 1.75% 2021 | | | 370,678 | | | | 367,957 | |
| U.S. Treasury 2.00% 2021 | | | 238,000 | | | | 239,468 | |
| U.S. Treasury 2.125% 2021 | | | 355,000 | | | | 358,049 | |
| U.S. Treasury 2.125% 2021 | | | 288,490 | | | | 291,060 | |
| U.S. Treasury 2.125% 2021 | | | 234,650 | | | | 236,905 | |
| U.S. Treasury 2.25% 2021 | | | 309,300 | | | | 314,954 | |
| U.S. Treasury 2.25% 2021 | | | 153,829 | | | | 156,257 | |
| U.S. Treasury 1.75% 2022 | | | 192,847 | | | | 189,208 | |
| U.S. Treasury 2.125% 2022 | | | 350,830 | | | | 350,707 | |
| U.S. Treasury 1.50% 2023 | | | 457,870 | | | | 440,485 | |
| U.S. Treasury 2.125% 2023 | | | 182,663 | | | | 181,521 | |
| U.S. Treasury 2.125% 2025 | | | 165,750 | | | | 162,551 | |
| U.S. Treasury 1.625% 2026 | | | 147,968 | | | | 138,286 | |
| U.S. Treasury 2.00% 2026 | | | 571,709 | | | | 550,269 | |
| U.S. Treasury 3.00% 2045 | | | 179,525 | | | | 176,584 | |
| 12 | The Bond Fund of America |
| | Principal amount
(000) | | | Value
(000) | |
| U.S. Treasury 2.25% 2046 | | $ | 294,712 | | | $ | 247,087 | |
| U.S. Treasury 2.50% 2046 | | | 602,245 | | | | 533,631 | |
| U.S. Treasury 0.88%–8.00% 2018–2046 | | | 1,927,291 | | | | 1,941,148 | |
| | | | | | | | 9,320,501 | |
| | | | | | | | | |
| U.S. Treasury inflation-protected securities 6.29% | | | | | | | | |
| U.S. Treasury Inflation-Protected Security 0.125% 20172 | | | 127,708 | | | | 128,003 | |
| U.S. Treasury Inflation-Protected Security 0.625% 20242 | | | 127,448 | | | | 129,858 | |
| U.S. Treasury Inflation-Protected Security 0.375% 20252 | | | 308,799 | | | | 307,421 | |
| U.S. Treasury Inflation-Protected Security 0.125% 20262 | | | 144,204 | | | | 139,581 | |
| U.S. Treasury Inflation-Protected Security 0.625% 20262 | | | 201,352 | | | | 203,281 | |
| U.S. Treasury Inflation-Protected Security 0.75% 20422 | | | 229,090 | | | | 217,542 | |
| U.S. Treasury Inflation-Protected Security 1.375% 20442 | | | 117,235 | | | | 128,274 | |
| U.S. Treasury Inflation-Protected Security 1.00% 20462 | | | 272,579 | | | | 274,316 | |
| U.S. Treasury Inflation-Protected Securities 0.13%–2.38% 2017–20432 | | | 480,348 | | | | 480,805 | |
| | | | | | | | 2,009,081 | |
| | | | | | | | | |
| Federal agency bonds & notes 0.03% | | | | | | | | |
| Other securities | | | | | | | 9,987 | |
| | | | | | | | | |
| Total U.S. Treasury bonds & notes | | | | | | | 11,339,569 | |
| | | | | | | | | |
| Corporate bonds & notes 29.82% | | | | | | | | |
| Financials 6.21% | | | | | | | | |
| Other securities | | | | | | | 1,985,313 | |
| | | | | | | | | |
| Health care 5.33% | | | | | | | | |
| Other securities | | | | | | | 1,703,567 | |
| | | | | | | | | |
| Energy 4.69% | | | | | | | | |
| Other securities | | | | | | | 1,500,868 | |
| | | | | | | | | |
| Consumer discretionary 3.44% | | | | | | | | |
| Other securities | | | | | | | 1,099,031 | |
| | | | | | | | | |
| Utilities 2.59% | | | | | | | | |
| Other securities | | | | | | | 828,641 | |
| | | | | | | | | |
| Consumer staples 2.04% | | | | | | | | |
| Other securities | | | | | | | 651,492 | |
| | | | | | | | | |
| Real estate 1.80% | | | | | | | | |
| Other securities | | | | | | | 573,966 | |
| | | | | | | | | |
| Industrials 1.08% | | | | | | | | |
| Other securities | | | | | | | 344,458 | |
| | | | | | | | | |
| Telecommunication services 1.03% | | | | | | | | |
| Other securities | | | | | | | 330,203 | |
| | | | | | | | | |
| Information technology 0.87% | | | | | | | | |
| Other securities | | | | | | | 279,340 | |
| | | | | | | | | |
| Materials 0.74% | | | | | | | | |
| Other securities | | | | | | | 235,219 | |
| | | | | | | | | |
| Total corporate bonds & notes | | | | | | | 9,532,098 | |
| The Bond Fund of America | 13 |
| Bonds, notes & other debt instruments (continued) | Principal amount
(000) | | | Value
(000) | |
| Mortgage-backed obligations 18.43% | | | | | | | | |
| Federal agency mortgage-backed obligations 15.91% | | | | | | | | |
| Fannie Mae 3.00% 20463 | | $ | 201,532 | | | $ | 200,354 | |
| Fannie Mae 3.50% 20463 | | | 157,615 | | | | 159,677 | |
| Fannie Mae 4.00% 20463 | | | 114,696 | | | | 120,661 | |
| Fannie Mae 4.00% 20473,4 | | | 217,389 | | | | 228,449 | |
| Fannie Mae 4.50% 20473,4 | | | 148,575 | | | | 159,591 | |
| Fannie Mae 4.50% 20473,4 | | | 126,550 | | | | 136,086 | |
| Fannie Mae 0%–11.00% 2017–20473,4,5 | | | 1,947,721 | | | | 2,026,366 | |
| Freddie Mac 3.50% 20463 | | | 286,045 | | | | 293,083 | |
| Freddie Mac 3.50% 20463 | | | 130,455 | | | | 133,659 | |
| Freddie Mac 0%–7.50% 2019–20473,4 | | | 988,816 | | | | 1,030,163 | |
| Government National Mortgage Assn. 4.50% 20453 | | | 116,252 | | | | 124,206 | |
| Government National Mortgage Assn. 1.29%–10.00% 2021–20653,5 | | | 442,183 | | | | 472,047 | |
| Other securities | | | | | | | 2,745 | |
| | | | | | | | 5,087,087 | |
| | | | | | | | | |
| Commercial mortgage-backed securities 1.19% | | | | | | | | |
| Other securities | | | | | | | 380,255 | |
| | | | | | | | | |
| Collateralized mortgage-backed (privately originated) 0.83% | | | | | | | | |
| Freddie Mac 1.76%–4.16% 2023–20283,5 | | | 51,542 | | | | 52,292 | |
| Other securities | | | | | | | 212,531 | |
| | | | | | | | 264,823 | |
| | | | | | | | | |
| Other mortgage-backed securities 0.50% | | | | | | | | |
| Freddie Mac 1.08%–3.53% 2020–20263,5 | | | 112,901 | | | | 114,455 | |
| Other securities | | | | | | | 44,034 | |
| | | | | | | | 158,489 | |
| | | | | | | | | |
| Total mortgage-backed obligations | | | | | | | 5,890,654 | |
| | | | | | | | | |
| Asset-backed obligations 5.75% | | | | | | | | |
| Chase Issuance Trust, Series 2016-A6, Class A6, 1.10% 20203 | | | 480,200 | | | | 479,112 | |
| Other securities | | | | | | | 1,357,937 | |
| | | | | | | | 1,837,049 | |
| | | | | | | | | |
| Bonds & notes of governments & government agencies outside the U.S. 3.17% | | | | | | | | |
| Japan 0.10% 2024–20262 | | ¥ | 22,843,500 | | | | 207,484 | |
| United Mexican States, Series M, 6.50% 2021 | | MXN | 2,766,800 | | | | 130,272 | |
| Other securities | | | | | | | 677,370 | |
| | | | | | | | 1,015,126 | |
| | | | | | | | | |
| Municipals 0.80% | | | | | | | | |
| Other securities | | | | | | | 254,635 | |
| | | | | | | | | |
| Federal agency bonds & notes 0.46% | | | | | | | | |
| Fannie Mae 2.125% 2026 | | | 14,240 | | | | 13,499 | |
| Federal Home Loan Bank 2.75% 2018 | | | 16,635 | | | | 17,040 | |
| Freddie Mac 1.25% 2019 | | | 26,500 | | | | 26,369 | |
| Other securities | | | | | | | 89,677 | |
| | | | | | | | 146,585 | |
| | | | | | | | | |
| Total bonds, notes & other debt instruments (cost: $30,136,020,000) | | | | | | | 30,015,716 | |
| | | | | | | | | |
| Convertible stocks 0.01% | | Shares | | | | |
| Industrials 0.01% | | | | | | |
| Other securities | | | | | | | 4,050 | |
| | | | | | | | | |
| Total convertible stocks (cost: $13,571,000) | | | | | | | 4,050 | |
| 14 | The Bond Fund of America |
| Preferred securities 0.01% | Shares | | | Value
(000) | |
| Financials 0.01% | | | | | | | | |
| Other securities | | | | | | $ | 3,986 | |
| | | | | | | | | |
| Total preferred securities (cost: $5,820,000) | | | | | | | 3,986 | |
| | | | | | | | | |
| Common stocks 0.04% | | | | | | | | |
| Other 0.04% | | | | | | | | |
| Other securities | | | | | | | 11,443 | |
| | | | | | | | | |
| Total common stocks (cost: $56,021,000) | | | | | | | 11,443 | |
| | | | | | | | | |
| Rights & warrants 0.00% | | | | | | | | |
| Energy 0.00% | | | | | | | | |
| Other securities | | | | | | | — | |
| | | | | | | | | |
| Total rights & warrants (cost: $671,000) | | | | | | | — | |
| | | | | | | | | |
| Short-term securities 6.51% | Principal amount
(000) | | | | | |
| Federal Home Loan Bank 0.45%–0.55% due 1/19/2017–5/17/2017 | | $ | 608,900 | | | | 608,306 | |
| Japanese Treasury Discount Bills 0.00% due 3/10/2017 | | | 90,000,000 | | | | 770,452 | |
| Microsoft Corp. 0.76%–0.86% due 2/14/2017–3/14/20176 | | | 188,900 | | | | 188,736 | |
| Other securities | | | | | | | 514,733 | |
| | | | | | | | | |
| Total short-term securities (cost: $2,196,606,000) | | | | | | | 2,082,227 | |
| | | | | | | | | |
| Total investment securities 100.48% (cost: $32,408,709,000) | | | | | | | 32,117,422 | |
| Other assets less liabilities (0.48)% | | | | | | | (153,334 | ) |
| | | | | | | | | |
| Net assets 100.00% | | | | | | $ | 31,964,088 | |
This summary investment portfolio is designed to streamline the report and help investors better focus on the fund’s principal holdings. See the inside back cover for details on how to obtain a complete schedule of portfolio holdings.
“Other securities” includes all issues that are not disclosed separately in the summary investment portfolio. “Other securities” includes securities which were valued under fair value procedures adopted by authority of the board of trustees. The total value of securities which were valued under fair value procedures was $194,795,000, which represented .61% of the net assets of the fund. “Other securities” also includes loan participations and assignments, which may be subject to legal or contractual restrictions on resale. The total value of all such loans was $28,970,000, which represented .09% of the net assets of the fund. Some securities in “Other securities” (with aggregate value of $7,094,000, an aggregate cost of $41,022,000, and which represented .02% of the net assets of the fund) were acquired from 3/10/2010 to 5/2/2013 through private placement transactions exempt from registration under the Securities Act of 1933, which may subject them to legal or contractual restrictions on resale.
Forward currency contracts
The fund has entered into forward currency contracts as shown in the following table. The average month-end notional amount of open forward currency contracts while held was $982,710,000.
| | | | | | | | | | | Unrealized | |
| | | | | | | | | (depreciation) | |
| | | | | | | Contract amount | | appreciation | |
| | | | | | | Receive | | Deliver | | at 12/31/2016 | |
| | | Settlement date | | Counterparty | | (000) | | (000) | | (000) | |
| Purchases: | | | | | | | | | | | | |
| Colombian pesos | | 1/27/2017 | | Citibank | | COP42,592,900 | | $14,200 | | | $ | (95 | ) |
| Euros | | 1/11/2017 | | JPMorgan Chase | | €10,139 | | $10,762 | | | | (80 | ) |
| Euros | | 1/12/2017 | | Barclays Bank PLC | | €9,605 | | $10,233 | | | | (114 | ) |
| Euros | | 1/20/2017 | | Citibank | | €11,000 | | $11,740 | | | | (147 | ) |
| Euros | | 1/20/2017 | | JPMorgan Chase | | €14,065 | | $15,154 | | | | (331 | ) |
| Euros | | 1/23/2017 | | Citibank | | €5,404 | | $5,637 | | | | 59 | |
| Malaysian ringgits | | 1/13/2017 | | Citibank | | MYR62,510 | | $14,119 | | | | (192 | ) |
| | | | | | | | | | | | $ | (900 | ) |
| Sales: | | | | | | | | | | | | | |
| Brazilian reais | | 1/6/2017 | | Bank of America, N.A. | | $4,795 | | BRL16,300 | | | | (203 | ) |
| Brazilian reais | | 1/11/2017 | | Bank of America, N.A. | | $2,405 | | BRL8,250 | | | | (121 | ) |
| Brazilian reais | | 1/11/2017 | | Citibank | | $17,758 | | BRL61,000 | | | | (916 | ) |
| Brazilian reais | | 1/13/2017 | | JPMorgan Chase | | $15,377 | | BRL53,000 | | | | (837 | ) |
| The Bond Fund of America | 15 |
Forward currency contracts (continued)
| | | | | | | | | | | Unrealized | |
| | | | | | | | | (depreciation) | |
| | | | | | | Contract amount | | appreciation | |
| | | | | | | Receive | | Deliver | | at 12/31/2016 | |
| | | Settlement date | | Counterparty | | (000) | | (000) | | (000) | |
| British pounds | | 1/24/2017 | | Bank of New York Mellon | | $461 | | £370 | | | $ | 5 | |
| Canadian dollars | | 1/12/2017 | | Bank of America, N.A. | | $17,334 | | C$23,100 | | | | 126 | |
| Chilean pesos | | 1/20/2017 | | Citibank | | $53,778 | | CLP35,813,750 | | | | 394 | |
| Chilean pesos | | 1/27/2017 | | Citibank | | $14,161 | | CLP9,573,000 | | | | (101 | ) |
| Euros | | 1/13/2017 | | Citibank | | $19,562 | | €18,750 | | | | (192 | ) |
| Indian rupees | | 1/6/2017 | | Bank of America, N.A. | | $2,908 | | INR200,000 | | | | (37 | ) |
| Indian rupees | | 1/11/2017 | | Citibank | | $949 | | INR65,350 | | | | (13 | ) |
| Indian rupees | | 1/11/2017 | | UBS AG | | $13,775 | | INR948,500 | | | | (184 | ) |
| Indian rupees | | 1/11/2017 | | JPMorgan Chase | | $17,991 | | INR1,238,700 | | | | (238 | ) |
| Indian rupees | | 1/25/2017 | | JPMorgan Chase | | $2,113 | | INR143,040 | | | | 11 | |
| Japanese yen | | 3/10/2017 | | Bank of America, N.A. | | $892,888 | | ¥90,000,000 | | | | 120,143 | |
| Japanese yen | | 3/17/2017 | | Barclays Bank PLC | | $49,436 | | ¥5,080,000 | | | | 5,801 | |
| Japanese yen | | 3/17/2017 | | UBS AG | | $13,137 | | ¥1,350,000 | | | | 1,541 | |
| Japanese yen | | 4/18/2017 | | JPMorgan Chase | | $14,722 | | ¥1,520,000 | | | | 1,644 | |
| Japanese yen | | 5/12/2017 | | Citibank | | $84,132 | | ¥8,620,000 | | | | 9,868 | |
| Japanese yen | | 6/9/2017 | | Citibank | | $17,099 | | ¥1,750,000 | | | | 2,001 | |
| Japanese yen | | 6/9/2017 | | Citibank | | $17,099 | | ¥1,750,000 | | | | 2,001 | |
| Japanese yen | | 6/9/2017 | | Citibank | | $17,099 | | ¥1,750,000 | | | | 2,001 | |
| Japanese yen | | 8/10/2017 | | JPMorgan Chase | | $11,470 | | ¥1,170,000 | | | | 1,341 | |
| Mexican pesos | | 1/9/2017 | | Citibank | | $2,876 | | MXN59,392 | | | | 16 | |
| Mexican pesos | | 1/11/2017 | | Citibank | | $676 | | MXN14,000 | | | | 2 | |
| Mexican pesos | | 1/20/2017 | | JPMorgan Chase | | $19,645 | | MXN403,550 | | | | 242 | |
| Mexican pesos | | 1/25/2017 | | JPMorgan Chase | | $9,344 | | MXN190,000 | | | | 216 | |
| Singapore dollars | | 1/24/2017 | | JPMorgan Chase | | $13,566 | | S$19,600 | | | | 34 | |
| South Korean won | | 1/13/2017 | | UBS AG | | $14,136 | | KRW16,600,000 | | | | 391 | |
| Turkish lira | | 1/23/2017 | | UBS AG | | $2,859 | | TRY10,125 | | | | 3 | |
| Turkish lira | | 1/23/2017 | | JPMorgan Chase | | $114 | | TRY405 | | | | — | 7 |
| | | | | | | | | | | | $ | 144,939 | |
| Forward currency contracts – net | | | | | | | | | $ | 144,039 | |
Interest rate swaps
The fund has entered into interest rate swaps as shown in the following table. The average month-end notional amount of interest rate swaps while held was $14,770,478,000.
| | | | | | | | | | | | | Unrealized | |
| | | | | | | | | | | | | (depreciation) | |
| | | | | | | | | | | | | appreciation | |
| Pay/receive | | | | | | Fixed | | | Expiration | | Notional | | at 12/31/2016 | |
| fixed rate | | Clearinghouse | | Floating rate index | | rate | | | date | | (000) | | (000) | |
| Receive | | LCH | | Sonio Overnight Deposit Rates | | 0.207 | % | | 10/13/2018 | | £ | 280,000 | | | $ | (311 | ) |
| Receive | | LCH | | Sonio Overnight Deposit Rates | | 0.227 | | | 10/14/2018 | | | 45,000 | | | | (30 | ) |
| Receive | | LCH | | Sonio Overnight Deposit Rates | | 0.226 | | | 10/14/2018 | | | 275,000 | | | | (190 | ) |
| Pay | | LCH | | 3-month USD-LIBOR | | 0.821 | | | 7/8/2019 | | $ | 95,000 | | | | 1,789 | |
| Receive | | LCH | | 6-month NOK-NIBOR | | 1.36 | | | 12/19/2019 | | NKr | 1,030,000 | | | | 44 | |
| Receive | | LCH | | 3-month USD-LIBOR | | 1.666 | | | 5/26/2020 | | $ | 250,000 | | | | (715 | ) |
| Receive | | LCH | | 3-month USD-LIBOR | | 1.371 | | | 1/25/2021 | | | 270,000 | | | | (5,138 | ) |
| Receive | | LCH | | 3-month USD-LIBOR | | 1.3705 | | | 1/25/2021 | | | 280,000 | | | | (5,334 | ) |
| Receive | | LCH | | 3-month USD-LIBOR | | 1.3095 | | | 2/2/2021 | | | 188,000 | | | | (4,083 | ) |
| Pay | | LCH | | 3-month USD-LIBOR | | 1.305 | | | 4/25/2021 | | | 293,000 | | | | 7,111 | |
| Receive | | LCH | | 3-month USD-LIBOR | | 1.3575 | | | 6/3/2021 | | | 75,000 | | | | (1,738 | ) |
| Pay | | LCH | | 3-month USD-LIBOR | | 1.0695 | | | 6/17/2021 | | | 160,000 | | | | 5,774 | |
| Pay | | LCH | | 3-month USD-LIBOR | | 1.086 | | | 6/21/2021 | | | 74,000 | | | | 2,628 | |
| Pay | | LCH | | 3-month USD-LIBOR | | 2.1892 | | | 8/13/2021 | | | 50,000 | | | | (594 | ) |
| Pay | | LCH | | 3-month USD-LIBOR | | 1.217 | | | 9/22/2021 | | | 67,000 | | | | 2,206 | |
| Pay | | LCH | | 3-month USD-LIBOR | | 1.225 | | | 9/22/2021 | | | 67,000 | | | | 2,182 | |
| Pay | | LCH | | 3-month USD-LIBOR | | 1.2255 | | | 9/23/2021 | | | 727,900 | | | | 23,722 | |
| Pay | | LCH | | 3-month USD-LIBOR | | 1.25 | | | 9/23/2021 | | | 660,000 | | | | 20,770 | |
| Pay | | LCH | | 3-month USD-LIBOR | | 1.225 | | | 9/23/2021 | | | 527,100 | | | | 17,189 | |
| Pay | | LCH | | 3-month USD-LIBOR | | 1.26775 | | | 10/7/2021 | | | 87,000 | | | | 2,703 | |
| 16 | The Bond Fund of America |
Pay/receive
fixed rate | | Clearinghouse | | Floating rate index | | Fixed
rate | | | Expiration
date | | Notional
(000) | | Unrealized
(depreciation)
appreciation
at 12/31/2016
(000) | |
| Pay | | LCH | | 3-month USD-LIBOR | | 1.2796 | % | | 10/11/2021 | | $ | 434,000 | | | $ | 13,306 | |
| Receive | | LCH | | 3-month USD-LIBOR | | 1.852 | | | 12/5/2021 | | | 15,000 | | | | (78 | ) |
| Receive | | LCH | | 3-month USD-LIBOR | | 1.813 | | | 12/6/2021 | | | 20,000 | | | | (141 | ) |
| Receive | | LCH | | 3-month USD-LIBOR | | 1.8855 | | | 12/15/2021 | | | 58,100 | | | | (218 | ) |
| Receive | | LCH | | 3-month USD-LIBOR | | 1.885 | | | 12/15/2021 | | | 291,900 | | | | (1,106 | ) |
| Receive | | LCH | | 3-month USD-LIBOR | | 2.8 | | | 9/2/2022 | | | 785,000 | | | | 4,090 | |
| Receive | | LCH | | 3-month USD-LIBOR | | 2.75 | | | 9/2/2022 | | | 392,000 | | | | 1,682 | |
| Receive | | LCH | | 3-month USD-LIBOR | | 1.733 | | | 10/9/2022 | | | 100,000 | | | | (1,765 | ) |
| Receive | | LCH | | 3-month USD-LIBOR | | 1.176 | | | 2/16/2023 | | | 240,000 | | | | (12,730 | ) |
| Receive | | LCH | | 3-month USD-LIBOR | | 1.615 | | | 8/18/2023 | | | 270,000 | | | | (4,941 | ) |
| Receive | | LCH | | 3-month USD-LIBOR | | 1.309 | | | 9/27/2023 | | | 27,000 | | | | (1,426 | ) |
| Receive | | LCH | | 3-month USD-LIBOR | | 2.2665 | | | 12/21/2023 | | | 20,000 | | | | 146 | |
| Pay | | LCH | | 3-month USD-LIBOR | | 2.82125 | | | 4/11/2024 | | | 42,000 | | | | (1,850 | ) |
| Pay | | LCH | | 3-month USD-LIBOR | | 2.7455 | | | 6/19/2024 | | | 45,000 | | | | (1,747 | ) |
| Pay | | LCH | | 3-month USD-LIBOR | | 2.683 | | | 8/4/2024 | | | 54,000 | | | | (1,860 | ) |
| Pay | | LCH | | 3-month USD-LIBOR | | 1.902 | | | 2/2/2025 | | | 3,000 | | | | 75 | |
| Pay | | LCH | | 6-month JPY-LIBOR | | 0.5327 | | | 3/4/2025 | | ¥ | 6,100,000 | | | | (1,617 | ) |
| Pay | | LCH | | 3-month USD-LIBOR | | 2.255 | | | 5/20/2025 | | $ | 75,000 | | | | (41 | ) |
| Pay | | LCH | | 6-month JPY-LIBOR | | 0.46995 | | | 11/17/2025 | | ¥ | 6,250,000 | | | | (1,394 | ) |
| Pay | | LCH | | 3-month USD-LIBOR | | 2.1145 | | | 12/10/2025 | | $ | 93,000 | | | | 1,273 | |
| Pay | | LCH | | 3-month USD-LIBOR | | 2.149 | | | 1/7/2026 | | | 10,000 | | | | 113 | |
| Pay | | LCH | | 3-month USD-LIBOR | | 2.0235 | | | 1/13/2026 | | | 38,000 | | | | 831 | |
| Pay | | LCH | | 3-month USD-LIBOR | | 1.9615 | | | 1/14/2026 | | | 110,000 | | | | 2,977 | |
| Pay | | LCH | | 6-month JPY-LIBOR | | 0.3822 | | | 1/15/2026 | | ¥ | 5,100,000 | | | | (789 | ) |
| Pay | | LCH | | 3-month USD-LIBOR | | 1.8855 | | | 1/25/2026 | | $ | 150,000 | | | | 5,043 | |
| Pay | | LCH | | 6-month JPY-LIBOR | | 0.228 | | | 2/8/2026 | | ¥ | 8,500,000 | | | | (282 | ) |
| Pay | | LCH | | 6-month JPY-LIBOR | | 0.20125 | | | 2/18/2026 | | | 8,240,000 | | | | (96 | ) |
| Receive | | LCH | | 6-month JPY-LIBOR | | 0.1223 | | | 5/11/2026 | | | 2,000,000 | | | | (115 | ) |
| Receive | | LCH | | 6-month JPY-LIBOR | | 0.1173 | | | 5/13/2026 | | | 1,000,000 | | | | (62 | ) |
| Receive | | LCH | | 6-month JPY-LIBOR | | 0.10855 | | | 5/16/2026 | | | 2,000,000 | | | | (138 | ) |
| Receive | | LCH | | 6-month JPY-LIBOR | | 0.0188 | | | 6/16/2026 | | | 1,000,000 | | | | (145 | ) |
| Receive | | LCH | | 6-month JPY-LIBOR | | (0.00395 | ) | | 6/17/2026 | | | 2,000,000 | | | | (321 | ) |
| Pay | | LCH | | 3-month USD-LIBOR | | 1.3805 | | | 7/5/2026 | | $ | 78,000 | | | | 6,334 | |
| Pay | | LCH | | 3-month USD-LIBOR | | 1.456 | | | 8/9/2026 | | | 15,000 | | | | 1,134 | |
| Receive | | LCH | | 6-month EURIBOR | | 0.398 | | | 10/27/2026 | | € | 6,100 | | | | (149 | ) |
| Receive | | LCH | | 6-month EURIBOR | | 0.408 | | | 10/27/2026 | | | 39,800 | | | | (931 | ) |
| Receive | | LCH | | 6-month EURIBOR | | 0.756 | | | 12/9/2026 | | | 28,000 | | | | 317 | |
| Pay | | LCH | | 3-month USD-LIBOR | | 2.97125 | | | 9/2/2030 | | $ | 79,900 | | | | (1,497 | ) |
| Pay | | LCH | | 3-month USD-LIBOR | | 3.005 | | | 9/2/2030 | | | 160,300 | | | | (3,459 | ) |
| Pay | | LCH | | 3-month USD-LIBOR | | 1.87 | | | 8/18/2031 | | | 57,000 | | | | 4,310 | |
| Receive | | LCH | | 3-month USD-LIBOR | | 3.4275 | | | 4/11/2034 | | | 23,000 | | | | 3,004 | |
| Receive | | LCH | | 3-month USD-LIBOR | | 2.523 | | | 12/8/2035 | | | 5,000 | | | | (19 | ) |
| Pay | | LCH | | 3-month USD-LIBOR | | 3.34 | | | 6/27/2044 | | | 70,000 | | | | (11,010 | ) |
| Pay | | LCH | | 3-month USD-LIBOR | | 3.206 | | | 7/31/2044 | | | 24,000 | | | | (3,124 | ) |
| Pay | | LCH | | 3-month USD-LIBOR | | 3.238 | | | 8/8/2044 | | | 25,000 | | | | (3,415 | ) |
| Pay | | LCH | | 3-month USD-LIBOR | | 2.7045 | | | 1/2/2045 | | | 33,000 | | | | (852 | ) |
| Pay | | LCH | | 3-month USD-LIBOR | | 2.476 | | | 1/9/2045 | | | 15,000 | | | | 332 | |
| Pay | | LCH | | 3-month USD-LIBOR | | 2.3505 | | | 1/20/2045 | | | 3,000 | | | | 145 | |
| Pay | | LCH | | 3-month USD-LIBOR | | 2.717 | | | 5/26/2045 | | | 45,000 | | | | (1,296 | ) |
| Pay | | LCH | | 3-month USD-LIBOR | | 2.943 | | | 7/17/2045 | | | 40,000 | | | | (3,078 | ) |
| Pay | | LCH | | 3-month USD-LIBOR | | 2.6995 | | | 9/2/2045 | | | 40,000 | | | | (1,008 | ) |
| Pay | | LCH | | 3-month USD-LIBOR | | 2.7055 | | | 9/2/2045 | | | 50,000 | | | | (1,323 | ) |
| Pay | | LCH | | 3-month USD-LIBOR | | 2.6785 | | | 9/4/2045 | | | 60,000 | | | | (1,243 | ) |
| Pay | | LCH | | 3-month USD-LIBOR | | 2.516 | | | 10/20/2045 | | | 72,000 | | | | 1,010 | |
| Pay | | LCH | | 3-month USD-LIBOR | | 2.525 | | | 10/20/2045 | | | 48,000 | | | | 581 | |
| Pay | | LCH | | 3-month USD-LIBOR | | 2.5315 | | | 10/26/2045 | | | 60,000 | | | | 641 | |
| Pay | | LCH | | 3-month USD-LIBOR | | 2.57082 | | | 11/6/2045 | | | 123,000 | | | | 283 | |
| Pay | | LCH | | 3-month USD-LIBOR | | 2.57067 | | | 11/9/2045 | | | 13,200 | | | | 31 | |
| Pay | | LCH | | 3-month USD-LIBOR | | 2.6485 | | | 11/16/2045 | | | 13,050 | | | | (187 | ) |
| Pay | | LCH | | 3-month USD-LIBOR | | 2.52822 | | | 11/23/2045 | | | 17,800 | | | | 204 | |
| Pay | | LCH | | 3-month USD-LIBOR | | 2.52611 | | | 11/24/2045 | | | 57,400 | | | | 684 | |
| Pay | | LCH | | 3-month USD-LIBOR | | 2.535 | | | 11/24/2045 | | | 4,600 | | | | 46 | |
| Pay | | LCH | | 3-month USD-LIBOR | | 2.4835 | | | 12/3/2045 | | | 10,000 | | | | 211 | |
| The Bond Fund of America | 17 |
Interest rate swaps (continued)
Pay/receive
fixed rate | | Clearinghouse | | Floating rate index | | Fixed
rate | | | Expiration
date | | Notional
(000) | | Unrealized
(depreciation)
appreciation
at 12/31/2016
(000) | |
| Pay | | LCH | | 3-month USD-LIBOR | | 2.59125 | % | | 12/16/2045 | | $ | 67,250 | | | $ | (137 | ) |
| Pay | | LCH | | 3-month USD-LIBOR | | 2.4095 | | | 1/14/2046 | | | 49,000 | | | | 1,819 | |
| Pay | | LCH | | 3-month USD-LIBOR | | 2.396 | | | 1/19/2046 | | | 25,000 | | | | 1,001 | |
| Pay | | LCH | | 3-month USD-LIBOR | | 2.3375 | | | 1/25/2046 | | | 60,000 | | | | 3,157 | |
| Pay | | LCH | | 3-month USD-LIBOR | | 2.354 | | | 1/29/2046 | | | 53,000 | | | | 2,590 | |
| Pay | | LCH | | 3-month USD-LIBOR | | 1.991 | | | 6/13/2046 | | | 8,000 | | | | 1,028 | |
| Pay | | LCH | | 3-month USD-LIBOR | | 1.9905 | | | 6/13/2046 | | | 4,000 | | | | 514 | |
| Pay | | LCH | | 3-month USD-LIBOR | | 1.9165 | | | 6/21/2046 | | | 8,500 | | | | 1,231 | |
| Receive | | LCH | | 3-month USD-LIBOR | | 1.803 | | | 7/14/2046 | | | 30,000 | | | | (5,091 | ) |
| Pay | | LCH | | 3-month USD-LIBOR | | 1.826 | | | 7/28/2046 | | | 30,000 | | | | 4,944 | |
| Pay | | LCH | | 6-month EURIBOR | | 0.9152 | | | 10/27/2046 | | € | 15,100 | | | | 1,289 | |
| Pay | | LCH | | 6-month EURIBOR | | 0.9007 | | | 10/27/2046 | | | 2,000 | | | | 179 | |
| Pay | | LCH | | 3-month USD-LIBOR | | 2.403 | | | 11/21/2046 | | $ | 31,000 | | | | 1,217 | |
| Receive | | LCH | | 3-month USD-LIBOR | | 2.542 | | | 12/6/2046 | | | 17,000 | | | | (149 | ) |
| Receive | | LCH | | 3-month USD-LIBOR | | 2.5445 | | | 12/6/2046 | | | 45,000 | | | | (369 | ) |
| Pay | | LCH | | 6-month EURIBOR | | 1.3092 | | | 12/9/2046 | | € | 11,000 | | | | (250 | ) |
| Pay | | LCH | | 3-month USD-LIBOR | | 2.7265 | | | 12/22/2046 | | $ | 97,000 | | | | (3,083 | ) |
| | | | | | | | | | | | | | | | $ | 61,225 | |
Credit default swaps
The fund has entered into credit default swaps as shown in the following table. The average month-end notional amount of credit default swaps while held was $533,022,000.
Centrally cleared credit default swaps on credit indices — buy protection
| Referenced index | | Clearinghouse | | Pay
fixed rate | | | Expiration
date | | Notional
(000) | | | Value
(000) | | | Upfront
premiums
paid
(000) | | | Unrealized
depreciation
at 12/31/2016
(000) | |
| CDX.NA.HY.25 | | CME | | | 5.00 | % | | 12/20/2020 | | $ | 198,000 | | | $ | (13,657 | ) | | $ | (3,973 | ) | | | $ | (9,684 | ) |
| CDX.NA.HY.27 | | ICE | | | 5.00 | | | 12/20/2021 | | | 304,600 | | | | (18,885 | ) | | | (11,209 | ) | | | | (7,676 | ) |
| | | | | | | | | | | | | | | | | | | | | | | | $ | (17,360 | ) |
Futures contracts
The fund has entered into futures contracts as shown in the following table. The average month-end notional amount of open futures contracts while held was $10,696,679,000.
| Contracts | | Clearinghouse | | Type | | Number of
contracts | | Expiration | | Notional
amount
(000) | | | Unrealized
appreciation
(depreciation)
at 12/31/2016
(000) | |
| 30 Day Federal Funds Futures | | CME | | Short | | 168 | | January 2017 | | $ | 69,596 | | | | $ | 42 | |
| 10 Year Ultra U.S. Treasury Note Futures | | CME | | Short | | 5,682 | | March 2017 | | | 759,322 | | | | | (2,421 | ) |
| 10 Year U.S. Treasury Note Futures | | CME | | Long | | 2,488 | | March 2017 | | | 309,316 | | | | | (104 | ) |
| 30 Year Ultra U.S. Treasury Bond Futures | | CME | | Long | | 1,317 | | March 2017 | | | 208,323 | | | | | 2,726 | |
| 20 Year U.S. Treasury Bond Futures | | CME | | Long | | 284 | | March 2017 | | | 43,264 | | | | | (477 | ) |
| 5 Year U.S. Treasury Note Futures | | CME | | Long | | 84,019 | | April 2017 | | | 9,907,026 | | | | | (21,009 | ) |
| 2 Year U.S. Treasury Note Futures | | CME | | Long | | 13,305 | | April 2017 | | | 2,885,056 | | | | | (2,029 | ) |
| 90 Day Euro Dollar Futures | | CME | | Long | | 1,878 | | December 2017 | | | 464,168 | | | | | (1,805 | ) |
| 90 Day Euro Dollar Futures | | CME | | Short | | 1,351 | | March 2018 | | | 333,593 | | | | | 1,382 | |
| | | | | | | | | | | | | | | | $ | (23,695 | ) |
| | |
| 18 | The Bond Fund of America |
The following footnotes apply to either the individual securities noted or one or more of the securities aggregated and listed as a single line item.
| 1 | A portion of this security was pledged as collateral. The total value of pledged collateral was $368,286,000, which represented 1.15% of the net assets of the fund. |
| 2 | Index-linked bond whose principal amount moves with a government price index. |
| 3 | Principal payments may be made periodically. Therefore, the effective maturity date may be earlier than the stated maturity date. |
| 4 | Purchased on a TBA basis. |
| 5 | Coupon rate may change periodically. |
| 6 | Acquired in a transaction exempt from registration under Rule 144A or Section 4(2) of the Securities Act of 1933. May be resold in the U.S. in transactions exempt from registration, normally to qualified institutional buyers. The total value of all such securities, including those in “Other securities,” was $3,948,345,000, which represented 12.35% of the net assets of the fund. |
| 7 | Amount less than one thousand. |
Key to abbreviations and symbols
BRL = Brazilian reais
£ = British pounds
C$ = Canadian dollars
CLP = Chilean pesos
CME = CME Group
COP = Colombian pesos
EURIBOR = Euro Interbank Offered Rate
€ = Euros
ICE = Intercontinental Exchange, Inc.
INR = Indian rupees
JPY/¥ = Japanese yen
KRW = South Korean won
LCH = LCH.Clearnet
LIBOR = London Interbank Offered Rate
MXN = Mexican pesos
MYR = Malaysian ringgits
NIBOR = Norwegian Interbank Offered Rate
NOK/NKr = Norwegian kroner
S$ = Singapore dollars
TBA = To-be-announced
TRY = Turkish lira
See Notes to Financial Statements
| The Bond Fund of America | 19 |
Financial statements
| Statement of assets and liabilities | |
| at December 31, 2016 | (dollars in thousands) |
| Assets: | | | | | | | | |
| Investment securities, at value (cost: $32,408,709) | | | | | | $ | 32,117,422 | |
| Cash | | | | | | | 3,685 | |
| Cash denominated in currencies other than U.S. dollars (cost: $13,113) | | | | | | | 13,067 | |
| Unrealized appreciation on open forward currency contracts | | | | | | | 147,840 | |
| Receivables for: | | | | | | | | |
| Sales of investments | | $ | 1,064,011 | | | | | |
| Sales of fund’s shares | | | 78,156 | | | | | |
| Closed forward currency contracts | | | 16,969 | | | | | |
| Variation margin | | | 81,393 | | | | | |
| Dividends and interest | | | 177,620 | | | | | |
| Other | | | 920 | | | | 1,419,069 | |
| | | | | | | | 33,701,083 | |
| Liabilities: | | | | | | | | |
| Unrealized depreciation on open forward currency contracts | | | | | | | 3,801 | |
| Payables for: | | | | | | | | |
| Purchases of investments | | | 1,585,868 | | | | | |
| Repurchases of fund’s shares | | | 65,918 | | | | | |
| Dividends on fund’s shares | | | 2,381 | | | | | |
| Closed forward currency contracts | | | 636 | | | | | |
| Investment advisory services | | | 5,012 | | | | | |
| Services provided by related parties | | | 7,555 | | | | | |
| Trustees’ deferred compensation | | | 745 | | | | | |
| Variation margin | | | 64,210 | | | | | |
| Other | | | 869 | | | | 1,733,194 | |
| Net assets at December 31, 2016 | | | | | | $ | 31,964,088 | |
| | | | | | | | | |
| Net assets consist of: | | | | | | | | |
| Capital paid in on shares of beneficial interest | | | | | | $ | 33,452,425 | |
| Undistributed net investment income | | | | | | | 2,550 | |
| Accumulated net realized loss | | | | | | | (1,363,273 | ) |
| Net unrealized depreciation | | | | | | | (127,614 | ) |
| Net assets at December 31, 2016 | | | | | | $ | 31,964,088 | |
See Notes to Financial Statements
| 20 | The Bond Fund of America |
(dollars and shares in thousands, except per-share amounts)
Shares of beneficial interest issued and outstanding (no stated par value) —
unlimited shares authorized (2,512,215 total shares outstanding)
| | | Net assets | | | Shares
outstanding | | | Net asset value
per share | |
| Class A | | $ | 19,436,620 | | | | 1,527,620 | | | $ | 12.72 | |
| Class B | | | 19,674 | | | | 1,546 | | | | 12.72 | |
| Class C | | | 1,276,382 | | | | 100,317 | | | | 12.72 | |
| Class F-1 | | | 757,323 | | | | 59,522 | | | | 12.72 | |
| Class F-2 | | | 3,337,867 | | | | 262,340 | | | | 12.72 | |
| Class 529-A | | | 916,888 | | | | 72,063 | | | | 12.72 | |
| Class 529-B | | | 1,607 | | | | 126 | | | | 12.72 | |
| Class 529-C | | | 321,589 | | | | 25,275 | | | | 12.72 | |
| Class 529-E | | | 47,585 | | | | 3,740 | | | | 12.72 | |
| Class 529-F-1 | | | 77,249 | | | | 6,071 | | | | 12.72 | |
| Class R-1 | | | 42,273 | | | | 3,322 | | | | 12.72 | |
| Class R-2 | | | 514,367 | | | | 40,427 | | | | 12.72 | |
| Class R-2E | | | 9,268 | | | | 728 | | | | 12.72 | |
| Class R-3 | | | 651,118 | | | | 51,175 | | | | 12.72 | |
| Class R-4 | | | 556,104 | | | | 43,707 | | | | 12.72 | |
| Class R-5E | | | 10 | | | | 1 | | | | 12.72 | |
| Class R-5 | | | 148,883 | | | | 11,701 | | | | 12.72 | |
| Class R-6 | | | 3,849,281 | | | | 302,534 | | | | 12.72 | |
See Notes to Financial Statements
| The Bond Fund of America | 21 |
| Statement of operations | |
| for the year ended December 31, 2016 | (dollars in thousands) |
| Investment income: | | | | | | | | |
| Income: | | | | | | | | |
| Interest (net of non-U.S. taxes of $364) | | $ | 738,982 | | | | | |
| Dividends | | | 119 | | | $ | 739,101 | |
| Fees and expenses*: | | | | | | | | |
| Investment advisory services | | | 57,403 | | | | | |
| Distribution services | | | 79,216 | | | | | |
| Transfer agent services | | | 41,510 | | | | | |
| Administrative services | | | 7,480 | | | | | |
| Reports to shareholders | | | 1,790 | | | | | |
| Registration statement and prospectus | | | 1,487 | | | | | |
| Trustees’ compensation | | | 256 | | | | | |
| Auditing and legal | | | 209 | | | | | |
| Custodian | | | 375 | | | | | |
| Other | | | 1,355 | | | | 191,081 | |
| Net investment income | | | | | | | 548,020 | |
| |
| Net realized gain and unrealized depreciation: | | | | | | | | |
| Net realized gain (loss) on: | | | | | | | | |
| Investments (net of non-U.S. taxes of $345) | | | 472,749 | | | | | |
| Forward currency contracts | | | (47,740 | ) | | | | |
| Interest rate swaps | | | 29,099 | | | | | |
| Credit default swaps | | | (37,597 | ) | | | | |
| Futures contracts | | | (190,541 | ) | | | | |
| Currency transactions | | | (9,651 | ) | | | 216,319 | |
| Net unrealized (depreciation) appreciation on: | | | | | | | | |
| Investments (net of non-U.S. taxes of $440) | | | (179,697 | ) | | | | |
| Forward currency contracts | | | 146,726 | | | | | |
| Interest rate swaps | | | 56,289 | | | | | |
| Credit default swaps | | | (18,769 | ) | | | | |
| Futures contracts | | | (23,695 | ) | | | | |
| Currency translations | | | (143 | ) | | | (19,289 | ) |
| Net realized gain and unrealized depreciation | | | | | | | 197,030 | |
| Net increase in net assets resulting from operations | | | | | | $ | 745,050 | |
* Additional information related to class-specific fees and expenses is included in the Notes to Financial Statements.
| Statements of changes in net assets | |
| | (dollars in thousands) |
| | | Year ended December 31 | |
| | | 2016 | | | 2015 | |
| Operations: | | | | | | | | |
| Net investment income | | $ | 548,020 | | | $ | 502,317 | |
| Net realized gain | | | 216,319 | | | | 241,515 | |
| Net unrealized depreciation | | | (19,289 | ) | | | (683,564 | ) |
| Net increase in net assets resulting from operations | | | 745,050 | | | | 60,268 | |
| | | | | | | | | |
| Dividends paid or accrued to shareholders from net investment income | | | (514,154 | ) | | | (547,669 | ) |
| | | | | | | | | |
| Net capital share transactions | | | 3,471,685 | | | | 780,496 | |
| | | | | | | | | |
| Total increase in net assets | | | 3,702,581 | | | | 293,095 | |
| | | | | | | | | |
| Net assets: | | | | | | | | |
| Beginning of year | | | 28,261,507 | | | | 27,968,412 | |
| End of year (including undistributed net investment income: $2,550 and $17,160, respectively) | | $ | 31,964,088 | | | $ | 28,261,507 | |
See Notes to Financial Statements
| 22 | The Bond Fund of America |
Notes to financial statements
1. Organization
The Bond Fund of America (the “fund”) is registered under the Investment Company Act of 1940 as an open-end, diversified management investment company. The fund seeks as high a level of current income as is consistent with the preservation of capital.
The fund has 18 share classes consisting of five retail share classes (Classes A, B and C, as well as two F share classes, F-1 and F-2), five 529 college savings plan share classes (Classes 529-A, 529-B, 529-C, 529-E and 529-F-1) and eight retirement plan share classes (Classes R-1, R-2, R-2E, R-3, R-4, R-5E, R-5 and R-6). The 529 college savings plan share classes can be used to save for college education. The retirement plan share classes are generally offered only through eligible employer-sponsored retirement plans. The fund’s share classes are described further in the following table:
| Share class | | Initial sales charge | | Contingent deferred sales
charge upon redemption | | Conversion feature | |
| Classes A and 529-A | | Up to 3.75% | | None (except 1% for certain redemptions within one year of purchase without an initial sales charge) | | None | |
| Classes B and 529-B* | | None | | Declines from 5% to 0% for redemptions within six years of purchase | | Classes B and 529-B convert to Classes A and 529-A, respectively, after eight years | |
| Class C | | None | | 1% for redemptions within one year of purchase | | Class C converts to Class F-1 after 10 years | |
| Class 529-C | | None | | 1% for redemptions within one year of purchase | | None | |
| Class 529-E | | None | | None | | None | |
| Classes F-1, F-2 and 529-F-1 | | None | | None | | None | |
| Classes R-1, R-2, R-2E, R-3, R-4, R-5E, R-5 and R-6 | | None | | None | | None | |
| * | Class B and 529-B shares of the fund are not available for purchase. |
Holders of all share classes have equal pro rata rights to the assets, dividends and liquidation proceeds of the fund. Each share class has identical voting rights, except for the exclusive right to vote on matters affecting only its class. Share classes have different fees and expenses (“class-specific fees and expenses”), primarily due to different arrangements for distribution, transfer agent and administrative services. Differences in class-specific fees and expenses will result in differences in net investment income and, therefore, the payment of different per-share dividends by each share class.
2. Significant accounting policies
The fund is an investment company that applies the accounting and reporting guidance issued in Topic 946 by the U.S. Financial Accounting Standards Board. The fund’s financial statements have been prepared to comply with U.S. generally accepted accounting principles (“U.S. GAAP”). These principles require the fund’s investment adviser to make estimates and assumptions that affect reported amounts and disclosures. Actual results could differ from those estimates. Subsequent events, if any, have been evaluated through the date of issuance in the preparation of the financial statements. The fund follows the significant accounting policies described in this section, as well as the valuation policies described in the next section on valuation.
Security transactions and related investment income — Security transactions are recorded by the fund as of the date the trades are executed with brokers. Realized gains and losses from security transactions are determined based on the specific identified cost of the securities. In the event a security is purchased with a delayed payment date, the fund will segregate liquid assets sufficient to meet its payment obligations. Dividend income is recognized on the ex-dividend date and interest income is recognized on an accrual basis. Market discounts, premiums and original issue discounts on fixed-income securities are amortized daily over the expected life of the security.
Class allocations — Income, fees and expenses (other than class-specific fees and expenses) are allocated daily among the various share classes based on the relative value of their settled shares. Realized and unrealized gains and losses are allocated daily among the various share classes based on their relative net assets. Class-specific fees and expenses, such as distribution, transfer agent and administrative services, are charged directly to the respective share class.
| The Bond Fund of America | 23 |
Dividends and distributions to shareholders — Dividends to shareholders are declared daily after the determination of the fund’s net investment income and are paid to shareholders monthly. Distributions to shareholders are recorded on the ex-dividend date.
Currency translation — Assets and liabilities, including investment securities, denominated in currencies other than U.S. dollars are translated into U.S. dollars at the exchange rates supplied by one or more pricing vendors on the valuation date. Purchases and sales of investment securities and income and expenses are translated into U.S. dollars at the exchange rates on the dates of such transactions. The effects of changes in exchange rates on investment securities are included with the net realized gain or loss and net unrealized appreciation or depreciation on investments in the fund’s statement of operations. The realized gain or loss and unrealized appreciation or depreciation resulting from all other transactions denominated in currencies other than U.S. dollars are disclosed separately.
3. Valuation
Capital Research and Management Company (“CRMC”), the fund’s investment adviser, values the fund’s investments at fair value as defined by U.S. GAAP. The net asset value of each share class of the fund is generally determined as of approximately 4:00 p.m. New York time each day the New York Stock Exchange is open.
Methods and inputs — The fund’s investment adviser uses the following methods and inputs to establish the fair value of the fund’s assets and liabilities. Use of particular methods and inputs may vary over time based on availability and relevance as market and economic conditions evolve.
Equity securities are generally valued at the official closing price of, or the last reported sale price on, the exchange or market on which such securities are traded, as of the close of business on the day the securities are being valued or, lacking any sales, at the last available bid price. Prices for each security are taken from the principal exchange or market on which the security trades.
Fixed-income securities, including short-term securities, are generally valued at prices obtained from one or more pricing vendors. Vendors value such securities based on one or more of the inputs described in the following table. The table provides examples of inputs that are commonly relevant for valuing particular classes of fixed-income securities in which the fund is authorized to invest. However, these classifications are not exclusive, and any of the inputs may be used to value any other class of fixed-income security.
| Fixed-income class | | Examples of standard inputs |
| All | | Benchmark yields, transactions, bids, offers, quotations from dealers and trading systems, new issues, spreads and other relationships observed in the markets among comparable securities; and proprietary pricing models such as yield measures calculated using factors such as cash flows, financial or collateral performance and other reference data (collectively referred to as “standard inputs”) |
| Corporate bonds & notes; convertible securities | | Standard inputs and underlying equity of the issuer |
| Bonds & notes of governments & government agencies | | Standard inputs and interest rate volatilities |
| Mortgage-backed; asset-backed obligations | | Standard inputs and cash flows, prepayment information, default rates, delinquency and loss assumptions, collateral characteristics, credit enhancements and specific deal information |
| Municipal securities | | Standard inputs and, for certain distressed securities, cash flows or liquidation values using a net present value calculation based on inputs that include, but are not limited to, financial statements and debt contracts |
When the fund’s investment adviser deems it appropriate to do so (such as when vendor prices are unavailable or deemed to be not representative), fixed-income securities will be valued in good faith at the mean quoted bid and ask prices that are reasonably and timely available (or bid prices, if ask prices are not available) or at prices for securities of comparable maturity, quality and type.
Securities with both fixed-income and equity characteristics, or equity securities traded principally among fixed-income dealers, are generally valued in the manner described for either equity or fixed-income securities, depending on which method is deemed most appropriate by the fund’s investment adviser. Forward currency contracts are valued at the mean of representative quoted bid and ask prices, generally based on prices supplied by one or more pricing vendors. Interest rate swaps and credit default swaps are generally valued by pricing vendors based on market inputs that include the index and term of index, reset frequency, payer/receiver, currency and pay frequency. Exchange-traded futures are generally valued at the official settlement price of, or the last reported sale price on, the exchange or market on which such instruments are traded, as of the close of business on the day the futures are being valued or, lacking any sales, at the last available bid price. Prices for each future are taken from the exchange or market on which the security trades.
| 24 | The Bond Fund of America |
Securities and other assets for which representative market quotations are not readily available or are considered unreliable by the fund’s investment adviser are fair valued as determined in good faith under fair valuation guidelines adopted by authority of the fund’s board of trustees as further described. The investment adviser follows fair valuation guidelines, consistent with U.S. Securities and Exchange Commission rules and guidance, to consider relevant principles and factors when making fair value determinations. The investment adviser considers relevant indications of value that are reasonably and timely available to it in determining the fair value to be assigned to a particular security, such as the type and cost of the security; contractual or legal restrictions on resale of the security; relevant financial or business developments of the issuer; actively traded similar or related securities; conversion or exchange rights on the security; related corporate actions; significant events occurring after the close of trading in the security; and changes in overall market conditions. In addition, the closing prices of equity securities that trade in markets outside U.S. time zones may be adjusted to reflect significant events that occur after the close of local trading but before the net asset value of each share class of the fund is determined. Fair valuations and valuations of investments that are not actively trading involve judgment and may differ materially from valuations that would have been used had greater market activity occurred.
Processes and structure — The fund’s board of trustees has delegated authority to the fund’s investment adviser to make fair value determinations, subject to board oversight. The investment adviser has established a Joint Fair Valuation Committee (the “Fair Valuation Committee”) to administer, implement and oversee the fair valuation process, and to make fair value decisions. The Fair Valuation Committee regularly reviews its own fair value decisions, as well as decisions made under its standing instructions to the investment adviser’s valuation teams. The Fair Valuation Committee reviews changes in fair value measurements from period to period and may, as deemed appropriate, update the fair valuation guidelines to better reflect the results of back testing and address new or evolving issues. The Fair Valuation Committee reports any changes to the fair valuation guidelines to the board of trustees with supplemental information to support the changes. The fund’s board and audit committee also regularly review reports that describe fair value determinations and methods.
The fund’s investment adviser has also established a Fixed-Income Pricing Review Group to administer and oversee the fixed-income valuation process, including the use of fixed-income pricing vendors. This group regularly reviews pricing vendor information and market data. Pricing decisions, processes and controls over security valuation are also subject to additional internal reviews, including an annual control self-evaluation program facilitated by the investment adviser’s compliance group.
Classifications — The fund’s investment adviser classifies the fund’s assets and liabilities into three levels based on the inputs used to value the assets or liabilities. Level 1 values are based on quoted prices in active markets for identical securities. Level 2 values are based on significant observable market inputs, such as quoted prices for similar securities and quoted prices in inactive markets. Certain securities trading outside the U.S. may transfer between Level 1 and Level 2 due to valuation adjustments resulting from significant market movements following the close of local trading. Level 3 values are based on significant unobservable inputs that reflect the investment adviser’s determination of assumptions that market participants might reasonably use in valuing the securities. The valuation levels are not necessarily an indication of the risk or liquidity associated with the underlying investment. For example, U.S. government securities are reflected as Level 2 because the inputs used to determine fair value may not always be quoted prices in an active market. The following tables present the fund’s valuation levels as of December 31, 2016 (dollars in thousands):
| | | Investment securities | |
| | | Level 1 | | | Level 2 | | | Level 3 | | | Total | |
| Assets: | | | | | | | | | | | | | | | | |
| Bonds, notes & other debt instruments: | | | | | | | | | | | | | | | | |
| U.S. Treasury bonds & notes | | $ | — | | | $ | 11,339,569 | | | $ | — | | | $ | 11,339,569 | |
| Corporate bonds & notes | | | — | | | | 9,517,643 | | | | 14,455 | | | | 9,532,098 | |
| Mortgage-backed obligations | | | — | | | | 5,890,654 | | | | — | | | | 5,890,654 | |
| Asset-backed obligations | | | — | | | | 1,804,759 | | | | 32,290 | | | | 1,837,049 | |
| Bonds & notes of governments & government agencies outside the U.S. | | | — | | | | 1,015,126 | | | | — | | | | 1,015,126 | |
| Municipals | | | — | | | | 254,635 | | | | — | | | | 254,635 | |
| Federal agency bonds & notes | | | — | | | | 146,585 | | | | — | | | | 146,585 | |
| Convertible stocks | | | — | | | | 4,050 | | | | — | | | | 4,050 | |
| Preferred securities | | | — | | | | 3,986 | | | | — | | | | 3,986 | |
| Common stocks | | | 1,483 | | | | 5,049 | | | | 4,911 | | | | 11,443 | |
| Short-term securities | | | — | | | | 2,082,227 | | | | — | | | | 2,082,227 | |
| Total | | $ | 1,483 | | | $ | 32,064,283 | | | $ | 51,656 | | | $ | 32,117,422 | |
| The Bond Fund of America | 25 |
| | | Other investments* | |
| | | Level 1 | | | Level 2 | | | Level 3 | | | Total | |
| Assets: | | | | | | | | | | | | | | | | |
| Unrealized appreciation on open forward currency contracts | | $ | — | | | $ | 147,840 | | | $ | — | | | $ | 147,840 | |
| Unrealized appreciation on interest rate swaps | | | — | | | | 153,890 | | | | — | | | | 153,890 | |
| Unrealized appreciation on futures contracts | | | 4,150 | | | | — | | | | — | | | | 4,150 | |
| Liabilities: | | | | | | | | | | | | | | | | |
| Unrealized depreciation on open forward currency contracts | | | — | | | | (3,801 | ) | | | — | | | | (3,801 | ) |
| Unrealized depreciation on interest rate swaps | | | — | | | | (92,665 | ) | | | — | | | | (92,665 | ) |
| Unrealized depreciation on credit default swaps | | | — | | | | (17,360 | ) | | | — | | | | (17,360 | ) |
| Unrealized depreciation on futures contracts | | | (27,845 | ) | | | — | | | | — | | | | (27,845 | ) |
| Total | | $ | (23,695 | ) | | $ | 187,904 | | | $ | — | | | $ | 164,209 | |
* Forward currency contracts, interest rate swaps, credit default swaps and futures contracts are not included in the investment portfolio.
4. Risk factors
Investing in the fund may involve certain risks including, but not limited to, those described below.
Market conditions — The prices of, and the income generated by, the securities held by the fund may decline — sometimes rapidly or unpredictably — due to various factors, including events or conditions affecting the general economy or particular industries; overall market changes; local, regional or global political, social or economic instability; governmental or governmental agency responses to economic conditions; and currency exchange rate, interest rate and commodity price fluctuations.
Issuer risks — The prices of, and the income generated by, securities held by the fund may decline in response to various factors directly related to the issuers of such securities, including reduced demand for an issuer’s goods or services, poor management performance and strategic initiatives such as mergers, acquisitions or dispositions and the market response to any such initiatives.
Investing in debt instruments — The prices of, and the income generated by, bonds and other debt securities held by the fund may be affected by changing interest rates and by changes in the effective maturities and credit ratings of these securities.
Rising interest rates will generally cause the prices of bonds and other debt securities to fall. Falling interest rates may cause an issuer to redeem, call or refinance a debt security before its stated maturity, which may result in the fund having to reinvest the proceeds in lower yielding securities. Longer maturity debt securities generally have greater sensitivity to changes in interest rates and may be subject to greater price fluctuations than shorter maturity debt securities.
Bonds and other debt securities are also subject to credit risk, which is the possibility that the credit strength of an issuer will weaken and/or an issuer of a debt security will fail to make timely payments of principal or interest and the security will go into default. Lower quality debt securities generally have higher rates of interest and may be subject to greater price fluctuations than higher quality debt securities. Credit risk is gauged, in part, by the credit ratings of the debt securities in which the fund invests. However, ratings are only the opinions of the rating agencies issuing them and are not guarantees as to credit quality or an evaluation of market risk. The fund’s investment adviser relies on its own credit analysts to research issuers and issues in seeking to mitigate various credit and default risks.
Investing in mortgage-related and other asset-backed securities — Mortgage-related securities, such as mortgage-backed securities, and other asset-backed securities, include debt obligations that represent interests in pools of mortgages or other income-bearing assets, such as consumer loans or receivables. Such securities often involve risks that are different from or more acute than the risks associated with investing in other types of debt securities. Mortgage-backed and other asset-backed securities are subject to changes in the payment patterns of borrowers of the underlying debt. When interest rates fall, borrowers are more likely to refinance or prepay their debt before its stated maturity. This may result in the fund having to reinvest the proceeds in lower yielding securities, effectively reducing the fund’s income. Conversely, if interest rates rise and borrowers repay their debt more slowly than expected, the time in which the mortgage-backed and other asset-backed securities are paid off could be extended, reducing the fund’s cash available for reinvestment in higher yielding securities.
Investing in securities backed by the U.S. government — Securities backed by the U.S. Treasury or the full faith and credit of the U.S. government are guaranteed only as to the timely payment of interest and principal when held to maturity. Accordingly, the current market values for these securities will fluctuate with changes in interest rates. Securities issued by government-sponsored entities and federal
| 26 | The Bond Fund of America |
agencies and instrumentalities that are not backed by the full faith and credit of the U.S. government are neither issued nor guaranteed by the U.S. government.
Liquidity risk — Certain fund holdings may be deemed to be less liquid or illiquid because they cannot be readily sold without significantly impacting the value of the holdings. Liquidity risk may result from the lack of an active market for a holding, legal or contractual restrictions on resale, or the reduced number and capacity of market participants to make a market in such holding. Market prices for less liquid or illiquid holdings may be volatile, and reduced liquidity may have an adverse impact on the market price of such holdings. Additionally, the sale of less liquid or illiquid holdings may involve substantial delays (including delays in settlement) and additional costs and the fund may be unable to sell such holdings when necessary to meet its liquidity needs.
Investing outside the U.S. — Securities of issuers domiciled outside the U.S., or with significant operations or revenues outside the U.S., may lose value because of adverse political, social, economic or market developments (including social instability, regional conflicts, terrorism and war) in the countries or regions in which the issuers operate or generate revenue. These securities may also lose value due to changes in foreign currency exchange rates against the U.S. dollar and/or currencies of other countries. Issuers of these securities may be more susceptible to actions of foreign governments, such as the imposition of price controls or punitive taxes, that could adversely impact the value of these securities. Securities markets in certain countries may be more volatile and/or less liquid than those in the U.S. Investments outside the U.S. may also be subject to different accounting practices and different regulatory, legal and reporting standards and practices, and may be more difficult to value, than those in the U.S. In addition, the value of investments outside the U.S. may be reduced by foreign taxes, including foreign withholding taxes on interest and dividends. Further, there may be increased risks of delayed settlement of securities purchased or sold by the fund. The risks of investing outside the U.S. may be heightened in connection with investments in emerging markets.
Investing in future delivery contracts — The fund may enter into contracts, such as to-be-announced contracts and mortgage dollar rolls, that involve the fund selling mortgage-related securities and simultaneously contracting to repurchase similar securities for delivery at a future date at a predetermined price. This can increase the fund’s market exposure, and the market price of the securities that the fund contracts to repurchase could drop below their purchase price. While the fund can preserve and generate capital through the use of such contracts by, for example, realizing the difference between the sale price and the future purchase price, the income generated by the fund may be reduced by engaging in such transactions. In addition, these transactions may increase the turnover rate of the fund.
Investing in inflation linked bonds — The values of inflation linked bonds generally fluctuate in response to changes in real interest rates — i.e., rates of interest after factoring in inflation. A rise in real interest rates may cause the prices of inflation linked securities to fall, while a decline in real interest rates may cause the prices to increase. Inflation linked bonds may experience greater losses than other debt securities with similar durations when real interest rates rise faster than nominal interest rates. There can be no assurance that the value of an inflation linked security will be directly correlated to changes in interest rates; for example, if interest rates rise for reasons other than inflation, the increase may not be reflected in the security’s inflation measure.
Investing in inflation linked bonds may also reduce the fund’s distributable income during periods of extreme deflation. If prices for goods and services decline throughout the economy, the principal and income on inflation linked securities may decline and result in losses to the fund.
Investing in derivatives — The use of derivatives involves a variety of risks, which may be different from, or greater than, the risks associated with investing in traditional cash securities, such as stocks and bonds. Changes in the value of a derivative may not correlate perfectly with, and may be more sensitive to market events than, the underlying asset, rate or index, and a derivative instrument may expose the fund to losses in excess of its initial investment. Derivatives may be difficult for the fund to buy or sell at an opportune time or price and may be difficult to terminate or otherwise offset. The fund’s use of derivatives may result in losses to the fund, and investing in derivatives may reduce the fund’s returns and increase the fund’s price volatility. The fund’s counterparty to a derivative transaction (including, if applicable, the fund’s clearing broker, the derivatives exchange or the clearinghouse) may be unable or unwilling to honor its financial obligations in respect of the transaction.
Management — The investment adviser to the fund actively manages the fund’s investments. Consequently, the fund is subject to the risk that the methods and analyses employed by the investment adviser in this process may not produce the desired results. This could cause the fund to lose value or its investment results to lag relevant benchmarks or other funds with similar objectives.
| The Bond Fund of America | 27 |
5. Certain investment techniques
Index-linked bonds — The fund has invested in index-linked bonds, which are fixed-income securities whose principal value is periodically adjusted to a government price index. Over the life of an index-linked bond, interest is paid on the adjusted principal value. Increases or decreases in the principal value of index-linked bonds are recorded as interest income in the fund’s statement of operations.
Mortgage dollar rolls — The fund has entered into mortgage dollar roll transactions in which the fund sells a mortgage-backed security to a counterparty and simultaneously enters into an agreement with the same counterparty to buy back a similar security on a specific future date at a predetermined price. Mortgage dollar rolls are accounted for as purchase and sale transactions, which may increase the fund’s portfolio turnover rate.
Loan transactions — The fund has entered into loan transactions in which the fund acquires a loan either through an agent, by assignment from another holder, or as a participation interest in another holder’s portion of a loan. The loan is often administered by a financial institution that acts as agent for the holders of the loan, and the fund may be required to receive approval from the agent and/or borrower prior to the sale of the investment. The loan’s interest rate and maturity date may change based on the terms of the loan, including potential early payments of principal.
Unfunded commitments — The fund has participated in a transaction that involves unfunded commitments, which may obligate the fund to purchase additional shares of the applicable issuer. Under the terms of the commitments, which will expire no later than April 1, 2021, the maximum potential exposure as of December 31, 2016, was $259,000. Should such commitments become due in full, these amounts would represent less than .01% of the net assets of the fund as of December 31, 2016.
Forward currency contracts — The fund has entered into forward currency contracts, which represent agreements to exchange currencies on specific future dates at predetermined rates. The fund’s investment adviser uses forward currency contracts to manage the fund’s exposure to changes in exchange rates. Upon entering into these contracts, risks may arise from the potential inability of counterparties to meet the terms of their contracts and from possible movements in exchange rates.
On a daily basis, the fund’s investment adviser values forward currency contracts and records unrealized appreciation or depreciation for open forward currency contracts in the fund’s statement of assets and liabilities. Realized gains or losses are recorded at the time the forward currency contract is closed or offset by another contract with the same broker for the same settlement date and currency.
Closed forward currency contracts that have not reached their settlement date are included in the respective receivables or payables for closed forward currency contracts in the fund’s statement of assets and liabilities. Net realized gains or losses from closed forward currency contracts and net unrealized appreciation or depreciation from open forward currency contracts are recorded in the fund’s statement of operations.
Interest rate swaps — The fund has entered into interest rate swap contracts, which are agreements to exchange one stream of future interest payments for another based on a specified notional amount. Typically, interest rate swaps exchange a fixed interest rate for a payment that floats relative to a benchmark or vice versa. The fund’s investment adviser uses interest rate swaps to seek to manage the interest rate sensitivity of the fund by increasing or decreasing the duration of the fund or a portion of the fund’s portfolio. Risks may arise as a result of the fund’s investment adviser incorrectly anticipating changes in interest rates, increased volatility, reduced liquidity and the potential inability of counterparties to meet the terms of their agreements.
Upon entering into an interest rate swap contract, the fund is required to deposit cash, U.S. government securities or other liquid securities, which is known as “initial margin.” Generally, the initial margin required for a particular interest rate swap is set and held as collateral by the clearinghouse on which the contract is cleared. The amount of initial margin required may be significantly modified from time to time by the clearinghouse during the term of the contract.
On a daily basis, the fund’s investment adviser records daily interest accruals related to the exchange of future payments as a receivable and payable in the fund’s statement of assets and liabilities. The fund also pays or receives a “variation margin” based on the increase or decrease in the value of the interest rate swaps, including accrued interest, and records variation margin on interest rate swaps in the statement of assets and liabilities. The fund records realized gains and losses on both the net accrued interest and any gain or loss recognized at the time the interest rate swap is closed or expires. Net realized gains or losses, as well as any net unrealized appreciation or depreciation, from interest rate swaps are recorded in the fund’s statement of operations.
Credit default swap indices — The fund has entered into centrally cleared credit default swap agreements on credit indices (“CDSI”) that involve one party (the protection buyer) making a stream of payments to another party (the protection seller) in exchange for the right to receive a specified return upon the occurrence of a credit event, such as a default or restructuring, with respect to any of the underlying
| 28 | The Bond Fund of America |
issuers (reference obligations) in the referenced index. The fund’s investment adviser uses credit default swaps to assume exposure to a diversified portfolio of credits or to hedge against existing credit risks.
CDSI are portfolios of credit instruments or exposures designed to be representative of some part of the credit market, such as the high-yield or investment-grade credit market. CDSI are generally traded using standardized terms, including a fixed spread and standard maturity dates, and reference all the names in the index. If there is a credit event, it is settled based on that name’s weight in the index. The composition of the underlying issuers or obligations within a particular index may change periodically, usually every six months. A specified credit event may affect all or individual underlying reference obligations included in the index, and will be settled based upon the relative weighting of the affected obligation(s) within the index. The value of each CDSI can be used as a measure of the current payment/performance risk of the CDSI and represents the likelihood of an expected liability or profit should the notional amount of the CDSI be closed or sold as of the period end. An increasing value, as compared to the notional amount of the CDSI, represents a deterioration of the referenced indices’ credit soundness and a greater likelihood of risk of default or other credit event occurring as defined under the terms of the agreement. When the fund provides sell protection, its maximum exposure is the notional amount of the credit default swap agreement.
Upon entering into a centrally cleared CDSI contract, the fund is required to deposit with a derivatives clearing member (“DCM”) in a segregated account in the name of the DCM an amount of cash, U.S. government securities or other liquid securities, which is known as “initial margin.” Generally, the initial margin required for a particular credit default swap is set and held as collateral by the clearinghouse on which the contract is cleared. The amount of initial margin required may be significantly modified from time to time by the clearinghouse during the term of the contract. Securities deposited as initial margin are designated on the investment portfolio.
On a daily basis, interest accruals related to the exchange of future payments are recorded as a receivable and payable in the fund’s statement of assets and liabilities. The fund also pays or receives a “variation margin” based on the increase or decrease in the value of the CDSI, and records variation margin in the statement of assets and liabilities. The fund records realized gains and losses on both the net accrued interest and any gain or loss recognized at the time the swap is closed or expires. Net realized gains or losses, as well as any net unrealized appreciation or depreciation, from credit default swaps are recorded in the fund’s statement of operations.
Futures contracts — The fund has entered into futures contracts, which provide for the future sale by one party and purchase by another party of a specified amount of a specific financial instrument for a specified price, date, time and place designated at the time the contract is made. Futures contracts are used to strategically manage portfolio volatility and downside equity risk.
Upon entering into futures contracts, and to maintain the fund’s open positions in futures contracts, the fund is required to deposit with a futures broker, or FCM, in a segregated account in the name of the FCM an amount of cash, U.S. government securities, suitable money market instruments, or other liquid securities, known as initial margin. The margin required for a particular futures contract is set by the exchange on which the contract is traded to serve as collateral, and may be significantly modified from time to time by the exchange during the term of the contract. When initial margin is deposited with brokers, a receivable is recorded in the fund’s statement of assets and liabilities.
On a daily basis, the fund pays or receives variation margin based on the increase or decrease in the value of the futures contracts and records variation margin on futures contracts in the statement of assets and liabilities. In addition, the fund segregates liquid assets equivalent to the fund’s outstanding obligations under the contract in excess of the initial margin and variation margin, if any. Futures contracts may involve a risk of loss in excess of the variation margin shown on the fund’s statement of assets and liabilities. The fund records realized gains or losses at the time the futures contract is closed or expires. Net realized gains or losses and net unrealized appreciation or depreciation from futures contracts are recorded in the fund’s statement of operations.
| The Bond Fund of America | 29 |
The following tables present the financial statement impacts resulting from the fund’s use of forward currency contracts, interest rate swaps, credit default swaps and futures contracts as of, or for the year ended, December 31, 2016 (dollars in thousands):
| | | | | Assets | | | Liabilities | |
| Contract | | Risk type | | Location on statement of
assets and liabilities | | Value | | | Location on statement of
assets and liabilities | | Value | |
| Forward currency | | Currency | | Unrealized appreciation on open forward currency contracts | | $ | 147,840 | | | Unrealized depreciation on open forward currency contracts | | $ | 3,801 | |
| Forward currency | | Currency | | Receivables for closed forward currency contracts | | | 16,969 | | | Payables for closed forward currency contracts | | | 636 | |
| Interest rate swaps | | Interest | | Net unrealized appreciation* | | | 153,890 | | | Net unrealized depreciation* | | | 92,665 | |
| Credit default swaps | | Credit | | Net unrealized appreciation* | | | — | | | Net unrealized depreciation* | | | 17,360 | |
| Futures contracts | | Interest | | Net unrealized appreciation* | | | 4,150 | | | Net unrealized depreciation* | | | 27,845 | |
| | | | | | | $ | 322,849 | | | | | $ | 142,307 | |
| | | | | | | | | | | | | | | |
| | | | | Net realized (loss) gain | | | Net unrealized appreciation (depreciation) | |
| Contract | | Risk type | | Location on statement of
operations | | Value | | | Location on statement of
operations | | Value | |
| Forward currency | | Currency | | Net realized loss on forward currency contracts | | $ | (47,740 | ) | | Net unrealized appreciation on forward currency contracts | | $ | 146,726 | |
| Interest rate swaps | | Interest | | Net realized gain on interest rate swaps | | | 29,099 | | | Net unrealized appreciation on interest rate swaps | | | 56,289 | |
| Credit default swaps | | Credit | | Net realized loss on credit default swaps | | | (37,597 | ) | | Net unrealized depreciation on credit default swaps | | | (18,769 | ) |
| Futures contracts | | Interest | | Net realized loss on futures contracts | | | (190,541 | ) | | Net unrealized depreciation on futures contracts | | | (23,695 | ) |
| | | | | | | $ | (246,779 | ) | | | | $ | 160,551 | |
| * | Includes cumulative appreciation/depreciation on interest rate swaps, credit default swaps and futures contracts as reported in the applicable tables following the fund’s investment portfolio. Only current day’s variation margin is reported within the statement of assets and liabilities. |
Collateral — The fund participates in a collateral program due to its use of forward currency contracts, interest rate swaps, credit default swaps, futures contracts and future delivery contracts. For forward currency contracts, the program calls for the fund to either receive or pledge collateral based on the net gain or loss on unsettled forward currency contracts by counterparty. For interest rate swaps, credit default swaps and futures contracts, the program calls for the fund to pledge collateral for initial and variation margin by contract. For future delivery contracts, the program calls for the fund to either receive or pledge collateral based on the net gain or loss on unsettled contracts by certain counterparties. The purpose of the collateral is to cover potential losses that could occur in the event that either party cannot meet its contractual obligations.
| 30 | The Bond Fund of America |
Rights of offset — The fund has entered into enforceable master netting agreements with certain counterparties for forward currency contracts, where on any date amounts payable by each party to the other (in the same currency with respect to the same transaction) may be closed or offset by each party’s payment obligation. If an early termination date occurs under these agreements following an event of default or termination event, all obligations of each party to its counterparty are settled net through a single payment in a single currency (“close-out netting”). For financial reporting purposes, the fund does not offset financial assets and financial liabilities that are subject to these master netting arrangements in the statement of assets and liabilities.
The following table presents the fund’s forward currency contracts by counterparty that are subject to master netting agreements but that are not offset in the fund’s statement of assets and liabilities. The net amount column shows the impact of offsetting on the fund’s statement of assets and liabilities as of December 31, 2016, if close-out netting was exercised (dollars in thousands):
| | | Gross amounts
recognized in the
statement of assets
and liabilities | | | Gross amounts not offset in the
statement of assets and liabilities and
subject to a master netting agreement | | | | |
| Counterparty | | | | Available
to offset | | | Non-cash
collateral* | | | Cash
collateral | | | Net
amount | |
| Assets: | | | | | | | | | | | | | | | | | | | | |
| Bank of America, N.A. | | $ | 125,597 | | | $ | (664 | ) | | $ | (124,933 | ) | | $ | — | | | $ | — | |
| Bank of New York Mellon | | | 5 | | | | — | | | | — | | | | — | | | | 5 | |
| Barclays Bank PLC | | | 7,348 | | | | (114 | ) | | | (7,234 | ) | | | — | | | | — | |
| Citibank | | | 17,270 | | | | (1,655 | ) | | | (15,615 | ) | | | — | | | | — | |
| HSBC Bank | | | 876 | | | | (257 | ) | | | (619 | ) | | | — | | | | — | |
| JPMorgan Chase | | | 11,307 | | | | (1,563 | ) | | | (9,744 | ) | | | — | | | | — | |
| UBS AG | | | 2,406 | | | | (184 | ) | | | (2,191 | ) | | | — | | | | 31 | |
| Total | | $ | 164,809 | | | $ | (4,437 | ) | | $ | (160,336 | ) | | $ | — | | | $ | 36 | |
| Liabilities: | | | | | | | | | | | | | | | | | | | | |
| Bank of America, N.A. | | $ | 664 | | | $ | (644 | ) | | $ | — | | | $ | — | | | $ | — | |
| Barclays Bank PLC | | | 114 | | | | (114 | ) | | | — | | | | — | | | | — | |
| Citibank | | | 1,655 | | | | (1,655 | ) | | | — | | | | — | | | | — | |
| HSBC Bank | | | 257 | | | | (257 | ) | | | — | | | | — | | | | — | |
| JPMorgan Chase | | | 1,563 | | | | (1,563 | ) | | | — | | | | — | | | | — | |
| UBS AG | | | 184 | | | | (184 | ) | | | — | | | | — | | | | — | |
| Total | | $ | 4,437 | | | $ | (4,437 | ) | | $ | — | | | $ | — | | | $ | — | |
| * | Non-cash collateral is shown on a settlement basis. |
6. Taxation and distributions
Federal income taxation — The fund complies with the requirements under Subchapter M of the Internal Revenue Code applicable to mutual funds and intends to distribute substantially all of its net taxable income and net capital gains each year. The fund is not subject to income taxes to the extent such distributions are made. Therefore, no federal income tax provision is required.
As of and during the period ended December 31, 2016, the fund did not have a liability for any unrecognized tax benefits. The fund recognizes interest and penalties, if any, related to unrecognized tax benefits as income tax expense in the statement of operations. During the period, the fund did not incur any interest or penalties.
The fund is not subject to examination by U.S. federal tax authorities for tax years before 2013, by state tax authorities for tax years before 2012 and by tax authorities outside the U.S. for tax years before 2014.
Non-U.S. taxation — Dividend and interest income are recorded net of non-U.S. taxes paid. The fund may file withholding tax reclaims in certain jurisdictions to recover a portion of amounts previously withheld. These reclaims are recorded when the amount is known and there are no significant uncertainties on collectability. Gains realized by the fund on the sale of securities in certain countries are subject to non-U.S. taxes. The fund records an estimated deferred tax liability based on unrealized gains to provide for potential non-U.S. taxes payable upon the sale of these securities.
Distributions — Distributions paid to shareholders are based on net investment income and net realized gains determined on a tax basis, which may differ from net investment income and net realized gains for financial reporting purposes. These differences are due primarily to different treatment for items such as currency gains and losses; short-term capital gains and losses; capital losses related to sales of certain securities within 30 days of purchase; cost of investments sold; paydowns on fixed-income securities; net capital losses; non-U.S.
| The Bond Fund of America | 31 |
taxes on capital gains and income on certain investments. The fiscal year in which amounts are distributed may differ from the year in which the net investment income and net realized gains are recorded by the fund for financial reporting purposes.
During the year ended December 31, 2016, the fund reclassified $48,468,000 from undistributed net investment income to accumulated net realized loss and $8,000 from undistributed net investment income to capital paid in on shares of beneficial interest to align financial reporting with tax reporting.
Under the Regulated Investment Company Modernization Act of 2010 (the “Act”), net capital losses recognized after December 31, 2010, may be carried forward indefinitely, and their character is retained as short-term and/or long-term losses. Previously, net capital losses were carried forward for eight years and treated as short-term losses. As a transition rule, the Act requires that post-enactment net capital losses be used before pre-enactment net capital losses.
As of December 31, 2016, the tax basis components of distributable earnings, unrealized appreciation (depreciation) and cost of investment securities were as follows (dollars in thousands):
| Undistributed ordinary income | | $ | 132,930 | |
| Capital loss carryforward expiring 2017* | | | (1,282,818 | ) |
| Gross unrealized appreciation on investment securities | | | 332,400 | |
| Gross unrealized depreciation on investment securities | | | (672,148 | ) |
| Net unrealized depreciation on investment securities | | | (339,748 | ) |
| Cost of investment securities | | | 32,457,170 | |
| * | Reflects the utilization of capital loss carryforward of $295,779,000. The capital loss carryforward will be used to offset any capital gains realized by the fund in future years through the expiration date. The fund will not make distributions from capital gains while a capital loss carryforward remains. |
Tax-basis distributions paid or accrued to shareholders from ordinary income were as follows (dollars in thousands):
| | | Year ended December 31 | |
| Share class | | 2016 | | | | | 2015 | |
| Class A | | $ | 331,377 | | | | | $ | 369,608 | |
| Class B | | | 436 | | | | | | 1,428 | |
| Class C | | | 12,115 | | | | | | 16,772 | |
| Class F-1 | | | 12,250 | | | | | | 13,147 | |
| Class F-2 | | | 42,281 | | | | | | 31,899 | |
| Class 529-A | | | 14,899 | | | | | | 17,368 | |
| Class 529-B | | | 33 | | | | | | 115 | |
| Class 529-C | | | 2,833 | | | | | | 3,951 | |
| Class 529-E | | | 681 | | | | | | 824 | |
| Class 529-F-1 | | | 1,403 | | | | | | 1,475 | |
| Class R-1 | | | 419 | | | | | | 631 | |
| Class R-2 | | | 5,073 | | | | | | 7,139 | |
| Class R-2E | | | 77 | | | | | | 6 | |
| Class R-3 | | | 9,355 | | | | | | 11,673 | |
| Class R-4 | | | 9,284 | | | | | | 10,136 | |
| Class R-5E* | | | — | † | | | | | — | † |
| Class R-5 | | | 3,606 | | | | | | 4,690 | |
| Class R-6 | | | 68,032 | | | | | | 56,807 | |
| Total | | $ | 514,154 | | | | | $ | 547,669 | |
| * | Class R-5E shares were offered beginning November 20, 2015. |
| † | Amount less than one thousand. |
7. Fees and transactions with related parties
CRMC, the fund’s investment adviser, is the parent company of American Funds Distributors,® Inc. (“AFD”), the principal underwriter of the fund’s shares, and American Funds Service Company® (“AFS”), the fund’s transfer agent. CRMC, AFD and AFS are considered related parties to the fund.
Investment advisory services — The fund has an investment advisory and service agreement with CRMC that provides for monthly fees accrued daily. These fees are based on a series of decreasing annual rates beginning with 0.300% on the first $60 million of daily net assets and decreasing to 0.110% on such assets in excess of $36 billion. The agreement also provides for monthly fees, accrued daily,
| 32 | The Bond Fund of America |
based on a series of decreasing rates beginning with 2.25% on the first $8,333,333 of the fund’s monthly gross income and decreasing to 1.75% on such income in excess of $41,666,667. For the year ended December 31, 2016, the investment advisory services fee was $57,403,000, which was equivalent to an annualized rate of 0.186% of average daily net assets.
Class-specific fees and expenses — Expenses that are specific to individual share classes are accrued directly to the respective share class. The principal class-specific fees and expenses are further described below:
Distribution services — The fund has plans of distribution for all share classes, except Class F-2, R-5E, R-5 and R-6 shares. Under the plans, the board of trustees approves certain categories of expenses that are used to finance activities primarily intended to sell fund shares and service existing accounts. The plans provide for payments, based on an annualized percentage of average daily net assets, ranging from 0.25% to 1.00% as noted in this section. In some cases, the board of trustees has limited the amounts that may be paid to less than the maximum allowed by the plans. All share classes with a plan may use up to 0.25% of average daily net assets to pay service fees, or to compensate AFD for paying service fees, to firms that have entered into agreements with AFD to provide certain shareholder services. The remaining amounts available to be paid under each plan are paid to dealers to compensate them for their sales activities.
For Class A and 529-A shares, distribution-related expenses include the reimbursement of dealer and wholesaler commissions paid by AFD for certain shares sold without a sales charge. These share classes reimburse AFD for amounts billed within the prior 15 months but only to the extent that the overall annual expense limit of 0.25% is not exceeded. As of December 31, 2016, there were no unreimbursed expenses subject to reimbursement for Class A or 529-A shares.
| Share class | | Currently approved limits | | Plan limits |
| Class A | | | 0.25 | % | | | 0.25 | % |
| Class 529-A | | | 0.25 | | | | 0.50 | |
| Classes B and 529-B | | | 1.00 | | | | 1.00 | |
| Classes C, 529-C and R-1 | | | 1.00 | | | | 1.00 | |
| Class R-2 | | | 0.75 | | | | 1.00 | |
| Class R-2E | | | 0.60 | | | | 0.85 | |
| Classes 529-E and R-3 | | | 0.50 | | | | 0.75 | |
| Classes F-1, 529-F-1 and R-4 | | | 0.25 | | | | 0.50 | |
Transfer agent services — The fund has a shareholder services agreement with AFS under which the fund compensates AFS for providing transfer agent services to each of the fund’s share classes. These services include recordkeeping, shareholder communications and transaction processing. In addition, the fund reimburses AFS for amounts paid to third parties for performing transfer agent services on behalf of fund shareholders.
Administrative services — The fund has an administrative services agreement with CRMC under which the fund compensates CRMC for providing administrative services to Class A, C, F, 529 and R shares. These services include, but are not limited to, coordinating, monitoring, assisting and overseeing third parties that provide services to fund shareholders. Under the agreement, Class A shares pay an annual fee of 0.01% and Class C, F, 529 and R shares pay an annual fee of 0.05% of their respective average daily net assets.
529 plan services — Each 529 share class is subject to service fees to compensate the Virginia College Savings Plan (“Virginia529“) for its oversight and administration of the 529 college savings plan. From January 1, 2016 to June 30, 2016, the quarterly fee was based on a series of decreasing annual rates beginning with 0.10% on the first $30 billion of the net assets invested in Class 529 shares of the American Funds and decreasing to 0.05% on such assets in excess of $70 billion. Effective July 1, 2016, the quarterly fee was amended to annual rates of 0.10% on the first $20 billion of the net assets invested in the Class 529 shares of the American Funds, 0.05% on such assets between $20 billion and $100 billion, and 0.03% on such assets over $100 billion. The fee for any given calendar quarter is accrued and calculated on the basis of the average net assets of Class 529 shares of the American Funds for the last month of the prior calendar quarter. The fee is included in other expenses in the fund’s statement of operations. Virginia529 is not considered a related party to the fund.
| The Bond Fund of America | 33 |
For the year ended December 31, 2016, class-specific expenses under the agreements were as follows (dollars in thousands):
| Share class | | Distribution
services | | | Transfer agent
services | | | Administrative
services | | | 529 plan
services | |
| Class A | | | $48,192 | | | | $30,179 | | | | $1,973 | | | | Not applicable | |
| Class B | | | 484 | | | | 88 | | | | Not applicable | | | | Not applicable | |
| Class C | | | 13,650 | | | | 2,105 | | | | 685 | | | | Not applicable | |
| Class F-1 | | | 1,833 | | | | 1,068 | | | | 372 | | | | Not applicable | |
| Class F-2 | | | Not applicable | | | | 2,383 | | | | 1,081 | | | | Not applicable | |
| Class 529-A | | | 2,148 | | | | 1,226 | | | | 467 | | | | $736 | |
| Class 529-B | | | 43 | | | | 8 | | | | 2 | | | | 4 | |
| Class 529-C | | | 3,350 | | | | 470 | | | | 170 | | | | 269 | |
| Class 529-E | | | 243 | | | | 36 | | | | 24 | | | | 39 | |
| Class 529-F-1 | | | — | | | | 100 | | | | 38 | | | | 60 | |
| Class R-1 | | | 456 | | | | 53 | | | | 23 | | | | Not applicable | |
| Class R-2 | | | 4,028 | | | | 1,963 | | | | 272 | | | | Not applicable | |
| Class R-2E | | | 36 | | | | 12 | | | | 3 | | | | Not applicable | |
| Class R-3 | | | 3,384 | | | | 1,130 | | | | 341 | | | | Not applicable | |
| Class R-4 | | | 1,369 | | | | 567 | | | | 275 | | | | Not applicable | |
| Class R-5E | | | Not applicable | | | | — | * | | | — | * | | | Not applicable | |
| Class R-5 | | | Not applicable | | | | 99 | | | | 92 | | | | Not applicable | |
| Class R-6 | | | Not applicable | | | | 23 | | | | 1,662 | | | | Not applicable | |
| Total class-specific expenses | | | $79,216 | | | | $41,510 | | | | $7,480 | | | | $1,108 | |
| * | Amount less than one thousand. |
Trustees’ deferred compensation — Trustees who are unaffiliated with CRMC may elect to defer the cash payment of part or all of their compensation. These deferred amounts, which remain as liabilities of the fund, are treated as if invested in shares of the fund or other American Funds. These amounts represent general, unsecured liabilities of the fund and vary according to the total returns of the selected funds. Trustees’ compensation of $256,000 in the fund’s statement of operations reflects $217,000 in current fees (either paid in cash or deferred) and a net increase of $39,000 in the value of the deferred amounts.
Affiliated officers and trustees — Officers and certain trustees of the fund are or may be considered to be affiliated with CRMC, AFD and AFS. No affiliated officers or trustees received any compensation directly from the fund.
Security transactions with related funds — The fund may purchase from, or sell securities to, other CRMC-managed funds (or funds managed by certain affiliates of CRMC) under procedures adopted by the fund’s board of trustees. The funds involved in such transactions are considered related by virtue of having a common investment adviser (or affiliated investment advisers), common trustees and/or common officers. When such transactions occur, each transaction is executed at the current market price of the security and no brokerage commissions or fees are paid in accordance with Rule 17a-7 of the 1940 Act.
| 34 | The Bond Fund of America |
8. Capital share transactions
Capital share transactions in the fund were as follows (dollars and shares in thousands):
| | | Sales1 | | Reinvestments of
dividends | | Repurchases1 | | | Net increase
(decrease) | |
| Share class | | Amount | | | Shares | | | Amount | | | Shares | | | Amount | | | Shares | | | Amount | | | Shares | |
| | | | | | | | | | | | | | | | | | | | | | | | | |
| Year ended December 31, 2016 |
| | | | | | | | | | | | | | | | | | | | | | | | | | | | | | | | | |
| Class A | | $ | 3,951,151 | | | | 305,755 | | | $ | 322,470 | | | | 24,958 | | | $ | (3,596,110 | ) | | | (278,510 | ) | | $ | 677,511 | | | | 52,203 | |
| Class B | | | 2,346 | | | | 182 | | | | 426 | | | | 33 | | | | (67,889 | ) | | | (5,259 | ) | | | (65,117 | ) | | | (5,044 | ) |
| Class C | | | 299,015 | | | | 23,154 | | | | 11,733 | | | | 909 | | | | (410,436 | ) | | | (31,798 | ) | | | (99,688 | ) | | | (7,735 | ) |
| Class F-1 | | | 265,974 | | | | 20,611 | | | | 11,850 | | | | 917 | | | | (199,852 | ) | | | (15,485 | ) | | | 77,972 | | | | 6,043 | |
| Class F-2 | | | 2,487,608 | | | | 191,937 | | | | 41,181 | | | | 3,190 | | | | (692,695 | ) | | | (53,585 | ) | | | 1,836,094 | | | | 141,542 | |
| Class 529-A | | | 156,763 | | | | 12,132 | | | | 14,850 | | | | 1,150 | | | | (161,563 | ) | | | (12,512 | ) | | | 10,050 | | | | 770 | |
| Class 529-B | | | 441 | | | | 34 | | | | 33 | | | | 2 | | | | (6,302 | ) | | | (488 | ) | | | (5,828 | ) | | | (452 | ) |
| Class 529-C | | | 58,197 | | | | 4,506 | | | | 2,819 | | | | 218 | | | | (79,881 | ) | | | (6,190 | ) | | | (18,865 | ) | | | (1,466 | ) |
| Class 529-E | | | 7,869 | | | | 608 | | | | 678 | | | | 53 | | | | (9,195 | ) | | | (712 | ) | | | (648 | ) | | | (51 | ) |
| Class 529-F-1 | | | 21,542 | | �� | | 1,671 | | | | 1,394 | | | | 108 | | | | (17,920 | ) | | | (1,391 | ) | | | 5,016 | | | | 388 | |
| Class R-1 | | | 9,616 | | | | 746 | | | | 416 | | | | 32 | | | | (15,151 | ) | | | (1,173 | ) | | | (5,119 | ) | | | (395 | ) |
| Class R-2 | | | 141,658 | | | | 10,987 | | | | 5,019 | | | | 389 | | | | (183,298 | ) | | | (14,209 | ) | | | (36,621 | ) | | | (2,833 | ) |
| Class R-2E | | | 9,530 | | | | 736 | | | | 77 | | | | 6 | | | | (1,607 | ) | | | (125 | ) | | | 8,000 | | | | 617 | |
| Class R-3 | | | 200,062 | | | | 15,507 | | | | 9,283 | | | | 719 | | | | (227,210 | ) | | | (17,608 | ) | | | (17,865 | ) | | | (1,382 | ) |
| Class R-4 | | | 160,132 | | | | 12,401 | | | | 9,254 | | | | 716 | | | | (129,996 | ) | | | (10,073 | ) | | | 39,390 | | | | 3,044 | |
| Class R-5E | | | — | | | | — | | | | — | | | | — | | | | — | | | | — | | | | — | | | | — | |
| Class R-5 | | | 62,293 | | | | 4,830 | | | | 3,478 | | | | 269 | | | | (126,576 | ) | | | (9,737 | ) | | | (60,805 | ) | | | (4,638 | ) |
| Class R-6 | | | 1,232,208 | | | | 95,329 | | | | 68,034 | | | | 5,264 | | | | (172,034 | ) | | | (13,261 | ) | | | 1,128,208 | | | | 87,332 | |
| Total net increase (decrease) | | $ | 9,066,405 | | | | 701,126 | | | $ | 502,995 | | | | 38,933 | | | $ | (6,097,715 | ) | | | (472,116 | ) | | $ | 3,471,685 | | | | 267,943 | |
| | | | | | | | | | | | | | | | | | | | | | | | | | | | | | | | | |
| Year ended December 31, 2015 |
| |
| Class A | | $ | 2,835,690 | | | | 221,702 | | | $ | 358,397 | | | | 28,022 | | | $ | (2,985,792 | ) | | | (233,593 | ) | | $ | 208,295 | | | | 16,131 | |
| Class B | | | 3,718 | | | | 290 | | | | 1,390 | | | | 109 | | | | (86,526 | ) | | | (6,766 | ) | | | (81,418 | ) | | | (6,367 | ) |
| Class C | | | 247,243 | | | | 19,325 | | | | 16,131 | | | | 1,262 | | | | (380,924 | ) | | | (29,798 | ) | | | (117,550 | ) | | | (9,211 | ) |
| Class F-1 | | | 209,390 | | | | 16,372 | | | | 12,686 | | | | 992 | | | | (190,480 | ) | | | (14,882 | ) | | | 31,596 | | | | 2,482 | |
| Class F-2 | | | 597,049 | | | | 46,646 | | | | 31,107 | | | | 2,433 | | | | (383,033 | ) | | | (29,979 | ) | | | 245,123 | | | | 19,100 | |
| Class 529-A | | | 119,755 | | | | 9,362 | | | | 17,305 | | | | 1,353 | | | | (162,892 | ) | | | (12,759 | ) | | | (25,832 | ) | | | (2,044 | ) |
| Class 529-B | | | 747 | | | | 58 | | | | 113 | | | | 9 | | | | (8,326 | ) | | | (651 | ) | | | (7,466 | ) | | | (584 | ) |
| Class 529-C | | | 50,233 | | | | 3,926 | | | | 3,931 | | | | 307 | | | | (82,732 | ) | | | (6,479 | ) | | | (28,568 | ) | | | (2,246 | ) |
| Class 529-E | | | 6,410 | | | | 501 | | | | 821 | | | | 64 | | | | (9,257 | ) | | | (725 | ) | | | (2,026 | ) | | | (160 | ) |
| Class 529-F-1 | | | 19,884 | | | | 1,557 | | | | 1,468 | | | | 115 | | | | (14,851 | ) | | | (1,164 | ) | | | 6,501 | | | | 508 | |
| Class R-1 | | | 11,206 | | | | 876 | | | | 626 | | | | 49 | | | | (19,650 | ) | | | (1,539 | ) | | | (7,818 | ) | | | (614 | ) |
| Class R-2 | | | 133,437 | | | | 10,427 | | | | 7,064 | | | | 552 | | | | (192,583 | ) | | | (15,067 | ) | | | (52,082 | ) | | | (4,088 | ) |
| Class R-2E | | | 1,391 | | | | 110 | | | | 5 | | | | — | 2 | | | (154 | ) | | | (12 | ) | | | 1,242 | | | | 98 | |
| Class R-3 | | | 170,152 | | | | 13,295 | | | | 11,578 | | | | 905 | | | | (238,779 | ) | | | (18,681 | ) | | | (57,049 | ) | | | (4,481 | ) |
| Class R-4 | | | 169,535 | | | | 13,224 | | | | 10,103 | | | | 790 | | | | (138,127 | ) | | | (10,796 | ) | | | 41,511 | | | | 3,218 | |
| Class R-5E3 | | | 10 | | | | 1 | | | | — | | | | — | | | | — | | | | — | | | | 10 | | | | 1 | |
| Class R-5 | | | 67,235 | | | | 5,245 | | | | 4,715 | | | | 368 | | | | (70,460 | ) | | | (5,468 | ) | | | 1,490 | | | | 145 | |
| Class R-6 | | | 864,399 | | | | 67,542 | | | | 56,704 | | | | 4,436 | | | | (296,566 | ) | | | (23,197 | ) | | | 624,537 | | | | 48,781 | |
| Total net increase (decrease) | | $ | 5,507,484 | | | | 430,459 | | | $ | 534,144 | | | | 41,766 | | | $ | (5,261,132 | ) | | | (411,556 | ) | | $ | 780,496 | | | | 60,669 | |
| 1 | Includes exchanges between share classes of the fund. |
| 2 | Amount less than one thousand. |
| 3 | Class R-5E shares were offered beginning November 20, 2015. |
9. Investment transactions
The fund made purchases and sales of investment securities, excluding short-term securities and U.S. government obligations, if any, of $76,349,658,000 and $74,592,995,000, respectively, during the year ended December 31, 2016.
| The Bond Fund of America | 35 |
Financial highlights
| | | | | | Income (loss) from | | | | | | | | | | | | | | | | | | | |
| | | | | | investment operations1 | | | | | | | | | | | | | | | | | | | |
| | | | | | | | | Net gains | | | | | | | | | | | | | | | | | | | | | | |
| | | Net asset | | | | | | (losses) on | | | | | | Dividends | | | Net asset | | | | | | | | | Ratio of | | | Ratio of | |
| | | value, | | | Net | | | securities (both | | | Total from | | | (from net | | | value, | | | | | | Net assets, | | | expenses | | | net income | |
| | | beginning | | | investment | | | realized and | | | investment | | | investment | | | end | | | Total | | | end of period | | | to average | | | to average | |
| | | of period | | | income | | | unrealized) | | | operations | | | income) | | | of period | | | return2 | | | (in millions) | | | net assets | | | net assets | |
| Class A: | | | | | | | | | | | | | | | | | | | | | | | | | | | | | | | | | | | | | | | | |
| Year ended 12/31/2016 | | $ | 12.59 | | | $ | .23 | | | $ | .12 | | | $ | .35 | | | $ | (.22 | ) | | $ | 12.72 | | | | 2.74 | % | | $ | 19,437 | | | | .61 | % | | | 1.79 | % |
| Year ended 12/31/2015 | | | 12.81 | | | | .23 | | | | (.20 | ) | | | .03 | | | | (.25 | ) | | | 12.59 | | | | .23 | | | | 18,580 | | | | .60 | | | | 1.81 | |
| Year ended 12/31/2014 | | | 12.40 | | | | .27 | | | | .41 | | | | .68 | | | | (.27 | ) | | | 12.81 | | | | 5.53 | | | | 18,691 | | | | .62 | | | | 2.11 | |
| Year ended 12/31/2013 | | | 12.95 | | | | .26 | | | | (.52 | ) | | | (.26 | ) | | | (.29 | ) | | | 12.40 | | | | (1.99 | ) | | | 18,895 | | | | .61 | | | | 2.10 | |
| Year ended 12/31/2012 | | | 12.55 | | | | .30 | | | | .43 | | | | .73 | | | | (.33 | ) | | | 12.95 | | | | 5.90 | | | | 24,142 | | | | .60 | | | | 2.33 | |
| Class B: | | | | | | | | | | | | | | | | | | | | | | | | | | | | | | | | | | | | | | | | |
| Year ended 12/31/2016 | | | 12.59 | | | | .13 | | | | .12 | | | | .25 | | | | (.12 | ) | | | 12.72 | | | | 1.97 | | | | 20 | | | | 1.37 | | | | 1.01 | |
| Year ended 12/31/2015 | | | 12.81 | | | | .13 | | | | (.19 | ) | | | (.06 | ) | | | (.16 | ) | | | 12.59 | | | | (.51 | ) | | | 83 | | | | 1.34 | | | | 1.05 | |
| Year ended 12/31/2014 | | | 12.40 | | | | .18 | | | | .41 | | | | .59 | | | | (.18 | ) | | | 12.81 | | | | 4.75 | | | | 166 | | | | 1.36 | | | | 1.40 | |
| Year ended 12/31/2013 | | | 12.95 | | | | .17 | | | | (.52 | ) | | | (.35 | ) | | | (.20 | ) | | | 12.40 | | | | (2.72 | ) | | | 257 | | | | 1.36 | | | | 1.33 | |
| Year ended 12/31/2012 | | | 12.55 | | | | .21 | | | | .43 | | | | .64 | | | | (.24 | ) | | | 12.95 | | | | 5.10 | | | | 441 | | | | 1.35 | | | | 1.60 | |
| Class C: | | | | | | | | | | | | | | | | | | | | | | | | | | | | | | | | | | | | | | | | |
| Year ended 12/31/2016 | | | 12.59 | | | | .12 | | | | .12 | | | | .24 | | | | (.11 | ) | | | 12.72 | | | | 1.94 | | | | 1,276 | | | | 1.40 | | | | 1.00 | |
| Year ended 12/31/2015 | | | 12.81 | | | | .13 | | | | (.20 | ) | | | (.07 | ) | | | (.15 | ) | | | 12.59 | | | | (.56 | ) | | | 1,361 | | | | 1.40 | | | | 1.01 | |
| Year ended 12/31/2014 | | | 12.40 | | | | .17 | | | | .41 | | | | .58 | | | | (.17 | ) | | | 12.81 | | | | 4.71 | | | | 1,502 | | | | 1.41 | | | | 1.33 | |
| Year ended 12/31/2013 | | | 12.95 | | | | .16 | | | | (.52 | ) | | | (.36 | ) | | | (.19 | ) | | | 12.40 | | | | (2.76 | ) | | | 1,680 | | | | 1.41 | | | | 1.29 | |
| Year ended 12/31/2012 | | | 12.55 | | | | .20 | | | | .43 | | | | .63 | | | | (.23 | ) | | | 12.95 | | | | 5.05 | | | | 2,400 | | | | 1.39 | | | | 1.54 | |
| Class F-1: | | | | | | | | | | | | | | | | | | | | | | | | | | | | | | | | | | | | | | | | |
| Year ended 12/31/2016 | | | 12.59 | | | | .22 | | | | .12 | | | | .34 | | | | (.21 | ) | | | 12.72 | | | | 2.71 | | | | 757 | | | | .64 | | | | 1.76 | |
| Year ended 12/31/2015 | | | 12.81 | | | | .23 | | | | (.20 | ) | | | .03 | | | | (.25 | ) | | | 12.59 | | | | .21 | | | | 673 | | | | .63 | | | | 1.78 | |
| Year ended 12/31/2014 | | | 12.40 | | | | .27 | | | | .41 | | | | .68 | | | | (.27 | ) | | | 12.81 | | | | 5.53 | | | | 653 | | | | .62 | | | | 2.15 | |
| Year ended 12/31/2013 | | | 12.95 | | | | .26 | | | | (.52 | ) | | | (.26 | ) | | | (.29 | ) | | | 12.40 | | | | (2.03 | ) | | | 961 | | | | .64 | | | | 2.06 | |
| Year ended 12/31/2012 | | | 12.55 | | | | .30 | | | | .43 | | | | .73 | | | | (.33 | ) | | | 12.95 | | | | 5.88 | | | | 1,452 | | | | .61 | | | | 2.32 | |
| Class F-2: | | | | | | | | | | | | | | | | | | | | | | | | | | | | | | | | | | | | | | | | |
| Year ended 12/31/2016 | | | 12.59 | | | | .26 | | | | .12 | | | | .38 | | | | (.25 | ) | | | 12.72 | | | | 3.00 | | | | 3,338 | | | | .36 | | | | 2.03 | |
| Year ended 12/31/2015 | | | 12.81 | | | | .26 | | | | (.20 | ) | | | .06 | | | | (.28 | ) | | | 12.59 | | | | .47 | | | | 1,521 | | | | .37 | | | | 2.05 | |
| Year ended 12/31/2014 | | | 12.40 | | | | .29 | | | | .43 | | | | .72 | | | | (.31 | ) | | | 12.81 | | | | 5.82 | | | | 1,303 | | | | .35 | | | | 2.27 | |
| Year ended 12/31/2013 | | | 12.95 | | | | .29 | | | | (.52 | ) | | | (.23 | ) | | | (.32 | ) | | | 12.40 | | | | (1.75 | ) | | | 467 | | | | .37 | | | | 2.36 | |
| Year ended 12/31/2012 | | | 12.55 | | | | .33 | | | | .43 | | | | .76 | | | | (.36 | ) | | | 12.95 | | | | 6.16 | | | | 483 | | | | .35 | | | | 2.56 | |
| Class 529-A: | | | | | | | | | | | | | | | | | | | | | | | | | | | | | | | | | | | | | | | | |
| Year ended 12/31/2016 | | | 12.59 | | | | .22 | | | | .12 | | | | .34 | | | | (.21 | ) | | | 12.72 | | | | 2.66 | | | | 917 | | | | .69 | | | | 1.71 | |
| Year ended 12/31/2015 | | | 12.81 | | | | .22 | | | | (.20 | ) | | | .02 | | | | (.24 | ) | | | 12.59 | | | | .13 | | | | 898 | | | | .70 | | | | 1.71 | |
| Year ended 12/31/2014 | | | 12.40 | | | | .26 | | | | .41 | | | | .67 | | | | (.26 | ) | | | 12.81 | | | | 5.44 | | | | 939 | | | | .71 | | | | 2.02 | |
| Year ended 12/31/2013 | | | 12.95 | | | | .25 | | | | (.52 | ) | | | (.27 | ) | | | (.28 | ) | | | 12.40 | | | | (2.08 | ) | | | 947 | | | | .70 | | | | 2.01 | |
| Year ended 12/31/2012 | | | 12.55 | | | | .29 | | | | .43 | | | | .72 | | | | (.32 | ) | | | 12.95 | | | | 5.80 | | | | 1,101 | | | | .68 | | | | 2.24 | |
| Class 529-B: | | | | | | | | | | | | | | | | | | | | | | | | | | | | | | | | | | | | | | | | |
| Year ended 12/31/2016 | | | 12.59 | | | | .11 | | | | .12 | | | | .23 | | | | (.10 | ) | | | 12.72 | | | | 1.85 | | | | 2 | | | | 1.50 | | | | .89 | |
| Year ended 12/31/2015 | | | 12.81 | | | | .12 | | | | (.20 | ) | | | (.08 | ) | | | (.14 | ) | | | 12.59 | | | | (.64 | ) | | | 7 | | | | 1.47 | | | | .92 | |
| Year ended 12/31/2014 | | | 12.40 | | | | .16 | | | | .41 | | | | .57 | | | | (.16 | ) | | | 12.81 | | | | 4.62 | | | | 15 | | | | 1.49 | | | | 1.27 | |
| Year ended 12/31/2013 | | | 12.95 | | | | .15 | | | | (.52 | ) | | | (.37 | ) | | | (.18 | ) | | | 12.40 | | | | (2.84 | ) | | | 23 | | | | 1.49 | | | | 1.21 | |
| Year ended 12/31/2012 | | | 12.55 | | | | .19 | | | | .43 | | | | .62 | | | | (.22 | ) | | | 12.95 | | | | 4.96 | | | | 39 | | | | 1.48 | | | | 1.47 | |
| | |
| 36 | The Bond Fund of America |
| | | | | | Income (loss) from | | | | | | | | | | | | | | | | | | | |
| | | | | | investment operations1 | | | | | | | | | | | | | | | | | | | |
| | | | | | | | | Net gains | | | | | | | | | | | | | | | | | | | | | | |
| | | Net asset | | | | | | (losses) on | | | | | | Dividends | | | Net asset | | | | | | | | | Ratio of | | | Ratio of | |
| | | value, | | | Net | | | securities (both | | | Total from | | | (from net | | | value, | | | | | | Net assets, | | | expenses | | | net income | |
| | | beginning | | | investment | | | realized and | | | investment | | | investment | | | end | | | Total | | | end of period | | | to average | | | to average | |
| | | of period | | | income | | | unrealized) | | | operations | | | income) | | | of period | | | return2 | | | (in millions) | | | net assets | | | net assets | |
| Class 529-C: | | | | | | | | | | | | | | | | | | | | | | | | | | | | | | | | | | | | | | | | |
| Year ended 12/31/2016 | | $ | 12.59 | | | $ | .12 | | | $ | .12 | | | $ | .24 | | | $ | (.11 | ) | | $ | 12.72 | | | | 1.88 | % | | $ | 322 | | | | 1.45 | % | | | .95 | % |
| Year ended 12/31/2015 | | | 12.81 | | | | .12 | | | | (.20 | ) | | | (.08 | ) | | | (.14 | ) | | | 12.59 | | | | (.63 | ) | | | 337 | | | | 1.46 | | | | .95 | |
| Year ended 12/31/2014 | | | 12.40 | | | | .16 | | | | .41 | | | | .57 | | | | (.16 | ) | | | 12.81 | | | | 4.64 | | | | 371 | | | | 1.47 | | | | 1.26 | |
| Year ended 12/31/2013 | | | 12.95 | | | | .16 | | | | (.52 | ) | | | (.36 | ) | | | (.19 | ) | | | 12.40 | | | | (2.83 | ) | | | 388 | | | | 1.48 | | | | 1.24 | |
| Year ended 12/31/2012 | | | 12.55 | | | | .19 | | | | .43 | | | | .62 | | | | (.22 | ) | | | 12.95 | | | | 4.97 | | | | 477 | | | | 1.46 | | | | 1.46 | |
| Class 529-E: | | | | | | | | | | | | | | | | | | | | | | | | | | | | | | | | | | | | | | | | |
| Year ended 12/31/2016 | | | 12.59 | | | | .19 | | | | .12 | | | | .31 | | | | (.18 | ) | | | 12.72 | | | | 2.45 | | | | 48 | | | | .90 | | | | 1.50 | |
| Year ended 12/31/2015 | | | 12.81 | | | | .19 | | | | (.20 | ) | | | (.01 | ) | | | (.21 | ) | | | 12.59 | | | | (.08 | ) | | | 48 | | | | .91 | | | | 1.50 | |
| Year ended 12/31/2014 | | | 12.40 | | | | .23 | | | | .41 | | | | .64 | | | | (.23 | ) | | | 12.81 | | | | 5.21 | | | | 51 | | | | .93 | | | | 1.80 | |
| Year ended 12/31/2013 | | | 12.95 | | | | .22 | | | | (.52 | ) | | | (.30 | ) | | | (.25 | ) | | | 12.40 | | | | (2.30 | ) | | | 52 | | | | .93 | | | | 1.79 | |
| Year ended 12/31/2012 | | | 12.55 | | | | .26 | | | | .43 | | | | .69 | | | | (.29 | ) | | | 12.95 | | | | 5.55 | | | | 61 | | | | .93 | | | | 1.99 | |
| Class 529-F-1: | | | | | | | | | | | | | | | | | | | | | | | | | | | | | | | | | | | | | | | | |
| Year ended 12/31/2016 | | | 12.59 | | | | .25 | | | | .12 | | | | .37 | | | | (.24 | ) | | | 12.72 | | | | 2.89 | | | | 77 | | | | .46 | | | | 1.94 | |
| Year ended 12/31/2015 | | | 12.81 | | | | .25 | | | | (.20 | ) | | | .05 | | | | (.27 | ) | | | 12.59 | | | | .36 | | | | 71 | | | | .47 | | | | 1.94 | |
| Year ended 12/31/2014 | | | 12.40 | | | | .28 | | | | .42 | | | | .70 | | | | (.29 | ) | | | 12.81 | | | | 5.68 | | | | 66 | | | | .48 | | | | 2.24 | |
| Year ended 12/31/2013 | | | 12.95 | | | | .28 | | | | (.52 | ) | | | (.24 | ) | | | (.31 | ) | | | 12.40 | | | | (1.86 | ) | | | 62 | | | | .48 | | | | 2.24 | |
| Year ended 12/31/2012 | | | 12.55 | | | | .32 | | | | .43 | | | | .75 | | | | (.35 | ) | | | 12.95 | | | | 6.04 | | | | 73 | | | | .46 | | | | 2.45 | |
| Class R-1: | | | | | | | | | | | | | | | | | | | | | | | | | | | | | | | | | | | | | | | | |
| Year ended 12/31/2016 | | | 12.59 | | | | .13 | | | | .12 | | | | .25 | | | | (.12 | ) | | | 12.72 | | | | 1.97 | | | | 42 | | | | 1.37 | | | | 1.03 | |
| Year ended 12/31/2015 | | | 12.81 | | | | .13 | | | | (.20 | ) | | | (.07 | ) | | | (.15 | ) | | | 12.59 | | | | (.53 | ) | | | 47 | | | | 1.36 | | | | 1.05 | |
| Year ended 12/31/2014 | | | 12.40 | | | | .17 | | | | .42 | | | | .59 | | | | (.18 | ) | | | 12.81 | | | | 4.75 | | | | 55 | | | | 1.36 | | | | 1.37 | |
| Year ended 12/31/2013 | | | 12.95 | | | | .17 | | | | (.52 | ) | | | (.35 | ) | | | (.20 | ) | | | 12.40 | | | | (2.72 | ) | | | 58 | | | | 1.37 | | | | 1.34 | |
| Year ended 12/31/2012 | | | 12.55 | | | | .20 | | | | .43 | | | | .63 | | | | (.23 | ) | | | 12.95 | | | | 5.08 | | | | 81 | | | | 1.36 | | | | 1.57 | |
| Class R-2: | | | | | | | | | | | | | | | | | | | | | | | | | | | | | | | | | | | | | | | | |
| Year ended 12/31/2016 | | | 12.59 | | | | .13 | | | | .12 | | | | .25 | | | | (.12 | ) | | | 12.72 | | | | 1.98 | | | | 514 | | | | 1.35 | | | | 1.05 | |
| Year ended 12/31/2015 | | | 12.81 | | | | .14 | | | | (.20 | ) | | | (.06 | ) | | | (.16 | ) | | | 12.59 | | | | (.51 | ) | | | 545 | | | | 1.34 | | | | 1.07 | |
| Year ended 12/31/2014 | | | 12.40 | | | | .17 | | | | .41 | | | | .58 | | | | (.17 | ) | | | 12.81 | | | | 4.73 | | | | 606 | | | | 1.39 | | | | 1.34 | |
| Year ended 12/31/2013 | | | 12.95 | | | | .17 | | | | (.52 | ) | | | (.35 | ) | | | (.20 | ) | | | 12.40 | | | | (2.70 | ) | | | 636 | | | | 1.35 | | | | 1.37 | |
| Year ended 12/31/2012 | | | 12.55 | | | | .20 | | | | .43 | | | | .63 | | | | (.23 | ) | | | 12.95 | | | | 5.09 | | | | 807 | | | | 1.36 | | | | 1.57 | |
| Class R-2E: | | | | | | | | | | | | | | | | | | | | | | | | | | | | | | | | | | | | | | | | |
| Year ended 12/31/2016 | | | 12.59 | | | | .17 | | | | .12 | | | | .29 | | | | (.16 | ) | | | 12.72 | | | | 2.31 | | | | 9 | | | | 1.05 | | | | 1.36 | |
| Year ended 12/31/2015 | | | 12.81 | | | | .18 | | | | (.19 | ) | | | (.01 | ) | | | (.21 | ) | | | 12.59 | | | | (.07 | ) | | | 1 | | | | .96 | | | | 1.41 | |
| Period from 8/29/2014 to 12/31/20143,4 | | | 12.82 | | | | .07 | | | | .01 | | | | .08 | | | | (.09 | ) | | | 12.81 | | | | .63 | 5,6 | | | — | 7 | | | .25 | 5,6 | | | .52 | 5,6 |
| Class R-3: | | | | | | | | | | | | | | | | | | | | | | | | | | | | | | | | | | | | | | | | |
| Year ended 12/31/2016 | | | 12.59 | | | | .19 | | | | .12 | | | | .31 | | | | (.18 | ) | | | 12.72 | | | | 2.43 | | | | 651 | | | | .91 | | | | 1.49 | |
| Year ended 12/31/2015 | | | 12.81 | | | | .19 | | | | (.20 | ) | | | (.01 | ) | | | (.21 | ) | | | 12.59 | | | | (.08 | ) | | | 662 | | | | .91 | | | | 1.50 | |
| Year ended 12/31/2014 | | | 12.40 | | | | .23 | | | | .41 | | | | .64 | | | | (.23 | ) | | | 12.81 | | | | 5.21 | | | | 731 | | | | .93 | | | | 1.80 | |
| Year ended 12/31/2013 | | | 12.95 | | | | .22 | | | | (.52 | ) | | | (.30 | ) | | | (.25 | ) | | | 12.40 | | | | (2.30 | ) | | | 748 | | | | .92 | | | | 1.79 | |
| Year ended 12/31/2012 | | | 12.55 | | | | .26 | | | | .43 | | | | .69 | | | | (.29 | ) | | | 12.95 | | | | 5.55 | | | | 955 | | | | .92 | | | | 2.00 | |
See page 38 for footnotes.
| The Bond Fund of America | 37 |
Financial highlights (continued)
| | | | | | Income (loss) from | | | | | | | | | | | | | | | | | | | |
| | | | | | investment operations1 | | | | | | | | | | | | | | | | | | | |
| | | | | | | | | Net gains | | | | | | | | | | | | | | | | | | | | | | |
| | | Net asset | | | | | | (losses) on | | | | | | Dividends | | | Net asset | | | | | | | | | Ratio of | | | Ratio of | |
| | | value, | | | Net | | | securities (both | | | Total from | | | (from net | | | value, | | | | | | Net assets, | | | expenses | | | net income | |
| | | beginning | | | investment | | | realized and | | | investment | | | investment | | | end | | | Total | | | end of period | | | to average | | | to average | |
| | | of period | | | income | | | unrealized) | | | operations | | | income) | | | of period | | | return2 | | | (in millions) | | | net assets | | | net assets | |
| Class R-4: | | | | | | | | | | | | | | | | | | | | | | | | | | | | | | | | | | | | | | | | |
| Year ended 12/31/2016 | | $ | 12.59 | | | $ | .23 | | | $ | .12 | | | $ | .35 | | | $ | (.22 | ) | | $ | 12.72 | | | | 2.75 | % | | $ | 556 | | | | .60 | % | | | 1.80 | % |
| Year ended 12/31/2015 | | | 12.81 | | | | .23 | | | | (.20 | ) | | | .03 | | | | (.25 | ) | | | 12.59 | | | | .24 | | | | 512 | | | | .59 | | | | 1.82 | |
| Year ended 12/31/2014 | | | 12.40 | | | | .27 | | | | .41 | | | | .68 | | | | (.27 | ) | | | 12.81 | | | | 5.55 | | | | 480 | | | | .61 | | | | 2.12 | |
| Year ended 12/31/2013 | | | 12.95 | | | | .26 | | | | (.52 | ) | | | (.26 | ) | | | (.29 | ) | | | 12.40 | | | | (1.99 | ) | | | 484 | | | | .60 | | | | 2.11 | |
| Year ended 12/31/2012 | | | 12.55 | | | | .30 | | | | .43 | | | | .73 | | | | (.33 | ) | | | 12.95 | | | | 5.89 | | | | 602 | | | | .60 | | | | 2.33 | |
| Class R-5E: | | | | | | | | | | | | | | | | | | | | | | | | | | | | | | | | | | | | | | | | |
| Year ended 12/31/2016 | | | 12.59 | | | | .25 | | | | .12 | | | | .37 | | | | (.24 | ) | | | 12.72 | | | | 2.89 | | | | — | 7 | | | .47 | | | | 1.91 | |
| Period from 11/20/2015 to 12/31/20153,8 | | | 12.66 | | | | .03 | | | | (.06 | ) | | | (.03 | ) | | | (.04 | ) | | | 12.59 | | | | (.24 | )5 | | | — | 7 | | | .05 | 5 | | | .22 | 5 |
| Class R-5: | | | | | | | | | | | | | | | | | | | | | | | | | | | | | | | | | | | | | | | | |
| Year ended 12/31/2016 | | | 12.59 | | | | .27 | | | | .12 | | | | .39 | | | | (.26 | ) | | | 12.72 | | | | 3.05 | | | | 149 | | | | .31 | | | | 2.13 | |
| Year ended 12/31/2015 | | | 12.81 | | | | .27 | | | | (.20 | ) | | | .07 | | | | (.29 | ) | | | 12.59 | | | | .54 | | | | 206 | | | | .30 | | | | 2.11 | |
| Year ended 12/31/2014 | | | 12.40 | | | | .31 | | | | .41 | | | | .72 | | | | (.31 | ) | | | 12.81 | | | | 5.86 | | | | 207 | | | | .31 | | | | 2.43 | |
| Year ended 12/31/2013 | | | 12.95 | | | | .30 | | | | (.52 | ) | | | (.22 | ) | | | (.33 | ) | | | 12.40 | | | | (1.70 | ) | | | 226 | | | | .31 | | | | 2.41 | |
| Year ended 12/31/2012 | | | 12.55 | | | | .34 | | | | .43 | | | | .77 | | | | (.37 | ) | | | 12.95 | | | | 6.20 | | | | 311 | | | | .31 | | | | 2.63 | |
| Class R-6: | | | | | | | | | | | | | | | | | | | | | | | | | | | | | | | | | | | | | | | | |
| Year ended 12/31/2016 | | | 12.59 | | | | .27 | | | | .12 | | | | .39 | | | | (.26 | ) | | | 12.72 | | | | 3.11 | | | | 3,849 | | | | .25 | | | | 2.15 | |
| Year ended 12/31/2015 | | | 12.81 | | | | .28 | | | | (.20 | ) | | | .08 | | | | (.30 | ) | | | 12.59 | | | | .58 | | | | 2,710 | | | | .25 | | | | 2.16 | |
| Year ended 12/31/2014 | | | 12.40 | | | | .31 | | | | .42 | | | | .73 | | | | (.32 | ) | | | 12.81 | | | | 5.92 | | | | 2,132 | | | | .26 | | | | 2.42 | |
| Year ended 12/31/2013 | | | 12.95 | | | | .31 | | | | (.52 | ) | | | (.21 | ) | | | (.34 | ) | | | 12.40 | | | | (1.65 | ) | | | 1,128 | | | | .26 | | | | 2.51 | |
| Year ended 12/31/2012 | | | 12.55 | | | | .35 | | | | .43 | | | | .78 | | | | (.38 | ) | | | 12.95 | | | | 6.26 | | | | 559 | | | | .25 | | | | 2.61 | |
| | | Year ended December 31 |
| Portfolio turnover rate for all share classes9 | | 2016 | | 2015 | | 2014 | | 2013 | | 2012 |
| Including mortgage dollar roll transactions | | 363% | | 401% | | 348% | | 419% | | 264% |
| Excluding mortgage dollar roll transactions | | 168% | | 151% | | 136% | | Not available |
| 1 | Based on average shares outstanding. |
| 2 | Total returns exclude any applicable sales charges, including contingent deferred sales charges. |
| 3 | Based on operations for the period shown and, accordingly, is not representative of a full year. |
| 4 | Class R-2E shares were offered beginning August 29, 2014. |
| 5 | Not annualized. |
| 6 | All or a significant portion of assets in this class consisted of seed capital invested by CRMC and/or its affiliates. Certain fees (including, where applicable, fees for distribution services) are not charged or accrued on these seed capital assets. If such fees were paid by the fund on seed capital assets, fund expenses would have been higher and net income and total return would have been lower. |
| 7 | Amount less than $1 million. |
| 8 | Class R-5E shares were offered beginning November 20, 2015. |
| 9 | Refer to Note 5 for more information on mortgage dollar rolls. |
See Notes to Financial Statements
| 38 | The Bond Fund of America |
Report of Independent Registered Public Accounting Firm
To the Shareholders and Board of Trustees of The Bond Fund of America:
We have audited the accompanying statement of assets and liabilities of The Bond Fund of America (the “Fund”), including the summary investment portfolio, as of December 31, 2016, and the related statement of operations for the year then ended, the statements of changes in net assets for each of the two years in the period then ended, and the financial highlights for each of the periods presented. These financial statements and financial highlights are the responsibility of the Fund’s management. Our responsibility is to express an opinion on these financial statements and financial highlights based on our audits.
We conducted our audits in accordance with the standards of the Public Company Accounting Oversight Board (United States). Those standards require that we plan and perform the audit to obtain reasonable assurance about whether the financial statements and financial highlights are free of material misstatement. The Fund is not required to have, nor were we engaged to perform, an audit of its internal control over financial reporting. Our audits included consideration of internal control over financial reporting as a basis for designing audit procedures that are appropriate in the circumstances, but not for the purpose of expressing an opinion on the effectiveness of the Fund’s internal control over financial reporting. Accordingly, we express no such opinion. An audit also includes examining, on a test basis, evidence supporting the amounts and disclosures in the financial statements, assessing the accounting principles used and significant estimates made by management, as well as evaluating the overall financial statement presentation. Our procedures included confirmation of securities owned as of December 31, 2016, by correspondence with the custodian, brokers, and agent banks; where replies were not received from brokers and agent banks, we performed other auditing procedures. We believe that our audits provide a reasonable basis for our opinion.
In our opinion, such financial statements and financial highlights referred to above present fairly, in all material respects, the financial position of The Bond Fund of America as of December 31, 2016, the results of its operations for the year then ended, the changes in its net assets for each of the two years in the period then ended, and the financial highlights for each of the periods presented, in conformity with accounting principles generally accepted in the United States of America.
Deloitte & Touche LLP
Costa Mesa, California
February 10, 2017
| The Bond Fund of America | 39 |
As a fund shareholder, you incur two types of costs: (1) transaction costs, such as initial sales charges on purchase payments and contingent deferred sales charges on redemptions (loads), and (2) ongoing costs, including management fees, distribution and service (12b-1) fees, and other expenses. This example is intended to help you understand your ongoing costs (in dollars) of investing in the fund so you can compare these costs with the ongoing costs of investing in other mutual funds. The example is based on an investment of $1,000 invested at the beginning of the period and held for the entire six-month period (July 1, 2016, through December 31, 2016).
Actual expenses:
The first line of each share class in the table on the following page provides information about actual account values and actual expenses. You may use the information in this line, together with the amount you invested, to estimate the expenses that you paid over the period. Simply divide your account value by $1,000 (for example, an $8,600 account value divided by $1,000 = 8.6), then multiply the result by the number in the first line under the heading titled “Expenses paid during period” to estimate the expenses you paid on your account during this period.
Hypothetical example for comparison purposes:
The second line of each share class in the table on the following page provides information about hypothetical account values and hypothetical expenses based on the actual expense ratio for the share class and an assumed rate of return of 5.00% per year before expenses, which is not the actual return of the share class. The hypothetical account values and expenses may not be used to estimate the actual ending account balance or expenses you paid for the period. You may use this information to compare the ongoing costs of investing in the fund and other funds. To do so, compare this 5.00% hypothetical example with the 5.00% hypothetical examples that appear in the shareholder reports of the other funds.
Notes:
Retirement plan participants may be subject to certain fees charged by the plan sponsor, and Class F-1, F-2 and 529-F-1 shareholders may be subject to fees charged by financial intermediaries, typically ranging from 0.75% to 1.50% of assets annually depending on services offered. You can estimate the impact of these fees by adding the amount of the fees to the total estimated expenses you paid on your account during the period as calculated above. In addition, your ending account value would be lower by the amount of these fees.
Note that the expenses shown in the table on the following page are meant to highlight your ongoing costs only and do not reflect any transactional costs, such as sales charges (loads). Therefore, the second line of each share class in the table is useful in comparing ongoing costs only and will not help you determine the relative total costs of owning different funds. In addition, if these transactional costs were included, your costs would have been higher.
| 40 | The Bond Fund of America |
| | | Beginning
account value
7/1/2016 | | | Ending
account value
12/31/2016 | | | Expenses paid
during period* | | | Annualized
expense ratio | |
| Class A - actual return | | $ | 1,000.00 | | | $ | 978.02 | | | $ | 2.99 | | | | .60 | % |
| Class A - assumed 5% return | | | 1,000.00 | | | | 1,022.18 | | | | 3.06 | | | | .60 | |
| Class B - actual return | | | 1,000.00 | | | | 974.29 | | | | 6.77 | | | | 1.36 | |
| Class B - assumed 5% return | | | 1,000.00 | | | | 1,018.35 | | | | 6.92 | | | | 1.36 | |
| Class C - actual return | | | 1,000.00 | | | | 974.16 | | | | 6.92 | | | | 1.39 | |
| Class C - assumed 5% return | | | 1,000.00 | | | | 1,018.20 | | | | 7.07 | | | | 1.39 | |
| Class F-1 - actual return | | | 1,000.00 | | | | 977.86 | | | | 3.19 | | | | .64 | |
| Class F-1 - assumed 5% return | | | 1,000.00 | | | | 1,021.98 | | | | 3.26 | | | | .64 | |
| Class F-2 - actual return | | | 1,000.00 | | | | 979.22 | | | | 1.80 | | | | .36 | |
| Class F-2 - assumed 5% return | | | 1,000.00 | | | | 1,023.39 | | | | 1.84 | | | | .36 | |
| Class 529-A - actual return | | | 1,000.00 | | | | 977.65 | | | | 3.39 | | | | .68 | |
| Class 529-A - assumed 5% return | | | 1,000.00 | | | | 1,021.78 | | | | 3.47 | | | | .68 | |
| Class 529-B - actual return | | | 1,000.00 | | | | 973.74 | | | | 7.36 | | | | 1.48 | |
| Class 529-B - assumed 5% return | | | 1,000.00 | | | | 1,017.74 | | | | 7.53 | | | | 1.48 | |
| Class 529-C - actual return | | | 1,000.00 | | | | 973.93 | | | | 7.11 | | | | 1.43 | |
| Class 529-C - assumed 5% return | | | 1,000.00 | | | | 1,018.00 | | | | 7.27 | | | | 1.43 | |
| Class 529-E - actual return | | | 1,000.00 | | | | 976.65 | | | | 4.38 | | | | .88 | |
| Class 529-E - assumed 5% return | | | 1,000.00 | | | | 1,020.77 | | | | 4.48 | | | | .88 | |
| Class 529-F-1 - actual return | | | 1,000.00 | | | | 978.79 | | | | 2.19 | | | | .44 | |
| Class 529-F-1 - assumed 5% return | | | 1,000.00 | | | | 1,022.99 | | | | 2.24 | | | | .44 | |
| Class R-1 - actual return | | | 1,000.00 | | | | 974.25 | | | | 6.82 | | | | 1.37 | |
| Class R-1 - assumed 5% return | | | 1,000.00 | | | | 1,018.30 | | | | 6.97 | | | | 1.37 | |
| Class R-2 - actual return | | | 1,000.00 | | | | 974.21 | | | | 6.82 | | | | 1.37 | |
| Class R-2 - assumed 5% return | | | 1,000.00 | | | | 1,018.30 | | | | 6.97 | | | | 1.37 | |
| Class R-2E - actual return | | | 1,000.00 | | | | 975.81 | | | | 5.23 | | | | 1.05 | |
| Class R-2E - assumed 5% return | | | 1,000.00 | | | | 1,019.91 | | | | 5.35 | | | | 1.05 | |
| Class R-3 - actual return | | | 1,000.00 | | | | 976.48 | | | | 4.58 | | | | .92 | |
| Class R-3 - assumed 5% return | | | 1,000.00 | | | | 1,020.57 | | | | 4.69 | | | | .92 | |
| Class R-4 - actual return | | | 1,000.00 | | | | 978.03 | | | | 2.99 | | | | .60 | |
| Class R-4 - assumed 5% return | | | 1,000.00 | | | | 1,022.18 | | | | 3.06 | | | | .60 | |
| Class R-5E - actual return | | | 1,000.00 | | | | 978.77 | | | | 2.34 | | | | .47 | |
| Class R-5E - assumed 5% return | | | 1,000.00 | | | | 1,022.84 | | | | 2.40 | | | | .47 | |
| Class R-5 - actual return | | | 1,000.00 | | | | 979.45 | | | | 1.55 | | | | .31 | |
| Class R-5 - assumed 5% return | | | 1,000.00 | | | | 1,023.64 | | | | 1.58 | | | | .31 | |
| Class R-6 - actual return | | | 1,000.00 | | | | 979.77 | | | | 1.25 | | | | .25 | |
| Class R-6 - assumed 5% return | | | 1,000.00 | | | | 1,023.95 | | | | 1.28 | | | | .25 | |
| * | The “expenses paid during period” are equal to the “annualized expense ratio,” multiplied by the average account value over the period, multiplied by the number of days in the period, and divided by 365 (to reflect the one-half year period). |
| The Bond Fund of America | 41 |
We are required to advise you of the federal tax status of certain distributions received by shareholders during the fiscal year. The fund hereby designates the following amounts for the fund’s fiscal year ended December 31, 2016:
| Qualified dividend income | $ | 2,878,000 |
| Corporate dividends received deduction | $ | 1,755,000 |
| U.S. government income that may be exempt from state taxation | $ | 221,250,000 |
Individual shareholders should refer to their Form 1099 or other tax information, which was mailed in January 2017, to determine the calendar year amounts to be included on their 2016 tax returns. Shareholders should consult their tax advisors.
| 42 | The Bond Fund of America |
Board of trustees and other officers
Independent trustees1
| Name and year of birth | | Year first
elected a
trustee of
the fund2 | | Principal occupation(s) during past five years | | Number of
portfolios in fund
complex overseen
by trustee | | Other directorships3 held
by trustee |
| William H. Baribault, 1945 | | 2010 | | CEO and President, Richard Nixon Foundation; Chairman of the Board and CEO, Oakwood Enterprises (private investment and consulting) | | 81 | | General Finance
Corporation |
| James G. Ellis, 1947 | | 2006 | | Dean and Professor of Marketing, Marshall School of Business, University of Southern California | | 81 | | Mercury General Corporation |
| Leonard R. Fuller, 1946 | | 1994 | | Private investor; former President and CEO, Fuller Consulting (financial management consulting) | | 81 | | None |
R. Clark Hooper, 1946
Chairman of the Board (Independent and Non-Executive) | | 2005 | | Private investor | | 81 | | None |
| Merit E. Janow, 1958 | | 2010 | | Dean and Professor, Columbia University, School of International and Public Affairs | | 80 | | MasterCard Incorporated; Trimble Inc. |
| Laurel B. Mitchell, PhD, 1955 | | 2009 | | Distinguished Professor of Accounting, University of Redlands; former Director, Accounting Program, University of Redlands | | 77 | | None |
| Frank M. Sanchez, 1943 | | 1999 | | Principal, The Sanchez Family Corporation dba McDonald’s Restaurants (McDonald’s licensee) | | 77 | | None |
| Margaret Spellings, 1957 | | 2010 | | President, The University of North Carolina; former President, George W. Bush Foundation; former President and CEO, Margaret Spellings & Company (public policy and strategic consulting); former President, U.S. Chamber Foundation and Senior Advisor to the President and CEO, U.S. Chamber of Commerce | | 82 | | ClubCorp Holdings, Inc. |
| Steadman Upham, PhD, 1949 | | 2007 | | President Emeritus and University Professor, The University of Tulsa | | 80 | | None |
Interested trustee4,5
Name, year of birth and position
with fund | | Year first
elected a
trustee or
officer of
the fund2 | | Principal occupation(s) during past five years and
positions held with affiliated entities or the principal
underwriter of the fund | | Number of
portfolios in fund
complex overseen
by trustee | | Other directorships3
held by trustee |
John H. Smet, 1956
Vice Chairman of the Board and President | | 1994 | | Partner — Capital Fixed Income Investors, Capital Research and Management Company; Director, Capital Research and Management Company | | 23 | | None |
| Michael C. Gitlin, 1970 | | 2015 | | Partner — Capital Fixed Income Investors, Capital Research and Management Company; Director, The Capital Group Companies, Inc.;6 served as Head of Fixed Income at a large investment management firm prior to joining Capital Research and Management Company in 2015 | | 19 | | None |
The fund’s statement of additional information includes further details about fund trustees and is available without charge upon request by calling American Funds Service Company at (800) 421-4225 or by visiting the American Funds website at americanfunds.com. The address for all trustees and officers of the fund is 333 South Hope Street, Los Angeles, CA 90071, Attention: Secretary.
See page 44 for footnotes.
| The Bond Fund of America | 43 |
Other officers5
Name, year of birth and
position with fund | | Year first elected
an officer of the
fund2 | | Principal occupation(s) during past five years and positions held with affiliated entities or the principal
underwriter of the fund |
Andrew F. Barth, 1961
Senior Vice President | | 2011 | | Partner — Capital Fixed Income Investors, Capital Bank and Trust Company;6
Director, Capital Group International, Inc.;6 Chairman of the Board, Capital Guardian Trust Company;6
Partner — Capital Fixed Income Investors, Capital Guardian Trust Company;6
Partner — Capital Fixed Income Investors, Capital Research and Management Company |
David J. Betanzos, 1974
Senior Vice President | | 2017 | | Partner — Capital Fixed Income Investors, Capital Research and Management Company |
David A. Hoag, 1965
Senior Vice President | | 2015 | | Partner — Capital Fixed Income Investors, Capital Research and Management Company;
Partner — Capital Fixed Income Investors, Capital Bank and Trust Company;6
Director, The Capital Group Companies, Inc.6 |
Fergus N. MacDonald, 1969
Senior Vice President | | 2015 | | Partner — Capital Fixed Income Investors, Capital Research and Management Company |
Robert H. Neithart, 1965
Senior Vice President | | 2011 | | Partner — Capital Fixed Income Investors, Capital Research and Management Company; Chairman of the Board, Capital Strategy Research, Inc.6 |
Kristine M. Nishiyama, 1970
Senior Vice President | | 2003 | | Senior Vice President and Senior Counsel — Fund Business Management Group, Capital Research and Management Company; Senior Vice President and General Counsel, Capital Bank and Trust Company6 |
Pramod Atluri, 1976
Vice President | | 2017 | | Vice President — Capital Fixed Income Investors, Capital Research and Management Company;
Vice President — Capital Fixed Income Investors, Capital Bank and Trust Company6 |
Steven I. Koszalka, 1964
Secretary | | 2010 | | Vice President — Fund Business Management Group, Capital Research and Management Company |
Brian C. Janssen, 1972
Treasurer | | 2011 | | Vice President — Investment Operations, Capital Research and Management Company |
Jane Y. Chung, 1974
Assistant Secretary | | 2014 | | Associate — Fund Business Management Group, Capital Research and Management Company |
Dori Laskin, 1951
Assistant Treasurer | | 2010 | | Vice President — Investment Operations, Capital Research and Management Company |
Gregory F. Niland, 1971
Assistant Treasurer | | 2015 | | Vice President — Investment Operations, Capital Research and Management Company |
| 1 | The term independent trustee refers to a trustee who is not an “interested person” of the fund within the meaning of the Investment Company Act of 1940. |
| 2 | Trustees and officers of the fund serve until their resignation, removal or retirement. |
| 3 | This includes all directorships/trusteeships (other than those in the American Funds or other funds managed by Capital Research and Management Company or its affiliates) that are held by each trustee as a trustee or director of a public company or a registered investment company. |
| 4 | The term interested trustee refers to a trustee who is an “interested person” within the meaning of the Investment Company Act of 1940, on the basis of their affiliation with the fund’s investment adviser, Capital Research and Management Company, or affiliated entities (including the fund’s principal underwriter). |
| 5 | All of the trustees and/or officers listed are officers and/or directors/trustees of one or more of the other funds for which Capital Research and Management Company serves as investment adviser. |
| 6 | Company affiliated with Capital Research and Management Company. |
| 44 | The Bond Fund of America |
Offices of the fund and of the investment adviser
Capital Research and Management Company
333 South Hope Street
Los Angeles, CA 90071-1406
6455 Irvine Center Drive
Irvine, CA 92618-4518
Transfer agent for shareholder accounts
American Funds Service Company
(Write to the address near you.)
P.O. Box 6007
Indianapolis, IN 46206-6007
P.O. Box 2280
Norfolk, VA 23501-2280
Custodian of assets
JPMorgan Chase Bank
270 Park Avenue
New York, NY 10017-2070
Counsel
Morgan, Lewis & Bockius, LLP
300 South Grand Avenue, 22nd Floor
Los Angeles, CA 90071-3132
Independent registered public accounting firm
Deloitte & Touche LLP
695 Town Center Drive
Suite 1200
Costa Mesa, CA 92626-7188
Principal underwriter
American Funds Distributors, Inc.
333 South Hope Street
Los Angeles, CA 90071-1406
Investors should carefully consider investment objectives, risks, charges and expenses. This and other important information is contained in the fund prospectus and summary prospectus, which can be obtained from your financial professional and should be read carefully before investing. You may also call American Funds Service Company (AFS) at (800) 421-4225 or visit the American Funds website at americanfunds.com.
“American Funds Proxy Voting Procedures and Principles” — which describes how we vote proxies relating to portfolio securities — is available on the American Funds website or upon request by calling AFS. The fund files its proxy voting record with the U.S. Securities and Exchange Commission (SEC) for the 12 months ended June 30 by August 31. The proxy voting record is available free of charge on the SEC website at sec.gov and on the American Funds website.
A complete December 31, 2016, portfolio of The Bond Fund of America’s investments is available free of charge by calling AFS or visiting the SEC website (where it is part of Form N-CSR).
The Bond Fund of America files a complete list of its portfolio holdings with the SEC for the first and third quarters of each fiscal year on Form N-Q. This filing is available free of charge on the SEC website. You may also review or, for a fee, copy this filing at the SEC’s Public Reference Room in Washington, D.C. Additional information regarding the operation of the Public Reference Room may be obtained by calling the SEC’s Office of Investor Education and Advocacy at (800) SEC-0330. Additionally, the list of portfolio holdings is available by calling AFS.
This report is for the information of shareholders of The Bond Fund of America, but it also may be used as sales literature when preceded or accompanied by the current prospectus or summary prospectus, which gives details about charges, expenses, investment objectives and operating policies of the fund. If used as sales material after March 31, 2017, this report must be accompanied by an American Funds statistical update for the most recently completed calendar quarter.
Bloomberg® is a trademark of Bloomberg Finance L.P. (collectively with its affiliates, “Bloomberg”). Barclays® is a trademark of Barclays Bank Plc (collectively with its affiliates, “Barclays”), used under license. Neither Bloomberg nor Barclays approves or endorses this material, guarantees the accuracy or completeness of any information herein and, to the maximum extent allowed by law, neither shall have any liability or responsibility for injury or damages arising in connection therewith.
American Funds from Capital Group
The Capital AdvantageSM
Since 1931, American Funds, part of Capital Group, has helped investors pursue long-term investment success. Our consistent approach — in combination with The Capital SystemSM — has resulted in a superior long-term track record.
| | Aligned with investor success |
| | We base our decisions on a long-term perspective, which we believe aligns our goals with the interests of our clients. Our portfolio managers average 27 years of investment experience, including 22 years at our company, reflecting a career commitment to our long-term approach.1 |
| | |
| | The Capital SystemSM |
| | The Capital System combines individual accountability with teamwork. Funds using The Capital System are divided into portions that are managed independently by investment professionals with diverse backgrounds, ages and investment approaches. An extensive global research effort is the backbone of our system. |
| | |
| | American Funds’ superior long-term track record |
| | Equity funds have beaten their Lipper peer indexes in 91% of 10-year periods and 95% of 20-year periods. Fixed income funds have beaten their Lipper indexes in 58% of 10-year periods and 58% of 20-year periods.2 Fund management fees have been among the lowest in the industry.3 |
| | |
| | 1 | Portfolio manager experience as of December 31, 2015. |
| | 2 | Based on Class A share results for rolling periods through December 31, 2015. Periods covered are the shorter of the fund’s lifetime or since the comparable Lipper index inception date (except Capital Income Builder and SMALLCAP World Fund, for which the Lipper average was used). Expenses differ for each share class, so results will vary. |
| | 3 | On average, our management fees were in the lowest quintile 68% of the time, based on the 20-year period ended December 31, 2015, versus comparable Lipper categories, excluding funds of funds. |

ITEM 2 – Code of Ethics
The Registrant has adopted a Code of Ethics that applies to its Principal Executive Officer and Principal Financial Officer. The Registrant undertakes to provide to any person without charge, upon request, a copy of the Code of Ethics. Such request can be made to American Funds Service Company at 800/421-9225 or to the Secretary of the Registrant, 333 South Hope Street, Los Angeles, California 90071.
ITEM 3 – Audit Committee Financial Expert
The Registrant’s board has determined that Laurel B. Mitchell, a member of the Registrant’s audit committee, is an “audit committee financial expert” and "independent," as such terms are defined in this Item. This designation will not increase the designee’s duties, obligations or liability as compared to his or her duties, obligations and liability as a member of the audit committee and of the board, nor will it reduce the responsibility of the other audit committee members. There may be other individuals who, through education or experience, would qualify as "audit committee financial experts" if the board had designated them as such. Most importantly, the board believes each member of the audit committee contributes significantly to the effective oversight of the Registrant’s financial statements and condition.
| ITEM 4 – Principal Accountant Fees and Services | |
| | | |
| Registrant: | |
| a) Audit Fees: | |
| | 2015 | $195,000 |
| | 2016 | $177,000 |
| | | |
| b) Audit-Related Fees: | |
| | 2015 | $9,000 |
| | 2016 | $9,000 |
| | | |
| c) Tax Fees: | |
| | 2015 | $8,000 |
| | 2016 | $8,000 |
| | The tax fees consist of professional services relating to the preparation of the Registrant’s tax returns. |
| | | |
| d) All Other Fees: | |
| | 2015 | None |
| | 2016 | None |
| | Adviser and affiliates (includes only fees for non-audit services billed to the adviser and affiliates for engagements that relate directly to the operations and financial reporting of the Registrant and were subject to the pre-approval policies described below): |
| a) Audit Fees: | |
| | Not Applicable | |
| | | |
| b) Audit-Related Fees: | |
| | 2015 | $1,183,000 |
| | 2016 | $1,098,000 |
| | The audit-related fees consist of assurance and related services relating to the examination of the Registrant’s transfer agent, principal underwriter and investment adviser conducted in accordance with Statement on Standards for Attestation Engagements Number 16 issued by the American Institute of Certified Public Accountants. |
| | | |
| c) Tax Fees: | |
| | 2015 | None |
| | 2016 | None |
| | The tax fees consist of consulting services relating to the Registrant’s investments. |
| | | |
| | | |
| d) All Other Fees: | |
| | 2015 | $5,000 |
| | 2016 | None |
| | The other fees consist of subscription services related to an accounting research tool. |
| | | |
| All audit and permissible non-audit services that the Registrant’s audit committee considers compatible with maintaining the independent registered public accounting firm’s independence are required to be pre-approved by the committee. The pre-approval requirement will extend to all non-audit services provided to the Registrant, the investment adviser, and any entity controlling, controlled by, or under common control with the investment adviser that provides ongoing services to the Registrant, if the engagement relates directly to the operations and financial reporting of the Registrant. The committee will not delegate its responsibility to pre-approve these services to the investment adviser. The committee may delegate to one or more committee members the authority to review and pre-approve audit and permissible non-audit services. Actions taken under any such delegation will be reported to the full committee at its next meeting. The pre-approval requirement is waived with respect to non-audit services if certain conditions are met. The pre-approval requirement was not waived for any of the non-audit services listed above provided to the Registrant, adviser and affiliates. |
| | | |
| Aggregate non-audit fees paid to the Registrant’s auditors, including fees for all services billed to the Registrant, adviser and affiliates that provide ongoing services to the Registrant, were $1,475,000 for fiscal year 2015 and $1,262,000 for fiscal year 2016. The non-audit services represented by these amounts were brought to the attention of the committee and considered to be compatible with maintaining the auditors’ independence. |
ITEM 5 – Audit Committee of Listed Registrants
Not applicable to this Registrant, insofar as the Registrant is not a listed issuer as defined in Rule 10A-3 under the Securities Exchange Act of 1934.
ITEM 6 – Schedule of Investments
The Bond Fund of America®
Investment portfolio
December 31, 2016
Bonds, notes & other debt instruments 93.91%
U.S. Treasury bonds & notes 35.48%
U.S. Treasury 29.16% | Principal amount
(000) | Value
(000) |
| U.S. Treasury 0.75% 2018 | $210,300 | $209,053 |
| U.S. Treasury 0.875% 2018 | 8,975 | 8,956 |
| U.S. Treasury 1.00% 2018 | 46,500 | 46,353 |
| U.S. Treasury 1.50% 2018 | 53,000 | 53,338 |
| U.S. Treasury 1.50% 2019 | 50,725 | 51,007 |
| U.S. Treasury 1.625% 2019 | 207,500 | 208,538 |
| U.S. Treasury 1.625% 2019 | 157,950 | 159,060 |
| U.S. Treasury 1.625% 2019 | 124,400 | 125,265 |
| U.S. Treasury 1.125% 2020 | 53,700 | 53,010 |
| U.S. Treasury 1.25% 20201 | 296,675 | 294,311 |
| U.S. Treasury 1.25% 2020 | 109,700 | 108,895 |
| U.S. Treasury 1.375% 2020 | 34,759 | 34,333 |
| U.S. Treasury 1.375% 2020 | 32,250 | 32,048 |
| U.S. Treasury 1.50% 2020 | 59,650 | 59,470 |
| U.S. Treasury 1.625% 20201 | 374,500 | 374,268 |
| U.S. Treasury 1.75% 2020 | 206,610 | 206,563 |
| U.S. Treasury 1.75% 2020 | 142,270 | 142,570 |
| U.S. Treasury 2.00% 2020 | 137,810 | 139,247 |
| U.S. Treasury 3.625% 2020 | 20,000 | 21,284 |
| U.S. Treasury 1.125% 20211 | 179,375 | 174,555 |
| U.S. Treasury 1.125% 2021 | 82,120 | 79,352 |
| U.S. Treasury 1.25% 2021 | 64,200 | 62,259 |
| U.S. Treasury 1.25% 2021 | 11,250 | 10,991 |
| U.S. Treasury 1.375% 20211 | 417,550 | 410,944 |
| U.S. Treasury 1.375% 2021 | 37,369 | 36,661 |
| U.S. Treasury 1.375% 2021 | 28,228 | 27,672 |
| U.S. Treasury 1.75% 2021 | 370,678 | 367,957 |
| U.S. Treasury 2.00% 2021 | 238,000 | 239,468 |
| U.S. Treasury 2.00% 2021 | 115,570 | 115,498 |
| U.S. Treasury 2.00% 2021 | 102,120 | 102,535 |
| U.S. Treasury 2.00% 2021 | 44,250 | 44,380 |
| U.S. Treasury 2.125% 2021 | 355,000 | 358,049 |
| U.S. Treasury 2.125% 2021 | 288,490 | 291,060 |
| U.S. Treasury 2.125% 2021 | 234,650 | 236,905 |
| U.S. Treasury 2.25% 2021 | 309,300 | 314,954 |
| U.S. Treasury 2.25% 2021 | 153,829 | 156,257 |
| U.S. Treasury 3.625% 2021 | 10,900 | 11,702 |
| U.S. Treasury 8.00% 2021 | 250 | 320 |
| U.S. Treasury 1.625% 2022 | 25,768 | 25,087 |
| U.S. Treasury 1.75% 2022 | 192,847 | 189,208 |
| U.S. Treasury 2.00% 2022 | 73,300 | 72,830 |
| U.S. Treasury 2.125% 2022 | 350,830 | 350,707 |
| U.S. Treasury 2.125% 2022 | 85,340 | 85,646 |
| U.S. Treasury 1.375% 2023 | 117,500 | 111,308 |
| U.S. Treasury 1.50% 2023 | 457,870 | 440,485 |
| U.S. Treasury 1.75% 2023 | 41,975 | 40,895 |
The Bond Fund of America — Page 1 of 43
Bonds, notes & other debt instruments
U.S. Treasury bonds & notes (continued)
U.S. Treasury (continued) | Principal amount
(000) | Value
(000) |
| U.S. Treasury 2.125% 2023 | $182,663 | $181,521 |
| U.S. Treasury 2.25% 2023 | 8,120 | 8,128 |
| U.S. Treasury 2.00% 2025 | 79,160 | 77,069 |
| U.S. Treasury 2.00% 2025 | 57,850 | 56,056 |
| U.S. Treasury 2.125% 2025 | 165,750 | 162,551 |
| U.S. Treasury 6.875% 2025 | 70,145 | 94,838 |
| U.S. Treasury 1.625% 2026 | 147,968 | 138,286 |
| U.S. Treasury 1.625% 2026 | 2,950 | 2,751 |
| U.S. Treasury 2.00% 2026 | 571,709 | 550,269 |
| U.S. Treasury 4.50% 2036 | 84,207 | 106,424 |
| U.S. Treasury 2.875% 2043 | 3,750 | 3,616 |
| U.S. Treasury 2.875% 2045 | 121,150 | 116,250 |
| U.S. Treasury 3.00% 2045 | 179,525 | 176,584 |
| U.S. Treasury 3.00% 2045 | 36,010 | 35,433 |
| U.S. Treasury 2.25% 2046 | 294,712 | 247,087 |
| U.S. Treasury 2.50% 2046 | 602,245 | 533,631 |
| U.S. Treasury 2.50% 2046 | 52,800 | 46,784 |
| U.S. Treasury 2.875% 2046 | 101,750 | 97,969 |
| | | 9,320,501 |
| U.S. Treasury inflation-protected securities 6.29% | | |
| U.S. Treasury Inflation-Protected Security 0.125% 20172 | 127,708 | 128,003 |
| U.S. Treasury Inflation-Protected Security 2.375% 20172 | 23,972 | 23,976 |
| U.S. Treasury Inflation-Protected Security 0.125% 20212 | 67,312 | 67,747 |
| U.S. Treasury Inflation-Protected Security 0.125% 20222 | 18,100 | 18,164 |
| U.S. Treasury Inflation-Protected Security 0.125% 20232 | 34,705 | 34,502 |
| U.S. Treasury Inflation-Protected Security 0.375% 20232 | 13,762 | 13,907 |
| U.S. Treasury Inflation-Protected Security 0.125% 20242 | 101,240 | 99,605 |
| U.S. Treasury Inflation-Protected Security 0.625% 20242 | 127,448 | 129,858 |
| U.S. Treasury Inflation-Protected Security 0.25% 20252 | 87,817 | 86,465 |
| U.S. Treasury Inflation-Protected Security 0.375% 20252 | 308,799 | 307,421 |
| U.S. Treasury Inflation-Protected Security 0.125% 20262 | 144,204 | 139,581 |
| U.S. Treasury Inflation-Protected Security 0.625% 20262 | 201,352 | 203,281 |
| U.S. Treasury Inflation-Protected Security 2.00% 20262 | 55,718 | 62,804 |
| U.S. Treasury Inflation-Protected Security 1.75% 20282 | 4,846 | 5,415 |
| U.S. Treasury Inflation-Protected Security 2.125% 20412 | 3,775 | 4,711 |
| U.S. Treasury Inflation-Protected Security 0.75% 20422 | 229,090 | 217,542 |
| U.S. Treasury Inflation-Protected Security 0.625% 20432 | 69,101 | 63,509 |
| U.S. Treasury Inflation-Protected Security 1.375% 20442 | 117,235 | 128,274 |
| U.S. Treasury Inflation-Protected Security 1.00% 20462 | 272,579 | 274,316 |
| | | 2,009,081 |
| Federal agency bonds & notes 0.03% | | |
| Japan Finance Organization for Municipalities 2.125% 20193 | 10,000 | 9,987 |
| Total U.S. Treasury bonds & notes | | 11,339,569 |
Corporate bonds & notes 29.82%
Financials 6.21% | | |
| ACE INA Holdings Inc. 2.30% 2020 | 15,615 | 15,608 |
| ACE INA Holdings Inc. 2.875% 2022 | 3,270 | 3,296 |
| ACE INA Holdings Inc. 3.35% 2026 | 1,485 | 1,504 |
| ACE INA Holdings Inc. 4.35% 2045 | 1,715 | 1,812 |
| Allstate Corp. 3.28% 2026 | 5,095 | 5,115 |
| Allstate Corp. 4.20% 2046 | 1,925 | 1,969 |
The Bond Fund of America — Page 2 of 43
Bonds, notes & other debt instruments
Corporate bonds & notes (continued)
Financials (continued) | Principal amount
(000) | Value
(000) |
| American Express Co. 6.15% 2017 | $150 | $154 |
| American Express Co. 1.55% 2018 | 3,000 | 2,995 |
| Assicurazioni Generali SPA 7.75% 2042 | €3,500 | 4,398 |
| Assicurazioni Generali SPA 10.125% 2042 | 4,200 | 5,765 |
| Australia & New Zealand Banking Group Ltd. 2.55% 2021 | $31,600 | 31,337 |
| AXA SA 8.60% 2030 | 6,715 | 9,250 |
| Banco Nacional de Comercio Exterior SNC 3.80% 20263 | 1,850 | 1,737 |
| Banco Santander, SA 2.70% 2019 | 7,500 | 7,496 |
| Bank of America Corp. 2.625% 2020 | 43,625 | 43,656 |
| Bank of America Corp. 5.625% 2020 | 10,500 | 11,547 |
| Bank of America Corp. 2.625% 2021 | 12,000 | 11,919 |
| Bank of America Corp. 2.503% 2022 | 16,000 | 15,477 |
| Bank of America Corp. 3.248% 2027 | 41,746 | 39,879 |
| Bank of America Corp., Series L, 2.25% 2020 | 13,500 | 13,423 |
| Bank of New York Mellon Corp. 2.20% 2023 | 7,500 | 7,154 |
| Barclays Bank PLC 3.25% 2021 | 11,105 | 11,147 |
| Barclays Bank PLC 3.65% 2025 | 13,500 | 13,101 |
| BB&T Corp. 2.45% 2020 | 13,500 | 13,603 |
| BBVA Bancomer SA 6.50% 20213 | 1,000 | 1,082 |
| Berkshire Hathaway Finance Corp. 1.15% 2018 | 3,250 | 3,234 |
| Berkshire Hathaway Inc. 2.00% 2018 | 5,210 | 5,247 |
| Berkshire Hathaway Inc. 2.20% 2021 | 1,115 | 1,112 |
| BPCE SA group 2.75% 2021 | 39,325 | 38,937 |
| BPCE SA group 5.70% 20233 | 23,630 | 24,902 |
| BPCE SA group 5.15% 20243 | 17,845 | 18,149 |
| BPCE SA group 4.50% 20253 | 8,845 | 8,621 |
| BPCE SA group 4.875% 20263 | 9,000 | 8,998 |
| Capital One Financial Corp. 1.85% 2019 | 6,000 | 5,933 |
| Charles Schwab Corp. 2.20% 2018 | 1,390 | 1,401 |
| Charles Schwab Corp, Series E, junior subordinated 4.625% 2049 | 22,500 | 21,254 |
| Citigroup Inc. 1.70% 2018 | 15,000 | 14,970 |
| Citigroup Inc. 2.15% 2018 | 7,250 | 7,276 |
| Citigroup Inc. 2.05% 2019 | 13,500 | 13,451 |
| Citigroup Inc. 2.55% 2019 | 15,080 | 15,205 |
| Citigroup Inc. 8.50% 2019 | 5,695 | 6,498 |
| Citigroup Inc. 2.021% 20214 | 2,905 | 2,918 |
| Citigroup Inc. 2.35% 2021 | 24,475 | 23,945 |
| Citigroup Inc. 2.70% 2021 | 13,500 | 13,471 |
| Citigroup Inc. 2.90% 2021 | 77,400 | 77,204 |
| Citigroup Inc. 3.20% 2026 | 31,340 | 29,985 |
| CNA Financial Corp. 3.95% 2024 | 6,705 | 6,804 |
| Credit Agricole SA 4.375% 20253 | 13,745 | 13,525 |
| Credit Suisse Group AG 3.45% 2021 | 11,250 | 11,323 |
| Credit Suisse Group AG 3.80% 2022 | 15,903 | 16,047 |
| Credit Suisse Group AG 3.80% 2023 | 22,900 | 22,882 |
| Credit Suisse Group AG 3.75% 2025 | 7,600 | 7,488 |
| Credit Suisse Group AG 4.55% 2026 | 20,250 | 21,042 |
| Danske Bank AS 1.65% 20193 | 22,000 | 21,676 |
| Danske Bank AS 2.00% 20213 | 31,955 | 31,062 |
| Deutsche Bank AG 2.50% 2019 | 10,000 | 9,921 |
| Deutsche Bank AG 2.85% 2019 | 25,500 | 25,396 |
| Discover Financial Services 2.00% 2018 | 5,200 | 5,200 |
| Discover Financial Services 10.25% 2019 | 3,150 | 3,617 |
| DNB ASA 2.375% 20213 | 27,000 | 26,721 |
The Bond Fund of America — Page 3 of 43
Bonds, notes & other debt instruments
Corporate bonds & notes (continued)
Financials (continued) | Principal amount
(000) | Value
(000) |
| Goldman Sachs Group, Inc. 2.00% 2019 | $5,325 | $5,305 |
| Goldman Sachs Group, Inc. 2.30% 2019 | 42,890 | 42,880 |
| Goldman Sachs Group, Inc. 2.55% 2019 | 20,200 | 20,352 |
| Goldman Sachs Group, Inc. 2.60% 2020 | 11,060 | 11,073 |
| Goldman Sachs Group, Inc. 2.241% 20214 | 11,850 | 11,921 |
| Goldman Sachs Group, Inc. 2.35% 2021 | 22,815 | 22,170 |
| Goldman Sachs Group, Inc. 2.625% 2021 | 12,500 | 12,411 |
| Goldman Sachs Group, Inc. 2.875% 2021 | 22,151 | 22,256 |
| Goldman Sachs Group, Inc. 3.75% 2025 | 7,654 | 7,677 |
| Goldman Sachs Group, Inc. 3.50% 2026 | 25,525 | 25,053 |
| HSBC Bank PLC 1.50% 20183 | 12,650 | 12,580 |
| HSBC Holdings PLC 4.125% 20203 | 9,453 | 9,919 |
| HSBC Holdings PLC 2.65% 2022 | 27,500 | 26,901 |
| HSBC Holdings PLC 4.375% 2026 | 6,675 | 6,728 |
| HSBK (Europe) BV 7.25% 20213 | 3,710 | 3,989 |
| Icahn Enterprises Finance Corp. 3.50% 2017 | 2,100 | 2,105 |
| Intercontinentalexchange, Inc. 2.50% 2018 | 1,735 | 1,759 |
| Intesa Sanpaolo SpA 3.875% 2019 | 7,000 | 7,126 |
| Intesa Sanpaolo SpA 5.017% 20243 | 29,060 | 26,868 |
| Intesa Sanpaolo SpA 5.71% 20263 | 9,000 | 8,592 |
| iStar Financial Inc. 4.00% 2017 | 775 | 781 |
| iStar Financial Inc., Series B, 9.00% 2017 | 3,175 | 3,274 |
| JPMorgan Chase & Co. 2.25% 2020 | 21,945 | 21,889 |
| JPMorgan Chase & Co. 2.55% 2020 | 30,730 | 30,700 |
| JPMorgan Chase & Co. 2.295% 2021 | 3,100 | 3,042 |
| JPMorgan Chase & Co. 2.40% 2021 | 17,500 | 17,335 |
| JPMorgan Chase & Co. 2.55% 2021 | 26,400 | 26,307 |
| JPMorgan Chase & Co. 2.70% 2023 | 20,975 | 20,517 |
| Keybank National Association 2.50% 2019 | 13,500 | 13,639 |
| Leucadia National Corp. 5.50% 2023 | 4,695 | 4,974 |
| Lloyds Banking Group PLC 3.10% 2021 | 4,470 | 4,526 |
| Lloyds Banking Group PLC 4.50% 2024 | 17,200 | 17,468 |
| Lloyds Banking Group PLC 4.582% 2025 | 13,143 | 13,213 |
| MetLife Global Funding I 2.30% 20193 | 8,770 | 8,831 |
| MetLife Global Funding I 2.00% 20203 | 12,825 | 12,679 |
| MetLife Global Funding I 2.50% 20203 | 7,500 | 7,501 |
| MetLife Global Funding I 1.95% 20213 | 8,000 | 7,775 |
| Metlife, Inc. 3.60% 2024 | 6,190 | 6,353 |
| MetLife, Inc. 5.25% 2049 | 7,755 | 7,871 |
| Metropolitan Life Global Funding I, 1.75% 20183 | 7,640 | 7,643 |
| Metropolitan Life Global Funding I, 3.45% 20263 | 26,325 | 26,560 |
| Mitsubishi UFJ Financial Group, Inc. 2.19% 2021 | 16,500 | 16,041 |
| Mizuho Financial Group, Inc. 2.632% 20213 | 3,100 | 3,067 |
| Morgan Stanley 2.125% 2018 | 3,370 | 3,384 |
| Morgan Stanley 2.80% 2020 | 8,000 | 8,066 |
| Morgan Stanley 2.50% 2021 | 51,900 | 51,343 |
| Morgan Stanley 2.625% 2021 | 69,500 | 68,675 |
| Morgan Stanley 3.125% 2026 | 14,510 | 13,870 |
| Navient Corp. 4.875% 2019 | 1,325 | 1,375 |
| Navient Corp. 5.50% 2023 | 155 | 151 |
| New York Life Global Funding 1.50% 20193 | 2,445 | 2,412 |
| New York Life Global Funding 2.10% 20193 | 17,000 | 17,072 |
| New York Life Global Funding 1.95% 20203 | 2,190 | 2,174 |
| New York Life Global Funding 1.70% 20213 | 50,000 | 48,203 |
The Bond Fund of America — Page 4 of 43
Bonds, notes & other debt instruments
Corporate bonds & notes (continued)
Financials (continued) | Principal amount
(000) | Value
(000) |
| NN Group NV, 4.50% 2049 | €9,850 | $10,388 |
| Nordea Bank AB 2.50% 20203 | $2,745 | 2,746 |
| Northern Trust Corp. 5.85% 20173 | 1,050 | 1,088 |
| PNC Bank 2.40% 2019 | 22,433 | 22,638 |
| PNC Bank 2.30% 2020 | 12,500 | 12,492 |
| PNC Bank 2.60% 2020 | 1,775 | 1,790 |
| PNC Financial Services Group, Inc. 2.854% 2022 | 9,189 | 9,117 |
| PNC Funding Corp. 3.30% 2022 | 8,000 | 8,222 |
| PNC Preferred Funding Trust I, junior subordinated 2.613% (undated)3,4 | 6,000 | 5,790 |
| Prudential Financial, Inc. 3.50% 2024 | 4,900 | 5,004 |
| QBE Insurance Group Ltd. 2.40% 20183 | 18,590 | 18,623 |
| Rabobank Nederland 2.25% 2019 | 13,000 | 13,069 |
| Rabobank Nederland 2.50% 2021 | 8,500 | 8,497 |
| Rabobank Nederland 4.625% 2023 | 11,935 | 12,562 |
| Rabobank Nederland 4.375% 2025 | 11,600 | 11,909 |
| Royal Bank of Scotland PLC 4.80% 2026 | 5,250 | 5,259 |
| Skandinaviska Enskilda Banken AB 1.875% 2021 | 13,500 | 13,052 |
| Skandinaviska Enskilda Banken AB 2.625% 2021 | 39,275 | 39,305 |
| Sovereign Bancorp, Inc. 8.75% 2018 | 1,880 | 2,024 |
| Standard Chartered PLC 2.10% 20193 | 1,500 | 1,483 |
| Svenska Handelsbanken AB 1.875% 2021 | 8,920 | 8,649 |
| Toronto-Dominion Bank 1.45% 2018 | 10,000 | 9,954 |
| UBS Group AG 2.95% 20203 | 13,500 | 13,508 |
| UBS Group AG 2.65% 20223 | 3,100 | 3,013 |
| UBS Group AG 4.125% 20253 | 8,200 | 8,332 |
| Unum Group 5.625% 2020 | 345 | 376 |
| Unum Group 3.00% 2021 | 2,085 | 2,079 |
| Unum Group 3.875% 2025 | 3,190 | 3,119 |
| VEB Finance Ltd. 6.902% 20203 | 9,100 | 9,858 |
| VEB Finance Ltd. 6.80% 20253 | 500 | 535 |
| Wells Fargo & Co. 2.55% 2020 | 23,655 | 23,676 |
| Wells Fargo & Co. 2.10% 2021 | 40,600 | 39,495 |
| Wells Fargo & Co. 2.50% 2021 | 13,500 | 13,397 |
| Wells Fargo & Co. 3.00% 2026 | 18,960 | 18,049 |
| | | 1,985,313 |
| Health care 5.33% | | |
| Abbott Laboratories 2.35% 2019 | 16,700 | 16,723 |
| Abbott Laboratories 2.90% 2021 | 64,235 | 64,155 |
| Abbott Laboratories 3.40% 2023 | 23,710 | 23,629 |
| Abbott Laboratories 3.75% 2026 | 87,330 | 86,857 |
| Abbott Laboratories 4.75% 2036 | 18,430 | 18,766 |
| Abbott Laboratories 4.90% 2046 | 49,570 | 50,976 |
| AbbVie Inc. 1.80% 2018 | 6,400 | 6,406 |
| AbbVie Inc. 2.50% 2020 | 12,585 | 12,591 |
| AbbVie Inc. 2.30% 2021 | 23,935 | 23,455 |
| AbbVie Inc. 2.90% 2022 | 12,310 | 12,161 |
| AbbVie Inc. 3.20% 2022 | 2,140 | 2,142 |
| AbbVie Inc. 2.85% 2023 | 8,170 | 7,928 |
| AbbVie Inc. 3.60% 2025 | 17,825 | 17,664 |
| AbbVie Inc. 3.20% 2026 | 40,525 | 38,577 |
| AbbVie Inc. 4.50% 2035 | 12,465 | 12,266 |
| AbbVie Inc. 4.45% 2046 | 24,375 | 23,387 |
| Aetna Inc. 1.70% 2018 | 27,770 | 27,750 |
The Bond Fund of America — Page 5 of 43
Bonds, notes & other debt instruments
Corporate bonds & notes (continued)
Health care (continued) | Principal amount
(000) | Value
(000) |
| Aetna Inc. 1.90% 2019 | $31,775 | $31,713 |
| Aetna Inc. 2.40% 2021 | 39,705 | 39,531 |
| Aetna Inc. 2.80% 2023 | 5,770 | 5,685 |
| Aetna Inc. 3.20% 2026 | 44,220 | 43,769 |
| Aetna Inc. 4.25% 2036 | 11,635 | 11,685 |
| Aetna Inc. 4.375% 2046 | 7,100 | 7,144 |
| Allergan PLC 2.35% 2018 | 14,250 | 14,335 |
| Allergan PLC 3.00% 2020 | 30,830 | 31,265 |
| Allergan PLC 3.45% 2022 | 12,040 | 12,223 |
| Allergan PLC 3.80% 2025 | 44,145 | 44,218 |
| Allergan PLC 4.55% 2035 | 14,550 | 14,424 |
| Allergan PLC 4.75% 2045 | 42,735 | 42,035 |
| Amgen Inc. 1.85% 2021 | 13,235 | 12,753 |
| Amgen Inc. 4.40% 2045 | 5,355 | 5,149 |
| AstraZeneca PLC 3.375% 2025 | 6,100 | 6,056 |
| Bayer AG 2.375% 20193 | 5,150 | 5,159 |
| Bayer AG 3.375% 20243 | 4,670 | 4,646 |
| Becton, Dickinson and Co. 1.80% 2017 | 3,729 | 3,738 |
| Becton, Dickinson and Co. 2.675% 2019 | 5,005 | 5,079 |
| Becton, Dickinson and Co. 4.685% 2044 | 2,015 | 2,096 |
| Biogen Inc. 3.625% 2022 | 6,860 | 7,043 |
| Biogen Inc. 5.20% 2045 | 6,950 | 7,477 |
| Boston Scientific Corp. 2.85% 2020 | 10,015 | 10,167 |
| Boston Scientific Corp. 3.375% 2022 | 5,000 | 5,083 |
| Boston Scientific Corp. 3.85% 2025 | 9,500 | 9,523 |
| Cardinal Health, Inc. 1.90% 2017 | 5,650 | 5,666 |
| Cardinal Health, Inc. 1.70% 2018 | 2,210 | 2,208 |
| Catholic Health Initiatives, Series 2012, 1.60% 2017 | 1,250 | 1,256 |
| Celgene Corp. 3.625% 2024 | 15,400 | 15,482 |
| Celgene Corp. 3.875% 2025 | 6,725 | 6,824 |
| Celgene Corp. 5.00% 2045 | 6,400 | 6,667 |
| Centene Corp. 5.625% 2021 | 700 | 738 |
| Centene Corp. 4.75% 2022 | 6,890 | 6,993 |
| Centene Corp. 4.75% 2025 | 3,200 | 3,132 |
| Community Health Systems Inc. 5.125% 2021 | 635 | 591 |
| Concordia Healthcare Corp. 9.00% 20223 | 2,025 | 1,724 |
| Concordia Healthcare Corp. 9.50% 20223 | 6,165 | 2,219 |
| Concordia Healthcare Corp. 7.00% 20233 | 2,080 | 666 |
| DaVita HealthCare Partners Inc. 5.00% 2025 | 1,015 | 1,001 |
| Dignity Health 3.125% 2022 | 4,100 | 4,020 |
| DJO Finance LLC 10.75% 2020 | 3,175 | 2,683 |
| DJO Finco Inc. 8.125% 20213 | 2,515 | 2,194 |
| EMD Finance LLC 2.40% 20203 | 37,585 | 37,367 |
| EMD Finance LLC 2.95% 20223 | 21,145 | 21,059 |
| EMD Finance LLC 3.25% 20253 | 43,085 | 42,138 |
| Gilead Sciences, Inc. 1.95% 2022 | 5,860 | 5,668 |
| Gilead Sciences, Inc. 2.95% 2027 | 16,350 | 15,643 |
| Gilead Sciences, Inc. 4.15% 2047 | 7,620 | 7,241 |
| HCA Inc. 5.875% 2022 | 7,000 | 7,560 |
| HCA Inc. 5.00% 2024 | 2,250 | 2,320 |
| HCA Inc. 5.25% 2025 | 500 | 523 |
| HCA Inc. 5.25% 2026 | 2,100 | 2,176 |
| HCA Inc. 4.50% 2027 | 10,625 | 10,466 |
| Healthsouth Corp. 5.75% 2025 | 1,490 | 1,490 |
The Bond Fund of America — Page 6 of 43
Bonds, notes & other debt instruments
Corporate bonds & notes (continued)
Health care (continued) | Principal amount
(000) | Value
(000) |
| Humana Inc. 3.85% 2024 | $10,950 | $11,214 |
| Humana Inc. 4.95% 2044 | 6,285 | 6,619 |
| Immucor, Inc. 11.125% 2019 | 170 | 161 |
| inVentiv Health, Inc. 9.00% 20183 | 4,140 | 4,148 |
| inVentiv Health, Inc. 7.50% 20243 | 5,125 | 5,394 |
| Johnson & Johnson 2.45% 2026 | 1,865 | 1,783 |
| Kinetic Concepts, Inc. 9.625% 20213 | 11,500 | 12,219 |
| Kinetic Concepts, Inc. 12.50% 20213 | 8,990 | 9,462 |
| Laboratory Corporation of America Holdings 3.60% 2025 | 4,800 | 4,781 |
| Laboratory Corporation of America Holdings 4.70% 2045 | 9,480 | 9,382 |
| Mallinckrodt PLC 4.875% 20203 | 1,630 | 1,644 |
| Molina Healthcare, Inc. 5.375% 2022 | 6,065 | 6,186 |
| Mylan Laboratories Inc. 2.50% 20193 | 10,500 | 10,447 |
| Mylan Laboratories Inc. 3.15% 20213 | 9,500 | 9,325 |
| Pfizer Inc. 7.20% 2039 | 1,829 | 2,643 |
| Quintiles Transnational Corp. 4.875% 20233 | 380 | 388 |
| Roche Holdings, Inc. 2.875% 20213 | 6,500 | 6,610 |
| Roche Holdings, Inc. 1.75% 20223 | 19,580 | 18,811 |
| Roche Holdings, Inc. 2.375% 20273 | 10,115 | 9,464 |
| Rotech Healthcare Inc., Term Loan, 13.00% 20204,5,6,7,8 | 7,264 | 7,028 |
| Rotech Healthcare Inc., Term Loan A, 5.50% 20184,5,6,7 | 3,483 | 3,459 |
| Rotech Healthcare Inc., Term Loan B, 10.00% 20194,5,6,7 | 2,715 | 2,701 |
| Shire PLC 1.90% 2019 | 34,520 | 34,089 |
| Shire PLC 2.40% 2021 | 74,487 | 71,965 |
| Shire PLC 2.875% 2023 | 35,065 | 33,339 |
| Shire PLC 3.20% 2026 | 53,015 | 49,574 |
| St. Jude Medical, Inc. 2.80% 2020 | 9,405 | 9,459 |
| Tenet Healthcare Corp. 4.375% 2021 | 600 | 594 |
| Tenet Healthcare Corp., First Lien, 6.00% 2020 | 4,505 | 4,708 |
| Teva Pharmaceutical Finance Company BV 1.40% 2018 | 23,725 | 23,537 |
| Teva Pharmaceutical Finance Company BV 1.70% 2019 | 24,205 | 23,786 |
| Teva Pharmaceutical Finance Company BV 2.20% 2021 | 35,915 | 34,365 |
| Teva Pharmaceutical Finance Company BV 2.80% 2023 | 16,240 | 15,378 |
| Teva Pharmaceutical Finance Company BV 3.15% 2026 | 40,060 | 36,953 |
| Teva Pharmaceutical Finance Company BV 4.10% 2046 | 16,090 | 13,815 |
| Thermo Fisher Scientific Inc. 2.40% 2019 | 4,261 | 4,294 |
| Thermo Fisher Scientific Inc. 4.15% 2024 | 4,005 | 4,172 |
| Thermo Fisher Scientific Inc. 5.30% 2044 | 180 | 202 |
| UnitedHealth Group Inc. 6.00% 2017 | 17,920 | 18,290 |
| UnitedHealth Group Inc. 1.90% 2018 | 7,750 | 7,785 |
| UnitedHealth Group Inc. 2.70% 2020 | 6,855 | 6,957 |
| UnitedHealth Group Inc. 3.35% 2022 | 5,210 | 5,366 |
| UnitedHealth Group Inc. 3.75% 2025 | 12,055 | 12,477 |
| UnitedHealth Group Inc. 3.45% 2027 | 20,895 | 21,230 |
| UnitedHealth Group Inc. 4.625% 2035 | 1,475 | 1,608 |
| UnitedHealth Group Inc. 4.75% 2045 | 2,455 | 2,706 |
| VPI Escrow Corp. 6.375% 20203 | 5,655 | 4,886 |
| VPI Escrow Corp. 7.50% 20213 | 3,000 | 2,554 |
| VRX Escrow Corp. 6.125% 20253 | 5,000 | 3,775 |
| WellPoint, Inc. 2.30% 2018 | 6,680 | 6,725 |
| WellPoint, Inc. 2.25% 2019 | 18,500 | 18,466 |
| Zimmer Holdings, Inc. 2.00% 2018 | 4,010 | 4,016 |
| Zimmer Holdings, Inc. 2.70% 2020 | 11,340 | 11,343 |
The Bond Fund of America — Page 7 of 43
Bonds, notes & other debt instruments
Corporate bonds & notes (continued)
Health care (continued) | Principal amount
(000) | Value
(000) |
| Zimmer Holdings, Inc. 3.15% 2022 | $13,976 | $13,940 |
| Zimmer Holdings, Inc. 3.55% 2025 | 12,520 | 12,200 |
| | | 1,703,567 |
| Energy 4.69% | | |
| American Energy (Marcellus), Term Loan A, 8.50% 20214,6,7 | 2,448 | 306 |
| American Energy (Marcellus), Term Loan B, 5.25% 20204,6,7 | 3,450 | 1,915 |
| American Energy (Permian Basin) 7.125% 20203 | 2,820 | 2,425 |
| Anadarko Petroleum Corp. 4.85% 2021 | 29,065 | 31,169 |
| Anadarko Petroleum Corp. 5.55% 2026 | 24,440 | 27,368 |
| Anadarko Petroleum Corp. 6.45% 2036 | 685 | 816 |
| Anadarko Petroleum Corp. 6.20% 2040 | 635 | 728 |
| Anadarko Petroleum Corp. 6.60% 2046 | 12,290 | 15,185 |
| APT Pipelines Ltd. 4.20% 20253 | 2,975 | 2,967 |
| Blue Racer Midstream LLC / Blue Racer Finance Corp. 6.125% 20223 | 5,030 | 5,055 |
| Boardwalk Pipeline Partners, LP 3.375% 2023 | 2,155 | 2,052 |
| Boardwalk Pipeline Partners, LP 4.95% 2024 | 5,555 | 5,706 |
| Canadian Natural Resources Ltd. 3.45% 2021 | 6,185 | 6,323 |
| Canadian Natural Resources Ltd. 3.80% 2024 | 1,780 | 1,775 |
| Cenovus Energy Inc. 3.00% 2022 | 19,115 | 18,483 |
| Cenovus Energy Inc. 3.80% 2023 | 8,285 | 8,090 |
| Cheniere Energy, Inc. 7.00% 20243 | 2,785 | 3,029 |
| Cheniere Energy, Inc. 5.875% 20253 | 3,175 | 3,251 |
| Chesapeake Energy Corp. 4.13% 20194 | 1,675 | 1,692 |
| Chesapeake Energy Corp. 4.875% 2022 | 1,875 | 1,706 |
| Chesapeake Energy Corp. 8.00% 20253 | 2,225 | 2,278 |
| Chevron Corp. 2.10% 2021 | 14,750 | 14,620 |
| Chevron Corp. 2.954% 2026 | 16,075 | 15,808 |
| Columbia Pipeline Partners LP 2.45% 2018 | 7,500 | 7,538 |
| Columbia Pipeline Partners LP 3.30% 2020 | 1,090 | 1,111 |
| Columbia Pipeline Partners LP 4.50% 2025 | 1,360 | 1,429 |
| Columbia Pipeline Partners LP 5.80% 2045 | 2,135 | 2,460 |
| Concho Resources Inc. 4.375% 2025 | 2,650 | 2,658 |
| ConocoPhillips 4.20% 2021 | 2,300 | 2,443 |
| ConocoPhillips 4.95% 2026 | 30,605 | 33,805 |
| ConocoPhillips 5.95% 2046 | 2,745 | 3,403 |
| CONSOL Energy Inc. 5.875% 2022 | 4,325 | 4,260 |
| DCP Midstream Operating LP 4.95% 2022 | 1,495 | 1,540 |
| Devon Energy Corp. 3.25% 2022 | 7,355 | 7,310 |
| Devon Energy Corp. 5.85% 2025 | 12,085 | 13,737 |
| Devon Energy Corp. 5.00% 2045 | 3,925 | 3,863 |
| Diamond Offshore Drilling, Inc. 4.875% 2043 | 31,800 | 22,747 |
| Ecopetrol SA 5.875% 2023 | 8,600 | 9,125 |
| Ecopetrol SA 5.375% 2026 | 6,095 | 6,080 |
| Ecopetrol SA 5.875% 2045 | 2,545 | 2,212 |
| Enbridge Energy Partners, LP 9.875% 2019 | 15,755 | 17,907 |
| Enbridge Energy Partners, LP 4.375% 2020 | 18,415 | 19,227 |
| Enbridge Energy Partners, LP 5.20% 2020 | 1,500 | 1,598 |
| Enbridge Energy Partners, LP 4.20% 2021 | 6,100 | 6,349 |
| Enbridge Energy Partners, LP 5.875% 2025 | 35,865 | 40,005 |
| Enbridge Energy Partners, LP 5.50% 2040 | 3,500 | 3,481 |
| Enbridge Energy Partners, LP 7.375% 2045 | 45,040 | 55,959 |
| Enbridge Energy Partners, LP, Series B, 6.50% 2018 | 20,820 | 21,912 |
| Enbridge Inc. 5.60% 2017 | 17,750 | 17,933 |
The Bond Fund of America — Page 8 of 43
Bonds, notes & other debt instruments
Corporate bonds & notes (continued)
Energy (continued) | Principal amount
(000) | Value
(000) |
| Enbridge Inc. 4.00% 2023 | $26,745 | $27,162 |
| Enbridge Inc. 3.50% 2024 | 9,715 | 9,466 |
| Enbridge Inc. 4.25% 2026 | 9,515 | 9,747 |
| Enbridge Inc. 5.50% 2046 | 19,080 | 20,546 |
| Energy Transfer Partners, LP 4.15% 2020 | 3,000 | 3,107 |
| Energy Transfer Partners, LP 5.875% 2024 | 1,375 | 1,427 |
| Energy Transfer Partners, LP 4.75% 2026 | 12,100 | 12,516 |
| Energy Transfer Partners, LP 5.50% 2027 | 1,315 | 1,289 |
| Energy Transfer Partners, LP 6.125% 2045 | 22,270 | 23,735 |
| EnLink Midstream Partners, LP 2.70% 2019 | 9,060 | 9,069 |
| EnLink Midstream Partners, LP 4.40% 2024 | 5,870 | 5,835 |
| EnLink Midstream Partners, LP 4.15% 2025 | 17,190 | 16,694 |
| EnLink Midstream Partners, LP 4.85% 2026 | 2,710 | 2,735 |
| EnLink Midstream Partners, LP 5.05% 2045 | 2,535 | 2,302 |
| Ensco PLC 5.20% 2025 | 1,860 | 1,616 |
| Ensco PLC 5.75% 2044 | 2,380 | 1,737 |
| Enterprise Products Operating LLC 3.95% 2027 | 3,000 | 3,075 |
| Enterprise Products Operating LLC 4.85% 2044 | 1,775 | 1,795 |
| Enterprise Products Operating LLC 4.90% 2046 | 3,000 | 3,086 |
| Exxon Mobil Corp. 1.708% 2019 | 7,900 | 7,918 |
| Exxon Mobil Corp. 2.222% 2021 | 17,800 | 17,806 |
| Exxon Mobil Corp. 3.043% 2026 | 5,450 | 5,441 |
| Exxon Mobil Corp. 4.114% 2046 | 885 | 907 |
| Gazprom OJSC 6.51% 20223 | 8,350 | 9,244 |
| Genesis Energy, LP 6.75% 2022 | 1,225 | 1,279 |
| Halliburton Co. 3.80% 2025 | 17,045 | 17,324 |
| Halliburton Co. 5.00% 2045 | 16,465 | 17,892 |
| Jupiter Resources Inc. 8.50% 20223 | 1,000 | 867 |
| Kinder Morgan Energy Partners, LP 5.30% 2020 | 1,250 | 1,343 |
| Kinder Morgan Energy Partners, LP 6.85% 2020 | 12,840 | 14,315 |
| Kinder Morgan Energy Partners, LP 3.50% 2021 | 955 | 970 |
| Kinder Morgan Energy Partners, LP 4.15% 2022 | 5,000 | 5,131 |
| Kinder Morgan Energy Partners, LP 4.15% 2024 | 2,790 | 2,840 |
| Kinder Morgan Energy Partners, LP 4.25% 2024 | 9,700 | 9,930 |
| Kinder Morgan Energy Partners, LP 6.95% 2038 | 2,350 | 2,730 |
| Kinder Morgan Energy Partners, LP 6.55% 2040 | 2,000 | 2,203 |
| Kinder Morgan Energy Partners, LP 5.40% 2044 | 4,500 | 4,493 |
| Kinder Morgan Energy Partners, LP 5.50% 2044 | 1,100 | 1,123 |
| Kinder Morgan Finance Co. 5.05% 2046 | 14,272 | 14,155 |
| Kinder Morgan, Inc. 3.05% 2019 | 6,810 | 6,909 |
| Kinder Morgan, Inc. 4.30% 2025 | 28,090 | 28,934 |
| Kinder Morgan, Inc. 5.30% 2034 | 5,825 | 5,920 |
| Kinder Morgan, Inc. 5.55% 2045 | 19,900 | 20,968 |
| NGL Energy Partners LP 6.875% 2021 | 2,455 | 2,523 |
| NGPL PipeCo LLC 9.625% 20193 | 2,015 | 2,121 |
| Noble Corp. PLC 5.25% 2018 | 400 | 400 |
| Noble Corp. PLC 7.20% 2025 | 2,425 | 2,286 |
| Noble Corp. PLC 8.20% 2045 | 4,155 | 3,480 |
| Odebrecht Drilling Norbe VIII/IX Ltd 6.35% 20213,7 | 4,186 | 1,915 |
| Odebrecht Offshore Drilling Finance Ltd. 6.75% 20223,7 | 8,934 | 2,457 |
| Petrobras Global Finance Co. 3.25% 2019 | €3,470 | 3,742 |
| Petrobras Global Finance Co. 8.375% 2021 | $4,750 | 5,130 |
| Petrobras Global Finance Co. 4.375% 2023 | 3,670 | 3,216 |
| Petrobras Global Finance Co. 6.25% 2024 | 410 | 394 |
The Bond Fund of America — Page 9 of 43
Bonds, notes & other debt instruments
Corporate bonds & notes (continued)
Energy (continued) | Principal amount
(000) | Value
(000) |
| Petrobras Global Finance Co. 6.85% 2115 | $1,910 | $1,557 |
| Petrobras International Finance Co. 5.75% 2020 | 825 | 837 |
| Petróleos Mexicanos 5.50% 2021 | 9,850 | 10,145 |
| Petróleos Mexicanos 6.375% 20213 | 3,800 | 4,056 |
| Petróleos Mexicanos 5.375% 20223 | 9,830 | 10,078 |
| Petróleos Mexicanos 3.50% 2023 | 5,000 | 4,602 |
| Petróleos Mexicanos 4.625% 20233 | 14,100 | 13,752 |
| Petróleos Mexicanos 4.50% 2026 | 6,725 | 6,143 |
| Petróleos Mexicanos 6.875% 20263 | 9,460 | 10,004 |
| Petróleos Mexicanos 6.875% 2026 | 5,000 | 5,287 |
| Petróleos Mexicanos 7.47% 2026 | MXN200,000 | 7,963 |
| Petróleos Mexicanos 6.50% 20273 | $18,515 | 19,121 |
| Petróleos Mexicanos 5.50% 2044 | 8,054 | 6,743 |
| Petróleos Mexicanos 5.625% 2046 | 6,675 | 5,565 |
| Petróleos Mexicanos 6.75% 20473 | 35,102 | 33,252 |
| Phillips 66 Partners LP 3.605% 2025 | 2,570 | 2,518 |
| Phillips 66 Partners LP 3.55% 2026 | 16,130 | 15,619 |
| Phillips 66 Partners LP 4.68% 2045 | 205 | 191 |
| Phillips 66 Partners LP 4.90% 2046 | 2,765 | 2,660 |
| Pioneer Natural Resources Co. 3.45% 2021 | 1,860 | 1,901 |
| Pioneer Natural Resources Co. 4.45% 2026 | 1,555 | 1,651 |
| Plains All American Pipeline, LP 4.50% 2026 | 4,750 | 4,821 |
| QGOG Atlantic/Alaskan Rigs Ltd. 5.25% 20193,7 | 4,247 | 4,077 |
| QGOG Constellation SA 6.25% 20193 | 2,775 | 1,845 |
| Range Resources Corp. 4.875% 2025 | 3,000 | 2,921 |
| Ras Laffan Liquefied Natural Gas II 5.298% 20203,7 | 2,350 | 2,479 |
| Ras Laffan Liquefied Natural Gas III 6.332% 20277 | 1,000 | 1,152 |
| Royal Dutch Shell PLC 1.375% 2019 | 27,000 | 26,619 |
| Royal Dutch Shell PLC 1.75% 2021 | 36,850 | 35,800 |
| Royal Dutch Shell PLC 2.50% 2026 | 3,190 | 2,992 |
| Royal Dutch Shell PLC 3.75% 2046 | 14,475 | 13,325 |
| Sabine Pass Liquefaction, LLC 5.625% 2021 | 925 | 994 |
| Sabine Pass Liquefaction, LLC 5.75% 2024 | 1,100 | 1,185 |
| Sabine Pass Liquefaction, LLC 5.625% 2025 | 5,015 | 5,385 |
| Sabine Pass Liquefaction, LLC 5.00% 20273 | 13,900 | 14,074 |
| Schlumberger BV 3.00% 20203 | 8,720 | 8,902 |
| Schlumberger BV 3.625% 20223 | 11,425 | 11,838 |
| Schlumberger BV 4.00% 20253 | 19,380 | 20,305 |
| Seven Generations Energy Ltd. 6.75% 20233 | 1,000 | 1,070 |
| Shell International Finance BV 1.875% 2021 | 35,750 | 34,944 |
| Shell International Finance BV 2.875% 2026 | 10,000 | 9,665 |
| Shell International Finance BV 4.00% 2046 | 7,850 | 7,510 |
| SM Energy Co. 5.625% 2025 | 475 | 461 |
| Southwestern Energy Co. 4.10% 2022 | 3,125 | 2,968 |
| Southwestern Energy Co. 6.70% 2025 | 15,330 | 15,752 |
| Spectra Energy Partners, LP 3.375% 2026 | 3,980 | 3,809 |
| Spectra Energy Partners, LP 4.50% 2045 | 640 | 610 |
| Sunoco LP 6.25% 2021 | 1,515 | 1,547 |
| Tallgrass Energy Partners, LP 5.50% 20243 | 2,800 | 2,793 |
| Targa Resources Corp. 4.125% 2019 | 2,775 | 2,824 |
| Targa Resources Corp. 5.125% 20253 | 1,675 | 1,669 |
| Targa Resources Partners LP 6.75% 2024 | 500 | 539 |
| Targa Resources Partners LP 5.375% 20273 | 1,675 | 1,667 |
| TC PipeLines, LP 4.375% 2025 | 9,030 | 9,107 |
The Bond Fund of America — Page 10 of 43
Bonds, notes & other debt instruments
Corporate bonds & notes (continued)
Energy (continued) | Principal amount
(000) | Value
(000) |
| Teekay Corp. 8.50% 2020 | $11,920 | $11,384 |
| Tesoro Corp. 4.75% 20233 | 2,150 | 2,165 |
| Tesoro Corp. 5.125% 20263 | 7,850 | 7,954 |
| Tesoro Logistics LP 5.50% 2019 | 1,115 | 1,185 |
| Tesoro Logistics LP 6.125% 2021 | 700 | 737 |
| Tesoro Logistics LP 6.375% 2024 | 990 | 1,064 |
| Tesoro Logistics LP 5.25% 2025 | 4,350 | 4,459 |
| TransCanada PipeLines Ltd. 6.50% 2018 | 7,500 | 8,027 |
| TransCanada PipeLines Ltd., junior subordinated 5.625% 2075 | 5,470 | 5,538 |
| Transocean Inc. 8.125% 2021 | 1,865 | 1,874 |
| Transocean Inc. 5.55% 2022 | 5,135 | 4,532 |
| Transocean Inc. 9.00% 20233 | 5,575 | 5,742 |
| Transportadora de Gas Peru SA 4.25% 20283,7 | 2,535 | 2,510 |
| Valero Energy Partners LP 4.375% 2026 | 7,945 | 8,054 |
| Weatherford International PLC 4.50% 2022 | 2,165 | 1,889 |
| Weatherford International PLC 8.25% 2023 | 1,275 | 1,300 |
| Weatherford International PLC 9.875% 20243 | 475 | 507 |
| Weatherford International PLC 6.50% 2036 | 800 | 646 |
| Weatherford International PLC 6.75% 2040 | 2,735 | 2,202 |
| Western Gas Partners LP 2.60% 2018 | 515 | 516 |
| Western Gas Partners LP 4.00% 2022 | 2,460 | 2,501 |
| Western Gas Partners LP 3.95% 2025 | 4,415 | 4,355 |
| Western Gas Partners LP 4.65% 2026 | 3,655 | 3,786 |
| Western Gas Partners LP 5.45% 2044 | 4,200 | 4,334 |
| Williams Companies, Inc. 3.70% 2023 | 1,680 | 1,630 |
| Williams Partners LP 5.25% 2020 | 4,125 | 4,408 |
| Williams Partners LP 3.60% 2022 | 20,250 | 20,361 |
| Williams Partners LP 4.50% 2023 | 3,975 | 4,085 |
| Williams Partners LP 4.30% 2024 | 22,380 | 22,609 |
| Williams Partners LP 3.90% 2025 | 4,530 | 4,445 |
| Williams Partners LP 4.00% 2025 | 21,435 | 21,205 |
| Williams Partners LP 5.40% 2044 | 8,000 | 7,767 |
| Williams Partners LP 4.90% 2045 | 1,585 | 1,468 |
| Williams Partners LP 5.10% 2045 | 15,923 | 15,162 |
| Woodside Finance Ltd. 4.60% 20213 | 9,565 | 10,058 |
| Woodside Petroleum Ltd. 3.65% 20253 | 4,700 | 4,594 |
| YPF SA 8.50% 20253 | 7,700 | 7,827 |
| YPF SA 8.50% 2025 | 600 | 610 |
| | | 1,500,868 |
| Consumer discretionary 3.44% | | |
| 21st Century Fox America, Inc. 4.95% 2045 | 415 | 427 |
| 21st Century Fox America, Inc. 4.75% 20463 | 4,600 | 4,623 |
| Amazon.com, Inc. 3.80% 2024 | 8,775 | 9,225 |
| Amazon.com, Inc. 4.95% 2044 | 4,750 | 5,428 |
| American Honda Finance Corp. 1.20% 2019 | 13,500 | 13,259 |
| American Honda Finance Corp. 2.25% 2019 | 13,500 | 13,630 |
| American Honda Finance Corp. 1.65% 2021 | 10,625 | 10,230 |
| American Honda Finance Corp. 1.70% 2021 | 24,500 | 23,637 |
| American Honda Finance Corp. 2.30% 2026 | 415 | 387 |
| Bayerische Motoren Werke AG 1.45% 20193 | 14,700 | 14,526 |
| Bayerische Motoren Werke AG 1.85% 20213 | 25,100 | 24,230 |
| Bayerische Motoren Werke AG 2.00% 20213 | 24,500 | 24,038 |
| Bayerische Motoren Werke AG 2.25% 20233 | 18,900 | 18,109 |
The Bond Fund of America — Page 11 of 43
Bonds, notes & other debt instruments
Corporate bonds & notes (continued)
Consumer discretionary (continued) | Principal amount
(000) | Value
(000) |
| Cablevision Systems Corp. 6.75% 2021 | $2,000 | $2,155 |
| CBS Corp. 1.95% 2017 | 2,000 | 2,007 |
| CCO Holdings LLC and CCO Holdings Capital Corp. 3.579% 2020 | 6,125 | 6,250 |
| CCO Holdings LLC and CCO Holdings Capital Corp. 4.464% 2022 | 22,290 | 23,298 |
| CCO Holdings LLC and CCO Holdings Capital Corp. 4.908% 2025 | 17,490 | 18,442 |
| CCO Holdings LLC and CCO Holdings Capital Corp. 5.75% 20263 | 1,975 | 2,049 |
| CCO Holdings LLC and CCO Holdings Capital Corp. 6.384% 2035 | 7,875 | 9,005 |
| CCO Holdings LLC and CCO Holdings Capital Corp. 6.484% 2045 | 11,600 | 13,434 |
| Clear Channel Worldwide Holdings, Inc. 7.625% 2020 | 4,250 | 4,263 |
| Comcast Corp. 2.35% 2027 | 11,635 | 10,751 |
| Cumulus Media Holdings Inc. 7.75% 2019 | 2,445 | 1,013 |
| Cumulus Media Inc., Term Loan B, 4.25% 20204,6,7 | 3,000 | 1,975 |
| Daimler Finance NA LLC 2.70% 20203 | 3,500 | 3,520 |
| DaimlerChrysler North America Holding Corp. 1.375% 20173 | 13,080 | 13,081 |
| DaimlerChrysler North America Holding Corp. 1.875% 20183 | 13,450 | 13,469 |
| DaimlerChrysler North America Holding Corp. 2.375% 20183 | 7,700 | 7,758 |
| DaimlerChrysler North America Holding Corp. 1.50% 20193 | 26,000 | 25,579 |
| DaimlerChrysler North America Holding Corp. 2.25% 20203 | 2,315 | 2,304 |
| DaimlerChrysler North America Holding Corp. 2.00% 20213 | 21,050 | 20,434 |
| DaimlerChrysler North America Holding Corp. 2.20% 20213 | 20,275 | 19,807 |
| DaimlerChrysler North America Holding Corp. 2.875% 20213 | 26,250 | 26,405 |
| DaimlerChrysler North America Holding Corp. 3.30% 20253 | 2,000 | 1,980 |
| DaimlerChrysler North America Holding Corp. 8.50% 2031 | 3,000 | 4,517 |
| DISH DBS Corp. 4.25% 2018 | 1,200 | 1,233 |
| Dollar General Corp. 4.125% 2017 | 938 | 952 |
| Dollar General Corp. 1.875% 2018 | 1,817 | 1,820 |
| Ford Motor Co. 4.346% 2026 | 24,855 | 25,129 |
| Ford Motor Co. 4.75% 2043 | 2,500 | 2,378 |
| Ford Motor Co. 5.291% 2046 | 12,500 | 12,686 |
| Ford Motor Credit Co. 2.145% 2018 | 11,615 | 11,633 |
| Ford Motor Credit Co. 2.375% 2018 | 7,440 | 7,474 |
| Ford Motor Credit Co. 2.375% 2019 | 22,325 | 22,315 |
| Ford Motor Credit Co. 2.597% 2019 | 21,820 | 21,792 |
| Ford Motor Credit Co. 2.459% 2020 | 8,040 | 7,938 |
| Ford Motor Credit Co. 3.157% 2020 | 31,000 | 31,234 |
| Ford Motor Credit Co. 3.20% 2021 | 5,600 | 5,609 |
| Ford Motor Credit Co. 3.336% 2021 | 4,500 | 4,532 |
| Ford Motor Credit Co. 3.096% 2023 | 2,000 | 1,932 |
| Ford Motor Credit Co. 4.389% 2026 | 13,000 | 13,182 |
| General Motors Co. 5.00% 2035 | 2,000 | 1,953 |
| General Motors Co. 6.60% 2036 | 490 | 561 |
| General Motors Co. 6.75% 2046 | 1,210 | 1,421 |
| General Motors Financial Co. 2.40% 2019 | 21,800 | 21,746 |
| General Motors Financial Co. 3.10% 2019 | 6,000 | 6,065 |
| General Motors Financial Co. 3.50% 2019 | 3,715 | 3,783 |
| General Motors Financial Co. 3.20% 2021 | 28,400 | 28,167 |
| General Motors Financial Co. 4.20% 2021 | 4,500 | 4,631 |
| General Motors Financial Co. 4.375% 2021 | 9,100 | 9,441 |
| General Motors Financial Co. 3.45% 2022 | 18,855 | 18,650 |
| General Motors Financial Co. 3.70% 2023 | 11,250 | 11,073 |
| General Motors Financial Co. 4.30% 2025 | 7,085 | 7,032 |
| General Motors Financial Co. 4.00% 2026 | 13,765 | 13,251 |
| Grupo Televisa, SAB 6.625% 2040 | 5,200 | 5,474 |
| Grupo Televisa, SAB 7.25% 2043 | MXN25,290 | 912 |
The Bond Fund of America — Page 12 of 43
Bonds, notes & other debt instruments
Corporate bonds & notes (continued)
Consumer discretionary (continued) | Principal amount
(000) | Value
(000) |
| Hilton Worldwide Holdings Inc. 4.25% 20243 | $4,275 | $4,168 |
| Home Depot, Inc. 2.125% 2026 | 4,815 | 4,440 |
| Home Depot, Inc. 4.25% 2046 | 1,200 | 1,260 |
| Hyundai Capital America 2.00% 20193 | 7,605 | 7,547 |
| Hyundai Capital America 3.00% 20203 | 2,000 | 2,000 |
| Hyundai Capital America 2.45% 20213 | 18,000 | 17,592 |
| Hyundai Capital Services Inc. 1.625% 20193 | 6,150 | 6,053 |
| Limited Brands, Inc. 6.875% 2035 | 1,150 | 1,179 |
| Lowe’s Companies, Inc. 2.50% 2026 | 6,000 | 5,696 |
| McClatchy Co. 9.00% 2022 | 1,000 | 1,070 |
| McDonald’s Corp. 3.70% 2026 | 10,850 | 11,052 |
| McDonald’s Corp. 4.70% 2035 | 3,750 | 3,973 |
| McDonald’s Corp. 4.875% 2045 | 12,000 | 12,878 |
| NBC Universal Enterprise, Inc. 1.565% 20183,4 | 10,425 | 10,491 |
| NBC Universal Enterprise, Inc. 5.25% 20493 | 17,895 | 18,834 |
| Neiman Marcus Group LTD Inc. 8.00% 20213 | 675 | 505 |
| Newell Rubbermaid Inc. 2.60% 2019 | 6,450 | 6,523 |
| Newell Rubbermaid Inc. 3.15% 2021 | 27,255 | 27,741 |
| Newell Rubbermaid Inc. 3.85% 2023 | 16,875 | 17,510 |
| Newell Rubbermaid Inc. 4.20% 2026 | 24,595 | 25,666 |
| Newell Rubbermaid Inc. 5.50% 2046 | 20,470 | 23,509 |
| Nissan Motor Co., Ltd. 1.55% 20193 | 12,420 | 12,232 |
| RCI Banque 3.50% 20183 | 13,500 | 13,744 |
| Schaeffler Verwaltungs 4.75% 20263,8 | 5,215 | 5,046 |
| Seminole Tribe of Florida 7.804% 20203,7 | 3,192 | 3,192 |
| Sotheby’s Holdings, Inc. 5.25% 20223 | 775 | 765 |
| Starbucks Corp. 2.10% 2021 | 725 | 723 |
| Starbucks Corp. 2.70% 2022 | 1,500 | 1,507 |
| Starbucks Corp. 4.30% 2045 | 1,750 | 1,839 |
| Thomson Reuters Corp. 1.30% 2017 | 1,890 | 1,890 |
| Thomson Reuters Corp. 1.65% 2017 | 16,600 | 16,621 |
| Thomson Reuters Corp. 6.50% 2018 | 21,175 | 22,621 |
| Thomson Reuters Corp. 4.30% 2023 | 8,805 | 9,215 |
| Thomson Reuters Corp. 3.35% 2026 | 6,000 | 5,832 |
| Thomson Reuters Corp. 5.65% 2043 | 1,905 | 2,102 |
| TI Automotive Ltd. 8.75% 20233 | 855 | 898 |
| Time Warner Cable Inc. 6.75% 2018 | 11,650 | 12,440 |
| Time Warner Cable Inc. 4.50% 2042 | 2,000 | 1,815 |
| Time Warner Inc. 3.80% 2027 | 4,535 | 4,505 |
| Time Warner Inc. 6.20% 2040 | 6,450 | 7,458 |
| Toyota Motor Credit Corp. 2.15% 2020 | 14,500 | 14,471 |
| Toyota Motor Credit Corp. 2.25% 2023 | 16,615 | 16,013 |
| Under Armour, Inc. 3.25% 2026 | 4,780 | 4,517 |
| Volkswagen Group of America Finance, LLC 1.65% 20183 | 10,500 | 10,445 |
| Volkswagen Group of America Finance, LLC 2.40% 20203 | 5,000 | 4,949 |
| Volkswagen International Finance NV 2.125% 20183 | 1,500 | 1,500 |
| Walt Disney Co. 1.85% 2026 | 5,300 | 4,775 |
| WPP Finance 2010 3.75% 2024 | 3,000 | 3,021 |
| Wynn Las Vegas, LLC and Wynn Capital Corp. 4.25% 20233 | 1,075 | 1,028 |
| Wynn Macau, Ltd. 5.25% 20213 | 2,900 | 2,936 |
| | | 1,099,031 |
The Bond Fund of America — Page 13 of 43
Bonds, notes & other debt instruments
Corporate bonds & notes (continued)
Utilities 2.59% | Principal amount
(000) | Value
(000) |
| Abu Dhabi National Energy Co. PJSC (TAQA) 5.875% 20213 | $1,055 | $1,170 |
| Abu Dhabi National Energy Co. PJSC (TAQA) 3.625% 20233 | 5,610 | 5,596 |
| Abu Dhabi National Energy Co. PJSC (TAQA) 6.50% 2036 | 1,500 | 1,840 |
| Abu Dhabi National Energy Co. PJSC (TAQA) 6.50% 20363 | 1,000 | 1,226 |
| AES Corp. 5.50% 2025 | 1,275 | 1,281 |
| American Electric Power Co., Inc. 1.65% 2017 | 7,180 | 7,183 |
| American Electric Power Co., Inc. 2.75% 2026 | 7,183 | 6,782 |
| Berkshire Hathaway Energy Co. 2.40% 2020 | 6,964 | 6,984 |
| CenterPoint Energy, Inc. 2.25% 2022 | 3,132 | 3,062 |
| CenterPoint Energy, Inc. 2.40% 2026 | 3,220 | 3,021 |
| Cleveland Electric Illuminating Co. 8.875% 2018 | 12,864 | 14,460 |
| CMS Energy Corp. 8.75% 2019 | 4,352 | 5,026 |
| CMS Energy Corp. 5.05% 2022 | 21,169 | 23,194 |
| CMS Energy Corp. 3.875% 2024 | 1,205 | 1,254 |
| CMS Energy Corp. 3.00% 2026 | 12,250 | 11,796 |
| CMS Energy Corp. 2.95% 2027 | 6,100 | 5,793 |
| Colbun SA 6.00% 20203 | 2,400 | 2,595 |
| Colbun SA 4.50% 20243 | 2,450 | 2,477 |
| Comision Federal de Electricidad 4.875% 20243 | 2,500 | 2,497 |
| Comision Federal de Electricidad 4.75% 20273 | 5,230 | 5,034 |
| Commonwealth Edison Company 2.55% 2026 | 2,825 | 2,691 |
| Consolidated Edison Company of New York, Inc. 3.85% 2046 | 1,200 | 1,145 |
| Consumers Energy Co. 5.65% 2020 | 2,029 | 2,234 |
| Dominion Resources, Inc. 1.875% 20183 | 14,700 | 14,679 |
| Dominion Resources, Inc. 1.60% 2019 | 3,210 | 3,162 |
| Dominion Resources, Inc. 2.962% 2019 | 2,550 | 2,582 |
| Dominion Resources, Inc. 4.104% 2021 | 23,809 | 24,805 |
| Duke Energy Carolinas, Inc. 2.50% 2023 | 8,900 | 8,819 |
| Duke Energy Corp. 1.80% 2021 | 12,776 | 12,309 |
| Duke Energy Corp. 2.65% 2026 | 19,363 | 18,082 |
| Duke Energy Corp. 3.75% 2046 | 8,970 | 8,092 |
| E.ON International Finance BV 5.80% 20183 | 15,000 | 15,735 |
| EDP Finance BV 4.125% 20203 | 28,600 | 29,304 |
| EDP Finance BV 5.25% 20213 | 7,000 | 7,411 |
| Electricité de France SA 4.95% 20453 | 9,600 | 9,717 |
| Electricité de France SA 4.875% 20443 | 1,000 | 1,002 |
| Electricité de France SA 5.25% 20493 | 4,750 | 4,483 |
| Electricité de France SA 6.00% 2114 | £300 | 514 |
| Emera Inc. 6.75% 2076 | $14,811 | 15,922 |
| Emera US Finance LP 2.15% 20193 | 7,180 | 7,169 |
| Emera US Finance LP 2.70% 20213 | 5,950 | 5,890 |
| Emera US Finance LP 3.55% 20263 | 10,045 | 9,880 |
| Emera US Finance LP 4.75% 20463 | 4,000 | 4,042 |
| Empresa Nacional de Electricidad SA 4.25% 2024 | 1,500 | 1,503 |
| Enel Finance International SA 6.00% 20393 | 2,210 | 2,473 |
| Enel Società per Azioni 8.75% 20733 | 9,500 | 10,783 |
| Entergy Corp. 5.59% 2024 | 611 | 709 |
| Entergy Corp. 2.40% 2026 | 6,195 | 5,779 |
| Entergy Corp. 2.95% 2026 | 12,315 | 11,526 |
| Entergy Corp. 4.44% 2026 | 3 | 3 |
| Entergy Louisiana, LLC 3.30% 2022 | 2 | 2 |
| Eversource Energy 2.50% 2021 | 10,002 | 9,932 |
| Eversource Energy 2.375% 2022 | 1,282 | 1,259 |
| Exelon Corp. 2.45% 2021 | 4,080 | 4,032 |
The Bond Fund of America — Page 14 of 43
Bonds, notes & other debt instruments
Corporate bonds & notes (continued)
Utilities (continued) | Principal amount
(000) | Value
(000) |
| Exelon Corp. 3.95% 2025 | $5,000 | $5,143 |
| Exelon Corp. 3.40% 2026 | 1,000 | 982 |
| Exelon Corp. 4.45% 2046 | 6,950 | 6,817 |
| FirstEnergy Corp. 7.375% 2031 | 13,036 | 16,813 |
| FirstEnergy Corp., Series B, 4.25% 2023 | 17,403 | 17,997 |
| Fortis Inc 3.055% 20263 | 7,550 | 7,065 |
| Iberdrola Finance Ireland 5.00% 20193 | 4,000 | 4,270 |
| Israel Electric Corp. Ltd. 8.10% 20963 | 6,250 | 7,281 |
| MidAmerican Energy Holdings Co. 5.75% 2018 | 15,700 | 16,495 |
| MidAmerican Energy Holdings Co. 3.75% 2023 | 5,350 | 5,597 |
| Mississippi Power Co. 4.25% 2042 | 7,618 | 6,602 |
| National Rural Utilities Cooperative Finance Corp. 10.375% 2018 | 17,685 | 20,396 |
| National Rural Utilities Cooperative Finance Corp. 2.70% 2023 | 2,800 | 2,781 |
| Nevada Power Co., General and Refunding Mortgage Notes, Series V, 7.125% 2019 | 5,594 | 6,219 |
| New York State Electric & Gas Corp. 3.25% 20263 | 7,200 | 7,167 |
| NextEra Energy, Inc. 1.649% 2018 | 6,360 | 6,341 |
| Niagara Mohawk Power Corp. 3.508% 20243 | 8,470 | 8,626 |
| Niagara Mohawk Power Corp. 4.278% 20343 | 3,000 | 3,054 |
| Northern States Power Co., First Mortgage Bonds, 2.15% 2022 | 1,252 | 1,224 |
| NRG Energy, Inc. 6.25% 2022 | 2,255 | 2,272 |
| NRG Energy, Inc. 7.25% 20263 | 2,850 | 2,850 |
| NRG Energy, Inc. 6.625% 20273 | 5,300 | 5,035 |
| NV Energy, Inc 6.25% 2020 | 11,400 | 12,930 |
| Ohio Power Co., Series G, 6.60% 2033 | 2,090 | 2,573 |
| Ohio Power Co., Series D, 6.60% 2033 | 353 | 432 |
| Pacific Gas and Electric Co. 3.25% 2021 | 2,158 | 2,219 |
| Pacific Gas and Electric Co. 3.25% 2023 | 14,072 | 14,361 |
| Pacific Gas and Electric Co. 3.85% 2023 | 92 | 97 |
| Pacific Gas and Electric Co. 3.40% 2024 | 2,000 | 2,045 |
| Pacific Gas and Electric Co. 3.75% 2024 | 301 | 314 |
| Pacific Gas and Electric Co. 3.75% 2042 | 559 | 526 |
| Pacific Gas and Electric Co. 4.00% 2046 | 5,000 | 4,942 |
| Pacific Gas and Electric Co. 4.25% 2046 | 3,938 | 4,010 |
| PacifiCorp. 3.35% 2025 | 5,900 | 5,986 |
| PacifiCorp., First Mortgage Bonds, 2.95% 2023 | 1,300 | 1,307 |
| PG&E Corp. 2.40% 2019 | 4,945 | 4,965 |
| Progress Energy, Inc. 7.05% 2019 | 3,100 | 3,427 |
| Progress Energy, Inc. 7.00% 2031 | 4,000 | 5,189 |
| Progress Energy, Inc. 7.75% 2031 | 4,000 | 5,507 |
| Public Service Co. of Colorado 5.80% 2018 | 9,606 | 10,212 |
| Public Service Co. of Colorado 2.25% 2022 | 870 | 856 |
| Public Service Electric and Gas Co., 1.90% 2021 | 2,035 | 1,998 |
| Public Service Enterprise Group Inc. 1.60% 2019 | 9,650 | 9,517 |
| Public Service Enterprise Group Inc. 2.00% 2021 | 13,009 | 12,598 |
| Puget Energy, Inc. 6.50% 2020 | 12,086 | 13,627 |
| Puget Energy, Inc. 6.00% 2021 | 8,500 | 9,521 |
| Puget Energy, Inc. 5.625% 2022 | 20,391 | 22,583 |
| Puget Energy, Inc. 3.65% 2025 | 884 | 872 |
| Sierra Pacific Power Co. 2.60% 2026 | 6,448 | 6,168 |
| Southern California Edison Co. 1.845% 20227 | 9,173 | 9,022 |
| Southern Co. 2.15% 2019 | 9,325 | 9,328 |
| Southern Co. 2.35% 2021 | 14,650 | 14,400 |
| Southern Co. 4.40% 2046 | 6,000 | 5,947 |
| Southern Co. 5.50% 2057 | 5,915 | 5,981 |
The Bond Fund of America — Page 15 of 43
Bonds, notes & other debt instruments
Corporate bonds & notes (continued)
Utilities (continued) | Principal amount
(000) | Value
(000) |
| Talen Energy Corp. 4.625% 20193 | $1,400 | $1,334 |
| Tampa Electric Co. 2.60% 2022 | 901 | 887 |
| Teco Finance, Inc. 1.476% 20184 | 680 | 679 |
| Teco Finance, Inc. 5.15% 2020 | 10,153 | 10,783 |
| TEX Operations Co. LLC, Term Loan B, 5.00% 20234,6,7 | 1,038 | 1,048 |
| TEX Operations Co. LLC, Term Loan C, 5.00% 20234,6,7 | 237 | 239 |
| Tri-State Generation and Transmission Assn. Inc., Pass Through Trust, Series 2003-A, 6.04% 20183,7 | 522 | 534 |
| Virginia Electric and Power Co. 1.20% 2018 | 5,000 | 4,980 |
| Virginia Electric and Power Co. 2.95% 2022 | 5,482 | 5,558 |
| Virginia Electric and Power Co. 2.95% 2026 | 9,645 | 9,381 |
| Virginia Electric and Power Co. 3.15% 2026 | 2,000 | 1,987 |
| Virginia Electric and Power Co., Series B, 5.95% 2017 | 8,000 | 8,244 |
| Xcel Energy Inc. 4.70% 2020 | 15,451 | 16,434 |
| Xcel Energy Inc. 2.40% 2021 | 14,867 | 14,786 |
| Xcel Energy Inc. 2.60% 2022 | 3,645 | 3,631 |
| Xcel Energy Inc. 3.30% 2025 | 3,099 | 3,101 |
| Xcel Energy Inc. 3.35% 2026 | 4,305 | 4,311 |
| Xcel Energy Inc. 6.50% 2036 | 5,000 | 6,296 |
| | | 828,641 |
| Consumer staples 2.04% | | |
| Altria Group, Inc. 2.625% 2020 | 15,195 | 15,371 |
| Altria Group, Inc. 2.95% 2023 | 6,500 | 6,498 |
| Altria Group, Inc. 4.00% 2024 | 3,600 | 3,805 |
| Altria Group, Inc. 2.625% 2026 | 4,420 | 4,188 |
| Altria Group, Inc. 4.50% 2043 | 3,500 | 3,564 |
| Altria Group, Inc. 5.375% 2044 | 3,105 | 3,594 |
| Altria Group, Inc. 3.875% 2046 | 20,845 | 19,279 |
| Anheuser-Busch InBev NV 2.65% 2021 | 9,350 | 9,402 |
| Anheuser-Busch InBev NV 3.30% 2023 | 7,725 | 7,864 |
| Anheuser-Busch InBev NV 3.65% 2026 | 38,820 | 39,423 |
| Anheuser-Busch InBev NV 4.90% 2046 | 3,750 | 4,042 |
| British American Tobacco International Finance PLC 2.75% 20203 | 6,200 | 6,232 |
| British American Tobacco International Finance PLC 3.50% 20223 | 4,495 | 4,606 |
| British American Tobacco International Finance PLC 3.95% 20253 | 6,200 | 6,419 |
| Coca-Cola Co. 1.55% 2021 | 22,500 | 21,857 |
| Coca-Cola Co. 2.25% 2026 | 13,400 | 12,616 |
| CVS Health Corp. 1.90% 2018 | 5,150 | 5,171 |
| CVS Health Corp. 2.80% 2020 | 5,150 | 5,229 |
| CVS Health Corp. 2.125% 2021 | 13,745 | 13,519 |
| CVS Health Corp. 3.50% 2022 | 5,150 | 5,293 |
| Danone SA 2.947% 20263 | 6,450 | 6,147 |
| Imperial Tobacco Finance PLC 2.05% 20183 | 3,050 | 3,053 |
| Imperial Tobacco Finance PLC 3.50% 20233 | 2,673 | 2,696 |
| Kraft Heinz Co. 3.00% 2026 | 16,000 | 15,030 |
| Kraft Heinz Co. 6.50% 2040 | 2,000 | 2,441 |
| Kraft Heinz Co. 4.375% 2046 | 16,815 | 15,855 |
| Kroger Co. 2.00% 2019 | 4,430 | 4,441 |
| Kroger Co. 2.60% 2021 | 10,500 | 10,480 |
| Kroger Co. 3.50% 2026 | 2,235 | 2,246 |
| Molson Coors Brewing Co. 1.45% 2019 | 4,980 | 4,907 |
| Molson Coors Brewing Co. 2.10% 2021 | 6,705 | 6,531 |
| Molson Coors Brewing Co. 3.00% 2026 | 20,210 | 19,115 |
| Molson Coors Brewing Co. 4.20% 2046 | 710 | 663 |
The Bond Fund of America — Page 16 of 43
Bonds, notes & other debt instruments
Corporate bonds & notes (continued)
Consumer staples (continued) | Principal amount
(000) | Value
(000) |
| Mondelez International, Inc. 1.625% 20193 | $27,300 | $26,767 |
| PepsiCo, Inc. 1.35% 2019 | 10,500 | 10,419 |
| PepsiCo, Inc. 1.70% 2021 | 2,630 | 2,557 |
| PepsiCo, Inc. 2.375% 2026 | 18,300 | 17,316 |
| PepsiCo, Inc. 3.45% 2046 | 12,810 | 11,675 |
| Pernod Ricard SA 2.95% 20173 | 13,500 | 13,507 |
| Pernod Ricard SA 4.45% 20223 | 25,050 | 26,582 |
| Philip Morris International Inc. 2.75% 2026 | 14,100 | 13,551 |
| Philip Morris International Inc. 4.25% 2044 | 25,195 | 24,888 |
| Procter & Gamble Co. 1.70% 2021 | 8,250 | 8,106 |
| Procter & Gamble Co. 2.45% 2026 | 6,700 | 6,419 |
| Reynolds American Inc. 2.30% 2018 | 4,365 | 4,394 |
| Reynolds American Inc. 3.25% 2020 | 12,135 | 12,437 |
| Reynolds American Inc. 3.25% 2022 | 19,360 | 19,303 |
| Reynolds American Inc. 4.00% 2022 | 4,140 | 4,331 |
| Reynolds American Inc. 4.85% 2023 | 3,750 | 4,074 |
| Reynolds American Inc. 4.45% 2025 | 20,470 | 21,622 |
| Reynolds American Inc. 5.70% 2035 | 750 | 863 |
| Reynolds American Inc. 4.75% 2042 | 2,500 | 2,460 |
| Reynolds American Inc. 6.15% 2043 | 5,700 | 6,890 |
| Reynolds American Inc. 5.85% 2045 | 17,170 | 20,370 |
| Unilever Capital Corp. 1.375% 2021 | 16,500 | 15,843 |
| Walgreens Boots Alliance, Inc. 1.75% 2018 | 13,300 | 13,316 |
| Walgreens Boots Alliance, Inc. 2.60% 2021 | 24,495 | 24,345 |
| Walgreens Boots Alliance, Inc. 3.10% 2023 | 4,495 | 4,467 |
| Walgreens Boots Alliance, Inc. 3.45% 2026 | 1,615 | 1,586 |
| Walgreens Boots Alliance, Inc. 4.65% 2046 | 1,045 | 1,063 |
| WM. Wrigley Jr. Co 2.90% 20193 | 2,800 | 2,849 |
| WM. Wrigley Jr. Co 3.375% 20203 | 36,879 | 37,915 |
| | | 651,492 |
| Real estate 1.80% | | |
| Alexandria Real Estate Equities, Inc. 2.75% 2020 | 4,815 | 4,804 |
| Alexandria Real Estate Equities, Inc. 3.90% 2023 | 7,250 | 7,363 |
| Alexandria Real Estate Equities, Inc. 4.30% 2026 | 775 | 797 |
| Alexandria Real Estate Equities, Inc. 4.50% 2029 | 755 | 756 |
| American Campus Communities, Inc. 3.35% 2020 | 19,670 | 19,998 |
| American Campus Communities, Inc. 3.75% 2023 | 17,860 | 18,026 |
| American Campus Communities, Inc. 4.125% 2024 | 11,095 | 11,380 |
| American Tower Corp. 3.40% 2019 | 18,075 | 18,474 |
| AvalonBay Communities, Inc. 4.20% 2023 | 5,000 | 5,285 |
| Boston Properties, Inc. 3.65% 2026 | 6,025 | 5,953 |
| Brandywine Operating Partnership, LP 5.70% 2017 | 25 | 25 |
| Brandywine Operating Partnership, LP 3.95% 2023 | 100 | 100 |
| Communications Sales & Leasing, Inc. 6.00% 20233 | 1,675 | 1,734 |
| Corporate Office Properties LP 3.60% 2023 | 2,834 | 2,728 |
| Corporate Office Properties LP 5.25% 2024 | 936 | 975 |
| Corporate Office Properties LP 5.00% 2025 | 9,320 | 9,524 |
| Crown Castle International Corp. 2.25% 2021 | 7,000 | 6,773 |
| DCT Industrial Trust Inc. 4.50% 2023 | 10,030 | 10,185 |
| DDR Corp. 4.25% 2026 | 6,285 | 6,323 |
| Developers Diversified Realty Corp. 7.50% 2017 | 32,727 | 33,180 |
| Developers Diversified Realty Corp. 4.75% 2018 | 1,225 | 1,260 |
| Developers Diversified Realty Corp. 7.875% 2020 | 19,859 | 23,129 |
The Bond Fund of America — Page 17 of 43
Bonds, notes & other debt instruments
Corporate bonds & notes (continued)
Real estate (continued) | Principal amount
(000) | Value
(000) |
| EPR Properties 4.50% 2025 | $8,650 | $8,549 |
| EPR Properties 4.75% 2026 | 13,620 | 13,494 |
| ERP Operating LP 2.85% 2026 | 4,900 | 4,622 |
| Essex Portfolio L.P. 3.625% 2022 | 4,370 | 4,472 |
| Essex Portfolio L.P. 3.25% 2023 | 4,935 | 4,918 |
| Essex Portfolio L.P. 3.875% 2024 | 5,500 | 5,602 |
| Essex Portfolio L.P. 3.50% 2025 | 4,800 | 4,730 |
| Essex Portfolio L.P. 3.375% 2026 | 3,845 | 3,720 |
| Highwoods Properties, Inc. 3.625% 2023 | 3,000 | 2,968 |
| Hospitality Properties Trust 6.70% 2018 | 28,005 | 28,716 |
| Hospitality Properties Trust 4.25% 2021 | 19,750 | 20,435 |
| Hospitality Properties Trust 5.00% 2022 | 10,800 | 11,403 |
| Hospitality Properties Trust 4.50% 2023 | 15,765 | 15,724 |
| Hospitality Properties Trust 4.50% 2025 | 1,825 | 1,780 |
| Hospitality Properties Trust 5.25% 2026 | 8,250 | 8,354 |
| Host Hotels & Resorts LP 3.75% 2023 | 6,000 | 5,893 |
| Host Hotels & Resorts LP 4.50% 2026 | 2,150 | 2,179 |
| Kimco Realty Corp. 4.30% 2018 | 10,500 | 10,713 |
| Kimco Realty Corp. 6.875% 2019 | 4,000 | 4,482 |
| Kimco Realty Corp. 3.40% 2022 | 2,290 | 2,324 |
| Kimco Realty Corp. 2.70% 2024 | 13,865 | 13,272 |
| Omega Healthcare Investors, Inc. 4.375% 2023 | 2,100 | 2,080 |
| Omega Healthcare Investors, Inc. 5.25% 2026 | 3,800 | 3,906 |
| Piedmont Operating Partnership LP 3.40% 2023 | 2,800 | 2,647 |
| Piedmont Operating Partnership LP 4.45% 2024 | 3,000 | 2,989 |
| Prologis, Inc. 3.35% 2021 | 15,250 | 15,695 |
| Prologis, Inc. 4.25% 2023 | 6,390 | 6,786 |
| Prologis, Inc. 3.75% 2025 | 5,995 | 6,146 |
| Scentre Group 2.375% 20193 | 810 | 809 |
| Scentre Group 2.375% 20213 | 11,410 | 11,222 |
| Scentre Group 3.25% 20253 | 10,655 | 10,291 |
| Scentre Group 3.50% 20253 | 13,070 | 12,903 |
| Select Income REIT 4.15% 2022 | 8,710 | 8,626 |
| Simon Property Group, LP 2.35% 2022 | 4,485 | 4,423 |
| Simon Property Group, LP 3.25% 2026 | 29,395 | 28,839 |
| Tanger Factory Outlet Centers, Inc. 3.125% 2026 | 2,500 | 2,350 |
| UDR, Inc. 3.70% 2020 | 1,430 | 1,475 |
| Ventas, Inc. 3.125% 2023 | 3,000 | 2,946 |
| Ventas, Inc. 3.25% 2026 | 3,000 | 2,848 |
| WEA Finance LLC 2.70% 20193 | 15,525 | 15,706 |
| WEA Finance LLC 3.25% 20203 | 34,845 | 35,453 |
| WEA Finance LLC 3.75% 20243 | 20,710 | 20,942 |
| Weingarten Realty Investors 3.85% 2025 | 3,000 | 2,994 |
| Weingarten Realty Investors 3.25% 2026 | 1,755 | 1,657 |
| Welltower Inc. 4.25% 2026 | 3,000 | 3,111 |
| | | 573,966 |
| Industrials 1.08% | | |
| 3M Co. 1.625% 2021 | 2,200 | 2,143 |
| 3M Co. 2.25% 2026 | 12,500 | 11,730 |
| 3M Co. 3.125% 2046 | 1,500 | 1,337 |
| ABB Finance (USA) Inc. 2.875% 2022 | 1,000 | 1,010 |
| AerCap Holdings NV 3.75% 2019 | 1,850 | 1,889 |
| AerCap Holdings NV 3.95% 2022 | 15,700 | 15,877 |
The Bond Fund of America — Page 18 of 43
Bonds, notes & other debt instruments
Corporate bonds & notes (continued)
Industrials (continued) | Principal amount
(000) | Value
(000) |
| Air Lease Corp. 2.125% 2020 | $6,500 | $6,404 |
| Air Lease Corp. 3.00% 2023 | 4,000 | 3,823 |
| European Aeronautic Defence and Space Company 2.70% 20233 | 885 | 871 |
| Allison Transmission Holdings, Inc. 5.00% 20243 | 300 | 304 |
| Builders FirstSource, Inc. 5.625% 20243 | 650 | 656 |
| Canadian National Railway Co. 3.20% 2046 | 2,105 | 1,851 |
| Caterpillar Inc. 1.70% 2021 | 6,750 | 6,482 |
| CEVA Group PLC, Apollo Global Securities LLC LOC, 5.969% 20214,6,7 | 555 | 454 |
| CEVA Logistics Canada, ULC, Term Loan, 6.50% 20214,6,7 | 98 | 80 |
| CEVA Logistics Holdings BV, Term Loan, 6.50% 20214,6,7 | 569 | 465 |
| CEVA Logistics U.S. Holdings Inc., Term Loan B, 6.50% 20214,6,7 | 785 | 642 |
| Continental Airlines, Inc., Series 1998-1, Class B, 6.748% 20187 | 514 | 519 |
| Continental Airlines, Inc., Series 1998-1, Class A, 6.648% 20197 | 2,314 | 2,348 |
| Continental Airlines, Inc., Series 1997-4, Class A, 6.90% 20197 | 3,115 | 3,144 |
| Continental Airlines, Inc., Series 2000-2, Class B, 8.307% 20197 | 40 | 42 |
| Continental Airlines, Inc., Series 1999-1, Class A, 6.545% 20207 | 5,338 | 5,586 |
| Continental Airlines, Inc., Series 1999-1, Class B, 6.795% 20207 | 429 | 438 |
| Continental Airlines, Inc., Series 1999-2, Class A1, 7.256% 20217 | 141 | 150 |
| Continental Airlines, Inc., Series 2001-1, Class A1, 6.703% 20227 | 2,535 | 2,712 |
| Continental Airlines, Inc., Series 2000-2, Class A1, 7.707% 20227 | 6,018 | 6,496 |
| Continental Airlines, Inc., Series 2000-1, Class A1, 8.048% 20227 | 5,355 | 5,927 |
| Corporate Risk Holdings LLC 9.50% 20193 | 3,315 | 3,423 |
| Corporate Risk Holdings LLC 13.50% 20203,5,8 | 1,141 | 1,267 |
| DAE Aviation Holdings, Inc. 10.00% 20233 | 830 | 878 |
| Delta Air Lines, Inc., Series 2002-1, Class G1, MBIA insured, 6.718% 20247 | 1,130 | 1,286 |
| ENA Norte Trust 4.95% 20283,7 | 2,834 | 2,947 |
| ERAC USA Finance Co. 2.60% 20213 | 7,500 | 7,382 |
| ERAC USA Finance Co. 2.70% 20233 | 4,725 | 4,541 |
| ERAC USA Finance Co. 4.20% 20463 | 4,560 | 4,176 |
| Euramax International, Inc. 12.00% 20203 | 2,075 | 2,251 |
| FedEx Corp. 3.25% 2026 | 16,100 | 15,998 |
| FedEx Corp. 4.75% 2045 | 1,080 | 1,121 |
| Fortive Corp. 2.35% 20213 | 3,550 | 3,503 |
| General Electric Capital Corp. 2.342% 2020 | 16,841 | 16,812 |
| General Electric Capital Corp., Series A, 6.00% 2019 | 3,007 | 3,322 |
| General Electric Corp. 5.25% 2017 | 4,377 | 4,535 |
| Hardwoods Acquisition Inc 7.50% 20213 | 1,400 | 1,190 |
| HDTFS Inc. 5.875% 2020 | 1,475 | 1,449 |
| HDTFS Inc. 5.50% 20243 | 1,125 | 989 |
| Honeywell International Inc. 1.85% 2021 | 20,575 | 20,101 |
| Honeywell International Inc. 2.50% 2026 | 14,395 | 13,650 |
| Lima Metro Line Finance Ltd. 5.875% 20343,7 | 3,167 | 3,357 |
| Lockheed Martin Corp. 1.85% 2018 | 1,100 | 1,105 |
| Lockheed Martin Corp. 2.50% 2020 | 6,245 | 6,299 |
| Lockheed Martin Corp. 3.10% 2023 | 1,345 | 1,360 |
| Lockheed Martin Corp. 3.55% 2026 | 7,350 | 7,513 |
| Lockheed Martin Corp. 4.50% 2036 | 715 | 761 |
| Lockheed Martin Corp. 4.70% 2046 | 3,935 | 4,289 |
| LSC Communications, Inc. 8.75% 20233 | 675 | 680 |
| Navios Maritime Acquisition Corp. and Navios Acquisition Finance (US) Inc. 8.125% 20213 | 2,000 | 1,710 |
| Navios Maritime Holdings Inc. 7.375% 20223 | 2,000 | 1,210 |
| Navios Maritime Holdings Inc. and Navios Maritime Finance II (US) Inc. 8.125% 2019 | 1,000 | 762 |
| Norfolk Southern Corp. 3.25% 2021 | 4,745 | 4,874 |
| PACCAR Inc. 1.65% 2021 | 5,050 | 4,850 |
The Bond Fund of America — Page 19 of 43
Bonds, notes & other debt instruments
Corporate bonds & notes (continued)
Industrials (continued) | Principal amount
(000) | Value
(000) |
| Ply Gem Industries, Inc. 6.50% 2022 | $1,350 | $1,406 |
| R.R. Donnelley & Sons Co. 7.875% 2021 | 1,475 | 1,527 |
| R.R. Donnelley & Sons Co. 7.00% 2022 | 19 | 19 |
| R.R. Donnelley & Sons Co. 6.50% 2023 | 850 | 832 |
| Red de Carreteras de Occidente 9.00% 20287 | MXN61,570 | 2,751 |
| Republic Services, Inc. 3.55% 2022 | $500 | 519 |
| Roper Technologies, Inc. 2.80% 2021 | 6,585 | 6,583 |
| Roper Technologies, Inc. 3.80% 2026 | 11,240 | 11,333 |
| Siemens AG 1.30% 20193 | 14,750 | 14,470 |
| Siemens AG 2.15% 20203 | 5,000 | 4,969 |
| Siemens AG 1.70% 20213 | 13,500 | 12,966 |
| Siemens AG 2.90% 20223 | 5,000 | 5,036 |
| Siemens AG 2.35% 20263 | 11,500 | 10,641 |
| Siemens AG 4.40% 20453 | 2,000 | 2,108 |
| Silver II Borrower S.C.A./Silver II U.S. Holdings, LLC 7.75% 20203 | 2,000 | 1,675 |
| Union Pacific Corp. 5.75% 2017 | 12,250 | 12,721 |
| United Rentals, Inc. 5.50% 2025 | 550 | 563 |
| United Technologies Corp. 1.95% 2021 | 12,010 | 11,769 |
| United Technologies Corp. 2.65% 2026 | 5,040 | 4,838 |
| United Technologies Corp. 3.75% 2046 | 5,000 | 4,761 |
| | | 344,458 |
| Telecommunication services 1.03% | | |
| América Móvil, SAB de CV 8.46% 2036 | MXN27,000 | 1,146 |
| AT&T Inc. 3.00% 2022 | $14,600 | 14,334 |
| AT&T Inc. 3.40% 2025 | 12,400 | 11,957 |
| AT&T Inc. 4.125% 2026 | 13,200 | 13,372 |
| AT&T Inc. 8.25% 2031 | 2,534 | 3,525 |
| AT&T Inc. 4.50% 2035 | 8,175 | 7,911 |
| AT&T Inc. 4.35% 2045 | 6,932 | 6,189 |
| AT&T Inc. 4.75% 2046 | 6,818 | 6,472 |
| AT&T Inc. 4.50% 2048 | 4,100 | 3,711 |
| Cequel Communications Holdings I, LLC and Cequel Capital Corp. 6.375% 20203 | 2,950 | 3,046 |
| Deutsche Telekom International Finance BV 1.50% 20193 | 18,900 | 18,599 |
| Deutsche Telekom International Finance BV 1.95% 20213 | 38,200 | 36,815 |
| Deutsche Telekom International Finance BV 9.25% 2032 | 4,994 | 7,713 |
| Digicel Group Ltd. 6.00% 20213 | 4,465 | 4,060 |
| Digicel Group Ltd. 7.125% 20223 | 1,975 | 1,542 |
| France Télécom 9.00% 2031 | 5,053 | 7,602 |
| Frontier Communications Corp. 11.00% 2025 | 3,575 | 3,705 |
| Inmarsat PLC 4.875% 20223 | 1,575 | 1,539 |
| Inmarsat PLC 6.50% 20243 | 975 | 992 |
| Intelsat Jackson Holding Co. 7.25% 2019 | 2,450 | 2,070 |
| Intelsat Jackson Holding Co. 7.25% 2020 | 2,750 | 2,145 |
| Ligado Networks, Term Loan, 9.75% 20204,6,7,8 | 7,680 | 7,136 |
| MetroPCS Wireless, Inc. 6.25% 2021 | 2,900 | 3,023 |
| Orange SA 2.75% 2019 | 3,230 | 3,273 |
| SoftBank Corp. 4.50% 20203 | 3,250 | 3,339 |
| SoftBank Group Corp. 3.36% 20233,7 | 44,800 | 44,893 |
| Telefónica Emisiones, SAU 3.192% 2018 | 10,500 | 10,653 |
| TELUS Corp. 2.80% 2027 | 9,730 | 9,117 |
| Trilogy International Partners, LLC 13.375% 20193 | 3,725 | 3,837 |
| Verizon Communications Inc. 1.75% 2021 | 6,225 | 5,973 |
| Verizon Communications Inc. 2.625% 2026 | 24,300 | 22,382 |
The Bond Fund of America — Page 20 of 43
Bonds, notes & other debt instruments
Corporate bonds & notes (continued)
Telecommunication services (continued) | Principal amount
(000) | Value
(000) |
| Verizon Communications Inc. 4.272% 2036 | $13,016 | $12,478 |
| Verizon Communications Inc. 3.85% 2042 | 7,485 | 6,499 |
| Verizon Communications Inc. 4.125% 2046 | 20,682 | 18,756 |
| Verizon Communications Inc. 4.522% 2048 | 8,538 | 8,204 |
| Wind Acquisition SA 7.375% 20213 | 6,150 | 6,411 |
| Windstream Holdings, Inc. 7.75% 2021 | 4,275 | 4,416 |
| Ziggo Bond Finance BV 5.50% 20273 | 1,400 | 1,368 |
| | | 330,203 |
| Information technology 0.87% | | |
| Alphabet Inc. 1.998% 2026 | 8,290 | 7,607 |
| Analog Devices, Inc. 2.50% 2021 | 3,635 | 3,602 |
| Analog Devices, Inc. 3.125% 2023 | 8,750 | 8,749 |
| Analog Devices, Inc. 3.50% 2026 | 6,350 | 6,281 |
| Apple Inc. 1.55% 2021 | 16,675 | 16,117 |
| Apple Inc. 2.25% 2021 | 13,250 | 13,249 |
| Apple Inc. 2.45% 2026 | 5,950 | 5,583 |
| Apple Inc. 3.85% 2046 | 5,950 | 5,704 |
| BMC Software, Inc. 8.125% 20213 | 7,675 | 7,210 |
| Camelot Finance SA 7.875% 20243 | 5,975 | 6,199 |
| Cisco Systems, Inc. 1.85% 2021 | 40,175 | 39,209 |
| Dell Inc. 4.42% 20213 | 6,410 | 6,634 |
| Dell Inc. 8.35% 20463 | 875 | 1,079 |
| EchoStar Corp. 6.625% 20263 | 1,500 | 1,511 |
| First Data Corp. 5.375% 20233 | 1,350 | 1,404 |
| Gogo Inc. 12.50% 20223 | 4,500 | 4,894 |
| Harris Corp. 1.999% 2018 | 6,800 | 6,805 |
| Harris Corp. 2.70% 2020 | 3,010 | 3,007 |
| Harris Corp. 3.832% 2025 | 1,890 | 1,921 |
| Harris Corp. 4.854% 2035 | 2,765 | 2,909 |
| International Business Machines Corp. 3.45% 2026 | 3,400 | 3,478 |
| JDA Software Group, Inc. 7.375% 20243 | 1,400 | 1,454 |
| Kronos Inc., Term Loan B, 9.25% 20244,6,7 | 1,475 | 1,522 |
| Microsoft Corp. 1.55% 2021 | 25,245 | 24,479 |
| Microsoft Corp. 2.40% 2026 | 13,200 | 12,474 |
| Microsoft Corp. 3.70% 2046 | 16,225 | 15,282 |
| Oracle Corp. 1.90% 2021 | 25,675 | 25,082 |
| Oracle Corp. 2.80% 2021 | 5,600 | 5,706 |
| Oracle Corp. 2.65% 2026 | 17,000 | 16,132 |
| Oracle Corp. 4.00% 2046 | 4,525 | 4,330 |
| Qorvo, Inc. 7.00% 2025 | 1,300 | 1,446 |
| Seagate Technology LLC 4.75% 2023 | 1,475 | 1,463 |
| Visa Inc. 3.15% 2025 | 13,200 | 13,255 |
| Western Digital Corp. 7.375% 20233 | 925 | 1,020 |
| Xerox Corp. 2.95% 2017 | 2,535 | 2,543 |
| | | 279,340 |
| Materials 0.74% | | |
| Agrium Inc. 4.125% 2035 | 4,945 | 4,541 |
| Air Liquide SA 1.75% 20213 | 12,560 | 12,090 |
| Air Liquide SA 2.50% 20263 | 14,900 | 14,017 |
| Anglo American Capital PLC 4.125% 20213 | 725 | 741 |
| ArcelorMittal 7.75% 2041 | 4,095 | 4,382 |
| Ball Corp. 4.375% 2020 | 550 | 577 |
The Bond Fund of America — Page 21 of 43
Bonds, notes & other debt instruments
Corporate bonds & notes (continued)
Materials (continued) | Principal amount
(000) | Value
(000) |
| BHP Billiton Finance (USA) Ltd. 3.85% 2023 | $3,400 | $3,598 |
| BHP Billiton Finance Ltd. 6.25% 20753 | 7,995 | 8,688 |
| BHP Billiton Finance Ltd. 6.75% 20753 | 6,445 | 7,251 |
| CF Industries, Inc. 4.50% 20263 | 695 | 683 |
| CF Industries, Inc. 4.95% 2043 | 1,520 | 1,250 |
| Chemours Co. 6.625% 2023 | 2,360 | 2,348 |
| Chemours Co. 7.00% 2025 | 3,055 | 3,024 |
| Cliffs Natural Resources Inc. 8.00% 20203 | 100 | 105 |
| Cliffs Natural Resources Inc. 8.25% 20203 | 2,650 | 2,915 |
| Corporación Nacional del Cobre de Chile 3.00% 2022 | 13,580 | 13,176 |
| Corporación Nacional del Cobre de Chile 4.50% 2025 | 3,750 | 3,816 |
| CRH America, Inc. 3.875% 20253 | 6,100 | 6,214 |
| CRH America, Inc. 5.125% 20453 | 2,000 | 2,087 |
| Eastman Chemical Co. 3.80% 2025 | 4,005 | 4,041 |
| Ecolab Inc. 3.25% 2023 | 2,260 | 2,302 |
| Ecolab Inc. 2.70% 2026 | 5,570 | 5,306 |
| Ecolab Inc. 3.70% 2046 | 3,570 | 3,253 |
| First Quantum Minerals Ltd. 6.75% 20203 | 1,899 | 1,904 |
| First Quantum Minerals Ltd. 7.00% 20213 | 4,549 | 4,547 |
| First Quantum Minerals Ltd. 7.25% 20223 | 6,775 | 6,707 |
| Georgia Gulf Corp. 4.625% 2021 | 625 | 642 |
| Georgia-Pacific Corp. 5.40% 20203 | 2,000 | 2,199 |
| Glencore Funding LLC 4.00% 20253 | 5,570 | 5,468 |
| Glencore Xstrata LLC 4.625% 20243 | 1,220 | 1,252 |
| Holcim Ltd. 5.15% 20233 | 3,315 | 3,596 |
| Huntsman International LLC 4.875% 2020 | 1,225 | 1,276 |
| International Paper Co. 3.65% 2024 | 8,900 | 9,003 |
| Monsanto Co. 3.375% 2024 | 7,400 | 7,371 |
| Novelis Corp. 5.875% 20263 | 700 | 709 |
| Packaging Corp. of America 4.50% 2023 | 1,585 | 1,680 |
| Potash Corp. of Saskatchewan Inc. 4.00% 2026 | 10,000 | 10,069 |
| Praxair, Inc. 2.25% 2020 | 8,339 | 8,318 |
| Rayonier Advanced Materials Inc. 5.50% 20243 | 700 | 658 |
| Rio Tinto Finance PLC 3.75% 2025 | 12,000 | 12,364 |
| Rio Tinto PLC 4.125% 2042 | 1,500 | 1,476 |
| Ryerson Inc. 11.00% 20223 | 2,905 | 3,203 |
| Vale Overseas Ltd. 5.875% 2021 | 15,200 | 15,960 |
| Vale Overseas Ltd. 4.375% 2022 | 1,050 | 1,034 |
| Vale Overseas Ltd. 6.25% 2026 | 15,258 | 15,906 |
| Vale Overseas Ltd. 6.875% 2039 | 4,500 | 4,399 |
| Xstrata Canada Financial Corp. 4.95% 20213 | 6,200 | 6,641 |
| Yara International ASA 7.875% 20193 | 2,175 | 2,432 |
| | | 235,219 |
| Total corporate bonds & notes | | 9,532,098 |
Mortgage-backed obligations 18.43%
Federal agency mortgage-backed obligations 15.91% | | |
| Fannie Mae 3.189% 20177 | 1,908 | 1,922 |
| Fannie Mae 10.999% 20207 | 13 | 14 |
| Fannie Mae 5.00% 20237 | 1,006 | 1,075 |
| Fannie Mae 5.50% 20237 | 5,422 | 5,809 |
| Fannie Mae 6.00% 20237 | 155 | 167 |
| Fannie Mae 4.50% 20247 | 3,446 | 3,657 |
The Bond Fund of America — Page 22 of 43
Bonds, notes & other debt instruments
Mortgage-backed obligations (continued)
Federal agency mortgage-backed obligations (continued) | Principal amount
(000) | Value
(000) |
| Fannie Mae 4.50% 20257 | $3,887 | $4,104 |
| Fannie Mae 4.50% 20257 | 2,515 | 2,663 |
| Fannie Mae 4.50% 20257 | 1,899 | 2,002 |
| Fannie Mae 6.00% 20267 | 2,832 | 3,201 |
| Fannie Mae 2.50% 20277 | 16,668 | 16,716 |
| Fannie Mae 2.50% 20277 | 5,110 | 5,125 |
| Fannie Mae 2.50% 20277 | 3,218 | 3,228 |
| Fannie Mae 2.50% 20277 | 1,427 | 1,431 |
| Fannie Mae 2.50% 20277 | 1,084 | 1,087 |
| Fannie Mae 2.50% 20277 | 1,054 | 1,057 |
| Fannie Mae 2.50% 20277 | 831 | 833 |
| Fannie Mae 2.50% 20277 | 605 | 607 |
| Fannie Mae 2.50% 20277 | 530 | 532 |
| Fannie Mae 2.50% 20277 | 486 | 488 |
| Fannie Mae 5.50% 20277 | 1,300 | 1,444 |
| Fannie Mae 2.50% 20287 | 17,545 | 17,596 |
| Fannie Mae 2.50% 20287 | 4,960 | 4,975 |
| Fannie Mae 6.00% 20287 | 398 | 450 |
| Fannie Mae 2.50% 20317 | 29,499 | 29,567 |
| Fannie Mae 2.50% 20317 | 10,925 | 10,950 |
| Fannie Mae 2.50% 20317 | 1,165 | 1,168 |
| Fannie Mae 2.50% 20327 | 80,000 | 80,184 |
| Fannie Mae 2.50% 20327 | 21,750 | 21,801 |
| Fannie Mae 2.50% 20327,9 | 4,000 | 4,005 |
| Fannie Mae 6.50% 20327 | 109 | 115 |
| Fannie Mae 3.00% 20357 | 26,457 | 26,805 |
| Fannie Mae 3.50% 20357 | 3,364 | 3,489 |
| Fannie Mae 4.00% 20367 | 20,368 | 21,652 |
| Fannie Mae 4.00% 20367 | 9,336 | 9,926 |
| Fannie Mae 4.00% 20367 | 6,974 | 7,422 |
| Fannie Mae 4.00% 20367 | 5,852 | 6,222 |
| Fannie Mae 4.00% 20367 | 3,745 | 3,987 |
| Fannie Mae 4.00% 20367 | 3,700 | 3,939 |
| Fannie Mae 4.00% 20367 | 1,738 | 1,847 |
| Fannie Mae 4.00% 20367 | 733 | 780 |
| Fannie Mae 7.00% 20367 | 137 | 151 |
| Fannie Mae 7.00% 20367 | 84 | 88 |
| Fannie Mae 7.50% 20367 | 352 | 392 |
| Fannie Mae 8.00% 20367 | 192 | 215 |
| Fannie Mae 6.00% 20377 | 751 | 817 |
| Fannie Mae 6.00% 20377 | 343 | 373 |
| Fannie Mae 6.50% 20377 | 1,296 | 1,486 |
| Fannie Mae 6.50% 20377 | 820 | 903 |
| Fannie Mae 6.50% 20377 | 785 | 857 |
| Fannie Mae 7.00% 20377 | 466 | 512 |
| Fannie Mae 7.00% 20377 | 448 | 492 |
| Fannie Mae 7.00% 20377 | 168 | 180 |
| Fannie Mae 7.00% 20377 | 115 | 128 |
| Fannie Mae 7.00% 20377 | 97 | 107 |
| Fannie Mae 7.00% 20377 | 65 | 71 |
| Fannie Mae 7.50% 20377 | 256 | 285 |
| Fannie Mae 7.50% 20377 | 123 | 133 |
| Fannie Mae 7.50% 20377 | 112 | 123 |
| Fannie Mae 7.50% 20377 | 96 | 106 |
The Bond Fund of America — Page 23 of 43
Bonds, notes & other debt instruments
Mortgage-backed obligations (continued)
Federal agency mortgage-backed obligations (continued) | Principal amount
(000) | Value
(000) |
| Fannie Mae 7.50% 20377 | $79 | $92 |
| Fannie Mae 7.50% 20377 | 61 | 68 |
| Fannie Mae 7.50% 20377 | 63 | 66 |
| Fannie Mae 7.50% 20377 | 26 | 28 |
| Fannie Mae 5.50% 20387 | 22 | 24 |
| Fannie Mae 6.00% 20387 | 578 | 654 |
| Fannie Mae 6.50% 20387 | 32,399 | 37,138 |
| Fannie Mae 4.50% 20397 | 10,989 | 11,848 |
| Fannie Mae 5.00% 20397 | 9,623 | 10,636 |
| Fannie Mae 5.50% 20397 | 8,460 | 9,453 |
| Fannie Mae 4.00% 20407 | 7,803 | 8,232 |
| Fannie Mae 4.00% 20407 | 7,657 | 8,057 |
| Fannie Mae 4.00% 20407 | 5,245 | 5,522 |
| Fannie Mae 4.00% 20407 | 1,394 | 1,467 |
| Fannie Mae 4.00% 20407 | 1,356 | 1,436 |
| Fannie Mae 4.00% 20407 | 433 | 457 |
| Fannie Mae 4.50% 20407 | 2,350 | 2,533 |
| Fannie Mae 5.00% 20407 | 919 | 1,004 |
| Fannie Mae 5.50% 20407 | 4,164 | 4,635 |
| Fannie Mae 4.00% 20417 | 4,027 | 4,253 |
| Fannie Mae 4.00% 20417 | 2,662 | 2,809 |
| Fannie Mae 4.00% 20417 | 2,112 | 2,237 |
| Fannie Mae 4.00% 20417 | 1,950 | 2,052 |
| Fannie Mae 4.00% 20417 | 1,280 | 1,353 |
| Fannie Mae 4.00% 20417 | 1,019 | 1,079 |
| Fannie Mae 4.00% 20417 | 683 | 724 |
| Fannie Mae 4.50% 20417 | 2,644 | 2,854 |
| Fannie Mae 5.00% 20417 | 8,081 | 8,847 |
| Fannie Mae 5.00% 20417 | 4,020 | 4,462 |
| Fannie Mae 5.00% 20417 | 2,881 | 3,200 |
| Fannie Mae 5.00% 20417 | 2,195 | 2,447 |
| Fannie Mae 5.00% 20417 | 1,423 | 1,587 |
| Fannie Mae 4.00% 20427 | 12,191 | 12,907 |
| Fannie Mae 4.00% 20427 | 11,787 | 12,451 |
| Fannie Mae 4.00% 20427 | 10,330 | 10,945 |
| Fannie Mae 4.00% 20427 | 5,887 | 6,191 |
| Fannie Mae 4.00% 20427 | 3,497 | 3,705 |
| Fannie Mae 4.00% 20427 | 953 | 1,003 |
| Fannie Mae 4.00% 20437 | 30,862 | 32,587 |
| Fannie Mae 4.00% 20437 | 9,314 | 9,861 |
| Fannie Mae 4.00% 20437 | 7,551 | 7,948 |
| Fannie Mae 3.50% 20447 | 49,426 | 50,944 |
| Fannie Mae 3.50% 20457 | 9,233 | 9,492 |
| Fannie Mae 4.00% 20457 | 81,968 | 86,227 |
| Fannie Mae 4.00% 20457 | 68,151 | 72,136 |
| Fannie Mae 4.00% 20457 | 54,947 | 57,784 |
| Fannie Mae 4.00% 20457 | 42,389 | 44,582 |
| Fannie Mae 4.00% 20457 | 28,431 | 29,904 |
| Fannie Mae 4.00% 20457 | 19,015 | 20,089 |
| Fannie Mae 4.00% 20457 | 16,912 | 17,785 |
| Fannie Mae 4.00% 20457 | 12,656 | 13,394 |
| Fannie Mae 4.00% 20457 | 11,126 | 11,777 |
| Fannie Mae 4.00% 20457 | 10,978 | 11,622 |
| Fannie Mae 3.00% 20467 | 201,532 | 200,354 |
The Bond Fund of America — Page 24 of 43
Bonds, notes & other debt instruments
Mortgage-backed obligations (continued)
Federal agency mortgage-backed obligations (continued) | Principal amount
(000) | Value
(000) |
| Fannie Mae 3.00% 20467 | $119,533 | $118,833 |
| Fannie Mae 3.00% 20467 | 104,556 | 103,996 |
| Fannie Mae 3.50% 20467 | 157,615 | 159,677 |
| Fannie Mae 3.50% 20467 | 116,005 | 117,522 |
| Fannie Mae 3.50% 20467 | 50,550 | 51,907 |
| Fannie Mae 3.50% 20467 | 33,185 | 34,076 |
| Fannie Mae 3.50% 20467 | 23,698 | 24,334 |
| Fannie Mae 3.50% 20467 | 18,361 | 18,646 |
| Fannie Mae 3.50% 20467 | 15,978 | 16,431 |
| Fannie Mae 3.50% 20467 | 9,094 | 9,338 |
| Fannie Mae 3.50% 20467 | 2,885 | 2,966 |
| Fannie Mae 3.50% 20467 | 1,389 | 1,428 |
| Fannie Mae 3.50% 20467 | 1,295 | 1,329 |
| Fannie Mae 3.50% 20467 | 707 | 727 |
| Fannie Mae 4.00% 20467 | 114,696 | 120,661 |
| Fannie Mae 4.00% 20467 | 77,361 | 81,420 |
| Fannie Mae 4.00% 20467 | 59,752 | 63,171 |
| Fannie Mae 4.00% 20467 | 53,644 | 56,437 |
| Fannie Mae 4.00% 20467 | 44,270 | 46,552 |
| Fannie Mae 4.00% 20467 | 43,380 | 45,639 |
| Fannie Mae 4.00% 20467 | 17,856 | 18,523 |
| Fannie Mae 4.00% 20467 | 13,570 | 14,277 |
| Fannie Mae 4.00% 20467 | 10,218 | 10,600 |
| Fannie Mae 4.00% 20467 | 6,252 | 6,486 |
| Fannie Mae 4.00% 20467 | 6,230 | 6,458 |
| Fannie Mae 4.00% 20467 | 5,810 | 6,027 |
| Fannie Mae 4.00% 20467 | 3,735 | 3,870 |
| Fannie Mae 4.50% 20467 | 47,758 | 51,470 |
| Fannie Mae 4.50% 20467 | 37,144 | 40,118 |
| Fannie Mae 4.50% 20467 | 37,074 | 39,962 |
| Fannie Mae 4.50% 20467 | 5,493 | 5,930 |
| Fannie Mae 4.50% 20467 | 3,192 | 3,441 |
| Fannie Mae 4.50% 20467 | 2,641 | 2,787 |
| Fannie Mae 4.50% 20467 | 1,915 | 1,991 |
| Fannie Mae 4.50% 20467 | 1,391 | 1,499 |
| Fannie Mae 4.50% 20467 | 1,368 | 1,479 |
| Fannie Mae 4.50% 20467 | 1,221 | 1,318 |
| Fannie Mae 4.50% 20467 | 1,043 | 1,129 |
| Fannie Mae 3.50% 20477,9 | 16,000 | 16,390 |
| Fannie Mae 4.00% 20477,9 | 217,389 | 228,449 |
| Fannie Mae 4.50% 20477,9 | 148,575 | 159,591 |
| Fannie Mae 4.50% 20477,9 | 126,550 | 136,086 |
| Fannie Mae 7.00% 20477 | 50 | 57 |
| Fannie Mae 7.00% 20477 | 14 | 16 |
| Fannie Mae, Series 2002-15, Class PG, 6.00% 20177 | 2 | 2 |
| Fannie Mae, Series 2001-4, Class GA, 9.349% 20254,7 | 37 | 41 |
| Fannie Mae, Series 2001-4, Class NA, 9.653% 20254,7 | 30 | 32 |
| Fannie Mae, Series 1998-W5, Class B3, 6.50% 20287 | 778 | 772 |
| Fannie Mae, Series 2002-W7, Class A5, 7.50% 20297 | 195 | 224 |
| Fannie Mae, Series 2001-25, Class ZA, 6.50% 20317 | 1,452 | 1,605 |
| Fannie Mae, Series 2001-20, Class E, 9.586% 20314,7 | 7 | 8 |
| Fannie Mae, Series 2006-51, Class PO, principal only, 0% 20367 | 1,468 | 1,304 |
| Fannie Mae, Series 2006-32, Class OA, principal only, 0% 20367 | 1,344 | 1,171 |
| Fannie Mae, Series 2006-96, Class OP, principal only, 0% 20367 | 439 | 391 |
The Bond Fund of America — Page 25 of 43
Bonds, notes & other debt instruments
Mortgage-backed obligations (continued)
Federal agency mortgage-backed obligations (continued) | Principal amount
(000) | Value
(000) |
| Fannie Mae, Series 2001-T10, Class A1, 7.00% 20417 | $2,169 | $2,468 |
| Fannie Mae, Series 2001-50, Class BA, 7.00% 20417 | 475 | 536 |
| Fannie Mae, Series 2002-W3, Class A5, 7.50% 20417 | 1,213 | 1,398 |
| Fannie Mae, Series 2002-W1, Class 2A, 6.181% 20424,7 | 1,572 | 1,785 |
| Freddie Mac 5.00% 20237 | 946 | 1,007 |
| Freddie Mac 5.00% 20237 | 34 | 36 |
| Freddie Mac 5.00% 20237 | 5 | 5 |
| Freddie Mac 5.00% 20247 | 2,119 | 2,268 |
| Freddie Mac 4.50% 20307 | 1,133 | 1,217 |
| Freddie Mac 2.50% 20327 | 33,500 | 33,587 |
| Freddie Mac 3.50% 20347 | 14,088 | 14,539 |
| Freddie Mac 3.00% 20357 | 2,754 | 2,791 |
| Freddie Mac 3.00% 20357 | 2,262 | 2,299 |
| Freddie Mac 3.50% 20357 | 44,081 | 45,615 |
| Freddie Mac 3.50% 20357 | 28,224 | 29,207 |
| Freddie Mac 3.50% 20357 | 28,220 | 29,151 |
| Freddie Mac 3.50% 20357 | 23,054 | 23,813 |
| Freddie Mac 3.50% 20357 | 21,272 | 21,975 |
| Freddie Mac 3.50% 20357 | 7,360 | 7,603 |
| Freddie Mac 3.50% 20357 | 6,047 | 6,258 |
| Freddie Mac 3.50% 20357 | 3,737 | 3,860 |
| Freddie Mac 3.50% 20367 | 40,480 | 41,943 |
| Freddie Mac 4.00% 20367 | 46,728 | 49,622 |
| Freddie Mac 4.00% 20367 | 9,519 | 10,116 |
| Freddie Mac 4.00% 20367 | 3,667 | 3,897 |
| Freddie Mac 4.00% 20367 | 3,172 | 3,371 |
| Freddie Mac 4.50% 20377 | 4,955 | 5,340 |
| Freddie Mac 5.50% 20377 | 1,810 | 2,030 |
| Freddie Mac 5.50% 20377 | 45 | 51 |
| Freddie Mac 5.50% 20377 | 10 | 11 |
| Freddie Mac 7.00% 20377 | 154 | 166 |
| Freddie Mac 7.50% 20377 | 319 | 356 |
| Freddie Mac 5.50% 20387 | 1,367 | 1,522 |
| Freddie Mac 5.50% 20387 | 554 | 618 |
| Freddie Mac 5.50% 20387 | 233 | 260 |
| Freddie Mac 5.50% 20387 | 147 | 164 |
| Freddie Mac 4.50% 20397 | 1,222 | 1,314 |
| Freddie Mac 5.00% 20397 | 9,356 | 10,184 |
| Freddie Mac 5.50% 20397 | 10,460 | 11,616 |
| Freddie Mac 5.50% 20397 | 3,275 | 3,650 |
| Freddie Mac 4.50% 20407 | 22,283 | 23,979 |
| Freddie Mac 5.50% 20407 | 6 | 7 |
| Freddie Mac 4.50% 20417 | 9,032 | 9,726 |
| Freddie Mac 4.50% 20417 | 2,283 | 2,460 |
| Freddie Mac 4.50% 20417 | 1,292 | 1,397 |
| Freddie Mac 4.50% 20417 | 455 | 490 |
| Freddie Mac 5.00% 20417 | 7,556 | 8,300 |
| Freddie Mac 5.00% 20417 | 2,994 | 3,278 |
| Freddie Mac 5.50% 20417 | 4,780 | 5,328 |
| Freddie Mac 4.00% 20427 | 8,913 | 9,419 |
| Freddie Mac 4.00% 20437 | 17,162 | 18,137 |
| Freddie Mac 4.00% 20457 | 41,121 | 43,484 |
| Freddie Mac 3.50% 20467 | 286,045 | 293,083 |
| Freddie Mac 3.50% 20467 | 130,455 | 133,659 |
The Bond Fund of America — Page 26 of 43
Bonds, notes & other debt instruments
Mortgage-backed obligations (continued)
Federal agency mortgage-backed obligations (continued) | Principal amount
(000) | Value
(000) |
| Freddie Mac 3.50% 20467 | $82,907 | $84,945 |
| Freddie Mac 3.50% 20467 | 50,418 | 51,150 |
| Freddie Mac 3.50% 20467 | 47,345 | 48,038 |
| Freddie Mac 3.50% 20467 | 36,897 | 37,895 |
| Freddie Mac 3.50% 20467 | 35,000 | 35,905 |
| Freddie Mac 3.50% 20467 | 10,955 | 11,114 |
| Freddie Mac 3.50% 20467 | 9,454 | 9,710 |
| Freddie Mac 3.50% 20467 | 6,801 | 6,988 |
| Freddie Mac 3.50% 20467 | 3,955 | 4,057 |
| Freddie Mac 3.50% 20467 | 3,834 | 3,938 |
| Freddie Mac 3.50% 20467 | 3,377 | 3,464 |
| Freddie Mac 3.50% 20467 | 2,835 | 2,908 |
| Freddie Mac 3.50% 20467 | 2,000 | 2,052 |
| Freddie Mac 3.50% 20467 | 1,882 | 1,933 |
| Freddie Mac 3.50% 20467 | 1,678 | 1,721 |
| Freddie Mac 3.50% 20467 | 1,084 | 1,116 |
| Freddie Mac 3.50% 20467 | 1,027 | 1,058 |
| Freddie Mac 3.50% 20467 | 1,009 | 1,037 |
| Freddie Mac 4.00% 20467 | 48,302 | 50,760 |
| Freddie Mac 4.00% 20467 | 42,081 | 44,224 |
| Freddie Mac 4.00% 20467 | 29,747 | 31,252 |
| Freddie Mac 4.00% 20467 | 16,380 | 17,004 |
| Freddie Mac 4.00% 20467 | 2,094 | 2,174 |
| Freddie Mac 4.00% 20467 | 1,065 | 1,127 |
| Freddie Mac 4.00% 20467 | 1,002 | 1,062 |
| Freddie Mac 4.00% 20467 | 572 | 594 |
| Freddie Mac 4.50% 20467 | 3,692 | 3,972 |
| Freddie Mac 4.50% 20467 | 2,216 | 2,390 |
| Freddie Mac 4.50% 20467 | 1,139 | 1,240 |
| Freddie Mac 4.50% 20467 | 1,078 | 1,170 |
| Freddie Mac 4.50% 20467 | 999 | 1,084 |
| Freddie Mac 4.50% 20467 | 996 | 1,081 |
| Freddie Mac 4.00% 20477,9 | 35,700 | 37,481 |
| Freddie Mac 6.50% 20477 | 200 | 223 |
| Freddie Mac, Series 2890, Class KT, 4.50% 20197 | 619 | 634 |
| Freddie Mac, Series 2626, Class NG, 3.50% 20237 | 20 | 20 |
| Freddie Mac, Series 2122, Class QM, 6.25% 20297 | 888 | 982 |
| Freddie Mac, Series 3136, Class OP, principal only, 0% 20367 | 975 | 891 |
| Freddie Mac, Series 3147, Class OD, principal only, 0% 20367 | 876 | 772 |
| Freddie Mac, Series 3149, Class MO, principal only, 0% 20367 | 818 | 760 |
| Freddie Mac, Series 3149, Class AO, principal only, 0% 20367 | 719 | 657 |
| Freddie Mac, Series 3156, Class PO, principal only, 0% 20367 | 16 | 14 |
| Freddie Mac, Series 3257, Class PA, 5.50% 20367 | 9,116 | 10,202 |
| Freddie Mac, Series 3286, Class JN, 5.50% 20377 | 6,963 | 7,626 |
| Freddie Mac, Series 3318, Class JT, 5.50% 20377 | 3,899 | 4,271 |
| Government National Mortgage Assn. 10.00% 20217 | 32 | 34 |
| Government National Mortgage Assn. 2.50% 20287 | 3,041 | 3,080 |
| Government National Mortgage Assn. 5.00% 20357 | 871 | 942 |
| Government National Mortgage Assn. 6.00% 20387 | 6,845 | 7,721 |
| Government National Mortgage Assn. 6.50% 20387 | 217 | 248 |
| Government National Mortgage Assn. 5.00% 20397 | 1,152 | 1,241 |
| Government National Mortgage Assn. 4.50% 20407 | 2,250 | 2,425 |
| Government National Mortgage Assn. 5.50% 20407 | 6,199 | 6,951 |
| Government National Mortgage Assn. 3.50% 20417 | 28 | 30 |
The Bond Fund of America — Page 27 of 43
Bonds, notes & other debt instruments
Mortgage-backed obligations (continued)
Federal agency mortgage-backed obligations (continued) | Principal amount
(000) | Value
(000) |
| Government National Mortgage Assn. 4.00% 20417 | $252 | $269 |
| Government National Mortgage Assn. 4.50% 20417 | 13,215 | 14,147 |
| Government National Mortgage Assn. 4.50% 20417 | 1,219 | 1,302 |
| Government National Mortgage Assn. 4.50% 20417 | 1,061 | 1,138 |
| Government National Mortgage Assn. 4.50% 20417 | 826 | 884 |
| Government National Mortgage Assn. 5.00% 20417 | 6,871 | 7,397 |
| Government National Mortgage Assn. 3.50% 20427 | 997 | 1,024 |
| Government National Mortgage Assn. 3.50% 20437 | 2,993 | 3,114 |
| Government National Mortgage Assn. 4.50% 20437 | 686 | 733 |
| Government National Mortgage Assn. 4.50% 20437 | 368 | 393 |
| Government National Mortgage Assn. 4.00% 20457 | 470 | 499 |
| Government National Mortgage Assn. 4.00% 20457 | 0 | — |
| Government National Mortgage Assn. 4.50% 20457 | 116,252 | 124,206 |
| Government National Mortgage Assn. 4.50% 20457 | 88,208 | 94,243 |
| Government National Mortgage Assn. 4.50% 20457 | 69,698 | 74,467 |
| Government National Mortgage Assn. 4.50% 20457 | 63,535 | 67,883 |
| Government National Mortgage Assn. 4.50% 20457 | 53,348 | 56,993 |
| Government National Mortgage Assn. 4.50% 20457 | 37,341 | 39,895 |
| Government National Mortgage Assn. 4.50% 20457 | 29,758 | 31,794 |
| Government National Mortgage Assn. 4.50% 20457 | 19,049 | 20,352 |
| Government National Mortgage Assn. 4.00% 20467 | 7,525 | 7,833 |
| Government National Mortgage Assn. 4.50% 20467 | 3,000 | 3,207 |
| Government National Mortgage Assn. 5.621% 20597 | 43 | 44 |
| Government National Mortgage Assn. 4.690% 20617 | 755 | 784 |
| Government National Mortgage Assn. 4.70% 20617 | 4,671 | 4,832 |
| Government National Mortgage Assn. 4.70% 20617 | 689 | 712 |
| Government National Mortgage Assn. 4.72% 20617 | 313 | 324 |
| Government National Mortgage Assn. 4.785% 20617 | 333 | 344 |
| Government National Mortgage Assn. 4.799% 20617 | 339 | 352 |
| Government National Mortgage Assn. 4.822% 20617 | 1,713 | 1,766 |
| Government National Mortgage Assn. 4.878% 20617 | 1,019 | 1,050 |
| Government National Mortgage Assn. 5.081% 20617 | 1,564 | 1,650 |
| Government National Mortgage Assn. 5.083% 20617 | 1,229 | 1,284 |
| Government National Mortgage Assn. 4.669% 20637 | 763 | 792 |
| Government National Mortgage Assn. 1.286% 20644,7 | 489 | 492 |
| Government National Mortgage Assn. 4.766% 20647 | 1,261 | 1,303 |
| Government National Mortgage Assn. 5.176% 20647 | 850 | 891 |
| Government National Mortgage Assn. 5.20% 20647 | 88 | 91 |
| Government National Mortgage Assn. 6.506% 20647 | 522 | 549 |
| Government National Mortgage Assn. 6.64% 20647 | 40 | 42 |
| Government National Mortgage Assn. 4.984% 20657 | 874 | 912 |
| Government National Mortgage Assn., Series 2012-H20, Class PT, 1.466% 20624,7 | 3,573 | 3,594 |
| National Credit Union Administration, Series 2010-R2, Class 1A, 1.022% 20174,7 | 759 | 760 |
| National Credit Union Administration, Series 2011-R3, Class 1A, 1.064% 20204,7 | 878 | 878 |
| National Credit Union Administration, Series 2011-R1, Class 1A, 1.102% 20204,7 | 1,106 | 1,107 |
| | | 5,087,087 |
| Commercial mortgage-backed securities 1.19% | | |
| Aventura Mall Trust, Series A, 3.743% 20323,4,7 | 8,000 | 8,412 |
| Banc of America Commercial Mortgage Inc., Series 2006-3, Class A4, 5.889% 20444,7 | 144 | 144 |
| Banc of America Commercial Mortgage Inc., Series 2007-3, Class A4, 5.548% 20494,7 | 1,540 | 1,549 |
| Banc of America Commercial Mortgage Inc., Series 2007-2, Class AM, 5.648% 20494,7 | 4,083 | 4,095 |
| Banc of America Commercial Mortgage Inc., Series 2007-4, Class AM, 5.814% 20514,7 | 4,645 | 4,731 |
| Banc of America Commercial Mortgage Inc., Series 2008-1, Class A4, 6.235% 20514,7 | 4,179 | 4,287 |
The Bond Fund of America — Page 28 of 43
Bonds, notes & other debt instruments
Mortgage-backed obligations (continued)
Commercial mortgage-backed securities (continued) | Principal amount
(000) | Value
(000) |
| Bear Stearns Commercial Mortgage Securities Trust, Series 2007-T28, Class A1A, 5.71% 20424,7 | $2,556 | $2,618 |
| Bear Stearns Commercial Mortgage Securities Trust, Series 2007-PW17, Class A1A, 5.65% 20504,7 | 1,199 | 1,221 |
| Bear Stearns Commercial Mortgage Securities Trust, Series 2007-PW18, Class AM, 6.084% 20504,7 | 5,730 | 5,911 |
| Citigroup Commercial Mortgage Trust, Series 2008-C7, Class AM, 6.136% 20494,7 | 7,468 | 7,682 |
| Commercial Mortgage Trust, Series 2005-LP5, Class E, 4.688% 20433,4,7 | 979 | 978 |
| Commercial Mortgage Trust, Series 2007-C9, Class A1A, 5.812% 20494,7 | 2,266 | 2,296 |
| Core Industrial Trust, Series 2015-CALW, Class A, 3.04% 20343,7 | 28,025 | 28,611 |
| CS First Boston Mortgage Securities Corp., Series 2007-C3, Class A1A1, 5.687% 20394,7 | 2,868 | 2,877 |
| CS First Boston Mortgage Securities Corp., Series 2007-C5, Class A4, 5.695% 20404,7 | 2,640 | 2,678 |
| CS First Boston Mortgage Securities Corp., Series 2007-C2, Class AM, 5.615% 20494,7 | 12,708 | 12,815 |
| DBUBS Mortgage Trust, Series 2011-LC2A, Class A1, 4.537% 20443,7 | 10,000 | 10,776 |
EQTY 2014-INNS Mortgage Trust Commercial Mortgage Pass-Through Certificates, Series 2014-A,
1.499% 20313,4,7 | 7,543 | 7,549 |
Greenwich Capital Commercial Funding Corp., Series 2007-GG11, Class A1A,
5.704% 20497 | 8,086 | 8,197 |
Greenwich Capital Commercial Funding Corp., Series 2007-GG11, Class AM,
5.867% 20494,7 | 13,585 | 13,885 |
| GS Mortgage Securities Corp. II, Series 2010-C2, Class A2, 5.162% 20433,4,7 | 4,000 | 4,372 |
| GS Mortgage Securities Corp. II, Series 2007-GG10, Class A1A, 5.793% 20454,7 | 868 | 877 |
| Hilton USA Trust, Series 2013-HLF, Class DFX, 4.407% 20303,7 | 52 | 52 |
| J.P. Morgan Chase Commercial Mortgage Securities Corp., Series 2007-CB18, Class A1A, 5.431% 20474,7 | 459 | 459 |
| J.P. Morgan Chase Commercial Mortgage Securities Corp., Series 2007-LDPX, Class A1A, 5.439% 20497 | 435 | 436 |
| J.P. Morgan Chase Commercial Mortgage Securities Corp., Series 2007-CB19, Class A1A, 5.713% 20494,7 | 28,297 | 28,492 |
| J.P. Morgan Chase Commercial Mortgage Securities Corp., Series 2007-CB19, Class A4, 5.713% 20494,7 | 21,977 | 22,111 |
| J.P. Morgan Chase Commercial Mortgage Securities Corp., Series 2007-C1, Class A4, 5.716% 20517 | 11,659 | 11,922 |
| J.P. Morgan Chase Commercial Mortgage Securities Corp., Series 2007-LD12, Class A1A, 5.85% 20514,7 | 2,268 | 2,294 |
| L.A. Arena Funding, LLC, Series 1, Class A, 7.656% 20263,7 | 13,727 | 14,560 |
| LB Commercial Mortgage Trust, Series 2007-C3, Class A1A, multifamily 5.873% 20444,7 | 5,956 | 6,022 |
| LB-UBS Commercial Mortgage Trust, Series 2007-C2, Class A1A, 5.387% 20407 | 11,551 | 11,585 |
| LB-UBS Commercial Mortgage Trust, Series 2007-C2, Class AM, 5.493% 20404,7 | 4,275 | 4,311 |
| LB-UBS Commercial Mortgage Trust, Series 2007-C6, Class AM, 6.114% 20404,7 | 29,467 | 30,245 |
| LB-UBS Commercial Mortgage Trust, Series 2007-C7, Class A3, 5.866% 20454,7 | 5,315 | 5,447 |
| LB-UBS Commercial Mortgage Trust, Series 2007-C7, Class AM, 6.159% 20454,7 | 8,680 | 8,963 |
| Merrill Lynch Mortgage Trust, Series 2007-C1, Class A4, 5.826% 20504,7 | 6,558 | 6,614 |
| ML-CFC Commercial Mortgage Trust, Series 2007-9, Class A4, 5.70% 20497 | 668 | 681 |
| ML-CFC Commercial Mortgage Trust, Series 2007-8, Class A3, 6.852% 20494,7 | 6,833 | 6,916 |
| ML-CFC Commercial Mortgage Trust, Series 2007-7, Class A4, 5.733% 20504,7 | 3,355 | 3,377 |
| Morgan Stanley Capital I Trust, Series 2014-CPT, Class A, 3.35% 20293,7 | 6,885 | 7,116 |
| Morgan Stanley Capital I Trust, Series 2007-TA27, Class A1A, 5.643% 20424,7 | 4,495 | 4,547 |
| Morgan Stanley Capital I Trust, Series 2011-C2, Class A4, 4.661% 20443,7 | 4,950 | 5,375 |
| Morgan Stanley Capital I Trust, Series 2007-IQ13, Class AM, 5.406% 20447 | 13,600 | 13,591 |
| Morgan Stanley Capital I Trust, Series 2011-C1, Class A4, 5.033% 20473,4,7 | 1,485 | 1,620 |
| Morgan Stanley Capital I Trust, Series 2007-IQ15, Class A4, 5.902% 20494,7 | 14,626 | 14,859 |
| Wachovia Bank Commercial Mortgage Trust, Series 2007-C31, Class AM, 5.591% 20474,7 | 17,020 | 17,129 |
| Wachovia Bank Commercial Mortgage Trust, Series 2007-C32, Class A3, 5.707% 20494,7 | 14,878 | 14,970 |
| | | 380,255 |
| Collateralized mortgage-backed (privately originated) 0.83% | | |
| Bellemeade Re Ltd., Series 2015-1A, Class M1, 3.256% 20253,4,7 | 909 | 913 |
| Connecticut Avenue Securities, Series 2013-C01, Class M1, 2.756% 20233,4,7 | 1,014 | 1,022 |
| Connecticut Avenue Securities, Series 2014-C01, Class M1, 2.356% 20243,4,7 | 837 | 843 |
| Connecticut Avenue Securities, Series 2016-C05, Class 2M1, 2.106% 20294,7 | 2,789 | 2,797 |
| CS First Boston Mortgage Securities Corp., Series 2002-30, Class IA1, 7.50% 20327 | 137 | 150 |
| CS First Boston Mortgage Securities Corp., Series 2002-34, Class IA1, 7.50% 20327 | 18 | 20 |
The Bond Fund of America — Page 29 of 43
Bonds, notes & other debt instruments
Mortgage-backed obligations (continued)
Collateralized mortgage-backed (privately originated) (continued) | Principal amount
(000) | Value
(000) |
| CS First Boston Mortgage Securities Corp., Series 2003-21, Class VA1, 6.50% 20337 | $1,065 | $1,148 |
| CS First Boston Mortgage Securities Corp., Series 2003-29, Class VA1, 7.00% 20337 | 17 | 18 |
| Freddie Mac, Series 2013-DN2, Class M1, 2.206% 20234,7 | 2,166 | 2,176 |
| Freddie Mac, Series 2013-DN1, Class M1, 4.156% 20234,7 | 2,532 | 2,576 |
| Freddie Mac, Series 2014-DN1, Class M1, 1.756% 20244,7 | 193 | 193 |
| Freddie Mac, Series 2014-HQ2, Class M1, 2.206% 20244,7 | 3,200 | 3,216 |
| Freddie Mac, Series 2014-DN2, Class M2, 2.406% 20244,7 | 2,625 | 2,647 |
| Freddie Mac, Series 2014-HQ2, Class M2, 2.956% 20244,7 | 17,865 | 18,272 |
| Freddie Mac, Series 2014-DN4, Class M2, 3.156% 20244,7 | 1,307 | 1,312 |
| Freddie Mac, Series 2014-HQ1, Class M2, 3.256% 20244,7 | 7,195 | 7,302 |
| Freddie Mac, Series 2015-HQ2, Class M1, 1.856% 20254,7 | 788 | 790 |
| Freddie Mac, Series 2015-HQ2, Class M2, 2.706% 20254,7 | 7,950 | 8,073 |
| Freddie Mac, Series 2016-DNA3, Class M1, 1.856% 20284,7 | 5,521 | 5,534 |
| Freddie Mac, Series 2015-HQA2, Class M1, 1.906% 20284,7 | 200 | 201 |
| Mortgage Repurchase Agreement Financing Trust, Series 2016-3, Class A1, 1.664% 20183,4,5,7 | 89,400 | 89,434 |
| Mortgage Repurchase Agreement Financing Trust, Series 2016-5, Class A1, 1.17% 20193,4,5,7 | 10,000 | 9,998 |
| Nationstar HECM Loan Trust, Series 2016-3A, Class A, 2.013% 20263,7 | 13,110 | 13,155 |
| Nationstar HECM Loan Trust, Series 2016-2A, Class A, 2.239% 20263,5,7 | 2,305 | 2,313 |
| Station Place Securitization Trust, Series 2016-1, Class A, 1.756% 20484,5,7 | 9,000 | 9,000 |
| Station Place Securitization Trust, Series 2016-3, Class A, 1.856% 20483,4,5,7 | 13,500 | 13,500 |
| TBW Mortgage-backed Trust, Series 2007-2, Class A4B, 1.176% 20374,7 | 11,828 | 10,311 |
| Towd Point Mortgage Trust, Series 2016-3, Class A1, 2.25% 20553,4,7 | 15,994 | 15,899 |
| Towd Point Mortgage Trust, Series 2016-4, Class A1, 2.25% 20563,4,7 | 36,447 | 36,147 |
| Towd Point Mortgage Trust, Series 2015-2, Class 2A11, 3.00% 20573,4,7 | 5,789 | 5,863 |
| | | 264,823 |
| Other mortgage-backed securities 0.50% | | |
| Bank of Nova Scotia 1.75% 20173,7 | 14,150 | 14,167 |
| Caisse Centrale Desjardins 1.60% 20173,7 | 3,375 | 3,378 |
| Commonwealth Bank of Australia 2.25% 20173,7 | 4,150 | 4,159 |
| Credit Mutuel-CIC Home Loan SFH 1.50% 20173,7 | 4,400 | 4,393 |
| Freddie Mac, Series KF02, Class A2, multifamily 1.084% 20204,7 | 7,761 | 7,793 |
| Freddie Mac, Series KF02, Class A3, multifamily 1.164% 20204,7 | 3,642 | 3,659 |
| Freddie Mac, Series K722, Class A1, multifamily 2.183% 20227 | 24,110 | 24,074 |
| Freddie Mac, Series K723, Class A2, multifamily 2.454% 20237 | 2,000 | 1,987 |
| Freddie Mac, Series KS01, Class A2, multifamily 2.522% 20237 | 3,435 | 3,448 |
| Freddie Mac, Series K036, Class A2, multifamily 3.527% 20234,7 | 24,490 | 25,838 |
| Freddie Mac, Series K043, Class A2, multifamily 3.062% 20247 | 23,500 | 23,996 |
| Freddie Mac, Series K052, Class A1, multifamily 2.598% 20257 | 8,603 | 8,679 |
| Freddie Mac, Series K056, Class A2, multifamily 2.525% 20267 | 7,360 | 7,132 |
| Freddie Mac, Series K055, Class A2, multifamily 2.673% 20267 | 8,000 | 7,849 |
| National Australia Bank 2.00% 20173,7 | 3,500 | 3,512 |
| Toronto-Dominion Bank 1.50% 20173,7 | 10,000 | 10,008 |
| Westpac Banking Corp. 1.25% 20173,7 | 4,425 | 4,417 |
| | | 158,489 |
| Total mortgage-backed obligations | | 5,890,654 |
| Asset-backed obligations 5.75% | | |
| Aesop Funding LLC, Series 2011-5A, Class A, 3.27% 20183,7 | 3,467 | 3,473 |
| Aesop Funding LLC, Series 2012-3A, Class A, 2.10% 20193,7 | 1,000 | 1,001 |
| Aesop Funding LLC, Series 2014-1A, Class A, 2.46% 20203,7 | 500 | 499 |
| Aesop Funding LLC, Series 2014-2A, Class A, 2.50% 20213,7 | 18,075 | 18,009 |
| Aesop Funding LLC, Series 2015-1, Class A, 2.50% 20213,7 | 15,095 | 14,980 |
The Bond Fund of America — Page 30 of 43
Bonds, notes & other debt instruments
Asset-backed obligations (continued) | Principal amount
(000) | Value
(000) |
| Aesop Funding LLC, Series 2015-2A, Class A, 2.63% 20213,7 | $16,845 | $16,641 |
| Ally Master Owner Trust, Series 2014-1, Class A1, 1.174% 20194,7 | 8,015 | 8,016 |
| Ally Master Owner Trust, Series 2014-1, Class A2, 1.29% 20197 | 8,700 | 8,700 |
| American Express Credit Account Master Trust, Series 2014-4, Class A, 1.43% 20207 | 30,600 | 30,652 |
| AmeriCredit Automobile Receivables Trust, Series 2016-4, Class A1, 0.78% 20177 | 32,931 | 32,931 |
| AmeriCredit Automobile Receivables Trust, Series 2012-4, Class C, 1.93% 20187 | 65 | 65 |
| AmeriCredit Automobile Receivables Trust, Series 2014-3, Class A3, 1.15% 20197 | 1,775 | 1,774 |
| AmeriCredit Automobile Receivables Trust, Series 2015-1, Class A3, 1.26% 20197 | 5,550 | 5,544 |
| AmeriCredit Automobile Receivables Trust, Series 2014-4, Class A3, 1.27% 20197 | 2,119 | 2,119 |
| AmeriCredit Automobile Receivables Trust, Series 2016-3, Class A2A, 1.37% 20197 | 24,000 | 24,015 |
| AmeriCredit Automobile Receivables Trust, Series 2016-2, Class C, 2.87% 20217 | 645 | 649 |
| AmeriCredit Automobile Receivables Trust, Series 2016-3, Class C, 2.24% 20227 | 5,000 | 4,950 |
| AmeriCredit Automobile Receivables Trust, Series 2016-1, Class C, 2.89% 20227 | 4,240 | 4,294 |
| Appalachian Consumer Rate Relief Funding LLC, Series 2013-1, Class A1, 2.01% 20247 | 4,967 | 4,931 |
| Ares CLO Ltd., Series 2012-3A, Class AR, CLO, 1.768% 20243,4,7 | 56,500 | 56,501 |
| ARI Fleet Lease Trust, Series 2014-A, Class A2, 0.81% 20223,7 | 177 | 177 |
| Avant Loans Funding Trust, Series 2016-C, Class A, 2.96% 20193,7 | 5,557 | 5,554 |
| Avant Loans Funding Trust, Series 2016-B, Class A, 3.92% 20193,7 | 4,603 | 4,620 |
| Avant Loans Funding Trust, Series 2016-A, Class A, 4.11% 20193,7 | 4,219 | 4,228 |
| Avant Loans Funding Trust, Series 2016-C, Class B, 4.92% 20203,7 | 8,365 | 8,362 |
| Avant Loans Funding Trust, Series 2015-A, Class A, 4.00% 20213,7 | 7,982 | 8,010 |
| Babson CLO Ltd., Series 2012-2A, Class A1R, CLO, 2.146% 20233,4,7 | 5,176 | 5,183 |
| Bank of the West Auto Trust, Series 2014-1, Class A3, 1.09% 20193,7 | 1,971 | 1,971 |
| Black Diamond CLO Ltd., Series 2006-1A, Class AD, CLO, 1.137% 20193,4,7 | 1,563 | 1,563 |
| BMW Vehicle Lease Trust, Series 2016-2, Class A1, 0.72% 20177 | 9,109 | 9,109 |
| BMW Vehicle Owner Trust 2016-A, Series 2016-A, Class A2A, 0.99% 20197 | 15,000 | 14,982 |
| Cabela’s Master Credit Card Trust, Series 2012-2A, Class A1, 1.45% 20203,7 | 3,235 | 3,239 |
| Cabela’s Master Credit Card Trust, Series 2016-1, Class A1, 1.78% 20227 | 10,580 | 10,552 |
| Capital Auto Receivables Asset Trust, Series 2016-2, Class A1, 0.75% 20177 | 1,812 | 1,812 |
| Capital One Multi-asset Execution Trust, Series 2014-A5, Class A, 1.48% 20207 | 12,000 | 12,024 |
| Capital One Multi-asset Execution Trust, Series 2015-A5, Class A5, 1.60% 20217 | 14,485 | 14,527 |
| Carlyle Global Market Strategies Commodities Fund, Series 2015-1A, Class A, 2.131% 20203,4,5,7 | 28,350 | 21,968 |
| Carlyle Global Market Strategies Commodities Fund, Series 2014-1A, Class A, 2.78% 20213,4,5,7 | 12,985 | 10,322 |
| CarMaxAuto Owner Trust, Series 2014-4, Class A3, 1.25% 20197 | 7,256 | 7,256 |
| Chase Issuance Trust, Series 2016-A7, Class A, 1.06% 20197 | 29,000 | 28,976 |
| Chase Issuance Trust, Series 2014-A7, Class A, 1.38% 20197 | 5,835 | 5,841 |
| Chase Issuance Trust, Series 2016-A6, Class A6, 1.10% 20207 | 480,200 | 479,112 |
| Chase Issuance Trust, Series 2013-A7, Class A, 1.134% 20204,7 | 11,955 | 11,995 |
| Chase Issuance Trust, Series 2015-A2, Class A, 1.59% 20207 | 63,355 | 63,542 |
| Chesapeake Funding LLC, Series 2014-1A, Class A, 1.072% 20263,4,7 | 7,639 | 7,613 |
| Chrysler Capital Auto Receivables Trust, Series 2015-AA, Class A3, 1.22% 20193,7 | 2,910 | 2,910 |
| Chrysler Capital Auto Receivables Trust, Series 2014-AA, Class A4, 1.31% 20193,7 | 3,001 | 3,002 |
| Citi Held For Issuance, Series 2015-PM2, Class A, 2.35% 20223,7 | 6,904 | 6,899 |
| Citi Held For Issuance, Series 2015-PM3, Class A, 2.56% 20223,7 | 9,184 | 9,175 |
| Citi Held For Issuance, Series 2016-PM1, Class A, 4.65% 20253,7 | 6,560 | 6,641 |
| Citibank Credit Card Issuance Trust, Series 2008-A2, Class A2, 1.905% 20204,7 | 13,590 | 13,732 |
| CLI Funding V LLC, Series 2013-1A, Class Note, 2.83% 20283,7 | 4,360 | 4,201 |
| CLI Funding V LLC, Series 2013-2A, Class Note, 3.22% 20283,7 | 1,207 | 1,168 |
| CLI Funding V LLC, Series 2013-1A, Class A, 3.67% 20283,7 | 1,589 | 1,532 |
| CLI Funding V LLC, Series 2014-1A, Class A, 3.29% 20293,7 | 6,589 | 6,357 |
| CLI Funding V LLC, Series 2014-2A, Class A, 3.38% 20293,7 | 7,809 | 7,510 |
| Conseco Finance Home Equity Loan Trust, Series 2002-B, Class M1, 2.454% 20334,7 | 557 | 561 |
| Conseco Finance Securitizations Corp., Series 2002-2, Class A2, 6.03% 20337 | 74 | 75 |
| Consumer Credit Origination Loan Trust, Series 2015-1, Class A, 2.82% 20213,7 | 165 | 166 |
| CPS Auto Receivables Trust, Series 2015-A, Class A, 1.53% 20193,7 | 778 | 778 |
The Bond Fund of America — Page 31 of 43
Bonds, notes & other debt instruments
Asset-backed obligations (continued) | Principal amount
(000) | Value
(000) |
| CPS Auto Receivables Trust, Series 2015-C, Class A, 1.77% 20193,7 | $1,643 | $1,645 |
| CPS Auto Receivables Trust, Series 2016-B, Class A, 2.07% 20193,7 | 2,307 | 2,311 |
| CPS Auto Receivables Trust, Series 2016-D, Class A, 1.50% 20203,7 | 15,025 | 14,994 |
| CPS Auto Receivables Trust, Series 2016-A, Class B, 3.34% 20203,7 | 2,000 | 2,029 |
| CPS Auto Receivables Trust, Series 2015-A, Class B, 2.79% 20213,7 | 3,125 | 3,156 |
| CPS Auto Receivables Trust, Series 2016-A, Class C, 3.80% 20213,7 | 3,500 | 3,534 |
| CPS Auto Receivables Trust, Series 2015-A, Class C, 4.00% 20213,7 | 2,395 | 2,414 |
| CWHEQ Revolving Home Equity Loan Trust, Series 2005-C, Class 2A, FSA insured, 0.884% 20354,7 | 3,957 | 3,587 |
| CWHEQ Revolving Home Equity Loan Trust, Series 2006-I, Class 2A, FSA insured, 0.844% 20374,7 | 5,844 | 5,435 |
| CWHEQ Revolving Home Equity Loan Trust, Series 2007-B, Class A, FSA insured, 0.854% 20374,7 | 8,882 | 7,928 |
| Dell Equipment Finance Trust, Series 2016-1, Class A1, 0.85% 20173,7 | 6,701 | 6,701 |
| Discover Card Execution Note Trust, Series 2015-A1, Class A1, 1.054% 20204,7 | 9,970 | 9,987 |
| Discover Card Execution Note Trust, Series 2014-A5, Class A, 1.39% 20207 | 10,600 | 10,610 |
| DRB Prime Student Loan Trust, Series 2015-D, Class A3, 2.50% 20363,7 | 3,001 | 2,988 |
| Drive Auto Receivables Trust, Series 2016-CA, Class A2, 1.41% 20193,7 | 25,935 | 25,937 |
| Drive Auto Receivables Trust, Series 2015-AA, Class B, 2.28% 20193,7 | 1,420 | 1,422 |
| Drive Auto Receivables Trust, Series 2015-BA, Class C, 2.76% 20213,7 | 15,145 | 15,239 |
| Drive Auto Receivables Trust, Series 2015-CA, Class C, 3.01% 20213,7 | 6,680 | 6,739 |
| Drive Auto Receivables Trust, Series 2015-AA, Class C, 3.06% 20213,7 | 6,700 | 6,767 |
| Drive Auto Receivables Trust, Series 2015-DA, Class C, 3.38% 20213,7 | 11,925 | 12,098 |
| Drive Auto Receivables Trust, Series 2016-AA, Class C, 3.91% 20213,7 | 18,000 | 18,265 |
| Drive Auto Receivables Trust, Series 2016-BA, Class C, 3.19% 20223,7 | 2,890 | 2,913 |
| Drivetime Auto Owner Trust, Series 2015-3A, Class A, 1.66% 20193,7 | 1,408 | 1,408 |
| Drivetime Auto Owner Trust, Series 2016-2A, Class A, 1.73% 20193,7 | 1,509 | 1,510 |
| Drivetime Auto Owner Trust, Series 2016-1A, Class C, 3.54% 20213,7 | 1,365 | 1,375 |
| Drivetime Auto Owner Trust, Series 2016-3A, Class C, 3.15% 20223,7 | 8,860 | 8,869 |
| Drivetime Auto Owner Trust, Series 2016-2A, Class C, 3.67% 20223,7 | 3,735 | 3,772 |
| Dryden Senior Loan Fund, Series 2012-23RA, Class A1R, CLO, 2.13% 20233,4,7 | 8,788 | 8,789 |
| Enterprise Fleet Financing LLC, Series 2016-2, Class A1, 0.85% 20173,7 | 8,044 | 8,042 |
| Enterprise Fleet Financing LLC, Series 2014-1, Class A2, 0.87% 20193,7 | 507 | 507 |
| Fifth Third Auto Trust, Series 2014-3, Class A3, 0.96% 20197 | 3,053 | 3,051 |
| Finn Square CLO Ltd., Series 2012-1A, Class A1R, CLO, 2.207% 20233,4,7 | 31,800 | 31,802 |
| Ford Credit Auto Owner Trust, Series 2014-1A, 2.26% 20253,7 | 3,680 | 3,712 |
| Ford Credit Auto Owner Trust, Series 2015-1, Class A, 2.12% 20263,7 | 24,110 | 24,143 |
| Ford Credit Auto Owner Trust, Series 2014-2A, 2.31% 20263,7 | 9,165 | 9,241 |
| Ford Credit Auto Owner Trust, Series 2016-2, Class A, 2.03% 20273,7 | 23,810 | 23,420 |
| Ford Credit Auto Owner Trust, Series 2016-1, Class A, 2.31% 20273,7 | 20,400 | 20,363 |
| Ford Credit Auto Owner Trust, Series 2015-2, Class A, 2.44% 20273,7 | 23,070 | 23,275 |
| Ford Credit Floorplan Master Owner Trust, Series 2016-3, Class B, 1.75% 20217 | 4,621 | 4,572 |
| Ford Credit Floorplan Master Owner Trust, Series 2016-5, Class A1, 1.95% 20217 | 18,000 | 18,004 |
| Ford Credit Floorplan Master Owner Trust, Series 2015-2, Class A1, 1.98% 20227 | 10,890 | 10,917 |
| Henderson Receivables LLC, Series 2006-3-A, Class A1, 0.642% 20413,4,7 | 1,731 | 1,634 |
| Henderson Receivables LLC, Series 2006-4-A, Class A1, 0.904% 20413,4,7 | 2,173 | 2,142 |
| Hertz Fleet Lease Funding LP, Series 2014-1A, 1.064% 20283,4,7 | 3,567 | 3,567 |
| Hertz Vehicle Financing LLC, Rental Car Asset-backed Notes, Series 2011-1A, Class A2, 3.29% 20183,7 | 345 | 346 |
| Hertz Vehicle Financing LLC, Rental Car Asset-backed Notes, Series 2013-1A, Class A2, 1.83% 20193,7 | 36,500 | 36,217 |
| Hertz Vehicle Financing LLC, Rental Car Asset-backed Notes, Series 2015-3A, Class A, 2.67% 20213,7 | 20,595 | 20,616 |
| Hertz Vehicle Financing LLC, Rental Car Asset-backed Notes, Series 2015-1, Class A, 2.73% 20213,7 | 31,883 | 31,684 |
| Hertz Vehicle Financing LLC, Rental Car Asset-backed Notes, Series 2015-1, Class A, 3.52% 20213,7 | 1,939 | 1,924 |
| Hertz Vehicle Financing LLC, Rental Car Asset-backed Notes, Series 2016-2A, Class A, 2.95% 20223,7 | 5,000 | 4,943 |
| Home Equity Asset Trust, Series 2004-7, Class M1, 1.686% 20354,7 | 4,712 | 4,570 |
| Honda Auto Receivables Owner Trust, Series 2014-3, Class A3, 0.88% 20187 | 4,604 | 4,601 |
IndyMac Home Equity Mortgage Loan Asset-backed Trust, Series 2007-H1, Class A1,
FSA insured, 0.916% 20374,7 | 4,570 | 4,168 |
| Lehman ABS Manufactured Housing Contract Trust, Series 2002-A, Class A, 0.988% 20334,7 | 708 | 701 |
The Bond Fund of America — Page 32 of 43
Bonds, notes & other debt instruments
Asset-backed obligations (continued) | Principal amount
(000) | Value
(000) |
| Lehman ABS Manufactured Housing Contract Trust, Series 2001-B, Class A3, 4.35% 20407 | $359 | $366 |
| Lehman ABS Manufactured Housing Contract Trust, Series 2001-B, Class A4, 5.27% 20407 | 184 | 189 |
| Lehman ABS Manufactured Housing Contract Trust, Series 2001-B, Class A5, 5.873% 20407 | 604 | 626 |
| Marine Park CLO Ltd., Series 2012-1A, Class A1AR, CLO, 2.189% 20233,4,7 | 35,000 | 34,987 |
| MarketPlace Loan Trust, Series 2015-AV1, Class A, 4.00% 20213,5,7 | 9,751 | 9,795 |
| Navient Student Loan Trust, Series 2015-A, Class A1, 1.204% 20213,4,7 | 712 | 712 |
| Octagon Investment Partners XII Ltd., Series 2012-1AR, Class AR, CLO, 2.151% 20233,4,7 | 7,311 | 7,312 |
| Octagon Investment Partners XV Ltd., Series 2013-1A, Class A, CLO, 2.168% 20253,4,7 | 14,850 | 14,844 |
| Prestige Auto Receivables Trust, Series 2015-1, Class B, 2.04% 20213,7 | 2,500 | 2,495 |
| Prestige Auto Receivables Trust, Series 2015-1, Class C, 2.40% 20213,7 | 7,000 | 6,985 |
| Prestige Auto Receivables Trust, Series 2015-1, Class D, 3.05% 20213,7 | 5,000 | 4,962 |
| RAMP Trust, Series 2004-RS10, Class AI6, 4.55% 20347 | 180 | 183 |
| Residential Funding Mortgage Securities II, Inc., Series 2006-HSA3, Class A, FSA insured, 0.886% 20364,7 | 658 | 587 |
| Santander Drive Auto Receivables Trust, Series 2016-3, Class A1, 0.80% 20177 | 39,844 | 39,827 |
| Santander Drive Auto Receivables Trust, Series 2013-2, Class C, 1.95% 20197 | 1,572 | 1,575 |
| Santander Drive Auto Receivables Trust, Series 2014-1, Class C, 2.36% 20207 | 3,975 | 3,992 |
| Santander Drive Auto Receivables Trust, Series 2014-5, Class C, 2.46% 20207 | 12,410 | 12,508 |
| Santander Drive Auto Receivables Trust, Series 2013-4, Class C, 3.25% 20207 | 715 | 720 |
| Santander Drive Auto Receivables Trust, Series 2015-2, Class C, 2.44% 20217 | 14,110 | 14,219 |
| Santander Drive Auto Receivables Trust, Series 2015-1, Class C, 2.57% 20217 | 1,150 | 1,160 |
| Santander Drive Auto Receivables Trust, Series 2016-2, Class C, 2.66% 20217 | 8,195 | 8,220 |
| Santander Drive Auto Receivables Trust, Series 2015-5, Class C, 2.74% 20217 | 14,335 | 14,452 |
| Santander Drive Auto Receivables Trust, Series 2015-3, Class C, 2.74% 20217 | 5,820 | 5,880 |
| Santander Drive Auto Receivables Trust, Series 2015-4, Class C, 2.97% 20217 | 14,215 | 14,356 |
| Santander Drive Auto Receivables Trust, Series 2016-1, Class C, 3.09% 20227 | 3,675 | 3,725 |
| SLM Private Credit Student Loan Trust, Series 2008-1, Class A3, 1.382% 20174,7 | 271 | 271 |
| SLM Private Credit Student Loan Trust, Series 2014-A, Class A1, 1.304% 20223,4,7 | 950 | 950 |
| SLM Private Credit Student Loan Trust, Series 2010-1, Class A, 1.156% 20254,7 | 4,601 | 4,484 |
| SLM Private Credit Student Loan Trust, Series 2012-3, Class A, 1.406% 20254,7 | 1,688 | 1,645 |
| Social Professional Loan Program LLC, Series 2015-C, Class A2, 2.51% 20333,7 | 4,511 | 4,507 |
| TAL Advantage V LLC, Series 2013-1A, Class A, 2.83% 20383,7 | 3,090 | 2,940 |
| TAL Advantage V LLC, Series 2013-2A, Class A, 3.55% 20383,7 | 4,292 | 4,167 |
| TAL Advantage V LLC, Series 2014-3A, Class A, 3.27% 20393,7 | 2,213 | 2,113 |
| TAL Advantage V LLC, Series 2014-1A, Class A, 3.51% 20393,7 | 6,945 | 6,695 |
| Utility Debt Securitization Auth., Series 2013-T, 3.435% 20257 | 6,735 | 6,970 |
| Verizon Owner Trust, Series 2016-1A, Class A, 1.42% 20213,7 | 11,140 | 11,074 |
| Volkswagen Auto Loan Enhanced Trust, Series 2014-2, Class A3, 0.95% 20197 | 9,385 | 9,364 |
| Westlake Automobile Receivables Trust, Series 2016-3, Class A2, 1.42% 20193,7 | 20,800 | 20,775 |
| Westlake Automobile Receivables Trust, Series 2015-1-A, Class C, 2.29% 20203,7 | 2,750 | 2,757 |
| Westlake Automobile Receivables Trust, Series 2016-1A, Class C, 3.29% 20213,7 | 4,500 | 4,547 |
| Westlake Automobile Receivables Trust, Series 2015-1-A, Class D, 2.96% 20223,7 | 3,875 | 3,904 |
| Wheels SPV 2 LLC, Series 2016-1A, Class A2, 1.59% 20253,7 | 1,200 | 1,198 |
| World Financial Network Credit Card Master Note Trust, Series 2015-A, Class A, 1.184% 20224,7 | 1,600 | 1,604 |
| World Omni Auto Receivables Trust, Series 2014-B, Class A3, 1.14% 20207 | 4,838 | 4,834 |
| | | 1,837,049 |
| Bonds & notes of governments & government agencies outside the U.S. 3.17% | | |
| Abu Dhabi (Emirate of) 3.125% 20263 | 5,000 | 4,916 |
| Argentine Republic 6.875% 20213 | 3,075 | 3,283 |
| Argentine Republic 18.20% 2021 | ARS23,600 | 1,524 |
| Argentine Republic 7.50% 20263 | $4,925 | 5,184 |
| Argentine Republic 15.50% 2026 | ARS14,700 | 898 |
| Argentine Republic 8.28% 20337,8 | $4,984 | 5,346 |
| Argentine Republic 0% 2035 | 25,700 | 2,397 |
| Argentine Republic 7.625% 20463 | 4,250 | 4,261 |
The Bond Fund of America — Page 33 of 43
Bonds, notes & other debt instruments
Bonds & notes of governments & government agencies outside the U.S. (continued) | Principal amount
(000) | Value
(000) |
| Armenia (Republic of) 7.15% 20253 | $4,810 | $5,073 |
| Bermuda 4.138% 20233 | 1,700 | 1,751 |
| Bermuda 4.854% 20243 | 10,650 | 11,120 |
| Bermuda 3.717% 20273 | 7,445 | 7,073 |
| Brazil (Federative Republic of) 0% 2020 | BRL262,000 | 58,736 |
| Brazil (Federative Republic of) 10.00% 2025 | 14,000 | 3,999 |
| Brazil (Federative Republic of) 5.625% 2047 | $6,590 | 5,799 |
| Buenos Aires (City of) 8.95% 20217 | 1,000 | 1,120 |
| Caisse d’Amortissement de la Dette Sociale 1.125% 20173 | 10,470 | 10,470 |
| Chile (Banco Central de) 4.50% 2021 | CLP35,025,000 | 53,728 |
| Colombia (Republic of) 4.50% 2026 | $1,700 | 1,757 |
| Cote d’Ivoire (Republic of) 6.375% 20283,7 | 7,275 | 7,111 |
| Dominican Republic 7.50% 20217 | 950 | 1,034 |
| Dominican Republic 5.875% 20247 | 1,640 | 1,648 |
| Dominican Republic 5.50% 20253 | 10,380 | 10,061 |
| Dominican Republic 6.875% 20263 | 4,300 | 4,485 |
| Export-Import Bank of India 3.375% 20263 | 4,500 | 4,212 |
| FMS Wertmanagement 1.00% 2017 | 4,400 | 4,391 |
| FMS Wertmanagement 1.625% 2018 | 6,400 | 6,421 |
| Honduras (Republic of) 8.75% 2020 | 4,175 | 4,669 |
| Honduras (Republic of) 7.50% 20247 | 3,330 | 3,574 |
| Hungary 4.00% 2019 | 3,000 | 3,110 |
| Hungary 5.375% 2023 | 5,950 | 6,471 |
| Hungary 7.625% 2041 | 14,850 | 20,831 |
| India (Republic of) 7.80% 2021 | INR716,060 | 11,037 |
| India (Republic of) 8.83% 2023 | 387,200 | 6,347 |
| India (Republic of) 8.60% 2028 | 1,015,200 | 16,809 |
| India (Republic of) 9.20% 2030 | 264,540 | 4,594 |
| Indonesia (Republic of) 3.70% 20223 | $13,225 | 13,288 |
| Indonesia (Republic of) 3.75% 2022 | 13,255 | 13,338 |
| Indonesia (Republic of) 3.375% 2023 | 9,350 | 9,145 |
| Iraq (Republic of) 5.80% 20287 | 5,150 | 4,292 |
| Japan, Series 18, 0.10% 20242 | ¥5,386,240 | 48,551 |
| Japan, Series 19, 0.10% 20242 | 2,988,000 | 27,164 |
| Japan, Series 20, 0.10% 20252 | 12,974,000 | 118,112 |
| Japan, Series 21, 0.10% 20262 | 1,495,260 | 13,657 |
| Jordan (Hashemite Kingdom of) 6.125% 20263 | $2,090 | 2,114 |
| Jordan (Hashemite Kingdom of) 5.75% 20273 | 615 | 584 |
| Kazakhstan (Republic of) 5.125% 20253 | 2,250 | 2,412 |
| Kazakhstan (Republic of) 6.50% 20453 | 2,250 | 2,585 |
| Kenya (Republic of) 6.875% 20243 | 8,195 | 7,777 |
| Landwirtschaftliche Rentenbank 1.75% 2019 | 8,970 | 9,000 |
| Malaysia (Federation of), Series 0315, 3.659% 2020 | MYR55,000 | 12,256 |
| Malaysia (Federation of), Series 0416, 3.62% 2021 | 52,750 | 11,732 |
| Morocco (Kingdom of) 4.25% 2022 | $5,400 | 5,532 |
| Morocco (Kingdom of) 5.50% 2042 | 10,200 | 10,493 |
| Nigeria (Federal Republic of) 5.125% 20183 | 2,525 | 2,570 |
| Nigeria (Federal Republic of) 6.375% 2023 | 1,990 | 1,933 |
| Pakistan (Islamic Republic of) 5.50% 20213 | 2,535 | 2,579 |
| Pakistan (Islamic Republic of) 8.25% 2024 | 2,010 | 2,183 |
| Pakistan (Islamic Republic of) 8.25% 2025 | 2,900 | 3,182 |
| Paraguay (Republic of) 5.00% 20263 | 1,575 | 1,607 |
| Paraguay (Republic of) 5.00% 2026 | 900 | 918 |
| Qatar (State of) 4.625% 20463 | 6,000 | 6,016 |
| Saudi Arabia (Kingdom of) 2.375% 20213 | 30,700 | 29,837 |
The Bond Fund of America — Page 34 of 43
Bonds, notes & other debt instruments
Bonds & notes of governments & government agencies outside the U.S. (continued) | Principal amount
(000) | Value
(000) |
| Saudi Arabia (Kingdom of) 3.25% 20263 | $50,395 | $47,846 |
| Saudi Arabia (Kingdom of) 4.50% 20463 | 6,170 | 5,926 |
| Slovenia (Republic of) 5.50% 2022 | 22,410 | 24,813 |
| Slovenia (Republic of) 5.85% 2023 | 15,500 | 17,487 |
| Slovenia (Republic of) 5.85% 20233 | 2,750 | 3,103 |
| Slovenia (Republic of) 5.25% 2024 | 5,810 | 6,379 |
| South Africa (Republic of) 5.50% 2020 | 1,000 | 1,062 |
| Swedish Export Credit Corp. 2.875% 20233 | 9,000 | 8,975 |
| Trinidad & Tobago (Republic of) 4.50% 20263 | 4,450 | 4,384 |
| Turkey (Republic of) 5.625% 2021 | 19,350 | 19,887 |
| Turkey (Republic of) 9.00% 2024 | TRY11,025 | 2,806 |
| Turkey (Republic of) 4.25% 2026 | $7,700 | 6,862 |
| Turkey (Republic of) 4.875% 2026 | 3,580 | 3,322 |
| Turkey (Republic of) 8.00% 2034 | 1,250 | 1,433 |
| Turkey (Republic of) 6.00% 2041 | 2,820 | 2,623 |
| United Mexican States 5.125% 2020 | 1,250 | 1,345 |
| United Mexican States 4.00% 2023 | 8,000 | 8,038 |
| United Mexican States 3.60% 2025 | 7,600 | 7,345 |
| United Mexican States 4.125% 2026 | 1,600 | 1,591 |
| United Mexican States 4.00% 20402 | MXN17,258 | 861 |
| United Mexican States 5.55% 2045 | $2,500 | 2,566 |
| United Mexican States, Series M, 6.50% 2021 | MXN2,766,800 | 130,272 |
| United Mexican States, Series M, 5.75% 2026 | 605,000 | 25,940 |
| Venezuela (Bolivarian Republic of) 12.75% 20227 | $765 | 478 |
| Venezuela (Bolivarian Republic of) 8.25% 2024 | 2,335 | 1,097 |
| Venezuela (Bolivarian Republic of) 7.65% 2025 | 915 | 421 |
| Venezuela (Bolivarian Republic of) 11.75% 2026 | 1,530 | 872 |
| Venezuela (Bolivarian Republic of) 9.25% 2027 | 3,480 | 1,783 |
| Venezuela (Bolivarian Republic of) 9.25% 2028 | 385 | 179 |
| Venezuela (Bolivarian Republic of) 11.95% 20317 | 2,210 | 1,243 |
| Venezuela (Bolivarian Republic of) 9.375% 2034 | 350 | 164 |
| Venezuela (Bolivarian Republic of) 7.00% 2038 | 495 | 210 |
| Zambia (Republic of) 5.375% 2022 | 2,750 | 2,503 |
| Zambia (Republic of) 8.97% 20273,7 | 3,245 | 3,213 |
| | | 1,015,126 |
| Municipals 0.80% | | |
| Turlock Irrigation Dist., Rev. Ref. Bonds, Series 2016, 5.00% 2046 | 10,000 | 11,257 |
| State of California, Veterans G.O. Ref. Bonds, Series 2015-CM, AMT, 2.45% 2031 | 1,385 | 1,380 |
| State of California, Industry Public Facs. Auth., Tax Allocation Rev. Ref. Bonds (Civic - Recreational-Industrial Redev. Project No. 1), Series 2015-A, Assured Guaranty Municipal insured, 2.203% 2018 | 10,000 | 10,058 |
State of California, Infrastructure and Econ. Dev. Bank, Rev. Ref. Bonds (J. Paul Getty Trust), Series 2011-A-2,
1.00% 2038 (put 2017)4 | 2,400 | 2,400 |
| State of Connecticut, Housing Fin. Auth., Housing Mortgage Fin. Program Rev. Ref. Bonds, Series 2015-C-1, 3.50% 2045 | 1,915 | 1,987 |
| State of Florida, Hurricane Catastrophe Fund Fin. Corp., Rev. Bonds, Series 2013-A, 2.995% 2020 | 6,550 | 6,711 |
| State of Florida, State Board of Administration Fin. Corp., Rev. Bonds, Series 2016-A, 2.638% 2021 | 5,650 | 5,676 |
| State of Illinois, G.O. Taxable Build America Bonds, Series 2010-5, 6.20% 2021 | 1,090 | 1,149 |
| Fin. Auth., Rev. Bonds (Mercy Health Corp.), Series 2016, 5.00% 2040 | 10,000 | 10,657 |
| State of Illinois, G.O. Bonds, Pension Funding Series 2013, 5.877% 2019 | 705 | 748 |
| State of Illinois, G.O. Bonds, Series 2013-B, 3.65% 2020 | 2,570 | 2,542 |
| State of Illinois, G.O. Bonds, Build America Bonds, Series 2010-3, 5.727% 2020 | 3,230 | 3,387 |
| State of Illinois, G.O. Bonds, Taxable Build America Bonds, Series 2010-2, 5.65% 2020 | 820 | 857 |
| State of Illinois, G.O. Bonds, Series 2013-B, 4.11% 2022 | 2,280 | 2,214 |
| State of Illinois, G.O. Bonds, Taxable Build America Bonds, Series 2010-2, 5.85% 2022 | 905 | 944 |
The Bond Fund of America — Page 35 of 43
Bonds, notes & other debt instruments
Municipals (continued) | Principal amount
(000) | Value
(000) |
| State of Illinois, G.O. Bonds, Series 2013-B, 4.31% 2023 | $7,325 | $7,093 |
| State of Illinois, G.O. Bonds, Pension Funding Series 2003, 4.95% 2023 | 21,300 | 21,833 |
| State of Illinois, G.O. Bonds, Taxable Build America Bonds, Series 2010-2, 5.95% 2023 | 2,275 | 2,382 |
| State of Illinois, G.O. Bonds, Taxable Build America Bonds, Series 2010-2, 6.15% 2025 | 2,250 | 2,378 |
| State of Illinois, G.O. Bonds, Pension Funding Series 2003, 5.10% 20337 | 8,500 | 7,621 |
| State of Illinois, G.O. Bonds, Series 2014, 5.00% 2039 | 17,900 | 17,663 |
| State of Illinois, Housing Dev. Auth., Rev. Bonds, Series 2016-A, 4.00% 2046 | 990 | 1,048 |
| State of Illinois, Housing Dev. Auth., Multifamily Housing Rev. Notes (Marshall Field Garden Apartment Homes), 1.72% 2050 (put 2025)4 | 4,650 | 4,603 |
| State of Iowa, Fin. Auth., Single Family Mortgage Bonds, Series 2016-A, 4.00% 2046 | 955 | 1,014 |
| State of Kentucky, Housing Corp., Housing Rev. Bonds, Series 2013-D, 3.50% 2033 | 1,320 | 1,365 |
| State of Maine, Housing Auth., Mortgage Purchase Rev. Ref. Bonds, Series 2015-E-1, AMT, 3.50% 2035 | 3,285 | 3,387 |
| State of Maryland, Community Dev. Administration, Dept. of Housing and Community Dev., Residential Rev. Bonds, Series 2014-B, AMT, 3.25% 2044 | 3,575 | 3,659 |
| State of Massachusetts, Housing Fin. Agcy., Single Family Housing Rev. Bonds, Series 178, 3.50% 2042 | 955 | 992 |
| State of Michigan, Fin. Auth., Local Government Loan Program Rev. Bonds (City of Detroit Fin. Recovery Income Tax Local Project), Series 2014-F-2, 4.60% 2022 | 6,000 | 6,099 |
| State of Michigan, Housing Dev. Auth., Single-Family Mortgage Rev. Bonds, Series 2016-B, 3.50% 2047 | 21,000 | 21,706 |
| State of Minnesota, Housing Fin. Agcy., Residential Housing Fin. Bonds, Series 2015-A, AMT, 4.00% 2041 | 645 | 678 |
| State of Minnesota, Housing Fin. Agcy., Residential Housing Fin. Bonds, Series 2014-C, AMT, 4.00% 2045 | 4,085 | 4,276 |
| State of Minnesota, Housing Fin. Agcy., Residential Housing Fin. Bonds, Series 2015-E, AMT, 3.50% 2046 | 1,815 | 1,871 |
| State of Missouri, Housing Dev. Commission, Single Family Mortgage Rev. Bonds (Special Homeownership Loan Program), Series 2015-A, 3.75% 2038 | 895 | 935 |
State of Nebraska, Investment Fin. Auth., Single Family Housing Rev. Bonds, Series 2015-C,
3.50% 2045 | 1,310 | 1,356 |
State of Nebraska, Investment Fin. Auth., Single Family Housing Rev. Bonds, Series 2016-A,
3.50% 2046 | 1,975 | 2,054 |
State of New Jersey, Econ. Dev. Auth., School Facs. Construction Rev. Ref. Bonds, Series 2015-YY,
4.447% 2020 | 15,500 | 15,663 |
State of New Jersey, Transportation Trust Fund Auth., Transportation System Rev. Ref. Bonds,
Series 2013-B, 1.758% 2018 | 10,500 | 10,269 |
| State of New York, Mortgage Agcy., Homeowner Mortgage Rev. Bonds, Series 52, AMT, 3.50% 2030 | 1,720 | 1,773 |
State of Ohio, Buckeye Tobacco Settlement Fncg. Auth., Tobacco Settlement Asset-backed Bonds,
Current Interest Bonds, Series 2007-A-2, 5.875% 2047 | 15,000 | 13,248 |
| Territory of Puerto Rico, Electric Power Auth., Power Rev. Ref. Bonds, Series UU, Assured Guaranty Municipal insured, 1.087% 20294 | 7,665 | 5,815 |
| State of South Carolina, Housing Fin. Auth., Mortgage Rev. Ref. Bonds, 4.00% 2036 | 980 | 1,038 |
| State of South Carolina, Housing Fin. Auth., Mortgage Rev. Ref. Bonds, AMT, 4.00% 2041 | 2,745 | 2,882 |
| State of Tennessee, Housing Dev. Agcy., Residential Fin. Program Bonds, Series 2013-2-A, AMT, 4.00% 2043 | 740 | 768 |
| State of Tennessee, Housing Dev. Agcy., Homeownership Program Rev. Ref. Bonds, Issue 2015-A, 3.50% 2045 | 1,095 | 1,140 |
| State of Tennessee, Housing Dev. Agcy., Residential Fin. Program Bonds, Series 2015-1-A, AMT, 4.00% 2045 | 1,830 | 1,925 |
| State of Tennessee, Housing Dev. Agcy., Residential Fin. Program Bonds, AMT, 4.00% 2046 | 2,320 | 2,434 |
| Water Dev. Board, State Water Implementation Rev. Fund, Rev. Bonds (Master Trust), Series 2016, 5.00% 2046 | 7,000 | 8,026 |
| State of Texas, SA Energy Acquisition Public Fac. Corp., Gas Supply Rev. Bonds, Series 2007, 5.50% 2023 | 6,000 | 6,906 |
| State of Texas, Board of Regents of the Texas A&M University System, Rev. Fncg. System Bonds, Taxable Series 2016-B, 2.766% 2026 | 200 | 197 |
| State of Utah, Housing Corp., Single Family Mortgage Bonds, Class III, Series 2015-D-2, 4.00% 2045 | 1,065 | 1,125 |
State of Wisconsin, Housing and Econ. Dev. Auth., Home Ownership Rev. Bonds, Series 2015-A, AMT,
4.00% 2045 | 2,395 | 2,496 |
State of Wisconsin, Housing and Econ. Dev. Auth., Home Ownership Rev. Bonds, Series 2016-A, AMT,
3.50% 2046 | 1,930 | 1,987 |
| State of Wyoming, Community Dev. Auth., Housing Rev. Bonds, Series 2015-6, 4.00% 2045 | 910 | 963 |
| | | 254,635 |
The Bond Fund of America — Page 36 of 43
Bonds, notes & other debt instruments
Federal agency bonds & notes 0.46% | Principal amount
(000) | Value
(000) |
| CoBank, ACB 1.563% 20223,4 | $29,725 | $28,610 |
| Fannie Mae 2.125% 2026 | 14,240 | 13,499 |
| Federal Agricultural Mortgage Corp. 5.125% 20173 | 5,000 | 5,066 |
| Federal Home Loan Bank 2.75% 2018 | 16,635 | 17,040 |
| Freddie Mac 1.25% 2019 | 26,500 | 26,369 |
| Tennessee Valley Authority 1.875% 2022 | 15,600 | 15,400 |
| Tennessee Valley Authority 4.65% 2035 | 4,000 | 4,657 |
| Tennessee Valley Authority 5.25% 2039 | 21,250 | 26,726 |
| Tennessee Valley Authority, Series B, 3.50% 2042 | 9,400 | 9,218 |
| | | 146,585 |
| Total bonds, notes & other debt instruments (cost: $30,136,020,000) | | 30,015,716 |
Convertible stocks 0.01%
Industrials 0.01% | Shares | |
| CEVA Group PLC, Series A-1, 4.022% convertible preferred4,5,10 | 9,732 | 3,406 |
| CEVA Group PLC, Series A-2, 3.022% convertible preferred4,5,10 | 2,576 | 644 |
| Total convertible stocks (cost: $13,571,000) | | 4,050 |
Preferred securities 0.01%
Financials 0.01% | | |
| CoBank, ACB, Class E, noncumulative3 | 6,250 | 3,986 |
| Total preferred securities (cost: $5,820,000) | | 3,986 |
Common stocks 0.04%
Industrials 0.01% | | |
| CEVA Group PLC5,10,11 | 12,179 | 3,044 |
| Atrium Corp.3,5,11 | 985 | 1 |
| | | 3,045 |
| Health care 0.01% | | |
| Rotech Healthcare Inc.5,11 | 342,069 | 2,757 |
| Information technology 0.01% | | |
| Corporate Risk Holdings I, Inc.5,11 | 188,850 | 2,153 |
| Corporate Risk Holdings Corp.5,11 | 955 | — |
| | | 2,153 |
| Materials 0.01% | | |
| Warrior Met Coal, LLC, Class B3,5,11 | 4,359 | 1,504 |
| Warrior Met Coal, LLC, Class A3,5,11 | 1,452 | 501 |
| | | 2,005 |
| Telecommunication services 0.00% | | |
| NII Holdings, Inc.11 | 686,010 | 1,475 |
The Bond Fund of America — Page 37 of 43
Common stocks
Energy 0.00% | Shares | Value
(000) |
| Gener8 Maritime, Inc.11 | 1,716 | $8 |
| Total common stocks (cost: $56,021,000) | | 11,443 |
Rights & warrants 0.00%
Energy 0.00% | | |
| Gener8 Maritime, Inc., warrants, expire 20173,5,11 | 2,654 | — |
| Total rights & warrants (cost: $671,000) | | — |
| Short-term securities 6.51% | Principal amount
(000) | |
| Abbey National Treasury Services PLC 1.08% due 4/24/2017 | $12,050 | 12,012 |
| ANZ New Zealand (International) Ltd. 1.14% due 3/28/20173 | 20,000 | 19,952 |
| Apple Inc. 0.64% due 2/6/20173 | 59,700 | 59,667 |
| Chevron Corp. 0.74%–0.82% due 2/21/2017–4/3/20173 | 100,500 | 100,325 |
| Coca-Cola Co. 0.69% due 1/13/20173 | 25,000 | 24,996 |
| ExxonMobil Corp. 0.69% due 1/24/2017 | 50,000 | 49,977 |
| Federal Farm Credit Banks 0.52% due 4/27/2017 | 35,000 | 34,937 |
| Federal Home Loan Bank 0.45%–0.55% due 1/19/2017–5/17/2017 | 608,900 | 608,306 |
| Japanese Treasury Discount Bills 0% due 3/10/2017 | ¥90,000,000 | 770,452 |
| Microsoft Corp. 0.76%–0.86% due 2/14/2017–3/14/20173 | 188,900 | 188,736 |
| Paccar Financial Corp. 0.68% due 1/27/2017 | 23,400 | 23,389 |
| Pfizer Inc. 0.78% due 1/23/20173 | 42,852 | 42,838 |
| Qualcomm Inc. 0.66%–0.70% due 2/8/2017–2/22/20173 | 71,100 | 71,039 |
| Svenska Handelsbanken Inc. 1.08% due 4/24/20173 | 21,700 | 21,632 |
| Toronto-Dominion Holdings USA Inc. 1.16% due 3/21/20173 | 20,000 | 19,959 |
| Wells Fargo Bank, N.A. 1.09% due 4/24/2017 | 34,000 | 34,010 |
| Total short-term securities (cost: $2,196,606,000) | | 2,082,227 |
| Total investment securities 100.48% (cost: $32,408,709,000) | | 32,117,422 |
| Other assets less liabilities (0.48)% | | (153,334) |
| Net assets 100.00% | | $31,964,088 |
Forward currency contracts
The fund has entered into forward currency contracts as shown in the following table. The average month-end notional amount of open forward currency contracts while held was $982,710,000.
| | Settlement
date | Counterparty | Contract amount | Unrealized
(depreciation)
appreciation
at 12/31/2016
(000) |
Receive
(000) | Deliver
(000) |
| Purchases: | | | | | |
| Colombian pesos | 1/27/2017 | Citibank | COP42,592,900 | $14,200 | $(95) |
| Euros | 1/11/2017 | JPMorgan Chase | €10,139 | $10,762 | (80) |
| Euros | 1/12/2017 | Barclays Bank PLC | €9,605 | $10,233 | (114) |
| Euros | 1/20/2017 | Citibank | €11,000 | $11,740 | (147) |
| Euros | 1/20/2017 | JPMorgan Chase | €14,065 | $15,154 | (331) |
| Euros | 1/23/2017 | Citibank | €5,404 | $5,637 | 59 |
| Malaysian ringgits | 1/13/2017 | Citibank | MYR62,510 | $14,119 | (192) |
| | | | | | $(900) |
The Bond Fund of America — Page 38 of 43
| | Settlement
date | Counterparty | Contract amount | Unrealized
(depreciation)
appreciation
at 12/31/2016
(000) |
Receive
(000) | Deliver
(000) |
| Sales: | | | | | |
| Brazilian reais | 1/6/2017 | Bank of America, N.A. | $4,795 | BRL16,300 | $(203) |
| Brazilian reais | 1/11/2017 | Bank of America, N.A. | $2,405 | BRL8,250 | (121) |
| Brazilian reais | 1/11/2017 | Citibank | $17,758 | BRL61,000 | (916) |
| Brazilian reais | 1/13/2017 | JPMorgan Chase | $15,377 | BRL53,000 | (837) |
| British pounds | 1/24/2017 | Bank of New York Mellon | $461 | £370 | 5 |
| Canadian dollars | 1/12/2017 | Bank of America, N.A. | $17,334 | C$23,100 | 126 |
| Chilean pesos | 1/20/2017 | Citibank | $53,778 | CLP35,813,750 | 394 |
| Chilean pesos | 1/27/2017 | Citibank | $14,161 | CLP9,573,000 | (101) |
| Euros | 1/13/2017 | Citibank | $19,562 | €18,750 | (192) |
| Indian rupees | 1/6/2017 | Bank of America, N.A. | $2,908 | INR200,000 | (37) |
| Indian rupees | 1/11/2017 | Citibank | $949 | INR65,350 | (13) |
| Indian rupees | 1/11/2017 | UBS AG | $13,775 | INR948,500 | (184) |
| Indian rupees | 1/11/2017 | JPMorgan Chase | $17,991 | INR1,238,700 | (238) |
| Indian rupees | 1/25/2017 | JPMorgan Chase | $2,113 | INR143,040 | 11 |
| Japanese yen | 3/10/2017 | Bank of America, N.A. | $892,888 | ¥90,000,000 | 120,143 |
| Japanese yen | 3/17/2017 | Barclays Bank PLC | $49,436 | ¥5,080,000 | 5,801 |
| Japanese yen | 3/17/2017 | UBS AG | $13,137 | ¥1,350,000 | 1,541 |
| Japanese yen | 4/18/2017 | JPMorgan Chase | $14,722 | ¥1,520,000 | 1,644 |
| Japanese yen | 5/12/2017 | Citibank | $84,132 | ¥8,620,000 | 9,868 |
| Japanese yen | 6/9/2017 | Citibank | $17,099 | ¥1,750,000 | 2,001 |
| Japanese yen | 6/9/2017 | Citibank | $17,099 | ¥1,750,000 | 2,001 |
| Japanese yen | 6/9/2017 | Citibank | $17,099 | ¥1,750,000 | 2,001 |
| Japanese yen | 8/10/2017 | JPMorgan Chase | $11,470 | ¥1,170,000 | 1,341 |
| Mexican pesos | 1/9/2017 | Citibank | $2,876 | MXN59,392 | 16 |
| Mexican pesos | 1/11/2017 | Citibank | $676 | MXN14,000 | 2 |
| Mexican pesos | 1/20/2017 | JPMorgan Chase | $19,645 | MXN403,550 | 242 |
| Mexican pesos | 1/25/2017 | JPMorgan Chase | $9,344 | MXN190,000 | 216 |
| Singapore dollars | 1/24/2017 | JPMorgan Chase | $13,566 | S$19,600 | 34 |
| South Korean won | 1/13/2017 | UBS AG | $14,136 | KRW16,600,000 | 391 |
| Turkish lira | 1/23/2017 | UBS AG | $2,859 | TRY10,125 | 3 |
| Turkish lira | 1/23/2017 | JPMorgan Chase | $114 | TRY405 | —12 |
| | | | | | $144,939 |
| Forward currency contracts — net | $144,039 |
Interest rate swaps
The fund has entered into interest rate swaps as shown in the following table. The average month-end notional amount of interest rate swaps while held was $14,770,478,000.
Pay/receive
fixed rate | Clearinghouse | Floating rate index | Fixed
rate | Expiration
date | Notional
(000) | Unrealized
(depreciation)
appreciation
at 12/31/2016
(000) |
| Receive | LCH | Sonio Overnight Deposit Rates | 0.207% | 10/13/2018 | £280,000 | $(311) |
| Receive | LCH | Sonio Overnight Deposit Rates | 0.227 | 10/14/2018 | 45,000 | (30) |
| Receive | LCH | Sonio Overnight Deposit Rates | 0.226 | 10/14/2018 | 275,000 | (190) |
| Pay | LCH | 3-month USD-LIBOR | 0.821 | 7/8/2019 | $95,000 | 1,789 |
| Receive | LCH | 6-month NOK-NIBOR | 1.36 | 12/19/2019 | NKr1,030,000 | 44 |
| Receive | LCH | 3-month USD-LIBOR | 1.666 | 5/26/2020 | $250,000 | (715) |
| Receive | LCH | 3-month USD-LIBOR | 1.371 | 1/25/2021 | 270,000 | (5,138) |
The Bond Fund of America — Page 39 of 43
Pay/receive
fixed rate | Clearinghouse | Floating rate index | Fixed
rate | Expiration
date | Notional
(000) | Unrealized
(depreciation)
appreciation
at 12/31/2016
(000) |
| Receive | LCH | 3-month USD-LIBOR | 1.3705% | 1/25/2021 | $280,000 | $(5,334) |
| Receive | LCH | 3-month USD-LIBOR | 1.3095 | 2/2/2021 | 188,000 | (4,083) |
| Pay | LCH | 3-month USD-LIBOR | 1.305 | 4/25/2021 | 293,000 | 7,111 |
| Receive | LCH | 3-month USD-LIBOR | 1.3575 | 6/3/2021 | 75,000 | (1,738) |
| Pay | LCH | 3-month USD-LIBOR | 1.0695 | 6/17/2021 | 160,000 | 5,774 |
| Pay | LCH | 3-month USD-LIBOR | 1.086 | 6/21/2021 | 74,000 | 2,628 |
| Pay | LCH | 3-month USD-LIBOR | 2.1892 | 8/13/2021 | 50,000 | (594) |
| Pay | LCH | 3-month USD-LIBOR | 1.217 | 9/22/2021 | 67,000 | 2,206 |
| Pay | LCH | 3-month USD-LIBOR | 1.225 | 9/22/2021 | 67,000 | 2,182 |
| Pay | LCH | 3-month USD-LIBOR | 1.2255 | 9/23/2021 | 727,900 | 23,722 |
| Pay | LCH | 3-month USD-LIBOR | 1.25 | 9/23/2021 | 660,000 | 20,770 |
| Pay | LCH | 3-month USD-LIBOR | 1.225 | 9/23/2021 | 527,100 | 17,189 |
| Pay | LCH | 3-month USD-LIBOR | 1.26775 | 10/7/2021 | 87,000 | 2,703 |
| Pay | LCH | 3-month USD-LIBOR | 1.2796 | 10/11/2021 | 434,000 | 13,306 |
| Receive | LCH | 3-month USD-LIBOR | 1.852 | 12/5/2021 | 15,000 | (78) |
| Receive | LCH | 3-month USD-LIBOR | 1.813 | 12/6/2021 | 20,000 | (141) |
| Receive | LCH | 3-month USD-LIBOR | 1.8855 | 12/15/2021 | 58,100 | (218) |
| Receive | LCH | 3-month USD-LIBOR | 1.885 | 12/15/2021 | 291,900 | (1,106) |
| Receive | LCH | 3-month USD-LIBOR | 2.8 | 9/2/2022 | 785,000 | 4,090 |
| Receive | LCH | 3-month USD-LIBOR | 2.75 | 9/2/2022 | 392,000 | 1,682 |
| Receive | LCH | 3-month USD-LIBOR | 1.733 | 10/9/2022 | 100,000 | (1,765) |
| Receive | LCH | 3-month USD-LIBOR | 1.176 | 2/16/2023 | 240,000 | (12,730) |
| Receive | LCH | 3-month USD-LIBOR | 1.615 | 8/18/2023 | 270,000 | (4,941) |
| Receive | LCH | 3-month USD-LIBOR | 1.309 | 9/27/2023 | 27,000 | (1,426) |
| Receive | LCH | 3-month USD-LIBOR | 2.2665 | 12/21/2023 | 20,000 | 146 |
| Pay | LCH | 3-month USD-LIBOR | 2.82125 | 4/11/2024 | 42,000 | (1,850) |
| Pay | LCH | 3-month USD-LIBOR | 2.7455 | 6/19/2024 | 45,000 | (1,747) |
| Pay | LCH | 3-month USD-LIBOR | 2.683 | 8/4/2024 | 54,000 | (1,860) |
| Pay | LCH | 3-month USD-LIBOR | 1.902 | 2/2/2025 | 3,000 | 75 |
| Pay | LCH | 6-month JPY-LIBOR | 0.5327 | 3/4/2025 | ¥6,100,000 | (1,617) |
| Pay | LCH | 3-month USD-LIBOR | 2.255 | 5/20/2025 | $75,000 | (41) |
| Pay | LCH | 6-month JPY-LIBOR | 0.46995 | 11/17/2025 | ¥6,250,000 | (1,394) |
| Pay | LCH | 3-month USD-LIBOR | 2.1145 | 12/10/2025 | $93,000 | 1,273 |
| Pay | LCH | 3-month USD-LIBOR | 2.149 | 1/7/2026 | 10,000 | 113 |
| Pay | LCH | 3-month USD-LIBOR | 2.0235 | 1/13/2026 | 38,000 | 831 |
| Pay | LCH | 3-month USD-LIBOR | 1.9615 | 1/14/2026 | 110,000 | 2,977 |
| Pay | LCH | 6-month JPY-LIBOR | 0.3822 | 1/15/2026 | ¥5,100,000 | (789) |
| Pay | LCH | 3-month USD-LIBOR | 1.8855 | 1/25/2026 | $150,000 | 5,043 |
| Pay | LCH | 6-month JPY-LIBOR | 0.228 | 2/8/2026 | ¥8,500,000 | (282) |
| Pay | LCH | 6-month JPY-LIBOR | 0.20125 | 2/18/2026 | 8,240,000 | (96) |
| Receive | LCH | 6-month JPY-LIBOR | 0.1223 | 5/11/2026 | 2,000,000 | (115) |
| Receive | LCH | 6-month JPY-LIBOR | 0.1173 | 5/13/2026 | 1,000,000 | (62) |
| Receive | LCH | 6-month JPY-LIBOR | 0.10855 | 5/16/2026 | 2,000,000 | (138) |
| Receive | LCH | 6-month JPY-LIBOR | 0.0188 | 6/16/2026 | 1,000,000 | (145) |
| Receive | LCH | 6-month JPY-LIBOR | (0.00395) | 6/17/2026 | 2,000,000 | (321) |
| Pay | LCH | 3-month USD-LIBOR | 1.3805 | 7/5/2026 | $78,000 | 6,334 |
| Pay | LCH | 3-month USD-LIBOR | 1.456 | 8/9/2026 | 15,000 | 1,134 |
| Receive | LCH | 6-month EURIBOR | 0.398 | 10/27/2026 | €6,100 | (149) |
| Receive | LCH | 6-month EURIBOR | 0.408 | 10/27/2026 | 39,800 | (931) |
| Receive | LCH | 6-month EURIBOR | 0.756 | 12/9/2026 | 28,000 | 317 |
| Pay | LCH | 3-month USD-LIBOR | 2.97125 | 9/2/2030 | $79,900 | (1,497) |
| Pay | LCH | 3-month USD-LIBOR | 3.005 | 9/2/2030 | 160,300 | (3,459) |
The Bond Fund of America — Page 40 of 43
Pay/receive
fixed rate | Clearinghouse | Floating rate index | Fixed
rate | Expiration
date | Notional
(000) | Unrealized
(depreciation)
appreciation
at 12/31/2016
(000) |
| Pay | LCH | 3-month USD-LIBOR | 1.87% | 8/18/2031 | $57,000 | $4,310 |
| Receive | LCH | 3-month USD-LIBOR | 3.4275 | 4/11/2034 | 23,000 | 3,004 |
| Receive | LCH | 3-month USD-LIBOR | 2.523 | 12/8/2035 | 5,000 | (19) |
| Pay | LCH | 3-month USD-LIBOR | 3.34 | 6/27/2044 | 70,000 | (11,010) |
| Pay | LCH | 3-month USD-LIBOR | 3.206 | 7/31/2044 | 24,000 | (3,124) |
| Pay | LCH | 3-month USD-LIBOR | 3.238 | 8/8/2044 | 25,000 | (3,415) |
| Pay | LCH | 3-month USD-LIBOR | 2.7045 | 1/2/2045 | 33,000 | (852) |
| Pay | LCH | 3-month USD-LIBOR | 2.476 | 1/9/2045 | 15,000 | 332 |
| Pay | LCH | 3-month USD-LIBOR | 2.3505 | 1/20/2045 | 3,000 | 145 |
| Pay | LCH | 3-month USD-LIBOR | 2.717 | 5/26/2045 | 45,000 | (1,296) |
| Pay | LCH | 3-month USD-LIBOR | 2.943 | 7/17/2045 | 40,000 | (3,078) |
| Pay | LCH | 3-month USD-LIBOR | 2.6995 | 9/2/2045 | 40,000 | (1,008) |
| Pay | LCH | 3-month USD-LIBOR | 2.7055 | 9/2/2045 | 50,000 | (1,323) |
| Pay | LCH | 3-month USD-LIBOR | 2.6785 | 9/4/2045 | 60,000 | (1,243) |
| Pay | LCH | 3-month USD-LIBOR | 2.516 | 10/20/2045 | 72,000 | 1,010 |
| Pay | LCH | 3-month USD-LIBOR | 2.525 | 10/20/2045 | 48,000 | 581 |
| Pay | LCH | 3-month USD-LIBOR | 2.5315 | 10/26/2045 | 60,000 | 641 |
| Pay | LCH | 3-month USD-LIBOR | 2.57082 | 11/6/2045 | 123,000 | 283 |
| Pay | LCH | 3-month USD-LIBOR | 2.57067 | 11/9/2045 | 13,200 | 31 |
| Pay | LCH | 3-month USD-LIBOR | 2.6485 | 11/16/2045 | 13,050 | (187) |
| Pay | LCH | 3-month USD-LIBOR | 2.52822 | 11/23/2045 | 17,800 | 204 |
| Pay | LCH | 3-month USD-LIBOR | 2.52611 | 11/24/2045 | 57,400 | 684 |
| Pay | LCH | 3-month USD-LIBOR | 2.535 | 11/24/2045 | 4,600 | 46 |
| Pay | LCH | 3-month USD-LIBOR | 2.4835 | 12/3/2045 | 10,000 | 211 |
| Pay | LCH | 3-month USD-LIBOR | 2.59125 | 12/16/2045 | 67,250 | (137) |
| Pay | LCH | 3-month USD-LIBOR | 2.4095 | 1/14/2046 | 49,000 | 1,819 |
| Pay | LCH | 3-month USD-LIBOR | 2.396 | 1/19/2046 | 25,000 | 1,001 |
| Pay | LCH | 3-month USD-LIBOR | 2.3375 | 1/25/2046 | 60,000 | 3,157 |
| Pay | LCH | 3-month USD-LIBOR | 2.354 | 1/29/2046 | 53,000 | 2,590 |
| Pay | LCH | 3-month USD-LIBOR | 1.991 | 6/13/2046 | 8,000 | 1,028 |
| Pay | LCH | 3-month USD-LIBOR | 1.9905 | 6/13/2046 | 4,000 | 514 |
| Pay | LCH | 3-month USD-LIBOR | 1.9165 | 6/21/2046 | 8,500 | 1,231 |
| Receive | LCH | 3-month USD-LIBOR | 1.803 | 7/14/2046 | 30,000 | (5,091) |
| Pay | LCH | 3-month USD-LIBOR | 1.826 | 7/28/2046 | 30,000 | 4,944 |
| Pay | LCH | 6-month EURIBOR | 0.9152 | 10/27/2046 | €15,100 | 1,289 |
| Pay | LCH | 6-month EURIBOR | 0.9007 | 10/27/2046 | 2,000 | 179 |
| Pay | LCH | 3-month USD-LIBOR | 2.403 | 11/21/2046 | $31,000 | 1,217 |
| Receive | LCH | 3-month USD-LIBOR | 2.542 | 12/6/2046 | 17,000 | (149) |
| Receive | LCH | 3-month USD-LIBOR | 2.5445 | 12/6/2046 | 45,000 | (369) |
| Pay | LCH | 6-month EURIBOR | 1.3092 | 12/9/2046 | €11,000 | (250) |
| Pay | LCH | 3-month USD-LIBOR | 2.7265 | 12/22/2046 | $97,000 | (3,083) |
| | | | | | | $61,225 |
The Bond Fund of America — Page 41 of 43
Credit default swaps
The fund has entered into credit default swaps as shown in the following table. The average month-end notional amount of credit default swaps while held was $533,022,000.
Centrally cleared credit default swaps on credit indices — buy protection
| Referenced index | Clearinghouse | Pay
fixed rate | Expiration
date | Notional
(000) | Value
(000) | Upfront
premiums
paid
(000) | Unrealized
depreciation
at 12/31/2016
(000) |
| CDX.NA.HY.25 | CME | 5.00% | 12/20/2020 | $198,000 | $(13,657) | $(3,973) | $(9,684) |
| CDX.NA.HY.27 | ICE | 5.00 | 12/20/2021 | 304,600 | (18,885) | (11,209) | (7,676) |
| | | | | | | | $(17,360) |
Futures contracts
The fund has entered into futures contracts as shown in the following table. The average month-end notional amount of open futures contracts while held was $10,696,679,000.
| Contracts | Clearinghouse | Type | Number of
contracts | Expiration | Notional
amount
(000) | Unrealized
appreciation
(depreciation)
at 12/31/2016
(000) |
| 30 Day Federal Funds Futures | CME | Short | 168 | January 2017 | $69,596 | $42 |
| 10 Year Ultra U.S. Treasury Note Futures | CME | Short | 5,682 | March 2017 | 759,322 | (2,421) |
| 10 Year U.S. Treasury Note Futures | CME | Long | 2,488 | March 2017 | 309,316 | (104) |
| 30 Year Ultra U.S. Treasury Bond Futures | CME | Long | 1,317 | March 2017 | 208,323 | 2,726 |
| 20 Year U.S. Treasury Bond Futures | CME | Long | 284 | March 2017 | 43,264 | (477) |
| 5 Year U.S. Treasury Note Futures | CME | Long | 84,019 | April 2017 | 9,907,026 | (21,009) |
| 2 Year U.S. Treasury Note Futures | CME | Long | 13,305 | April 2017 | 2,885,056 | (2,029) |
| 90 Day Euro Dollar Futures | CME | Long | 1,878 | December 2017 | 464,168 | (1,805) |
| 90 Day Euro Dollar Futures | CME | Short | 1,351 | March 2018 | 333,593 | 1,382 |
| | | | | | | $(23,695) |
The following footnotes apply to either the individual securities noted or one or more of the securities aggregated and listed as a single line item.
| 1 | A portion of this security was pledged as collateral. The total value of pledged collateral was $368,286,000, which represented 1.15% of the net assets of the fund. |
| 2 | Index-linked bond whose principal amount moves with a government price index. |
| 3 | Acquired in a transaction exempt from registration under Rule 144A or Section 4(2) of the Securities Act of 1933. May be resold in the U.S. in transactions exempt from registration, normally to qualified institutional buyers. The total value of all such securities was $3,948,345,000, which represented 12.35% of the net assets of the fund. |
| 4 | Coupon rate may change periodically. |
| 5 | Valued under fair value procedures adopted by authority of the board of trustees. The total value of all such securities was $194,795,000, which represented .61% of the net assets of the fund. |
| 6 | Loan participations and assignments; may be subject to legal or contractual restrictions on resale. The total value of all such loans was $28,970,000, which represented .09% of the net assets of the fund. |
| 7 | Principal payments may be made periodically. Therefore, the effective maturity date may be earlier than the stated maturity date. |
| 8 | Payment in kind; the issuer has the option of paying additional securities in lieu of cash. |
| 9 | Purchased on a TBA basis. |
| 10 | Acquired through a private placement transaction exempt from registration under the Securities Act of 1933. May be subject to legal or contractual restrictions on resale. Further details on these holdings appear below. |
| 11 | Security did not produce income during the last 12 months. |
| 12 | Amount less than one thousand. |
The Bond Fund of America — Page 42 of 43
| Private placement securities | Acquisition
date(s) | Cost
(000) | Value
(000) | Percent
of net
assets |
| CEVA Group PLC, Series A-1, 4.022% convertible preferred | 5/2/2013 | $9,867 | $3,406 | .01% |
| CEVA Group PLC | 3/10/2010-5/2/2013 | 27,452 | 3,044 | .01 |
| CEVA Group PLC, Series A-2, 3.022% convertible preferred | 3/10/2010-1/23/2012 | 3,703 | 644 | .00 |
| Total private placement securities | | 41,022 | 7,094 | .02% |
| Key to abbreviations and symbols | | |
| ADS = American Depositary Shares | Dist. = District | LCH = LCH.Clearnet |
| Agcy. = Agency | Econ. = Economic | LIBOR = London Interbank Offered Rate |
| AMT = Alternative Minimum Tax | EURIBOR = Euro Interbank Offered Rate | LOC = Letter of Credit |
| ARS = Argentine pesos | € = Euros | MXN = Mexican pesos |
| Auth. = Authority | Fac. = Facility | MYR = Malaysian ringgits |
| BRL = Brazilian reais | Facs. = Facilities | NIBOR = Norwegian Interbank Offered Rate |
| £ = British pounds | Fin. = Finance | NOK/NKr = Norwegian kroner |
| C$ = Canadian dollars | Fncg. = Financing | Redev. = Redevelopment |
| CLO = Collateralized Loan Obligations | G.O. = General Obligation | Ref. = Refunding |
| CLP = Chilean pesos | ICE = Intercontinental Exchange, Inc. | Rev. = Revenue |
| CME = CME Group | INR = Indian rupees | S$ = Singapore dollars |
| COP = Colombian pesos | JPY/¥ = Japanese yen | TBA = To-be-announced |
| Dept. = Department | KRW = South Korean won | TRY = Turkish lira |
| Dev. = Development | | |
Refer to the fund’s current shareholder report for additional disclosures.
Investments are not FDIC-insured, nor are they deposits of or guaranteed by a bank or any other entity, so they may lose value.
Investors should carefully consider investment objectives, risks, charges and expenses. This and other important information is contained in the fund prospectus and summary prospectus, which can be obtained from your financial professional and should be read carefully before investing. You may also call American Funds Service Company (AFS) at (800) 421-4225 or visit the American Funds website at americanfunds.com.
| MFGEFPX-008-0217O-S54097 | The Bond Fund of America — Page 43 of 43 |
REPORT OF INDEPENDENT REGISTERED PUBLIC ACCOUNTING FIRM
To the Shareholders and Board of Trustees of
The Bond Fund of America:
We have audited the accompanying statement of assets and liabilities of The Bond Fund of America (the “Fund”), including the summary schedule of investments, as of December 31, 2016, and the related statements of operations for the year then ended, the statements of changes in net assets for each of the two years in the period then ended (collectively, the “financial statements”), the financial highlights for each of the five years in the period then ended (the financial statements and financial highlights are included in Item 1 of this Form N-CSR), and the schedule of investments in securities as of December 31, 2016 (included in Item 6 of this Form N-CSR). These financial statements, financial highlights, and schedule of investments in securities are the responsibility of the Fund’s management. Our responsibility is to express an opinion on these financial statements, financial highlights, and schedule of investments in securities based on our audits.
We conducted our audits in accordance with the standards of the Public Company Accounting Oversight Board (United States). Those standards require that we plan and perform the audit to obtain reasonable assurance about whether the financial statements, financial highlights, and schedule of investments in securities are free of material misstatement. An audit includes examining, on a test basis, evidence supporting the amounts and disclosures in the financial statements and schedule of investments in securities, assessing the accounting principles used and significant estimates made by management, as well as evaluating the overall financial statement presentation. Our procedures included confirmation of securities owned as of December 31, 2016, by correspondence with the custodian, brokers, and agent banks; where replies were not received from brokers and agent banks, we performed other auditing procedures. We believe that our audits provide a reasonable basis for our opinion.
In our opinion, the financial statements, financial highlights, and schedule of investments in securities referred to above present fairly, in all material respects, the financial position of The Bond Fund of America as of December 31, 2016, and the results of its operations for the year then ended, the changes in its net assets for each of the two years in the period then ended, and the financial highlights for each of the five years in the period then ended, in conformity with accounting principles generally accepted in the United States of America.
DELOITTE & TOUCHE LLP
Costa Mesa, California
February 10, 2017
ITEM 7 – Disclosure of Proxy Voting Policies and Procedures for Closed-End Management Investment Companies
Not applicable to this Registrant, insofar as the Registrant is not a closed-end management investment company.
ITEM 8 – Portfolio Managers of Closed-End Management Investment Companies
Not applicable to this Registrant, insofar as the Registrant is not a closed-end management investment company.
ITEM 9 – Purchases of Equity Securities by Closed-End Management Investment Company and Affiliated Purchasers
Not applicable to this Registrant, insofar as the Registrant is not a closed-end management investment company.
ITEM 10 – Submission of Matters to a Vote of Security Holders
There have been no material changes to the procedures by which shareholders may recommend nominees to the Registrant’s board of trustees since the Registrant last submitted a proxy statement to its shareholders. The procedures are as follows. The Registrant has a nominating and governance committee comprised solely of persons who are not considered ‘‘interested persons’’ of the Registrant within the meaning of the Investment Company Act of 1940, as amended. The committee periodically reviews such issues as the board’s composition, responsibilities, committees, compensation and other relevant issues, and recommends any appropriate changes to the full board of trustees. While the committee normally is able to identify from its own resources an ample number of qualified candidates, it will consider shareholder suggestions of persons to be considered as nominees to fill future vacancies on the board. Such suggestions must be sent in writing to the nominating and governance committee of the Registrant, c/o the Registrant’s Secretary, and must be accompanied by complete biographical and occupational data on the prospective nominee, along with a written consent of the prospective nominee for consideration of his or her name by the nominating and governance committee.
ITEM 11 – Controls and Procedures
| (a) | The Registrant’s Principal Executive Officer and Principal Financial Officer have concluded, based on their evaluation of the Registrant’s disclosure controls and procedures (as such term is defined in Rule 30a-3 under the Investment Company Act of 1940), that such controls and procedures are adequate and reasonably designed to achieve the purposes described in paragraph (c) of such rule. |
| | |
| (b) | There were no changes in the Registrant’s internal controls over financial reporting (as defined in Rule 30a-3(d) under the Investment Company Act of 1940) that occurred during the Registrant’s second fiscal quarter of the period covered by this report that has materially affected, or is reasonably likely to materially affect, the Registrant’s internal control over financial reporting. |
ITEM 12 – Exhibits
| (a)(1) | The Code of Ethics that is the subject of the disclosure required by Item 2 is attached as an exhibit hereto. |
| | |
| (a)(2) | The certifications required by Rule 30a-2 of the Investment Company Act of 1940 and Sections 302 and 906 of the Sarbanes-Oxley Act of 2002 are attached as exhibits hereto. |
SIGNATURES
Pursuant to the requirements of the Securities Exchange Act of 1934 and the Investment Company Act of 1940, the Registrant has duly caused this report to be signed on its behalf by the undersigned, thereunto duly authorized.
| | THE BOND FUND OF AMERICA |
| | |
| | By /s/ John H. Smet |
| | John H. Smet, Vice Chairman, President and Principal Executive Officer |
| | |
| | Date: February 28, 2017 |
Pursuant to the requirements of the Securities Exchange Act of 1934 and the Investment Company Act of 1940, this report has been signed below by the following persons on behalf of the Registrant and in the capacities and on the dates indicated.
| By /s/ John H. Smet |
John H. Smet, Vice Chairman, President and Principal Executive Officer |
| |
| Date: February 28, 2017 |
| By /s/ Brian C. Janssen |
Brian C. Janssen, Treasurer and Principal Financial Officer |
| |
| Date: February 28, 2017 |
